A Reevaluation of the Effect of Human Capital Accumulation on Economic Growth: Using Natural Disasters as an Instrument By Raymond Robertson, Mark Skidmore and Hideki Toya Working Paper 05 - 08 University of Wisconsin – Whitewater Department of Economics 4 th Floor Carlson Hall 800 W. Main Street Whitewater, WI 53538 Tel: (262) 472 -1361

Welcome message from author
This document is posted to help you gain knowledge. Please leave a comment to let me know what you think about it! Share it to your friends and learn new things together.
Transcript

A Reevaluation of the Effect of Human Capital Accumulation on Economic Growth:
Using Natural Disasters as an Instrument
By
Raymond Robertson, Mark Skidmore and Hideki Toya
Working Paper 05 - 08
University of Wisconsin – Whitewater Department of Economics
4th Floor Carlson Hall 800 W. Main Street
Whitewater, WI 53538
Tel: (262) 472 -1361
July 2005
A Reevaluation of the Effect of Human Capital Accumulation on Economic Growth: Using Natural Disasters as an Instrument
Hideki Toya1,
Mark Skidmore2
and
Raymond Robertson3
JEL: 047
Abstract
Theoretic growth models and microeconomic evidence suggest that human capital accumulation is an important determinant of per capita income growth. However, outliers, measurement errors, and incorrect specifications may have affected early macroeconomic studies that found a weak relationship between growth and human capital accumulation. While recent studies addressing these problems are beginning to show larger positive effects, the potential endogeneity of human capital accumulation has received relatively little attention. In this paper, we demonstrate that endogeneity is significant and find that natural disasters are a good instrument for changes in schooling. Our resulting instrumental variable estimates are larger than our OLS estimates and are generally larger than those in previous studies. Our analysis also provides some limited evidence of human capital externalities.
1 Faculty of Economics, Nagoya City University, Yamanothata-1, Mizuho-cho, Mizuho-ku, Nagoya, 467-8501, Japan; [email protected]; phone: 81-52-872-5737. 2 Department of Economics, University of Wisconsin-Whitewater, 800 West Main, Whitewater, WI 53190; [email protected]; phone: 262-472-1354. 3 Department of Economics, Macalester College, 1600 Grand Avenue, Saint Paul, MN 55105-1899; [email protected]; phone: 651-696-6739.
A Reevaluation of the Effect of Human Capital Accumulation
on Economic Growth Using Natural Disasters as an Instrument
JEL: 047
Abstract Theoretic growth models and microeconomic evidence suggest that human capital accumulation is an important determinant of per capita income growth. However, outliers, measurement errors, and incorrect specifications may have affected early macroeconomic studies that found a weak relationship between growth and human capital accumulation. While recent studies addressing these problems are beginning to show larger positive effects, the potential endogeneity of human capital accumulation has received relatively little attention. In this paper, we demonstrate that endogeneity is significant and find that natural disasters are a good instrument for changes in schooling. Our resulting instrumental variable estimates are larger than our OLS estimates and are generally larger than those in previous studies. Our analysis also provides some limited evidence of human capital externalities.

1
1. Introduction
Theoretic models of economic growth suggest that human capital accumulation is
a significant determinant of rising per capita income. Microeconomic evidence of the
positive relationship between schooling and wages supports this prediction. Estimates
using macroeconomic data demonstrate that the initial stock of human capital is an
important determinant of economic growth,1 but empirical estimates of the effects of
changes in human capital (human capital accumulation) poorly match theoretic
predictions (Barro and Sala-i-Martin (1995) and Benhabib and Spiegel (1994)).
Most studies approach this poor match as a measurement error problem (Temple
(1999a), Mankiw, Romer, and Weil (1992), Krueger and Lindahl (2001)), including
correcting for imperfect measures of quality (Hanushek and Kimko (2000), Wossmann
(2003)). Other studies have focused on the effects of outliers (Temple 1999b) or the use
of incorrect specifications (Englander and Gurney (1994) Gemmel (1996), Bassanini and
Scarpetta (2002), Engelbrecht (2003)). These studies suggest that restricting the sample
to OECD countries can generate a generally positive effect of changes in schooling or
school enrollments on growth that is similar in magnitude to those found in
microeconomic estimates based on survey data, but tell us little about the experience of
countries outside the OECD, which are often considered to be the developing countries.
Our contribution to the literature is based on the possibility that the poor match
between theory and empirical work results not from how we measure human capital, but
from the potentially endogenous relationship between changes in human capital and
economic growth. Using data from developed and developing countries, we present
1

2
evidence suggesting that human capital is, in fact, endogenously determined and
therefore empirical analysis requires an instrumental variable approach.
Of course, we are not the first to introduce instrumental variables to this literature.
Pritchett (2001) and Krueger and Lindahl (2001) apply an instrumental variables
technique to estimate the effect of changes in average years of schooling on growth,
using Nehru, Swanson, and Dubey (1995) and Kyriacou’s (1991) schooling data as
instruments, respectively.2 Their purpose in using the instrumental variables method is to
overcome the measurement error issue, and not necessarily to address endogeneity per se.
Indeed, the Nehru, Swanson, and Dubey and Kyriacou schooling variables are not
appropriate instruments if one is trying to address endogeneity. A valid instrument in this
context is one that determines changes in schooling but is not a direct determinant of
economic growth; alternative measures of schooling are arguably just as important a
determinant to growth as is the Barro and Lee measure of schooling. Furthermore,
researchers like Glewwe and Hanan (2004) have shown that demand for education is
positively correlated with increases in household income and wealth, thus emphasizing
the two-way relationship between economic growth and human capital accumulation.
It appears that a key reason that researchers have not yet addressed the
endogeneity issue is because of the lack of valid instruments. To our knowledge, no
studies exist in which the endogeneity of human capital accumulation is tested, and if
found to be present, the instrumental variables method is used to estimate the effects of
changes in human capital on growth. Skidmore and Toya (2002) demonstrate that
2 Curiously, Pritchett (2001) finds that instrumental variables does not lead to a positive estimated effect of changes in schooling on growth, but Krueger and Lindahl (2001) find that instrumental variables yields a positive effect of changes in schooling on per capita GDP growth. Depending on specification and whether the coefficient on capital is constrained, these coefficient estimates range from 0 to a range similar to estimates generated from micro data.
3
climatic natural disasters affect growth through human capital accumulation, indicating
that a climatic disaster variable may be an appropriate instrument. In the aftermath of the
2004 Southeast Asian Tsunami that killed more than 280,000 and affected millions, it is
not unreasonable for economists to consider how the threat of natural disasters might
affect human and physical capital decisions. Skidmore and Toya (2002) suggest that due
to relatively recent advances in forecasting, climatic disasters (as opposed to geologic
disasters) are primarily a threat to immobile physical capital but not mobile forms of
capital such as human capital. The relative increase in exposure to risk of physical
capital provides an incentive for economic agents to invest relatively more heavily in
human capital. The correlation between exogenous natural disasters and endogenous
investment decisions over time suggest that disasters are a valid instrument for factors
that affect growth.
In this paper, we use measures of the propensity for natural disasters to test for the
endogeneity of schooling enrollment and changes in average years of schooling over the
1960-1990 period.3 We find evidence of endogeneity. We therefore employ instrumental
variables techniques to estimate the effects of changes in human capital on economic
growth. The instrumental variables estimation procedure yields a coefficient on human
capital accumulation that is larger in magnitude than found in our OLS estimates and in
most previous studies that use data from a wide range of countries and is closer to
theoretic predictions.
Bils and Klenow (2000) attempt to determine the causal relationship between
schooling and economic growth. They point out that a common belief is that “reverse
causality” or simultaneity is likely to lead to an over-estimate of the effect of human 3 Schooling enrollment data run through 1985.
4
capital accumulation on growth because anticipated increases in future economic growth
could cause schooling to increase. In fact, however, the direction of bias introduced by
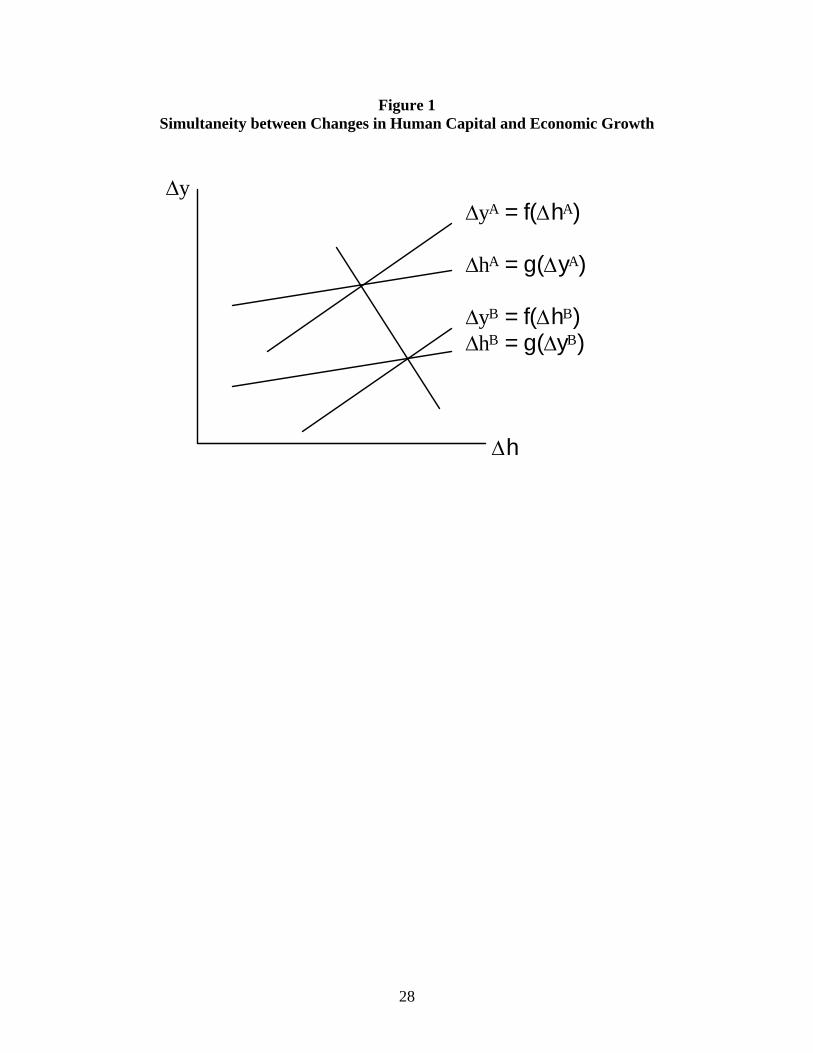
simultaneity is indeterminate. To illustrate, consider Figure 1. We characterize two-way
causality with two equations: One in which changes in human capital is a function of
changes in output, ∆h = g(∆y), and vise versa, ∆y = f(∆h), for two countries A, and B.
These two countries can also be thought of as representative of, say, OECD verses
developing countries. The intersections between the two equations for each country
depict what we might observe in the data. In this example, the line connecting the two
intersections indicates a negative relationship between changes in output and changes in
human capital. Of course, this is just an example; the direction of bias could be in
another direction. Therefore, to observe the causal relationship of changes in human
capital on changes in output, we control for other factors that determine economic growth
and identify the ∆y = f(∆h) function with an appropriate instrument.
Our paper mirrors instrumental variables approaches to estimating the
contribution of physical capital. Barro and Sali-i-Martin (1995) use the instrumental
variables technique to show that the rate of physical capital investment is not a significant
determinant of long-run growth. A smaller role for capital may be consistent with the
idea that current coefficient estimates of changes human capital are too small, and an
instrumental variables approach for human capital accumulation may be valuable.
The remainder of the paper is organized as follows. The next section provides a
review of the relevant theoretical considerations and outlines our empirical strategy. In
section 3, we present an overview of natural disasters and describe the intuition behind
their effectiveness as instruments. In section 4, we carefully evaluate the validity of

5
natural disasters as an instrument and present the empirical analysis. Section 5
concludes.
2. Theoretical and Empirical Underpinnings
Two general theoretic approaches have been used as a basis for determining the
appropriate functional form for empirical growth research. First, Barro (1991) and others
build on endogenous growth models (such as in Romer (1990)) in which human capital is
a primary input to research and development. In this approach, the rate of technological
progress depends on initial stocks of human capital. Nelson and Phelps (1966) suggested
that countries with larger stocks of human capital absorb new ideas and products that
have been developed abroad more easily, which could generate a feedback effect between
growth and human capital.
A second approach follows the work of Lucas (1988) who stressed the importance
of externalities associated with connections to others who are well educated. In this
context, increases in human capital per person lead to higher rates of human and physical
capital investment and per capita economic growth. In addition, rising human capital per
person increases productivity in the market place, reducing fertility rates and thus
increasing output per capita (Becker, Murphy, and Tamura, 1990). These two approaches
suggest that human capital could enter into the growth equation in initial levels or in
changes.
A growth accounting approach is often used to empirically evaluate the
determinants of growth: an aggregate production function in which per capita income yi
for country i is dependent upon three input factors, per capita physical capital, ki, per
6
capita human capital, hi , and technology, A. Transforming a Cobb-Douglas production
function, such as yi = Aikiαhi
1-α, into a growth equation yields
)/)(1()/(// ihihikikAAyy iiii ∆−+∆+∆=∆ αα , (1)
which suggests that changes in human capital should be an important determinant of
growth.
Pritchett's (2001) microeconomic estimates of the return to schooling support
these theories and imply that even in the absence of any human capital externalities the
contribution of changes in human capital to growth should be somewhere on the order of
0.20-0.40.4 More recent studies also generate estimates in this range. Evidence of human
capital externalities would require estimates that exceed this upper bound, but
disentangling the feedback effects of income, technological advances, human capital
accumulation, and physical capital investment is difficult. The appropriate approach
would be an instrumental variables technique such as one used by Barro and Sala-i-
Martin (1995). The problem has been finding appropriate instruments. To our
knowledge, researchers have not yet identified valid instruments to appropriately test for,
and (if endogeneity is found), use appropriate econometric procedures to estimate the
effects of human capital accumulation on growth. Thus, researchers have been cautious
in their interpretation of the coefficient estimates on changes in average years of
schooling. In the next section, we examine whether the propensity for natural disasters
is an appropriate instrument, and subsequently use measures of disasters to estimate a
growth equation using the instrumental variables technique.
4 Krueger and Lindahl (2001) summarize the microeconomic research on returns to schooling. Their conclusion regarding the how much education should matter in a growth regression is similar to that of Pritchett (2001).
7
3. Natural Disasters as an Instrument
Exposure to catastrophes varies significantly from country to country.5 Although
death tolls vary from year to year, major disasters kill about 140,000 annually worldwide.
While about 95% of the deaths occur in developing countries, natural catastrophes also
have severe impacts on developed countries.6 Asia is affected most severely by natural
disasters both in terms of the number of events and deaths.
In pre-modern times disasters affected both physical and human capital decisions.
Historically, recovery from extreme disasters such as region-wide famine caused by
severe drought may have taken as long as 25 years. Physical capital and skills
disappeared with death and out-migration of craftsmen. Before the industrial revolution,
natural disasters affected the wealthy, who ignorant of engineering principles, spent
enormous sums of money to over-design their structures to withstand forces well in
excess of the likely forces (Alexander, 1993), which may have reduced investment in
other forms of productive capital.
It is important to note that different types of disasters may affect physical and
human capital differently. Climatic disasters, which are generally more predictable than
geologic disasters, may increase investment in human capital relative to physical capital
because people are easier to evacuate than physical capital. The higher relative risk
associated with disasters provides an incentive for economic agents to invest relatively
more heavily in mobile capital like education. As an illustration of the exposure of 5 For example, Jones (1981) compiles data on disasters and finds that a person living in Asia is about 30 times more likely to die in a seismic disaster than one living in Europe. This calculation is, of course, based on very imprecise data as tallies on deaths and damages was not always compiled. Alexander (1993) shows that most hurricanes occur within the tropics between latitudes 30° N and S, but not within ±5° of the equator where atmospheric disturbances tend to be insufficient to cause them. 6 For example, according to Alexander (1993), in the United States 30 disasters are declared in an average year, of which floods account for about 40% of property damage, while hurricanes and other tropical storms yield 20% of all disaster related fatalities. See Shah (1983).

8
physical capital relative to human capital to climatic disasters, in 1992 Hurricane Andrew
caused damages in southern Florida and Louisiana exceeding $20 billion but due to
effective forecasting and evacuation procedures, only 13 deaths occurred.
The effects on physical relative to human capital of geologic disasters are less
clear. Shaw (1994) estimates the cost of an earthquake equivalent in magnitude to the
Great Kanto earthquake of 1923 in the Tokyo area, home to about one-fifth of Japan’s
population, to be as much as $1.2 trillion7 and holds potentially horrific consequences for
human life. The recent tsunami event in Southeast Asia is a dire illustration of the
catastrophic human loss that can accompany a disaster event. In the case of climatic
disasters or more generally natural events that can be forecasted, disaster risk could lower
the expected return to physical capital, reducing physical capital investment. This in turn
increases the relative return to human capital. We therefore expect a positive relationship
between climatic disasters and human capital, but the net long-run effect of disaster risk
on physical capital is theoretically ambiguous. Alternatively, Dacy and Kunreuther
(1969) and Tol and Leek (1999) suggest that the short-run economic effects of natural
disasters are positive. Since disaster-prone areas are likely to use some of the limited
resources for disaster management (stronger and better engineered structures for
example), we might expect a higher level of investment to meet these needs.
This discussion suggests that disaster risk may indeed have an effect on steady
state levels of human and physical capital. We assert, however, that during the 20th
7 $1.2 trillion is roughly one-fifth of the Japanese GDP. To provide a frame of reference, the estimated losses from the Kobe earthquake were $114 billion or about one-tenth of the estimated effect of a quake of similar magnitude in Tokyo. Kobe’s population is roughly one-fifth of Tokyo’s more than 8 million people. If economic losses are proportional to population size, then a quake in Tokyo of similar magnitude would yield losses of about $570 billion or about half of Shaw’s estimate. But Yokohama (with a population of 3.3 million) and the highly populated area surrounding Tokyo would also be affected.
9
century disaster risk has also played a role in human and physical capital accumulation,
and this assertion is supported by our empirical analysis. Improvements in forecasting as
well as information dissemination that occurred over the past 100 years have enabled
economic agents to assess risk, particularly from climatic disasters, and make appropriate
responses to such events. Technology-enhanced forecasting has effectively enabled
agents to protect human life (and thus human capital) from the onslaught of hurricanes,
typhoons, and the like. This change may have altered the relative expected returns to
human and physical capital accumulation during the period of analysis, and as a result we
might observe changes in the accumulation of human and perhaps physical capital.
The above discussion suggests that disasters can affect growth by affecting human
and physical capital investment. In Lucas (1988) and Azariadis and Drazen (1990),
individuals invest in physical and human capital, and the aggregate stock of human
capital accumulated by previous generations has a positive intergenerational externality
on the aggregate level of human capital of succeeding generations. This intergenerational
externality is the driving force of growth and is implicitly assumed in a number of growth
models in which human capital is the key determinant of growth.8 Consider the case
where an economic agent may invest in human and physical capital. Increased risk of
capital destruction lowers the expected return to physical capital, making human capital
relatively more attractive.9 Agents respond by increasing human capital
investment, ii hh /∆ . In addition, since human capital is an important component in the
8 For example, if, in the Lucas (1988) model, the infinitely-lived representative agent is interpreted as a family consisting of finitely-lived agents, no growth would arise without assuming some kind of intergenerational externality. 9 Of course, natural disasters are also a risk to life and thus also lower the expected return to human capital investment. However, human capital destruction (death) is a far less likely result than loss of physical capital. Therefore we expect the risks to physical capital to dominate the risks to life.
10
adoption of new technologies (Benhabib and Spiegel, 1994), the rate of technological
advancement might be enhanced, particularly for developing countries in the process of
“catch-up.”
We can formalize this reasoning with a simple four equation- model similar to the
approach used by Frankel and Romer (1999) to evaluate the effects of trade on economic
development. First, the growth rate in a country is a function of the rate of technological
advancement, the rate of human capital accumulation, and the rate of physical capital
investment and other factors:
iiiii ihihikikAAyy ελβ +∆+∆+∆=∆ )/()/(// (2)
where yi is per capita income for country i, Ai represents the level of technology, ki is per
capita physical capital stock, hi represents human capital stock per capita, and ∆ indicates
a change over time. Finally, ε represents other factors that determine growth in per capita
income. In the spirit of Nelson and Phelps (1966), the rate of change in technological
advancement depends on the initial stock of human capital, the growth in human capital
as well as other factors:
iiiii hhhAA πχα +∆+=∆ )/()(/ (3)
The idea here is that in order for a country to adopt and make use of new technology, its
workers must first have the ability to learn and put the new technology to use.
Substituting equation (3) into equation (2) yields:
iiiiiiiii hhkkhyy επλχβα ++∆++∆+=∆ )/)(()/()(/ (4)
where π represents factors that indirectly affect growth via technological advancement
(e.g., government subsidized research and development) and ε represents factors that
affect growth directly.
11
The two other equations concern the determinants of physical capital investment
and human capital accumulation. The rate of physical capital investment is a function of
two variables that reflect climatic and geologic disaster propensities and other factors:
iiiii GCkk δγφϕ +++=∆ / (5)
in which Ci represents the propensity for climatic disasters and Gi represent the
propensity for geologic disasters. The two disaster types enter into the equation
separately because each may have their own effects on investment decisions. Lastly, δi
represents other factors that determine investment in physical capital.
Human capital accumulation is also modeled as a function of climatic and
geologic disasters and other factors:
iiiii GChh νµλπ +++=∆ / (6)
Again, climatic and geologic disasters enter into the equation separately.
The residual in equation (4), ii επ + , are likely to be correlated with the residuals
in equations (5) and (6), iδ , and iν . That is, factors that determine growth are also likely
to determine physical and human capital accumulation. The key identifying assumption
is that countries’ disaster characteristics are uncorrelated with the residual in equation (2).
In other words, the propensities for climatic and geologic disasters are not affected by
economic growth or by other factors that affect growth. It is difficult to think of
important ways that natural disasters could affect long-run growth other than through
their effects on investment decisions.
If Ci and Gi are uncorrelated with ii επ + , data on ii yy /∆ , initial period ih ,
ii hh /∆ , ii kk /∆ , iC and iG would allow us to estimate equation (2) by instrumental
12
variables: iC and iG are correlated with ii hh /∆ and ii kk /∆ by (5) and (6) and are
uncorrelated with ii επ + by our identifying assumption. Skidmore and Toya (2002)
show that the prevalence of climatic and geologic disasters are significant determinants of
human capital accumulation, suggesting that disasters may work well as instruments.
To empirically evaluate the validity of disasters as instruments, we use data from
the Center for Research on the Epidemiology of Disasters (CRED) at the Universite
Catholicque de Louvain in Brussels, Belgium (EMDAT, 2000). CRED has compiled
data on the occurrences and effects of mass disasters in the world from 1900 to the
present. CRED uses specific criteria for determining whether an event is classified as a
natural disaster.10 The database includes information on number of events, damages,
numbers affected, and deaths.
We are reluctant to use data on damages, number affected, and deaths in this
study for three reasons. First, data on these factors are not always available. More
importantly, since total damages increase with income, the damages caused by disasters
may be endogenously determined. Similarly, numbers of people affected fall with
income so that low-income countries experience more human casualties and losses.
Wealthy countries clearly spend more money on safety in terms of building codes,
engineering, and other safety precautions, reducing deaths. On the other hand, wealthy
countries also have far more physical capital at risk should a natural event occur,
increasing the possible damages. Finally, as noted by Albala-Bertrand (1993), the
impacts of disasters are sometimes exaggerated in developing countries in order to secure
10 The reasons for taking into account a disaster are: 1) 10 or more people were killed; 2) 100 or more people were affected/injured/homeless, 3) significant damages were incurred; or 4) a declaration of a state of emergency and/or an appeal for international assistance was made.

13
international assistance. Therefore, data on damages and loss of life are to some degree
unreliable. Instead of damages, number affected, and deaths, we use the total number of
significant events occurring in a country over the 1960-1990 period because we believe
the occurrence of a natural event is the best exogenous measure of disaster risk available.
Whether or not a country experiences a natural event does not depend on its level of
development.
In the remainder of this paper, we use the total number of natural events
normalized by land area since larger countries generally experience more natural
disasters. We note, however, that using the unadjusted total number of natural events
yields qualitatively similar results.11
4. Empirical Analysis
4.1 Quality of the Instruments
We begin our empirical analysis by estimating several regressions of different
measures of human capital to assess whether climatic and geologic disasters are robust
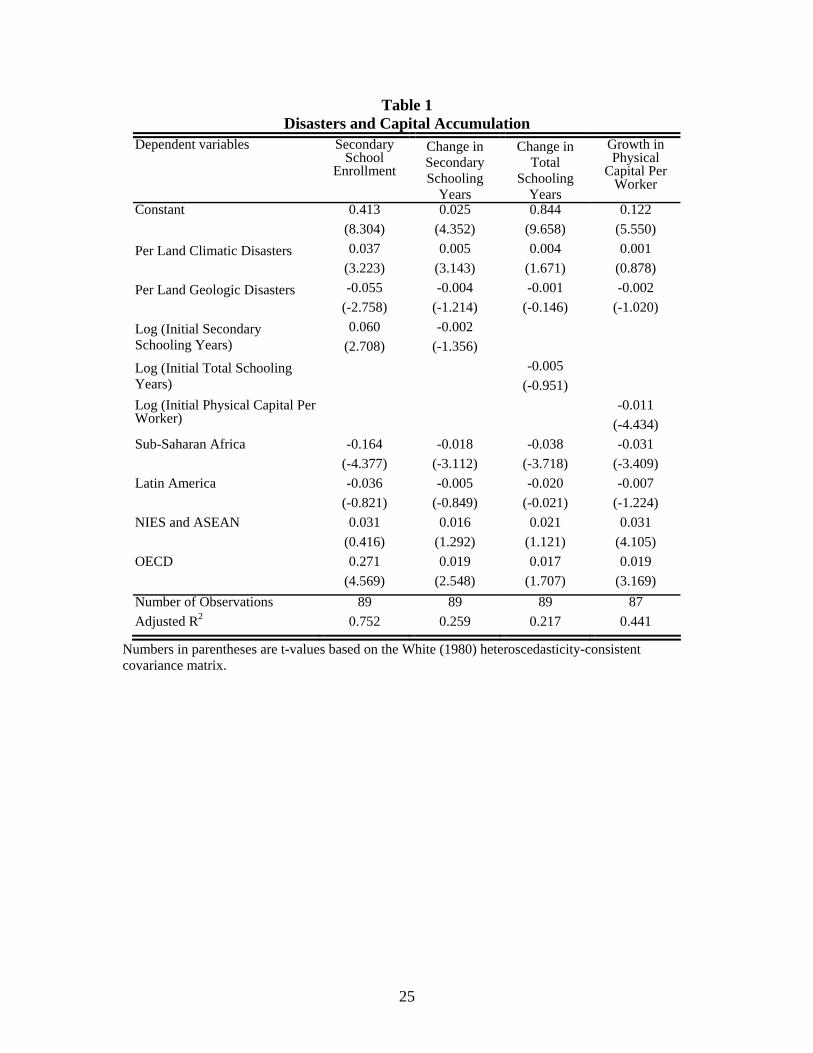
determinants of both human and physical capital accumulation. The estimates presented
in Table 1 come from a 1960 through 1990 cross-section of 89 countries (or 87 countries
in some specifications). We examine the relationship between three measures of human
capital (secondary schooling enrollment, changes in average years of secondary
schooling, and changes in average years of total schooling)12 and the disaster variables
while controlling for the log of the initial level of human capital and several continent
11 See Skidmore and Toya (2002) for a summary of results using the total number of natural events. 12 See Appendix Tables A, B, and C for detailed information on specific definitions, a list of countries, and summary statistics for all variables included in the analysis.
14
specific indicator variables.13 These and all regressions presented in the paper use
White’s (1980) heteroskedasticity-consistent covariance matrix. The climatic disaster
variables are significant and positively correlated with each measure of human capital
accumulation, whereas there is a negative but generally statistically insignificant
coefficient on the geologic disaster variable. In column 4 of Table 1 we also present
estimates of the determinants of physical capital accumulation. Neither geologic nor
climatic disasters are significant determinants of growth in physical capital per worker.14
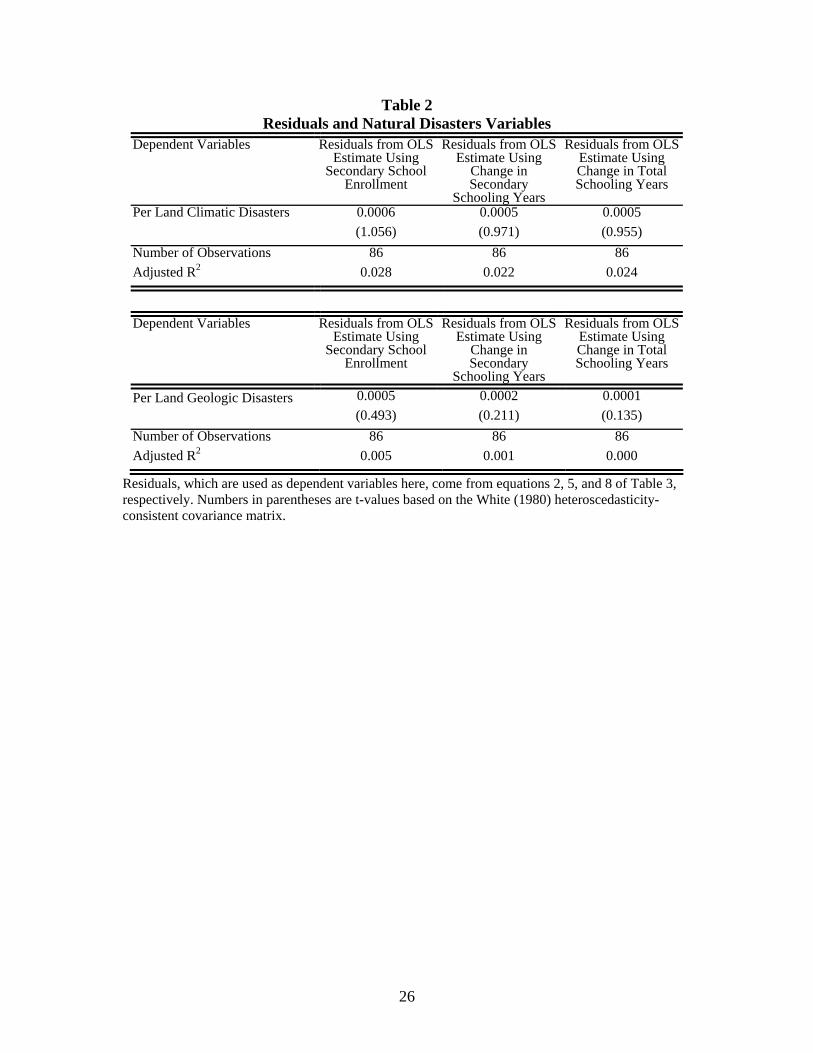
While these estimates demonstrate that climatic disasters are significantly
correlated with several different measures of human capital accumulation, they must also
be uncorrelated with the residual from the growth equation to be valid instruments. Table
2 contains the results from tests of the correlation between the instruments and the
residuals from the growth equations shown in Table 3 (which are discussed below).
These results show that the instruments are uncorrelated with the residuals from the
growth equations.
4.2 Growth Estimates
Given that the natural disaster variables appear to be appropriate instruments, we
conduct a Hausman test to determine whether an endogenous relationship exists between
growth and our measures of human capital. To conduct the Hausman test, we first
calculated the predicted values of our measures of human capital accumulation (the first-
stage regression). Since physical capital investment is also endogenously determined we 13 In regressions not presented but are available upon request, we also examine measures of schooling quality or quality-adjusted human capital stock as in Wossman (2003). However, the primary objective in this paper is to examine changes in schooling over time and not stock measures such as schooling quality or quality-adjusted human capital stock. Skidmore and Toya (2002) find a positive correlation between measures of schooling quality (Hanushek and Kim, 1995) and climatic disasters. 14 In our three-stage least squares estimates, we also use the initial level of physical capital stock as an instrument. Barro and Sali-i-Martin (1995) also use the initial level of physical capital stock as instrument for growth in physical capital.
15
also generate a predicted value from a physical capital investment equation, which is
presented in column 4 of Table 1. We then include the predicted values of human and
physical capital accumulation variables in the second-stage growth regression. The
coefficients on the predicted values of human and physical capital investment are tested
against zero using an F test.15 All three measures of changes in schooling (as well as
growth in physical capital) are shown to be endogenously determined. Results of the
Hausman test are presented in Appendix Table D.
We now proceed to estimate the relationship between the three measures of
human capital accumulation and growth, using the climatic and geologic natural disasters
and the initial level of physical capital per worker as instrumental variables, while
controlling for the natural logarithm of the respective measure of the initial level of
human capital, the growth in physical capital per worker, and several continent-specific
indicator variables.
Before we present the results, a brief discussion of the how changes in schooling
should enter into the growth regression is in order. A common approach to estimating a
growth equation is the log-log specification. As described in Krueger and Lindahl
(2001), a log-log specification is appropriate if one assumes that schooling enters an
aggregate Cobb-Douglas production function linearly. Topel (1999), however, argues
that the Mincer-type specification is more appropriate, and that human capital should be
specified as an exponential function of schooling in the production function. This means
15 See Kennedy (1994) for detailed discussion of this version of the Hausman test.

16
that the change in linear years of schooling would enter the growth function.16 We follow
Krueger and Lindahl (2001) and others who estimate linear education specifications.
The first column in Table 3 contains estimates of growth in GDP per capita
regressed on a constant, growth in physical capital per worker, and secondary schooling
enrollment. This regression yields a positive and significant coefficient on secondary
schooling enrollment. We find a similar coefficient on secondary schooling enrollment
when we include initial secondary schooling years and a series of regional dummy
variables as additional covariates. When these variables are included (column 2), the
OLS estimates of the contribution of human capital accumulation is nearly identical to
column 1. Column 3 presents the instrumental variables estimation. Here the coefficient
on secondary schooling enrollment nearly triples. While these estimates suggest that the
effect of human capital accumulation is biased downward in the OLS estimates, the
nature of this specification prevents us from making direct comparisons with the micro-
estimates of the effect of human capital accumulation. We now turn to an examination of
measures of changes in schooling, which provide estimates that are directly comparable
to the micro-estimates.
The fourth column in Table 3 contains estimates of growth in GDP per capita
regressed on a constant, growth in physical capital per worker, and the change in average
years of secondary schooling. This regression yields a positive and significant coefficient
on the change in average years of secondary schooling: a coefficient estimate of 0.21 is
16 Consider the following Cobb-Douglas production function: y=Akαh1-α, where y is per capita GDP, A is the level of technology, k is per capita capital stock, and h is per capita human capital. Transforming this function into log form yields: lny = lnA + αlnk + (1-α)lnh. With a Mincer-type model, h equals ψes with s = average years of schooling. Taking the log difference over time yields: lnyt – lnyt-1 = (lnAt – lnAt-1) + α(lnkt - lnkt-1) + (1-α)(lnht - lnht-1). Substituting in for h yields: lnyt – lnyt-1 = lnAt – lnAt-1 + α(lnkt - lnkt-1) + (1-α)(lnψ + st - lnψ - st-1) or lnyt – lnyt-1 = lnAt – lnAt-1 + α(lnkt - lnkt-1) + (1-α)(st - st-1).
17
in the lower range suggested by Pritchett (2001). We find a smaller coefficient on
changes in secondary schooling when we include initial years of schooling and a series of
regional dummy variables as additional covariates.17 When these variables are included
(column 5), the OLS estimates of the contribution of human capital accumulation is about
0.14, a number that falls below Pritchett's (2001) suggested range. This result reflects our
motivation for exploring endogeneity: OLS estimates are generally smaller than values
suggested by theoretic or microeconomic studies.
In column 6, we present the three-stage least squares estimates of changes in
average years of secondary schooling. Using instrumental variables leads to a coefficient
estimate on changes in secondary schooling of 0.46, which is two to three times higher
than the OLS estimates. Evidence of human capital externalities would require estimates
to exceed Pritchett’s upper range of 0.40. These findings suggest that human capital
accumulation plays a more important role in economic growth than many of the existing
empirical studies that include a wide range of countries in the analyses suggest.18 The
estimates presented here also provide some empirical evidence in support of Lucas’
human capital externality theory: an estimate of 0.46 exceeds the upper range value of
0.4 suggested by micro evidence. We also notice that once we use the instrumental
variable approach, the coefficient on physical capital investment is reduced and becomes
statistically insignificant, consistent with Barro and Sala-i-Martin (1995).
17 The error terms are normally distributed when both changes in schooling and initial schooling are included in the specifications. 18 Krueger and Lindahl (2001) present on page 1125 coefficients on changes in schooling that range between 0.013 and 0.069. On page 1112, they obtain coefficient estimates on changes in human capital that are as high as 0.61, but only if they exclude growth in physical capital from the regression. After removing outliers Temple (1999b) present coefficients on changes in schooling ranging between 0.063 and 0.165 after removing influential outliers. Using data on OECD countries and constraining the coefficient on growth in physical capital to 0.35, Englebrecht (2003) generates coefficients on changes in schooling that are as high as 0.37 and 0.71. However, he must constrain the coefficient on capital to obtain coefficient estimates on changes in schooling that are this high.

18
In columns 7-9, we modify the regressions presented in columns 4-6 by replacing
changes in average years of secondary schooling with average years of total schooling.
These estimates mirror those found in columns 4-6 except that the coefficient estimates
on change in average years of total schooling are slightly smaller. The instrumental
variables coefficient estimate on the change in average years of schooling is 0.32, which
is still in the upper range suggested by micro evidence. Again consistent with Barro and
Sala-i-Martin (1995), the coefficient on growth in physical capital becomes insignificant
in the instrumental variables analysis.
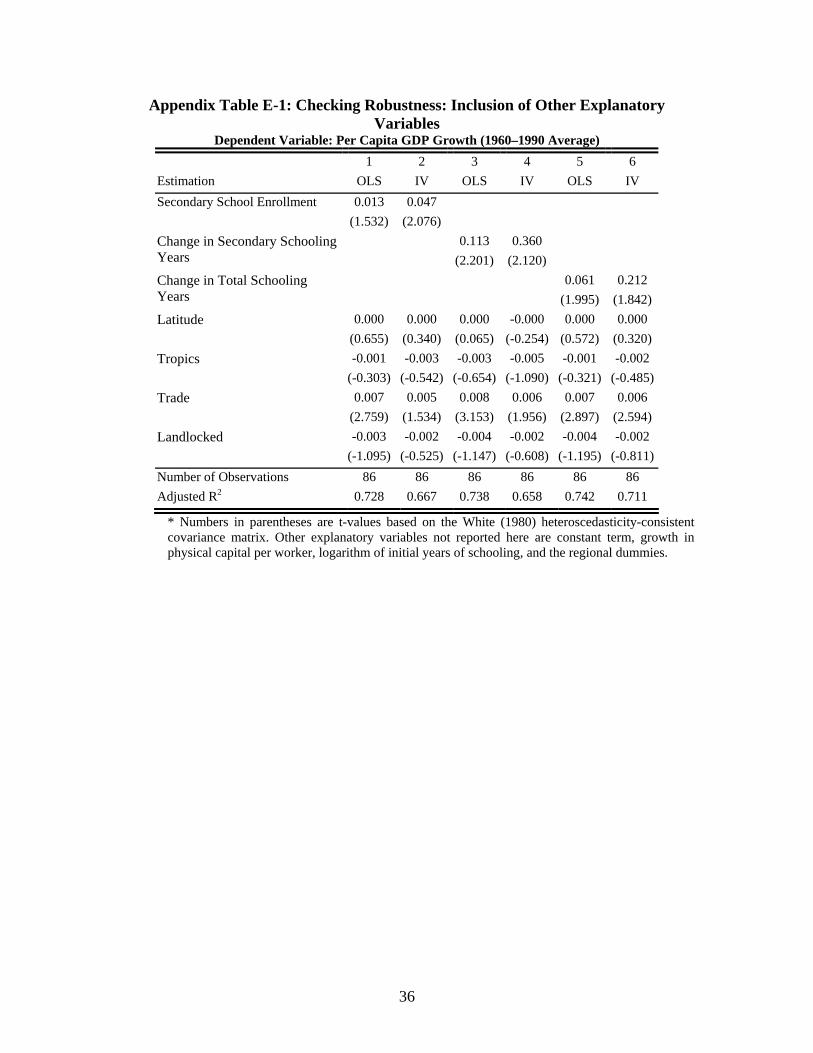
4.3 Robustness
The estimated coefficients on human capital accumulation are robust to the
inclusion of other variables that influence economic growth. We explored the robustness
of human capital effects to the inclusion of a country’s distance from the equator
(Latitude), the approximate proportion of land area subject to a tropical climate (Tropics),
the average ratio of exports plus imports to GDP for the period 1960-1990 (Trade), and
whether a country is landlocked (Landlocked). The estimated findings on the variables
that characterize human capital accumulation in these estimates, which are presented in
Appendix Table E-1, are qualitatively similar to those presented in Table 3.
Countries in Asia have experienced a remarkable rate of economic development
over the period of analysis. Thus, rates of both physical and human capital accumulation
have been exceptionally high. It is also the case the Asian countries experience frequent
natural disasters. It is possible that our findings may be driven by a spurious correlation
between disasters and economic development in these Asian countries. Although we
include regional dummies in Table 3 to control for these factors, we also examine

19
whether our findings are robust to the exclusion of these countries. In a series of
additional regressions presented in Appendix Table E-2, we find that our results are
robust to the exclusion of these countries. In a series of regressions that exclude different
sets of Asian and “ring of fire” countries, we show that the coefficients on the measures
of human capital accumulation are similar to those presented in this paper.19
Temple (1999b) shows that in a broader dataset, such as the one used in the
present study, the correlation between economic growth and increases in educational
attainment can be masked by unrepresentative data. Using the same data but omitting a
number of outliers, Temple shows that the results of Benhabib and Spiegel (1994) are
sensitive to the exclusion of outliers. We therefore use a procedure outlined by Krasker,
Kuh, and Welsch (1983) to identify outliers. The test results identify just five countries
(Botswana, Korea, Lesotho, Singapore, and Thailand) as potential outliers. We then
omitted these countries and then re-estimated each regression. The results are very
similar to those reported here (see Appendix Table E-2). Thus, the presence of influential
outliers does not appear to be affecting our results.
4.4 Why Are the Three-Stage Least Squares Estimates Greater Than the
OLS Estimates?
The finding that the instrumental variables estimates generate coefficients on
human capital accumulation that are larger than the ordinary least squares estimates is
consistent with theory, but, to be thorough, we explore in a mechanical sense why this is
19 We estimate three sets of regressions. First, we exclude five high-growth East Asian countries (Hong Kong, Japan, Korea, Singapore, and Taiwan). We then exclude a larger set of eight high-growth Asian countries (Hong Kong, Indonesia, Japan, Korea, Malaysia, Singapore, Thailand, and Taiwan). Finally, we exclude all 18 countries considered by the U.S. Geological Survey to be in the “ring of fire” (Canada, Chile, Colombia, Costa Rica, Ecuador, El Salvador, Guatemala, Honduras, Indonesia, Japan, Malaysia, Mexico, New Zealand, Nicaragua, Panama, Papua New Guinea, Philippines, and the United States). All of these results are qualitatively similar to those presented in this paper.

20
so. The ordinary least squares estimate is determined by the partial association between
economic growth and human capital accumulation, while the instrumental variables
estimate is determined by the partial association between economic growth and the
component of human capital accumulation correlated with the instruments. Given that
the ordinary least squares estimates are smaller than the instrumental variables estimate,
the partial association between economic growth and component of human capital
accumulation not associated with the instruments is weaker than its partial association the
component that is associated with the instruments.
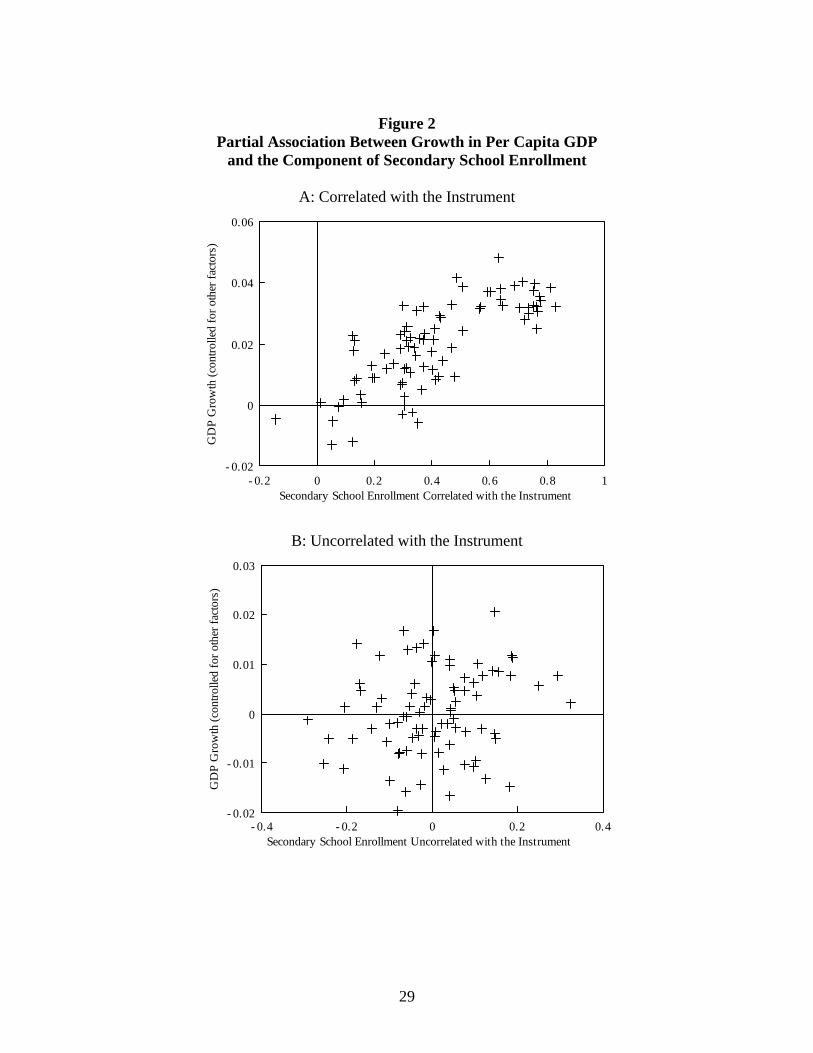
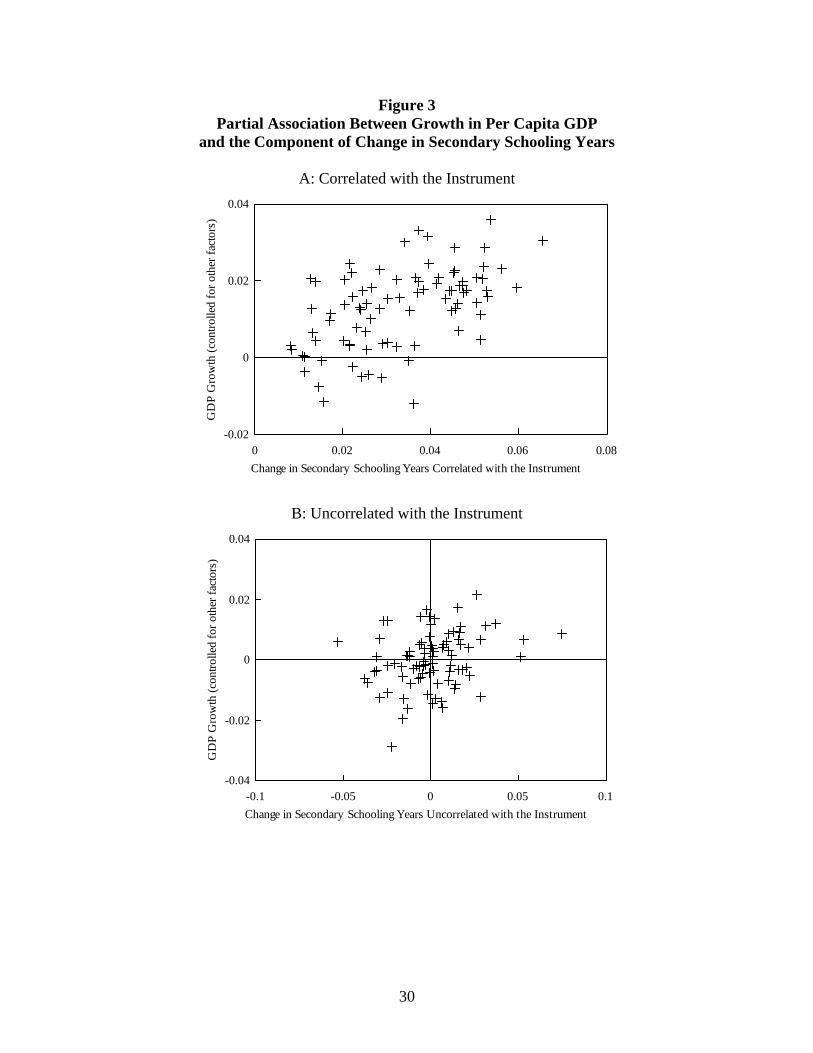
In Figures 2, 3, and 4 we present these two partial associations for the same two
measures of human capital accumulation used in Table 3. In each of the figures, Panel A
shows the positive partial association between economic growth and the component of
human capital accumulation that is correlated with the instruments. This is the positive
association that underlies the positive coefficient on human capital accumulation in the
instrumental variables regressions found in Table 3. Panel B shows the partial
association between economic growth and the component of human capital accumulation
that is not correlated with the instruments. This association is considerably smaller than
the association shown in Panel A. It is this smaller relationship that causes the ordinary
least squares estimate to be less than the instrumental variables estimates. The figures
again confirm that the difference between the ordinary least squares estimate and the
instrumental variables estimates is not due to just a few outliers.
IV. Conclusions
The gap between the theoretically-predicted contribution of human capital to
growth and the contribution estimated in most studies is increasingly receiving attention.

21
Nearly all studies that address this problem, however, address the problem as one of
measurement or specification error. Very few studies address the possibility that human
capital is an endogenous function of growth. The most likely reason that most studies do
not address this possibility is that appropriate instruments are difficult to find.
In this paper, we first show that human capital is, in fact, endogenously
determined. We then show that climatic natural disasters are a significant determinant of
secondary schooling enrollment, and changes in secondary and total schooling, but not of
economic growth directly. Thus, we appear to have identified a valid instrument with
which we can examine the potential endogeneity of human capital accumulation in
estimates of economic growth. We then use an instrumental variables procedure to
estimate the effects of changes in schooling on long-run economic growth.
We demonstrate that our findings are robust; they appear not to be driven by
outliers and are robust to the inclusion of a wide range of variables considered important
determinants of economic growth and factor accumulation in the previous literature.
These estimates also provide limited empirical evidence in support of the Lucas human
capital externality theory. Our results suggest that previous estimates may be biased
downward due to the simultaneity between human capital accumulation and economic
growth, and that endogeneity should be seriously considered in studies of economic
growth.

22
References
Albala-Bertrand, J. Political Economy of Large Natural Disasters. Oxford: Clarendon Press, 1993.
Alexander, D. Natural Disasters, New York: Chapman and Hall. 1993. Azariadis, C., and A. Drazen. "Threshold Externalities in Economic Development."
Quarterly Journal of Economics 105 (2), 1990, 501-26. Barro, R. "Economic Growth in a Cross Section of Countries." Quarterly Journal of
Economics, 106 (2), 1991, 407-43. Barro, R., and J. Lee. "International Measures of Schooling Years and Schooling
Quality." American Economic Review, 86 (2), 1996, 218-23. Barro, R., and X. Sala-i-Martin. Economic Growth. Boston: McGraw Hill. 1995. Bassanini, A., and S. Scarpetta. “Does Human Capital Matter for Growth in OECD
Countries? A Pooled Mean-Group Approach.” Economics Letters, 74 (3), 2002, 399-405.
Becker, G. S., K. M. Murphy, and Tamura, R. “Human capital, fertility, and economic
growth.” Journal of Political Economy, 98 (5), 1990, S12-37. Benhabib, J., and M. Spiegel. "The Role of Human Capital in Economic Development:
Evidence From Aggregate Cross-Country Data." Journal of Monetary Economics, 34, 1994 (2), 143-73.
Bils, M., and P. Klenow. "Does Schooling Cause Growth?" American Economic Review,
90 (5), 2000, 1160-83. Dacy, D. C., and H. C. Kunreuther. The Economics of Natural Disasters. New York:
Free Press, 1969. Easterly, W., and H. Yu. “Global Development Network Growth Database.” Taken
from the World Bank Research Department's web page, http://www.worldbank.org/research/growth/GDNdata.htm, 2000.
Engelbrecht, H. “Human Capital and Economic Growth: Cross-section Evidence for
OECD Countries.” Economic Record, 79 (2), 2003, S40-S51. Englander, A., and A. Gurney. “Medium-term Determinants of OECD Productivity.”
OECD Economic Studies, 22 (2), 1994, 49-109. EMDAT, The OFDA/CRED International Disaster Database, Universite Catholicque de
Louvain, Brussels, Belgium, www.md.ucl.ac.be/cred, 2000.

23
Frankel, J., and D. Romer. “Does Trade Cause Growth?” American Economic Review, 89 (3), 1999, 379-99.
Gemmel, N. “Evaluating the Impacts of Human Capital Stocks and Accumulation on
Economic Growth.” Oxford Bulletin of Economics and Statistics, 58 (1), 1996, 9-28.
Glewwe, P., and J. Hanan. “Economic Growth and the Demand for Education: Is There
a Wealth Effect?” Journal of Development Economics, 74 (1), 2004, 33-51. Hanushek, E., and D. Kim. “Schooling, Labor Force Quality, and Economic Growth.”
NBER Working Paper No. 5399, 1995. Hanushek, E., and D. Kimko. “Schooling, Labor-Force Quality, and the Growth of
Nations.” American Economic Review, 90 (5), 2000, 1184-1208. Hall, R.E., and C.I. Jones. “Why Do Some Countries Produce So Much More Output per
Worker than Others?", Quarterly Journal of Economics, 114 (1), 1999, 83-116. Jones, E. L. The European Miracle: Environments, Economies and Geopolitics in the
History of Europe and Asia. Cambridge: Cambridge University Press, 1981. Kennedy, P. A Guide to Econometrics. Cambridge: The MIT Press, 1994. Krasker, W., E. Kuh, and R. Welsch. “Estimation of Dirty Data and Flawed Models.”
Handbook of Econometrics, Volume I. Griliches and Intrilligator eds. North-Holland Publishing Company, New York, 1983, 660-664.
Krueger, A., and M. Lindahl. “Education for Growth: Why and for Whom?” Journal of
Economic Literature, 39 (4), 2001, 1101-1136. Kyriacou, G. “Level and Growth Effects of Human Capital,” working paper, C. V. Star
Center, NYU, 1991. Lucas, R., "On the Mechanics of Economic Development." Journal of Monetary
Economics, 22 (1), 1988, 3-42. Mankiw, G., D. Romer, and D. Weil. "A Contribution to the Empirics of Economic
Growth." Quarterly Journal of Economics, 106 (2), 1992, 407-37. Nelson. R., and E. Phelps. “Investment in Humans, Technological Diffusion, and
Economic Growth.” American Economic Review, 56 (1/2), 1966, 69-75. Nehru, V., E. Swanson, and A. Dubey. “New Database on Human Capital Stock in
Developing and Industrial Countries: Sources, Methodology, and Results.” Journal of Development Economics, 46 (2), 1995, 379-401.
24
Pritchett, L. "Where Has All the Education Gone?" World Bank Economic Review, 15
(3), 2001, 367-91. Romer, P. “Endogenous Technical Change.” Journal of Political Economy, 98 (5), 1990,
71-102. Sachs, J. D. and Warner, A. M. “Fundamental sources of long-run growth.” American
Economic Review Papers and Proceeding, 84 (2) 1997, 184-188. Shah, B. V. “Is the Environment Becoming More Hazardous? A Global Survey 1947 to
1980.” Disasters, 7, 1983, 202-09. Shaw, H., As quoted in the New York Times, September 20, p. C9, 1994. Skidmore, M., and H. Toya. "Do Natural Disasters Promote Long-run Growth?"
Economic Inquiry, 40 (3), 2002, 644-686. Summers, R., and A. Heston. "The Penn World Table (Mark 5.6)." Taken from the
NBER Web page, 1994. Temple, J. “The New Growth Evidence.” Journal of Economic Literature, 37 (1),
1999a, 112-156. Temple, J. “A Positive Effect of Human Capital on Growth.” Economic Letters, 65,
1999b (1), 131-134. Temple, J. “Growth Effects of Education and Social Capital in the OECD Countries.”
OECD Economic Studies, 33 (2), 2001, 57-101. Tol, R., and F. Leek. “Economic Analysis of Natural Disasters,” in Climate, Change and
Risk. T. E. Downing, A. J. Olsthoorn and R. S. J. Tol, eds. Routledge, 1999, 308-27.
Topel, R. “Labor Markets and Economic Growth,” in Handbook of Labor Economics.
Orley Ashenfelter and David Card, eds. Amsterdam: North Holland, 1999. White, H. “A Heteroskedasticity-consistent Covariance Matrix and a Direct Test for
Heteroskasticity.” Econometrica, 48 (4), 1980, 721-46. Wossman, L. “Specifying Human Capital.” Journal of Economic Surveys, 17 (3), 2003,
239-270.
25
Table 1 Disasters and Capital Accumulation
Dependent variables Secondary School
Enrollment
Change in Secondary Schooling
Years
Change in Total
Schooling Years
Growth in Physical
Capital Per Worker
Constant 0.413 0.025 0.844 0.122 (8.304) (4.352) (9.658) (5.550)
Per Land Climatic Disasters 0.037 0.005 0.004 0.001 (3.223) (3.143) (1.671) (0.878)
Per Land Geologic Disasters -0.055 -0.004 -0.001 -0.002 (-2.758) (-1.214) (-0.146) (-1.020)
0.060 -0.002 Log (Initial Secondary Schooling Years) (2.708) (-1.356)
-0.005 Log (Initial Total Schooling Years) (-0.951)
-0.011 Log (Initial Physical Capital Per Worker) (-4.434) Sub-Saharan Africa -0.164 -0.018 -0.038 -0.031
(-4.377) (-3.112) (-3.718) (-3.409) Latin America -0.036 -0.005 -0.020 -0.007
(-0.821) (-0.849) (-0.021) (-1.224) NIES and ASEAN 0.031 0.016 0.021 0.031
(0.416) (1.292) (1.121) (4.105) OECD 0.271 0.019 0.017 0.019
(4.569) (2.548) (1.707) (3.169) Number of Observations 89 89 89 87 Adjusted R2 0.752 0.259 0.217 0.441
Numbers in parentheses are t-values based on the White (1980) heteroscedasticity-consistent covariance matrix.
26
Table 2 Residuals and Natural Disasters Variables
Dependent Variables Residuals from OLS Estimate Using
Secondary School Enrollment
Residuals from OLS Estimate Using
Change in Secondary
Schooling Years
Residuals from OLS Estimate Using Change in Total Schooling Years
Per Land Climatic Disasters 0.0006 0.0005 0.0005 (1.056) (0.971) (0.955)
Number of Observations 86 86 86 Adjusted R2 0.028 0.022 0.024
Dependent Variables Residuals from OLS Estimate Using
Secondary School Enrollment
Residuals from OLS Estimate Using
Change in Secondary
Schooling Years
Residuals from OLS Estimate Using Change in Total Schooling Years
Per Land Geologic Disasters 0.0005 0.0002 0.0001 (0.493) (0.211) (0.135)
Number of Observations 86 86 86 Adjusted R2 0.005 0.001 0.000
Residuals, which are used as dependent variables here, come from equations 2, 5, and 8 of Table 3, respectively. Numbers in parentheses are t-values based on the White (1980) heteroscedasticity-consistent covariance matrix.

27
Table 3 Human Capital Accumulation and Growth
Dependent Variable: Per Capita GDP Growth (1960–1990 Average) 1 2 3 4 5 6 7 8 9
Estimation OLS OLS IV OLS OLS IV OLS OLS IV Constant -0.002 0.003 -0.007 0.001 0.008 0.004 0.001 0.002 0.016
(-0.985) (0.680) (-0.696) (0.237) (1.987) (0.491) (0.319) (0.333) (0.807)0.504 0.380 0.128 0.493 0.379 0.116 0.508 0.355 0.161 Growth in Physical
Capital Per Worker (9.336) (6.805) (0.960) (9.213) (6.918) (0.723) (9.397) (6.665) (0.965)0.023 0.022 0.060 Secondary School
Enrollment (5.914) (2.664) (3.710) 0.210 0.140 0.462 Change in Secondary
Schooling Years (4.193) (3.029) (3.362) 0.083 0.068 0.324 Change in Total
Schooling Years (2.278) (2.308) (1.866) 0.001 -0.003 0.002 0.002 Log (Initial Secondary
Schooling Years) (0.708) (-1.900) (2.171) (1.760) 0.005 0.007 Log (Initial Total
Schooling Years) (2.821) (3.626)Sub-Saharan Africa -0.001 -0.000 -0.001 0.001 -0.002 0.006
(-0.224) (-0.025) (-0.304) (0.078) (-0.475) (0.628)Latin America -0.007 -0.007 -0.006 -0.006 -0.008 -0.005
(-1.653) (-1.819) (-1.607) (-1.621) (-1.968) (-0.831)NIES and ASEAN 0.017 0.025 0.015 0.020 0.015 0.015
(3.029) (3.769) (2.760) (2.083) (2.675) (1.201)OECD -0.002 -0.010 0.002 -0.020 0.002 -0.007
(-0.371) (-1.760) (0.390) (-0.327) (0.432) (-1.177)Number of Observations
87 86 86 86 86 86 86 86 86
Adjusted R2 0.641 0.717 0.594 0.631 0.721 0.550 0.570 0.726 0.585
Numbers in parentheses are t-values based on the White (1980) heteroscedasticity-consistent covariance matrix.
28
Figure 1 Simultaneity between Changes in Human Capital and Economic Growth
∆yA = f(∆hA) ∆hA = g(∆yA) ∆yB = f(∆hB) ∆hB = g(∆yB) ∆h
∆y
29
Figure 2
Partial Association Between Growth in Per Capita GDP and the Component of Secondary School Enrollment
A: Correlated with the Instrument
- 0.2 0 0.2 0.4 0.6 0.8 1- 0.02
0
0.02
0.04
0.06
Secondary School Enrollment Correlated with the Instrument
GD
P G
row
th (c
ontro
lled
for o
ther
fact
ors)
B: Uncorrelated with the Instrument
- 0.4 - 0.2 0 0.2 0.4- 0.02
- 0.01
0
0.01
0.02
0.03
Secondary School Enrollment Uncorrelated with the Instrument
GD
P G
row
th (c
ontro
lled
for o
ther
fact
ors)
30
Figure 3 Partial Association Between Growth in Per Capita GDP
and the Component of Change in Secondary Schooling Years
A: Correlated with the Instrument
0 0.02 0.04 0.06 0.08-0.02
0
0.02
0.04
Change in Secondary Schooling Years Correlated with the Instrument
GD
P G
row
th (c
ontro
lled
for o
ther
fact
ors)
B: Uncorrelated with the Instrument
-0.1 -0.05 0 0.05 0.1-0.04
-0.02
0
0.02
0.04
Change in Secondary Schooling Years Uncorrelated with the Instrument
GD
P G
row
th (c
ontro
lled
for o
ther
fact
ors)

31
Figure 4 Partial Association Between Growth in Per Capita GDP and the Component of Change in Total Schooling Years
A: Correlated with the Instrument
0.02 0.04 0.06 0.08 0.1 0.12 0.140
0.02
0.04
0.06
Change in Total Schooling Years Correlated with the Instrument
GD
P G
row
th (c
ontro
lled
for o
ther
fact
ors)
B: Uncorrelated with the Instrument
-0.1 -0.05 0 0.05 0.1-0.03
-0.02
-0.01
0
0.01
0.02
0.03
Change in Total Schooling Years Uncorrelated with the Instrument
GD
P G
row
th (c
ontro
lled
for o
ther
fact
ors)

32
Appendix Table A: Definitions and Sources of Variables Variables Definition Source Per Capita GDP Growth Average annual growth rate of real per-capita
GDP for the period 1960-1990 SH
Growth in Physical Capital Per Worker Average annual growth rate of physical capital per worker for the period 1961-1990
GDN
Secondary School Enrollment Average gross enrollment ratio for secondary education for the period 1960-1985
BL
Change in Secondary Schooling Years Difference between years of secondary schooling in 1990 and years of secondary schooling year in 1960
BL
Change in Total Schooling Years Difference between average years of schooling in 1990 and average years of schooling in 1960
BL
Log (Initial Total Schooling Years) Natural logarithm of years of secondary schooling in the total population aged 15 and over in 1960
BL
Log (Initial Secondary Schooling Years) Natural logarithm of years of secondary schooling in the total population aged 15 and over in 1960
BL
Log (Initial Physical Capital Per Worker) Logarithm of physical capital per worker in 1961
GDN
Per Land Climatic Disasters Logarithm of 1 + number of climatic disaster events per million square Km
CRED
Per Land Geologic Disasters Logarithm of 1 + number of geological disaster events per million square Km
CRED
Sub-Saharan Africa Dummy for Sub-Saharan African countries Latin America Dummy for Latin-American Countries NIES and ASEAN Dummy for NIES and ASEAN members OECD Dummy for OECD members Latitude Country’s absolute distance from the equator HJ Tropics Proportion of land area subject to a tropical
climate SW
Trade Average ratio of exports plus imports to GDP for the period 1960-1990
SH
Landlocked Dummy for a country is landlocked SW
Sources: BL: Barro and Lee (1996)"International Measures of Schooling Years and Schooling Quality,"
American Economic Review, 86(2), 218-23, taken from the World Bank Research Department's Web page, http://www.worldbank.org/research/growth/ddbarle2.htm.
CRED: EMDAT, The OFDA/CRED International Disaster Database (2000). Universite Catholicque de Louvain, Brussels, Belgium, www.md.ucl.ac.be/cred.
GDN: Global Development Network Growth Database (2000) by William Easterly and Hairong Yu, taken from the World Bank Research Department's Web page, http://www.worldbank.org/research/growth/GDNdata.htm.
SH: Summers and Heston (1994)"The Penn World Table (Mark 5.6)," taken from the NBER Web page, http://www.nber.org/data/
SW: Sachs and Warner (1997) "Fundamental Source of Long-Run Growth", American Economic Review, Papers and Proceedings, May 1997, taken from Economic Growth Resources Web page, http://www.bris.ac.uk/Depts/Economics/Growth/sachs.htm
HJ: Hall and Jones (1999) "Why Do Some Countries Produce So Much More Output per Worker than Others?", Quarterly Journal of Economics, 114, 83-116, taken from Charles I. Jones’s web page, http://elsa.berkeley.edu/~chad/datasets.html

33
Appendix Table B: List Of Countries Algeria Haiti Norway Argentina Honduras Pakistan Australia Hong Kong, China Panama Austria Iceland Papua New Guinea Bangladesh India Paraguay Barbados Indonesia Peru Belgium Iran, Islamic Rep. Philippines Bolivia Iraq (2,3) Portugal Botswana Ireland Senegal Brazil Israel Singapore Cameroon Italy South Africa Canada Jamaica Spain Central African Republic Japan Sri Lanka Chile Jordan Swaziland Colombia Kenya Sweden Congo, Dem. Rep. Korea, Rep. Switzerland Costa Rica Lesotho Syrian Arab Republic Cyprus Liberia (2,3) Taiwan Denmark Malawi Thailand Dominican Republic Malaysia Togo Ecuador Mali Trinidad and Tobago El Salvador Malta (1,3) Tunisia Fiji Mauritius Turkey Finland Mexico Uganda France Mozambique United Kingdom Germany Nepal (2,3) United States Ghana Netherlands Uruguay Greece New Zealand Venezuela Guatemala Nicaragua Zambia Guyana Niger Zimbabwe
The number in parentheses represents the data availability: (1) not available in the sample of 89 countries, (2) not available in the sample of 87 countries, and (3) not available in the sample of 86 countries, respectively. See Appendix A for a listing of data sources and Appendix C for the number of countries for which data are available.

34
Appendix Table C: Summary of Statistics of all Variables Used in the Analysis Mean Standard
Deviation Number of
ObservationsPer Capita GDP Growth 0.021 0.018 89 Growth in Physical Capital Per Worker 0.029 0.024 87 Secondary School Enrollment 0.399 0.254 89 Change in Secondary Schooling Years 0.033 0.248 89 Change in Total Schooling Years 0.069 0.035 89 Log (Initial Total Schooling Years) 0.948 0.960 89 Log (Initial Secondary Schooling Years) -0.954 1.367 89 Log (Initial Physical Capital Per Worker) 8.667 1.385 87 Per Land Climatic Disasters 1.306 1.418 89 Per Land Geologic Disasters 0.584 0.814 89 Sub-Saharan Africa 0.225 0.417 89 Latin America 0.258 0.438 89 NIES and ASEAN 0.079 0.269 89 OECD 0.258 0.438 89 Latitude 25.51 16.77 86 Tropics 0.512 0.503 86 Trade 0.618 0.406 86 Landlocked 0.186 0.391 86

35
Appendix Table D: Hausman Test of Endogeneity*
F-value 7.054 Secondary School Enrollment
(0.0016) 7.917 Change in Secondary Schooling Years
(0.0008) 7.357 Change in Total Schooling Years
(0.0012)
Numbers in parentheses are upper tail areas. * See Kennedy (1994, p. 169) for a discussion of the Hausman Test as a test of endogeneity. For each measure of human capital accumulation, we reject the null hypothesis of exogeneity with a 99 percent level of confidence.
36
Appendix Table E-1: Checking Robustness: Inclusion of Other Explanatory Variables
Dependent Variable: Per Capita GDP Growth (1960–1990 Average) 1 2 3 4 5 6
Estimation OLS IV OLS IV OLS IV Secondary School Enrollment 0.013 0.047 (1.532) (2.076)
0.113 0.360 Change in Secondary Schooling Years (2.201) (2.120)
0.061 0.212 Change in Total Schooling Years (1.995) (1.842) Latitude 0.000 0.000 0.000 -0.000 0.000 0.000 (0.655) (0.340) (0.065) (-0.254) (0.572) (0.320) Tropics -0.001 -0.003 -0.003 -0.005 -0.001 -0.002 (-0.303) (-0.542) (-0.654) (-1.090) (-0.321) (-0.485)Trade 0.007 0.005 0.008 0.006 0.007 0.006 (2.759) (1.534) (3.153) (1.956) (2.897) (2.594)
-0.003 -0.002 -0.004 -0.002 -0.004 -0.002 Landlocked (-1.095) (-0.525) (-1.147) (-0.608) (-1.195) (-0.811)
Number of Observations 86 86 86 86 86 86 Adjusted R2 0.728 0.667 0.738 0.658 0.742 0.711
* Numbers in parentheses are t-values based on the White (1980) heteroscedasticity-consistent covariance matrix. Other explanatory variables not reported here are constant term, growth in physical capital per worker, logarithm of initial years of schooling, and the regional dummies.

37
Appendix Table E-2: Checking Robustness: Different Sample Size Dependent Variable: Per Capita GDP Growth (1960–1990 Average)
Exclusion of five Asian countries
Exclusion of eight Asian countries
Exclusion of 18 “ring of fire” countries
Exclusion of five outliers
Estimation OLS IV OLS IV OLS IV OLS IV 0.021 0.062 0.021 0.060 0.021 0.074 0.022 0.058 Secondary School
Enrollment (2.283) (3.979) (2.282) (3.899) (2.140) (3.922) (2.586) (3.023) Number of Observations 81 81 78 78 68 68 81 81 Adjusted R2 0.601 0.424 0.563 0.375 0.735 0.588 0.660 0.548
Exclusion of five Asian countries
Exclusion of eight Asian countries
Exclusion of 18 “ring of fire” countries
Exclusion of five outliers
Estimation OLS IV OLS IV OLS IV OLS IV 0.154 0.651 0.157 0.639 0.117 0.505 0.160 0.547 Change in Secondary
Schooling Years (2.916) (3.658) (2.914) (3.735) (2.227) (2.564) (3.046) (3.518) Number of Observations 81 81 78 78 68 68 81 81 Adjusted R2 0.614 0.372 0.577 0.336 0.733 0.532 0.671 0.487
Exclusion of five Asian countries
Exclusion of eight Asian countries
Exclusion of 18 “ring of fire” countries
Exclusion of five outliers
Estimation OLS IV OLS IV OLS IV OLS IV 0.074 0.408 0.078 0.447 0.061 0.253 0.084 0.512 Change in Total
Schooling Years (2.287) (1.282) (2.337) (1.291) (1.697) (1.475) (2.440) (1.906) Number of Observations 81 81 78 78 68 68 81 81 Adjusted R2 0.622 0.438 0.585 0.382 0.746 0.671 0.673 0.443
* Numbers in parentheses are t-values based on the White (1980) heteroscedasticity-consistent covariance matrix. Five Asian countries are Hong Kong, Japan, Korea, Singapore, and Taiwan. Eight Asian countries are Hong Kong, Indonesia, Japan, Korea, Malaysia, Singapore, Thailand, and Taiwan. 18 “ring of fire” countries are Canada, Chile, Colombia, Costa Rica, Ecuador, El Salvador, Guatemala, Honduras, Indonesia, Japan, Malaysia, Mexico, New Zealand, Nicaragua, Panama, Papua New Guinea, Philippines, and the United States .Other explanatory variables not reported here are constant term, growth in physical capital per worker, logarithm of initial years of schooling, and the regional dummies.
Related Documents