A Probabilistic Tsunami Hazard Study of the Auckland Region, Part I: Propagation Modelling and Tsunami Hazard Assessment at the Shoreline WILLIAM POWER, 1 XIAOMING WANG, 1 EMILY LANE, 2 and PHILIP GILLIBRAND 2,3 Abstract—Regional source tsunamis represent a potentially devastating threat to coastal communities in New Zealand, yet are infrequent events for which little historical information is available. It is therefore essential to develop robust methods for quantitatively estimating the hazards posed, so that effective mitigation measures can be implemented. We develop a probabilistic model for the tsunami hazard posed to the Auckland region of New Zealand from the Kermadec Trench and the southern New Hebrides Trench subduction zones. An innovative feature of our model is the sys- tematic analysis of uncertainty regarding the magnitude-frequency distribution of earthquakes in the source regions. The methodology is first used to estimate the tsunami hazard at the coastline, and then used to produce a set of scenarios that can be applied to produce probabilistic maps of tsunami inundation for the study region; the production of these maps is described in part II. We find that the 2,500 year return period regional source tsunami hazard for the densely populated east coast of Auckland is dominated by events originating in the Kermadec Trench, while the equivalent hazard to the sparsely populated west coast is approximately equally due to events on the Kermadec Trench and the southern New Hebrides Trench. Key words: Tsunami, New Zealand, probabilistic, hazard assessment. 1. Introduction The devastating tsunamis in the Indian Ocean in 2004 (BORRERO, 2005) and on the coast of northern Japan in 2011 (MORI et al., 2011) have highlighted the need to mitigate the effects of tsunami. Proposed mitigation measures include evacuation zoning, pro- vision of vertical evacuation structures, restrictions on land use, engineered tsunami defenses and many others (JONIENTZ-TRISLER et al., 2005;EISNER, 2005). To be effective these measures require an accurate estimation of tsunami hazard. Probabilistic tsunami hazard analysis (PTHA, e.g. RIKITAKE and AIDA, 1988;GEIST, 2006) provides a method for providing this information, and follows a similar process to that used in probabilistic seismic hazard analysis (PSHA, e.g. CORNELL, 1968;MCGUIRE, 2004). PTHA has been applied in New Zealand (POWER et al., 2007), north- west USA GONZA ´ LEZ (2009), the Mediterranean (SORENSEN et al., 2012) and Australia (BURBIDGE et al., 2008), among others. Auckland is the most populous city in New Zea- land, and is located on an isthmus between the Hauraki Gulf on the Pacific Ocean and the Manukau Harbour on the Tasman Sea. A large proportion of the 1.35 million residents live at less than 20 m asl, which makes effective tsunami hazard mitigation particularly important. At the long return periods used for matters of life safety ( [ 1,000 years), local and regional subduction-zone tsunami sources are expected to be the cause of the largest tsunamis. POWER et al.(2012) identified the Kermadec Trench subduction zone and the southern New Hebrides subduction margin (Fig. 1) as the most important sources of this type for the northern coasts of North Island, New Zealand. Substantial epistemic uncertainty [that is, uncer- tainty due to a lack of knowledge, see SENIOR SEISMIC HAZARD ANALYSIS COMMITTEE (SSHAC) (1997)] exists regarding the true magnitude-frequency distributions of these source regions. For example the maximum magnitude of earthquakes in the Kermadec Trench can only be confidently stated as being between about M w 8.5, slightly above the largest historical events, and M w 9.4 if only the length of the subduction zone constrains the possible magnitude (MCCAFFREY, 1 GNS Science, Lower Hutt, New Zealand. E-mail: [email protected] 2 NIWA, Christchurch, New Zealand. 3 CSIRO Marine and Atmospheric Research, Hobart, Australia. Pure Appl. Geophys. Ó 2012 Springer Basel AG DOI 10.1007/s00024-012-0543-z Pure and Applied Geophysics

Welcome message from author
This document is posted to help you gain knowledge. Please leave a comment to let me know what you think about it! Share it to your friends and learn new things together.
Transcript

A Probabilistic Tsunami Hazard Study of the Auckland Region, Part I: Propagation
Modelling and Tsunami Hazard Assessment at the Shoreline
WILLIAM POWER,1 XIAOMING WANG,1 EMILY LANE,2 and PHILIP GILLIBRAND2,3
Abstract—Regional source tsunamis represent a potentially
devastating threat to coastal communities in New Zealand, yet are
infrequent events for which little historical information is available.
It is therefore essential to develop robust methods for quantitatively
estimating the hazards posed, so that effective mitigation measures
can be implemented. We develop a probabilistic model for the
tsunami hazard posed to the Auckland region of New Zealand from
the Kermadec Trench and the southern New Hebrides Trench
subduction zones. An innovative feature of our model is the sys-
tematic analysis of uncertainty regarding the magnitude-frequency
distribution of earthquakes in the source regions. The methodology
is first used to estimate the tsunami hazard at the coastline, and then
used to produce a set of scenarios that can be applied to produce
probabilistic maps of tsunami inundation for the study region; the
production of these maps is described in part II. We find that
the 2,500 year return period regional source tsunami hazard for the
densely populated east coast of Auckland is dominated by events
originating in the Kermadec Trench, while the equivalent hazard to
the sparsely populated west coast is approximately equally due to
events on the Kermadec Trench and the southern New Hebrides
Trench.
Key words: Tsunami, New Zealand, probabilistic, hazard
assessment.
1. Introduction
The devastating tsunamis in the Indian Ocean in
2004 (BORRERO, 2005) and on the coast of northern
Japan in 2011 (MORI et al., 2011) have highlighted
the need to mitigate the effects of tsunami. Proposed
mitigation measures include evacuation zoning, pro-
vision of vertical evacuation structures, restrictions
on land use, engineered tsunami defenses and many
others (JONIENTZ-TRISLER et al., 2005; EISNER, 2005).
To be effective these measures require an accurate
estimation of tsunami hazard. Probabilistic tsunami
hazard analysis (PTHA, e.g. RIKITAKE and AIDA,
1988; GEIST, 2006) provides a method for providing
this information, and follows a similar process to that
used in probabilistic seismic hazard analysis (PSHA,
e.g. CORNELL, 1968; MCGUIRE, 2004). PTHA has been
applied in New Zealand (POWER et al., 2007), north-
west USA GONZALEZ (2009), the Mediterranean
(SORENSEN et al., 2012) and Australia (BURBIDGE et al.,
2008), among others.Auckland is the most populous city in New Zea-
land, and is located on an isthmus between the
Hauraki Gulf on the Pacific Ocean and the Manukau
Harbour on the Tasman Sea. A large proportion of the
1.35 million residents live at less than 20 m asl,
which makes effective tsunami hazard mitigation
particularly important. At the long return periods
used for matters of life safety ([1,000 years), local
and regional subduction-zone tsunami sources are
expected to be the cause of the largest tsunamis.
POWER et al. (2012) identified the Kermadec Trench
subduction zone and the southern New Hebrides
subduction margin (Fig. 1) as the most important
sources of this type for the northern coasts of North
Island, New Zealand.Substantial epistemic uncertainty [that is, uncer-
tainty due to a lack of knowledge, see SENIOR SEISMIC
HAZARD ANALYSIS COMMITTEE (SSHAC) (1997)] exists
regarding the true magnitude-frequency distributions
of these source regions. For example the maximum
magnitude of earthquakes in the Kermadec Trench
can only be confidently stated as being between about
Mw 8.5, slightly above the largest historical events,
and Mw 9.4 if only the length of the subduction zone
constrains the possible magnitude (MCCAFFREY,
1 GNS Science, Lower Hutt, New Zealand. E-mail:
[email protected] NIWA, Christchurch, New Zealand.3 CSIRO Marine and Atmospheric Research, Hobart,
Australia.
Pure Appl. Geophys.
� 2012 Springer Basel AG
DOI 10.1007/s00024-012-0543-z Pure and Applied Geophysics

2008). For matters of life safety it is important to take
a conservative approach to such uncertainties, and
correspondingly we develop techniques for incorpo-
rating epistemic uncertainty into the hazard analysis
in order to accommodate this in a systematic manner.
The logic-tree techniques we apply are similar to
those that ANNAKA et al. (2007) used to estimate
tsunami hazard at specific sites along the Japanese
coast; the authors of that work considered a mixture
of tsunami from local and distant earthquake sources
to infer the tsunami hazard at the locations of
important coastal facilities. Our study differs from
that of ANNAKA et al. (2007) in that we seek to esti-
mate a continuous coastal distribution of hazard
and to be able to use the coastal hazard model as
the systematic basis for probabilistic inundation
mapping.
2. Approach
The problem of uncertainty in tsunami sources is
a major one if we wish to effectively mitigate the
risks that tsunami pose. The magnitude of earth-
quakes varies naturally from event to event within a
source region: if we were able to have a precise
history of events over a long enough time frame, it
would be possible to empirically establish the true
magnitude-frequency distribution for the source.
Techniques have been developed for estimating
Figure 1Tectonic setting of the Kermadec and New Hebrides plate margins. Black triangles signify the over-riding plate at the regions’ subduction
margins. White arrows show predicted motion of the Pacific Plate relative to the Australian Plate. MH Isl. Matthew Hunter Islands, MHFZ
Matthew Hunter fracture zone, PAC Pacific Plate, AUS Australian Plate, SZ subduction zone
W. Power et al. Pure Appl. Geophys.

tsunami hazard at the coast once a magnitude-fre-
quency distribution has been determined (e.g.
BURBIDGE et al., 2008; SORENSEN et al., 2012). How-
ever, the 2011 Japan tsunami, for which the most
recent near-equivalent event was in 869, has high-
lighted that for many subduction zones, it may be
necessary to have an earthquake record spanning
more than a 1,000 years before a magnitude-fre-
quency distribution can be empirically estimated with
accuracy.
Fortunately, some of the parameters that control
the magnitude-frequency distribution can be esti-
mated by other means—for instance the strength of
interseismic coupling on a subduction interface can
be studied through geodetic techniques (e.g. WALLACE
et al., 2004). Also, the combinations of these con-
trolling parameters are subject to the constraint that
they cannot imply a magnitude frequency distribution
which is inconsistent with the available catalogue
data.
If it is possible to place uncertainty distributions
on the set of parameters that control the magnitude-
frequency distribution, then this can be used to define
an uncertainty distribution for the magnitude-fre-
quency distribution itself. This forms the basis for the
logic-tree techniques that have become established in
the field of seismic hazard analysis, but are rarely
used for tsunami hazard analysis. Notable examples
where logic trees have been used for tsunami hazard
analysis are given by ANNAKA et al. (2007) and
BERRYMAN (2005). Typically a Monte-Carlo tech-
nique is used to sample from the branches of the logic
tree, but this dictates that the hazard analysis for each
branch must be performed quickly. In this study the
logic trees that are used are relatively simple; this
makes it possible to perform a hazard analysis for
each possible branch of the logic tree.
From the set of tsunami hazard estimates and their
corresponding logic-tree weights, we can then quan-
tify the uncertainty present in the tsunami hazard.
This has important practical applications—for insur-
ance purposes we may be interested in the ‘best’ (i.e.
most likely, given available data) estimate of tsunami
hazard, while when designing a critical piece of
infrastructure we may wish to have a higher degree of
confidence that our estimate of tsunami hazard will
not be exceeded because of uncertainties in the
source characterisation. By explicitly estimating the
hazard at a specified return period and level of con-
fidence, the intention is to provide probabilistic
equivalents to established engineering terms such as
the ‘Maximum Credible Event’ [see BOMMER (2002)
for a helpful discussion of the relationship between
deterministic and probabilistic hazard assessment in
the context of seismic hazard].
Our measure of tsunami hazard, the maximum
amplitude at the coast, is both limited in its practical
relevance and constrained by the limitations of our
modelling (i.e. linear shallow water equations and
reflective boundary conditions). In part II we dem-
onstrate how to go past these limitations by
performing a hazard analysis using non-linear tsu-
nami models incorporating inundation, having first
established the appropriate magnitude-frequency
distribution to use to achieve the required confidence
level with the linearised model presented here.
3. Tsunami Source Regions
The primary regional sources of interest for the
study area are the Kermadec Trench, a subduction
zone that extends northwards from East Cape on the
North Island of New Zealand to the point where the
trench intersects the Louisville Ridge seamount
chain, and the southern New Hebrides subduction
margin that lies between the southern New Hebrides
and Fiji (Fig. 1). These were judged to be the only
regional sources capable of influencing the location
of the 2,500 year 84th percent confidence inundation
line in the Auckland region.
The Kermadec Trench accommodates westward
subduction of the Pacific Plate beneath the active
Kermadec volcanic arc (Fig. 1). Since *5 Ma-pres-
ent, back-arc extension of the overriding plate has
occurred along the Havre Trough (PELLETIER et al,
1998; WRIGHT, 1993; DELTEIL et al., 2002) and Lau
Basin (LAWVER et al., 1976; WEISSEL, 1977; PARSON
and HAWKINS, 1994). The New Hebrides Trench
defines the Australia-Pacific plate boundary zone
between the Tonga-Fiji region and New Guinea
(Fig. 1). Here the Australian Plate subducts north-
eastward beneath Vanuatu, and a complex series of
rifts and transforms lies to the north and east in the
A Probabilistic Tsunami Hazard Study of the Auckland Region
North Fiji Basin (NFB). GPS data from the Matthew
and Hunter Islands (Fig. 1) indicate that up to 5 cm/
year of convergence is occurring on the east-west
striking portion of the southern New Hebrides Trench
(POWER et al., 2012; CALMANT et al., 2003), suggest-
ing that active subduction occurs on this segment of
the New Hebrides Trench, at least as far east as
172�E. Previous studies that consider the Kermadec
Arc as a tsunami source include DE LANGE and HEALY
(2001), WALTERS et al., (2006) and POWER et al.
(2012); previous studies that consider the New Heb-
rides Arc as a tsunami source include BERRYMAN
(2005), GOFF et al. (2006) and POWER et al. (2012).
POWER et al. (2012) evaluated the available geo-
detic, geological and seismic data to produce logic
trees for each of the two source zones, and these logic
trees were used for this study. The logic trees char-
acterise the range of possible source parameters,
encompassing the range of epistemic uncertainty
[SENIOR SEISMIC HAZARD ANALYSIS COMMITTEE
(SSHAC) (1997)] in these parameters, with weighting
according to expert opinion (Figs. 2, 3). An important
constraint on the parameter weightings is that the
resulting magnitude-frequency distributions should
not be inconsistent with the available historical seis-
mic data [see Appendix of POWER et al. (2012)].
4. Unit-Source Tsunami Models
The two source regions were each divided into a
set of unit-source ‘patches’ 100 km long, and either
50 km (Kermadec Arc) or 60 km (New Hebrides)
wide (Figs. 4, 5). The position, depth and dip angles
of these patches used the values estimated from
seismic data by POWER et al. (2012).
OKADA’s (1985) elastic finite fault theory was
adopted to calculate seafloor displacement of each
unit source with 1.0-m ‘‘unit’’ slip; a pure thrust
mechanism was assumed. This displacement is con-
sidered the source of tsunami generation and is used
as the initial condition for tsunami propagation
modelling [this is similar to the approach used by
TITOV et al. (2005) to develop tsunami forecast dat-
abases]. Using these initial conditions the tsunami
propagation time history caused by 1 m of slip on
each of the unit sources was estimated using the
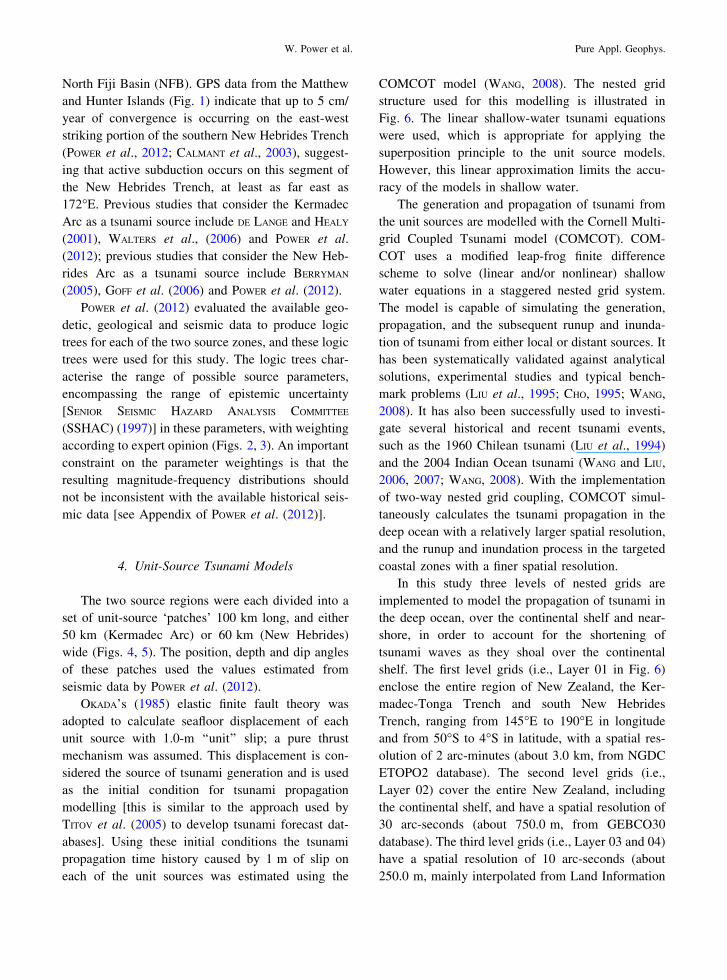
COMCOT model (WANG, 2008). The nested grid
structure used for this modelling is illustrated in
Fig. 6. The linear shallow-water tsunami equations
were used, which is appropriate for applying the
superposition principle to the unit source models.
However, this linear approximation limits the accu-
racy of the models in shallow water.
The generation and propagation of tsunami from
the unit sources are modelled with the Cornell Multi-
grid Coupled Tsunami model (COMCOT). COM-
COT uses a modified leap-frog finite difference
scheme to solve (linear and/or nonlinear) shallow
water equations in a staggered nested grid system.
The model is capable of simulating the generation,
propagation, and the subsequent runup and inunda-
tion of tsunami from either local or distant sources. It
has been systematically validated against analytical
solutions, experimental studies and typical bench-
mark problems (LIU et al., 1995; CHO, 1995; WANG,
2008). It has also been successfully used to investi-
gate several historical and recent tsunami events,
such as the 1960 Chilean tsunami (LIU et al., 1994)
and the 2004 Indian Ocean tsunami (WANG and LIU,
2006, 2007; WANG, 2008). With the implementation
of two-way nested grid coupling, COMCOT simul-
taneously calculates the tsunami propagation in the
deep ocean with a relatively larger spatial resolution,
and the runup and inundation process in the targeted
coastal zones with a finer spatial resolution.
In this study three levels of nested grids are
implemented to model the propagation of tsunami in
the deep ocean, over the continental shelf and near-
shore, in order to account for the shortening of
tsunami waves as they shoal over the continental
shelf. The first level grids (i.e., Layer 01 in Fig. 6)
enclose the entire region of New Zealand, the Ker-
madec-Tonga Trench and south New Hebrides
Trench, ranging from 145�E to 190�E in longitude
and from 50�S to 4�S in latitude, with a spatial res-
olution of 2 arc-minutes (about 3.0 km, from NGDC
ETOPO2 database). The second level grids (i.e.,
Layer 02) cover the entire New Zealand, including
the continental shelf, and have a spatial resolution of
30 arc-seconds (about 750.0 m, from GEBCO30
database). The third level grids (i.e., Layer 03 and 04)
have a spatial resolution of 10 arc-seconds (about
250.0 m, mainly interpolated from Land Information
W. Power et al. Pure Appl. Geophys.

New Zealand nautical charts), covering the nearshore
regions around Auckland and the Northland Penin-
sula (see Fig. 7 for locations of places referred to in
the text). This type of nested grid system guarantees
that the grid resolution is sufficient to resolve tsunami
wave profiles both in the deep ocean and nearshore.
Mw 9.4 (0.12)
Mw 9.2 (0.15)
Mw 8.8 (0.32)
Mw 8.5 (0.42)
Maximum Magnitude
C=0.9 (0.4)
C=0.6 (0.4)
C=0.3 (0.2)
C=0.9 (0.2)
C=0.6 (0.4)
C=0.3 (0.4)
C=0.9 (0.1)
C=0.6 (0.3)
C=0.3 (0.6)
C=0.9 (<0.01)
C=0.6 (0.2)
C=0.3 (0.8)
Coupling coefficient
Kermadec Arc
Figure 2Logic tree for the Kermadec Trench. Mw is the moment magnitude of the largest earthquake that the Kermadec Arc can experience, and C is
the interseismic coupling coefficient. Weightings are in brackets
Maximum Magnitude
Mw 8.8 (1/3)
Mw 8.6 (1/3)
Mw 8.4 (1/3)
C=0.9 (0.1)
C=0.6 (0.4)
C=0.3 (0.5)
C=0.9 (0.1)
C=0.6 (0.4)
C=0.3 (0.5)
C=0.9 (0.1)
C=0.6 (0.4)
C=0.3 (0.5)
Coupling coefficient
S. New Hebrides
Figure 3Logic tree for the Southern New Hebrides Trench. Mw is the moment magnitude of the largest earthquake that the Southern New Hebrides
Trench can experience, and C is the interseismic coupling coefficient. Weightings are in brackets
A Probabilistic Tsunami Hazard Study of the Auckland Region

Time series of model-predicted water level and
velocity were stored at 2 arc-minute intervals over the
area from 165.6 to 186.0�E and from 48.5 to 23.5�S.
Water level time-series predictions were also
stored at 30 arc-second intervals over the area from
172.3 to 176.4�E and from 39.3 to 34.0�S. To con-
serve disc space only data points within 3 km of the
coast were stored.
5. Monte-Carlo Modelling
The hazard due to each of the two studied source
regions (the Kermadec and southern New Hebrides
trenches) was evaluated separately. For each branch
of the corresponding logic tree a 100,000 year sim-
ulated sequence of earthquakes was generated,
according to the statistical source parameters that
define the magnitude-frequency distribution for the
particular branch. That is, in total there were 12
synthetic earthquake catalogues generated for the
Kermadec Trench and 9 for the southern New
Hebrides trench. A truncated Gutenberg-Richter
magnitude-frequency distribution was assumed, with
a b value of 1, matching the global magnitude-fre-
quency distribution. The maximum magnitude and
the coupling coefficient values from the logic trees
were sufficient to parameterise this distribution using
moment rate balancing (that is by reconciling the
seismic moment rate with the geodetic/geologic
moment rate), and the known plate convergence rates
and estimated interface dimensions. Earthquake
magnitudes were randomly sampled from the trun-
cated Gutenberg-Richter distribution once the
necessary parameters were determined. For each
simulated earthquake the amount of slip caused by
Figure 4Unit source locations for the Kermadec Trench. Unit sources 20–33 (not shown) extend towards Tonga, but were not used in this study
W. Power et al. Pure Appl. Geophys.

that event on each of the unit sources was determined
using the scaling relations described in POWER et al.
(2007) and a randomly sampled midpoint (along
strike) for each rupture. Using the pre-calculated
tsunami responses, a weighted linear superposition of
the tsunami time series was used to create time series
for the heights of the simulated tsunami within the
study area. The maximum water level was recorded
for each simulated event on a line around the
coasts of Auckland and the Northland Peninsula.
Using these maximum water levels for the entire
100,000 year sequence, the greatest height (to the
nearest metre) that was exceeded on more than 40
occasions was used to estimate the 2,500 year return
period hazard for the branch of the logic tree corre-
sponding to the particular synthetic catalogue.
These maximum water level exceedances were
then used as a measure of the hazard to the Auckland
region from each of the respective logic tree bran-
ches. The spread of hazard results corresponding to
the different logic-tree branches represents the spread
of uncertainty in the hazard due to our lack of
knowledge regarding the magnitude-frequency prop-
erties of the source. Analysis of hazard plots such as
Fig. 8 allowed the logic-tree branches to be ranked
according to the level of hazard in the study region.
Then, taking into account the logic-tree weightings,
the logic-tree branch corresponding to the 84th per-
centile of source uncertainty was obtained (the 84th
percentile is often used in hazard studies, as it cor-
responds to the mean plus one standard deviation in a
normal distribution). Figure 8 shows the estimated
hazard posed by that branch of the logic tree for the
Kermadec Trench, and Fig. 9 shows the equivalent
2,500 year 84th percentile hazard from the southern
New Hebrides.
Figure 5Unit source locations for the southern New Hebrides Trench
A Probabilistic Tsunami Hazard Study of the Auckland Region

Although the primary purpose of our study is to
evaluate tsunami hazard in Auckland, it is useful to
examine the results for their wider relevance. Fig-
ure 8 shows that the Kermadec Trench poses very
high levels of tsunami hazard ([5 m tsunami height
at the coast) for portions of the Coromandel Penin-
sula, Great Barrier Island and the Northland
Peninsula north of 36.5�S. These areas are directly in
the path of greatest tsunami energy in many simu-
lated events generated on the Kermadec Trench (see
POWER et al., 2012). Fortunately the densely popu-
lated central areas of Auckland are relatively
sheltered by the Coromandel Peninsula and Great
Barrier Island, though the hazard of the northern
coastal suburbs increases the further north you go
from central Auckland. Sufficient tsunami energy
‘wraps around’ the far northern tip of the Northland
Peninsula in Kermadec Trench events to pose a high
hazard to the west coast, particularly north of 36.7�S.
The hazard shown in Fig. 9, caused by earth-
quakes on the southern New Hebrides Trench, is
typically (with some exceptions) much higher on the
west coast of the Northland Peninsula than on the east.
This is a consequence of the wave-guiding roles of the
Three Kings Ridge and the Norfolk Ridge in directing
tsunami energy from this source region towards New
Zealand (see POWER et al., 2012). There are small
areas on the west coast of the Aupouri Peninsula that
show a particularly large hazard from the southern
New Hebrides; this localised sensitivity appears to be
a consequence of the interaction of waves guided
along the Three Kings Ridge with the areas in which
they initially meet the North Island landmass. This
localised effect warrants further investigation.
Figure 6Nested grid structure used for tsunami propagation modelling. Grid resolutions are: 2 arc-minutes (about 3.0 km) for Layer 01, 30 arc-seconds
(about 750 m) for Layer 02, and 10 arc-seconds (about 250 m) for Layers 03 and 04. Yellow boxes indicate the coverage of nested grid layers
W. Power et al. Pure Appl. Geophys.
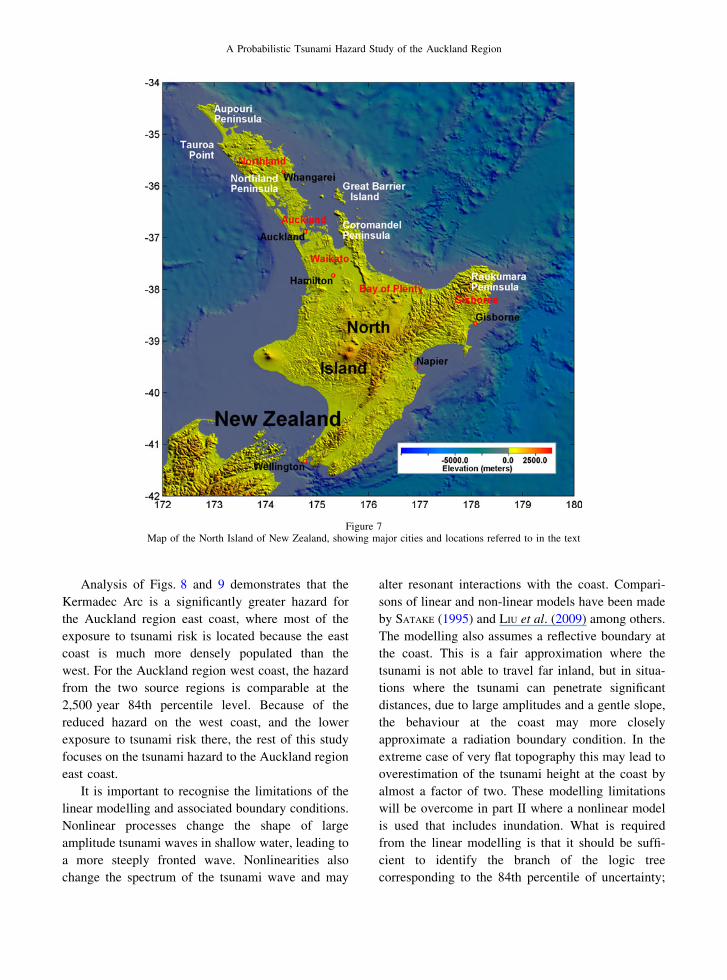
Analysis of Figs. 8 and 9 demonstrates that the
Kermadec Arc is a significantly greater hazard for
the Auckland region east coast, where most of the
exposure to tsunami risk is located because the east
coast is much more densely populated than the
west. For the Auckland region west coast, the hazard
from the two source regions is comparable at the
2,500 year 84th percentile level. Because of the
reduced hazard on the west coast, and the lower
exposure to tsunami risk there, the rest of this study
focuses on the tsunami hazard to the Auckland region
east coast.
It is important to recognise the limitations of the
linear modelling and associated boundary conditions.
Nonlinear processes change the shape of large
amplitude tsunami waves in shallow water, leading to
a more steeply fronted wave. Nonlinearities also
change the spectrum of the tsunami wave and may
alter resonant interactions with the coast. Compari-
sons of linear and non-linear models have been made
by SATAKE (1995) and LIU et al. (2009) among others.
The modelling also assumes a reflective boundary at
the coast. This is a fair approximation where the
tsunami is not able to travel far inland, but in situa-
tions where the tsunami can penetrate significant
distances, due to large amplitudes and a gentle slope,
the behaviour at the coast may more closely
approximate a radiation boundary condition. In the
extreme case of very flat topography this may lead to
overestimation of the tsunami height at the coast by
almost a factor of two. These modelling limitations
will be overcome in part II where a nonlinear model
is used that includes inundation. What is required
from the linear modelling is that it should be suffi-
cient to identify the branch of the logic tree
corresponding to the 84th percentile of uncertainty;
Figure 7Map of the North Island of New Zealand, showing major cities and locations referred to in the text
A Probabilistic Tsunami Hazard Study of the Auckland Region

for this we must assume that the larger the amplitude
at the coast estimated with the linear model, the lar-
ger the extent of inundation will be in the nonlinear
inundation model.
The combined coastal hazard from both source
regions cannot, in general, be simply obtained from
the hazard plots for each individual source. However,
for the Auckland region east coast the hazard from
the Kermadec source is significantly higher than from
the southern New Hebrides. The 2,500 year 84th
percentile water level for the Auckland region east
coast is higher than that of the maximum event pos-
sible from the southern New Hebrides in our logic
tree. Consequently, for the east coast we may assume
that most of the regional tsunami hazard comes from
the Kermadec Arc and that we can neglect the
southern New Hebrides without significantly chang-
ing the result. Thus, the maximum water levels in
Fig. 8 describe the 2,500 year 84th percentile hazard
from all regional sources along the Auckland east
coast.
Having determined which branch of the logic tree
represents the 84th percentile (which turns out to be
that with maximum magnitude Mw = 9.2 and cou-
pling coefficient C = 0.6), we can now develop a set
of scenarios to be used for the Monte Carlo modelling
Figure 8Estimated 2,500 year 84th percentile tsunami hazard from the Kermadec Trench, expressed in terms of the maximum water level in meters.
Note that the hazard is estimated with a linear model and reflective boundary conditions (See discussion in Sect. 5)
W. Power et al. Pure Appl. Geophys.

of inundation. Ideally we would perform inundation
modelling for all of the events in the 100,000 year
period. This, however, would be computationally
infeasible because of the large number of simulated
events within that period. Instead we use the linear
modelling process previously developed to quickly
remove those events too small to contribute to the
2,500 year return period inundation.
Using the logic-tree branch for the Kermadec
Trench that was estimated to represent the 84th per-
centile uncertainty at the 2,500 year return period, a
synthetic sequence of tsunamigenic earthquakes was
created for a 100,000 year period. The magnitude of
each event was randomly selected according to the
statistical properties of the chosen branch. The mid-
point location of each rupture was randomly selected,
and the length of rupture determined according to the
scaling laws presented in POWER et al. (2007), with a
maximum source width of 100 km.
Over this 100,000 year period there are approxi-
mately 3,000 simulated earthquakes, and for each of
these the unit-source models were used to estimate
the subsequent maximum water levels around the
coast. For each event, the maximum water level was
Figure 9Estimated 2,500 year 84th percentile tsunami hazard from the southern New Hebrides Trench, expressed in terms of the maximum water level
in meters. Note that the hazard is estimated with a linear model and reflective boundary conditions (see discussion in Sect. 5)
A Probabilistic Tsunami Hazard Study of the Auckland Region

averaged over the Auckland region east coast shore-
line. The events were then ranked from that with the
highest (average) water level on the Auckland region
shoreline to that with the lowest. From this ranking,
the 100 largest events were selected for the purpose
of inundation modelling.
6. Links to Inundation Modelling
For the purposes of this study it was necessary to
go beyond estimates of tsunami hazard at the coast to
provide estimates of tsunami inundation at the
2,500 year return period and 84 percent confidence
level along the east coast of Auckland. As discussed
in Sect. 5, at this return period and confidence level it
is only the Kermadec Trench source that is important:
even the most severe logic-tree branch for the New
Hebrides at a 2,500 year return period produced a
lower hazard on the Auckland east coast than the
2,500 year 84th percentile hazard from the Kermadec
Trench.
For the inundation modelling the RiCOM model
was used (WALTERS, 2005). To couple COMCOT
with the RiCOM model, time series of water level
and current velocity describing the tsunami propa-
gation from each unit source (with 1.0-m slip) at the
eastern boundary locations of the RiCOM model grid
are extracted from COMCOT simulations. The time
series data from unit sources are weighted, linearly
superimposed together and then used to force the
RiCOM model as boundary conditions for the inun-
dation modelling of the 100 most severe scenarios in
the 100,000 year simulation period.
The area inundated on a 2,500 year return period
was determined by looking for locations that were
inundated more than 40 times in 10,000 years. The
reason for modelling the 100 most severe scenarios,
rather than only the top 40, was to ensure that all
events that might contribute to this area were inclu-
ded, as some of the sample tsunami had a relatively
stronger impact on some parts of the study region
than others. As a validation that 100 events was
sufficient for this purpose, a hazard model equivalent
to Fig. 8 was constructed using only the 100 selected
events; this showed negligible differences to Fig. 8 in
the Auckland east coast study area. In other words,
events outside our selected sample of 100 had neg-
ligible contribution to the 2,500 year return period
hazard. The 100 most severe scenarios ranged in
magnitude from Mw 8.8 to Mw 9.2, and in latitude of
the rupture midpoint from 37.6�S to 27.2�S, with the
majority of events being south of 36�S; this is con-
sistent with the observation that the Auckland region
is most strongly affected by tsunami caused by
earthquakes on the southern portion of the Kermadec
Arc (POWER et al., 2012). The 40 most severe sce-
narios ranged in magnitude from Mw 9.0 to Mw 9.2,
and were more strongly concentrated towards the
southern portion of the subduction zone: all had
midpoint latitudes south of 33�S. The full details of
the inundation modelling and subsequent results are
described in part II.
7. Conclusions and Discussion
We have taken the techniques of PTHA and
expanded them to systematically account for uncer-
tainty in the magnitude-frequency distribution of the
source regions, by evaluating the tsunami hazard for
each branch of the logic trees. This has important
practical implications, because for many tsunami
source regions, including those studied here, there
remains a great deal of uncertainty about the mag-
nitude-frequency distributions, and this should be
accounted for in order that mitigation measures are
appropriate.
In taking this approach it was very helpful that the
logic trees were relatively small. There are other
areas of uncertainty that could potentially be inclu-
ded, leading to a more complicated tree and a more
difficult analysis; to some extent the simplicity of the
trees used can be justified by the fact that these are
regional sources and that some of the complexities of
the source that are relevant in the near-field (i.e for
local sources) are ‘washed out’ with increasing dis-
tance (see discussion in POWER et al., 2012; and
GEIST, 2002), though a more complete analysis
including other effects, such as the roles of non-uni-
form slip and splay-faulting, would be useful further
work to verify this conclusion. The use of uniform
slip on relatively large (50 9 100 km) unit sources
also limits the range of frequencies present in the
W. Power et al. Pure Appl. Geophys.
modelled tsunami, the effects of which could also be
examined when investigating the role of non-uniform
slip.
Volcanic and landslide tsunami sources were not
included in this analysis [see discussion in Chapter 5
of BERRYMAN (2005)], which assumes that subduction
zone earthquakes are the dominant source of regional
tsunami on the time frames considered here, although
it has been suggested that a collapse of the Healy
caldera approximately 600 years ago may have been
tsunamigenic (WRIGHT et al., 2003), and this has been
proposed as a possible source of paleotsunami
deposits in northern New Zealand (GOFF et al., 2010).
The primary site of interest for this study was the
east coast of Auckland, and a goal of this work was to
be able to provide a set of scenarios from the prob-
abilistic hazard model that could be used to make a
probabilistic model of inundation; this later step has
been done and is described in part II. For this purpose
it was fortunate that, at the requested 2,500 years
return period, only one of the two source zones was
significant in determining the hazard; simply put, on
this time frame the largest tsunamis are all from the
Kermadec Trench. Had this not been the case it
would have been possible, but onerous, to construct a
combined logic tree with 12 9 9 = 108 branches and
work with that to evaluate the combined hazard at the
requested 84 % confidence. In general, as the number
of source regions, or the number of logic-tree bran-
ches, increases, our method of evaluating the hazard
for every branch becomes increasingly impractical.
Probably some form of sampling from the set of
possible epistemic parameters will be necessary.
While our results demonstrate that the 2,500 year
hazard to the densely populated east coast of Auck-
land is relatively low because of its location in the
‘shadow zone’ behind the Coromandel Peninsular
and Great Barrier Island, there is a demonstrably high
tsunami hazard from the Kermadec Trench affecting
many other areas of northern New Zealand, particu-
larly the east coasts of the Coromandel Peninsular,
Great Barrier Island and the Northland Peninsular
north of Auckland. The tsunami hazard from the
southern New Hebrides Trench is greatest along the
west coast and in the far north (Aupouri Peninsula);
in these areas the hazard is typically comparable to
that from the Kermadec Trench. These results
illustrate an urgent need for tsunami mitigation
measures in these regions.
Acknowledgments
This research was funded by the Auckland Regional
Council, and benefited from research funded by the
Earthquake Commission (EQC) and the New Zealand
Natural Hazards Platform. We are grateful for helpful
discussions with Laura Wallace, Martin Reyners,
Mark Stirling and Graeme McVerry. We thank an
anonymous reviewer for helpful suggestions that
improved this manuscript.
REFERENCES
ANNAKA, T., SATAKE, K., SAKAKIYAMA, T., YANAGISAWA, K. and
SHUTO, N. (2007) Logic-tree approach for probabilistic tsunami
hazard analysis and its applications to the Japanese coasts. Pure
Appl. Geophys. 164, 577–592
BERRYMAN, K. (Compiler), 2005. ‘‘Review of Tsunami Hazard and
Risk in New Zealand’’. Institute of Geological & Nuclear Sci-
ences, Client Report 2005/104, Wellington
BOMMER, J.J. (2002). Deterministic vs. probabilistic seismic hazard
assessment: an exaggerated and obstructive dichotomy, Journal
of Earthquake Engineering 6 (special issue no. 1), 43–73.
BORRERO, J.C. (2005). Field survey of northern Sumatra and Banda
Aceh, Indonesia after the tsunami and earthquake of 26
December 2004, Seism. Res. Lett. 76, 312–320
BURBIDGE, D., CUMMINS, P.R., MLECZKO, R., and THIO, H.K. (2008),
A probabilistic tsunami hazard assessment for Western Australia,
Pure Appl. Geophys., 165, 2059–2088.
CALMANT, S., PELLETIER, B., LEBELLEGARD, P., BEVIS, M., TAYLOR,
F.W., and PHILLIPS, D.A. (2003), New insights on the tectonics
along the New Hebrides subduction zone based on GPS results:
J. Geophys. Res., 108(18), doi:10.1029/2001J1200644.
CHO, Y.-S. (1995), Numerical simulations of tsunami and runup.
PhD thesis, Cornell University.
CORNELL, C.A. (1968), Engineering seismic risk analysis, Bull.
Seismol. Soc. Am. 58(5), 1583–1606.
DE LANGE, W.P., and T.R. HEALY (2001), Tsunami hazard for the
Auckland region and Hauraki Gulf, New Zealand, Natural Haz-
ards, 24(3), 267–284, 2001.
DELTEIL, J., RUELLAN, E., WRIGHT, I., and MATSUMOTO, T. (2002),
Structure and structural development of the Havre Trough (SW
Pacific), J. Geophys. Res., 107(B8), doi:10.1029/2001J1200494.
EISNER, R. K. (2005), Planning for tsunami: reducing future losses
through mitigation. Nat. Hazards 35, 155–162.
GEIST, E.L. (2002). Complex earthquake rupture and local tsunami.
J. Geophys. Res., 107, B5, doi:10.1029/2000JB000139
GEIST, E. L., and T. PARSONS (2006). Probabilistic analysis of
tsunami hazards, Nat. Haz. 37, 277–314.
GOFF, J.R., PEARCE, S., NICHOL, S.L., CHAGUE-GOFF, C., HORROCKS,
M., and STROTZ, L., (2010). Multiproxy records of regionally-
sourced tsunamis, New Zealand. Geomorphology 118, 369–382.
A Probabilistic Tsunami Hazard Study of the Auckland Region

GOFF, J.R., WALTERS, R.A., and CALLAGHAN, F., (2006). ‘‘Tsunami
source study’’. Environment Waikato Report TR 2006/49.
GONZALEZ, F.I., E.L. GEIST, B. JAFFE, U. KANOGLU, H. MOFJELD, C.E.
SYNOLAKIS, V.V. TITOV, D. ARCAS, D. BELLOMO, D. CARLTON, T.
HORNING, J. JOHNSON, J. NEWMAN, T. PARSONS, R. PETERS, C.
PETERSON, G. PRIEST, A. VENTURATO, J. WEBER, F. WONG, and A.
YALCINER (2009), Probabilistic tsunami hazard assessment at
Seaside, Oregon, for near- and far-field seismic sources.
J. Geophys. Res. 114, C11023, doi:10.1029/2008JC005132.
JONIENTZ-TRISLER, C., SIMMONS, R.S., YANAGI, B., CRAWFORD, G.,
DARIENZO, M., EISNER, R., PETTY, E. and PRIEST, G., (2005),
Planning for tsunami-resilient communities. Nat. Hazards 35,
121–139.
LAWVER, L.A., HAWKINS, J.W. and SCLATER, J.G. (1976), Magnetic
anomalies and crustal dilation in the Lau Basin, Earth Planet.
Sci. Lett. 33, 27–35.
LIU, P.L.-F., CHO, Y.-S., YOON, S.B. and SEO, S.N. (1994),
Numerical simulations of the 1960 chilean tsunami propagation
and inundation at hilo, hawaii. In Recent Development in Tsu-
nami Research, pages 99–115. Kluwer Academic Publishers.
LIU, P.L.-F., CHO, Y-S., BRIGGS, M.J., SYNOLAKIS, C.E., and KANO-
GLU, U. (1995), Run-up of Solitary Waves on a Circular Island, J.
Fluid Mechanics, 302, 259–285.
LIU, Y., SHI, Y., YUEN, D.A., SEVRE, E.O.D., YUAN, X., and XING,
H.L. (2009) Comparison of linear and nonlinear shallow wave
water equations applied to tsunami waves over the China Sea.
Acta Geotechnica, 4, 129–137.
MCGUIRE, R. (2004), Seismic hazard and risk analysis, MNO-10
(Earthquake Engineering Research Institute, USA).
MCCAFFREY, R. (2008) Global frequency of magnitude 9 earth-
quakes. Geology 36, 263-266. doi:10.1130/852G24402A.1
MORI, N., TAKAHASHI, T., YASUDA, T. andYANAGISAWA, H. (2011)
Survey of 2011 Tohoku earthquake tsunami inundation and
run-up, Geophys. Res. Lett. 38, L00G14, doi:10.1029/2011
GL049210
OKADA, Y., (1985). Surface deformation due to shear and tensile
faults in a half space, Bull. Seismol. Soc. Am. 75, 1135-1154.
PARSON, L.M. and HAWKINS, J.W. (1994), Two-stage ridge propa-
gation and the geological history of the Lau back-arc basin,
Proc. Ocean Drill. Program Sci. Results 135, 819–828.
PELLETIER, B., CALMANT, S. and PILLET, R. (1998), Current tectonics
of the Tonga-New Hebrides region: Earth and Planetary Sci.
Letters 164, 263-276.
POWER, W. L., DOWNES, G., and STIRLING, M. (2007). Estimation of
tsunami hazard in New Zealand due to South American earth-
quakes. Pure Appl. Geophys. 164(2), 547–564.
POWER, W.L., WALLACE, L.M., WANG, X. and REYNERS M. (2012).
Tsunami hazard posed to New Zealand by the Kermadec and
Southern New Hebrides subduction margins: an assessment
based on plate boundary kinematics, Pure Appl. Geophys. 169,
1–36.
RIKITAKE, T. and AIDA, I. (1988), Tsunami hazard probability in
Japan, Bull. Seismol. Soc. Am. 78(3), 1268–1278.
SENIOR SEISMIC HAZARD ANALYSIS COMMITTEE (SSHAC), Recom-
mendations for Probabilistic Seismic Hazard Analysis: Guidance
on Uncertainty and Use of Experts (US Nuclear Regulatory
Commission, NUREG/CR-6372, Washington, DC, 1997).
SORENSEN, M., SPADA, M., BABAEYKO, A., WIEMER S., and GRUN-
THAL, G. (2012), Probabilistic tsunami hazard in the
Mediterranean Sea, J. Geophys. Res. 117, B01305, 15 PP., 2012
doi:10.1029/2010JB008169
SATAKE, K. (1995), Linear and Nonlinear Computations of the 1992
Nicaragua Earthquake Tsunami, Pure Appl. Geophys. 144,
455–470.
TITOV, V.V., GONZALEZ, F.I., BERNARD, E.N., EBLE, M.C., MOFJELD,
H.O., NEWMAN, J.C., and VENTURATO, A.J. (2005), Real-time
tsunami forecasting: Challenges and solutions, Nature Hazards
35(1), 41–58.
WALLACE, L., BEAVAN, J., MCCAFFREY R., and DARBY, D. (2004).
Subduction zone coupling and tectonic block rotation in the
North Island, New Zealand, J. geophy. Res., 109, B12406, doi:
10.1029/2004JB003241.
WALTERS, R.A. (2005). A semi-implicit finite element model for
non-hydrostatic (dispersive) surface waves. International Journal
for Numerical Methods in Fluid 49, 721–737.
WALTERS, R.A., GOFF, J.R., and WANG, K. (2006), Tsunamigenic
sources in the Bay of Plenty, New Zealand, Sci. Tsu. Haz., 24,
339–357.
WANG, X. (2008). Numerical modelling of surface and internal
waves over shallow and intermediate water. PhD thesis, Cornell
University, 2008.
WANG, X. and LIU, P.L.-F. (2006), An analysis of 2004 sumatra
earthquake fault plane mechanisms and indian ocean tsunami.
J. Hydraulic Res., 44(2):147–154.
WANG, X. and LIU, P.L.-F. (2007), Numerical simulations of the
2004 indian ocean tsunamis - coastal effects. Journal of Earth-
quake and Tsunami, 1(3):273–297.
WEISSEL, J.K. (1977), Evolution of the Lau Basin by the growth of
small plates, in Island Arcs, Deep Sea Trenches, and Back-Arc
Basins, Maurice Ewing Ser., vol. 1, edited by M. Talwani and
W.C. Pitman III, pp. 429–436, AGU, Washington, D. C.
WRIGHT, I.C. (1993), Pre-spreading rifting and heterogeneous
volcanism in the southern Havre Trough back-arc basin, MAR.
GEOL., 113, 179–200.
WRIGHT, I.C., GAMBLE, J.A., and SHANE, P.A.R. (2003). Submarine
silicic volcanism of the Healy caldera, southern Kermadec arc
(SW Pacific): I—volcanology and eruptive mechanisms. Bulletin
of Volcanology 65, 15–29.
(Received February 2, 2012, revised June 22, 2012, accepted June 23, 2012)
W. Power et al. Pure Appl. Geophys.
Related Documents