Scholars' Mine Scholars' Mine Doctoral Dissertations Student Theses and Dissertations Fall 2018 A proactive drilling system to prevent stuck pipe and differential A proactive drilling system to prevent stuck pipe and differential sticking sticking Ethar H. K. Alkamil Follow this and additional works at: https://scholarsmine.mst.edu/doctoral_dissertations Part of the Petroleum Engineering Commons Department: Geosciences and Geological and Petroleum Engineering Department: Geosciences and Geological and Petroleum Engineering Recommended Citation Recommended Citation Alkamil, Ethar H. K., "A proactive drilling system to prevent stuck pipe and differential sticking" (2018). Doctoral Dissertations. 2883. https://scholarsmine.mst.edu/doctoral_dissertations/2883 This thesis is brought to you by Scholars' Mine, a service of the Missouri S&T Library and Learning Resources. This work is protected by U. S. Copyright Law. Unauthorized use including reproduction for redistribution requires the permission of the copyright holder. For more information, please contact [email protected].

Welcome message from author
This document is posted to help you gain knowledge. Please leave a comment to let me know what you think about it! Share it to your friends and learn new things together.
Transcript
Scholars' Mine Scholars' Mine
Doctoral Dissertations Student Theses and Dissertations
Fall 2018
A proactive drilling system to prevent stuck pipe and differential A proactive drilling system to prevent stuck pipe and differential
sticking sticking
Ethar H. K. Alkamil
Follow this and additional works at: https://scholarsmine.mst.edu/doctoral_dissertations
Part of the Petroleum Engineering Commons
Department: Geosciences and Geological and Petroleum Engineering Department: Geosciences and Geological and Petroleum Engineering
Recommended Citation Recommended Citation Alkamil, Ethar H. K., "A proactive drilling system to prevent stuck pipe and differential sticking" (2018). Doctoral Dissertations. 2883. https://scholarsmine.mst.edu/doctoral_dissertations/2883
This thesis is brought to you by Scholars' Mine, a service of the Missouri S&T Library and Learning Resources. This work is protected by U. S. Copyright Law. Unauthorized use including reproduction for redistribution requires the permission of the copyright holder. For more information, please contact [email protected].
A PROACTIVE DRILLING SYSTEM TO PREVENT STUCK PIPE AND
DIFFERENTIAL STICKING
by
ETHAR HISHAM KHALIL ALKAMIL
A DISSERTATION
Presented to the Faculty of the Graduate School of the
MISSOURI UNIVERSITY OF SCIENCE AND TECHNOLOGY
In Partial Fulfillment of the Requirements for the Degree
DOCTOR OF PHILOSOPHY
IN
PETROLEUM ENGINEERING
2018
Approved by:
Ralph Flori (Advisor)
Andreas Eckert
Shari Dunn-Norman
Mingzhen Wei
Rickey Hendrix

2018
ETHAR HISHAM KHALIL ALKAMIL
All Rights Reserved
iii
PUBLICATION DISSERTATION OPTION
This dissertation has been prepared in the form of three articles, formatted in style
used by the Missouri University of Science and Technology:
Paper I: Pages 14-45 have been published in Journal of Petroleum Science and
Engineering.
Paper II: Pages 46-73 have been submitted to Journal of Petroleum Science and
Engineering.
Paper III: Pages 74-95 have been submitted to Journal of Petroleum Science and
Engineering.
iv
ABSTRACT
During drilling operations for the E oilfield in the Mishrif formation in southern
Iraq, stuck pipe and differential sticking have been identified as significant geomechanical
and drilling problems for several deviated wells. In this work, an integrated approach with
three phases is presented to serve as a proactive geo-drilling system to prevent wellbore
instability. In the first phase, a comprehensive geomechanical assessment of the Mishrif
formation has been carried out to evaluate the in-situ stresses, maximum horizontal stress
orientation, pore pressure, rock properties, and rock strength parameters. Moreover, the
geomechanical evaluation has been incorporated into the mud design using three rock
failure criteria: the Mohr-Coulomb, Mogi-Coulomb, and Modified Lade. In the second
phase, the feasibility of using managed pressure drilling (MPD) in oilfield E (the Mishrif
formation with a narrow mud window between collapse pressure and differential sticking)
has been evaluated. MPD provides the fully automated capability to maintain nearly
constant bottomhole pressure by varying the surface backpressure, thus compensating for
pressure fluctuations during drilling operations. The MPD approach yields several
operational benefits, such as increasing rate of penetration, managing surge and swab
related pressure fluctuations, and maintaining hole cleaning efficiency, which helps
prevent stuck pipe. In the third phase of this work, the geomechanical model, well
geometry, the hydraulic model, and drilling parameters sensitivity on the stresses,
distribution around the wellbore and the mud design are combined as inputs to a novel
image processing approach to estimate the collapse volume. This approach can help the
drilling operation engineers in evaluating the mud weight effect on stuck pipe problems in
real time based on the estimated collapse volume and the drilling system hole cleaning
efficiency.
v
ACKNOWLEDGMENTS
I would like to express my sincere gratitude to the Iraqi Ministry of Higher
Education and Scientific Research (MOHESR) for rewarding me a fully funded
scholarship. My sincere gratitude is extended to my PhD advisor, Dr. Ralph Flori, for his
inspiration and invaluable support throughout my research. He has always been an
excellent mentor, contributor, supporter, and friend during the whole study. I would also
like to thank my committee members, Dr. Andreas Eckert (for his discussions and
valuable contribution in my papers), Dr. Shari Dunn-Norman, Dr. Mingzhen Wei, and Dr.
Rickey Hendrix, for their time, valuable advice and recommendations.
Special thanks to Signa Engineering Corp (Dr. Sagar Nauduri and Mr. George
Medley), Weatherford Oil Company (Don Hannagan), and Ikon Science Company for
sharing information and providing me complementary softwares.
I am very thankful for my research group members, Husam R. Abbod and Ahmed
Abbas for being such wonderful partners and helpers. I would also like to thank friends
in my hometown and in Rolla, especially Dr. Ali Albattat and Dr. Ali Alhuraishawy, for
their support and encouragement.
A special thanks to my family, especially my parents, for their love, support,
encouragement, and prayers throughout my study. Special thanks to my family members
and friends who were a great support.
Ultimately, I would like to thank my lovely wife, Dhoha, my sweet daughter,
Manar, and my awesome son, Ahmed, for their love and great patience throughout my
study. Without their steadfast support and kind encouragement, this study would have
never been completed.
vi
TABLE OF CONTENTS
Page
PUBLICATION DISSERTATION OPTION ................................................................. iii
ABSTRACT .................................................................................................................. iv
ACKNOWLEDGMENTS ...............................................................................................v
LIST OF ILLUSTRATIONS ......................................................................................... xi
LIST OF TABLES ...................................................................................................... xiii
SECTION
1. INTRODUCTION ...................................................................................................... .1
1.1. GEOLOGICAL CHARECTARISTICS ................................................................4
1.2. DATA UTILIZATION FOR WELLBORE-STABILITY ANALYSIS .................4
1.2.1. Well Logging Data ......................................................................................4
1.2.2. Daily Drilling Reports .................................................................................7
1.2.3. Daily Mud Reports ......................................................................................7
1.2.4. Daily Mud Logging Reports .......................................................................7
1.2.5. Primary Cementing Reports .......................................................................7
1.2.6. Final Well Report ......................................................................................7
2. LITERATURE STUDY ...............................................................................................8
2.1. MECHANICS EARTH MODELING (MEM).…………..………………………..8
2.2. MANAGED PRESSURE DRILLING (MPD)……………………………………..9
2.3. COLLAPSE VOLUME LOG USING IMAGE PROCESSING LOG.………........9
2.4. LITERATURE REVIEW DISCUSSION. ........................................................... 10
3. RESEARCH OBJECTIVES. ..................................................................................... 13
vii
PAPER
I. CASE STUDY OF WELLBORE STABILITY EVALUATION FOR THE
MISHRIF FORMATION, IRAQ ............................................................................... 14
ABSTRACT .................................................................................................................. 14
1. INTRODUCTION ..................................................................................................... 15
2. METHODOLOGY .................................................................................................... 16
2.1. IN-SITU STRESSES .......................................................................................... 17
2.1.1. Vertical Stress .......................................................................................... 17
2.1.2. Minimum Horizontal Stress ...................................................................... 18
2.1.3. Pore Pressure ............................................................................................ 19
2.1.4. Maximum Horizontal Stress ..................................................................... 20
2.1.5. The Orientation of Maximum Horizontal Stresses………..………….........23
2.2. ELASTIC PARAMETERS ................................................................................. 25
2.3. ROCK STRENGTH ........................................................................................... 25
2.3.1. Unconfined Compressive Strength (UCS) ................................................ 26
2.3.2. Internal Friction Angle ............................................................................. 26
2.3.3. Tensile Strength ....................................................................................... 26
3. WELLBORE STABILITY ........................................................................................ 27
3.1. DRILLING CHALLENGES .............................................................................. 27
3.2. COLLAPSE PRESSURE ................................................................................... 28
3.3. DIFFERENTIAL STICKING ............................................................................. 28
4. SENSITIVITY ANALYSIS ....................................................................................... 29
5. RESULTS AND DISCUSSION................................................................................. 29
6. CONCLUSIONS ...................................................................................................... 31
viii
ABBREVIATIONS ....................................................................................................... 34
ACKNOWLEDGEMENTS .......................................................................................... 35
NOMENCLATURE ..................................................................................................... 35
APPENDICES
A. MISHRIF FORMATION LOG DATA ..................................................................... 37
B. QUALITY RANKING SYSTEM.............................................................................. 38
C. ROCK FAILURE CRITERIA FOR WELLBORE STABILITY ANALYSIS……....39
REFERENCES .............................................................................................................. 41
II. A PROACTIVE MANAGED PRESSURE DRILLING SYSTEM TO
PREVENT STUCK PIPE AND DIFFERENTIAL STICKING IN THE
MISHRIF FORMATION, SOUTHERN IRAQ ......................................................... 46
ABSTRACT .................................................................................................................. 46
1. INTRODUCTION ..................................................................................................... 47
2. METHODOLOGY .................................................................................................... 50
2.1. MPD STRATEGY TO REDUCE STUCK PIPE RISK AND
DIFFERENTIAL STICKING ............................................................................. 50
2.2. MPD CANDIDATE SELECTION APPROACH ................................................ 52
3. RESULTS ................................................................................................................. 53
3.1. WELLBORE STABILITY ASSESSMENT BASED ON 1D MEM
APPROACH…………..………………………………………...……………….53
3.2. MPD VS CONVENTIONAL DRILLING .......................................................... 53
3.3. INTEGRATION OF MEM AND MPD .............................................................. 54
4. DISCUSSION ........................................................................................................... 56
4.1. MPD REDUCED MUD WEIGHT EFFECT ON DRILLING RATE ................ 57
4.2. MPD REAL-TIME BHP CONTROL ............................................................... 58
4.3. HOLE CLEANING .......................................................................................... 59
ix
4.4. MPD SURGE AND SWAB EFFECTS ON BHP .............................................. 61
5. SUMMARY AND CONCLUSIONS ......................................................................... 63
ACKNOWLEDGEMENTS ..................................................................................... ..65
REFERENCES ............................................................................................................. .65
APPENDIX……………………………………………………………………………....72
III. A COLLAPSE VOLUME LOG ESTIMATION BASED ON IMAGE
PROCESSING..……………………………………………………………….......….74
ABSTRACT .................................................................................................................. 74
1. INTRODUCTION ..................................................................................................... 75
2. METHODOLOGY….………………………..………………………...……………..77
2.1. ANALYTICAL VISUALIZATION OF FAILURE AREA...…………….……..79
2.2. PREDICTION OF COLLAPSE AREA AND VOLUME USING IMAGE
PROCESSING ................................................................................................... 81
3. RESULTS……………………………………………………………….. ................... 82
3.1. MISHRIF FORMATION ................................................................................... 83
3.2. ZUBAIR FORMATION ..................................................................................... 84
4. DISCUSSION ........................................................................................................... 87
5. CONCLUSIONS ....................................................................................................... 90
ACKNOWLEDGEMENTS ....................................................................................... 91
REFERENCES ............................................................................................................. .91
SECTION
4. CONCLUSIONS AND RECOMMENDATIONS ...................................................... 96
4.1. CONCLUSIONS ................................................................................................ 96

x
4.2. RECOMMENDATIONS .................................................................................... 98
REFERENCES…………………………………………………………………………..99
VITA……………………………………………………………………………………108
xi
LIST OF ILLUSTRATIONS
Figure Page
SECTION
1.1. The stratigraphic column of the E oilfield …………………………….….……….5
1.2. The geological prognosis of the E oilfield ……………………………..……….....6
PAPER I
1. Extended leak-off test in Well A to determine the minimum horizontal stress,
Sh for the Mishrif formation……………………………….………..……….……..19
2. The E Field mud pressure window is based on interpolated pore pressure and
formation breakdown pressures.…………………….………….......……………....20
3. Mishrif Formation stress polygon analysis showing that the inferred stress
magnitudes document a normal faulting stress regime.……………........… ………23
4. FMI log (well A) showing an exemplary borehole breakout oriented towards
146oN and 328oN, indicating an approximately NE-SW maximum horizontal
stress orientation…………..………………………………………………………..24
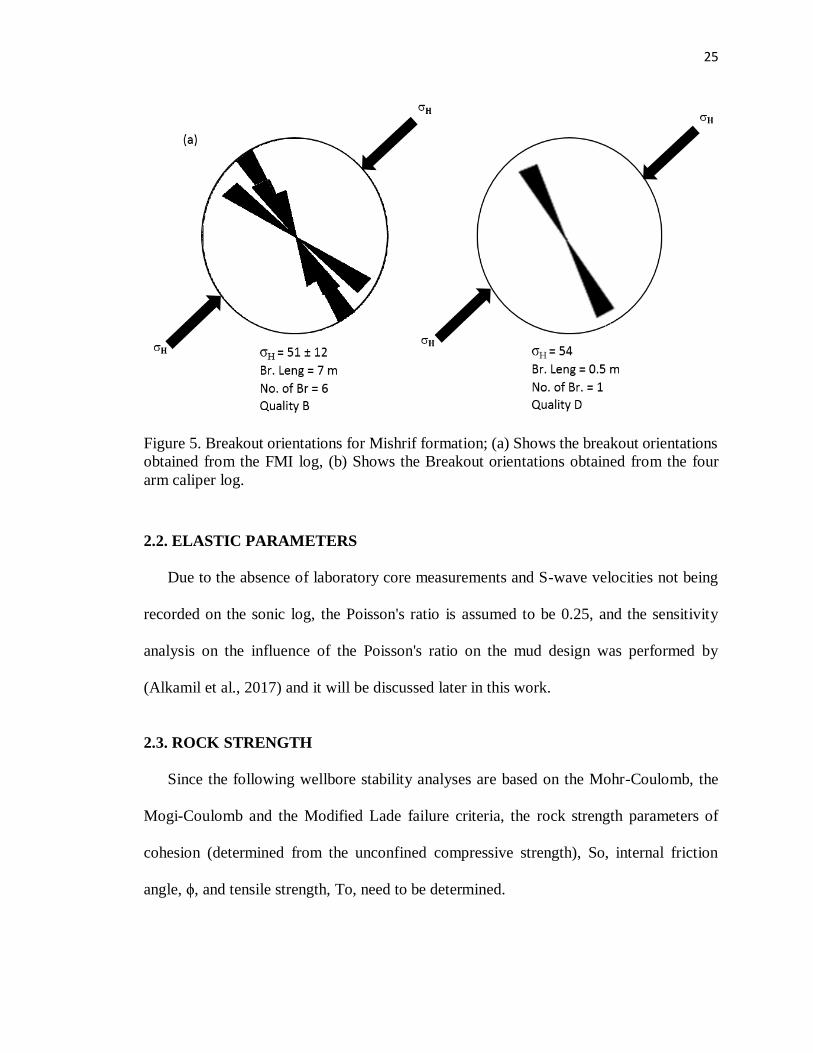
5. Breakout orientations for Mishrif formation; (a) Shows the breakout orientations
obtained from the FMI log, (b) Shows the Breakout orientations obtained from
the four arm caliper log.………………………………………………………….....25
6. Sensitivity analysis in normal faulting stress regime of Mishrif Formation …………29
7. Minimum mud weight plots for different failure criteria............................................33
8. Minimum mud weight plots for different failure criteria. .………………………….34
PAPER II
1. Operational mud pressure window (highlighted in green) for the Mishrif
Formation in Oilfield E is defined on the low side by the collapse pressure
(Pc) for the Mishrif Formation, and on the high side by the differential
sticking pressure (Pds) for the Mishrif Formation….……………………………....51
2. Minimum mud weight plots using Mogi-Coulomb failure criterion .....……...…….54
xii
3. Combined mud pressure window obtained from the 1D MEM derived
collapse pressure and the surface back pressure adjusted MPD approach…….……56
4. Cleaning efficiency vs. cutting size and cutting density………..…………..……....60
5. Swab/Surge Effect on the BHPDynamic when the rig pumps are OFF….……….…..64
PAPER III
1. Collapse volume log estimation approach workflow diagram.………………............79
2. Inferred area (outlined with black lines) of collapse failure for UCS=45 MPa...…..80
3. Flowchart indicating the calculation of the collapse area.…....………….……........82
4. Mishrif Formation-Shale rock (a) wellbore diameter data obtained from the
6-arm caliper log data (b) calculated borehole diameter obtained from the
image processing approach……………………………………..…..…….…..……84
5. Zubair Formation-Shale rock (a) wellbore diameter data obtained from the
6-arm caliper log data (b) calculated borehole diameter obtained from the
image processing approach…………..…………….……………….….………..….85
6. Zubair Formation-Sand rock (a) wellbore diameter data obtained from the
6-arm caliper log data (b) calculated borehole diameter obtained from the
image processing approach…….………………………………………………..….86
7. Predicted wellbore hole profile while drilling using the image processing
approach…..……………………………………………………………………...…90
xiii
LIST OF TABLES
Table Page
PAPER I
1. MEM parameters for eight wells in Mishrif Formation. ………………………..…...18
2. Well trajectory data, actual used mud weight, recommended mud weight for
the three different failure criteria…....……………………………………………...32
PAPER II
1. MPD definitions of pressures and equations…………………………..……….........52
2. Annular Pressure Data under static and dynamic conditions…………………...........55
3. Parameters considered to determine hole cleaning efficiency………...……….........59
PAPER III
1. MEM input parameters and source of measurement...................................................78
2. Exemplary 1D MEM parameters obtained from wireline logs and various
formation tests for the Mishrif Formation……………………………...……….......83
1
SECTION
1. INTRODUCTION
The obvious goal for drilling operators is to drill economical, safe, and stable wells by
reducing nonproductive time (NPT) due to wellbore stability problems such as borehole
collapse and associated stuck pipe, and borehole breakdown and associated loss of
circulation. A key issue for successful drilling operations in geomechanically challenging
zones is considering all relevant factors including formation strength properties, in-situ
stresses, pore pressure, and applied pressure by the drilling mud. The Mishrif Formation is
the most challenging one in the E oilfield in southern Iraq due to its stratigraphic
characteristics such as high heterogeneity (Aqrawi et al., 2005; Jassim and Goff, 2006).
Historically, wellbore instability problems occur during drilling operations in field E
(termed oilfield E in this work) through this formation. In recent years the problems are
greater since more deviated wells are being drilled to achieve production efficiency and
better recovery. Wellbore instability problems such as stuck pipe and differential sticking
introduce significant non-productive time to the drilling program, and in some wells, these
problems require drilling sidetracks which are undesirable and expensive. Therefore, it is
crucial that drilling engineers consider these wellbore instability problems during well
planning and design and introduce appropriate solutions (Numbere and Okoli, 2014).
Borehole failure problems, which are very likely especially when drilling overbalanced
without geomechanical consideration, cost the petroleum industry several billions of
dollars each year. Prevention of these problems requires clear understanding of the
interaction between formation strength, in-situ stresses, and drilling practice. Since in-situ
stress and rock strength are not controllable parameters, adjusting the drilling practices (i.e.
2
selecting optimal trajectory and bottom-hole pressure) is the common way to inhibit
wellbore failure, which can be achieved by performing specialized geomechanical studies.
Therefore, the objective of this work is to mitigate the differential sticking and stuck pipe
problems in Mishrif formation in field E. (Alkamil et al., 2017, Alkamil et al., 20181, 2). To
achieve this objective, a real-time proactive drilling system is developed to prevent the
stuck pipe and differential sticking problems.
This study analyzed data from eight wells in field E that penetrated the Mishrif
formation to determine the 1D MEM factors that contributed to wellbore instability like
borehole collapse. Furthermore, the analyses accounted for other drilling input parameters
like bottomhole assembly (BHA), deviated well geometry, and mud rheology to evaluate
the feasibility of utilizing the managed pressure drilling (MPD) to ensure drilling a safe
well by avoiding related drilling problems, taking into account drilling practice effects such
as swab, surge, hole cleaning, and rate of penetration (Malloy and Shayegi, 2010).
First, the Mishrif formation geomechanical assessment was built based on eight wells
(A-H) data such as in-situ stresses, pore pressure, bottomhole pressure, and formation
properties. This assessment is applied to the wellbore stability of offset wells to verify and
calibrate it. The goal of the analysis is to determine the proper mud weight range along
with an optimum wellbore profile to prevent collapse problems, stuck pipe, or differential
sticking.
Second, this work investigates using cutting-edge drilling technology like MPD to
optimize the drilling process. MPD allows the use of the lowest reasonable mud weight,
as it achieves the needed downhole mud pressure by applying varying backpressure at the
surface. Where, the MPD drilling parameters are modified due to the pore pressure of the
3
formation (Rehm, 2008; Tian et al., 2007). To do so, the mud weight can be reduced with
the surface back pressure (SBP) adjustment based on the pore pressure of the drilled layer,
to cope with a significant change in the regime of pore pressure (Zambrano et al., 2015).
Both MPD hydraulic planning and simulations are run with many possible mud weights
with their required surface back pressure to find out the optimum senario to achieve the
target equivalent circulating density (ECD) at the top of the pressure window (Cui et al.,
1999; Alkamil et al., 2017).
Third, a novel approach determining the area/volume of collapse failure by using
image processing is presented. The presented approach is independent of any failure
criterion and very versatile. Based on the failure criterion applied to determine borehole
collapse, the detailed 2D area of collapse can be determined, thus limiting the degree of
underestimation compared to analytical techniques, which assume a triangular breakout
geometry.
Last of all, a proactive drilling system is developed to estimate the collapse volume
log while drilling using an image processing approach (Alkamil et al., 2017) by
performing a real-time evaluation of MEM and MPD parameters. Based on an MEM
approach, the computed breakout angle vs. depth indicates a narrow (but acceptable) mud
weight window vs. depth, which ensures a stable wellbore or at least minimizes breakout
occurrence. The MPD system is utilized for precise pressure control by using the MEM
recommended mud weight and a proposed surface backpressure window to reduce the
overbalanced pressure and to avoid differential sticking. The collapse volume log can aid
the drilling engineers in evaluating the mud weight effect on the hole cleaning efficiency
4
to avoid stuck pipe problems. In addition, knowledge of the collapse volume provides
better estimates on the required mud and cement volumes.
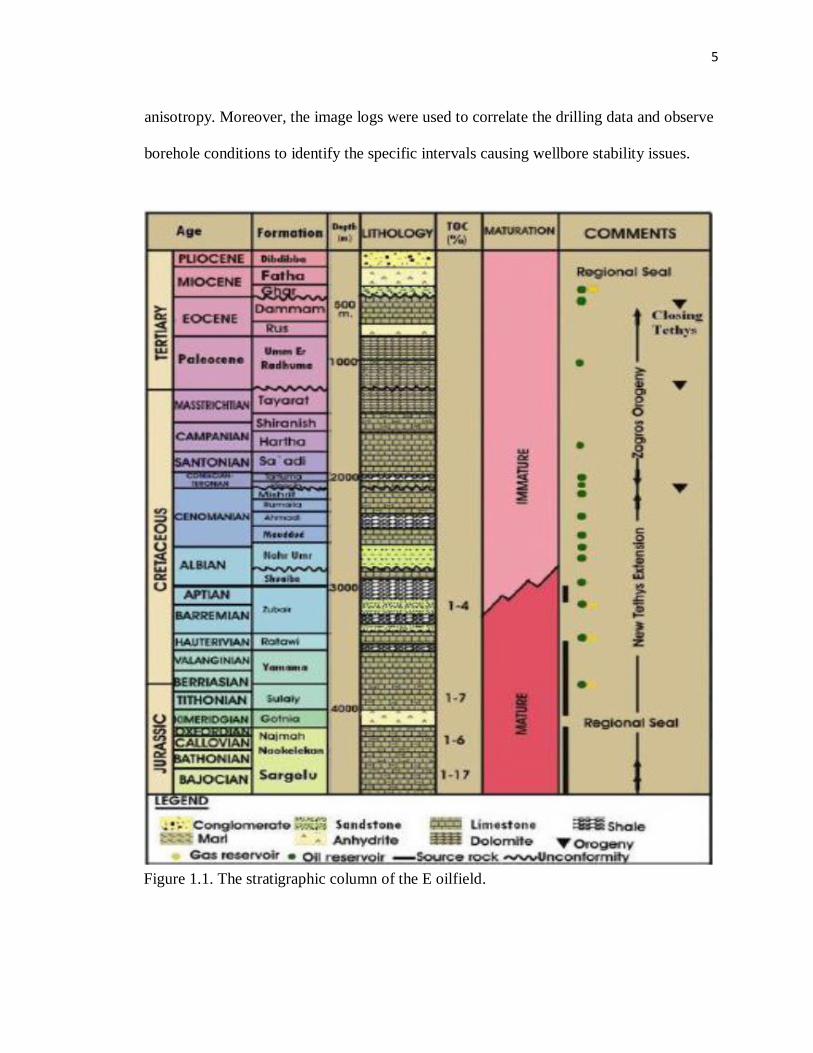
1.1. GEOLOGICAL CHARECTARISTICS
The E oilfield in the southern of Iraq is a double-plunging symmetrical anticline about
60 km long and 15 km wide, with closure in the order of 400 m for the middle and early
Cretaceous reservoirs. Thirteen separate hydrocarbon-bearing horizons have been
identified in carbonate and clastic reservoirs, including Miocene (Ghar formation), late
Cretaceous (Shiranish, Hartha, Saadi, Tanuma and Khasib formations), and early
Cretaceous (Mishrif, Ahmadi, Nahr Umr, Shuaiba, Yamama and Zubair formations). The
source rocks for the field are thought to be the Middle Jurassic shale of the Sargelu and
Naokelekan formations(Aqrawi et al., 2005; Jassim and Goff, 2006).
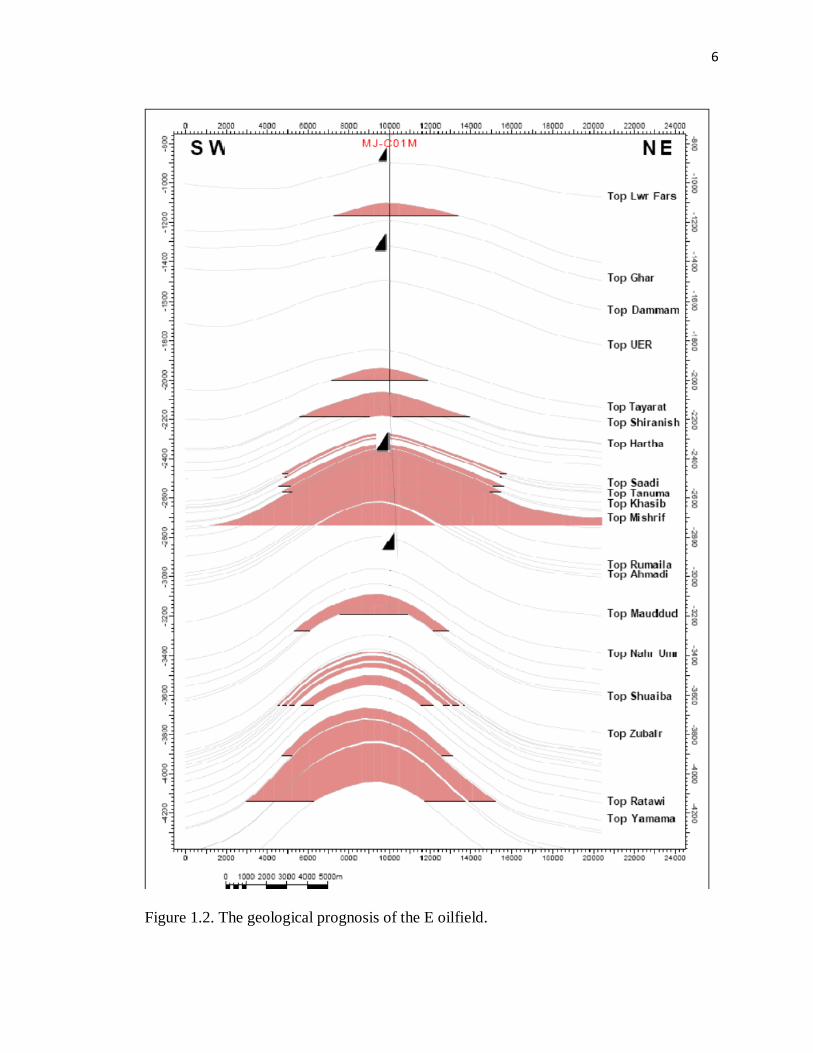
Several regional unconformities and shales provide seals for the oil pools, with Nahr
Umr shale being a particular effective seal horizon for major accumulations. The
stratigraphic column of the E oilfield is illustrated in Figure 1.1, and the geological
prognosis is based on the most recent mapping of the field structure illustrated in Figure
1.2.
1.2. DATA UTILIZATION FOR WELLBORE-STABILITY ANALYSIS
Data needed for wellbore-stability analysis are discussed in the following subsections.
1.2.1 Well Logging Data. Well logging data are available for several wells drilled in
the study field. Well log data were used to build petrophysical models. In addition, image
and sonic log data collected in a limited number of wells were utilized to obtain in-situ
stress magnitudes as well as stress orientations and to estimate the level of stress
5
anisotropy. Moreover, the image logs were used to correlate the drilling data and observe
borehole conditions to identify the specific intervals causing wellbore stability issues.
Figure 1.1. The stratigraphic column of the E oilfield.
6
Figure 1.2. The geological prognosis of the E oilfield.
7
1.2.2 Daily Drilling Reports. Daily drilling reports can be a helpful source to identify
unstable intervals and causes for rock failure when well-log data are not available.
Challenges observed during the drilling process such as string over-pulls, dragging, and
mud losses were correlated with caliper and well image log data to identify the unstable
intervals. The time effect associated with the chemical interactions was indirectly implied
from the drilling performance and the caliper data.
1.2.3 Daily Mud Reports. Daily mud reports were utilized to identify the mud
characteristics: MW, rheological properties, and sand percent. In addition, the report
describe the formation’s cuttings size and provides an indirect clue to the hole cleaning
issues during drilling of the directional wells.
1.2.4 Mud Logging Reports. Daily mud logging reports were used to acquire: (1)
input data for petrophysical modeling. (2) identify the high pore pressure zones. (3) the
size and shape of cuttings were used to verify the active wellbore- failure mechanism
taking place in the field to make a critical decision about whether to increase mud weight
or to hold it at the same level. (4) gas show readings were used to pinpoint the pore
pressure for the hydrocarbon saturated shale intervals.
1.2.5 Primary Cementing Reports. The utilization of the cementing reports
represents an indirect way to correlate different factors, which help in the prediction of an
allowable equivalent circulation density (ECD) to drill a planned section.
1.2.6 Final Well Report. The final drilling reports were used to evaluate the drilling
parameters and estimate the feasibility of the drilling operations for the oilfield
development plan.
8
2. LITERATURE STUDY
The main objective of this section is to review and discuss the wellbore instability
problems in the Mishrif Formation with the consideration of all possible parameters that
will affect them. Previous modeling efforts used to evaluate these problem mitigation
solutions like geomechanics and one of the leading drilling technology like MPD are
evaluated. Moreover, the literature review is extended to cover studies about detailed
breakout geometry. A detailed review of the current usage of MEM and/or MPD is
followed by a critical review of these methods to identify the current limitations.
2.1 MECHANICS EARTH MODELING (MEM)
A MEM consists of three major parts: well geometry, in-situ stresses and pore pressure,
and rock physical properties. A properly constructed 1D MEM model based on the classic
Kirsch equations for stresses around a cylindrical hole (for both vertical and deviated wells)
and the classical 2D Mohr-Coulomb failure criteria is used in this paper (Bell and Cough,
1979; Zoback et al., 1985; Aadnoy and Looyeh, 2011). The 1D MEM results are represented
by the hoop, radial and axial stresses (σƟƟ, σrr, and σzz) around the wellbore and the required
unconfined to determine the collapse pressure (i.e., minimum mud weight) for the Mishrif
Formation. Three different failure criteria, the Mohr-Coulomb, Mogi-Coulomb, and
Modified Lade criteria (Mohr, 1900; Ewy, 1999; Al-Ajmi and Zimmerman, 2005; Maleki,
et al., 2014; Rahimi and Nygaard, 2015) were investigated in order to analyze the existing
wellbore stability problems for the eight wells (termed A–H), and to determine feasible
(safe) drilling trajectories (i.e. azimuths and inclinations) and mud weight conditions for
many different wells in the Mishrif Formation.
9
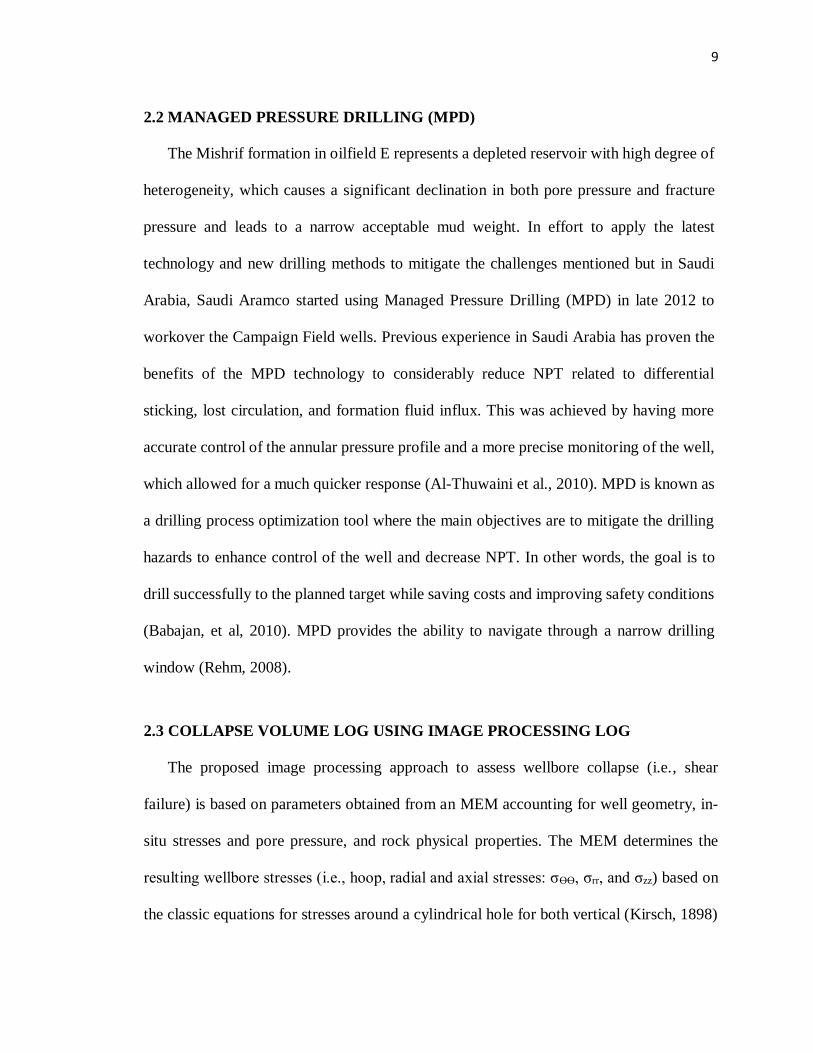
2.2 MANAGED PRESSURE DRILLING (MPD)
The Mishrif formation in oilfield E represents a depleted reservoir with high degree of
heterogeneity, which causes a significant declination in both pore pressure and fracture
pressure and leads to a narrow acceptable mud weight. In effort to apply the latest
technology and new drilling methods to mitigate the challenges mentioned but in Saudi
Arabia, Saudi Aramco started using Managed Pressure Drilling (MPD) in late 2012 to
workover the Campaign Field wells. Previous experience in Saudi Arabia has proven the
benefits of the MPD technology to considerably reduce NPT related to differential
sticking, lost circulation, and formation fluid influx. This was achieved by having more
accurate control of the annular pressure profile and a more precise monitoring of the well,
which allowed for a much quicker response (Al-Thuwaini et al., 2010). MPD is known as
a drilling process optimization tool where the main objectives are to mitigate the drilling
hazards to enhance control of the well and decrease NPT. In other words, the goal is to
drill successfully to the planned target while saving costs and improving safety conditions
(Babajan, et al, 2010). MPD provides the ability to navigate through a narrow drilling
window (Rehm, 2008).
2.3 COLLAPSE VOLUME LOG USING IMAGE PROCESSING LOG
The proposed image processing approach to assess wellbore collapse (i.e., shear
failure) is based on parameters obtained from an MEM accounting for well geometry, in-
situ stresses and pore pressure, and rock physical properties. The MEM determines the
resulting wellbore stresses (i.e., hoop, radial and axial stresses: σƟƟ, σrr, and σzz) based on
the classic equations for stresses around a cylindrical hole for both vertical (Kirsch, 1898)
10
and deviated wells (Peska and Zoback, 1995). Based on the rock strength properties
applied, the area of collapse can be calculated. In order to provide a proactive geo-drilling
assessment tool for the collapse volume, while many necessary MEM input parameters can
be obtained pre-drilling or during measurements while drilling the horizontal stress
magnitudes need to be determined from offset well data (or from a nearby field), as their
determination/estimation is only possible post-drilling (Zoback et al., 1985; Bell and
Babcock, 1986; Mastin, 1988; Tingay et al., 2011). It is clear that the magnitudes of the in-
situ stresses and the rock strength properties will affect the relationship between breakout
width and depth, and therefore a detailed description of the geometry of the breakout is
necessary (Moos et al., 2007; Zoback, 2010).
In order to validate the predicted breakout area obtained from the image processing
approach, the breakout width is initially determined analytically based on the MEM. As
stated by Zoback (2010), breakout width is a critical parameter for assessing the severity
of collapse. If the width of the breakout, WBO, exceeds 90° and 60o for vertical and deviated
respectively, a severe breakout occurs resulting in wellbore collapse. While the width of
breakouts can be determined analytically, an analytical solution for the breakout depth, to
the authors’ knowledge, does not currently exist.
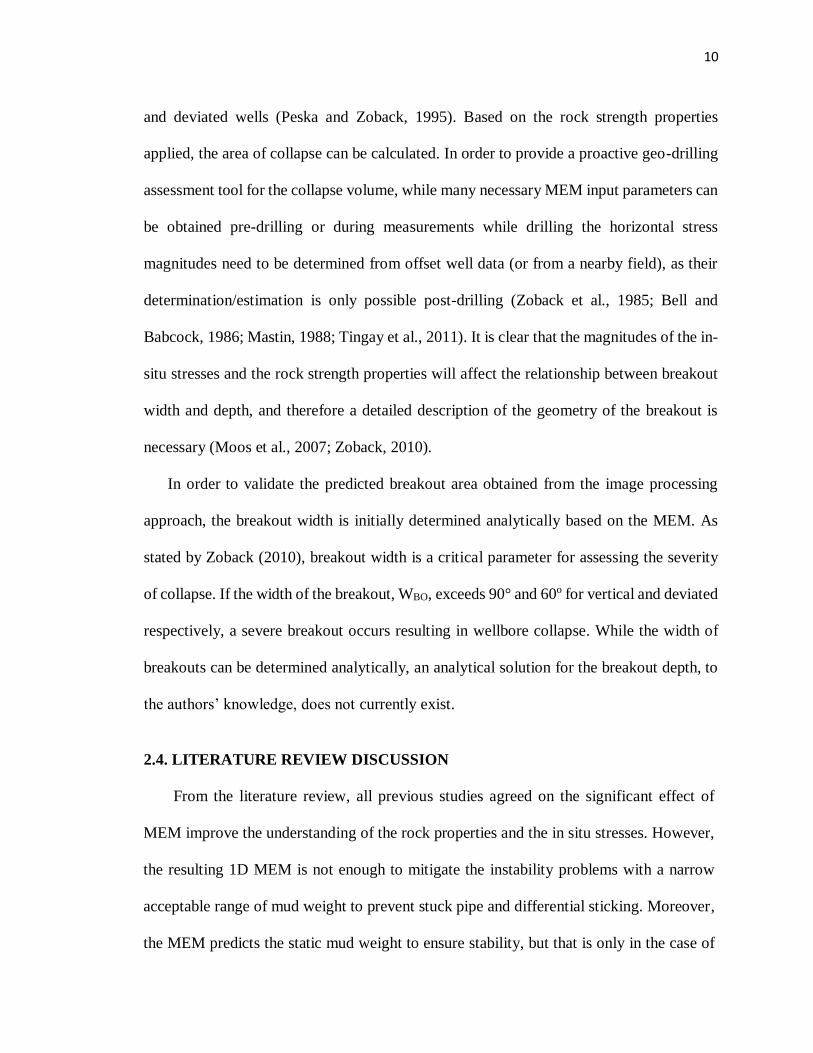
2.4. LITERATURE REVIEW DISCUSSION
From the literature review, all previous studies agreed on the significant effect of
MEM improve the understanding of the rock properties and the in situ stresses. However,
the resulting 1D MEM is not enough to mitigate the instability problems with a narrow
acceptable range of mud weight to prevent stuck pipe and differential sticking. Moreover,
the MEM predicts the static mud weight to ensure stability, but that is only in the case of
11
rig pumps that are switched off. When the pumps are on, an additional pressure is needed
to compensate the annular friction pressure effect, which increases the ECD. Furthermore,
there are some of uncertainties in estimation the MEM parameters like SH, that’s why
sensitivity analysis for the MEM parameters is required.
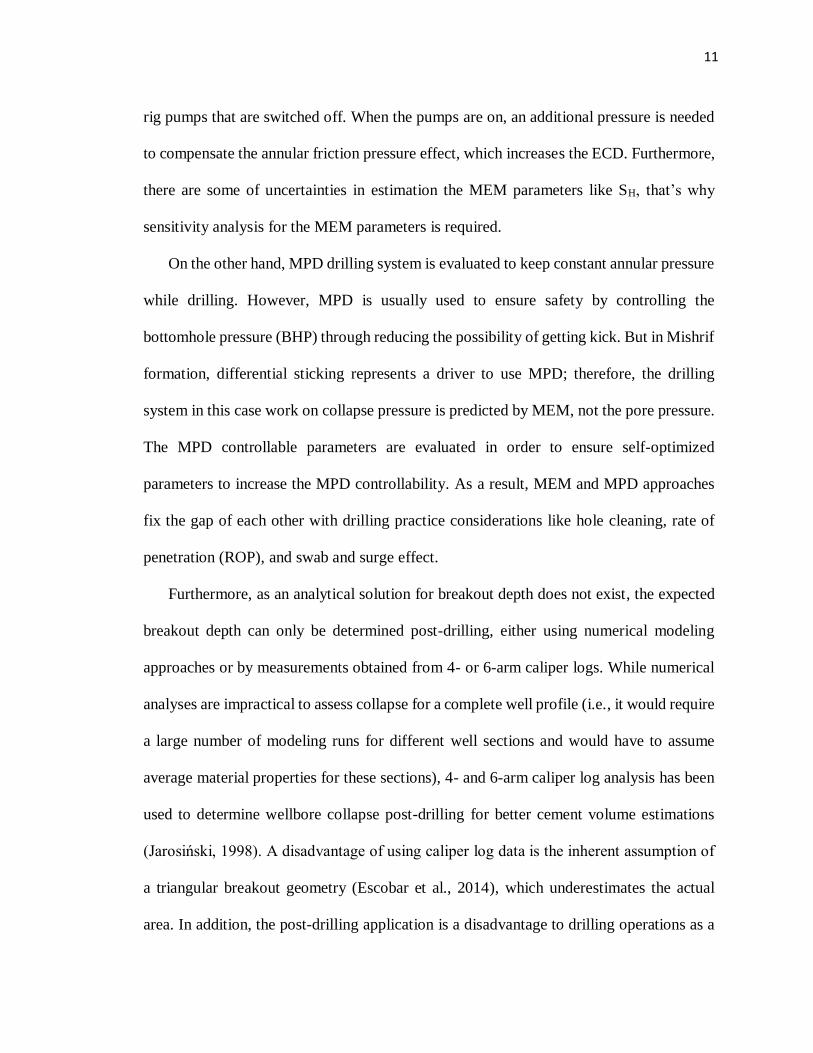
On the other hand, MPD drilling system is evaluated to keep constant annular pressure
while drilling. However, MPD is usually used to ensure safety by controlling the
bottomhole pressure (BHP) through reducing the possibility of getting kick. But in Mishrif
formation, differential sticking represents a driver to use MPD; therefore, the drilling
system in this case work on collapse pressure is predicted by MEM, not the pore pressure.
The MPD controllable parameters are evaluated in order to ensure self-optimized
parameters to increase the MPD controllability. As a result, MEM and MPD approaches
fix the gap of each other with drilling practice considerations like hole cleaning, rate of
penetration (ROP), and swab and surge effect.
Furthermore, as an analytical solution for breakout depth does not exist, the expected
breakout depth can only be determined post-drilling, either using numerical modeling
approaches or by measurements obtained from 4- or 6-arm caliper logs. While numerical
analyses are impractical to assess collapse for a complete well profile (i.e., it would require
a large number of modeling runs for different well sections and would have to assume
average material properties for these sections), 4- and 6-arm caliper log analysis has been
used to determine wellbore collapse post-drilling for better cement volume estimations
(Jarosiński, 1998). A disadvantage of using caliper log data is the inherent assumption of
a triangular breakout geometry (Escobar et al., 2014), which underestimates the actual
area. In addition, the post-drilling application is a disadvantage to drilling operations as a
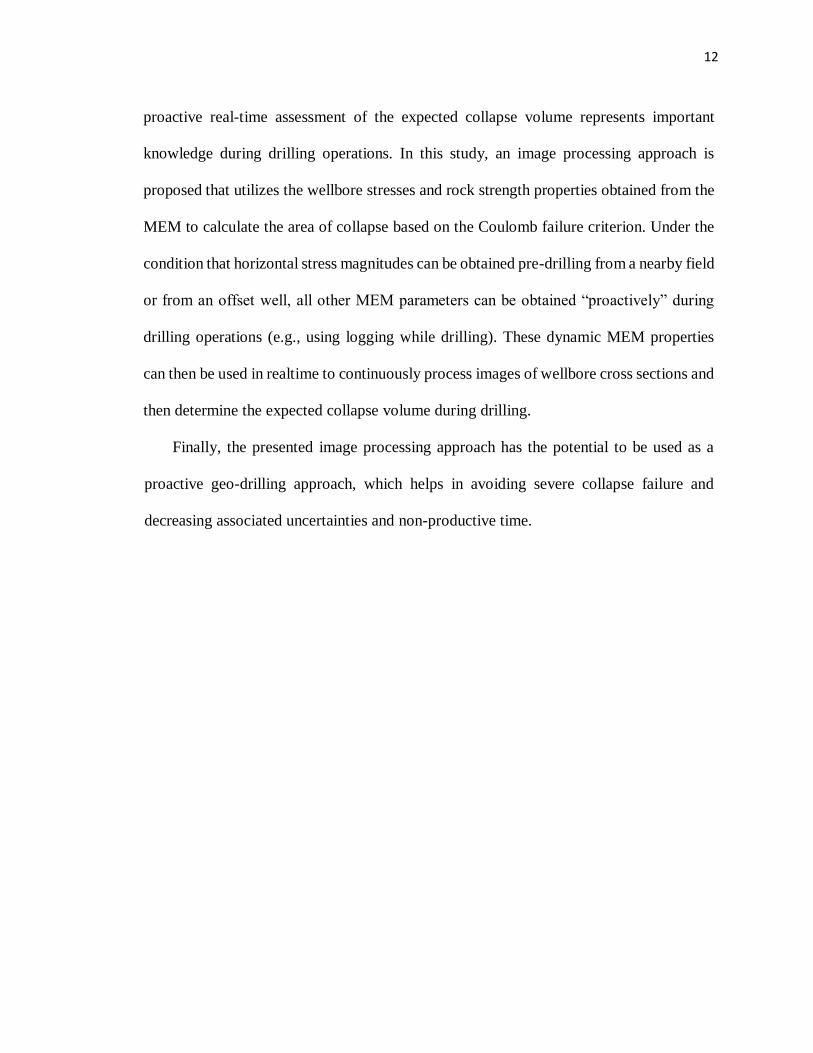
12
proactive real-time assessment of the expected collapse volume represents important
knowledge during drilling operations. In this study, an image processing approach is
proposed that utilizes the wellbore stresses and rock strength properties obtained from the
MEM to calculate the area of collapse based on the Coulomb failure criterion. Under the
condition that horizontal stress magnitudes can be obtained pre-drilling from a nearby field
or from an offset well, all other MEM parameters can be obtained “proactively” during
drilling operations (e.g., using logging while drilling). These dynamic MEM properties
can then be used in realtime to continuously process images of wellbore cross sections and
then determine the expected collapse volume during drilling.
Finally, the presented image processing approach has the potential to be used as a
proactive geo-drilling approach, which helps in avoiding severe collapse failure and
decreasing associated uncertainties and non-productive time.
13
3. RESEARCH OBJECTIVES
In this research, a proactive drilling system is developed to compute the possible
wellbore breakout angle/area/volume in a real-time mode using MEM and MPD
principles. Based on an MEM approach, the computed breakout angle vs. depth indicates
a narrow (but acceptable) mud weight window vs. depth, which will ensure a stable
wellbore or at least minimize breakout occurrence. To overcome the identified gaps in the
literature, the main research objective for this dissertation is to develop a method to
estimate a collapse volume log while drilling and determine how it is related to the wireline
data stream and the manipulated mud weight.
The main objective can be broken down to the following three sub objectives:
1. Assess and address existing wellbore stability problems to provide guidance for
future well plans that increase the drilling efficiency by reducing the nonproductive
time. Use a Mishrif formation geomechanical assessment to ensure wellbore
stability.
2. Evaluate the feasibility of using MPD to keep the bottomhole pressure constant,
which helps in reducing the overbalanced pressure and reducing differential sticking.
3. Integrate MEM with MPD to reduce both collapse failure and differential sticking
by keeping the bottomhole pressure constant (i.e., adhere to the collapse pressure
from MEM), with drilling practice considerations.
4. Use the image processing approach to estimate the collapse volume log while
drilling, which can help as a real-time proactive geo-drilling system to prevent stuck
pipe.
14
PAPER
I. CASE STUDY OF WELLBORE STABILITY EVALUATION FOR THE
MISHRIF FORMATION, IRAQ
Ethar H.K. Alkamil, Husam R. Abbood, Ralph E. Flori, Andreas Eckert
Missouri University of Science and Technology
(Published in Journal of Petroleum Science and Engineering 164 (2018) 663–674)
ABSTRACT
During drilling operations for the E oilfield in the Mishrif formation in southern Iraq,
stuck pipe has been identified as a significant geomechanical problem for several wells. In
this study, a 1-D mechanical earth model (MEM) of the Mishrif formation is compiled
based on its state of stress and rock strength parameters, and is utilized to assess the
contribution of borehole collapse leading to the stuck pipe problems. The results of this
study show that wells characterized by stuck pipe are drilled along azimuths which promote
wellbore collapse. Three different failure criteria, the Mohr-Coulomb, Mogi-Coulomb, and
Modified Lade rock failure criteria, are investigated in order to determine feasible drilling
trajectories (i.e. azimuths and inclinations) and mud pressure conditions for many different
wells in the Mishrif Formation. If a specific azimuth for a well cannot be altered, an
optimum inclination is recommended to reduce the severity of the borehole collapse.
However, as the intermediate principal in-situ stress increases the optimum drilling
inclination progressively changes. The presented study shows that 1-D MEMs are an
important tool to both assess and address existing wellbore stability problems and to
provide guidance for future well plans for better drilling efficiency.
15
1. INTRODUCTION
\\\
It is estimated that more than 60% of the world's oil and 40% of the world's gas reserves
are held in carbonate reservoirs. The Arabian plate, as an example, is dominated by
carbonate fields, with around 70% of oil and 90% of gas reserves held within these
reservoirs. The Mishrif Formation in southern Iraq represents heterogeneous organic
detrital limestones, with beds of algal, rudist, and coral reef limestones, capped by limonitic
fresh water limestones (Aqrawi et al., 2010; Jassim and Goff, 2006). The thickness of the
formation is around 237 m, ranging from the top 2393m true vertical depth (TVD) to the
bottom of the formation at 2630m TVD.
For improved drilling and production efficiency, non-vertical, deviated production
wells are adopted in a particular oilfield in the Mishrif Formation (termed Oilfield E in this
paper). In some cases, a substantial distance horizontally away from the drilling location
was reached using deviated boreholes (Schroeter and Chan, 1989). Moreover, the deviated
boreholes are crucial to reach not accessible locations by vertical boreholes due to
Explosive Remnants of War (ERW; Hooft van Huysduynen et al., 2014; Tianshou et al.,
2015; Mansourizadeh et al., 2016). However, drilling non-vertical boreholes accounts for
a variety of problems like cuttings transport, drill string friction, casing setting and its
cementing job. In the E oilfield, many wells were characterized by differential sticking
(Helmick and Longley, 1957) across the Mishrif formation and also had some challenges
during in-hole cleaning as the “J” and “S” shaped wells had a tangent section between 20o
and 42o degree inclination. Moreover, several wells experienced significant wellbore
stability problems with stuck pipe as a consequence of borehole collapse being the most
frequent (Charlez, 1991). The wellbore stability problems were observed in wells with
16
azimuths ranging from 9o to 310o. A review of the drilling operation data shows that the
used mud weight window was based on formation pore pressure and formation breakdown
pressure only. Detailed geomechanical calculations necessary to determine the safe mud
pressure window for deviated wellbore trajectories (e.g. PesKa and Zoback, 1995),
including the in-situ stress magnitudes, rock strength properties and oriented wellbore data,
were not considered.
This study utilizes a 1D MEM approach (e.g. Kristiansen, 2007; Gholami et al., 2014;
Alkamil et al., 2017; Das and Chatterjee, 2017) in order to determine the collapse pressure
(i.e. minimum mud weight) for the Mishrif Formation. The geomechanical model includes
the in-situ principal stresses and their orientations obtained from wireline logging
measurements, measurements while drilling (MWD), and leak off tests (LOT). Rock
strength properties are obtained from empirical equations and extended leak off tests. Three
different failure criteria, the Mohr-Coulomb, Mogi-Coulomb, and Modified Lade criteria,
representing a conservative, realistic and optimistic criterion (Ewy, 1999; Al-Ajmi and
Zimmerman, 2005; Maleki et al., 2014; Rahimi and Nygaard, 2015; Gholami et al., 2015;
Najibi et al., 2017) are investigated in order to analyze the existing wellbore stability and
differential sticking problems for 8 wells (termed Wells A – H), and to determine feasible
(i.e. safe) drilling trajectories (i.e. azimuths and inclinations) and mud weight conditions
for many different wells in the Mishrif Formation.
2. METHODOLOGY
An analysis of the optimal mud weight for drilling a new well through depleted
reservoirs requires a field-specific geomechanical model, termed a 1D Mechanical Earth
17
Model (MEM), that consists of characterization of the elastic parameters, rock strength
properties, pore pressure and in-situ stresses. The components of the 1D MEM for the
Mishrif Formation are derived from daily drilling reports, daily mud reports, formation
integrity tests (FIT), and wireline well logs (Far et al., 2016).
2.1. IN-SITU STRESSES
Stable drilling trajectories are directly dependent on the knowledge of the in-situ state
of stress (Bell, 1990). Since detailed information about the in-situ stress regime of the
Mishrif formation is unknown (or confidential), the assumed Andersonian state of stress
(Jaeger et al., 2007) is determined by a procedure, which initially determines the vertical
stress from wireline density logs, followed by minimum horizontal stress determination
from extended leak-off tests and the estimation of the maximum horizontal stress using
borehole breakout data (Zajac and Stock, 1992), which in turn is validated by stress
polygon analysis (Zoback et al., 1986; Moos and Zoback, 1990). Stress orientations are
derived from breakout orientations (e.g. Zoback et al., 1985; Bell and Babcock, 1986;
Mastin, 1988; Tingay et al., 2011).
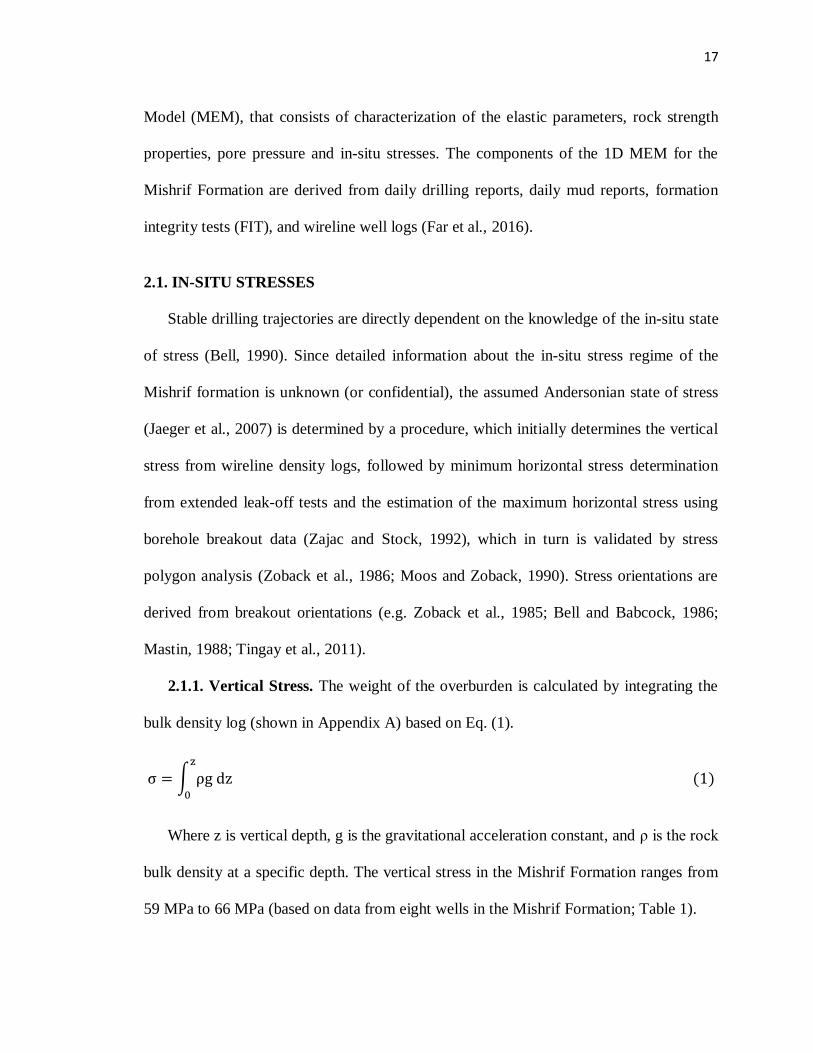
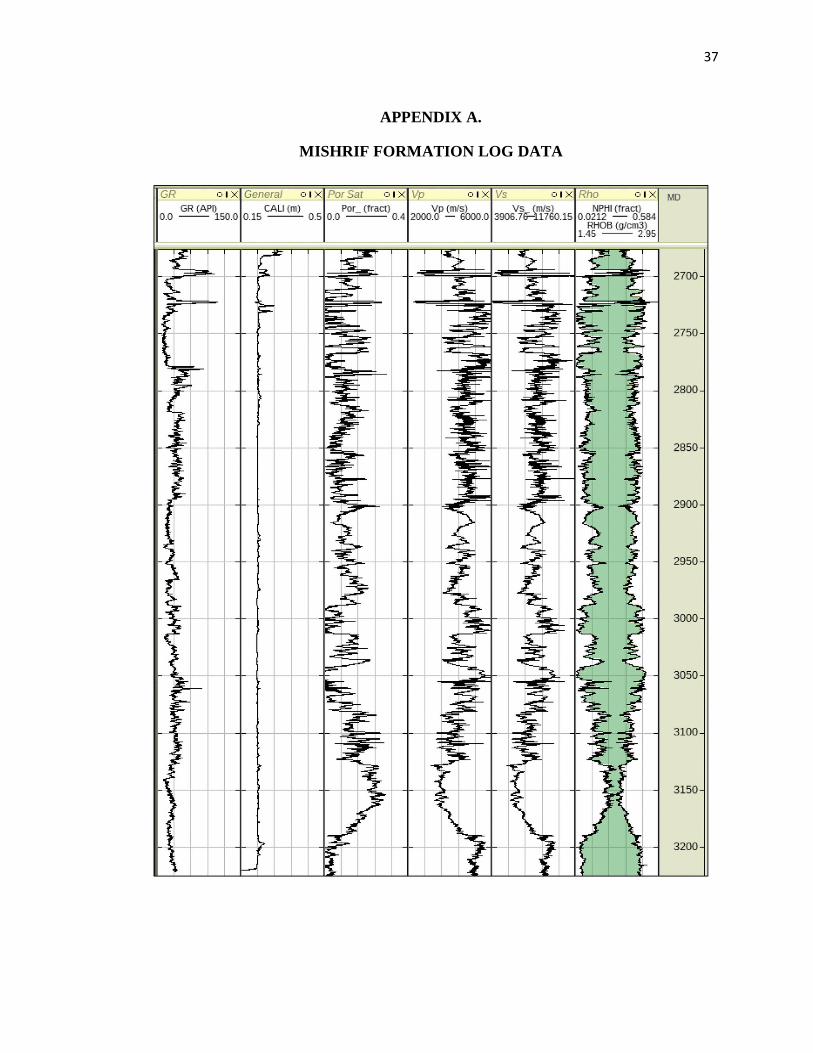
2.1.1. Vertical Stress. The weight of the overburden is calculated by integrating the
bulk density log (shown in Appendix A) based on Eq. (1).
σ = ∫ ρg dz (1)z
0
Where z is vertical depth, g is the gravitational acceleration constant, and ρ is the rock
bulk density at a specific depth. The vertical stress in the Mishrif Formation ranges from
59 MPa to 66 MPa (based on data from eight wells in the Mishrif Formation; Table 1).
18
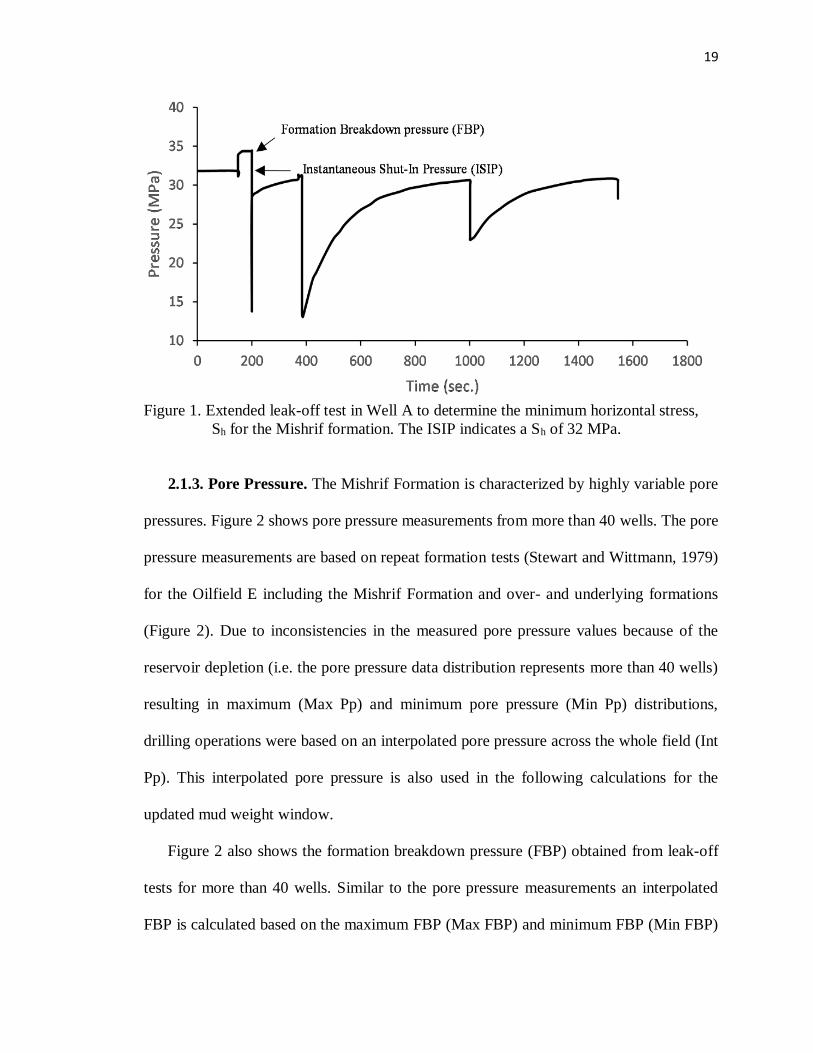
2.1.2. Minimum Horizontal Stress. The minimum horizontal stress is determined by
an extended leak-off test (Zoback et al., 1985) conducted in Well A of the E Oilfield.
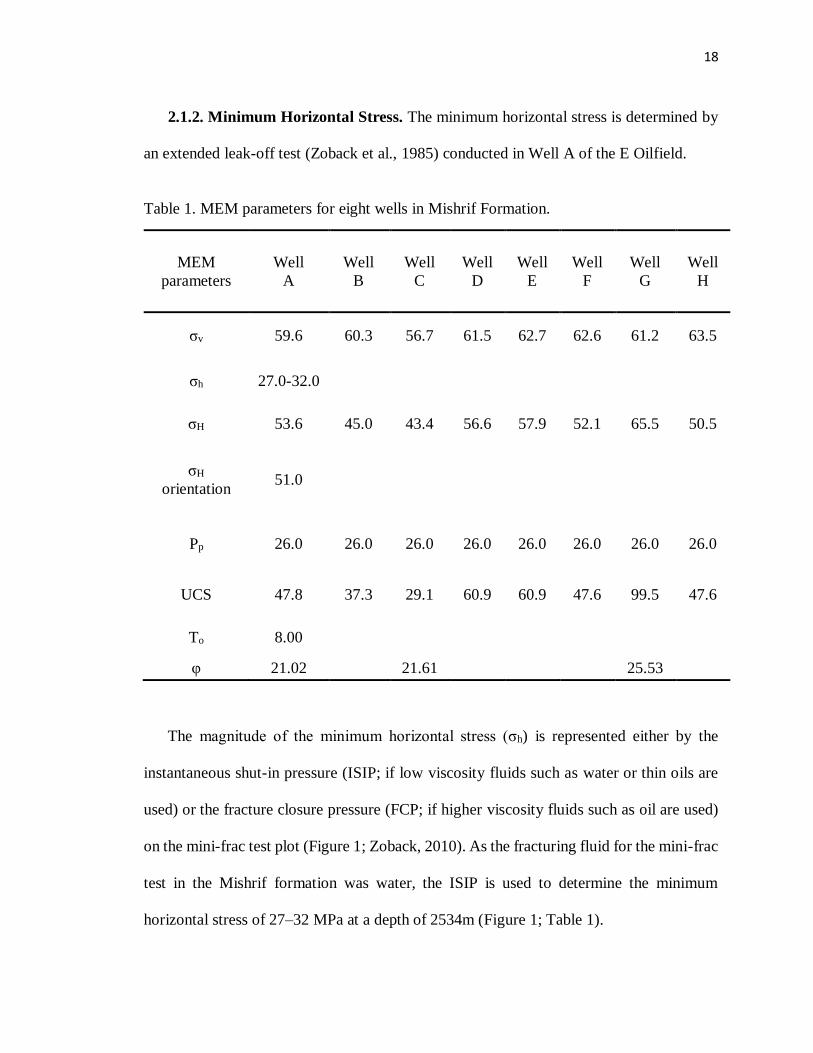
Table 1. MEM parameters for eight wells in Mishrif Formation.
The magnitude of the minimum horizontal stress (σh) is represented either by the
instantaneous shut-in pressure (ISIP; if low viscosity fluids such as water or thin oils are
used) or the fracture closure pressure (FCP; if higher viscosity fluids such as oil are used)
on the mini-frac test plot (Figure 1; Zoback, 2010). As the fracturing fluid for the mini-frac
test in the Mishrif formation was water, the ISIP is used to determine the minimum
horizontal stress of 27–32 MPa at a depth of 2534m (Figure 1; Table 1).
MEM
parameters
Well
A
Well
B
Well
C
Well
D
Well
E
Well
F
Well
G
Well
H
σv 59.6 60.3 56.7 61.5 62.7 62.6 61.2 63.5
σh 27.0-32.0
σH 53.6 45.0 43.4 56.6 57.9 52.1 65.5 50.5
σH
orientation 51.0
Pp 26.0 26.0 26.0 26.0 26.0 26.0 26.0 26.0
UCS 47.8 37.3 29.1 60.9 60.9 47.6 99.5 47.6
To 8.00
φ 21.02 21.61 25.53
19
Figure 1. Extended leak-off test in Well A to determine the minimum horizontal stress,
Sh for the Mishrif formation. The ISIP indicates a Sh of 32 MPa.
2.1.3. Pore Pressure. The Mishrif Formation is characterized by highly variable pore
pressures. Figure 2 shows pore pressure measurements from more than 40 wells. The pore
pressure measurements are based on repeat formation tests (Stewart and Wittmann, 1979)
for the Oilfield E including the Mishrif Formation and over- and underlying formations
(Figure 2). Due to inconsistencies in the measured pore pressure values because of the
reservoir depletion (i.e. the pore pressure data distribution represents more than 40 wells)
resulting in maximum (Max Pp) and minimum pore pressure (Min Pp) distributions,
drilling operations were based on an interpolated pore pressure across the whole field (Int
Pp). This interpolated pore pressure is also used in the following calculations for the
updated mud weight window.
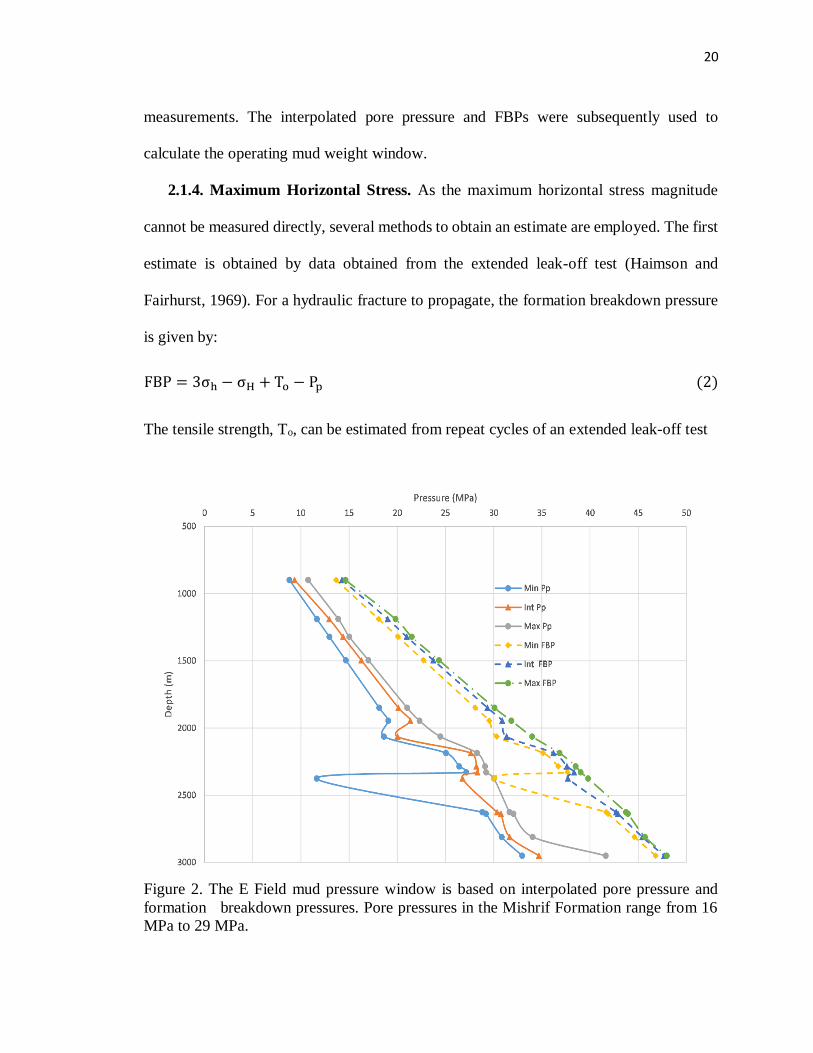
Figure 2 also shows the formation breakdown pressure (FBP) obtained from leak-off
tests for more than 40 wells. Similar to the pore pressure measurements an interpolated
FBP is calculated based on the maximum FBP (Max FBP) and minimum FBP (Min FBP)
20
measurements. The interpolated pore pressure and FBPs were subsequently used to
calculate the operating mud weight window.
2.1.4. Maximum Horizontal Stress. As the maximum horizontal stress magnitude
cannot be measured directly, several methods to obtain an estimate are employed. The first
estimate is obtained by data obtained from the extended leak-off test (Haimson and
Fairhurst, 1969). For a hydraulic fracture to propagate, the formation breakdown pressure
is given by:
FBP = 3σh − σH + To − Pp (2)
The tensile strength, To, can be estimated from repeat cycles of an extended leak-off test
Figure 2. The E Field mud pressure window is based on interpolated pore pressure and
formation breakdown pressures. Pore pressures in the Mishrif Formation range from 16
MPa to 29 MPa.
21
(Fjaer, 1992; To=8 MPa for the Mishrif Formation), σH is given by:
σH = 3σh − FBP + To − Pp (3)
For the extended leak-off test conducted in well A in the Mishrif Formation σH = 41
MPa. Since measurements/estimates for pore pressure, FBP and tensile strength are also
available (based on extended leakoff tests) for wells B-H, assuming that σh from Well A
applies for the whole field, additional stress magnitude estimates for σH (for wells B-H)
can be obtained (Table 1).
The second estimate for σH is obtained using the technique of circumferential wellbore
modeling (Zoback et al., 2003). The fact that drilling induced tensile failure is not observed
in any well in the Mishrif Formation requires:
3σh − σH − Pp − Pi > −To (4)
With the previously determine magnitudes for σh, pore pressure, mud pressure and
tensile strength, wellbore fluid pressure, σH > 46 MPa in the Mishrif Formation.
A similar constraint on σH can be obtained considering the observation of breakouts in
a deviated well following Zoback and Peska (1995). However, since the following analysis
evaluates the influence of three different failure criteria (Modifier Lade, Mohr-Coulomb,
Mogi-Coulomb) on the observed well stability problems in the E oilfield, Zoback and
Peska's (1995) procedure would have to be conducted for the three different failure criteria.
Moreover, Fjær et al. (2008) have shown that six different permutations of the axial, hoop
and radial stress have to be considered in order to map the occurrence of instability regions
in a deviated wellbore. Such an extensive analysis of the estimation of σH is beyond the
scope of this study and will be considered in a separate contribution. For the assumption
22
of a vertical well (for a Mohr-Coulomb failure criterion) a simple estimate of σH can be
obtained by requiring:
Pore pressures in the Mishrif Formation range from 16 MPa to 29 MPa.
σ1 ≥ UCS + σ3
1 + sin
1 − sin (5)
Where σ1 = σƟƟ (hoop stress), σ3 = σrr (radial stress), UCS is the unconfined compressive
strength, and ϕ is the coefficient of internal friction. This gives:
3σH − σh − Pp − Pi ≥ UCS + (Pi − Pp)1 + sin
1 − sin (6)
Where Pi represents the wellbore fluid pressure. Hence, σH can be estimated by:
σH ≥1
3[UCS + (Pi − Pp)
1 + sin
1 − sin + σh + Pp + Pi] (7)
The data for the Mishrif formation for well A yields σH > 53 MPa, which coincides
with the previous estimate of σH > 46 MPa. Since breakouts and wellbore collapse is
observed in several wells in the Mishrif formation, σH = 53 MPa is used for the subsequent
wellbore stability analysis, UCS and ϕ (Table 1).
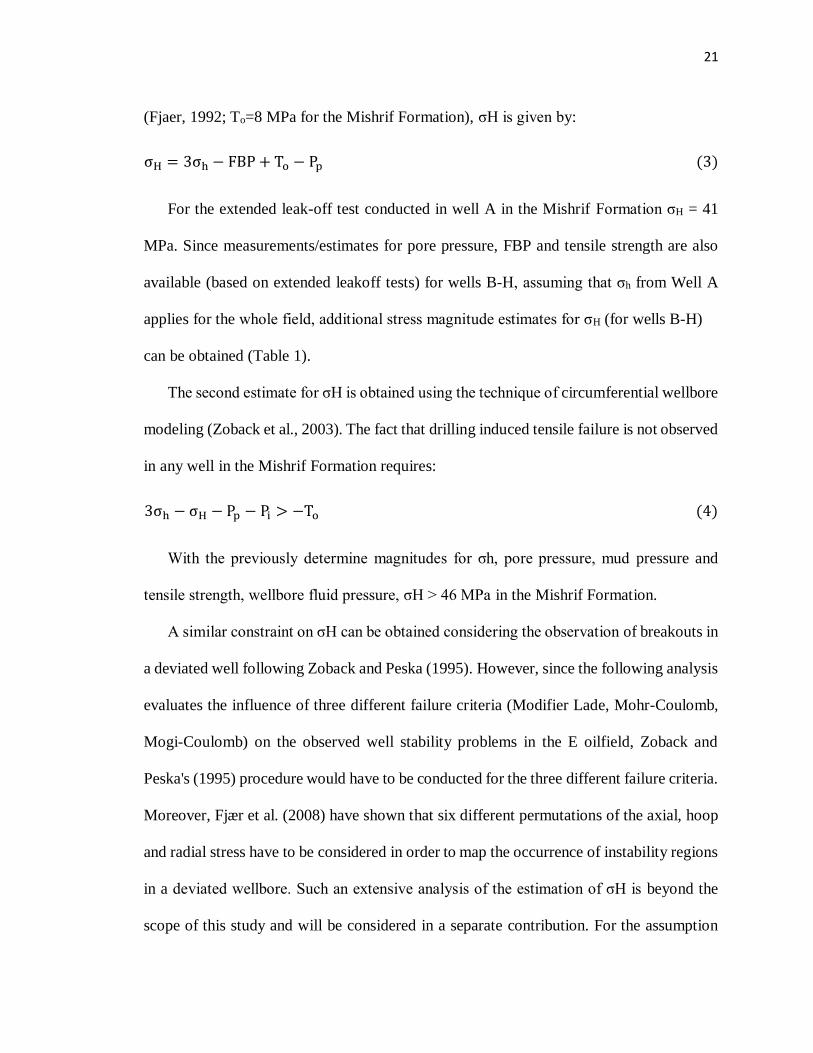
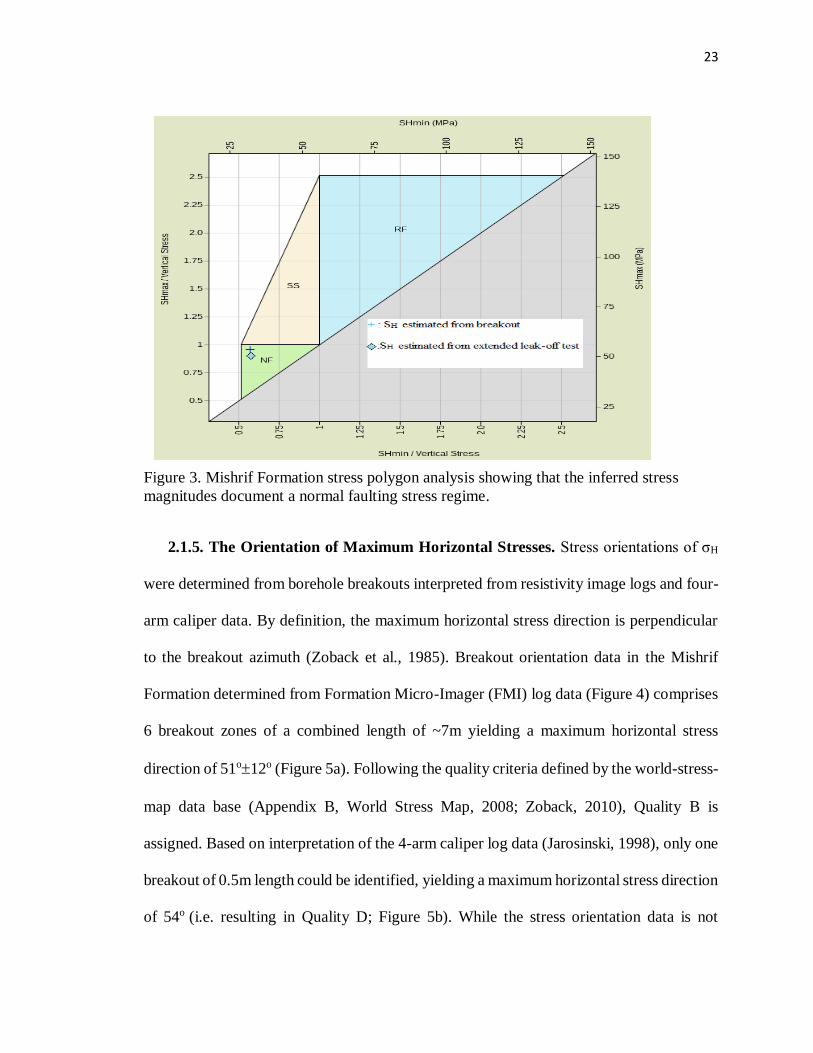
In addition, to further evaluate the previous constraints for σH, stress polygon analysis
(Figure 3; Zoback et al., 1986) shows that the σH magnitudes determined favor an
extensional (i.e. normal faulting) stress regime and that the σH magnitudes arrange are on
the periphery of the polygon, which is often observed for crustal stresses in frictional
equilibrium (Zoback, 2010).
23
Figure 3. Mishrif Formation stress polygon analysis showing that the inferred stress
magnitudes document a normal faulting stress regime.
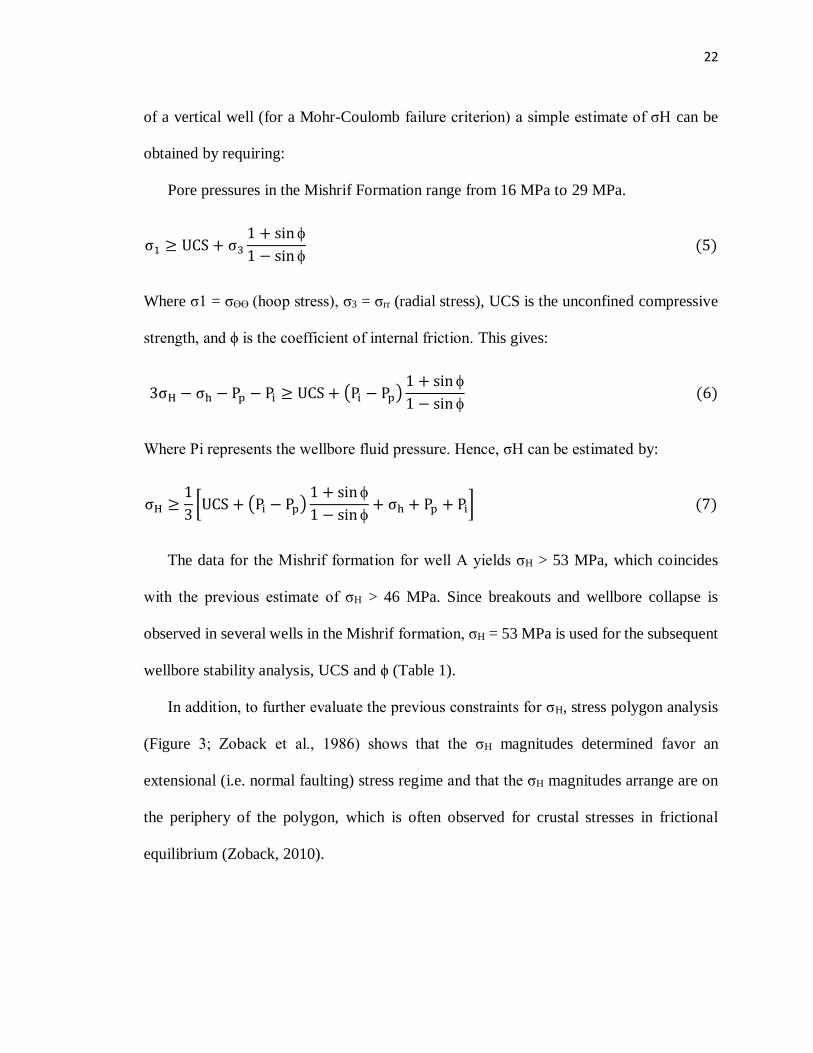
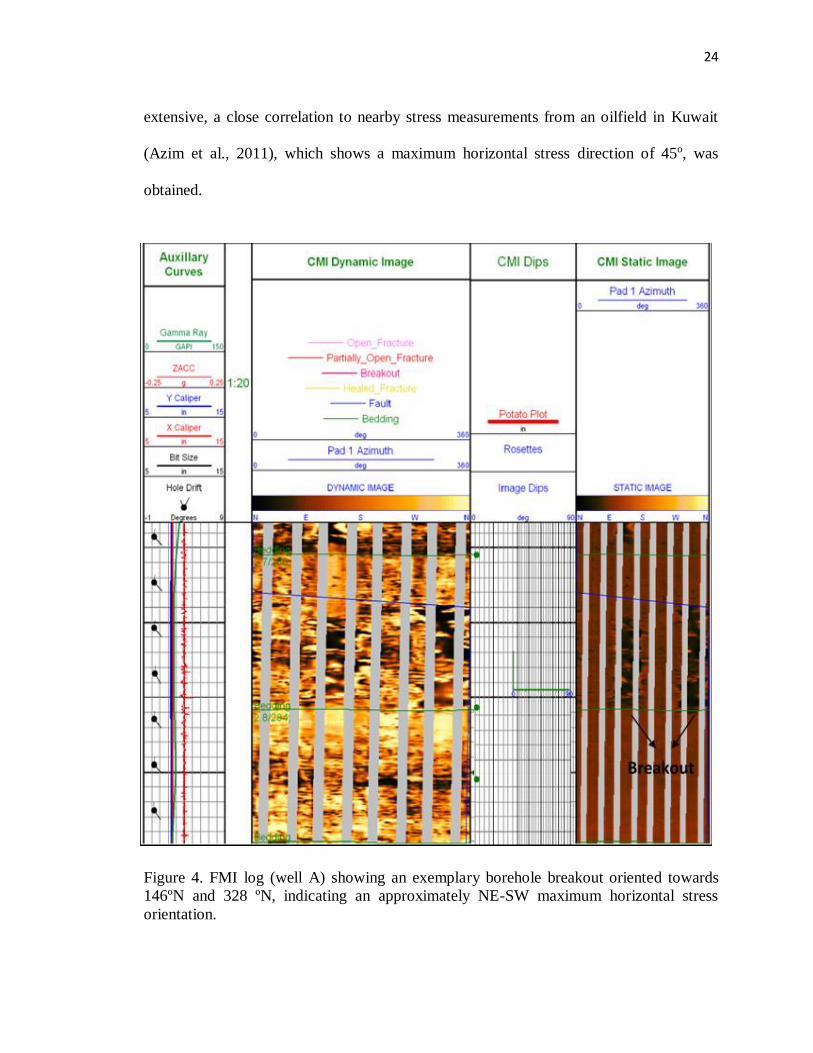
2.1.5. The Orientation of Maximum Horizontal Stresses. Stress orientations of σH
were determined from borehole breakouts interpreted from resistivity image logs and four-
arm caliper data. By definition, the maximum horizontal stress direction is perpendicular
to the breakout azimuth (Zoback et al., 1985). Breakout orientation data in the Mishrif
Formation determined from Formation Micro-Imager (FMI) log data (Figure 4) comprises
6 breakout zones of a combined length of ~7m yielding a maximum horizontal stress
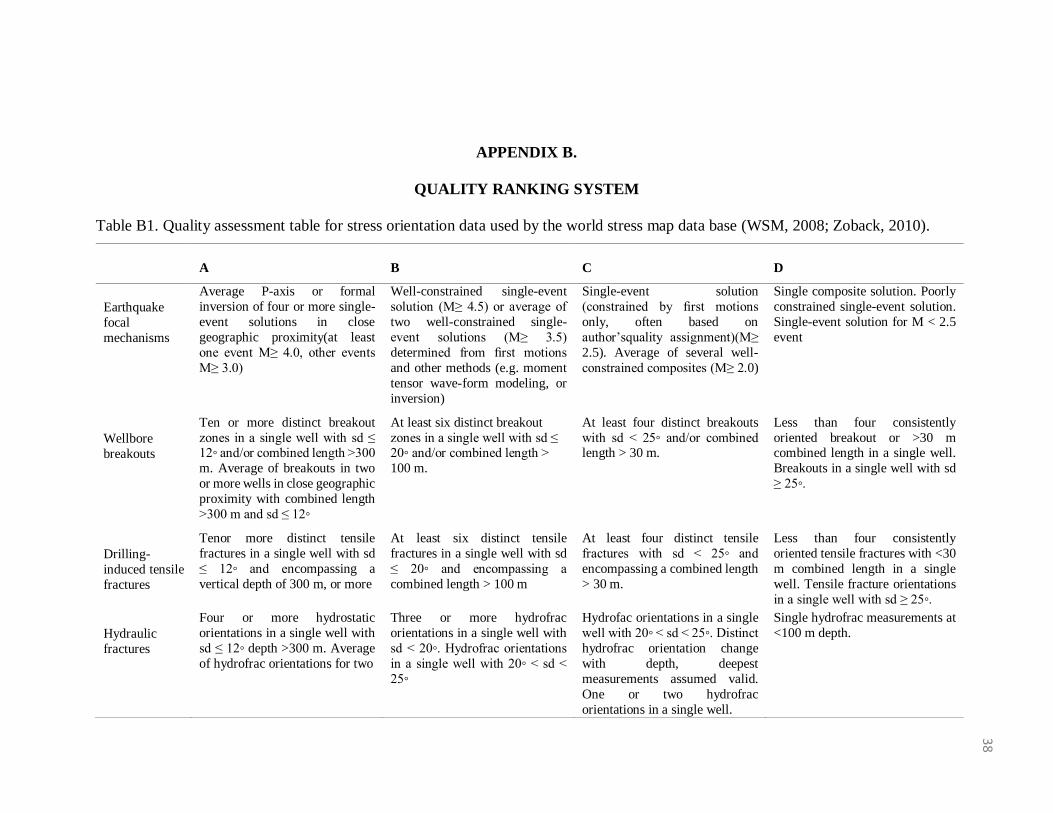
direction of 51o12o (Figure 5a). Following the quality criteria defined by the world-stress-
map data base (Appendix B, World Stress Map, 2008; Zoback, 2010), Quality B is
assigned. Based on interpretation of the 4-arm caliper log data (Jarosinski, 1998), only one
breakout of 0.5m length could be identified, yielding a maximum horizontal stress direction
of 54o (i.e. resulting in Quality D; Figure 5b). While the stress orientation data is not
24
extensive, a close correlation to nearby stress measurements from an oilfield in Kuwait
(Azim et al., 2011), which shows a maximum horizontal stress direction of 45o, was
obtained.
Figure 4. FMI log (well A) showing an exemplary borehole breakout oriented towards
146ºN and 328 ºN, indicating an approximately NE-SW maximum horizontal stress
orientation.
25
Figure 5. Breakout orientations for Mishrif formation; (a) Shows the breakout orientations
obtained from the FMI log, (b) Shows the Breakout orientations obtained from the four
arm caliper log.
2.2. ELASTIC PARAMETERS
Due to the absence of laboratory core measurements and S-wave velocities not being
recorded on the sonic log, the Poisson's ratio is assumed to be 0.25, and the sensitivity
analysis on the influence of the Poisson's ratio on the mud design was performed by
(Alkamil et al., 2017) and it will be discussed later in this work.
2.3. ROCK STRENGTH
Since the following wellbore stability analyses are based on the Mohr-Coulomb, the
Mogi-Coulomb and the Modified Lade failure criteria, the rock strength parameters of
cohesion (determined from the unconfined compressive strength), So, internal friction
angle, ϕ, and tensile strength, To, need to be determined.
26
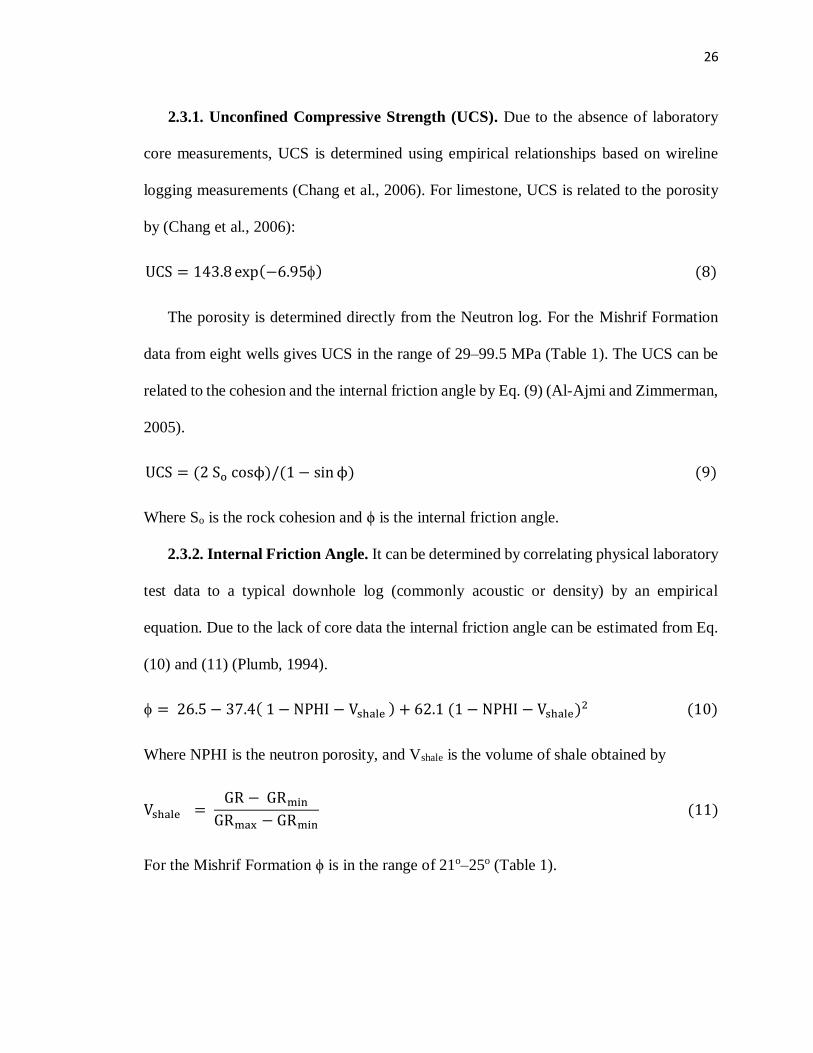
2.3.1. Unconfined Compressive Strength (UCS). Due to the absence of laboratory
core measurements, UCS is determined using empirical relationships based on wireline
logging measurements (Chang et al., 2006). For limestone, UCS is related to the porosity
by (Chang et al., 2006):
UCS = 143.8 exp(−6.95) (8)
The porosity is determined directly from the Neutron log. For the Mishrif Formation
data from eight wells gives UCS in the range of 29–99.5 MPa (Table 1). The UCS can be
related to the cohesion and the internal friction angle by Eq. (9) (Al-Ajmi and Zimmerman,
2005).
UCS = (2 So cosϕ)/(1 − sin ϕ) (9)
Where So is the rock cohesion and ϕ is the internal friction angle.
2.3.2. Internal Friction Angle. It can be determined by correlating physical laboratory
test data to a typical downhole log (commonly acoustic or density) by an empirical
equation. Due to the lack of core data the internal friction angle can be estimated from Eq.
(10) and (11) (Plumb, 1994).
= 26.5 − 37.4( 1 − NPHI − Vshale ) + 62.1 (1 − NPHI − Vshale)2 (10)
Where NPHI is the neutron porosity, and Vshale is the volume of shale obtained by
Vshale = GR − GRmin
GRmax − GRmin (11)
For the Mishrif Formation ϕ is in the range of 21o–25o (Table 1).
27
2.3.3. Tensile Strength. Due to the absence of a Brazilian strength test, To is estimated
from the extended leak-off test (Torres et al., 2003), for which To can be estimated by the
difference between the FBP and ISIP as shown in Figure 1. For the Mishrif Formation a
tensile strength of 8 MPa is determined (based on data from Well A; Table 1).
3. WELLBORE STABILITY
3.1. DRILLING CHALLENGES
Due to the heterogeneity of the Mishrif reservoir, the formation pore pressure fluctuates
across the entire reservoir zone, which causes localized fluctuations in the near-wellbore
stresses. Under this scenario, high enough mud-weight values (while maintaining
overbalanced drilling conditions) are required to minimize breakout severity (i.e. shear
failure: e.g. Zoback, 2010; Aadnoy and Looyeh, 2011). However, in the case of low
reservoir pore pressure (as also observed in the Mishrif Formation), the pore pressure might
be close to hydrostatic or sub-hydrostatic; thus, a higher mud weight is likely to cause a
large overbalance, increasing the chances of getting differentially stuck while drilling
across these reservoirs (Helmick and Longley, 1957). It needs to be restated that the
interpolated pore pressure was used to calculate the operating mud weight window.
Due to the uncertainty in the distribution of the pore pressure along the planned
trajectory, the predicted mud weight will have uncertainties both for minimizing breakouts
and managing differential sticking. Because a drilling problem could result from one or a
combination of these parameters, an integrated approach to select the optimum mud weight
between the minimum mud weight required to prevent collapse failure and the maximum
overbalance allowed to prevent the differential sticking occurrence, is used here.
28
3.2. COLLAPSE PRESSURE
The minimum mud weight, i.e. also termed collapse pressure, is determined based on
the compiled 1D MEM for all possible wellbore trajectories (PesKa and Zoback, 1995).
The equations for the calculation of the required tangential wellbore stresses in an
arbitrarily oriented wellbore are given in detail in Aadnoy (1989), PesKa and Zoback
(1995), Zoback (2010) and are therefore not repeated here. Based on the MEM, three
different failure criteria (Mohr-Coulomb, Mogi-Coulomb, and Modified Lade; Appendix
C) are used to evaluate the risk of borehole collapse. Figures. 6 and 7 show the collapse
pressure for two of the eight wells in Field E for different wellbore orientations.
3.3. DIFFERENTIAL STICKING
Differential sticking can result when pressure from an overbalanced mud column acts
on the surface area of the drill string against a filter cake deposited across a permeable
formation. The surface area of the pipe that is embedded into the mud cake has a pressure
equal to the pore pressure acting from one direction while the hydrostatic pressure acts in
the other direction. When the hydrostatic pressure in the wellbore is higher than the
formation pressure, the pressure differential forces the pipe towards the borehole wall. This
usually occurs along the drill collars because there is less annular clearance to begin with,
the drill collars usually have larger diameter, which increases the crossectional area that is
in contact with the borehole, and the drill collars are the first section of the pipe to encounter
the permeable formation (Rehm et al., 2008). The best method to limit the risk of
differential sticking is by using the minimum mud weight (Helmick and Longley, 1957).
29
4. SENSITIVITY ANALYSIS
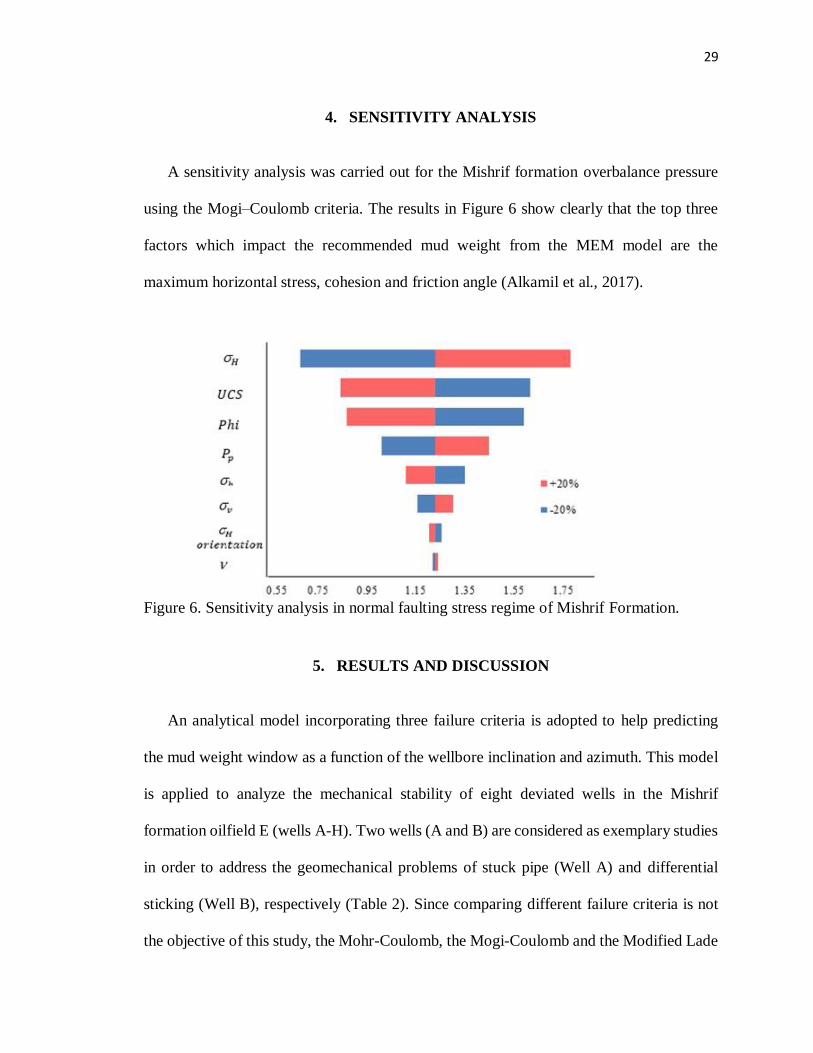
A sensitivity analysis was carried out for the Mishrif formation overbalance pressure
using the Mogi–Coulomb criteria. The results in Figure 6 show clearly that the top three
factors which impact the recommended mud weight from the MEM model are the
maximum horizontal stress, cohesion and friction angle (Alkamil et al., 2017).
Figure 6. Sensitivity analysis in normal faulting stress regime of Mishrif Formation.
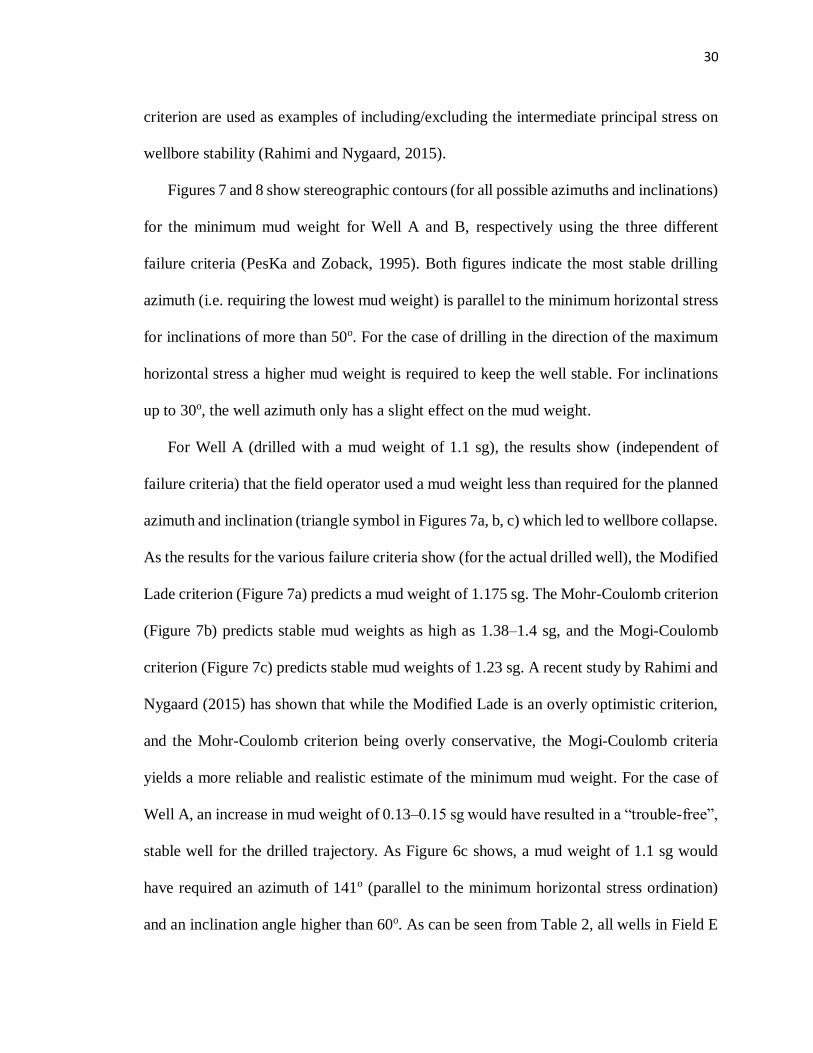
5. RESULTS AND DISCUSSION
An analytical model incorporating three failure criteria is adopted to help predicting
the mud weight window as a function of the wellbore inclination and azimuth. This model
is applied to analyze the mechanical stability of eight deviated wells in the Mishrif
formation oilfield E (wells A-H). Two wells (A and B) are considered as exemplary studies
in order to address the geomechanical problems of stuck pipe (Well A) and differential
sticking (Well B), respectively (Table 2). Since comparing different failure criteria is not
the objective of this study, the Mohr-Coulomb, the Mogi-Coulomb and the Modified Lade
30
criterion are used as examples of including/excluding the intermediate principal stress on
wellbore stability (Rahimi and Nygaard, 2015).
Figures 7 and 8 show stereographic contours (for all possible azimuths and inclinations)
for the minimum mud weight for Well A and B, respectively using the three different
failure criteria (PesKa and Zoback, 1995). Both figures indicate the most stable drilling
azimuth (i.e. requiring the lowest mud weight) is parallel to the minimum horizontal stress
for inclinations of more than 50o. For the case of drilling in the direction of the maximum
horizontal stress a higher mud weight is required to keep the well stable. For inclinations
up to 30o, the well azimuth only has a slight effect on the mud weight.
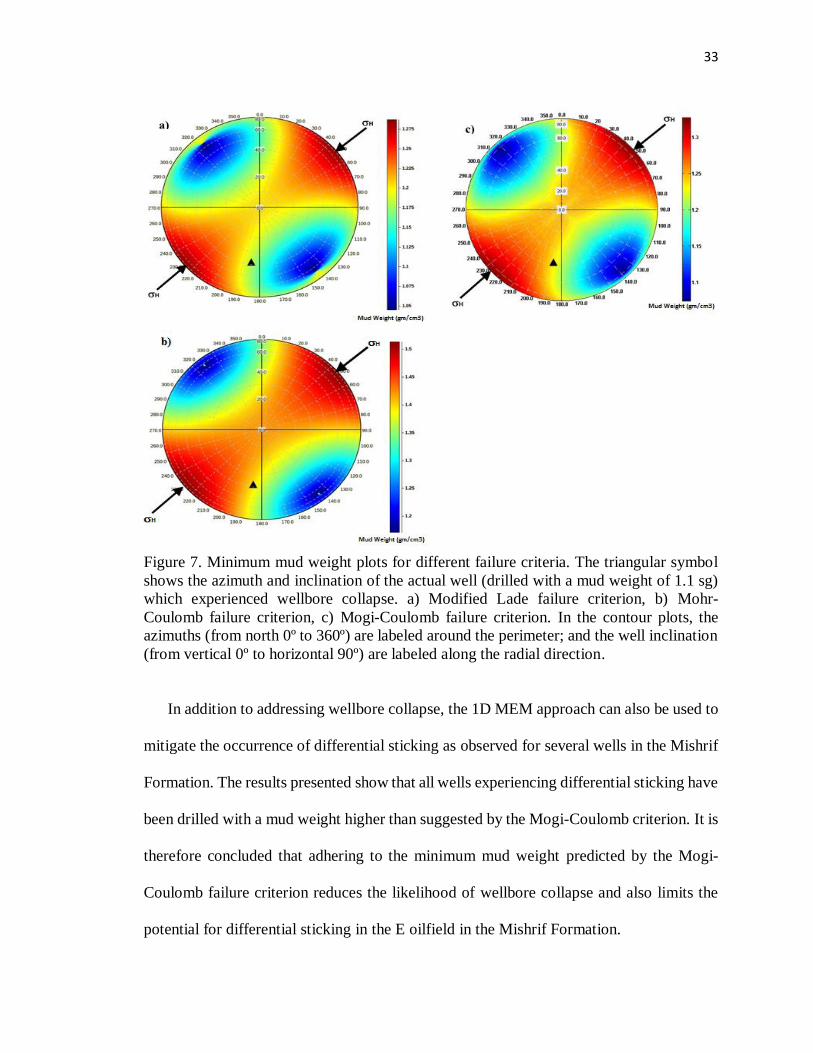
For Well A (drilled with a mud weight of 1.1 sg), the results show (independent of
failure criteria) that the field operator used a mud weight less than required for the planned
azimuth and inclination (triangle symbol in Figures 7a, b, c) which led to wellbore collapse.
As the results for the various failure criteria show (for the actual drilled well), the Modified
Lade criterion (Figure 7a) predicts a mud weight of 1.175 sg. The Mohr-Coulomb criterion
(Figure 7b) predicts stable mud weights as high as 1.38–1.4 sg, and the Mogi-Coulomb
criterion (Figure 7c) predicts stable mud weights of 1.23 sg. A recent study by Rahimi and
Nygaard (2015) has shown that while the Modified Lade is an overly optimistic criterion,
and the Mohr-Coulomb criterion being overly conservative, the Mogi-Coulomb criteria
yields a more reliable and realistic estimate of the minimum mud weight. For the case of
Well A, an increase in mud weight of 0.13–0.15 sg would have resulted in a “trouble-free”,
stable well for the drilled trajectory. As Figure 6c shows, a mud weight of 1.1 sg would
have required an azimuth of 141o (parallel to the minimum horizontal stress ordination)
and an inclination angle higher than 60o. As can be seen from Table 2, all wells in Field E
31
of the Mishrif Formation experiencing wellbore collapse and associated “stuck pipe”
(Wells A, E and H) have been drilled with a mud weight less than suggested by the Mogi-
Coulomb criterion. It is therefore concluded that the presented 1D MEM approach can be
used to mitigate all wellbore collapse problems observed in Field E.
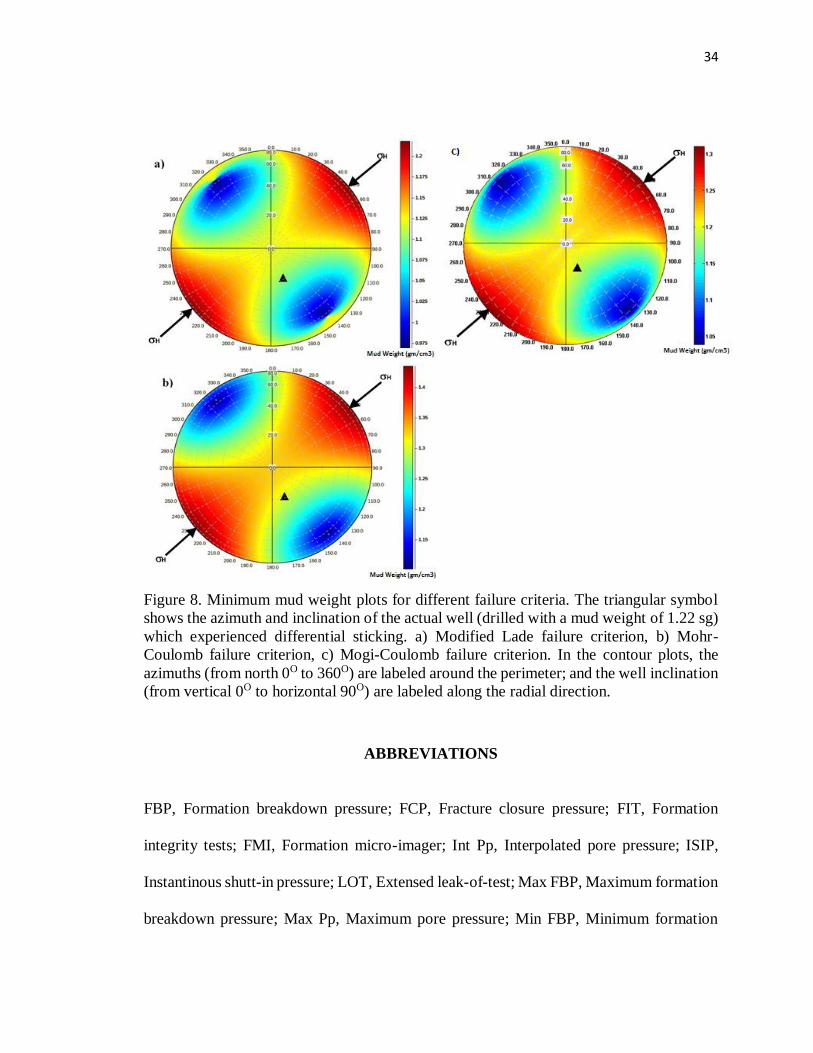
For Well B, the operator tried to support the wellbore by increasing the mud weight
(1.22 sg; without geomechanical consideration) resulting in high overbalance pressure
conditions, which caused differential sticking. The Modified Lade criterion (Figure 8a)
suggests that a reduction to 1.09 sg would be possible, however as shown for Well A, this
would increase the likelihood of collapse. The Mohr-Coulomb criterion (Figure 8b) even
suggests a higher minimum mud weight than used, and therefore cannot be considered. The
Mogi-Coulomb criterion would enable a reduction of 0.05 sg before risking the onset of
collapse. If this reduction still results in differential sticking, the optimal drilling trajectory
(with an azimuth of 141o and an inclination of more than 60o) would enable to use a mud
weight as low as 1.05 sg. As can be seen in Table 2, all wells in Field E of the Mishrif
Formation experiencing differential sticking (Wells B, C, D, F and G) have been drilled
with a mud weight higher than suggested by the Mogi-Coulomb criterion.
6. CONCLUSIONS
This study shows that drilling operations in the Mishrif formation were conducted
without considering an appropriate geomechanical analysis. The operating minimum mud
weight was assigned based on the interpolated pore pressure distribution, and widespread
32
borehole collapse was observed in several wells in the Mishrif Formation. A simple 1D
MEM used to calculate the minimum mud weight (based on the principal stresses of an
arbitrary oriented wellbore) shows that the widespread stability problems could have been
prevented.
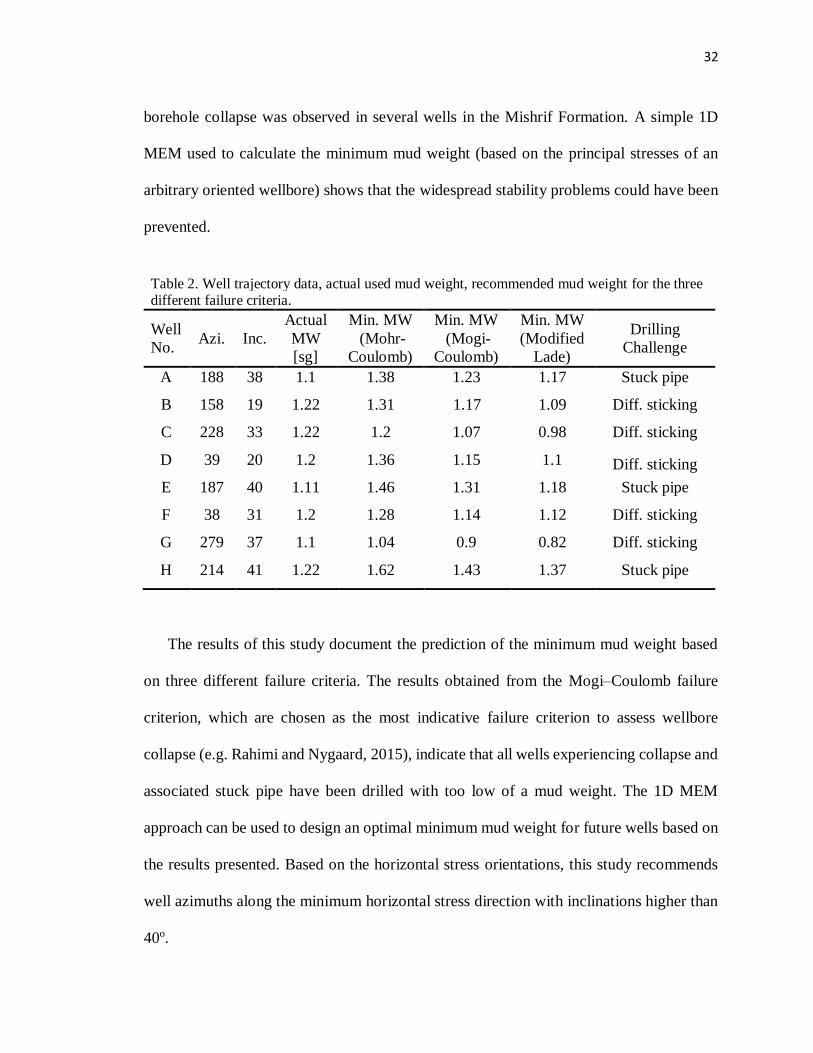
The results of this study document the prediction of the minimum mud weight based
on three different failure criteria. The results obtained from the Mogi–Coulomb failure
criterion, which are chosen as the most indicative failure criterion to assess wellbore
collapse (e.g. Rahimi and Nygaard, 2015), indicate that all wells experiencing collapse and
associated stuck pipe have been drilled with too low of a mud weight. The 1D MEM
approach can be used to design an optimal minimum mud weight for future wells based on
the results presented. Based on the horizontal stress orientations, this study recommends
well azimuths along the minimum horizontal stress direction with inclinations higher than
40o.
Table 2. Well trajectory data, actual used mud weight, recommended mud weight for the three different failure criteria.
Well
No. Azi. Inc.
Actual
MW
[sg]
Min. MW
(Mohr-
Coulomb)
Min. MW
(Mogi-
Coulomb)
Min. MW
(Modified
Lade)
Drilling
Challenge
A 188 38 1.1 1.38 1.23 1.17 Stuck pipe
B 158 19 1.22 1.31 1.17 1.09 Diff. sticking
C 228 33 1.22 1.2 1.07 0.98 Diff. sticking
D 39 20 1.2 1.36 1.15 1.1 Diff. sticking
E 187 40 1.11 1.46 1.31 1.18 Stuck pipe
F 38 31 1.2 1.28 1.14 1.12 Diff. sticking
G 279 37 1.1 1.04 0.9 0.82 Diff. sticking
H 214 41 1.22 1.62 1.43 1.37 Stuck pipe
33
Figure 7. Minimum mud weight plots for different failure criteria. The triangular symbol
shows the azimuth and inclination of the actual well (drilled with a mud weight of 1.1 sg)
which experienced wellbore collapse. a) Modified Lade failure criterion, b) Mohr-
Coulomb failure criterion, c) Mogi-Coulomb failure criterion. In the contour plots, the
azimuths (from north 0º to 360º) are labeled around the perimeter; and the well inclination
(from vertical 0º to horizontal 90º) are labeled along the radial direction.
In addition to addressing wellbore collapse, the 1D MEM approach can also be used to
mitigate the occurrence of differential sticking as observed for several wells in the Mishrif
Formation. The results presented show that all wells experiencing differential sticking have
been drilled with a mud weight higher than suggested by the Mogi-Coulomb criterion. It is
therefore concluded that adhering to the minimum mud weight predicted by the Mogi-
Coulomb failure criterion reduces the likelihood of wellbore collapse and also limits the
potential for differential sticking in the E oilfield in the Mishrif Formation.
34
Figure 8. Minimum mud weight plots for different failure criteria. The triangular symbol
shows the azimuth and inclination of the actual well (drilled with a mud weight of 1.22 sg)
which experienced differential sticking. a) Modified Lade failure criterion, b) Mohr-
Coulomb failure criterion, c) Mogi-Coulomb failure criterion. In the contour plots, the
azimuths (from north 0O to 360O) are labeled around the perimeter; and the well inclination
(from vertical 0O to horizontal 90O) are labeled along the radial direction.
ABBREVIATIONS
FBP, Formation breakdown pressure; FCP, Fracture closure pressure; FIT, Formation
integrity tests; FMI, Formation micro-imager; Int Pp, Interpolated pore pressure; ISIP,
Instantinous shutt-in pressure; LOT, Extensed leak-of-test; Max FBP, Maximum formation
breakdown pressure; Max Pp, Maximum pore pressure; Min FBP, Minimum formation

35
breakdown pressure; Min Pp, Minimum pore pressure; MEM, Mechanical earth model;
MW, Mud weight; MWD, Measuring while drilling; NPHI, Neutron porosity; TPN, Non-
productive time; TVD, True vertical depth; UCS, Unconfined compressive strength;
Vshale, Shale volume.
ACKNOWLEDGEMENTS
We would like to express our appreciation to the Iraqi Ministry of Higher Education
and Scientific Research (MOHESR) - University of Basrah for sponsoring Ethar Alkamil
to finish this work. Husam Abbood would like to thank South Oil Company for the
permission to publish the data of the Mishrif Formation.
NOMENCLATURE
ϕ Internal friction angle
Co Unconfined compressive strength
DTCO Sonic log
Edyn Dynamic Young's Modules
Estat Static Young's Modules
G Bulk Modules
i Inclination
k Stress path coefficient
NF Normal Fault
Pp Pore pressure
Pw Mud Weight

36
q Flow factor parameter
r Distance from wellbore
R Wellbore radius
RHOB Density log
37
APPENDIX A.
MISHRIF FORMATION LOG DATA
38
APPENDIX B.
QUALITY RANKING SYSTEM
Table B1. Quality assessment table for stress orientation data used by the world stress map data base (WSM, 2008; Zoback, 2010).
A B C D
Earthquake
focal
mechanisms
Average P-axis or formal
inversion of four or more single-
event solutions in close
geographic proximity(at least
one event M≥ 4.0, other events
M≥ 3.0)
Well-constrained single-event
solution (M≥ 4.5) or average of
two well-constrained single-
event solutions (M≥ 3.5)
determined from first motions
and other methods (e.g. moment
tensor wave-form modeling, or
inversion)
Single-event solution
(constrained by first motions
only, often based on
author’squality assignment)(M≥
2.5). Average of several well-
constrained composites (M≥ 2.0)
Single composite solution. Poorly
constrained single-event solution.
Single-event solution for M < 2.5
event
Wellbore
breakouts
Ten or more distinct breakout
zones in a single well with sd ≤ 12◦ and/or combined length >300
m. Average of breakouts in two
or more wells in close geographic
proximity with combined length
>300 m and sd ≤ 12◦
At least six distinct breakout
zones in a single well with sd ≤ 20◦ and/or combined length >
100 m.
At least four distinct breakouts
with sd < 25◦ and/or combined length > 30 m.
Less than four consistently
oriented breakout or >30 m combined length in a single well.
Breakouts in a single well with sd
≥ 25◦.
Drilling-
induced tensile
fractures
Tenor more distinct tensile
fractures in a single well with sd
≤ 12◦ and encompassing a
vertical depth of 300 m, or more
At least six distinct tensile
fractures in a single well with sd
≤ 20◦ and encompassing a
combined length > 100 m
At least four distinct tensile
fractures with sd < 25◦ and
encompassing a combined length
> 30 m.
Less than four consistently
oriented tensile fractures with <30
m combined length in a single
well. Tensile fracture orientations
in a single well with sd ≥ 25◦.
Hydraulic
fractures
Four or more hydrostatic
orientations in a single well with
sd ≤ 12◦ depth >300 m. Average
of hydrofrac orientations for two
Three or more hydrofrac
orientations in a single well with
sd < 20◦. Hydrofrac orientations
in a single well with 20◦ < sd <
25◦
Hydrofac orientations in a single
well with 20◦ < sd < 25◦. Distinct
hydrofrac orientation change
with depth, deepest
measurements assumed valid.
One or two hydrofrac
orientations in a single well.
Single hydrofrac measurements at
<100 m depth.
38
39
APPENDIX C.
ROCK FAILURE CRITERIA FOR WELLBORE STABILITY ANALYSIS
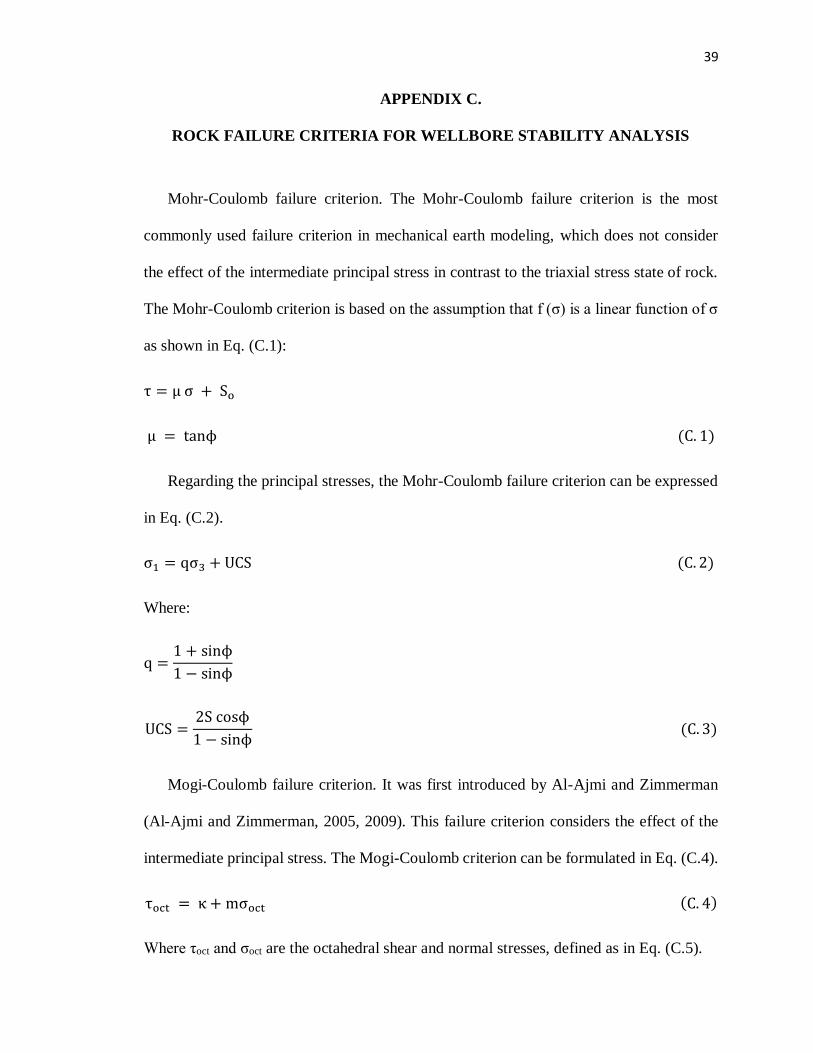
Mohr-Coulomb failure criterion. The Mohr-Coulomb failure criterion is the most
commonly used failure criterion in mechanical earth modeling, which does not consider
the effect of the intermediate principal stress in contrast to the triaxial stress state of rock.
The Mohr-Coulomb criterion is based on the assumption that f (σ) is a linear function of σ
as shown in Eq. (C.1):
τ = μ σ + So
μ = tanϕ (C. 1)
Regarding the principal stresses, the Mohr-Coulomb failure criterion can be expressed
in Eq. (C.2).
σ1 = qσ3 + UCS (C. 2)
Where:
q =1 + sinϕ
1 − sinϕ
UCS =2S cosϕ
1 − sinϕ (C. 3)
Mogi-Coulomb failure criterion. It was first introduced by Al-Ajmi and Zimmerman
(Al-Ajmi and Zimmerman, 2005, 2009). This failure criterion considers the effect of the
intermediate principal stress. The Mogi-Coulomb criterion can be formulated in Eq. (C.4).
τoct = κ + mσoct (C. 4)
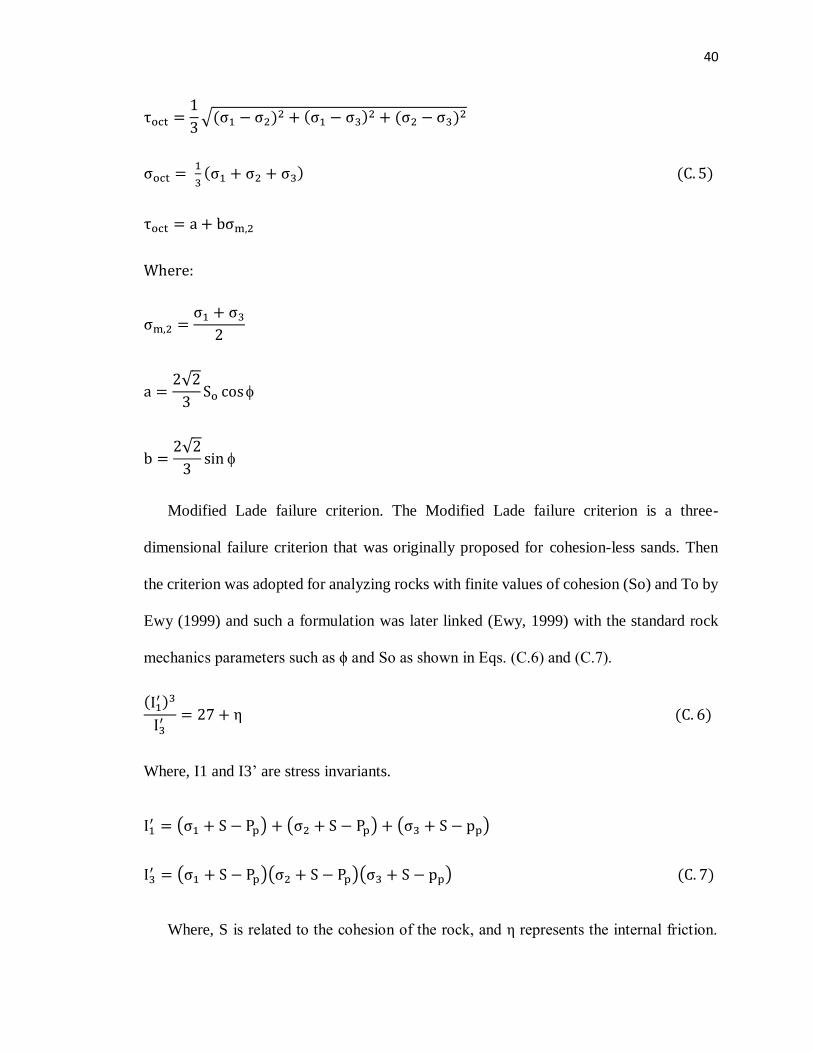
Where τoct and σoct are the octahedral shear and normal stresses, defined as in Eq. (C.5).
40
τoct =1
3√(σ1 − σ2)2 + (σ1 − σ3)2 + (σ2 − σ3)2
σoct = 1
3(σ1 + σ2 + σ3) (C. 5)
τoct = a + bσm,2
Where:
σm,2 =σ1 + σ3
2
a =2√2
3So cos
b =2√2
3sin
Modified Lade failure criterion. The Modified Lade failure criterion is a three-
dimensional failure criterion that was originally proposed for cohesion-less sands. Then
the criterion was adopted for analyzing rocks with finite values of cohesion (So) and To by
Ewy (1999) and such a formulation was later linked (Ewy, 1999) with the standard rock
mechanics parameters such as ϕ and So as shown in Eqs. (C.6) and (C.7).
(I1′ )3
I3′ = 27 + η (C. 6)
Where, I1 and I3’ are stress invariants.
I1′ = (σ1 + S − Pp) + (σ2 + S − Pp) + (σ3 + S − pp)
I3′ = (σ1 + S − Pp)(σ2 + S − Pp)(σ3 + S − pp) (C. 7)
Where, S is related to the cohesion of the rock, and η represents the internal friction.
41
Parameters S and η can be derived directly from the Mohr-Coulomb cohesion So and
internal friction angle ϕ by Eq. (C.8).
S =So
tanϕ η =
4tan2ϕ(9 − 7sinϕ)
1 − sinϕ (C. 8)
Note that So can be linked to Co and ϕ through So =Co/2q1/2, whereas q=tan2 (π/4+ ϕ/2).
REFERENCES
Aadnoy, B.S., Looyeh, R., 2011. Petroleum Rock Mechanics Drilling Operations and Well
Design, first ed. Gulf Professional Pub, Oxford.
Aadnoy, B.S., 1989. Stresses around horizontal boreholes drilled in sedimentary rocks. J.
Petrol. Sci. Eng. 2, 349–360.
Al-Ajmi, A.M., Zimmerman, R.W., 2009. A new well path optimization model for
increased mechanical borehole stability. J. Petrol. Sci. Eng. 2006 (69), 53–62.
Al-Ajmi, A.M., Zimmerman, R.W., 2005. The relation between the Mogi and the Coulomb
failure criteria. Int. J. Rock Mech. Min. Sci. 42, 441–439.
Alkamil, E.H.K., Abbood, H.R., Flori, R.E., Eckert, A., 2017. Wellbore stability evaluation
for Mishrif formation. In: SPE Middle East Oil & Gas Show and Conference Held in
Manama, Kingdom of Bahrain, 6–9 March 2017. https://doi.org/10.2118/183668-MS.
Aqrawi, A.A.M., Goff, J.C., Horbury, A.D., Sadooni, F.N., 2010. The Petroleum Geology
of Iraq, first ed. Scientilic Press Ltd.
Azim, S.A., Mukherjee, P., Al-Anezi, S.A., Al-Otaibi, B., Al-Saad, B., Perumalla, S.V.,
Babbington, J.F., 2011. Using an integrated geomechanical study to resolve expensive
wellbore stability problems while drilling through the Zubair shale/sand sequence of
Kuwait: a case study. In: SPE/IADC Middle East Drilling and Technology Conference
and Exhibition, Muscat, Oman, 24–26 October 2011.
Babbington, J.F., 2011. Using an integrated geomechanical study to resolve expensive
wellbore stability problems while drilling through the Zubair shale/sand sequence of
Kuwait: a case study. In: SPE/IADC Middle East Drilling and Technology Conference
and Exhibition, Muscat, Oman, 24–26 October 2011. https://doi.org/10.2118/148049-
MS.
42
Bell, J.S., Babcock, E.A., 1986. The stress regime of the Western Canadian basin and
implications for hydrocarbon production. Bull. Can. Petrol. Geol. 34 (3), 364–378.
September.
Bell, J.S., 1990. Investigating stress regimes in sedimentary basins using information from
oil industry wireline logs and drilling records. In: Hurst, A., Lovell, M., Morton, A.
(Eds.), Geological Applications of Wireline Logs, Geol. Soc. Lond. Spec. Publ, vol. 48,
pp. 305–325.
Chang, C., Zoback, M.D., Khaksar, A., 2006. Empirical relations between rock strength
and physical properties in sedimentary rocks. J. Petrol. Sci. Eng. 51 (3–4), 223–237.
Charlez, P., 1991. Rock Mechanics. Vol. I. Theoretical Fundamentals. Editions Technip,
Paris.
Das, B., Chatterjee, R., 2017. Wellbore stability analysis and prediction of minimum mud
weight for few wells in Krishna-Godavari Basin, India. Int. J. Rock Mech. Min. Sci. 93,
30–37. ISSN 1365-1609. https://doi.org/10.1016/j.ijrmms.2016.12.018.
Ewy, R.T., 1999. Wellbore-stability Predictions by Use of a Modified Lade Criterion.
Society of Petroleum Engineers. https://doi.org/10.2118/56862-P.
Far, P.B., Hassani, A.H., Al-Ajmi, A.M., Heydari, H., 2016. A novel model for wellbore
stability analysis during reservoir depletion, in. J. Nat. Gas Sci. Eng. 35 (Part A), 935–
943. ISSN 1875-5100. https://doi.org/10.1016/j.jngse.2016.09.051.
Fjaer, E., 1992. Petroleum Related Rock Mechanics, second ed. Elsevier, Amsterdam.
Fjær, E., Holt, R.M., Horsrud, P., Raaen, A.M., Risnes, R., 2008. Petroleum Related Rock
Mechanics, second ed. Elsevier Science, Amsterdam.
Gholami, R., Rabiei, M., Rasouli, V., Aadnoy, B., Fakhari, N., 2015. Application of
quantitative risk assessment in wellbore stability analysis. J. Petrol. Sci. Eng. 135, 185–
200. ISSN 0920-4105. https://doi.org/10.1016/j.petrol.2015.09.013.
Gholami, R., Maleki, S., Moradzadeh, A., Rasouli, V., Hanachi, J., 2014. Practical
application of failure criteria in determining safe mud weight windows in drilling
operations. J. Rock Mech. Geotech. Eng. 6, 13–25.
Haimson, B., Fairhurst, C., 1969, January 1. In-Situ Stress Determination At Great Depth
By Means Of Hydraulic Fracturing. American Rock Mechanics Association.
Helmick, W.E., Longley, A.J., 1957. Pressure-differential sticking of drill pipe and how it
can Be voided or relieved. In: The Spring Meeting of the Pacific Coast District, Division
of Production, Los Angeles, May 1957, pp. 55–61.
43
Hooft van Huysduynen, T., Ames, S.P., Tierney, W., Verspoor, R., 2014, November 10.
Flawless Startups in Iraq - Majnoon Oil Field achieves First Commercial Production.
Society of Petroleum Engineers. https://doi.org/10.2118/171912-MS.
Jaeger, J.C., Cook, N.G., Zimmerman, R., April 2007. Fundamentals of Rock Mechanics,
fourth ed. Wiley-Blackwell, Blackwell.
Jarosinski, M., 1998. Contemporary stress field distortion in the Polish part of the Western
Outer Carpathians and their basement. Tectonophysics 297 (1–4), 91–119, 20, ISSN
0040-1951.
Jassim, S.Z., Goff, J.C., 2006. Geology of Iraq, first ed. Dolin, Prague.
Kristiansen, T.G., 2007. Drilling wellbore stability in the compacting and subsiding Valhall
field: a case study. J. SPE Drill. Complet. 277–295. https://doi.org/10.2118/87221-PA.
Maleki, S., Gholami, R., Rasouli, V., Moradzadeh, A., 2014. Comparison of different
failure criteria in prediction of safe mud weigh window in drilling practice. Earth Sci.
Rev. 136, 36–58. ISSN 0012-8252.
Mastin, L., 1988. Effect of borehole deviation on breakout orientations. J. Geophys. Res.
93 (B8), 9187–9195. https://doi.org/10.1029/JB093iB08p09187.
Moos, D., Zoback, M.D., 1990. Utilization of observations of well bore failure to constrain
the orientation and magnitude of crustal stresses: application to continental, Deep Sea
Drilling Project, and Ocean Drilling Program boreholes. J. Geophys. Res. 95 (B6),
9305–9325. https://doi.org/10.1029/JB095iB06p09305.
Mansourizadeh, Mostafa, Jamshidian, Majid, Bazargan, Pouya, Mohammadzadeh, Omid,
2016. Wellbore stability analysis and breakout pressure prediction in vertical and
deviated boreholes using failure criteria – a case study. J. Petrol. Sci. Eng. 145, 482–
492. ISSN 0920-4105. https://doi.org/10.1016/j.petrol.2016.06.024.
Najibi, A.R., Ghafoori, M., Lashkaripour, G.R., Asef, M.R., Asef, Mohammad Reza, 2017.
Reservoir geomechanical modeling: in-situ stress, pore pressure, and mud design. J.
Petrol. Sci. Eng. 151, 31–39. ISSN 0920-4105. https://doi.org/10.1016/j.petrol.
2017.01.045.
PesKa, P., Zoback, M.D., July 1995. Compressive and tensile failure of inclined well bores
and determination of in situ stress and rock strength. J. Geophys. Res. Atmos. 100 (B7),
12791 https://doi.org/10.1029/95JB00319.
Plumb, R.A., 1994. Influence of composition and texture on the failure properties of clastic
rocks. In: Eurocks 94, Rock Mechanics in Petroleum Engineering Conference, pp. 13–
20.
44
Rahimi, R., Nygaard, R., 2015. Comparison of rock failure criteria in predicting borehole
shear failure. Int. J. Rock Mech. Min. Sci. 79, 29–40.
Rehm, B., Schubert, J., Haghshenas, A., Paknejad, A., Hughes, J., 2008. Managed Pressure
Drilling, first ed. Gulf Publishing Company, Houston.
Schroeter, D.R., Chan, H.W., 1989. Successful application of drilling technology extends
directional capability. J. SPE Drill. Eng. https://doi.org/10.2118/17660-PA.
Stewart, G., Wittmann, M., 1979. Interpretation of the Pressure Response of the Repeat
Formation Tester. Society of Petroleum Engineers, pp. 230–236.
https://doi.org/10.2118/8362-MS.
Tianshou, Ma, Chen, Ping, Yang, Chunhe, Zhao, Jian, 2015. Wellbore stability analysis
and well path optimization based on the breakout width model and Mogi–Coulomb
criterion. J. Petrol. Sci. Eng. 135, 678–701. ISSN 0920-4105. https://doi.org/10.
1016/j.petrol.2015.10.029.
Tingay, M., Bentham, P., De Feyter, A., Kellner, A., May 2011. Present-day stress field
rotations associated with evaporites in the offshore Nile Delta. Geol. Soc. Am. Bull. 123
(5–6), 1171–1180. https://doi.org/10.1130/B30185.1.
Torres, M.E., Gonzalez, A.J., Last, N.C., 2003. In-situ stress state eastern Cordillera
(Colombia). In: SPE Latin American and Caribbean Petroleum Engineering Conference
Held in Port-of-Spain, Trinidad, West Indies, 27–30 April 2003.
https://doi.org/10.2118/81074-MS.
World Stress Map Quality Ranking Scheme for Stress Orientations 2008; available at:
http://dc-app3-14.gfz-potsdam.de/pub/stress_data/stress_data_frame.html.
Zajac, B.J., Stock, J.M., 1992. Using borehole breakouts to constrain the complete stress
tensor: results from the Sijan deep drilling project and offshore Santa Maria basin
California. J. Geophys. Res. 102, 10083–10100.
Zoback, M. D., Barton, C. A., Brudy, M., Castillo, D. A., Finkbeiner, T., Grollimund, B.
R., Moos, D. B., Peska, P., Ward, C. D., and Wiprut, D. J. 2003. Determination of stress
orientation and magnitude in deep wells. International Journal of Rock Mechanics &
Mining Sciences; 40 (2003) 1049–1076.
Moos, D.B., Peska, P., Ward, C.D., Wiprut, D.J., 2003. Determination of stress orientation
and magnitude in deep wells. Int. J. Rock Mech. Min. Sci. 40, 1049–1076.
Zoback, M.D., Mastin, L., Barton, C.A., 1986. In-situ Stress Measurements in Deep
Boreholes Using Hydraulic Fracturing, Wellbore Breakouts, and Stonely Wave
Polarization. International Society for Rock Mechanics.
Zoback, M.D., Moos, D., Mastin, L.G., Anderson, R.N., 1985. Well bore breakouts and in
situ stress. J. Geophys. Res. 90, 5523–5530.

45
Zoback, M.D., Peska, P., 1995. In-situ stress and rock strength in the GBRN/DOE
pathfinder well, South Eugene Island, Gulf of Mexico. J. Petrol. Technol. 582–585.
https://doi.org/10.2118/29233-PA.
Zoback, M.D., 2010. Reservoir Geomechanics, first ed. Cambridge University Press,
Cambridge.
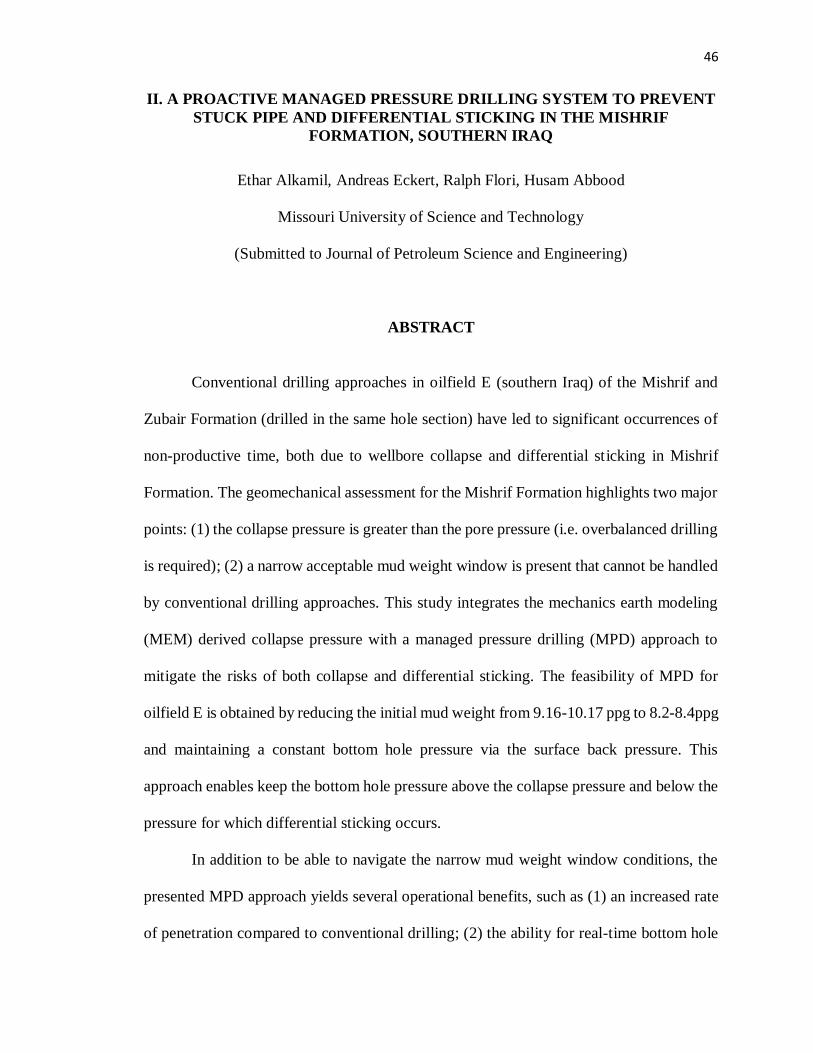
46
II. A PROACTIVE MANAGED PRESSURE DRILLING SYSTEM TO PREVENT
STUCK PIPE AND DIFFERENTIAL STICKING IN THE MISHRIF
FORMATION, SOUTHERN IRAQ
Ethar Alkamil, Andreas Eckert, Ralph Flori, Husam Abbood
Missouri University of Science and Technology
(Submitted to Journal of Petroleum Science and Engineering)
ABSTRACT
Conventional drilling approaches in oilfield E (southern Iraq) of the Mishrif and
Zubair Formation (drilled in the same hole section) have led to significant occurrences of
non-productive time, both due to wellbore collapse and differential sticking in Mishrif
Formation. The geomechanical assessment for the Mishrif Formation highlights two major
points: (1) the collapse pressure is greater than the pore pressure (i.e. overbalanced drilling
is required); (2) a narrow acceptable mud weight window is present that cannot be handled
by conventional drilling approaches. This study integrates the mechanics earth modeling
(MEM) derived collapse pressure with a managed pressure drilling (MPD) approach to
mitigate the risks of both collapse and differential sticking. The feasibility of MPD for
oilfield E is obtained by reducing the initial mud weight from 9.16-10.17 ppg to 8.2-8.4ppg
and maintaining a constant bottom hole pressure via the surface back pressure. This
approach enables keep the bottom hole pressure above the collapse pressure and below the
pressure for which differential sticking occurs.
In addition to be able to navigate the narrow mud weight window conditions, the
presented MPD approach yields several operational benefits, such as (1) an increased rate
of penetration compared to conventional drilling; (2) the ability for real-time bottom hole
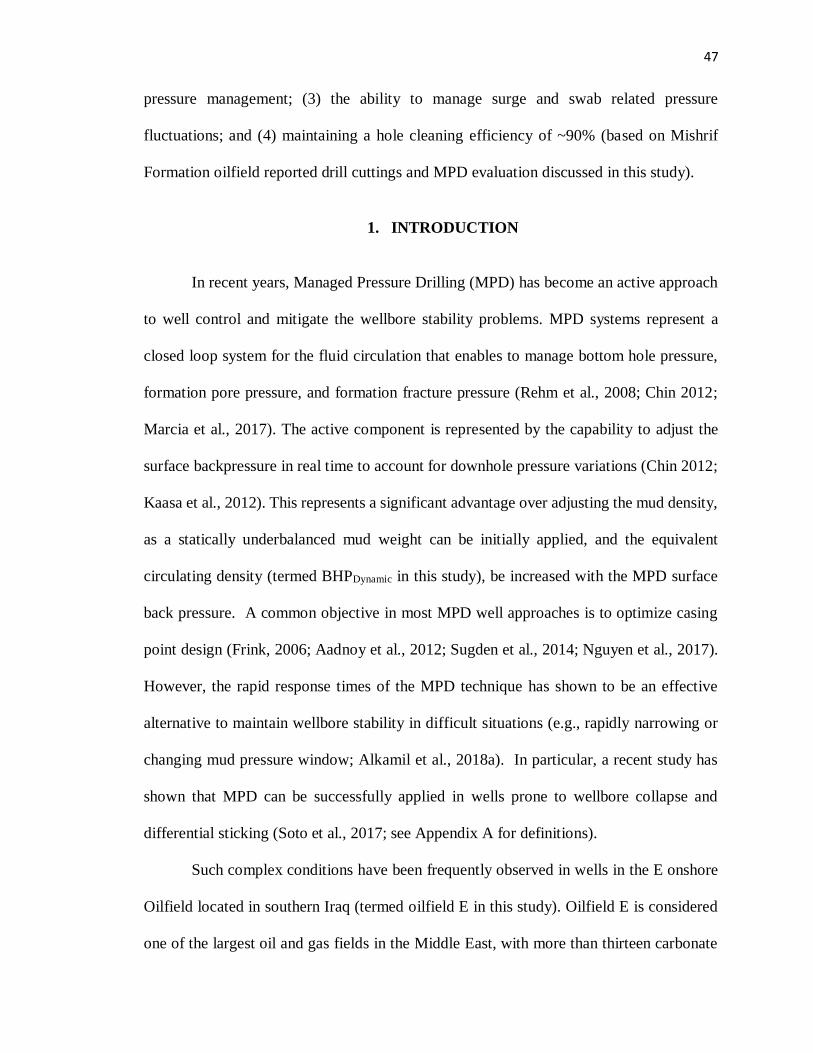
47
pressure management; (3) the ability to manage surge and swab related pressure
fluctuations; and (4) maintaining a hole cleaning efficiency of ~90% (based on Mishrif
Formation oilfield reported drill cuttings and MPD evaluation discussed in this study).
1. INTRODUCTION
In recent years, Managed Pressure Drilling (MPD) has become an active approach
to well control and mitigate the wellbore stability problems. MPD systems represent a
closed loop system for the fluid circulation that enables to manage bottom hole pressure,
formation pore pressure, and formation fracture pressure (Rehm et al., 2008; Chin 2012;
Marcia et al., 2017). The active component is represented by the capability to adjust the
surface backpressure in real time to account for downhole pressure variations (Chin 2012;
Kaasa et al., 2012). This represents a significant advantage over adjusting the mud density,
as a statically underbalanced mud weight can be initially applied, and the equivalent
circulating density (termed BHPDynamic in this study), be increased with the MPD surface
back pressure. A common objective in most MPD well approaches is to optimize casing
point design (Frink, 2006; Aadnoy et al., 2012; Sugden et al., 2014; Nguyen et al., 2017).
However, the rapid response times of the MPD technique has shown to be an effective
alternative to maintain wellbore stability in difficult situations (e.g., rapidly narrowing or
changing mud pressure window; Alkamil et al., 2018a). In particular, a recent study has
shown that MPD can be successfully applied in wells prone to wellbore collapse and
differential sticking (Soto et al., 2017; see Appendix A for definitions).
Such complex conditions have been frequently observed in wells in the E onshore
Oilfield located in southern Iraq (termed oilfield E in this study). Oilfield E is considered
one of the largest oil and gas fields in the Middle East, with more than thirteen carbonate
48
and sandstone reservoirs (Aqrawi et al., 2005; Jassim and Goff, 2006). The two main
reservoirs are the Mishrif Formation, a highly heterogeneous limestone formation (Aqrawi
et al., 2005; Jassim and Goff, 2006) at 7849 ft true vertical depth (TVD) to 8645 ft TVD
(i.e., 796 ft thickness), and the Zubair Formation at 10942 ft to 12299 ft TVD (i.e., 1357 ft
thickness). Due to the heterogeneity of the Mishrif reservoir, the formation pore pressure
fluctuates across the entire reservoir zone around 4.16 ppg (i.e., being under-pressured),
however the Zubair formation is normally pressured around 9.5 ppg (Alkamil, et al., 2018a;
Alkamil, et al., 2018b). This causes localized fluctuations in the near-wellbore stresses (i.e.
Helmick and Longgley, 1957; Teale 1965; Zoback 2010; Aadnoy and Looyeh, 2011) and
therefore leads to uncertainties in predicting the operational mud weight window required
for minimizing breakouts (lower limit; i.e., collapse pressure), managing differential
sticking (upper limit), and the minimum overbalanced pressure required to prevent fluid
influx (i.e., kick prevention; Rehm, 2008; Smith and Patel, 2012). To reduce drilling costs
both formations were initially drilled in the same hole (8 ½-in. section); however, this plan
led to a high percentage of non-productive time (NPT) as the resulting acceptable mud
weight window in the Mishrif Formation became very small. As a result wellbore
instability (i.e., collapse) in deviated production wells (which are adopted to improve
drilling and production efficiency; Schroeter et al., 1989; Huysduynen et al., 2014)
occurred. In addition, if the mud weight was slightly increased to mitigate the risk of
collapse, one of the most significant drilling operation challenges in the Mishrif formation
was differential sticking (Helmick and Longley, 1957; Charlez, 1991), resulting from the
low formation pore pressure and the high mud weight required to keep the bottom hole
pressure (BHP) higher than the pore pressure exposed in the Zubair and other formations
in this hole.
49
A recent geomechanical assessment of Oilfield E in the Mishrif Formation (Alkamil
et al., 2018a) has shown that all wells experiencing collapse and associated stuck pipe have
been drilled with too low of a mud weight (based on the Mogi-Coulomb failure criterion;
Maleki et al, 2014; Rahimi and Nygaard, 2015). In addition, Alkamil et al.’s (2018b) results
show that all wells experiencing differential sticking have been drilled with a mud weight
higher than suggested by the Mogi-Coulomb criterion (Alkamil et al, 2018). It is therefore
concluded that adhering to the minimum mud weight predicted by the Mogi-Coulomb
failure criterion reduces the likelihood of wellbore collapse and also limits the potential for
differential sticking in the Mishrif Formation.
The main objective of this study is to investigate the feasibility of the MPD
approach to mitigate the prevalent drilling problems in the Mishrif Formation (i.e. stuck
pipe and differential sticking) for the present very narrow acceptable mud weight window.
While Alkamil et al.’s (2018) geomechanical assessment of the Mishrif Formation
considers the static wellbore conditions (i.e. when the pumps are shut off), resulting in the
calculation of the static mud density (PStatic), which in this case is equal to the collapse
pressure, Pc; Figure 1; Soto et al., 2017), the added annular frictional pressure (AFP) to
maintain the dynamic bottom hole pressure (i.e., BHPDynamic; BHPDynamic= PStatic +AFP) will
cause BHPDynamic to become larger than the pressure, Pds, to prevent the onset of
differential sticking in the Mishrif Formation (dashed red line in Figure 1). The
combination of MPD and the initial geomechanical assessment provides an integrated
approach to mitigate these risks by adjusting the BHPDynamic via the surface back pressure
and an automated MPD approach also enables to monitor pit gain and to prevent fluid
influx. Based on data obtained from eight wells in oilfield E a 1D mechanical earth
modeling (MEM) approach (Alkamil et al., 2017) is used to calculate the borehole collapse
50
pressure to provide the static geomechanical constraints for wellbore stability. The analysis
of formation pore pressure, collapse pressure, in combination with many other drilling
input parameters such as the required BHPDynamic, bottom-hole assembly (BHA), deviated
well geometry, and mud rheology is used to evaluate the feasibility of using the MPD
technique for the Mishrif Formation. The goal is to ensure that the selected mud weight is
larger than the minimum mud weight required to prevent collapse/stuck pipe and lower
than the maximum mud weight allowed to prevent differential sticking, while being
overbalanced enough to prevent fluid influx. The MPD approach for a suggested target
well is discussed with respect to its operational capabilities such as real time adjustments,
hole cleaning, surge and swab effects (Malloy and Shayegi, 2010), rate of penetration, and
alternative approaches such as underbalanced drilling.
2. METHODOLOGY
2.1. MPD STRATEGY TO REDUCE STUCK PIPE RISK AND DIFFERENTIAL
STICKING
The MPD method (the fundamental principles, and how BHPDynamic is calculated is
shown by Alkamil et al., 2018b)) can enhance drilling practice by reducing the overbalance
pressure against any formation, minimizing differential pressure and preventing wellbore
collapse and associated stuck pipe problems by applying many approaches (Rehm et al.
2008). In this study, the Constant Bottom Hole Pressure (CBHP) MPD technique is
adopted.
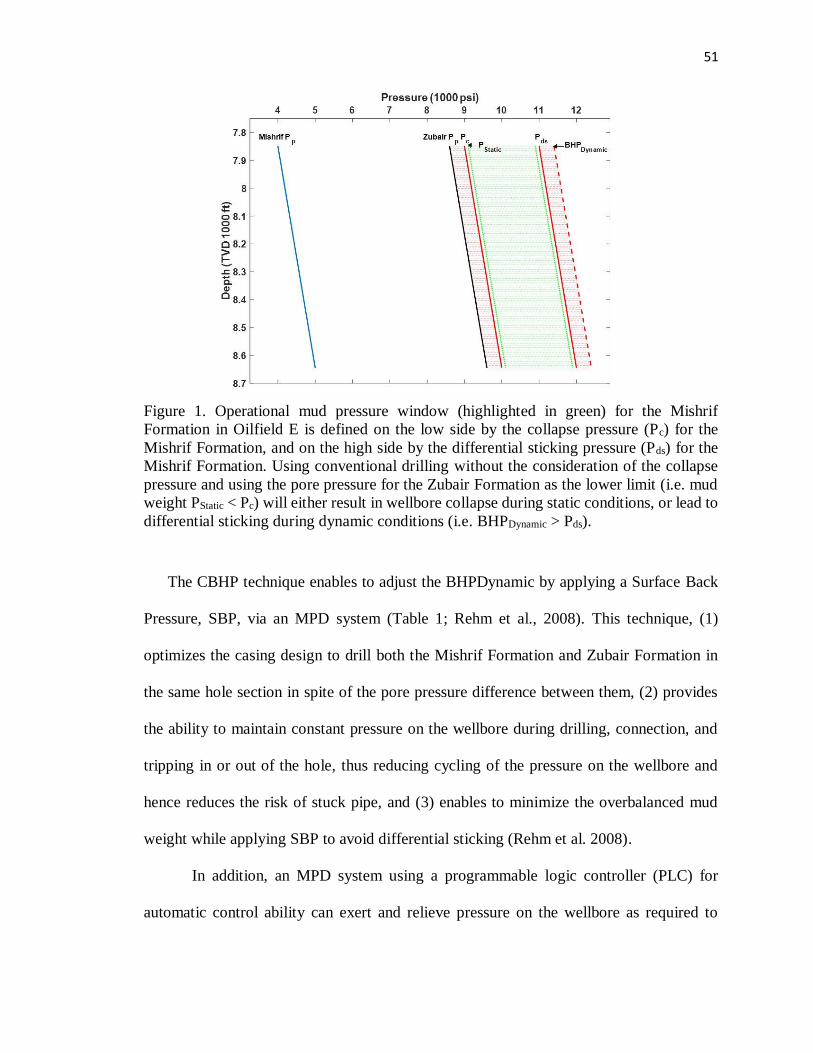
51
Figure 1. Operational mud pressure window (highlighted in green) for the Mishrif
Formation in Oilfield E is defined on the low side by the collapse pressure (Pc) for the
Mishrif Formation, and on the high side by the differential sticking pressure (Pds) for the
Mishrif Formation. Using conventional drilling without the consideration of the collapse
pressure and using the pore pressure for the Zubair Formation as the lower limit (i.e. mud
weight PStatic < Pc) will either result in wellbore collapse during static conditions, or lead to
differential sticking during dynamic conditions (i.e. BHPDynamic > Pds).
The CBHP technique enables to adjust the BHPDynamic by applying a Surface Back
Pressure, SBP, via an MPD system (Table 1; Rehm et al., 2008). This technique, (1)
optimizes the casing design to drill both the Mishrif Formation and Zubair Formation in
the same hole section in spite of the pore pressure difference between them, (2) provides
the ability to maintain constant pressure on the wellbore during drilling, connection, and
tripping in or out of the hole, thus reducing cycling of the pressure on the wellbore and
hence reduces the risk of stuck pipe, and (3) enables to minimize the overbalanced mud
weight while applying SBP to avoid differential sticking (Rehm et al. 2008).
In addition, an MPD system using a programmable logic controller (PLC) for
automatic control ability can exert and relieve pressure on the wellbore as required to
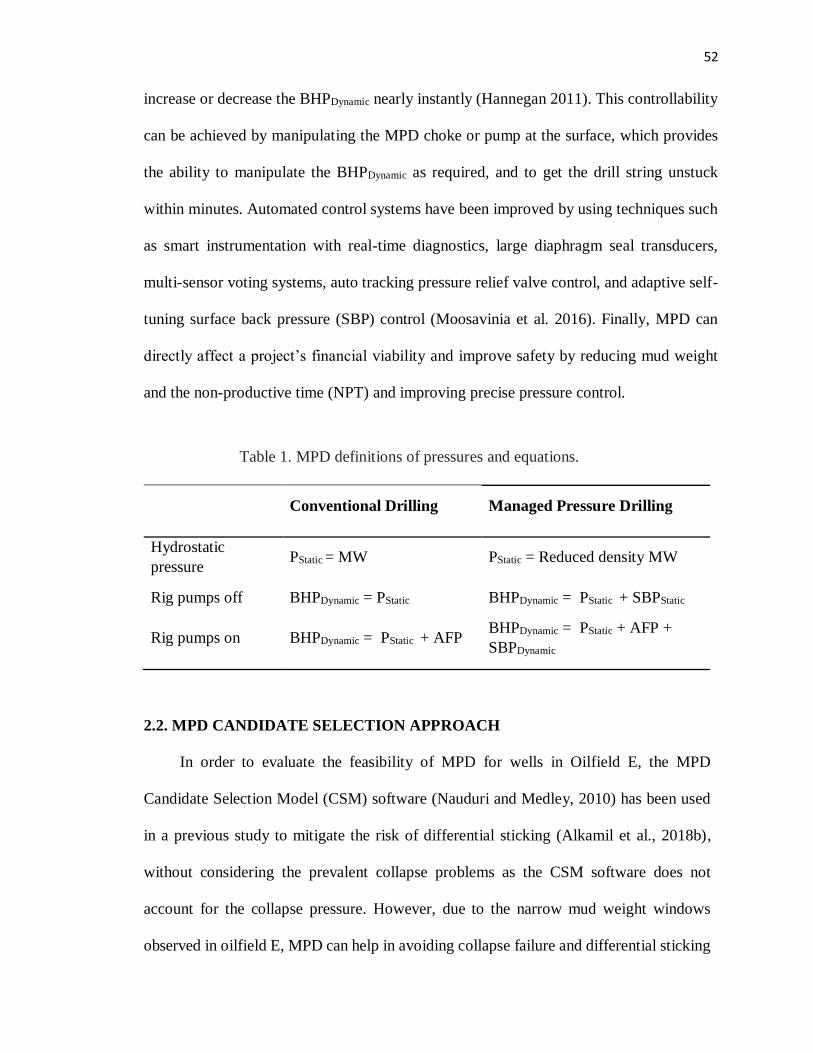
52
increase or decrease the BHPDynamic nearly instantly (Hannegan 2011). This controllability
can be achieved by manipulating the MPD choke or pump at the surface, which provides
the ability to manipulate the BHPDynamic as required, and to get the drill string unstuck
within minutes. Automated control systems have been improved by using techniques such
as smart instrumentation with real-time diagnostics, large diaphragm seal transducers,
multi-sensor voting systems, auto tracking pressure relief valve control, and adaptive self-
tuning surface back pressure (SBP) control (Moosavinia et al. 2016). Finally, MPD can
directly affect a project’s financial viability and improve safety by reducing mud weight
and the non-productive time (NPT) and improving precise pressure control.
Table 1. MPD definitions of pressures and equations.
2.2. MPD CANDIDATE SELECTION APPROACH
In order to evaluate the feasibility of MPD for wells in Oilfield E, the MPD
Candidate Selection Model (CSM) software (Nauduri and Medley, 2010) has been used
in a previous study to mitigate the risk of differential sticking (Alkamil et al., 2018b),
without considering the prevalent collapse problems as the CSM software does not
account for the collapse pressure. However, due to the narrow mud weight windows
observed in oilfield E, MPD can help in avoiding collapse failure and differential sticking
Conventional Drilling Managed Pressure Drilling
Hydrostatic
pressure PStatic = MW PStatic = Reduced density MW
Rig pumps off BHPDynamic = PStatic BHPDynamic = PStatic + SBPStatic
Rig pumps on BHPDynamic = PStatic + AFP BHPDynamic = PStatic + AFP +
SBPDynamic
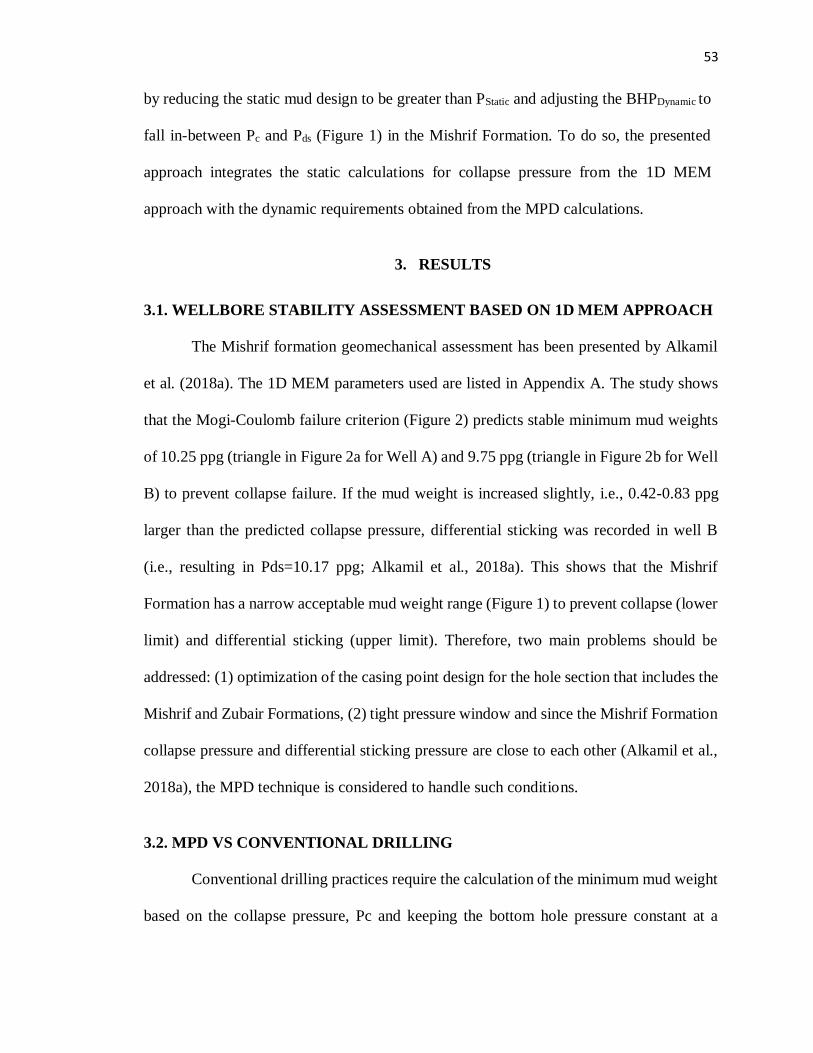
53
by reducing the static mud design to be greater than PStatic and adjusting the BHPDynamic to
fall in-between Pc and Pds (Figure 1) in the Mishrif Formation. To do so, the presented
approach integrates the static calculations for collapse pressure from the 1D MEM
approach with the dynamic requirements obtained from the MPD calculations.
3. RESULTS
3.1. WELLBORE STABILITY ASSESSMENT BASED ON 1D MEM APPROACH
The Mishrif formation geomechanical assessment has been presented by Alkamil
et al. (2018a). The 1D MEM parameters used are listed in Appendix A. The study shows
that the Mogi-Coulomb failure criterion (Figure 2) predicts stable minimum mud weights
of 10.25 ppg (triangle in Figure 2a for Well A) and 9.75 ppg (triangle in Figure 2b for Well
B) to prevent collapse failure. If the mud weight is increased slightly, i.e., 0.42-0.83 ppg
larger than the predicted collapse pressure, differential sticking was recorded in well B
(i.e., resulting in Pds=10.17 ppg; Alkamil et al., 2018a). This shows that the Mishrif
Formation has a narrow acceptable mud weight range (Figure 1) to prevent collapse (lower
limit) and differential sticking (upper limit). Therefore, two main problems should be
addressed: (1) optimization of the casing point design for the hole section that includes the
Mishrif and Zubair Formations, (2) tight pressure window and since the Mishrif Formation
collapse pressure and differential sticking pressure are close to each other (Alkamil et al.,
2018a), the MPD technique is considered to handle such conditions.
3.2. MPD VS CONVENTIONAL DRILLING
Conventional drilling practices require the calculation of the minimum mud weight
based on the collapse pressure, Pc and keeping the bottom hole pressure constant at a
54
pressure greater than Pc (Note: for formations where the pore pressure, Pp, exceeds Pc, the
pore pressure is the minimum mud weight).
Figure 2. Minimum mud weight plots using Mogi-Coulomb failure criterion (after Alkamil
et al., 2018a). a) The triangular symbol shows the azimuth and inclination of the actual
well A (drilled with a mud weight of 9.16 ppg) which experienced wellbore collapse using.
b) The actual well B (drilled with a mud weight of 10.16 ppg) experienced differential
sticking.
For static conditions this is equal to PStatic, which should be greater than Pc (e.g.
9.75 ppg for Well B), PStatic = MW (Table 1). However, when the rig pumps are ON,
additional pressure will be added to account for the annular friction pressure in the well
(AFP = 1.45 ppg for Well B). Therefore, BHPDynamic will be 11.2 ppg, which exceeds the
differential sticking pressure (e.g., Pds = 10.17 ppg, as observed during operations) shown
in Figure 1. As an alternative, Managed Pressure Drilling (MPD) is recommended to be
evaluated to keep the bottom hole pressure constant and adhere to the safe drilling pressure
(Rehm et al., 2008).
3.3. INTEGRATION OF MEM AND MPD
If the Mishrif and Zubair Formations are to be drilled in the same hole section (as
is practice in the oilfield E) the MPD approach needs to account for the MEM results
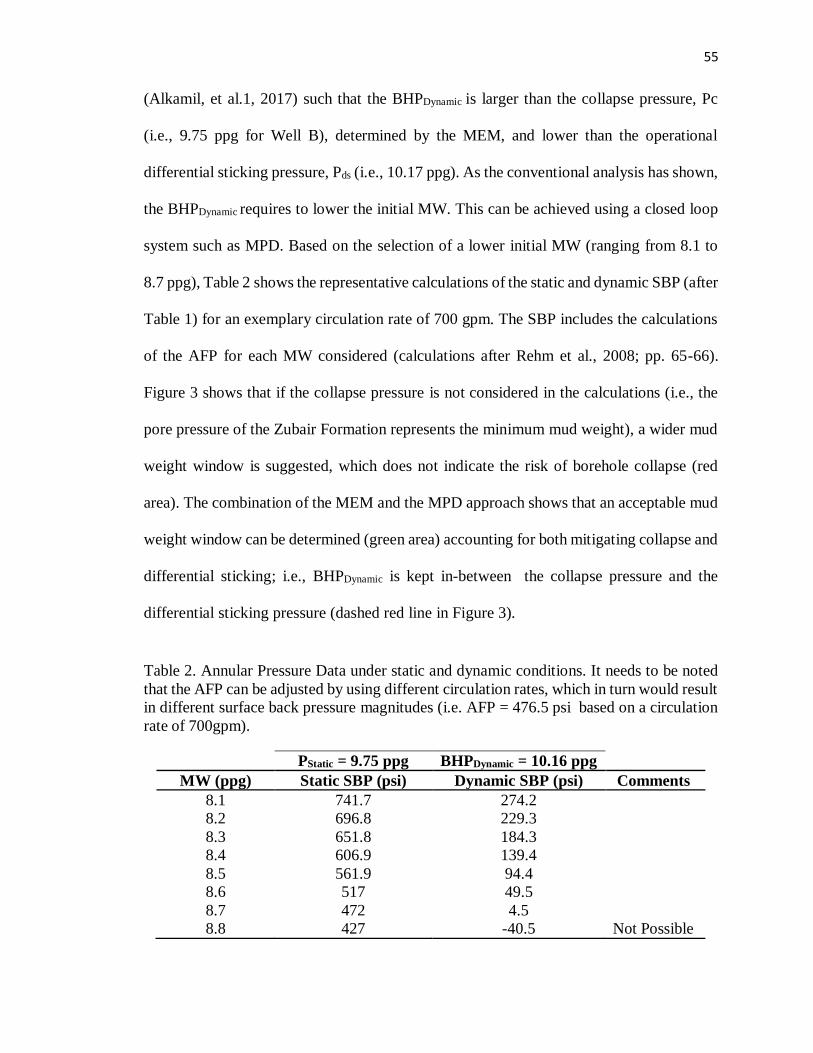
55
(Alkamil, et al.1, 2017) such that the BHPDynamic is larger than the collapse pressure, Pc
(i.e., 9.75 ppg for Well B), determined by the MEM, and lower than the operational
differential sticking pressure, Pds (i.e., 10.17 ppg). As the conventional analysis has shown,
the BHPDynamic requires to lower the initial MW. This can be achieved using a closed loop
system such as MPD. Based on the selection of a lower initial MW (ranging from 8.1 to
8.7 ppg), Table 2 shows the representative calculations of the static and dynamic SBP (after
Table 1) for an exemplary circulation rate of 700 gpm. The SBP includes the calculations
of the AFP for each MW considered (calculations after Rehm et al., 2008; pp. 65-66).
Figure 3 shows that if the collapse pressure is not considered in the calculations (i.e., the
pore pressure of the Zubair Formation represents the minimum mud weight), a wider mud
weight window is suggested, which does not indicate the risk of borehole collapse (red
area). The combination of the MEM and the MPD approach shows that an acceptable mud
weight window can be determined (green area) accounting for both mitigating collapse and
differential sticking; i.e., BHPDynamic is kept in-between the collapse pressure and the
differential sticking pressure (dashed red line in Figure 3).
Table 2. Annular Pressure Data under static and dynamic conditions. It needs to be noted
that the AFP can be adjusted by using different circulation rates, which in turn would result
in different surface back pressure magnitudes (i.e. AFP = 476.5 psi based on a circulation
rate of 700gpm).
PStatic = 9.75 ppg BHPDynamic = 10.16 ppg
MW (ppg) Static SBP (psi) Dynamic SBP (psi) Comments
8.1 741.7 274.2
8.2 696.8 229.3
8.3 651.8 184.3
8.4 606.9 139.4
8.5 561.9 94.4
8.6 517 49.5
8.7 472 4.5
8.8 427 -40.5 Not Possible
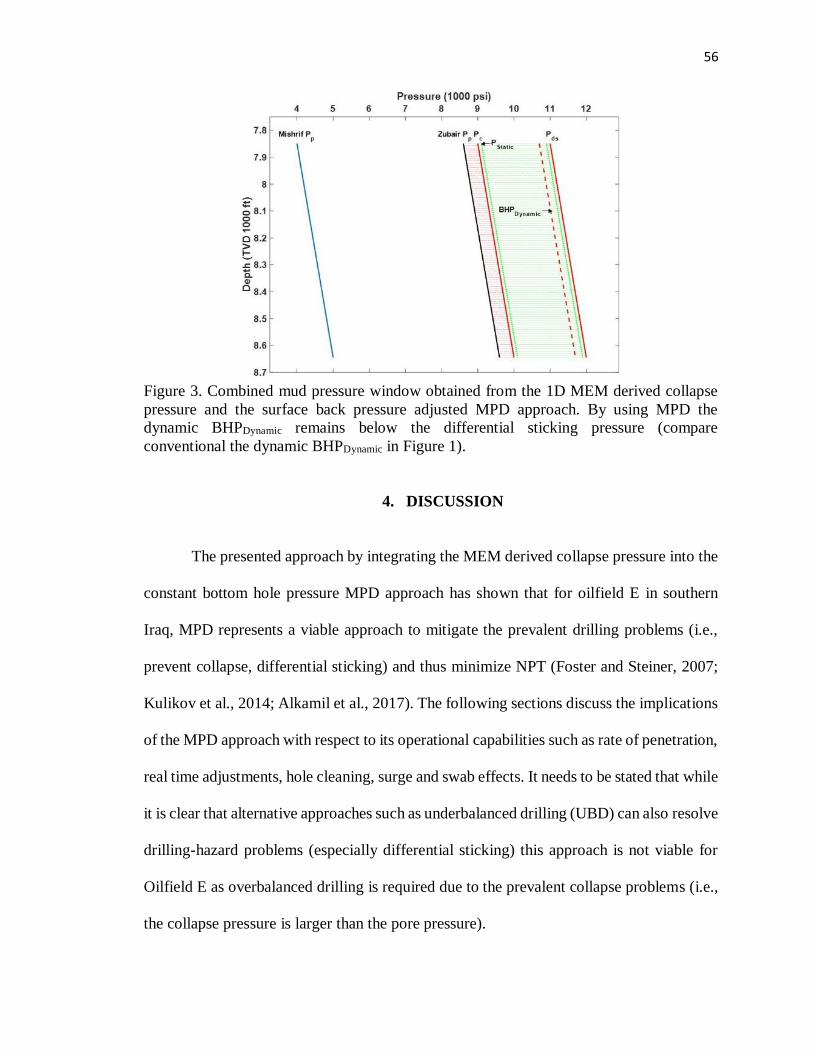
56
Figure 3. Combined mud pressure window obtained from the 1D MEM derived collapse
pressure and the surface back pressure adjusted MPD approach. By using MPD the
dynamic BHPDynamic remains below the differential sticking pressure (compare
conventional the dynamic BHPDynamic in Figure 1).
4. DISCUSSION
The presented approach by integrating the MEM derived collapse pressure into the
constant bottom hole pressure MPD approach has shown that for oilfield E in southern
Iraq, MPD represents a viable approach to mitigate the prevalent drilling problems (i.e.,
prevent collapse, differential sticking) and thus minimize NPT (Foster and Steiner, 2007;
Kulikov et al., 2014; Alkamil et al., 2017). The following sections discuss the implications
of the MPD approach with respect to its operational capabilities such as rate of penetration,
real time adjustments, hole cleaning, surge and swab effects. It needs to be stated that while
it is clear that alternative approaches such as underbalanced drilling (UBD) can also resolve
drilling-hazard problems (especially differential sticking) this approach is not viable for
Oilfield E as overbalanced drilling is required due to the prevalent collapse problems (i.e.,
the collapse pressure is larger than the pore pressure).
57
4.1. MPD REDUCED MUD WEIGHT EFFECT ON DRILLING RATE
The rate of penetration (ROP) can be affected by many different parameters such
as operating conditions, rock properties and formation characteristics, bit type and most
importantly drilling fluid properties (Kulikov et al., 2014; Mitchell et al., 2017). The
drilling fluid properties that affect the rate of penetration are its solids contents, filtration
characteristics, rheological flow properties, chemical composition and density. As the
drilling fluid density increases, the BHP will increase as well and lead to an increase in the
differential pressure (i.e., overbalance) between the formation fluid pressure and the
drilling fluid pressure. As a result of overbalance change, the ROP is affected as well, as
demonstrated by Bourgoyne et al. (1974) based on multiple regression analysis of the
drilling data obtained over short intervals. The simplified version of the derived expression
is shown in eq.1, relating changes in mud density to change in penetration rates (Cheathem
et al., 1985; Bourgoyne et al., 1991; Nauduri et al., 2009; Patel et al., 2013; Kulikov et al.,
2014).
ROP2 = ROP1e(∆P) (1)
where: ROP is the rate of penetration (m/h), is a coefficient related to the rock
properties and P is the overbalance pressure (psi).
As conventional drilling approaches require adjusting the mud density, an increase in
P results, which in turn decreases the resulting ROP. In contrast, by keeping the
overbalance pressure close to the collapse pressure, MPD will significantly improve the
rate of penetration from ~36 to ~50 ft/hr.
58
4.2. MPD REAL-TIME BHP CONTROL
Pressure stability in heterogeneous and depleted formations such as the Mishrif
Formation in oilfield E, is a key success parameter in closed loop pressure drilling
operations. One operational target of MPD is to eliminate or minimize any type of pressure
anomaly that may cause the BHP to fall outside its safe operating window (i.e. for oilfield
E; Pc < BHP < Pds). Common pressure spikes are caused either by changing stress or pore
pressure conditions surrounding the wellbore, or while adjusting the rig pump rate, which
occurs during connections and trips such as swab or surge (Dupriest et al., 2005; Azim et
al. 2011; Imtiaz et al., 2017).
To keep the bottom hole pressure constant and within its safe operating window,
MPD systems are equipped with the dynamic annular pressure control (DAPC) facility,
which is an example of an automated back-pressure control system. It is designed to keep
the bottom hole pressure constant while drilling (even if the drilled section passes through
two formations with different pore pressures such as oilfield E with the Zubair Formation
and the Mishrif Formation), for both scenarios of rig pumps ON or OFF, respectively. The
DAPC main components are: choke manifold, back-pressure pump, hydraulics model, and
integrated pressure manager. The DAPC moves the choke of the MPD system to the
required position providing the required back pressure to keep the BHP constant while
drilling in oilfield E. It adheres to the stable conditions, by maintaining the bottom hole
pressure at the set point (i.e. Pc < BHP < Pds) without pressure spikes through providing the
dynamic SBP (Rehm et al., 2008).
The MPD setup enables to achieve real time automated control on accurate bottom
hole pressure calculations by equipping the DAPC with a programmable logic controller
(PLC) (Hannegan 2011). The PLC system collects pressure measurements and feedback
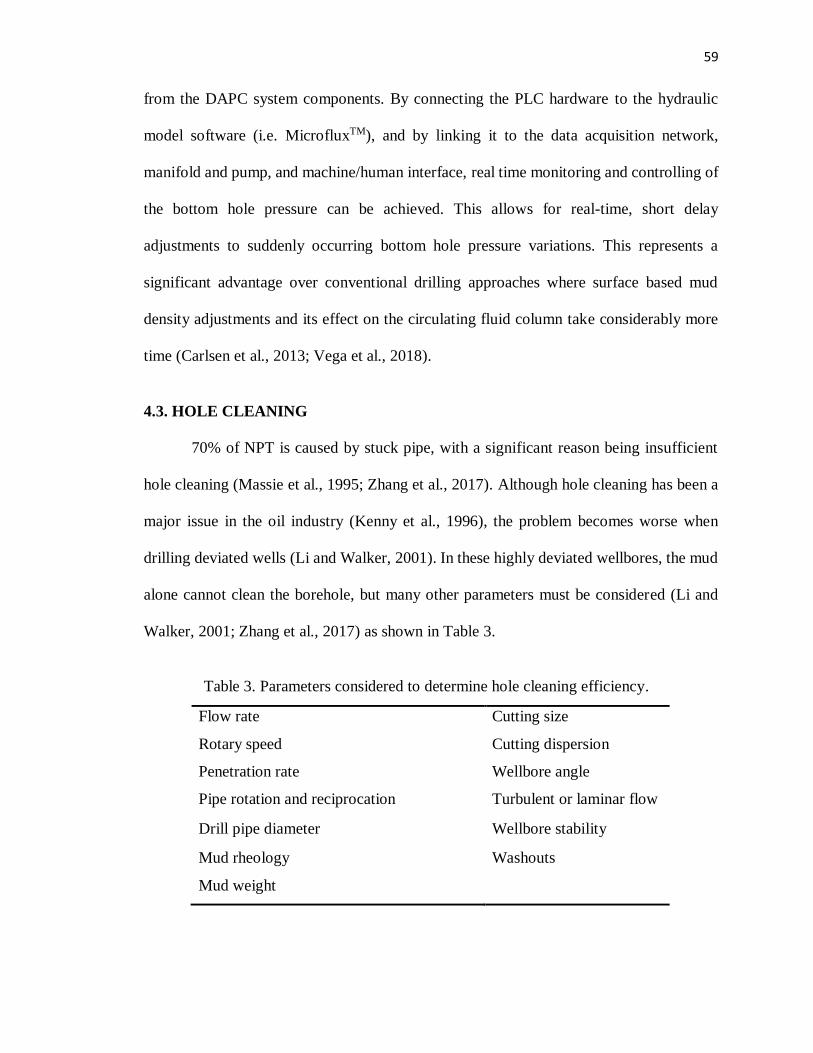
59
from the DAPC system components. By connecting the PLC hardware to the hydraulic
model software (i.e. MicrofluxTM), and by linking it to the data acquisition network,
manifold and pump, and machine/human interface, real time monitoring and controlling of
the bottom hole pressure can be achieved. This allows for real-time, short delay
adjustments to suddenly occurring bottom hole pressure variations. This represents a
significant advantage over conventional drilling approaches where surface based mud
density adjustments and its effect on the circulating fluid column take considerably more
time (Carlsen et al., 2013; Vega et al., 2018).
4.3. HOLE CLEANING
70% of NPT is caused by stuck pipe, with a significant reason being insufficient
hole cleaning (Massie et al., 1995; Zhang et al., 2017). Although hole cleaning has been a
major issue in the oil industry (Kenny et al., 1996), the problem becomes worse when
drilling deviated wells (Li and Walker, 2001). In these highly deviated wellbores, the mud
alone cannot clean the borehole, but many other parameters must be considered (Li and
Walker, 2001; Zhang et al., 2017) as shown in Table 3.
Table 3. Parameters considered to determine hole cleaning efficiency.
Flow rate Cutting size
Rotary speed Cutting dispersion
Penetration rate Wellbore angle
Pipe rotation and reciprocation Turbulent or laminar flow
Drill pipe diameter Wellbore stability
Mud rheology Washouts
Mud weight
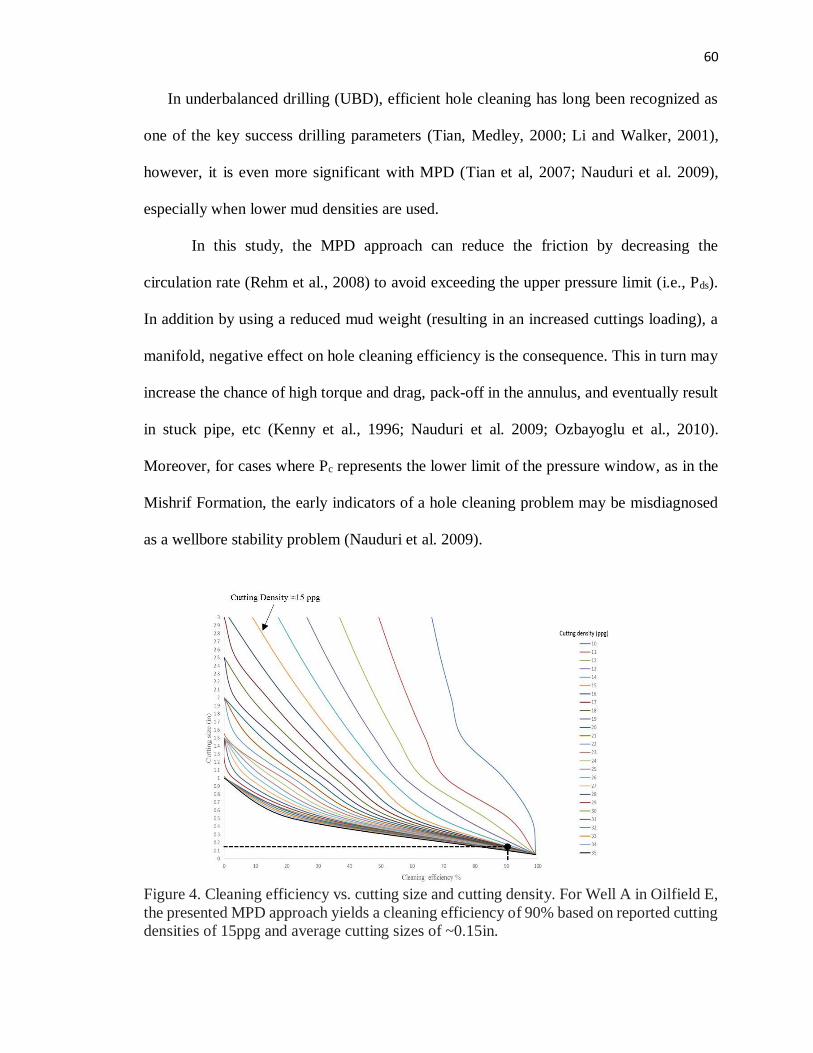
60
In underbalanced drilling (UBD), efficient hole cleaning has long been recognized as
one of the key success drilling parameters (Tian, Medley, 2000; Li and Walker, 2001),
however, it is even more significant with MPD (Tian et al, 2007; Nauduri et al. 2009),
especially when lower mud densities are used.
In this study, the MPD approach can reduce the friction by decreasing the
circulation rate (Rehm et al., 2008) to avoid exceeding the upper pressure limit (i.e., Pds).
In addition by using a reduced mud weight (resulting in an increased cuttings loading), a
manifold, negative effect on hole cleaning efficiency is the consequence. This in turn may
increase the chance of high torque and drag, pack-off in the annulus, and eventually result
in stuck pipe, etc (Kenny et al., 1996; Nauduri et al. 2009; Ozbayoglu et al., 2010).
Moreover, for cases where Pc represents the lower limit of the pressure window, as in the
Mishrif Formation, the early indicators of a hole cleaning problem may be misdiagnosed
as a wellbore stability problem (Nauduri et al. 2009).
Figure 4. Cleaning efficiency vs. cutting size and cutting density. For Well A in Oilfield E,
the presented MPD approach yields a cleaning efficiency of 90% based on reported cutting
densities of 15ppg and average cutting sizes of ~0.15in.
61
In order to evaluate if the MPD approach suggested for the wells in Oilfield E
represents hole cleaning challenges, a commercial software simulation (i.e., MicrofluxTM;
Santos et al., 2007) is used. Using the operational drilling parameters for Well A (which
experiences collapse), the simulation results show that the most significant parameters
affecting the cleaning efficiency are the mud flow rate, cutting size, and cutting density.
By keeping the MPD flow rate constant and controlling the BHP by adjusting the SBP
(Table 2), the cleaning efficiency behavior is calculated for different cutting sizes and
densities at a specific flow rate (700 gpm) as a shown in Figure 5.
Cutting densities range from 10 ppg to 35 ppg, and the range of the cutting size is
from 0.1 to 3 inches. For each case, the software estimates the cleaning efficiency
(calculations based on Santos et al., 2007) and returns a singular cleaning efficiency value.
By combining all possible cases, Figure 5 presents a guideline to hole cleaning efficiency
applicable to every well. For Well A in the Mishrif Formation cutting densities are ~15 ppg
based on the available drilling reports. The cutting size has not been reported but for an
average size of 0.15 in. (Well A drilling operator; personal communication), the resulting
efficiency is ~90%, making the MPD approach viable. This estimation helps the drilling
engineer to manipulate the other drilling parameters to control the cleaning efficiency.
Hence, it is important to mention the cleaning efficiency chart in Figure 5 can be generated
for each individual planned well, and can then be utilized for the real-time estimation of
the hole cleaning efficiency, while drilling.
4.4. MPD SURGE AND SWAB EFFECTS ON BHP
For wells where collapse failure is a risk, the drill string dynamic motion resulting in
pressure variations during swab needs to be carefully monitored in order to remain in the
62
safe MPD operational window (Lubinski et al., 1977; Mitchell 1988; Samuel et al., 2002).
As example, for evaluating the MPD feasibility in Oilfield E, the swab related pressure
drop may be lead to collapse failure for a small period of time, and if the hole cleaning is
not sufficient enough, stuck pipe may occur. In addition, surge related pressure increase
may lead to differential sticking. Therefore, it is necessary to precisely control the annular
pressure throughout the wellbore, while drilling, tripping, and connection (Rehm et al.,
2008; Samuel and Lovorn, 2016). This is particularly important for the Mishrif Formation,
as it has been shown that drilling beyond the mentioned narrow acceptable mud range for
even short time has historically led to expensive wellbore problems.
This section presents a swab/surge model, whereby the BHP (i.e., PHydrostatic; pumps
are OFF) can be predicted and adjusted automatically using DAPC (Rehm et al., 2008;
Samuel and Lovorn, 2016). To estimate the pipe movement associated maximum pressure
fluctuation, Lapeyrouse (2002) proposed a steady-state models with the assumption of
power-law fluid. In this model, the maximum fluid velocity and drilling fluid properties
are calculated to estimate maximum pressure fluctuations.
The drilling fluid properties are given in eq.2 and eq.3:
n = 3.32 log (R600
R300) (2)
K =R300
511n (3)
Where R300 and R600 = relevant rotational viscometer readings; n = power-law constant;
and K = consistency index. And the drilling fluid maximum velocity can be estimated as
in eq. 4:
63
vm = [0.675 +1.5dp
2
dh2 − dp
2] (4)
Where vm = drilling fluid maximum velocity, ft/sec.; dp = drill pipe outside diameter, in.;
dh = hole diameter, in.; vp = drill pipe maximum velocity, ft/sec.
The pressure fluctuation can then be estimated using eq. 5:
Pms = (144vm
dh − dpX
2n + 1
3n)
n
XKL
300(dh − dp) (5)
Where pms = maximum swab/surge pressure, psi; L = drill string length, ft.
Figure 5 shows that the Mishrif Formation BHP while tripping the drill pipe inside
the wellbore is the summation of PHydrostatic and Pms. However, when tripping the drill pipe
outside of the wellbore, Pms is subtracted from the mud weight hydrostatic pressure.
Therefore, due to the swab/surge effect on the bottom hole pressure, the ranges of the MPD
reduced mud weight mentioned in Section 3.3 have to be adjusted to 8.2 ppg < MW < 8.4
ppg. These mud weights allow for maximum pipe velocities ranging between 120-300
ft/min. For example, for a maximum pipe velocity of 240 ft/min., the acceptable mud
weight ranges are 8.1 < MW < 8.5 ppg (orange line in Figure 5).
5. SUMMARY AND CONCLUSIONS
For Oilfield E in southern Iraq, where two reservoirs, the Mishrif Formation and the
Zubair Formation, each having different stress conditions, are commonly drilled in the
same section, resulting in a narrow acceptable mud weight window. Conventional drilling
approaches have resulted in significant occurrences of NPT due to borehole collapse and
differential sticking.
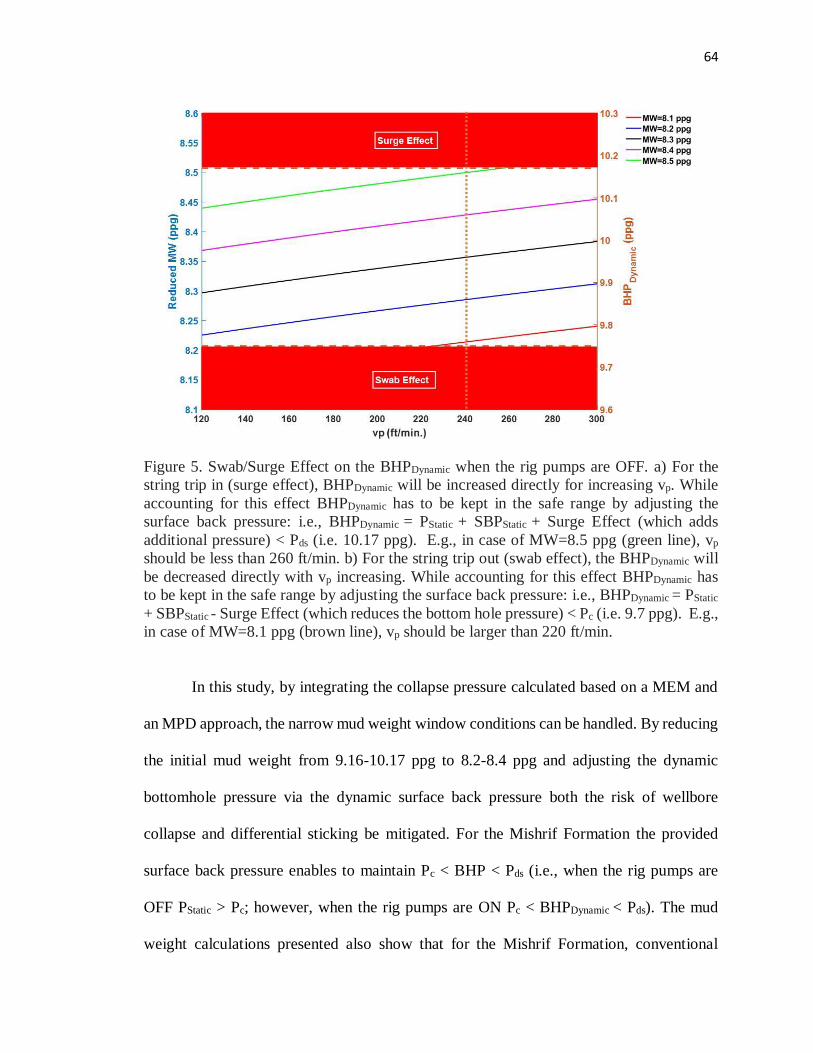
64
Figure 5. Swab/Surge Effect on the BHPDynamic when the rig pumps are OFF. a) For the
string trip in (surge effect), BHPDynamic will be increased directly for increasing vp. While
accounting for this effect BHPDynamic has to be kept in the safe range by adjusting the
surface back pressure: i.e., BHPDynamic = PStatic + SBPStatic + Surge Effect (which adds
additional pressure) < Pds (i.e. 10.17 ppg). E.g., in case of MW=8.5 ppg (green line), vp
should be less than 260 ft/min. b) For the string trip out (swab effect), the BHPDynamic will
be decreased directly with vp increasing. While accounting for this effect BHPDynamic has
to be kept in the safe range by adjusting the surface back pressure: i.e., BHPDynamic = PStatic
+ SBPStatic - Surge Effect (which reduces the bottom hole pressure) < Pc (i.e. 9.7 ppg). E.g.,
in case of MW=8.1 ppg (brown line), vp should be larger than 220 ft/min.
In this study, by integrating the collapse pressure calculated based on a MEM and
an MPD approach, the narrow mud weight window conditions can be handled. By reducing
the initial mud weight from 9.16-10.17 ppg to 8.2-8.4 ppg and adjusting the dynamic
bottomhole pressure via the dynamic surface back pressure both the risk of wellbore
collapse and differential sticking be mitigated. For the Mishrif Formation the provided
surface back pressure enables to maintain Pc < BHP < Pds (i.e., when the rig pumps are
OFF PStatic > Pc; however, when the rig pumps are ON Pc < BHPDynamic < Pds). The mud
weight calculations presented also show that for the Mishrif Formation, conventional
65
drilling approaches fail to provide acceptable mud weights and differential sticking is the
likely result. In addition to be able to navigate the narrow mud weight window conditions,
the presented MPD approach yields several operational benefits, such as (1) an increased
rate of penetration (compared to conventional drilling); and (2) the ability for real-time
bottom hole pressure management (utilizing a programmable logic controller and the
dynamic annular pressure control (DAPC) facility to adaptively keep the bottom hole
pressure constant by providing the surface back pressure thus compensating pressure
fluctuations while drilling).
The presented case study for the Mishrif Formation also shows that other important
processes during drilling operations such as (1) surge and swab related pressure
fluctuations can be safely handled using MPD; and (2) hole cleaning efficiency for average
is maintained at 90% using MPD.
ACKNOWLEDGEMENTS
We would like to express our appreciation to the Iraqi Ministry of Higher Education
and Scientific Research (MOHESR) - University of Basrah for sponsoring Ethar Alkamil
to finish this work. Husam Abbood would like to thank Basrah Oil Company for the
permission to publish the data of the Mishrif Formation.
REFERENCES
Aadnoy, B.S., 1989. Stresses around horizontal boreholes drilled in sedimentary rocks. J.
Petrol. Sci. Eng. 2, 349–360.
Aadnoy, B.S., Looyeh, R., 2011. Petroleum Rock Mechanics Drilling Operations and Well
Design, first ed. Gulf Professional Pub, Oxford.
66
Aadnøy, B.S., Society of Petroleum Engineers (U.S.), 2009. Advanced drilling and well
technology. Richardson, TX: Society of Petroleum Engineers.
Aadnoy, B.S., Kaarstad, E., Belayneh, M., 2012. Casing Depth Selection Using Multiple
Criteria. In: IADC/SPE Drilling Conference and Exhibition, 6-8 March, San Diego,
California, USA. doi:10.2118/150931-MS
Al-Ajmi, A.M., Zimmerman, R.W., 2009. A new well path optimization model for
increased mechanical borehole stability. J. Petrol. Sci. Eng. 2006 (69), 53–62.
Al-Ajmi, A.M., Zimmerman, R.W., 2005. The relation between the Mogi and the Coulomb
failure criteria. Int. J. Rock Mech. Min. Sci. 42, 441–439.
Alkamil, E.H.K., Abbood, H.R., Flori, R.E., Eckert, A., 2017. Wellbore stability evaluation
for Mishrif formation. In: SPE Middle East Oil & Gas Show and Conference Held in
Manama, Kingdom of Bahrain, 6–9 March 2017. https://doi.org/10.2118/183668- MS.
Alkamil, E.H.K., Abbood, H.R., Flori, R.E., Eckert, A., 2018a. Case study of wellbore
stability evaluation for the Mishrif Formation, Iraq, J. Petrol. Sci. Eng., 164 (2018) 663-
674. doi.org/10.1016/j.petrol.2018.01.018.
Alkamil, E.H.K., Abbood, H.R., Flori, R.E., Medley, G., Nauduri, S., Alsaba, M., 2018b.
Using Managed Pressure Drilling to Reduce Stuck Pipe Problem. In: SPE Kingdom of
Saudi Arabia Annual Technical Symposium and Exhibition, 23–26 April, Dammam,
Saudi Arabia. (In Press)
Aqrawi, A.A.M., Goff, J.C., Horbury, A.D., Sadooni, F.N., 2010. The Petroleum Geology
of Iraq, first ed. Scientilic Press Ltd.
Asgharzadeh Shishavan, R., Hubbell, C., Perez, H., Hedengren, J., Pixton, D., 2015.
Combined Rate of Penetration and Pressure Regulation for Drilling Optimization by
Use of High-Speed Telemetry. J. SPE. doi:10.2118/170275-PA
Azim, S.A., Mukherjee, P., Al-Anezi, S.A., Al-Otaibi, B., Al-Saad, B., Perumalla, S.V.,
Babbington, J.F., 2011. Using an integrated geomechanical study to resolve expensive
wellbore stability problems while drilling through the Zubair shale/sand sequence of
Kuwait: a case study. In: SPE/IADC Middle East Drilling and Technology Conference
and Exhibition, Muscat, Oman, 24–26 October 2011. https://doi.org/ 10.2118/148049-
MS.
Bourgoyne, A.T., Young, F.S.Jr., 1974. A Multiple Regression Approach to Optimal
Drilling and Abnormal Pressure Detection. J. SPE, August 1974 371-384; Trans.,
AIME 257.
Bourgoyne, Jr.A., Chenevert, M., Millheim, K., Young, Jr.F.S., 1991. Applied Drilling
Engineering. SPE Textbook Series, Vol. 2.
67
Carlsen, L.A., Rolland, N.L., Nygaard, G., Time, R.W., 2013. Simultaneous Continuous
Monitoring of the Drilling-Fluid Friction Factor and Density. J. SPE.
doi:10.2118/163101-PA.
Chang, C., Zoback, M.D., Khaksar, A., 2006. Empirical relations between rock strength
and physical properties in sedimentary rocks. J. Petrol. Sci. Eng. 51 (3–4), 223–237.
Cheathem, C.A., Nahm, J.J., Heitkamp, N.D., 1985. Effects of Selected Mud properties on
Rate of Penetration in Full-Scale Shale Drilling Simulations. In: SPE/IADC Drilling
Conference, 5-8 March, New Orleans, Louisiana. https://doi.org/10.2118/13465-MS
Chin, W.C., 2012. Managed Pressure Drilling - Modeling, Strategy and Planning. Elsevier
Science.
Demirdal, B., Cunha, J.C., 2009. Importance of Drilling Fluids’ Rheological and
Volumetric Characterization to Plan and Optimize Managed Pressure Drilling
Operations. J. Can. Petrol. Tech. doi:10.2118/09-02-08-TB
Duan, M., Miska, S.Z., Yu, M., Takach, N.E., Ahmed, R.M., Zettner, C.M., 2008.
Transport of Small Cuttings in Extended-Reach Drilling. J. SPE. doi:10.2118/104192-
PA
Dupriest, F.E., Witt, J.W., Remmert, S.M., 2005. Maximizing ROP with Real-Time
Analysis of digital Data and MSE. In: International Petroleum Technology Conference,
21-23 November, Doha, Qatar. doi.org/10.2523/IPTC-10607-MS
Fjaer, E., Holt, R.M., Horsrud, P., Raaen, A.M., Risnes, R. 2008. Petroleum related rock
mechanics, second ed. Elsevier Science, Amsterdam.
Foster, J.K., Steiner, A., 2007. The Use of MPD and an Unweighted Fluid System for
Drilling ROP Improvement. In: 2007 IADC/SPE Managed Pressure Drilling and
Underbalanced Operations Conference and Exhibition held in Galveston, Texas,
28–29 March. doi:10.2118/108343-MS
Godhavn, J.M., 2010. Control Requirements for Automatic Managed Pressure Drilling
System. J. SPE. doi:10.2118/119442-PA
Gravdal, J.E., Nikolaou, M., Breyholtz, Ø., Carlsen, L.A., 2010. Improved Kick
Management During MPD by Real-Time Pore-Pressure Estimation. J. SPE.
doi:10.2118/124054-PA.
Hannegan, D., 2011. MPD - Drilling Optimization Technology, Risk Management Tool,
or Both?. In: SPE Annual Technical Conference and Exhibition, location, Denver,
Colorado, USA, 30 October–2 November. https://doi.org/10.2118/146644-MS.
68
Imtiaz, S., Perumalla, S., Hynes, L., Basu, P., Shinde, A., Benmamar, S., … Sherbeny,
W.E., 2017. Delivering Value Through Advanced Geomechanics in Complex Drilling
Environments: From Well Planning to Real-Time. In: Abu Dhabi International
Petroleum Exhibition & Conference, 13-16 November, Abu Dhabi, UAE.
https://doi.org/10.2118/188397-MS.
Jassim, S.Z., Goff, J.C., 2006. Geology of Iraq, first ed. Dolin, Prague.
Kaasa, G., Stamnes, Ø.N., Aamo, O.M., Imsland, L.S., 2012. Simplified Hydraulics Model
Used for Intelligent Estimation of Downhole Pressure for a Managed-Pressure-Drilling
Control System. J. SPE. doi:10.2118/143097-PA.
Kang, Y., Yu, M., Miska, S.Z., and Takach, N., 2009. Wellbore Stability: A Critical
Review and Introduction to DEM. In: SPE Annual Technical Conference and
Exhibition, 4-7 October, New Orleans, Louisiana. doi:10.2118/124669-MS.
Kulikov, S., Veliev, G., Chumachenko, A., Shilkin, P., 2014. Managed Pressure Drilling
Advances Well Construction with Enhanced Hazard Mitigation. SPE Russian Oil and
Gas Exploration and Production Technical Conference and Exhibition, 14-16 October,
Moscow, Russia. doi:10.2118/171288-MS
Li, J., Walker, S., 2001. Sensitivity Analysis of Hole Cleaning Parameters in Directional
Wells. J. SPE. doi:10.2118/74710-PA
Lubinski, A., Hsu, F.H., Nolte, K.G., 1977. Transient Pressure Surges Due to Pipe
Movement in an Oil Well. J. Oil and Gas Sci. and Tech., 32(3) 307–348.
Maleki, S., Gholami, R., Rasouli, V., Moradzadeh, A., 2014. Comparison of different
failure criteria in prediction of safe mud weigh window in drilling practice. Earth Sci.
Rev. 136, 36–58. ISSN 0012-8252.
Malloy, K., Shayegi, S., 2010. UBD or MPD: An Engineering Choice Based on Intent. In:
SPE/IADC Managed Pressure Drilling and Underbalanced Operations Conference and
Exhibition, 24-25 February, Kuala Lumpur, Malaysia. https://doi.org/10.2118/130563-
MS
McSpadden, A.R., Coker, O.D., Ruan, G.C., 2012. Advanced Casing Design With Finite-
Element Model of Effective Dogleg Severity, Radial Displacements, and Bending
Loads. J. SPE. doi:10.2118/141458-PA.
Moosavinia, M., Parker, M., Alexandrov, V., Palenov, M., 2016. Intelligent Control for
MPD. In: SPE/IADC Managed Pressure Drilling and Underbalanced Operations
Conference and Exhibition, 12-13 April, Galveston, Texas, USA.
https://doi.org/10.2118/180069-MS
Mitchell, R.F., 1988. Dynamic Surge/Swab Pressure Predictions. J. SPE.
doi:10.2118/16156-PA.
69
Mitchell, R.F., Miska, S.Z., 2017. Fundamentals of drilling engineering. Society of
Petroleum Engineers.
Nauduri, A.S.S., Medley, G.H., Schubert, J.J., 2009. MPD: Beyond Narrow Pressure
Windows. In: IADC/SPE Managed Pressure Drilling and Underbalanced Operations
Conference & Exhibition, 12-13 February, San Antonio, Texas. doi:10.2118/122276-
MS.
Nauduri, S., Medley, G., 2010. MPD Candidate Identification: To MPD or Not To MPD.
In: SPE/IADC Managed Pressure Drilling and Underbalanced Operations Conference
and Exhibition, 24-25 February, Kuala Lumpur, Malaysia.
https://doi.org/10.2118/130330-MS
Nguyen, T.C., de Oliveira, R., Al-Safran, E., Saasen, A., 2017. Casing-Design
Optimization With CAML Technique and Drilling-Fluid Performance. J. SPE.
doi:10.2118/185951-PA.
Numbere, O., Okoli, U., (2014. The Importance of Geomechanical Analysis for Well
Design and Engineering. In: SPE Nigeria Annual International Conference and
Exhibition, 5-7 August, Lagos, Nigeria. doi:10.2118/172387-MS.
Ozbayoglu, M.E., Sorgun, M., Saasen, A., Svanes, K., 2010. Hole Cleaning Performance
of Light-Weight Drilling Fluids During Horizontal Underbalanced Drilling. Journal of
J. Can. Petrol. Tech. doi:10.2118/136689-PA.
Patel, B., Grayson, B., Gans, H., 2013. Optimized Unconventional Shale Development
With MPD Techniques. IADC/SPE Managed Pressure Drilling and Underbalanced
Operations Conference and Exhibition, 17-18 April, San Antonio, Texas, USA.
doi:10.2118/164565-MS
PevsKa, P., Zoback, M.D., July 1995. Compressive and tensile failure of inclined well
bores and determination of in situ stress and rock strength. J. Geophys. Res. Atmos. 100
(B7), 12791 https://doi.org/10.1029/95JB00319.
Plumb, R.A., 1994. Influence of composition and texture on the failure properties of clastic
rocks. In: Eurocks 94, Rock Mechanics in Petroleum Engineering Conference, pp. 13–
20.
Rahimi, R., Nygaard, R., 2015. Comparison of rock failure criteria in predicting borehole
shear failure. Int. J. Rock Mech. Min. Sci. 79, 29–40.
Rehm, B., Schubert, J., Haghshenas, A., Paknejad, A., Hughes, J., 2008. Managed Pressure
Drilling, first ed. Gulf Publishing Company, Houston.
Samuel, G.R., Bajwa, F., Franklin, M., LeBlanc, J., 2002. Model Accurately Predicts
Intermediate Casing-Run Surge Pressure in Marlin SS-1 Well. J. Oil and Gas, 16 (7c).
70
Samuel, R., Lovorn, R., 2016. Swab and Surge Pressures with Reservoir Fluid Influx
Condition during MPD. In: IADC/SPE Drilling Conference and Exhibition, 1-3 March,
Fort Worth, Texas, USA. doi:10.2118/178881-MS.
Santos, H.M., Catak, E., Kinder, J.I., Nogueira, E.F., Lage, A.C.V.M., Sonnemann, P.,
2007. First Field Applications of Microflux Control Show Very Positive Surprises.
IADC/SPE Managed Pressure Drilling & Underbalanced Operations, 28-29 March,
Galveston, Texas, USA. doi:10.2118/108333-MS.
Schroeter, D.R., Chan, H.W., 1989. Successful Application of Drilling Technology
Extends Directional Capability. J. SPE Drilling Engineers, 4 (3) 230-236. doi:
10.2118/17660-PA.
Sifferman, T.R., Becker, T.E., 1992. Hole Cleaning in Full-Scale Inclined Wellbores. J.
SPE. doi:10.2118/20422-PA.
Smith, J.R., Patel, B.M., 2012. A Proposed Method for Planning the Best Initial Response
to Kicks Taken During Managed-Pressure-Drilling Operations. J. SPE.
doi:10.2118/143101-PA.
Stewart, G., Wittmann, M., 1979. Interpretation of the Pressure Response of the Repeat
Formation Tester. In: SPE Annual Technical Conference and Exhibition, 23-26
September, Las Vegas, Nevada. doi.org/10.2118/8362-MS.
Sugden, C., Bacon, W., Gabaldon, O.R., Borges, J.U.A., Soares, C.M., Falcao, J.L.,
…Chita, L.C., 2014. Real-Time Casing-Design Optimization: A Case Study in the Use
of Managed-Pressure Drilling To Develop an Adaptive Well Design and Eliminate
Casing Strings on a Deepwater Exploration Well. J. SPE. doi:10.2118/168028-PA.
Teale, R., 1965. The concept of specific energy in rock drilling, International Journal of
Rock Mechanics and Mining Sciences and Geomechanics Abstracts, 2 (1) 57-73.
doi.org/10.1016/0148-9062(65)90022-7.
Tian, S., Medley, G., Stone, C.R., 2007. Parametric Analysis of MPD Hydraulics. In:
IADC/SPE Managed Pressure Drilling and Underbalanced Operations, 28-29 March,
Galveston, Texas, USA. doi.org/10.2118/108354-MS.
Torres, M.E., Gonzalez, A.J., Last, N.C., 2003. In-situ stress state eastern Cordillera
(Colombia). In: SPE Latin American and Caribbean Petroleum Engineering Conference
Held in Port-of-Spain, Trinidad, West Indies, 27–30 April 2003. https://
doi.org/10.2118/81074-MS.
Udegbunam, J.E., Fjelde, K.K., Evje, S., Nygaard, G., 2015. On the Advection-Upstream-
Splitting-Method Hybrid Scheme: A Simple Transient-Flow Model for Managed-
Pressure-Drilling and Underbalanced-Drilling Applications. J. SPE.
doi:10.2118/168960-PA.
71
Vega, M.P., Oliveira, G.F., Fernandes, L.D., Martins, A.L., 2018. Monitoring and control
strategies to manage pressure fluctuations during oil well drilling, J. Petrol. Sci. Eng.,
166 (2018) 337-349. https://doi.org/10.1016/j.petrol.2018.03.048.
Zambrano, N.P., Bargawi, R., Mutawa, A., Aramco, S., Hadj-Moussa, A., Mazouz, C.,…
Zambrano, R., 2015. The Successful Application of MPD Technology in Drilling
Horizontal Wells in a High Pressure Formation Heterogeneity to Mitigate Drilling
Hazards: Case Study. In: SPE/IADC Managed Pressure Drilling and Underbalanced
Operations Conference & Exhibition, 13-14 April, Dubai, UAE. doi:10.2118/173818-
MS.
Zoback, M.D., 2010. Reservoir Geomechanics, first ed. Cambridge University Press,
Cambridge.
Zoback, M.D., Moos, D., Mastin, L.G., Anderson, R.N., 1985. Well bore breakouts and in
situ stress. J. Geophys. Res. 90, 5523–5530.
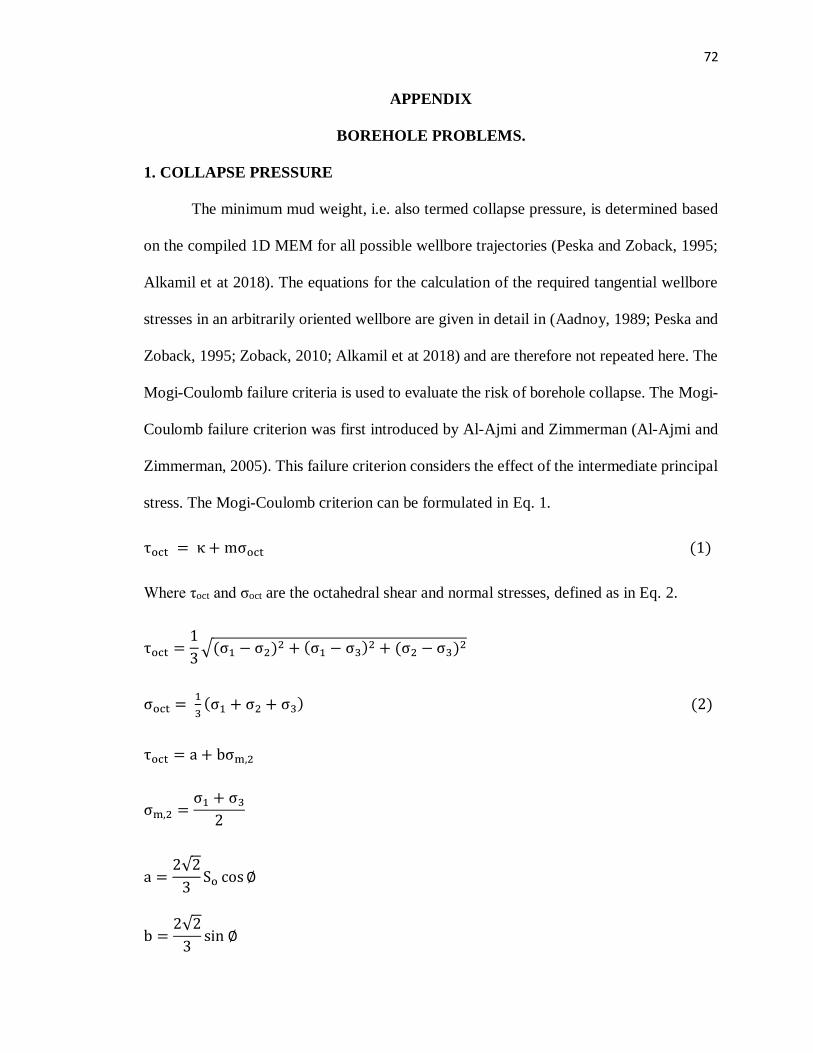
72
APPENDIX
BOREHOLE PROBLEMS.
1. COLLAPSE PRESSURE
The minimum mud weight, i.e. also termed collapse pressure, is determined based
on the compiled 1D MEM for all possible wellbore trajectories (Peska and Zoback, 1995;
Alkamil et at 2018). The equations for the calculation of the required tangential wellbore
stresses in an arbitrarily oriented wellbore are given in detail in (Aadnoy, 1989; Peska and
Zoback, 1995; Zoback, 2010; Alkamil et at 2018) and are therefore not repeated here. The
Mogi-Coulomb failure criteria is used to evaluate the risk of borehole collapse. The Mogi-
Coulomb failure criterion was first introduced by Al-Ajmi and Zimmerman (Al-Ajmi and
Zimmerman, 2005). This failure criterion considers the effect of the intermediate principal
stress. The Mogi-Coulomb criterion can be formulated in Eq. 1.
τoct = κ + mσoct (1)
Where τoct and σoct are the octahedral shear and normal stresses, defined as in Eq. 2.
τoct =1
3√(σ1 − σ2)2 + (σ1 − σ3)2 + (σ2 − σ3)2
σoct = 1
3(σ1 + σ2 + σ3) (2)
τoct = a + bσm,2
σm,2 =σ1 + σ3
2
a =2√2
3So cos ∅
b =2√2
3sin ∅
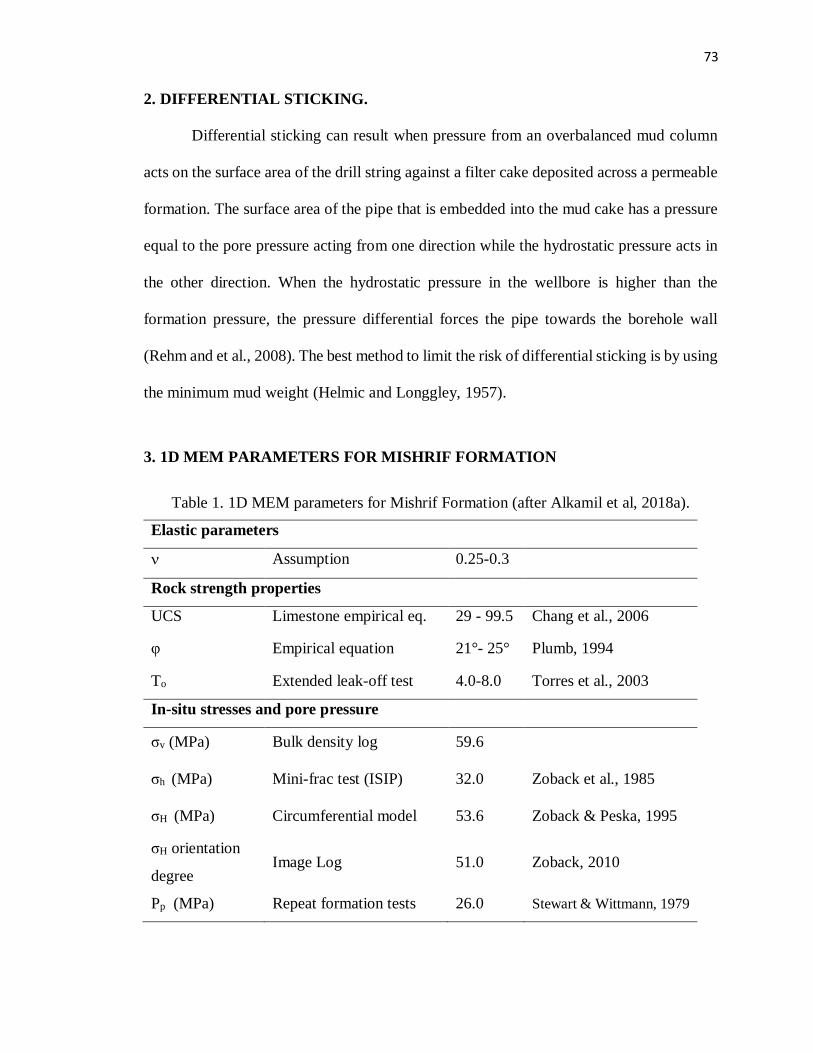
73
2. DIFFERENTIAL STICKING.
Differential sticking can result when pressure from an overbalanced mud column
acts on the surface area of the drill string against a filter cake deposited across a permeable
formation. The surface area of the pipe that is embedded into the mud cake has a pressure
equal to the pore pressure acting from one direction while the hydrostatic pressure acts in
the other direction. When the hydrostatic pressure in the wellbore is higher than the
formation pressure, the pressure differential forces the pipe towards the borehole wall
(Rehm and et al., 2008). The best method to limit the risk of differential sticking is by using
the minimum mud weight (Helmic and Longgley, 1957).
3. 1D MEM PARAMETERS FOR MISHRIF FORMATION
Table 1. 1D MEM parameters for Mishrif Formation (after Alkamil et al, 2018a).
Elastic parameters
Assumption 0.25-0.3
Rock strength properties
UCS Limestone empirical eq. 29 - 99.5 Chang et al., 2006
φ Empirical equation 21°- 25° Plumb, 1994
To Extended leak-off test 4.0-8.0 Torres et al., 2003
In-situ stresses and pore pressure
σv (MPa) Bulk density log 59.6
σh (MPa) Mini-frac test (ISIP) 32.0 Zoback et al., 1985
σH (MPa) Circumferential model 53.6 Zoback & Peska, 1995
σH orientation
degree Image Log 51.0 Zoback, 2010
Pp (MPa) Repeat formation tests 26.0 Stewart & Wittmann, 1979
74
III. A COLLAPSE VOLUME LOG ESTIMATION BASED ON IMAGE
PROCESSING
Alkamil, Ethar, Eckert, A., Flori, R., Abbas, A.
Missouri University of Science and Technology
(Submitted in Journal of Petroleum Science and Engineering)
ABSTRACT
Wellbore collapse as a result of severe borehole breakouts represents a major problem
in many drilling operations. In order to quantify the risk associated to wellbore collapse a
reliable estimate of the collapse volume is necessary. In this study, a novel approach
determining the area/volume of collapse failure by using an image processing approach is
presented. The presented approach is independent of any failure criterion and very
versatile. Based on the failure criterion applied to determine borehole collapse, the detailed
2D are of collapse can be determined therefore limiting the degree of underestimation
compared to analytical techniques which assume a triangular breakout geometry. The
method shows a good agreement with breakout depths obtained from caliper logs obtained
from the Mishrif and Zubair Formations in Southern Iraq. For hydrocarbon fields where
Mechanical Earth Modeling (MEM) approaches capable of predicting the spatial
distribution of horizontal stresses exist, the presented image processing approach is utilized
to generate an automated log of collapse volume while drilling. Based on this log, mud
pressure adjustments can be undertaken while drilling a new well based on the predicted
collapse volume. This can help the drilling engineers in evaluating the mud weight effect
on the hole cleaning efficiency to avoid stuck pipe problems. In addition, knowledge of the
collapse volume provides better estimates on the required mud and cement volumes.
75
1. INTRODUCTION
The International Association of Drilling Contractors (IADC) defines the drilling
window as “the difference between the maximum pore pressure and the minimum effective
fracture pressure” (API, 2013) and does not consider the collapse pressure which can be
higher than the pore pressure. However, it has been observed that wellbore collapse (i.e.
shear failure of the borehole wall resulting in excessive breakouts) and associated stuck
pipe problems are a major reason for a non-productive time during drilling operations
(Howard and Glover, 1994; Salminen et al., 2017).
In order to assess and predict wellbore stability and to design appropriate mud pressures
to prevent collapse, Mechanical Earth Models (MEM) represent a common approach (e.g.,
Goodman and Connolly, 2007; Kristiansen, 2007; Fjaer et al., 2008; Gholami et al., 2014;
Alkamil et al., 2017b). MEMs include key parameters including formation strength
properties, in-situ stresses, and pore pressure. Once the MEM is validated, it can be used
to predict applications such as wellbore stability (Cheatham, 1984; Kaushik et al., 2016;
Alkamil et al., 2018). While the general conditions for collapse occurrence are understood
and can be calculated analytically based on the MEM, which in turn can be used to
determine the breakout width analytically (Zoback et al., 1985), no analytical solution for
the detailed breakout geometry (especially the breakout depth) exists (Moos et al., 2007).
Knowledge about the severity of breakouts (i.e., WBO > 90o for vertical wells and WBO >
60o for deviated wells; Zoback, 2010) and the resulting breakout geometry provide/enable
estimates for the collapse volume which represents important knowledge for drilling
operations (Alkamil et al. 2018). The severity of breakouts can be assessed post-drilling
either by numerical modeling approaches accounting for plastic failure (Herrick and
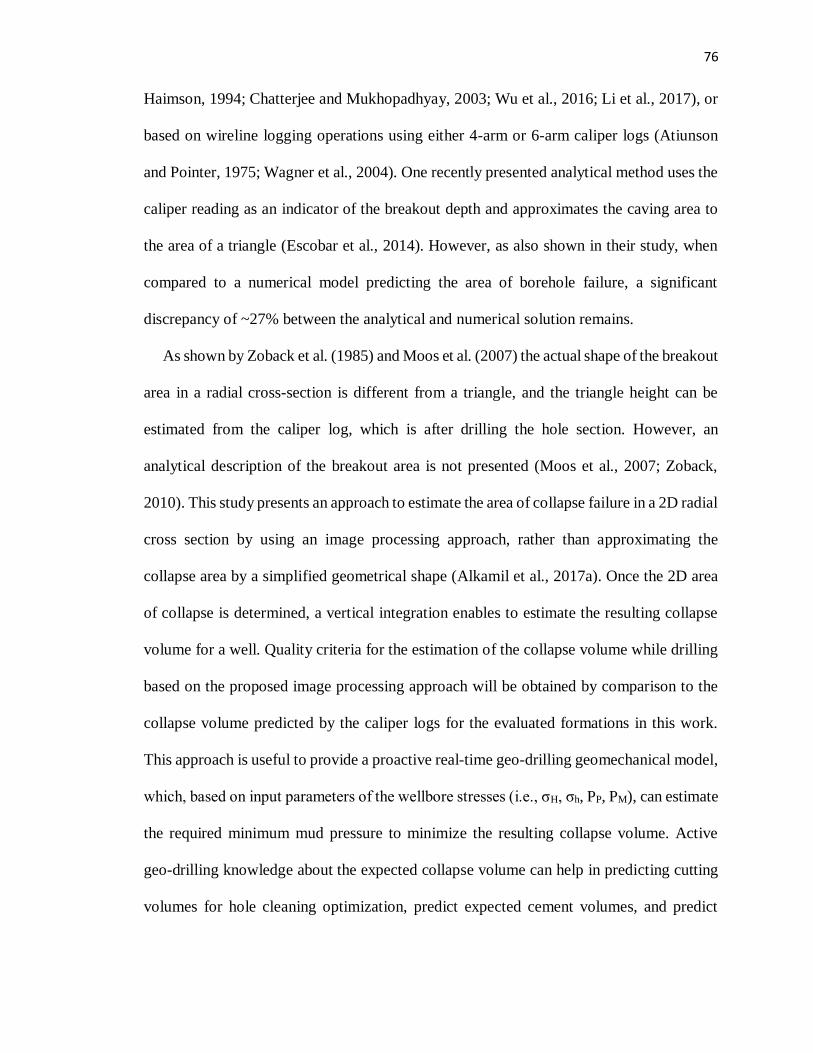
76
Haimson, 1994; Chatterjee and Mukhopadhyay, 2003; Wu et al., 2016; Li et al., 2017), or
based on wireline logging operations using either 4-arm or 6-arm caliper logs (Atiunson
and Pointer, 1975; Wagner et al., 2004). One recently presented analytical method uses the
caliper reading as an indicator of the breakout depth and approximates the caving area to
the area of a triangle (Escobar et al., 2014). However, as also shown in their study, when
compared to a numerical model predicting the area of borehole failure, a significant
discrepancy of ~27% between the analytical and numerical solution remains.
As shown by Zoback et al. (1985) and Moos et al. (2007) the actual shape of the breakout
area in a radial cross-section is different from a triangle, and the triangle height can be
estimated from the caliper log, which is after drilling the hole section. However, an
analytical description of the breakout area is not presented (Moos et al., 2007; Zoback,
2010). This study presents an approach to estimate the area of collapse failure in a 2D radial
cross section by using an image processing approach, rather than approximating the
collapse area by a simplified geometrical shape (Alkamil et al., 2017a). Once the 2D area
of collapse is determined, a vertical integration enables to estimate the resulting collapse
volume for a well. Quality criteria for the estimation of the collapse volume while drilling
based on the proposed image processing approach will be obtained by comparison to the
collapse volume predicted by the caliper logs for the evaluated formations in this work.
This approach is useful to provide a proactive real-time geo-drilling geomechanical model,
which, based on input parameters of the wellbore stresses (i.e., σH, σh, PP, PM), can estimate
the required minimum mud pressure to minimize the resulting collapse volume. Active
geo-drilling knowledge about the expected collapse volume can help in predicting cutting
volumes for hole cleaning optimization, predict expected cement volumes, and predict
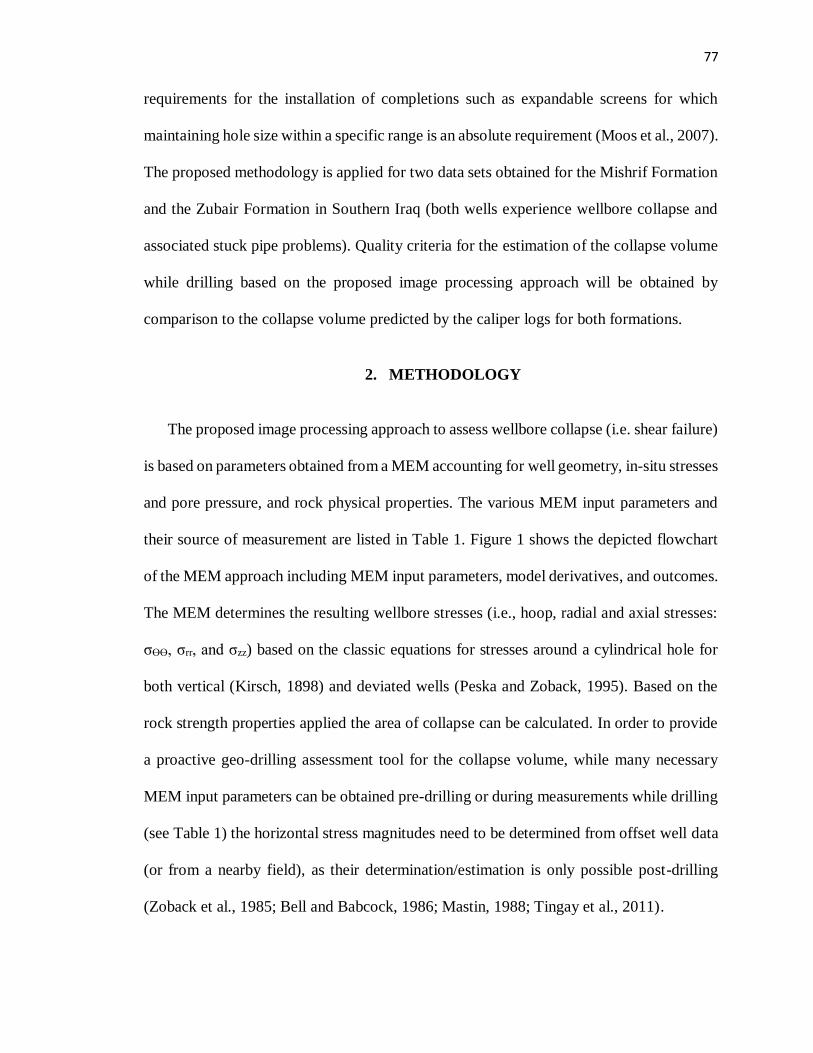
77
requirements for the installation of completions such as expandable screens for which
maintaining hole size within a specific range is an absolute requirement (Moos et al., 2007).
The proposed methodology is applied for two data sets obtained for the Mishrif Formation
and the Zubair Formation in Southern Iraq (both wells experience wellbore collapse and
associated stuck pipe problems). Quality criteria for the estimation of the collapse volume
while drilling based on the proposed image processing approach will be obtained by
comparison to the collapse volume predicted by the caliper logs for both formations.
2. METHODOLOGY
The proposed image processing approach to assess wellbore collapse (i.e. shear failure)
is based on parameters obtained from a MEM accounting for well geometry, in-situ stresses
and pore pressure, and rock physical properties. The various MEM input parameters and
their source of measurement are listed in Table 1. Figure 1 shows the depicted flowchart
of the MEM approach including MEM input parameters, model derivatives, and outcomes.
The MEM determines the resulting wellbore stresses (i.e., hoop, radial and axial stresses:
σƟƟ, σrr, and σzz) based on the classic equations for stresses around a cylindrical hole for
both vertical (Kirsch, 1898) and deviated wells (Peska and Zoback, 1995). Based on the
rock strength properties applied the area of collapse can be calculated. In order to provide
a proactive geo-drilling assessment tool for the collapse volume, while many necessary
MEM input parameters can be obtained pre-drilling or during measurements while drilling
(see Table 1) the horizontal stress magnitudes need to be determined from offset well data
(or from a nearby field), as their determination/estimation is only possible post-drilling
(Zoback et al., 1985; Bell and Babcock, 1986; Mastin, 1988; Tingay et al., 2011).
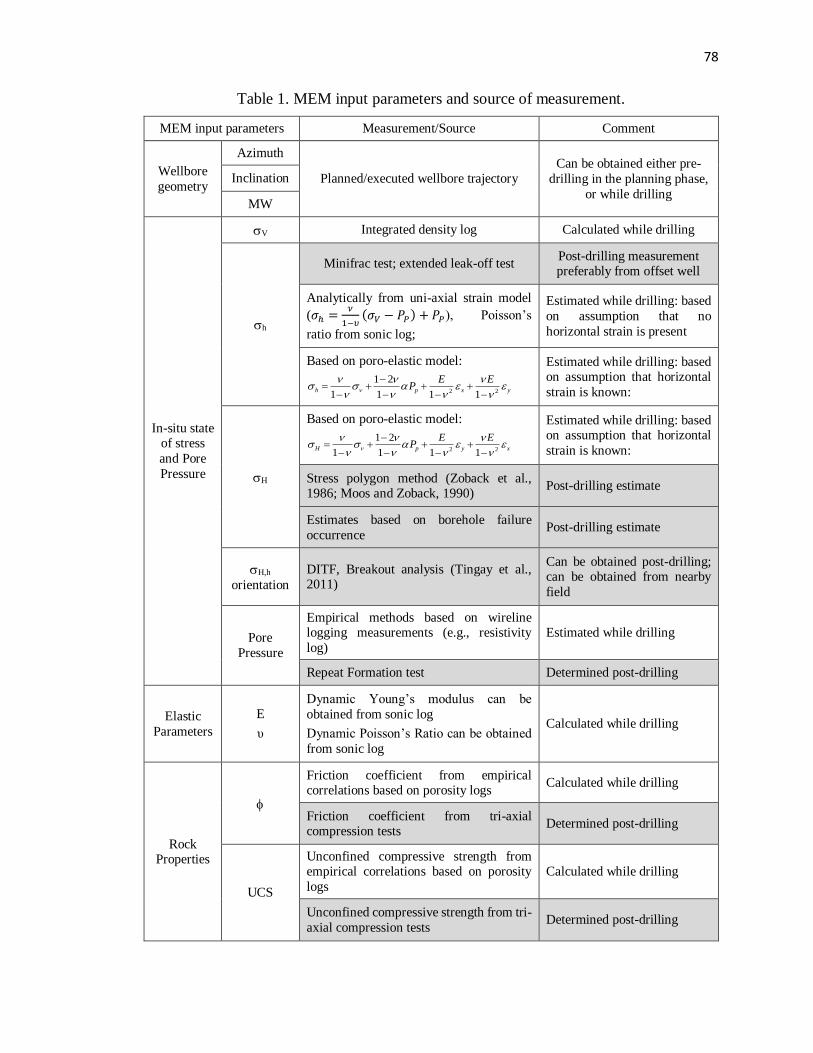
78
Table 1. MEM input parameters and source of measurement.
MEM input parameters Measurement/Source Comment
Wellbore
geometry
Azimuth
Planned/executed wellbore trajectory Can be obtained either pre-
drilling in the planning phase,
or while drilling
Inclination
MW
In-situ state of stress
and Pore
Pressure
V Integrated density log Calculated while drilling
h
Minifrac test; extended leak-off test Post-drilling measurement preferably from offset well
Analytically from uni-axial strain model
(𝜎ℎ =𝜈
1−𝜐(𝜎𝑉 − 𝑃𝑃) + 𝑃𝑃), Poisson’s
ratio from sonic log;
Estimated while drilling: based
on assumption that no
horizontal strain is present
Based on poro-elastic model:
Estimated while drilling: based on assumption that horizontal
strain is known:
H
Based on poro-elastic model:
Estimated while drilling: based on assumption that horizontal
strain is known:
Stress polygon method (Zoback et al., 1986; Moos and Zoback, 1990)
Post-drilling estimate
Estimates based on borehole failure
occurrence Post-drilling estimate
H,h
orientation
DITF, Breakout analysis (Tingay et al., 2011)
Can be obtained post-drilling; can be obtained from nearby
field
Pore
Pressure
Empirical methods based on wireline logging measurements (e.g., resistivity
log)
Estimated while drilling
Repeat Formation test Determined post-drilling
Elastic
Parameters
E
υ
Dynamic Young’s modulus can be
obtained from sonic log
Dynamic Poisson’s Ratio can be obtained
from sonic log
Calculated while drilling
Rock Properties
Friction coefficient from empirical correlations based on porosity logs
Calculated while drilling
Friction coefficient from tri-axial compression tests
Determined post-drilling
UCS
Unconfined compressive strength from empirical correlations based on porosity
logs
Calculated while drilling
Unconfined compressive strength from tri-
axial compression tests Determined post-drilling
2 2
1 2
1 1 1 1h p x y
E EP
2 2
1 2
1 1 1 1H p y x
E EP
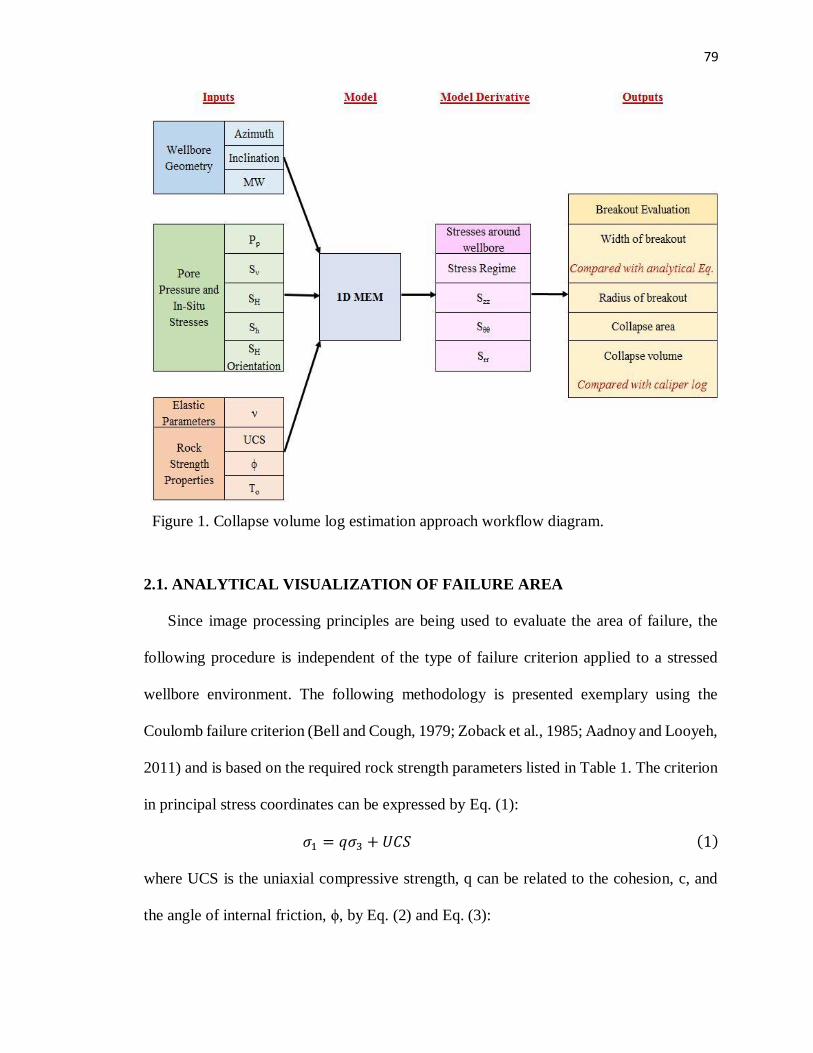
79
Figure 1. Collapse volume log estimation approach workflow diagram.
2.1. ANALYTICAL VISUALIZATION OF FAILURE AREA
Since image processing principles are being used to evaluate the area of failure, the
following procedure is independent of the type of failure criterion applied to a stressed
wellbore environment. The following methodology is presented exemplary using the
Coulomb failure criterion (Bell and Cough, 1979; Zoback et al., 1985; Aadnoy and Looyeh,
2011) and is based on the required rock strength parameters listed in Table 1. The criterion
in principal stress coordinates can be expressed by Eq. (1):
𝜎1 = 𝑞𝜎3 + 𝑈𝐶𝑆 (1)
where UCS is the uniaxial compressive strength, q can be related to the cohesion, c, and
the angle of internal friction, ϕ, by Eq. (2) and Eq. (3):
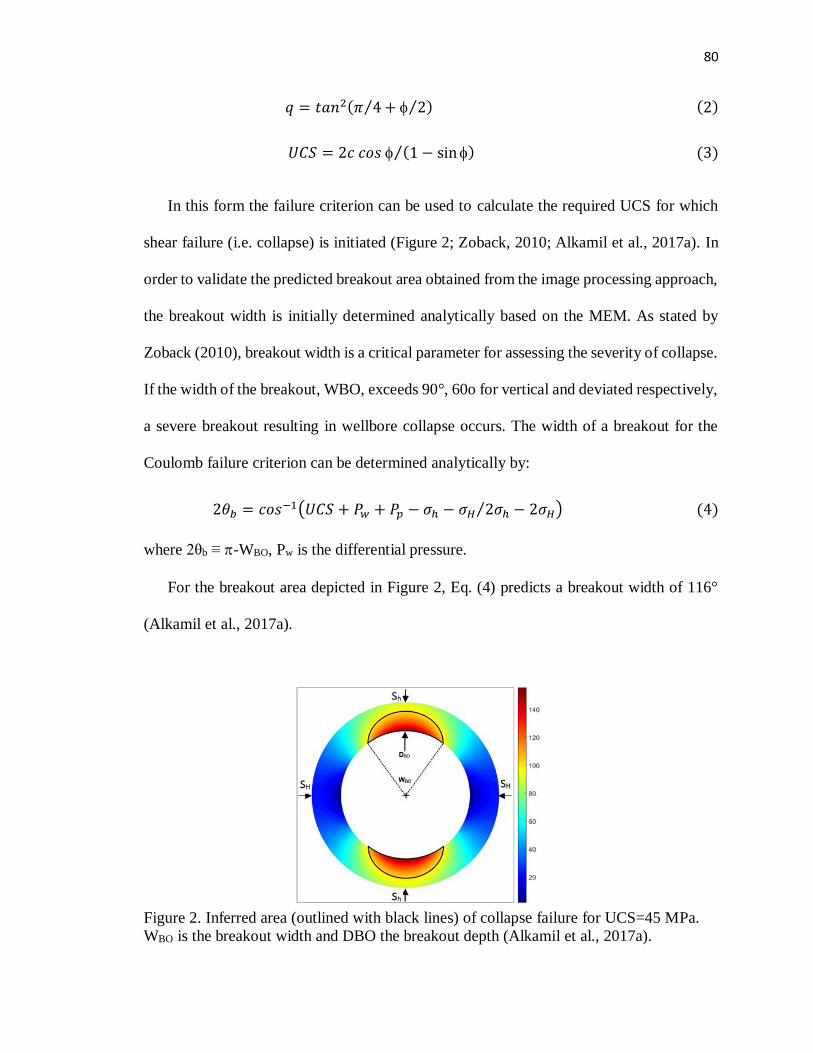
80
𝑞 = 𝑡𝑎𝑛2(𝜋 4⁄ + 2⁄ ) (2)
𝑈𝐶𝑆 = 2𝑐 𝑐𝑜𝑠 (1 − sin ) (3)⁄
In this form the failure criterion can be used to calculate the required UCS for which
shear failure (i.e. collapse) is initiated (Figure 2; Zoback, 2010; Alkamil et al., 2017a). In
order to validate the predicted breakout area obtained from the image processing approach,
the breakout width is initially determined analytically based on the MEM. As stated by
Zoback (2010), breakout width is a critical parameter for assessing the severity of collapse.
If the width of the breakout, WBO, exceeds 90°, 60o for vertical and deviated respectively,
a severe breakout resulting in wellbore collapse occurs. The width of a breakout for the
Coulomb failure criterion can be determined analytically by:
2𝜃𝑏 = 𝑐𝑜𝑠−1(𝑈𝐶𝑆 + 𝑃𝑤 + 𝑃𝑝 − 𝜎ℎ − 𝜎𝐻 2𝜎ℎ − 2𝜎𝐻⁄ ) (4)
where 2θb ≡ -WBO, Pw is the differential pressure.
For the breakout area depicted in Figure 2, Eq. (4) predicts a breakout width of 116°
(Alkamil et al., 2017a).
Figure 2. Inferred area (outlined with black lines) of collapse failure for UCS=45 MPa.
WBO is the breakout width and DBO the breakout depth (Alkamil et al., 2017a).
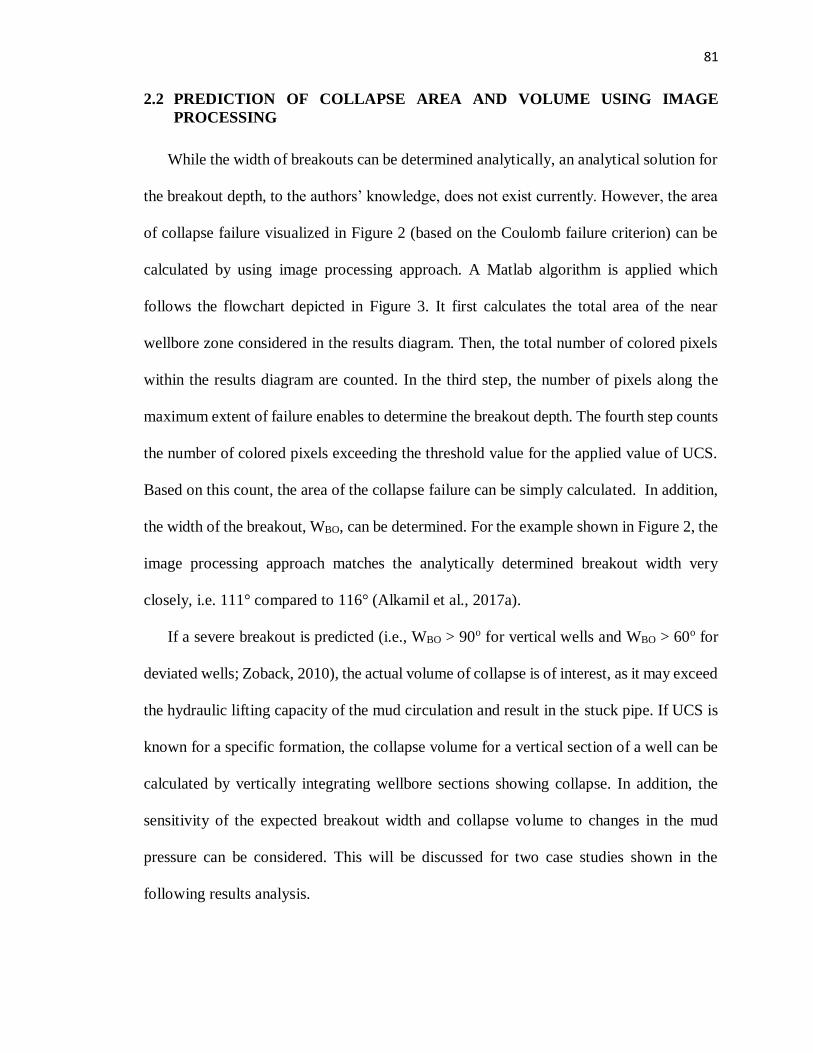
81
2.2 PREDICTION OF COLLAPSE AREA AND VOLUME USING IMAGE
PROCESSING
While the width of breakouts can be determined analytically, an analytical solution for
the breakout depth, to the authors’ knowledge, does not exist currently. However, the area
of collapse failure visualized in Figure 2 (based on the Coulomb failure criterion) can be
calculated by using image processing approach. A Matlab algorithm is applied which
follows the flowchart depicted in Figure 3. It first calculates the total area of the near
wellbore zone considered in the results diagram. Then, the total number of colored pixels
within the results diagram are counted. In the third step, the number of pixels along the
maximum extent of failure enables to determine the breakout depth. The fourth step counts
the number of colored pixels exceeding the threshold value for the applied value of UCS.
Based on this count, the area of the collapse failure can be simply calculated. In addition,
the width of the breakout, WBO, can be determined. For the example shown in Figure 2, the
image processing approach matches the analytically determined breakout width very
closely, i.e. 111° compared to 116° (Alkamil et al., 2017a).
If a severe breakout is predicted (i.e., WBO > 90o for vertical wells and WBO > 60o for
deviated wells; Zoback, 2010), the actual volume of collapse is of interest, as it may exceed
the hydraulic lifting capacity of the mud circulation and result in the stuck pipe. If UCS is
known for a specific formation, the collapse volume for a vertical section of a well can be
calculated by vertically integrating wellbore sections showing collapse. In addition, the
sensitivity of the expected breakout width and collapse volume to changes in the mud
pressure can be considered. This will be discussed for two case studies shown in the
following results analysis.
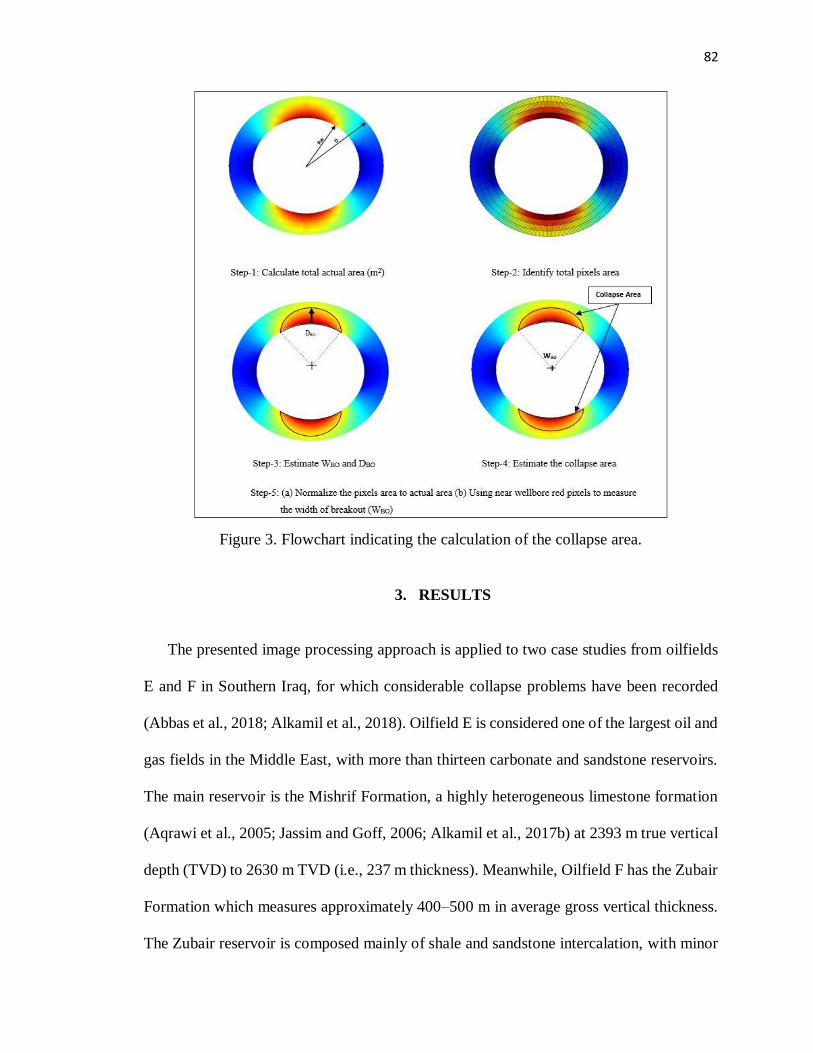
82
Figure 3. Flowchart indicating the calculation of the collapse area.
3. RESULTS
The presented image processing approach is applied to two case studies from oilfields
E and F in Southern Iraq, for which considerable collapse problems have been recorded
(Abbas et al., 2018; Alkamil et al., 2018). Oilfield E is considered one of the largest oil and
gas fields in the Middle East, with more than thirteen carbonate and sandstone reservoirs.
The main reservoir is the Mishrif Formation, a highly heterogeneous limestone formation
(Aqrawi et al., 2005; Jassim and Goff, 2006; Alkamil et al., 2017b) at 2393 m true vertical
depth (TVD) to 2630 m TVD (i.e., 237 m thickness). Meanwhile, Oilfield F has the Zubair
Formation which measures approximately 400–500 m in average gross vertical thickness.
The Zubair reservoir is composed mainly of shale and sandstone intercalation, with minor
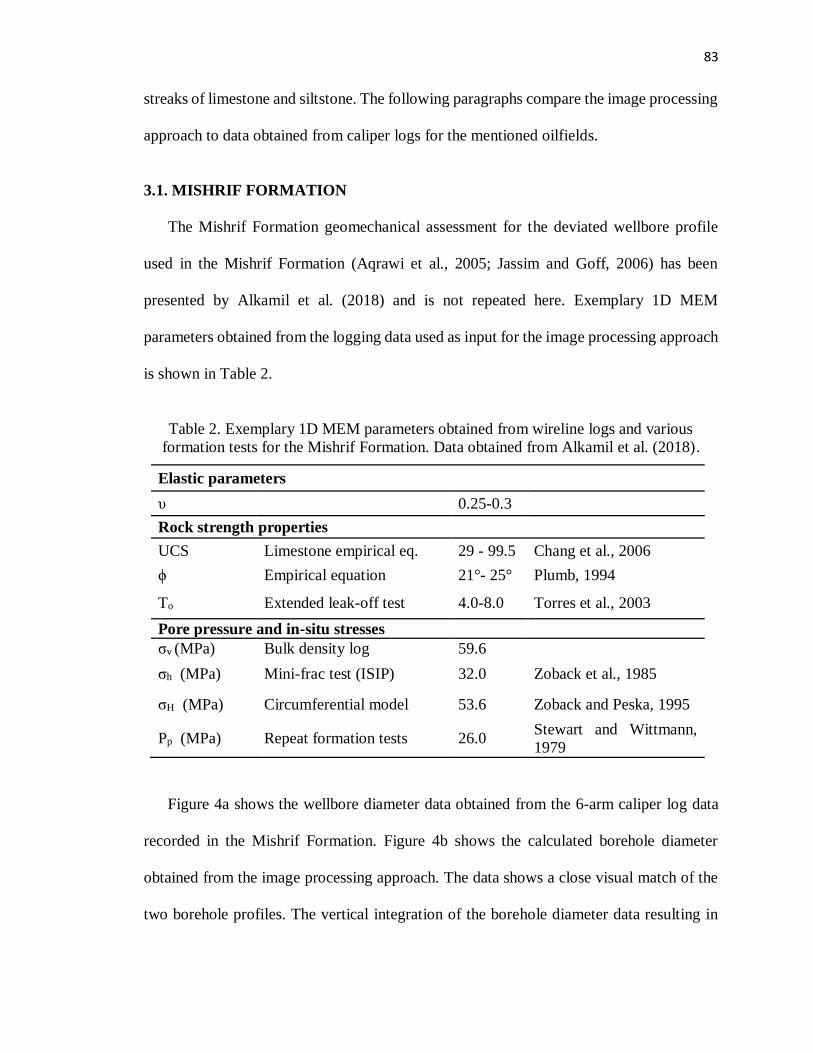
83
streaks of limestone and siltstone. The following paragraphs compare the image processing
approach to data obtained from caliper logs for the mentioned oilfields.
3.1. MISHRIF FORMATION
The Mishrif Formation geomechanical assessment for the deviated wellbore profile
used in the Mishrif Formation (Aqrawi et al., 2005; Jassim and Goff, 2006) has been
presented by Alkamil et al. (2018) and is not repeated here. Exemplary 1D MEM
parameters obtained from the logging data used as input for the image processing approach
is shown in Table 2.
Table 2. Exemplary 1D MEM parameters obtained from wireline logs and various
formation tests for the Mishrif Formation. Data obtained from Alkamil et al. (2018).
Elastic parameters
υ 0.25-0.3
Rock strength properties
UCS Limestone empirical eq. 29 - 99.5 Chang et al., 2006
ϕ Empirical equation 21°- 25° Plumb, 1994
To Extended leak-off test 4.0-8.0 Torres et al., 2003
Pore pressure and in-situ stresses
σv (MPa) Bulk density log 59.6
σh (MPa) Mini-frac test (ISIP) 32.0 Zoback et al., 1985
σH (MPa) Circumferential model 53.6 Zoback and Peska, 1995
Pp (MPa) Repeat formation tests 26.0 Stewart and Wittmann,
1979
Figure 4a shows the wellbore diameter data obtained from the 6-arm caliper log data
recorded in the Mishrif Formation. Figure 4b shows the calculated borehole diameter
obtained from the image processing approach. The data shows a close visual match of the
two borehole profiles. The vertical integration of the borehole diameter data resulting in
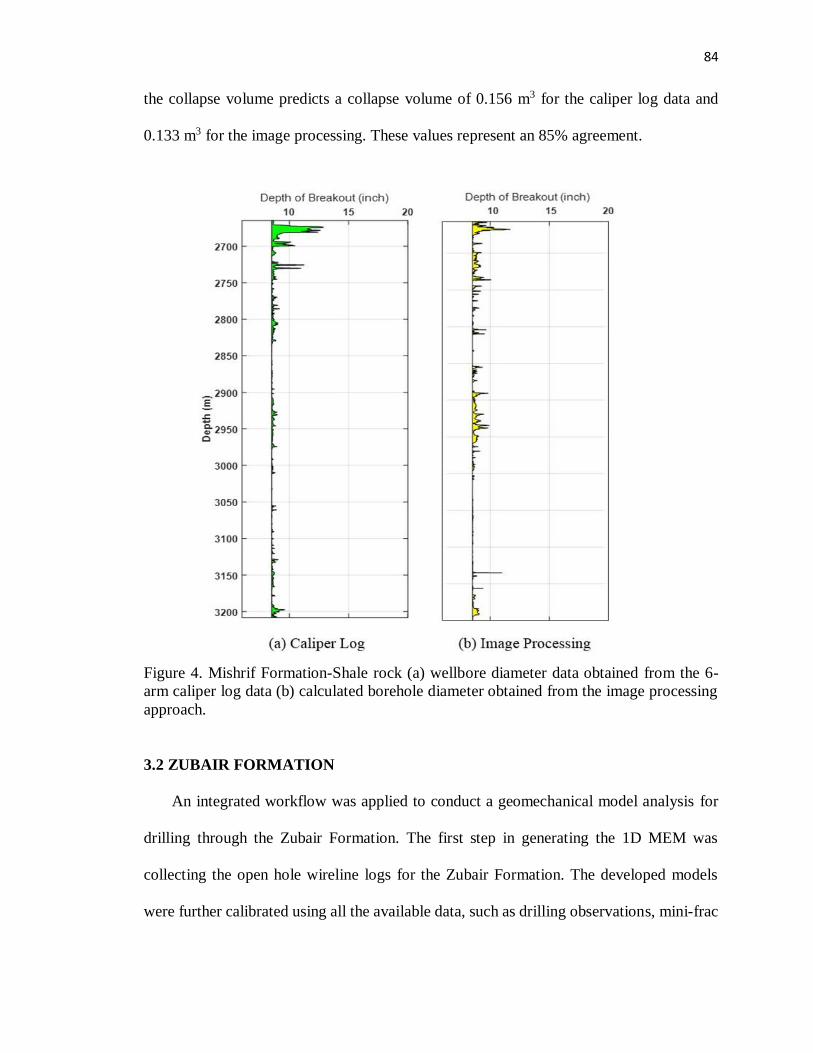
84
the collapse volume predicts a collapse volume of 0.156 m3 for the caliper log data and
0.133 m3 for the image processing. These values represent an 85% agreement.
Figure 4. Mishrif Formation-Shale rock (a) wellbore diameter data obtained from the 6-
arm caliper log data (b) calculated borehole diameter obtained from the image processing
approach.
3.2 ZUBAIR FORMATION
An integrated workflow was applied to conduct a geomechanical model analysis for
drilling through the Zubair Formation. The first step in generating the 1D MEM was
collecting the open hole wireline logs for the Zubair Formation. The developed models
were further calibrated using all the available data, such as drilling observations, mini-frac
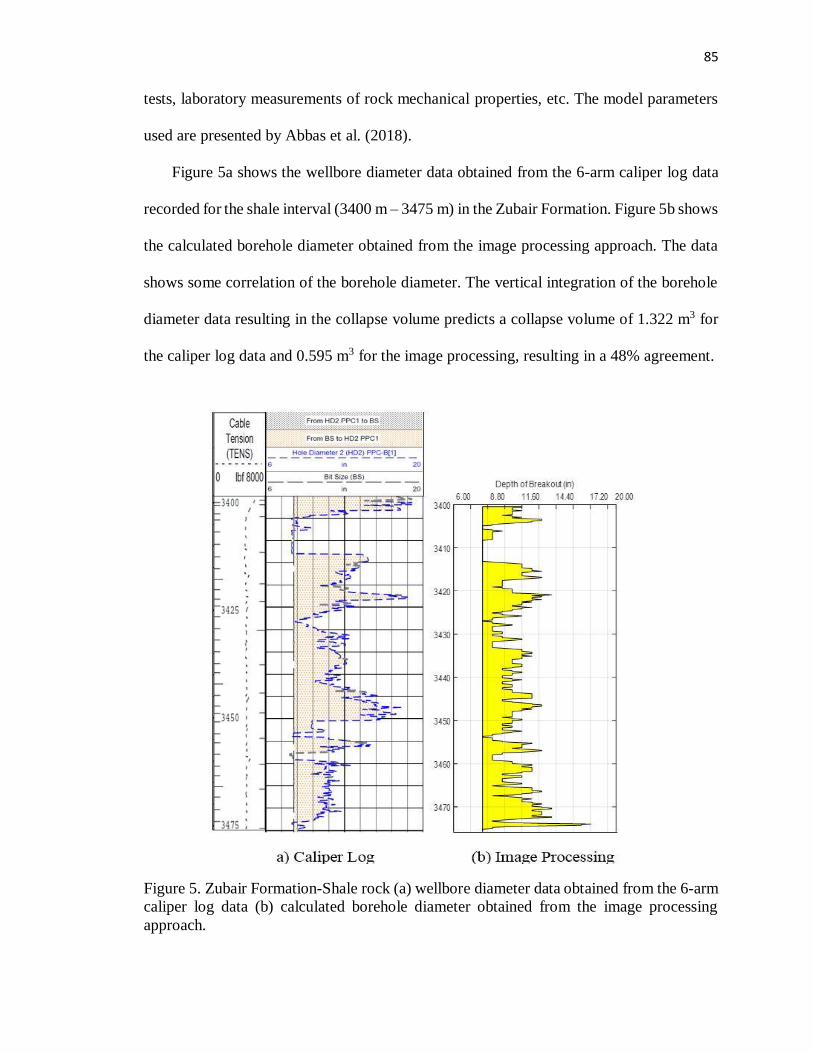
85
tests, laboratory measurements of rock mechanical properties, etc. The model parameters
used are presented by Abbas et al. (2018).
Figure 5a shows the wellbore diameter data obtained from the 6-arm caliper log data
recorded for the shale interval (3400 m – 3475 m) in the Zubair Formation. Figure 5b shows
the calculated borehole diameter obtained from the image processing approach. The data
shows some correlation of the borehole diameter. The vertical integration of the borehole
diameter data resulting in the collapse volume predicts a collapse volume of 1.322 m3 for
the caliper log data and 0.595 m3 for the image processing, resulting in a 48% agreement.
Figure 5. Zubair Formation-Shale rock (a) wellbore diameter data obtained from the 6-arm
caliper log data (b) calculated borehole diameter obtained from the image processing
approach.
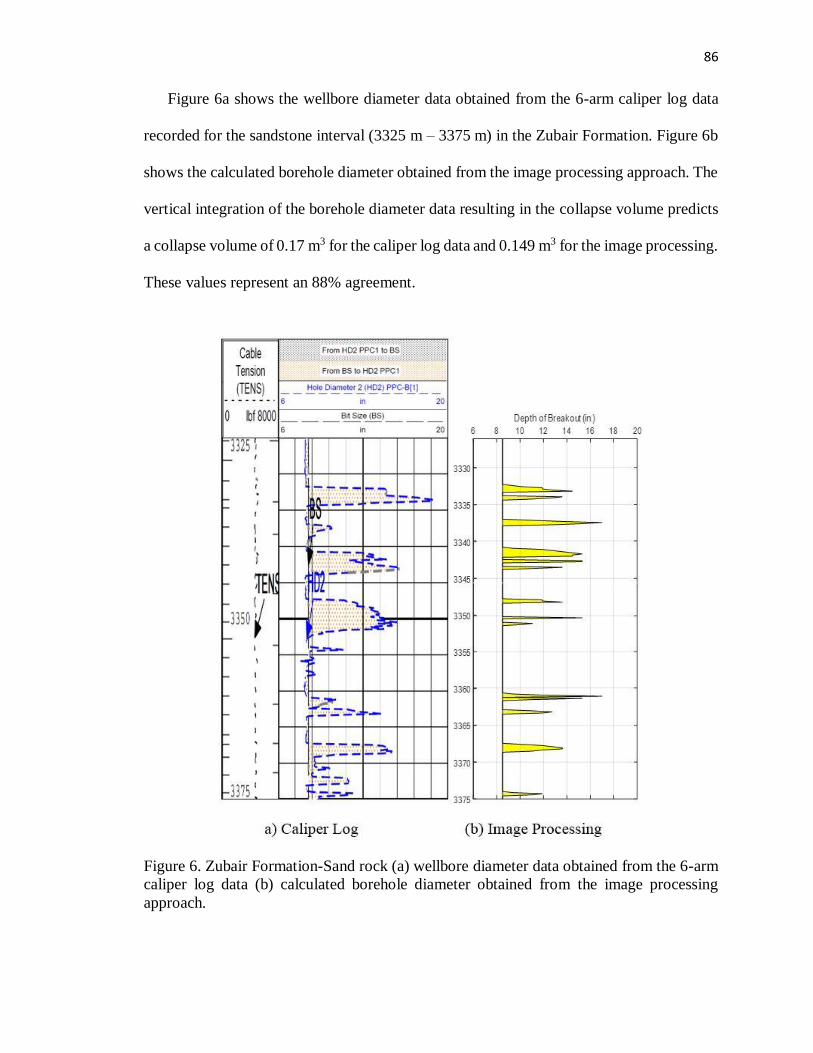
86
Figure 6a shows the wellbore diameter data obtained from the 6-arm caliper log data
recorded for the sandstone interval (3325 m – 3375 m) in the Zubair Formation. Figure 6b
shows the calculated borehole diameter obtained from the image processing approach. The
vertical integration of the borehole diameter data resulting in the collapse volume predicts
a collapse volume of 0.17 m3 for the caliper log data and 0.149 m3 for the image processing.
These values represent an 88% agreement.
Figure 6. Zubair Formation-Sand rock (a) wellbore diameter data obtained from the 6-arm
caliper log data (b) calculated borehole diameter obtained from the image processing
approach.
87
4. DISCUSSION
Common 1D MEM approaches can be used to derive an analytical solution for the
width of breakouts (WBO in Figure 2), which in turn is used to assess the severity of
wellbore collapse (Moos et al., 2007, Zoback, 2010). The width of a breakout is expected
to remain stable with an increased radius of collapse failure as the breakouts tend to deepen
(Barton et al., 1988). In combination, breakout width and breakout depth determine the
geometry of the resulting breakout and are therefore necessary to determine collapse
volume. As an analytical solution for breakout depth does not exist the expected breakout
depth can only be determined post-drilling, either using of numerical modeling approaches
or by measurements obtained from 4- or 6-arm caliper logs. While numerical analyses are
impractical to assess collapse for a complete well profile (i.e. it would require a large
number of modeling runs for different well sections and would have to assume average
material properties for these sections), 4- and 6-arm caliper log analysis has been used to
determine wellbore collapse post-drilling for better cement volume estimations (Jarosiński,
1998). A disadvantage of using caliper log data is the inherent assumption of a triangular
breakout geometry (Escobar et al., 2014, which underestimates the actual area. In addition,
the post-drilling application is a disadvantage to drilling operations as a proactive real-time
assessment of the expected collapse volume represents important knowledge during
drilling operations. In this study, an image processing approach is proposed that utilizes
the wellbore stresses and rock strength properties obtained from the MEM to calculate the
area of collapse based on the Coulomb failure criterion. Under the condition that horizontal
stress magnitudes can be obtained pre-drilling from a nearby field or from an offset well,
all other MEM parameters can be obtained “proactively” during drilling operations (e.g.,
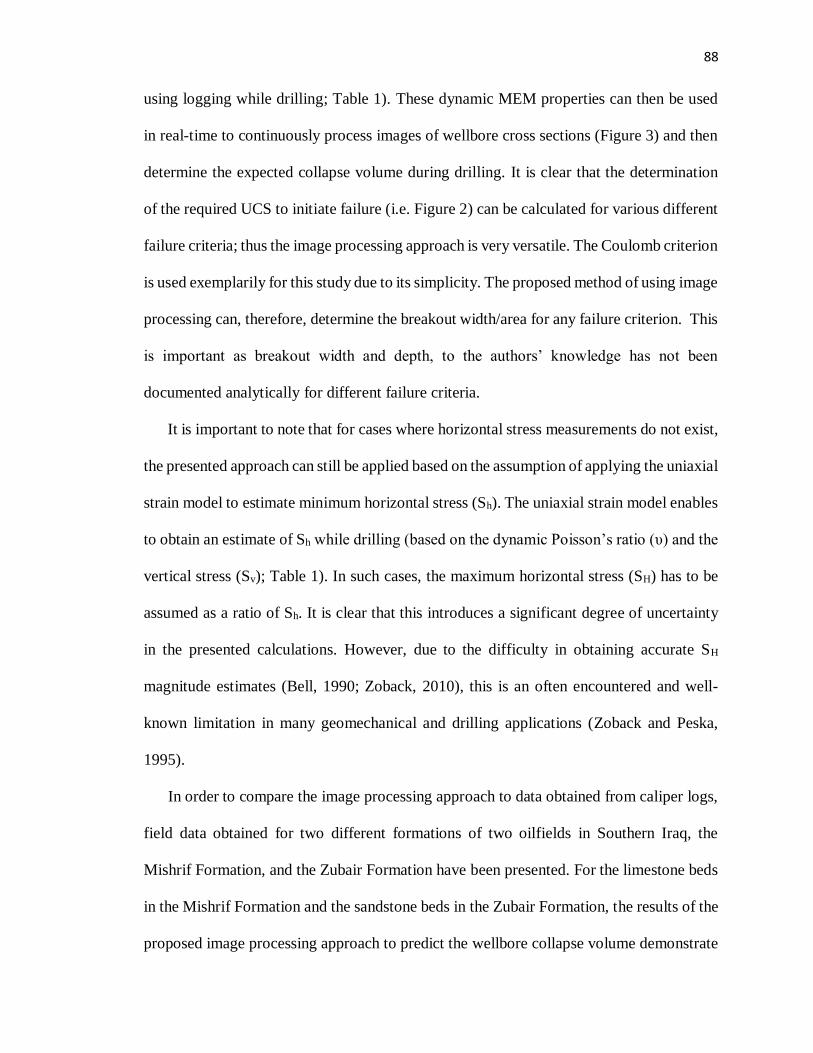
88
using logging while drilling; Table 1). These dynamic MEM properties can then be used
in real-time to continuously process images of wellbore cross sections (Figure 3) and then
determine the expected collapse volume during drilling. It is clear that the determination
of the required UCS to initiate failure (i.e. Figure 2) can be calculated for various different
failure criteria; thus the image processing approach is very versatile. The Coulomb criterion
is used exemplarily for this study due to its simplicity. The proposed method of using image
processing can, therefore, determine the breakout width/area for any failure criterion. This
is important as breakout width and depth, to the authors’ knowledge has not been
documented analytically for different failure criteria.
It is important to note that for cases where horizontal stress measurements do not exist,
the presented approach can still be applied based on the assumption of applying the uniaxial
strain model to estimate minimum horizontal stress (Sh). The uniaxial strain model enables
to obtain an estimate of Sh while drilling (based on the dynamic Poisson’s ratio (υ) and the
vertical stress (Sv); Table 1). In such cases, the maximum horizontal stress (SH) has to be
assumed as a ratio of Sh. It is clear that this introduces a significant degree of uncertainty
in the presented calculations. However, due to the difficulty in obtaining accurate SH
magnitude estimates (Bell, 1990; Zoback, 2010), this is an often encountered and well-
known limitation in many geomechanical and drilling applications (Zoback and Peska,
1995).
In order to compare the image processing approach to data obtained from caliper logs,
field data obtained for two different formations of two oilfields in Southern Iraq, the
Mishrif Formation, and the Zubair Formation have been presented. For the limestone beds
in the Mishrif Formation and the sandstone beds in the Zubair Formation, the results of the
proposed image processing approach to predict the wellbore collapse volume demonstrate
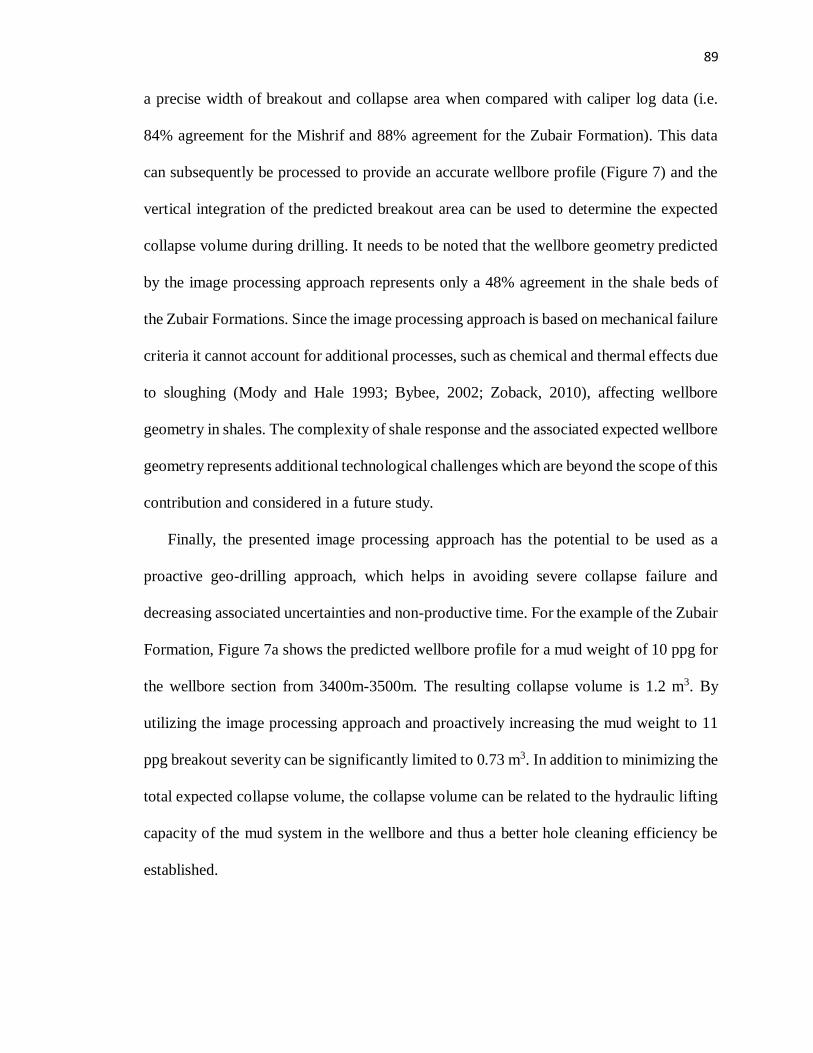
89
a precise width of breakout and collapse area when compared with caliper log data (i.e.
84% agreement for the Mishrif and 88% agreement for the Zubair Formation). This data
can subsequently be processed to provide an accurate wellbore profile (Figure 7) and the
vertical integration of the predicted breakout area can be used to determine the expected
collapse volume during drilling. It needs to be noted that the wellbore geometry predicted
by the image processing approach represents only a 48% agreement in the shale beds of
the Zubair Formations. Since the image processing approach is based on mechanical failure
criteria it cannot account for additional processes, such as chemical and thermal effects due
to sloughing (Mody and Hale 1993; Bybee, 2002; Zoback, 2010), affecting wellbore
geometry in shales. The complexity of shale response and the associated expected wellbore
geometry represents additional technological challenges which are beyond the scope of this
contribution and considered in a future study.
Finally, the presented image processing approach has the potential to be used as a
proactive geo-drilling approach, which helps in avoiding severe collapse failure and
decreasing associated uncertainties and non-productive time. For the example of the Zubair
Formation, Figure 7a shows the predicted wellbore profile for a mud weight of 10 ppg for
the wellbore section from 3400m-3500m. The resulting collapse volume is 1.2 m3. By
utilizing the image processing approach and proactively increasing the mud weight to 11
ppg breakout severity can be significantly limited to 0.73 m3. In addition to minimizing the
total expected collapse volume, the collapse volume can be related to the hydraulic lifting
capacity of the mud system in the wellbore and thus a better hole cleaning efficiency be
established.
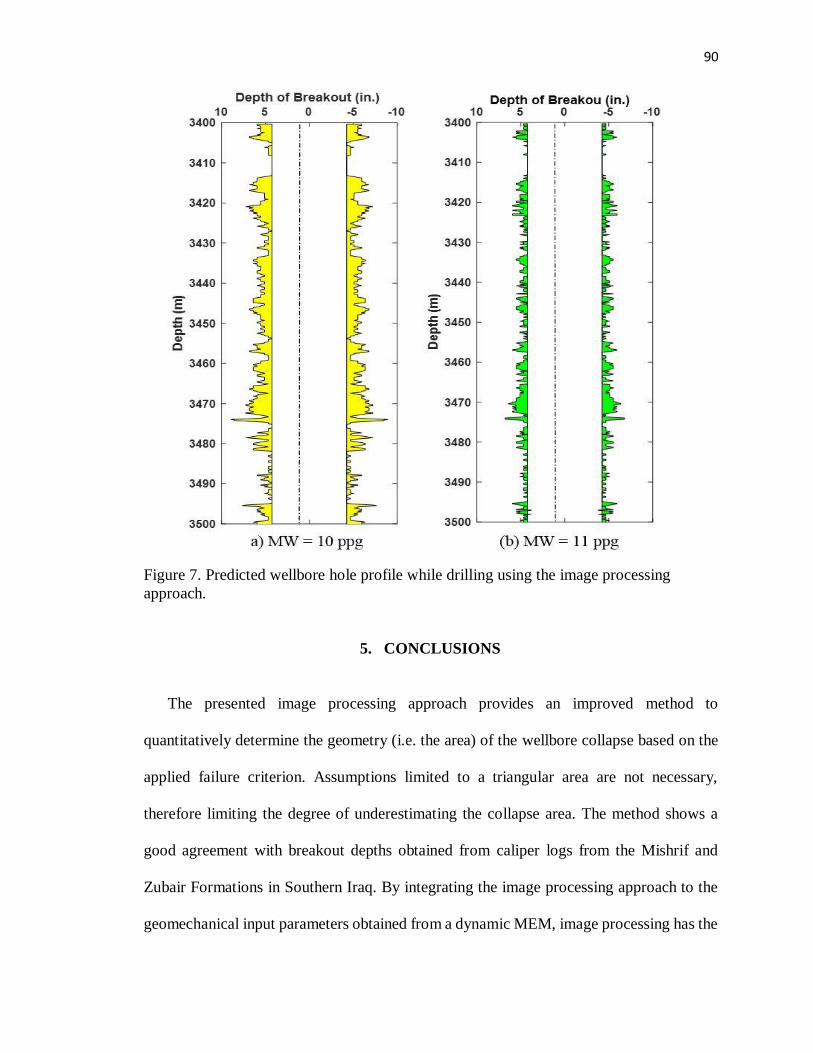
90
Figure 7. Predicted wellbore hole profile while drilling using the image processing
approach.
5. CONCLUSIONS
The presented image processing approach provides an improved method to
quantitatively determine the geometry (i.e. the area) of the wellbore collapse based on the
applied failure criterion. Assumptions limited to a triangular area are not necessary,
therefore limiting the degree of underestimating the collapse area. The method shows a
good agreement with breakout depths obtained from caliper logs from the Mishrif and
Zubair Formations in Southern Iraq. By integrating the image processing approach to the
geomechanical input parameters obtained from a dynamic MEM, image processing has the
91
potential to be used as a proactive geo-drilling approach, which helps in avoiding severe
collapse failure and decreasing associated uncertainties and non-productive time. This
approach can help the drilling operation engineers in evaluating the mud weight effect on
stuck pipe problems in real-time based on the estimated collapse volume and the drilling
system hole cleaning efficiency. This, in turn, could lead to design criteria to select mud
properties to achieve the desired degree of hole quality for running modern completions.
In addition, knowledge of the collapse volume provides better estimates on the required
mud and cement volumes.
ACKNOWLEDGMENTS
We would like to express our appreciation to the Iraqi Ministry of Higher Education
and Scientific Research (MOHESR) - the University of Basrah for sponsoring Ethar
Alkamil to finish this work.
REFERENCES
Aadnoy, B.S., Looyeh, R., 2011. Petroleum rock mechanics drilling operations and well
design, first ed.Gulf Professional Pub, Oxford.
Abbas, A.K., Al-Asadi, Y.M.B., Alsaba, M., Flori, R.E., Alhussainy, S., 2018.
Development of a Geomechanical Model for Drilling Deviated Wells through the Zubair
Formation in Southern Iraq. In: SPE/IADC Middle East Drilling Technology
Conference and Exhibition, 29-31 January, Abu Dhabi, UAE.
https://doi.org/10.2118/189306-MS
Alkamil, E.H.K., Abbood, H. R., Flori, R.E., Eckert A., 2018. Case study of wellbore
stability evaluation for the Mishrif Formation, Iraq, J. Petrol. Sci. and Eng. 164, 663-
674, doi.org/10.1016/j.petrol.2018.01.018.
Alkamil, K. E.H.K., Flori, R.E., Eckert, A., 2017a. A Novel Approach to Predict Collapse
Volume Using Image Processing. In: 51st U.S. Rock Mechanics/Geomechanics
Symposium, 25-28 June, San Francisco, California, USA.
92
Alkamil, E.H.K., Abbood, H.R., Flori, R.E., Eckert, A., 2017b. Wellbore stability
evaluation for Mishrif formation. In: SPE Middle East Oil and Gas Show and
Conference Held in Manama, Kingdom of Bahrain, 6–9 March 2017.
https://doi.org/10.2118/183668-MS.
Aqrawi, A.A.M., Goff, J.C., Horbury, A.D., Sadooni, F.N. 2005. The petroleum geology
of Iraq, first ed. Scientilic Press Ltd.
Atiunson, A., Pointer, R., 1975. Logging Services Used for Large Diameter Boreholes.
Society of Petrophysicists and Well-Log Analysts.
Barton, C.A., Zoback, M.D., Burns, K.L., 1988. In situ stress orientation and magnitude at
the Fenton Geothermal site, New Mexico, determined from wellbore breakouts.
Geophysical Research Letters, 15(5), pp. 467–470.
Bell, J.S., 1990. Investigating stress regimes in sedimentary basins using information from
oil industry wireline logs and drilling records. In: Hurst, A., Lovell, M., Morton, A.
(Eds.), Geological Applications of Wireline Logs, Geol. Soc. Lond. Spec. Publ, vol. 48,
pp. 305–325.
Bell, J.S., Babcock, E.A., 1986. The stress regime of the Western Canadian basin and
implications for hydrocarbon production. Bull. Can. Petrol. Geol. 34 (3), 364–378.
September.
Bell, J.S., Gough, D.I., 1979. Northeast-southwest compressive stress in Alberta: Evidence
from oil wells. Earth Planet. Sci. Lett., 45, pp. 475–482.
Bybee, K., 2002. Chemical and Thermal Effects on Wellbore Stability of Shale Formations.
Society of Petroleum Engineers. doi:10.2118/0202-0051-JPT.
Chang, C., Zoback, M.D., Khaksar, A., 2006. Empirical relations between rock strength
and physical properties in sedimentary rocks. J. Petrol. Sci. Eng. 51 (3–4), 223–237.
Chatterjee, R., Mukhopadhyay, M., 2003. Numerical Modelling of Stress Around a
Wellbore. In: SPE Asia Pacific Oil and Gas Conference and Exhibition, 9-11 September,
Jakarta, Indonesia. doi:10.2118/80489-MS.
Cheatham, J.B., 1984. Wellbore Stability. J. SPE. doi:10.2118/13340-PA.
Escobar, R.G., Carrillo, Z.H.C., Peña, Y.A.Q., 2014. New Approach for Estimating
Cavings Volume to Avoid Wellbore Instabilities. In: ISRM Conference on Rock
Mechanics for Natural Resources and Infrastructure - SBMR 2014, 9-13 September,
Goiania, Brazil.
Fjær, E., Holt, R.M., Horsrud, P., Raaen, A.M., Risnes, R., 2008. Petroleum Related Rock
Mechanics, second ed. Elsevier Science, Amsterdam.
93
Gholami, R., Maleki, S., Moradzadeh, A., Rasouli, V., Hanachi, J., 2014. Practical
application of failure criteria in determining safe mud weight windows in drilling
operations. J. Rock Mech. Geotech. Eng. 6, 13-25.
Goodman, H.E., Connolly, P., 2007. Reconciling Subsurface Uncertainty with the
Appropriate Well Design Using the Mechanical Earth Model (MEM) Approach. In:
Nigeria Annual International Conference and Exhibition, 6-8 August, Abuja, Nigeria.
doi:10.2118/111913-MS.
Herrick, C.G., Haimson, B.C., 1994. Modeling of Episodic Failure Leading to Borehole
Breakouts in Alabama Limestone. 1st North American Rock Mechanics Symposium, 1-
3 June, Austin, Texas.
Howard, J.A., Glover, S.B., 1994. Tracking Stuck Pipe Probability While Drilling. In:
SPE/IADC Drilling Conference, 15-18 February, Dallas, Texas. doi:10.2118/27528-
MS.
Jarosiński, M., 1998. Contemporary stress field distortion in the Polish part of the Western
Outer Carpathians and their basement. Tectonophysics 297 (1-4), 91-119, 20, ISSN
0040-1951.
Jassim, S.Z., Goff, J.C., 2006. Geology of Iraq, first ed. Dolin, Prague.
Kaushik, Y.D., Baishya, R.C., Majithia, P.P.S., Bagchi, D., Pratap, M., Kumar, R., Singh,
H., 2016. Reducing Drilling Risks in ERD Wells Through Geomechanical Solutions. In:
SPE Annual Technical Conference and Exhibition, 26-28 September, Dubai, UAE.
doi:10.2118/181399-MS.
Kirsch, G. (1898). “Die Theorie der Elastizitat und die Bedurfnisse der Festigkeitslehre,
Zeitschrift des Verlines Deutscher Ingenieure.” 42, 707.
Kristiansen, T.G., 2007. Drilling wellbore stability in the compacting and subsiding Valhall
field: a case study. J. SPE Drill. Complet. 277–295. https://doi.org/10.2118/87221-PA.
Li, X., El-Mohtar, C., Gray, K., 2017. Investigation of Wellbore Breakouts in Deviated
Wells - a 3D Numerical Modeling Approach. 51st U.S. Rock Mechanics/Geomechanics
Symposium, 25-28 June, San Francisco, California, USA.
Mastin, L., 1988. Effect of borehole deviation on breakout orientations. J. Geophys. Res.
93 (B8), 9187–9195. https://doi.org/10.1029/JB093iB08p09187.
Modine, J.D., 2009. American Petroleum Institute Handbook. American Petroleum
Institute.
Mody, F. K., Hale, A. H., 1993. Borehole-Stability Model to Couple the Mechanics and
Chemistry of Drilling-Fluid/Shale Interactions. J. SPE. doi:10.2118/25728-PA.
94
Moos, D., Barton, C.A., Willson, S., 2007. Impact of Rock Properties on the Relationship
Between Wellbore Breakout Width and Depth. 1st Canada - U.S. Rock Mechanics
Symposium, 27-31 May, Vancouver, Canada.
Moos, D., Zoback, M.D., 1990. Utilization of observations of well bore failure to constrain
the orientation and magnitude of crustal stresses: application to continental, Deep Sea
Drilling Project, and Ocean Drilling Program boreholes. J. Geophys. Res. 95 (B6),
9305–9325. https://doi.org/10.1029/JB095iB06p09305.
Peska, P., Zoback, M.D., 1995. Compressive and tensile failure of inclined well bores and
determination of in situ stress and rock strength. J. Geophys. Res. Atmos. 100 (B7),
12791 https://doi.org/10.1029/95JB00319.
Plumb, R.A. Influence of composition and texture on the failure properties of clastic rocks.
In: Eurocks 94, Rock Mechanics in Petroleum Engineering Conference, pp. 13–20.
Salminen, K., Cheatham, C., Smith, M., Valiullin, K., 2017. Stuck-Pipe Prediction by Use
of Automated Real-Time Modeling and Data Analysis. J. SPE. doi:10.2118/178888-PA.
Stewart, G., Wittmann, M., 1979. Interpretation of the Pressure Response of the Repeat
Formation Tester. Society of Petroleum Engineers, pp. 230–236.
https://doi.org/10.2118/8362-MS.
Tingay, M., Bentham, P., De Feyter, A., Kellner, A., May 2011. Present-day stress field
rotations associated with evaporites in the offshore Nile Delta. Geol. Soc. Am. Bull. 123
(5–6), 1171–1180. https://doi.org/10.1130/B30185.1.
Torres, M.E., Gonzalez, A.J., Last, N.C., 2003. In-situ stress state eastern Cordillera
(Colombia). In: SPE Latin American and Caribbean Petroleum Engineering Conference
Held in Port-of-Spain, Trinidad, West Indies, 27–30 April 2003.
https://doi.org/10.2118/81074-MS.
Wagner, D., Müller, B., Tingay, M., 2004. Correcting for Tool Decentralization of
Oriented Six-Arm Caliper Logs for Determination of Contemporary Tectonic Stress
Orientation. J. Petrophys., 45 (6), pp. 530-539.
Wu, B., Chen, Z., Zhang, X., 2016. Stability of Borehole with Breakouts - An Experimental
and Numerical Modelling Study. 50th U.S. Rock Mechanics/Geomechanics
Symposium, 26-29 June, Houston, Texas.
Zoback, M.D., 2010. Reservoir Geomechanics, first ed. Cambridge University Press,
Cambridge.
Zoback, M.D., Mastin, L., Barton, C.A., 1986. In-situ Stress Measurements in Deep
Boreholes Using Hydraulic Fracturing, Wellbore Breakouts, and Stonely Wave
Polarization. International Society for Rock Mechanics.

95
Zoback, M.D., Moos, D., Mastin, L.G., Anderson, R.N., 1985. Well bore breakouts and in
situ stress. J. Geophys. Res. 90, 5523–5530.
Zoback, M.D., Peska, P., 1995. In-situ stress and rock strength in the GBRN/DOE
pathfinder well, South Eugene Island, Gulf of Mexico. J. Petrol. Technol. 582–585.
https://doi.org/10.2118/29233-PA.
96
SECTION
4. CONCLUSIONS AND RECOMMENDATIONS
4.1. CONCLUSIONS
In this dissertation, both a comprehensive evaluation of a Mishrif Formation
geomechanics parameters and historical drilled wells with stuck pipe and differential
sticking problems. The major findings of this research are summarized below:
The results obtained from the Mogi–Coulomb failure criterion, which are chosen as
the most indicative failure criterion to assess wellbore collapse, indicate that all wells
experiencing collapse and associated stuck pipe have been drilled with too low of a
mud weight.
Based on the horizontal stress orientations, this study recommends well azimuths
along the minimum horizontal stress direction with inclinations higher than 40o.
The 1D MEM approach can also be used to mitigate the occurrence of differential
sticking as observed for several wells in the Mishrif Formation.
The Mishrif Formation has a narrow mud weight window conditions between collapse
failure and differential sticking.
Adhering to the minimum mud weight predicted by the Mogi-Coulomb failure
criterion reduces the likelihood of wellbore collapse and also limits the potential for
differential sticking in the E oilfield in the Mishrif Formation.
The MPD approach reduces the initial mud weight from 9.16-10.17 ppg to 8.2-8.4
ppg and adjusting the dynamic bottomhole pressure via the dynamic surface back
pressure both the risk of wellbore collapse and differential sticking be mitigated.
97
For the Mishrif Formation the provided surface back pressure enables to maintain
Pc < BHP < Pds (i.e., when the rig pumps are OFF PStatic > Pc; however, when the
rig pumps are ON Pc < BHPDynamic < Pds).
The presented MPD approach yields several operational benefits, such as (1) an
increased rate of penetration (compared to conventional drilling); and (2) the ability
for real-time bottom hole pressure management (utilizing a programmable logic
controller and the dynamic annular pressure control (DAPC) facility to adaptively
keep the bottom hole pressure constant by providing the surface back pressure thus
compensating pressure fluctuations while drilling).
The presented case study for the Mishrif Formation also shows that other important
processes during drilling operations such as (1) surge and swab related pressure
fluctuations can be safely handled using MPD; and (2) hole cleaning efficiency for
average is maintained at 90% using MPD.
The presented image processing approach provides an improved method to
quantitatively determine the geometry (i.e. the area) of the wellbore collapse based
on the applied failure criterion.
The method shows a good agreement with breakout depths obtained from caliper
logs from the Mishrif and Zubair Formations in Southern Iraq.
By integrating the image processing approach to the geomechanical input
parameters obtained from a dynamic MEM, image processing has the potential to
be used as a proactive geo-drilling approach, which helps in avoiding severe
collapse failure and decreasing associated uncertainties and non-productive time.
98
This approach can help the drilling operation engineers in evaluating the mud
weight effect on stuck pipe problems in real-time based on the estimated collapse
volume and the drilling system hole cleaning efficiency.
This, in turn, could lead to design criteria to select mud properties to achieve the
desired degree of hole quality for running modern completions. In addition,
knowledge of the collapse volume provides better estimates on the required mud
and cement volumes.
4.2. RECOMMENDATIONS
The main objective of this work is to mitigate the differential sticking and stuck
pipe problems in Mishrif formation in field E. To achieve that, a real-time proactive
drilling system is developed to prevent these problems, using the integration between
MEM., MPD, and image processing approach. The future academic research potentials are
outlined to extend the current research in the following points:
Using the Mishrif Formation field core data to construct the geomechanical model.
Include the thermal and chemical effect in the Mishrif Formation mechanics earth
modeling to boast the results precision.
Improve the real-time geomechanical model presented in this work to develop an
event triggering system while drilling.
99
REFERENCES
Aadnoy, B.S., 1989. Stresses around horizontal boreholes drilled in sedimentary rocks. J.
Petrol. Sci. Eng. 2, 349–360.
Aadnoy, B.S., Kaarstad, E., Belayneh, M., 2012. Casing Depth Selection Using Multiple
Criteria. In: IADC/SPE Drilling Conference and Exhibition, 6-8 March, San Diego,
California, USA. doi:10.2118/150931-MS
Aadnoy, B.S., Looyeh, R., 2011. Petroleum Rock Mechanics Drilling Operations and Well
Design, first ed. Gulf Professional Pub, Oxford.
Aadnøy, B.S., Society of Petroleum Engineers (U.S.), 2009. Advanced drilling and well
technology. Richardson, TX: Society of Petroleum Engineers.
Al-Ajmi, A.M., Zimmerman, R.W., 2005. The relation between the Mogi and the Coulomb
failure criteria. Int. J. Rock Mech. Min. Sci. 42, 441–439.
Al-Ajmi, A.M., Zimmerman, R.W., 2009. A new well path optimization model for
increased mechanical borehole stability. J. Petrol. Sci. Eng. 2006 (69), 53–62.
Aqrawi, A.A.M., Goff, J.C., Horbury, A.D., Sadooni, F.N. 2005. The petroleum geology
of Iraq, first ed. Scientilic Press Ltd.
Asgharzadeh Shishavan, R., Hubbell, C., Perez, H., Hedengren, J., Pixton, D., 2015.
Combined Rate of Penetration and Pressure Regulation for Drilling Optimization by
Use of High-Speed Telemetry. J. SPE. doi:10.2118/170275-PA
Atiunson, A., Pointer, R., 1975. Logging Services Used for Large Diameter Boreholes.
Society of Petrophysicists and Well-Log Analysts.
Azim, S.A., Mukherjee, P., Al-Anezi, S.A., Al-Otaibi, B., Al-Saad, B., Perumalla, S.V.,
Babbington, J.F., 2011. Using an integrated geomechanical study to resolve expensive
wellbore stability problems while drilling through the Zubair shale/sand sequence of
Kuwait: a case study. In: SPE/IADC Middle East Drilling and Technology Conference
and Exhibition, Muscat, Oman, 24–26 October 2011. https://doi.org/ 10.2118/148049-
MS.
Babbington, J.F., 2011. Using an integrated geomechanical study to resolve expensive
wellbore stability problems while drilling through the Zubair shale/sand sequence of
Kuwait: a case study. In: SPE/IADC Middle East Drilling and Technology Conference
and Exhibition, Muscat, Oman, 24–26 October 2011. https://doi.org/10.2118/148049-
MS.
Barton, C.A., Zoback, M.D., Burns, K.L., 1988. In situ stress orientation and magnitude at
the Fenton Geothermal site, New Mexico, determined from wellbore breakouts.
Geophysical Research Letters, 15(5), pp. 467–470.
100
Bell, J.S., 1990. Investigating stress regimes in sedimentary basins using information from
oil industry wireline logs and drilling records. In: Hurst, A., Lovell, M., Morton, A.
(Eds.), Geological Applications of Wireline Logs, Geol. Soc. Lond. Spec. Publ, vol. 48,
pp. 305–325.
Bell, J.S., Babcock, E.A., 1986. The stress regime of the Western Canadian basin and
implications for hydrocarbon production. Bull. Can. Petrol. Geol. 34 (3), 364–378.
September.
Bell, J.S., Gough, D.I., 1979. Northeast-southwest compressive stress in Alberta: Evidence
from oil wells. Earth Planet. Sci. Lett., 45, pp. 475–482.
Bourgoyne, A.T., Young, F.S.Jr., 1974. A Multiple Regression Approach to Optimal
Drilling and Abnormal Pressure Detection. J. SPE, August 1974 371-384; Trans.,
AIME 257.
Bourgoyne, Jr.A., Chenevert, M., Millheim, K., Young, Jr.F.S., 1991. Applied Drilling
Engineering. SPE Textbook Series, Vol. 2.
Carlsen, L.A., Rolland, N.L., Nygaard, G., Time, R.W., 2013. Simultaneous Continuous
Monitoring of the Drilling-Fluid Friction Factor and Density. J. SPE.
doi:10.2118/163101-PA.
Chang, C., Zoback, M.D., Khaksar, A., 2006. Empirical relations between rock strength
and physical properties in sedimentary rocks. J. Petrol. Sci. Eng. 51 (3–4), 223–237.
Chatterjee, R., Mukhopadhyay, M., 2003. Numerical Modelling of Stress Around a
Wellbore. In: SPE Asia Pacific Oil and Gas Conference and Exhibition, 9-11 September,
Jakarta, Indonesia. doi:10.2118/80489-MS.
Cheatham, J.B., 1984. Wellbore Stability. J. SPE. doi:10.2118/13340-PA.
Cheathem, C.A., Nahm, J.J., Heitkamp, N.D., 1985. Effects of Selected Mud properties on
Rate of Penetration in Full-Scale Shale Drilling Simulations. In: SPE/IADC Drilling
Conference, 5-8 March, New Orleans, Louisiana. https://doi.org/10.2118/13465-MS
Chin, W.C., 2012. Managed Pressure Drilling - Modeling, Strategy and Planning. Elsevier
Science.
Das, B., Chatterjee, R., 2017. Wellbore stability analysis and prediction of minimum mud
Demirdal, B., Cunha, J.C., 2009. Importance of Drilling Fluids’ Rheological and
Volumetric Characterization to Plan and Optimize Managed Pressure Drilling
Operations. J. Can. Petrol. Tech. doi:10.2118/09-02-08-TB.
101
Duan, M., Miska, S.Z., Yu, M., Takach, N.E., Ahmed, R.M., Zettner, C.M., 2008.
Transport of Small Cuttings in Extended-Reach Drilling. J. SPE. doi:10.2118/104192-
PA.
Dupriest, F.E., Witt, J.W., Remmert, S.M., 2005. Maximizing ROP with Real-Time
Analysis of digital Data and MSE. In: International Petroleum Technology Conference,
21-23 November, Doha, Qatar. doi.org/10.2523/IPTC-10607-MS.
Escobar, R.G., Carrillo, Z.H.C., Peña, Y.A.Q., 2014. New Approach for Estimating
Cavings Volume to Avoid Wellbore Instabilities. In: ISRM Conference on Rock
Mechanics for Natural Resources and Infrastructure - SBMR 2014, 9-13 September,
Goiania, Brazil.
Ewy, R.T., 1999. Wellbore-stability Predictions by Use of a Modified Lade Criterion.
Society of Petroleum Engineers. https://doi.org/10.2118/56862-P.
Fjaer, E., 1992. Petroleum Related Rock Mechanics, second ed. Elsevier, Amsterdam.
Fjaer, E., Holt, R.M., Horsrud, P., Raaen, A.M., Risnes, R. 2008. Petroleum related rock
mechanics, second ed. Elsevier Science, Amsterdam.
Foster, J.K., Steiner, A., 2007. The Use of MPD and an Unweighted Fluid System for
Drilling ROP Improvement. In: 2007 IADC/SPE Managed Pressure Drilling and
Underbalanced Operations Conference and Exhibition held in Galveston, Texas,
28–29 March. doi:10.2118/108343-MS.
Gholami, R., Maleki, S., Moradzadeh, A., Rasouli, V., Hanachi, J., 2014. Practical
application of failure criteria in determining safe mud weight windows in drilling
operations. J. Rock Mech. Geotech. Eng. 6, 13–25.
Gholami, R., Rabiei, M., Rasouli, V., Aadnoy, B., Fakhari, N., 2015. Application of
quantitative risk assessment in wellbore stability analysis. J. Petrol. Sci. Eng. 135,
185–200. ISSN 0920-4105. https://doi.org/10.1016/j.petrol.2015.09.013.
Godhavn, J.M., 2010. Control Requirements for Automatic Managed Pressure Drilling
System. J. SPE. doi:10.2118/119442-PA.
Goodman, H.E., Connolly, P., 2007. Reconciling Subsurface Uncertainty with the
Appropriate Well Design Using the Mechanical Earth Model (MEM) Approach. In:
Nigeria Annual International Conference and Exhibition, 6-8 August, Abuja, Nigeria.
doi:10.2118/111913-MS.
Gravdal, J.E., Nikolaou, M., Breyholtz, Ø., Carlsen, L.A., 2010. Improved Kick
Management During MPD by Real-Time Pore-Pressure Estimation. J. SPE.
doi:10.2118/124054-PA.
102
Hannegan, D., 2011. MPD - Drilling Optimization Technology, Risk Management Tool,
or Both?. In: SPE Annual Technical Conference and Exhibition, location, Denver,
Colorado, USA, 30 October–2 November. https://doi.org/10.2118/146644-MS.
Herrick, C.G., Haimson, B.C., 1994. Modeling of Episodic Failure Leading to Borehole
Breakouts in Alabama Limestone. 1st North American Rock Mechanics Symposium, 1-
3 June, Austin, Texas.
Hooft van Huysduynen, T., Ames, S.P., Tierney, W., Verspoor, R., 2014, November 10.
Flawless Startups in Iraq - Majnoon Oil Field achieves First Commercial Production.
Society of Petroleum Engineers. https://doi.org/10.2118/171912-MS.
Howard, J.A., Glover, S.B., 1994. Tracking Stuck Pipe Probability While Drilling. In:
SPE/IADC Drilling Conference, 15-18 February, Dallas, Texas. doi:10.2118/27528-
MS.
Imtiaz, S., Perumalla, S., Hynes, L., Basu, P., Shinde, A., Benmamar, S., … Sherbeny,
W.E., 2017. Delivering Value Through Advanced Geomechanics in Complex Drilling
Environments: From Well Planning to Real-Time. In: Abu Dhabi International
Petroleum Exhibition & Conference, 13-16 November, Abu Dhabi, UAE.
https://doi.org/10.2118/188397-MS.
Jarosinski, M., 1998. Contemporary stress field distortion in the Polish part of the
Western Outer Carpathians and their basement. Tectonophysics 297 (1–4), 91–119,
20, ISSN 0040-1951.
Jassim, S.Z., Goff, J.C., 2006. Geology of Iraq, first ed. Dolin, Prague.
Kaasa, G., Stamnes, Ø.N., Aamo, O.M., Imsland, L.S., 2012. Simplified Hydraulics Model
Used for Intelligent Estimation of Downhole Pressure for a Managed-Pressure-Drilling
Control System. J. SPE. doi:10.2118/143097-PA.
Kang, Y., Yu, M., Miska, S.Z., and Takach, N., 2009. Wellbore Stability: A Critical
Review and Introduction to DEM. In: SPE Annual Technical Conference and
Exhibition, 4-7 October, New Orleans, Louisiana. doi:10.2118/124669-MS.
Kaushik, Y.D., Baishya, R.C., Majithia, P.P.S., Bagchi, D., Pratap, M., Kumar, R., Singh,
H., 2016. Reducing Drilling Risks in ERD Wells Through Geomechanical Solutions. In:
SPE Annual Technical Conference and Exhibition, 26-28 September, Dubai, UAE.
doi:10.2118/181399-MS.
Kirsch, G. (1898). “Die Theorie der Elastizitat und die Bedurfnisse der Festigkeitslehre,
Zeitschrift des Verlines Deutscher Ingenieure.” 42, 707.
Kristiansen, T.G., 2007. Drilling wellbore stability in the compacting and subsiding Valhall
field: a case study. J. SPE Drill. Complet. 277–295. https://doi.org/10.2118/87221-PA.
103
Kulikov, S., Veliev, G., Chumachenko, A., Shilkin, P., 2014. Managed Pressure Drilling
Advances Well Construction with Enhanced Hazard Mitigation. SPE Russian Oil and
Gas Exploration and Production Technical Conference and Exhibition, 14-16 October,
Moscow, Russia. doi:10.2118/171288-MS.
Li, J., Walker, S., 2001. Sensitivity Analysis of Hole Cleaning Parameters in Directional
Wells. J. SPE. doi:10.2118/74710-PA.
Li, X., El-Mohtar, C., Gray, K., 2017. Investigation of Wellbore Breakouts in Deviated
Wells - a 3D Numerical Modeling Approach. 51st U.S. Rock Mechanics/Geomechanics
Symposium, 25-28 June, San Francisco, California, USA.
Lubinski, A., Hsu, F.H., Nolte, K.G., 1977. Transient Pressure Surges Due to Pipe
Movement in an Oil Well. J. Oil and Gas Sci. and Tech., 32(3) 307–348.
Maleki, S., Gholami, R., Rasouli, V., Moradzadeh, A., 2014. Comparison of different
failure criteria in prediction of safe mud weigh window in drilling practice. Earth Sci.
Rev. 136, 36–58. ISSN 0012-8252.
Malloy, K., Shayegi, S., 2010. UBD or MPD: An Engineering Choice Based on Intent. In:
SPE/IADC Managed Pressure Drilling and Underbalanced Operations Conference and
Exhibition, 24-25 February, Kuala Lumpur, Malaysia. https://doi.org/10.2118/130563-
MS.
Mastin, L., 1988. Effect of borehole deviation on breakout orientations. J. Geophys. Res.
93 (B8), 9187–9195. https://doi.org/10.1029/JB093iB08p09187.
McSpadden, A.R., Coker, O.D., Ruan, G.C., 2012. Advanced Casing Design With Finite-
Element Model of Effective Dogleg Severity, Radial Displacements, and Bending
Loads. J. SPE. doi:10.2118/141458-PA.
Mitchell, R.F., 1988. Dynamic Surge/Swab Pressure Predictions. J. SPE.
doi:10.2118/16156-PA.
Mitchell, R.F., Miska, S.Z., 2017. Fundamentals of drilling engineering. Society of
Petroleum Engineers.
Modine, J.D., 2009. American Petroleum Institute Handbook. American Petroleum
Institute.
Mody, F. K., Hale, A. H., 1993. Borehole-Stability Model to Couple the Mechanics and
Chemistry of Drilling-Fluid/Shale Interactions. J. SPE. doi:10.2118/25728-PA.
Moos, D., Barton, C.A., Willson, S., 2007. Impact of Rock Properties on the Relationship
Between Wellbore Breakout Width and Depth. 1st Canada - U.S. Rock Mechanics
Symposium, 27-31 May, Vancouver, Canada.
104
Moos, D., Zoback, M.D., 1990. Utilization of observations of well bore failure to constrain
the orientation and magnitude of crustal stresses: application to continental, Deep Sea
Drilling Project, and Ocean Drilling Program boreholes. J. Geophys. Res. 95 (B6),
9305–9325. https://doi.org/10.1029/JB095iB06p09305.
Moos, D.B., Peska, P., Ward, C.D., Wiprut, D.J., 2003. Determination of stress orientation
and magnitude in deep wells. Int. J. Rock Mech. Min. Sci. 40, 1049–1076.
Moosavinia, M., Parker, M., Alexandrov, V., Palenov, M., 2016. Intelligent Control for
MPD. In: SPE/IADC Managed Pressure Drilling and Underbalanced Operations
Conference and Exhibition, 12-13 April, Galveston, Texas, USA.
https://doi.org/10.2118/180069-MS.
Nauduri, A.S.S., Medley, G.H., Schubert, J.J., 2009. MPD: Beyond Narrow Pressure
Windows. In: IADC/SPE Managed Pressure Drilling and Underbalanced Operations
Conference & Exhibition, 12-13 February, San Antonio, Texas. doi:10.2118/122276-
MS.
Nauduri, S., Medley, G., 2010. MPD Candidate Identification: To MPD or Not To MPD.
In: SPE/IADC Managed Pressure Drilling and Underbalanced Operations Conference
and Exhibition, 24-25 February, Kuala Lumpur, Malaysia.
https://doi.org/10.2118/130330-MS.
Nguyen, T.C., de Oliveira, R., Al-Safran, E., Saasen, A., 2017. Casing-Design
Optimization With CAML Technique and Drilling-Fluid Performance. J. SPE.
doi:10.2118/185951-PA.
Numbere, O., Okoli, U., (2014. The Importance of Geomechanical Analysis for Well
Design and Engineering. In: SPE Nigeria Annual International Conference and
Exhibition, 5-7 August, Lagos, Nigeria. doi:10.2118/172387-MS.
Ozbayoglu, M.E., Sorgun, M., Saasen, A., Svanes, K., 2010. Hole Cleaning Performance
of Light-Weight Drilling Fluids During Horizontal Underbalanced Drilling. Journal of
J. Can. Petrol. Tech. doi:10.2118/136689-PA.
Patel, B., Grayson, B., Gans, H., 2013. Optimized Unconventional Shale Development
With MPD Techniques. IADC/SPE Managed Pressure Drilling and Underbalanced
Operations Conference and Exhibition, 17-18 April, San Antonio, Texas, USA.
doi:10.2118/164565-MS.
Peska, P., Zoback, M.D., 1995. Compressive and tensile failure of inclined well bores and
determination of in situ stress and rock strength. J. Geophys. Res. Atmos. 100 (B7),
12791 https://doi.org/10.1029/95JB00319.
PevsKa, P., Zoback, M.D., July 1995. Compressive and tensile failure of inclined well
bores and determination of in situ stress and rock strength. J. Geophys. Res. Atmos. 100
(B7), 12791 https://doi.org/10.1029/95JB00319.
105
Plumb, R.A., 1994. Influence of composition and texture on the failure properties of clastic
rocks. In: Eurocks 94, Rock Mechanics in Petroleum Engineering Conference, pp. 13–
20.
Rahimi, R., Nygaard, R., 2015. Comparison of rock failure criteria in predicting borehole
shear failure. Int. J. Rock Mech. Min. Sci. 79, 29–40.
Rehm, B., Schubert, J., Haghshenas, A., Paknejad, A., Hughes, J., 2008. Managed Pressure
Drilling, first ed. Gulf Publishing Company, Houston.
Salminen, K., Cheatham, C., Smith, M., Valiullin, K., 2017. Stuck-Pipe Prediction by Use
of Automated Real-Time Modeling and Data Analysis. J. SPE. doi:10.2118/178888-PA.
Samuel, G.R., Bajwa, F., Franklin, M., LeBlanc, J., 2002. Model Accurately Predicts
Intermediate Casing-Run Surge Pressure in Marlin SS-1 Well. J. Oil and Gas, 16 (7c).
Samuel, R., Lovorn, R., 2016. Swab and Surge Pressures with Reservoir Fluid Influx
Condition during MPD. In: IADC/SPE Drilling Conference and Exhibition, 1-3 March,
Fort Worth, Texas, USA. doi:10.2118/178881-MS
Santos, H.M., Catak, E., Kinder, J.I., Nogueira, E.F., Lage, A.C.V.M., Sonnemann, P.,
2007. First Field Applications of Microflux Control Show Very Positive Surprises.
IADC/SPE Managed Pressure Drilling & Underbalanced Operations, 28-29 March,
Galveston, Texas, USA. doi:10.2118/108333-MS.
Schroeter, D.R., Chan, H.W., 1989. Successful Application of Drilling Technology
Extends Directional Capability. J. SPE Drilling Engineers, 4 (3) 230-236. doi:
10.2118/17660-PA.
Sifferman, T.R., Becker, T.E., 1992. Hole Cleaning in Full-Scale Inclined Wellbores. J.
SPE. doi:10.2118/20422-PA.
Smith, J.R., Patel, B.M., 2012. A Proposed Method for Planning the Best Initial Response
to Kicks Taken During Managed-Pressure-Drilling Operations. J. SPE.
doi:10.2118/143101-PA.
Stewart, G., Wittmann, M., 1979. Interpretation of the Pressure Response of the Repeat
Formation Tester. Society of Petroleum Engineers, pp. 230–236.
https://doi.org/10.2118/8362-MS.
Sugden, C., Bacon, W., Gabaldon, O.R., Borges, J.U.A., Soares, C.M., Falcao, J.L.,
…Chita, L.C., 2014. Real-Time Casing-Design Optimization: A Case Study in the Use
of Managed-Pressure Drilling To Develop an Adaptive Well Design and Eliminate
Casing Strings on a Deepwater Exploration Well. J. SPE. doi:10.2118/168028-PA.
Teale, R., 1965. The concept of specific energy in rock drilling, International Journal of
Rock Mechanics and Mining Sciences and Geomechanics Abstracts, 2 (1) 57-73.
doi.org/10.1016/0148-9062(65)90022-7.
106
Tian, S., Medley, G., Stone, C.R., 2007. Parametric Analysis of MPD Hydraulics. In:
IADC/SPE Managed Pressure Drilling and Underbalanced Operations, 28-29 March,
Galveston, Texas, USA. doi.org/10.2118/108354-MS.
Tingay, M., Bentham, P., De Feyter, A., Kellner, A., May 2011. Present-day stress field
rotations associated with evaporites in the offshore Nile Delta. Geol. Soc. Am. Bull. 123
(5–6), 1171–1180. https://doi.org/10.1130/B30185.1.
Torres, M.E., Gonzalez, A.J., Last, N.C., 2003. In-situ stress state eastern Cordillera
(Colombia). In: SPE Latin American and Caribbean Petroleum Engineering Conference
Held in Port-of-Spain, Trinidad, West Indies, 27–30 April 2003.
https://doi.org/10.2118/81074-MS.
Torres, M.E., Gonzalez, A.J., Last, N.C., 2003. In-situ stress state eastern Cordillera
(Colombia). In: SPE Latin American and Caribbean Petroleum Engineering Conference
Held in Port-of-Spain, Trinidad, West Indies, 27–30 April 2003. https://
doi.org/10.2118/81074-MS.
Udegbunam, J.E., Fjelde, K.K., Evje, S., Nygaard, G., 2015. On the Advection-Upstream-
Splitting-Method Hybrid Scheme: A Simple Transient-Flow Model for Managed-
Pressure-Drilling and Underbalanced-Drilling Applications. J. SPE.
doi:10.2118/168960-PA.
Vega, M.P., Oliveira, G.F., Fernandes, L.D., Martins, A.L., 2018. Monitoring and control
strategies to manage pressure fluctuations during oil well drilling, J. Petrol. Sci. Eng.,
166 (2018) 337-349. https://doi.org/10.1016/j.petrol.2018.03.048.
Wagner, D., Müller, B., Tingay, M., 2004. Correcting for Tool Decentralization of
Oriented Six-Arm Caliper Logs for Determination of Contemporary Tectonic Stress
Orientation. J. Petrophys., 45 (6), pp. 530-539.
World Stress Map Quality Ranking Scheme for Stress Orientations 2008; available at:
http://dc-app3-14.gfz-potsdam.de/pub/stress_data/stress_data_frame.html.
Wu, B., Chen, Z., Zhang, X., 2016. Stability of Borehole with Breakouts - An Experimental
and Numerical Modelling Study. 50th U.S. Rock Mechanics/Geomechanics
Symposium, 26-29 June, Houston, Texas.
Zajac, B.J., Stock, J.M., 1992. Using borehole breakouts to constrain the complete stress
tensor: results from the Sijan deep drilling project and offshore Santa Maria basin
California. J. Geophys. Res. 102, 10083–10100.
Zambrano, N.P., Bargawi, R., Mutawa, A., Aramco, S., Hadj-Moussa, A., Mazouz, C.,…
Zambrano, R., 2015. The Successful Application of MPD Technology in Drilling
Horizontal Wells in a High Pressure Formation Heterogeneity to Mitigate Drilling
Hazards: Case Study. In: SPE/IADC Managed Pressure Drilling and Underbalanced
Operations Conference & Exhibition, 13-14 April, Dubai, UAE. doi:10.2118/173818-
MS.
107
Zoback, M.D., 2010. Reservoir Geomechanics, first ed. Cambridge University Press,
Cambridge.
Zoback, M.D., Mastin, L., Barton, C.A., 1986. In-situ Stress Measurements in Deep
Boreholes Using Hydraulic Fracturing, Wellbore Breakouts, and Stonely Wave
Polarization. International Society for Rock Mechanics.
Zoback, M.D., Moos, D., Mastin, L.G., Anderson, R.N., 1985. Well bore breakouts and in
situ stress. J. Geophys. Res. 90, 5523–5530.
Zoback, M.D., Peska, P., 1995. In-situ stress and rock strength in the GBRN/DOE
pathfinder well, South Eugene Island, Gulf of Mexico. J. Petrol. Technol. 582–585.
https://doi.org/10.2118/29233-PA.
108
VITA
Ethar Alkamil was born in Basrah, Iraq. He was received B.Sc. and M.Sc. degrees in
mechatronics engineering from University of Baghdad, Baghdad, Iraq, in 2005 and 2008.
After graduating with his BS degree, he worked as a quality control engineer at many
projects. After finishing his Master degree, he worked as a faculty member in the Computer
Engineering department of the Iraq University College, Basrah, Iraq. Finally, he worked as
a faculty member in the Petroleum Engineering department of the University of Basrah,
Basrah, Iraq.
He was granted a Ph.D. scholarship by the Ministry of Higher Education and Scientific
Research in 2013 to study at Missouri S&T. He has been a member of many professional
organizations, such as International Association of Drilling Contractors (IADC), 2017;
Center for Chemical Process Safety (CCPS), 2017; American Institute of Chemical
Engineers (AIChE), 2017; American Association of Rock Mechanics (ARMA); 2017;
Society of Exploration and Geophysics (SEG), 2017; American Association For Drilling
Engineers (AADE), 2015; Society of Petroleum Engineering (SPE), 2014; International
Electrical Electronics Engineers (IEEE), 2005; American Society of Mechanical Engineers
(ASME), 2005; and Iraqi Engineers Union (IEU), 2005.
He received hid Ph.D. in petroleum engineering from Missouri University of Science
and Technology, Rolla, MO, in December 2018. His research interests included
constructing geomechanical models; performing real time drilling data and MPD analysis,
assessment and control; and achieving greater wellbore stability. This work has been
extended into new areas such as drilling automation and control and machine learning. He
has published a number of journal and conference papers in these research areas.
Related Documents