DOI: 10.1542/peds.2007-1365 2008;121;e794-e802 Pediatrics Vander Veur, Joan Nachmani, Allison Karpyn, Shiriki Kumanyika and Justine Shults Gary D. Foster, Sandy Sherman, Kelley E. Borradaile, Karen M. Grundy, Stephanie S. A Policy-Based School Intervention to Prevent Overweight and Obesity http://www.pediatrics.org/cgi/content/full/121/4/e794 located on the World Wide Web at: The online version of this article, along with updated information and services, is rights reserved. Print ISSN: 0031-4005. Online ISSN: 1098-4275. Grove Village, Illinois, 60007. Copyright © 2008 by the American Academy of Pediatrics. All and trademarked by the American Academy of Pediatrics, 141 Northwest Point Boulevard, Elk publication, it has been published continuously since 1948. PEDIATRICS is owned, published, PEDIATRICS is the official journal of the American Academy of Pediatrics. A monthly at Univ of California on February 11, 2009 www.pediatrics.org Downloaded from

Welcome message from author
This document is posted to help you gain knowledge. Please leave a comment to let me know what you think about it! Share it to your friends and learn new things together.
Transcript
DOI: 10.1542/peds.2007-1365 2008;121;e794-e802 Pediatrics
Vander Veur, Joan Nachmani, Allison Karpyn, Shiriki Kumanyika and Justine Shults Gary D. Foster, Sandy Sherman, Kelley E. Borradaile, Karen M. Grundy, Stephanie S.
A Policy-Based School Intervention to Prevent Overweight and Obesity
http://www.pediatrics.org/cgi/content/full/121/4/e794located on the World Wide Web at:
The online version of this article, along with updated information and services, is
rights reserved. Print ISSN: 0031-4005. Online ISSN: 1098-4275. Grove Village, Illinois, 60007. Copyright © 2008 by the American Academy of Pediatrics. All and trademarked by the American Academy of Pediatrics, 141 Northwest Point Boulevard, Elkpublication, it has been published continuously since 1948. PEDIATRICS is owned, published, PEDIATRICS is the official journal of the American Academy of Pediatrics. A monthly
at Univ of California on February 11, 2009 www.pediatrics.orgDownloaded from
ARTICLE
A Policy-Based School Intervention to PreventOverweight and ObesityGary D. Foster, PhDa, Sandy Sherman, EdDb, Kelley E. Borradaile, PhDa, Karen M. Grundy, MA, MSEdc, Stephanie S. Vander Veur, MPHa,
Joan Nachmani, MS, CNS, SFNSd, Allison Karpyn, PhDb, Shiriki Kumanyika, PhD, MPHe, Justine Shults, PhDe
aCenter for Obesity Research and Education, Temple University, Philadelphia, Pennsylvania; bThe Food Trust, Philadelphia, Pennsylvania; cDepartment of ClinicalDevelopmental Psychology, Bryn Mawr College, Bryn Mawr, Pennsylvania; dDepartment of Health, Physical Education, Safety and Sports Administration, School Districtof Philadelphia, Philadelphia, Pennsylvania; eDepartment of Biostatistics and Epidemiology, University of Pennsylvania, Philadelphia, Pennsylvania
The authors have indicated they have no financial relationships relevant to this article to disclose.
What’s Known on This Subject
The increasing prevalence and consequences of childhood obesity have prompted callsfor broad public health solutions that reach beyond clinic settings. Schools are idealsettings for population-based interventions. Despite their intuitive appeal, the results forschool-based interventions are mixed.
What This Study Adds
This study has several distinctive features: (1) it is a school-based intervention that iscommunity originated, (2) the population is composed of fourth- to sixth-graders froma low socioeconomic status, and (3) the program is effective and particularly so forblacks.
ABSTRACT
BACKGROUND. The prevalence and seriousness of childhood obesity has prompted callsfor broad public health solutions that reach beyond clinic settings. Schools are idealsettings for population-based interventions to address obesity.
OBJECTIVE. The purpose of this work was to examine the effects of a multicomponent,School Nutrition Policy Initiative on the prevention of overweight (85.0th to 94.9thpercentile) and obesity (�95.0th percentile) among children in grades 4 through 6over a 2-year period.
METHODS. Participants were 1349 students in grades 4 through 6 from 10 schools in aUS city in the Mid-Atlantic region with �50% of students eligible for free orreduced-price meals. Schools were matched on school size and type of food serviceand randomly assigned to intervention or control. Students were assessed at baselineand again after 2 years. The School Nutrition Policy Initiative included the followingcomponents: school self-assessment, nutrition education, nutrition policy, socialmarketing, and parent outreach.
RESULTS. The incidences of overweight and obesity after 2 years were primary out-comes. The prevalence and remission of overweight and obesity, BMI z score, totalenergy and fat intake, fruit and vegetable consumption, body dissatisfaction, andhours of activity and inactivity were secondary outcomes. The intervention resultedin a 50% reduction in the incidence of overweight. Significantly fewer children inthe intervention schools (7.5%) than in the control schools (14.9%) became over-weight after 2 years. The prevalence of overweight was lower in the interventionschools. No differences were observed in the incidence or prevalence of obesity or inthe remission of overweight or obesity at 2 years.
CONCLUSION.A multicomponent school-based intervention can be effective in preventing the development of over-weight among children in grades 4 through 6 in urban public schools with a high proportion of children eligible forfree and reduced-priced school meals.
THE INCREASING PREVALENCE and serious consequences of childhood obesity have prompted calls for broad publichealth solutions that reach beyond clinic settings.1 Schools are ideal settings for population-based interventions
to address obesity.2,3 Children spend approximately half of their waking hours in school. Schools provide 1 to 2 mealsdaily and are a natural setting for education about healthy food choices. Despite their intuitive appeal, the results forschool-based interventions have been mixed. Although some school-based programs have had favorable effects onBMI,4–6 many have not.7–9 The reason for this is unknown but may include an insufficient dose, barriers to effectiveimplementation, the inability to effectively target children at highest risk, and that the behaviors targeted byinterventions may not relate directly to body weight. Nearly all of the interventions tested have been developedand/or implemented by university-based teams. Few studies have examined the effects of school-based programs thathave originated in the community. Also, as Doak et al10 note, few studies have examined the possible adverse effects
www.pediatrics.org/cgi/doi/10.1542/peds.2007-1365
doi:10.1542/peds.2007-1365
KeyWordschildren and adolescents, communitypediatrics, obesity, population-basedstudies, school-based program
AbbreviationsSNPI—School Nutrition Policy InitiativeCDC—Centers for Disease Control andPreventionGEE—generalized estimating equationMI—multiple imputationOR—odds ratioCI—confidence interval
Accepted for publication Aug 30, 2007
Address correspondence to Gary D. Foster,PhD, Center for Obesity Research andEducation, Temple University, 3223 N Broad St,Suite 175, Philadelphia, PA 19140. E-mail:[email protected]
PEDIATRICS (ISSN Numbers: Print, 0031-4005;Online, 1098-4275). Copyright © 2008 by theAmerican Academy of Pediatrics
e794 FOSTER et al at Univ of California on February 11, 2009 www.pediatrics.orgDownloaded from
of obesity prevention programs, such as worsening bodyimage or decreases in BMI z scores among those who arenormal weight or underweight.
The purpose of this study was to examine the effectsof a multicomponent School Nutrition Policy Initiative(SNPI) on the prevention of overweight and obesityamong children in grades 4 through 6 over a 2-yearperiod. Given the disproportionately high rates of obe-sity among children in lower socioeconomic statusgroups,11 the study was implemented in schools that had�50% of children eligible for federally subsidized, free,or reduced-price meals.
METHODS
Study DesignThe study was conducted in 10 schools in the SchoolDistrict of Philadelphia. Schools were the unit of ran-domization and intervention. Ten schools were selectedfrom among 27 Kindergarten through eighth gradeschools with �50% of students eligible for free or re-duced-price meals. To obtain pairs of 2 schools per clus-ter, the 27 schools were first organized into 5 clusters of4 to 7 schools each, based on school size and type of foodservice (eg, full service [2 clusters] or heat and serve [3clusters]). Schools within each cluster were approachedto participate in a predetermined, random order. When2 schools in each cluster agreed to participate, theschools were randomly assigned as intervention or con-trol schools. A total of 12 schools were approached; 2declined and 10 were enrolled. Within schools, writtenparental consent and child assent were required for in-dividual children to participate. The study was approvedby the University of Pennsylvania Institutional ReviewBoard.
InterventionThe SNPI was developed and delivered by The FoodTrust, a community-based organization, and was fundedby the US Department of Agriculture Food Stamp Nu-trition Education Program. A task force was developed,which devoted a year to discerning how best to adapt theCenters for Disease Control and Prevention (CDC)Guidelines to Promote Lifelong Healthy Eating andPhysical Activity12 to meet the needs of the Philadelphiaschool district. Committees were established to makerecommendations on the CDC guidelines and to workwith the Food Services Division, which operates foodservices in all Philadelphia public schools, to remove allsodas, sweetened drinks, and snacks that did not meetthe standards set by the committee (see below in nutri-tion policy) from the vending machines and the cafeterialine. All of the schools were under the direction of thedistrict’s Food Service Division, which agreed to makethe necessary changes in the intervention schools, whilemaking no changes to the control schools.
The SNPI included the following components: (1)school self-assessment; (2) nutrition education; (3) nu-trition policy; (4) social marketing; and (5) parent out-reach. Each component is described briefly below. A
more detailed description of the intervention is availableat www.thefoodtrust.org.
Self-AssessmentSchools assessed their environments by using the CDCSchool Health Index.13 Each school formed a NutritionAdvisory Group to guide the assessment. Teams includedadministrators, teachers, nurses, coaches, and parents.After completing ratings on healthy eating and physicalactivity, schools developed an action plan for change.Schools proposed various strategies, such as limiting theuse of food as reward, punishment, or for fundraising;promoting active recess; and serving breakfast in class-rooms to increase the number of students eating ahealthy breakfast.
Staff TrainingAll of the school staff in the intervention schools wereoffered �10 hours per year of training in nutrition ed-ucation. At these trainings, staff received curricula andsupporting materials such as Planet Health4 and KnowYour Body,14 as well as nutrition and physical activitytheme packets designed to integrate classroom lessons,cafeteria promotions, and parent outreach. Staff at-tended trainings both across and in intervention schools,giving them a chance to work together as a team and toshare ideas with their counterparts in other interventionschools.
Nutrition EducationThe goal was to provide 50 hours of food and nutritioneducation per student per school year, which was basedon the National Center for Education Statistics guide-lines.15 The educational component was designed to beintegrative and interdisciplinary. Its purpose was toshow how food choices and physical activity are tied topersonal behavior, individual health, and the environ-ment. Nutrition was integrated into various classroomsubjects. For example, students used food labels to prac-tice fractions and nutrition topics for writing assign-ments.
Nutrition PolicyIn each of the intervention schools, all of the foods soldand served were changed to meet the following nutri-tional standards, which were based on the DietaryGuidelines for Americans and converted from the per-centage of calories to grams per serving,16 which is inalignment with information shown on nutrition labels:all of the beverages were limited to 100% juice (recom-mended 6-oz serving size), water (no portion limits), andlow-fat milk (recommended 8-oz serving size). Snackstandards allowed �7 g of total fat, 2 g of saturated fat,360 mg of sodium, and 15 g of sugar per serving. Beforethese changes, soda, chips, and other drinks and snackshad been sold in vending machines and a la carte in thecafeteria of schools with full-service kitchens. Schoolswithout full-service kitchens did not sell a la carte fooditems or have vending machines. Schools were matched
PEDIATRICS Volume 121, Number 4, April 2008 e795 at Univ of California on February 11, 2009 www.pediatrics.orgDownloaded from
by type of food service to control for differences in thesales of vending and a la carte items.
Social MarketingThe SNPI used several social marketing techniques. Toincrease meal participation and consumption of healthysnack and beverage items, students who purchasedhealthy snacks and beverages or who brought in snackitems that met the nutritional standards from home orlocal stores received raffle tickets. Raffle winners re-ceived prizes for healthy eating, such as bicycles, indoorbasketball hoops, jump ropes, and calculators. The mes-sage “Want Strength?. . .Eat Healthy Foods,” paired withan easily recognizable character, reinforced healthy mes-sages through incentives and frequent exposure. Boththe slogan and the character were developed throughfocus groups with students who were not in the studyschools but were of similar age, ethnicity, and socioeco-nomic status.
Family OutreachNutrition educators reached family members throughhome and school association meetings, report cardnights, parent education meetings, and weekly nutritionworkshops. They encouraged parents and students, onthe way to and from school, to purchase healthy snacks.Students participated in the 2-1-5 challenge to be lesssedentary (�2 hours per day of television and videogames), to be more physically active (�1 hour per day),and to eat more fruits and vegetables (�5 per day).Intervention schools reduced the amount of unhealthyfoods sold at parent fundraisers and discouraged parentsfrom sending sweets to teachers at holiday time. Oneschool chose to have a weekly breakfast club with femaleathletes from a local university.
OutcomesMeasurements were collected at baseline in the springsemester and again at year 2 in the spring semester.Interim weight data were collected in the spring semes-ter of year 1. Return visits were scheduled within 1month to reach absent students. Race/ethnicity datawere self-reported by each child and were collected toassess potential interaction effects with the intervention,as well as to examine the disproportionate prevalence ofoverweight and obesity.
Weight and HeightHeights and weights were measured annually on a dig-ital scale and wall-mounted stadiometer by a trainedresearch team with a standardized protocol. The teamwas not blinded to treatment condition, because socialmarketing materials were in the intervention schools.BMI z scores and percentiles based on age and genderwere calculated for each student using CDC growthcharts.17 Each participant was classified into 1 of 4 weightcategories as described by the Institute of Medicine1:underweight (BMI for age less than the fifth percentile;n � 23; 2.2%); normal weight (BMI for age from the
fifth to 84.9th percentile; n � 619; 57.9%); overweight(BMI for age from the 85th to 94.9th percentile; n � 182;17.1%); and obese (BMI for age �95th percentile; n �245; 22.9%).
Dietary Intake, Physical Activity, and Sedentary BehaviorDietary intake, specifically total energy consumed (kilo-joules), fat consumption (grams), and the number offruit and vegetable servings, was measured with theYouth/Adolescent Questionnaire, a self-administered152-item food frequency questionnaire, which has beenused to measure dietary intake in previous studies.18,19
Physical activity and sedentary behavior, specificallytelevision viewing, were measured by the Youth/Ado-lescent Activity Questionnaire, a self-administered 24-item questionnaire also used in past research. Total in-activity was calculated by combining all of the 8sedentary behaviors that were assessed in the question-naire. Finally, body image was assessed using the bodydissatisfaction subscale of the Eating Disorder Invento-ry-2 (EDI-2).20
Statistical AnalysisIncidence of overweight and obesity after 2 years (per-centage of subjects who were initially not overweight orobese but who became overweight or obese) was ana-lyzed as a primary outcome, because the goal of theintervention was the prevention of overweight and obe-sity. Prevalence (percentage of subjects who were over-weight or obese) and remission (percentage of subjectswho were overweight or obese at baseline but were notoverweight or obese at follow-up) were analyzed assecondary outcomes. Analyses of overweight and obe-sity were conducted separately. Analyses were also con-ducted after collapsing the overweight and obese cate-gories (�85th percentile). Additional secondary analysesincluded BMI z score, total energy and fat intake, fruitand vegetable consumption, body dissatisfaction, andhours of activity and inactivity, including weekday tele-vision viewing after 2 years.
The generalized estimating equations (GEE) methodwas used to account for the intraclass correlation ofresponses within a school (ie, students within a schoolare more similar than students between schools). Inaddition to individual-level covariates measured at base-line, an indicator variable for each randomization pairwas included in these models as fixed effects to accountfor school matching.21,22 To assess the primary outcomeof incidence and the secondary outcomes of prevalenceand remission, GEE was used to model a binary out-come. These models included race/ethnicity, gender,age, and an indicator of the randomization pair as co-variates. The models predicting prevalence also con-trolled for prevalence at baseline.
For the remaining secondary outcomes, GEE was alsoused to model a Poisson distribution for count variables(eg, hours of inactivity and television watching). Wenote that, because GEE and random coefficients analyses
e796 FOSTER et al at Univ of California on February 11, 2009 www.pediatrics.orgDownloaded from
were demonstrated to yield comparable results,23 GEEwas used to model continuous outcomes (eg, BMI zscore). These models included race/ethnicity, gender,age, randomization pair, weight status at baseline, andbaseline measures of the dependent variable. We notealso that, because the unit of randomization and inter-vention was the school, we also implemented the ap-proach suggested by Donner and Klar24 to compare pro-portions (eg, of subjects who become obese). Thisapproach uses a paired t test to compare the mean of thebinary (for proportions) or continuous variables. Thisapproach can work well even for a sample size of 5pairs.24
To account for attrition at the student level, we im-puted missing data at year 2 using the multiple imputa-tion (MI) procedure with the Markov chain Monte Carloalgorithm.25 Although the more conventional intent-to-treat analyses fill in a single value for each missing value,the MI procedure uses information obtained from anindividual (eg, demographics, baseline values, interven-tion condition, etc) to replace each missing value with aset of plausible values that incorporate uncertainty aboutthe right value to impute. Plausible values are thenintegrated into a single data set using the MIANALYZEprocedure in SAS (SAS Institute, Inc, Cary, NC). The MIprocedure is superior to the more conventional intent-to-treat analyses, because it produces estimates that areconsistent, asymptotically efficient, and asymptoticallynormal.26 Convergence was assessed via time series andautocorrelation plots. In addition, to assess the consis-tency of our findings, data were analyzed using the more
conventional baseline carried forward and last observa-tion carried forward methods.
RESULTS
Student and Teacher ParticipationThe consent rate across the 10 schools was 69.5% �15.4%, with no significant difference between control(67.7% � 18.5%) and intervention (71.4% � 13.5%)schools. There was no attrition at the school level.Among the 1349 students assessed at baseline, 921(68.3%) (510 intervention and 411 control) were reas-sessed at year 1 and 844 (62.6%; 479 intervention and365 control) were reassessed at year 2. Attrition rates didnot differ between intervention and control schools at 1(31.9% vs 31.5%) or 2 years (36.0% vs 39.2%). Thereasons for attrition at 2 years were transfer (95.4%),repeated absences (3.6%), and refusals (1.0%). Theanalyses that accounted for attrition (MI, baseline car-ried forward, and last observation carried forward) didnot differ from the analyses using complete data. Thus,the results obtained from participants whose data wehad at the relevant assessment points (ie, baseline andyear 2) are reported here. In addition, the results ob-tained from the paired t tests and GEE analyses weresimilar, so the GEE results are reported here.
With respect to implementation of the intervention,teachers and support staff participated in an average of10.4 � 2.9 and 8.4 � 2.2 hours of training, respectively,during the first and second years of the intervention.Teachers and support staff, respectively, provided an
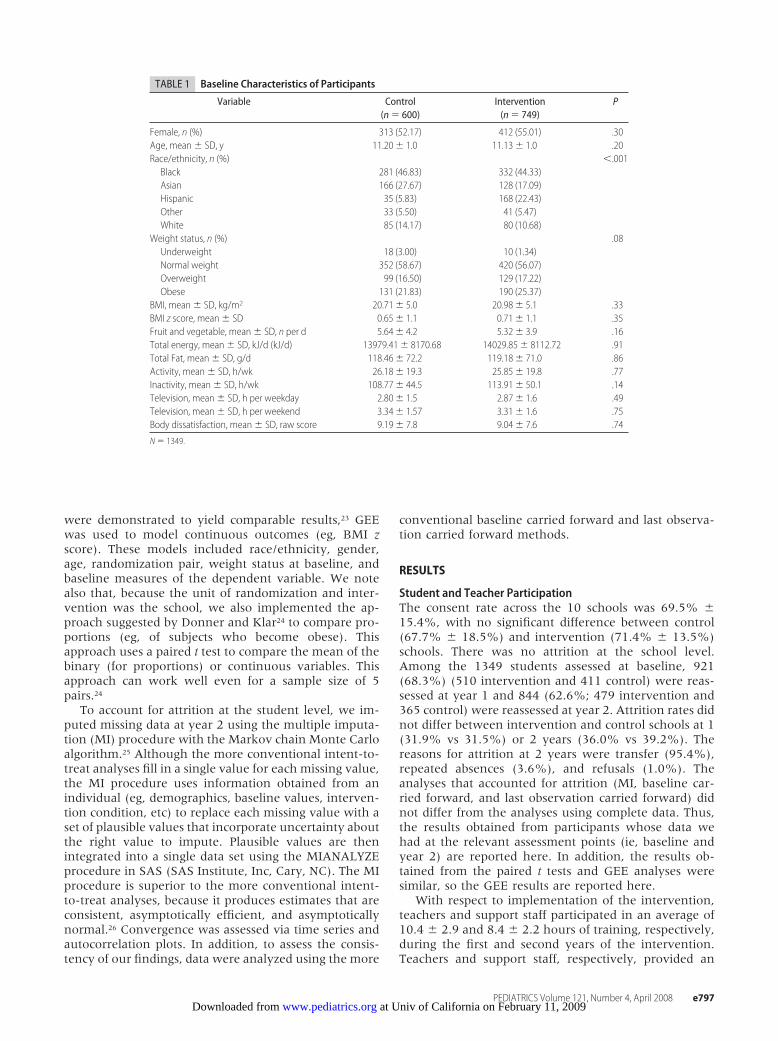
TABLE 1 Baseline Characteristics of Participants
Variable Control(n � 600)
Intervention(n � 749)
P
Female, n (%) 313 (52.17) 412 (55.01) .30Age, mean � SD, y 11.20� 1.0 11.13� 1.0 .20Race/ethnicity, n (%) �.001
Black 281 (46.83) 332 (44.33)Asian 166 (27.67) 128 (17.09)Hispanic 35 (5.83) 168 (22.43)Other 33 (5.50) 41 (5.47)White 85 (14.17) 80 (10.68)
Weight status, n (%) .08Underweight 18 (3.00) 10 (1.34)Normal weight 352 (58.67) 420 (56.07)Overweight 99 (16.50) 129 (17.22)Obese 131 (21.83) 190 (25.37)
BMI, mean � SD, kg/m2 20.71� 5.0 20.98� 5.1 .33BMI z score, mean � SD 0.65� 1.1 0.71� 1.1 .35Fruit and vegetable, mean � SD, n per d 5.64� 4.2 5.32� 3.9 .16Total energy, mean � SD, kJ/d (kJ/d) 13979.41� 8170.68 14029.85� 8112.72 .91Total Fat, mean � SD, g/d 118.46� 72.2 119.18� 71.0 .86Activity, mean � SD, h/wk 26.18� 19.3 25.85� 19.8 .77Inactivity, mean � SD, h/wk 108.77� 44.5 113.91� 50.1 .14Television, mean � SD, h per weekday 2.80� 1.5 2.87� 1.6 .49Television, mean � SD, h per weekend 3.34� 1.57 3.31� 1.6 .75Body dissatisfaction, mean � SD, raw score 9.19� 7.8 9.04� 7.6 .74
N � 1349.
PEDIATRICS Volume 121, Number 4, April 2008 e797 at Univ of California on February 11, 2009 www.pediatrics.orgDownloaded from
average of 48.0 � 27.1 and 44.0 � 18.3 hours of nutri-tion education during each year of the intervention.
Student Characteristics at BaselineBaseline characteristics of the students are shown inTable 1. Among the 1388 students who provided paren-tal consent and child assent, 1349 were assessed at base-line. The sample consisted of 53.7% females. Participantshad (mean � SD) an age of 11.2 � 1.0 years, BMI of20.9 � 5.1 kg/m2, and BMI z score of 0.7 � 1.0. Morethan 40% (40.7%) were overweight or obese (�85thpercentile), and nearly a quarter (23.8%) were obese(�95th percentile). Black children composed nearly halfof the sample. There were no significant differences be-tween control and intervention groups on any variableat baseline except for race/ethnicity (see Table 1). Therewere more Hispanic/Latino students in the interventiongroup (22.4%) than there were in the control group(5.8%; P � .001). To account for these differences atbaseline, race/ethnicity was controlled for in subsequentanalyses.
Primary Outcome
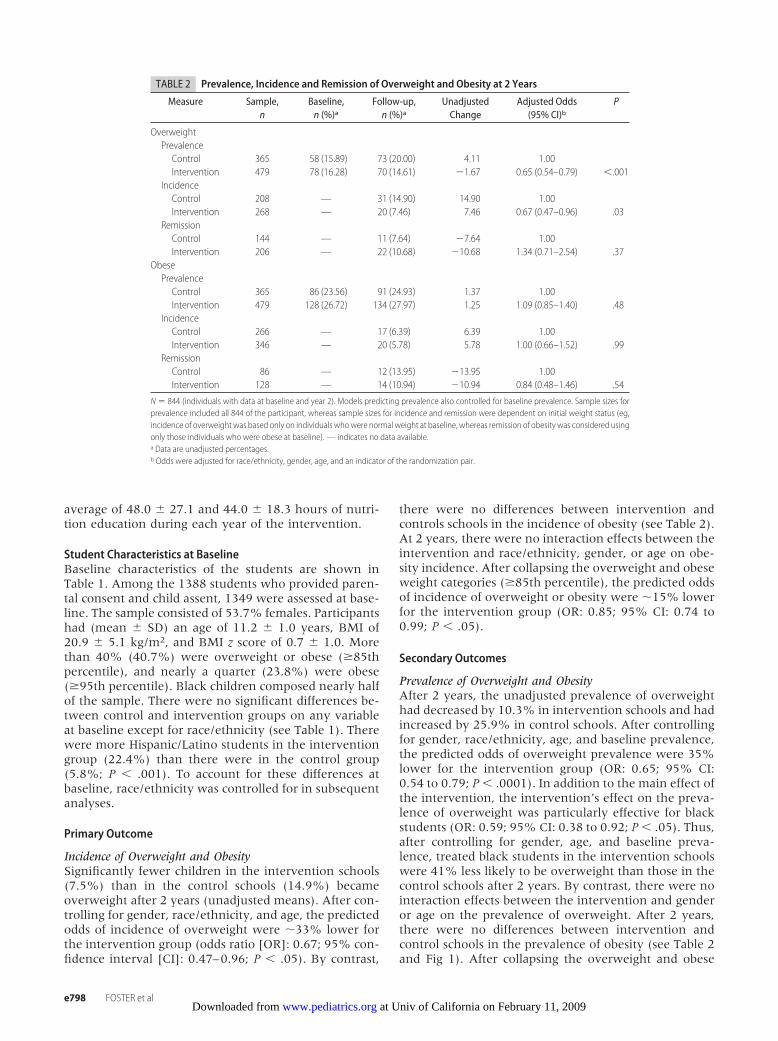
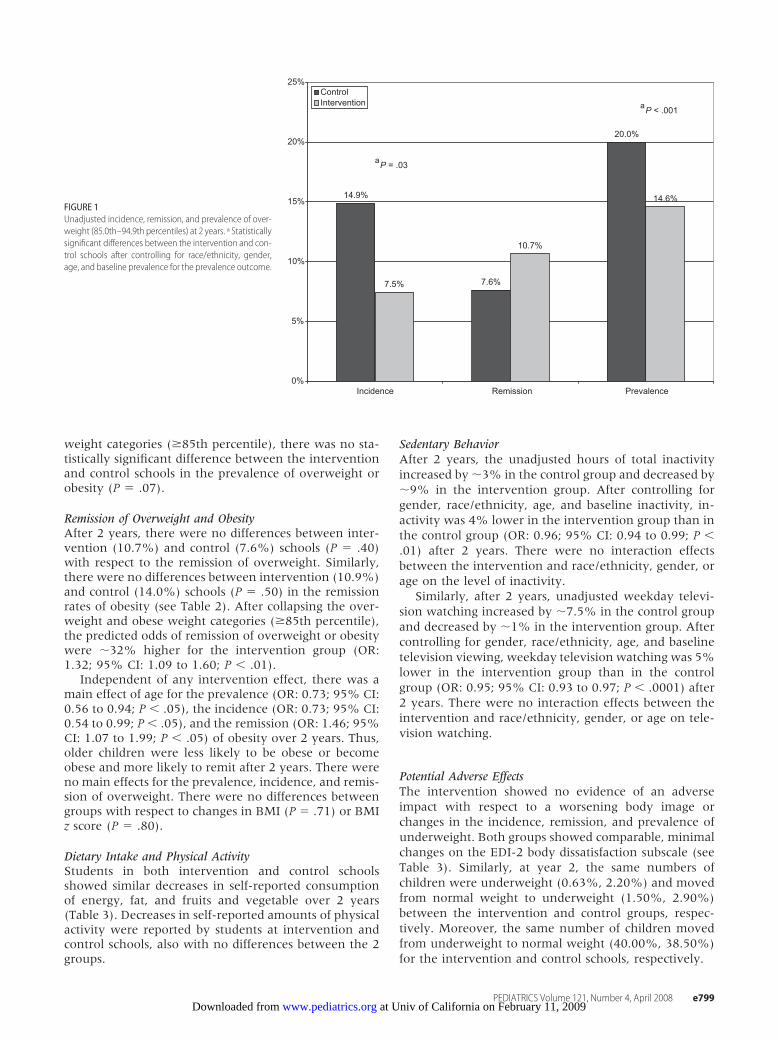
Incidence of Overweight and ObesitySignificantly fewer children in the intervention schools(7.5%) than in the control schools (14.9%) becameoverweight after 2 years (unadjusted means). After con-trolling for gender, race/ethnicity, and age, the predictedodds of incidence of overweight were �33% lower forthe intervention group (odds ratio [OR]: 0.67; 95% con-fidence interval [CI]: 0.47–0.96; P � .05). By contrast,
there were no differences between intervention andcontrols schools in the incidence of obesity (see Table 2).At 2 years, there were no interaction effects between theintervention and race/ethnicity, gender, or age on obe-sity incidence. After collapsing the overweight and obeseweight categories (�85th percentile), the predicted oddsof incidence of overweight or obesity were �15% lowerfor the intervention group (OR: 0.85; 95% CI: 0.74 to0.99; P � .05).
Secondary Outcomes
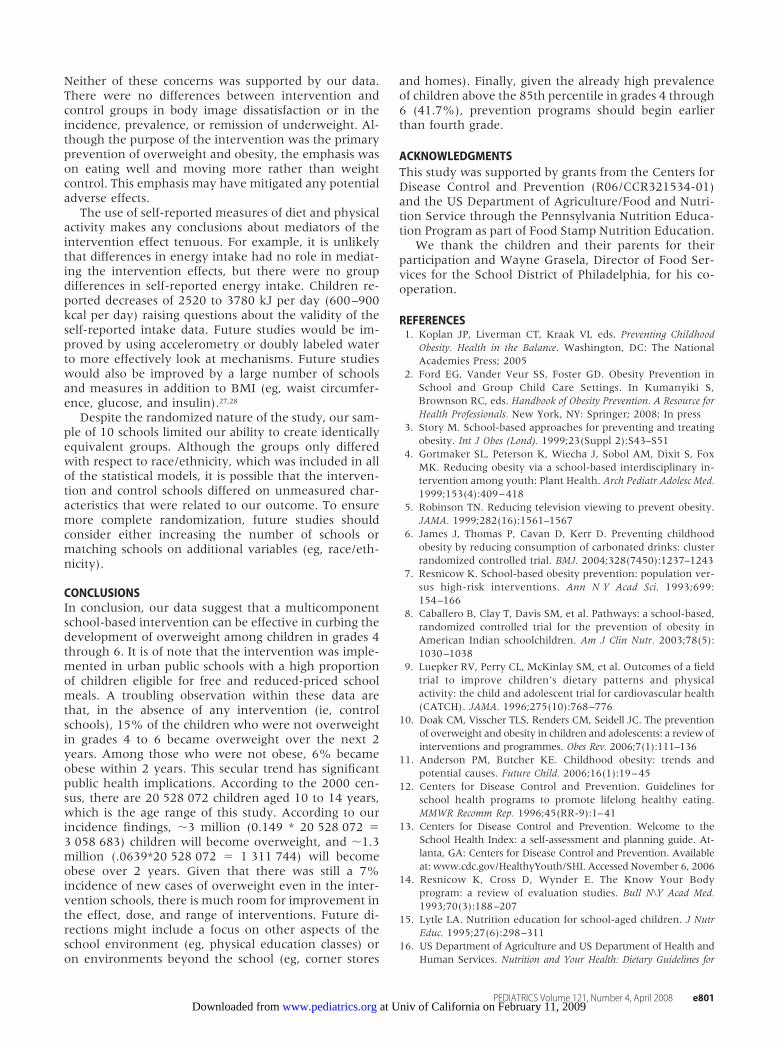
Prevalence of Overweight and ObesityAfter 2 years, the unadjusted prevalence of overweighthad decreased by 10.3% in intervention schools and hadincreased by 25.9% in control schools. After controllingfor gender, race/ethnicity, age, and baseline prevalence,the predicted odds of overweight prevalence were 35%lower for the intervention group (OR: 0.65; 95% CI:0.54 to 0.79; P � .0001). In addition to the main effect ofthe intervention, the intervention’s effect on the preva-lence of overweight was particularly effective for blackstudents (OR: 0.59; 95% CI: 0.38 to 0.92; P � .05). Thus,after controlling for gender, age, and baseline preva-lence, treated black students in the intervention schoolswere 41% less likely to be overweight than those in thecontrol schools after 2 years. By contrast, there were nointeraction effects between the intervention and genderor age on the prevalence of overweight. After 2 years,there were no differences between intervention andcontrol schools in the prevalence of obesity (see Table 2and Fig 1). After collapsing the overweight and obese
TABLE 2 Prevalence, Incidence and Remission of Overweight and Obesity at 2 Years
Measure Sample,n
Baseline,n (%)a
Follow-up,n (%)a
UnadjustedChange
Adjusted Odds(95% CI)b
P
OverweightPrevalenceControl 365 58 (15.89) 73 (20.00) 4.11 1.00Intervention 479 78 (16.28) 70 (14.61) �1.67 0.65 (0.54–0.79) �.001
IncidenceControl 208 — 31 (14.90) 14.90 1.00Intervention 268 — 20 (7.46) 7.46 0.67 (0.47–0.96) .03
RemissionControl 144 — 11 (7.64) �7.64 1.00Intervention 206 — 22 (10.68) �10.68 1.34 (0.71–2.54) .37
ObesePrevalenceControl 365 86 (23.56) 91 (24.93) 1.37 1.00Intervention 479 128 (26.72) 134 (27.97) 1.25 1.09 (0.85–1.40) .48
IncidenceControl 266 — 17 (6.39) 6.39 1.00Intervention 346 — 20 (5.78) 5.78 1.00 (0.66–1.52) .99
RemissionControl 86 — 12 (13.95) �13.95 1.00Intervention 128 — 14 (10.94) �10.94 0.84 (0.48–1.46) .54
N � 844 (individuals with data at baseline and year 2). Models predicting prevalence also controlled for baseline prevalence. Sample sizes forprevalence included all 844 of the participant, whereas sample sizes for incidence and remission were dependent on initial weight status (eg,incidence of overweight was based only on individuals whowere normal weight at baseline, whereas remission of obesity was considered usingonly those individuals who were obese at baseline). — indicates no data available.a Data are unadjusted percentages.b Odds were adjusted for race/ethnicity, gender, age, and an indicator of the randomization pair.
e798 FOSTER et al at Univ of California on February 11, 2009 www.pediatrics.orgDownloaded from
weight categories (�85th percentile), there was no sta-tistically significant difference between the interventionand control schools in the prevalence of overweight orobesity (P � .07).
Remission of Overweight and ObesityAfter 2 years, there were no differences between inter-vention (10.7%) and control (7.6%) schools (P � .40)with respect to the remission of overweight. Similarly,there were no differences between intervention (10.9%)and control (14.0%) schools (P � .50) in the remissionrates of obesity (see Table 2). After collapsing the over-weight and obese weight categories (�85th percentile),the predicted odds of remission of overweight or obesitywere �32% higher for the intervention group (OR:1.32; 95% CI: 1.09 to 1.60; P � .01).
Independent of any intervention effect, there was amain effect of age for the prevalence (OR: 0.73; 95% CI:0.56 to 0.94; P � .05), the incidence (OR: 0.73; 95% CI:0.54 to 0.99; P � .05), and the remission (OR: 1.46; 95%CI: 1.07 to 1.99; P � .05) of obesity over 2 years. Thus,older children were less likely to be obese or becomeobese and more likely to remit after 2 years. There wereno main effects for the prevalence, incidence, and remis-sion of overweight. There were no differences betweengroups with respect to changes in BMI (P � .71) or BMIz score (P � .80).
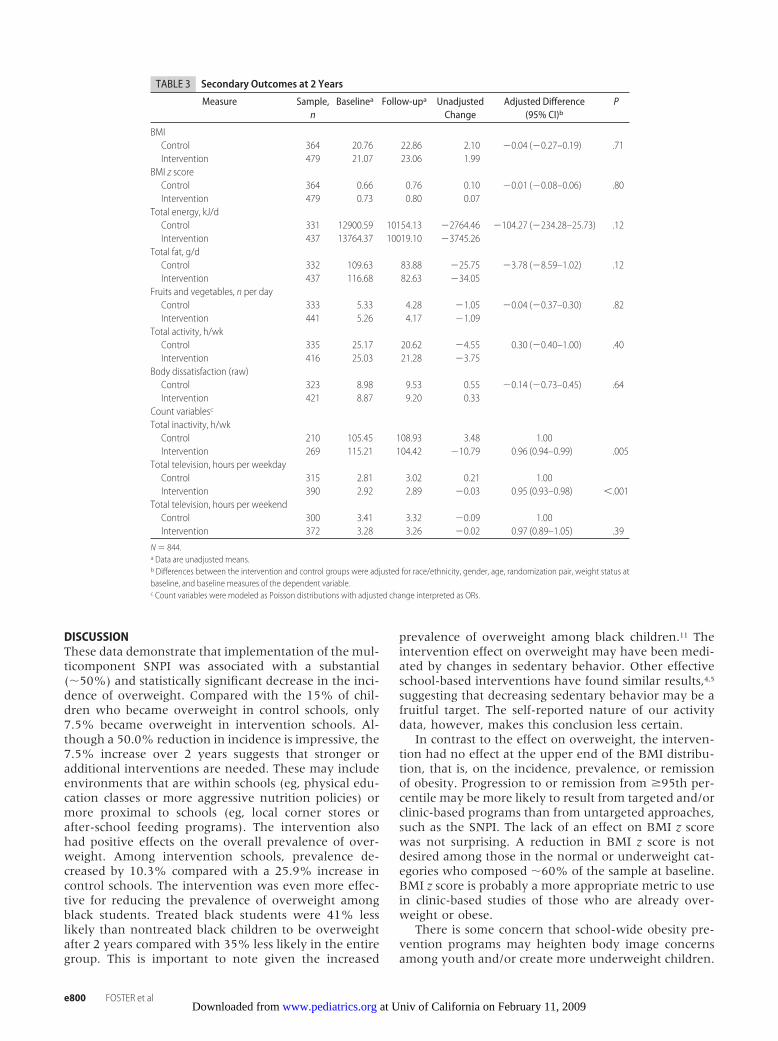
Dietary Intake and Physical ActivityStudents in both intervention and control schoolsshowed similar decreases in self-reported consumptionof energy, fat, and fruits and vegetable over 2 years(Table 3). Decreases in self-reported amounts of physicalactivity were reported by students at intervention andcontrol schools, also with no differences between the 2groups.
Sedentary BehaviorAfter 2 years, the unadjusted hours of total inactivityincreased by �3% in the control group and decreased by�9% in the intervention group. After controlling forgender, race/ethnicity, age, and baseline inactivity, in-activity was 4% lower in the intervention group than inthe control group (OR: 0.96; 95% CI: 0.94 to 0.99; P �.01) after 2 years. There were no interaction effectsbetween the intervention and race/ethnicity, gender, orage on the level of inactivity.
Similarly, after 2 years, unadjusted weekday televi-sion watching increased by �7.5% in the control groupand decreased by �1% in the intervention group. Aftercontrolling for gender, race/ethnicity, age, and baselinetelevision viewing, weekday television watching was 5%lower in the intervention group than in the controlgroup (OR: 0.95; 95% CI: 0.93 to 0.97; P � .0001) after2 years. There were no interaction effects between theintervention and race/ethnicity, gender, or age on tele-vision watching.
Potential Adverse EffectsThe intervention showed no evidence of an adverseimpact with respect to a worsening body image orchanges in the incidence, remission, and prevalence ofunderweight. Both groups showed comparable, minimalchanges on the EDI-2 body dissatisfaction subscale (seeTable 3). Similarly, at year 2, the same numbers ofchildren were underweight (0.63%, 2.20%) and movedfrom normal weight to underweight (1.50%, 2.90%)between the intervention and control groups, respec-tively. Moreover, the same number of children movedfrom underweight to normal weight (40.00%, 38.50%)for the intervention and control schools, respectively.
14.9%
7.6%
20.0%
7.5%
10.7%
14.6%
0%
5%
10%
15%
20%
25%
PrevalenceRemissionIncidence
ControlIntervention
a
a
P = .03
P < .001
FIGURE 1Unadjusted incidence, remission, and prevalence of over-weight (85.0th–94.9th percentiles) at 2 years. a Statisticallysignificant differences between the intervention and con-trol schools after controlling for race/ethnicity, gender,age, and baseline prevalence for the prevalence outcome.
PEDIATRICS Volume 121, Number 4, April 2008 e799 at Univ of California on February 11, 2009 www.pediatrics.orgDownloaded from
DISCUSSIONThese data demonstrate that implementation of the mul-ticomponent SNPI was associated with a substantial(�50%) and statistically significant decrease in the inci-dence of overweight. Compared with the 15% of chil-dren who became overweight in control schools, only7.5% became overweight in intervention schools. Al-though a 50.0% reduction in incidence is impressive, the7.5% increase over 2 years suggests that stronger oradditional interventions are needed. These may includeenvironments that are within schools (eg, physical edu-cation classes or more aggressive nutrition policies) ormore proximal to schools (eg, local corner stores orafter-school feeding programs). The intervention alsohad positive effects on the overall prevalence of over-weight. Among intervention schools, prevalence de-creased by 10.3% compared with a 25.9% increase incontrol schools. The intervention was even more effec-tive for reducing the prevalence of overweight amongblack students. Treated black students were 41% lesslikely than nontreated black children to be overweightafter 2 years compared with 35% less likely in the entiregroup. This is important to note given the increased
prevalence of overweight among black children.11 Theintervention effect on overweight may have been medi-ated by changes in sedentary behavior. Other effectiveschool-based interventions have found similar results,4,5
suggesting that decreasing sedentary behavior may be afruitful target. The self-reported nature of our activitydata, however, makes this conclusion less certain.
In contrast to the effect on overweight, the interven-tion had no effect at the upper end of the BMI distribu-tion, that is, on the incidence, prevalence, or remissionof obesity. Progression to or remission from �95th per-centile may be more likely to result from targeted and/orclinic-based programs than from untargeted approaches,such as the SNPI. The lack of an effect on BMI z scorewas not surprising. A reduction in BMI z score is notdesired among those in the normal or underweight cat-egories who composed �60% of the sample at baseline.BMI z score is probably a more appropriate metric to usein clinic-based studies of those who are already over-weight or obese.
There is some concern that school-wide obesity pre-vention programs may heighten body image concernsamong youth and/or create more underweight children.
TABLE 3 Secondary Outcomes at 2 Years
Measure Sample,n
Baselinea Follow-upa UnadjustedChange
Adjusted Difference(95% CI)b
P
BMIControl 364 20.76 22.86 2.10 �0.04 (�0.27–0.19) .71Intervention 479 21.07 23.06 1.99
BMI z scoreControl 364 0.66 0.76 0.10 �0.01 (�0.08–0.06) .80Intervention 479 0.73 0.80 0.07
Total energy, kJ/dControl 331 12900.59 10154.13 �2764.46 �104.27 (�234.28–25.73) .12Intervention 437 13764.37 10019.10 �3745.26
Total fat, g/dControl 332 109.63 83.88 �25.75 �3.78 (�8.59–1.02) .12Intervention 437 116.68 82.63 �34.05
Fruits and vegetables, n per dayControl 333 5.33 4.28 �1.05 �0.04 (�0.37–0.30) .82Intervention 441 5.26 4.17 �1.09
Total activity, h/wkControl 335 25.17 20.62 �4.55 0.30 (�0.40–1.00) .40Intervention 416 25.03 21.28 �3.75
Body dissatisfaction (raw)Control 323 8.98 9.53 0.55 �0.14 (�0.73–0.45) .64Intervention 421 8.87 9.20 0.33
Count variablesc
Total inactivity, h/wkControl 210 105.45 108.93 3.48 1.00Intervention 269 115.21 104.42 �10.79 0.96 (0.94–0.99) .005
Total television, hours per weekdayControl 315 2.81 3.02 0.21 1.00Intervention 390 2.92 2.89 �0.03 0.95 (0.93–0.98) �.001
Total television, hours per weekendControl 300 3.41 3.32 �0.09 1.00Intervention 372 3.28 3.26 �0.02 0.97 (0.89–1.05) .39
N � 844.a Data are unadjusted means.b Differences between the intervention and control groups were adjusted for race/ethnicity, gender, age, randomization pair, weight status atbaseline, and baseline measures of the dependent variable.c Count variables were modeled as Poisson distributions with adjusted change interpreted as ORs.
e800 FOSTER et al at Univ of California on February 11, 2009 www.pediatrics.orgDownloaded from
Neither of these concerns was supported by our data.There were no differences between intervention andcontrol groups in body image dissatisfaction or in theincidence, prevalence, or remission of underweight. Al-though the purpose of the intervention was the primaryprevention of overweight and obesity, the emphasis wason eating well and moving more rather than weightcontrol. This emphasis may have mitigated any potentialadverse effects.
The use of self-reported measures of diet and physicalactivity makes any conclusions about mediators of theintervention effect tenuous. For example, it is unlikelythat differences in energy intake had no role in mediat-ing the intervention effects, but there were no groupdifferences in self-reported energy intake. Children re-ported decreases of 2520 to 3780 kJ per day (600–900kcal per day) raising questions about the validity of theself-reported intake data. Future studies would be im-proved by using accelerometry or doubly labeled waterto more effectively look at mechanisms. Future studieswould also be improved by a large number of schoolsand measures in addition to BMI (eg, waist circumfer-ence, glucose, and insulin).27,28
Despite the randomized nature of the study, our sam-ple of 10 schools limited our ability to create identicallyequivalent groups. Although the groups only differedwith respect to race/ethnicity, which was included in allof the statistical models, it is possible that the interven-tion and control schools differed on unmeasured char-acteristics that were related to our outcome. To ensuremore complete randomization, future studies shouldconsider either increasing the number of schools ormatching schools on additional variables (eg, race/eth-nicity).
CONCLUSIONSIn conclusion, our data suggest that a multicomponentschool-based intervention can be effective in curbing thedevelopment of overweight among children in grades 4through 6. It is of note that the intervention was imple-mented in urban public schools with a high proportionof children eligible for free and reduced-priced schoolmeals. A troubling observation within these data arethat, in the absence of any intervention (ie, controlschools), 15% of the children who were not overweightin grades 4 to 6 became overweight over the next 2years. Among those who were not obese, 6% becameobese within 2 years. This secular trend has significantpublic health implications. According to the 2000 cen-sus, there are 20 528 072 children aged 10 to 14 years,which is the age range of this study. According to ourincidence findings, �3 million (0.149 * 20 528 072 �3 058 683) children will become overweight, and �1.3million (.0639*20 528 072 � 1 311 744) will becomeobese over 2 years. Given that there was still a 7%incidence of new cases of overweight even in the inter-vention schools, there is much room for improvement inthe effect, dose, and range of interventions. Future di-rections might include a focus on other aspects of theschool environment (eg, physical education classes) oron environments beyond the school (eg, corner stores
and homes). Finally, given the already high prevalenceof children above the 85th percentile in grades 4 through6 (41.7%), prevention programs should begin earlierthan fourth grade.
ACKNOWLEDGMENTSThis study was supported by grants from the Centers forDisease Control and Prevention (R06/CCR321534-01)and the US Department of Agriculture/Food and Nutri-tion Service through the Pennsylvania Nutrition Educa-tion Program as part of Food Stamp Nutrition Education.
We thank the children and their parents for theirparticipation and Wayne Grasela, Director of Food Ser-vices for the School District of Philadelphia, for his co-operation.
REFERENCES1. Koplan JP, Liverman CT, Kraak VI, eds. Preventing Childhood
Obesity. Health in the Balance. Washington, DC: The NationalAcademies Press; 2005
2. Ford EG, Vander Veur SS, Foster GD. Obesity Prevention inSchool and Group Child Care Settings. In Kumanyiki S,Brownson RC, eds. Handbook of Obesity Prevention. A Resource forHealth Professionals. New York, NY: Springer; 2008; In press
3. Story M. School-based approaches for preventing and treatingobesity. Int J Obes (Lond). 1999;23(Suppl 2):S43–S51
4. Gortmaker SL, Peterson K, Wiecha J, Sobol AM, Dixit S, FoxMK. Reducing obesity via a school-based interdisciplinary in-tervention among youth: Plant Health. Arch Pediatr Adolesc Med.1999;153(4):409–418
5. Robinson TN. Reducing television viewing to prevent obesity.JAMA. 1999;282(16):1561–1567
6. James J, Thomas P, Cavan D, Kerr D. Preventing childhoodobesity by reducing consumption of carbonated drinks: clusterrandomized controlled trial. BMJ. 2004;328(7450):1237–1243
7. Resnicow K. School-based obesity prevention: population ver-sus high-risk interventions. Ann N Y Acad Sci. 1993;699:154–166
8. Caballero B, Clay T, Davis SM, et al. Pathways: a school-based,randomized controlled trial for the prevention of obesity inAmerican Indian schoolchildren. Am J Clin Nutr. 2003;78(5):1030–1038
9. Luepker RV, Perry CL, McKinlay SM, et al. Outcomes of a fieldtrial to improve children’s dietary patterns and physicalactivity: the child and adolescent trial for cardiovascular health(CATCH). JAMA. 1996;275(10):768–776
10. Doak CM, Visscher TLS, Renders CM, Seidell JC. The preventionof overweight and obesity in children and adolescents: a review ofinterventions and programmes. Obes Rev. 2006;7(1):111–136
11. Anderson PM, Butcher KE. Childhood obesity: trends andpotential causes. Future Child. 2006;16(1):19–45
12. Centers for Disease Control and Prevention. Guidelines forschool health programs to promote lifelong healthy eating.MMWR Recomm Rep. 1996;45(RR-9):1–41
13. Centers for Disease Control and Prevention. Welcome to theSchool Health Index: a self-assessment and planning guide. At-lanta, GA: Centers for Disease Control and Prevention. Availableat: www.cdc.gov/HealthyYouth/SHI. Accessed November 6, 2006
14. Resnicow K, Cross D, Wynder E. The Know Your Bodyprogram: a review of evaluation studies. Bull N�Y Acad Med.1993;70(3):188–207
15. Lytle LA. Nutrition education for school-aged children. J NutrEduc. 1995;27(6):298–311
16. US Department of Agriculture and US Department of Health andHuman Services. Nutrition and Your Health: Dietary Guidelines for
PEDIATRICS Volume 121, Number 4, April 2008 e801 at Univ of California on February 11, 2009 www.pediatrics.orgDownloaded from
Americans. Home and Garden Bulletin. Washington DC: US Govern-ment Printing Office; 2000:5(232)
17. Dean AG, Dean JA, Coulombier D, et al. Epi Info™, Version6.04a, a Word Processing, Database, and Statistics Program for PublicHealth on IBM-Compatible Microcomputers. Atlanta, GA: Centersfor Disease Control and Prevention; 1996
18. Rockett HR, Wolf AM, Colditz GA. Development and reproduc-ibility of a food frequency questionnaire to assess diets of olderchildren and adolescents. J Am Diet Assoc. 1995;95(3):336–340
19. Rockett HR, Breitenbach M, Fraizer AL, et al. Validation ofyouth/adolescent food frequency questionnaire. Prev Med.1997;26(6):808–816
20. Garner DM. Eating Disorders Inventory 2. Professional Manual.Odessa, FL: Psychological Assessment Resources; 1997
21. Gortmaker SL, Cheung LW, Peterson KE, et al. Impact of aschool-based interdisciplinary intervention on diet and physi-cal activity among urban primary school children: Eat well andkeep moving. Arch Pediatr Adolesc Med. 1999;153(9):976–983
22. Grossman DC, Neckerman HJ, Koepsell TD, et al. Effectivenessof a violence prevention curriculum among children in ele-
mentary school: A randomized controlled trial. JAMA. 1997;277(20):1605–1611
23. Twisk JW. Longitudinal data analysis. A comparison betweengeneralized estimating equations and random coefficient anal-ysis. Eur J Epidemiol. 2004;19(8):769–776
24. Donner A, Klar N. Design and Analysis of Cluster RandomizationTrials in Health Research. London, United Kingdom: ArnoldPublishers; 2000
25. Rubin, DB. Multiple Imputation for Nonresponse in Surveys. NewYork, NY: Wiley; 1987
26. Allison, PD. Missing Data. Thousand Oaks, CA: Sage; 2001:SageUniversity Papers Series on Quantitative Applications in theSocial Sciences, 07-136
27. Baranowski T, Cooper DM, Harrell J. Presence of diabetes riskfactors in a large U.S. eighth-grade cohort. Diabetes Care. 2006;29(2):212–217
28. Trevino RP, Yin Z, Hernandez A, Hale DE, Garcia OA, MobleyC. Impact of the Bienstar school–based diabetes mellitus pre-vention program on fasting capillary glucose levels. Arch PediatrAdolesc Med. 2004;158(9):911–917
e802 FOSTER et al at Univ of California on February 11, 2009 www.pediatrics.orgDownloaded from
DOI: 10.1542/peds.2007-1365 2008;121;e794-e802 Pediatrics
Vander Veur, Joan Nachmani, Allison Karpyn, Shiriki Kumanyika and Justine Shults Gary D. Foster, Sandy Sherman, Kelley E. Borradaile, Karen M. Grundy, Stephanie S.
A Policy-Based School Intervention to Prevent Overweight and Obesity
& ServicesUpdated Information
http://www.pediatrics.org/cgi/content/full/121/4/e794including high-resolution figures, can be found at:
References
http://www.pediatrics.org/cgi/content/full/121/4/e794#BIBLat: This article cites 19 articles, 8 of which you can access for free
Citations
eshttp://www.pediatrics.org/cgi/content/full/121/4/e794#otherarticlThis article has been cited by 1 HighWire-hosted articles:
Subspecialty Collections
mhttp://www.pediatrics.org/cgi/collection/nutrition_and_metabolis
Nutrition & Metabolismfollowing collection(s): This article, along with others on similar topics, appears in the
Permissions & Licensing
http://www.pediatrics.org/misc/Permissions.shtmltables) or in its entirety can be found online at: Information about reproducing this article in parts (figures,
Reprints http://www.pediatrics.org/misc/reprints.shtml
Information about ordering reprints can be found online:
at Univ of California on February 11, 2009 www.pediatrics.orgDownloaded from
Related Documents