Copyright © 2013, The Health and Social Care Information Centre. All rights reserved HSE 2012: VOL 1 | CHAPTER 10: ADULT ANTHROPOMETRIC MEASURES, OVERWEIGHT AND OBESITY 1 Adult anthropometric measures, overweight and obesity Alison Moody ● This chapter reports on measurements relevant to obesity: body mass index (BMI), prevalence of overweight and obesity, and waist circumference. In addition, self- reported height and weight estimates, perceptions of weight, and the relationships between obesity and other health measures are examined. ● In 2012 around a quarter of adults (24% of men and 25% of women) were obese, including morbidly obese. This was similar to the level in recent years, for example 2011 when 24% of men and 26% of women were obese. ● Overweight was more common than obesity, with 42% of men and 32% of women being overweight but not obese. In 2011 the figures were similar (41% of men and 33% of women). Thus overall in 2012, 67% of men and 57% of women were either overweight or obese. ● Obesity was strongly related to age, rising from 12% of men and 14% of women aged 16-24, to 33% of men and women aged 65-74, before falling again to 19% of men and 18% of women aged 85 and over. ● The proportion of those who were overweight or obese increased from 36% of men and women aged 16-24, to 76-81% of men aged 45-84 and 68-71% of women aged 55-84, before declining in the oldest age group. ● Interviewer-measured mean BMI was 27.3kg/m 2 for men and 27.0kg/m 2 for women; as in previous years, this rose with age from youth to late middle-age, before falling again in old age. ● Despite the majority of men being overweight or obese (67%), around half felt that they were about the right weight (52%), and 55% were not trying to change their weight. ● While fewer women than men were overweight or obese (57%), they were more likely than men to say that they were too heavy (51%) and that they were trying to lose weight (55%). ● Mean interviewer-measured height was 175.3cm for men and 161.9cm for women. As in 2011, self-reported height was greater, at 176.9cm for men and 162.8cm for women. ● Both interviewer-measured and self-reported height declined as age increased, from 177.8cm (interviewer-measured) among men aged 25-34 to 166.9cm among those aged 85 and over, and a little more among women, from 164.5cm among those aged 16-24 to 153.1cm among those aged 85 and over. ● As in 2011, inaccurate estimation of height and weight resulted in a discrepancy between BMI from self-report and BMI from interviewer measurements. 30% of men and 28% of women who were obese based on interviewer-measured BMI, gave estimated height and weight that placed them in the overweight (not obese) or not overweight categories. ● In addition to general overweight and obesity, central obesity was common. 34% of men and 45% of women had a raised waist circumference (over 102cm for men and 10 Summary

Welcome message from author
This document is posted to help you gain knowledge. Please leave a comment to let me know what you think about it! Share it to your friends and learn new things together.
Transcript

Copyright © 2013, The Health and Social Care Information Centre. All rights reserved
HSE 2012: VOL 1 | CHAPTER 10: ADULT ANTHROPOMETRIC MEASURES, OVERWEIGHT AND OBESITY 1
Adult anthropometricmeasures, overweightand obesity
Alison Moody
● This chapter reports on measurements relevant to obesity: body mass index (BMI),prevalence of overweight and obesity, and waist circumference. In addition, self-reported height and weight estimates, perceptions of weight, and the relationshipsbetween obesity and other health measures are examined.
● In 2012 around a quarter of adults (24% of men and 25% of women) were obese,including morbidly obese. This was similar to the level in recent years, for example2011 when 24% of men and 26% of women were obese.
● Overweight was more common than obesity, with 42% of men and 32% of womenbeing overweight but not obese. In 2011 the figures were similar (41% of men and33% of women). Thus overall in 2012, 67% of men and 57% of women were eitheroverweight or obese.
● Obesity was strongly related to age, rising from 12% of men and 14% of women aged16-24, to 33% of men and women aged 65-74, before falling again to 19% of men and18% of women aged 85 and over.
● The proportion of those who were overweight or obese increased from 36% of menand women aged 16-24, to 76-81% of men aged 45-84 and 68-71% of women aged55-84, before declining in the oldest age group.
● Interviewer-measured mean BMI was 27.3kg/m2 for men and 27.0kg/m2 for women; asin previous years, this rose with age from youth to late middle-age, before falling againin old age.
● Despite the majority of men being overweight or obese (67%), around half felt that theywere about the right weight (52%), and 55% were not trying to change their weight.
● While fewer women than men were overweight or obese (57%), they were more likelythan men to say that they were too heavy (51%) and that they were trying to loseweight (55%).
● Mean interviewer-measured height was 175.3cm for men and 161.9cm for women. Asin 2011, self-reported height was greater, at 176.9cm for men and 162.8cm for women.
● Both interviewer-measured and self-reported height declined as age increased, from177.8cm (interviewer-measured) among men aged 25-34 to 166.9cm among thoseaged 85 and over, and a little more among women, from 164.5cm among those aged16-24 to 153.1cm among those aged 85 and over.
● As in 2011, inaccurate estimation of height and weight resulted in a discrepancybetween BMI from self-report and BMI from interviewer measurements. 30% of menand 28% of women who were obese based on interviewer-measured BMI, gaveestimated height and weight that placed them in the overweight (not obese) or notoverweight categories.
● In addition to general overweight and obesity, central obesity was common. 34% ofmen and 45% of women had a raised waist circumference (over 102cm for men and
10Summary

2 HSE 2012: VOL 1 | CHAPTER 10: ADULT ANTHROPOMETRIC MEASURES, OVERWEIGHT AND OBESITY Copyright © 2013, The Health and Social Care Information Centre. All rights reserved
over 88cm for women). Like raised BMI, raised waist circumference increased withage. Unlike overweight and obesity defined by BMI, central obesity continued toincrease into the oldest age group, to 52% of men and 64% of women aged 75 andover.
● Both BMI and waist circumference contribute to the NICE (National Institute for Healthand Care Excellence) calculation of health risk caused by overweight and obesity. Bythese definitions 20% of men had increased risk, 12% a high risk and 22% a very highrisk. 13% of women had increased risk, 18% a high risk and 24% a very high risk.Thus a minority of men and women (45% and 42% respectively) had no increased riskfrom their combination of BMI and waist circumference.
● Overweight and obesity were associated with other health conditions. The prevalenceof hypertension doubled from 21% of men and 18% of women of normal weight to43% of obese men and 38% of obese women.
● Self-reported bad/very bad health was higher among obese people (7% of men and11% of women) than those of a normal weight (4% in each sex). There was the samepattern for limiting longstanding illness: among obese men, 21% had a limitinglongstanding illness, compared with 17% who were overweight and 15% of normalweight men. There was a stronger relationship among women, with 33% of obesewomen reporting a limiting longstanding illness compared with 21% of overweight and17% of underweight or normal weight women.
● Psychological disturbance or mental ill health was more common in obese men andwomen (13% and 21%) than those who were of normal weight (11% and 15%respectively).
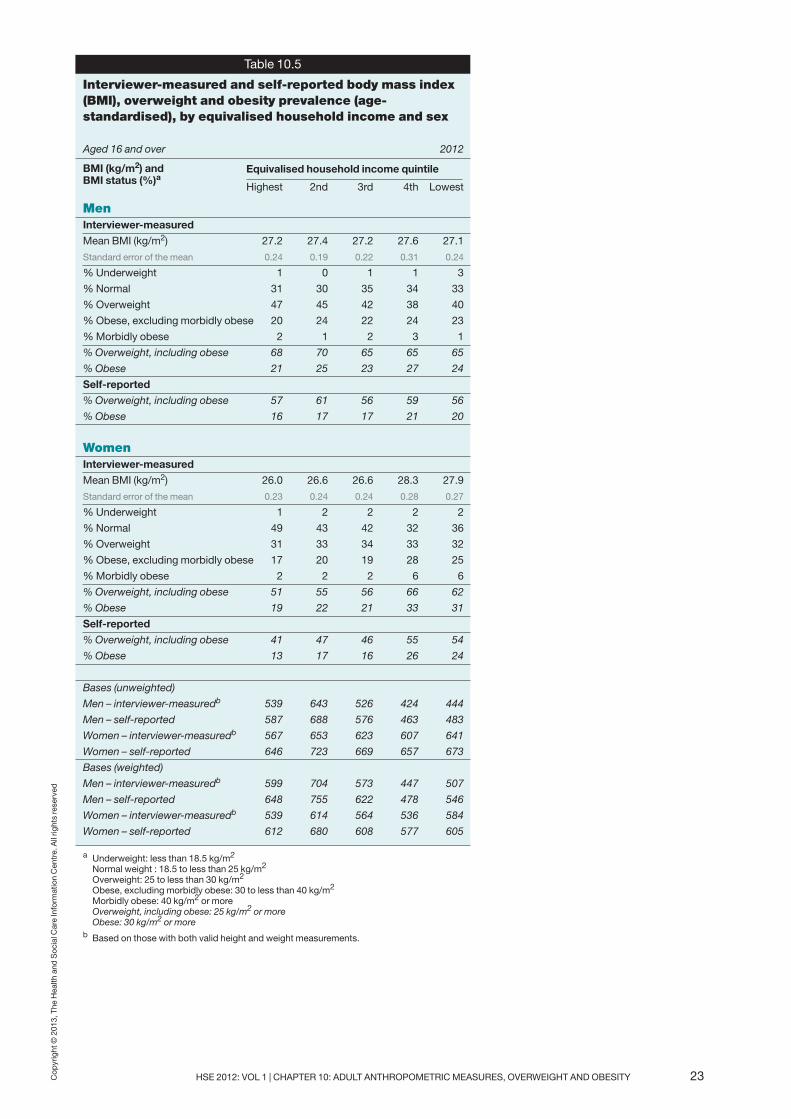
● Obesity was associated with income. It was lowest in the highest income groups (21%of men and 19% of women), and highest in the fourth quintile (27% of men and 33% ofwomen). The relationship between obesity and income appeared to be stronger forwomen than men.
● Prevalence of overweight including obesity varied between regions, and was notablylower in London than other regions of the country.

HSE 2012: VOL 1 | CHAPTER 10: ADULT ANTHROPOMETRIC MEASURES, OVERWEIGHT AND OBESITY 3Copyright © 2013, The Health and Social Care Information Centre. All rights reserved
10.1 Introduction
10.1.1 Contents of the chapter
The anthropometric measures presented in this chapter focus on measurements relevant toobesity for adults aged 16 and over. Height and weight data have been collected in eachyear of the Health Survey for England (HSE) series, and waist circumference in most years.Interviewer-measured height and weight data are used to calculate body mass index (BMI);waist circumference is used to assess central obesity. In 2011, the HSE for the first timeasked for self-reported height and weight, which were used to calculate self-reportedestimates of BMI, overweight and obesity1; this was continued for HSE 2012. In HSE 2012,adults were asked for the first time about their perception of their weight and whether or notthey were trying to change their weight.
Many surveys rely on self-reported height and weight, which are known to be less accuratethan interviewer-measured estimates,2,3,4 and which may be increasing in bias over time.5
The HSE is one of a small number of surveys that records interviewer measurements ofheight and weight. This chapter presents comparisons between self-reported andinterviewer-measured height and weight estimates, as was done in 2011. In addition,participants’ self-reported and interviewer-measured height and weight are presentedaccording to their perception of weight, and planned weight management, in order to seewhether individuals are correctly recognising whether they are too heavy, too light, or aboutright, and whether they are attempting to change their weight.
As well as presenting total data for men and women for the various measures, the chapterincludes analyses by sex, age and equivalised household income. Participants areclassified according to the National Institute for Health and Care Excellence (NICE) obesitycategories for health risk using both BMI and waist circumference.6 The associationsbetween obesity and other health problems (self-rated general health, limiting longstandingillnesses, hypertension, and mental health problems) are also included in the chapter.
There has been some exploration of the factors associated with obesity measures inprevious HSE reports. The 2007 report included a regression analysis of the risk factors forthose classified as ‘most at risk’ according to the NICE health risk categories7; the 2006report included a regression analysis exploring the risk factors associated with a raisedwaist circumference8; and the 2003 report included a regression analysis of risk factorsassociated with overweight and obesity.9
10.1.2 Overweight and obesity as health issues
Overweight and obesity are defined as abnormal or excessive fat accumulation that mayimpair health.10 Being overweight or obese is associated with an increased risk for anumber of common causes of disease and death including diabetes, cardiovasculardisease and some cancers.11,12 For individuals classified as obese, the risk of poor healthincreases sharply with increasing BMI.13
Trend data from the Health Survey for England has shown obesity rising from 13% of menand 16% of women in 1993, to 24% of men and women in 2006, after which the riseappears to have slowed or perhaps even halted.14 This reflects similar trends in hospitaladmissions with a primary diagnosis of obesity, which increased from just over 1,000 in2000/2001 to more than 11,500 a year in 2010/11 and 2011/12, although it is possible thatpart of this rise may be due to diagnostic/definitional changes.15 Those admitted with aprimary diagnosis of obesity are likely to be extreme cases, the ‘tip of the iceberg’, while themajority of harm is done to those with less extreme obesity, of whom there are many more.Around 48,000 deaths per year are attributed to obesity in England, placing obesity as thefourth largest risk factor (after hypertension, smoking, and high cholesterol) according tothe NHS Atlas of Risk.16
To address the issue of obesity, a number of government policies and initiatives are in place,aimed at individuals, the NHS, and local authorities. The Change4Life public information

campaign aims to improve diet and activity levels of parents and children.17 VoluntaryResponsibility Deals are aimed at improving food labelling systems to enable individuals tochoose their food more wisely, as well as encouraging the food industry to ‘shift themarketing mix towards lower calorie options’.18 NHS health checks for those aged 40 to 74will include BMI measurement every five years, as well as other tests to diagnose and offertimely treatment for common chronic conditions such as hypertension and diabetes.19 TheLiving Well for Longer policy document aims to encourage local authorities and clinicalcommissioning groups to follow the lead of Public Health England in acting on obesity.20
One issue related to appropriate weight management is the accurate knowledge of one’sown height and weight, and accurate perception of what a healthy weight should be.Research has shown that inaccurate estimates of height and weight are common21 and thatmisperceptions about having a healthy weight are both common and increasing.22,23 Thereare inequalities across income groups for weight perceptions and attempts at weightcontrol; the situation is worse among those in lower income households, especially amongwomen.24 This may explain why recent HSE reports have found mean BMI and prevalenceof obesity increasing as income decreases among women.1
10.2 Methods and definitions
10.2.1 Methods
Full details of the protocols for carrying out all the measurements are contained in Volume 2of this report, Methods and Documentation, Appendix B, and are summarised briefly here.Height and weight were measured during the interviewer visit, while waist and hipcircumferences were measured during the nurse visit.25
Height
Height was measured using a portable stadiometer with a sliding head plate, a base plateand connecting rods marked with a measuring scale. Participants were asked to removetheir shoes. One measurement was taken, with the participant stretching to the maximumheight and the head positioned in the Frankfort plane.26 The reading was recorded to thenearest millimetre. Participants who were unable to stand or were unsteady on their feetwere not measured.
Weight
New Class III Seca scales were introduced for the HSE 2011, and continued to be used in2012. These meet a higher specification than previous (Class IV) scales, and measure up toa maximum of 200kg, compared with the maximum of 130kg in the earlier models.27
For the weight measurement, participants were asked to remove their shoes and any bulkyclothing. A single measurement was recorded to the nearest 100g. Participants who werepregnant, unable to stand, or unsteady on their feet were not weighed. Participants whoweighed more than 200kg were asked for their estimated weight because the scales areinaccurate above this level. The estimated weight from the one individual affected(estimated weight 200kg) was included in the analyses.
In the analysis of height and weight, data were excluded from those who were consideredby the interviewer to have unreliable measurements, for example those who were toostooped or wearing excessive clothing.
Self-reported height and weight
Early in the interview, participants were asked to report how tall they were without shoes,and how much they weigh without clothes or shoes. Participants could give measurementsin either imperial or metric units, and these were converted to metric units if necessary(metres for height, kilograms for weight). The interviewer recorded any cases where theparticipant did not know their height and/or weight or was unwilling to provide this
4 HSE 2012: VOL 1 | CHAPTER 10: ADULT ANTHROPOMETRIC MEASURES, OVERWEIGHT AND OBESITY Copyright © 2013, The Health and Social Care Information Centre. All rights reserved

information.
Self-perception of weight and weight management
Adult participants were asked as part of the self-completion questionnaire to give theirperception of their weight: ‘Given your age and height, would you say that you are… aboutthe right weight, too heavy, or too light?’ They were also asked about intended weightmanagement: ‘At the present time are you trying to lose weight, trying to gain weight, or areyou not trying to change your weight?’
Waist circumference
The waist was defined as the midpoint between the lower rib and the upper margin of theiliac crest. It was measured using a tape with an insertion buckle at one end. Themeasurement was taken twice, using the same tape (waist and hip measurements werealternated), and was recorded to the nearest millimetre. Where the two waist measurementsdiffered by more than 3cm, a third measurement was taken. The mean of the two validmeasurements (the two out of the three measurements that were the closest to each other,if there were three measurements) was used in the analysis.
Participants were excluded from waist measurements if they reported that they werepregnant, had a colostomy or ileostomy, or were unable to stand. All those withmeasurements considered unreliable by the nurse, for example due to excessive clothing ormovement, were also excluded from the analysis.
Response to anthropometric measures
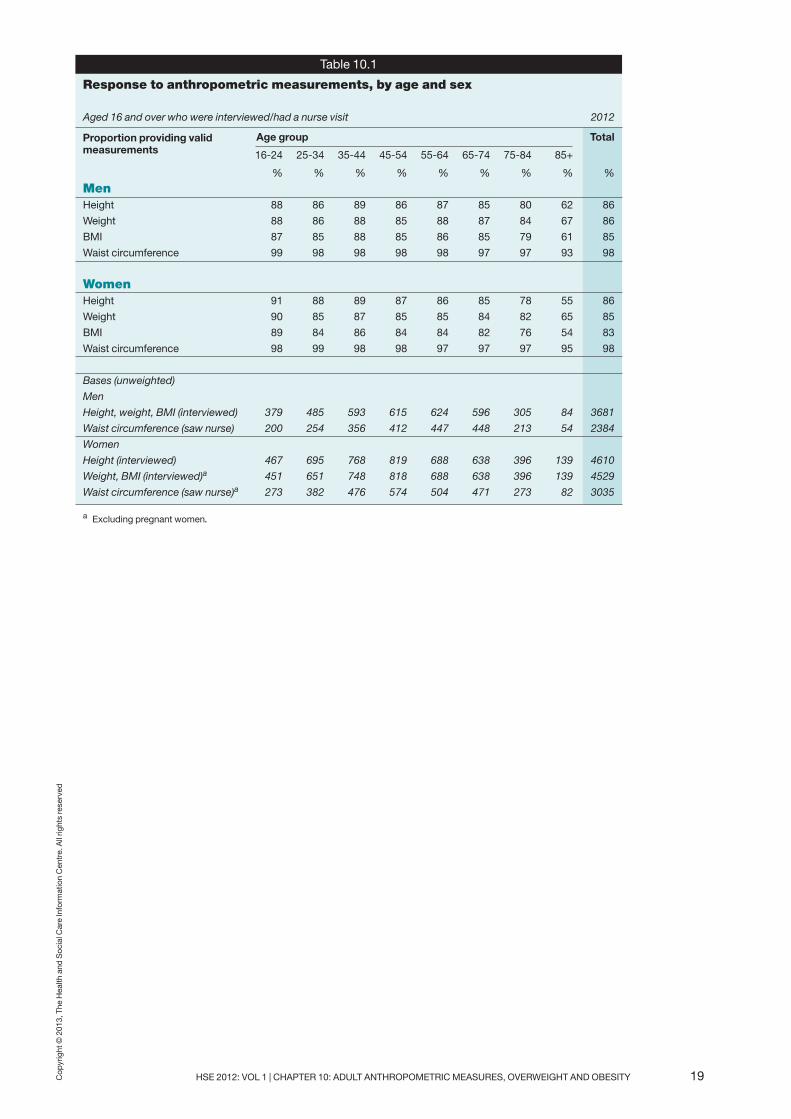
Response rates to anthropometric measurements are shown in Table 10.1. 86% of men andwomen provided a valid height measurement, and 86% of men and 85% of women a validweight measurement. Among those who received a nurse visit, response to waistmeasurements was 98%. Response to all three objective measures was lower among thoseaged 85 and over. For example, 26% of those in this age group were unable to give a heightmeasurement because of pain, an inability to stand steadily and sufficiently upright,disability, or other reasons; a further 7% refused; and 9% gave a measurement that wasconsidered unreliable. Table 10.1
10.2.2 Definitions
Body mass index (BMI)
In order to define overweight or obesity, a measurement is required that allows fordifferences in weight due to height. A widely accepted measure of weight for height is thebody mass index (BMI), defined as weight in kilograms divided by the square of the heightin metres (kg/m2). This has been used as a measure of obesity in the HSE series. Since2011, BMI has been calculated both from valid interviewer-measured height and weight,and from self-estimated height and weight. Adult participants were classified into thefollowing BMI groups according to the WHO (World Health Organisation) BMIclassification.28
BMI categories of overweight and obese have frequently been combined to show theproportion who are either overweight or obese. As in previous years’ reports, a subset of theobese category has also been defined, namely those with morbid obesity (BMI 40kg/m2 ormore), who are at highest risk of morbidity and mortality.29
HSE 2012: VOL 1 | CHAPTER 10: ADULT ANTHROPOMETRIC MEASURES, OVERWEIGHT AND OBESITY 5Copyright © 2013, The Health and Social Care Information Centre. All rights reserved
Table 10A
BMI (kg/m2) Description
Less than 18.5 Underweight
18.5 to less than 25 Normal
25 to less than 30 Overweight
30 or more Obese
40 or more Morbidly obese
Ethnic differences in target BMI
Recently, the National Institute for Health and Care Excellence (NICE) has issued guidanceabout BMI and waist circumference thresholds for people from minority ethnic groups. Theyconcluded that no single value applied to all such groups, and the evidence was verylimited for thresholds for specific groups. For diabetes risk, limited but consistent evidencein Asian and Chinese populations suggests:• a BMI threshold of 23kg/m2 to define overweight, equivalent to the threshold of 25kg/m2
in European populations • a BMI threshold of 27.5kg/m2 to define the same obesity-related diabetes risk as thethreshold of 30kg/m2 in European populations.
However, the obesity-related risk for other diseases and outcomes was even more sparse –or absent – so no overall recommendation was made for thresholds to be used.30 This HSEreport has therefore used the European thresholds for all participants, regardless of ethnicgroup.
Waist circumference
BMI does not distinguish between mass due to body fat and mass due to muscularphysique. It also does not take account of the distribution of fat. It has therefore beensuggested that waist circumference, waist to hip ratio (WHR) or waist to height ratio may bea better measure than BMI to identify those with a health risk from being overweight.31,32
A raised waist circumference has been taken to be greater than 102cm in men and greaterthan 88cm in women, in accordance with the definition of abdominal obesity used by theNational Institutes of Health (USA) ATP (Adult Treatment Panel) III.33 These levels identifiedpeople at risk of metabolic syndrome. It has been shown recently that these levelscorresponded fairly closely to the 95th centile of waist circumference for healthy people,indicating that few healthy people have a waist circumference above these thresholds.34
Combined assessment of health risk from obesity
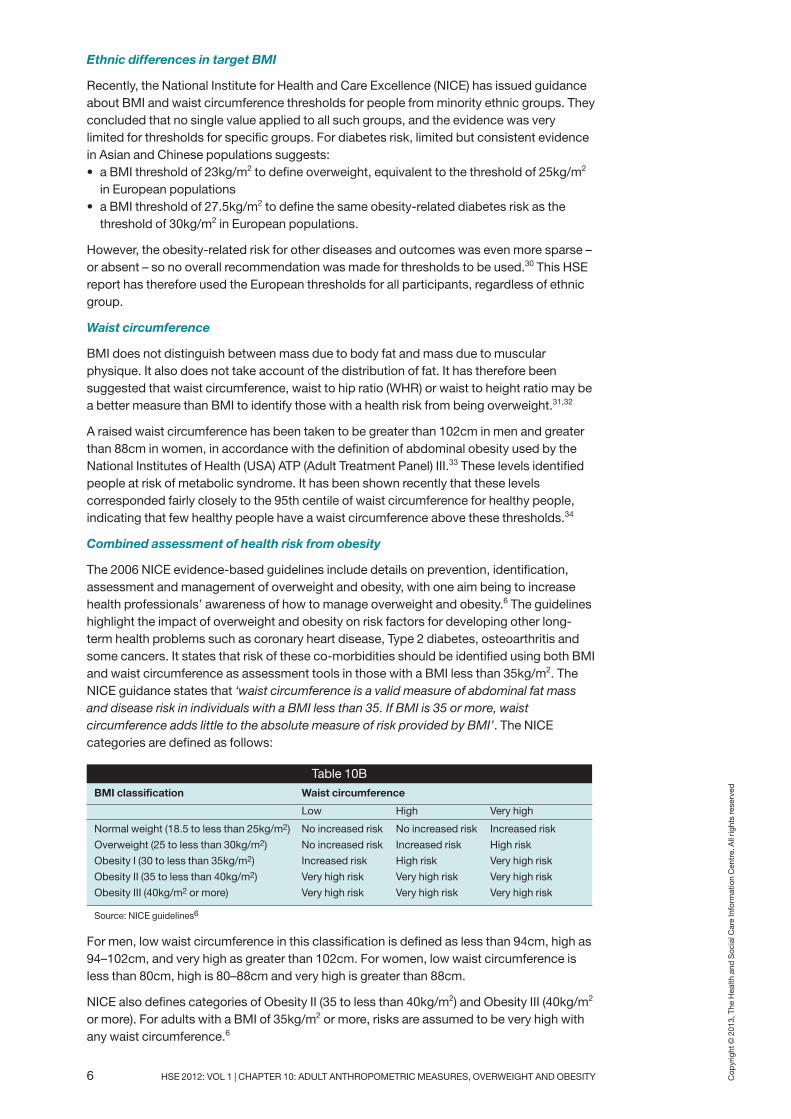
The 2006 NICE evidence-based guidelines include details on prevention, identification,assessment and management of overweight and obesity, with one aim being to increasehealth professionals’ awareness of how to manage overweight and obesity.6 The guidelineshighlight the impact of overweight and obesity on risk factors for developing other long-term health problems such as coronary heart disease, Type 2 diabetes, osteoarthritis andsome cancers. It states that risk of these co-morbidities should be identified using both BMIand waist circumference as assessment tools in those with a BMI less than 35kg/m2. TheNICE guidance states that ‘waist circumference is a valid measure of abdominal fat massand disease risk in individuals with a BMI less than 35. If BMI is 35 or more, waistcircumference adds little to the absolute measure of risk provided by BMI’. The NICEcategories are defined as follows:
For men, low waist circumference in this classification is defined as less than 94cm, high as94–102cm, and very high as greater than 102cm. For women, low waist circumference isless than 80cm, high is 80–88cm and very high is greater than 88cm.
NICE also defines categories of Obesity II (35 to less than 40kg/m2) and Obesity III (40kg/m2
or more). For adults with a BMI of 35kg/m2 or more, risks are assumed to be very high withany waist circumference.6
6 HSE 2012: VOL 1 | CHAPTER 10: ADULT ANTHROPOMETRIC MEASURES, OVERWEIGHT AND OBESITY Copyright © 2013, The Health and Social Care Information Centre. All rights reserved
Table 10B
BMI classification Waist circumference
Low High Very high
Normal weight (18.5 to less than 25kg/m2) No increased risk No increased risk Increased risk
Overweight (25 to less than 30kg/m2) No increased risk Increased risk High risk
Obesity I (30 to less than 35kg/m2) Increased risk High risk Very high risk
Obesity II (35 to less than 40kg/m2) Very high risk Very high risk Very high risk
Obesity III (40kg/m2 or more) Very high risk Very high risk Very high risk
Source: NICE guidelines6

Note that the combined measures shown in Table 10.12 are based on all adults with validheight, weight and waist circumference measurements. The data may therefore vary slightlyfrom those presented in Table 10.3 for mean BMI and BMI categories which are based onadults with valid height and weight measurements.
Hypertension
Hypertension is defined as the presence of persistently raised blood pressure, measuring140/90mmHg or above.35,36 The definition of hypertension in the HSE is based on objectiveblood pressure measurements taken during the nurse visit. This threshold to definehypertension is in accordance with guidelines on hypertension management. Adultparticipants were classified into one of four groups on the basis of their systolic (SBP) anddiastolic (DBP) readings and their current use of anti-hypertensive medication.
Participants in any of the last three categories are considered to have ‘hypertension’ for thepurpose of this report.
Mental health
The 12-item General Health Questionnaire (GHQ-12) is a widely used and validatedmeasure of mental health. It was originally intended for use in general practice settings as ascreening instrument for general, non-psychotic psychiatric morbidity. The questionnaireuses a Likert scale, and scoring is applied to give a maximum score of 12. A score of 4 ormore is referred to as a ‘high GHQ-12 score’, indicating probable psychological disturbanceor mental ill health. Chapter 4 examines GHQ-12 results in more detail.
10.3 Height and weight: interviewer-measured and self-reportedestimates
Mean interviewer-measured height was 175.3cm for men, and 161.9cm for women. It washighest among the youngest age groups (177.8cm for men aged 25-34 and 164.5cm forwomen aged 16-24), declining gradually by nearly 2cm between the 16-24 and 45-54groups, and then more rapidly by a further 8-9cm to 166.9cm for men and 153.1 for womenaged 85 and over (Figure 10A). The magnitude of the change across age groups wasgreater in women than in men.
Mean measured weight was 84.0kg among men and 70.7kg among women. It was lowestamong the youngest and oldest adult participants, rising from 76.4kg among men aged 16-24 up to 88.6kg among those aged 45-54, before declining again down to 74.1kg amongthose aged 85 and over. Among women a slightly less pronounced pattern was seen, withmean weight increasing from 66.5kg (aged 16-24) to 73.6kg (aged 45-54) and declining to62.3kg among those aged 85 and over (Figure 10B).
Mean self-reported height was greater than mean interviewer-measured height in both men(176.9cm) and women (162.8cm). Similarly, self-reported weight was lower for both men(82.4kg compared with 84.0kg) and women (68.3kg compared with 70.7kg). However, it
HSE 2012: VOL 1 | CHAPTER 10: ADULT ANTHROPOMETRIC MEASURES, OVERWEIGHT AND OBESITY 7Copyright © 2013, The Health and Social Care Information Centre. All rights reserved
Table 10C
Normotensive untreated SBP below 140mmHg and DBP below 90mmHg, not currently taking medication specifically prescribed to treat high blood pressure
Hypertensive controlled SBP below 140mmHg and DBP below 90mmHg, currently taking medication specifically prescribed to treat their high blood pressure
Hypertensive uncontrolled SBP at least 140mmHg or DBP at least 90mmHg, currently taking medication specifically prescribed to treat their high blood pressure
Hypertensive untreated SBP at least 140mmHg or DBP at least 90mmHg, notcurrently taking medication specifically prescribed to treat their high blood pressure
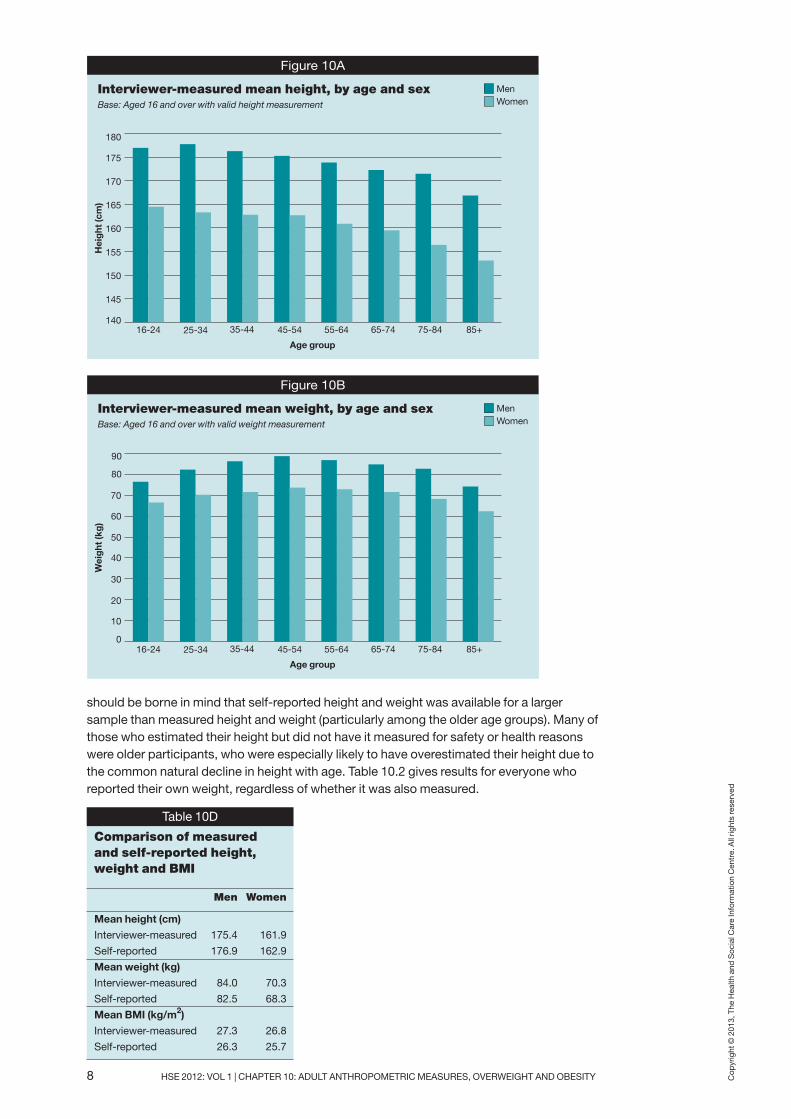
should be borne in mind that self-reported height and weight was available for a largersample than measured height and weight (particularly among the older age groups). Many ofthose who estimated their height but did not have it measured for safety or health reasonswere older participants, who were especially likely to have overestimated their height due tothe common natural decline in height with age. Table 10.2 gives results for everyone whoreported their own weight, regardless of whether it was also measured.
8 HSE 2012: VOL 1 | CHAPTER 10: ADULT ANTHROPOMETRIC MEASURES, OVERWEIGHT AND OBESITY Copyright © 2013, The Health and Social Care Information Centre. All rights reserved
Table 10D
Comparison of measured and self-reported height,weight and BMI
Men Women
Mean height (cm)
Interviewer-measured 175.4 161.9
Self-reported 176.9 162.9
Mean weight (kg)
Interviewer-measured 84.0 70.3
Self-reported 82.5 68.3
Mean BMI (kg/m2)
Interviewer-measured 27.3 26.8
Self-reported 26.3 25.7
Interviewer-measured mean height, by age and sexBase: Aged 16 and over with valid height measurement
Hei
ght
(cm
)
Figure 10A
140
145
150
155
160
165
170
175
180
35-44 45-5416-24 25-34 55-64 65-74 75-84 85+
Men Women
Age group
Interviewer-measured mean weight, by age and sexBase: Aged 16 and over with valid weight measurement
Wei
ght
(kg
)
Figure 10B
0
10
20
30
40
50
60
70
80
90
35-44 45-5416-24 25-34 55-64 65-74 75-84 85+
Men Women
Age group

The comparisons in Table 10D on the previous page are limited to participants who both hadtheir height and/or weight measured and reported their own estimates; the figures thereforediffer slightly from those presented in Tables 10.2 and 10.3 (though in fact the results are verysimilar). This ‘like-for-like’ comparison showed that self-reported height was1.5cm greateramong men, and 1.0cm greater among women. Mean self-reported weight was 1.5kg less formen, and 2.0kg less for women. Men's greater tendency to overestimate height, and women’sgreater tendency to underestimate weight, resulted in a similar underestimation of BMI byboth sexes: 1.0kg/m2 for men and 1.1kg/m2 for women. Tables 10D, 10.2, Figures 10A, 10B
10.4 Prevalence of obesity, overweight and raised waistcircumference
10.4.1 Prevalence of obesity, overweight and raised waist circumference, by age andsex
Mean BMI, obesity and overweight
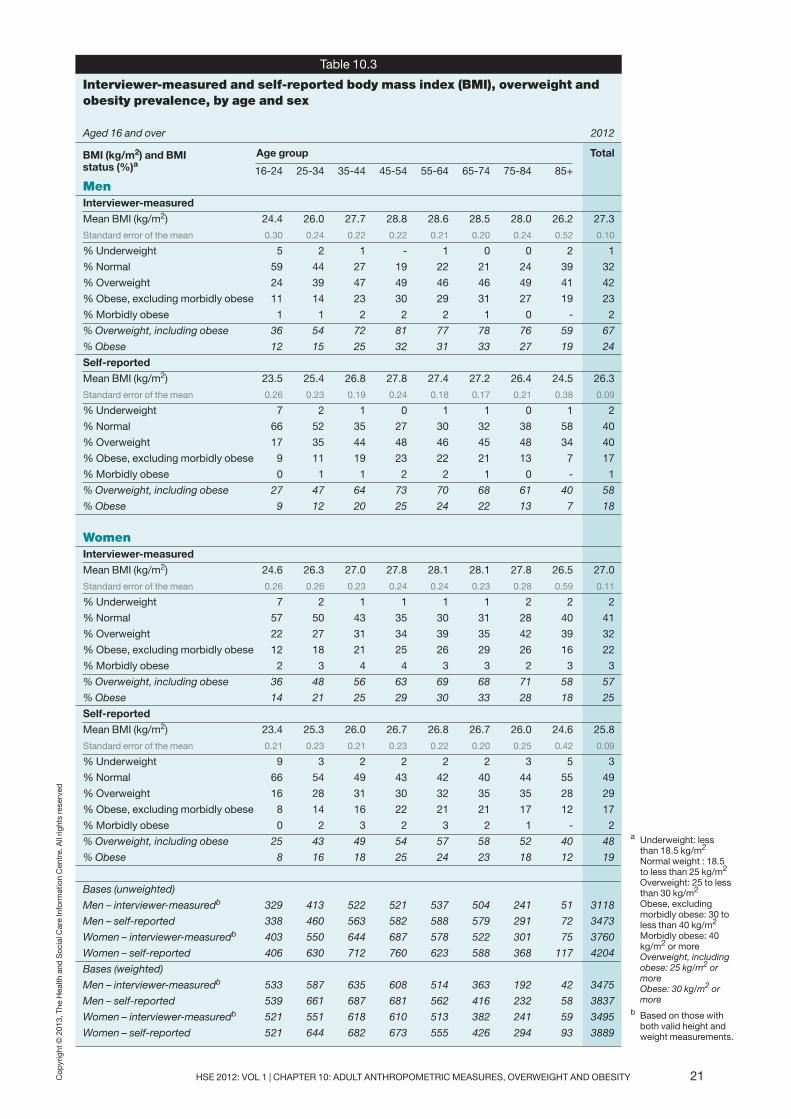
Mean BMI derived from interviewer measurements was higher among men (27.3kg/m2) thanwomen (27.0kg/m2) and followed a similar pattern in both sexes, rising between youth andmiddle age, before falling again in the oldest age groups.
A similar proportion of men and women were obese, including morbidly obese (24% and 25%respectively). Obesity rose from 12% of men and 14% of women aged 16-24, to 33% of menand women aged 65-74, before falling again to 19% of men and 18% of women aged 85 andover, as shown in Figure 10C. More men than women were overweight (42% and 32%respectively). Overweight also rose with age up to the age of 54, with similar levels amongolder age groups.
Overall, 67% of men and 57% of women were either overweight or obese. Taken together,these two groups increased from 36% of men and women aged 16-24, reaching 76-81% ofmen aged 45-84, and 68-71% of women aged 55-84, before decreasing somewhat to 59% ofmen and 58% of women aged 85 and over. Table 10.3, Figure 10C
Comparison with self-reported estimates
A substantial minority of those who were overweight gave estimated heights and weights thatyielded a ‘not overweight’ BMI (26% of overweight men and 29% of overweight women).Similarly 30% of men and 28% of women who were obese gave estimates that placed themin the ‘overweight’ or ‘not overweight or obese’ categories. Almost all the men and womenwho were not overweight (interviewer-measured) were also not overweight by their self-reported estimates of height and weight (95% of men and 97% of women). Table 10.6
HSE 2012: VOL 1 | CHAPTER 10: ADULT ANTHROPOMETRIC MEASURES, OVERWEIGHT AND OBESITY 9Copyright © 2013, The Health and Social Care Information Centre. All rights reserved
Interviewer-measured obesity, by age and sexBase: Aged 16 and over with valid height and weight measurement
Per
cent
Figure 10C
0
5
10
15
20
25
30
35
35-44 45-5416-24 25-34 55-64 65-74 75-84 85+
Men Women
Age group

Perception of weight
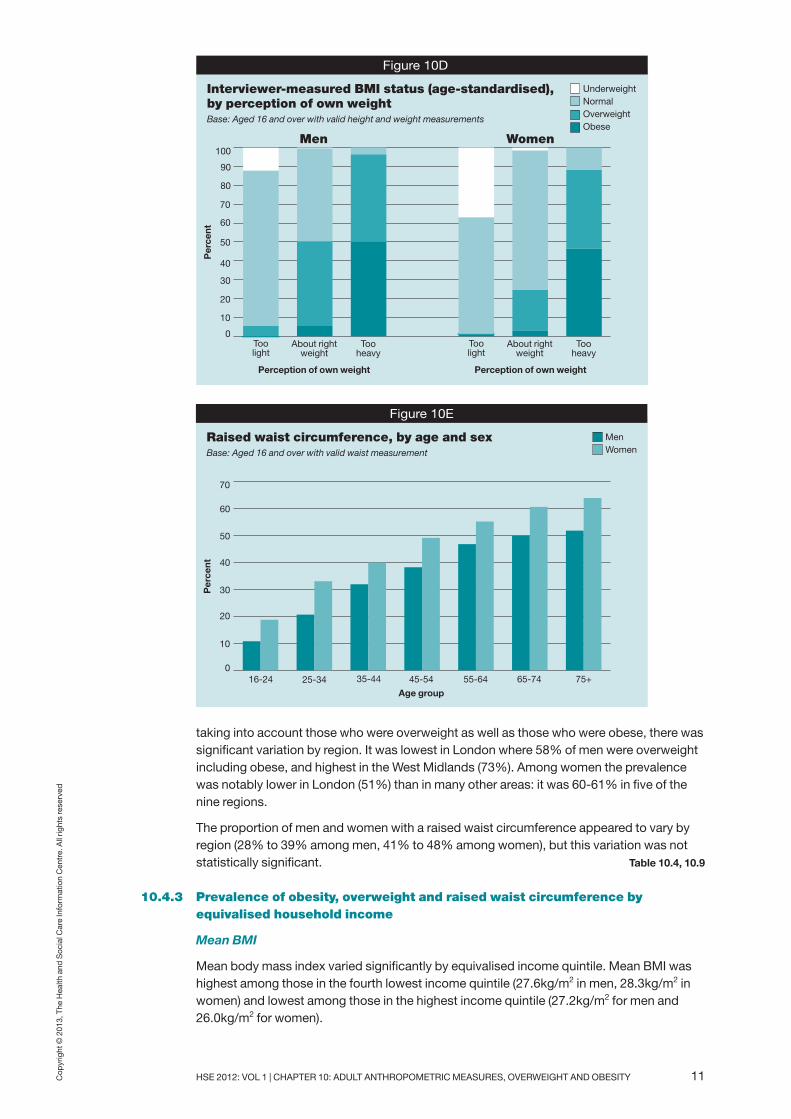
Table 10E below shows that around half of women (51%) and two fifths of men (42%) feltthat they were too heavy for someone of their age and height; a minority (6% of men and3% of women) felt that they were too light. Similarly substantial proportions of adults weretrying to change their weight (among women, 55% trying to lose, and 3% trying to gainweight; among men, 37% trying to lose and 8% trying to gain weight).
There tended to be a gap between perception of weight and classification of BMI, whichwas greater for men than for women. Half of men who felt that their weight was ‘about right’were in fact overweight (45%) or obese (5%). This group of men had a mean interviewer-measured BMI of 25.2kg/m2, on the threshold of the definition for overweight. Men who feltthat they were too heavy had a mean interviewer-measured BMI of 30.8kg/m2; 46% wereoverweight and a further 50% were obese. Only 12% of men who felt they were too lighthad a BMI in the underweight group, while 82% were within the normal BMI category and6% were in fact overweight.
In contrast with men, fewer women had a discrepancy between their perception of weightand classification of BMI. The mean BMI of women who felt they were about the rightweight (23.5kg/m2) was lower than for men who said the same. Compared with men, agreater proportion (74%) were in the normal BMI category, with only 22% overweight, and3% obese. Women who judged themselves to be too heavy had a similar profile to men: amean BMI of 30.6kg/m2, with 42% of women in this group being overweight and 46% beingobese, according to interviewer-measured BMI. Women who felt they were too light weremore likely than men to be underweight as measured by BMI (37% of women, comparedwith 12% of men), although 62% of women in this self-judged ‘too light’ group would beconsidered normal according to their BMI. The mean BMI (19.3kg/m2) for this group wasalso in the normal BMI range, though at the lower end. Tables 10E, 10.7, Figure 10D
Waist circumference
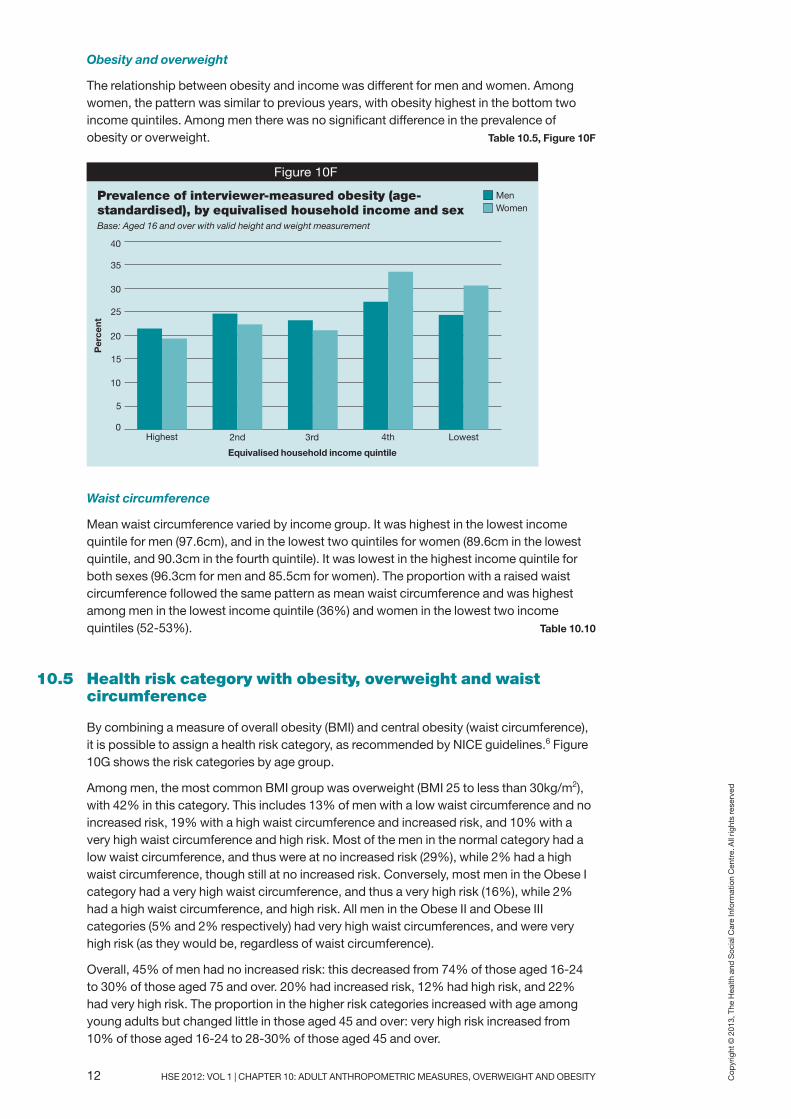
Mean waist circumference was 97.0cm for men and 87.6cm for women. Waistcircumference increased with age for both men and women. Unlike BMI (which decreasedin the oldest age groups compared with middle-age), the rise was continuous, from 85.5cmin men aged 16-24 to 103.0cm in men aged 75 and over and from 79.5cm to 92.4cm inwomen. For both men and women the increase was steeper in the younger age groups.
The definition of ‘raised waist circumference’ is more than 102cm for men, and more than88cm for women, so although men had a higher mean waist circumference, a greaterproportion of women had a raised circumference (45% of women, compared with 34% ofmen). As with the mean measurements, the proportion with a raised waist circumferenceincreased with age from 11% of men and 19% of women aged 16-24, to 52% of men and64% of women aged 75 and over. Table 10.8, Figure 10E
10.4.2 Prevalence of obesity, overweight and raised waist circumference by region
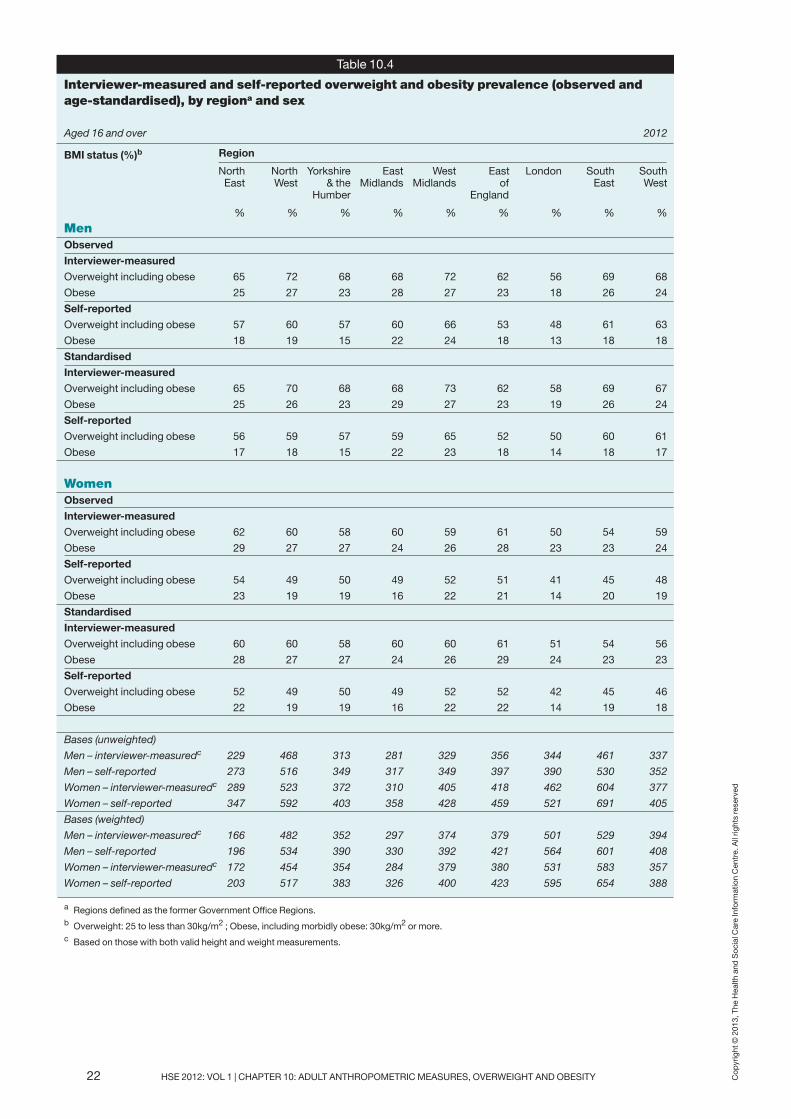
Age-standardised prevalence of interviewer-measured obesity did not vary significantly byregion, ranging from 19%-29% among men and 23%-29% among women. However,
10 HSE 2012: VOL 1 | CHAPTER 10: ADULT ANTHROPOMETRIC MEASURES, OVERWEIGHT AND OBESITY Copyright © 2013, The Health and Social Care Information Centre. All rights reserved
Table 10E
Perception of own weight, andintent to change
Men Women
% %
About the right weight 52 45
Too heavy 42 51
Too light 6 3
Not trying to change weight 55 42
Trying to lose weight 37 55
Trying to gain weight 8 3
taking into account those who were overweight as well as those who were obese, there wassignificant variation by region. It was lowest in London where 58% of men were overweightincluding obese, and highest in the West Midlands (73%). Among women the prevalencewas notably lower in London (51%) than in many other areas: it was 60-61% in five of thenine regions.
The proportion of men and women with a raised waist circumference appeared to vary byregion (28% to 39% among men, 41% to 48% among women), but this variation was notstatistically significant. Table 10.4, 10.9
10.4.3 Prevalence of obesity, overweight and raised waist circumference byequivalised household income
Mean BMI
Mean body mass index varied significantly by equivalised income quintile. Mean BMI washighest among those in the fourth lowest income quintile (27.6kg/m2 in men, 28.3kg/m2 inwomen) and lowest among those in the highest income quintile (27.2kg/m2 for men and26.0kg/m2 for women).
HSE 2012: VOL 1 | CHAPTER 10: ADULT ANTHROPOMETRIC MEASURES, OVERWEIGHT AND OBESITY 11Copyright © 2013, The Health and Social Care Information Centre. All rights reserved
Interviewer-measured BMI status (age-standardised), by perception of own weightBase: Aged 16 and over with valid height and weight measurements
Per
cent
Figure 10D
0
10
20
30
40
50
60
70
80
90
100
Toolight
About rightweight
Tooheavy
Toolight
About rightweight
Tooheavy
UnderweightNormalOverweightObese
Perception of own weight Perception of own weight
Men Women
Raised waist circumference, by age and sexBase: Aged 16 and over with valid waist measurement
Per
cent
Figure 10E
0
10
20
30
40
50
60
70
35-44 45-5416-24 25-34 55-64 65-74 75+
Men Women
Age group
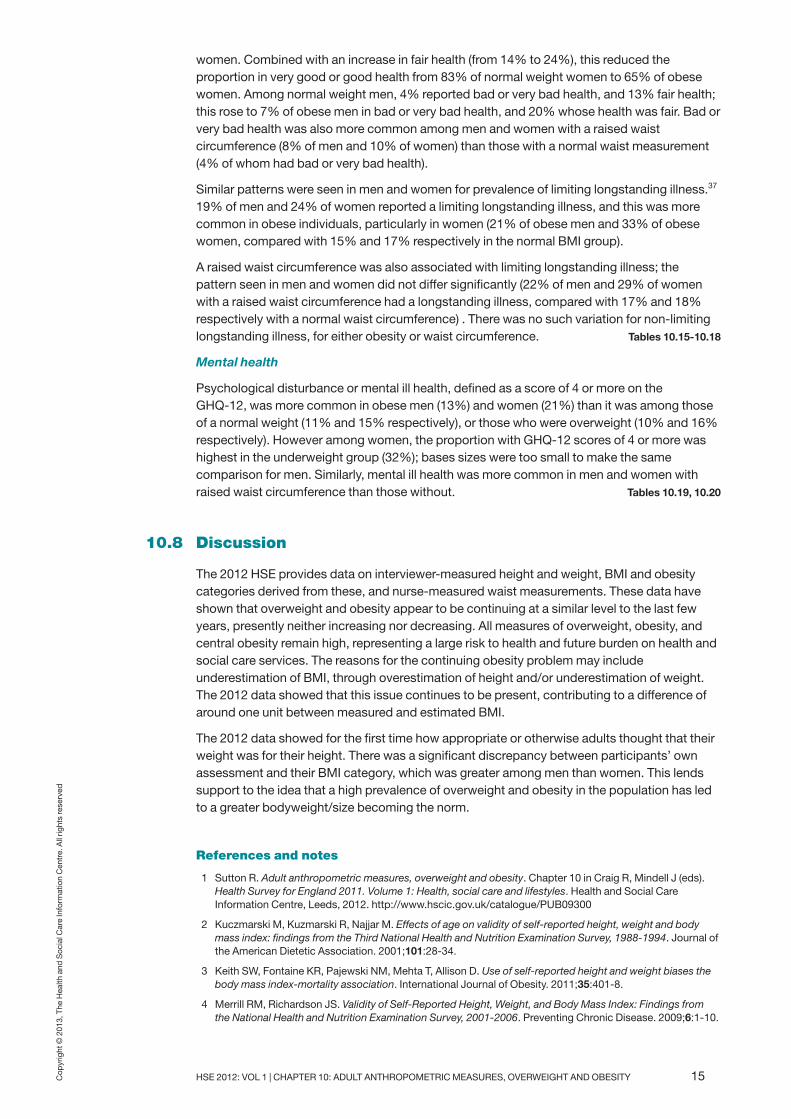
Obesity and overweight
The relationship between obesity and income was different for men and women. Amongwomen, the pattern was similar to previous years, with obesity highest in the bottom twoincome quintiles. Among men there was no significant difference in the prevalence ofobesity or overweight. Table 10.5, Figure 10F
Waist circumference
Mean waist circumference varied by income group. It was highest in the lowest incomequintile for men (97.6cm), and in the lowest two quintiles for women (89.6cm in the lowestquintile, and 90.3cm in the fourth quintile). It was lowest in the highest income quintile forboth sexes (96.3cm for men and 85.5cm for women). The proportion with a raised waistcircumference followed the same pattern as mean waist circumference and was highestamong men in the lowest income quintile (36%) and women in the lowest two incomequintiles (52-53%). Table 10.10
10.5 Health risk category with obesity, overweight and waistcircumference
By combining a measure of overall obesity (BMI) and central obesity (waist circumference),it is possible to assign a health risk category, as recommended by NICE guidelines.6 Figure10G shows the risk categories by age group.
Among men, the most common BMI group was overweight (BMI 25 to less than 30kg/m2),with 42% in this category. This includes 13% of men with a low waist circumference and noincreased risk, 19% with a high waist circumference and increased risk, and 10% with avery high waist circumference and high risk. Most of the men in the normal category had alow waist circumference, and thus were at no increased risk (29%), while 2% had a highwaist circumference, though still at no increased risk. Conversely, most men in the Obese Icategory had a very high waist circumference, and thus a very high risk (16%), while 2%had a high waist circumference, and high risk. All men in the Obese II and Obese IIIcategories (5% and 2% respectively) had very high waist circumferences, and were veryhigh risk (as they would be, regardless of waist circumference).
Overall, 45% of men had no increased risk: this decreased from 74% of those aged 16-24to 30% of those aged 75 and over. 20% had increased risk, 12% had high risk, and 22%had very high risk. The proportion in the higher risk categories increased with age amongyoung adults but changed little in those aged 45 and over: very high risk increased from10% of those aged 16-24 to 28-30% of those aged 45 and over.
12 HSE 2012: VOL 1 | CHAPTER 10: ADULT ANTHROPOMETRIC MEASURES, OVERWEIGHT AND OBESITY Copyright © 2013, The Health and Social Care Information Centre. All rights reserved
Prevalence of interviewer-measured obesity (age-standardised), by equivalised household income and sexBase: Aged 16 and over with valid height and weight measurement
Per
cent
Figure 10F
0
5
10
15
20
25
30
35
40
Highest 2nd 3rd
Equivalised household income quintile
4th Lowest
MenWomen

Among women, the most common BMI group was normal, including 41% of women.Compared with men, a higher proportion within this group had high or very high waistmeasurements: overall 28% had a low waist measurement, 11% a high waist measurement(both no increased risk), and 2% a very high waist measurement so increased risk. Of a totalof 32% of women who were overweight, 17% had a very high waist measurement and thuswere high risk, 11% a high waist circumference and increased risk, and only 4% had noincreased risk. As with men, almost all women in the obese categories had very high waistmeasurements, including 14% in Obese I, 6% in Obese II and 3% in Obese III, all with veryhigh risk.
Compared with men, a smaller proportion of women had no increased risk (42%), thoughsimilarly to men this decreased with age from 63% of women aged 16-24 to 26% of womenaged 75 and over. 13% of women had increased risk, 18% high risk, and 24% a very highrisk. The proportion with high risk increased with age, from 6% aged 16-24 to 35% aged 75and over. As with men, the proportion in the very high risk category increased with ageamong younger adults but varied less in women aged 45 and over, being 27-31%.
Table 10.11, Figure 10G
10.6 Trends in obesity and overweight
Obesity prevalence in men rose steadily through the 1990s, from 13% in 1993 to 19% in1999; since then, the increase has been more gradual, fluctuating around 24% from 2006 to2012. The pattern has been similar in women, with obesity rising from 16% in 1993 to 21%
HSE 2012: VOL 1 | CHAPTER 10: ADULT ANTHROPOMETRIC MEASURES, OVERWEIGHT AND OBESITY 13Copyright © 2013, The Health and Social Care Information Centre. All rights reserved
Risk based on BMI and waist circumference, by age and sexBase: Aged 16 and over with valid height, weight and waist measurements
Per
cent
Figure 10G
0
10
20
30
40
50
60
70
80
90
100
35-44 45-5416-24 25-34 55-64 65-74 75+
Not applicableNo increased riskIncreased riskHigh riskVery high risk
Age group
Men
Per
cent
0
10
20
30
40
50
60
70
80
90
100
35-44 45-5416-24 25-34 55-64 65-74 75+
Age group
Women

from 1998 to 2000, and more gradual increase since then. From 2005 to 2012, obesityprevalence has been 24-26%.
There has been little change in the proportion of adults who were overweight (excludingobese). Between 1993 and 2001, 44-47% of men were overweight, falling to 41-44% since2002. In women, the prevalence of overweight has remained at 31-34% throughout theperiod from 1993 to 2012.
The proportion of men and women who were overweight or obese in 2012 was similar to theprevious two years, and showed a similar relationship between sex, age, andoverweight/obesity. Table 10.12, Figure 10H
10.7 Health status by obesity, overweight and waist circumference
Hypertension
Hypertension was strongly associated with BMI, with prevalence doubling from 21% ofmen and 18% of women of normal weight to 43% of obese men and 38% of obese women.The increase was seen in all three categories of hypertension: controlled (with bloodpressure below 140/90mmHg due to medication), uncontrolled (on medication forhypertension, but systolic blood pressure above 140mmHg and/or diastolic above90mmHg) and untreated (not on medication for hypertension, despite blood pressure over140mmHg systolic and/or 90mmHg diastolic). Among those who were obese, 23% of menand 17% of women had untreated hypertension; 7% of men and 8% of women haduncontrolled hypertension, and 13% of each sex had controlled hypertension.
A similar relationship was shown with waist circumference: all categories of hypertensionwere higher among those with a raised waist circumference. Overall, 43% of men and 32%of women with a raised waist circumference had hypertension, compared with 24% of menand 19% of women without a raised waist circumference. Tables 10.13, 10.14
General health and longstanding illness
Overall, 78% of men and 74% of women reported that their health was very good or good.As obesity and waist circumference increased, the proportion of both men and womenreporting very good health decreased, and the proportion reporting fair, bad or very badhealth increased. For example, among women (in whom the difference was greater than formen), bad or very bad health increased from 4% of normal weight women to 11% of obese
14 HSE 2012: VOL 1 | CHAPTER 10: ADULT ANTHROPOMETRIC MEASURES, OVERWEIGHT AND OBESITY Copyright © 2013, The Health and Social Care Information Centre. All rights reserved
Overweight and obesity prevalence, 1993-2012, by sex (three year moving averages)Base: Aged 16 and over with valid height and weight measurements
Per
cent
Figure 10H
0
10
20
30
40
50
60
70
Men obeseMen overweight incl obeseWomen obeseWomen overweight incl obese
19941993
19951996
19971998
19992000
20012002
20032004
20052006
20072008
20092010
20112012
Year (mid year moving average)
Note: Data from 2003 onwards are weighted for non-response. Some points combine weighted and unweighted estimates.
women. Combined with an increase in fair health (from 14% to 24%), this reduced theproportion in very good or good health from 83% of normal weight women to 65% of obesewomen. Among normal weight men, 4% reported bad or very bad health, and 13% fair health;this rose to 7% of obese men in bad or very bad health, and 20% whose health was fair. Bad orvery bad health was also more common among men and women with a raised waistcircumference (8% of men and 10% of women) than those with a normal waist measurement(4% of whom had bad or very bad health).
Similar patterns were seen in men and women for prevalence of limiting longstanding illness.37
19% of men and 24% of women reported a limiting longstanding illness, and this was morecommon in obese individuals, particularly in women (21% of obese men and 33% of obesewomen, compared with 15% and 17% respectively in the normal BMI group).
A raised waist circumference was also associated with limiting longstanding illness; thepattern seen in men and women did not differ significantly (22% of men and 29% of womenwith a raised waist circumference had a longstanding illness, compared with 17% and 18%respectively with a normal waist circumference) . There was no such variation for non-limitinglongstanding illness, for either obesity or waist circumference. Tables 10.15-10.18
Mental health
Psychological disturbance or mental ill health, defined as a score of 4 or more on the GHQ-12, was more common in obese men (13%) and women (21%) than it was among thoseof a normal weight (11% and 15% respectively), or those who were overweight (10% and 16%respectively). However among women, the proportion with GHQ-12 scores of 4 or more washighest in the underweight group (32%); bases sizes were too small to make the samecomparison for men. Similarly, mental ill health was more common in men and women withraised waist circumference than those without. Tables 10.19, 10.20
10.8 Discussion
The 2012 HSE provides data on interviewer-measured height and weight, BMI and obesitycategories derived from these, and nurse-measured waist measurements. These data haveshown that overweight and obesity appear to be continuing at a similar level to the last fewyears, presently neither increasing nor decreasing. All measures of overweight, obesity, andcentral obesity remain high, representing a large risk to health and future burden on health andsocial care services. The reasons for the continuing obesity problem may includeunderestimation of BMI, through overestimation of height and/or underestimation of weight.The 2012 data showed that this issue continues to be present, contributing to a difference ofaround one unit between measured and estimated BMI.
The 2012 data showed for the first time how appropriate or otherwise adults thought that theirweight was for their height. There was a significant discrepancy between participants’ ownassessment and their BMI category, which was greater among men than women. This lendssupport to the idea that a high prevalence of overweight and obesity in the population has ledto a greater bodyweight/size becoming the norm.
References and notes
1 Sutton R. Adult anthropometric measures, overweight and obesity. Chapter 10 in Craig R, Mindell J (eds).Health Survey for England 2011. Volume 1: Health, social care and lifestyles. Health and Social CareInformation Centre, Leeds, 2012. http://www.hscic.gov.uk/catalogue/PUB09300
2 Kuczmarski M, Kuzmarski R, Najjar M. Effects of age on validity of self-reported height, weight and bodymass index: findings from the Third National Health and Nutrition Examination Survey, 1988-1994. Journal ofthe American Dietetic Association. 2001;101:28-34.
3 Keith SW, Fontaine KR, Pajewski NM, Mehta T, Allison D. Use of self-reported height and weight biases thebody mass index-mortality association. International Journal of Obesity. 2011;35:401-8.
4 Merrill RM, Richardson JS. Validity of Self-Reported Height, Weight, and Body Mass Index: Findings fromthe National Health and Nutrition Examination Survey, 2001-2006. Preventing Chronic Disease. 2009;6:1-10.
HSE 2012: VOL 1 | CHAPTER 10: ADULT ANTHROPOMETRIC MEASURES, OVERWEIGHT AND OBESITY 15Copyright © 2013, The Health and Social Care Information Centre. All rights reserved

5 Shiely F, Hayes K, Perry I, Kelleher C. Height and Weight Bias: The Influence of Time. PLOS ONE2013:8:e54386.
6 National Institute for Health and Clinical Excellence. Obesity: guidance on the prevention, identification,assessment and management of overweight and obesity in adults and children. NICE, London, 2006.www.nice.org.uk/guidance/CG43 page 4 (Accessed 18/08/2013).
7 Tabassum F. Adult anthropometric measures, overweight and obesity. Chapter 3 in Craig R, Shelton N(eds). Health Survey for England 2007. Volume 1: Healthy lifestyles: knowledge, attitudes and behaviour.Health and Social Care Information Centre, Leeds, 2008. www.hscic.gov.uk/pubs/hse07healthylifestyles(Accessed 25/09/2013)
8 Hirani V, Ali A. BMI, overweight, and obesity. Chapter 5 in Craig R, Mindell J (eds). Health Survey forEngland 2006, Volume 1: Cardiovascular disease and risk factors in adults. Health and Social CareInformation Centre, Leeds, 2008. www.hscic.gov.uk/pubs/hse06cvdandriskfactors (Accessed25/09/2013)
9 Hirani V. Anthropometric measures, overweight and obesity. Chapter 6 in Primatesta P, Erens B, Prior G(eds). Health Survey for England 2003. The Stationery Office, London, 2005. www.archive2.official-documents.co.uk/document/deps/doh/survey03/cardd/cardd05.htm
10 World Health Organisation. Fact Sheet No 311 Obesity and Overweight. WHO, Geneva, 2012.www.who.int/mediacentre/factsheets/fs311/en/index.html (Accessed 29/08/2013)
11 Prospective Studies Collaboration. Body-mass index and cause-specific mortality in 900,000 adults:collaborative analyses of 57 prospective studies. The Lancet. 2009;373:1083-96.
12 Calle E, Rodriguez C et al. Overweight, Obesity, and Mortality from Cancer in a Prospectively StudiedCohort of U.S. Adults. New England Journal of Medicine. 2003;348:1625-38.
13 Butland B, Jebb S, McPherson K et al. Tackling Obesities: Future Choices – Project report. GovernmentOffice for Science, London, 2007.
14 Health and Social Care Information Centre. Health Survey for England – 2011, Trend tables. Health andSocial Care Information Centre, Leeds, 2012. www.hscic.gov.uk/catalogue/PUB09302
15 Health and Social Care Information Centre. Statistics on Obesity, Physical Activity and Diet – England,2013. Health and Social Care Information Centre, Leeds, 2013.https://catalogue.ic.nhs.uk/publications/public-health/obesity/obes-phys-acti-diet-eng-2013/obes-phys-acti-diet-eng-2013-rep.pdf
16 NHS Atlas of Risk.www.nhs.uk/Tools/Pages/NHSAtlasofrisk.aspx
17 NHS Change4Life campaign.www.nhs.uk/Change4Life/Pages/why-change-for-life.aspx
18 Department of Health. Public Health Responsibility Deal. Department of Health, London, 2011.https://responsibilitydeal.dh.gov.uk/wp-content/uploads/2012/03/The-Public-Health-Responsibility-Deal-March-20111.pdf
19 NHS Health Check. www.nhs.uk/Planners/NHSHealthCheck/Pages/Thecheck.aspx
20 Department of Health. Living Well for Longer. Department of Health, London, 2013www.gov.uk/government/uploads/system/uploads/attachment_data/file/181103/Living_well_for_longer.pdf
21 Gorber SC, Tremblay M, Moher D, Gorber B. A comparison of direct vs. self-report measures forassessing height, weight and body mass index: a systematic review. Obesity Reviews. 2007;8:307–26.
22 Johnson F, Cooke L, Croker H et al. Changing perceptions of weight in Great Britain: comparison of twopopulation surveys. BMJ 2008; 337:a494.
23 Shiely F, Perry IJ, Lutomski J et al. Temporal trends in misclassification patterns of measured and self-report based body mass index categories – findings from three population surveys in Ireland. BMC PublicHealth. 2010;10:560.
24 Johnston D, Lordan G. Weight perceptions, weight control and income: An analysis using British data.Economics and Human Biology, 2013 e-publication ahead of print.www.sciencedirect.com/science/article/pii/S1570677X13000270
25 This chapter includes results of waist circumference measurements but not waist:hip ratios; details ofhow hip circumference was measured are therefore not included in this chapter but can be found inAppendix B, Volume 2 of this report.
26 The Frankfort Plane is an imaginary line passing through the external ear canal and across the top of thelower bone of the eye socket, immediately under the eye. A participant’s head is positioned so that theFrankfort Plane is horizontal. In this position the headplate of the stadiometer will rest on the crown of thehead.
27 In May 2008 and again in March 2010, the Department of Health issued an alert regarding the need touse Class III scales in certain settings; these include all measurements of those under the age of 18. TheNational Child Measurement Programme (NCMP) moved to using Class III scales, since it wasmonitoring children’s weight, and it was decided that scales in the HSE should also conform to thisstandard. Class III scales are manufactured to a more stringent standard of accuracy, and can provideaccurate measurements up to 200kg. www.dhsspsni.gov.uk/efa-2010-001a.pdf (Accessed 29/08/2013)
16 HSE 2012: VOL 1 | CHAPTER 10: ADULT ANTHROPOMETRIC MEASURES, OVERWEIGHT AND OBESITY Copyright © 2013, The Health and Social Care Information Centre. All rights reserved
28 World Health Organisation body mass index (BMI) classification.www.who.int/bmi/index.jsp?introPage=intro_3.html (Accessed 29/08/2013).
29 NHS Consensus Development Conference. Gastrointestinal surgery for severe obesity. Nutrition.1996;12:397-402.
30 National Institute for Health and Care Excellence. Body mass index and waist circumference thresholdsfor intervening to prevent ill health among black, Asian and other minority ethnic groups. Public healthguidance, PH46. NICE, London, 2013. www.nice.org.uk/nicemedia/live/14201/64332/64332.pdf(Accessed 25/09/2013)
31 Lean M, Han T, Morrison C. Waist circumference as a measure for indicating need for weightmanagement. BMJ 1995;311:158-61.
32 Schneider HJ, Friedrich N, Klotsche J et al. The Predictive Value of Different Measures of Obesity forIncident Cardiovascular Events and Mortality. The Journal of Clinical Endocrinology & Metabolism2010;95(4):1777–1785.
33 National Institutes of Health. Third Report of the National Cholesterol Education Program Expert Panel onDetection, Evaluation and Treatment of High Blood Cholesterol in Adults (Adult Treatment Panel III). NIHPublication 01-3670. NIH, Bethesda, Md, 2001.
34 Flegal KM. Waist circumference of healthy men and women in the United States. Int J Obes.2007;31:1134-9.
35 National Institute for Health and Clinical Excellence. Hypertension: clinical management of primaryhypertension in adults in primary care. NICE Clinical Guideline no 127. NICE, London, 2011.www.nice.org.uk/nicemedia/live/13561/56008/56008.pdf (Accessed 25/09/2013)
36 Williams B, Poulter NR, Brown MJ et al. Guidelines for management of hypertension: report of the fourthworking party of the British Hypertension Society, 2004-BHS IV. J Hum Hypertens. 2004;18:139-85.www.bhsoc.org/pdfs/BHS_IV_Guidelines.pdf (Accessed 25/09/2013)
37 The questions on longstanding illness changed in HSE 2012, from the wording used in the previous years‘long-standing illness, disability or infirmity’ to ‘any physical or mental health conditions or illnesses’. Thereference to a time period was also changed from ‘anything that has troubled you over a period of time,or that is likely to affect you over a period of time’ to ‘lasting or expected to last 12 months or more’.
HSE 2012: VOL 1 | CHAPTER 10: ADULT ANTHROPOMETRIC MEASURES, OVERWEIGHT AND OBESITY 17Copyright © 2013, The Health and Social Care Information Centre. All rights reserved
18 HSE 2012: VOL 1 | CHAPTER 10: ADULT ANTHROPOMETRIC MEASURES, OVERWEIGHT AND OBESITY Copyright © 2013, The Health and Social Care Information Centre. All rights reserved
Tables
10.1 Response to anthropometric measurements, byage and sex
10.2 Interviewer-measured and self-reported meanheight and weight, by age and sex
10.3 Interviewer-measured and self-reported bodymass index (BMI), overweight and obesityprevalence, by age and sex
10.4 Interviewer-measured and self-reportedoverweight and obesity prevalence (observedand age-standardised), by region and sex
10.5 Interviewer-measured and self-reported bodymass index (BMI), overweight and obesityprevalence (age-standardised), by equivalisedhousehold income and sex
10.6 Comparison of interviewer-measured and self-reported body mass index (BMI) status (age-standardised), by sex
10.7 Interviewer-measured and self-reported bodymass index (BMI), overweight and obesityprevalence (age-standardised), by perception ofown weight and sex
10.8 Waist circumference, by age and sex
10.9 Raised waist circumference (observed and age-standardised), by region and sex
10.10 Waist circumference (age-standardised), byequivalised household income and sex
10.11 Health risk category associated with overweightand obesity based on body mass index (BMI)and waist circumference, by age and sex
10.12 Trends in overweight and obesity prevalence,1993 to 2012, by age and sex
10.13 Hypertension categories (age-standardised), byinterviewer-measured body mass index (BMI)status and sex
10.14 Hypertension categories (age-standardised), bywaist circumference and sex
10.15 Self-reported general health (age-standardised), by interviewer-measured bodymass index (BMI) status and sex
10.16 Self-reported general health (age-standardised), by waist circumference and sex
10.17 Longstanding illness (age-standardised), byinterviewer-measured body mass index (BMI)status and sex
10.18 Longstanding illness (age-standardised), bywaist circumference and sex
10.19 GHQ-12 score (age-standardised), byinterviewer-measured body mass index (BMI)status and sex
10.20 GHQ-12 score (age-standardised), by waistcircumference and sex
Notes on the tables
1. The group on which the figures in the table are based is statedat the upper left corner of the table.
2. The data in most tables have been weighted. See Volume 2,Chapter 7 of this report for more detail. Both unweighted andweighted sample sizes are shown at the foot of each table.
3. Apart from tables showing age breakdowns, data have beenage-standardised to allow comparisons between groups afteradjusting for the effects of any differences in their agedistributions. See Volume 2, Chapter 8.4 of this report for moredetail.
4. The following conventions have been used in tables:- no observations (zero value)0 non-zero values of less than 0.5% and thus rounded to zero[ ] used to warn of small sample bases, if the unweighted baseis less than 50. If a group’s unweighted base is less than 30,data are normally not shown for that group.
5. Because of rounding, row or column percentages may not addexactly to 100%.
6. ‘Missing values’ occur for several reasons, including refusal orinability to answer a particular question; refusal to co-operatein an entire section of the survey (such as the nurse visit or aself-completion questionnaire); and cases where the questionis not applicable to the participant. In general, missing valueshave been omitted from all tables and analyses.
HSE 2012: VOL 1 | CHAPTER 10: ADULT ANTHROPOMETRIC MEASURES, OVERWEIGHT AND OBESITY 19Cop
yright © 2013, The Health and
Social C
are Inform
ation Centre. All rig
hts reservedTable 10.1
Response to anthropometric measurements, by age and sex
Aged 16 and over who were interviewed/had a nurse visit 2012
Age group Total
16-24 25-34 35-44 45-54 55-64 65-74 75-84 85+
% % % % % % % % %
MenHeight 88 86 89 86 87 85 80 62 86
Weight 88 86 88 85 88 87 84 67 86
BMI 87 85 88 85 86 85 79 61 85
Waist circumference 99 98 98 98 98 97 97 93 98
WomenHeight 91 88 89 87 86 85 78 55 86
Weight 90 85 87 85 85 84 82 65 85
BMI 89 84 86 84 84 82 76 54 83
Waist circumference 98 99 98 98 97 97 97 95 98
Bases (unweighted)
Men
Height, weight, BMI (interviewed) 379 485 593 615 624 596 305 84 3681
Waist circumference (saw nurse) 200 254 356 412 447 448 213 54 2384
Women
Height (interviewed) 467 695 768 819 688 638 396 139 4610
Weight, BMI (interviewed)a 451 651 748 818 688 638 396 139 4529
Waist circumference (saw nurse)a 273 382 476 574 504 471 273 82 3035
a Excluding pregnant women.
Proportion providing validmeasurements

20 HSE 2012: VOL 1 | CHAPTER 10: ADULT ANTHROPOMETRIC MEASURES, OVERWEIGHT AND OBESITY Cop
yright © 2013, The Health and
Social C
are Inform
ation Centre. All rig
hts reserved
Table 10.2
Interviewer-measured and self-reported mean height and weight, by age and sex
Aged 16 and over 2012
Age group Total
16-24 25-34 35-44 45-54 55-64 65-74 75-84 85+
MenMean height (m)
Interviewer-measured 177.0 177.8 176.3 175.3 173.9 172.3 171.5 166.9 175.3
Standard error of the mean 0.42 0.34 0.30 0.32 0.33 0.31 0.44 0.72 0.15
Self-reported 178.1 178.6 177.4 176.8 175.7 174.9 174.8 172.5 176.9
Standard error of the mean 0.43 0.33 0.31 0.31 0.32 0.31 0.40 0.64 0.15
Mean weight (kg)
Interviewer-measured 76.4 82.2 86.2 88.6 86.7 84. 7 82.6 74.1 84.0
Standard error of the mean 0.95 0.84 0.73 0.78 0.73 0.59 0.84 1.84 0.33
Self-reported 74.7 81.0 84.5 87.0 84.6 83.3 80.6 73.3 82.4
Standard error of the mean 0.85 0.78 0.65 0.80 0.67 0.55 0.73 1.38 0.31
WomenMean height (m)
Interviewer-measured 164.5 163.3 162.8 162.7 160.9 159.5 156.4 153.1 161.9
Standard error of the mean 0.33 0.32 0.23 0.24 0.28 0.29 0.38 0.72 0.12
Self-reported 164.9 163.7 163.6 163.3 161.8 161.3 159.7 158.9 162.8
Standard error of the mean 0.34 0.31 0.25 0.25 0.29 0.28 0.33 0.63 0.11
Mean weight (kg)
Interviewer-measured 66.5 70.2 71.5 73.6 72.8 71.5 68.2 62.3 70.7
Standard error of the mean 0.72 0.78 0.64 0.66 0.66 0.60 0.76 1.36 0.29
Self-reported 63.7 67.9 69.4 71.3 70.0 69.3 66.3 61.6 68.3
Standard error of the mean 0.58 0.66 0.57 0.61 0.60 0.54 0.69 1.04 0.25
Bases (unweighted)
Men
Interviewer-measured heighta 334 415 530 528 542 509 244 52 3154
Self-reported height 366 478 586 607 618 596 300 80 3631
Interviewer-measured weighta 332 416 522 525 547 518 256 56 3172
Self-reported weight 343 465 566 585 589 579 294 73 3494
Women
Interviewer-measured heighta 423 611 686 715 594 542 309 76 3956
Self-reported height 452 687 759 811 684 634 389 131 4547
Interviewer-measured weighta 404 553 649 692 586 533 326 90 3833
Self-reported weight 414 635 717 765 626 590 371 122 4240
Bases (weighted)
Men
Interviewer-measured heighta 540 591 644 616 520 367 195 43 3515
Self-reported height 582 688 715 709 591 429 240 65 4018
Interviewer-measured weighta 538 590 635 612 524 373 205 46 3524
Self-reported weight 546 668 692 685 563 416 235 59 3863
Women
Interviewer-measured heighta 545 615 659 635 526 397 247 60 3684
Self-reported height 579 697 723 719 612 461 312 104 4206
Interviewer-measured weighta 522 554 623 615 519 390 262 71 3555
Self-reported weight 532 649 687 677 558 428 297 97 3924
a Based on those with valid height measurement or valid weight measurement.
Mean height (m)and weight (kg)
HSE 2012: VOL 1 | CHAPTER 10: ADULT ANTHROPOMETRIC MEASURES, OVERWEIGHT AND OBESITY 21Cop
yright © 2013, The Health and
Social C
are Inform
ation Centre. All rig
hts reservedTable 10.3
Interviewer-measured and self-reported body mass index (BMI), overweight andobesity prevalence, by age and sex
Aged 16 and over 2012
Age group Total
16-24 25-34 35-44 45-54 55-64 65-74 75-84 85+
MenInterviewer-measured
Mean BMI (kg/m2) 24.4 26.0 27.7 28.8 28.6 28.5 28.0 26.2 27.3
Standard error of the mean 0.30 0.24 0.22 0.22 0.21 0.20 0.24 0.52 0.10
% Underweight 5 2 1 - 1 0 0 2 1
% Normal 59 44 27 19 22 21 24 39 32
% Overweight 24 39 47 49 46 46 49 41 42
% Obese, excluding morbidly obese 11 14 23 30 29 31 27 19 23
% Morbidly obese 1 1 2 2 2 1 0 - 2
% Overweight, including obese 36 54 72 81 77 78 76 59 67
% Obese 12 15 25 32 31 33 27 19 24
Self-reported
Mean BMI (kg/m2) 23.5 25.4 26.8 27.8 27.4 27.2 26.4 24.5 26.3
Standard error of the mean 0.26 0.23 0.19 0.24 0.18 0.17 0.21 0.38 0.09
% Underweight 7 2 1 0 1 1 0 1 2
% Normal 66 52 35 27 30 32 38 58 40
% Overweight 17 35 44 48 46 45 48 34 40
% Obese, excluding morbidly obese 9 11 19 23 22 21 13 7 17
% Morbidly obese 0 1 1 2 2 1 0 - 1
% Overweight, including obese 27 47 64 73 70 68 61 40 58
% Obese 9 12 20 25 24 22 13 7 18
WomenInterviewer-measured
Mean BMI (kg/m2) 24.6 26.3 27.0 27.8 28.1 28.1 27.8 26.5 27.0
Standard error of the mean 0.26 0.26 0.23 0.24 0.24 0.23 0.28 0.59 0.11
% Underweight 7 2 1 1 1 1 2 2 2
% Normal 57 50 43 35 30 31 28 40 41
% Overweight 22 27 31 34 39 35 42 39 32
% Obese, excluding morbidly obese 12 18 21 25 26 29 26 16 22
% Morbidly obese 2 3 4 4 3 3 2 3 3
% Overweight, including obese 36 48 56 63 69 68 71 58 57
% Obese 14 21 25 29 30 33 28 18 25
Self-reported
Mean BMI (kg/m2) 23.4 25.3 26.0 26.7 26.8 26.7 26.0 24.6 25.8
Standard error of the mean 0.21 0.23 0.21 0.23 0.22 0.20 0.25 0.42 0.09
% Underweight 9 3 2 2 2 2 3 5 3
% Normal 66 54 49 43 42 40 44 55 49
% Overweight 16 28 31 30 32 35 35 28 29
% Obese, excluding morbidly obese 8 14 16 22 21 21 17 12 17
% Morbidly obese 0 2 3 2 3 2 1 - 2
% Overweight, including obese 25 43 49 54 57 58 52 40 48
% Obese 8 16 18 25 24 23 18 12 19
Bases (unweighted)
Men – interviewer-measuredb 329 413 522 521 537 504 241 51 3118
Men – self-reported 338 460 563 582 588 579 291 72 3473
Women – interviewer-measuredb 403 550 644 687 578 522 301 75 3760
Women – self-reported 406 630 712 760 623 588 368 117 4204
Bases (weighted)
Men – interviewer-measuredb 533 587 635 608 514 363 192 42 3475
Men – self-reported 539 661 687 681 562 416 232 58 3837
Women – interviewer-measuredb 521 551 618 610 513 382 241 59 3495
Women – self-reported 521 644 682 673 555 426 294 93 3889
BMI (kg/m2) and BMIstatus (%)a
a Underweight: lessthan 18.5 kg/m2
Normal weight : 18.5to less than 25 kg/m2
Overweight: 25 to lessthan 30 kg/m2
Obese, excludingmorbidly obese: 30 toless than 40 kg/m2
Morbidly obese: 40kg/m2 or moreOverweight, includingobese: 25 kg/m2 ormoreObese: 30 kg/m2 ormore
b Based on those withboth valid height andweight measurements.
22 HSE 2012: VOL 1 | CHAPTER 10: ADULT ANTHROPOMETRIC MEASURES, OVERWEIGHT AND OBESITY Cop
yright © 2013, The Health and
Social C
are Inform
ation Centre. All rig
hts reserved
Interviewer-measured and self-reported overweight and obesity prevalence (observed andage-standardised), by regiona and sex
Aged 16 and over 2012
Region
North North Yorkshire East West East London South SouthEast West & the Midlands Midlands of East West
Humber England
% % % % % % % % %
MenObserved
Interviewer-measured
Overweight including obese 65 72 68 68 72 62 56 69 68
Obese 25 27 23 28 27 23 18 26 24
Self-reported
Overweight including obese 57 60 57 60 66 53 48 61 63
Obese 18 19 15 22 24 18 13 18 18
Standardised
Interviewer-measured
Overweight including obese 65 70 68 68 73 62 58 69 67
Obese 25 26 23 29 27 23 19 26 24
Self-reported
Overweight including obese 56 59 57 59 65 52 50 60 61
Obese 17 18 15 22 23 18 14 18 17
WomenObserved
Interviewer-measured
Overweight including obese 62 60 58 60 59 61 50 54 59
Obese 29 27 27 24 26 28 23 23 24
Self-reported
Overweight including obese 54 49 50 49 52 51 41 45 48
Obese 23 19 19 16 22 21 14 20 19
Standardised
Interviewer-measured
Overweight including obese 60 60 58 60 60 61 51 54 56
Obese 28 27 27 24 26 29 24 23 23
Self-reported
Overweight including obese 52 49 50 49 52 52 42 45 46
Obese 22 19 19 16 22 22 14 19 18
Bases (unweighted)
Men – interviewer-measuredc 229 468 313 281 329 356 344 461 337
Men – self-reported 273 516 349 317 349 397 390 530 352
Women – interviewer-measuredc 289 523 372 310 405 418 462 604 377
Women – self-reported 347 592 403 358 428 459 521 691 405
Bases (weighted)
Men – interviewer-measuredc 166 482 352 297 374 379 501 529 394
Men – self-reported 196 534 390 330 392 421 564 601 408
Women – interviewer-measuredc 172 454 354 284 379 380 531 583 357
Women – self-reported 203 517 383 326 400 423 595 654 388
a Regions defined as the former Government Office Regions.b Overweight: 25 to less than 30kg/m2 ; Obese, including morbidly obese: 30kg/m2 or more.c Based on those with both valid height and weight measurements.
BMI status (%)b
Table 10.4
HSE 2012: VOL 1 | CHAPTER 10: ADULT ANTHROPOMETRIC MEASURES, OVERWEIGHT AND OBESITY 23Cop
yright © 2013, The Health and
Social C
are Inform
ation Centre. All rig
hts reserved
Table 10.5
Interviewer-measured and self-reported body mass index(BMI), overweight and obesity prevalence (age-standardised), by equivalised household income and sex
Aged 16 and over 2012
Equivalised household income quintile
Highest 2nd 3rd 4th Lowest
MenInterviewer-measured
Mean BMI (kg/m2) 27.2 27.4 27.2 27.6 27.1
Standard error of the mean 0.24 0.19 0.22 0.31 0.24
% Underweight 1 0 1 1 3
% Normal 31 30 35 34 33
% Overweight 47 45 42 38 40
% Obese, excluding morbidly obese 20 24 22 24 23
% Morbidly obese 2 1 2 3 1
% Overweight, including obese 68 70 65 65 65
% Obese 21 25 23 27 24
Self-reported
% Overweight, including obese 57 61 56 59 56
% Obese 16 17 17 21 20
WomenInterviewer-measured
Mean BMI (kg/m2) 26.0 26.6 26.6 28.3 27.9
Standard error of the mean 0.23 0.24 0.24 0.28 0.27
% Underweight 1 2 2 2 2
% Normal 49 43 42 32 36
% Overweight 31 33 34 33 32
% Obese, excluding morbidly obese 17 20 19 28 25
% Morbidly obese 2 2 2 6 6
% Overweight, including obese 51 55 56 66 62
% Obese 19 22 21 33 31
Self-reported
% Overweight, including obese 41 47 46 55 54
% Obese 13 17 16 26 24
Bases (unweighted)
Men – interviewer-measuredb 539 643 526 424 444
Men – self-reported 587 688 576 463 483
Women – interviewer-measuredb 567 653 623 607 641
Women – self-reported 646 723 669 657 673
Bases (weighted)
Men – interviewer-measuredb 599 704 573 447 507
Men – self-reported 648 755 622 478 546
Women – interviewer-measuredb 539 614 564 536 584
Women – self-reported 612 680 608 577 605
a Underweight: less than 18.5 kg/m2
Normal weight : 18.5 to less than 25 kg/m2
Overweight: 25 to less than 30 kg/m2
Obese, excluding morbidly obese: 30 to less than 40 kg/m2
Morbidly obese: 40 kg/m2 or moreOverweight, including obese: 25 kg/m2 or moreObese: 30 kg/m2 or more
b Based on those with both valid height and weight measurements.
BMI (kg/m2) andBMI status (%)a

24 HSE 2012: VOL 1 | CHAPTER 10: ADULT ANTHROPOMETRIC MEASURES, OVERWEIGHT AND OBESITY Cop
yright © 2013, The Health and
Social C
are Inform
ation Centre. All rig
hts reserved
Table 10.6
Comparison of interviewer-measured andself-reported body mass index (BMI) status(age-standardised), by sex
Aged 16 and over with both self-reported and interviewer-measured height and weight 2012
Interviewer-measured BMI statusa
Not Overweight Obeseoverweight
% % %
MenNot overweight 95 26 1
Overweight 5 72 29
Obese 0 2 70
Overweight, including obese 5 74 99
WomenNot overweight 97 29 1
Overweight 3 68 26
Obese 0 2 72
Overweight, including obese 3 71 99
Bases (unweighted)
Men 890 1320 763
Women 1464 1152 877
Bases (weighted)
Men 1095 1394 806
Women 1423 1038 782
a Not overweight: less than 25kg/m2
Overweight: 25 to less than 30kg/m2
Obese: 30kg/m2 or moreOverweight, including obese: 25kg/m2 or more.
Self-reportedBMI statusa
Table 10.7
Interviewer-measured and self-reportedbody mass index (BMI), overweight andobesity prevalence (age-standardised), byperception of own weight and sex
Aged 16 and over 2012
Perception of own weight
About Too Tooright heavy light
weight
MenInterviewer-measured
Mean BMI (kg/m2) 25.2 30.8 21.2
Standard error of the mean 0.09 0.16 0.21
% Underweight 0 - 12
% Normal 49 4 82
% Overweight 45 46 6
% Obese, excluding morbidly obese 5 46 -
% Morbidly obese - 4 -
% Overweight, including obese 50 96 6
% Obese 5 50 -
Self-reported
% Overweight, including obese 36 93 5
% Obese 3 41 10
WomenInterviewer-measured
Mean BMI (kg/m2) 23.5 30.6 19.3
Standard error of the mean 0.08 0.15 0.28
% Underweight 1 - 37
% Normal 74 12 62
% Overweight 22 42 -
% Obese, excluding morbidly obese 3 40 1
% Morbidly obese 0 6 -
% Overweight, including obese 25 88 1
% Obese 3 46 1
Self-reported
% Overweight, including obese 15 82 1
% Obese 2 37 -
Bases (unweighted)
Men – interviewer-measuredb 1375 1211 146
Men – self-reported 1484 1266 158
Women – interviewer-measuredb 1445 1729 104
Women – self-reported 1565 1845 117
Bases (weighted)
Men – interviewer-measuredb 1561 1300 183
Men – self-reported 1663 1352 197
Women – interviewer-measuredb 1367 1581 102
Women – self-reported 1475 1678 111
a Underweight: less than 18.5 kg/m2
Normal weight : 18.5 to less than 25 kg/m2
Overweight: 25 to less than 30 kg/m2
Obese, excluding morbidly obese: 30 to less than 40 kg/m2
Morbidly obese: 40 kg/m2 or moreOverweight, including obese: 25 kg/m2 or moreObese: 30 kg/m2 or more
b Based on those with both valid height and weight measurements.
BMI (kg/m2) andBMI status (%)a

HSE 2012: VOL 1 | CHAPTER 10: ADULT ANTHROPOMETRIC MEASURES, OVERWEIGHT AND OBESITY 25Cop
yright © 2013, The Health and
Social C
are Inform
ation Centre. All rig
hts reserved
Table 10.8
Waist circumference, by age and sex
Aged 16 and over with a valid waist measurement 2012
Age group Total
16-24 25-34 35-44 45-54 55-64 65-74 75+
MenMean waist circumference (cm) 85.5 92.2 97.5 100.1 102.2 102.9 103.0 97.0
Standard error of the mean 1.07 0.81 0.76 0.67 0.60 0.58 0.66 0.37
% with raised waist circumference 11 21 32 38 47 50 52 34
WomenMean waist circumference (cm) 79.5 84.1 86.5 89.7 91.0 92.2 92.4 87.6
Standard error of the mean 0.84 0.79 0.66 0.65 0.60 0.65 0.68 0.30
% with raised waist circumference 19 33 40 49 55 61 64 45
Bases (unweighted)
Men 197 250 349 403 439 436 256 2330
Women 268 377 468 563 491 458 342 2967
Bases (weighted)
Men 381 433 459 457 382 270 194 2575
Women 367 411 460 460 385 294 268 2645
a Raised waist circumference: greater than 102cm in men and greater than 88cm in women.
Waist circumference (cm) andraised waist circumference (%)a
Raised waist circumference (observed and age-standardised), by regiona and sex
Aged 16 and over with a valid waist measurement 2012
Region
North North Yorkshire East West East London South SouthEast West & the Midlands Midlands of East West
Humber England
% % % % % % % % %
MenObserved
Raised waist circumference 30 37 29 39 37 33 25 40 31
Standardised
Raised waist circumference 30 36 29 38 38 33 28 39 30
WomenObserved
Raised waist circumference 48 44 48 45 44 49 42 42 44
Standardised
Raised waist circumference 48 44 46 45 45 48 44 41 41
Bases (unweighted)
Men 207 322 221 224 244 262 239 349 262
Women 259 400 267 263 308 323 319 512 316
Bases (weighted)
Men 129 346 267 229 270 284 384 387 277
Women 133 356 258 226 273 292 390 462 255
a Regions defined as the former Government Office Regions.b Raised waist circumference: greater than 102cm in men and greater than 88cm in women.
Waistcircumferenceb
Table 10.9

26 HSE 2012: VOL 1 | CHAPTER 10: ADULT ANTHROPOMETRIC MEASURES, OVERWEIGHT AND OBESITY Cop
yright © 2013, The Health and
Social C
are Inform
ation Centre. All rig
hts reserved
Table 10.10
Waist circumference (age-standardised), by equivalisedhousehold income and sex
Aged 16 and over with a valid waist measurement 2012
Equivalised household income quintile
Highest 2nd 3rd 4th Lowest
MenMean waist circumference (cm) 96.3 96.7 96.6 96.8 97.6
Standard error of the mean 0.92 0.67 0.87 1.09 1.00
% with raised waist circumference 31 31 32 34 36
WomenMean waist circumference (cm) 85.5 86.8 86.3 90.3 89.6
Standard error of the mean 0.74 0.69 0.69 0.83 0.81
% with raised waist circumference 37 43 39 53 52
Bases (unweighted)
Men 399 497 432 327 320
Women 468 513 532 484 474
Bases (weighted)
Men 439 540 449 350 375
Women 417 451 454 417 430
a Raised waist circumference: greater than 102cm in men and greater than 88cm in women.
Waist circumference (cm)and raised waistcircumference (%)a
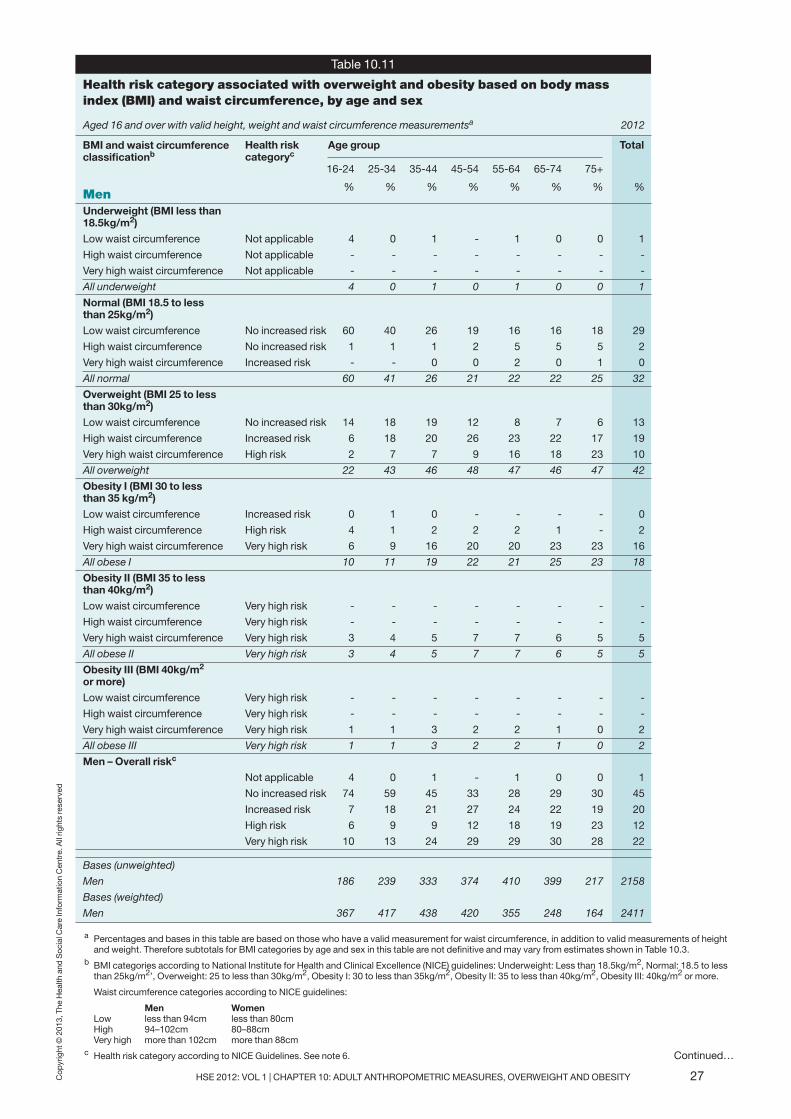
HSE 2012: VOL 1 | CHAPTER 10: ADULT ANTHROPOMETRIC MEASURES, OVERWEIGHT AND OBESITY 27Cop
yright © 2013, The Health and
Social C
are Inform
ation Centre. All rig
hts reservedTable 10.11
Health risk category associated with overweight and obesity based on body mass index (BMI) and waist circumference, by age and sex
Aged 16 and over with valid height, weight and waist circumference measurementsa 2012
Health risk Age group Totalcategoryc
16-24 25-34 35-44 45-54 55-64 65-74 75+
% % % % % % % %MenUnderweight (BMI less than 18.5kg/m2)
Low waist circumference Not applicable 4 0 1 - 1 0 0 1
High waist circumference Not applicable - - - - - - - -
Very high waist circumference Not applicable - - - - - - - -
All underweight 4 0 1 0 1 0 0 1
Normal (BMI 18.5 to less than 25kg/m2)
Low waist circumference No increased risk 60 40 26 19 16 16 18 29
High waist circumference No increased risk 1 1 1 2 5 5 5 2
Very high waist circumference Increased risk - - 0 0 2 0 1 0
All normal 60 41 26 21 22 22 25 32
Overweight (BMI 25 to less than 30kg/m2)
Low waist circumference No increased risk 14 18 19 12 8 7 6 13
High waist circumference Increased risk 6 18 20 26 23 22 17 19
Very high waist circumference High risk 2 7 7 9 16 18 23 10
All overweight 22 43 46 48 47 46 47 42
Obesity I (BMI 30 to less than 35 kg/m2)
Low waist circumference Increased risk 0 1 0 - - - - 0
High waist circumference High risk 4 1 2 2 2 1 - 2
Very high waist circumference Very high risk 6 9 16 20 20 23 23 16
All obese I 10 11 19 22 21 25 23 18
Obesity II (BMI 35 to less than 40kg/m2)
Low waist circumference Very high risk - - - - - - - -
High waist circumference Very high risk - - - - - - - -
Very high waist circumference Very high risk 3 4 5 7 7 6 5 5
All obese II Very high risk 3 4 5 7 7 6 5 5
Obesity III (BMI 40kg/m2
or more)
Low waist circumference Very high risk - - - - - - - -
High waist circumference Very high risk - - - - - - - -
Very high waist circumference Very high risk 1 1 3 2 2 1 0 2
All obese III Very high risk 1 1 3 2 2 1 0 2
Men – Overall riskc
Not applicable 4 0 1 - 1 0 0 1
No increased risk 74 59 45 33 28 29 30 45
Increased risk 7 18 21 27 24 22 19 20
High risk 6 9 9 12 18 19 23 12
Very high risk 10 13 24 29 29 30 28 22
Bases (unweighted)
Men 186 239 333 374 410 399 217 2158
Bases (weighted)
Men 367 417 438 420 355 248 164 2411
BMI and waist circumferenceclassificationb
a Percentages and bases in this table are based on those who have a valid measurement for waist circumference, in addition to valid measurements of heightand weight. Therefore subtotals for BMI categories by age and sex in this table are not definitive and may vary from estimates shown in Table 10.3.
b BMI categories according to National Institute for Health and Clinical Excellence (NICE) guidelines: Underweight: Less than 18.5kg/m2, Normal: 18.5 to lessthan 25kg/m2’, Overweight: 25 to less than 30kg/m2, Obesity I: 30 to less than 35kg/m2, Obesity II: 35 to less than 40kg/m2, Obesity III: 40kg/m2 or more.
Waist circumference categories according to NICE guidelines:
Men WomenLow less than 94cm less than 80cmHigh 94–102cm 80–88cmVery high more than 102cm more than 88cm
c Health risk category according to NICE Guidelines. See note 6. Continued…
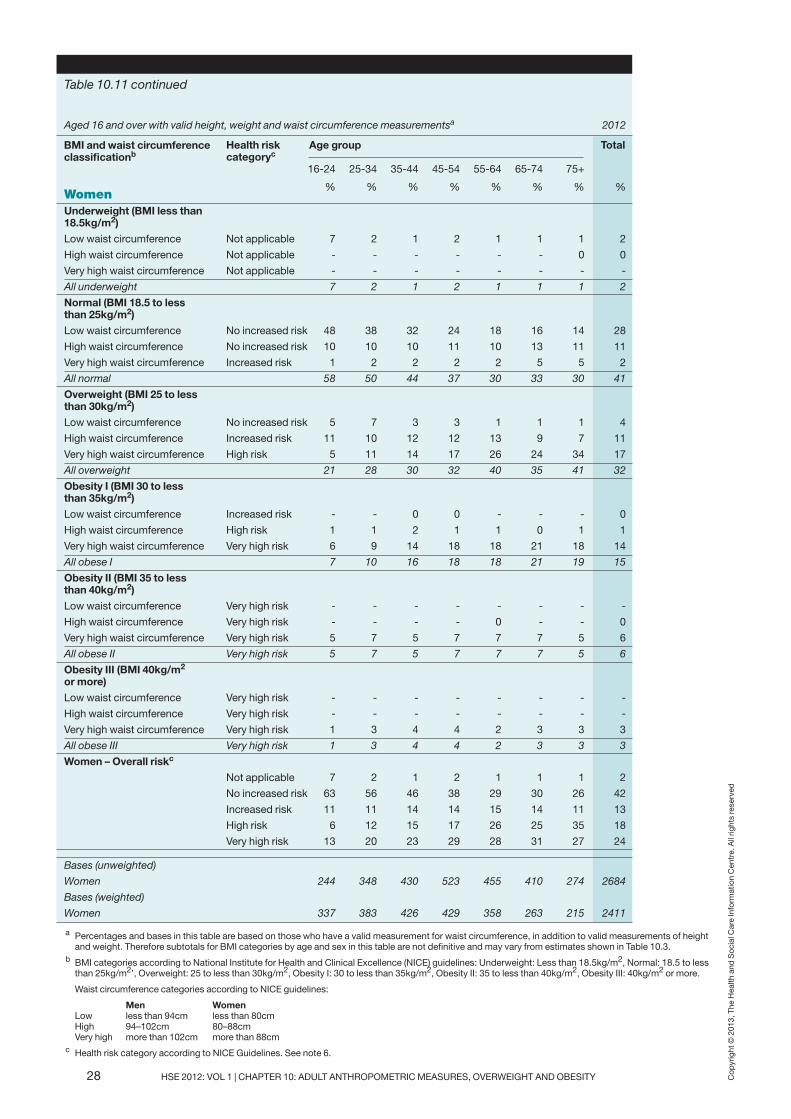
28 HSE 2012: VOL 1 | CHAPTER 10: ADULT ANTHROPOMETRIC MEASURES, OVERWEIGHT AND OBESITY Cop
yright © 2013, The Health and
Social C
are Inform
ation Centre. All rig
hts reserved
Table 10.11 continued
Aged 16 and over with valid height, weight and waist circumference measurementsa 2012
Health risk Age group Totalcategoryc
16-24 25-34 35-44 45-54 55-64 65-74 75+
% % % % % % % %WomenUnderweight (BMI less than 18.5kg/m2)
Low waist circumference Not applicable 7 2 1 2 1 1 1 2
High waist circumference Not applicable - - - - - - 0 0
Very high waist circumference Not applicable - - - - - - - -
All underweight 7 2 1 2 1 1 1 2
Normal (BMI 18.5 to less than 25kg/m2)
Low waist circumference No increased risk 48 38 32 24 18 16 14 28
High waist circumference No increased risk 10 10 10 11 10 13 11 11
Very high waist circumference Increased risk 1 2 2 2 2 5 5 2
All normal 58 50 44 37 30 33 30 41
Overweight (BMI 25 to less than 30kg/m2)
Low waist circumference No increased risk 5 7 3 3 1 1 1 4
High waist circumference Increased risk 11 10 12 12 13 9 7 11
Very high waist circumference High risk 5 11 14 17 26 24 34 17
All overweight 21 28 30 32 40 35 41 32
Obesity I (BMI 30 to less than 35kg/m2)
Low waist circumference Increased risk - - 0 0 - - - 0
High waist circumference High risk 1 1 2 1 1 0 1 1
Very high waist circumference Very high risk 6 9 14 18 18 21 18 14
All obese I 7 10 16 18 18 21 19 15
Obesity II (BMI 35 to less than 40kg/m2)
Low waist circumference Very high risk - - - - - - - -
High waist circumference Very high risk - - - - 0 - - 0
Very high waist circumference Very high risk 5 7 5 7 7 7 5 6
All obese II Very high risk 5 7 5 7 7 7 5 6
Obesity III (BMI 40kg/m2
or more)
Low waist circumference Very high risk - - - - - - - -
High waist circumference Very high risk - - - - - - - -
Very high waist circumference Very high risk 1 3 4 4 2 3 3 3
All obese III Very high risk 1 3 4 4 2 3 3 3
Women – Overall riskc
Not applicable 7 2 1 2 1 1 1 2
No increased risk 63 56 46 38 29 30 26 42
Increased risk 11 11 14 14 15 14 11 13
High risk 6 12 15 17 26 25 35 18
Very high risk 13 20 23 29 28 31 27 24
Bases (unweighted)
Women 244 348 430 523 455 410 274 2684
Bases (weighted)
Women 337 383 426 429 358 263 215 2411
BMI and waist circumferenceclassificationb
a Percentages and bases in this table are based on those who have a valid measurement for waist circumference, in addition to valid measurements of heightand weight. Therefore subtotals for BMI categories by age and sex in this table are not definitive and may vary from estimates shown in Table 10.3.
b BMI categories according to National Institute for Health and Clinical Excellence (NICE) guidelines: Underweight: Less than 18.5kg/m2, Normal: 18.5 to lessthan 25kg/m2’, Overweight: 25 to less than 30kg/m2, Obesity I: 30 to less than 35kg/m2, Obesity II: 35 to less than 40kg/m2, Obesity III: 40kg/m2 or more.
Waist circumference categories according to NICE guidelines:
Men WomenLow less than 94cm less than 80cmHigh 94–102cm 80–88cmVery high more than 102cm more than 88cm
c Health risk category according to NICE Guidelines. See note 6.
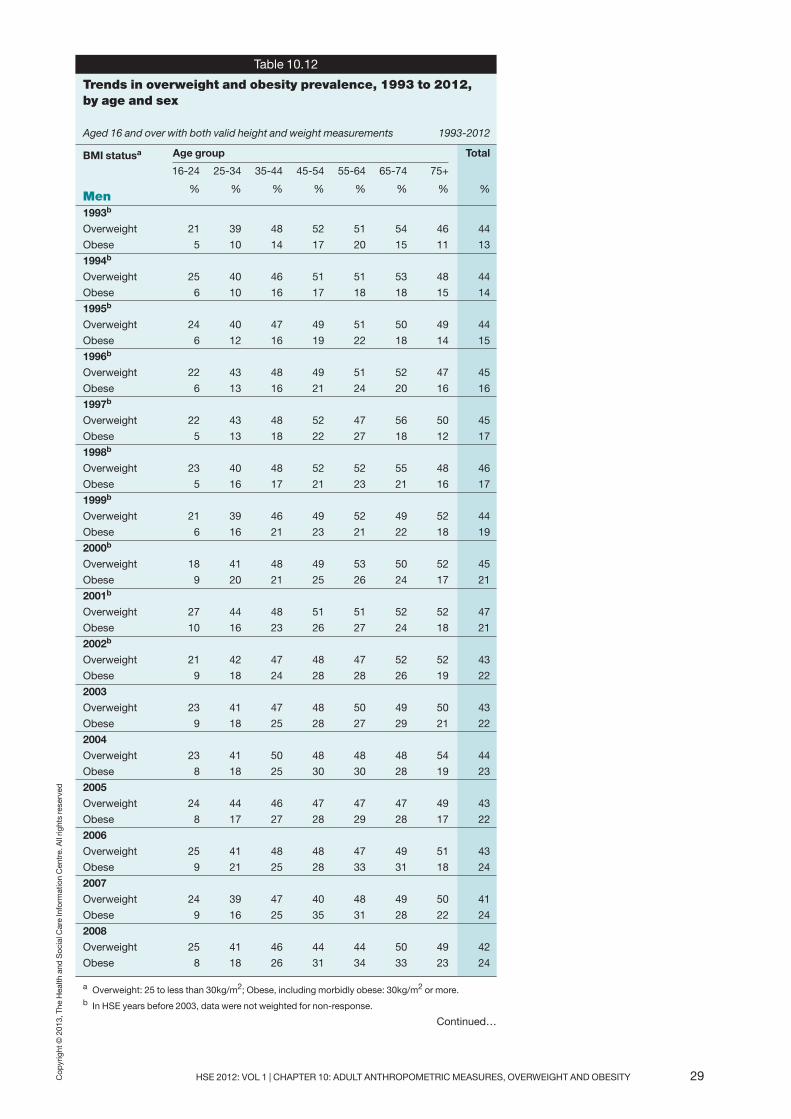
HSE 2012: VOL 1 | CHAPTER 10: ADULT ANTHROPOMETRIC MEASURES, OVERWEIGHT AND OBESITY 29Cop
yright © 2013, The Health and
Social C
are Inform
ation Centre. All rig
hts reserved
Table 10.12
Trends in overweight and obesity prevalence, 1993 to 2012, by age and sex
Aged 16 and over with both valid height and weight measurements 1993-2012
Age group Total
16-24 25-34 35-44 45-54 55-64 65-74 75+
% % % % % % % %Men1993b
Overweight 21 39 48 52 51 54 46 44
Obese 5 10 14 17 20 15 11 13
1994b
Overweight 25 40 46 51 51 53 48 44
Obese 6 10 16 17 18 18 15 14
1995b
Overweight 24 40 47 49 51 50 49 44
Obese 6 12 16 19 22 18 14 15
1996b
Overweight 22 43 48 49 51 52 47 45
Obese 6 13 16 21 24 20 16 16
1997b
Overweight 22 43 48 52 47 56 50 45
Obese 5 13 18 22 27 18 12 17
1998b
Overweight 23 40 48 52 52 55 48 46
Obese 5 16 17 21 23 21 16 17
1999b
Overweight 21 39 46 49 52 49 52 44
Obese 6 16 21 23 21 22 18 19
2000b
Overweight 18 41 48 49 53 50 52 45
Obese 9 20 21 25 26 24 17 21
2001b
Overweight 27 44 48 51 51 52 52 47
Obese 10 16 23 26 27 24 18 21
2002b
Overweight 21 42 47 48 47 52 52 43
Obese 9 18 24 28 28 26 19 22
2003
Overweight 23 41 47 48 50 49 50 43
Obese 9 18 25 28 27 29 21 22
2004
Overweight 23 41 50 48 48 48 54 44
Obese 8 18 25 30 30 28 19 23
2005
Overweight 24 44 46 47 47 47 49 43
Obese 8 17 27 28 29 28 17 22
2006
Overweight 25 41 48 48 47 49 51 43
Obese 9 21 25 28 33 31 18 24
2007
Overweight 24 39 47 40 48 49 50 41
Obese 9 16 25 35 31 28 22 24
2008
Overweight 25 41 46 44 44 50 49 42
Obese 8 18 26 31 34 33 23 24
a Overweight: 25 to less than 30kg/m2; Obese, including morbidly obese: 30kg/m2 or more.b In HSE years before 2003, data were not weighted for non-response.
Continued…
BMI statusa
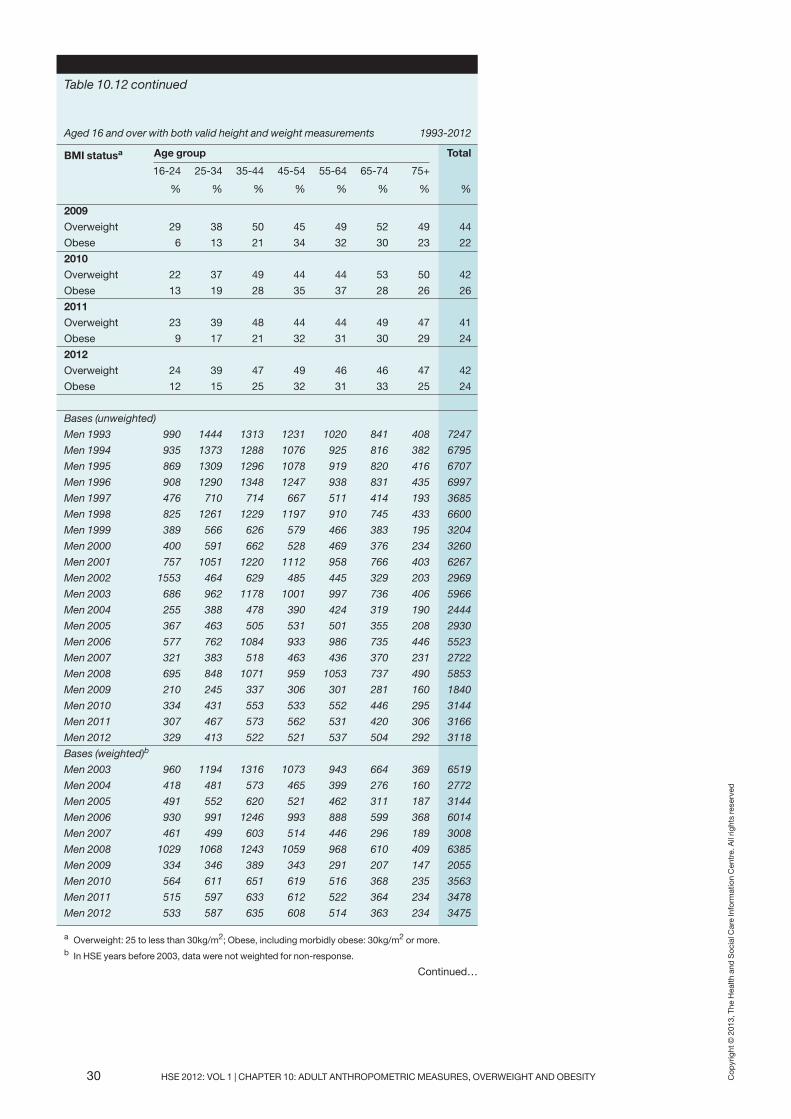
30 HSE 2012: VOL 1 | CHAPTER 10: ADULT ANTHROPOMETRIC MEASURES, OVERWEIGHT AND OBESITY Cop
yright © 2013, The Health and
Social C
are Inform
ation Centre. All rig
hts reserved
Table 10.12 continued
Aged 16 and over with both valid height and weight measurements 1993-2012
Age group Total
16-24 25-34 35-44 45-54 55-64 65-74 75+
% % % % % % % %
2009
Overweight 29 38 50 45 49 52 49 44
Obese 6 13 21 34 32 30 23 22
2010
Overweight 22 37 49 44 44 53 50 42
Obese 13 19 28 35 37 28 26 26
2011
Overweight 23 39 48 44 44 49 47 41
Obese 9 17 21 32 31 30 29 24
2012
Overweight 24 39 47 49 46 46 47 42
Obese 12 15 25 32 31 33 25 24
Bases (unweighted)
Men 1993 990 1444 1313 1231 1020 841 408 7247
Men 1994 935 1373 1288 1076 925 816 382 6795
Men 1995 869 1309 1296 1078 919 820 416 6707
Men 1996 908 1290 1348 1247 938 831 435 6997
Men 1997 476 710 714 667 511 414 193 3685
Men 1998 825 1261 1229 1197 910 745 433 6600
Men 1999 389 566 626 579 466 383 195 3204
Men 2000 400 591 662 528 469 376 234 3260
Men 2001 757 1051 1220 1112 958 766 403 6267
Men 2002 1553 464 629 485 445 329 203 2969
Men 2003 686 962 1178 1001 997 736 406 5966
Men 2004 255 388 478 390 424 319 190 2444
Men 2005 367 463 505 531 501 355 208 2930
Men 2006 577 762 1084 933 986 735 446 5523
Men 2007 321 383 518 463 436 370 231 2722
Men 2008 695 848 1071 959 1053 737 490 5853
Men 2009 210 245 337 306 301 281 160 1840
Men 2010 334 431 553 533 552 446 295 3144
Men 2011 307 467 573 562 531 420 306 3166
Men 2012 329 413 522 521 537 504 292 3118
Bases (weighted)b
Men 2003 960 1194 1316 1073 943 664 369 6519
Men 2004 418 481 573 465 399 276 160 2772
Men 2005 491 552 620 521 462 311 187 3144
Men 2006 930 991 1246 993 888 599 368 6014
Men 2007 461 499 603 514 446 296 189 3008
Men 2008 1029 1068 1243 1059 968 610 409 6385
Men 2009 334 346 389 343 291 207 147 2055
Men 2010 564 611 651 619 516 368 235 3563
Men 2011 515 597 633 612 522 364 234 3478
Men 2012 533 587 635 608 514 363 234 3475
a Overweight: 25 to less than 30kg/m2; Obese, including morbidly obese: 30kg/m2 or more.b In HSE years before 2003, data were not weighted for non-response.
Continued…
BMI statusa

HSE 2012: VOL 1 | CHAPTER 10: ADULT ANTHROPOMETRIC MEASURES, OVERWEIGHT AND OBESITY 31Cop
yright © 2013, The Health and
Social C
are Inform
ation Centre. All rig
hts reserved
b
Table 10.12 continued
Aged 16 and over with both valid height and weight measurements 1993-2012
Age group Total
16-24 25-34 35-44 45-54 55-64 65-74 75+
% % % % % % % %Women1993b
Overweight 20 25 29 37 39 41 42 32
Obese 8 11 17 19 24 22 16 16
1994b
Overweight 20 25 28 36 39 41 36 31
Obese 8 13 17 18 26 25 16 17
1995b
Overweight 19 25 31 36 42 45 41 33
Obese 8 13 17 22 23 24 17 18
1996b
Overweight 19 28 30 39 41 43 40 34
Obese 8 15 18 19 28 25 20 18
1997b
Overweight 19 27 32 36 37 44 41 33
Obese 9 15 18 23 30 25 22 20
1998b
Overweight 17 27 30 36 39 41 35 32
Obese 11 16 21 24 29 29 21 21
1999b
Overweight 19 27 34 35 40 40 40 33
Obese 10 16 19 26 29 30 20 21
2000b
Overweight 22 27 31 36 41 41 41 34
Obese 9 16 19 24 29 30 23 21
2001b
Overweight 22 26 31 36 38 41 41 33
Obese 12 19 22 28 31 30 20 23
2002b
Overweight 21 27 34 38 36 38 43 34
Obese 11 21 23 25 29 28 22 23
2003
Overweight 18 28 33 33 39 41 40 33
Obese 13 18 22 26 28 30 26 23
2004
Overweight 24 31 30 36 37 40 46 34
Obese 12 17 24 27 32 29 21 23
2005
Overweight 19 27 30 35 37 42 40 32
Obese 12 19 25 28 28 34 26 24
2006
Overweight 20 29 30 35 36 38 42 32
Obese 12 18 24 27 30 35 27 24
2007
Overweight 22 25 35 32 37 37 40 32
Obese 10 19 24 30 31 32 27 24
2008
Overweight 20 27 31 35 38 38 40 32
Obese 14 19 25 29 31 33 26 25
a Overweight: 25 to less than 30kg/m2; Obese, including morbidly obese: 30kg/m2 or more.b In HSE years before 2003, data were not weighted for non-response.
Continued…
BMI statusa

32 HSE 2012: VOL 1 | CHAPTER 10: ADULT ANTHROPOMETRIC MEASURES, OVERWEIGHT AND OBESITY Cop
yright © 2013, The Health and
Social C
are Inform
ation Centre. All rig
hts reserved
Table 10.12 continued
Aged 16 and over with both valid height and weight measurements 1993-2012
Age group Total
16-24 25-34 35-44 45-54 55-64 65-74 75+
% % % % % % % %
2009
Overweight 23 27 29 36 39 44 35 33
Obese 17 16 24 27 29 31 26 24
2010
Overweight 21 28 30 34 39 37 37 32
Obese 11 21 26 30 32 37 27 26
2011
Overweight 21 26 36 35 36 38 39 33
Obese 12 20 25 31 32 32 32 26
2012
Overweight 22 27 31 34 39 35 42 32
Obese 14 21 25 29 30 33 26 25
Bases (unweighted)
Women 1993 1020 1544 1459 1306 1060 991 657 8037
Women 1994 990 1524 1418 1227 988 1048 689 7884
Women 1995 979 1521 1394 1258 1028 936 613 7729
Women 1996 1016 1500 1493 1385 1007 986 677 8064
Women 1997 510 816 780 766 552 479 351 4254
Women 1998 903 1433 1449 1373 1043 853 676 7730
Women 1999 459 647 744 689 465 410 285 3699
Women 2000 362 674 778 632 509 422 326 3703
Women 2001 856 1221 1513 1331 1038 871 584 7414
Women 2002 1719 513 737 590 519 403 300 3509
Women 2003 788 1088 1452 1142 1194 810 616 7090
Women 2004 294 453 649 527 538 393 281 3135
Women 2005 385 531 668 614 588 364 259 3409
Women 2006 679 935 1308 1125 1106 776 575 6504
Women 2007 324 474 632 559 522 415 281 3207
Women 2008 787 1026 1309 1176 1196 828 661 6983
Women 2009 233 299 426 342 343 286 192 2121
Women 2010 387 559 693 750 613 460 381 3843
Women 2011 401 587 688 686 639 500 371 3872
Women 2012 403 550 644 687 578 522 376 3760
Bases (weighted)
Women 2003 912 1085 1289 1073 982 694 536 6570
Women 2004 378 460 564 459 425 295 231 2812
Women 2005 432 524 628 517 489 322 272 3184
Women 2006 866 942 1207 996 914 637 511 6074
Women 2007 405 466 599 497 452 312 252 2983
Women 2008 935 1020 1241 1057 985 663 549 6450
Women 2009 297 315 393 346 313 216 166 2045
Women 2010 500 544 643 631 529 378 297 3523
Women 2011 503 552 628 612 534 391 310 3530
Women 2012 521 551 618 610 513 382 300 3495
a Overweight: 25 to less than 30kg/m2; Obese, including morbidly obese: 30kg/m2 or more.b In HSE years before 2003, data were not weighted for non-response.
BMI statusa
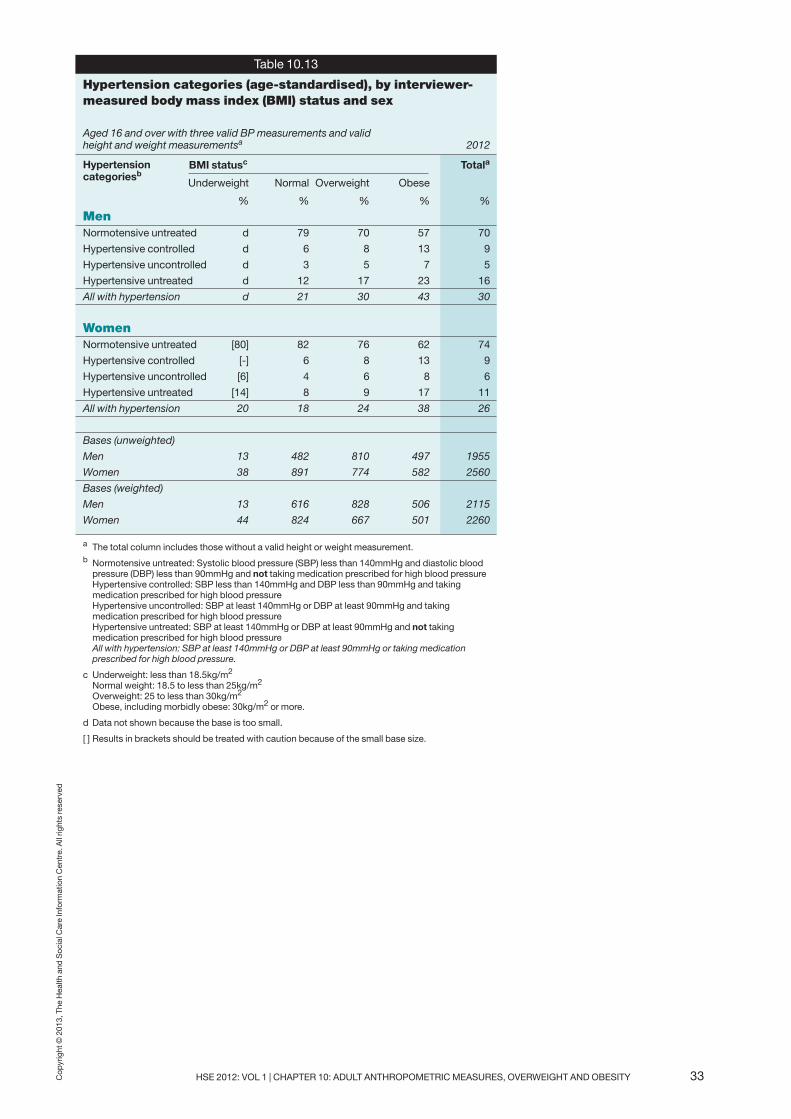
HSE 2012: VOL 1 | CHAPTER 10: ADULT ANTHROPOMETRIC MEASURES, OVERWEIGHT AND OBESITY 33Cop
yright © 2013, The Health and
Social C
are Inform
ation Centre. All rig
hts reserved
Table 10.13
Hypertension categories (age-standardised), by interviewer-measured body mass index (BMI) status and sex
Aged 16 and over with three valid BP measurements and valid height and weight measurementsa 2012
BMI statusc Totala
Underweight Normal Overweight Obese
% % % % %
MenNormotensive untreated d 79 70 57 70
Hypertensive controlled d 6 8 13 9
Hypertensive uncontrolled d 3 5 7 5
Hypertensive untreated d 12 17 23 16
All with hypertension d 21 30 43 30
WomenNormotensive untreated [80] 82 76 62 74
Hypertensive controlled [-] 6 8 13 9
Hypertensive uncontrolled [6] 4 6 8 6
Hypertensive untreated [14] 8 9 17 11
All with hypertension 20 18 24 38 26
Bases (unweighted)
Men 13 482 810 497 1955
Women 38 891 774 582 2560
Bases (weighted)
Men 13 616 828 506 2115
Women 44 824 667 501 2260
a The total column includes those without a valid height or weight measurement. b Normotensive untreated: Systolic blood pressure (SBP) less than 140mmHg and diastolic bloodpressure (DBP) less than 90mmHg and not taking medication prescribed for high blood pressureHypertensive controlled: SBP less than 140mmHg and DBP less than 90mmHg and takingmedication prescribed for high blood pressureHypertensive uncontrolled: SBP at least 140mmHg or DBP at least 90mmHg and takingmedication prescribed for high blood pressureHypertensive untreated: SBP at least 140mmHg or DBP at least 90mmHg and not takingmedication prescribed for high blood pressureAll with hypertension: SBP at least 140mmHg or DBP at least 90mmHg or taking medicationprescribed for high blood pressure.
c Underweight: less than 18.5kg/m2
Normal weight: 18.5 to less than 25kg/m2
Overweight: 25 to less than 30kg/m2
Obese, including morbidly obese: 30kg/m2 or more.
d Data not shown because the base is too small.
[ ] Results in brackets should be treated with caution because of the small base size.
Hypertensioncategoriesb

34 HSE 2012: VOL 1 | CHAPTER 10: ADULT ANTHROPOMETRIC MEASURES, OVERWEIGHT AND OBESITY Cop
yright © 2013, The Health and
Social C
are Inform
ation Centre. All rig
hts reserved
Table 10.14
Hypertension categories (age-standardised), bywaist circumference and sex
Aged 16 and over with three valid BP measurements and a valid waist measurementa 2012
Waist circumferencec Totala
Non raised Raisedwaist waist
circumference circumference
% % %
MenNormotensive untreated 76 57 70
Hypertensive controlled 7 12 9
Hypertensive uncontrolled 4 6 5
Hypertensive untreated 13 25 16
All with hypertension 24 43 30
WomenNormotensive untreated 81 68 74
Hypertensive controlled 7 10 9
Hypertensive uncontrolled 4 8 6
Hypertensive untreated 8 14 11
All with hypertension 19 32 26
Bases (unweighted)
Men 1173 749 1955
Women 1323 1191 2560
Bases (weighted)
Men 1371 717 2115
Women 1232 988 2260
a The total column includes those without a valid waist measurement. b Normotensive untreated: Systolic blood pressure (SBP) less than 140mmHg anddiastolic blood pressure (DBP) less than 90mmHg and not taking medicationprescribed for high blood pressureHypertensive controlled: SBP less than 140mmHg and DBP less than 90mmHgand taking medication prescribed for high blood pressureHypertensive uncontrolled: SBP at least 140mmHg or DBP at least 90mmHgand taking medication prescribed for high blood pressureHypertensive untreated: SBP at least 140mmHg or DBP at least 90mmHg andnot taking medication prescribed for high blood pressureAll with hypertension: SBP at least 140mmHg or DBP at least 90mmHg or takingmedication prescribed for high blood pressure.
c Raised waist circumference: greater than 102cm in men and greater than 88cmin women.
Hypertensioncategoriesb
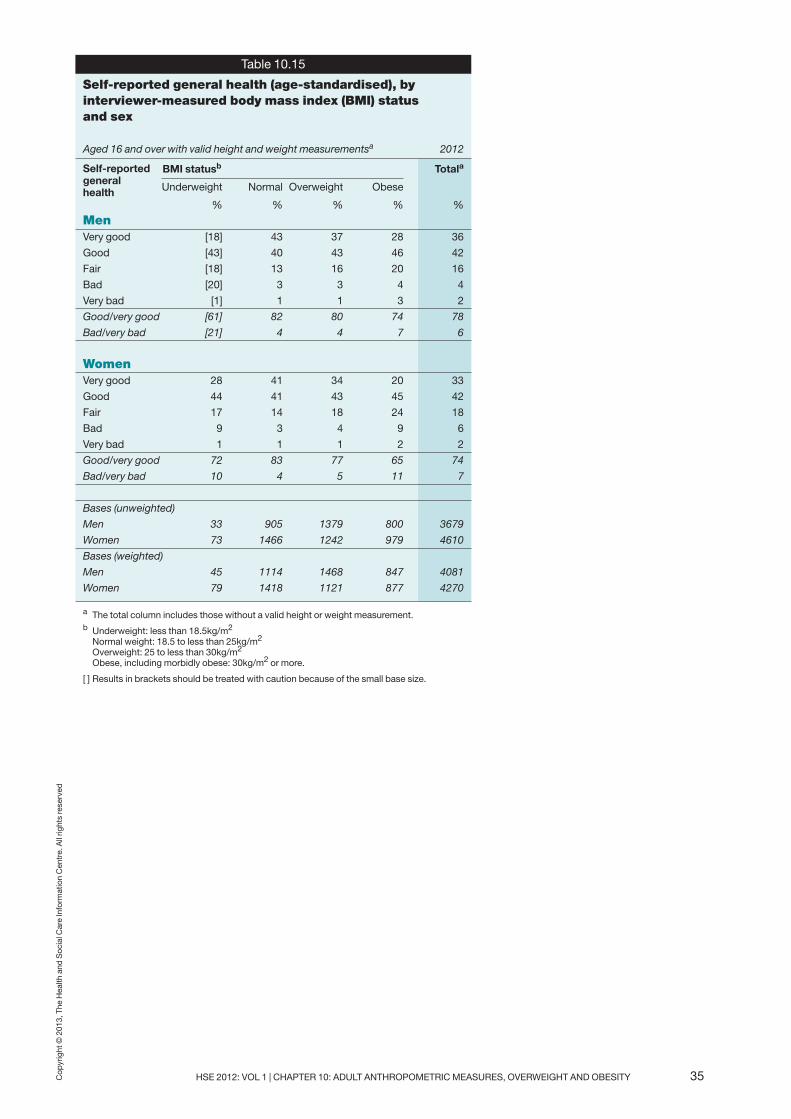
HSE 2012: VOL 1 | CHAPTER 10: ADULT ANTHROPOMETRIC MEASURES, OVERWEIGHT AND OBESITY 35Cop
yright © 2013, The Health and
Social C
are Inform
ation Centre. All rig
hts reserved
Table 10.15
Self-reported general health (age-standardised), byinterviewer-measured body mass index (BMI) status and sex
Aged 16 and over with valid height and weight measurementsa 2012
BMI statusb Totala
Underweight Normal Overweight Obese
% % % % %
MenVery good [18] 43 37 28 36
Good [43] 40 43 46 42
Fair [18] 13 16 20 16
Bad [20] 3 3 4 4
Very bad [1] 1 1 3 2
Good/very good [61] 82 80 74 78
Bad/very bad [21] 4 4 7 6
WomenVery good 28 41 34 20 33
Good 44 41 43 45 42
Fair 17 14 18 24 18
Bad 9 3 4 9 6
Very bad 1 1 1 2 2
Good/very good 72 83 77 65 74
Bad/very bad 10 4 5 11 7
Bases (unweighted)
Men 33 905 1379 800 3679
Women 73 1466 1242 979 4610
Bases (weighted)
Men 45 1114 1468 847 4081
Women 79 1418 1121 877 4270
a The total column includes those without a valid height or weight measurement.b Underweight: less than 18.5kg/m2
Normal weight: 18.5 to less than 25kg/m2
Overweight: 25 to less than 30kg/m2
Obese, including morbidly obese: 30kg/m2 or more.
[ ] Results in brackets should be treated with caution because of the small base size.
Self-reportedgeneralhealth

Table 10.16
Self-reported general health (age-standardised), by waist circumference and sex
Aged 16 and over with valid waist measurementa 2012
Waist circumferenceb Totala
Non raised Raisedwaist waist
circumference circumference
% % %
MenVery good 42 26 36
Good 40 47 42
Fair 14 19 16
Bad 3 6 4
Very bad 2 2 2
Good/very good 82 73 78
Bad/ very bad 4 8 6
WomenVery good 40 24 33
Good 42 44 42
Fair 14 23 18
Bad 3 8 6
Very bad 1 2 2
Good/very good 81 67 74
Bad/ very bad 4 10 7
Bases (unweighted)
Men 1435 895 3679
Women 1563 1404 4610
Bases (weighted)
Men 1708 867 4081
Women 1467 1178 4270
a The total column includes those without a valid waist measurement. b Raised waist circumference: greater than 102cm in men and greaterthan 88cm in women.
Self-reportedgeneralhealth
Cop
yright © 2013, The Health and
Social C
are Inform
ation Centre. All rig
hts reserved
36 HSE 2012: VOL 1 | CHAPTER 10: ADULT ANTHROPOMETRIC MEASURES, OVERWEIGHT AND OBESITY

Table 10.17
Longstanding illness (age-standardised), by interviewer-measuredbody mass index (BMI) status and sex
Aged 16 and over with valid height and weight measurementsa 2012
BMI statusb Totala
Underweight Normal Overweight Obese
% % % % %
MenLimiting longstanding illness [29] 15 17 21 19
Non-limiting longstanding illness [2] 15 17 18 16
No longstanding illness [69] 71 67 61 65
WomenLimiting longstanding illness 17 17 21 33 24
Non-limiting longstanding illness 10 18 18 18 17
No longstanding illness 73 65 62 49 59
Bases (unweighted)
Men 33 904 1377 799 3676
Women 73 1465 1242 976 4604
Bases (weighted)
Men 45 1113 1466 846 4077
Women 79 1417 1121 874 4265
a The total column includes those without a valid height or weight measurement.b Underweight: less than 18.5kg/m2
Normal weight: 18.5 to less than 25kg/m2
Overweight: 25 to less than 30kg/m2
Obese, including morbidly obese: 30kg/m2 or more.
[ ] Results in brackets should be treated with caution because of the small base size.
Longstandingillness
Table 10.18
Longstanding illness (age-standardised), by waistcircumference and sex
Aged 16 and over with valid waist measurementa 2012
Waist circumferenceb Totala
Non raised Raisedwaist waist
circumference circumference
% % %
MenLimiting longstanding illness 17 22 19
Non-limiting longstanding illness 16 19 16
No longstanding illness 67 59 65
WomenLimiting longstanding illness 18 29 24
Non-limiting longstanding illness 18 18 17
No longstanding illness 64 52 59
Bases (unweighted)
Men 1434 894 3676
Women 1561 1402 4604
Bases (weighted)
Men 1707 866 4077
Women 1465 1176 4265
a The total column includes those without a valid waist measurement. b Raised waist circumference: greater than 102cm in men and greater than 88cmin women.
Longstandingillness
Cop
yright © 2013, The Health and
Social C
are Inform
ation Centre. All rig
hts reserved
HSE 2012: VOL 1 | CHAPTER 10: ADULT ANTHROPOMETRIC MEASURES, OVERWEIGHT AND OBESITY 37

38 HSE 2012: VOL 1 | CHAPTER 10: ADULT ANTHROPOMETRIC MEASURES, OVERWEIGHT AND OBESITY Cop
yright © 2013, The Health and
Social C
are Inform
ation Centre. All rig
hts reserved
Table 10.19
GHQ-12 score (age-standardised), by interviewer-measuredbody mass index (BMI) status and sex
Aged 16 and over with valid height and weight measurementsa 2012
BMI statusc Totala
Underweight Normal Overweight Obese
% % % % %
MenScore 0 d 67 70 64 66
Score 1-3 d 23 20 23 22
Score 4 or more d 11 10 13 12
WomenScore 0 55 60 61 50 57
Score 1-3 14 25 23 29 25
Score 4 or more 32 15 16 21 18
Bases (unweighted)
Men 29 840 1260 740 3200
Women 63 1370 1139 902 4057
Bases (weighted)
Men 40 1034 1338 785 3539
Women 68 1328 1028 808 3757
a The total column includes those without a valid height or weight measurement.b A score of 4 or more is referred to as a ‘high GHQ-12 score’, indicating probablepsychological disturbance or mental ill health.
c Underweight: less than 18.5kg/m2
Normal weight: 18.5 to less than 25kg/m2
Overweight: 25 to less than 30kg/m2
Obese, including morbidly obese: 30kg/m2 or more.d Data not shown because the base is too small.
GHQ-12scoreb

HSE 2012: VOL 1 | CHAPTER 10: ADULT ANTHROPOMETRIC MEASURES, OVERWEIGHT AND OBESITY 39Cop
yright © 2013, The Health and
Social C
are Inform
ation Centre. All rig
hts reserved
Table 10.20
GHQ-12 score (age-standardised), by waistcircumference and sex
Aged 16 and over with valid waist measurementa 2012
Waist circumferencec Totala
Non raised Raisedwaist waist
circumference circumference
% % %
MenScore 0 64 61 66
Score 1-3 24 24 22
Score 4 or more 12 15 12
WomenScore 0 59 52 57
Score 1-3 24 28 25
Score 4 or more 17 20 18
Bases (unweighted)
Men 1318 823 3200
Women 1440 1284 4057
Bases (weighted)
Men 1566 797 3539
Women 1353 1074 3757
a The total column includes those without a valid waist measurement. b A score of 4 or more is referred to as a ‘high GHQ-12 score’, indicatingprobable psychological disturbance or mental ill health.
c Raised waist circumference: greater than 102cm in men and greaterthan 88cm in women.
GHQ-12scoreb
Related Documents