A novel in vitro three-dimensional retinoblastoma model for evaluating chemotherapeutic drugs Moutushy Mitra, 1 Chandana Mohanty, 2 Anju Harilal, 1 Uma K. Maheswari, 3 Sanjeeb Kumar Sahoo, 2 Subramanian Krishnakumar 1 1 Department of Ocular Pathology, Vision Research Foundation, Sankara Nethralaya, Tamil Nadu, India; 2 Laboratory of Nanomedicine, Institute of Life Sciences, Chandrasekharpur, Bhubaneswar, India; 3 CeNTAB, SASTRA University, Tanjore, India Purpose: Novel strategies are being applied for creating better in vitro models that simulate in vivo conditions for testing the efficacy of anticancer drugs. In the present study we developed surface-engineered, large and porous, biodegradable, polymeric microparticles as a scaffold for three dimensional (3-D) growth of a Y79 retinoblastoma (RB) cell line. We evaluated the effect of three anticancer drugs in naïve and nanoparticle-loaded forms on a 3-D versus a two-dimensional (2-D) model. We also studied the influence of microparticles on extracellular matrix (ECM) synthesis and whole genome miRNA-gene expression profiling to identify 3D-responsive genes that are implicated in oncogenesis in RB cells. Methods: Poly(D,L)-lactide-co-glycolide (PLGA) microparticles were prepared by the solvent evaporation method. RB cell line Y79 was grown alone or with PLGA–gelatin microparticles. Antiproliferative activity, drug diffusion, and cellular uptake were studied by 3-(4,5-dimethylthiazol-2-yl)-2,5-diphenyltetrazolium bromide, a yellow tetrazole (MTT) assay, fluorescent microscope, and flow cytometry. Extra cellular matrix (ECM) synthesis was observed by collagenase assay and whole genome miRNA-microarray profiling by using an Agilent chip. Results: With optimized composition of microparticles and cell culture conditions, an eightfold increase from the seeding density was achieved in 5 days of culture. The antiproliferative effect of the drugs in the 3-D model was significantly lower than in the 2-D suspension, which was evident from the 4.5 to 21.8 fold differences in their IC50 values. Using doxorubicin, the flow cytometry data demonstrated a 4.4 fold lower drug accumulation in the cells grown in the 3-D model at 4 h. The collagen content of the cells grown in the 3-D model was 2.3 fold greater than that of the cells grown in the 2- D model, suggesting greater synthesis of the extracellular matrix in the 3-D model as the extracellular matrix acted as a barrier to drug diffusion. The microarray and miRNA analysis showed changes in several genes and miRNA expression in cells grown in the 3-D model, which could also influence the environment and drug effects. Conclusions: Our 3-D retinoblastoma model could be used in developing effective drugs based on a better understanding of the role of chemical, biologic, and physical parameters in the process of drug diffusion through the tumor mass, drug retention, and therapeutic outcome. A suitable three dimensional (3-D) culture system provides a more physiologically relevant approach to the analysis of gene function, regulation, and cell phenotype ex vivo [1]. It has previously been shown that engineering the cell culture micro-environment to create growth conditions that more accurately mimic the in vivo behavior of cells is an essential step for improving the predictive accuracy of the drug discovery process [2]. Evidence suggests that modification of cell growth conditions can radically influence the behavior of cells in response to chemical reagents [3]. Many important studies have been done on cell proliferation, differentiation, and function in vitro; however, experience with cells in a flat tissue culture flask is different from the complexities of tissues within the body. In tissues, cells connect to each other as well as to the extracellular matrix Correspondence to: Subramanian Krishnakumar, Department of Ocular Pathology, Vision Research Foundation, Sankara Nethralaya, No. 18 college Road, Nungambakkam, Chennai – 600006, India; Phone: 91-44-28271616, ext 1302; FAX: 91-44-28254180; email: [email protected] (ECM), which is a key regulator of normal homeostasis and tissue phenotype [1]. Receptor complexes on the surface of cells facilitate interactions with their neighbors, with the ECM, and with other exogenous factors to enable cells to interpret the multitude of biochemical and physical cues from the immediate environment. The metastatic potential of tumor cells is believed to be regulated by interactions between the tumor cells and their extracellular environment (i.e., ECM). These interactions can be modified by the accumulation of genetic changes and by the transient alterations in gene expression induced by the local tumor microenvironment [4]. Given this intricate mechanical and biochemical interplay; important biologic properties may be missed if cells are studied within an in vitro culture system [5]. It has also been suggested that many important signals, key regulators, and tissue phenotypes are lost when cells are cultured on substrates such as culture plates [6]. Therefore, developing an in vitro model of a tumor that in many aspects would resemble an actual tumor to obtain a realistic assessment of drug efficacy before their testing in animal models or patients is important Molecular Vision 2012; 18:1361-1378 <http://www.molvis.org/molvis/v18/a142> Received 24 July 2011 | Accepted 28 May 2012 | Published 31 May 2012 © 2012 Molecular Vision 1361

Welcome message from author
This document is posted to help you gain knowledge. Please leave a comment to let me know what you think about it! Share it to your friends and learn new things together.
Transcript
A novel in vitro three-dimensional retinoblastoma model forevaluating chemotherapeutic drugs
Moutushy Mitra,1 Chandana Mohanty,2 Anju Harilal,1 Uma K. Maheswari,3 Sanjeeb Kumar Sahoo,2
Subramanian Krishnakumar1
1Department of Ocular Pathology, Vision Research Foundation, Sankara Nethralaya, Tamil Nadu, India; 2Laboratory ofNanomedicine, Institute of Life Sciences, Chandrasekharpur, Bhubaneswar, India; 3CeNTAB, SASTRA University, Tanjore, India
Purpose: Novel strategies are being applied for creating better in vitro models that simulate in vivo conditions for testingthe efficacy of anticancer drugs. In the present study we developed surface-engineered, large and porous, biodegradable,polymeric microparticles as a scaffold for three dimensional (3-D) growth of a Y79 retinoblastoma (RB) cell line. Weevaluated the effect of three anticancer drugs in naïve and nanoparticle-loaded forms on a 3-D versus a two-dimensional(2-D) model. We also studied the influence of microparticles on extracellular matrix (ECM) synthesis and whole genomemiRNA-gene expression profiling to identify 3D-responsive genes that are implicated in oncogenesis in RB cells.Methods: Poly(D,L)-lactide-co-glycolide (PLGA) microparticles were prepared by the solvent evaporation method. RBcell line Y79 was grown alone or with PLGA–gelatin microparticles. Antiproliferative activity, drug diffusion, and cellularuptake were studied by 3-(4,5-dimethylthiazol-2-yl)-2,5-diphenyltetrazolium bromide, a yellow tetrazole (MTT) assay,fluorescent microscope, and flow cytometry. Extra cellular matrix (ECM) synthesis was observed by collagenase assayand whole genome miRNA-microarray profiling by using an Agilent chip.Results: With optimized composition of microparticles and cell culture conditions, an eightfold increase from the seedingdensity was achieved in 5 days of culture. The antiproliferative effect of the drugs in the 3-D model was significantlylower than in the 2-D suspension, which was evident from the 4.5 to 21.8 fold differences in their IC50 values. Usingdoxorubicin, the flow cytometry data demonstrated a 4.4 fold lower drug accumulation in the cells grown in the 3-D modelat 4 h. The collagen content of the cells grown in the 3-D model was 2.3 fold greater than that of the cells grown in the 2-D model, suggesting greater synthesis of the extracellular matrix in the 3-D model as the extracellular matrix acted as abarrier to drug diffusion. The microarray and miRNA analysis showed changes in several genes and miRNA expressionin cells grown in the 3-D model, which could also influence the environment and drug effects.Conclusions: Our 3-D retinoblastoma model could be used in developing effective drugs based on a better understandingof the role of chemical, biologic, and physical parameters in the process of drug diffusion through the tumor mass, drugretention, and therapeutic outcome.
A suitable three dimensional (3-D) culture systemprovides a more physiologically relevant approach to theanalysis of gene function, regulation, and cell phenotype exvivo [1]. It has previously been shown that engineering thecell culture micro-environment to create growth conditionsthat more accurately mimic the in vivo behavior of cells is anessential step for improving the predictive accuracy of thedrug discovery process [2]. Evidence suggests thatmodification of cell growth conditions can radically influencethe behavior of cells in response to chemical reagents [3].Many important studies have been done on cell proliferation,differentiation, and function in vitro; however, experiencewith cells in a flat tissue culture flask is different from thecomplexities of tissues within the body. In tissues, cellsconnect to each other as well as to the extracellular matrix
Correspondence to: Subramanian Krishnakumar, Department ofOcular Pathology, Vision Research Foundation, Sankara Nethralaya,No. 18 college Road, Nungambakkam, Chennai – 600006, India;Phone: 91-44-28271616, ext 1302; FAX: 91-44-28254180; email:[email protected]
(ECM), which is a key regulator of normal homeostasis andtissue phenotype [1]. Receptor complexes on the surface ofcells facilitate interactions with their neighbors, with theECM, and with other exogenous factors to enable cells tointerpret the multitude of biochemical and physical cues fromthe immediate environment. The metastatic potential of tumorcells is believed to be regulated by interactions between thetumor cells and their extracellular environment (i.e., ECM).These interactions can be modified by the accumulation ofgenetic changes and by the transient alterations in geneexpression induced by the local tumor microenvironment [4].Given this intricate mechanical and biochemical interplay;important biologic properties may be missed if cells arestudied within an in vitro culture system [5]. It has also beensuggested that many important signals, key regulators, andtissue phenotypes are lost when cells are cultured on substratessuch as culture plates [6]. Therefore, developing an in vitromodel of a tumor that in many aspects would resemble anactual tumor to obtain a realistic assessment of drug efficacybefore their testing in animal models or patients is important
Molecular Vision 2012; 18:1361-1378 <http://www.molvis.org/molvis/v18/a142>Received 24 July 2011 | Accepted 28 May 2012 | Published 31 May 2012
© 2012 Molecular Vision
1361
[7]. Based on previous reports [7] we hypothesized that thecells grown with poly(D,L)-lactide-co-glycolide (PLGA)–gelatin microparticles behave differently than cells grownwithout PLGA–gelatin microparticles because of thestructural, molecular, and genetic variations in cells grown intwo different structural configurations. We selected threemodel anticancer drugs (doxorubicin, carboplatin, andetoposide), which are currently used in clinical practice forthe treatment of retinoblastoma, and drug-loadednanoparticles to determine the drug efficacy in both models.We studied drug diffusion and cellular uptake to understandthe discrepancy in drug efficacy in cells grown with or withoutPLGA–gelatin microparticles. In addition we studied theinfluence of microparticles on ECM synthesis and wholegenome miRNA-microarray profiling to identify 3-D-responsive genes that have been implicated in oncogenesis,survival, and growth of in vivo tumor.
METHODSMaterials: PLGA (copolymer ratio 50:50, molecular weight[MW]=34,000 Da, inherent viscosity=0.41) was purchasedfrom Birmingham polymers, Inc. (Birmingham, AL).Carboplatin, doxorubicin hydrochloride (DOXHCL),etoposide, polyvinyl alcohol (PVA; average MW 30,000–70,000 Da), BSA (fraction V), sucrose, chitosan from crabshells (85% deacetylated), and gelatin were purchased fromSigma-Aldrich (St. Louis, MO). All other chemicals usedwere of analytical grade obtained from Sigma-Aldrich. Mediaand fetal bovine serum (FBS) were purchased from Gibco-BRL (Rockville, MD). Y79 cells were cultured in RPMI 1640medium (Biocolor Ltd, County Antrim, UK). The SircolSoluble Collagen Assay kit was purchased from Biocolor Ltd.TRIZOL reagent was purchased from Invitrogen (Carlsbad,CA). TURBO DNase was purchased from Ambion (GenetixBiotech Asia Pvt. Ltd., New Delhi, India).Preparation of different drug-loaded nanoparticles:
Carboplatin-loaded nanoparticles—Nanoparticlescontaining carboplatin (CNPs) were prepared as decribed byParveen et al. [8]. Briefly, an aqueous solution of 2 ml sodiumalginate (0.625 mg/ml) was added dropwise into 8 ml ofchitosan solution (0.5 mg/ml dilute solution of HCl, with pHadjusted to approximately 5.5 with 0.1 M NaOH) containingcarboplatin (1.25 mg). After overnight stirring of theemulsion, the CNPs were recovered by ultracentrifugation(Sorvall Ultraspeed Centrifuge; Kendro, Asheville, NC) at30,000× g for 30 min at 4 °C. The nanoparticles were formedas a result of the interaction between negative groups ofalginate and positively charged amino groups of chitosan. Thepellets were dispersed in double-distilled water andlyophilized (LYPHLOCK 12; Labconco, Kansas City, MO)for 48 h and then stored at 4 °C for further studies.
Etoposide-loaded nanoparticles—Etoposide-loadednanoparticles (ENP) were formulated by using the singleemulsion–solvent evaporation technique. In this method,
etoposide (equivalent to 10% weight [w]/w dry weight ofpolymer) was dissolved in 3 ml organic solvent (chloroform)containing 90 mg of polymer (PLGA) to form a primaryemulsion. The emulsion was further emulsified in an aqueousPVA solution (12 ml, 5% w/volume [v]) to form an oil-in-water emulsion. The emulsification was performed using amicrotip probe sonicator (VC 505; Vibracell Sonics, Newton,CT) at 39 W of energy for 2 min in an ice bath. The emulsionwas stirred using a magnetic stirrer overnight to evaporate theorganic solvent. The resultant nanoparticles wereultracentrifuged at 125,000× g for 20 min at 4 °C with twicewashing with double-distilled water to remove the excessamount of PVA and unencapsulated etoposide. The obtainedparticles were resuspended in double-distilled water andlyophilized for 48 h to obtain the powder form and then storedat 4 °C for further use.
Doxorubicin-loaded nanoparticles—Doxorubicine-loaded nanoparticles (DNP) were prepared by using the singleemulsion–solvent evaporation technique. In brief, a solutionof 100 mg of PLGA polymer and 10 mg of doxorubicin (DOX)in 3 ml of 12.5% (v/v) methanol in chloroform solution wasemulsified in 12 ml of 2% w/v aqueous solution of PVA toform an oil-in-water emulsion. The emulsification wasperformed using a microtip probe sonicator set at 55 W ofenergy output for 2 min over an ice bath. The emulsion wasstirred overnight at room temperature on a magnetic stirringplate to allow evaporation of the organic solvent andformation of DNPs. DNPs were recovered byultracentrifugation at 125,000× g for 20 min at 4 °C, washedtwice with double-distilled water to remove unbound PVAand unencapsulated drug, and then lyophilized for 2 days toobtain the powdered DNPs. The lyophilized DNPs werestored at 4 °C until further use.Formulation of gelatin microparticles: PLGA microparticleswere prepared by the solvent evaporation method with slightmodifications [9]. In brief, 800 μl of an aqueous phase (W1)was prepared with BSA (2.5% w/v), sucrose (10% w/v),chitosan (1.25% w/v), gelatin (5% w/ v), and PVA (5% w/v)and emulsified with polymer solution (O; 200 mg PLGA in4 ml of dichloromethane), using an homogenizer (BiospecProduct Inc., Bartlesville, OK) at 80× g to form an oil-in-waterprimary emulsion. The resultant primary emulsion was addeddropwise into a 1% w/v aqueous solution of PVA containing10% w/v sucrose (W2) under constant magnetic stirring on astirring plate to form a multiple emulsion (W1/O/W2). Theemulsion was stirred overnight on a magnetic stir plate toevaporate the organic solvent. The resultant microparticleswere recovered by centrifugation at 15,000× g, washed threetimes with distilled water, and then lyophilized for 48 h thelyophilized microparticles were stored at 4 °C until furtheruse.
Characterization of different drug-loaded nanoparticles:Mean particle size and size distribution of the different drug-
Molecular Vision 2012; 18:1361-1378 <http://www.molvis.org/molvis/v18/a142> © 2012 Molecular Vision
1362
loaded nanoparticles were determined by using a MalvernZeta-sizer Nano ZS (Malvern Instrument, Malvern,Worcestershire, UK) based on quasi-elastic light scattering.Briefly, approximately 1 mg/ml of different formulations ofthe nanoparticle solutions were prepared in double-distilledwater and sonicated for 30 s in an ice bath. Size measurementswere performed in triplicate following the dilution (100 mldiluted to 1 ml) of the NP suspensions in MilliQ water at 25 °C.
The Zeta potential was measured in the same instrument at25 °C using the above protocol. All measurements wereperformed in triplicate.Characterization of gelatin microparticles: The shape andsurface morphology of gelatin microparticles werecharacterized by scanning electron microscopy (SEM, HitachiS-3400N; Hitachi High-Technologies, Krefeld, Germany).The powdered microparticles were attached to a brass stub
TABLE 1. LIST OF PRIMERS USED FOR REAL TIME QUANTITATIVE RT–PCR.
Gene name Primer sequences TmABCC6 FP 5′TTGGATTCGCCCTCATAGTC 3′ 65 °C
RP 3′GGTAGCTGGCAAGACAAAGC 5′ HMGA2 FP 5′GGCCAGCTCATAAAATGGAA 3′ 61 °C
RP 3′TACTGTTCCATTGGCCACAA 5′ MMP9 FP 5′TTGACAGCGACAAGAAGTGG 3′ 64 °C
RP 3′GCCATTCACGTCGTCCTTAT 5′ ABCA3 FP 5′AGGAAAGGAGGCTGAAGGAG 3′ 65 °C
RP 3′GTGCTGACCATGAAGCTGAA 5′ ERBB3 FP 5′GCCAATGAGTTCACCAGGAT 3′ 64 °C
RP 3′ACGTGGCCGATTAAGTGTTC 5′ BCL2 FP 5′GGATGCCTTTGTGGAACTGT 3′ 63 °C
RP 3′AGCCTGCAGCTTTGTTTCAT 5′ MYCN FP 5′CTTCGGTCCAGCTTTCTCAC 3′ 64 °C
RP 3′GTCCGAGCGTGTTCAATTTT 5′ APAF-1 FP 5′TTCTGATGCTTCGCAAACAC 3′ 63 °C
RP 3′CTGGCAAATCTGCCTTCTTC 5′ CDKN2A FP 5′ATATGCCTTCCCCCACTACC 3′ 67 °C
RP 3′CCCCTGAGCTTCCCTAGTTC 5′ CDKN1A FP 5′ATGAAATTCACCCCCTTTCC3′ 65 °C
RP 3′CCCTAGGCTGTGCTCACTTC5′ PDCD2 FP 5′GCATTGCCACCATAAATCCT3′ 63 °C
RP 3′GCAGTTTCCCATATGGTGCT5′
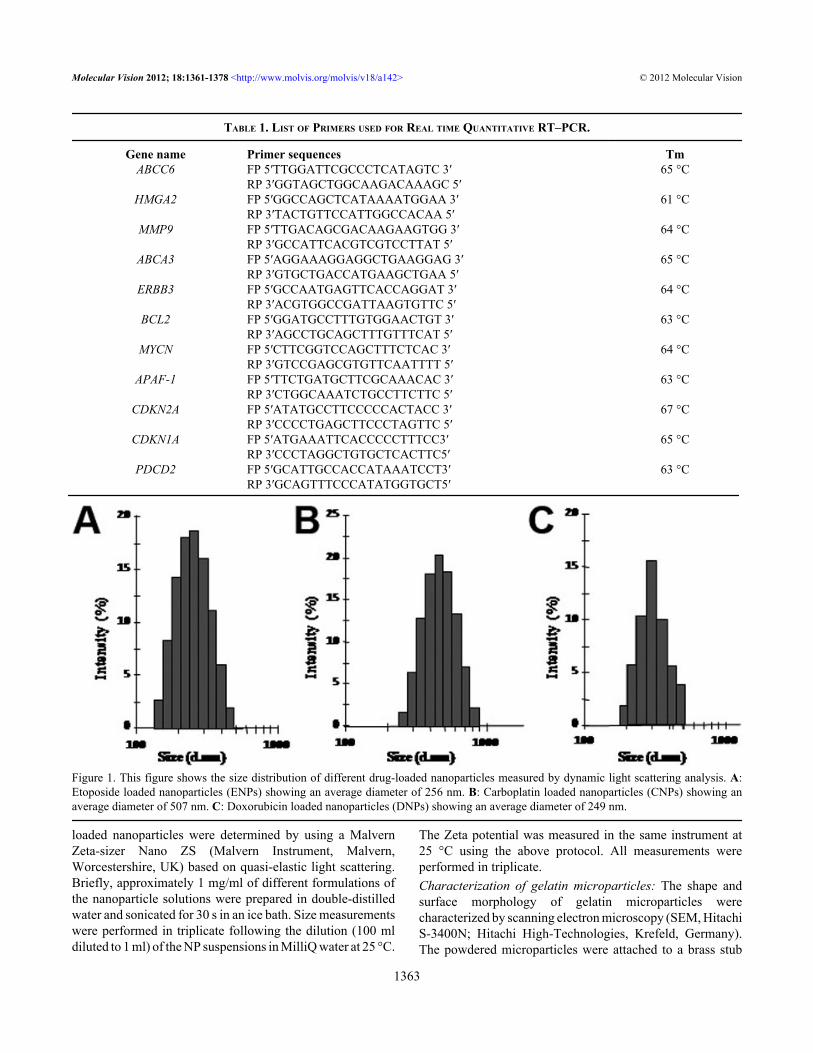
Figure 1. This figure shows the size distribution of different drug-loaded nanoparticles measured by dynamic light scattering analysis. A:Etoposide loaded nanoparticles (ENPs) showing an average diameter of 256 nm. B: Carboplatin loaded nanoparticles (CNPs) showing anaverage diameter of 507 nm. C: Doxorubicin loaded nanoparticles (DNPs) showing an average diameter of 249 nm.
Molecular Vision 2012; 18:1361-1378 <http://www.molvis.org/molvis/v18/a142> © 2012 Molecular Vision
1363
through double adhesive tape and were gold coated using asputter gold coater at 20 KV (Hitachi, E-1010, Ion Sputter;Hitachi High-Technologies). The stub was fixed in a sampleholder and placed in the vacuum chamber of the SEM (HitachiS-3400N; Hitachi High-Technologies) and observed underlow vacuum. The average particle diameters of microparticleswere determined from the SEM picture.Cell culture and cell seeding for gelatin microparticlecomposition optimization: Y79 cells RCB1645 were obtainedfrom the RIKEN cell bank (Ibaraki, Japan) and maintained inRPMI-1640 media supplemented with 10% FBS and 1%penicillin streptomycin in T-75 cm2 flasks in an incubator(Thermo Electron Corporation, Asheville, NC) at 37 °C and5% CO2. Fresh retinoblastoma tumor cells were isolated fromRB-enucleated eyeballs (Vision Research Foundation,Sankara Nethralaya, Chennai, India) and cultured as describedabove. All samples were collected with the approval of theinstitutional review board at VRF (Vision ResearchFoundation) and in accordance with the Declaration ofHelsinki. Each formulation of PLGA microparticles wasweighed (approximately 2 mg/ml) and soaked for 3 h at 37 °Cin 70% alcohol. Microparticles were centrifuged to removealcohol and washed twice with media. Fifty percent FBS wasadded, and the solution was kept in a CO2 incubator for 3 h.
For studying the effects of microparticle composition oncell growth, 1 ml of the microparticle suspension prepared asabove was transferred to separate wells of 6-well plates. Themedium from each well was aspirated carefully, leavingmicroparticles in the wells before cell seeding. A 500-μlaliquot of Y79 cell suspension (1×10⁶ cells/ml)/fresh RB cellsuspension in RPMI 1640 medium was added directly ontomicroparticles in each well. After 3 h of incubation at 37 °Cin a CO2 incubator, an additional 1.5 ml of medium was addedto each well and cells were allowed to grow in the incubator.The medium was changed on alternate days, and cells werecounted at 7 days post seeding to determine the effect ofmicroparticle composition on Y79 cell growth. To study thetotal number of cells grown in gelatin microparticles, theadherence cells from a microparticle clump was recoveredafter 10 days of post seeding. Cell detachment was done bytreating the microparticles with 1 ml of 0.1 M citrate buffercontaining 0.1% crystal violet for 1 h at 37 °C. Afterdetachment, the total number of cells grown with a differentformulation of microparticles was counted separately using ahemocytometer. Photomicrographs of selected plates withcells attached to microparticles were taken with a phase-contrast inverted microscope fitted with a digital camera. Thefluorescent images of Y79/RB cells labeled withCellTracker™ CM-DiI reagent (Molecular probes,
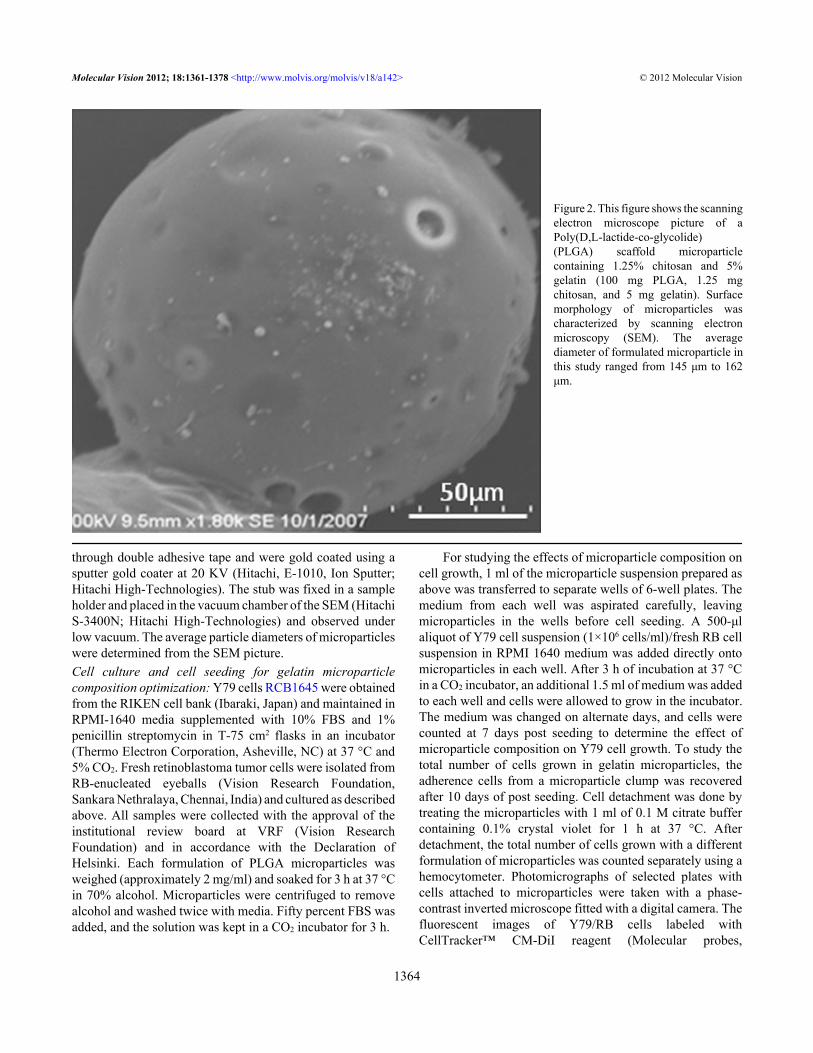
Figure 2. This figure shows the scanningelectron microscope picture of aPoly(D,L-lactide-co-glycolide)(PLGA) scaffold microparticlecontaining 1.25% chitosan and 5%gelatin (100 mg PLGA, 1.25 mgchitosan, and 5 mg gelatin). Surfacemorphology of microparticles wascharacterized by scanning electronmicroscopy (SEM). The averagediameter of formulated microparticle inthis study ranged from 145 μm to 162μm.
Molecular Vision 2012; 18:1361-1378 <http://www.molvis.org/molvis/v18/a142> © 2012 Molecular Vision
1364
Invitrogen, Bangalore, India) grown with the scaffold werecaptured.Antiproliferative effects of anticancer drugs and drug-loadednanoparticles: The antiproliferative effects of drugs, both inthe native form and encapsulated inside nanoparticles, wereanalyzed using the methodology of Horning et al. [7]. For thisstudy the Y79/RB cells were allowed to grow in a 2-Dsuspension (tissue culture-treated Petri dishes) and a 3-Dmodel (in microparticles). The tissue culture-treated Petridishes (100 mm×20 mm; #353003; Becton Dickson, FranklinLakes, NJ) taken for the 2-D study provided more surface areafor cells to grow without reaching confluency. For the 3-Dmodel, nontissue culture Petri dishes (100 mm×15 mm; #08–757–13; Fisher Scientific, Mumbai, India) were used; theseenabled better cellular attachment and growth ontomicroparticles compared to the surface of a Petri dish. Cellseeding in the case of the 2-D monolayer was performed thesecond day post seeding on microparticles at a cell density of0.5×106 cells/ml. This protocol for cell seeding and growthwas optimized to obtain approximately the same cell count inboth sets of experiments at the time of drug treatment for abetter comparison of drug efficacy. Three model anticancerdrugs, i.e., doxorubicin, carboplatin and etoposide, wereselected to determine their IC50 values in Y79/RB cells grownon 2-D as well as 3-D models. The chosen drugs are currentlybeing used in the treatment of retinoblastoma and are wellknown DNA intercalating anticancer agent. For the celltoxicity study the stock solutions of drugs were prepared inDMSO and diluted appropriately in tissue culture medium toobtain the desired concentration [8]. Similarly, equivalentconcentrations of drug encapsulated in nanoparticles(doxorubicin and etoposide in PLGA nanoparticles,carboplatin in chitosan nanoparticles) were prepared withRPMI medium. On day 5 of post seeding, media was carefullyremoved and replaced with 5 ml of media containing differentconcentrations of drugs and drug-loaded nanoparticles. After48 h the treated cells (2-D and 3-D culture) were collected andfiltered through 35 µm nylon mesh to separate cells frommicroparticles. The detached cells were stained using 0.4%(w/v) trypan blue in deionized water, and viable cells(unstained) were counted using a hemocytometer.Collagen assay: Collagen content was assayed using themanufacturer’s protocol. Cells with/without PLGA–gelatinmicroparticles were suspended in PBS (137 mM NaCl,2.7 mM KCl, 10 mM sodium phosphate dibasic, 2 mMpotassium phosphate monobasic and a pH of 7.4). Thepreparations were centrifuged at 80× g using an Eppendorfmicrocentrifuge (5417R; Eppendorf-Netheler-Hinz-GmbH,Hamburg, Germany), and the sediment was treated with 1 mlof 0.5 M acetic acid for 18 h at 4 °C. One milliliter of the dyereagent supplied with the assay kit was added to 100 μl of theacid extract in 1.5 ml Eppendorf tubes and mixed gently for30 min at room temperature. The collagen-bound dye complexwas recovered after centrifugation at 7,800 ×g for 10 min as
above. The complex was solubilized in 1 ml of the alkalireagent provided with the assay kit. The absorbance of thesamples was measured at 550 nm using a microwell platereader (Fisher Biotech, Pittsburgh, PA). A standard plot ofcollagen was prepared under similar conditions. Eithermicroparticles without cells or PBS was used as controls. Theamount of collagen present in the native microparticles wasdeduced from the actual collagen amounts obtained in 2-D and3-D culture experiments. Therefore the there was nointerference of the polymer used in microparticles in the assay.
Recovery of cells from poly(D,L)-lactide-co-glycolide–gelatin microparticles following freezing: To determinewhether the cells grown in the 3-D model could be rescuedafter freezing, microparticles were seeded (seeding density)0.5×10⁶ cells/mg of microparticles) and cultured as above innoncell culture Petri dishes for 5 days. Cells with PLGA–gelatin microparticles were washed with RPMI-1640medium, resuspended in 1 ml of cryopreservation media(DMSO, 10%; FBS, 90%), transferred into cryovials, and thenfrozen in liquid nitrogen. After 24 h of freezing, cells werethawed and the entire content of each cryovial was transferredinto Petri dishes and recultured for 48 h in RPMI medium.Cells with PLGA–gelatin microparticles cultured as above forthe same time period but not subjected to the freezing step,were used as the control. Cells cultured without PLGA–gelatin microparticles (0.5×10⁶ cells/ml of cryopreservationmedia) were also frozen and recultured as above. Cell viabilityfor each sample was determined using trypan blue as above.The percentages of cells with or without PLGA–gelatinmicroparticles rescued were calculated from the cell numberswith and without the freezing step.
Flow cytometry: Doxorubicin was used for this study becauseof its inherent fluorescent property. Fluorescent intensity as ameasure of drug uptake by cells with or without PLGA–gelatin microparticles was determined using a FACSCaliburflow cytometer (Becton Dickson) at 488 nm excitation and a585/42 filter (564–606 nm) to match the emission spectra ofdoxorubicin. On day 5 post seeding, media were carefullyremoved and 5 ml of doxorubicin solution (2,500 ng/ml) wasadded to each Petri dish and placed at 37 °C for 4 and 8 h eachwith triplicates. Cells were trypsinized from microparticlesand monolayered as described above, centrifuged, andresuspended into a single cell suspension in DPBS + 2% FBSat concentrations of either 2×10⁶ cells/ml or 1×10⁶ cells/ml.The cell suspensions containing microparticles were filteredtwice through a 35-μm nylon mesh tube cap into a 12×75 mmround-bottom tube (#352235; Becton Dickson) to removemicroparticles from the cell suspension.Oligonucleotide arrays: Total RNA used for the microarrayanalysis was isolated from cultured cells using TRIZOLreagent and treated with TURBO DNase to remove the DNAcontamination. The RNA samples (10 μg each) in a 50-μlreaction were treated with 1 μl of TURBO DNase (2 U) in 1×
Molecular Vision 2012; 18:1361-1378 <http://www.molvis.org/molvis/v18/a142> © 2012 Molecular Vision
1365

TURBO DNase buffer at 37 °C for 30 min. After incubation,the RNA sample was extracted with phenol–chloroform toinactivate the TURBO DNase. Agilent's Low RNA InputLinear Amplification Kit PLUS (Agilent TechnologiesGenotypic, Bangalore, India) was used to generate fluorescentcomplementary RNA (cRNA). This method uses T7 RNApolymerase, which simultaneously amplifies the target
material and incorporates cyanine 3-labeled cytidine tri-phosphate. Qiagen’s RNeasy mini spin columns (Qiagen,New Delhi, India) were used for purification of the amplifiedcRNA samples, and the samples were then hybridized to theHuman Whole Genome 44K Oligo Microarray for 17 h at65 °C, as recommended by the manufacturer (AgilentTechnologies). Data analysis was done using Genespring GX
Figure 3. This figure shows the growthkinetics of Y79 cells with differentseeding densities (104 to 105 cells) co-cultured with a gelatin scaffold for 20days. The cells were harvested andcounted on 2nd, 5th, 8th, 15th, and 20thday. The Y79 growth kinetics results ongelatin microparticle demonstrated thecomposition of formulatedmicroparticle facilitated profound Y79cell proliferation.
Figure 4. This figure shows the growthkinetics of Y79 cells co-cultured withmicroparticles formulated with differentconcentrations of gelatin (3% and 5%gelatin). The graph shows increased cellconcentrations on 15th and 20th. Day ofY79 cell culture on microparticlescoated with 5% gelatin (p<0.01) whencompared to that of 3% gelatin coatedmicroparticles 0.01).
Molecular Vision 2012; 18:1361-1378 <http://www.molvis.org/molvis/v18/a142> © 2012 Molecular Vision
1366
version 10 (Agilent Technologies). Agilent FeatureExtraction software (G25677AA; Agilent Technologies) wasused to analyze the microarray data. Two biologic replicateswere used for gene expression microarray analysis.MicroRNA isolation and expression analysis:
RNA extraction—Total RNA was isolated using TRI-Reagent (Ambion, Austin, TX). RNA concentration andpurity were quantified using a Nanodrop (Nanodrop, SantaClara, CA) spectrophotometer with the nanodrop ribogreenassay, and the quality of the total RNA was determined on anAgilent bioanalyzer (Agilent, Santa Clara, CA).
MicroRNA array hybridization and detection—Twobiologic replicate samples were used for the miRNAmicroarray analysis. Human miRNA V2 8×15k Agilentarrays, which represent 723 human and 76 human viralmiRNAs, were used for the miRNA analysis. Total RNAunderwent phosphatase treatment. The 3′ end of thedephosphorylated RNA was ligated with one molecule ofcyanine 3-cytidine bisphosphate (3-pCp), as this reagentselectively labels and hybridizes mature miRNAs with greaterthan 30% efficiency. A hybridization cocktail was added tothe arrays, and hybridization was performed in thehybridization oven set at 55 °C for 20 h. The microarrays werewashed using Agilent wash buffer. Scanning and extractionwas performed using Agilent feature extraction software. Thestudy was done in three biologic replicates. Data analysis wasdone using Genespring GX version 10. Agilent FeatureExtraction software (G25677AA) was used to analyze themicroarray data. The sum of background-subtracted signals
for each repeated miRNA was calculated and log transformedto log base 2. The cut off was greater than 1 (log-transformedvalue) and less than 1 (log-transformed value).
Real-time quantitative reverse-transcriptase (RT)-PCR—RNA was extracted by the guanidine isothiocyanateand chloroform method (TRI Reagent; Sigma-Aldrich,Bangalore, India). All RNA samples were treated with DNase(Turbo; Ambion, Genetix Biotech Asia Pvt. Ltd). For allsamples, 1 μg of total RNA was used to synthesize first-strandcDNA with reverse transcriptase (SuperScript II; Invitrogen,Joyvel, Chennai, India) and random primers. The cDNAsynthesis was performed at 37 °C for 60 min after heatinactivation at 95 °C for 10 min. The primer sequences of theselected genes from the microarray are listed in Table 1. PCRwas performed using 1× SYBR Green PCR Master Mix(Applied Biosystems, Lab India, Chennai, India) on a real-time PCR system (Prism 7300; Applied Biosystems). Cyclingconditions were as follows: 2 min at 50 °C, 10 min at 95 °C,and 40 cycles of 15 s at 95 °C, plus 1 min at 60 °C. Commercialsoftware (SDS ver.2.3; Applied Biosystems) was used tocalculate ΔΔCt relative expression values for all the genesstudied, normalized to the GAPDH endogenous control.Statistical analysis: The statistical analysis included theindependent Student t test. Statistical analysis was performedusing SPSS version 12.0 software (Chicago, IL). P values lessthan 0.05 were considered significant.
RESULTSCharacterization of different drug-loaded nanoparticles: Thesize distribution and surface charge of different drug-loaded
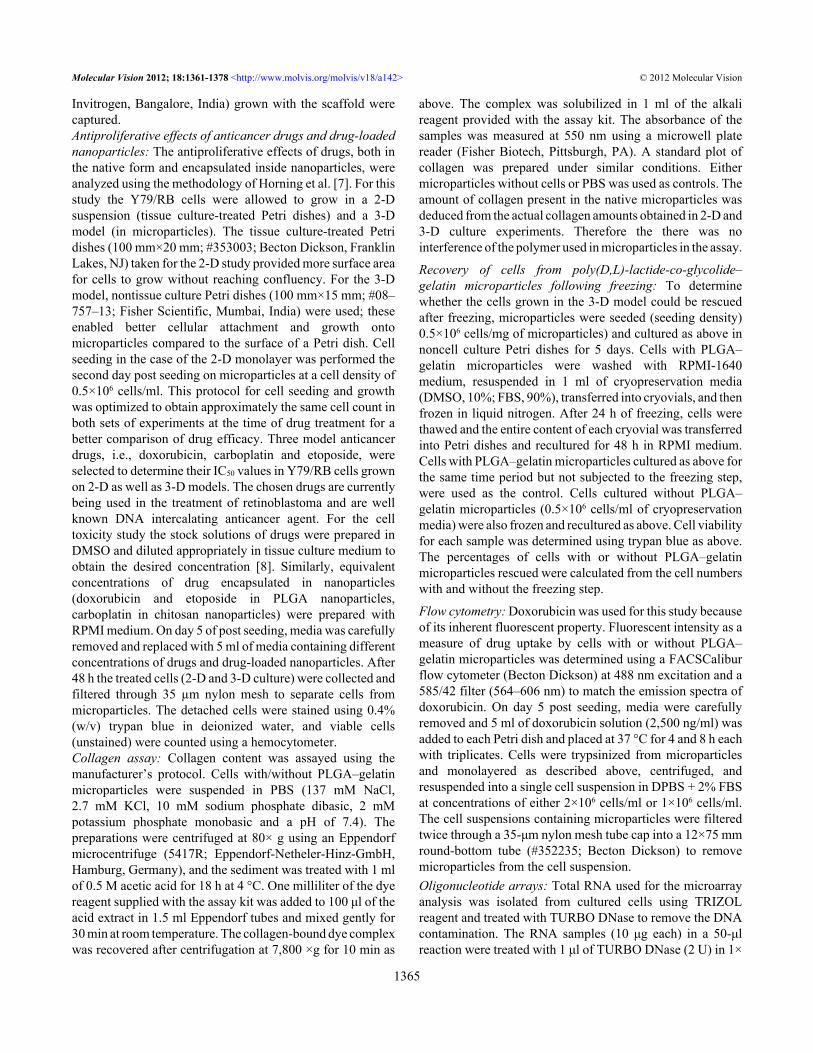
Figure 5. This figure shows the phasecontrast and fluorescent microscopeimages of Y79 cells grown on Poly(D,L-lactide-co-glycolide) (PLGA) scaffoldmicroparticles. A: Phase contrastmicroscope picture of Gelatin-coatedPLGA microparticles under 10×magnification. B: Phase-contrastimages showing cells attached to themicroparticles (white arrows pointingY79 cells attached to microparticles)forming a three-dimensional growthover the microparticles under 10×magnification. C: Phase contrastmicroscopic image of 3-D growth ofY79 cells over scaffold microparticles(black arrow pointing to Y79 cellsattaché to microparticles) under40× magnification. D: Fluorescentmicroscopic image showing the 3-Dgrowth of Y79 cells (labeled withCelltracker dye) over scaffoldmicroparticle (white arrows pointingY79 cells attached to microparticle)under 40× magnification.
Molecular Vision 2012; 18:1361-1378 <http://www.molvis.org/molvis/v18/a142> © 2012 Molecular Vision
1367
nanoparticles were measured by dynamic light scatteringanalysis. This study revealed that ENPs, CNPs, and DNPshave an average diameter of 256 nm, 507 nm, and 249 nm,respectively, as shown in Figure 1 and have an average Zetapotential of −13 mV, –36 mV, and −5.56 mV, respectively.
Formulation and characterization of poly(D,L)-lactide-co-glycolide microparticles: In the current study, we prepared a3-D tumor model with PLGA–gelatin microparticles for invitro evaluation of different anticancer drugs (native andloaded in nanoparticles). It was previously well documentedthat gelatin is a suitable candidate for scaffold materialsbecause of its biocompatibility, low immunogenicity, andbiodegradability. Gelatin contains Arg–Gly–Asp (RGD)-likesequences that promote cell adhesion and migration byforming a polyelectrolyte complex. Furthermore, the anioniccell surface provided by the gelatin–chitosan-blendedmicroparticles provide better cell adhesion and cellularbioactivity for proliferating cells. A successful microparticleformulation was achieved with a highly porous matrix tofacilitate the infiltration of proliferating cells. As evidencedfrom the SEM image, the formulated microparticle showed aporous infrastructure with interconnected void structures andhad a spherical shape covered with a thin film of polymer(Figure 2). This rough surface could be due to deposition ofcationic chitosan on the anionic microparticle surface, whichis apparent from the surface characteristics [7]. Similarly,particle size is an important parameter that could affect thedegradation of the polymer matrix [10]. To achieve a
microparticle of a desired diameter, the conditions foremulsification and formulation composition were optimized.The average diameter of the formulated microparticle in thisstudy ranged from 145 μm to 162 μm.Effect of composition of the scaffold and influence of cellseeding density on Y79 cell growth: We studied the effect ofgelatin concentration (used in microparticle composition) onthe proliferation of Y79 cells. The Y79 growth kinetic resultson the gelatin microparticle demonstrated that thecomposition of the formulated microparticle facilitatedprofound Y79 cell proliferation (Figure 3). It was further seenthat the microparticles formulated with a higher gelatincontent (5% w/v) demonstrated better cell growth than thoseformulated with a lower gelatin content (3% w/v; Figure 4).Therefore, PLGA microparticles fabricated with 5% gelatinwere chosen as a suitable formulation for further studies.
The optimized composition of microparticles, whichconsisted of 5% gelatin and 1.25% chitosan, demonstrated cellgrowth from an initial seeding cell density of 0.05×10⁶ to acell density of 0.4×10⁶ cells/mg of microparticles, which is aneightfold increase in cell density after 6 days of culture. Cellsattached more to the microparticles rather than to the surfaceof the nontissue culture Petri dish. Initially, cells were seenattached to the microparticle surface, and with time cellsengulfed the microparticles completely, forming a 3-D tumor-like structure (Figure 5A-C phase contrast and Figure 5Dfluorescence-labeled Y79 cells). Either a single microparticle
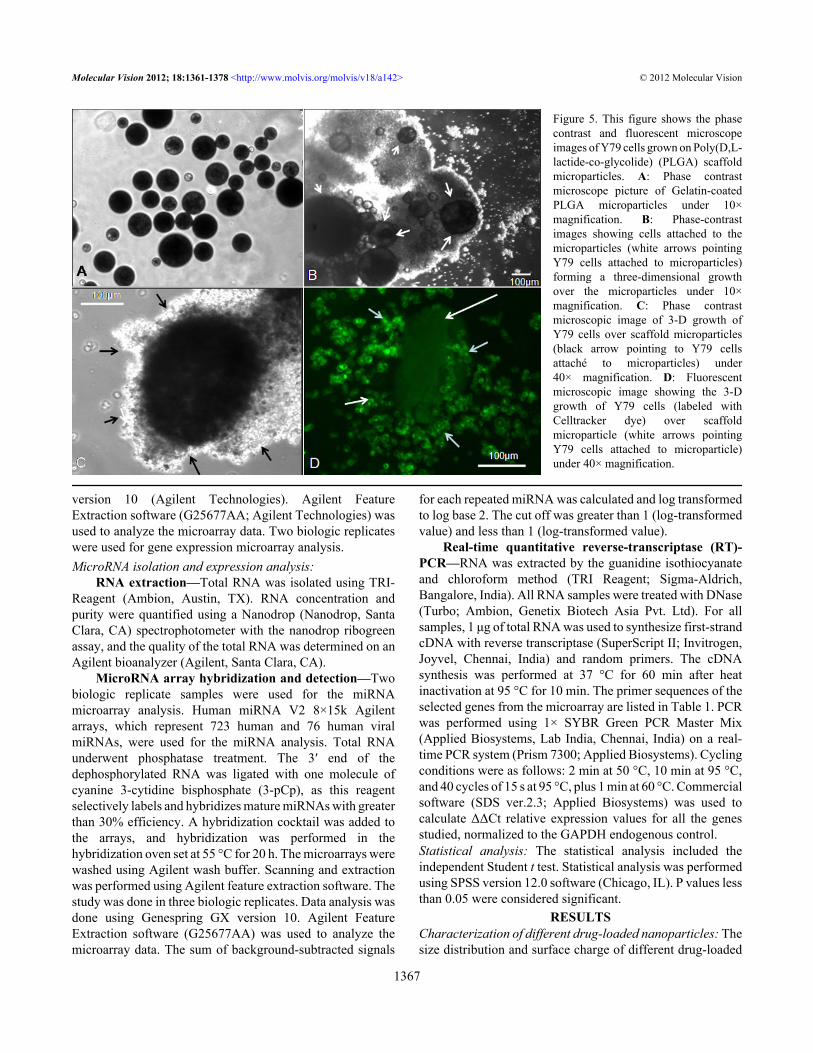
Figure 6. This figure shows thecomparison of post freeze and thawviability of Y79 cells between Y79 cellculture without microparticles (2-D)and Y79 cells co-cultured withmicroparticles (3-D). The bar diagramshows the viability of Y79 cultured cellswith (3-D) and without (2-D)microparticles retrieved from freezing.The Y79 cells viability was slightlyhigher in 3-D model compared to that in2-D monolayer (41% versus 35%).Error bars represent standard deviationobtained from triplicates.
Molecular Vision 2012; 18:1361-1378 <http://www.molvis.org/molvis/v18/a142> © 2012 Molecular Vision
1368
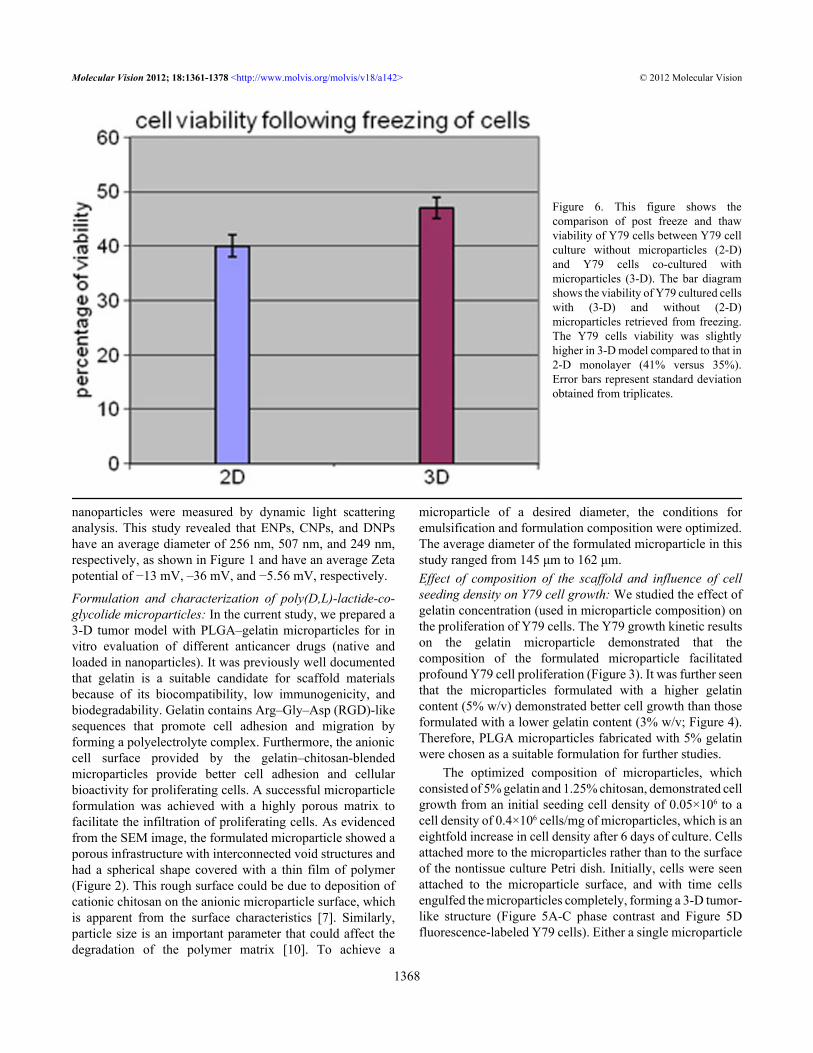
Figure 7. This figure shows the anti-proliferative effect of drug loaded nanoparticles on Y79 cells cultures in Two-dimensional (2-D) or threedimensional (3-D) patterns. A: Y79 cells co-cultured with microparticles (3-D) shows decreased sensitivity (p<0.001) to native carboplatinwhen compared to Y79 cells cultured without microparticles (2-D). B: Y79 cells co-cultured with microparticles (3-D) shows decreasedsensitivity (p<0.0001) to Carboplatin loaded nanoparticles when compared to Y79 cells cultured without microparticles (2-D). C: Y79 cellsco-cultured with microparticles (3-D) shows decreased sensitivity (p<0.001) to native etoposide when compared to Y79 cells cultured withoutmicroparticles (2-D). D: Y79 cells co-cultured with microparticles (3-D) shows decreased sensitivity (p<0.001) to etoposide-loaded Np whencompared to Y79 cells cultured without microparticles (2-D). E: Y79 cells co-cultured with microparticles (3-D) shows decreased sensitivity(p<0.001) to native doxorubicin when compared to Y79 cells cultured without microparticles (2-D). F: Y79 cells co-cultured withmicroparticles (3-D) shows decreased sensitivity (p<0.001) to doxorubicin loaded nanoparticles when compared to Y79 cells cultured withoutmicroparticles (2-D). G: Fresh retinoblastoma tumor cells co-cultured with microparticles (3-D) shows decreased sensitivity (p<0.001) tonative carboplatin when compared to Y79 cells cultured without microparticles (2-D). H: Fresh retinoblastoma tumor cells co-cultured withmicroparticles (3-D) shows decreased sensitivity (p<0.0001) to native etoposide when compared to Y79 cells cultured without microparticles(2-D). I: Fresh retinoblastoma tumor cells co-cultured with microparticles (3-D) shows decreased sensitivity (p<0.001) to native doxorubicinwhen compared to Y79 cells cultured without microparticles (2-D). Error bars represent standard deviation obtained from triplicates.
Molecular Vision 2012; 18:1361-1378 <http://www.molvis.org/molvis/v18/a142> © 2012 Molecular Vision
1369

or a cluster of two to three microparticles were witnessed toform the 3-D tumor-like structure.Extracellular matrix synthesis and retrieval of cells from athree-dimensional model following freezing: After 5 days ofgrowth, cells in the 3-D model synthesized 59.8±1.2 µg ofcollagen per 1×10⁶ cells, which was significantly higher thanthe 25.29±0.7 µg of collagen synthesized for the same numberof cells in the 2-D monolayer (p<0.05, n=5). Following thefreezing step, cell viability was slightly higher in the 3-Dmodel compared to that in the 2-D monolayer (41% versus35%; Figure 6).Antiproliferative activity of drugs and drug-loadednanoparticles on Y79 cells grown with or without a scaffold:Cytotoxicity of model anticancer drugs was determined inY79/RB cells grown with or without PLGA–gelatin
microparticles following 48 h of drug treatment. Cell numberswere similar in both models at the time of treatment, and theinhibition in cell growth was calculated according to therespective untreated controls. IC50 values of drugs and drug-loaded nanoparticles were significantly higher in Y79 cellswith PLGA–gelatin microparticles than in cells grownwithout PLGA–gelatin microparticles (Figure 7). Thedifferences in the IC50 values observed were 4.5 to 21.8 folddepending upon the drug and drug-loaded nanoparticles(Table 2). Similarly, we observed significantly higher IC50
values of native drugs in RB tumor cells with PLGA–gelatinmicroparticles compared to RB cells grown without PLGA–gelatin microparticles (Figure 7G-I). The differences in theIC50 values of native drugs in RB tumor cells observed were2.4 to 13.4 fold (Table 2).
TABLE 2. COMPARISON OF IC50 VALUES OF RESPECTIVE NATIVE DRUGS AND DRUG LOADED NANOPARTICLES BETWEEN Y79 CELLS CO-CULTURED WITH MICROPARTICLES (3-D0 AND Y79 CELLS CULTURED WITHOUT MICROPARTICLES (2-D).
IC50 Drug 2-D 3-D Fold changeNative doxorubicin 154.8 1202 7.76Np doxorubicin 9.54 102.3 10.7Native etoposide 17.66 159.2 9.01Np etoposide 3.86 17.37 4.5Native carboplatin 138 1584 11.47Np carboplatin 28.84 630 21.84
Figure 8. This figure shows the uptake of doxorubicin drug by Y79 cells either or not co-cultured with microparticles using flow cytometry.A: The flow cytometry histogram shows decreased uptake of drug by Y79 cells co-cultured with microparticles (3-D) when compared to Y79cells cultured without microparticles at 4 h. B: Flow cytometry histogram shows decreased uptake of a drug by Y79 cells co-cultured withmicroparticles (3-D) when compared to Y79 cells cultured without microparticles at 24 h. The x-axis represent fluorescein isothiocyanate(FITC) intensity and the y-axis represents cell counts.
Molecular Vision 2012; 18:1361-1378 <http://www.molvis.org/molvis/v18/a142> © 2012 Molecular Vision
1370
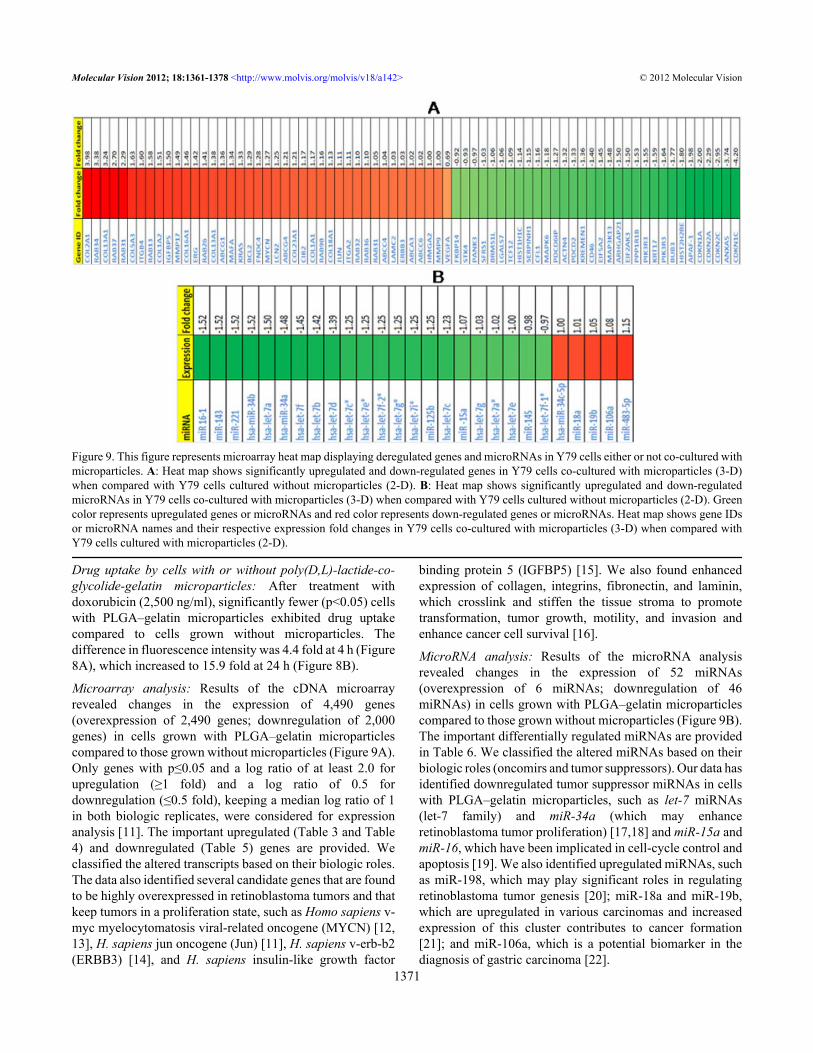
Drug uptake by cells with or without poly(D,L)-lactide-co-glycolide-gelatin microparticles: After treatment withdoxorubicin (2,500 ng/ml), significantly fewer (p<0.05) cellswith PLGA–gelatin microparticles exhibited drug uptakecompared to cells grown without microparticles. Thedifference in fluorescence intensity was 4.4 fold at 4 h (Figure8A), which increased to 15.9 fold at 24 h (Figure 8B).
Microarray analysis: Results of the cDNA microarrayrevealed changes in the expression of 4,490 genes(overexpression of 2,490 genes; downregulation of 2,000genes) in cells grown with PLGA–gelatin microparticlescompared to those grown without microparticles (Figure 9A).Only genes with p≤0.05 and a log ratio of at least 2.0 forupregulation (≥1 fold) and a log ratio of 0.5 fordownregulation (≤0.5 fold), keeping a median log ratio of 1in both biologic replicates, were considered for expressionanalysis [11]. The important upregulated (Table 3 and Table4) and downregulated (Table 5) genes are provided. Weclassified the altered transcripts based on their biologic roles.The data also identified several candidate genes that are foundto be highly overexpressed in retinoblastoma tumors and thatkeep tumors in a proliferation state, such as Homo sapiens v-myc myelocytomatosis viral-related oncogene (MYCN) [12,13], H. sapiens jun oncogene (Jun) [11], H. sapiens v-erb-b2(ERBB3) [14], and H. sapiens insulin-like growth factor
binding protein 5 (IGFBP5) [15]. We also found enhancedexpression of collagen, integrins, fibronectin, and laminin,which crosslink and stiffen the tissue stroma to promotetransformation, tumor growth, motility, and invasion andenhance cancer cell survival [16].
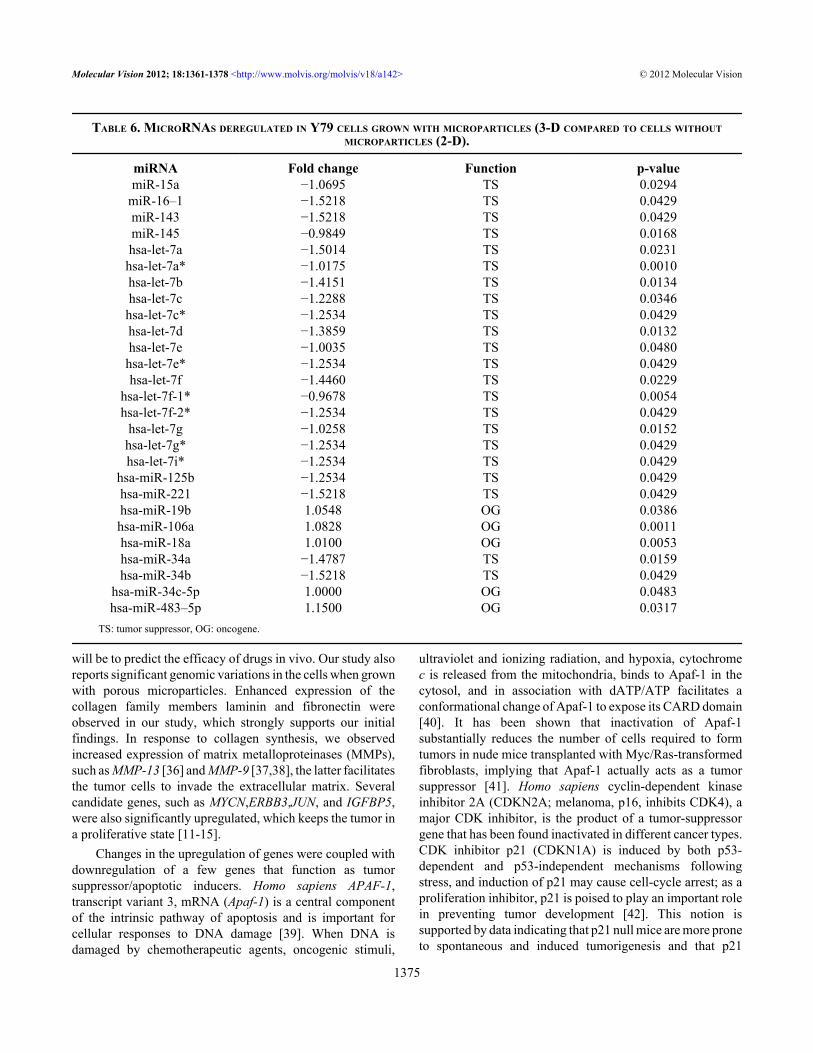
MicroRNA analysis: Results of the microRNA analysisrevealed changes in the expression of 52 miRNAs(overexpression of 6 miRNAs; downregulation of 46miRNAs) in cells grown with PLGA–gelatin microparticlescompared to those grown without microparticles (Figure 9B).The important differentially regulated miRNAs are providedin Table 6. We classified the altered miRNAs based on theirbiologic roles (oncomirs and tumor suppressors). Our data hasidentified downregulated tumor suppressor miRNAs in cellswith PLGA–gelatin microparticles, such as let-7 miRNAs(let-7 family) and miR-34a (which may enhanceretinoblastoma tumor proliferation) [17,18] and miR-15a andmiR-16, which have been implicated in cell-cycle control andapoptosis [19]. We also identified upregulated miRNAs, suchas miR-198, which may play significant roles in regulatingretinoblastoma tumor genesis [20]; miR-18a and miR-19b,which are upregulated in various carcinomas and increasedexpression of this cluster contributes to cancer formation[21]; and miR-106a, which is a potential biomarker in thediagnosis of gastric carcinoma [22].
Figure 9. This figure represents microarray heat map displaying deregulated genes and microRNAs in Y79 cells either or not co-cultured withmicroparticles. A: Heat map shows significantly upregulated and down-regulated genes in Y79 cells co-cultured with microparticles (3-D)when compared with Y79 cells cultured without microparticles (2-D). B: Heat map shows significantly upregulated and down-regulatedmicroRNAs in Y79 cells co-cultured with microparticles (3-D) when compared with Y79 cells cultured without microparticles (2-D). Greencolor represents upregulated genes or microRNAs and red color represents down-regulated genes or microRNAs. Heat map shows gene IDsor microRNA names and their respective expression fold changes in Y79 cells co-cultured with microparticles (3-D) when compared withY79 cells cultured with microparticles (2-D).
Molecular Vision 2012; 18:1361-1378 <http://www.molvis.org/molvis/v18/a142> © 2012 Molecular Vision
1371
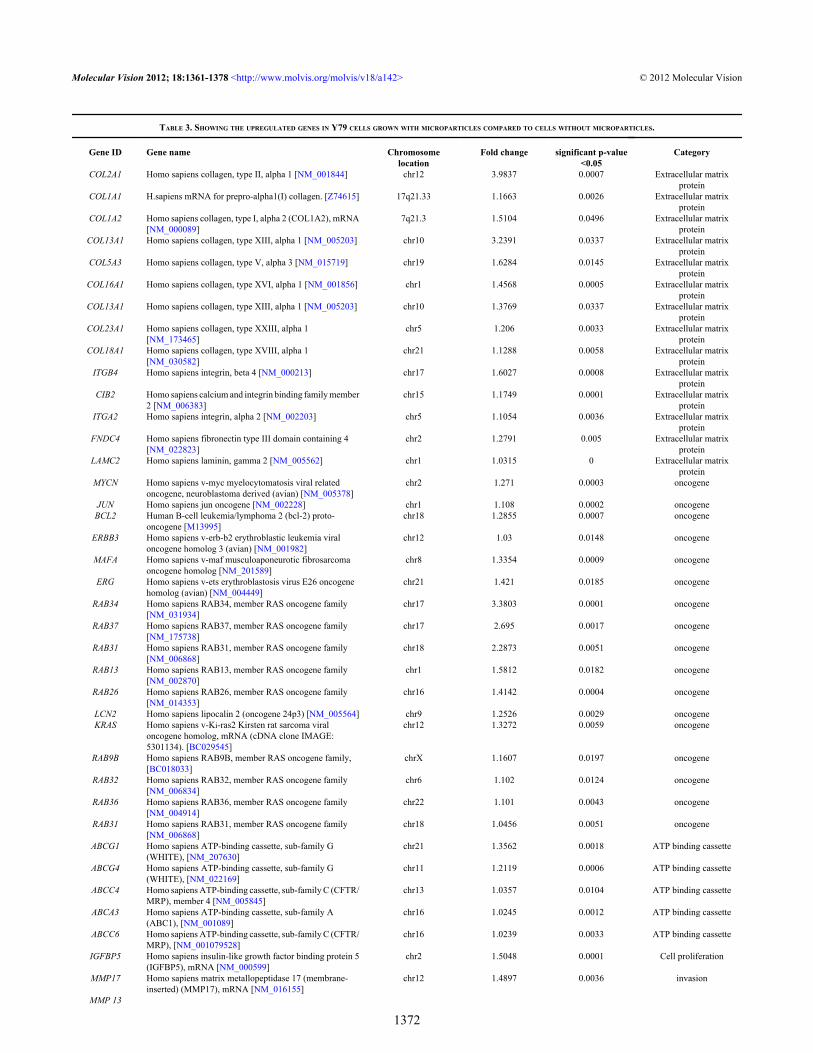
TABLE 3. SHOWING THE UPREGULATED GENES IN Y79 CELLS GROWN WITH MICROPARTICLES COMPARED TO CELLS WITHOUT MICROPARTICLES.
Gene ID Gene name Chromosomelocation
Fold change significant p-value<0.05
Category
COL2A1 Homo sapiens collagen, type II, alpha 1 [NM_001844] chr12 3.9837 0.0007 Extracellular matrixprotein
COL1A1 H.sapiens mRNA for prepro-alpha1(I) collagen. [Z74615] 17q21.33 1.1663 0.0026 Extracellular matrixprotein
COL1A2 Homo sapiens collagen, type I, alpha 2 (COL1A2), mRNA[NM_000089]
7q21.3 1.5104 0.0496 Extracellular matrixprotein
COL13A1 Homo sapiens collagen, type XIII, alpha 1 [NM_005203] chr10 3.2391 0.0337 Extracellular matrixprotein
COL5A3 Homo sapiens collagen, type V, alpha 3 [NM_015719] chr19 1.6284 0.0145 Extracellular matrixprotein
COL16A1 Homo sapiens collagen, type XVI, alpha 1 [NM_001856] chr1 1.4568 0.0005 Extracellular matrixprotein
COL13A1 Homo sapiens collagen, type XIII, alpha 1 [NM_005203] chr10 1.3769 0.0337 Extracellular matrixprotein
COL23A1 Homo sapiens collagen, type XXIII, alpha 1[NM_173465]
chr5 1.206 0.0033 Extracellular matrixprotein
COL18A1 Homo sapiens collagen, type XVIII, alpha 1[NM_030582]
chr21 1.1288 0.0058 Extracellular matrixprotein
ITGB4 Homo sapiens integrin, beta 4 [NM_000213] chr17 1.6027 0.0008 Extracellular matrixprotein
CIB2 Homo sapiens calcium and integrin binding family member2 [NM_006383]
chr15 1.1749 0.0001 Extracellular matrixprotein
ITGA2 Homo sapiens integrin, alpha 2 [NM_002203] chr5 1.1054 0.0036 Extracellular matrixprotein
FNDC4 Homo sapiens fibronectin type III domain containing 4[NM_022823]
chr2 1.2791 0.005 Extracellular matrixprotein
LAMC2 Homo sapiens laminin, gamma 2 [NM_005562] chr1 1.0315 0 Extracellular matrixprotein
MYCN Homo sapiens v-myc myelocytomatosis viral relatedoncogene, neuroblastoma derived (avian) [NM_005378]
chr2 1.271 0.0003 oncogene
JUN Homo sapiens jun oncogene [NM_002228] chr1 1.108 0.0002 oncogeneBCL2 Human B-cell leukemia/lymphoma 2 (bcl-2) proto-
oncogene [M13995]chr18 1.2855 0.0007 oncogene
ERBB3 Homo sapiens v-erb-b2 erythroblastic leukemia viraloncogene homolog 3 (avian) [NM_001982]
chr12 1.03 0.0148 oncogene
MAFA Homo sapiens v-maf musculoaponeurotic fibrosarcomaoncogene homolog [NM_201589]
chr8 1.3354 0.0009 oncogene
ERG Homo sapiens v-ets erythroblastosis virus E26 oncogenehomolog (avian) [NM_004449]
chr21 1.421 0.0185 oncogene
RAB34 Homo sapiens RAB34, member RAS oncogene family[NM_031934]
chr17 3.3803 0.0001 oncogene
RAB37 Homo sapiens RAB37, member RAS oncogene family[NM_175738]
chr17 2.695 0.0017 oncogene
RAB31 Homo sapiens RAB31, member RAS oncogene family[NM_006868]
chr18 2.2873 0.0051 oncogene
RAB13 Homo sapiens RAB13, member RAS oncogene family[NM_002870]
chr1 1.5812 0.0182 oncogene
RAB26 Homo sapiens RAB26, member RAS oncogene family[NM_014353]
chr16 1.4142 0.0004 oncogene
LCN2 Homo sapiens lipocalin 2 (oncogene 24p3) [NM_005564] chr9 1.2526 0.0029 oncogeneKRAS Homo sapiens v-Ki-ras2 Kirsten rat sarcoma viral
oncogene homolog, mRNA (cDNA clone IMAGE:5301134). [BC029545]
chr12 1.3272 0.0059 oncogene
RAB9B Homo sapiens RAB9B, member RAS oncogene family,[BC018033]
chrX 1.1607 0.0197 oncogene
RAB32 Homo sapiens RAB32, member RAS oncogene family[NM_006834]
chr6 1.102 0.0124 oncogene
RAB36 Homo sapiens RAB36, member RAS oncogene family[NM_004914]
chr22 1.101 0.0043 oncogene
RAB31 Homo sapiens RAB31, member RAS oncogene family[NM_006868]
chr18 1.0456 0.0051 oncogene
ABCG1 Homo sapiens ATP-binding cassette, sub-family G(WHITE), [NM_207630]
chr21 1.3562 0.0018 ATP binding cassette
ABCG4 Homo sapiens ATP-binding cassette, sub-family G(WHITE), [NM_022169]
chr11 1.2119 0.0006 ATP binding cassette
ABCC4 Homo sapiens ATP-binding cassette, sub-family C (CFTR/MRP), member 4 [NM_005845]
chr13 1.0357 0.0104 ATP binding cassette
ABCA3 Homo sapiens ATP-binding cassette, sub-family A(ABC1), [NM_001089]
chr16 1.0245 0.0012 ATP binding cassette
ABCC6 Homo sapiens ATP-binding cassette, sub-family C (CFTR/MRP), [NM_001079528]
chr16 1.0239 0.0033 ATP binding cassette
IGFBP5 Homo sapiens insulin-like growth factor binding protein 5(IGFBP5), mRNA [NM_000599]
chr2 1.5048 0.0001 Cell proliferation
MMP17 Homo sapiens matrix metallopeptidase 17 (membrane-inserted) (MMP17), mRNA [NM_016155]
chr12 1.4897 0.0036 invasion
MMP 13
Molecular Vision 2012; 18:1361-1378 <http://www.molvis.org/molvis/v18/a142> © 2012 Molecular Vision
1372
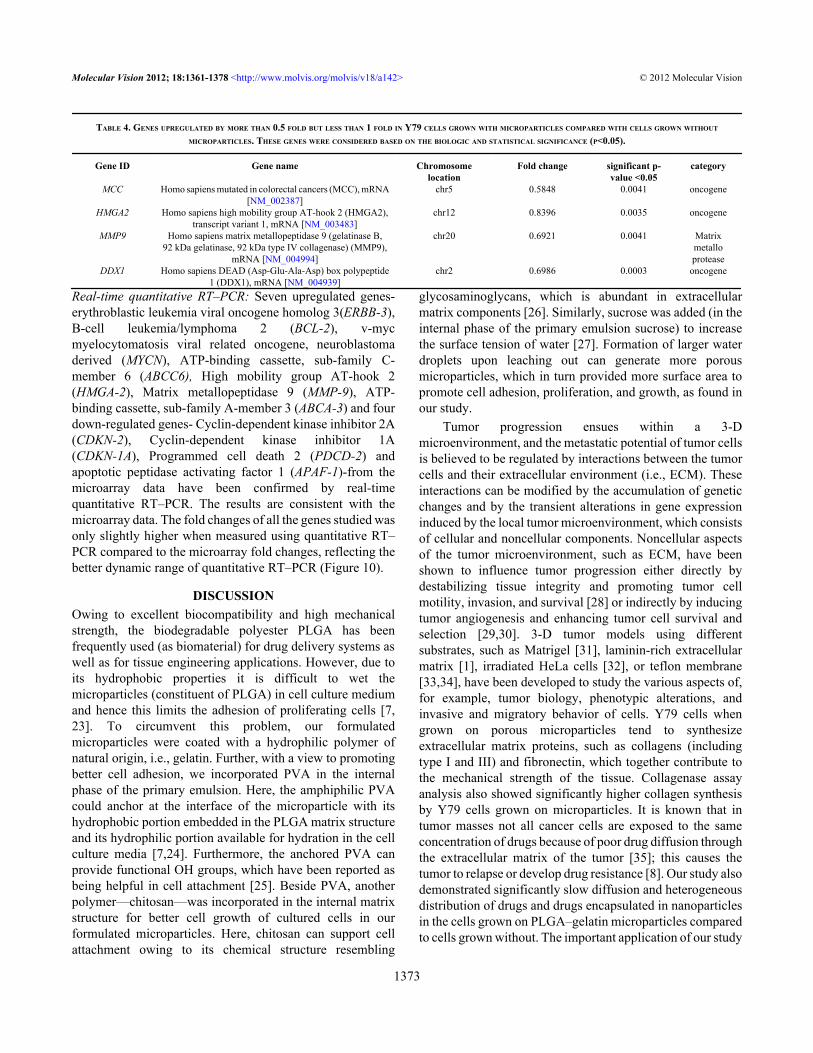
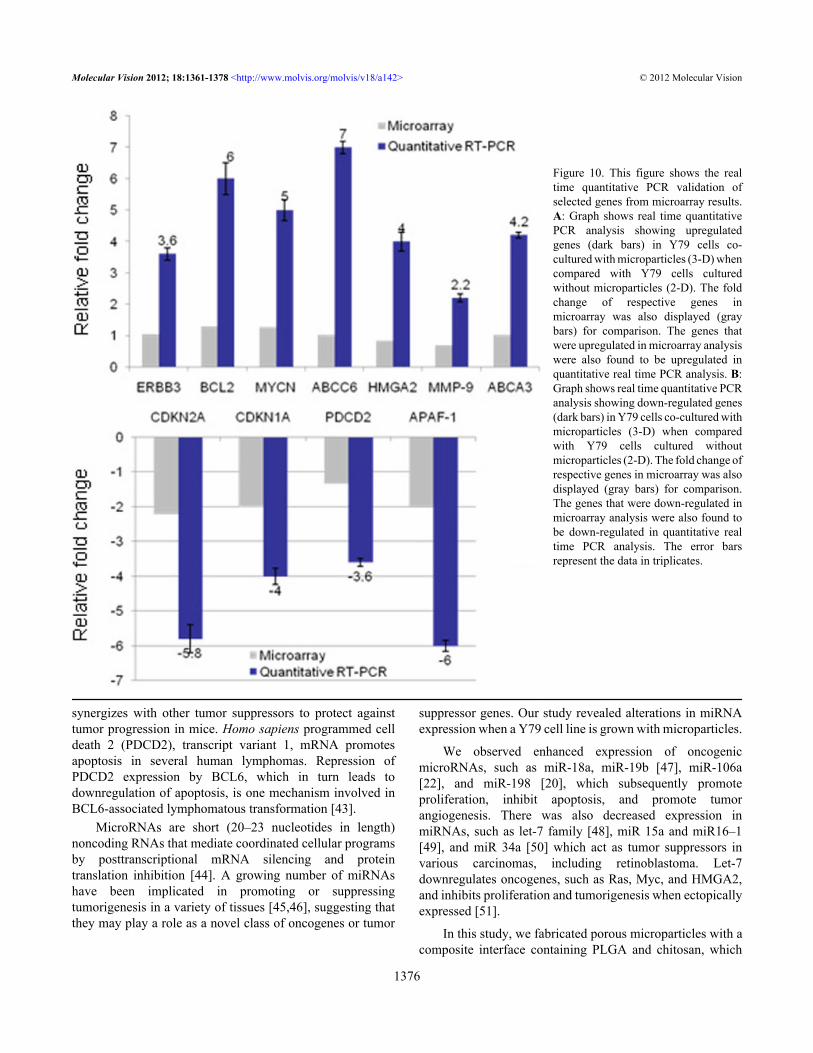
Real-time quantitative RT–PCR: Seven upregulated genes-erythroblastic leukemia viral oncogene homolog 3(ERBB-3),B-cell leukemia/lymphoma 2 (BCL-2), v-mycmyelocytomatosis viral related oncogene, neuroblastomaderived (MYCN), ATP-binding cassette, sub-family C-member 6 (ABCC6), High mobility group AT-hook 2(HMGA-2), Matrix metallopeptidase 9 (MMP-9), ATP-binding cassette, sub-family A-member 3 (ABCA-3) and fourdown-regulated genes- Cyclin-dependent kinase inhibitor 2A(CDKN-2), Cyclin-dependent kinase inhibitor 1A(CDKN-1A), Programmed cell death 2 (PDCD-2) andapoptotic peptidase activating factor 1 (APAF-1)-from themicroarray data have been confirmed by real-timequantitative RT–PCR. The results are consistent with themicroarray data. The fold changes of all the genes studied wasonly slightly higher when measured using quantitative RT–PCR compared to the microarray fold changes, reflecting thebetter dynamic range of quantitative RT–PCR (Figure 10).
DISCUSSIONOwing to excellent biocompatibility and high mechanicalstrength, the biodegradable polyester PLGA has beenfrequently used (as biomaterial) for drug delivery systems aswell as for tissue engineering applications. However, due toits hydrophobic properties it is difficult to wet themicroparticles (constituent of PLGA) in cell culture mediumand hence this limits the adhesion of proliferating cells [7,23]. To circumvent this problem, our formulatedmicroparticles were coated with a hydrophilic polymer ofnatural origin, i.e., gelatin. Further, with a view to promotingbetter cell adhesion, we incorporated PVA in the internalphase of the primary emulsion. Here, the amphiphilic PVAcould anchor at the interface of the microparticle with itshydrophobic portion embedded in the PLGA matrix structureand its hydrophilic portion available for hydration in the cellculture media [7,24]. Furthermore, the anchored PVA canprovide functional OH groups, which have been reported asbeing helpful in cell attachment [25]. Beside PVA, anotherpolymer—chitosan—was incorporated in the internal matrixstructure for better cell growth of cultured cells in ourformulated microparticles. Here, chitosan can support cellattachment owing to its chemical structure resembling
glycosaminoglycans, which is abundant in extracellularmatrix components [26]. Similarly, sucrose was added (in theinternal phase of the primary emulsion sucrose) to increasethe surface tension of water [27]. Formation of larger waterdroplets upon leaching out can generate more porousmicroparticles, which in turn provided more surface area topromote cell adhesion, proliferation, and growth, as found inour study.
Tumor progression ensues within a 3-Dmicroenvironment, and the metastatic potential of tumor cellsis believed to be regulated by interactions between the tumorcells and their extracellular environment (i.e., ECM). Theseinteractions can be modified by the accumulation of geneticchanges and by the transient alterations in gene expressioninduced by the local tumor microenvironment, which consistsof cellular and noncellular components. Noncellular aspectsof the tumor microenvironment, such as ECM, have beenshown to influence tumor progression either directly bydestabilizing tissue integrity and promoting tumor cellmotility, invasion, and survival [28] or indirectly by inducingtumor angiogenesis and enhancing tumor cell survival andselection [29,30]. 3-D tumor models using differentsubstrates, such as Matrigel [31], laminin-rich extracellularmatrix [1], irradiated HeLa cells [32], or teflon membrane[33,34], have been developed to study the various aspects of,for example, tumor biology, phenotypic alterations, andinvasive and migratory behavior of cells. Y79 cells whengrown on porous microparticles tend to synthesizeextracellular matrix proteins, such as collagens (includingtype I and III) and fibronectin, which together contribute tothe mechanical strength of the tissue. Collagenase assayanalysis also showed significantly higher collagen synthesisby Y79 cells grown on microparticles. It is known that intumor masses not all cancer cells are exposed to the sameconcentration of drugs because of poor drug diffusion throughthe extracellular matrix of the tumor [35]; this causes thetumor to relapse or develop drug resistance [8]. Our study alsodemonstrated significantly slow diffusion and heterogeneousdistribution of drugs and drugs encapsulated in nanoparticlesin the cells grown on PLGA–gelatin microparticles comparedto cells grown without. The important application of our study
TABLE 4. GENES UPREGULATED BY MORE THAN 0.5 FOLD BUT LESS THAN 1 FOLD IN Y79 CELLS GROWN WITH MICROPARTICLES COMPARED WITH CELLS GROWN WITHOUT
MICROPARTICLES. THESE GENES WERE CONSIDERED BASED ON THE BIOLOGIC AND STATISTICAL SIGNIFICANCE (P<0.05).
Gene ID Gene name Chromosomelocation
Fold change significant p-value <0.05
category
MCC Homo sapiens mutated in colorectal cancers (MCC), mRNA[NM_002387]
chr5 0.5848 0.0041 oncogene
HMGA2 Homo sapiens high mobility group AT-hook 2 (HMGA2),transcript variant 1, mRNA [NM_003483]
chr12 0.8396 0.0035 oncogene
MMP9 Homo sapiens matrix metallopeptidase 9 (gelatinase B,92 kDa gelatinase, 92 kDa type IV collagenase) (MMP9),
mRNA [NM_004994]
chr20 0.6921 0.0041 Matrixmetalloprotease
DDX1 Homo sapiens DEAD (Asp-Glu-Ala-Asp) box polypeptide1 (DDX1), mRNA [NM_004939]
chr2 0.6986 0.0003 oncogene
Molecular Vision 2012; 18:1361-1378 <http://www.molvis.org/molvis/v18/a142> © 2012 Molecular Vision
1373
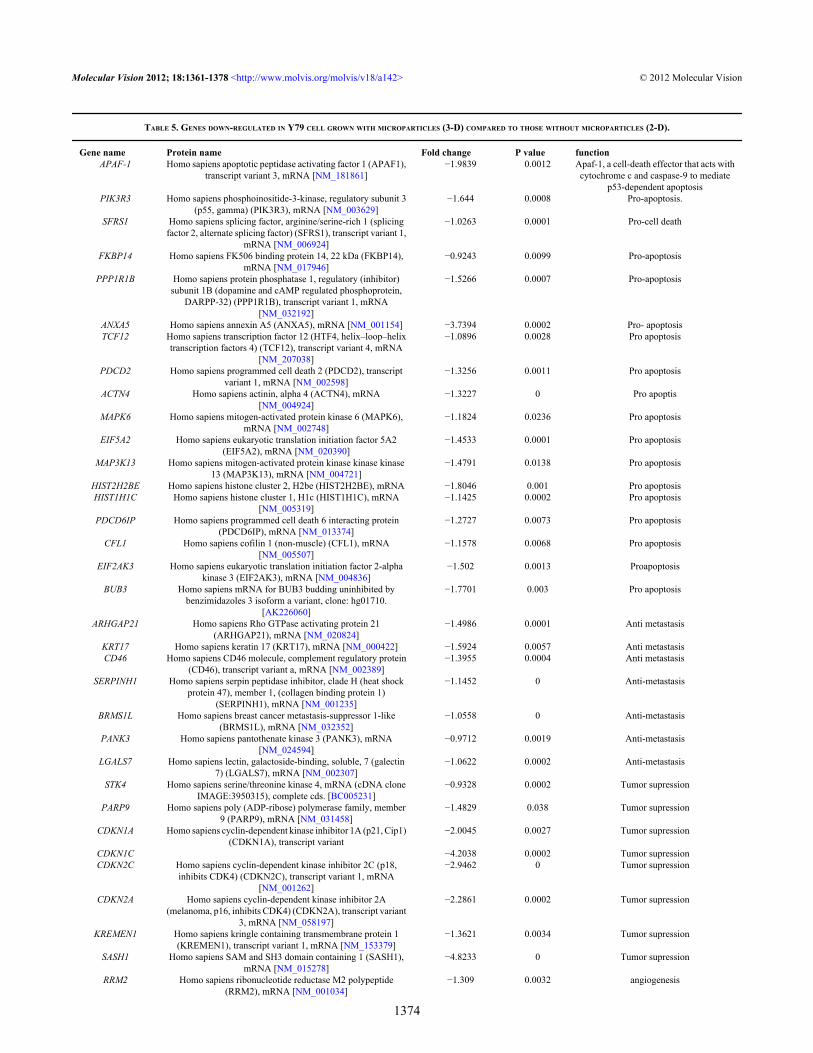
TABLE 5. GENES DOWN-REGULATED IN Y79 CELL GROWN WITH MICROPARTICLES (3-D) COMPARED TO THOSE WITHOUT MICROPARTICLES (2-D).
Gene name Protein name Fold change P value functionAPAF-1 Homo sapiens apoptotic peptidase activating factor 1 (APAF1),
transcript variant 3, mRNA [NM_181861]−1.9839 0.0012 Apaf-1, a cell-death effector that acts with
cytochrome c and caspase-9 to mediatep53-dependent apoptosis
PIK3R3 Homo sapiens phosphoinositide-3-kinase, regulatory subunit 3(p55, gamma) (PIK3R3), mRNA [NM_003629]
−1.644 0.0008 Pro-apoptosis.
SFRS1 Homo sapiens splicing factor, arginine/serine-rich 1 (splicingfactor 2, alternate splicing factor) (SFRS1), transcript variant 1,
mRNA [NM_006924]
−1.0263 0.0001 Pro-cell death
FKBP14 Homo sapiens FK506 binding protein 14, 22 kDa (FKBP14),mRNA [NM_017946]
−0.9243 0.0099 Pro-apoptosis
PPP1R1B Homo sapiens protein phosphatase 1, regulatory (inhibitor)subunit 1B (dopamine and cAMP regulated phosphoprotein,
DARPP-32) (PPP1R1B), transcript variant 1, mRNA[NM_032192]
−1.5266 0.0007 Pro-apoptosis
ANXA5 Homo sapiens annexin A5 (ANXA5), mRNA [NM_001154] −3.7394 0.0002 Pro- apoptosisTCF12 Homo sapiens transcription factor 12 (HTF4, helix–loop–helix
transcription factors 4) (TCF12), transcript variant 4, mRNA[NM_207038]
−1.0896 0.0028 Pro apoptosis
PDCD2 Homo sapiens programmed cell death 2 (PDCD2), transcriptvariant 1, mRNA [NM_002598]
−1.3256 0.0011 Pro apoptosis
ACTN4 Homo sapiens actinin, alpha 4 (ACTN4), mRNA[NM_004924]
−1.3227 0 Pro apoptis
MAPK6 Homo sapiens mitogen-activated protein kinase 6 (MAPK6),mRNA [NM_002748]
−1.1824 0.0236 Pro apoptosis
EIF5A2 Homo sapiens eukaryotic translation initiation factor 5A2(EIF5A2), mRNA [NM_020390]
−1.4533 0.0001 Pro apoptosis
MAP3K13 Homo sapiens mitogen-activated protein kinase kinase kinase13 (MAP3K13), mRNA [NM_004721]
−1.4791 0.0138 Pro apoptosis
HIST2H2BE Homo sapiens histone cluster 2, H2be (HIST2H2BE), mRNA −1.8046 0.001 Pro apoptosisHIST1H1C Homo sapiens histone cluster 1, H1c (HIST1H1C), mRNA
[NM_005319]−1.1425 0.0002 Pro apoptosis
PDCD6IP Homo sapiens programmed cell death 6 interacting protein(PDCD6IP), mRNA [NM_013374]
−1.2727 0.0073 Pro apoptosis
CFL1 Homo sapiens cofilin 1 (non-muscle) (CFL1), mRNA[NM_005507]
−1.1578 0.0068 Pro apoptosis
EIF2AK3 Homo sapiens eukaryotic translation initiation factor 2-alphakinase 3 (EIF2AK3), mRNA [NM_004836]
−1.502 0.0013 Proapoptosis
BUB3 Homo sapiens mRNA for BUB3 budding uninhibited bybenzimidazoles 3 isoform a variant, clone: hg01710.
[AK226060]
−1.7701 0.003 Pro apoptosis
ARHGAP21 Homo sapiens Rho GTPase activating protein 21(ARHGAP21), mRNA [NM_020824]
−1.4986 0.0001 Anti metastasis
KRT17 Homo sapiens keratin 17 (KRT17), mRNA [NM_000422] −1.5924 0.0057 Anti metastasisCD46 Homo sapiens CD46 molecule, complement regulatory protein
(CD46), transcript variant a, mRNA [NM_002389]−1.3955 0.0004 Anti metastasis
SERPINH1 Homo sapiens serpin peptidase inhibitor, clade H (heat shockprotein 47), member 1, (collagen binding protein 1)
(SERPINH1), mRNA [NM_001235]
−1.1452 0 Anti-metastasis
BRMS1L Homo sapiens breast cancer metastasis-suppressor 1-like(BRMS1L), mRNA [NM_032352]
−1.0558 0 Anti-metastasis
PANK3 Homo sapiens pantothenate kinase 3 (PANK3), mRNA[NM_024594]
−0.9712 0.0019 Anti-metastasis
LGALS7 Homo sapiens lectin, galactoside-binding, soluble, 7 (galectin7) (LGALS7), mRNA [NM_002307]
−1.0622 0.0002 Anti-metastasis
STK4 Homo sapiens serine/threonine kinase 4, mRNA (cDNA cloneIMAGE:3950315), complete cds. [BC005231]
−0.9328 0.0002 Tumor supression
PARP9 Homo sapiens poly (ADP-ribose) polymerase family, member9 (PARP9), mRNA [NM_031458]
−1.4829 0.038 Tumor supression
CDKN1A Homo sapiens cyclin-dependent kinase inhibitor 1A (p21, Cip1)(CDKN1A), transcript variant
−2.0045 0.0027 Tumor supression
CDKN1C −4.2038 0.0002 Tumor supressionCDKN2C Homo sapiens cyclin-dependent kinase inhibitor 2C (p18,
inhibits CDK4) (CDKN2C), transcript variant 1, mRNA[NM_001262]
−2.9462 0 Tumor supression
CDKN2A Homo sapiens cyclin-dependent kinase inhibitor 2A(melanoma, p16, inhibits CDK4) (CDKN2A), transcript variant
3, mRNA [NM_058197]
−2.2861 0.0002 Tumor supression
KREMEN1 Homo sapiens kringle containing transmembrane protein 1(KREMEN1), transcript variant 1, mRNA [NM_153379]
−1.3621 0.0034 Tumor supression
SASH1 Homo sapiens SAM and SH3 domain containing 1 (SASH1),mRNA [NM_015278]
−4.8233 0 Tumor supression
RRM2 Homo sapiens ribonucleotide reductase M2 polypeptide(RRM2), mRNA [NM_001034]
−1.309 0.0032 angiogenesis
Molecular Vision 2012; 18:1361-1378 <http://www.molvis.org/molvis/v18/a142> © 2012 Molecular Vision
1374
will be to predict the efficacy of drugs in vivo. Our study alsoreports significant genomic variations in the cells when grownwith porous microparticles. Enhanced expression of thecollagen family members laminin and fibronectin wereobserved in our study, which strongly supports our initialfindings. In response to collagen synthesis, we observedincreased expression of matrix metalloproteinases (MMPs),such as MMP-13 [36] and MMP-9 [37,38], the latter facilitatesthe tumor cells to invade the extracellular matrix. Severalcandidate genes, such as MYCN,ERBB3,JUN, and IGFBP5,were also significantly upregulated, which keeps the tumor ina proliferative state [11-15].
Changes in the upregulation of genes were coupled withdownregulation of a few genes that function as tumorsuppressor/apoptotic inducers. Homo sapiens APAF-1,transcript variant 3, mRNA (Apaf-1) is a central componentof the intrinsic pathway of apoptosis and is important forcellular responses to DNA damage [39]. When DNA isdamaged by chemotherapeutic agents, oncogenic stimuli,
ultraviolet and ionizing radiation, and hypoxia, cytochromec is released from the mitochondria, binds to Apaf-1 in thecytosol, and in association with dATP/ATP facilitates aconformational change of Apaf-1 to expose its CARD domain[40]. It has been shown that inactivation of Apaf-1substantially reduces the number of cells required to formtumors in nude mice transplanted with Myc/Ras-transformedfibroblasts, implying that Apaf-1 actually acts as a tumorsuppressor [41]. Homo sapiens cyclin-dependent kinaseinhibitor 2A (CDKN2A; melanoma, p16, inhibits CDK4), amajor CDK inhibitor, is the product of a tumor-suppressorgene that has been found inactivated in different cancer types.CDK inhibitor p21 (CDKN1A) is induced by both p53-dependent and p53-independent mechanisms followingstress, and induction of p21 may cause cell-cycle arrest; as aproliferation inhibitor, p21 is poised to play an important rolein preventing tumor development [42]. This notion issupported by data indicating that p21 null mice are more proneto spontaneous and induced tumorigenesis and that p21
TABLE 6. MICRORNAS DEREGULATED IN Y79 CELLS GROWN WITH MICROPARTICLES (3-D COMPARED TO CELLS WITHOUTMICROPARTICLES (2-D).
miRNA Fold change Function p-valuemiR-15a −1.0695 TS 0.0294
miR-16–1 −1.5218 TS 0.0429miR-143 −1.5218 TS 0.0429miR-145 −0.9849 TS 0.0168hsa-let-7a −1.5014 TS 0.0231hsa-let-7a* −1.0175 TS 0.0010hsa-let-7b −1.4151 TS 0.0134hsa-let-7c −1.2288 TS 0.0346hsa-let-7c* −1.2534 TS 0.0429hsa-let-7d −1.3859 TS 0.0132hsa-let-7e −1.0035 TS 0.0480hsa-let-7e* −1.2534 TS 0.0429hsa-let-7f −1.4460 TS 0.0229
hsa-let-7f-1* −0.9678 TS 0.0054hsa-let-7f-2* −1.2534 TS 0.0429
hsa-let-7g −1.0258 TS 0.0152hsa-let-7g* −1.2534 TS 0.0429hsa-let-7i* −1.2534 TS 0.0429
hsa-miR-125b −1.2534 TS 0.0429hsa-miR-221 −1.5218 TS 0.0429hsa-miR-19b 1.0548 OG 0.0386hsa-miR-106a 1.0828 OG 0.0011hsa-miR-18a 1.0100 OG 0.0053hsa-miR-34a −1.4787 TS 0.0159hsa-miR-34b −1.5218 TS 0.0429
hsa-miR-34c-5p 1.0000 OG 0.0483hsa-miR-483–5p 1.1500 OG 0.0317
TS: tumor suppressor, OG: oncogene.
Molecular Vision 2012; 18:1361-1378 <http://www.molvis.org/molvis/v18/a142> © 2012 Molecular Vision
1375
synergizes with other tumor suppressors to protect againsttumor progression in mice. Homo sapiens programmed celldeath 2 (PDCD2), transcript variant 1, mRNA promotesapoptosis in several human lymphomas. Repression ofPDCD2 expression by BCL6, which in turn leads todownregulation of apoptosis, is one mechanism involved inBCL6-associated lymphomatous transformation [43].
MicroRNAs are short (20–23 nucleotides in length)noncoding RNAs that mediate coordinated cellular programsby posttranscriptional mRNA silencing and proteintranslation inhibition [44]. A growing number of miRNAshave been implicated in promoting or suppressingtumorigenesis in a variety of tissues [45,46], suggesting thatthey may play a role as a novel class of oncogenes or tumor
suppressor genes. Our study revealed alterations in miRNAexpression when a Y79 cell line is grown with microparticles.
We observed enhanced expression of oncogenicmicroRNAs, such as miR-18a, miR-19b [47], miR-106a[22], and miR-198 [20], which subsequently promoteproliferation, inhibit apoptosis, and promote tumorangiogenesis. There was also decreased expression inmiRNAs, such as let-7 family [48], miR 15a and miR16–1[49], and miR 34a [50] which act as tumor suppressors invarious carcinomas, including retinoblastoma. Let-7downregulates oncogenes, such as Ras, Myc, and HMGA2,and inhibits proliferation and tumorigenesis when ectopicallyexpressed [51].
In this study, we fabricated porous microparticles with acomposite interface containing PLGA and chitosan, which
Figure 10. This figure shows the realtime quantitative PCR validation ofselected genes from microarray results.A: Graph shows real time quantitativePCR analysis showing upregulatedgenes (dark bars) in Y79 cells co-cultured with microparticles (3-D) whencompared with Y79 cells culturedwithout microparticles (2-D). The foldchange of respective genes inmicroarray was also displayed (graybars) for comparison. The genes thatwere upregulated in microarray analysiswere also found to be upregulated inquantitative real time PCR analysis. B:Graph shows real time quantitative PCRanalysis showing down-regulated genes(dark bars) in Y79 cells co-cultured withmicroparticles (3-D) when comparedwith Y79 cells cultured withoutmicroparticles (2-D). The fold change ofrespective genes in microarray was alsodisplayed (gray bars) for comparison.The genes that were down-regulated inmicroarray analysis were also found tobe down-regulated in quantitative realtime PCR analysis. The error barsrepresent the data in triplicates.
Molecular Vision 2012; 18:1361-1378 <http://www.molvis.org/molvis/v18/a142> © 2012 Molecular Vision
1376
causes cancer cells to develop into a tumor-like structure invitro. The drug efficacy was significantly lower in cells grownwith microparticles than in cells grown withoutmicroparticles, suggesting a role of cellular architecture ondrug uptake, distribution, and efficacy. Our tumor modelcould potentially be applicable in developing effective drugsbased on a better understanding of the role of chemical,biologic, and physical parameters in the process of drugdiffusion through the tumor mass, drug retention, andtherapeutic outcome. A correlation between the drug effectsseen in the tumor model to the in vivo efficacy would furtherestablish the usefulness of our model in drug discovery. Inconclusion, we developed a novel, retinoblastoma, in vitro, 3-D model that could be used for evaluating chemotherapeuticdrugs in the future.
ACKNOWLEDGMENTSWe thank Department of Biotechnology (DBT), Govt. ofIndia (grant No. BT/PR7968/MED/14/1206/2006), for thefinancial support and the core laboratory technical staff,Vision Research Foundation for the flow cytometry technicalhelp.
REFERENCES1. Lee GY, Kenny PA, Lee EH, Bissell MJ. Three-dimensional
culture models of normal and malignant breast epithelial cells.Nat Methods 2007; 4:359-65. [PMID: 17396127]
2. Bhadriraju K, Chen CS. Engineering cellularmicroenvironments to improve cell- based drug testing. DrugDiscov Today 2002; 7:612-20. [PMID: 12047872]
3. Sun T, Jackson S, Haycock JW, MacNeil S. Culture of skin cellsin 3D rather than 2D improves their ability to surviveexposure to cytotoxic agents. J Biotechnol 2006;122:372-81. [PMID: 16446003]
4. Lunt SJ, Chaudary N, Hill RP. The tumor microenvironmentand metastatic disease. Clin Exp Metastasis 2009; 26:19-34.[PMID: 18543068]
5. Bokhari M, Carnachan RJ, Cameron NR, Przyborski SA.Culture of HepG2 liver cells on three dimensional polystyrenescaffolds enhances cell structure and function duringtoxicological challenge. J Anat 2007; 211:567-76. [PMID:17711423]
6. Lee GY, Kenny PA, Lee EH, Bissell MJ. Three dimensionalculture models of normal and malignant breast epithelial cells.Nat Methods 2007; 4:359-65. [PMID: 17396127]
7. Horning JL, Sahoo SK, Vijayaraghavalu S, Dimitrijevic S,Vasir JK, Jain TK, Panda AK, Labhasetwar V. 3-D tumormodel for in vitro evaluation of anticancer drugs. Mol Pharm2008; 5:849-62. [PMID: 18680382]
8. Parveen S, Mitra M, Krishnakumar S, Sahoo SK. Enhancedantiproliferative activity of carboplatin-loaded chitosan-alginate nanoparticles in a retinoblastoma cell line. ActaBiomater 2010; 6:3120-31. [PMID: 20149903]
9. Sahoo SK, Panda AK, Labhasetwar V. Characterization ofporous PLGA/PLA microparticles as a scaffold for threedimensional growth of breast cancer cells.Biomacromolecules 2005; 6:1132-9. [PMID: 15762686]
10. Dunne M, Corrigan I, Ramtoola Z. Influence of particle size anddissolution conditions on the degradation properties ofpolylactide-co-glycolide particles. Biomaterials 2000;21:1659-68. [PMID: 10905407]
11. Mitra M, Mallikarjuna K, Verma RS, Uma M, KrishnakumarS. Genome-wide changes accompanying the knock-down ofEpCAM in retinoblastoma. Mol Vis 2010; 16:828-42.[PMID: 20461151]
12. MacPherson D, Conkrite K, Tam M, Mukai S, Mu D, Jacks T.Murine bilateral retinoblastoma exhibiting rapid-onset,metastatic progression and N-myc gene amplification. EMBOJ 2007; 26:784-94. [PMID: 17235288]
13. Sakai K, Tanooka H, Sasaki MS, Ejima Y, Kaneko A. Increasein copy number of N-myc in retinoblastomas in comparisonwith chromosome abnormality. Cancer Genet Cytogenet1988; 30:119-26. [PMID: 3422037]
14. Chakraborty S, Khare S, Dorairaj SK, Prabhakaran VC, PrakashDR, Kumar A. Identification of genes associated withtumorigenesis of retinoblastoma by microarray analysis.Genomics 2007; 90:344-53. [PMID: 17604597]
15. Xu XL, Lee TC, Offor N, Cheng C, Liu A, Fang Y, JhanwarSC, Abramson DH, Cobrinik D. Tumor-associated retinalastrocytes promote retinoblastoma cell proliferation throughproduction of IGFBP-5. Am J Pathol 2010; 177:424-35.[PMID: 20508032]
16. Erler JT, Weaver VM. Three-dimensional context regulation ofmetastasis. Clin Exp Metastasis 2009; 26:35-49. [PMID:18814043]
17. Mu G, Liu H, Zhou F, Xu X, Jiang H, Wang Y, Qu Y.Correlation of overexpression of HMGA1 and HMGA2 withpoor tumor differentiation, invasion, and proliferationassociated with let-7 down-regulation in retinoblastomas.Hum Pathol 2010; 41:493-502. [PMID: 20004941]
18. Dalgard CL, Gonzalez M, deNiro JE, O'Brien JM. DifferentialmicroRNA-34a expression and tumor suppressor function inretinoblastoma cells. Invest Ophthalmol Vis Sci 2009;50:4542-51. [PMID: 19443717]
19. Bandi N, Zbinden S, Gugger M, Arnold M, Kocher V, HasanL, Kappeler A, Brunner T, Vassella E. miR-15a and miR-16are implicated in cell cycle regulation in a Rb-dependentmanner and are frequently deleted or down-regulated in non-small cell lung cancer. Cancer Res 2009; 69:5553-9. [PMID:19549910]
20. Zhao JJ, Yang J, Lin J, Yao N, Zhu Y, Zheng J, Xu J, ChengJQ, Lin JY, Ma X. Identification of miRNAs associated withtumorigenesis of retinoblastoma by miRNA microarrayanalysis. Childs Nerv Syst 2009; 25:13-20. [PMID:18818933]
21. Esquela-Kerscher A, Frank JS. Oncomirs — microRNAs witha role in cancer. Nat Rev Cancer 2006; 6:259-69. [PMID:16557279]
22. Xiao B, Guo J, Miao Y, Jiang Z, Huan R, Zhang Y, Li D, ZhongJ. Detection of miR-106a in gastric carcinoma and its clinicalsignificance. Clin Chim Acta 2009; 400:97-102. [PMID:18996365]
23. Banerjee I, Mishra D, Maiti TK. PLGA MicrospheresIncorporated Gelatin Scaffold: Microspheres ModulateScaffold Properties. Int J Biomater 2009; 2009:143659.[PMID: 20126575]
Molecular Vision 2012; 18:1361-1378 <http://www.molvis.org/molvis/v18/a142> © 2012 Molecular Vision
1377
24. Sahoo SK, Panyam J, Prabha S, Labhasetwar V. Residualpolyvinyl alcohol associated with poly (D,L-lactide-co-glycolide) nanoparticles affects their physical properties andcellular uptake. J Control Release 2002; 82:105-14. [PMID:12106981]
25. Oh SH, Kang SG, Kim ES, Cho SH, Lee JH. Fabrication andcharacterization of hydrophilic poly(lactic-coglycolic acid)/poly(vinyl alcohol) blend cell scaffolds by meltmoldingparticulate-leaching method. Biomaterials 2003;24:4011-21. [PMID: 12834596]
26. Mei N, Chen G, Zhou P, Chen X, Shao ZZ, Pan LF, Wu CG.Biocompatibility of Poly(epsilon-caprolactone) scaffoldmodified by chitosan-the fibroblasts proliferation in vitro. JBiomater Appl 2005; 19:323-39. [PMID: 15788428]
27. Lee JC, Timasheff SN. The stabilization of proteins by sucrose.J Biol Chem 1981; 256:7193-201. [PMID: 7251592]
28. Weaver VM, Petersen OW, Wang F, Larabell CA, Briand P,Damsky C, Bissell MJ. Reversion of the malignant phenotypeof human breast cells in three-dimensional culture and in vivoby integrin blocking antibodies. J Cell Biol 1997;137:231-45. [PMID: 9105051]
29. Erler JT, Bennewith KL, Nicolau M, Dornhofer N, Kong C, LeQT, Chi JT, Jeffrey SS, Giaccia AJ. Lysyl oxidase is essentialfor hypoxia-induced metastasis. Nature 2006; 440:1222-6.[PMID: 16642001]
30. Paszek MJ, Zahir N, Johnson KR, Lakins JN, Rozenberg GI,Gefen A, Reinhart-King CA, Margulies SS, Dembo M,Boettiger D, Hammer DA, Weaver VM. Tensionalhomeostasis and the malignant phenotype. Cancer Cell 2005;8:241-54. [PMID: 16169468]
31. Debnath J, Brugge JS. Modelling glandular epithelial cancersin three-dimensional cultures. Nat Rev Cancer 2005;5:675-88. [PMID: 16148884]
32. Sasaki T, Yamamoto M, Yamaguchi T, Sugiyama S.Development of multicellular spheroids of HeLa cellscocultured with fibroblasts and their response to X-irradiation. Cancer Res 1984; 44:345-51. [PMID: 6690045]
33. Hicks KO, Ohms SJ, van Zijl PL, Denny WA, Hunter PJ,Wilson WR. An experimental and mathematical model for theextravascular transport of a DNA intercalator in tumours. BrJ Cancer 1997; 76:894-903. [PMID: 9328149]
34. Wilson WR, Hicks KO. Measurement of extravascular drugdiffusion in multicellular layers. Br J Cancer 1999;79:1623-6. [PMID: 10188919]
35. Minchinton AI, Tannock IF. Drug penetration in solid tumours.Nat Rev Cancer 2006; 6:583-92. [PMID: 16862189]
36. Zhang B, Cao X, Liu Y, Cao W, Zhang F, Zhang S, Li H, NingL, Fu L, Niu Y, Niu R, Sun B, Hao X. Tumor-derived matrixmetalloproteinase-13 (MMP-13) correlates with poorprognoses of invasive breast cancer. BMC Cancer 2008;8:83. [PMID: 18373849]
37. Bajenaru ML, Piña Y, Murray TG, Cebulla CM, Feuer W,Jockovich ME, Marin Castaño ME. Gelatinase expression inretinoblastoma: modulation of LH(BETA)T(AG) retinal
tumor development by anecortave acetate. Invest OphthalmolVis Sci 2010; 51:2860-4. [PMID: 20107171]
38. Adithi M, Nalini V, Kandalam M, Krishnakumar S. Expressionof matrix metalloproteinases and their inhibitors inretinoblastoma. J Pediatr Hematol Oncol 2007; 29:399-405.[PMID: 17551402]
39. Norbury CJ, Zhivotovsky B. DNA damage-induced apoptosis.Oncogene 2004; 23:2797-808. [PMID: 15077143]
40. Zou H, Henzel WJ, Liu X, Lutschg A, Wang X. Apaf-1, a humanprotein homologous to C. elegans CED-4, participates incytochrome c-dependent activation of caspase-3. Cell 1997;90:405-13. [PMID: 9267021]
41. Soengas MS, Alarcón RM, Yoshida H, Giaccia AJ, Hakem R,Mak TW, Lowe SW. Apaf-1 and caspase-9 in p53-dependentapoptosis and tumor inhibition. Science 1999; 284:156-9.[PMID: 10102818]
42. Gartel AL, Tyner AL. The role of the cyclin-dependent kinaseinhibitor p21 in apoptosis. Mol Cancer Ther 2002;1:639-49. [PMID: 12479224]
43. Baron BW, Hyjek E, Gladstone B, Thirman MJ, Baron JM.PDCD2, a protein whose expression is repressed by BCL6,induces apoptosis in human cells by activation of the caspasecascade. Blood Cells Mol Dis 2010; 45:169-75. [PMID:20605493]
44. Engels BM, Hutvagner G. Principles and effects ofmicroRNAmediated post-transcriptional gene regulation.Oncogene 2006; 25:6163-9. [PMID: 17028595]
45. Ma L, Teruya-Feldstein J, Weinberg RA. Tumour invasion andmetastasis initiated by microRNA-10b in breast cancer.Nature 2007; 449:682-8. [PMID: 17898713]
46. Welch C, Chen Y, Stallings RL. MicroRNA-34a functions as apotential tumor suppressor by inducing apoptosis inneuroblastoma cells. Oncogene 2007; 26:5017-22. [PMID:17297439]
47. Mendell JT. miRiad roles for the miR-17–92 cluster indevelopment and disease. Cell 2008; 133:217-22. [PMID:18423194]
48. Garzon R, Fabbri M, Cimmino A, Calin GA, Croce CM.MicroRNA expression and function in cancer. Trends MolMed 2006; 12:580-7. [PMID: 17071139]
49. Aqeilan RI, Calin GA, Croce CM. miR-15a and miR-16–1 incancer: discovery, function and future perspectivesmiR-15aand miR-16–1 in cancer. Cell Death Differ 2010;17:215-20. [PMID: 19498445]
50. Dalgard CL, Gonzalez M, deNiro JE, O'Brien JM. DifferentialmicroRNA-34a expression and tumor suppressor function inretinoblastoma cells. Invest Ophthalmol Vis Sci 2009;50:4542-51. [PMID: 19443717]
51. Chang TC, Zeitels LR, Hwang HW, Chivukula RR, WentzelEA, Dews M, Jung J, Gao P, Dang CV, Beer MA, Thomas-Tikhonenko A, Mendell JT. Lin-28B transactivation isnecessary for Myc-mediated let-7 repression andproliferation. Proc Natl Acad Sci USA 2009; 106:3384-9.[PMID: 19211792]
Molecular Vision 2012; 18:1361-1378 <http://www.molvis.org/molvis/v18/a142> © 2012 Molecular Vision
Articles are provided courtesy of Emory University and the Zhongshan Ophthalmic Center, Sun Yat-sen University, P.R. China.The print version of this article was created on 28 May 2012. This reflects all typographical corrections and errata to the articlethrough that date. Details of any changes may be found in the online version of the article.
1378
http://www.ncbi.nlm.nih.gov/entrez/query.fcgi?cmd=Retrieve&db=PubMed&dopt=abstract&list_uids=7251592
http://www.ncbi.nlm.nih.gov/entrez/query.fcgi?cmd=Retrieve&db=PubMed&dopt=abstract&list_uids=9105051
http://www.ncbi.nlm.nih.gov/entrez/query.fcgi?cmd=Retrieve&db=PubMed&dopt=abstract&list_uids=6690045
http://www.ncbi.nlm.nih.gov/entrez/query.fcgi?cmd=Retrieve&db=PubMed&dopt=abstract&list_uids=9328149
Related Documents