1 A new, intrinsic, thermal parameter for enzymes reveals true temperature optima Michelle E. Peterson*, Robert Eisenthal † , Michael J. Danson †† , Alastair Spence ††† and Roy M. Daniel* * Dept of Biological Sciences, University of Waikato, Private Bag 3105, Hamilton, New Zealand. † Department of Biology and Biochemistry, University of Bath, Bath, BA2 7AY, UK. †† Centre for Extremophile Research, Department of Biology and Biochemistry, University of Bath, Bath, BA2 7AY, UK. ††† Department of Mathematical Sciences, University of Bath, Bath, BA2 7AY, UK. Corresponding Author: Professor Roy Daniel, Dept of Biological Sciences, University of Waikato, Private Bag 3105, Hamilton, New Zealand Tel: +64-7-8384213 Fax: +64-7-8384324 Email: [email protected] Running Title: A new thermal parameter for enzymes

Welcome message from author
This document is posted to help you gain knowledge. Please leave a comment to let me know what you think about it! Share it to your friends and learn new things together.
Transcript
1
A new, intrinsic, thermal parameter for enzymes reveals true temperature
optima
Michelle E. Peterson*, Robert Eisenthal†, Michael J. Danson††, Alastair Spence†††
and Roy M. Daniel*
* Dept of Biological Sciences, University of Waikato, Private Bag 3105, Hamilton, New
Zealand.
† Department of Biology and Biochemistry, University of Bath, Bath, BA2 7AY, UK.
†† Centre for Extremophile Research, Department of Biology and Biochemistry, University
of Bath, Bath, BA2 7AY, UK.
††† Department of Mathematical Sciences, University of Bath, Bath, BA2 7AY, UK.
Corresponding Author:
Professor Roy Daniel,
Dept of Biological Sciences, University of Waikato, Private Bag 3105, Hamilton, New
Zealand
Tel: +64-7-8384213
Fax: +64-7-8384324
Email: [email protected]
Running Title: A new thermal parameter for enzymes

2
Summary
Two established thermal properties of enzymes are the Arrhenius activation energy and thermal
stability. Arising from anomalies found in the variation of enzyme activity with temperature, a
comparison has been made of experimental data for the activity and stability properties of 5
different enzymes with theoretical models. The results provide evidence for a new and
fundamental third thermal parameter of enzymes, Teq, arising from a sub-second timescale,
reversible, temperature-dependent equilibrium between the active enzyme and an inactive (or
less active) form. Thus, at temperatures above its optimum, the decrease in enzyme activity
arising from the temperature-dependent shift in this equilibrium is up to two orders of magnitude
greater than occurs through thermal denaturation. This parameter has important implications for
our understanding of the connection between catalytic activity and thermostability, and of the
effect of temperature on enzyme reactions within the cell. Unlike the Arrhenius activation
energy, which is unaffected by the source (“evolved”) temperature of the enzyme, and enzyme
stability, which is not necessarily related to activity, Teq is central to the physiological adaptation
of an enzyme to its environmental temperature and links the molecular, physiological, and
environmental aspects of the adaptation of life to temperature in a way that has not been
previously described. We may therefore expect the effect of evolution on Teq with respect to
enzyme temperature/activity effects to be more important than on thermal stability. Teq is also an
important parameter to consider when engineering enzymes to modify their thermal properties by
both rational design and by directed enzyme evolution.

3
Introduction
A graph of rate of product generation against temperature is sometimes presented to show the
“temperature optimum” (Topt) of an enzyme; however, it is a misconception that this optimum is
an intrinsic enzyme property. The descending limb of this plot arises mostly from the
denaturation of the enzyme and, since denaturation is both time and temperature dependent,
shorter assays give a higher Topt. In this classical description, the variation in enzyme activity
with temperature can be described as follows:
[ ] tkcat
inacteEkV .0max .. −= Equation (1)
where Vmax = maximum velocity of the enzyme; kcat = the enzyme's catalytic constant; [E0] =
total concentration of enzyme; kinact = thermal inactivation rate constant; t = assay duration. Both
rate constants, kcat and kinact, are dependent on temperature. This gives rise to temperature-
activity graphs as shown in Figure 1a, where it can be seen that the apparent Topt decreases with
increasing time during the assay, but at zero time (i.e., under initial rate conditions), no
temperature optimum exists (1). In this Classical Model the temperature–dependent behaviour
of the enzyme arises from the activation energy of the reaction and the thermal stability of the
enzyme.
However, the proposal (1) for a third temperature-dependent property of enzymes, involving the
reversible equilibrium between active and inactive forms of an enzyme, implies a “true”
temperature optimum. In this model (The Equilibrium Model), the active form of the enzyme
(Eact) is in reversible equilibrium with an inactive form (Einact) and it is the inactive form that
undergoes irreversible thermal inactivation to the thermally-denatured state (X):
Eact Einact X

4
In this situation, the concentration of active enzyme at any time point is defined by:
eq
oact
K
XEE
+−=
1
][][][ Equation (2)
where Keq is the equilibrium constant between active and inactive forms of the enzyme (Keq =
[Einact] / [Eact]). Thus Keq becomes a new temperature-dependent property of an enzyme, in
addition to kcat and kinact, and its variation with temperature is given by:
−∆=
TTR
HK
eq
eqeq
11)(ln Equation (3)
where ∆Heq is the enthalpic change associated with the conversion of active to inactive enzyme,
and Teq is the temperature at the mid-point of transition between the two forms. That is, Teq is the
temperature at which Keq = 1 and ∆Geq = 0; therefore Teq = ∆Heq/∆Seq. [We previously (1) used
the term Tm to designate this temperature, but now prefer the term Teq, as it is the temperature at
which the concentrations of Einact and Eact at equilibrium]. In this Equilibrium Model the
temperature-dependent behaviour of an enzyme can be explained only by the inclusion of an
additional intrinsic thermal parameter, Teq.
The effect of incorporating the parameters Keq and Teq into simulated progress curves (Figure 1b)
yields major differences from the Classical Model shown in Figure 1a, showing an initial rate
temperature optimum that is obviously independent of assay duration and enabling an
experimental distinction between the two models.
To compare the experimental data with the models, five enzymes from a variety of sources were
assayed for activity at different temperatures, using continuous assays to allow the simultaneous
measurement of activity and thermal stability in the same cuvette, and therefore under identical
5
conditions. These measurements allow the generation of a unique temperature profile for each
enzyme. Most of this work has been carried out on monomeric enzymes to avoid the potentially
complicating effects of subunit dissociation.
The data presented support the Equilibrium Model hypothesis, involving Keq as an intrinsic,
temperature-dependent property of enzymes. The consequence is that, in such cases, Teq must
now be considered as a new thermal parameter that is a characteristic of any particular enzyme
and which gives rise to a true temperature optimum.

6
Experimental Procedures
Enzymes and reagents
Alkaline phosphatase from calf intestinal mucosa was purchased from Roche Applied Science,
Basel, Switzerland. Adenosine deaminase from bovine spleen, aryl acylamidase from
Pseudomonas fluorescens and β-lactamase from Bacillus cereus were purchased from Sigma-
Aldrich Inc. (St. Louis, MO., USA). Acid phosphatase from wheat germ was purchased from
Serva Electrophoresis GmbH (Heidelberg, Germany). Reagents for the analysis of the activity of
these enzymes were purchased from Sigma-Aldrich, Merck KGaA (Darmstadt, Germany) and
Oxoid Ltd (Basingstoke, UK). All other chemicals used were of analytical grade. Buffers were
adjusted to the appropriate pH value at the assay temperature, using a combination electrode
calibrated at this temperature.
Enzyme Assays
All enzymic activities were measured using continuous assays on a Thermospectronic™ Helios
γ-spectrophotometer equipped with a Thermospectronic™ single cell peltier-effect cuvette
holder. This system was networked to a computer installed with Vision32™ (Version 1.25,
Unicam Ltd) software including the Vision Enhanced Rate Programme capable of recording
absorbance changes over time intervals of down to 0.125 seconds. Substrate concentrations were
maintained at approximately 10 times KM to minimise the effects of any possible increases in KM
with temperature. Where these concentrations could not be maintained (e.g. due to substrate
solubility), tests were conducted to confirm that there was no decrease in rate over the assay
period due to substrate depletion. No evidence was found for either substrate or product
inhibition under the experimental conditions described.

7
Adenosine deaminase [E.C. 3.5.4.4, adenosine aminohydrolyase] activity was measured by
following the decrease in absorbance at 265nm (∆ε265 = 8.1 mM-1·cm-1) resulting from the
deamination of adenosine to inosine (7). Reaction mixtures (1 mL) contained 0.1 M sodium
phosphate pH 7.4, 0.12 mM adenosine and 0.003 units of enzyme. One unit is defined as the
amount of enzyme that hydrolyses one µmole of adenosine to inosine per minute at 30ºC.
Acid phosphatase [E.C. 3.1.3.2, orthophosphoric-monoester phosphohydrolase (acid optimum)]
activity was measured using p-nitrophenylphosphate (pNPP) as substrate (8). Reaction mixtures
(1 mL) contained 0.1 M sodium acetate pH 5.0, 10 mM pNPP and 0.024 units of enzyme. The
release of p-nitrophenol was monitored at 410 nm (∆ε410 = 3.4 mM-1·cm-1). One unit is defined
as the amount of enzyme that hydrolyses one µmole of pNPP to p-nitrophenol per minute at
37ºC.
Alkaline phosphatase [E.C. 3.1.3.1, orthophosphoric-monoester phosphohydrolase (alkaline
optimum)] activity was measured using pNPP as substrate (9). Reaction mixtures (1 mL)
contained 0.1 M diethanolamine/HCl pH 8.5, 0.5 mM MgCl2, 10 mM pNPP and 0.02 units of
enzyme. The release of p-nitrophenol was monitored at 405 nm (∆ε405 = 18.3 mM-1·cm-1). One
unit is defined as the amount of enzyme that hydrolyses one µmole of pNPP to p-nitrophenol per
minute at 37ºC.
Aryl acylamidase [E.C. 3.5.1.13, aryl-acylamide amidohydrolyase] activity was measured by
following the increase in absorbance at 382nm (∆ε382 = 18.4 mM-1·cm-1) corresponding to the
release of p-nitroaniline from the p-nitroacetanilide (pNAA) substrate (10). Reaction mixtures
contained 0.1 M Tris/HCl pH 8.6, 0.75 mM pNAA and 0.018 units of enzyme. One unit is
8
defined as the amount of enzyme required to catalyse the hydrolysis of one µmole of pNAA per
minute at 37ºC.
β-lactamase [E.C. 3.5.2.6, β-lactamhydrolase] activity was measured by following the increase
in absorbance at 485nm (∆ε485 = 20.5 mM-1·cm-1) associated with the hydrolysis of the β-lactam
ring of nitrocefin (11). Reaction mixtures contained 0.05 M sodium phosphate pH 7.0, 0.1 mM
nitrocefin and 0.003 U of enzyme. One unit is defined as that which will hydrolyse the β-lactam
ring of one µmole of Cephalosporin per minute at 25ºC.
Data collection
For each enzyme, progress curves (absorbance versus time) at a variety of temperatures were
collected; the time interval was set so that an absorbance reading was collected every second.
Assay reactions were initiated by the addition of microlitre amounts of enzyme that had no
significant effect on the temperature. Three progress curves were collected at each temperature,
each for a five-minute period. Where the slope for these triplicates deviated by more than 10%,
the reactions were repeated. Temperature was recorded using a Cole-Palmer Digi-Sense®
thermocouple thermometer accurate to ± 0.1% of the reading and calibrated using a Cole-Parmer
NIST-traceable high-resolution glass thermometer. The temperature probe was placed inside the
cuvette adjacent to the light path during temperature equilibration prior to the initiation of the
reaction and again immediately after completion of each enzyme reaction. Measurements of
temperature were also taken at the top and bottom of the cuvette to check for temperature
gradients. Where the temperature measured before and after the reaction differed by more than
0.1ºC, the reaction was repeated.

9
Data analysis
For each enzyme, the catalytic rates (expressed as µM.s-1) were calculated at 1s time intervals
along the three progress curves at each temperature. The averages of each time-point value were
used to generate 3D plots of rate (v) versus temperature (T in Kelvin) versus time (t in seconds)
[SigmaPlot® 2001 for Windows, Version 7.101, SPSS Inc.]. Data were smoothed using a Loess
transformation, a curve-fitting technique based on local regression that applies a tricube weight
function to elicit trends from noisy data (12). The first data point was obtained at approximately
2 seconds, owing to the lag between the addition of enzyme to the reaction mixture and the start
of data collection. The data for zero time were obtained during the smoothing process, which
extrapolates back to zero using the trend elicited from the data.
The data for each enzyme were analysed to provide values of ∆G‡cat (the activation energy of the
catalytic reaction), ∆G‡inact (the activation energy of the thermal inactivation process), ∆Heq (the
enthalpy change for the transition between active and inactive forms of the enzyme) and Teq (the
temperature for the mid-point of this transition). Initial estimates of these parameters were
calculated from 2D analyses. Firstly, for the data at t = 0 (where there is no thermal
inactivation), Eyring plots of ln(v/T) versus 1/T give values of ∆H‡cat and ∆S‡
cat (from the slope
and intercept, respectively), from which ∆G‡cat can thus be calculated at any temperature of
assay. Secondly, at each assay temperature, plots of ln(v) versus time were used to calculate rate
constants (kinact) for the thermal inactivation process; Eyring plots of these data [ln(kinact/T) versus
1/T] similarly give values of ∆H‡inact and ∆S‡
inact, and hence of ∆G‡inact. Values of Keq were
calculated from an Arrhenius plot [ln(v) versus 1/T] for the data at t = 0. That is, according to
the Equilibrium Model (1), in the absence of any thermal inactivation, the deviation from

10
linearity in the Arrhenius plot is attributed to a shifting of the equilibrium from active to inactive
forms; a comparison of the observed values with those from the extrapolated linear portion can
thus be used to calculate the value of Keq at any temperature. Using equation (3), values of ∆Heq
and Teq were subsequently determined from a plot of ln(Keq) versus 1/T.
Using these estimates of the thermodynamic parameters, the complete data set for each enzyme
(rate versus time versus temperature) was fitted to the Equilibrium Model equations to derive the
values given in Table 1. The fits were performed using Scientist (Micromath) software,
employing a non-linear least squares minimisation of the numerically integrated rate equations
utilising Powell’s algorithm.
Protein determination
Protein concentrations were determined from A280 measurements or by the colorimetric methods
of Bradford and Biuret (13).
11
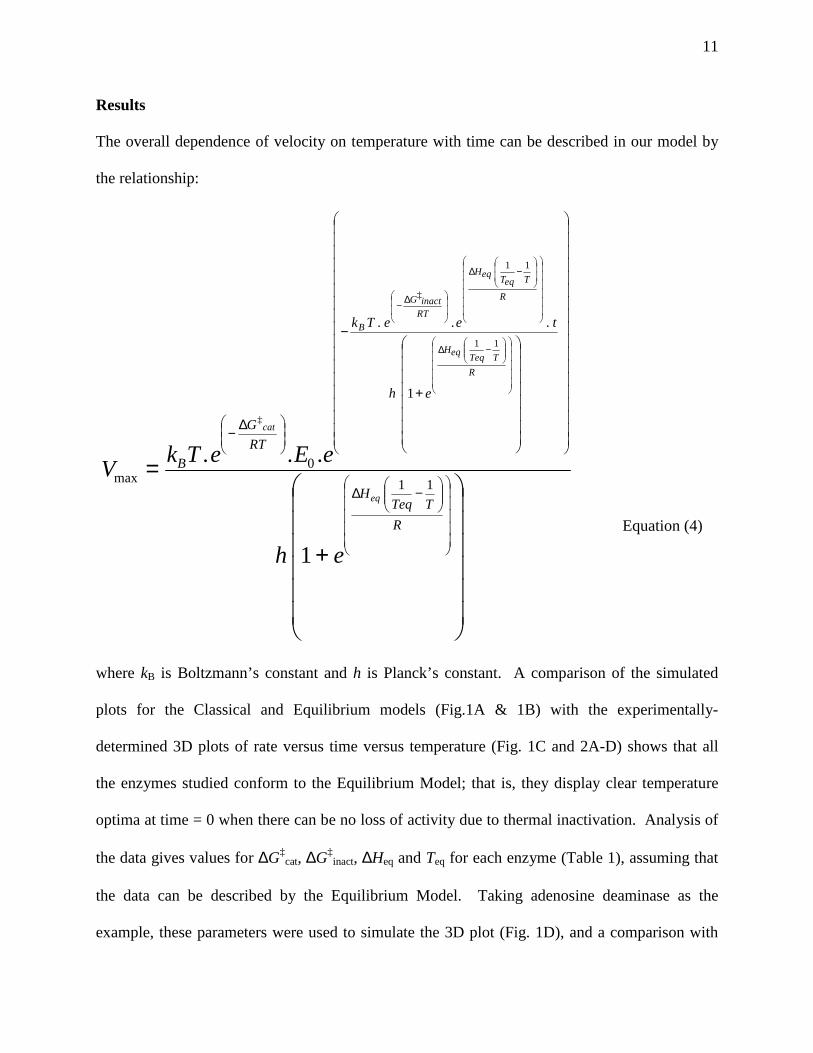
Results
The overall dependence of velocity on temperature with time can be described in our model by
the relationship:
+
=
−∆
+
−
∆−
−∆
−∆
∆−
R
TTeqH
eh
teeTk
RT
G
B
eq
R
TTeqeqH
R
TeqTeqH
RTinactG
B
cat
eh
eEeTkV
11
1
...
0max
1
...
11
11
‡
‡
Equation (4)
where kB is Boltzmann’s constant and h is Planck’s constant. A comparison of the simulated
plots for the Classical and Equilibrium models (Fig.1A & 1B) with the experimentally-
determined 3D plots of rate versus time versus temperature (Fig. 1C and 2A-D) shows that all
the enzymes studied conform to the Equilibrium Model; that is, they display clear temperature
optima at time = 0 when there can be no loss of activity due to thermal inactivation. Analysis of
the data gives values for ∆G‡cat, ∆G‡
inact, ∆Heq and Teq for each enzyme (Table 1), assuming that
the data can be described by the Equilibrium Model. Taking adenosine deaminase as the
example, these parameters were used to simulate the 3D plot (Fig. 1D), and a comparison with
12
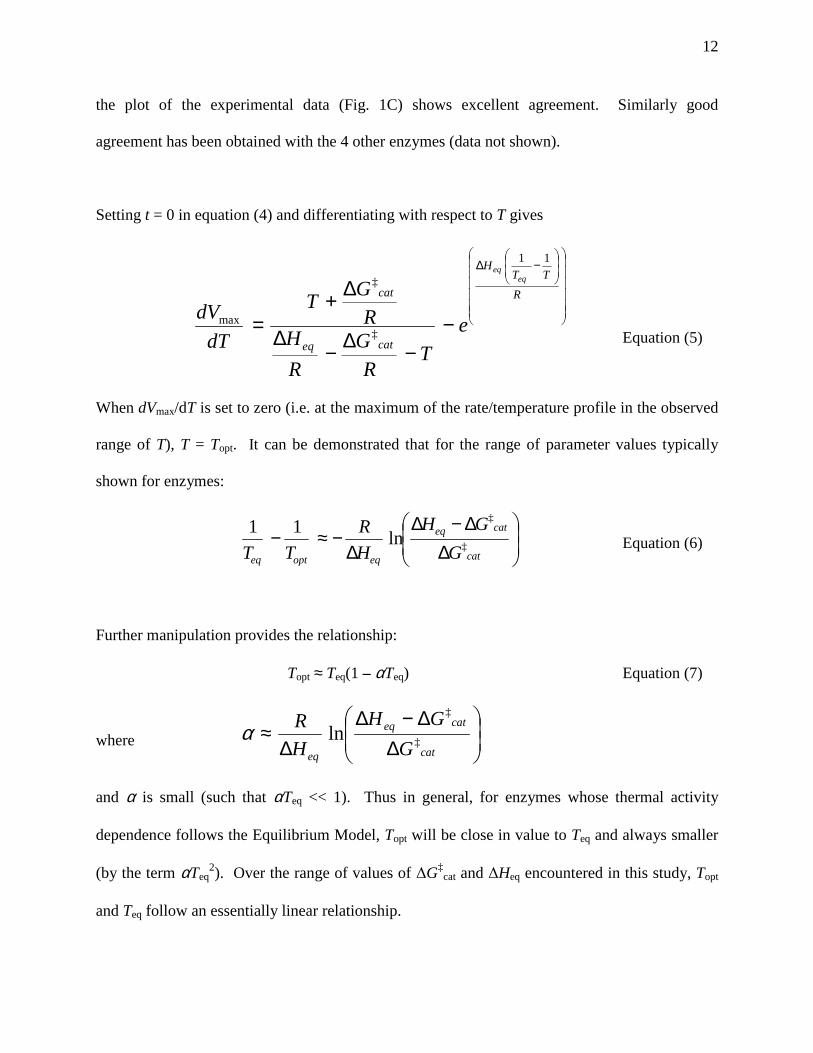
the plot of the experimental data (Fig. 1C) shows excellent agreement. Similarly good
agreement has been obtained with the 4 other enzymes (data not shown).
Setting t = 0 in equation (4) and differentiating with respect to T gives
−∆
−−∆−
∆
∆+=
R
TTH
cateq
cateq
eq
e
TR
G
R
HR
GT
dT
dV
11
‡
‡
max
Equation (5)
When dVmax/dT is set to zero (i.e. at the maximum of the rate/temperature profile in the observed
range of T), T = Topt. It can be demonstrated that for the range of parameter values typically
shown for enzymes:
∆∆−∆
∆−≈−
cat
cateq
eqopteq G
GH
H
R
TT ‡
‡
ln11
Equation (6)
Further manipulation provides the relationship:
Topt ≈ Teq(1 – αTeq) Equation (7)
where
∆∆−∆
∆≈
cat
cateq
eq G
GH
H
R‡
‡
lnα
and α is small (such that αTeq << 1). Thus in general, for enzymes whose thermal activity
dependence follows the Equilibrium Model, Topt will be close in value to Teq and always smaller
(by the term αTeq2). Over the range of values of ∆G‡
cat and ∆Heq encountered in this study, Topt
and Teq follow an essentially linear relationship.

13
A plot of relative activity at zero time versus temperature (Fig. 3) illustrates that all five enzymes
display true temperature optima of catalytic activity as defined by the Equilibrium Model, and
that the values of Topt are essentially in accordance with the determined values of Teq (Table 1).
For β-lactamase and adenosine deaminase, the difference between Topt and Teq is greater than for
the other enzymes; both enzymes have relatively low ∆Heq values, which will have a major
influence on this difference (Equation 7). It should be stressed that ∆G‡inact is not a factor in the
position of the peaks illustrated in Figure 3 as the curves are determined at “time zero” where
there is no thermal inactivation process. As also noted by Thomas and Scopes (2), in all cases
reported here the Topt is approximately 20-40ºC above the optimum growth temperature/body
temperature of the source organisms.
Although the application of the Equilibrium Model has the potential to be complicated by
temperature-induced subunit dissociation in the case of oligomeric enzymes, we find no evidence
to suggest that this treatment is restricted to monomeric enzymes; the data for the dimeric
alkaline phosphatase adhere equally well to the Equilibrium Model as do the other, monomeric,
enzymes investigated here.
Discussion
The results and their analysis indicate that the experimental velocity data as a function of
temperature can be described by the Equilibrium Model, suggesting Keq as an intrinsic,
temperature-dependent property of enzymes, and supporting the hypothesis that these enzymes
possess a third thermal parameter (Teq), alongside the Arrhenius activation energy and the
activation energy for thermal stability.
14
Currently, we have no evidence bearing on the molecular basis of the equilibrium between Eact
and Einact, although it is clearly a fast process relative to thermal denaturation. All the variation
of activity with temperature at zero time [Figs 2 and 3] occurs as a result of changes in the
Eact/Einact equilibrium, and is thus attained over timescales shorter than the mixing process, say
less than 1 second, whereas the measured rate of irreversible thermal inactivation (conversion
from Einact to denatured state) is at least two orders of magnitude slower over the same
temperature range. For example, in the case of aryl acylamidase [Fig 2A], at 51oC the activity at
time zero is approximately 40% lower than at the "optimum" temperature [46oC], whereas the
activity/time line at this temperature shows that it takes approximately 60 seconds for 40%
denaturation to occur.
Since the Native/Denatured transition is generally a two-state process for single-domain proteins
(14), Einact is unlikely to be significantly unfolded. A reversible conformational change is most
likely, and we speculate that the differing effects of temperature on the various weak interactions
stabilising protein structure offer an opportunity for a shift of structure with changing
temperature, leading to a change in activity. The existence of conformational sub-states in
equilibrium over sub-second timescales is widely accepted (15, 16), and it has recently been
suggested that adaptation to thermal stability may involve a change in the scale of fluctuations
about the average state (17).
Teq is important in describing the effect of temperature on enzymes, and in particular on the role
of temperature as a selection pressure on enzyme structure and function. There is no evidence
15
connecting the Arrhenius activation energy of an enzyme to its thermal environment, and
although there is a strong correlation between thermal stability and the environmental
temperature of the source organism, it is known that enzyme thermal stability also reflects
resistance to other cellular conditions such as the action of proteases (18). Teq is central to the
physiological adaptation of an enzyme to its environmental temperature and links the molecular,
physiological, and environmental aspects of the adaptation of life to temperature in a way that
has not been previously possible. We predict that Teq will be a better expression of the effect of
environmental temperature on the evolution of the enzyme than thermal stability; and thus we
might expect differences in the overall shapes of the curves such as those shown in Figure 2 to
describe the fit of an enzyme to its thermal environment, especially at the high temperature part
of the graph, since the shape of the low temperature part of the graph will be determined largely
by the Arrhenius activation energy. Teq thus provides an important new parameter for matching
an enzyme's properties to its cellular and environmental function.
In terms of protein engineering, Teq provides an additional parameter that determines the
thermoactivity of an enzyme and so must be considered when designing enzymes for particular
functions. Much enzyme engineering is directed at stabilising enzymes against denaturation.
The results here suggest that engineering to manipulate the Eact/Einact equilibrium [i.e., Teq] may
be equally productive, and that Teq must also be shifted to higher temperatures to obtain the
expected catalytic benefits of enhanced enzyme thermostability. It will be important to
distinguish between mutations that affect stability from those that affect Teq.
16
Acknowledgements
We thank C. Collet for some of the preliminary work on β-lactamase, and C. Cary and C. Monk
for assistance in collecting some of the data presented in this paper. The work was partially
supported by the National Science Foundation (Biocomplexity 0120648) and by the
Biotechnological and Biological Sciences Research Council, U.K.
References
1. Daniel, R. M., Danson, M. J. and Eisenthal, R. (2001) Trends Biochem. Sci. 26, 223-225
2. Thomas, T. M. and Scopes, R. K. (1998) Biochem. J. 330, 1087-1095
3. Gerike, U., Russell, N. J., Danson, M. J. and Hough, D. W. (1997) Eur. J. Biochem. 248,
49-57
4. Buchanan, C. L., Connaris, H., Hough, D. W., Reeve, C. D. and Danson, M. J. (1999)
Biochem. J. 343, 563-570
5. Arnott, M. A., Michael, R. A., Thompson, C. R., Hough, D. W. and Danson, M. J. (2000)
J. Mol. Biol. 304, 655-666
6. Medina, D. C., Hanna, E., MacRae, I. J., Fisher, A. J. and Segel, I. H. (2001) Arch.
Biochem. Biophys. 393, 51-60
7. Pfrogner, N. (1967) Arch. Biochem. Biophys. 119, 141-146
8. Hollander, V. P. (1971) in The Enzymes, Vol. 4 (ed. Boyer, P. D.) 449-498 (Academic
Press, New York)
9. Fernley, H. N. (1971) in The Enzymes, Vol. 4 (ed. Boyer, P. D.) 417-447 (Academic Press,
New York)
10. Hammond, P. M., Price, C. P. and Scawen, M. D. (1983) Eur. J. Biochem. 132, 651-655
17
11. O’Callaghan, C. H., Morris, A., Kirby, S. M. and Shingler, A. H. (1972) Antimicrob.
Agents Chemother. 1, 283-288
12. Cleveland, W. S. (1993) Visualizing Data, Hobart Press, New Jersey
13. Scopes, R. K. (1994) in Protein Purification: Principles and Practice, 3rd Edition, (ed.
Cantor, C. R.) 44-50 (Springer Verlag: San Diego)
14. Creighton, T. E. (1993) Proteins, 2nd Ed., W H Freeman, New York
15. Brooks, C. L., Karplus, M. and Pettitt, B. M. (1988) Proteins, John Wiley, New York
16. Svensson, A-K. E., O'Neill, J. C. and Matthews, C. R. (2003) J. Mol. Biol. 326, 569-583
17. Wintrode, P. L., Zhang, D., Vaidehi, N., Arnold, F. H. and Goddard III, W. A. (2003) J.
Mol. Biol. 327, 745-757
18. Daniel, R. M., Dines, M. and Petach, H. H. (1996) Biochem. J. 317, 1-11

18
Figure Legends
Fig. 1 - The temperature dependence of enzyme activity
(A) Simulated plot for the Classical Model (1). The variation of enzyme activity with
temperature (290-340K) and time during the assay (0-200s) was simulated using Equation (1).
The variation of the two rate constants in Equation (1) with temperature is given by kcat = (kBT/h)
e-(∆G‡cat
/RT) and kinact = (kBT/h) e-(∆G‡inact
/RT) where kB = Boltzmann's constant; R = Gas constant; T =
absolute temperature; h = Planck's constant; ∆G‡cat = activation energy of the catalysed reaction;
∆G‡inact = activation energy of the thermal inactivation process. The following parameter values
were used: ∆G‡cat = 80 kJ·mol-1; ∆G‡
inact = 95 kJ·mol-1; total enzyme concentration = 100nM.
(B) Simulated plot for the Equilibrium Model (1). The variation of enzyme activity with
temperature (280-360K) and time during the assay (0-200s) was simulated using the equation
Vmax = kcat[Eact], where the concentration of Eact at any time point is defined by Equation (2) and
the variation of Keq with temperature is given by Equation (3). The rate of formation of X is
given by d[X]/dt = kinact{[E0] – [Eact] – [X]}. The following parameter values were used: ∆G‡cat
= 80 kJ·mol-1; ∆G‡inact = 95 kJ·mol-1; total enzyme concentration = 100nM; ∆Heq = 100kJ·mol-1;
Teq = 320K.
(C) Experimental data for adenosine deaminase. The enzyme was assayed
spectrophotometrically at 265nm as described in Materials and Methods; the data are plotted as
rate (µM.s-1) versus temperature (K) versus time during assay (s).
19
(D) Simulated data for adenosine deaminase. The experimental data from (C) were analysed as
described in Materials and Methods to give estimated values of ∆G‡cat, ∆G‡
inact, ∆Heq, and Teq.
Using these values, the complete data set was fitted to the Equilibrium Model to give final
values, which were then used to simulate the plot of rate (µM.s-1) versus temperature (K) versus
time during assay (s).
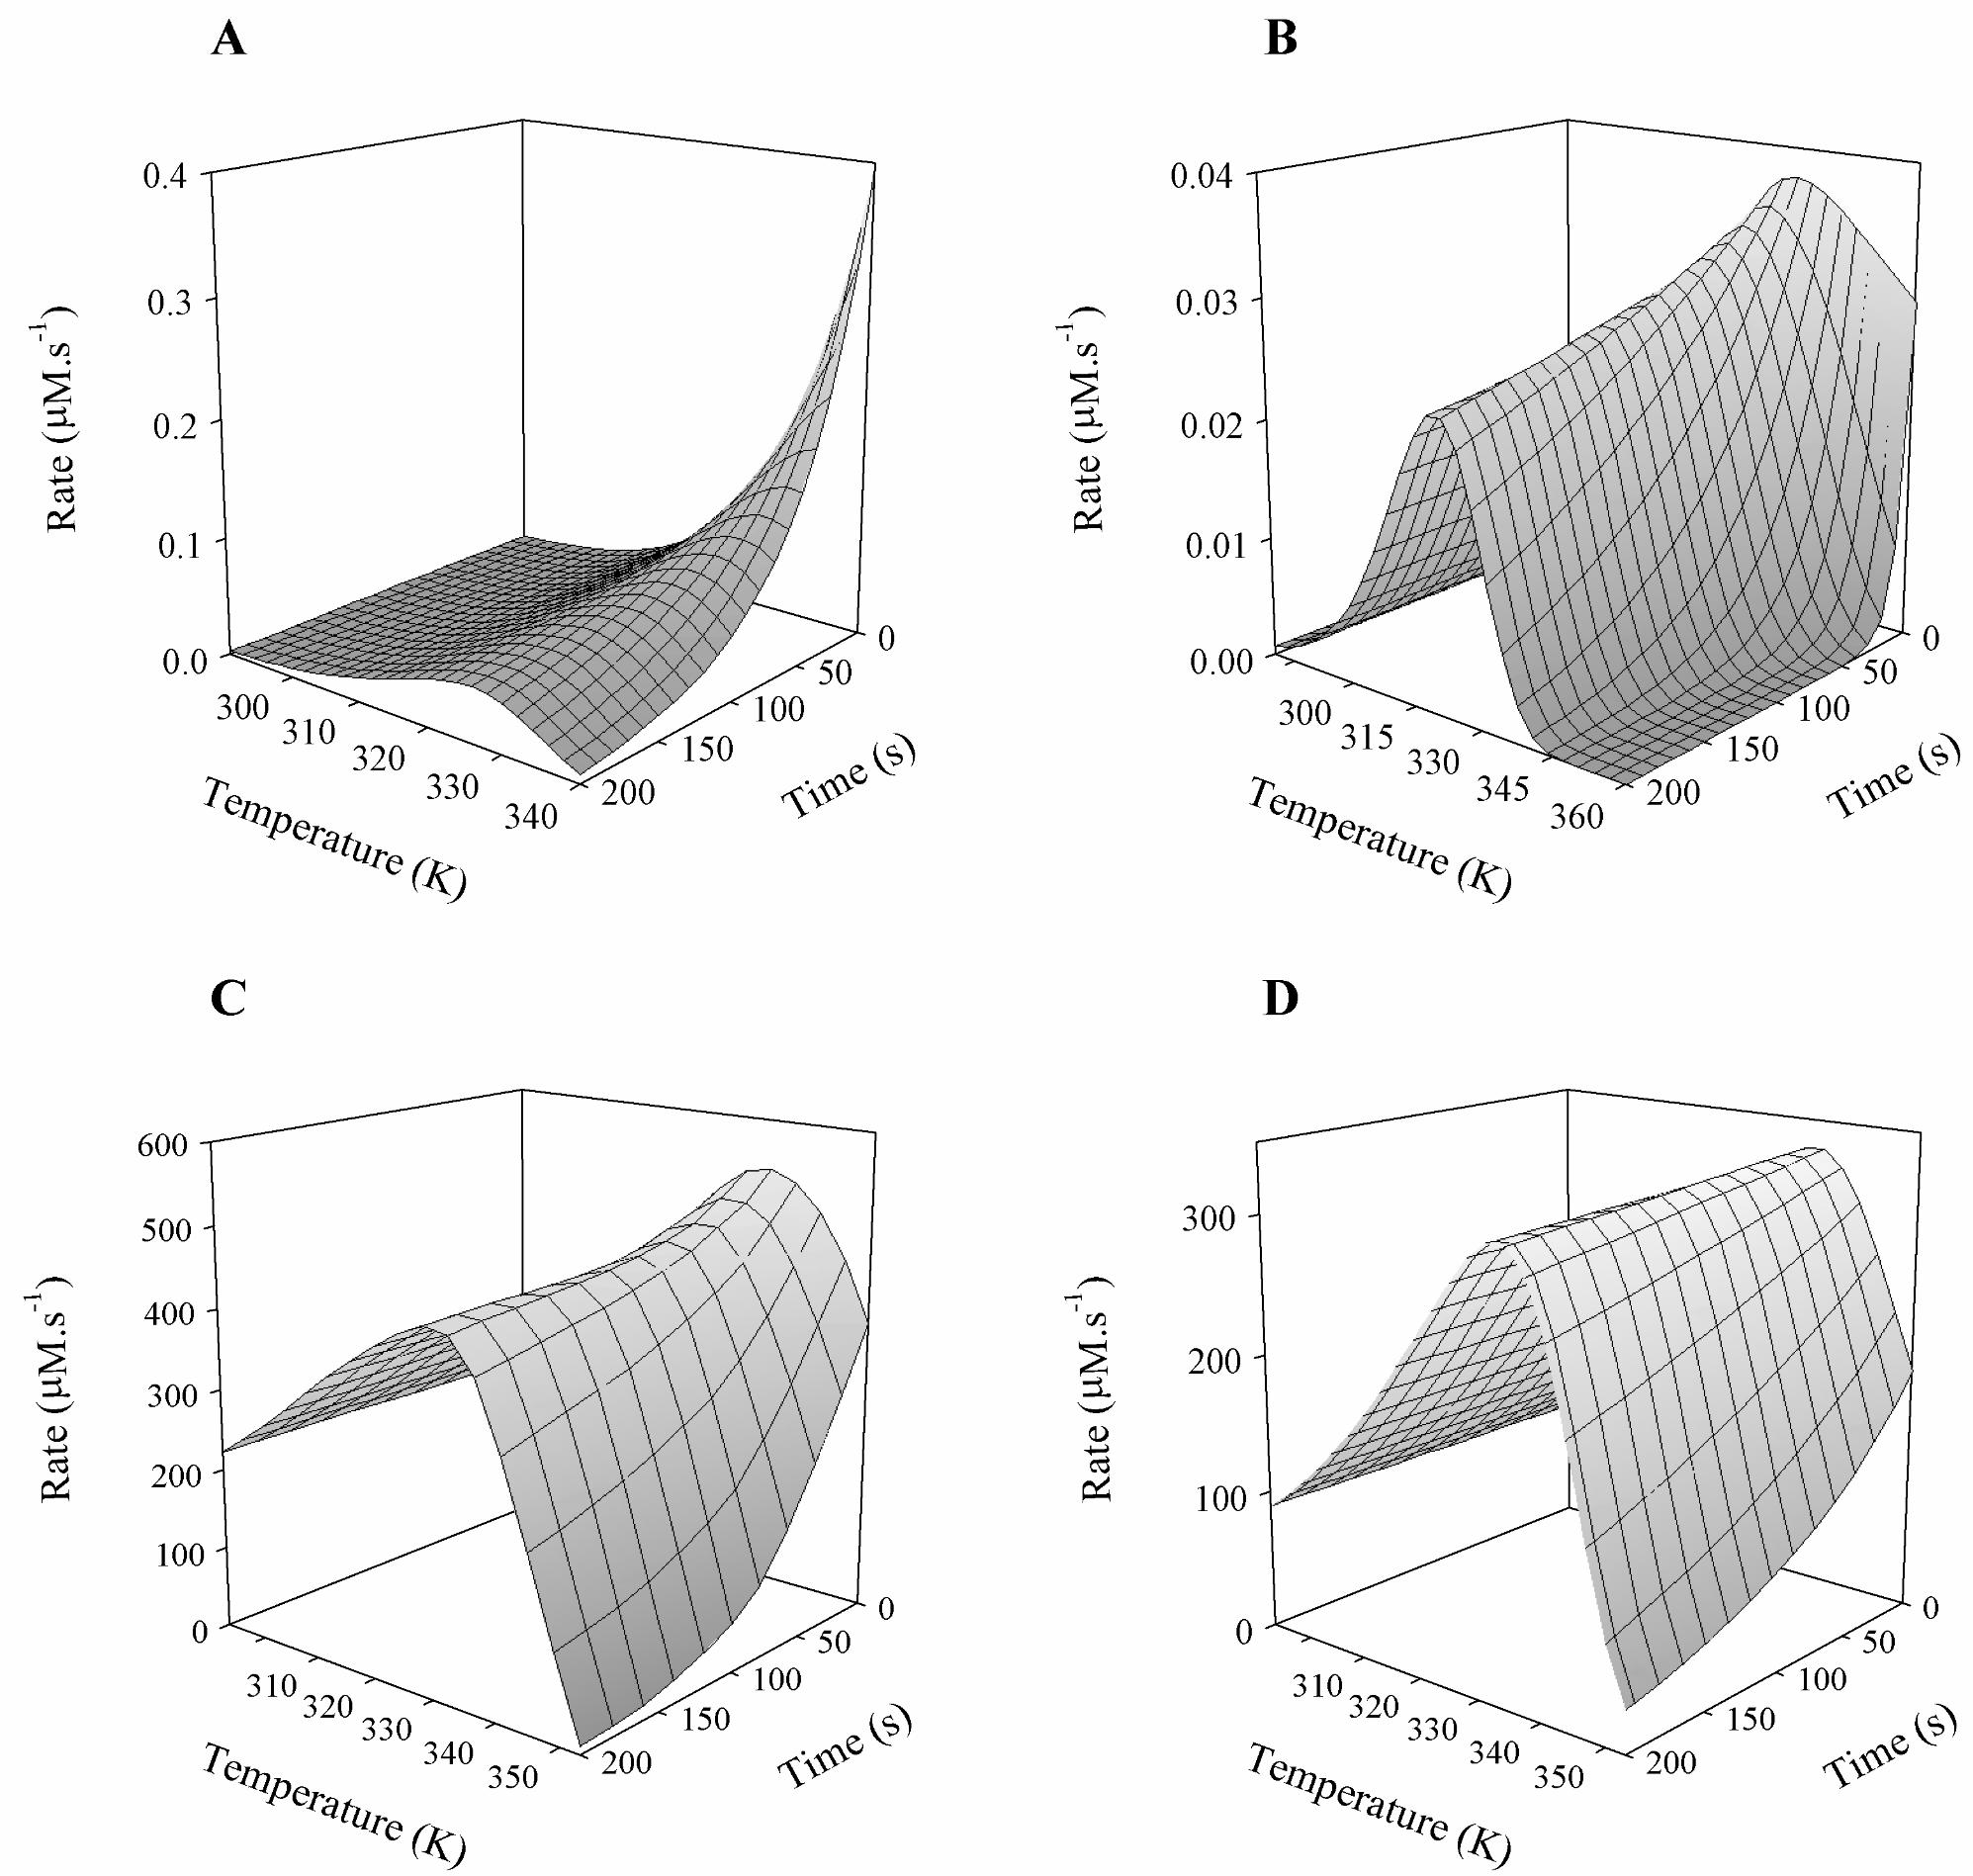
Fig. 2 - Experimentally-determined temperature dependence of enzymic activity.
Enzymes were assayed spectrophotometrically as described in Materials and Methods, and the
data plotted as rate (µM.s-1) versus temperature (K) versus time during assay (s).
(A) aryl acylamidase; (B) acid phosphatase; (C) β-lactamase; (D) alkaline phosphatase.
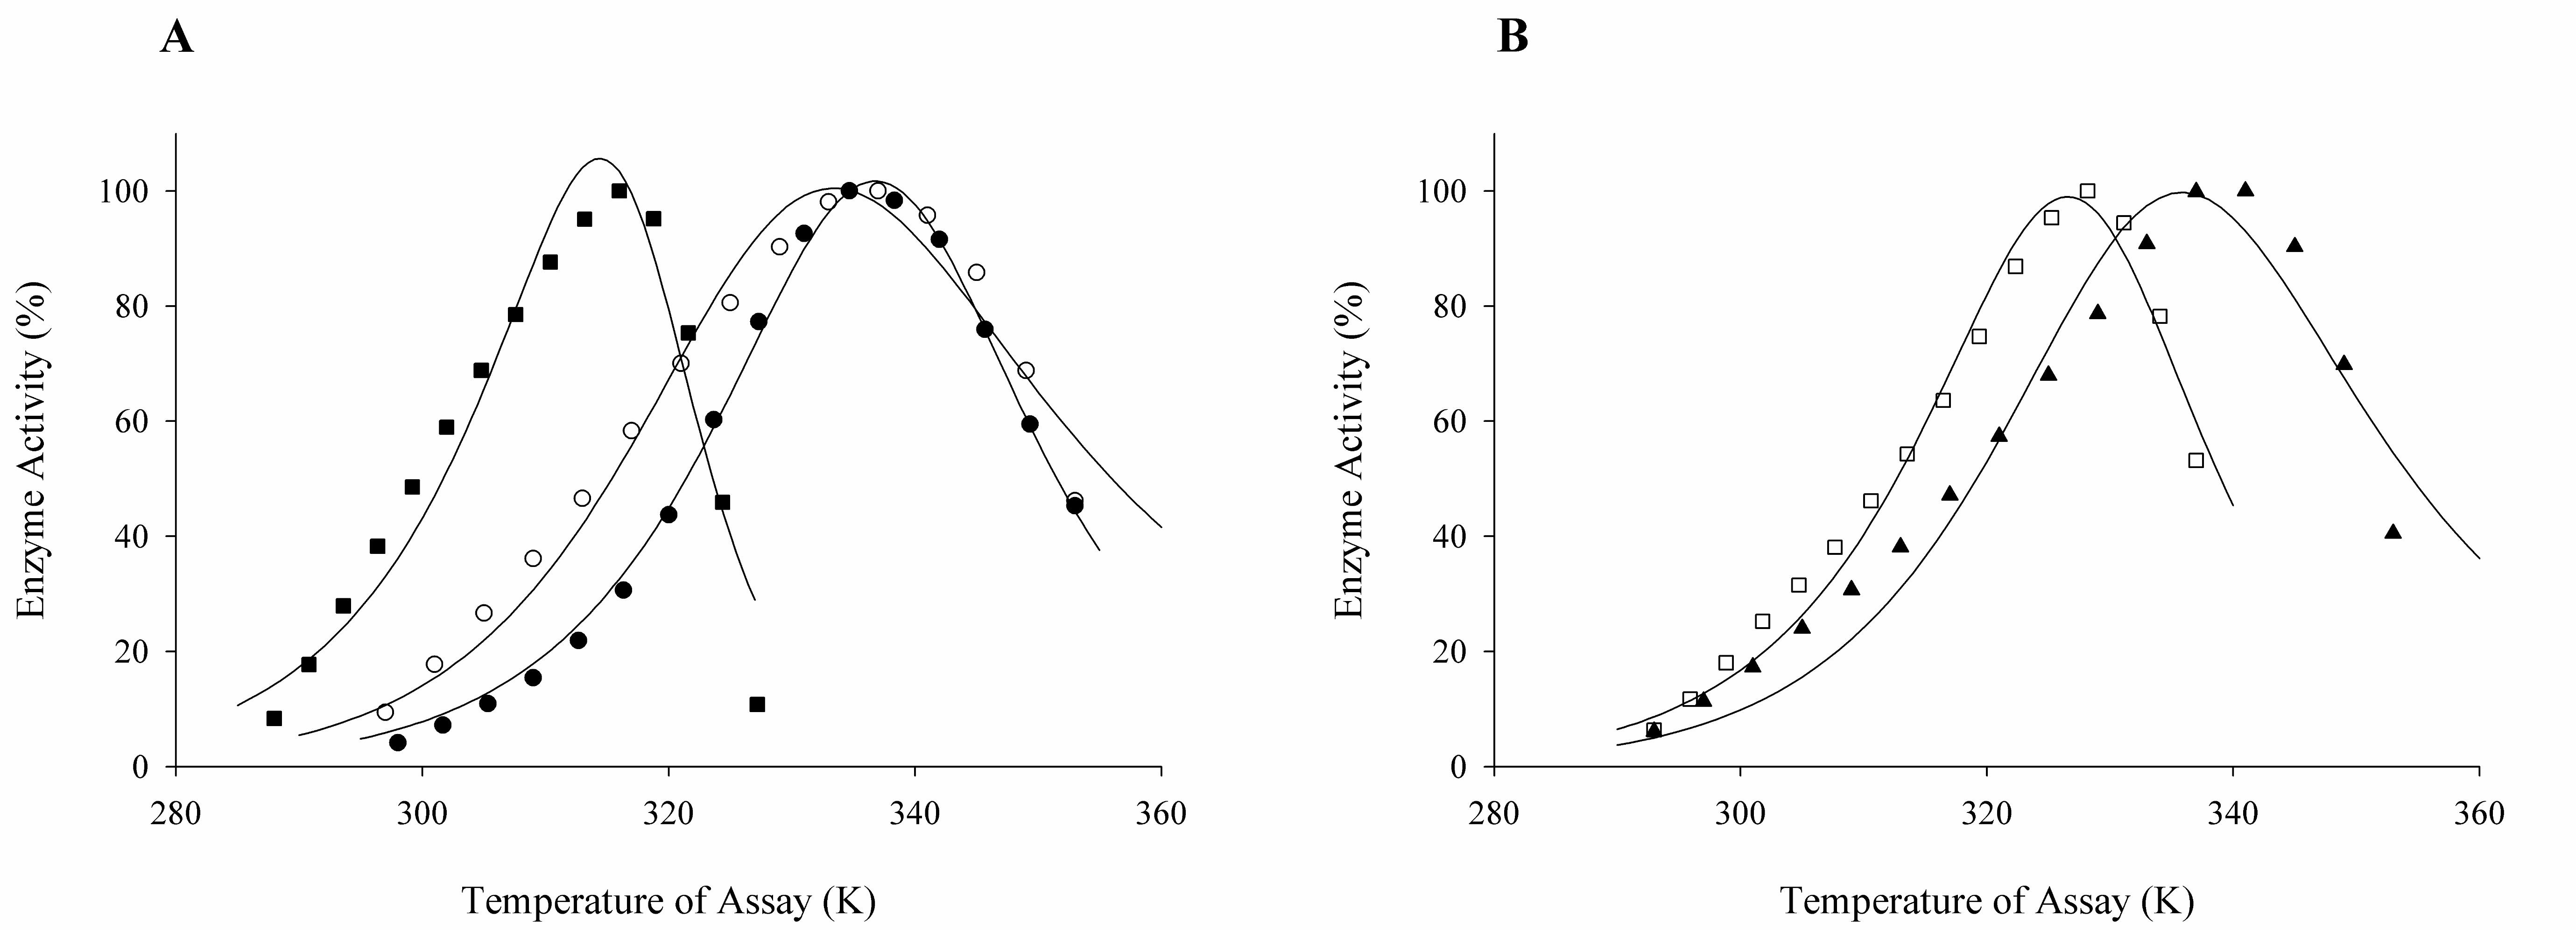
Figs. 3A & 3B - Temperature dependence of enzymic activity at time zero
From the experimental data in Figure 1C and Figure 2A-D, the enzymic activities at time zero
were plotted against temperature to demonstrate the dependence of enzymic activity on
temperature in the absence of thermal inactivation. For clarity, the data have been divided into
two graphs. The activity data for each enzyme are scaled from 5-100% relative to the maximum
activity for that enzyme. (A): (●) acid phosphatase; (○) adenosine deaminase; (■) aryl
acylamidase. (B): (□) β-lactamase; (▲) alkaline phosphatase. The solid curves through the
points are fits to the data using equation (4) with time (t) set to zero.
20
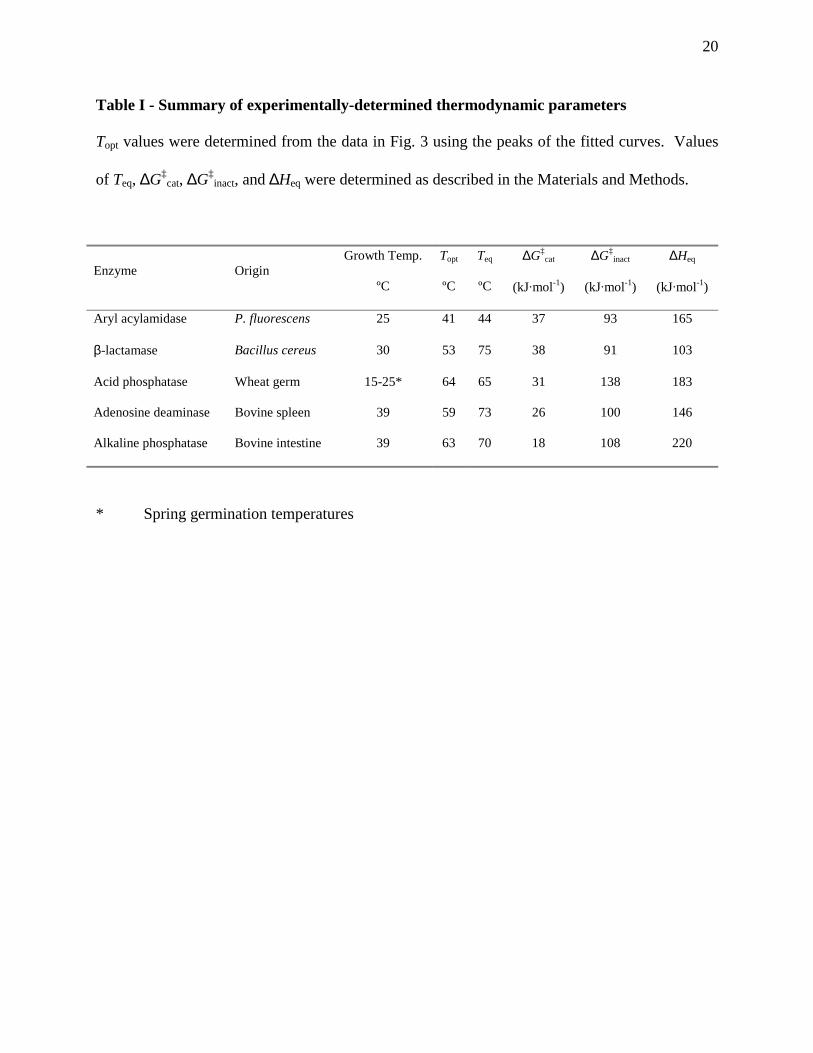
Table I - Summary of experimentally-determined thermodynamic parameters
Topt values were determined from the data in Fig. 3 using the peaks of the fitted curves. Values
of Teq, ∆G‡cat, ∆G‡
inact, and ∆Heq were determined as described in the Materials and Methods.
Enzyme Origin Growth Temp.
ºC
Topt
ºC
Teq
ºC
∆G‡cat
(kJ·mol-1)
∆G‡inact
(kJ·mol-1)
∆Heq
(kJ·mol-1)
Aryl acylamidase P. fluorescens 25 41 44 37 93 165
β-lactamase Bacillus cereus 30 53 75 38 91 103
Acid phosphatase Wheat germ 15-25* 64 65 31 138 183
Adenosine deaminase Bovine spleen 39 59 73 26 100 146
Alkaline phosphatase Bovine intestine 39 63 70 18 108 220
* Spring germination temperatures


Journal of Biological ChemistryCopy of e-mail Notification zbc3449
JBC proofs: M3:09143 article 3449 ready for download=====
Dear Dr. Daniel:
Email Address: your e-mail addressPassword: ----
To view your Journal of Biological Chemistry article, please refer to this URL address http://rapidproof.cadmus.com/RapidProof/retrieval/index.jsp
To view your Journal of Biological Chemistry article, please refer to this URL address:http://rapidproof.cadmus.com/RapidProof/retrieval/index.jsp
After printing the PDF file (use normal quality), please read the page proofs carefully and:1) Indicate changes or corrections in the margin of the page proofs; this is an opportunity for you to check for typographical errors.2) Proofread any tables and equations carefully.3) Check that any Greek characters, especially mu, have been setcorrectly.4) Please check all color figures and note clearly any concerns aboutcolor reproduction. Your computer screen reflects the color that will be visible in the online version of your article.
Reprint number: 3076852
PLEASE INCLUDE YOUR ARTICLE NO. (3449) WITH ALL CORRESPONDENCE FOREITHER
Approval with no further corrections can be sent by EMAIL or FAX
OR
If further corrections need to be made, PLEASE SEND BY FAX OR EMAIL,with pages marked clearly. (Because we need to have a record of eitheryour approval or corrections, please do not call these in by telephone.)
The proofs are representative of how your article will look online.PLEASE RESPOND TO JOYCE GRIMM AT THE E-MAIL ADDRESS OR FAX NUMBER LISTED BELOW WITHIN 24 HOURS WITH YOUR APPROVAL/CORRECTIONS.
Best regards,Joyce Grimm, JBC at Cadmus Communications940 Elkridge Landing Road, Linthicum, Maryland 21090Tel.: 410-691-6286; Fax: 410-684-2790: E-mail: [email protected]

VOLUME 279 (2004) PAGES 20717–20722
A new intrinsic thermal parameter for enzymes revealstrue temperature optima.Michelle E. Peterson, Robert Eisenthal, Michael J. Danson, Alastair Spence,and Roy M. Daniel
PAGE 20720:
Table I: It has become apparent to us that incorrect units were usedfor the fitting of experimental data to the “EquilibriumModel” and thatthe values for �Gcat
‡ , �Ginact‡ , �Heq, and Teq published in this paper are
therefore incorrect; a corrected Table I is shown below. The main con-clusion of the paper is unaffected, namely that “The results and theiranalysis indicate that the experimental velocity data as a function of
temperature can be described by the EquilibriumModel, suggestingKeq
as an intrinsic, temperature-dependent property of enzymes, and sup-porting the hypothesis that these enzymes possess a third thermalparameter (Teq), alongside the Arrhenius activation energy and the acti-vation energy for thermal stability.”
However, based on the original table we stated: “For �-lactamase andadenosine deaminase, the difference between Topt and Teq is greaterthan for the other enzymes; . . . ” This statement no longer applies. Inaddition, as a result of the corrected values, the statement that “Topt willbe close in value toTeq and always smaller” should read: “Topt will almostalways be close in value to Teq but may be smaller or larger, dependingon the relative values of �Gcat
‡ and �Heq.”
TABLE ONE
Summary of experimentally determined thermodynamic parametersTopt valueswere determined from the data in Fig. 3 using the peaks of the fitted curves. Values ofTeq,�Gcat
‡ ,�Ginact‡ , and�Heq were determined as described under
“Experimental Procedures.”Enzyme Origin Growth temp. Topt Teq �Gcat
‡ �Ginact‡ �Heq
°C °C °C kJ�mol�1 kJ�mol�1 kJ�mol�1
Aryl-acylamidase P. fluorescens 25 38 36 74 92 133�-Lactamase B. cereus 30 53 53 69 94 146Acid phosphatase Wheat germ 15–25a 66 63 79 95 133Adenosine deaminase Bovine spleen 39 62 56 65 99 101Alkaline phosphatase Bovine intestine 39 68 60 57 97 86
a Spring germination temperatures.
balt3/zbc-bc/zbc-bc/zbc00206/zbc3449-06a ironmong S�6 8/11/05 7:46 Comments: ARTNO: 3076852
THE JOURNAL OF BIOLOGICAL CHEMISTRY VOL. 281, NO. ??, p. 1, ???? ??, 2006© 2006 by The American Society for Biochemistry and Molecular Biology, Inc. Printed in the U.S.A.
???? ??, 2006 • VOLUME 281 • NUMBER ?? JOURNAL OF BIOLOGICAL CHEMISTRY 1
T1
ADDITIONS AND CORRECTIONS This paper is available online at www.jbc.org
We suggest that subscribers photocopy these corrections and insert the photocopies in the original publication at the location of the originalarticle. Authors are urged to introduce these corrections into any reprints they distribute. Secondary (abstract) services are urged to carrynotice of these corrections as prominently as they carried the original abstracts.
Related Documents