Brigham Young University Brigham Young University BYU ScholarsArchive BYU ScholarsArchive Theses and Dissertations 2009-12-03 A Multidimensional Measure of Professional Learning A Multidimensional Measure of Professional Learning Communities: The Development and Validation of the Learning Communities: The Development and Validation of the Learning Community Culture Indicator (LCCI) Community Culture Indicator (LCCI) Courtney D. Stewart Brigham Young University - Provo Follow this and additional works at: https://scholarsarchive.byu.edu/etd Part of the Educational Leadership Commons BYU ScholarsArchive Citation BYU ScholarsArchive Citation Stewart, Courtney D., "A Multidimensional Measure of Professional Learning Communities: The Development and Validation of the Learning Community Culture Indicator (LCCI)" (2009). Theses and Dissertations. 1981. https://scholarsarchive.byu.edu/etd/1981 This Dissertation is brought to you for free and open access by BYU ScholarsArchive. It has been accepted for inclusion in Theses and Dissertations by an authorized administrator of BYU ScholarsArchive. For more information, please contact [email protected], [email protected].

Welcome message from author
This document is posted to help you gain knowledge. Please leave a comment to let me know what you think about it! Share it to your friends and learn new things together.
Transcript

Brigham Young University Brigham Young University
BYU ScholarsArchive BYU ScholarsArchive
Theses and Dissertations
2009-12-03
A Multidimensional Measure of Professional Learning A Multidimensional Measure of Professional Learning
Communities: The Development and Validation of the Learning Communities: The Development and Validation of the Learning
Community Culture Indicator (LCCI) Community Culture Indicator (LCCI)
Courtney D. Stewart Brigham Young University - Provo
Follow this and additional works at: https://scholarsarchive.byu.edu/etd
Part of the Educational Leadership Commons
BYU ScholarsArchive Citation BYU ScholarsArchive Citation Stewart, Courtney D., "A Multidimensional Measure of Professional Learning Communities: The Development and Validation of the Learning Community Culture Indicator (LCCI)" (2009). Theses and Dissertations. 1981. https://scholarsarchive.byu.edu/etd/1981
This Dissertation is brought to you for free and open access by BYU ScholarsArchive. It has been accepted for inclusion in Theses and Dissertations by an authorized administrator of BYU ScholarsArchive. For more information, please contact [email protected], [email protected].
A MULTIDIMENSIONAL MEASURE OF
PROFESSIONAL LEARNING COMMUNITIES:
The Development and Validation
of the Learning Community
Culture Indicator (LCCI)
Courtney Dennis Stewart
A dissertation submitted to the faculty of Brigham Young University
in partial fulfillment of the requirements for the degree of
Doctor of Philosophy
Dr. Joseph Matthews Dr. Ellen Williams Dr. Sterling Hilton
Dr. LeGrand A. Richards Dr. Pam Hallam
Department of Educational Leadership and Foundations
Brigham Young University
December 2009

ii
Copyright © 2009 Courtney Stewart
All Rights Reserved
ABSTRACT
A MULTIDIMENSIONAL MEASURE OF
PROFESSIONAL LEARNING COMMUNITIES:
The Development and Validation
of the Learning Community
Culture Indicator (LCCI)
Courtney Dennis Stewart
Department of Educational Leadership and Foundations
Doctor of Philosophy
Because of disunity among prominent professional learning community (PLC) authors,
experts, and researchers, the literature was studied to develop a ten-element model that
represents a unified and reconceptualized list of characteristics of a PLC. From this model, the
Learning Community Culture Indicator (LCCI) was developed to measure professional learning
community (PLC) implementation levels based on the ten-element model. Exploratory and
confirmatory factor analyses were performed to determine the structural validity of the LCCI.
Factor analyses provided successful levels of fit for the models tested in representing the
constructs of the LCCI. Reliability measures also indicated high levels of internal consistency
among the responses to the survey items. Although some items and elements had moderate levels
of fit and need additional revisions and validity testing, the LCCI produced substantial evidence

iii
that this survey was a valid and reliable instrument in measuring levels of PLC implementation
across the ten elements.
Because this research validated the LCCI, school leaders can implement, monitor, and
diagnose elements of PLCs in their schools. The LCCI also provides a method in which future
research can be conducted to empirically support the influence of PLCs and student achievement.
Potential uses and recommendations for further research and consideration are presented. A call
for more empirical research is made in connecting the PLC reform model to improved student
learning. The theory of PLC is at a point of substantiation and growth. The LCCI is
recommended as potential tool for studying and facilitating the implementation of PLCs in
schools.
Keywords: Professional learning communities (PLC), Learning Community Culture Indicator (LCCI), survey validation, confirmatory factor analysis, and school reform.
iv
ACKNOWLEDGEMENTS This document, work, and experience could never have been completed solely under my
own ability. As in most of our lives, there are those supporting hands, hearts, and influences that
keep our chins up and faces pointed in the direction of the oncoming gusts of struggle. There are
also those great minds that stimulate and inspire the novice in taking faith-bound steps into the
unknown. As the wobbly legs of the novice become secure and more steadfast under their own
power, many voices encourage support. This acknowledgement is directed to them. The first is to
the greatest choice made in my life, my wife Johanna. Next is to my children who have inspired
me to leave the world better than I found it, no matter the sacrifice. Also, to my parents,
including the first Dr. Stewart, who taught me the joy of learning and the invaluable worth of
education and social service. I also acknowledge my chair, friend, and colleague Joe Matthews,
who is my MVP and role model in higher education. Ellen Williams is also my friend and
colleague who pushed for excellence in my work. I must thank others within the department and
on my committee who were essential in completing this dissertation: Dr. Sterling Hilton, Dr.
Buddy Richards, Dr. Pam Hallam, and Bonnie Bennett.

v
TABLE OF CONTENTS
LIST OF TABLES IX
LIST OF FIGURES X
CHAPTER 1: INTRODUCTION 11
Background of Professional Learning Communities................................................................ 12
Conceptual Model of the LCCI ................................................................................................ 15
Statement of the Problem.......................................................................................................... 17
Purpose of the Study ................................................................................................................. 18
Research Questions................................................................................................................... 19
Definition of Terms .................................................................................................................. 19
Summary and Organization of Chapters................................................................................... 21
CHAPTER 2: REVIEW OF THE LITERATURE 22
Introduction to the Literature Review....................................................................................... 22
Need to Validate the LCCI ....................................................................................................... 23
Types of Measurement Validity ............................................................................................... 24
Content Validity of Instruments............................................................................................ 25
Criterion Validity of Instruments.......................................................................................... 26
Construct Validity of Instruments......................................................................................... 27
Face Validity of Instruments................................................................................................. 29
Reliability of Instruments ..................................................................................................... 30
Reforms of Contemporary Organizational Culture .................................................................. 31
Review of School Culture..................................................................................................... 32
Analysis of School Culture ................................................................................................... 33

vi
Measures of Professional Learning Communities ................................................................ 34
Overview of School Reform..................................................................................................... 35
School Reforms as Communities.......................................................................................... 35
School Reform Failures ........................................................................................................ 37
Professional Learning Communities as Reform ....................................................................... 39
Authors and Elements of Professional Learning Communities............................................ 40
Rationale For a New Professional Learning Community Model.......................................... 43
Ten Elements from Williams, Matthews, and Stewart (2007) of Professional Learning
Communities ......................................................................................................................... 44
Analysis of the Professional Learning Community Literature Review................................ 56
Synthesis of the Professional Learning Community Elements............................................. 57
Creation of Common Elements of Professional Learning Community Literature ............... 58
CHAPTER 3: METHODS 61
Research Framework ................................................................................................................ 61
Questions Guiding the Research............................................................................................... 62
Development and Validation of the Structure of the LCCI ...................................................... 63
Development of Survey Items .............................................................................................. 63
Phase 1: Cognitive Interviews and Written Critiques........................................................... 67
Phase 2: Pilot Study .............................................................................................................. 68
School Selection................................................................................................................ 68
Missingness Rates............................................................................................................. 69
Structural Analysis............................................................................................................ 69
Concurrent Validity .......................................................................................................... 73
vii
Phase 3: Revision of the LCCI, Second Pilot, and Second Analysis.................................... 74
Summary................................................................................................................................... 75
CHAPTER 4: RESULTS 76
Phase 1: Cognitive Interviews and Written Critiques............................................................... 76
Phase 2: The Results from the Pilot Study ............................................................................... 80
First Pilot Study Analysis Results ........................................................................................ 82
Research Question 1: Does the LCCI Measure Unique Individual Elements of PLCs? .. 82
Research Question 2: Does the LCCI measure an overall level of PLC?......................... 87
First Pilot Study Reliability Results...................................................................................... 95
Concurrent Validity Results.................................................................................................. 95
Phase 3: The Revision of the LCCI, Second Pilot, and Second Analysis ................................ 99
Second Revisions to the LCCI.............................................................................................. 99
Second Pilot Study Analysis of the Second Version of the LCCI...................................... 104
Second Pilot Study Analysis Results .............................................................................. 105
Research Question 1: Does the LCCI Measure Unique Individual Elements of PLCs? 105
Research Question 2: Does the LCCI measure an overall level of PLC?....................... 107
Second Pilot Study Reliability Results ........................................................................... 115
Summary of Results................................................................................................................ 117
CHAPTER 5: DISCUSSION 118
Problems and Purpose of the Research................................................................................... 119
Research question 1: Does the LCCI measure unique individual elements of PLCs? ... 120
Research question 2: Does the LCCI measure an overall level of PLCs? ...................... 120
Research question 3: Is the LCCI a valid and reliable measure of PLCs? ..................... 121

viii
Analysis and Results of the Validation Plan........................................................................... 122
Practical Evidence of Validity ................................................................................................ 123
Statistical Evidence of Validity .............................................................................................. 124
Discussion of Implications...................................................................................................... 126
Practical Implications of the Study ..................................................................................... 126
Theoretical Implications of the Study................................................................................. 128
Limitations of the Research .................................................................................................... 130
Recommendations for Future Research and Uses of the LCCI .............................................. 131
Area 1: PLC Models Recommendation .............................................................................. 131
Area 2: Structure Learning Community Culture Indicator’s Recommendation................. 133
Area 3: Validation of the Learning Community Culture Indicator Recommendation ....... 134
Conclusion .............................................................................................................................. 136
REFERENCES 138
APPENDIX A 152
APPENDIX B 168
APPENDIX C 169
APPENDIX D 170
ix
LIST OF TABLES
Table 1. Matrix of PLC Authors and their Identified Elements .................................................... 60
Table 2. Pilot Study Results by School, Reponses Received, Rate of Missingness, and PLC level
....................................................................................................................................................... 79
Table 3. Identifying Elements and Descriptors............................................................................. 81
Table 4. Eigenvalues and Factor Loading from the First Pilot Study.......................................... 84
Table 5. First Pilot Model Results: Individual Models................................................................. 86
Table 6. The First Pilot Results: Results from the Group Models................................................ 89
Table 7. Model Results for Groups ............................................................................................... 92
Table 8. Mean Scores of Each School by PLC Level, Overall, and Element ............................... 97
Table 9. Results of General Linear Model Analysis Comparing School and Level ..................... 98
Table 10. LCCI Revisions ........................................................................................................... 103
Table 11. Eigenvalues and Factor Loadings for Second Pilot Study ......................................... 106
Table 12. Second Pilot Results: Individual Models and Fit Indices........................................... 108
Table 13. Second Pilot Model Results: Higher Order Models ................................................... 111
Table 14. Loadings for Second Pilot Group Models .................................................................. 114
Table 15. Single Construct Models ............................................................................................. 116
x
LIST OF FIGURES
Figure 1. Conceptual model of the LCCI ..................................................................................... 71
Figure 2. Response scale revisions: before and after revisions. ................................................... 78
Figure 3. An example of a single element first order model. Element B: Decision..................... 85
Figure 4. Bifactor model with all groups...................................................................................... 90
Figure 5. Bifactor CEFGJ............................................................................................................. 93
Figure 6. Bifactor ABDHI............................................................................................................ 94
Figure 7. Second pilot study: bifactor model. ............................................................................ 112

11
CHAPTER 1
INTRODUCTION
Educators at Monarch Middle School have been on a journey for five years to shift the
culture of the school to focus more on the individual learning needs of students. They have
formed instructional teams and have begun to meet regularly in those teams to build common
assessments and to collaborate on improving instructional practice. Teachers have become
leaders who are active in deciding key instructional decisions related to the school. Half of the
faculty and staff have attended national trainings on how to become a professional learning
community (PLC). Most educators in the school understand that becoming a PLC is a long
journey and that they may never reach the summit. Many leaders have wondered if there could
be a way to determine how they are doing along this journey. Knowing where everyone is in the
school regarding PLC practices could help in redirecting or enforcing current practices. Having a
measurement could provide reaffirmation in what steps school educators have taken. It could
also take measure the present culture in the organization to see the strength of its PLC.
The purpose of this study was to validate the development and design of the Learning
Community Culture Indicator (LCCI). The LCCI is an instrument that provides a
multidimensional measure of how schools are functioning in the implementation of school
cultural change focused on teacher and student learning. The LCCI was founded upon ten
elements of professional learning communities that were identified in the literature. The research
team of Williams, Matthews, Stewart, and Hilton (2007) created the LCCI based on the ten
elements that were found throughout the scholarly and authoritative literature on PLCs, which
will be identified in chapter 2. As a team that created the LCCI, we tested the instrument through
multiple validation phases and refined the LCCI as it was administered and re-administered in

12
schools. This study filled a deficit of validated educational measures of PLCs and provided a
reconceptualization of PLCs by providing a new model and method of measuring that model.
In this chapter, we discuss the background of PLCs, offer a list of 10 PLC elements, and
give two problems that exist among instruments used to measure PLCs. We also present the
research questions, the rationale for the study, and the definition of terms that are used
throughout this study. We conclude this chapter with a framework for subsequent chapters.
Background of Professional Learning Communities
Many researchers and experts (DuFour & Eaker, 1998; Fullan, 1992; Hord & Hirsh,
2008; Olivier, 2003) have promoted PLCs in schools as one of the most successful strategies that
schools can use for improving student learning. These educational reformers are looking to
schools to function as communities with collective cultures that include organizational purpose
and collaboration. According to these reformers, the idea that a school functions as a PLC has
potential for creating schools that are self-directing, self-adapting, and resistant to the needs of
those reforms that advocate more immediate and sweeping changes. Although several reformists
have contributed to this reform movement, none of them has attempted to unify all efforts into a
single model. Having no common conceptualization of PLCs and no means to measure whether
schools that claim to be PLCs are functioning as such can be problematic for research and
practice. Many schools that refer to themselves as PLCs might have only the appearance of being
one because they have adopted such structures as having teachers organized into teams with little
attention to some of the more critical aspects of PLCs such as a focus on student learning,
common assessments, data-driven decision making, or job-embedded professional development.
Without these substantive aspects of PLCs included in the way teacher teams function, these
schools might not achieve the promised sustainable improvement in student learning. Thus,

13
teachers might get discouraged and burned out, convinced that PLCs are just another empty
claim for how schools can improve. Unfortunately, this perception not only damages the schools
that have implemented PLCs poorly, but it inhibits the progress of schools that are endeavoring
to implement PLCs at the deep cultural level.
If a common definition of what constituted a PLC was crafted and if a validated means
for measuring it was devised, implementation efforts would be enhanced. Implementers would
have a clear vision of the elements that are present in the culture of high-functioning PLC
schools. They could also collect empirical data that showed which elements were present in their
schools and which were not. They could then use that data to guide the development of their
school PLCs more strategically in the future; thus, they would substantially increase the
likelihood of improving teaching and learning in their schools.
Although certain PLC concepts have been studied extensively (Blankstein, 2004;
DuFour, DuFour, Eaker, & Many, 2006; Hord, 1997; Louis & Marks, 1998; Senge, 1990; Senge,
et al., 2000), providing an explicit list of all the essential elements of learning communities is not
present in the literature. This problem, unfortunately, has presented difficulties for schools that
are attempting to measure their current implementation. Measuring existing implementation
levels and attempting to begin new strategies for improvement with the PLC concepts are
difficult for schools when there is no consensus on defining elements and instruments that can
measure those elements.
The PLC movement began a cultural shift toward systematic teacher collaboration that
was focused on improving student learning. This focus on student learning was a departure from
many earlier reform efforts that were occupied only with the teacher and teaching (Levin &
Wiens, 2003). However, explicitly defining PLCs was problematic because of their universal

14
application while simultaneously having uniqueness for each school (Smith, MacGregor,
Matthews, & Gabelnick, 2004). In other words, PLCs function differently in each school because
of a customized application to the needs and culture of that school (Smith, et al., 2004). The PLC
is initiated, developed, and led by members of that school’s community (Hord, 2004).
As with most bodies of knowledge, the PLC movement grew over time as new members
joined in the academic conversation (Graff & Birkenstein, 2006; Whetten, 1989). Many
researchers and practitioners provided different definitions and elements of PLCs. Until now no
consensus has been attempted to combine them into a unified model. Many researchers and
reformists have studied single elements and their benefit to schools, but no comprehensive list of
elements has previously been assembled and studied.
With my colleagues on the research team, we identified a common list of PLC elements
that has been identified through an extensive review of the literature and study of schools that
have implemented PLCs (Williams, et al., 2007). We identified ten common elements among the
PLC and school reform literature, namely:
1. Common mission, vision, values, and goals that are focused on teaching and learning
2. Decision making based on data
3. Participative leadership that is focused on teaching and learning
4. Teaming that is collaborative
5. Interdependent culture
6. Academic success for all students with systems of prevention and intervention
7. Professional development that is teacher driven and embedded in daily work
8. Principal leadership that is focused on student learning
9. High-trust embedded in school culture
15
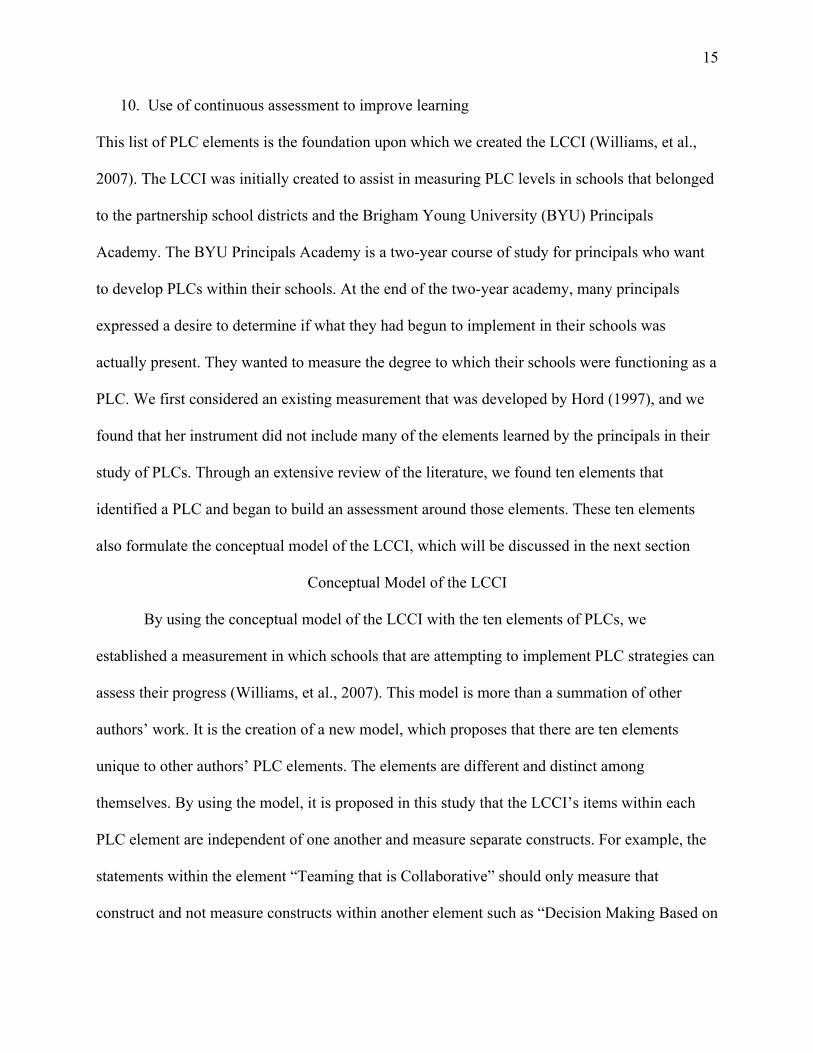
10. Use of continuous assessment to improve learning
This list of PLC elements is the foundation upon which we created the LCCI (Williams, et al.,
2007). The LCCI was initially created to assist in measuring PLC levels in schools that belonged
to the partnership school districts and the Brigham Young University (BYU) Principals
Academy. The BYU Principals Academy is a two-year course of study for principals who want
to develop PLCs within their schools. At the end of the two-year academy, many principals
expressed a desire to determine if what they had begun to implement in their schools was
actually present. They wanted to measure the degree to which their schools were functioning as a
PLC. We first considered an existing measurement that was developed by Hord (1997), and we
found that her instrument did not include many of the elements learned by the principals in their
study of PLCs. Through an extensive review of the literature, we found ten elements that
identified a PLC and began to build an assessment around those elements. These ten elements
also formulate the conceptual model of the LCCI, which will be discussed in the next section
Conceptual Model of the LCCI
By using the conceptual model of the LCCI with the ten elements of PLCs, we
established a measurement in which schools that are attempting to implement PLC strategies can
assess their progress (Williams, et al., 2007). This model is more than a summation of other
authors’ work. It is the creation of a new model, which proposes that there are ten elements
unique to other authors’ PLC elements. The elements are different and distinct among
themselves. By using the model, it is proposed in this study that the LCCI’s items within each
PLC element are independent of one another and measure separate constructs. For example, the
statements within the element “Teaming that is Collaborative” should only measure that
construct and not measure constructs within another element such as “Decision Making Based on

16
Data.” We also propose that not only can each PLC element be measured but that the LCCI can
measure an overall level of PLC implementation. The overall measure is derived from the
combination of the results of individual elements. In other words, in this study we will show two
things: one, each question measures the individual element for which it was created, and two, all
questions together provide a single measure for a level of PLC.
Although many surveys have been created and used to measure some aspect of school
culture, only two groups of researchers have attempted to measure PLC elements using a
validated measure. Shirley Hord (1997) created an instrument founded on her five elements of a
PLC that was validated by an external organization called The Evaluation Center (1998). In this
validation, only one school that was known to be a functioning PLC was sampled. This school
was compared to 21 other schools that had no known level of PLC within those schools.
Although, Hord’s instrument was validated, and it proved to provide some measure of PLC
levels, the instrument was limited to her five defining elements of a PLC. Another instrument,
which essentially was a modified form of Hord’s instrument, was created by Huffman, Hipp, and
Olivier (2003). The Professional Learning Community Assessment (PLCA) was an extended
version of Hord’s (1997) 17-item survey. While some validation and reliability were conducted,
although not presented in the literature, this instrument again was limited to the five elements of
Hord’s model. The limitation of these two instruments is problematic for schools that may be
implementing other models of PLCs, such as DuFour’s, Blankstein’s, or Louis and Kruse’s. At a
recent national conference, Hord admitted that her instrument was outdated and needed to be
revalidated (personal communication, NSDC Conference 2008). Also in a recent conference
paper presentation, Olivier and colleagues (2009) presented a modified PLCA instrument that
included two new questions regarding data utilization as encouraged by the additional work of
17
Hord and Hirsh (2008). However, this instrument also has limitations because it only measuresd
Hord’s model of a PLC and does not consider the other PLC models.
Statement of the Problem
In order to frame the difficulty and substantiate the need to conduct this research, we
emphasize two problems. The first problem is a lack of consensus among PLC experts and their
defining elements that make up a PLC. Thus, confusion exists in the field as to which elements
are essential to the development of a PLC. In order to assist school leaders in the development of
a PLC, consensus must exist as to which elements are important in establishing a PLC. Likewise,
a consensus of which elements that are identified in the literature are essential to PLCs would
also provide a foundation for further empirical research and provide substantiation to the claims
of PLCs and their success. By identifying the elements that are common among authors of
scholarly and authoritative literature, a common language can be used to study and implement
PLCs.
The second problem is the shortage of a current and psychometrically validated
instrument to measure PLC concepts that have been implemented by schools and the degree to
which they are functioning within those elements. As mentioned above, before the LCCI, only
Hord’s (1997) and Huffman, Hipp, and Olivier’s (2003) validated instruments were found in the
literature. However, the validation of these PLC instruments was limited in that the validation
occurred only once and the instruments were founded only on the defining elements of Hord’s
model (1997). By considering only Hord’s elements in the creation of the instrument, the surveys
were limited in providing measures of PLC implementation only to those schools that adhere to
Hord’s model of a PLC. However, for those who may be utilizing a DuFour model of PLC

18
within their school (DuFour, et al., 2006), there has been no validated instrument that can
measure PLC levels of implementation in that school.
In this study, the first problem helps to frame the second problem by establishing
justification for validating a survey to measure PLCs. Acknowledging the first problem that there
is disunity among the authors of PLC elements establishes the reason for the unifying 10
elements. In order to address the second problem, we will discuss the purpose for this study in
the next section.
Purpose of the Study
This study had two purposes. The first purpose was to present the development of a new
instrument to measure school levels of PLC, which may lead to a greater understanding of the
defining elements of a PLC and provide a means for schools to assess their level of
implementation. This instrument is an attempt to provide a new conceptualization of PLCs by
providing a new model in how PLCs are identified and studied.
A second purpose of this study was to test the validity of the LCCI. Messick (1995)
described validity as “an overall evaluative judgment of the degree to which empirical evidence
and theoretical rationales support the adequacy and appropriateness of interpretations and actions
…[in] modes of assessment” (Messick, 1995, p. 741). Validity represents how accurately an
instrument measures the constructs it was intended to measure. We conducted this study to test
the validity of the LCCI in its goal of measuring multiple elements of a PLC.
Although the purpose of this study was to present the development and validation of the
LCCI, we hope that the primary benefit of this research is an improved understanding of the
constituent elements of PLCs and the ways to assess them within schools. Providing this
understanding may offer critical information for educators and leaders as they implement PLCs

19
within their schools to improve student learning. The developers of this instrument anticipated
that the results of the validation would also show a sound, well developed, and valid measure of
PLCs. This instrument will provide empirical evidence on which leaders will be able to assess
their success in establishing PLC elements in their schools and to plan for the next steps.
Research Questions
There are two specific problem areas outlined in this study: lack of consensus among
PLC experts and their defining elements that make up a PLC, and the lack of a validated
instrument to measure schools that have implemented PLC concepts. In order to address the
problems identified by this study, the following three research questions guided this research:
1. Does the LCCI measure unique individual elements of PLCs?
2. Does the LCCI measure an overall level of PLC?
3. Is the LCCI a valid and reliable measure of PLCs?
Definition of Terms
The following terms are used throughout this study. They are defined as follows:
Confirmatory factor analysis (CFA)is a type of structural equation modeling, that is used
in the testing of measurement models and the relationships between observed and latent variables
(Brown, 2006). These variables are called factors.
Culture. The culture of an organization is the shared beliefs or patterns that have arisen
from encountering and solving problems faced by the organizations (Schein, 1984). It is also the
way things are done within an organization (Bolman & Deal, 1997).
Exploratory factor analysis (EFA) is a descriptive technique of the data before a CFA
that attempts to measure the number of common factors in a data set and to which latent
variables or factors they may belong (Brown, 2006).

20
Factor Loading are a statistical estimate of the presumed effects of the latent variables on
the observed scores (Kline, 2005) measured in CFA as regression coefficients.
Goodness-of-fit indices are a statistical measure of how well the proposed or
hypothesized model within a CFA fits the resulting data.
Learning Community Culture Indicator (LCCI) is a self reported questionnaire and
school culture survey taken by teachers and principals and used to measure 10 PLC elements and
their level of implementation within schools.
Learning Organizations are continuously learning and applying experience into
knowledge to help accomplish a common purpose (Senge, 1994).
Measurement Error is variance, or residual errors, that are not explained by the latent
variables or factors by the indicator scores (Kline, 2005).
No Child Left Behind (NCLB) Act of 2002 is a federal act mandating student
improvement and increasing school accountability through out the United States. The NCLB Act
was a reauthorization of the ESEA act of 1965.
Professional Learning Community (PLC) is a current school reform that shifts the focus
and culture of the school to be highly centered on all students and teachers learning together
through elements such as collaborative teaming, interdependent culture, and participative
leadership.
Reliability is a measure of the degree to which a test is free from measurement error
(AERA, APA, & NCME, 1999). The internal consistency, an estimate of reliability, is the degree
to which a group of survey questions measures a single concept.

21
Validity is a measure of the degree to which a survey has evidence that supports the
inferences made from the scores (AERA, et al., 1999). Categories of validity include construct
validity, content validity, criterion-related (concurrent) validity, and face validity.
Summary and Organization of Chapters
The organization of this introduction began with a discussion of PLCs, the constituent
elements, and problems among PLC authors. The ten elements identified by Williams and
associates (2007) provided the framework for the creation and structure of the LCCI. In chapter
2, we present a review of the literature of the standards and measures of validity and reliability,
school culture, origins of learning communities, and school reform. Each of the ten elements will
be reviewed individually and compared with five prominent authors of PLC elements. In chapter
3, we present the methodology for addressing the validity and reliability of the LCCI and how
testing the theoretical model was created. In chapter 4, we present the results from the three
phases of development and validation, and in chapter 5, we discuss the implication of the results
we observed and propose recommendations for further research.

22
CHAPTER 2
REVIEW OF THE LITERATURE
Introduction to the Literature Review
Since the creation of free public education in the United States, the function and purpose
of education have changed. Many events, individuals, and situations have promoted changes
hoping to make education more effective for a greater number of students. Some periods were
stagnant where many repetitive practices of unproductive actions in schools had prompted
individuals to promote change. Some governmental legislative acts were events that required
change. Change was quick and sometimes painful. Recently in the wake of many publications
and governmental acts calling for change, educational researchers and practitioners were looking
for types of reform that would be sustainable and linked with student learning.
Some reforms in the first decade of the 20th century were looking for schools to function
as learning communities with collective cultures of organizational purpose and collaboration.
Proponents claimed that the idea that schools function as learning communities had potential for
creating schools that were self-directing and self-adapting. Although some authors contributed to
this reform movement, nothing in the literature suggested that any attempt had been made to
unify all efforts into a single model of success. By synthesizing the best ideas and thoughts on
learning communities from educational researchers and practitioners, we hope to report that a
newly developed school reform tool has been developed to help educators in their quest for
improving learning for all students.
In the past decade, learning communities (also known as professional learning
communities [PLCs]) were often touted as the “most promising strategy for sustained,
substantive school improvement” (DuFour & Eaker, 1998, p. xi). Many authors attested to the

23
potential success of implementing learning communities in schools to enhance student
achievement (Blankstein, 2004; Darling-Hammond, 2005; Hord, 1997; Louis & Marks, 1998;
Rait, 1995; Senge, et al., 2000; Stoll, Bollam, McMahon, Wallace, & Thomas, 2006). However,
a problematic aspect of learning community literature was the lack of consensus among learning
community authors (Wells & Feun, 2007). Because of the lack of empirical studies and different
defining elements, the support for professional learning communities was often limited to
anecdotal stories.
For this study, we reviewed the contemporary authoritative and scholarly literature on
reforming and improving schools and measurement validation. We reviewed empirical studies
and primary research articles to find connections among the topics. We also reviewed secondary
research to provide a foundational base for this research. In this chapter, we will present a review
of measurement validation and show the need for the Learning Community Culture Indicator to
be a validated instrument. We reviewed how organizational culture was defined and measured in
the literature. We focused on the origins of learning communities and common elements
identified by PLC scholars and experts. We also present a review of the literature on the school
reforms that have affected professional learning communities. We will also discuss the
implementation of the professional learning community concept as a reform effort in schools.
We will then focus on school reforms and present how some have fallen short of success, and
then present a movement that has found success in improving student learning. Finally, we
conclude with an analysis of the literature.
Need to Validate the LCCI
Using the ten elements found in the literature, the research team of Williams, Matthews,
Stewart, and Hilton (2007) created the Learning Community Culture Indicator (LCCI). The

24
LCCI is a school survey instrument used for determining the level of implementation of ten PLC
elements identified in the literature. In order to substantiate the application and truthfulness in
which survey instruments measure the constructs upon which they are created, a standard of
validity was needed for the instrument (Messick, 1995). Below we provide a review of
measurement validity, reliability, and why they were essential in substantiating survey
instruments’ claims of accurately measuring a concept.
Types of Measurement Validity
In education and other social sciences, many researchers developed instruments in an
effort to measure an observed or unobserved concept. If researchers hope to infer any substantial
conclusions from the data collected by instruments, they must first establish whether the
instruments are accurate measurements of the concept. The determination of how well the
instruments measure the concept is known as its validity. Validity has been referred to as the
“degree to which evidence and theory support the interpretations of test scores entailed by
proposed uses of tests” (AERA, et al., 1999, p. 9). It has also been defined by Messick (1995) as
an “overall evaluative judgment of the degree to which empirical evidence and theoretical
rationales support the adequacy and appropriateness of interpretations and actions on the basis of
test scores or other modes of assessment” (p.741). In multiple instances, validity was not held in
the properties of the test but to the meaning of the test (Cronbach, 1971; Messick, 1995; Shepard,
1993). Validity was not solely based on the structure and wording of the instrument but on what
results were produced from the measurement. It is through the analysis of the results that validity
was determined.

25
The constituent elements of validity include content, criterion, construct, and face
validity. In the following section, we describe each element and relevant measures addressing
how that validity was determined.
Content Validity of Instruments
Content validity is defined as the degree to which an instrument measures all pertinent
characteristics of the behavioral or conceptual domain that the instrument was created to
measure. Traditionally, content validity relied on subjective judgments of an instrument’s ability
to measure a content (Bryant, 2000). Researchers commonly determined validity by visually
inspecting the items and their thoroughness in covering the content. Some researchers such as
Brown (1983) believed that there was no method statistically to measure validity. He stated,
“Since no quantitative index of sampling adequacy is available, evaluation will necessarily be a
rational, judgmental proves” (p. 69). In the past, researchers thought there was no way to
quantitatively measure the validity of an instrument. Researchers now use methods of
multivariate statistics to determine the content an instrument attempts to measure.
Using methods such as exploratory factor analysis (EFA), principal component analysis
(PCA), and confirmatory factor analysis (CFA), researchers have been able to measure what is
known as structural validity. EFA is typically conducted before performing a CFA. CFA tests the
hypothesis of a model, proposed by the research being conducted, on the domains of study in a
measurement. The hypothesis tests a model on which the researcher has predetermined which
items measure which domains and how well they correlate (Bryant, 2000). Goodness-of-fit
indices are measures within a CFA that determine support of the instrument’s validity. The
goodness-of-fit is a measure of how fitting the model is in representing the results of data. Does
the model fit with the results? As a model adjusts, goodness-of-fit measures can be compared to

26
see which is the best fitting model. A strength of the CFA is its ability to decide how well a
model may generalize across groups of individuals. Another strength of CFA is that it gives a
stronger framework than traditional techniques in accounting for measurement error (Brown,
2006).
Criterion Validity of Instruments
Criterion validity is related to how well an instrument can predict a known indicator of a
concept (Bryant, 2000). If the instrument is well designed in measuring its intended concepts, it
should be able to predict outcomes of the concept. This is referenced as predictive validity. It is
predictive in the sense that it informs about future results. Predictive validity is often used when
scores are collected in measuring an established criterion. Evaluating the predictive validity will
confirm that the expected scores will reflect the criterion it was intended to measure.
Another component of criterion validity is concurrent validity. The concept is concurrent
in the sense that it produces similar results to another measure of the same concept. Concurrent
validity is often used in establishing consistency among instruments measuring the same
concepts. Evaluating the concurrent validity will confirm that the scores obtained did reflect the
criterion the measure was intended to measure, and that the measure was similar to the result
produced by another measure of the same criterion. Concurrent validity is usually assessed using
another statistical procedure known as structural equation modeling (SEM).
In SEM “the researcher uses multiple measures as indicators of both the underlying
construct to be validated and of the criterion construct, and then estimates the causal influence
between the two latent constructs” (Bryant, 2000, p. 108). SEM is a relatively new statistical
technique in which a researcher can test a theory about causal relationships among concepts.

27
EFA does not allow causal relationships to be tested because it is exploratory in nature, therefore
the researcher must continue by using SEM as a method to confirm the findings of the EFA.
Another form of structural analysis similar to SEM is path analysis. However, path
analysis only deals with observed rather than latent variables (Klem, 2000). SEM has combined
elements of both factor analysis and path analysis. CFA is a type of SEM that is specifically
focused with relationships between latent and observed variables or measurement models
(Brown, 2006). These potential relationships can be confirmed through the building of models to
test the relationship between the observed and unobserved variables.
Construct Validity of Instruments
Often considered by researchers as a culminating conception of validity (Shepard, 1993),
construct validity is an element of test validation. Construct validity determines whether a given
measurement actually measures the conceptual constructs the instrument is attempting to
represent (Bryant, 2000). Constructs are the conceptual elements or characteristics that a
measurement hopes to gauge. As with the validation process, validity is not of the test, but the
explanation of the data that were collected by the procedure (Shepard, 1993). The Standards of
Educational and Psychological Measurement (AERA, et al., 1999) defined validity as “the
process of … accumulating evidence to provide a sound scientific basis for the proposed score
interpretation” (p. 9). The purpose of validity is whether a measurement is capturing the ability
to interpret some determined construct, thus establishing why construct validity is often
considered a culminating conception of validity.
Construct validity has two components. The first component is an internal structure
where the internal model of the measurement should represent the theory that was used in
defining the construct (Shepard, 1993). This can be measured using the SEM to assess the

28
structural validity of the instrument and the model upon which it was built. The second
component is the external. The external focuses on the framework’s representation of the
intended model or constructs and their relation to other constructs outside of the model. The
representativeness of the measure in relating to other constructs is important in determining the
validity and application of the instrument. If, for example, a measure is used to determine the
view of teachers on the importance of parent input, the measure should be somewhat related to
the parents’ input on school or student matters.
Within construct validity, there are two sub measures termed convergent and divergent
validity. Convergent validity is the degree to which multiple measures of a similar construct
converge or agree (Bryant, 2000). If within a test, multiple questions are attempting to measure
the same related concept, the questions should have a greater convergent validity if they intend to
measure that concept. A CFA would be used to assess the convergent validity of a measure.
Another gauge in determining convergent validity is comparing it to its counterpart, divergent
validity.
Divergent validity is a measure of whether questions from an instrument attempting to
measure different constructs are dissimilar or divergent. If multiple constructs are attempting to
measure different ideas within the same measurement, they should not be highly correlated. If
they were highly correlated, the concepts would be measuring the same concepts. Divergent
validity can also be assessed using a CFA by comparing models of convergence and divergence.
A convergent model theorizes that there is a single latent construct being measured in
comparison to a divergent model that theorized that there are multiple separate constructs being
measured. Using goodness-of-fit indices to compare both models, the researcher can then
determine which model represents the data better.

29
Traditionally, models of CFA were considered unidimensional in that they travel one
path of convergence or divergence. However, another model exists in which there can be a
simultaneous testing of both. This type of model is called a bifactor model. The bifactor model is
commonly compared to traditional hierarchal models of comparison (Chen, West, & Sousa,
2006; Reise, Morizot, & Hays, 2007).
Face Validity of Instruments
Although not a true measure of construct validity, face validity is a related measure. Face
validity is often considered a domain of criterion validity (Bryant, 2000), however in this review,
it will be addressed individually. Face validity does not attempt to determine the degree to which
an instrument measures a concept. Face validity does attempt, however, to represent consistently
the construct being measured by those taking or developing the instrument. Face validity is
subjective and based on the interpretation of those reading the measurement and determining
whether superficially it captures what it intended to measure (Bryant, 2000). Face validity is not
an attempt to determine the actual construct validity, and in some cases, it may not posses any,
but it is determining if the measure’s wording, questions, and relevance are trying to measure a
known construct.
Evaluators should consider multiple elements when evaluating the validity of a
measurement. Within each element, there are also methods or techniques to determine the degree
to which the measurement meets the criteria of each element of validity. Establishing the validity
of an instrument will substantiate the claims of those who are using the information in their
research.

30
Reliability of Instruments
Another related measurement of tests and how accurate they are in assessing a
predetermined idea is reliability. Reliability is defined as the “trustworthiness of a measure”
(Strube, 2000, p. 63). Similar to validity in the sense that it tries to capture a true value of some
concept, reliability is a measure of consistency of the questions on a test measuring the same
concept. Reliability is not related to validity in the sense that reliability does not depend on the
questions as being a valid measure of a construct, but only whether they consistently measure the
same idea (AERA, et al., 1999). Reliability is essential to validity, but validity is not essential to
reliability because researchers can consistently measure the wrong concept.
Another facet of reliability is the measurement’s stability over time and with different
sample populations. The Standards (1999) defined reliability as consistency of a measurement
when the testing process is repeated on a population of groups or individuals. The goal in
achieving reliability is the reduction of measurement error. Measurement error is part of the
observed score that represents the imprecision in capturing the true score (Strube, 2000).
An essential element in many measurement instruments is how consistent each of the
items in the test measures the same characteristic. This interrelationship among the various items
on a measurement is termed internal consistency (Brown, 1983). A common measure of internal
consistency, which is often used in determining reliability among test questions, is Cronbach’s
coefficient alpha. Cronbach’s alpha is the expected correlation of one test and another of the
same length taken from the same domain (Brown, 1983). It is measured on a scale of 0 to 1.0
with 0 having no internal consistency and 1.0 having a perfect consistency among the test items.
Many factors can influence the reliability coefficient. These factors are test length, range of

31
scores, test difficulty, time length, wording, and sentence construction (Brown, 1983; Strube,
2000).
Validity and reliability are domains within measurement validation that are important in
providing levels of accuracy and consistency of tests in assessing some intended concept. They
provide credibility to researchers’ claims after they have collected and interpreted data.
Gathering data is essential for researchers. However, gathering accurate and true representations
of the perspectives, characteristics, or knowledge of test subjects is even more essential.
Reforms of Contemporary Organizational Culture
Arising in the early 1980s, organizational culture emerged as a new concept. At the time,
organizations were analyzing the reasons the U.S. was underperforming when compared to some
other countries. Organizational researchers learned that in order to be competitive in the external
environment, the focus of change began with the understanding of the organizational culture
(Daft, 2005).
Schein (1984) defined organizational culture as “The pattern of basic assumptions that a
given group has invented, discovered, or developed in learning to cope with its problems…to be
taught to new members as the correct way to perceive, think, and feel in relation to those
problems” (p. 3). This definition then leads to an accepted and valid way of dealing with
problems that can be conveyed to a new employee of the organization. According to Schein, a
culture stems from artifacts, values, and assumptions that are both visible and self-evident.
Schein believed that because culture is typically taken for granted by the members of the
organization, assumptions of the culture are not typically revisited unless in times of turbulence.
However, currently revisiting culture is not limited to times of turbulence but can also occur
because of the needs of federal, state, and district educational systems.

32
The understanding of organizational culture in business has provided a foundation for
researchers to apply the same understanding to education. Many researchers began studying how
culture influenced the school. Peterson and Deal (1998) defined school culture as “the
underground stream of norms, values, beliefs, traditions, and rituals that has build up over time
as people work together, solve problems, and confront challenges” (p. 28). The following section
will provide a review of school culture reforms and how culture can be observed.
Review of School Culture
Any school reform effort and change are only lasting if the culture of the school changes
(Peterson & Deal, 1998). To facilitate change, the culture can be studied and shaped by school
leaders and members of the organization (Deal & Peterson, 2000). Deal and Peterson stated that
leaders could act out different roles such as historian, actor, or healer to shape and understand the
school culture.
Cultural change can occur from new events or needs in the organization. Just as culture
can influence day-to-day functions, culture can also influence school reforms. School leaders can
study their schools’ culture to assess whether reform implementations are taking root (Gruenert,
2000). Cavanagh and Dellar (1998) observed that leaders who ignore their school’s culture are
less likely to have the needed skills to change a culture and may be in opposition to needed
interventions. Understanding and diagnosing a culture would provide school leaders with
essential information in their journey of implementing and sustaining changes within the school.
The term culture is a latent concept in that it is not directly observable. School members
cannot look at a school and instantly determine the culture. However, culture can be studied by
the manifestations that arise from the elements. These manifestations are sometimes called
“footprints” (Gruenert, 2005, p. 45) of a culture. Because of the latency of culture, many

33
researchers have developed, designed, and modified existing surveys in an attempt to measure
particular aspects of school culture (Goddard, Goddard, & Tschannen-Moran, 2007; Gruenert,
2000, 2005; Hord, 1997; Lee & Smith, 1996; Newmann, Smith, Allensworth, & Bryk, 2001;
Supovitz, 2002; Wells & Feun, 2007). These instruments have measured multiple concepts
within schools. The results of the surveys have been analyzed to draw some conclusion about
school culture. The next section will present how researchers have analyzed and measured school
culture using instruments.
Analysis of School Culture
Collaboration, teaming, instructional coherence, professional communities, and learning,
all components of school culture, have been measured using cultural survey instruments.
Although these surveys have various levels of validation, the authors of these surveys have
connected culture to influence on school performance. Lee and Smith (1996) selected specific
questions from the National Educational Longitudinal Study to measure the collective
responsibility of teachers in a school. Another group of researchers (Newmann, et al., 2001)
attempted to measure instructional program coherence using a self developed survey. Hord
(1997) developed a survey attempting to measure school cultures focused on PLCs. Wells and
Feun (2007) modified Hord’s instrument by using only 16 questions to measure culture of
schools attempting to become PLCs. Olivier and others (2003) also modified Hord’s instrument
by adding an additional element and increasing the question length to 45. For his studies,
Gruenert (2000, 2005) used a survey based on six elements of a school collaborative culture.
Some surveys were as small as five questions (Goddard, et al., 2007), and others as large as 88
(Lee & Smith, 1996).
34
Only a few authors addressed the statistical validation of their survey instruments. Some
authors made inferences about student achievement, teacher perceptions, cohesiveness, and
school operations, and how culture influences these areas. Observing culture through surveys has
provided a means for researchers to compare a perception held by the school with some factor of
school design, and then to draw conclusions about the influence of that school design on the
school perception. Many surveys have been developed with only that author’s definition of the
concept, thus neglecting other definitions of the same concept. Some researchers have measured
the culture of a school based on the survey creator’s elements, but the school is implementing
another author’s different definition. A specific reform that is focused on cultural change is
PLCs. Although many instruments exist to measure culture, only a few measure PLCs.
Measures of Professional Learning Communities
Among the many instruments that measure the culture of schools (e.g., Goddard,
Goddard, & Tschannen-Moran, 2007; Gruenert, 2000, 2005; Lee & Smith, 1996; Newmann,
Smith, Allensworth, & Bryk, 2001; Supovitz, 2002; Wells & Feun, 2007), an extensive review of
the literature revealed only two specifically measure school cultures of a PLC. Founded around
her five elements, Hord’s (1997) instrument was 17 questions in length and had only one known
validation, which was conducted in 1998 by a separate organization. Another existing survey,
although a modified form of Hord’s instrument, was Huffman, Hipp, and Oliviers’s (2003)
PLCA. The PLCA is 46 questions in length, and was based on Hord’s (1997) five elements.
Some statistical validation of the PLCA was conducted, although only alluded to in the literature,
which produced an acceptable level of validity and reliability. Williams, Matthews, Stewart, and
Hilton (2007) recently created the LCCI as an instrument that measured PLCs based on ten
common elements that were identified in the scholarly and authoritative literature on PLCs.
35
Overview of School Reform
In the next section, we present a review of the literature on school reforms and how the
reforms led to the emergence of PLCs. The first section addresses the idea of community, and
how schools reformed to develop cultures of community.
School Reforms as Communities
From the origins of free public education, schools have been the proving ground of
intended change or reform. Common schools reformers such as Horace Mann, Francis Parker,
and John Dewey began in the middle to late 1800s pushing for standardization of education and
public control (Lubienski, 2001). Mann’s push for a free education of children was guided by his
desire to increase the value of labor (Gelberg, 1997). By 1900, two different philosophies of
education were present: an agenda of pro-efficiency modeled after the business trends of the day
and “decentralized schools organization” (Gelberg, 1997 p. 13) with a focus on the individual
student. Progressivists encouraged democratic ideals as a means of diffusing education among
the masses. “The basic principle of democracy was that every individual be counted and treated
as a person” (p. 54). Common schools and their availability to all children were then encouraged
to develop democratic principles of administration and operation. One democratic ideal of the
common school reformers was to view schools as communities, and functioning as a community
would later become an essential element of the PLC reform.
As schools functioned as communities, the culture of the organization changed.
Organizational reforms influenced how schools were viewed and provided a means for changing
school cultures to learning communities. Francis Parker was described by researchers (e.g.,
Smith, Vaughn, & Ketchum, 2001) to have considered common schools as “communities where
everyone is engaged in the educative work. . . that is best for the individual and the whole of the

36
group” (p. 297). Parker (1894) described public schools as a place where schools “shall work
together under the highest and best conditions in one community” (p. 420). This focus would
later become prominent as schools united to work together as learning communities.
John Dewey (1900) saw schools as communities where an “embryonic society” (p. 32)
could grow. John Dewey believed that schools were a social institution and that education was a
fundamental process of social progress and reform (Cremin, 1988). The idea that schools
function as cohesive units fostering productive and future citizens was a new idea to many
educators. The historic traditions of the one-room schoolhouse where teachers disseminated
knowledge were beginning to be challenged. Ella Flag Young, a colleague with Dewey,
expanded on the idea of schools as a community in her dissertation, Isolation in the School. She
addressed separation and isolation among school levels and that there needed to be tailored
approaches and support for individuality within the community (Smith, et al., 2001). She stated
that there needed to be “differentiation within a recognized unity” (Young, 1900, p. 13) rather
than an involuntarily forced combination of various levels and people. Young connected the
sense of community with an individualized and purposeful approach to the learning. However,
there was more than just having the harmonious sense of community in a school to teach
students.
This philosophy of schools acting as communities did not transfer to a more unified
practice by teachers and students focused on learning until the early 1970s. It was then that
educational reformers began to see schools as communities where there was a focus on learning
not only from the students but also from the teachers. Richard Graham (1972) presented the work
conducted by the Wisconsin Research and Development Center for Cognitive Learning in which
schools were divided into sub units called learning communities. In these schools, students had

37
Individualized Guided Education plans that were directed by learning communities of teacher
teams. The attention was on the learner rather than the curriculum. Teachers were also expected
to continue learning through staff development and shared interdependence. Graham’s (1972)
view of teacher learning is one “which places greater reliance on their own initiative and on
cooperation rather than competition” (p. 8). This new view of community was shifting from
schools focused only on the progress of the student to a teacher ownership of learning with their
students. However, attempting to change teachers and schools from the traditional isolationism
that permeated cultures of schools was difficult. This type of large-scale organizational shift in
culture became a prevalent focus after the 1970s.
This review has presented an overview of school community and reforms focused on
changing school culture. The interest in changing school cultures has roots in a modern reform
movement to promote change. The following will focus on the failures of school reform and
frame where the PLC models began to be utilized.
School Reform Failures
As the promotion of reforms had grown, so did the reasons for failure of reforms
(Elmore, 1996; Hopkins & Levin, 2000; Leithwood, Jantzi, & Mascall, 2002; McCombs &
Quiat, 2002). A specific failure in urban school reform found that school districts lacked an array
of resources. Specific reforms did not bring the measurable effects predicted by their more ardent
supporters, and the reform effort lacked civic capacity (Datnow, Lasky, Stringfield, & Teddlie,
2006). Programs such as Success for All and New American School were labeled as failed efforts
in their attempt to initiate school-wide reform models (Pogrow, 2002). Leithwood and associates
(2002) found in five case studies of large-scale change efforts that there were no gains in student
achievement. Levin and Wiens (2003) attributed disappointing results in many reforms to their

38
lack of focus on changes that were known to affect student performance in schools. Hopkins and
Levin (2000) found that reforms failed because they focused on the wrong variables, failed to
adopt a systemic perspective, and failed to pay enough attention to issues of implementation.
Educational reform policies required student improvement but failed to focus on how that would
occur. Hubberman (1992) captured this failure by stating,
By not addressing the impact on pupils, we will have indulged in the same magical
thinking as before: that adoption means implementation…that implementation meant
institutionalization…that enhanced teacher capacity means enhanced pupil achievement
or development…If changes in organizational and instructional practices are not followed
down to the level of effects on pupils, we will have to admit more openly that we are
essentially investing in professional development rather than the improvement of pupils
abilities. (Hubberman, 1992, p. 11)
Cuban (1998) found that policy-making elites gauged success in reforms based on effectiveness,
popularity, and fidelity standards, but practitioners would gauge success on adaptiveness and
longevity. This disconnect alluded to by Cuban between policy and practice was also addressed
by Elmore (2006). Elmore stated, “There is simply no way to solve the problem of large-scale
improvement in educational performance without connecting policy and practice more directly
and powerfully…schools simply cannot do what they are being asked to do without more explicit
and powerful guidance and support for instructional practice” (p. 217). Elmore also noted that
schools could not be both the cause of failure and the solution for success.
Many reforms fell short because of the lack of individuality of reforms in helping each
specific school. In many cases, reform was a generic externally derived solution attempting to fix
an internal specific problem (Hargreaves & Fink, 2006; Levin & Wiens, 2003; McCombs &

39
Quiat, 2002; Pogrow, 2002; Symonds, 2006). Moreover, most trends within a school are initiated
by one or two individuals and not invested in by the school faculty (Fullan & Hargreaves, 1996).
School faculties can have a large resistance to state-, district-, or school-level reform initiatives.
Teacher resistance is a major factor of educational reforms’ success in a school. Zimmerman
(2006) found that educator willingness or unwillingness can affect the success of a school
initiative that is attempted by the principal of a school. Simply having reforms implemented in a
school and attempting to change the work environment can create resistance among teachers
(Kelchtermans, 2005). Understanding who the resistors are and what potential resistance they
have may help find success in schools attempting change. Reform efforts have had difficulty
finding success when schools and teachers are not specifically considered when deciding what
type of reform to implement.
Glazer (2003) found that the literature is plentiful in the examination of reform efforts
and why they fail. He also called attention to the lack of research giving evidence of reforms that
have succeeded and those that are noted are more anecdotal than empirical. Are there reforms in
schools that have found success and can be supported empirically?
Although some reforms have fallen short of lasting success, there is a reform that
succeeds in many of the previously identified issues where other reforms have failed, such as
lack of individuality or lack of a connection to student learning. The learning community or
professional learning community concept is heavily gaining momentum as an effective
educational reform (Darling-Hammond, 2005; DuFour, et al., 2008).
Professional Learning Communities as Reform
In this section, we present a review of the existing problems in the literature of PLCs, the
prominent authors and researchers of the PLC reform, and difficulties in comparing existing

40
models of PLCs. We conclude this section with a presentation of common elements of PLCs
from the literature.
Defining a PLC is difficult because the concept has a universal application in many
schools, but simultaneously the term can also be unique to each school (Smith, et al., 2004).
PLCs function differently in each school as they are customized to meet the needs and culture of
the specific school (Smith, et al., 2004). PLCs are initiated, developed, and led by members of
that school’s community (Hord, 2004). Despite the individuality of each PLC, the overarching
elements are similar. Many educational researchers and practitioners have studied PLCs and their
application in schools in an attempt to understand what they contribute to education. Many
researchers and practitioners have provided different definitions and elements of PLCs, but no
one has attempted to reach consensus by combining existing thoughts into one unified idea.
Many have studied single elements and their benefit to schools extensively, but a search of the
literature revealed no comprehensive list of elements. The next section will present the most
prominent authors of PLCs and elements they have identified as comprising PLCs.
Authors and Elements of Professional Learning Communities
This section will focus on five authors of PLCs: Senge (1990), Kruse and Louis (1993),
Hord (1997), DuFour and Eaker (1998), and Blankstein (2004). We present each of their
defining elements of PLCs.
Senge (1990) described five different elements of a learning organization: shared vision,
mental models, systems thinking, personal mastery, and team learning. As one of the first to
promote learning organizations, Senge provided a foundation for multiple types of organizations
to grow together in how they learned and operated in their respective fields. The concept of team
learning was unique and provided a model for organizations to unite in a common effort to
41
accomplish a similar goal. He and his colleagues eventually connected these elements to schools
and described how they functioned that setting in his work, Schools that Learn (Senge, et al.,
2000).
Shortly after Senge’s work was published in 1990, two educational researchers produced
similar ideas in what they termed “professional communities.” In 1993, Kruse and Seashore-
Louis provided an introductory view of what they considered elements of PLCs. The elements
were divided into two larger areas, internal structures and organizational factors. Reflective
dialogue, deprivatized practice, collaboration and shared work, normative control, and
socialization of new professional members were elements of internal structures. The
organizational factors were school size, principal leadership, and trust. No other author
specifically mentioned trust as a single element, which we will present later in this review as
important to organizational success. Much of the supporting research by Little (1990), Darling-
Hammond (1990), Fullan (1992), and Talbert (1991) was similar to later works by Hord (1997)
and DuFour (1998), but they did not cite the work of Senge (1990), which other authors of PLCs
considered foundational.
Although Kruse and Louis’s (1993) initial presentation of elements was not as developed
and refined as in their later work, their original PLC elements remained consistent throughout the
rest of their work (Kruse, Louis, & Bryk, 1995). Kruse and Louis’s work is considered to be
foundational research because it was one of the first works to apply learning organizations to
education and because of its contribution to PLC literature, despite other researchers working
with either Kruse or Louis in further research of professional communities (Bryk, Camburn, &
Louis, 1999; Kruse, et al., 1995; Louis, Marks, & Sharon, 1996).

42
Hord (1997) presented five elements that defined PLCs in schools: namely, shared values
and vision, supportive shared leadership, shared personal practice, supportive conditions (which
included physical conditions and people capacities), and collective creativity. In comparing the
different authors of PLC research, Hord’s supportive citations included work from Senge (1990),
Louis and Kruse (1995), McLaughlin and Talbert (McLaughlin & Talbert, 1993), and Fullan
(1993), thus showing what research was considered as foundational for her work.
According to Google (2009) scholars cited by numbers, DuFour and Eaker (1998)
published one of the most heavily cited PLC texts to date in which they presented six elements:
shared mission, vision, and values; collective inquiry; collaborative teams; action orientation and
experimentation; continuous improvement; and results orientation. Unique to DuFour and Eaker
at the time was that their elements began to focus specifically on improving student learning.
Alan Blankstein (2004) identified six elements that had some similarities to others, and
he presented a new element that had not previously been stated. His six elements were common
mission, vision, values, and goals; ensuring achievement for all students with systems of
prevention and intervention; collaborative teaming focused on teaching and learning; using data
to guide decision making and continuous improvement; gaining active engagement from family
and community; and building sustainable leadership capacity. Of all the other contributors of
PLC elements, Blankstein was the first to specifically mention the use of data-based decision
making. He was also explicit in describing collaborative teaming that is focused on teaching and
learning, and ensuring achievement by using systems of prevention and intervention. He was
also alone in listing family and community involvement as an element, which is not addressed by
other authors.

43
These identified experts of PLCs provided multiple conceptualizations of PLCs.
Although there were some similarities among the defining elements, there was no consensus
presented by a single author. Without a common conceptualization of PLCs, there were
difficulties in utilizing the claims of this reform.
Rationale For a New Professional Learning Community Model
A difficulty with having multiple conceptualizations of professional learning
communities is identifying and documenting a school’s level of development as a PLC. Some
educators in schools might declare that they are a PLC, but they have no implementation of any
PLC elements that are in the literature. Other educators might be implementing PLC elements in
schools and not calling themselves a PLC. In order to determine the influence of PLC elements
in a school, these educators must determine if PLC practices are present at the school (DuFour,
2007). If measured at all, the presence of such elements has been identified using a survey
instrument such as the one developed by Hord (1997). However, most current professional
learning communities cannot be fully assessed with the Hord instrument because they are
employing different elements than those developed by Hord. Hord’s instrument contained five
sections consisting of her identifying elements:
The collegial and facilitative participation of the principal who shares leadership (and
power and authority) and decision making with the staff (with two descriptors); a shared
vision that is developed from the staff's unswerving commitment to students' learning and
that is consistently articulated and referenced for the staff's work (with three descriptors);
learning that is done collectively to create solutions that address students' needs (with five
descriptors); the visitation and review of each teacher's classroom practices by peers as a
feedback and assistance activity to support individual and community improvement (with

44
two descriptors); physical conditions and human capacities that support such an operation
(with five descriptors). (SEDL, 2009)
The five constituent elements of Hord’s instrument were Hord’s identifying elements of a PLC.
Ten Elements from Williams, Matthews, and Stewart (2007) of Professional Learning
Communities
In determining a list of PLC elements, Williams, Matthews, and Stewart (2007) reviewed
those authors who had published lists of PLC elements. The five PLC models that were reviewed
previously were the most prominent in the field of school reform using PLCs. Although other
authors have also written on PLCs, Senge, Kruse and Louis, Hord, DuFour, and Blankstein were
foundational and the most prolific in researching, writing, and disseminating the PLC models
nationwide. Other authors (Darling-Hammond & Bransford, 2005; Fullan, 2005; Huffman &
Hipp, 2003; Newmann & Wehlage, 1995; Stoll, et al., 2006) have written on PLC reform, but
they have thus far provided no new identifying elements.
Using the five foundational models, Williams, Matthews, and Stewart (2007) created a
list of elements that were common among the five models. They also developed other elements
from established practices and observations in the field. The ten elements are summarized as
follows:
1. Common Mission, Vision, Values, and Goals That Are Focused on Teaching and Learning
A mission provides the foundation for creating a vision by defining the school’s core
values and creating goals in accomplishing the vision (Matthews & Crow, 2003). A vision is also
a “persuasive and hopeful image of the future” (Bolman & Deal, 1997, p. 315). Some theorists
believe that vision is limited only to the leader (Senge, 1994), however in creating a common
sense of purpose, vision can unify organizations to help reach desired goals. Many of these

45
theorists have written on the importance of having a vision for the organization (Deal &
Peterson, 2000; Eastwood & Louis, 1992; Hoyle & Cornish, 2006; Lipton, 1996).
Stiggins (2004) suggested that schools in the U.S. have a new common mission as result
of NCLB standards that all children must succeed in learning. He also claimed that despite
having a common mission under a legislated act educators need to have a shared and common
mission and vision developed by the faculty. In their study of the effect of professional
communities on the classroom, Louis and Marks (1998) found that schools needed to have a
“shared sense of purpose” (p. 545) in which consensus exists among the faculty of what the
mission of the school is and how it is operationalized.
Although many theorists have promoted the need for having a vision and mission for an
organization and school, empirical evidence supporting the influence of these statements on
student performance is lacking (Weiss & Piderit, 1999). An additional concern is the variability
in the mission statements among schools. Some missions may focus on self-esteem of the student
while others focus on student learning. In their study of 304 mission statements in schools, Weiss
and Piderit (1999) found evidence that mission statements can influence student performance.
They discovered that when a mission statement specifically mentioned student learning, there
was evidence of improvement. They also found that when mission statements focused on self-
esteem of students math achievement scores increased. A troubling conclusion they came to was
that schools that included the phrase “all children can learn” in their mission statements actually
had a negative impact on student performance. The limitations presented in their study revealed
that no information as to how the mission was developed or implemented in the school was
collected.
2. Decision Making Based on Data and Research.

46
Research indicates that when teachers use data and research to inform their instructional
practice, student learning improves (DuFour & Eaker, 1998; Halverson, Grigg, Prichett, &
Thomas, 2005; Stiggins, 2004; Wall & Rinehart, 1998). In their case study of a school on
academic probation, Krajewski and Parker (2001) observed that as the teachers began to
disaggregate standardized test data and focus on deficiencies, they began to encourage and
support students to engage in their own learning and accept responsibility for their own quality
of work. This test data disaggregation eventually led to the removal of the academic probation
that was placed on the school. Lewis and Caldwell (2005) wrote that evidence-based practices of
school leadership were difficult, and that “the challenge for leaders is to collect and report data
and be able to internalize it at the right time for the right reasons and for the right students” (p.
182). These researchers also reaffirmed the need for leaders to create and sustain learning
communities that focus on a dramatic shift in decision making and their teachers’ investment in
research and experimentation. Halverson and Thomas (2007) stated, “Schools and districts have
faced growing pressure to use data for improving student learning. These pressures have come
from the high-stakes accountability requirements of NCLB and from research supporting the use
of data-based decision making” (p. 19). The potential benefits from this focus and pressure could
help identify students before they fail and perhaps change how educators view teaching and
learning. According to Blankstein and DuFour, using research and data-based decision making is
crucial in facilitating collaboration, participative leadership, and guiding instructional decisions
3. Participative Leadership That Focuses on Teaching and Learning Many researchers believe that in professional learning communities, teachers participate
in making decisions relating to teaching and student learning in substantive ways (DuFour, 2001;
Hord, 2004; Louis & Kruse, 1996). Spillane (2005) defined leadership as an organizational

47
quality rather than an individual attribute. He also classified leadership as a product of
interactions between leaders, followers, and situations.
Democratic leadership, teacher leadership, distributed leadership, school leadership,
collective leadership, and teacher empowerment are terms that are often used synonymously to
describe the practice of involving teachers in the decision-making process within a school’s
framework (Cameron, 2005; Clift, Johnson, Holland, & Veal, 1992; Hart, 1996; Spillane, 2005;
Spillane, Halverson, & Diamond, 2001). The term “participative leadership” used by (Smylie,
Lazarus, & Brownlee-Conyers, 1996) encompassed the broad spectrum of teacher leadership. In
their study, these researchers found that “school-based participative decision making” (p. 194)
was not effective unless part of systemic wide reform of curriculum and instruction. Smylie and
his colleagues also found that this type of decision making at the school level was dependent
upon frameworks, training, and professional development established by the district. Other
researchers (Blase, Blase, Anderson, & Dungan, 1995; Heller & Firestone, 1996). have
addressed the importance of teacher leadership and its benefit to schools.
In building a PLC, teacher leadership is fundamental. DuFour and associates (2008)
stated, “Individual leaders must have allies if they are going to establish and pursue a new
direction for their organization” (p. 123). Louis, Kruse, and Marks (1996) found that professional
communities prosper in schools that are flexible in the decision-making process with
instructional issues, such as school-based decision making versus top-down mandates. Hord
(1997) admitted that teacher leadership was not a new factor in school change efforts to become
a PLC, but an essential one. As seen in the literature, empowering teachers to become agents in
the direction of the school will provide added strength to the development of a culture of
learning.

48
4. Teaming that is Collaborative Teams can function in many different ways, such as planning school parties, making
school governing issues, or aligning instructional practice of teachers similar in content or grade.
Interdependence is a collective ideology held by members of a school faculty that is establishing
a learning community, but it is through teaming that the belief becomes action. The
collaborations of the team have the greatest influence for improvement in classrooms and the
school (Goddard, et al., 2007).
Many reforms that involved teaming within schools have found success in student
learning. Newman and colleagues (2001) found that school improvement efforts that focused on
instructional program coherence had increased student performance. Other successful reform
efforts studied by other authors (Cooper, Ponder, Merritt, & Matthews, 2005) attributed their
success, in part, to aligned curriculum within regular department meetings. Another study (Hunt,
Soto, Maier, Muller, & Goetz, 2002) found that providing increased social support for students
with teams that had a unified support plan found greater academic success for severe special
education students. Stewart and Brendefur (2005) observed that teams that focused on improving
day-to-day instruction using lesson study were more willing to take risks with lessons and open
their instructional practices to the team. Supovitz (2002) stated that “the success of teaming
therefore appears to depend on its ability to not be merely an organizational or structural reform
but one that promotes and supports changes in how teachers teach” (p. 1599). After accounting
for demographic characteristics, Supovitz also found that students of teachers who were on teams
with higher use of group instructional practice did better than students of teachers who were on

49
teams with low levels of group instructional practice. He also identified three attributes in
teacher teams whose instructional practice influenced student performance: First, they prepare
for instruction collaboratively; second, they teach each other; and third, they group students to
take advantage of strengths of team members and small group instruction. Goddard and his
colleagues’ (2007) work on the affects of collaboration on student achievement showed that
teacher collaboration for school improvement was significant as a positive predictor of
differences in student achievement among schools. In schools attempting to implement PLCs,
Well and Feun (2007) saw a major shift in each school as teachers began to collaborate in
instructional teams who taught the same content.
Many PLC authors attested to the essential function of teaming in their identifying
characteristics. Senge (1990) listed team learning, Louis and Kruse (1993) identified teaming as
collaborative-shared work and reflective dialogue, Hord (1997) identified collective creativity
and learning as teaming functions, and Blankstein (2004) explicitly identified an element as
collaborative teaming focused on student learning. Teaming is a necessary structure and action
the school takes to help focus on the learning of students.
5. Interdependent Culture That Sustains Continuous Improvement in Teaching and Learning Principals, teachers, aides, students, and parents are all actors within a school culture, but
how they interact is the critical piece toward building a positive culture (Peterson & Deal, 1998).
A positive culture in this review is the interdependence of key actors within a school culture as
they focus on improving student learning. Senge (1990, 1994) termed this element of
organizational learning as system thinking or thinking that “encompasses a large and fairly
amorphous body of methods, tools, and principles, all oriented to looking at the interrelatedness
of forces, and seeing them as part of a common process” (p. 89). Lee and Smith (1996) termed
50
this interdependence in schools as a collective responsibility among the faculty for student
learning. They described it as how teachers define their work; how they interact with students,
teachers, and superiors; and how they control their work. Lee and Smith (1996) claimed that
teachers must have shared norms that specifically focus on learning. They stated, “Cooperation
among teachers makes schools both more effective and more equitable environments” (p.131).
Lee and Smith found that in schools that had high levels of collective responsibility across the
entire faculty, students learned more in all subjects. Gruenert (2005) reported that collaborative
school cultures have elements of interdependence such as joint work, mutual support, and
agreement on educational values. He went on to find that the more collaborative the school’s
cultures the more likely they were to have higher student achievement.
Gajda and Koliba (2007) addressed the idea of interdependence as a form of intra-
organizational collaboration by stating that “the individual members of a social learning system
share common practices and work together to achieve mutually desired outcomes” (p. 27). They
also described intra-organizational collaboration as interpersonal practitioner collaboration. In
professional communities, Louis and Marks (1998) characterized the idea of interdependence as
deprivatized practice. They identified deprivatized practice as openness of one’s practice to
observation, scrutiny, and analysis. When teachers share strategies with one another, they can
become experts together (Bryk, et al., 1999). DuFour, DuFour, Eaker, and Many (2006) claimed
that members of a PLC cannot accomplish high levels of learning without the culture of the
school functioning collaboratively. Hord (1997) labeled this type of interdependence focused on
teaching and learning as shared personal practice. Sharing personal classroom practices with
other teachers allows for a review of behaviors that help foster or create a community of learners.
51
6. Academic Success for All Students with Systems of Prevention and Intervention Success for students is the goal for schools, but how does a school achieve the goal that
all students can learn? In their studies of high performing high schools, Cooper and associates
(2005) found that when schools had an open principal and aligned curriculum, the school
focused on student success and shared the credit when success was found. In schools serving at
risk students, Buxton (2005) showed how one school was able to form new identities of
institutional culture collectively that ensured success for students. Buxton claimed that focusing
on student success was not enough. He proposed that educators in these schools focus on
students who were not learning and then address the reasons these students were not learning so
that measures could be taken to prevent the failure (Blankstein, 2004; DuFour, 2004). DuFour
and associates (2008) concentrated on the need for educators to provide systematic interventions
for student who were at risk for failure. These experts stated that teachers that were functioning
in collaborative teams with common assessments and pacing would be more effective in their
interventions than teachers who do not. If educators want to ensure achievement for all students,
they must have a strategy that is uniform throughout the school that encompasses all types of
learners and a plan to help those that need extra help (Blankstein, 2004).
7. Professional Development that is Teacher Driven and Embedded in Daily Work In creating a quality teaching force, many policy makers began to focus on teacher
preparation and retention. Historical policies had used professional development as a means of
mediating and maintaining quality (Cohen-Vogel, 2005). Many of the professional development
events were “one-shot” workshops and failed to provide knowledge and skills to teachers over
the life of their careers (Darling-Hammond, 2005). Moreover, teachers did not develop sufficient
knowledge and skills from these workshops to solve the problems they will surely encounter

52
when they attempt to implement newly learned practices into their classroom instruction
(Bredesen, 2003). Thus when they encountered these problems and had no one to help solve
them, many teachers retreated to their tried, and true practices. Darling-Hammond reported what
other countries such as Japan and Germany did to provide increased time and pay to help
teachers constantly refine their practice with other teachers. These reforms have proven
successful for many of those countries. However in the U.S., Elmore (2006) described
educational reforms “post-Nation-at-Risk period,…was largely done to, rather than done with
educational professionals” (p. 215). Darling-Hammond, Bullmaster, and Cobb (1996) claimed
that in professional development schools or other restructuring schools, they “can offer organic
forms of professional leadership that develop intrinsically in connection with systemic
organizational change within a school” (p. 103). They also claimed that teacher leadership was
essentially connected with teacher learning. Bredeson (2003) described professional
development in PLCs by stating,
In contrast to more traditional work settings where professional improvement is
individual and oftentimes completely unconnected to the learning and work of others, in
professional learning cultures educators share knowledge through dialogue, consultation,
reflective processes, and joint work. These processes help to reinforce explicit values
around learning, strengthen individual and collective understanding of practice, and
contribute to organizational improvement. (p. 24)
Smylie (1996) also found that the greatest learning opportunities for principals and teachers are
embedded in their daily work and are linked to the priorities and context of the school’s
improvement efforts. Additional educational theorists (Glickman, 2002; Lambert, 2003; Roberts
& Pruitt, 2003; Sparks, 2005; Zmuda, Kuklis, & Line, 2004) remarked that leadership by
53
teachers within schools focused on reform efforts and professional development opportunities
can influence the school for change.
Teachers collaborating in instructional teams to improve student learning provides a rich
context for job-embedded professional development (Bredeson, 2003; Smylie, 1996). As they
interactively work to identify and solve instructional problems, teachers bring their first-hand
experience to bear on finding solutions. This first-hand knowledge is laden with knowledge and
skills of practice that may be new to other team members. As they incorporate this shared
knowledge into instructional solutions, teacher teams work collectively to adapt that knowledge
and new skills to meet the unique learning needs of their students. Through this iterative teaming
process, teachers expand their knowledge and develop an ever-widening array of pedagogical
skills to meet the learning needs of their students.
8. Principal Leadership that Is Focused on Student Learning Eilers and Camacho (2007) found that if a principal is proactive in developing a culture
of change and focused on student learning, the organization’s learning increased. Murphy (2001)
recommended a reculturing in the field of educational leadership to focus on “the centrality of
teaching, learning, and school improvement within the role of the school administrator” (p. 15).
Heck (1992) reaffirmed the importance of the instructional leadership role of the principal in
determining student achievement. From observing the characteristics of principals who improved
student reading scores, Mackey and associates (2006) found that those who understood their role
as instructional leaders had a greater impact on student achievement in reading. O’Donnell and
White (2005) indicated from their findings that principal behaviors focused on improving school
learning climate were predictors of student achievement. Marks and Printy (2003) discovered
that when instructional leadership and transformational leadership were integrated, the influence

54
on school performance was substantial. In order for a professional community to develop,
leaders needed to focus their efforts on problems related to continuous school improvement and
classroom practice (Kruse & Louis, 1993). Marzano, Waters, and McNulty (2005) stated, “The
research of the last 35 years provides strong guidance on specific leadership behaviors for school
administrators and that those behaviors have well-documented effects on student achievement”
(p. 7). DuFour and associates (2008) defined the job of a principal in a PLC as someone who
creates conditions that help adults in the school continually improve their ability to ensure
students gain knowledge and skills that are essential to their success.
9. High-Trust Embedded in School Culture Trust is considered a critical factor in any school improvement (Tschannen-Moran &
Hoy, 2000). Tschannen-Moran and Hoy found that trust facilitates productivity, and when it was
not present, it slowed progress. Regarding student learning, they also found that when a student
did not feel trust, energy intended for learning was diverted and focused on self-protection. Trust
was also essential in the implementation of many school-wide reforms, which required
participation by the faculty. When distrust was present in the school culture, the school would
not be effective in helping students. Trust was also a critical resource as leaders begin plans for
improving student learning (Bryk & Schneider, 2002). Bryk and Schneider found that in schools
with high levels of trust, students were three times more likely to improve in math, science, and
reading.
Bryk and Schneider (2002) described three types of trust: organic, contractual, and
relational. Relational trust was the most fitting in school settings where relationships were built
between principal and teacher, teachers and teachers, and teacher and students. Rather than just
an exchange of products or knowledge, building relationships was the key factor. Although the

55
principal had formalized authority over teachers, the principal remained reliant on the teachers’
joint efforts to keep the social order of the school and the reputation in the community.
Relational trust was also made up of personal regard for others. Personal regard was founded
upon interpersonal trust, which deepens as individuals perceived that others cared about them
and were willing to extend themselves beyond what their role might formally require in any
given situation.
Bryk, Camburn, and Louis (1999) also found that the strongest facilitator of professional
communities was social trust among faculties. This type of trust became a resource to support
collaboration, dialogue, and shared decision making of a PLC. Another finding presented by
Bryk and associates was that a mutual supporting relationship existed between professional
communities and social trust. Of the five PLC models presented previously, Kruse and Louis
(1993) were the only authors to list trust as an element. They considered trust as necessary in
shared decision making and collegiality among the faculty, and an essential condition in building
a professional community. While Hord’s (1997) model did not explicitly list trust among her
elements, she did define her element of supportive conditions using Louis and Kruse’s (1995)
characteristics of respect and trust.
10. Use of Continuous Assessment to Improve Learning With NCLB’s mandates and requirements, educators are to assess student learning. In his
writings about continuous assessment, Stiggins (2004) stated, “High stakes testing without
supportive classroom assessment environments harm struggling students” (p. 24). Stiggins
referred to teachers in their calling to diagnose student needs and collect continuously student
evidence-based on high quality assessment in the classroom. In a review of over 20 studies,
Black and Wiliam (1998) found that innovations of formative assessments produced substantial

56
and significant learning gains in students from the age of five to university level students.
Formative assessment occurs when teachers adapt their teaching to meet the needs of their
students from the results of assessments (Black & Wiliam, 1998). Continuous assessment created
a collective focus on student learning, which is central to professional communities by helping
faculty guide their instruction to facilitate opportunities for student learning (Louis & Marks,
1998) and to refine their skills for effective teaching. DuFour, DuFour, and Eaker (2008) wrote
about continuous improvement as an “ongoing cycle of planning, doing, checking, and acting to
improve results constantly…gathering current levels of student learning…and applying the new
knowledge in the next cycle of continuous improvement” (p. 465). In Blankstein’s (2004) list of
elements, he combined both data-based decision making and continuous assessment, alluding to
the direct relationship between assessment and using assessment data to improve student
learning.
Analysis of the Professional Learning Community Literature Review
Looking at past educational reform movements and modern legislative acts, educators are
now in an opportunistic situation to focus on change that works. The pressures of Nation at Risk
and NCLB, despite their invasiveness or promotion of hysteria, highlighted a need for schools to
implement successful lasting reforms that improve all students learning. School leaders will first
need to understand the culture, past beliefs, and how people currently work together in the
school. After understanding what type of culture the school has, the school leaders can then
determine where they want to go. Using successful reforms such as PLCs may be a method for
successfully implementing reforms that do work and are helping all students learn. Nevertheless,
to facilitate the untapped potential of PLCs, there needs to be a unification of models in how
PLC characteristics function together. This unification can then provide a foundation for

57
measuring PLCs within schools and facilitating future steps in helping schools continue with that
goal. Filling this gap in the research could provide critical information for schools and leaders as
they begin to construct PLCs within their schools.
Synthesis of the Professional Learning Community Elements
Currently, if educators in a school wanted to determine if a PLC is present in that school,
these educators would first have to ask to which author of PLC elements the school adheres.
Many authors and researchers have attempted to define and list elements of a PLC. Although
many elements are distinct to a particular author, there are some similarities among elements. For
example, Hord (1997), Kruse and associates (1995), Blankstein (2004), and DuFour (1998)
included collaboration as an element of PLCs. Kruse and Louis (1993) provided the element of
trust, which is not addressed by any of the other authors.
When attempting to measure the presence of a PLC in a school based on which elements
of a PLC exist or not, educators in the school first need to be establish which model that the
school leaders are attempting to follow. For example, Wells and Feun (2007) studied
collaborative teams throughout a year after they had received training provided by DuFour and
associates (2006). However, when attempting to measure whether the schools had successfully
implemented any elements, Wells and Feun used a survey developed by Hord (1997). Hord’s
elements were different from DuFour’s elements, thus posing a problem in the analysis of the
results. The researchers attempted to measure a PLC in a school that does not adhere to Hord’s
elements of a PLC and drew conclusions that the school had not yet implemented a PLC.
According to Hord’s instrument and defining elements, the educators in the school probably had
not implemented a PLC, but perhaps, according to DuFour’s model, they had. This lack of
common elements has presented difficulties for schools attempting to measure and implement

58
strategies for improvement with the PLC concepts when there is no consensus on its defining
elements.
Creation of Common Elements of Professional Learning Community Literature
As part of the research team of Williams, Matthews, Stewart and Hilton (2007), we
conducted an extensive review of PLC literature and determined a universal list of PLC
elements. We identified ten elements based on PLC research and practice. The ten elements
encompass previous definitions and elements in the literature.
In order to determine a comprehensive list of the five authors and their elements, we
identified which elements had common characteristics. The matrix in Table 1 illustrates the
authors’ elements in comparison to the ten elements. The five authors had listed in some form
that common mission, vision, values, and goals were essential in PLCs. Two elements had
agreement by four of the five authors, interdependent culture and teaming that is collaborative.
The four areas of high trust embedded in a school culture, academic success for students with
systems of prevention and intervention, professional development that is teacher driven, and use
of continuous assessment to improve learning were similar among three of the authors. The
remaining two areas of principal leadership focused on student learning and data-based decision
making were only common between two authors. In the creation of the ten elements, we did not
include two elements of PLC that Kruse and Louis, and Blankstein had provided. Kruse and
Louis’s element of school size was an important element of school success, but, as a physical
setting, we felt it did not adhere to other instructional issues of PLCs. Similarly, Blankstein’s
element of gaining academic engagement of family and community, we also determined to be
outside the area of instructional issues related to student learning.

59
Having a common list of elements that encompasses the prominent authors of PLCs will
provide a base in which schools implementing any of the five models of PLCs can determine
levels the school may be operating within those elements. The list of ten elements that the
research team established provided the basis for the creation of an instrument that will measure
PLCs in schools. The creation and validation of this instrument will be addressed in the
following chapter. In this literature review, we have presented the importance of validity and
reliability of an instrument. We have also framed where the PLC reform has arisen and the
constituent elements found in the literature. Utilizing the findings from the literature review in
building the LCCI, we will now present the plan that was taken in the validation of this
instrument.

60
Table 1. Matrix of PLC Authors and their Identified Elements Williams, Matthews, & Stewart (2007)
Senge (1990)
Kruse & Louis (1993) Hord (1997) DuFour & Eaker
(1998) Blankstein (2004)
Common mission, vision, values, and goals
Shared vision
Socialization of new professional members/ shared sense of purpose
Shared values and vision
Shared mission, vision, and value. focus on learning (DuFour, et al., 2006)
Common mission, vision, values, and goals
Principal leadership that is focused on student learning
Principal leadership
Participative leadership focused on student learning
Facilitative leadership (Louis & Marks, 1998)
Supportive shared leadership Building sustainable
leadership capacity
High trust embedded in school culture
Mental models
Trust
Supportive conditions (relationships)
Interdependent culture
System thinking
Deprivatized practice
Shared personal practice
Collaborative culture with focus on learning for all
Academic success for students with systems of prevention and intervention
Supportive conditions (physical structures)
Results orientation
Ensuring achievement for all students with systems of prevention intervention
Professional development that is teacher driven
Personal mastery
Socialization of new professional members
Collective inquiry into best practice and current reality
Data-based decision making
Action orientation and experimentation
Using data to guide decision making Continuous improvement
Teaming that is collaborative
Team learning
Collaborative shared work Reflective dialogue
Collective creativity/learning (Huffman & Hipp, 2003)
Collaborative teaming focused on student learning
Use of continuous assessment to improve learning
Normative control/ collective focus on student learning (Louis & Marks, 1998)
Commitment to continuous improvement
Using data to guide decision making Continuous improvement (repeat)
________________________________________________________________________________________________________ Note. Does not include Louis & Kruse, 1993 “School size” and Blankstein, 2004 “Gain academic engagement from family and community”

61
CHAPTER 3
METHODS
In this study, professional learning communities have ten constituent elements or
characteristics developed by the research team of Williams, Matthews, Stewart, and Hilton,
(2007). The ten elements provided unity in identifying the elements of a PLC. As described in
chapter 2, the ten elements were identified in the literature and provided the foundation to the
LCCI. The purpose in creating the LCCI was to measure the degree to which schools were
implementing these elements. The focus of this study was to determine the validity and
reliability of the LCCI’s ability to measure both the ten individual elements of a PLC and an
overall level of PLC.
This chapter will begin with a review of the research problem and the research questions.
Following the research questions, we present the development and structure of the LCCI. We
also describe the four phase iterative process that was followed for validating the LCCI. The
chapter concludes with a summary of the methods.
Research Framework
Although many types of school reforms have emerged hoping to improve student
achievement, many reforms also failed (Elmore, 1996; Fullan & Hargreaves, 1996; Leithwood,
et al., 2002). Some researchers and writers (DuFour & Eaker, 1998; Hord, 1997; Louis & Marks,
1998) have regarded PLCs as a reform that can promote the improvement for student learning.
Although there was little evidence that PLCs as a cohesive reform have improved student
learning (Wells & Feun, 2007), researchers have demonstrated that specific PLC elements have
influenced student achievement. As PLCs have received recent attention and application in

62
educational practice and literature, the need to have a unified understanding of constituent
elements also emerged.
In this study, we provide a new conceptualization of PLCs. As reported in the review of
the literature, there was a need to unify the elements of PLCs. There was also a need to develop
and validate an instrument to measure PLCs. The ten elements identified in this study provide a
unified model of PLCs, and it was upon these ten that the LCCI was created. Having a validated
instrument to measure PLC elements will provide school leaders with critical information for
implementing PLC reform efforts and could help researchers determine which elements are
foundational and vital to the success of the PLCs. The measurement tool will provide specific
information of which elements exist in a school and at what degree the school is functioning
within the elements. This information should give school leaders direction in how to improve
implementation and on which elements to focus.
The LCCI will provide a method of assessing the influence of PLCs on student
achievement and show which elements have the greatest influence on improving student
achievement. This understanding will help principals and teachers to focus efforts on what
provides the greatest influence in helping students.
This instrument will also provide a means for researchers to empirically build the
theoretical framework of PLCs. Having a tool to study PLCs will help to provide understanding
in how PLCs function and what is their influence.
Questions Guiding the Research
The two problems this study addressed are first, lack of consensus among PLC experts
and their defining elements that make up a PLC, and second, the deficit of a validated instrument

63
to measure PLC elements that schools have implemented. The following three research questions
guided this research.
1. Does the LCCI measure unique individual elements of PLCs?
2. Does the LCCI measure an overall level of PLC?
3. Is the LCCI a valid and reliable measure of PLCs?
Development and Validation of the Structure of the LCCI
Validating an instrument is an iterative process that gathers information through
measurement processes and systematic diagnosis of the instrument. The information gained from
these processes was incorporated into the subsequent versions of the instrument. Throughout the
development of the LCCI, there was a purposeful focus on creating a valid instrument. In the
instrument development, the research team focused on content validity through the determination
of the indicators and the writing of the survey items. As a team, we gave significant effort to
capture the elements of PLCs as identified from the literature and expert opinion and to measure
accurately the implementation level within a school.
The research team decided to design a quantitative survey based on two considerations.
First, we anticipated that this instrument would be administered to hundreds of principals and
thousands of teachers. Thus, we needed an efficient way to collect, organize, and analyze the
vast amount of data. Second, we planned to use this instrument in large-scale research
anticipating that the results could be generalized to the larger population. The research team
designed the LCCI survey items by focusing on one PLC element at a time.
Development of Survey Items
Based on the identified elements and expert knowledge of PLCs, we brainstormed
possible indicators that would signal the presence of each element in a PLC school culture. For

64
example, under the element of Interdependent Culture, we developed indicators that would show
this element was present in a school. For example, in high-functioning PLCs, educators would do
the following:
Collaborate at large;
Collaborate across disciplines, grade levels, departments, schools, districts;
Collaborate informally to enhance instructional expertise;
Share responsibility for all children interdependently;
Assist spontaneously to help teachers solve problems that improve instructional practice;
Dialogue continuously to synergize thinking and share and enlarge world views
Share and expand tacit knowledge;
Work comfortably inside and outside each others’ physical, intellectual, and emotional
space;
Share expert practice continuously among members of the community of practice to
spread and create new knowledge of the practice.
These literature based PLC elements and indicators laid the foundation for the
development of the LCCI items. With the level of detail they provided, we crafted the survey
items. After identifying the indicators for each element, we then decided how to measure those
indicators.
The research team developed three types of items to ascertain the level at which schools
had implemented the ten elements of a PLC. The decision of what type of response scale to use
depended on the kind of information each survey item required. For example, the following item
required a frequency response: How often does your department or grade level instructional
team meet to collaborate on improving teaching and learning? This next example required a

65
percentage response: What percent of your instructional goals are derived from multiple sources
of data? The following item required response indicating the degree of agreement: I help make
school-wide decisions that relate to teaching and learning.
In order to measure the three different types of survey items, we used three types of
response scales. Initially a 6-point Likert scale that consisted of “Strongly Agree” to “Strongly
Disagree” was selected. No middle or neutral value was provided. Although in some questions, a
“Does Not Apply” was provided.
The second type of response scale was a percentage scale used to measure the percent of
the time a teacher or team would be involved in the activity identified. The initial break down of
percentages was in increments of 25% (i.e., 0%, 25%, 50%, 75%, 100%).
The third type of response scale was a binary scale that was used to determine the
presence or absence of an attribute using a yes and no response. These types of items asked such
things as whether teachers were placed on a team or whether the school had a written mission
statement.
The point of view from which a survey item is written is an important consideration. The
research team considered writing items from the third person point of view of how individuals
viewed the school as a whole such as, Faculty members are comfortable seeking advice from one
another on instructional problems. However, this item could also be written from a first-person
point-of-view of how individuals personally experienced the culture, for example: I feel
comfortable seeking advice from colleagues to solve instructional problems. We concluded that
writing the items as statements from the first person perspective would give us a more accurate
reading of the whole school. A statement from the first person perspective provided what each
individual teacher perceived. Thus, collecting all teachers perspectives, we could then compile a

66
school perspective rather than asking what the teacher’s perception was of all members of the
school.
To narrow the selection of items and refine the items that would be used in the LCCI, the
research team analyzed each item with the following guidelines:
• Was the item clear, specific, and readable?
• Did the item lead the respondents to answer in a certain way?
• Did the item address only one indicator?
• Did the item actually measure the selected indicator for the target PLC element?
Using these guidelines, we refined the items to assess more precisely the specific indicator. To
make our final choice of questions and address issues of content validity, we asked a PLC expert
who was not affiliated with the research team to cross check our work. This expert analyzed our
preliminary list of questions through the same guidelines and offered suggestions for further
refinement. From this evaluation, we selected the final LCCI items and prepared for the formal
validation process. The final structure of the LCCI included 65 items with approximately six to
seven items per element.
At this point in the development of the LCCI, the research team had focused on the
content validity internally by purposively selecting and refining items and externally by having
an outside expert analyze the items. In order to conduct a more formalized process of
determining the face, content, construct, and concurrent validity, we went through three phases.
Because the validation process was cyclical, information gleaned from each phase informed and
guided the next phase. The purpose in identifying these phases was to provide a structure for
reporting corresponding results for each phase. In the following three phases, we will present the
processes that provided results to inform the next revision to the LCCI, the types of validity
67
focused on, and within each phase the specific criteria that we defined as acceptable levels in
validating the instrument.
In phase 1, we conducted cognitive interviews and written critiques. Within this phase,
we addressed elements of content and face validity. In phase 2, a pilot study was conducted.
Within this phase, we presented how content and construct validity were addressed through
factor analysis and estimates of reliability of the instrument. Phase 2 also addressed concurrent
validity of the instrument by evaluating two measurements of PLCs through the piloting of the
instrument. Depending upon what was learned in the first two phases, the information provided
guidance and rationale for conducting a third phase of the development and validation of LCCI.
Phase 1: Cognitive Interviews and Written Critiques
In order to refine the structure and items selected in the LCCI and address issues of face
validity, the research team conducted cognitive interviews. Cognitive interviews are a technique
used in developing survey questions through verbal interviews of individuals reading the
questionnaire (Willis, Royston, & Bercini, 1991).
We conducted cognitive interviews with eight K-12 teachers, half of whom were from
schools whose principals had participated in the BYU Principals Academy and half of whom
whose principals had not participated. The cognitive interviews were taped and conducted with
individual teachers using the following procedures. Teachers read and answered each item while
one of the researchers noted the time it took to read and answer the question and the other
researcher asked the teacher his or her understanding of the question. Questions that the
participant found confusing or unclear were flagged to be rewritten. Teachers also offered
suggestions for refining the questions. This process was repeated for all questions in the LCCI
making the cognitive interviews last an average of two hours. Results from the interviews
68
provided suggestions for refining semantics and structural organization of the questions. The
feedback from the participants helped to gauge whether the items appeared to measure PLC
implementation, thus addressing the area of face validity.
Next, we solicited written critiques of the LCCI to 19 K-12 teachers; half of these
teachers had principals who had participated in the BYU Principals Academy and half of these
teachers with principals who had not participated. The teachers were provided a paper version of
the LCCI that included areas for respondents to write comments and critiques of each survey
item. To help guide the participants’ reflection, three statements were provided to the participant
in the comment boxes: the question does not address the attribute, the question needs to be
reworded, and the question could be eliminated. The teachers took the LCCI, provided written
critiques of each test item, and reflected in writing on their overall feelings about the instrument.
The written observations and critiques provided documented suggestions for improving the
survey while addressing the area of face validity.
Phase 2: Pilot Study
In order to formally analyze the content and construct validity of the LCCI as we had
refined it based on phase 1, we conducted a pilot study. Within the pilot study, I analyzed the
results using factor analysis and reliability measures. The data from these processes provided
information to help assess the structure and content of LCCI. In order to determine the
concurrent validity of the LCCI, specific schools were selected to participate in the pilot study
based on an expert assessment of the level of development of PLC at the school.
School Selection
The research team selected the pilot group from possible schools with principals who
have attended or were currently attending the BYU Principals Academy. We randomly selected

69
15 schools using a random number generator after stratifying for three different levels of PLC
implementation. The directors of the BYU Principals Academy are experts in PLCs and have a
combined 20 years of experience in researching, writing, and teaching about PLCs. The directors
determined the school’s level of PLC implementation as either an emerging, medium, or high
level of PLC development. Their decisions were based on the directors’ involvement with each
school, its principal, and the schools’ length of time involved with PLC.
Missingness Rates
The pilot of the LCCI was administered at each of the fifteen schools. The surveys were
given in a paper format to each teacher during a school faculty meeting. So as not to influence
responses on questions related to principal leadership, the principal and assistant principals were
asked to leave the room while teachers were given the survey. An incentive was given to those
teachers who chose to take the survey. The rates of missingness were calculated for all fifteen
schools. The criteria established in meeting issues of validity would be a low missingness rate.
The definition we determined in meeting the missingness rate criteria, and taking into
consideration that the first survey allowed for branching, item skipping, and selections of “not
applicable,” was 40%. We calculated the rate of missingness by dividing the number of partially
completed surveys by the total number of surveys submitted.
Structural Analysis
The process to address issues of content and construct validity was the analysis of the
structure of the LCCI. The analysis included three areas: Exploratory factor analysis (EFA),
confirmatory factor analysis (CFA), and estimates of reliability (internal consistency) among the
survey items. Using two procedures, EFA and CFA, we determined benchmark levels of validity
among the conceptual constructs in the survey and tested the conceptual model upon which the
70
LCCI was designed. The EFA was used as a precursor to the CFA allowing the exploration of
the structure of the measurement before confirming the structure. CFA was chosen because it
provided a method to confirm the conceptual model upon which the LCCI instrument was
designed. Based on the conceptual model that each of the constructs of the LCCI measure unique
elements within the school, we determined the EFA and CFA would test that each observed
variable loads uniquely onto a latent variable or construct of a PLC solely (see Figure 1).
Exploratory factor analysis. The EFA was conducted by first evaluating each element’s
loadings and Eigenvalues. Principal Component Analysis (PCA) and Eigenvalues were
calculated using the statistical program SPSS. Observing how each element performed in the
component analysis, helped to inform the model to be tested in the CFA and provide
understanding with the results of the models. We then evaluated the overall structure of the LCCI
using a maximum likelihood analysis and rotational method. The criteria we determined that
needed to be met within the first pilot study analysis began with the conducting of the EFA. The
first criterion within the EFA was that ten unique factors (also referred to as elements in this
study) would emerge from the analysis indicated by the item loadings on single factors.
The second criterion would be that all items of the survey loaded onto one overall factor.
Definitions in meeting these criteria would be acceptable when we observed loadings that were
extracted using a PCA greater than .400 for individual elements. In loading all items onto one
overall factor, we considered an acceptable loading to be greater than .300. Pattern matrixes were
created using Maximum Likelihood extraction methods. Any factors with multiple item loadings
greater than .400 onto two or more factors were not considered acceptable.

71
Figure 1. Conceptual model of the LCCI
72
Another definition in meeting the criteria within the EFA was the number of factors that
had Eigenvalues greater than 1.0. If more than one factor had Eigenvalues greater than 1.0, there
might be evidence of items loading onto multiple factors. We defined an acceptable Eigenvalue
measure as the presence of only one factor with an Eigenvalue greater than 1.0.
Confirmatory factor analysis. The CFA was conducted using the SPSS SEM software
program AMOS. We began by building individual models for each element and comparing the
fit indices. Using the EFA as a prelude to the CFA guided the building of models and the
interpretation of results that we observed. After building individual models, we then built a first
order model comparing all elements together. A second order model and bifactor model were
built to test the larger structure of the LCCI.
The criterion we determined, which needed to be met within the models we tested in the CFA,
was that the models represented a good fit of the data. The CFA tested the models that we had
created based upon the results from the EFA. Measures of fit were calculated for three different
models. The first model was a first order model testing the hypothesis that each item loads
uniquely onto the factor (or element). The second model, which was a second order model, tested
the hypothesis that each factor loads onto an overall factor of PLC. The third model tested both
models simultaneously in a bifactor model. The levels of acceptance in meeting the criteria were
measured from three fit indices: the Normed Fit Index (NFI), Tucker Louis Index (TLI), and
Comparative Fit Index (CFI). The Root Mean Square Error of Approximation (RMSEA) was
also calculated to determine the estimates of error among the models. The definitions that we
determined as good measures of fit were values greater than .80. Any value less than .05 for
RMSEA was also considered good. Another measure of fit is X2, although it is inflated by sample

73
size and often used for other purposes such as nested models. X2 is reported in this study, but
other fit indices are more reliable (Brown, 2006).
Reliability. We were able to measure the internal consistency of each survey elements’
corresponding items using Cronbach’s alpha. The evaluation provided a measure of reliability
among the items in capturing consistency among each element’s items. The criteria needed in
meeting issues related to reliability were to have high levels of internal consistency among the
survey items. Internal consistency was measured using Cronbach’s alpha. A good measure of
reliability would be a value close to 1.0 with 1.0 being perfect internal consistency among the
items and 0 having no level of internal consistency. The definition of good reliability that we
utilized in this study was values greater than .80. Cronbach’s alpha was calculated for both the
overall survey and each element. Cronbach’s alpha was calculated using the statistical software
program SPSS.
Concurrent Validity
Concurrent validity was assessed by comparing the average LCCI responses for the three
levels of schools identified by the directors. The results were analyzed using an Analysis of
Variance (ANOVA) procedure of the different PLC levels that were identified by the directors of
the Principals Academy. The ANOVA procedure used was a General Linear Model (GLM),
which provided information as to whether the three levels identified by the directors were
significantly different from each other. The GLM provided a means of comparing random and
fixed factors by nesting the school within the level of PLC as identified by the directors. The
definition determined in meeting concurrent validity criterion was that results of each level
would significantly differ from one another and that the means of each previously identified level

74
of PLC would differ correspondingly by level. For example, a high PLC would have a higher
mean than a middle level PLC. A GLM was conducted using Minitab software.
Phase 3: Revision of the LCCI, Second Pilot, and Second Analysis
In the final phase of this study, the research team reviewed the results of the first pilot
study. Using the same iterative process as described previously, we began again to refine the
LCCI further. Based on what we had learned from the first pilot, we conducted revisions to the
LCCI survey. Revisions to structure, administration, and questions were informed by utilizing
the results of the first pilot. After the revisions were complete, we administered the survey as a
second pilot study to two school districts—one large suburban school district that has
implemented PLCs for the past four years and a small rural district that had recently begun
implementing PLCs. As in the first pilot, analyses of the results were conducted to confirm the
changes to the LCCI.
As cognitive interviews and written critiques provided revisions to the survey and the
pilot study tested the structure of the LCCI in phase 2, phase 3 provided revisions to the survey
based on the first pilot results. To determine which items needed to be revised, removed, or
transferred to different elements, we used evidence from the EFA, CFA, and reliability estimates.
The EFA provided information on which items did not load onto their intended constructs (the
individual elements and overall construct). The EFA also showed which items that were initially
thought to be within one element and had loaded onto a different element. We verified all the
results observed in the EFA by re-reading the survey text to compare semantics and item
structure to see if the items by their wording could adhere to different elements. The CFA also
confirmed the results of the EFA by showing which elements had better measures of fit in the
models we proposed and which elements had items loading to other elements or not loading onto
75
any element. Reliability estimates revealed which items if deleted would increase the reliability
of the element. From these measures, we were able to make recommendations to revising the
wording or structure of the LCCI. The second version of the LCCI survey was then given to
outside experts of PLCs to provide additional suggestions or revisions to the survey instrument.
These revisions provided a new version of the LCCI that we administered as a second pilot
study. The second pilot study’s criteria definitions were the same as in the first pilot study.
Summary
In this chapter, we presented the LCCI and its need to be validated so it can provide a
measurement tool for PLCs. Assessing whether elements of a PLC exist and to which degree
they exist will provide schools with a foundation of results to continue efforts or change current
practices within their cultures. An essential dimension presented in this chapter addressed the
method for meeting the validity and reliability needs of a survey instrument. Validity was a focus
from the beginning of the design of the instrument and was the focus of its piloting and
validation phases. The conceptual model of the LCCI was tested utilizing EFA and CFA analysis
methods. The next chapter will present the results from the testing of the LCCI.

76
CHAPTER 4
RESULTS
An iterative process of developing and validating the LCCI was described in chapter 3.
Although issues of validity were considered throughout the creation and refinement of the LCCI,
three phases provided a formalized process in determining the refinement and validity of the
instrument. This chapter will present details from the three corresponding phases and how these
results informed and guided the subsequent phases. Specifically, results from the cognitive
interviews and written critiques conducted before the piloting of the instrument are presented and
followed by the results from the first and second pilot study. The final phase presents the
revisions to the instrument that were based on the first pilot study analysis and the results from a
second pilot study.
Phase 1: Cognitive Interviews and Written Critiques
Before the piloting of the LCCI, eight teachers were selected to participate in cognitive
interviews from five schools with principals who had attended or were currently attending the
BYU Principals Academy. We conducted the cognitive interviews to record the thought process
of the individual as he or she read through and answered the questions.
We also selected 18 teachers from a different group of five schools with principals who
were participating or had participated in the BYU Principals Academy. These teachers were
asked to provide written critiques of the LCCI. The teachers were provided a paper version of the
LCCI that included areas to write comments and critiques of each survey item.
From the results of the cognitive interviews and written critiques, many respondents
recommended semantic and grammatical changes to the texts of the items. Although these
recommended changes were considered by the research team, not all suggestions were utilized in

77
the revision of the LCCI. Some suggestions by the participants were indicative of
misunderstanding of PLC concepts. Other suggestions were contradictory to feedback already
provided by participants. An example of a suggested change is found in item 3A. Before the
cognitive interviews, it read, “Our school mission statement is revisited to make it responsive to
the needs of our students.” The suggested revision from the interviewees and critiques
recommended changing the word “revisited” to “reviewed.” Because of wordiness, the
interviewees also recommended simplifying the statement for the same item. The item was
rewritten to read, “Our school mission statement is reviewed at least yearly.” Although ten items
received changes in the wording based on the feedback, interviewees had no suggestions for new
items and no recommendations that any items be removed.
Based on suggestions from the cognitive interviews and written critiques, changes were
made to item response scales. Many of the respondents agreed that the items fit with the intended
constructs. Many respondents, however, suggested Likert scale revisions to allow for more
choice and clarity in answering. Many participants felt that there was not enough of an option in
selecting a response with the 6-point Likert scale. More options in selecting a response were
recommended by the participants. Thus, we created an 11-point scale. The scale was also
adjusted to include numerical values with each level of agreement. The change provided value
with each option and greater ease in coding.
Response values for the percentage questions were also expanded to include a continuum
of 100% to 0% on a line with intervals of 10. The changes to the scales were intended to give
greater clarity for the respondent in selecting a response.

78
Likert Scale before Revision [agree strongly] [agree] [agree somewhat] [disagree somewhat] [disagree] [disagree strongly] Likert Scale After Revision Agree Agree Disagree Disagree Strongly Agree Somewhat Somewhat Disagree Strongly 10----------9----------8----------7----------6----------5----------4----------3----------2----------1---------0 Percentage Values Before Revision [100-85%] [84-70%] [69-55%] [54-40%] [39-25%] [24-10%] [10-0%] Percentage Values After Revision 100%-----90%-----80%-----70%-----60%-----50%------40%-----30%-----20%-----10%----0% Figure 2. Response scale revisions: before and after revisions.
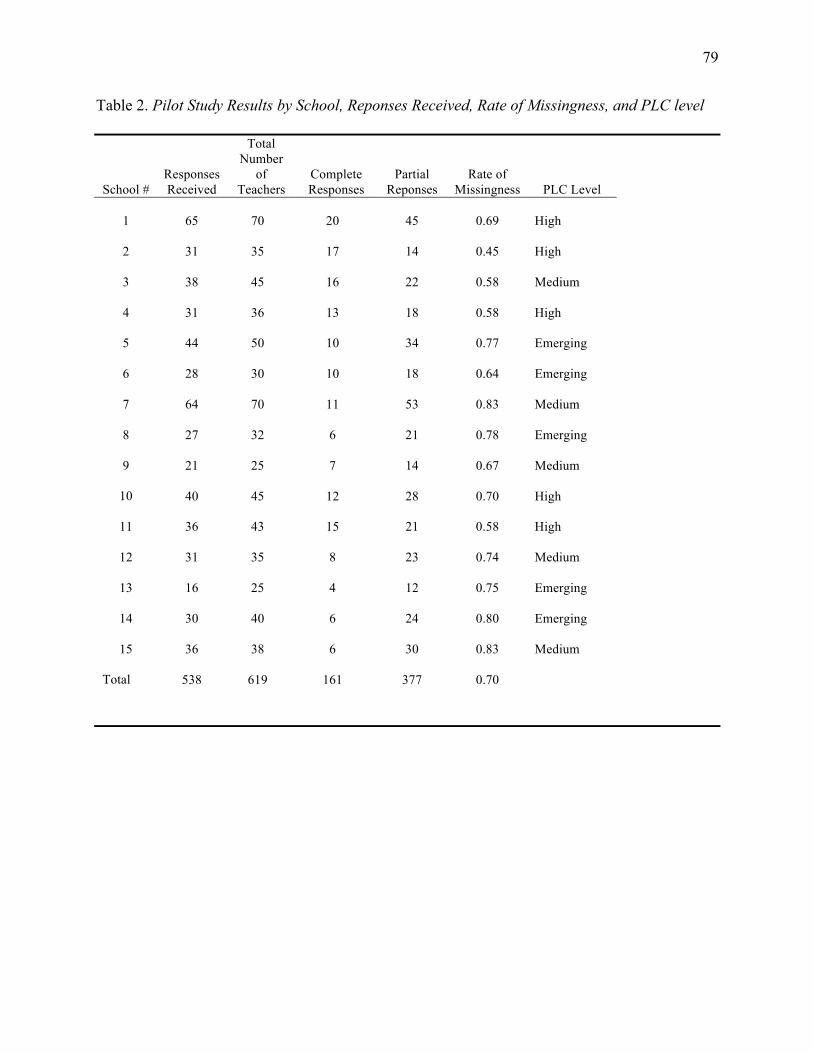
79
Table 2. Pilot Study Results by School, Reponses Received, Rate of Missingness, and PLC level
School # Responses Received
Total Number
of Teachers
Complete Responses
Partial Reponses
Rate of Missingness PLC Level
1 65 70 20 45 0.69 High
2 31 35 17 14 0.45 High
3 38 45 16 22 0.58 Medium
4 31 36 13 18 0.58 High
5 44 50 10 34 0.77 Emerging
6 28 30 10 18 0.64 Emerging
7 64 70 11 53 0.83 Medium
8 27 32 6 21 0.78 Emerging
9 21 25 7 14 0.67 Medium
10 40 45 12 28 0.70 High
11 36 43 15 21 0.58 High
12 31 35 8 23 0.74 Medium
13 16 25 4 12 0.75 Emerging
14 30 40 6 24 0.80 Emerging
15 36 38 6 30 0.83 Medium Total 538 619 161 377 0.70
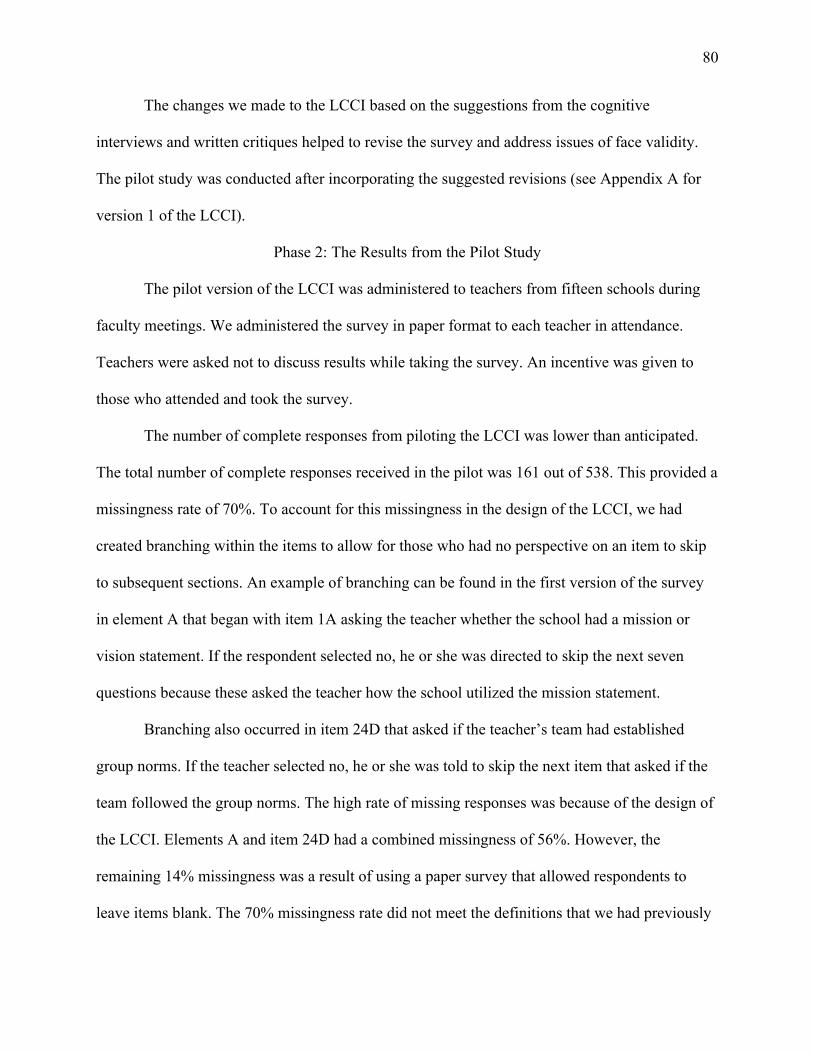
80
The changes we made to the LCCI based on the suggestions from the cognitive
interviews and written critiques helped to revise the survey and address issues of face validity.
The pilot study was conducted after incorporating the suggested revisions (see Appendix A for
version 1 of the LCCI).
Phase 2: The Results from the Pilot Study
The pilot version of the LCCI was administered to teachers from fifteen schools during
faculty meetings. We administered the survey in paper format to each teacher in attendance.
Teachers were asked not to discuss results while taking the survey. An incentive was given to
those who attended and took the survey.
The number of complete responses from piloting the LCCI was lower than anticipated.
The total number of complete responses received in the pilot was 161 out of 538. This provided a
missingness rate of 70%. To account for this missingness in the design of the LCCI, we had
created branching within the items to allow for those who had no perspective on an item to skip
to subsequent sections. An example of branching can be found in the first version of the survey
in element A that began with item 1A asking the teacher whether the school had a mission or
vision statement. If the respondent selected no, he or she was directed to skip the next seven
questions because these asked the teacher how the school utilized the mission statement.
Branching also occurred in item 24D that asked if the teacher’s team had established
group norms. If the teacher selected no, he or she was told to skip the next item that asked if the
team followed the group norms. The high rate of missing responses was because of the design of
the LCCI. Elements A and item 24D had a combined missingness of 56%. However, the
remaining 14% missingness was a result of using a paper survey that allowed respondents to
leave items blank. The 70% missingness rate did not meet the definitions that we had previously

81
Table 3. Identifying Elements and Descriptors
LCCI Section Descriptor Element
A Mission Common mission, vision, values, and goals that are focused on teaching and learning
B Decision Decision making based on data
C Participative Participative leadership that is focused on teaching and learning
D Teaming Teaming that is collaborative
E Interdependent Interdependent culture
F Academic Academic success for all students with systems of prevention and intervention
G Development Professional development that is teacher driven and embedded in daily work
H Principal Principal leadership that is focused on student learning
I Trust High-trust embedded in school culture
J Assessment Use of continuous assessment to improve learning

82
produced estimates of the reliability or internal consistency of the items of the LCCI. Four items
(1A, 17D, 18D, and 24D) were excluded from these analyses because they were categorical
responses.
Table 3 provides the abbreviated descriptions to represent the corresponding elements
that were analyzed in this study. The ten elements are identified by a letter and a corresponding
descriptor.
First Pilot Study Analysis Results
The results from the analysis of the pilot study data will be presented according to the
two research questions related to the structural validity of the LCCI. The first research question
was Does the LCCI uniquely measure individual elements of PLCs? The second question was
Does the LCCI measure an overall level of PLC? In this section, we will present the
corresponding EFA and CFA results with each research question.
Research Question 1: Does the LCCI Measure Unique Individual Elements of PLCs?
The EFA and CFA provided results in order to test the theory that the LCCI measures
individual elements of PLCs. These two processes indicated whether the individual elements
were loading separately.
Exploratory factor analysis. The EFA was conducted to explore the results of the pilot
study and to compare the theory based on the LCCI conceptual model. In conducting an EFA,
two indicators of successful factor loadings were monitored (see Table 4). The first indicator was
loadings from a PCA that were greater than .400. The second indicator was having one
Eigenvalue greater than 1.0. In conducting a PCA for each element that we observed, all but one
element, Development, loaded uniquely onto its corresponding factor. Development loaded onto
two different factors. The first factor had loadings greater than .669 and the second factor had

83
loadings less than .387. We also observed that all elements, excluding Development and
Assessment, had Eigenvalues that were greater than 1.0 for single factors. Development and
Assessment had two Eigenvalues greater than 1.0. The percentage of variance explained for each
individual element was greater than 47% (for complete EFA results for first pilot study, see
Appendix C).
These EFA results provided evidence that the LCCI was measuring individual elements
of a PLC, excluding Development and Assessment. These two elements appeared to be
measuring two separate constructs within each element.
Confirmatory factor analysis. In order to confirm the results of the EFA and examine the
fit of the factor structure of the conceptual model, several single first order models were built.
For an example of a single model, see Figure 3. The first theory of the conceptual model needed
to be confirmed in the CFA. As supported by strong loadings and single Eigenvalues of each
element, there was evidence that each element, excluding Development and Assessment, was
uniquely measuring a single construct.
To begin the CFA, we built models for each respective element to confirm that
individually the items loaded onto their intended constructs. The measures of fit for each model
are presented in table 5. Two fit indices revealed a good measure of fit of the data for all
elements in supporting the model with NFI greater than .812 and CFI greater than .822.
However, the TLI fit index revealed five elements less than .776. RMSEA values for all
elements, excluding Decision, were greater than .09. Although two indices provided evidence of
good fitting models, the TLI and RMSEA showed that some models of elements are problematic.

84
Table 4. Eigenvalues and Factor Loading from the First Pilot Study
Element Descriptor Eigenvalues >1 First Loading Second Loading A
Mission
3.381
6 items >.662
B Decision 2.259 4 items > .693
C Participative 3.401 5 items > .734
D Teaming 2.622 6 items > .581
E Interdependent 3.154 6 items > .666
F
Academic
2.834
5 items > .664 1 items > .354
G Development 3.023 1.059
6 items > .610 6 items >.302
H Principal 4.534 6 items > .869
I
Trust
4.365
7 items > .684
J
Assessment
4.167 1.279
9 items > .494
3 item >.340

85
Figure 3. An example of a single element first order model. Element B: Decision.

86
Table 5. First Pilot Model Results: Individual Models ______________________________________________________________________________
Model DF NFI TLI CFI RMSEA X2 A 9 0.955 0.913 0.963 0.09 48.4 B 2 0.922 0.986 0.997 0.03 03.0 C 5 0.892 0.682 0.894 0.25 168.90 D 9 0.882 0.752 0.894 0.11 67.1 E 9 0.910 0.807 0.917 0.13 90.8 F 9 0.850 0.667 0.857 0.15 121.80 G 9 0.897 0.776 0.904 0.14 106.40 H 9 0.980 0.960 0.983 0.09 51.1 I 14 0.944 0.899 0.95 0.12 118.20 J 27 0.812 0.704 0.822 0.15 335.30

87
This evidence posed a dilemma in deciding measure we should accept as evidence supporting the
structure of the LCCI. We tested the second theory of the conceptual model after confirming that
the models of each element were supporting the evidence from the EFA and that each item
loaded onto its respective factor with a moderate to good level of fit.
Research Question 2: Does the LCCI measure an overall level of PLC?
To test the second theory of the conceptual model, we conducted an EFA to explore the
structure of the LCCI in its ability to measure an overall level of PLC. We also conducted a CFA
to confirm the theory that we were testing. The same two indicators of Eigenvalues greater than
1.0 and loadings greater than .400 were monitored to determine if the items were measuring an
overall factor of PLC.
Exploratory factor analysis. The number of Eigenvalues greater than 1.0 observed in the
EFA was 14 with the first value at 20.177. The cumulative percent of variation explained by the
14 values was 74%. The Eigenvalues indicated that 14 factors were emerging from the items of
the LCCI. This was partially observed in the first question, when Development and Assessment
had two factor loadings. However, two additional factors emerged when loading all items
together.
In loading all questions onto one overall factor, all but two items (21D, 34F) had loadings
greater than .400. Item 34F was problematic in the first EFA. When individually looking at the
element of Academic, it loaded with a .354. Item 21D also had a lower loading in the first EFA
than did the remaining items of Teaming with a loading of .581. Nevertheless, all other items
loaded at an acceptable level onto one overall factor of PLC.
Confirmatory factor analysis. To confirm in the CFA what we had observed in the EFA
that all items successfully loaded onto a single overall construct, we began to build larger

88
models. The first model built was a first order hierarchal model. This oblique model tested that
each item loaded onto the item’s corresponding factor and correlated with all other elements. The
results (see Table 6) produced NFI, TLI, and CFI indices of less than .804, however, this model
had an RMSEA value of .06. In building a second order model, which tested that each item
loaded onto the corresponding factor and then each factor loaded onto an overall construct of
PLC, the results revealed fit indices less than .785 and similar RMSEA (see Table 6).
The second order hierarchal model tested the theory that in succession the questions
loaded first onto individual constructs and then onto one overall construct. However, the EFA
provided evidence that the factors individually and combined had acceptable loadings. A bifactor
model provided an alternative approach to the analysis. The bifactor model provided an
adaptation to the hypothesis that the factors and items would simultaneously load rather than in
succession. A bifactor model was the final model that we tested in the CFA (see Figure 4). In
comparison to the second order hierarchal model that we built initially, the results provided a
slightly better fit with the bifactor model than the second order hierarchal model. Although the
result of the bifactor model was a moderate level of fit (NFI=.768, RMSEA=.054).
A review of the results from both the first and second questions provided evidence of
some elements having a better fit individually and together than did other elements. An
additional EFA and CFA were conducted to isolate which elements were performing better. A
rotational method revealed the separation of elements into two groups based on their success in
loading uniquely onto single constructs. Using the rotational extraction method Promax with
Kaiser Normalization, we were able to separate more finitely the ten elements into two groups of
elements. The first group, Mission, Decision, Teaming, Principal, and Trust, loaded with

89
Table 6. First Pilot Results: Results from the Group Models Model DF NFI TLI CFI RMSEA X2 1st order All
1724
0.733
0.785
0.804
0.06
5045.2
2nd order All
1642
0.717
0.769
0.785
0.064
5244.7
Bi-factor All (Fig. 4)
1596
0.768
0.821
0.839
0.056
4305.7

90
Figure 4. Bifactor model with all groups
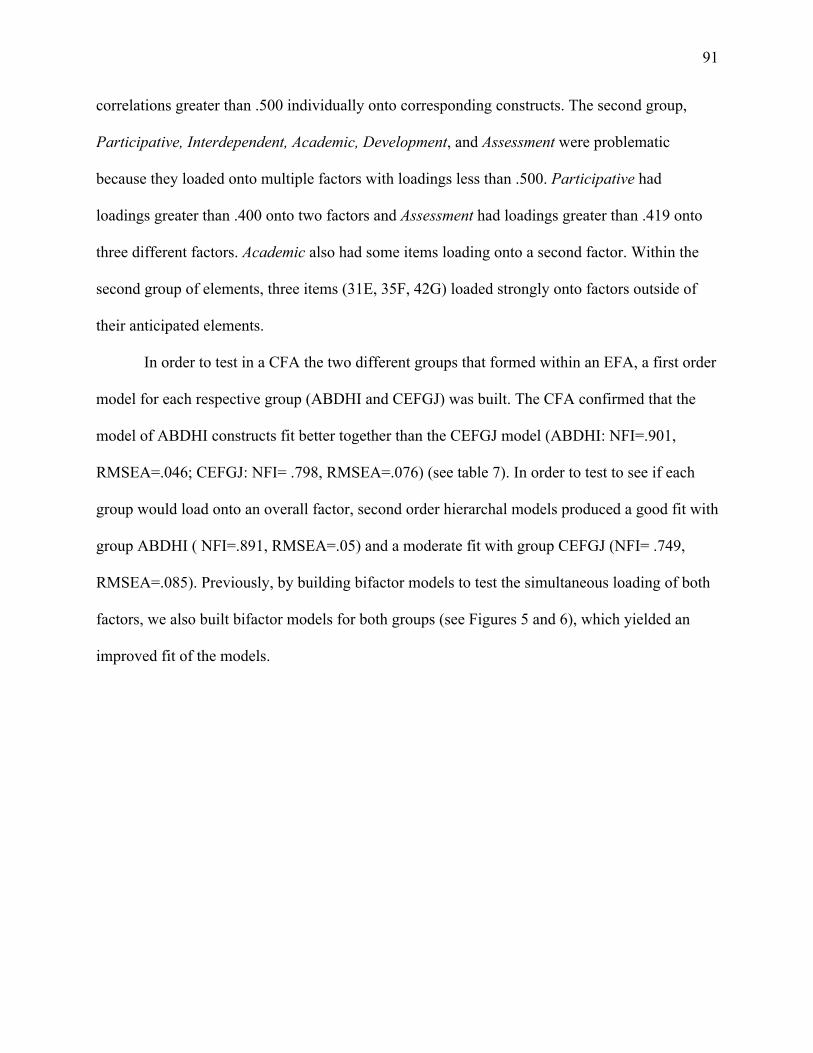
91
correlations greater than .500 individually onto corresponding constructs. The second group,
Participative, Interdependent, Academic, Development, and Assessment were problematic
because they loaded onto multiple factors with loadings less than .500. Participative had
loadings greater than .400 onto two factors and Assessment had loadings greater than .419 onto
three different factors. Academic also had some items loading onto a second factor. Within the
second group of elements, three items (31E, 35F, 42G) loaded strongly onto factors outside of
their anticipated elements.
In order to test in a CFA the two different groups that formed within an EFA, a first order
model for each respective group (ABDHI and CEFGJ) was built. The CFA confirmed that the
model of ABDHI constructs fit better together than the CEFGJ model (ABDHI: NFI=.901,
RMSEA=.046; CEFGJ: NFI= .798, RMSEA=.076) (see table 7). In order to test to see if each
group would load onto an overall factor, second order hierarchal models produced a good fit with
group ABDHI ( NFI=.891, RMSEA=.05) and a moderate fit with group CEFGJ (NFI= .749,
RMSEA=.085). Previously, by building bifactor models to test the simultaneous loading of both
factors, we also built bifactor models for both groups (see Figures 5 and 6), which yielded an
improved fit of the models.

92
Table 7. Model Results for Groups
Model DF NFI TLI CFI RMSEA X2
1st order ABDHI
340
0.901
0.983
0.944
0.046
731.4
2nd order ABDHI
345 0.891 0.922 0.934 0.050 813.2
1st order CEFGJ
408 0.798 0.802 0.838 0.076 1667.9
2nd order CEFGJ
428 0.749 0.754 0.788 0.085 2074.1
Bi-factor (Fig. 5) ABDHI
322 0.908 0.935 0.949 0.046 685.5
Bi-factor (Fig. 6) CEFGJ
405 0.831 0.844 0.873 0.067 1391.1

93
Figure 5. Bifactor CEFGJ

94
Figure 6. Bifactor ABDHI

95
First Pilot Study Reliability Results
In order to determine the LCCI’s reliability, Cronbach’s alpha was used to measure the
internal consistency. The LCCI had an overall acceptable level of reliability of .959. Six of the
ten elements, Mission, Participative, Interdependent, Principal, Trust, and Assessment, produced
reliability estimates greater than .80 (see Appendix C for first pilot study reliability results). The
remaining four elements, Decisions, Teaming, Academic, and Development, had values less than
.80 but greater than .723. The output within SPSS Cronbach’s Alpha if Item Deleted results
revealed that only one item, 34F, if deleted would increase the elements respective alpha
coefficient.
Concurrent Validity Results
Concurrent validity of the LCCI was explored by comparing the data from the pilot study
to an expert designation of the schools’ development level of a PLC. The schools in the pilot
study were selected based upon their level of PLC development as determined by expert review.
Specifically, five schools were selected in each of the following categories: emergent PLC,
moderate PLC, and high PLC. If the expert review was accurate and if the LCCI measured the
level of PLC in a school, then we expected the average scores from the LCCI to be different
across the three levels of development determined by expert review.
Results from the exploratory and confirmatory factor analyses of the pilot study data
revealed that only 5 of the 10 LCCI elements were internally consistent and valid. The average
of these five elements (Mission, Decision, Teaming, Principal, and Trust) was used to explore
the concurrent validity of the LCCI.
As predicted by expert review, the emergent PLC schools’ group average was lowest
(M=7.23, SD=1.17); the high PLC schools group average was highest (M=7.88, SD= 1.09); and

96
the moderate PLC schools group average was between them (M=7.43, SD=1.18). A general
linear model was used to test whether these group means were significantly different from each
other. The response variable was the teacher average on the five elements. The PLC development
variable was the primary explanatory variable, and a school variable was included to account for
the potential dependency among teacher scores from the same school. Results from the analysis
are found in Table 9. These results indicate that the PLC development means are not statistically
different from one another at a significance level of 0.05 (p=0.157).
Concurrent validity was not clearly established for these data. While the relative size of
the group averages were correctly predicted by expert review, these group means were not
statistically significant at the standard level of 0.05. One possible explanation for this is that the
expert review misclassified some of the schools, that is, some of the schools may have been at
PLC development level different from what the experts observed.
Another possible explanation that concurrent validity was not clearly established is that
the sample size of the pilot study was not large enough to clearly detect differences between the
groups. While there are several hundred teachers who provided data for the pilot study, there
were only 15 schools included in the pilot study, and the number of schools is the effective
sample size for testing differences between groups of schools. A p-value of 0.157 is moderately
small and suggested there might be a difference in LCCI scores between these groups. A
significant difference might be detectable in other studies if more schools are sampled.
Another explanation for the inconclusive concurrent validity is worth consideration. It is
possible that schools that are emerging as professional learning communities might overestimate
their level of development out of ignorance of what professional learning communities truly are.

97
Table 8. Mean Scores of Each School by PLC Level, Overall, and Element
PLC Level PLC Level
M sd School # Overall Mean
Mean A
Mean B
Mean D
Mean H
Mean I
Emerging 5 7.21 7.5 6.6 5.8 7.7 8.0 Emerging 6 7.69 7.6 7.5 6.9 8.9 7.5 Emerging 8 7.05 5.9 7.0 6.2 8.0 7.7 Emerging 13 7.84 8.1 7.2 6.2 9.0 8.3 Emerging 7.23 1.17 14 6.74 6.7 6.3 5.0 7.6 7.3 Medium 3 7.83 7.6 6.2 7.9 8.5 8.2 Medium 7 6.72 6.8 5.7 7.4 6.5 6.8 Medium 9 8.33 6.7 7.7 8.5 9.4 8.8 Medium 12 7.27 7.9 7.0 5.5 8.7 7.1 Medium 7.43 1.18 15 7.83 6.9 7.9 7.8 8.4 7.8 High 1 7.64 7.6 6.4 7.7 8.0 8.0 High 2 8.46 7.9 7.6 8.8 9.5 8.2 High 4 7.74 7.4 7.3 7.8 8.0 7.9 High 10 7.76 6.8 6.4 8.0 8.7 8.2 High 7.88 1.09 11 8.12 8.6 6.9 7.6 8.4 8.5

98
Table 9. Results of General Linear Model Analysis Comparing School and Level
Variable DF Seq SS Adj SS Adj MS F Sig.
Level 2 35.965 30.470 15.2350 2.16 0.157 School (Level) 12 91.038 91.038 7.5865 7.76 0.000
Error 524 512.600 512.6000 0.9783 Total 538 639.600

99
This phenomenon has been observed in various fields of study and has been labeled the J-Curve
effect (Erb & Stevenson, 1999) because initially an organization’s understanding of a new
initiative is shallow, but members of the organization think they are functioning at a higher level
than they actually are. Over time as the organization grows in understanding, members will
actually drop in their perception as to how they are enacting the initiative. Organizational
members will realize that they were not performing according to the demands of the endeavor
because they have a deeper understanding of the requirements. Eventually the organization’s
members will have a higher understanding and an accompanying perception of excelling in the
endeavor beyond initial levels. While this J-curve was not observed in the pilot study data at the
group level, the possibility exists that the overestimation of performance because of shallow
understanding was occurring at various emerging schools in the pilot study.
Phase 3: The Revision of the LCCI, Second Pilot, and Second Analysis
The final phase in the development and validation of the LCCI included the revisions to
the first version of the survey, a second piloting of the second version of the LCCI, and a second
pilot study analysis from the new administration. In this phase, we will describe how the results
from the previous two phases informed the revisions that were made to the LCCI and present a
second pilot study of the instrument.
Second Revisions to the LCCI
The revisions to the survey were based on the results of the pilot study and the
recommendations by PLC experts. The revisions were conducted by the research team that
created the LCCI. Revisions to the survey were divided into two components. The first
component contained revisions to the items. The second component contained revisions to the
structure and administration of the LCCI.

100
As a research team, we began revising the questions by looking at the results from the
EFA, CFA, and reliability estimates. Within the EFA, we targeted five elements that had
problematic loadings. Participative, Interdependent, Academic, Development, Principal, and
Assessment had loadings onto multiple factors and loadings less than .400. Some items (31E,
35F, 42G) were loading onto elements outside of their intended constructs. Participative had
loadings greater than .581 but onto two different factors. Assessment had similar strength in
loadings as Participative, but onto three different factors. Two items (21D, 34F) did not load
onto the overall construct of a PLC. Within the CFA, the results highlighting which elements
were problematic from EFA were substantiated. The CFA also revealed that elements
Participative, Teaming, Academic, Development, and Assessment had fit indices less than .900
and RMSEA values greater than .11. From these results, we determined that elements
Participative, Teaming, Interdependent, Academic, Development, Principal, and Assessment
needed revisions. As indicated in Table 9, the number of revisions and additions from the first
version to the second version was greatest among those identified elements. However, we
revised the remaining four elements based on recommendations from PLC experts. We also
included negatively worded questions.
To begin the changes to the elements, we started by eliminating items that were
problematic in the validation. Fourteen total items were removed from the first version of the
LCCI. Seventy percent of the removed items came from the six elements that we had determined
as problematic. Item 34F was eliminated based on the results from the EFA and reliability
estimates. The other four items were eliminated based on changes to the structure of the survey
and changes in the response scales of the survey.

101
As an alternative to eliminating more items from the survey, we determined to revise
existing items. Eighteen of the original 65 items we revised to read differently. Some revisions
were minor such as 19D that had originally stated, “My department or grade level instructional
team sets goals and objectives that guide our efforts to improve teaching and learning” to the
revised item that stated “My instructional team sets goals and objectives that guide our efforts to
improve teaching and learning.” This revision was simply the change from “department or grade
level instructional team” to “instructional team.” Other revisions were major changes such as
21D that originally stated, “I have received professional training on collaboration” to a more
specific statement of “I have participated in professional development to learn various skills of
collaborating to improve student learning.”
In review of the pilot study results, we determined that the branching structure of the
instrument facilitated the problem of high missingness rates. Based on the high missingness rate,
we decided to eliminate all branching from the survey. All categorical questions, except item
18D, were eliminated. Item 18D was considered an essential categorical question that asked of
how often the teacher’s instructional team met.
An additional change we made to prevent the high missingness rates was changing the
method of administration of the LCCI. In the pilot study, we had used a paper format in which
responses could be left blank. We changed the process of administering the LCCI to a digital
online survey that was completed by teachers on a computer. We elected to use the online survey
website Qualtrics. The online version could be e-mailed to the teachers’ computers and
completed either in a designated window of time or at the convenience of teacher. The online
survey required each response to be completed before moving on within the survey. Qualtrics
website also allows the administrators to track completion results of all participants. The online
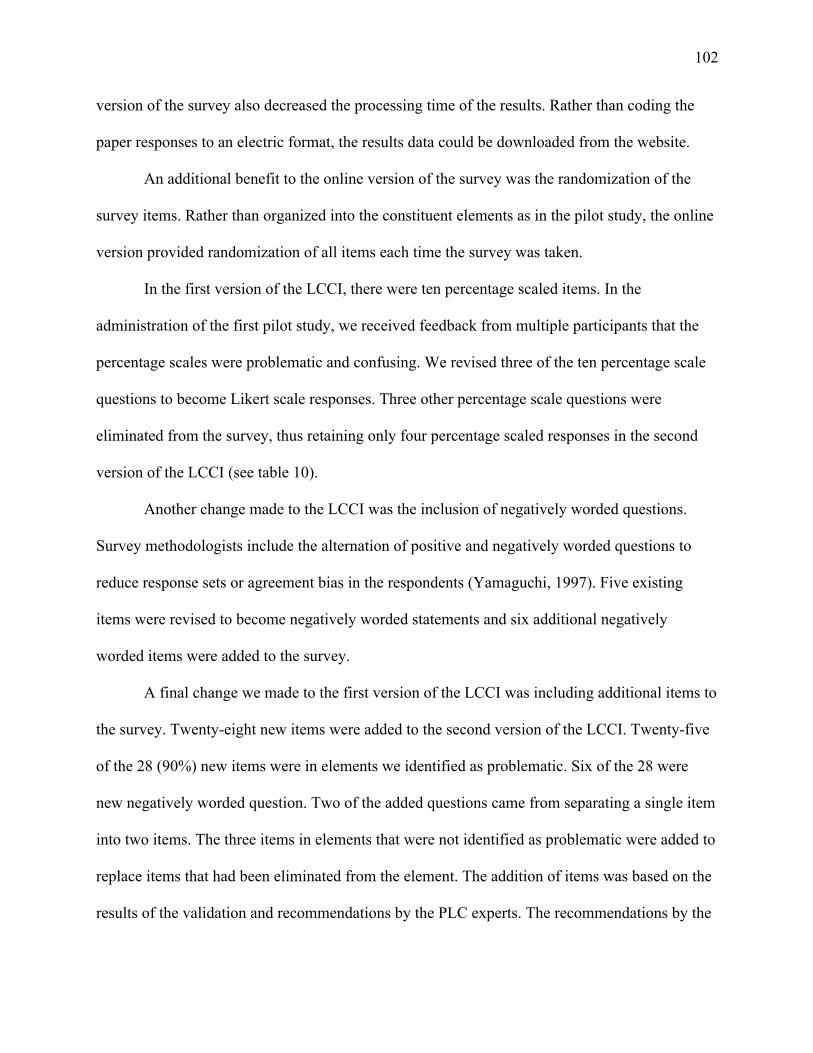
102
version of the survey also decreased the processing time of the results. Rather than coding the
paper responses to an electric format, the results data could be downloaded from the website.
An additional benefit to the online version of the survey was the randomization of the
survey items. Rather than organized into the constituent elements as in the pilot study, the online
version provided randomization of all items each time the survey was taken.
In the first version of the LCCI, there were ten percentage scaled items. In the
administration of the first pilot study, we received feedback from multiple participants that the
percentage scales were problematic and confusing. We revised three of the ten percentage scale
questions to become Likert scale responses. Three other percentage scale questions were
eliminated from the survey, thus retaining only four percentage scaled responses in the second
version of the LCCI (see table 10).
Another change made to the LCCI was the inclusion of negatively worded questions.
Survey methodologists include the alternation of positive and negatively worded questions to
reduce response sets or agreement bias in the respondents (Yamaguchi, 1997). Five existing
items were revised to become negatively worded statements and six additional negatively
worded items were added to the survey.
A final change we made to the first version of the LCCI was including additional items to
the survey. Twenty-eight new items were added to the second version of the LCCI. Twenty-five
of the 28 (90%) new items were in elements we identified as problematic. Six of the 28 were
new negatively worded question. Two of the added questions came from separating a single item
into two items. The three items in elements that were not identified as problematic were added to
replace items that had been eliminated from the element. The addition of items was based on the
results of the validation and recommendations by the PLC experts. The recommendations by the

103
Table 10. LCCI Revisions
Element LCCI 1 item #
LCCI 2 item #
Change in item #
Items removed
Items added
Items revised
Items changed to negative
wording Negative
items added A 7 6 -1 2 1 2 1 0 B 4 4 0 1 1 0 0 0 C* 5 7 2 1 3 3 1 2 D* 9 15 6 2 8 3 0 1 E* 6 8 2 1 3 0 1 0 F* 6 7 1 3 4 3 0 0 G* 6 8 2 2 4 3 0 1 H 6 6 0 1 1 2 0 1 I 7 7 0 0 0 0 2 0 J* 9 11 2 1 3 2 0 1 Total 65 79 14 14 28 18 5 6 Percentage scaled items
10 4 -6
Categorical scaled items
4 1 -3
Likert scaled items
51 74 23
Note. * indicates elements identified from EFA and CFA as problematic.
104
PLC experts were based on their experience with PLCs and their knowledge of PLC literature
and were applicable in addressing issues related to content validity. With the revisions to the
second version completed, we then conducted a second administration of the LCCI to revalidate
the changes we had made to the LCCI (see version 2 of the LCCI in Appendix D).
Second Pilot Study Analysis of the Second Version of the LCCI
The second pilot study analysis of the LCCI followed the same organization as the first
described in phase two. In meeting the assumptions required in conducting this analysis, the
sample size was adequate at 1467. The second assumption of multivariate normality was similar
to the first pilot in that the second administration results indicated that the data was
approximately normal with most skew and kurtosis levels at +/- 2.0 (Schumacker & Lomax,
2004). The last assumption of handling missing data was also met. In the second administration,
we had acceptable levels of missingness rates, and only complete data were used in the analysis.
The second pilot study analysis involved three processes. The first was the exploratory
factor analysis that reviewed the results of the survey and explored the structure of the survey
items according to the two theories that the LCCI measures individual elements of a PLC and
measures an overall PLC. The EFA provided an additional test of the theories of this research by
exploring the results of the data. Confirmatory factor analysis was the second process used to
confirm the testing of the two theories. The final process of the first pilot study produced
estimates of the reliability or internal consistency of the items of the LCCI. One item was
excluded from the statistical analysis. Item 21D was excluded because it asked for a categorical
response of how often the teacher’s team met.
In the previous pilot study, before the processing of any results, we needed to resolve the
problem of missing data. Fortunately, because of the number of complete responses, no

105
imputation was utilized in the second analysis. The results analyzed were only complete
responses from the two districts (N=1467). In analyzing the results in this step, we used the
statistical software SPSS.
Second Pilot Study Analysis Results
The results from the analysis of the second pilot study data will be presented according to
the two research questions related to the structural validity of the LCCI. The first research
question is Does the LCCI measure unique individual elements of PLCs? The second question is
Does the LCCI measure an overall level of PLC? In this section, we will present the
corresponding EFA and CFA results with each research question.
Research Question 1: Does the LCCI Measure Unique Individual Elements of PLCs?
The EFA and CFA provided a test of the theory that the LCCI measures individual
elements of PLCs. These two processes indicated whether the individual elements were loading
separately.
Exploratory factor analysis. The EFA was conducted to explore the results of the pilot
study and compare the theory based on the conceptual model of the LCCI. In conducting an
EFA, two indicators of successful factor loadings were monitored. (see table 11) After
performing a PCA within the EFA, four elements, Teaming, Academic, Development, and
Assessment, loaded onto two different factors. The factor loadings within each element had
loadings greater than .481, excluding Teaming that had two items with loadings less than .405.
Mission, Decision, Participative, Interdependent, Principal, and Trust had Eigenvalues that were
greater than 1.0 for single factors. Teaming, Academic, Development and Assessment had two
factors greater than 1.0. The percentage of variance explained for each individual element was
greater than 44%.

106
Table 11. Eigenvalues and Factor Loadings for Second Pilot Study
Element Descriptor Eigenvalues >1 First Loading Second Loading A
Mission
3.438
6 items > .482
B
Decision
2.308
4 items > .719
C
Participative
3.786
7 items > .556
D
Teaming
6.986 1.076
14 items >.341
4 items > .307
E Interdependent 3.831 8 items > .516 F
Academic
4.007 1.001
7 items > .681
5 items > .349
G
Development
3.508 1.173
8 items > .587
5 items > .378
H
Principal
4.058
6 items > .786
I
Trust
3.309
7 items > .561
J
Assessment
5.738 1.164
11 items >.406
4 items > .312
107
The results from the EFA revealed evidence that many of the elements are loading onto
individual factors. However, four elements were problematic in that they were loading onto two
factors and have two Eigenvalues greater than 1.
Confirmatory factor analysis. In order to confirm the results of the EFA and examine the
fit of the factor structure of the conceptual model, several single first order models were built.
The strong loadings and single Eigenvalues of each element provided the evidence that each
element, excluding Teaming, Academic, Development, and Assessment, were uniquely
measuring a single construct.
To begin the CFA, we built models for each respective element to confirm that
individually the items loaded onto their intended factors. The measures of fit for each model are
presented in table 12. The fit indices for all elements revealed a good measure of fit of the data in
supporting the model. All elements had NFI fit indices greater than .932 and TLI greater than
.907. This was a stronger result than we had observed in the first pilot study. The RMSEA values
also improved from the first pilot study, four elements had values greater than .097. Although
Teaming, Academic, Development, and Assessment had multiple loadings in the EFA, the
models confirmed that individually the models were a good fit of the data.
After confirming that the models of each element were supporting the evidence from the
EFA and that each item loaded onto to its respective factor with a good level of fit, we then
began to test the second theory of the conceptual model.
Research Question 2: Does the LCCI measure an overall level of PLC?
To test the second theory of the conceptual model, we conducted an EFA to explore the
structure of the LCCI in its ability to measure an overall level of PLC. We also conducted a

108
Table 12. Second Pilot Results: Individual Models and Fit Indices
Element df NFI TLI CFI RMSEA Chi-Sq A 9 0.989 0.986 0.992 0.048 39.50 B 2 0.994 0.987 0.996 0.044 7.6 C 13 0.972 0.959 0.975 0.075 119.200 D 75 0.956 0.955 0.963 0.061 490.600 E 18 0.973 0.965 0.977 0.057 104.900 F 11 0.947 0.903 0.949 0.130 281.900 G 18 0.932 0.903 0.937 0.088 224.200 H 7 0.962 0.921 0.963 0.138 202.800 I 13 0.939 0.907 0.943 0.094 182.100 J 41 0.964 0.958 0.969 0.067 307.500

109
CFA. The same two indicators of Eigenvalues greater than 1 and loadings greater than .400 were
monitored to determine if the items were measuring an overall factor of PLC.
Exploratory factor analysis. The number of Eigenvalues greater than 1 observed in this
EFA was 13. The first Eigenvalue was 27.103, and cumulative percentage of variance explained
by the 13 factors was 62.8%.
In loading all items onto one overall factor, all items loadings were greater than .334. We
then created a rotated factor matrix of all factors using the rotational method of Varimax with
Kaiser Normalization. Three items failed to load at the threshold of .300 (3A, 38E, 55G). In the
matrix, we also observed that many elements had loadings onto multiple factors. Elements such
as Mission, which previously within the EFA we had observed single factor loadings and an
Eigenvalue of 1.0 for a single factor, were now loading with other elements. Many elements had
loadings greater than .400 onto the first factor, while also loading with slightly weaker loadings
onto a second factor. However, many of the second loadings were isolated items from the
element.
Confirmatory factor analysis. To confirm again in the CFA what we had observed in the
EFA that all items loaded onto a single overall construct and to confirm the second theory of the
conceptual model, we began to build larger models. The first model built was a first order
hierarchal model. This oblique model tested each item loaded onto the item’s corresponding
factor and correlated items with all other elements. Also in this model, we correlated 14 item
errors based on the modification indices observed in each individual elements model. The result
(see table 12) produced a moderate fit of the data in confirming the model. It was a substantial
improvement from the first pilot study results. (1st pilot NFI = .733, 2nd pilot NFI =.810)

110
We built a second order model that loaded each item onto the corresponding factor and
then each factor loaded onto an overall factor of PLC. The model revealed a moderate to good fit
of the data (see table 13). Although this result was an improvement from the first pilot study, the
fit was still less than .800 (1st validation NFI=.717, 2nd validation NFI=.781). However, the
RMSEA values were at .05 indicating a good fit of the data.
As in the first pilot study analysis, we used a bifactor model to also test the second theory
of the conceptual model. The bifactor model provided an adaptation to the theory that the factors
and items would simultaneously load rather than load in succession. Another adaptation we made
to the bifactor model in the second pilot study was correlating the same errors that we had
correlated in the second order model. We allowed five items to load onto other elements (see
Figure 7). We identified the five items from the rotated factor matrix based on their strong
loadings onto another element and through a re-reading of the item’s wording to confirm
theoretically that they could align with the different element. The results of the bifactor model
provided an acceptable level of fit in representing the data with an NFI of .825 and RMSEA of
.052.
From the matrix and based on an additional review of the individual element results, we
separated more finitely the ten elements into two groups of elements as in the first pilot study.
Before the rotated factor matrix, the first group, Mission, Decisions, Participative,
Interdependent, Principal, and Trust loaded onto corresponding constructs with correlations
greater than .500. Also before the rotated factor matrix, the second group, Teaming, Academic,
Development, and Assessment were problematic because they loaded onto multiple constructs
with some loadings less than .400.

111
Table 13. Second Pilot Model Results: Higher Order Models
Model Df NFI TLI CFI RMSEA Chi-Sq 1st order All 2866 0.81 0.835 0.842 0.051 13923.3 2nd order All 2901 0.781 0.807 0.813 0.055 15988.1 Bifactor All 2542 0.825 0.846 0.855 0.052 12433.0

112
Figure 7. Second pilot study: bifactor model.

113
Within the results of two groups, two pairs of elements that loaded strongly together were
identified, Interdependent and Trust, and Academic and Assessment. These pairs of elements had
most of their items loading together with loadings greater than .300. Other isolated items would
load strongly onto other elements, such as item 56G loaded with a .590 onto Teaming and item
39E loaded with a .451 onto Mission. Other individual items loaded onto multiple factors, but in
providing a theory to test in the CFA, we only considered items that had strong loadings and
theoretically from reading the items saw that the content of the item related to the other element.
In order to test the two groups that we had observed in the EFA, we built a first order
model for each respective group (ABCEHI and DFGJ). The CFA did not confirm that the two
models had different levels of fit. Both models provided equal fit in representing their
corresponding data (ABCEHI: NFI=.876, RMSEA=.056; CEFGJ: NFI= .875, RMSEA=.0.059)
(See table 14). The best fitting model for the two separate groups was a bifactor model for each
group. The fit indices for both groups were near .900 with RMSEA values near .05.
Another model we built to test an additional finding of the EFA that related to the
additional findings in the EFA was a single construct model. The model tested that two pairs of
elements may actually be attempting to measure the same construct. As we had identified within
the EFA, Interdependent and Trust, and elements Academic and Assessment had multiple items
loading together. In order to test the additional theory that these two pairs of items might be more
unified than we had anticipated, we built a model with all the items of the respective pairs
loading together on one factor. We then compared it to a first order model. The single construct
model tested the theory that all items within the pairs were attempting to measure the same
construct.

114
Table 14. Loadings for Second Pilot Group Models
Model Df NFI TLI CFI RMSEA Chi-Sq
ABCEHI 646 0.876 0.886 0.896 0.056 3619.6 ABCEHI 2nd order
655 0.863 0.874 0.882 0.059 4014.6
ABCEHI Bifactor
623 0.887 0.894 0.907 0.054 3288.7
DFGJ 724 0.875 0.885 0.893 0.059 4420.5 DFGJ 2nd order
726 0.873 0.883 0.891 0.059 4493.1
DFGJ Bifactor 690 0.89 0.895 0.907 0.056 3909.6

115
The first order model tested each individual element’s items attempt to measure a separate
construct.
Theoretically, the two pairs of elements were similar in the content they were attempting
to measure. The items Interdependent and Trust were attempting to measure Interdependent
Culture and High Trust Embedded in the School Culture. Academic and Assessment were
attempting to measure Academic Success for All Students with Systems of Prevention and
Intervention and Use of Continuous Assessment to Improve Learning.
In building the single construct model, we eliminated items that had not loaded in the
EFA (E and I=items 35E, 36E, and 38E; F and J=items 44F, 45F, and 73J). The results supported
the hypothesis that the two pairs were attempting to measure the same construct. The single
construct model had a better fit of the data for EI than the first order model had. The single
model FJ had a slightly lower fit when compared to the first order model. Although the bifactor
models provided the best fit of the data, the bifactor supported the evidence of the single
construct model by also testing whether the items were measuring the same construct by loading
the items simultaneously with the elements (see Table 15).
Second Pilot Study Reliability Results
In order to determine the second version of LCCI’s reliability, we measured the internal
consistency using Cronbach’s alpha. The LCCI had an overall acceptable level of reliability of
.971. After excluding three items (3A, 13C, 21D), we observed that eight of the ten elements
produced reliability estimates greater than .80. The remaining four elements had values less than
.80 but greater than .752. The Alpha if items deleted result revealed that three items, 25D, 27D,
and 37E if deleted would increase the alpha coefficient for its respective element. However, the
increase would be only minimal.

116
Table 15. Single Construct Models
Model df NFI TLI CFI RMSEA Chi-Square
EI 1st order 88 0.878 0.865 0.887 0.086 1038.90 EI 2nd order 88 0.878 0.865 0.887 0.086 1038.90 EI Bifactor 74 0.904 0.875 0.912 0.083 818.7 EI Single construct 89 0.835 0.815 0.814 0.101 1411.10 EI Single construct (35E, 36E, 38E)*
53 0.890 0.872 0.897 0.093 730.8
FJ 1st Order 128 0.938 0.935 0.945 0.067 962.8 FJ 2nd Order 128 0.938 0.935 0.945 0.067 962.8 FJ Bifactor 111 0.950 0.941 0.957 0.063 765.5 FJ Single construct 129 0.880 0.866 0.887 0.096 1855.30 FJ Single construct (44F, 45F, 73J)*
88 0.892 0.878 0.898 0.101 1412.30
* indicates excluded items from the model

117
Summary of Results
The results presented in this chapter provided a moderate to strong validity and reliability
of the items and constructs attempting to measure the implementation levels of PLCs. There
were concerns with the multiple loadings of items and elements. Although there might be
overlap in the concepts that they are attempting to measure in the element and items, the
statistical validation indicated a substantial amount of crossover. The second pilot study provided
stronger results in the EFA, CFA, and reliability when compared to the first pilot study results.
However based on the results, there are still elements with weaker reliability and multiple cross
loadings. In the final chapter, we discuss the findings of this study, future research
recommendations, and limitations of this study.

118
CHAPTER 5
DISCUSSION
Richard DuFour (2007), one of the most prolific writers of PLCs, wrote an article titled,
Professional Learning Communities: A Bandwagon, an Idea Worth Considering, or Our Best
Hope For High Levels Of Learning? In the article, he captured the two most pressing dilemmas
of PLCs and essentially verified the purposes for conducting this research. The first dilemma
DuFour proposed was that educators were confused about what a PLC was. PLCs have been so
quickly defined, described, listed, bought, sold, and tried on as the trendiest effort for schools
scrambling to help improve student scores that PLCs might be in jeopardy of losing all meaning.
The second dilemma DuFour described was that if educators wanted to determine the influence
of a PLC in their school, a way to “determine if PLC practices were actually in place in the
school” (DuFour, 2007, p. 4) must be developed. These two dilemmas captured the problems of
this study. The two problems as stated previously are the lack of consensus among PLC elements
and models and the lack of validated instruments to measure them. Focusing on these two
problems, the research team identified ten elements describing a PLC from the literature and then
created the LCCI. It then became my purpose for this research as a member of the research team
and as an independent researcher to ensure that what we had identified and created was valid and
reliable in measuring PLCs so that the LCCI could be used to measure PLCs in schools.
A tool can have many different uses. A tool can help to build something. It can help to
measure something. It can also be used to destroy something. How do researchers know if the
tool is accurately measuring something? Some tools are so simple in their measurements that the
result can only provide a near estimation. Some tools that have been calibrated and well
developed can measure with specific exactness. For example, some tools are used to measure in

119
feet while others are used to measure in inches or even millimeters. As with any tool, it needs to
be useful and functional for the intended purpose for which it was created, otherwise it is not
worth using. The LCCI is a tool. It was created as a tool for schools. More specifically, it was
created as a tool to help educators help students. It was also created to help educators build
PLCs, and PLCs are implemented to help students learn at higher levels. The purpose of this
study was to determine if the LCCI was accurate and exact in measuring a PLC. The results
showed that the LCCI did measure PLC levels within schools. The results also showed that the
LCCI was practical and could be used by educators in schools to develop their PLC strategically.
In this chapter, we will share why these conclusions can be made.
In order to address the purposes of this research methodically and effectively, we
determined specific research questions for deciding on the best plan for determining the validity
and reliability of the LCCI. The plan proved to be a solid process in modifying, measuring, and
gauging the validity of this instrument. As with any work, there are limitations and
recommendations for the next steps, but a more important question to address in this chapter is
how will the results of this research help schools and in turn help students?
Problems and Purpose of the Research
We started this study because of the problems that emerged in the literature as our
research team worked with principals who were learning and studying the concepts of PLCs. As
principals were reaching the second year in implementing PLC strategies, they were looking for
a way to see if their efforts in building PLCs were successful. As we considered existing
measures of PLCs, we detected a lack of agreement among the prominent PLC elements by
experts in the field. We also found that there was a shortage of validated instrument to measure
the degree to which critical PLC elements were functioning in implementing schools. In an

120
attempt to solve these problems, the research team identified ten elements that grew out of our
examination and analysis of the authoritative and scholarly literature. We then built a survey that
could measure schools against these ten elements and provide a degree to which educators in the
schools were implementing the PLC elements. We systematically analyzed and refined the LCCI
through an iterative process that was constantly informed by each phase’s measures. In order to
frame this study, we asked three questions to guide this work.
1. Does the LCCI measure unique individual elements of PLCs?
2. Does the LCCI measure an overall level of PLC?
3. Is the LCCI a valid and reliable measure of PLCs?
These questions framed the research we conducted, and the responses to the questions provided
additional evidence in drawing the conclusions that the LCCI was a valid and useful survey tool
for educators trying to create PLCs in schools.
Research question 1: Does the LCCI measure unique individual elements of PLCs?
One of the strongest evidences of this research was that the LCCI did measure unique
individual elements of a PLC. The strength of this evidence came from the fit indices of the
models of the factor analysis from both validations for each individual element. Another strength
came from the bifactor model. Conceptually, the bifactor model tested questions 1 and 2
together. The bifactor models showed that the best explanation of the data came when the
individual elements were simultaneously measured together with the overall PLC measure.
These results gave evidence that the LCCI measured unique individual elements of PLCs.
Research question 2: Does the LCCI measure an overall level of PLCs?
After revising many of the items and elements based on the results of the pilot and first
statistical validation, the models showed evidence that the LCCI was measuring an overall level

121
of PLCs. As in question 1, when we included the bifactor model in the analysis, the measures of
fit also improved. This evidence supported the LCCI as measuring an overall construct of PLCs.
Research question 3: Is the LCCI a valid and reliable measure of PLCs?
The four areas of validity addressed in this study are face, content, concurrent, and
construct. Multiple sources provided support in providing evidence of face and content validity
to the instrument. The first support came from the results of the cognitive interviews and written
critiques. Although some respondents suggested revisions to the wording and structure of the
LCCI, most respondents found the items readable and applicable to the element they were
intended to measure. Respondents in the pilot study also provided similar feedback to the
structure and items of the survey. The factor analysis revealed which items needed to be revised,
but for the most part, the items provided adequate evidence that they were appropriately worded.
Based on the rate of missingness and factor analysis, the research team changed the LCCI
structure and a number of survey items. Another measure that provided support for the face and
content validity of the LCCI was the high internal consistency of the elements. We were able to
determine reliability of the instrument by measuring the internal consistency of the LCCI. The
first and second pilot studies of the LCCI gave similar high levels of internal consistency. These
high levels of reliability provided the evidence that the LCCI was a reliable measure. Based on
these findings, the evidence was strong that the LCCI had face and content valid.
Concurrent validity was not clearly supported by the results of the ANOVA test in
comparing whether each PLC level identified by the directors of the Principals Academy were
the same. Although means of each level were different, the results showed that the groups
identified by the directors were not statistically different due possibly in part to a
misidentification of the level of school and that the schools may be exhibiting the J-curve effect.

122
Both questions 1 and 2 provided strong support of content and construct validity to the
LCCI. Establishing that the LCCI measured individual elements and an overall measure of PLC
supported the areas of content and construct validity. The LCCI was a valid and reliable measure
of PLCs. Later we will show additional statistical and practical evidence that also supported the
LCCI as a valid measure of PLCs. Seeing the strength of these results also supported the overall
purpose of this research in developing an instrument that could help educators in their
implementation of PLCs in schools. Using these questions as a framework to guide this research
has also provided a framework in presenting a summary of the conclusions of this work. In
answering the questions, results have shown that the LCCI was a valid measure of the constituent
elements and an overall PLC.
Analysis and Results of the Validation Plan
We used three phases in the process of validating the LCCI: cognitive interviews and
written critiques, first pilot study, and a second pilot study. The phases also included measures to
ascertain the validity and reliability of the LCCI. To determine statistical levels of the validity
and reliability, measurements such as descriptive statistics, factor analysis, structural equation
modeling, and Cronbach’s alpha were used. Within each measurement, we also established
levels of acceptable criteria. The process and measurements were specifically designed to
address the four areas of validity we had chosen to focus on in this study. In order to reflect and
evaluate the process we had chosen, we saw benefits from the types of measurement we had
selected. Each measurement provided an essential view for understanding the data and how the
data represented the measures of the LCCI. Factor analysis provided testing of the theoretical
constructs. Reliability estimates provided testing of the internal consistency of the items. We
were satisfied with the plan used to validate the LCCI. Although including other measures such

123
as test and retest reliability would have provided additional insight into the reliability of the
LCCI, the measures selected gave sufficient evidence to answer the questions of this research
and concluded that the instrument was valid and reliable and had practical application.
Practical Evidence of Validity
In supporting the conclusions of this study, support for face validity and criterion
(concurrent) validity came from the practical evidence. Face validity means that in the text and
organization the test appears to measure what the author was trying to measure (Bryant, 2000).
However, face validity is not whether the test actually measures the idea. The cognitive
interviews, written critiques, and pilot administration of the LCCI provided the evidence of face
validity that the items and structure of the LCCI were trying to measure constructs of PLCs.
Criterion, or more specifically concurrent validity, is how well an instrument can
replicate another established measure of a known indicator of a concept (Bryant, 2000). It is
concurrent in the sense that the two measures of the same idea produce similar results. For
example, if a person measures the temperature outside with a digital thermometer or a mercury
thermometer, both measurements should give similar readings of the temperature. In the pilot
study, we had two measures. The first measure was conducted by the directors of the Principals
Academy. The second measure was through the LCCI. By comparing the LCCI results with the
levels indicated by the directors, we observed that the results were similar. The results of the
pilot study revealed that the LCCI was concurrently measuring levels of PLCs. Measuring the
face and concurrent validity provided the practical evidence of the LCCI. It was practical in that
it was easy to read and understandable in what it was trying to measure. This survey was also
practical in that the survey replicated what outside experts had observed from the studies of
124
schools. Again, this provided support for the conclusion that the LCCI was practical and could
be used in schools to help build PLCs.
Statistical Evidence of Validity
We used statistical means to address the two remaining areas of validity, that is, content
and construct. Content validity is whether the instrument measures everything it was supposed to
measure about a construct (Bryant, 2000). An example would be if a test were created to measure
the types of leader power (French & Raven, 1959), it would include the five areas of power,
namely: legitimate, reward, coercive, expert, and referent. If the test measured only some of the
types of power and not the others, it might be considered to lack content validity. The LCCI
attempted to measure two types of content, namely, individual elements of a PLC and an overall
level of PLC. Based on the identified elements from the literature, all ten elements should be
measured in the LCCI. In measuring an overall PLC, the ten elements were identified as essential
elements of a PLC. Although the theoretical and conceptual model created from the literature
and PLC experts provided some measure of content validity, the results of the factor analysis in
both validations gave additional evidence of content validity. The results were at or near the
criteria that we had established as acceptable.
The final type of validity, often considered the culminating concept of validity (Messick,
1995; Shepard, 1993), was construct validity. Construct validity is whether the measurement
actually measures what the instrument was trying to measure (Bryant, 2000). If a test is trying to
measure whether an individual is able to drive a car, the test, whether through observing the
driver and asking him or her questions about operating a car, should provide a representation of
the actual knowledge and skill of the individual driving a car. Construct validity has an internal
and external component. The internal component is the internal structure of the measurement.

125
The external is representation of the model and the relation to constructs outside of the model.
The internal structure of the LCCI was heavily supported by results of chapter 4 as represented in
the answers to questions 1 and 2. This component was important to consider because it provided
the greatest rationale in supporting the first conclusion of this study that the LCCI was a
structurally valid instrument. However, the concurrent and face validity evidence gave the only
support of external validity. Additional evidence, which will be addressed in the
recommendations, was needed to support the LCCI’s external validity.
Also within construct validity and pertinent to this type of study, two sub-measures of
convergent and divergent validity existed. Convergent validity is the degree to which multiple
measures of a similar construct converge or agree (Bryant, 2000). Divergent validity is a measure
of whether questions from an instrument attempting to measure different constructs are
dissimilar or divergent. Both convergent and divergent validity were assessed in the CFAs and
represented in questions 1 and 2. The testing of whether the LCCI measured individual PLC
elements or question 1, divergent validity or question 2, or provided an overall PLC measure
addressed convergent validity. The greatest evidence in support of these two measures of
construct validity was the results from the bifactor models. The bifactor models tested both
divergent and convergent validity simultaneously and were the best fitting of any model tested.
The statistical evidence that addressed areas of content and construct validity directly
connected to the first conclusion that the LCCI was a valid and reliable instrument that measured
the constituent elements and overall level of PLCs. The face and concurrent validity provided
support for the second conclusion that the LCCI was practical by providing concurrent measures
of PLCs and that it was easy to read and understand what was being measured.

126
Discussion of Implications
We begin this section by asking the question of “so what?” So what if we know that the
LCCI was valid and reliable in measuring the 10 elements that the research team identified in the
literature? What were the implications of this knowledge? We determined two implications for
this knowledge—practical and theoretical.
Practical Implications of the Study
Educators in schools have been spending money and time to implement PLCs. These
educators have made efforts to create instructional teams and to build common assessments and
curriculum standards. Some educators in schools did not implement any strategies of PLCs and
claimed they were a PLC. Other educators were not sure if they were a PLC but extensively
applied PLC strategies. Some educators have studied and implemented the DuFours’ (2006)
model of PLCs. Other educators have studied and implemented Hord’s (1997) model. These
educators wanted to know where they were in establishing a PLC. Where can educators focus
their next efforts? What are the strengths of the PLC in their schools? Why should they invest
time and money in the PLC process without the evidence that it was improving student learning?
The knowledge from this study has implications in these areas. The practical implications of this
knowledge are that now educators have a means of measuring PLCs despite the model they
might follow.
The purpose in creating the LCCI and its contribution to the field of PLCs was to provide
administrators and educators with an accurate measure of how schools are functioning as PLCs.
One practical use of the LCCI is to diagnose the development of individual elements of PLCs in
schools. And similar to the development of individual elements, a second practical use is that the
LCCI can diagnosis and develop the overall PLC in schools. A third practical use of the LCCI is

127
that educators who are considering implementing PLC strategies can use it as a benchmark for
measuring levels of development and growth from one point to the next.
The LCCI can be used to diagnosis current implementation levels of PLC elements in
schools. The diagnosis can be a single initial look or a continual observation of the school over
time. From the diagnosis, the results from the LCCI can provide data so that educators can
identify areas in need of improvement on which to focus their efforts. An example might be
within the element of teaming. If a school has been creating instructional teams and providing
time for these teams to meet, the school leaders might want to know how the teams are
functioning. The LCCI provides levels in which the instructional team is functioning in a specific
area such as common assessments. These teams may have scored high on administering teacher-
made common assessments but scored lower on using the results to differentiate instruction.
Based on these findings, the school leader could plan professional development that specifically
focused on how teachers could use the results of common assessments to modify instruction that
accommodated the needs of students who demonstrated mastery, approached mastery, or who
just did not get it. Repeat administrations of the LCCI may provide monitoring as to how the
team is improving in the element of teaming.
A second use for the LCCI is a measurement of the overall level of PLCs within a school.
District leaders, principals, and teachers can use the LCCI to diagnosis the school-wide level of
PLC implementation. Similar to the individual element diagnosis, the overall measure may
provide general needs of the school in the elements of a PLC. Recommendations for professional
development and goal setting may emerge from the school results.
A third practical use of the LCCI is for educators in schools or districts considering
implementing PLCs to use the LCCI as a tool to gauge initial benchmark levels. These

128
benchmarks provide a baseline from which school leaders can assess their growth on individual
elements or PLCs as a whole. It can also provide school faculties that have not begun the study
or utilization of PLC strategies with evidence that shows how they may be functioning within
individual elements. School leaders could use this information to determine where to focus their
PLC implementation efforts.
A fourth practical use of the LCCI is that it provides a detailed model of what PLCs are
and how they function by using an instrument that has been substantiated statistically. This
model could serve as a vision of what a high functioning PLC would look like. Rather than
relying on general PLC descriptors such as collaborative teaming, systems of prevention and
intervention, or common assessments, the items under each major element put details to that
element. For example, under the element Academic Success for All Students with Systems of
Prevention and Intervention, six items bring specificity to what those systems look like and how
they operate, including identifying students who are not mastering core concepts and
systematically providing them with extra instructional time and support to achieve mastery.
These items provide educators with a clear picture of what their systems of prevention should
look like and how they should function.
The practical uses presented in this section are focused on the day-to-day functions of
schools. However, this knowledge is not limited to the practice of schooling. These findings also
provide important implications for the theoretical base of PLCs.
Theoretical Implications of the Study
As referenced throughout this study, several models of PLCs existed in the literature and
the field. Each model claimed to help improve student learning. Unity and empirical evidence to
support the theory of PLCs was needed in order to substantiate PLCs as a successful and lasting
129
reform that improved student learning. The PLC literature was rich on claims of success but poor
on empirical evidence to substantiate the claims (Wells & Feun, 2007). Anecdotal stories of
success were positive and provided situational and brief moments of support to the PLC models.
However, to build this theory and create a unified framework in which PLCs could be
substantiated as “the most promising strategy for sustained, substantive school improvement”
(DuFour & Eaker, 1998, p. xi), a valid measurement tool was needed. If researchers begin to
study the influence that PLCs had on student achievement, DuFour (2007) acknowledged, “Any
valid assessment of the affect of PLC concepts on a school…would first need to determine if
PLC practices were actually in place in the school” (p. 4). Up until now, only one PLC model
had an instrument--Hord’s (1997) model and Huffman and Hipp’s (2003) modified Hord’s
model.
The final theoretical use that we will describe in this section is using the LCCI as a means
of conducting further research and empirical studies to contribute to the theory of PLCs. Wells
and Feun (2007) stated that the meaning of PLCs are confusing. In their work, they utilized
Hord’s (1997) instrument to measure whether the schools had successfully implemented
DuFour’s (1998) model. They also drew attention to the lack of research linking PLCs to
improved student learning. Multiple models and lists of constituent elements are rampant in the
literature. To provide a foundation to build this research, there is a need for a unified model. The
elements of the LCCI provide this reconceptualization of PLCs in which researchers could begin
a coherent effort to substantiate this reform strategy. This study comes at time when many
authors and researchers have created claims of success with PLCs, but now these claims need to
be substantiated as a real solution for school improvement.

130
Limitations of the Research
Despite trying from the beginning to take methodic and systematic steps to make sure the
research team addressed all the areas of validity in this research, some limitations remained. We
found three limitations as we evaluated the output of this research.
The first limitation was that external validity of this study was limited from the two
administrations of the LCCI to only schools that adhered to a DuFour model of PLCs. The
homogeny of the two administrations specifically located only in Utah might not be reflective of
schools nationwide. This research did not address schools outside of Utah that might be using
different PLC models, but the research team plans to continue the validation in the future.
Another factor limiting the validity of this study was the method of selecting schools to
participate in the validation of the LCCI. Schools were selected in the first pilot study through a
stratified random sample. However, the second piloting of the LCCI was a purposive selection of
two different school districts based on their implementation of PLCs and locations. As identified
by Garson (2007), a limitation with non random samples was that a factor analysis was
considered only exploratory in nature rather than confirmatory. This study might be considered
confirmatory because of the nature of PLCs and their implementation in schools. Educators elect
which reform efforts to utilize in their schools, thus only some schools might choose to
implement PLC ideas. We rationalized the purposive sample of the second administration
because the number of districts utilizing PLCs in all schools was limited. Randomly selecting
schools or districts posed a problem in that first, it was difficult to find schools implementing
PLCs; second, it was difficult to determine whether they were implementing PLCs; and third,
randomly selecting from within a district or state population might identify schools that have no
exposure to PLCs. Before the LCCI, no instrument existed to determine if PLCs under a

131
common conceptualization existed in schools. Finding schools that were implementing PLCs
required identification by experts of PLCs. The purposive samples, although introducing
potential bias, were beneficial in this type of study and provided support in confirming the
structure of the LCCI.
A final limitation of this study was the generalizability of the results of the LCCI from
one school to another. The results of the LCCI were unique to each school in that they captured
the perception of individuals at that school for the time it was administered. Making inferences
about one school and applying those inferences to another school were limited. The results could
not be predictive because they were limited to individuals’ perceptions, which were dynamic and
not reflective of the population. They were also limited because the LCCI measured the level or
degree to which a school implemented a PLC element. The PLC level might be different
throughout the year and for every school.
Recommendations for Future Research and Uses of the LCCI
In review of the results and conclusions of this study, we have determined three areas that
need additional research. Within each area of need, we provide recommendations for addressing
the need. The three areas include the PLC models, the LCCI’s structure, and the validation of the
LCCI. We conclude this section by providing potential uses of the LCCI.
Area 1: PLC Models Recommendation
This study offered a reconceptualization of the model of PLCs by providing 10
identifying elements. This research provided a first step in the confirmation of the new model.
This research revealed evidence that the 10 elements the research team found existing in the
literature linked to an overall idea or construct. Although some questions continue to exist as to
whether certain elements needed to be combined or whether some items in the survey needed to

132
be included with different elements, broadly these elements showed substantial support in
measuring what the research team had deemed to be a PLC. However, linking these elements to
improved student learning, which is the expectation of PLCs, has not been substantiated. This
model provided a framework in which the elements could be tested and studied to see if each
element was essential in a PLC. By having a common list of elements, researchers could study
which elements emerged first in a school or were foundational to building a PLC. Based on this
area of need, we recommend the following.
In order to test this model of PLC, we recommend that future researchers study the
influence of these elements in schools. Some possible outputs as evidence of improvement might
be teacher retention, student achievement, at risk student gains, or graduation rates. Another
beneficial study would be to determine which elements are foundational in beginning a PLC.
Studying longitudinal data from the time a school begins the process of becoming a PLC might
provide evidence as to which elements are foundational or essential in the emerging stages of a
PLC. Connecting elements to student achievement might also show which elements have the
greatest influence on student achievement and thus, might be foundational. Utilizing the existing
theory and research on PLCs, this model encompasses the prominent PLC researchers and
writers. This model not only provides a tool for measuring PLCs, but it also provides a model
that encompasses and extends all other prominent models. Schools will not be limited in
choosing which sources of supporting research to study and build their PLCs if they desire to
measure and gauge levels of implementation. Rather than adhering to only one author or one
researcher such as the DuFour model or Hord model the school faculty may utilize both and be
able to measure both implementations. In this recommendation, we anticipate that other

133
researchers will begin to substantiate the claims of PLCs and connect the lists of elements to
improved student achievement and teacher growth.
Area 2: Structure Learning Community Culture Indicator’s Recommendation
The results presented in chapter 4 and the answers to the research questions presented in
this chapter provided evidence that the structure of the LCCI is not complete. From the first
version to the second version, we made considerable improvement in the elements and items.
Model fits improved and individually the elements appeared quite solid. Simultaneously, more
items began to cross load on to other elements. Theoretically, the items and elements have some
overlap in what they are attempting to measure. For example, element D attempts to measure the
functions of a collaborative team. Within the team are actions of interdependence, trust, data-
based decision making, and continuous assessment that might overlap with school functions of
the same element. The fact that some items load with other elements makes sense and provides
additional evidence that the LCCI is an overall measure of PLCs. Similar to the idea of the
bifactor model in simultaneously testing that both constructs are occurring together, the items
may be indicating that what we are measuring is two ideas together—PLC and the respective
element. Despite the theoretical rationale as to why some items are overlapping, evidence shows
that the overall model is not as strong as was anticipated. The fit of the second order and bifactor
models are only moderate to good. The ten elements need to be revisited and possibly some
elements combined. As we had stated in chapter 4, two pairs had strong loadings together. The
theory supports that they could be combined, but future research in studying the factor structure
would be needed to confirm this theory. There is also evidence of some negative items not
loading that also needs to be addressed. These structural issues of the LCCI lead to the second
recommendation.
134
In making recommendations for future research regarding the structure of the LCCI, we
would recommend that in order to strengthen the relationship among the elements, a deeper
scrutinizing of the constituent items of the survey will show where there is overlap and
similarities and what combinations or changes might be suggested. Semantics, phrasing, and
terminology might be the cause for some items to cross load. These three areas might need to be
revised to provide improved adherence to an element.
Second, we would recommend that the theory of the same elements be revisited to
determine if two pairs of elements should be combined. This would potentially be a combination
of element J with F and element I with E.
Third, we would recommend removing negative items that failed to load in the results of
the EFA. Negative questions might help reduce agreement bias, but if the negative item is
confusing to the participant and not phrased in direct opposite of the intended meaning, it might
prove problematic (Colosi, 2005).
Area 3: Validation of the Learning Community Culture Indicator Recommendation
The results from the validation of the LCCI were encouraging. The results and analysis
of the two administrations indicated that the LCCI was a valid and reliable instrument. Although
the level of validity and reliability was not as strong as we had hoped, it did nonetheless show
evidence of being a valid instrument. However, this study was delimited to two administrations
in the same state. As described earlier, validation is not of the test but in how the data collected
represents the validity (Shepard, 1993). This instrument needs to be tested outside the state of
Utah to increase the external validity.
This study has indicated that any survey or measurement instrument needs to be refined
and revalidated. In the literature, many instruments received single validations (Huffman &

135
Hipp, 2003; Olivier, 2003; SEDL, 2009) and often only a reliability estimate to show validity
(Supovitz, 2002; Tien, Chung, & Tsai, 2005). This study has illustrated the systematic process
involved in reworking and revising an instrument to reach a level of strong validity. Validity is
not solely left to the loadings or fit indices. Validity also involves the theory and application
outside of the models to ascertain its true validity. A survey must be continuously refined and
revalidated as revisions are made.
A final area within the validation of the LCCI that needs to be addressed is the
generalizability of the results. The LCCI measures the perceptions of individuals in a school to
determine how they perceive the level at what they are functioning within the 10 PLC elements
we had identified. The cumulative results might provide a reflection of the educators’
perceptions for that day and time, but the results do not provide conclusive evidence that the
educators were enacting these elements. The LCCI provides a snapshot of the perception of that
school at that time, and the results for one school are not transferable to another school (Cziko,
1992). Longitudinal data might provide a better perception of the school over time. Triangulating
with other forms of measurement might also provide an ability to reach a more solid conclusion.
However, this survey provides only one form. These issues will be addressed in the final
recommendation.
The first recommendation addressed the need to administer the survey to schools utilizing
different models of PLC. As we addressed in the limitations of this study, administering the
LCCI to schools using other models of PLCs would provide greater exposure and validity to the
instrument.
The second recommendation addressing the issue of additional validation of the LCCI is
to refine and revalidate the survey continually. Refining and revising the survey, while

136
simultaneously considering issues of validity and reliability, will provide greater clarity and
organization of the survey. We recommend an additional revision of the LCCI based on this
study’s results and analysis. We would then recommend an additional validation to confirm the
revisions. As mentioned earlier in the reliability section, we recommend additional measures of
reliability and validity. Through constant refinement and revalidation, the LCCI will eventually
reach the point at which it is a stronger and more valid survey instrument.
The final recommendation addresses the interpretation and application of the results from
the LCCI for schools. Although this issue is not directly related to the validation of the LCCI, we
recommend caution be used by educators who hope to generalize the results of the LCCI. The
results from the LCCI are a snapshot of the perception of the faculty of the school. We
recommend the following additional measures to support the findings of the LCCI: impartial
outside observers to study the PLC culture of the school; a survey of the principal’s perception in
how he or she understands the school to be functioning; and longitudinal data collected to show
changes and systematic collection of data to show improvement in student learning and other
indicators of success in school.
Conclusion
From the answers to the research questions to the results of the factor analysis, we have
presented substantial evidence to support the LCCI as a valid and reliable measure of PLCs in
schools. A more important conclusion from this research is that the LCCI can be used in schools
to help measure, build, and develop PLCs to improve student learning. The instrument could be
valid and useful to schools, but the question is “So what?” This research came at a time when
PLCs were being implemented almost rampantly in some schools and often without guidance
and direction. PLCs are operating without substantial research that they do what they are

137
supposed to do, that is, improve learning for all students. This is the “so what.” These results and
conclusions provide schools, teachers, principals, and researchers with a measurement tool to
establish PLCs as an effective reform by empirically connecting the presence of PLCs in schools
with student achievement. This is pivotal information that will reconceptualize PLCs and their
importance. Educators attempting to utilize PLCs need to determine if what they are doing is
actually happening. The LCCI provides that information. Educators in PLC schools often claim
that they can help students learn at higher levels based on the anecdotal stories of support in the
literature, but this reform will be left to single stories until educators and researchers begin to
tangibly connect the elements to student actions. Educators need evidence of which PLC
elements are foundational. They need to know which elements have the greatest influence on
student learning. PLCs need to move from a good idea to an established, supported, and
researched model. Establishing this claim will not only verify what has been done in schools to
help students succeed through implementing PLCs, it will also provide a call for others who have
not considered or have even resisted PLCs to begin developing a PLC.

138
REFERENCES
AERA, APA, & NCME. (1999). Standards for educational and psychological testing.
Washington, DC: American Educational Research Association.
Black, P., & Wiliam, D. (1998). Inside the black box. Phi Delta Kappan, 80(2), 139.
Blankstein, A. (2004). Failure is not an option. Thousand Oaks, CA: Corwin Press.
Blase, J., Blase, J., Anderson, G. L., & Dungan, S. (1995). Democratic principals in action:
Eight pioneers. Thousand Oaks, CA.: Corwin Press.
Bolman, L., & Deal, T. (1997). Reframing organizations. San Francisco: Jossey-Bass.
Bredeson, P. (2003). Designs for learning: A new architecture for professional development in
schools. Thousand Oaks, CA: Corwin Press.
Brown, F. (1983). Principles of educational and psychological testing (3rd ed.). New York: Holt,
Rinehart, & Winston.
Brown, T. (2006). Confirmatory factor analysis for applied research. New York: The Guilford
Press.
Bryant, F. (2000). Assessing the validity of measurement. In L. Grimm & P. Yarnold (Eds.),
Reading and understanding more multivariate statistics. Washington DC: American
Psychological Association.
Bryk, A., Camburn, E., & Louis, K. S. (1999). Professional community in Chicago elementary
schools: Facilitating factors and organizational consequences. Educational
Administration Quarterly, 35(Supplement), 751-781.
Bryk, A., & Schneider, B. (2002). Trust in schools: A core resource for improvement. New
York: Russell Sage Foundation.

139
Buxton, C. A. (2005). Creating a culture of academic success in an urban science and math
magnet high school. Science Education, 89(3), 392-417.
Cameron, D. (2005). Teachers working in collaborative structures: A case study of a secondary
school in the USA. Educational Management Administration & Leadership, 33(3), 311-
330.
Cavanagh, R., & Dellar, G. (1998). The development, maintenance and transformation of school
culture. Paper presented at the American Educational Research Association, San Deigo,
CA.
Center, T. E. (1998). FY 97 report : External evaluation of the Appalachia Educational
Laboratory. Kalamazoo, MI Western Michigan University.
Chen, F. F., West, S. G., & Sousa, K. H. (2006). A comparison of bifactor and second-order
models of quality of life. Multivariate Behavioral Research, 41(2), 189-225.
Clift, R., Johnson, M., Holland, P., & Veal, M. L. (1992). Developing the potential for
collaborative school leadership. American Educational Research Journal, 29(4), 877-
908.
Cohen-Vogel, L. (2005). Federal role in teacher quality: Redefinition or policy alignment?
Educational Policy, 19(1), 25.
Colosi, R. (2005). Negatively worded questions cause respondent confusion. In U. B. o. t.
Census (Ed.), (pp. 2896-2903). Suitland, MD: ASA Section on Survey Research
Methods.
Cooper, J., Ponder, G., Merritt, S., & Matthews, C. (2005). High-performing high schools:
Patterns of success. NASSP Bulletin, 89(645), 2-23.

140
Cremin, L. (1988). American education: The metropolitan experience. New York: Harper &
Row.
Cronbach, L. J. (1971). Test validation. In R. L. Thorndike (Ed.), Educational measurement (2nd
ed., pp. 443-507). Washington DC: American Council on Education.
Cuban, L. (1998). How schools change reforms: Redefining reform success and failure. Teachers
College Record, 99(3), 453-477.
Cziko, G. A. (1992). Purposeful behavior as the control of perception: Implications for
educational research. Educational Researcher, 21(9), 10-27.
Daft, R. (2005). The leadership experience (3rd ed.). Fort Worth: Harcourt Brace College
Publishers.
Darling-Hammond, L. (1990). Instructional policy into practice: The power of the bottom over
the top. Educational Evaluation and Policy Analysis, 12(3), 233-241.
Darling-Hammond, L. (2005). Teaching as a profession: Lessons in teacher preparation and
professional development. Phi Delta Kappan, 87(3), 4.
Darling-Hammond, L., & Bransford, J. (Eds.). (2005). Preparing teachers for a changing world.
San Francisco: Jossey-Bass.
Darling-Hammond, L., Bullmaster, M., & Cobb, V. (1996). Rethinking teacher leadership
through professional development schools. The Elementary School Journal, 96(1), 87-
106.
Datnow, A., Lasky, S., Stringfield, S., & Teddlie, C. (2006). Integrating educational systems for
successful reform in diverse contexts. New York: Cambridge University Press.
Deal, T., & Peterson, K. (Eds.). (2000). Eight roles of symbolic leaders. San Francisco: Jossey-
Bass.

141
Dewey, J. (1900). The school and society. Chicago: The University of Chicago Press.
DuFour, R. (2001). Getting everyone to buy iIn. National Staff Development Council, 24(4), 60-
61.
DuFour, R. (2004). What Is a Professional Learning Community? Educational Leadership,
61(8), 6-11.
DuFour, R. (2007). Professional learning communities: A bandwagon, an idea worth
considering, or our best hope for high levels of learning? Middle School Journal 39(1), 4-
8.
DuFour, R., DuFour, R., & Eaker, R. (2008). Revisiting professional learning communities at
work. Bloomington, IN: Solution Tree.
DuFour, R., DuFour, R., Eaker, R., & Many, T. (2006). Learning by doing. Bloomington, IN:
Solution Tree.
DuFour, R., & Eaker, R. (1998). Professional learning communities at work: Best practices for
enhancing student achievement. Bloomington, IN: National Education Service.
Eastwood, K. W., & Louis, K. S. (1992). Restructuring that lasts: Managing the performance dip.
Journal of School Leadership, 2(2), 212-224.
Eilers, A., & Camacho, A. (2007). School culture change in the making: Leadership factors that
matter. Urban Education, 42(6), 616-637.
Elmore, R. (1996). Getting to scale with good educational practice. Harvard Educational
Review, 66(1), 1-26.
Elmore, R. (2006). School reform: From the inside out. Cambridge, MA: Harvard Education
Press.

142
Erb, T., & Stevenson, C. (1999). Middle school reforms throw a "J-Curve": Don't strike out.
Middle School Journal, 30(5), 45-47.
French, J. R., & Raven, B. H. (1959). The bases of social power In D. Cartwright (Ed.), Studies
in Social Power (pp. 150-167). Ann Arbor, MI: Institute for Social Research, University
of Michigan.
Fullan, M. (1992). Successful school improvement Buckingham, PA: Open University Press.
Fullan, M. (1993). Change forces: Probing the depths of educational reform. New York: Falmer
Press.
Fullan, M. (2005). Professional learning communities writ large. In R. DuFour, R. Eaker & R.
DuFour (Eds.), On common ground: The power of professional learning communities
(pp. 209-223). Bloomington, IN: Solution Tree.
Fullan, M., & Hargreaves, A. (1996). What's worth fighting for in your school. New York:
Teachers College Press.
Gajda, R., & Koliba, C. (2007). Evaluating the imperative of intraorganizational collaboration: A
school improvement perspective. American Journal of Evaluation, 28(1), 26-44.
Garson, G. D. (2007). Quantitative research in public administration Retrieved May 15, 2009,
from http://faculty.chass.ncsu.edu/garson/PA765/structur.htm#assume
Gelberg, D. (1997). The business of reforming American schools. Albany, NY: State University
of New York Press.
Glazer, N. (2003). The American way of school reform. In D. Gordon (Ed.), A nation reformed?
Cambridge, MA: Harvard Education Press.
Glickman, C. D. (2002). Leadership for Learning: How to Help Teachers Succeed. Alexandria,
VA: Association for Supervision and Curriculum Development.

143
Goddard, Y., Goddard, R., & Tschannen-Moran, M. (2007). A theoretical and empirical
investigation of teacher collaboration for school improvement and student achievement in
public elementary schools. Teachers College Record, 109(4), 877-896.
Google. (2009). Google Scholar Retrieved January 13, 2009, from
http://scholar.google.com/scholar?q=Professional+Learning+Communities&hl=en&lr=&
btnG=Search
Graff, G., & Birkenstein, C. (2006). They say I say: The moves that matter in academic writing.
New York, London: WW Norton & Company.
Graham, R. (1972). The school as a learning community. Theory into Practice, 11(1), 4-8.
Gruenert, S. (2000). Shaping a new school culture. Contemporary Education, 71(2), 14-17.
Gruenert, S. (2005). Correlations of collaborative school cultures with student achievement.
NASSP Bulletin, 89(645), 43-55.
Halverson, R., Grigg, J., Prichett, R., & Thomas, C. (2005). The new instructional leadership:
Creating data-driven instructional systems in schools. Madison, WI: Wisconsin Center
for Education Research.
Halverson, R., & Thomas, C. (2007). The role and practices of student services staff as data-
driven instructional leaders. WCER Working Paper No. 2007-1. Retrieved from
Hargreaves, A., & Fink, D. (2006). The ripple effect. Educational Leadership, 63(8), 16-20.
Hart, A. W. (1996). Reconceiving school leadership: Emergent views. The Elementary School
Journal, 96(1), 9-28.
Heck, R. (1992). Principals' instructional leadership and school performance: Implications for
policy development Educational Evaluation and Policy Analysis, 14(1), 21-34.

144
Heller, M., & Firestone, W. (1996). Who's in charge here? Sources of leadership for change in
eight schools. The Elementary School Journal, 96(1), 65-86.
Hopkins, D., & Levin, B. (2000). Government policy and school development. School
Leadership & Management, 20(1), 15-30.
Hord, S. (1997). Professional learning communities: Communities of continuous inquiry and
improvement. Austin, TX: Southwest Educational Development Laboratory.
Hord, S. (Ed.). (2004). Learning together, leading together. New York, Oxford, OH: NSDC &
Teachers College Press.
Hord, S., & Hirsh, S. (2008). Making the promise a reality. In A. Blankstein, P. D. Houston & R.
W. Cole (Eds.), Sustaining professional learning communities. Thousand Oaks, CA:
Corwin Press.
Hoyle, J., & Cornish, E. (2006). Leadership and futuring: Making visions happen. Thousand
Oaks, CA: Corwin Press.
Hubberman, M. (1992). Critical Introduction. In M. Fullan (Ed.), Successful School
Improvement. Buckingham: Open University Press.
Huffman, J. B., & Hipp, K. K. (2003). Reculturing schools as professional learning
communities. Lanham, MD: Scarecrow Education.
Hunt, P., Soto, G., Maier, J., Muller, E., & Goetz, L. (2002). Collaborative teaming to support
students with augmentative and alternative communication needs in general education
classrooms. Augmentative and Alternative Communication, 18, 20-35.
Kelchtermans, G. (2005). Teachers' emotions in educational reforms: Self-understanding,
vulnerable commitment and micropolitical literacy. Teaching and Teacher Education,
21(4), 995-1006.
145
Klem, L. (2000). Structural equation modeling. In L. Grimm & P. Yarnold (Eds.), Reading and
Understanding More Multivariate Statistics. Washington, DC: American Psychological
Association.
Kline, R. (2005). Principles and practice of structural equation modeling. New York: Guilford
Press.
Krajewski, B., & Parker, M. (2001). Active learning: Raising the achievement bar. NASSP
Bulletin, 85(624), 5-13.
Kruse, S. D., & Louis, K. S. (1993). An emerging framework for analyzing school-based
professional community. Paper presented at the Paper presented at the Annual Meeting of
the American Educational Research Association Atlanta, GA
Kruse, S. D., Louis, K. S., & Bryk, A. S. (1995). An emerging framework for analyzing school-
based professional community. In K. S. Louis & S. D. Kruse (Eds.), Professionalism and
Communicty (pp. 23-42). Thousand Oaks, CA: Corwin Press.
Lambert, L. (2003). Leadership Capacity for Lasting School Improvement. Alexandria, VA:
Association for Supervision and Curriculum Development.
Lee, V. E., & Smith, J. B. (1996). Collective responsibility for learning and its effects on gains in
achievement for early secondary school students. American Journal of Education, 104(2),
103-147.
Leithwood, K., Jantzi, D., & Mascall, B. (2002). A framework for research on large-scale
reform. Journal of Educational Change, 3, 7-33.
Levin, B., & Wiens, J. (2003). There is another way: A different approach to education reform.
Phi Delta Kappan, 84(9), 658.
146
Lewis, J., & Caldwell, B. (2005). Evidence-based leadership. Educational Forum, 69(2), 182-
191.
Lipton, M. (1996). Demystifying the development of an organizational vision. Sloan
Management Review, 37(4), 83-93.
Little, J. W. (1990). The persistence of privacy: Autonomy and initiative in teachers' professional
relations. Teachers College Record, 91(4), 509-536.
Louis, K. S., & Kruse, S. (1995). Professionalism and community: Perspectives on reforming
Urban schools. Thousand Oaks, CA.: Corwin Press.
Louis, K. S., & Kruse, S. (1996). Putting teachers at the center of reform: Learning schools.
NASSP Bulletin, 80(580), 9.
Louis, K. S., & Marks, H. (1998). Does professional community affect the classroom? Teachers'
work and student experiences in restructuring schools. American Journal of Education,
106(4), 532-575.
Louis, K. S., Marks, H. M., & Sharon, K. (1996). Teachers' Professional Community in
Restructuring Schools. American Educational Research Journal, 33(4), 757-798.
Lubienski, C. (2001). Redefining "Public" education: Charter schools, common schools, and the
rhetoric of reform. Teachers College Record, 103(4), 634-666.
Mackey, B., Pitcher, S., & Decman, J. (2006). The influence of four elementary principals upon
their schools' reading programs and students' reading scores. Education, 127 (1), 39-55.
Marks, H., & Printy, S. (2003). Principal leadership and school performance: An integration of
transformational and instructional leadership. Educational Administration Quarterly,
39(3), 370-397.

147
Marzano, R., Waters, T., & McNulty, B. (2005). School leadership that works. Alexandria, VA
& Aurora, CO: Association of Supervision and Curriculum Development, Mid-continent
Research for Education and Learning.
Matthews, L. J., & Crow, G. (2003). Being and becoming a principal. Boston: Allyn and Bacon.
McCombs, B. L., & Quiat, M. (2002). What makes a comprehensive school reform model
learner centered? Urban Education, 37(4), 476-496.
McLaughlin, M., & Talbert, J. (1993). What matters most in teachers' workplace context. In J.
W. Little & M. McLaughlin (Eds.), Teachers work: Individuals, colleagues, and contexts.
New York: Teachers College Press.
Messick, S. (1995). Validity of psychological assessment: Validation of inferences from persons'
responses and performances as scientific inquiry into score meaning. American
Psychologist, 50(9), 741-749.
Murphy, J. (2001). The changing face of leadership preparation. The School Administrator, 14-
17.
Newmann, F. M., Smith, B., Allensworth, E., & Bryk, A. S. (2001). Instructional program
coherence: What it is and why it should guide school improvement policy. Educational
Evaluation and Policy Analysis, 23(4), 297-321.
Newmann, F. M., & Wehlage, G. (1995). Successful school restructuring: A report to the public
and educators by the Center for Restructuring Schools. Madison, WI: University of
Wisconsin Press.
O'Donnell, R., & White, G. (2005). Within the accountability era: Principals' instructional
leadership behaviors and student achievement. NASSP Bulletin, 89(645), 56-71.

148
Olivier, D. (2003). Assessing schools as PLCs. In J. Huffman & K. Hipp (Eds.), Reculturing
schools as professional learning communities. Lantham, MD: Scarecrow Education.
Olivier, D., Antoine, S., Cormier, R., Lewis, V., Minckler, C., & Stadalis, M. (2009). Assessing
schools as professional learning communities. Paper presented at the Annual meeting of
the Louisiana Education Research Association, Lafayette, LA.
Parker, F. W. (1894). Talks on pedagogics. New York: E.L. Kellog & Co.
Peterson, K., & Deal, T. (1998). How leaders influence the culture of schools. Educational
Leadership, 56(1), 28-30.
Pogrow, S. (2002). Success for all is a failure. Phi Delta Kappan, 83(6), 463.
Rait, E. (1995). Against the current: Organizational learning in schools. In S. B. Bacharach & B.
Mundell (Eds.), Images of Schools. Thousand Oaks, CA: Corwin Press.
Reise, S., Morizot, J., & Hays, R. (2007). The role of the bifactor model in resolving
dimensionality issues in health outcomes measures. Quality of Life Research, 16(0), 19-
31.
Roberts, S. M., & Pruitt, E. Z. (2003). Schools as Professional Learning Communities:
Collaborative Strategies for Professional Development. Thousand Oaks, CA: Corwin
Press.
Schein, E. (1984). Coming to a new awareness of culture. Sloan Management Review, 25(2), 3-
16.
Schumacker, R., & Lomax, R. (2004). A beginner's guide to structural equation modeling
(Second Edition ed.). Mahwah, NJ: Lawrence Erlbaum Associates.
SEDL. (2009). Assessing a School Staff as a Community of Professional Learners Retrieved
May 28, 2009, from http://www.sedl.org/change/issues/issues71/structure.html

149
Senge, P. (1990). The fifth discipline: The art and practice of the learning organization. New
York: Doubleday.
Senge, P., Cambron-McCabe, N., Lucas, T., Smith, B., Dutton, J., & Kleiner, A. (2000). Schools
that learn. New York: Doubleday.
Senge, P. M., Roberts,C., Ross, R. B.,Smith,B.J.,& Kleiner,A. (1994). The fifth discipline
fieldbook: Strategies and tools for building a learning organization. New York: Currency
Doubleday.
Shepard, L. (1993). Evaluating Test Validity. Review of Research in Education, 19, 405-450.
Smith, B. L., MacGregor, J., Matthews, R., & Gabelnick, F. (2004). Learning communities:
Reforming undergraduate education. San Francisco, CA: Jossey-Bass.
Smith, J. K., Vaughn, C., & Ketchum, D. (2001). Educational reform and the unstilled voice of
progressivism in the twentieth century. American Educational History Journal, 28, 215-
223.
Smylie, M. (1996). From bureaucratic control to building human capital: The importance of
teacher learning in education reform. Educational Researcher, 25(9), 9-11.
Smylie, M., Lazarus, V., & Brownlee-Conyers, J. (1996). Instructional outcomes of school-based
participative decision making. Educational Evaluation and Policy Analysis, 18(4), 181-
198.
Sparks, D. (2005). Leading for transformation in teaching, learning, and relationships. In R.
DuFour, R. Eaker & R. DuFour (Eds.), On Common Ground. Bloomington, IN: National
Educations Service.
Spillane, J. (2005). Distributed leadership. The Educational Forum, 69(2), 143-150.

150
Spillane, J., Halverson, R., & Diamond, J. (2001). Investigating school leadership practice: A
distributed perspective. Educational Researcher, 30(3), 23-28.
Stewart, R., & Brendefur, T. (2005). Fusing lesson study and authentic achievement: A model
for teacher collaboration. Phi Delta Kappan, 86(9), 681-687.
Stiggins, R. (2004). New assessment beliefs for a new school mission. Phi Delta Kappan, 86(1),
22-27.
Stoll, L., Bollam, R., McMahon, A., Wallace, M., & Thomas, S. (2006). Professional learning
communities: A review of the literature. Journal of Educational Change, 7(4), 221-258.
Strube, M. (2000). Reliability and Generalizability Theory. In L. Grimm & P. Yarnold (Eds.),
Reading and Understanding More Multivariate Statistics. Washington DC: American
Psychological Association.
Supovitz, J. (2002). Developing communities of instructional practice. Teachers College Record,
104(8), 1591-1626.
Symonds, W. C. (2006). The reform of school reform. Business Week, 1(3990), 72-75.
Talbert, J. (1991). Boundaries of teachers' professional communities in U.S. high schools. Paper
presented at the American Educational Research Association, Chicago, IL.
Tien, S.-W., Chung, Y.-C., & Tsai, C.-H. (2005). An empirical study on the correlation between
environmental design implementation and business competitive advantages in Taiwan's
industries. Technovation, 25(7), 783-794.
Tschannen-Moran, M., & Hoy, W. K. (2000). A multidisciplinary analysis of the nature,
meaning, and measurement of trust. Review of Educational Research, 70(4), 547-593.
Wall, R., & Rinehart, J. (1998). School-based decision making and the empowerment of
secondary school teachers. Journal of School Leadership, 8(1), 49-64.
151
Weiss, J., & Piderit, S. (1999). The value of mission statements in public agencies. Journal of
Public Administration Research and Theory, 9(2), 193-223.
Wells, C., & Feun, L. (2007). Implementation of learning community principles: A study of six
high schools. NASSP Bulletin, 91(2), 141-160.
Whetten, D. A. (1989). What constitutes a theoretical contribution? Academy of Management
Review, 14(4), 490-495.
Williams, E., Matthews, J., Stewart, C., & Hilton, S. (2007). The learning community culture
indicator: The development and validation of an instrument to measure multi-
dimensional application of learning communities in schools Paper presented at the
University Council for Education Administration Washington DC.
Willis, G. B., Royston, P., & Bercini, D. (1991). The use of verbal report methods in the
development and testing of survey questionnaires. Applied Cognitive Psychology, 5(3),
251-267.
Yamaguchi, J. (1997). Positive vs. negative wording Retrieved May 31, 2009, from
http://www.rasch.org/rmt/rmt112h.htm
Young, E. F. (1900). Isolation in the School. Chicago: The University of Chicago Press.
Zimmerman, J. (2006). Why some teachers resist change and what principals can do about it.
NASSP Bulletin, 90(3), 238-249.
Zmuda, A., Kuklis, R., & Line, E. (2004). Transforming schools: Creating a culture of
continuous improvement. Alexandria, VA: Association of Supervision and Curriculum
Development.
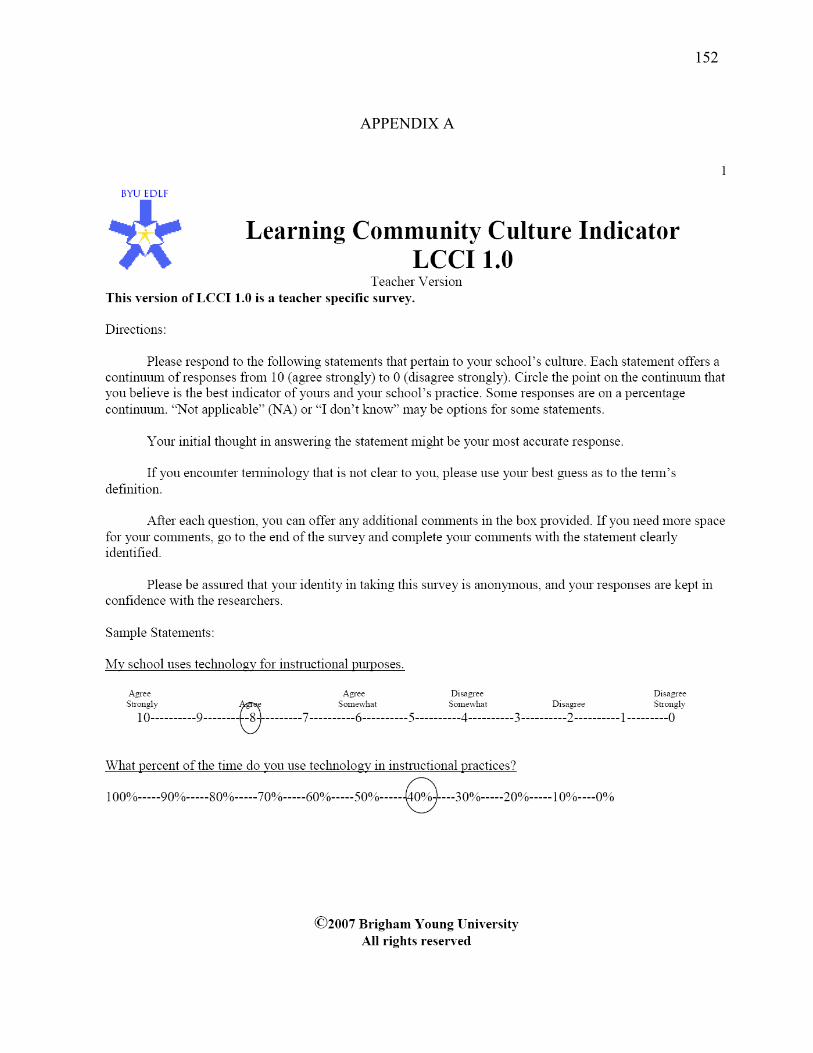
152
APPENDIX A

153

154

155
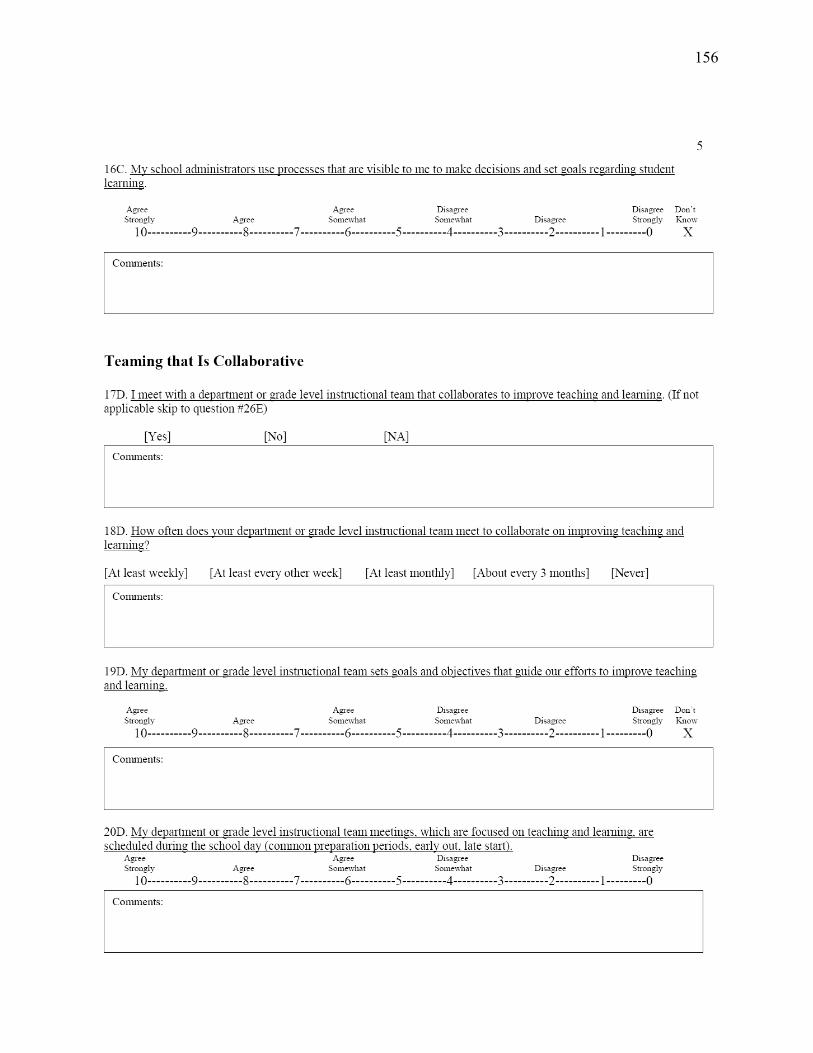
156

157
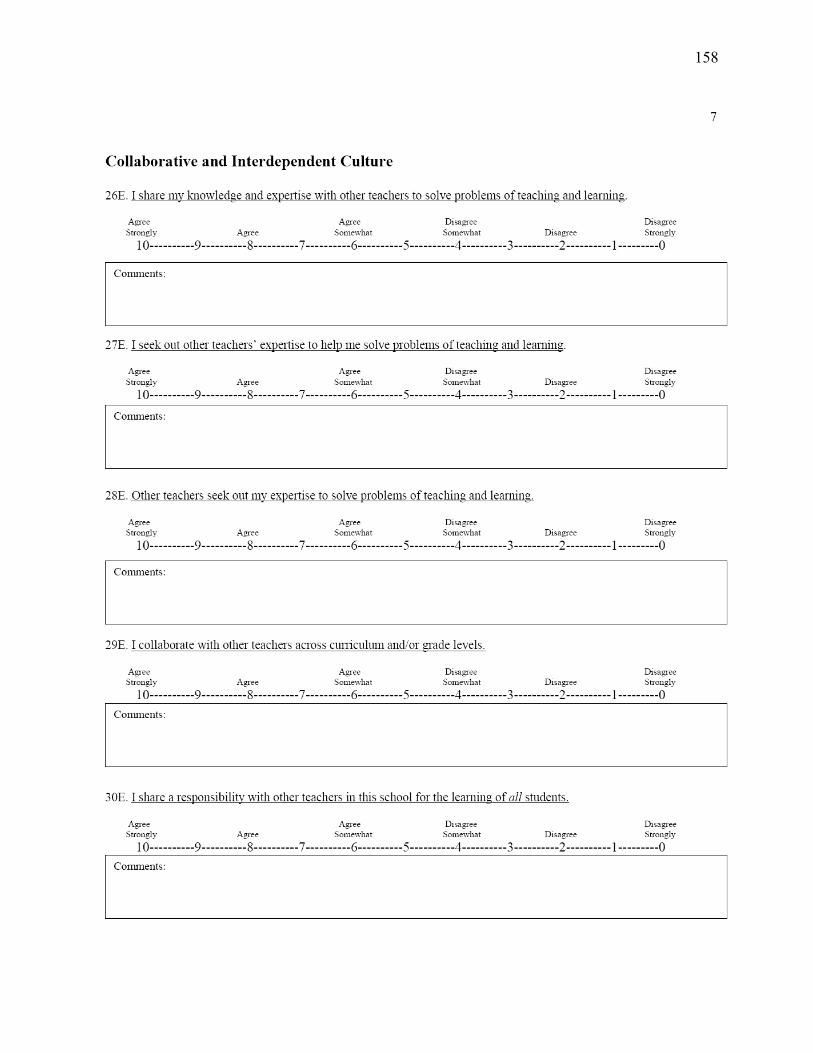
158

159
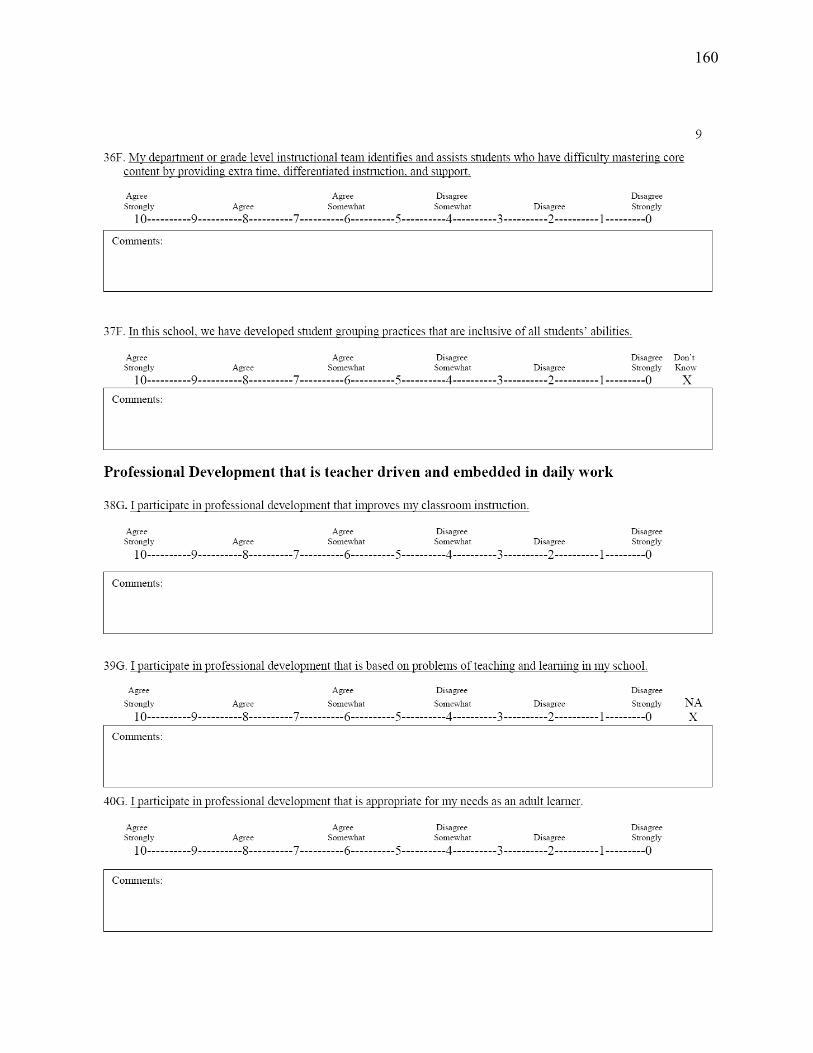
160
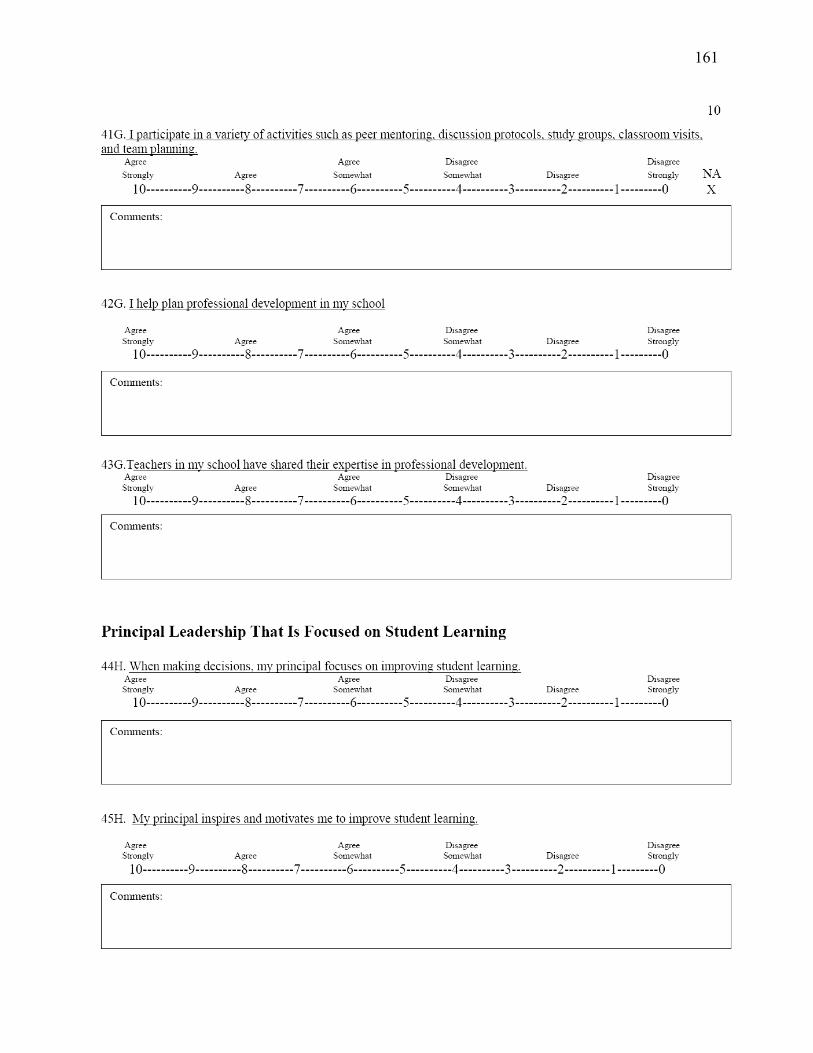
161
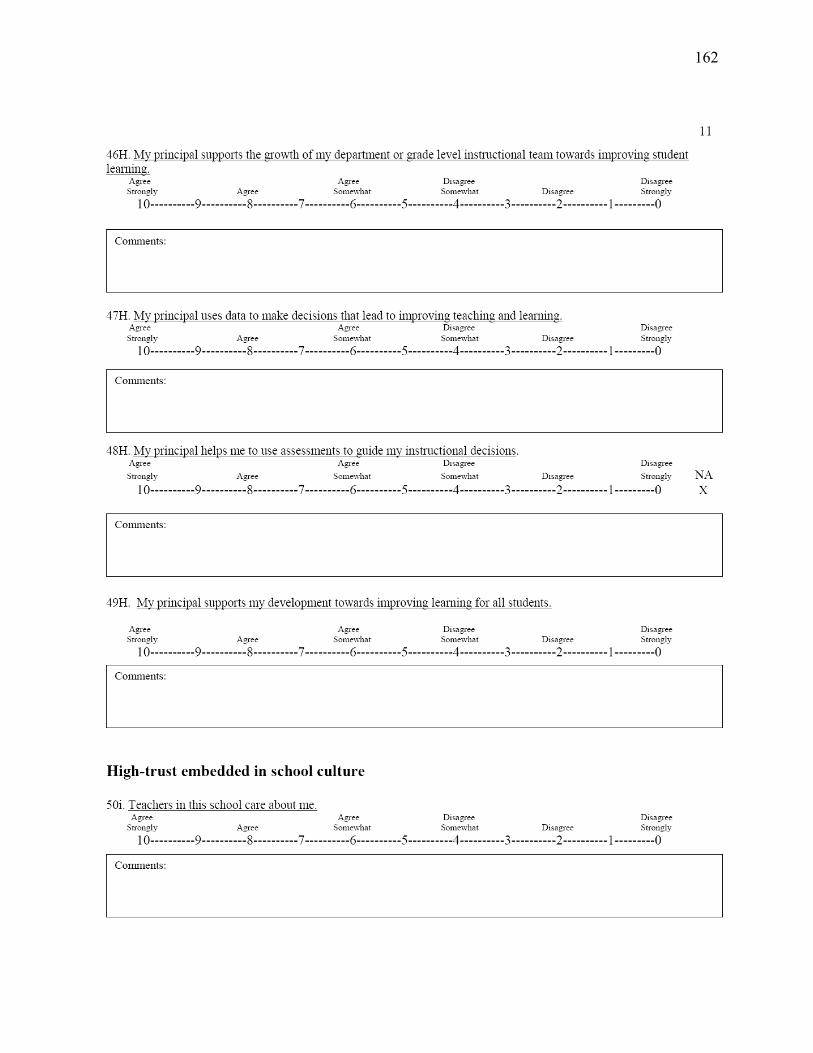
162

163
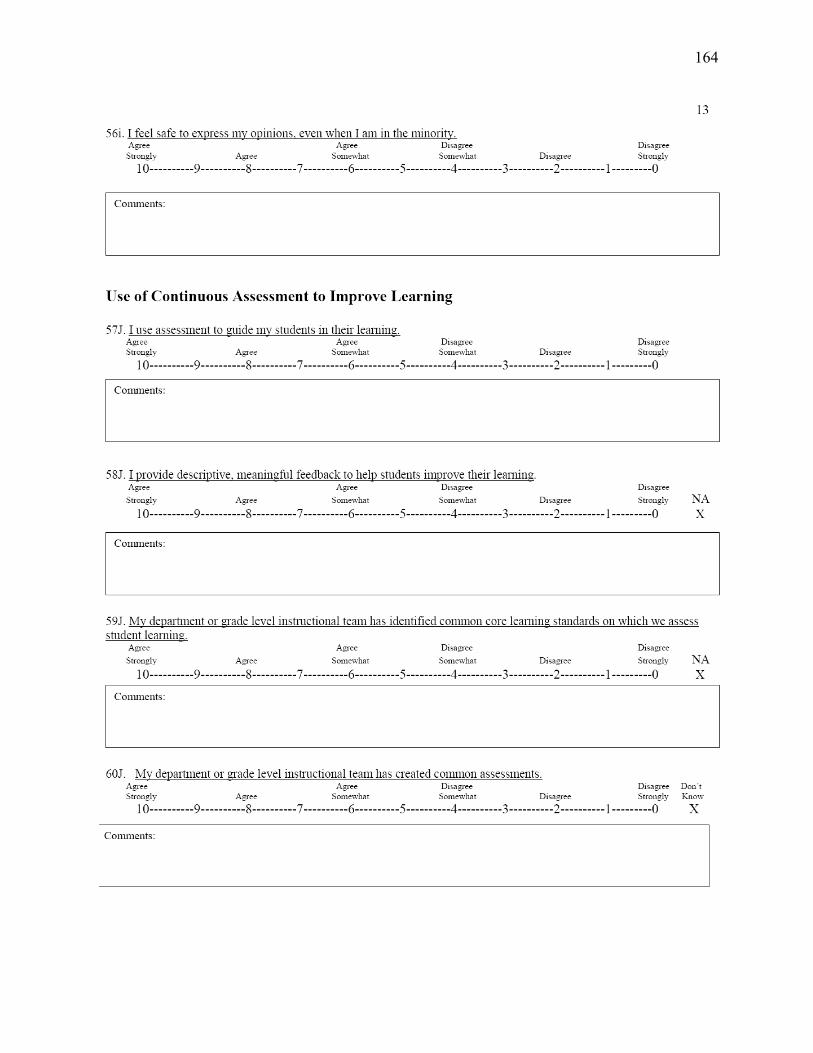
164
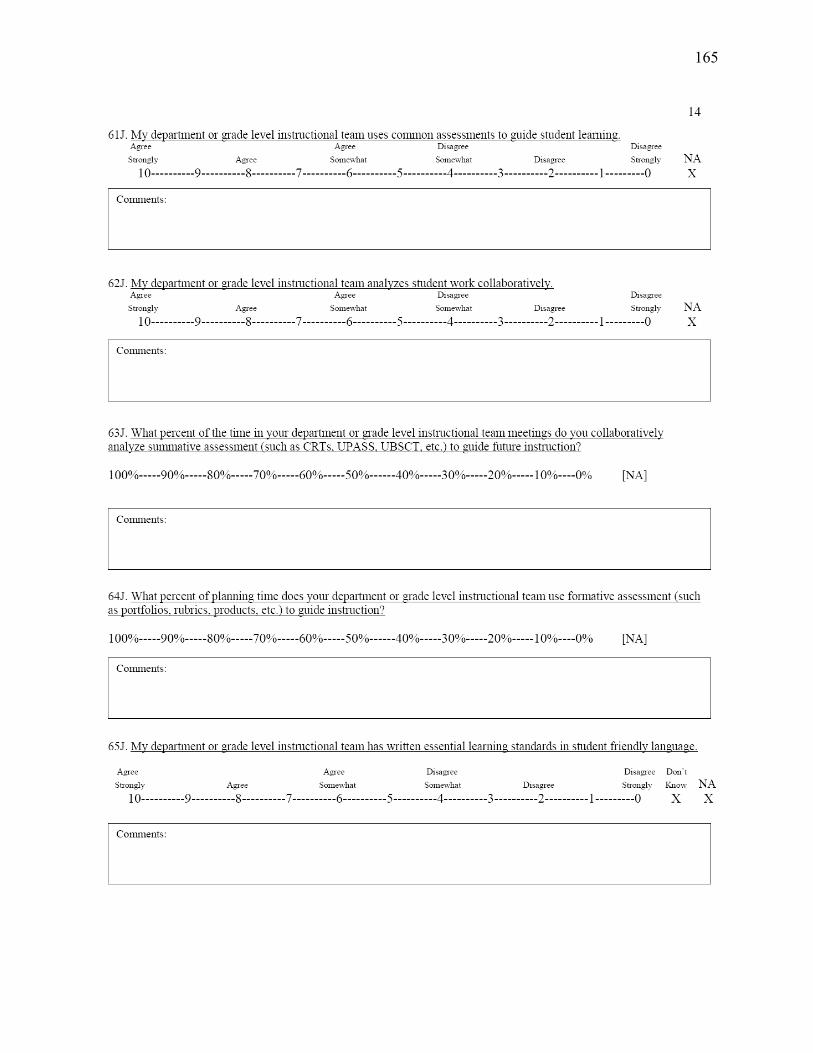
165

166
167

168
APPENDIX B

169
APPENDIX C
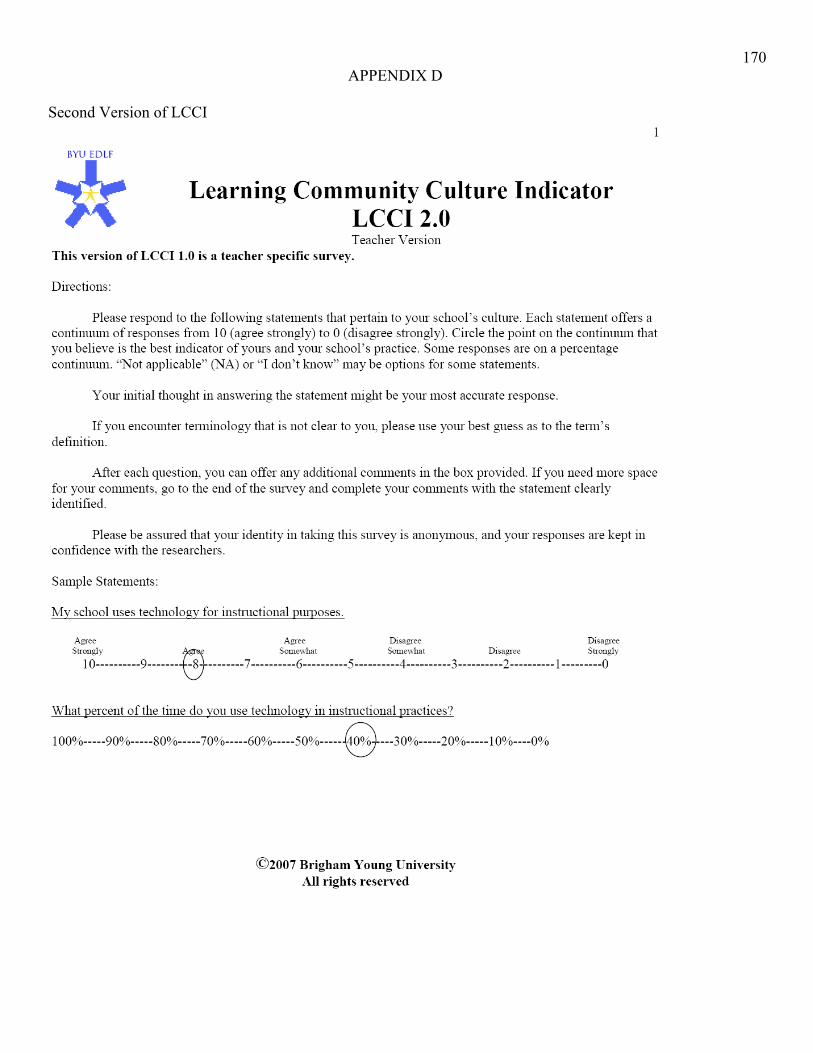
170 APPENDIX D
Second Version of LCCI

171

172

173

174

175

176
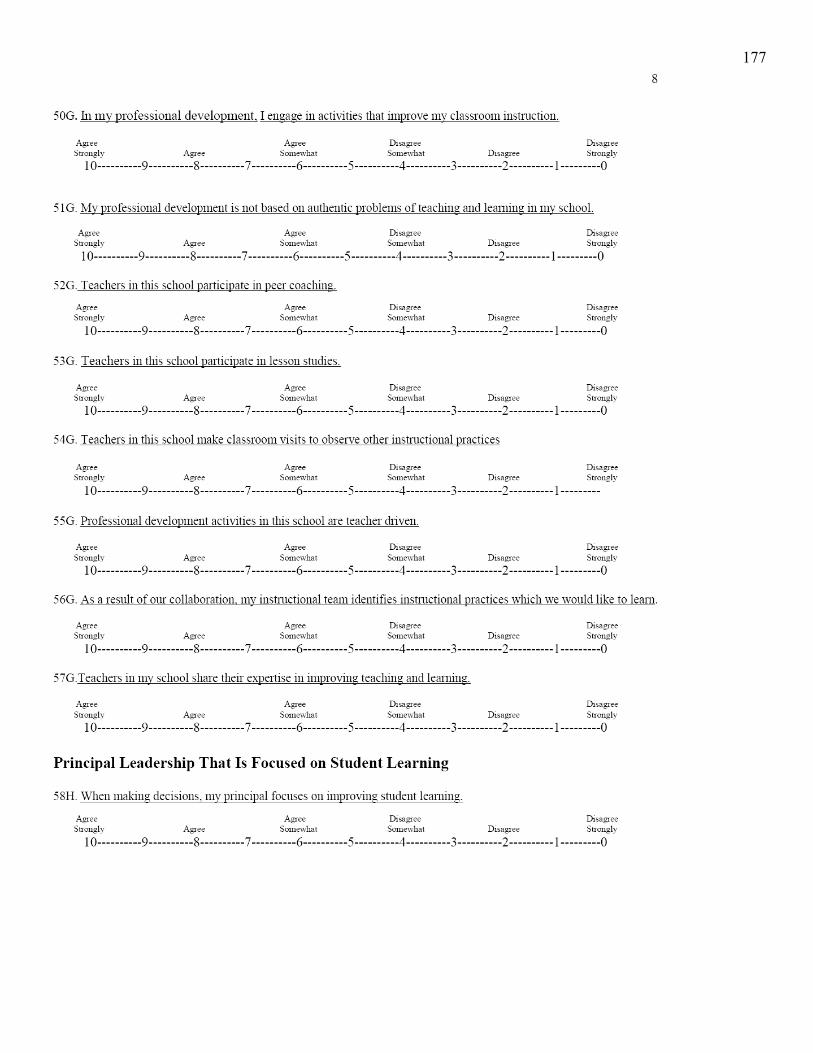
177

178

179

180
181
182 Second Version of LCCI (online)

183

184

185

186

187

188

189
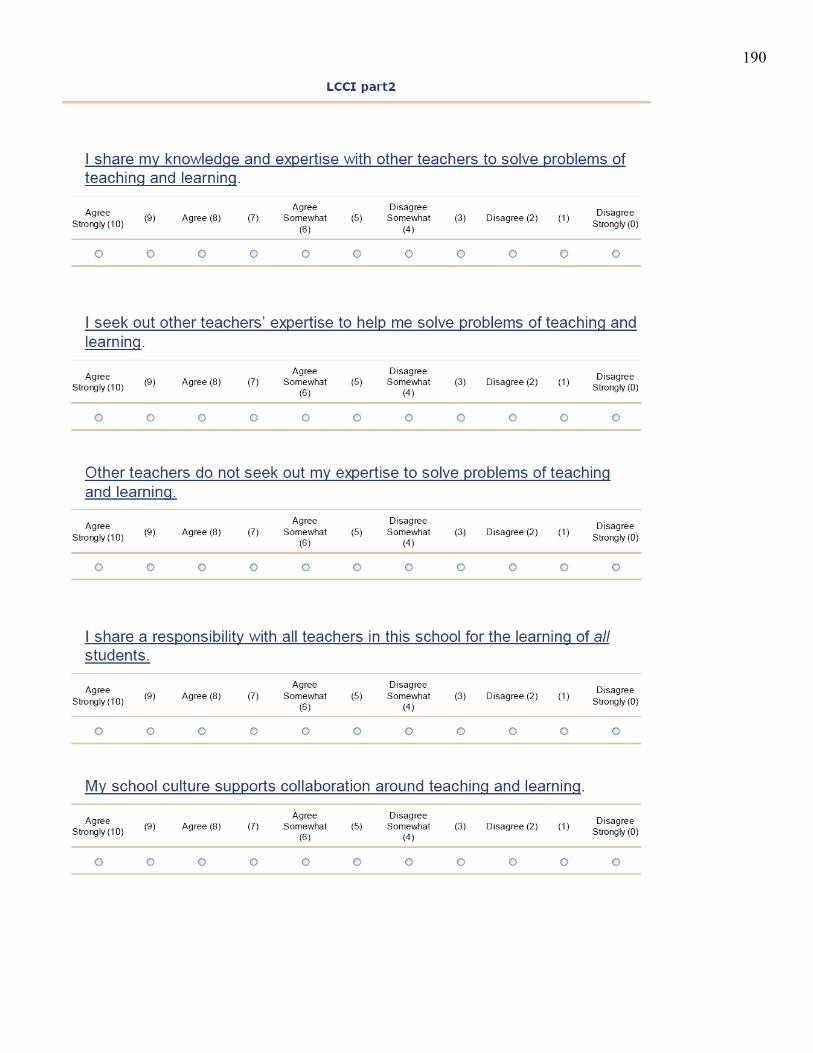
190

191

192
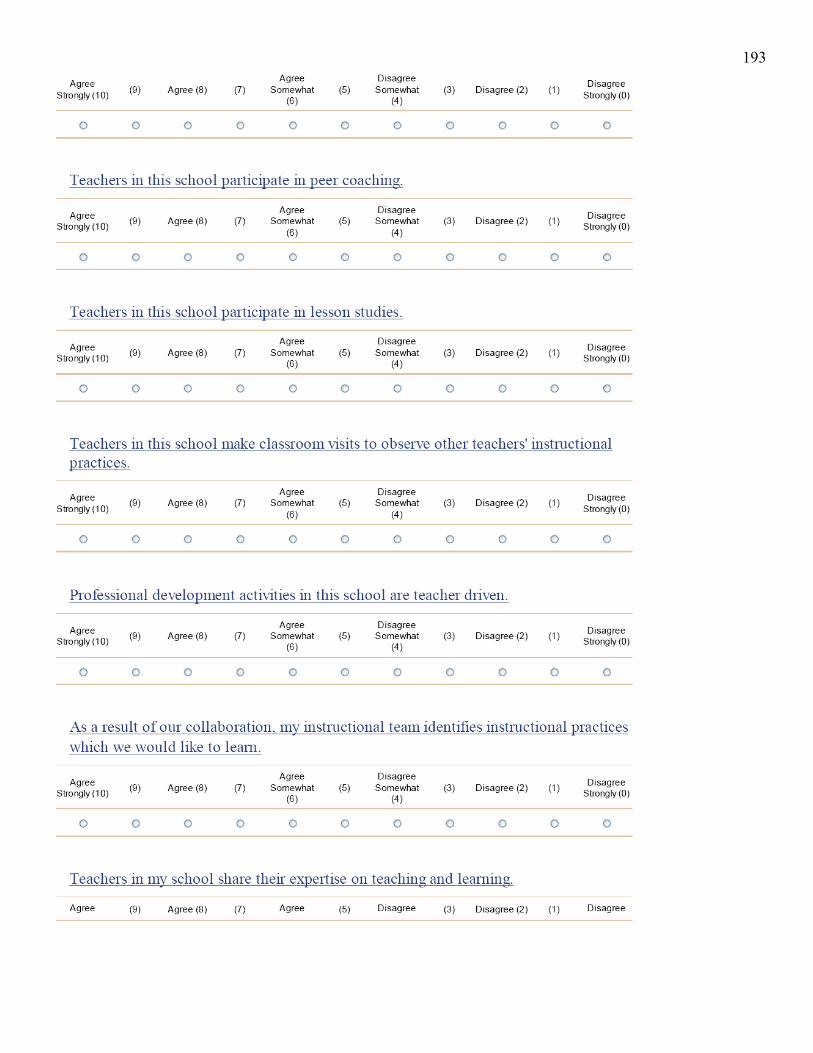
193

194

195

196

197
198
Related Documents