JRAP (1998) 28, 1: 3-1 7 A multidimensional estimation of export base Thomas R. Harris, George E. Ebai, and J. Scott Shonkwiler* University of Nevada, Reno Abstract. One of the most contentious issues in analyzing a region's export base is identifying a region's basic or export activity. Direct surveys to derive a region's export base have been proposed, but direct surveys are expensive, and they experience selection bias and errors by respondents to questionnaires. Several non-survey techniques have been proposed, examined, and refined for computing regional economic base. This paper develops a multidimensional measure of a county's export activity using confirmatory factor analysis. The procedure is applied to five rural Nevada counties to estimate export activity. 1. Introduction One of the most explicit theories of economic development is the demand- oriented export base theory. Export base theory argues that a county's or community's economy may be bifurcated into two sectors: an export or basic sector and a non-export or nonbasic sector (Andrews 1970; North 1956; Tiebout 1956). The basic sector that trades outside its boundaries brings money into the local economy, which provides impetus for future economic development. The nonbasic sector, on the other hand, supplies local consumption of goods and services whose activity depends upon basic sector export sales. External demand for a region's exportable goods and services injects income into the local econ- omy, which in turn augments local demand for non-exportable goods and services (Krikelas 1992). One of the uses of export-base theory is the identification of economic sec- tors that export and the amount of their export sales.' By identifying the export * This research was funded by the University of Nevada Agricultural Experiment Station Project 209, the University Center for Economic Development and the University of Nevada Foundation.

Welcome message from author
This document is posted to help you gain knowledge. Please leave a comment to let me know what you think about it! Share it to your friends and learn new things together.
Transcript
JRAP (1998) 28, 1: 3-1 7
A multidimensional estimation of export base
Thomas R. Harris, George E. Ebai, and J. Scott Shonkwiler* University of Nevada, Reno
Abstract. One of the most contentious issues in analyzing a region's export base is identifying a region's basic or export activity. Direct surveys to derive a region's export base have been proposed, but direct surveys are expensive, and they experience selection bias and errors by respondents to questionnaires. Several non-survey techniques have been proposed, examined, and refined for computing regional economic base. This paper develops a multidimensional measure of a county's export activity using confirmatory factor analysis. The procedure is applied to five rural Nevada counties to estimate export activity.
1. Introduction
One of the most explicit theories of economic development is the demand- oriented export base theory. Export base theory argues that a county's or community's economy may be bifurcated into two sectors: an export or basic sector and a non-export or nonbasic sector (Andrews 1970; North 1956; Tiebout 1956).
The basic sector that trades outside its boundaries brings money into the local economy, which provides impetus for future economic development. The nonbasic sector, on the other hand, supplies local consumption of goods and services whose activity depends upon basic sector export sales. External demand for a region's exportable goods and services injects income into the local econ- omy, which in turn augments local demand for non-exportable goods and services (Krikelas 1992).
One of the uses of export-base theory is the identification of economic sec- tors that export and the amount of their export sales.' By identifying the export
* This research was funded by the University of Nevada Agricultural Experiment Station Project 209, the University Center for Economic Development and the University of Nevada Foundation.
4 T.R. Hanis, G.E. Ebai, and J.S. Shonkwiler
or basic sectors, regional development practitioners can identify factors that influence export sales. If some factors are endogenous to the regional economy, regional development authorities may be able to formulate strategies to strengthen, protect, or expand sectoral export sales. Sectors that do not export and that may be importers of a given good and service also can be identified. By identifying importing sectors, regional economic development practitioners can formulate import substitution strategies that potentially could reverse flows of dollars from the regional economy (Shaffer 1989).
Probably the most expansive use of export-base theory is the development of export-base multipliers for impact analysis. The estimation of sectoral basic and nonbasic employment or income is essential for the estimation of export- base multipliers. The bifurcation of economic sectors often has employed indirect or secondary procedures whose results may differ substantially from direct or primary surveys (Gibson and Worden 1981). Estimation of basic employment through direct or primary procedures, however, has been costly, time-consuming, and subject to selection bias and accuracy errors by respon- dents. As stated by Isserman (1980):
Since there is no systematic correction factor, the analyst should not rely on one set of estimates, but rather should compare results from several approaches coupled with a good working knowledge of the community's economy in order to arrive at the 'best' estimate.
Given Isserman's suggestion, the primary objective of this paper is to develop procedures to allow multidimensional estimation of a region's export base.
2. Study area and data description
Because of the lack of economic interlinkages and the importance of export sales by small rural economies, small economies may be more appropriate for export-base theory than are large metropolitan counties. Blumfield (1955) states that the basic/nonbasic ratio is meaningful only in small and simply structured communities; the larger and more complex (that is, the more 'metropolitan') the community, the less applicable is the ratio and the entire method.
Therefore, we use five rural Nevada counties for this paper. These counties are Elko, Eureka, Lincoln, Nye, and White Pine. All five counties are nonme- tropolitan counties with different characteristics. Elko County has been one of the fastest growing counties in the state of Nevada. Population in Elko County has risen from 17,269 in 1980 to 45,630 in 1996, a 164.2 percent increase. Most
-- -
I Billings (1 969) shows mathematically a similarity between regional input-output and economic base models.
A multidimensional estimation of export base 5
of Elko County's growth can be attributed to expansion in the gold mining and casino/gambling sectors.
Eureka County, a much smaller county, also has realized growth in popula- tion, rising fiom 1,198 in 1980 to 1,650 in 1996, a 37.7 percent increase. The expansion of the Eureka County economy can be attributed to the expansion of gold mining activities. The mining industry accounted for 96 percent of total county employment for Eureka County. Because most of the new mining devel- opments have occurred in northern Eureka County, where little or no housing is available, most of the job force resides in Elko County.
Lincoln County exhibited a slower growth rate in population through the 1980s increasing from 3,732 in 1980 to 4,020 in 1996, an increase of only 7.7 percent. As opposed to many of Nevada's rural counties, mines closed in Lin- coln County during the 1980s. The principal employer in Lincoln County is the Federal Test Site which has experienced lay-offs due to the downsizing of the U.S. military.
Nye County in southern Nevada showed rapid population growth in the 1980s increasing from 9,048 in 1980 to 25,235 in 1996, an increase in popula- tion of 178.9 percent. Southern Nye County has experienced rapid population growth due to the retirement population migrating fiom southern California and because the community of Pahrump has become a bedroom community to Las Vegas. The primary employment sectors in Nye County are the mining and service sectors. Persons employed at the Nevada Test Site are employed in the service sector. Some have proposed that the Yucca Mountain nuclear waste dump be located in Nye County.
White Pine County's population grew fiom 8,167 in 1980 to 10,400 in 1996, a jump of 27.3 percent. Like most of Nevada's rural economies, employ- ment in White Pine County primarily has occurred in the mining and service sectors. The newest national park, Great Basin National Park, is located in White Pine County and may provide impetus for growth in the county's tourism industry.
One digit SIC monthly non-agricultural employment data for the five rural Nevada counties and the nation were collected from January 1970 to December 1992. The one digit SIC sectors were mining; construction; manufacturing; public utilities; trade; finance, insurance, and real estate; services; and govern- ment. These data are used to derive sectoral and county basic and nonbasic employment.
3. Export base definition
One of the most contentious issues facing development of an export-base model or export-base analysis is the identification of a region's basic or export activity. The economic base model is predicated upon the bifurcation of regional
6 T.R. Harris, G.E. Ebai, and J.S. Shonkwiler
economic activity into at least two distinct sectors, export or basic sector and non-export or nonbasic sector. State and county data for development of export- base activity usually cannot be obtained, except at a high cost.
Because of the high cost, potentials9lection bias,-and accuracy errors of respondents, many regional scientists and mnotlric development practitioners have adopted non-survey techniques for identifying basic or export activity. Numerous studies have appeared in the literature devoted to the formulation and refinement of competing non-survey techniques. Richardson (1985) and Isser- man (1980) review and critique non-survey techniques such as the assignment, location quotient, minimum requirements, and Mathur-Rosen techniques. Three non-survey procedures are employed in the current research: (I) the assignment, (2) location quotient, and (3) minimum requirements procedures.
For the assignment approach, two procedures, BASE 1 and BASE 2 are employed. The assignment procedure is the simplest of the procedures to esti- mate export or basic employment. Under assignment procedures, employment within a broad employment category is assigned to either the basic or the non- basic sector. For the BASE 1 procedure, monthly employment data in the mining sector, the construction sector, and the manufacturing sector are aggre- gated as basic sector employment fiom January 1970 to December 1992. Employment in all other sectors is aggregated into nonbasic sectors. For the BASE 2 procedure, only mining sector employment is designated as basic sec- tor. All other sectoral employment for the BASE 2 procedure is aggregated as nonbasic employment.
In contrast to the assignment model, location quotient procedures do not assume that all sectoral employment is entirely basic or nonbasic. Location quo- tients measure specialization in a given economy. If a community or county is highly specialized, the sector must be exporting its goods andlor services to cli- ents outside the region.
The location quotient procedure follows the time-series version developed by Lesage and Reed (1989) and can be stated as:
where:
E, = Employment in sector i in region r in time period t;
E, = Total employment in region r in time period t;
Enit = National (n) employment in sector i in time period t;
En, = Total national (n) employment in time period t; and
LQ, = Location quotient for sector i in region r in time period t. After calculating location quotient values, if LQ, is greater than one, the region is said to be producing more than the expected amount of output in that sector. Hence, the excess is classified as that portion of industry i that is basic employ-
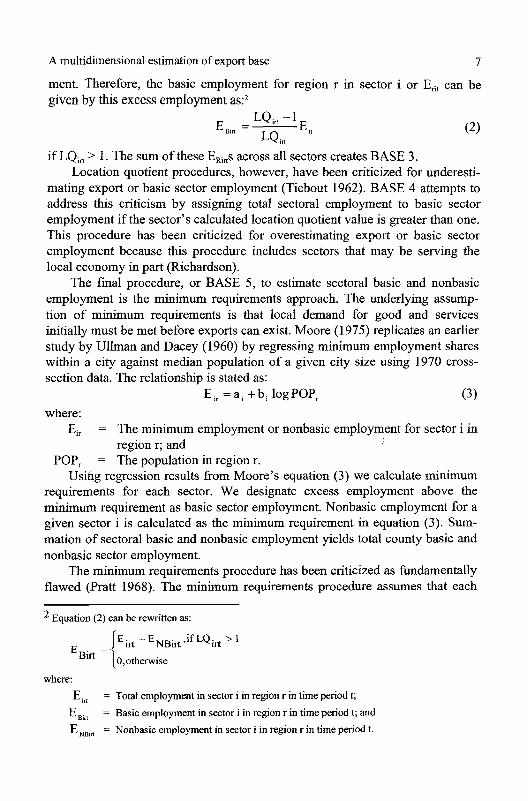
A multidi~nensional estimation of export base 7
ment. Therefore, the basic employment for region r in sector i or E,, can be given by this excess employment as2
LQ, -1 'Ban =- 'it
LQ in
if LQ,, > 1. The sum of these ERins across all sectors creates BASE 3. Location quotient procedures, however, have been criticized for underesti-
mating export or basic sector employment (Tiebout 1962). BASE 4 attempts to address this criticism by assigning total sectoral employment to basic sector employment if the sector's calculated location quotient value is greater than one. This procedure has been criticized for overestimating export or basic sector employment because this procedure includes sectors that may be serving the local economy in part (Richardson).
The final procedure, or BASE 5, to estimate sectoral basic and nonbasic employment is the minimum requirements approach. The underlying assump- tion of minimum requirements is that local demand for good and services initially must be met before exports can exist. Moore (1975) replicates an earlier study by Ullman and Dacey (1960) by regressing minimum employment shares within a city against median population of a given city size using 1970 cross- section data. The relationship is stated as:
E,, = a i +b , logPoPC (3 where:
E,, = The minimum employment or nonbasic employment for sector i in region r; and I
POP, = The population in region r. Ushg regression results from Moore's equation (3) we calculate minimum
requirements for each sector. We designate excess employment above the minimum requirement as basic sector employment. Nonbasic employment for a given sector i is calculated as the minimum requirement in equation (3). Sum- mation of sectoral basic and nonbasic employment yields total county basic and nonbasic sector employment.
The minimum requirements procedure has been criticized as fbndamentally flawed (Pratt 1968). The minimum requirements procedure assumes that each
Equation (2) can be rewritten as:
where:
E,, = Total employment in sector i in region r in time period t;
E,, = Basic employment in sector i in region r in time period t; and
EN,,, = Nonbasic employment in sector i in region r in time period t.
8 T.R. Hanis, G.E. Ebai, and J.S. Shonkwiler
county, except the county with minimum share, produces for export. Therefore, counties must satisfy local demands for a given good or service fiom local pro- duction and no imports of a given good or service exist for internal consumption.
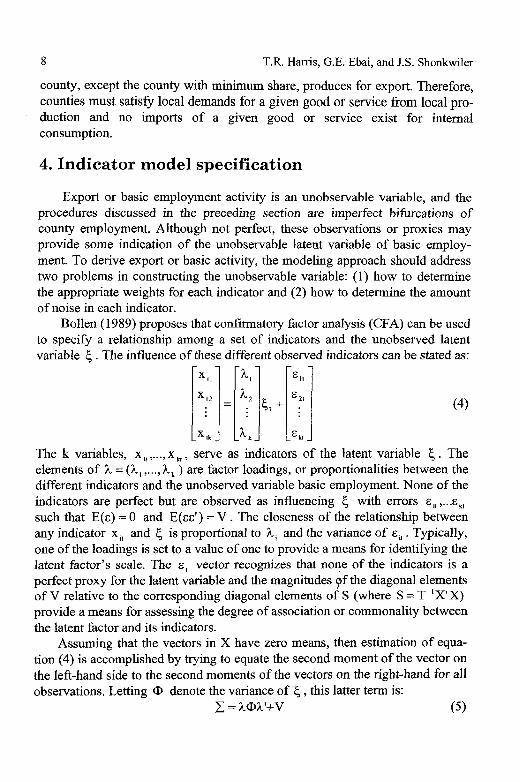
4. Indicator model specification
Export or basic employment activity is an unobservable variable, and the procedures discussed in the preceding section are imperfect bifurcations of county employment. Although not perfect, these observations or proxies may provide some indication of the unobservable latent variable of basic employ- ment. To derive export or basic activity, the modeling approach should address two problems in constructing the unobservable variable: (1) how to determine the appropriate weights for each indicator and (2) how to determine the amount of noise in each indicator.
Bollen (1989) proposes that confirmatory factor analysis (CFA) can be used to specify a relationship among a set of indicators and the unobserved latent variable 6 . The influence of these different observed indicators can be stated as:
The k variables, x,, ,..., x,, , serve as indicators of the latent variable 6 . The elements of h = (A, ,. . ., h, ) are factor loadings, or proportionalities between the different indicators and the unobserved variable basic employment. None of the indicators are perfect but are observed as influencing 5 with errors E,, ,... E,
such that E(E) = 0 and E(EE') = V . The closeness of the relationship between any indicator x , and 5 is proportional to h, and the variance of E,, . Typically, one of the loadings is set to a value of one to provide a means for identifying the latent factor's scale. The E , vector recognizes that none of the indicators is a perfect proxy for the latent variable and the magnitudes gf the diagonal elements of V relative to the corresponding diagonal elements of S (where S = T-'X'X) provide a means for assessing the degree of association or commonality between the latent factor and its indicators.
Assuming that the vectors in X have zero means, then estimation of equa- tion (4) is accomplished by trying to equate the second moment of the vector on the left-hand side to the second moments of the vectors on the right-hand for all observations. Letting @ denote the variance of , this latter term is:
C = h@h'+V ( 5 )
A multidimensional estimation of export base 9
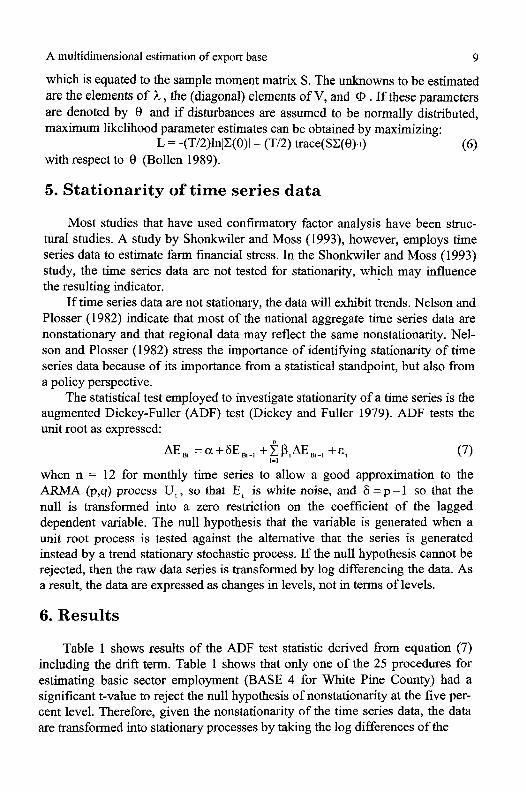
which is equated to the sample moment matrix S. The unknowns to be estimated are the elements of A, the (diagonal) elements of V, and Qj . If these parameters are denoted by 8 and if disturbances are assumed to be normally distributed, maximum likelihood parameter estimates can be obtained by maximizing:
L = -(T/2)lnJC(O)1- (Tl2) trace(SC(8)-1) (6) with respect to 8 (Bollen 1989).
5. Stationarity of time series data
Most studies that have used confirmatory factor analysis have been struc- tural studies. A study by Shonkwiler and Moss (1993), however, employs time series data to estimate farm financial stress. In the Shonkwiler and Moss (1993) study, the time series data are not tested for stationarity, which may influence the resulting indicator.
If time series data are not stationary, the data will exhibit trends. Nelson and Plosser (1982) indicate that most of the national aggregate time series data are nonstationary and that regional data may reflect the same nonstationarity. Nel- son and Plosser (1982) stress the importance of identifiing stationarity of time series data because of its importance from a statistical standpoint, but also from a policy perspective.
The statistical test employed to investigate stationarity of a time series is the augmented Dickey-Fuller (ADF) test (Dickey and Fuller 1979). ADF tests the unit root as expressed:
when n = 12 for monthly time series to allow a good approximation to the ARMA (p,q) process U, , so that E l is white noise, and 6 = p -1 so that the null is transformed into a zero restriction on the coefficient of the lagged dependent variable. The null hypothesis that the variable is generated when a unit root process is tested against the alternative that the series is generated instead by a trend stationary stochastic process. If the null hypothesis cannot be rejected, then the raw data series is transformed by log differencing the data. As a result, the data are expressed as changes in levels, not in terms of levels.
6. Results
Table 1 shows results of the ADF test statistic derived from equation (7) including the drift term. Table 1 shows that only one of the 25 procedures for estimating basic sector employment (BASE 4 for White Pine County) had a significant t-value to reject the null hypothesis of nonstationarity at the five per- cent level. Therefore, given the nonstationarity of the time series data, the data are transformed into stationary processes by taking the log differences of the
10 T.R. Hanis, G.E. Ebai, and J.S. Shonkwiler
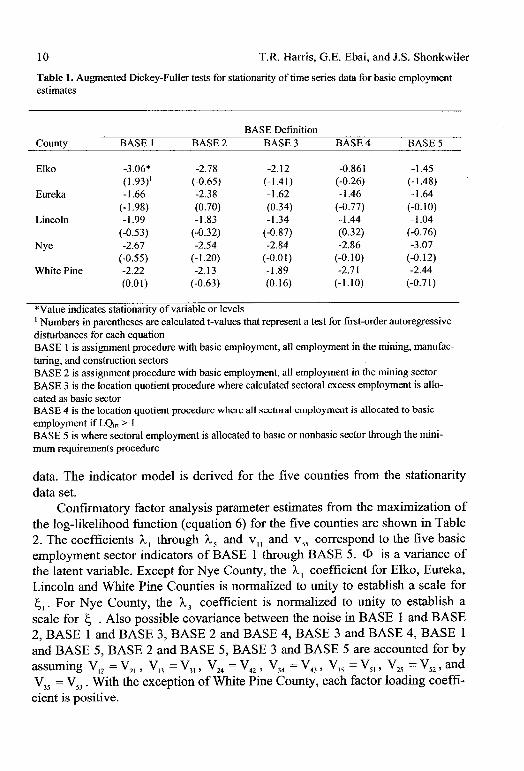
Table 1. Augmented Dickey-Fuller tests for stationarity of time series data for basic employment estimates
BASE Definition County BASE 1 BASE 2 BASE 3 BASE 4 BASE 5
Elk0 -3.06* (1.93)'
Eureka -1.66 (- 1.98)
Lincoln -1.99 (-0.53)
NY e -2.67 (-0.55)
White Pine -2.22 (0.01)
*Value indicates stationarity of variable or levels Numbers in parentheses are calculated t-values that represent a test for first-order autoregressive
disturbances for each equation BASE 1 is assignment procedure with basic employment, all employment in the mining, manufac- turing, and construction sectors BASE 2 is assignment procedure with basic employment, all employment in the mining sector BASE 3 is the location quotient procedure where calculated sectoral excess employment is allo- cated as basic sector BASE 4 is the location quotient procedure where all sectoral employment is allocated to basic employment if LQ,, > I BASE 5 is where sectoral employment is allocated to basic or nonbasic sector through the mini- mum requirements procedure
data. The indicator model is derived for the five counties fi-om the stationarity data set.
Confirmatory factor analysis parameter estimates fi-om the maximization of the log-likelihood function (equation 6) for the five counties are shown in Table 2. The coefficients h, through h, and v,, and v,, correspond to the five basic employment sector indicators of BASE 1 through BASE 5. @ is a variance of the latent variable. Except for Nye County, the h, coefficient for Elko, Eureka, Lincoln and White Pine Counties is normalized to unity to establish a scale for E,, . For Nye County, the h, coefficient is normalized to unity to establish a scale for 6 . Also possible covariance between the noise in BASE 1 and BASE 2, BASE 1 and BASE 3, BASE 2 and BASE 4, BASE 3 and BASE 4, BASE 1 and BASE 5, BASE 2 and BASE 5, BASE 3 and BASE 5 are accounted for by assuming V,, = V,, , V,, = V,, , V24 = V4, , V,, = V,, , V,, = V,, , V,, = V,, , and V,, = V,, . With the exception of White Pine County, each factor loading coeffi- ..
cient is positive.
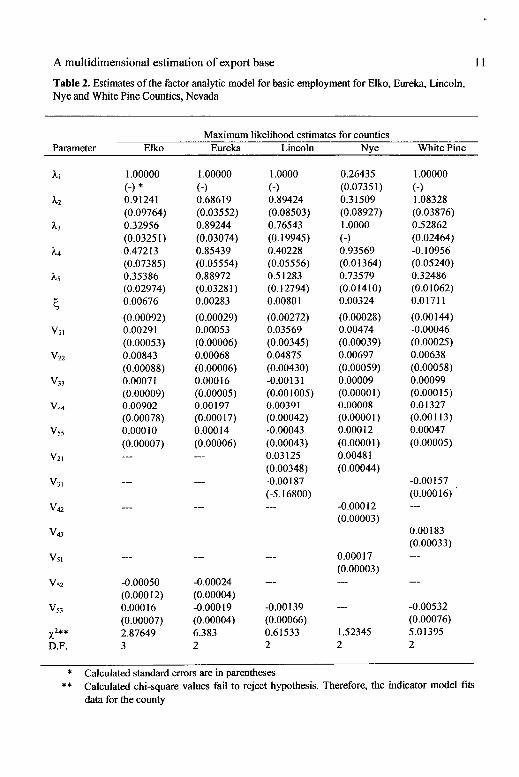
A multidimensional estimation of export base 1 1
Table 2. Estimates of the factor analytic model for basic employment for Elko, Eureka, Lincoln, Nye and White Pine Counties, Nevada
Maximum likelihood estimates for counties Parameter Elko Eureka Lincoln Nve White Pine
xZ**
D.F.
1 .OOOOO 1 .OOOOO 1 .OOOO 0.26435 1 .OOOOO (-) * (-) (-) (0.0735 1) (-1 0.91241 0.68619 0.89424 0.3 1509 1.08328 (0.09764) (0.03552) (0.08503) (0.08927) (0.03876) 0.32956 0.89244 0.76543 1 .OOOO 0.52862 (0.03251) (0.03074) (0.1 9945) (-) (0.02464) 0.47213 0.85439 0.40228 0.93569 -0.10956 (0.07385) (0.05554) (0.05556) (0.01364) (0.05240) 0.35386 0.88972 0.5 1283 0.73579 0.32486 (0.02974) (0.0328 1 ) (0.12794) (0.0 14 10) (0.0 1062) 0.00676 0.00283 0.00801 0.00324 0.01711
(0.00092) (0.00029) (0.00272) (0.00028) (0.00144) 0.00291 0.00053 0.03569 0.00474 -0.00046 (0.00053) (0.00006) (0.00345) (0.00039) (0.00025) 0.00843 0.00068 0.04875 0.00697 0.00638 (0.00088) (0.00006) (0.00430) (0.00059) (0.00058) 0.00071 0.000 16 -0.00131 0.00009 0.00099 (0.00009) (0.00005) (0.001 005) (0.00001) (0.000 15) 0.00902 0.00197 0.00391 0.00008 0.01327 (0.00078) (0.000 17) (0.00042) (0.00001 ) (0.00 1 13) 0.000 10 0.000 14 -0.00043 0.00012 0.00047 (0.00007) (0.00006) (0.00043) (0.00001) (0.00005) --- --- 0.03125 0.0048 1
(0.00348) (0.00044) --- --- -0.00187 -0.00157
(-5.16800) (0.00016) --- --- --- -0.000 12 ---
(0.00003) 0.00 183 (0.00033)
--- --- -- 0.00017 --- (0.00003)
-0.00050 -0.00024 --- --- -- (0.000 12) (0.00004) 0.000 16 -0.00019 -0.00139 -- -0.00532 (0.00007) (0.00004) (0.00066) (0.00076) 2.87649 6.383 0.61533 1.52345 5.01395 3 2 2 2 2
Calculated standard errors are in parentheses Calculated chi-square values fail to reject hypothesis. Therefore, the indicator model fits data for the county
12 T.R. Hams, G.E. Ebai, and J.S. Shonkwiler
The positive factor loading values suggest that each has a positive influence in deriving basic sector employment. The calculated coefficients of deterrnina- tion measures show that the unobserved constructs are adequately represented by their constituent indicator variables. Also, all factor loading parameters for each county are statistically significant. For Elko County the loading with the highest weight is the assignment procedure where all employment in the mining, manufacturing, and construction sectors is designated and aggregated to be basic employment, followed by the second assignment procedure where all mining employment is assigned as basic employment, and the location quotient proce- dure where the entire sector employment is assigned as basic employment if LQ,, > 1. Factor loading for other counties can be derived similarly from Table 2.
In order to assess the validity of the estimated model for each county, a test of overidentifying restrictions implied by the specification is performed. The sample moment S matrix has 15 unique elements of which 12 are estimated, (except 14 in the case of White Pine County), thus there are three overidentify- ing restrictions. A likelihood ratio test of whether these restrictions are consistent with the data generation process (Bollen 1989) yields the test statis- tics reported at the bottom of Table 2. Because the calculated test statistic does not exceed a chi-squared critical value at the five percent level, the overidenti- fying restrictions cannot be rejected. Therefore, it is concluded that the indicator model results for each county found in Table 2 appropriately fit the data.
The square correlation or communality of the degree of association between the individual indicators and the latent factor is given by:
rt2 =I-?,, /I,, (8)
Table 3 reveals the degree of association of the latent variable with its indi- cator. Results vary from county to county, suggesting differences in socioeconomic structure in these five counties. Table 3 shows the calculated values for Elko County BASE 1 through BASE 5 are 0.69, 0.40,0.50,0.14, and 0.89. These statistics suggest that the (marginal) relative importance of the indi- cators in decreasing order is BASE 5 (minimum requirement); BASE 1 (assignment procedure where all mining, manufacturing, and construction sec- tors are allocated to basic; BASE 3 (excess location quotient); BASE 2 (assignment procedures where only mining sector employment is allocated to basic); and BASE 4 (location quotient procedure 2 or all sector employment allocated to basic sector if LQ,, > 1 .) Eureka County follows the same order as Elko. For Lincoln County the relative importance of indicators in descending order is BASE 3, BASE 5, BASE 4, BASE 1, and BASE 2. For Nye County BASE 3 and BASE 4 tie in having the highest importance of indicators followed
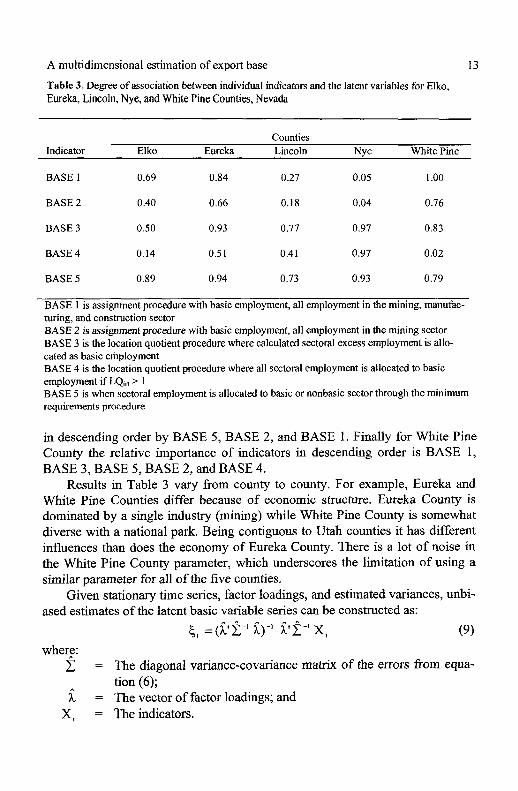
A lnultidimensional estimation of export base 13
Table 3. Degree of association between individual indicators and the latent variables for Elko, Eureka, Lincoln, Nye, and White Pine Counties, Nevada
Counties Indicator Elko Eureka Lincoln NY e White Pine
BASE l 0.69 0.84 0.27 0.05 1 .OO
BASE 2 0.40 0.66 0.18 0.04 0.76
BASE 3 0.50 0.93 0.77 0.97 0.83
BASE 4 0.14 0.5 1 0.41 0.97 0.02
BASE 5 0.89 0.94 0.73 0.93 0.79
BASE 1 is assignment procedure with basic employment, all employment in the mining, manufac- turing, and construction sector BASE 2 is assignment procedure with basic employment, all employment in the mining sector BASE 3 is the location quotient procedure where calculated sectoral excess employment is allo- cated as basic employment BASE 4 is the location quotient procedure where all sectoral employment is allocated to basic employment if LQ,, > 1 BASE 5 is when sectoral employment is allocated to basic or nonbasic sector through the minimum requirements procedure
in descending order by BASE 5, BASE 2, and BASE 1. Finally for White Pine County the relative importance of indicators in descending order is BASE 1, BASE 3, BASE 5, BASE 2, and BASE 4.
Results in Table 3 vary from county to county. For example, Eureka and White Pine Counties differ because of economic structure. Eureka County is dominated by a single industry (mining) while White Pine County is somewhat diverse with a national park. Being contiguous to Utah counties it has different influences than does the economy of Eureka County. There is a lot of noise in the White Pine County parameter, which underscores the limitation of using a similar parameter for all of the five counties.
Given stationary time series, factor loadings, and estimated variances, unbi- ased estimates of the latent basic variable series can be constructed as:
c1 = (22-1 ;)-I 25-1 X I (9) where:
C = The diagonal variance-covariance matrix of the errors from equa- tion (6);
= The vector of factor loadings; and X, = The indicators.
14 T.R. Hams, G.E. Ebai, and J.S. Shonkwiler
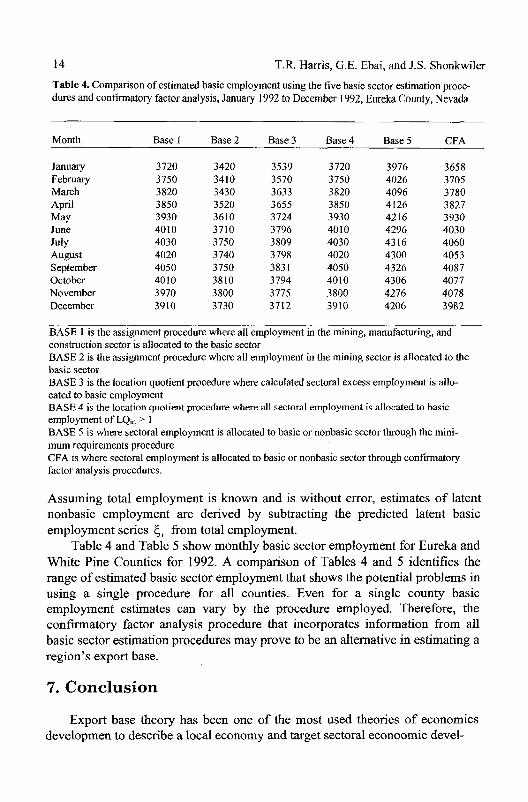
Table 4. Comparison of estimated basic employment using the five basic sector estimation proce- dures and confmnatory factor analysis, January 1992 to December 1992, Eureka County, Nevada
Month Base 1 Base2 Base 3 Base 4 Base 5 CFA
January February March April May June July August September October November December
BASE 1 is the assignment procedure where all employment in the mining, manufacturing, and construction sector is allocated to the basic sector BASE 2 is the assignment procedure where all employment in the mining sector is allocated to the basic sector BASE 3 is the location quotient procedure where calculated sectoral excess employment is allo- cated to basic employment BASE 4 is the location quotient procedure where all sectoral employment is allocated to basic employment of LQ,, > 1 BASE 5 is where sectoral employment is allocated to basic or nonbasic sector through the mini- mum requirements procedure CFA is where sectoral employment is allocated to basic or nonbasic sector through confirmatory factor analysis procedures.
Assuming total employment is known and is without error, estimates of latent nonbasic employment are derived by subtracting the predicted latent basic employment series 6 , from total employment.
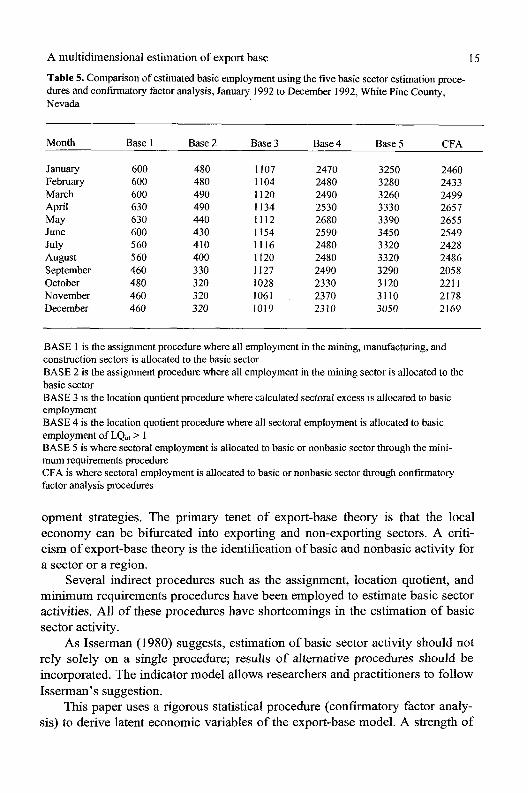
Table 4 and Table 5 show monthly basic sector employment for Eureka and White Pine Counties for 1992. A comparison of Tables 4 and 5 identifies the range of estimated basic sector employment that shows the potential problems in using a single procedure for all counties. Even for a single county basic employment estimates can vary by the procedure employed. Therefore, the confirmatory factor analysis procedure that incorporates information from all basic sector estimation procedures may prove to be an alternative in estimating a region's export base.
7. Conclusion
Export base theory has been one of the most used theories of economics developmen to describe a local economy and target sectoral econoomic devel-
A multidimensional estimation of export base 15
Table 5. Comparison of estimated basic employment using the five basic sector estimation proce- dures and confirmatory factor analysis, January 1992 to December 1992, White Pine County, Nevada
Month Base l Base 2 Base 3 Base 4 Base 5 CFA
January February March April May June July August September October November December
BASE 1 is the assignment procedure where all employment in the mining, manufacturing, and construction sectors is allocated to the basic sector BASE 2 is the assignment procedure where all employment in the mining sector is allocated to the basic sector BASE 3 is the location quotient procedure where calculated sectoral excess is allocated to basic employment BASE 4 is the location quotient procedure where all sectoral employment is allocated to basic employment of LQ,, > 1 BASE 5 is where sectoral employment is allocated to basic or nonbasic sector through the mini- mum requirements procedure CFA is where sectoral employment is allocated to basic or nonbasic sector through confirmatory factor analysis procedures
opment strategies. The primary tenet of export-base theory is that the local economy can be bifurcated into exporting and non-exporting sectors. A criti- cism of export-base theory is the identification of basic and nonbasic activity for a sector or a region.
Several indirect procedures such as the assignment, location quotient, and minimum requirements procedures have been employed to estimate basic sector activities. All of these procedures have shortcomings in the estimation of basic sector activity.
As Isserman (1980) suggests, estimation of basic sector activity should not rely solely on a single procedure; results of alternative procedures should be incorporated. The indicator model allows researchers and practitioners to follow Isserman's suggestion.
This paper uses a rigorous statistical procedure (confirmatory factor analy- sis) to derive latent economic variables of the export-base model. A strength of
16 T.R. Hanis, G.E. Ebai, and J.S. Shonkwiler
confirmatory factor analysis is that it combines the weights and noise of the export base indicators to derive export base employment.
An indicator model employing five alternative basic sector estimation pro- cedures is used for five rural Nevada counties. The monthly employment for each of these five Nevada counties is tested for stationarity. These data nonsta- tionary, and the resulting monthly employment time series is transformed into a stationary process.
Given stationary time series, factor loadings, and estimated variances, unbi- ased estimates of the latent basic variable series can be constructed as shown in equation (9). Assuming total employment is known and is without error, esti- mates of latent nonbasic employment are derived by subtracting the predicted latent basic employment series 5, &om total employment.
This paper employs a rigorous statistical method to determine export-base activity in five rural Nevada counties. First, procedures are employed to bihr- cate the sectoral employment data into basic and nonbasic employment. Second, the employment time series data is tested for stationarity. Third, a confirmatory factor analysis model is applied to a log-differenced data to determine the weights and noise of the indicators. Finally, a factor scores regression model is employed to derive the basic employment time series for these five Nevada rural counties.
References
Andrews, Richard B., "The Problem of Base Measurement," reprinted in Ralph W. Pfouts (ed.), The Techniques of Urban Analysis (West Trenton, NJ: Chandler-Davis, 1970), pp. 65-80.
Billings, Bruce R., "The Mathematical Identity of the Multipliers Derived from the Economic Base Models and the Input-Output Models," Jolrrnal of Regional Science, 9( 1969). pp. 47 1-473.
Blumenfield, H., "The Economic Base of the Metropolis," Jozrrnal of the American Institlrte of Planners. 2 1 (1995), pp. 1 14-132.
Bollen, K.A., Stnrctlrral Eqlrations With Latent Variables (New York: John Wiley and Sons, 1989).
Dickey, David A., and Wayne A. Fuller, "Distribution of the Estimators for Autoregressive Time Series With a Unit Root," Jo~rrnal of the American Statistical Association. 5 (1979). pp. 455- 461.
Fuller, W.A., Meas~rrement Error Models (New York: John Wiley and Sons, 1987).
Gibson, Lay, and Marshall Worden, "Estimating the Economic Base Multiplier: A Test of Altema- tive Procedures," Economic Geography, 57 (1 98 1 ), pp. 146-159.
Issennan, Andrew, "Estimating Export Activity in a Regional Economy: A Theoretical and Empirical Analysis of Alternative Methods," International Regional Science Review. 5 (1980), pp. 155-184.
Krikelas, Andrew W., "Why Regions Grow: A Review of Research on the Economic Base Model," Economic Review: Atlanta Federal Reserve Bank (1992), pp. 16-28.
LeSage, James, and David Reed, "The Dynamic Relationship Between Export, Local and Total Area Employment," Regional Science and Urban Economics, 19 ( 1989), pp. 61 5-636.
A multidimensional estimation of export base 17
Moore, Craig, "A New Look at the Minimum Requirements Approach to Regional Economic Analysis," Economic Geography, 5 1 (1 975), pp. 350-356.
Nelson, Charles R., and Charles I. Plosser, 'Trends and Random Walks in Macroeconomic Time Series: Some Evidence and Implications," Joltrnal o f Monetary Economics, 10 (1982), pp. 139-162.
Nevada State Demographer's Office, Nevada Population Projections and Forecasts 1997-201 7 and Review ofMethods (Nevada Department of Taxation, Carson City, Nevada, 1997).
North, Douglas C., "Location Theory and Regional Economic Growth," Journal of Political Econ- omy, 63 (1955), pp. 243-258.
Pratt, Richard, "An Appraisal of the Minimum Requirements Technique," Economic Geography, 44 (1968), pp. 177-124.
Richardson, Hany, "Economic Base and Input-Output Models," Journal of Regional Science, 25 (1 985), pp. 607-662.
Shaffer, Ron, Community Economies: Economic Sfructure and Change in Smaller Communities (Ames, Iowa: Iowa State University Press, 1989).
Shonkwiler, J. Scott, and Charles B. Moss, "A Multidimensional Index of Financial Stress in the Farm Sector," Social indicators Research. 29 ( 1993), pp. 307-3 16.
Tiebout, Charles, The Community Economic Base Study, Supplementary Paper 16 (New York: Committee for Economic Development, I 962).
Tiebout, Charles M., "Exports and Regional Economic Growth," Journal of Political Economy, 64 (1956), pp. 160-169.
Ullman, E., and M. Dacey, "The Minimum Requirements Approach to the Urban Economic Base," Papers,fir Regional Science Association, 6 (1 960), pp. 175-1 94.
Related Documents