Atmos. Meas. Tech., 14, 4255–4277, 2021 https://doi.org/10.5194/amt-14-4255-2021 © Author(s) 2021. This work is distributed under the Creative Commons Attribution 4.0 License. A multi-purpose, multi-rotor drone system for long-range and high-altitude volcanic gas plume measurements Bo Galle 1 , Santiago Arellano 1 , Nicole Bobrowski 2,3 , Vladimir Conde 1 , Tobias P. Fischer 4 , Gustav Gerdes 5 , Alexandra Gutmann 6 , Thorsten Hoffmann 6 , Ima Itikarai 7 , Tomas Krejci 8 , Emma J. Liu 9,10 , Kila Mulina 7 , Scott Nowicki 4,11 , Tom Richardson 12 , Julian Rüdiger 6 , Kieran Wood 12 , and Jiazhi Xu 1 1 Department of Earth, Space and Environment, Chalmers University of Technology, 41296, Gothenburg, Sweden 2 Institute for Environmental Physics, University of Heidelberg, 69120 Heidelberg, Germany 3 Max Planck Institute for Chemistry, 55128 Mainz, Germany 4 Department of Earth and Planetary Sciences, University of New Mexico, Albuquerque, NM 87131, USA 5 Gerdes solutions AB, 128 41, Stockholm, Sweden 6 Department of Chemistry, Johannes Gutenberg University, 55099 Mainz, Germany 7 Rabaul Volcano Observatory, P.O. Box 386, Rabaul, Papua New Guinea 8 HAB Electronic AB, 34140, Ljungby, Sweden 9 Department of Earth Sciences, University of Cambridge, Cambridge, CB2 3EQ, UK 10 Department of Earth Sciences, University College London, London, WC1E 6BS, UK 11 Quantum Spatial, Inc., Albuquerque, NM, USA 12 Department of Aerospace Engineering, University of Bristol, Bristol, BS8 1TR, UK Correspondence: Bo Galle ([email protected]) and Santiago Arellano ([email protected]) Received: 11 November 2020 – Discussion started: 14 December 2020 Revised: 10 March 2021 – Accepted: 26 April 2021 – Published: 9 June 2021 Abstract. A multi-rotor drone has been adapted for studies of volcanic gas plumes. This adaptation includes improved capacity for high-altitude and long-range, real-time SO 2 con- centration monitoring, long-range manual control, remotely activated bag sampling and plume speed measurement ca- pability. The drone is capable of acting as a stable plat- form for various instrument configurations, including multi- component gas analysis system (MultiGAS) instruments for in situ measurements of SO 2 ,H 2 S, and CO 2 concentrations in the gas plume and portable differential optical absorption spectrometer (MobileDOAS) instruments for spectroscopic measurement of total SO 2 emission rate, remotely controlled gas sampling in bags and sampling with gas denuders for posterior analysis on the ground of isotopic composition and halogens. The platform we present was field-tested during three cam- paigns in Papua New Guinea: in 2016 at Tavurvur, Bagana and Ulawun volcanoes, in 2018 at Tavurvur and Langila vol- canoes and in 2019 at Tavurvur and Manam volcanoes, as well as in Mt. Etna in Italy in 2017. This paper describes the drone platform and the multiple payloads, the various measurement strategies and an algo- rithm to correct for different response times of MultiGAS sensors. Specifically, we emphasize the need for an adaptive flight path, together with live data transmission of a plume tracer (such as SO 2 concentration) to the ground station, to ensure optimal plume interception when operating beyond the visual line of sight. We present results from a compre- hensive plume characterization obtained during a field de- ployment at Manam volcano in May 2019. The Papua New Guinea region, and particularly Manam volcano, has not been extensively studied for volcanic gases due to its re- mote location, inaccessible summit region and high level of volcanic activity. We demonstrate that the combination of a multi-rotor drone with modular payloads is a versatile solu- tion to obtain the flux and composition of volcanic plumes, even for the case of a highly active volcano with a high- altitude plume such as Manam. Drone-based measurements offer a valuable solution to volcano research and monitor- ing applications and provide an alternative and complemen- Published by Copernicus Publications on behalf of the European Geosciences Union.

Welcome message from author
This document is posted to help you gain knowledge. Please leave a comment to let me know what you think about it! Share it to your friends and learn new things together.
Transcript

Atmos. Meas. Tech., 14, 4255–4277, 2021https://doi.org/10.5194/amt-14-4255-2021© Author(s) 2021. This work is distributed underthe Creative Commons Attribution 4.0 License.
A multi-purpose, multi-rotor drone system for long-range andhigh-altitude volcanic gas plume measurementsBo Galle1, Santiago Arellano1, Nicole Bobrowski2,3, Vladimir Conde1, Tobias P. Fischer4, Gustav Gerdes5,Alexandra Gutmann6, Thorsten Hoffmann6, Ima Itikarai7, Tomas Krejci8, Emma J. Liu9,10, Kila Mulina7,Scott Nowicki4,11, Tom Richardson12, Julian Rüdiger6, Kieran Wood12, and Jiazhi Xu1
1Department of Earth, Space and Environment, Chalmers University of Technology, 41296, Gothenburg, Sweden2Institute for Environmental Physics, University of Heidelberg, 69120 Heidelberg, Germany3Max Planck Institute for Chemistry, 55128 Mainz, Germany4Department of Earth and Planetary Sciences, University of New Mexico, Albuquerque, NM 87131, USA5Gerdes solutions AB, 128 41, Stockholm, Sweden6Department of Chemistry, Johannes Gutenberg University, 55099 Mainz, Germany7Rabaul Volcano Observatory, P.O. Box 386, Rabaul, Papua New Guinea8HAB Electronic AB, 34140, Ljungby, Sweden9Department of Earth Sciences, University of Cambridge, Cambridge, CB2 3EQ, UK10Department of Earth Sciences, University College London, London, WC1E 6BS, UK11Quantum Spatial, Inc., Albuquerque, NM, USA12Department of Aerospace Engineering, University of Bristol, Bristol, BS8 1TR, UK
Correspondence: Bo Galle ([email protected]) and Santiago Arellano ([email protected])
Received: 11 November 2020 – Discussion started: 14 December 2020Revised: 10 March 2021 – Accepted: 26 April 2021 – Published: 9 June 2021
Abstract. A multi-rotor drone has been adapted for studiesof volcanic gas plumes. This adaptation includes improvedcapacity for high-altitude and long-range, real-time SO2 con-centration monitoring, long-range manual control, remotelyactivated bag sampling and plume speed measurement ca-pability. The drone is capable of acting as a stable plat-form for various instrument configurations, including multi-component gas analysis system (MultiGAS) instruments forin situ measurements of SO2, H2S, and CO2 concentrationsin the gas plume and portable differential optical absorptionspectrometer (MobileDOAS) instruments for spectroscopicmeasurement of total SO2 emission rate, remotely controlledgas sampling in bags and sampling with gas denuders forposterior analysis on the ground of isotopic composition andhalogens.
The platform we present was field-tested during three cam-paigns in Papua New Guinea: in 2016 at Tavurvur, Baganaand Ulawun volcanoes, in 2018 at Tavurvur and Langila vol-canoes and in 2019 at Tavurvur and Manam volcanoes, aswell as in Mt. Etna in Italy in 2017.
This paper describes the drone platform and the multiplepayloads, the various measurement strategies and an algo-rithm to correct for different response times of MultiGASsensors. Specifically, we emphasize the need for an adaptiveflight path, together with live data transmission of a plumetracer (such as SO2 concentration) to the ground station, toensure optimal plume interception when operating beyondthe visual line of sight. We present results from a compre-hensive plume characterization obtained during a field de-ployment at Manam volcano in May 2019. The Papua NewGuinea region, and particularly Manam volcano, has notbeen extensively studied for volcanic gases due to its re-mote location, inaccessible summit region and high level ofvolcanic activity. We demonstrate that the combination of amulti-rotor drone with modular payloads is a versatile solu-tion to obtain the flux and composition of volcanic plumes,even for the case of a highly active volcano with a high-altitude plume such as Manam. Drone-based measurementsoffer a valuable solution to volcano research and monitor-ing applications and provide an alternative and complemen-
Published by Copernicus Publications on behalf of the European Geosciences Union.
4256 B. Galle et al.: A drone system for long-range and high-altitude volcanic gas plume measurements
tary method to ground-based and direct sampling of volcanicgases.
1 Introduction
1.1 The use of drones for studies of volcanic plumes
The use of drones for volcanic plume studies was pioneeredby Faivre-Pierret et al. (1980), who employed a fixed-wingdrone equipped with in situ sensors to measure the com-position of the volcanic plume of Mt. Etna, together withcorrelation-spectrometry-derived (COSPEC; Stoiber et al.,1983) fluxes of H2O, SO2, HCl and HF. This was anunmanned research aircraft that demanded high expertiseand complex field operations. More recently, McGonigle etal. (2008) employed an unmanned helicopter equipped alter-natively with a multi-component gas analysis system (Multi-GAS; Aiuppa et al., 2005; Shinohara, 2005) and a portabledifferential optical absorption spectrometer (MobileDOAS;Galle et al., 2003) system to measure the flux of CO2 andSO2 from the crater rim of Vulcano Island, Italy. This wasa proof-of-concept study that demonstrated the utility of acommercial system to acquire proximal measurements, al-though the vehicle still required a level of piloting expertise.The first use of a multi-rotor platform capable of reachinga high-elevation plume was reported by Mori et al. (2016),who performed measurements with a multi-rotor drone in theeruptive plume of Ontake volcano and measured SO2, CO2,H2S, H2O and HCl concentrations, employing a combinationof MultiGAS and MobileDOAS instruments. The authors re-ported various problems, such as the need to properly shieldelectrochemical sensors used in MultiGAS units from elec-tromagnetic interference derived from the drone motors orradio telemetry. Similar work was conducted by Rüdiger etal. (2018), who measured the plumes of Masaya, Stromboliand Turrialba volcanoes and studied the ageing of halogenicspecies using drone-mounted denuder samplers. De Moor etal. (2019) and Stix et al. (2018) used a multi-rotor drone toperform MultiGAS and MobileDOAS measurements and tocollect plume samples for posterior carbon isotopic specia-tion analyses. They also measured plume speed by lettingthe drone drift freely with the winds at plume level. Man-don et al. (2019) also used a multi-rotor drone and a sam-pling unit to collect high-temperature filter pack samples ofvolcanic gases at White Island volcano, which were charac-terized geochemically, focusing on the composition of tracemetal aerosols. At Villarrica, comparison of the plume chem-istry measured directly above the lava lake (using a drone-mounted gas analyser) and downwind on the crater rim (us-ing a traditional ground-based instrument) simultaneouslyshowed how volcanic plumes can dilute and homogenizeover short distances of< 150 m, especially in turbulent craterenvironments (Liu et al., 2019). Furthermore, Schellenberg et
al. (2019) described in-plume ash collection at long range us-ing fixed-wing vehicles at Fuego volcano (Guatemala), andSyahbana et al. (2019) launched a fixed-wing aircraft withsensors for H2O, CO2 and SO2 that were essential for asuccessful assessment of eruptive activity of Mt. Agung in2017. This short account is intended to highlight represen-tative studies using drones as platforms for volcanic plumemeasurements; more comprehensive reviews, including thebroader applications of drones in volcanology, can be foundin Villa et al. (2016) or James et al. (2020).
The above-mentioned studies show different aspects of thecapabilities of drones to reach volcanic plumes and ventsand perform measurements with various levels of complex-ity. Our study combines multiple aspects of these indepen-dent developments to show that the same unit can be used toachieve the above-mentioned goals in a single field experi-ment, with maximum field operability in terms of portabil-ity and a reduced number of people required for the mea-surement, i.e. usually only two. These features make our ap-proach a practical solution to expand the use of drones forroutine monitoring of volcanic plumes.
1.2 Manam volcano
Manam volcano, located in Papua New Guinea, is the highestvolcano in the Bismarck arc. The volcano is a 3000 m highcomposite volcano that rises about 1800 ma.m.s.l. (abovemean sea level). The island of Manam is about 10 km in di-ameter. Manam has erupted about 40 times since the early1600s. The current phase of eruptive activity began in June2014 and continues to date of writing, characterized bysporadic VEI4 eruptions superimposed on persistent pas-sive degassing and minor explosive activity (Venzke, 2013).In 2004, an eruption devastated large sectors of the islandand displaced thousands of people to the mainland (Liu etal., 2020). Manam is currently ranked as one of the top10 SO2 and CO2 emitters in the world and degassed about1 MtCO2 a−1 during 2005–2015 based on petrological prox-ies to estimate the CO2 flux (Aiuppa et al., 2019; Fischeret al., 2019).
Manam is an archetypical case that represents the chal-lenges of obtaining detailed information on volcanic plumesfor a large proportion of volcanoes in the world. Indeed,our present knowledge of the composition and flux of gasemissions from volcanoes is limited due to the same rea-sons described above: remote location, explosive activityor inaccessible vents and plumes. Although satellite-basedremote-sensing instruments have a large potential to over-come these limitations, this approach is in general onlyvalid for SO2 because its atmospheric background concen-tration is low compared to the volcanic signal. For most otherspecies, in situ measurements are the only option, when fea-sible. From a total of nearly 1500 Holocene volcanoes listedin the Smithsonian Institution’s Global Volcanism Programdatabase (https://volcano.si.edu/list_volcano_holocene.cfm,
Atmos. Meas. Tech., 14, 4255–4277, 2021 https://doi.org/10.5194/amt-14-4255-2021

B. Galle et al.: A drone system for long-range and high-altitude volcanic gas plume measurements 4257
last access: 4 June 2021), about 50 % have a summit alti-tude above 2 kma.m.s.l. Nearly 100 of the Holocene volca-noes had a flux of SO2 above the Ozone Monitoring Instru-ment (OMI) 1 year-average threshold of about 40 td−1 (Carnet al., 2017) during 2005–2016, of which∼ 60 % have a sum-mit at 2 kma.m.s.l. or higher. Therefore, a drone-based plat-form for gas sampling or real-time measurement of volcanicspecies in the plume needs to be suitable to reach plumes athigh elevation where air density is low and robust enough tosustain harsh measurement conditions such as acidity, cor-rosion and turbulence that are encountered in dense regionsof the plume. Thus, Manam volcano is a suitable volcanofor demonstrating the challenging use of a drone in volcanogas monitoring, and for this reason it was chosen as the tar-get of a field campaign (Aerial Based Observations of Vol-canic Emissions, ABOVE; Liu et al., 2020) to characterizethis strong, yet difficult-to-access, volcanic plume.
2 Methods
2.1 The drone platform
We designed our system to fulfil the following demands:
– capability to measure in situ concentrations in excess ofa few parts per million (ppm) above ambient for severalcomponents of the plume: CO2, SO2 and H2S in realtime;
– capability to measure the flux of all major volcanicspecies in the plume, SO2 with direct measurement andthe other gases after obtaining their ratio against SO2and combination with SO2 flux;
– capability to collect physical bag samples of the vol-canic plume, for posterior chemical or isotopic analysis(of carbon or other species) on the ground;
– capability to reach altitudes higher than 2 km abovetake-off altitude and ranges of the order of 5 km;
– relatively low-cost, low-expertise threshold to operateand high field robustness and portability.
With these demands in mind, we developed the followingconcept: a multi-rotor drone platform with modular payloadsfor different types of measurement. We chose a hexa-copterin Y-shape configuration, the Micro model developed bySky-Eye Innovations in Sweden, which we dubbed “Munin”.Among the advantages of a multi-rotor configuration, we in-clude (1) the possibility to hover, which is required for op-timal positioning of the drone in the plume, for collectingsamples in a bag from a confined region and for measur-ing during a time long enough to guarantee a good signal;(2) the possibility to perform measurements in the verticaldirection, required to, for example, determine the concentra-tion profile in the plume; (3) high manoeuvrability to adapt
to changing wind conditions and to chase high volcanic gasconcentration regions of the plume; (4) high portability dueto its small size, low weight and foldable parts; and (5) sim-plicity for operation, usually not requiring expert pilotingcapabilities and no more than two people. The main disad-vantage of a battery-driven multi-rotor drone in comparisonwith combustion-powered (i.e. liquid fuel) platforms is a lim-ited flight time, which translates into a reduced time of mea-surement in the plume, especially at high altitudes and dis-tances. A main disadvantage with the combustion-poweredplatforms related to gas volcanic measurements is the risk ofcontamination, especially under hovering conditions.
2.1.1 Drone feasibility studies and lessons learnt
The development of our drone platform was initially moti-vated by the goal to measure the CO2 emission from Baganavolcano, identified as one of the strongest emitters of SO2(Carn et al., 2017), in 2016. The high level of activity of thisremote volcano made it impossible for people to reach its ac-tive vents for sampling, and to reach a plume at summit levelrequired at least 1600 m of vertical climb above ground. Wetested an earlier version of our drone for high-altitude flights,in order to assess the maximum altitude achievable with apayload of about 1 kg. These tests were performed at the ES-RANGE Space Center, which is operated by the SwedishSpace Corporation and located near to Kiruna, in northernSweden. Loaded flights were done in vertical and horizon-tal trajectories to measure the current consumption duringclimb (at 5 ms−1), hovering, descent (at 4 ms−1) and cruise(at 8 ms−1). Typical currents for these flight modes were54, 33, 22 and 30 A (1200, 730, 490, 660 W), respectively,during horizontal wind conditions of∼ 10 ms−1. Vertical as-cents up to 1800 m above ground were reached in these tests,above which radio control signal (at 2.4 GHz) was lost. Us-ing two batteries, each consisting of 24 Li-ion cells (3.7 V,2.5 Ah each) connected in a 6S4P configuration, gives a totalbattery capacity of 20 Ah. For a conservative mean currentconsumption of 40 A, this battery capacity allows for a nom-inal flight time of 30 min. After the experience gained fromthis study and field studies in Bagana and Ulawun (North-ern Hemisphere (NH) autumn 2016), Etna (NH spring 2017)and Langila (NH autumn 2018) volcanoes, the main lessonslearnt were as follows.
– When ascending and moving horizontally, it was foundthat energy consumption could be reduced if the riseand forward motion were balanced in an optimal way,as compared to moving only in one direction at a time.This is because a considerable horizontal component inthe movement gives a lift that reduces the energy con-sumption for maintaining the vertical position. An ad-ditional advantage is that the drone then flies in undis-turbed air with less turbulence compared to a clean ver-tical movement. When the drone flew into clouds, en-ergy consumption increased by about 50 %. On descent,
https://doi.org/10.5194/amt-14-4255-2021 Atmos. Meas. Tech., 14, 4255–4277, 2021

4258 B. Galle et al.: A drone system for long-range and high-altitude volcanic gas plume measurements
it was found that stability deteriorated when descend-ing through clouds; see Fig. 1. Therefore, we avoidedclouds as much as possible during flights. In the laterpart of the campaign, this was facilitated by using an on-board camera and flying with FPV (first-person view).The drone’s angle through the air, the tilt related tothe ratio between horizontal and vertical motion, alsoproved to be of great importance for energy consump-tion. Both during ascent and descent, energy consump-tion could be minimized by considering and taking ad-vantage of the wind’s strength and direction. On the pre-vailing conditions at Manam, a tilt of 11◦ from the hori-zon was found to be optimal for the decent.
– The volcanic plumes were typically found to move bothhorizontally and vertically within a short time span. Inorder to be able to sample the plume with in situ meth-ods, it is crucial that the plume centre, having the dens-est gas concentrations, can be reached. Thus it is impor-tant to be able to receive real-time information on theground of a relevant plume tracer (SO2 concentration)and to be able to control the remote drone location fromthe ground and thereby adapt the flight path of the dronein response to this real-time data stream.
– Electrical interference from motors and telemetry in-fluenced the noise level of the electrochemical sensors.Thus shielding and location of power and data cables, aswell as location of antennas, were important (see hard-ware modifications detailed below).
– It was found that the time needed for switching be-tween different payloads could be considerably reducedby changes in the drone frame and payload designs(balance, power connection, data access, telemetry).The batteries were mounted under the frame and couldbe changed with a “click” locking. This enabled fastswitching of batteries and improved the balance, es-pecially at take-off and landing. The payloads weremounted on individual plates that were locked in placeon the drone platform with a click lock similar to whatwas used for the batteries and provided by the dronemanufacturer. This enabled the payloads to be pre-balanced, and no further balancing of the drone wasneeded after replacement of payload. A special poweroutput on the drone gave the payloads power and accessto the drone-mounted telemetry. This power output wasalways turned on to make it possible to do pre-flight andpost-flight operations on the payload instrument withoutturning on the main drone electricity to save power.
– Access to the drone flight logs were found to be usefulfor post-flight analysis of power consumption with dif-ferent flight modes, extraction of wind information andbackup data of basic parameters like pressure, temper-ature and position. An example of data from the flightlog is given in Fig. 1.
Based on these experiences, we modified the standardmodel of our platform in the following ways:
– Change of operative system. We adopted an open-source navigation module PixHawk V4 with its ownpower distribution card in order to overcome typical re-strictions in altitude and distance of other commerciallyavailable solutions, as well as to access all informationof the flight logs for posterior analysis.
– Modifications in the frame design. These modificationsinclude addition of a larger payload-carrying platform,the use of more robust motors with race drone ESC(electronic speed control) that improves the manoeuvra-bility and propellers with a larger diameter than are typ-ically standard for a drone of this size (45 cm). We alsoplaced the batteries below, instead of on top, of the mainframe to gain further stability. The drone has a triple in-ertial measurement unit (IMU), dual compass and oneGPS and was provided with two 6S4P 10 Ah batteries.
– Control board. Jeti DC16 was used as a pilot controller,and for transmission a Crossfire (TBS Crossfire Diver-sity Nano RX) was used. A tablet was connected tothe Crossfire for flight planning and for monitoring thetelemetry.
– Increased telemetry range. We replaced the common2.4 GHz by a 900 MHz radio link and used a high-gaindirectional antenna for ground control. Figure 2 shows aphoto of the drone and its main modular payloads. Tech-nical specifications of our drone are provided in Table 1.
– Electrical interference. We used a shielded metal boxfor the electrochemical sensors and tested the optimallocation of power and data cables and antennas to mini-mize electrical interference on these detectors.
– Camera. During the later part of the campaign atManam, it was found to be useful to include a cam-era running in FPV (first-person view) mode. The mainreason for this was that it facilitated the avoidance ofclouds and thereby reduced energy consumption. It alsoimproved the manoeuvrability as it gave the pilot ac-cess to critical parameters in real time within their view(goggles).
With these modifications we have been able to reachheights of 2000 m above take off position (equivalent to ab-solute altitudes of up to 3700 ma.m.s.l.) and a range of nearly5 km. Although we have limited the total flight time to 30 minunder normal conditions (i.e. those conditions resulting innormal current consumption), with favourable conditions andflight piloting strategies, a flight time of 35 min could beachieved within a safe margin. In the following sections,we describe each of the modular payloads and measurementstrategies compatible with this drone platform.
Atmos. Meas. Tech., 14, 4255–4277, 2021 https://doi.org/10.5194/amt-14-4255-2021

B. Galle et al.: A drone system for long-range and high-altitude volcanic gas plume measurements 4259
Figure 1. Flight data from the drone flight shown in Fig. 9. The upper panels show time series of yaw, pitch and roll angles, the thrust(percentage) and the altitude of the drone. Notice the high variability of the parameters associated with acceleration, hovering and interferencefrom clouds.
Figure 2. Photo of the multi-rotor drone with modular payloads. The MultiGAS unit includes in situ sensors for gas composition (XA –concentration of species A, p – pressure, T – temperature, %RH – relative humidity, xyz – tilt coordinates), a gas-sampling unit and ananemometer. The MobileDOAS is used for the remote sensing of the gas flux. The modules are clamped to the drone at balanced position.The battery pack is placed below the drone chassis to lower the centre of gravity of the system. Flight and sensor data are telemetered in realtime (photo courtesy of Matthew Wordell).
https://doi.org/10.5194/amt-14-4255-2021 Atmos. Meas. Tech., 14, 4255–4277, 2021

4260 B. Galle et al.: A drone system for long-range and high-altitude volcanic gas plume measurements
Table 1. Technical specifications of the hexa-copter.
Model SkyEye Innovations Micro
Nickname MuninConfiguration Y6 multi-rotor (three pairs of co-axial, counter-rotating rotors in tandem)Navigation system PixHawk model V4Remote control Jeti DC16Camera system OcuSync 2.0Drone size, folded (D×H ×W ) (cm) 80× 20× 23Frame weight, without batteries 3.0Drone weight, including batteries (kg) 4.5–6.0Maximum payload (kg) 2.0Maximum combined thrust (N) 120Battery voltage (V) 22.2 (6× 3.7)Battery capacity (Ah) 20 (2× 10)Control range (km) 5Typical flight time (1 kg payload) (min) 30Maximum climb speed (ms−1) 5Maximum descent speed (ms−1) 4Maximum cruise speed (still wind) (ms−1) 10
2.2 In situ measurements of plume speed
When determining the gas emission rate – using methodssuch as MobileDOAS (Galle et al., 2003), ScanDOAS (Ed-monds et al., 2003) or COSPEC (Stoiber et al., 1983) – infor-mation about the wind speed at plume height is critical. Sincevolcanic plumes are often located at several kilometres’ alti-tude, and the measurements are conducted in an area rela-tively close to a major topographic structure, acquiring rep-resentative measurements of plume speed is challenging. Theuse of atmospheric models (such as operational databasesprovided by NOAA or ECMWF) is an alternative approach;however, these models are usually coarse in horizontal, ver-tical and temporal resolutions, and thus validation of thesemodelled wind data by local measurements is valuable. Adrone can offer such in situ validation.
We have applied two different methods for plume speedmeasurements using the drone: drone drift and anemometer.In the drone drift method, the drone is first positioned at thealtitude of the plume, and then the GPS position-locking isdeactivated. The drone is thus left free to drift with the hor-izontal wind and, after an initial lag time of less than 1 min,the drone reaches the local wind speed. The movement of thedrone is logged with a separate GPS receiver, from which thelocal wind speed can be determined. Additionally, the actualairspeed can also be monitored in real time through the infor-mation sent to ground control, derived from GPS data. In thesecond method, a small and lightweight anemometer was in-stalled on the drone, logging the total velocity experienced bythe drone (wind velocity+ drone velocity). With the droneheld in a fixed position close to the plume, the plume speedis thus obtained. The advantage of this method over the dronedrift approach is that plume speed may be derived at the same
time as other measurements in the plume are conducted. Theanemometer is integrated with the MultiGAS unit, describedbelow.
2.3 MobileDOAS for remote measurement of SO2emission rate
Since 2002 an instrument referred to as MobileDOAS (Galleet al., 2003; Johansson, 2009) has been used increasinglyto replace the previously used COSPEC instrument (Stoiberet al., 1983) for measurements of volcanic SO2 gas emissionrate. Both MobileDOAS and COSPEC instruments use thediffused UV solar radiation as a light source for the deter-mination of the total column of SO2 above the instrument,which is calculated using absorption spectroscopy. During atypical measurement, the instrument is moved in such a waythat it passes under the gas plume in a direction close to per-pendicular to the plume transport direction while simultane-ously recording spectra and GPS location. Thus, by correct-ing for deviations from traversing the plume perpendicularlyusing GPS data and using DOAS evaluation algorithms toderive SO2 total columns along the track, the total numberof SO2 molecules in a cross-section of the gas plume can bederived. This quantity is then multiplied by wind speed at thecentre of mass of the plume – i.e. plume speed – to derive thegas emission rate.
The main sources of error in these measurements are “dilu-tion” of the absorption signal due to simultaneous collectionof skylight that has been either transmitted through the plumeor scattered from outside of the plume (Millán, 1980; Mori etal., 2006) and limited knowledge of the plume speed (Galleet al., 2010).
Atmos. Meas. Tech., 14, 4255–4277, 2021 https://doi.org/10.5194/amt-14-4255-2021

B. Galle et al.: A drone system for long-range and high-altitude volcanic gas plume measurements 4261
Figure 3. Schematic layout of the MobileDOAS instrument.
MobileDOAS measurements from a drone platform offerseveral advantages compared to traditional approaches (e.g.Rüdiger et al., 2018; De Moor et al., 2019): regardless of in-frastructure (roads) and topography, traverses can be madein a direction perpendicular to the plume direction. Measure-ments can be made at an elevated altitude, thus reducing theeffects of light dilution, and plume speed can be determinedreasonably accurately by the methods described in Sect. 2.2.
General details of the MobileDOAS hard- and softwareare given in Johansson et al. (2009). Details specific to ourdrone-mountable version of the instrument are provided inTable A1 (Appendix A). A schematic view of the Mobile-DOAS instrument is shown in Fig. 3.
The MobileDOAS instrument is built into a plastic casewith clamps adapted to a platform on the drone in a bal-anced position, and it is powered from a 12/5 V power cablefrom the drone that was permanently active. Thus, the Mo-bileDOAS could be installed on the drone platform, and theMobileDOAS software could be started up, or data from theMobileDOAS could be backed up, without the main dronepower turned on, thereby saving battery power. While theMobileDOAS software is active, a stream of basic informa-tion (time, position, SO2 column density) is transmitted inreal time via an independent radio link from the instrument.These real-time data help the pilot to guide the drone and en-sure a complete traverse of the plume. The full traverse canbe visualized upon landing, by connecting an external com-puter to the instrument computer running MobileDOAS.
2.4 MultiGAS for in situ measurement of gascomposition
MobileDOAS and ScanDOAS are used to obtain SO2 – andunder some circumstances also BrO (Lübcke et al., 2014) –emission rates from the ground using remote-sensing tech-niques. However, to obtain the relative concentrations of
other volcanic species, such as CO2 and H2S, direct measure-ments must be conducted within the plume itself; high atmo-spheric background concentrations or weak optical absorp-tion of these species preclude robust detection by remote-sensing methods. The most common method used for this ismulti-component gas analyser systems (MultiGAS; Aiuppaet al., 2005; Shinohara, 2005). MultiGAS-type instrumentsgenerally consist of several small sensors (typically elec-trochemical or optical), with low power consumption, con-nected to a micro-computer and sometimes a data link forreal-time data transfer. The instrument is typically installedin a gas-exposed location (e.g. a crater rim), often proxi-mal to the vent location. Although its installation may belabour-intensive and sometimes risky, this method is gen-erally straightforward. However, on many volcanoes, ap-proaching the summit area would represent an enormousrisk – this is the situation at Manam. In such cases, perform-ing the in-plume measurements using a drone is an attrac-tive possibility. An obvious requirement here is the ability ofthe drone to reach high altitude as well as having long en-durance. This is emphasized further by the fact that manyof the sensors used have slow response times, while the gasconcentrations (especially close to the vent where the signalis stronger) may vary quickly within seconds due to dilutionand turbulent wind conditions. Under these conditions, it ispreferable to expose the sensors to the volcanic gas for aslong a sampling duration as possible – ideally at least sev-eral minutes. Short time fluctuations in concentration andplume location also imply that the ability to monitor a gastracer (such as SO2) in real time is desirable to “chase” high-concentration sites. This is of course not guaranteed whenthe drone is sent in autopilot, unless an adaptive flight rou-tine based on a plume tracer is implemented.
MultiGAS units combine information from different sen-sors to determine the mixing ratios of different species. In ourpresent system, these quantities are determined according tothe following processes:
– For SO2 and H2S. The target gas is pumped into a cham-ber to which the electrochemical sensors are exposed.The signal generated by the electrochemical effect froman electrode exposed to the gas of interest is subtractedfrom the signal of a reference electrode inside the sys-tem This differential signal is proportional to the gasmixing ratio. The proportionality is linear within a cer-tain range and depends to some degree on temperature,pressure and the concentration of interfering species.These proportionality and disturbance factors are deter-mined by calibration.
– For CO2.
– The same gas sample is passed through a cavity il-luminated by two infrared beams with wavelengthscentred in and out of an absorption band of CO2.
https://doi.org/10.5194/amt-14-4255-2021 Atmos. Meas. Tech., 14, 4255–4277, 2021

4262 B. Galle et al.: A drone system for long-range and high-altitude volcanic gas plume measurements
– Using Beer–Lambert’s extinction law, the localconcentration of CO2 is determined.
– To get the mixing ratio, further corrections areneeded for temperature, pressure and relative hu-midity, which should be established by calibration.
For the case of H2O, the mixing ratio can be derived frommeasured relative humidity, pressure and temperature, fol-lowing known thermodynamic laws (see Appendix B). Ifthe measurement of such variables is done inside the sam-pling circuit, the H2O mixing ratio of the sample can be de-termined simultaneously to the other species. Our system,however, measures these variables only inside the instru-ment box, so the mixing ratio is representative of ambientgas passively diffusing in the interior of the unit; H2O there-fore varies differently than the other species as it is deter-mined from outside of the closed system. The schematic lay-out of the MultiGAS instrument used in this study is shownin Fig. 4, and technical specifications of the sensors are givenin Appendix A.
Data from this unit are transmitted through an independentdata link and visualized on the ground using self-developedsoftware used for tracking emissions from ships (Beeckenet al., 2015; Mellqvist et al., 2018). This visualization is thebasis to fine-tune the position of the drone for the samplingof more concentrated regions of the plume.
To obtain the mixing ratios representative of the volcanicemission, it is necessary to correct for the contribution fromthe same species present in the background atmosphere. Ide-ally, such a measurement should be done at similar ambientconditions (i.e. pressures, temperature) to those expected in-side the plume, unless the corrections for different conditionsare known precisely.
When two sensors have different response time character-istics, the signals they measure will have different amplitudeand shape and be time-shifted with respect to the input sig-nals depending on the frequency content of the input. This“distortion” of the input signals can be large when a rapidlyfluctuating signal is measured for a short time; i.e. the instru-ment basically records only the transient signal. This couldbe the case with MultiGAS measurements on a flying dronein a turbulent plume. These effects must be considered toreproduce the input signal and subsequently analyse it (forexample, taking the ratio of two signals such as CO2/SO2).
However, if only the ratio of the signals, and not their in-stantaneous amplitudes, is sought, it is enough that the dy-namic constants are similar. Alternatively, the true ampli-tudes may be obtained if the input signals have variationsin timescales longer than the characteristic response times ofthe sensors, and the measurement is taken for a time longerthan the response time of the sensor. This can be achievedin two ways, either by selecting carefully the characteristicsof the sensors or by exposing them to a near-constant signal.To achieve the latter, a practical solution is to take a sam-ple of the gas and then expose the sensors to the sampled
gas for a time long enough to achieve the correct amplitudes.Our system fulfils these two criteria: the sensors have simi-lar response characteristics, and the MultiGAS incorporatesa bag and pump unit that makes it possible to take samples ofthe plume and then expose it to the sensors for several min-utes i.e. on the ground (see Sect. 2.5). In this mode the gasfrom the Teflon bag is circulated through the detectors in aclosed loop, thereby exposing the detectors for the constantgas concentration in the sample for several minutes. Anotheradvantage here is that any possible losses, i.e. wall effects,could be monitored and compensated for. This method washowever not tested in the actual field campaign because thelimited gas samples were instead used for isotopic composi-tion analyses.
A detailed analysis of the problems encountered whencombining data from sensors with different response timesis given in the following section.
2.4.1 Correction of time-response differences inMultiGAS sensors
When measurements are made with combined data from sev-eral sensors having a different response time, e.g. measure-ments of the ratio CO2/SO2 using a MultiGAS instrument,great care must be taken.
In this measurement procedure, three characteristic timesare important:
– the time of variability in gas concentration, tv;
– the sampling time, ts;
– the response time of the sensor, t90 (meaning the time toreach 90 % of the true signal for a step change in con-centration, higher than the detection limit).
The first characteristic is determined by variability inemission, variability caused by local turbulence at the pointof measurement and variability caused by relative transit ofthe drone with respect to the plume. The second characteris-tic is determined by the sampling rate of the instrument andthe time required for exchange of the gas sample inside themeasurement cavity. By the third characteristic, we mean thedynamic response time of the sensor. Because sensors oftenoperate according to different principles, the sensor responsetimes are usually different; this may introduce artefacts in themixing ratios, which would then result in wrong molar ratiosfor the different species, as discussed by Aiuppa et al. (2005),Shinohara (2005), Roberts et al. (2017) and Liu et al. (2019).
Drone MultiGAS measurements are normally performedby hovering in a region of high gas concentration. This meansthat the relative motion of gas parcels is mostly determinedby local turbulence. Farther away from active vents, concen-tration heterogeneities are largely smoothed out, but the sig-nal is very weak. Therefore, strong signals are usually subjectto high variability.
Atmos. Meas. Tech., 14, 4255–4277, 2021 https://doi.org/10.5194/amt-14-4255-2021

B. Galle et al.: A drone system for long-range and high-altitude volcanic gas plume measurements 4263
Figure 4. Schematic layout of the MultiGAS instrument.
Our MultiGAS intakes a flow of 0.5 Lmin−1
(∼ 10−5 m3 s−1), which means that for a measurementcell section of ∼ 10 cm2, the flow speed is in the order of0.01 ms−1. This results in a negligible dynamic pressurein relation to atmospheric pressure inside the measurementcavity. The relation between the sampling and variabilitytime is determined by the Nyquist criterion. The instrumentwould only be able to capture signals with frequency fluctu-ations lower than half the sampling frequency accurately (inpractice, a much higher sampling frequency is required). OurMultiGAS takes a sample every second, so variations withfrequencies higher than 0.5 Hz cannot be properly captured.Such dynamic changes in plume composition are assumedto be improbable for most typical scenarios. The CO2 sensorhas a cavity with dimensions of 153 mm× 30 mm× 36 mm;i.e. the sampling volume of 0.17 L is exchanged in a timeof about 20 s. For the electrochemical sensors, the responsetime depends on the transport through the membrane,dissolution in the electrolyte, reaction time and sampling.Thus, differences in sensor geometry and measurementprinciple produce differences in response times, even if thegas flow rate remains constant (i.e. with the same pump).
The response time depends on the dynamic properties ofthe sensor and the nature of the signal. For first-order sensors,only one energy-storing and one energy-dissipating com-
ponent dominate, and oscillatory behaviours are neglected.For such sensors, the dynamical response can be modelledthrough the differential equation (e.g. Pallas-Areny and Web-ster, 1991):
x(t)= a0y(t)+ a1dy(t)
dt, (1)
where x(t) is the time-varying input signal (e.g. mixing ra-tio of SO2), y(t) is the time-varying measured signal (e.g.voltage of the SO2 electrochemical sensor), dy/dt is the firstderivative of the measured signal with respect to time, anda0 and a1 are constants identified with the response time(τ = a1/a0) and static sensitivity of the sensor (K = 1/a0).
The dynamical time-response factor defines a delay in theresponse of the measured signal in relation to the input sig-nal. If the input signal is a step function, one usually relatesthis factor by the time required for the sensor to achieve acertain level of the signal, for example 90 %. Periodical sig-nals will be affected by an error in amplitude and by a shiftcaused by the frequency response of the sensor. The steady-state amplitude response to a signal of angular frequency ωis given by k/[(ωτ)2+)]0.5. The shift is given by tan−1(ωτ ).An arbitrary signal can be represented by a Fourier sum ofperiodical signals, and for linear systems, the response of the
https://doi.org/10.5194/amt-14-4255-2021 Atmos. Meas. Tech., 14, 4255–4277, 2021

4264 B. Galle et al.: A drone system for long-range and high-altitude volcanic gas plume measurements
sensor is obtained by superposition of the responses to themonochromatic signals (Pallas-Areny and Webster, 1991).
We correct our signals based on these conditions:
– Sensors of the MultiGAS instrument can be accuratelymodelled as first-order systems.
– The input signals of different sensors measured at thesame time are highly correlated.
– Variability of the gas concentration occurs at a charac-teristic time much shorter than the exchange time in thesensor.
– The total measurement time is much larger than the ex-change/diffusion time in the sensor.
The first assumption is supported by the design and lab-oratory characterization of the electrochemical and opticalsensors. The second assumption requires that the molar ra-tio of different species is constant and homogeneous withinthe time of measurement. Sampling a heterogeneous mix-ture would produce different ratios at different times, com-plicating both the measurement and the interpretation of theresults. In volcanic emissions, drastic changes in molar ra-tios within minutes are unlikely if the gases come from thesame source. But if the plume mixes emissions from differentvents, or if large local heterogeneities affect the chemistry orcondensation of different species unequally (e.g. for plumeswith heterogeneous concentration of ash), changes in gasmolar ratios can occur, even on short timescales (Kelly et al.,2013). The third condition ensures that enough informationis available for finding a unique solution because the highvariability in the signal is required for the cross-correlationanalysis, and the fourth condition is required to reduce theerror caused by sampling over different exchange/diffusiontimes of the sensors.
Based on the first assumption, our method starts withthe two measured signals (e.g. yCO2(t) and ySO2(t)) andconstructs from them their derivatives (dyCO2(t)/dt anddySO2(t)/dt) by simple numerical approximation, whichworks fine as long as the sampling time is short (i.e. as longas large variability in timescales shorter than the samplingrate is not expected). Based on the second assumption, weexpect that a simple scaling exists between the two input sig-nals, defining a constant ratio r (r = xCO2(t)/xSO2(t)). Nowwe simply iteratively vary the time-response factors of thetwo signals and look for the combination that maximizes thecross-correlation between the reproduced inputs accordingto Eq. (1) (see Appendix B for an implementation of thismethod). This method works best for strongly fluctuatingsignals, rich in information for the correlation analysis. Fig-ure 5 shows an example of this method applied to field mea-surements of a very dynamical signal obtained in the craterof Tavurvur volcano (Papua New Guinea) in 2016 using theSunkist instrument.
This method is quite general for the correction of the dy-namic response of the sensors. It obviates time-consumingand frequent characterization of the response time in a labo-ratory and accounts for the fact that the sensors may changetheir dynamic characteristics when exposed to different con-ditions in the field, relative to the lab. Of course, calibrationis still desirable to check for possible changes in offset andsensitivity of the sensor over time.
2.5 Bag sampling unit for gas composition and isotopicanalysis
In some cases, real-time measurements in the gas plumeare not possible, either because longer measurement timeis needed to reduce the signal-to-noise ratio or because themeasurement requires an analytical technique that is morecomplex than can be performed in situ on a drone platform.In such cases, acquiring a sample of the plume gas using adrone carrying a sample bag and a pump may be a viable op-tion. For successful sampling of the most concentrated regionof the plume, real-time data transmission of a plume tracer –such as SO2 – to the drone operator on the ground (in combi-nation with manual flight control to respond accordingly) isadvantageous; however, this can be technically challenging,especially for long-range flights.
Measurement of the carbon isotope composition of vol-canic CO2 is a key example of an application that re-quires in-plume sample collection. Carbon isotope analysesare performed using instrumentation such as isotope ratiomass (IRMS) spectrometers (Chiodini et al., 2011; Sharp,2007), bench-top infrared spectroscopic analyses (Fischerand Lopez, 2016; Rizzo et al., 2014; van Geldern et al.,2014) or cavity ring down spectroscopy (Lucic et al., 2015).While the bench-top spectroscopic techniques are muchmore portable than IRMS systems and do not require a vac-uum, they still depend on a stable 110 or 220 V power sourceand pressurized calibration and dilution gases – facilities thatare not always available in remote field locations. The spec-troscopic techniques generally require a sample volume ofabout 300 mL at atmospheric pressure and temperature. Thiscan be accomplished by directly placing the instrument inthe volcanic plume (Rizzo et al., 2014, 2015) or by collect-ing a plume or fumarole sample in an appropriately sealedand non-reactive container (i.e. Tedlar sample bags) for sub-sequent analyses by spectroscopy (Fischer and Lopez, 2016).The application of drones for this purpose is advantageousover the use of helicopters due to the lower operational costand smaller scale logistics, as well as avoiding sample con-tamination by gases present in the helicopter exhaust (Fischerand Lopez, 2016).
During our fieldwork at Manam volcano, we used two pay-loads to sample the plume. In the first, we equipped our dronewith four Tedlar sampling bags. Each bag was connected toa small rotary pump triggered by a timer. The drone operatorpositioned the drone in the plume, at which point the sam-
Atmos. Meas. Tech., 14, 4255–4277, 2021 https://doi.org/10.5194/amt-14-4255-2021

B. Galle et al.: A drone system for long-range and high-altitude volcanic gas plume measurements 4265
Figure 5. (a) Time series of CO2 and SO2 mixing ratios measured inside the crater of Tavurvur volcano in September 2016 using a Multi-GAS unit (Arellano et al., 2017). The two signals are reconstructed iteratively until an optimal correlation is found between them. For thisinstrument, the SO2 sensor was slower than the CO2 sensor and could not capture all rapid fluctuations. (b) After the correction, the corre-lation between the two series is higher, and the dispersion of the scatter plot much lower. But most importantly, the CO2/SO2 molar ratiochanges from 2.8± 0.3 to 2.6± 0.08 (± of 95 % CI), and the background CO2 (inside the crater) changes from 457± 26 to 473± 9 ppm.
ple was collected by a timed trigger. The duration of sam-ple collection was approximately 45 s at an approximate flowrate of 1 Lmin−1. A valve system was not necessary becausethe pump also functioned as a valve once it stopped pump-ing. The second system was similar, but here the pump (at0.5 Lmin−1) could be remotely controlled, and only one Ted-lar bag was used. After return of the samples to the ground,the valves on the Tedlar bags were closed, and the sampleswere analysed by a Delta Ray infrared spectrometer. In addi-tion to collecting samples from the plume, a clean air samplewas collected upwind and at the same elevation as the plume.In principle, the analytical procedure followed that describedin Fischer and Lopez (2016). Due to the remote location ofManam island and the difficulty encountered when obtainingcalibration and CO2-free air gases in-country, we developedan air purification system that utilized a bicycle pump andCO2 scrubber, Sulfolime™, obtained from PP systems Inc.,to produce pressurized CO2-free air. This system allowed theproduction of essentially unlimited amounts of CO2-free airwith CO2 contents of< 0.7 ppm, as measured using the DeltaRay. The calibration gas was pure CO2 obtained from a lo-cal distributor. Prior to analysis, the C isotope composition ofthis gas was not known, and we therefore collected a sampleof this gas to analyse back in the Volatiles Laboratory at theUniversity of New Mexico using the Delta Ray and standardcalibration gases. Therefore, we were not able to determinethe exact C isotope compositions of the samples in the fieldbut were able to adjust the pure CO2 calibration gas to theconcentration of CO2 measured in the bag sample by settingthe corresponding CO2 concentration in the Delta Ray soft-ware. We then retroactively corrected all our measurementsusing the values obtained for the field calibration gas.
2.6 Plume sampling of halogens using a denudersystem
Besides H2O, CO2 and SO2, halogens are among the ma-jor constituents of volcanic emissions (Textor et al., 2004).The discovery of bromine monoxide (BrO) in volcanicplumes and the correlation of the simultaneously gainedBrO/SO2 ratio with volcanic activity by automatized instru-ments (Lübcke et al., 2014) made BrO/SO2 a promising vol-cano monitoring tool. To utilize BrO/SO2 ratios for monitor-ing volcanic activity, an understanding of ongoing brominechemistry in the plume is essential. For a detailed discus-sion on bromine chemistry in volcanic plumes, see Gutmannet al. (2018) and references therein. Besides BrO, no otherbromine species can be detected by remote-sensing instru-ments. Therefore in situ methods have been developed re-cently for the determination of reactive bromine (BrX) andhydrogen bromide (HBr) (Rüdiger et al., 2017; Gutmannet al., 2020, respectively). The new methods reveal the down-wind conversion of released HBr to other bromine specieswith time in a volcanic plume.
Bromine speciation can be measured using gas diffu-sion denuder systems. Gaseous molecules are derivatizedin situ by an organic coating at the inner walls whenpumped through gas diffusion denuders. Analysis of brominespeciation has been carried out for two different brominespecies. HBr has been determined by 5,6-epoxy-[1,10]-phenanthroline-coated denuders (Gutmann et al., 2020), andBrX (such as Br2, BrCl, HOBr) and reactive chlorine species(ClX) were detected by 1,3,5-trimethoxybenzene-coated de-nuders (Rüdiger et al., 2017). Samples were analysed byhigh-performance liquid chromatography or gas chromatog-raphy coupled to mass spectrometry, at the University ofMainz, Germany, after returning from the field.
For the detection of SO2 a compact MultiGAS-type sys-tem called “Sunkist” (Rüdiger et al., 2018) was used, which
https://doi.org/10.5194/amt-14-4255-2021 Atmos. Meas. Tech., 14, 4255–4277, 2021

4266 B. Galle et al.: A drone system for long-range and high-altitude volcanic gas plume measurements
Figure 6. Drone-based denuder sampling setup and SO2 sensor(Sunkist).
contained an electrochemical CiTiceL 3MST/F sensor. Thecalibration of the electrochemical SO2 sensor followed Arel-lano et al. (2017). The Sunkist also measures ambient pres-sure and temperature. Since the thermometer is inside the iso-lated box and is affected by running instruments, only tem-peratures at the beginning of the flight were considered. Thetemperature at the starting position was 26 ◦C for the firstflight and 32 ◦C for the second. Assuming a vertical tempera-ture gradient of −5 Kkm−1 and an approximate flight heightof 2000 m, 16 and 22 ◦C were estimated for calculations, re-spectively.
Denuders were connected by PTFE tubes to a micro pumpproviding 200 mL min−1 for each denuder. Denuder sam-pling does not provide time-resolved samples and insteadyields an average concentration for the whole exposure in-terval (i.e. an average per flight). Since results obtained withenvironmental denuders predict that these bromine speciesusually only appear within the volcanic plume, we calculatetheir plume concentrations based on the known duration ofexposure in the plume as detected by the SO2 sensor. Fig-ure 6 shows a photo of the drone, with denuders and Sunkist,mounted on the drone and ready for take-off.
A blank correction for denuder results was performed bysubtracting analysis results from coated denuders that trav-elled alongside samples but did not sample any air.
Background environmental blanks were sampled at thestarting position of flights. For subtraction of backgroundenvironmental blanks, the atmospheric concentration of sam-ples (ppb) was calculated for the total flight time. After blanksubtraction, the atmospheric concentration of the brominespecies was calculated for the duration in the plume (esti-mated based on SO2 signals).
Limits of detection (LOD) and limits of quantification(LOQ) were calculated via 3 and 10 times deviation of thecoated denuder blanks (n= 3), respectively. LOD and LOQare dependent on sampling time and the processing method
in the laboratory and are, therefore, calculated for each sam-ple separately.
3 Results
3.1 Manam field-campaign conditions
A field campaign was conducted at Manam volcano inPapua New Guinea during 19–27 May 2019. This field cam-paign utilized all above-mentioned measurement and sam-pling techniques and was the culmination of several previouscampaigns during which parts of the system had been exten-sively tested and modified in response to lessons learnt (seeSect. 2.1.1). The meteorological conditions during the cam-paign at Manam were characterized by low wind speeds andvarying wind direction. Volcanic gas was emitted from twodifferent locations close to the summit, the Main Crater andthe Southern Crater (Liu et al., 2020). The Southern Craterwas the most active, with incandescent lava visible within thecrater and emanation of a persistent strong gas plume withhigh buoyancy (2–3 km above the crater rim). In contrast, theMain Crater showed more fumarolic degassing, generating aweaker plume with reduced buoyancy (see Fig. 7). Due to thelow wind speed and varying wind direction, during some pe-riods there was a buildup of high ambient SO2 concentrationscovering a large part of the island, giving rise to challengingmeasurement conditions.
3.2 Plume speed measurements
Figure 8 shows the horizontal wind velocity measured withan anemometer on board the drone, made in connection witha MultiGAS measurement on 22 May 2019. The high windspeeds measured before reaching the maximum altitude aredue to a combination of wind velocity and horizontal dronevelocity when approaching the plume region. After reachingthe plume region (indicated by increased SO2 concentrationaround 2000 m altitude), the drone is kept at a fixed position,and after a short time a stable plume speed of 3.0± 0.5 ms−1
is obtained.Figure 9 shows a plume speed measurement made using
the drone drift method. After reaching the plume altitude,the drone GPS is deactivated remotely, and after a time lag(caused by the inertia of the drone), a stable drift speed of3.8 ms−1 is obtained.
As can be seen in Fig. 10, the wind speed at Manam dur-ing the field campaign was variable and relatively low, 1–4 ms−1, except on the final day (27 May 2019). This vari-ability results in larger overall emission rate error estimates,as a change of a few metres per second (ms−1) in wind speedgenerates a large uncertainty in the emission. However, thedata from the ECMWF regional model are in relatively goodagreement with our drone measurements.
Atmos. Meas. Tech., 14, 4255–4277, 2021 https://doi.org/10.5194/amt-14-4255-2021

B. Galle et al.: A drone system for long-range and high-altitude volcanic gas plume measurements 4267
Figure 7. (a) Map showing the location of Manam volcano (based on GeoMapApp; Ryan et al., 2009), with the main sites of launch of ourdrone (red) and the location of the crater emissions (black). (b) Photo of the plumes of Manam taken on the 27 May 2019 from Site 1.
Figure 8. Horizontal wind speed measurement made 22 May 2019 using an onboard anemometer. The effective measurement of wind speedat a certain level is obtained when the drone is placed in a hovering position for several seconds, usually in combination with compositionmeasurements or gas sampling.
3.3 SO2 emission rate
Figure 11 shows an example of a MobileDOAS traversemade at an altitude of 1000 ma.m.s.l. at Manam volcano on27 May 2019. An SO2 emission rate of 5200± 660/180 td−1
was obtained for this traverse using a wind speed at plumeheight of 6 ms−1 measured with the drone drift method about30 min after completing the traverse.
This drone-based emission rate measurement can be com-pared to ScanDOAS measurements made from the groundon the same day, yielding an average over the day of4512± 2230 td−1, using wind speed from the ECMWFERA5 model (Liu et al., 2020). One possible reason for
this higher value in the drone measurement is that the rel-atively high elevation minimizes the atmospheric scatteringdilution in this measurement. Over the full period of thefield campaign, the representative SO2 flux was estimatedat 5150± [733/336] td−1 (high and low 1σ bound on uncer-tainty) by synthesizing a large number of measurements (andtheir respective uncertainties) from ground-based, drone-mounted and satellite-based approaches (Liu et al., 2020).
3.4 Molar ratios
Figure 12 shows the results from a flight simultaneously car-rying a MultiGAS instrument and a plume sampling device
https://doi.org/10.5194/amt-14-4255-2021 Atmos. Meas. Tech., 14, 4255–4277, 2021

4268 B. Galle et al.: A drone system for long-range and high-altitude volcanic gas plume measurements
Figure 9. Example of a plume speed measurement made by thedrone drift method on 27 May 2019. The sequence starts at the mo-ment when the GPS position is unlocked, and the drone is left freeto be drifted by the wind at an altitude of 1911 ma.m.s.l. It tookabout 30 s to stabilize at 3.8 ms−1.
Figure 10. Wind data at 1800 m altitude at Manam volcano showingmodel data from the ECMWF ERA5 model and drone data usingthe drone drift and in situ anemometer methods, as well as resultsfrom a ground-based dual-beam remote-sensing method (Johanssonet al., 2009). The drone measurements were taken at different alti-tudes (between 1500 and 2500 ma.m.s.l.), where a SO2 signal wasdetected by the MultiGAS sensor. All winds are horizontal windonly.
on the drone. To obtain the CO2/SO2 ratio, it was first nec-essary to compensate for (a) the pressure and temperatureeffects on the raw concentration data, (b) the dynamical re-sponses of the sensors and (c) the atmospheric backgroundconcentration of CO2 (see details in Appendix B), where thebackground is identified as the concentration of CO2 takenat the same altitude outside of the plume (where the plumetracer SO2= 0). The resulting CO2/SO2 ratios are shownin Fig. 13. Using a linear regression, a CO2/SO2 ratio of0.9± 0.2 is obtained for the Manam plume on 26 May 2019.For the entire campaign in 2019, the average plume molarratio was 1.07± 0.06 based on multiple measurements ac-quired on different days; these additional measurements wereobtained using a different (but essentially similar in opera-
Figure 11. Example of MobileDOAS traverse made at Manam vol-cano on 27 May 2019 at an altitude of 1000 ma.m.s.l. The emis-sion rate of SO2 was 5200± 660/180 td−1, using the plume speedshown in Fig. 9. Information about the position of the drone belowthe plume is telemetered in real time.
Figure 12. MultiGAS measurements of CO2 and SO2 mixing ratiosat 500 m above the Southern Crater of Manam volcano on 26 May2019. SO2 was detected in small concentrations above the MainCrater (region around 800–900 s after launch) but peaked above thehigh emission column of the Southern Crater. CO2 concentrationsabove background values are only detected over this crater. Theshaded area corresponds to periods of bag sampling activated re-motely and used for isotopic analysis at Baliau village by the DeltaRay infrared mass spectrometer.
tion) MultiGAS unit on board a fixed-wing unmanned aerialvehicle (UAV). The full dataset and volcanological discus-sion thereof are presented in Liu et al. (2020).
3.5 Carbon isotopic composition
Figure 12 shows data from a flight conducted on 26 May2019 combining a MultiGAS instrument with a bag sam-pling unit. A first bag sample was collected after reachingthe anticipated plume location, although no significant SO2concentration was seen in the real-time data on the ground.After some manoeuvering of the drone, the plume was found,and a second bag sample was collected.
Atmos. Meas. Tech., 14, 4255–4277, 2021 https://doi.org/10.5194/amt-14-4255-2021

B. Galle et al.: A drone system for long-range and high-altitude volcanic gas plume measurements 4269
Figure 13. A regression plot of data from Fig. 12 yielding aCO2/SO2 ratio of 0.9± 0.2. Only corresponding pairs where theSO2 mixing ratio was higher than 2 ppm and the altitude was stable(> 2140 ma.m.s.l.) were used for the regression.
Most samples obtained from Manam had concentrationssimilar to the clean air background, with CO2 concentra-tions ranging from 408 to 415 ppm CO2. These samples hadvariable and unreliable δ13C values ranging from −4.2 ‰to −8.6 ‰, reflecting the large error on these low concen-tration samples. Only five samples were obtained with con-centrations above 420 ppm, ranging from 421 to 494 ppmCO2; these data and the volcanological interpretation thereofare discussed in Liu et al. (2020). Extrapolation of thesedata to 100 % CO2 following the methodology of Fischerand Lopez (2016) and Rizzo et al. (2014) yields a value ofδ13C=−3.7 ‰, close to the MOR (mid-oceanic ridge) man-tle range of −5± 1 ‰ of Marty and Zimmermann (1999)and −6.5± 2 ‰ of Sano and Marty (1995). We note, how-ever, that the regression is unconstrained at high CO2 dueto the low CO2 concentrations of the plume samples; there-fore, statistically the potential extrapolated range could beas large as −3.7± 9.5 ‰ in the 95 % confidence interval,i.e. a very large uncertainty (Liu et al., 2020). Values above+1 ‰ are highly unlikely, given that the global compila-tion of arc gases has a δ13C range of +2 ‰ to −19 ‰ (Fis-cher and Chiodini, 2015; Mason et al., 2017). The lowestpossible value within that range of uncertainty would be−13.2 ‰. We can, therefore, rule out a significant contribu-tion from organic carbon, which would have δ13C values ofaround −30 ‰ (Sano and Marty, 1995). Our data are gener-ally consistent with δ13C values of fumarole and hot springgases obtained during the few prior studies in the PNG re-gion (−2.7± 0.1 ‰, Sano and Williams, 1996). Additionaldata from more concentrated samples (with higher CO2 con-centrations ideally > 1000 ppm) collected closer to the ventwould improve the accuracy of the Manam δ13C values. Nev-ertheless, most importantly these results demonstrate a valu-able proof-of-concept that highlights the potential of drone-based sampling of volcanic emissions for future geochemicalstudies.
Table 2. Bromine speciation based on the length of stay in theplume detected by the SO2 sensor.
Date 27 May 2019 Flight 1 Flight 2
Start time [local] 06:54 11:11Average SO2/both peaks [ppm] 0.6 1.0HBr/SO2 × 10−4 30 441 HBr/SO2 × 10−4 13 9BrX/SO2 × 10−4 3 51 BrX/SO2 × 10−4 3 3BrX/HBr × 100 10 121 BrX/HBr × 100 12 6HBr [ppb] 1.7 4.61 HBr [ppb] 0.7 0.9LOD [ppb] 4.3 3.5LOQ [ppb] 14.3 11.7BrX [ppb] 0.2 0.51 BrX [ppb] 0.2 0.3LOD [ppb] 0.2 0.2LOQ [ppb] 0.6 0.6ClX [ppb] 0.1 0.31 ClX [ppb] 0.2 0.2LOD [ppb] 0.5 0.5LOQ [ppb] 1.8 1.8
3.6 Halogen concentrations
On 27 May 2019, we achieved two successful flights with thedenuder system where detection of SO2 indicated that we hadentered the plume. In both flights we detected SO2 in two po-sitions, each at different altitudes, consistent with the obser-vation of two source regions for summit emissions (Fig. 14).The maximum SO2 concentrations were 1.74 and 1.87 ppmin flight 1 and 1.22 and 4.62 ppm in flight 2 for peak 1 and 2,respectively. Detected SO2 concentrations were averaged foreach time we entered the plume. SO2 concentration for eachflight was averaged proportionally to the sampling durationin the plume (Table 2).
For both denuder types, an environmental blank was sam-pled at the starting position on the ground. For HBr the de-nuder results were within the deviation of unsampled butcoated denuders. For reactive bromine, the environmentalblank values were the highest values of the whole campaign(BrX: 0.2 ppb for 3 L sampling volume). In addition, theamount of reactive chlorine was higher than that of reactivebromine in this sample only (ClX: 0.4 ppb for 3 L samplingvolume). Therefore, we infer that this sample was either con-taminated or the location in the grass close to the sea does notrepresent the atmospheric conditions encountered during theflight. Alternatively, we subtracted an environmental blanksampled 10 d earlier in a pre-campaign at Tavurvur volcano,at an altitude of 104 m upwind on the flank of the volcano andabove barren volcanic rock (17 May 2019, BrX: 0.002 ppb,ClX: 0.000 ppb). The result of the environmental blank of
https://doi.org/10.5194/amt-14-4255-2021 Atmos. Meas. Tech., 14, 4255–4277, 2021

4270 B. Galle et al.: A drone system for long-range and high-altitude volcanic gas plume measurements
Figure 14. SO2 data detected by Sunkist in two flights on 27 May 2019.
HBr was within the deviation of coated denuders not usedfor sample collection.
Average concentrations of all analysed bromine and chlo-rine species based on the duration of exposure in the plumeand their calculated LOD and LOQ are given in Table 2. Re-sults were just below the LOD for both bromine species inflight 1. Bromine results for flight 2 were below the LOQbut above LOD. ClX was below LOD in both samples. Theratio of the bromine species to SO2 varies between the twoflights from 30× 104 to 44× 104 for HBr/SO2 and 3× 10⁴
to 5× 10⁴ for BrX/SO2 from flight 1 to 2, respectively, whilethe ratio between the two bromine species BrX/HBr staysstable (flight 1: 0.10, flight 2: 0.12).
Although measurement results were below the LOQ, wewere able to detect HBr and BrX in the plume of Manamvolcano with our two flights. The observed BrX/HBr ratio of0.10–0.12 is relatively low compared to previous detected ra-tios of approximately 0.30 within the first minute in Masaya’splume (Rüdiger et al., 2021). Observed bromine evolution inManam plume seems to follow the trend for high Br/S ratiossuggested by Roberts et al. (2014).
4 Conclusions
We present a hexa-copter UAV specially configured for long-range, high-altitude volcanic gas plume measurements, to-gether with a suite of drone-mountable payloads specializedfor various gas measurements. We describe how the droneand its payloads were operated during a field campaign atManam volcano in Papua New Guinea, demonstrating theutility of the proposed system for achieving long-range high-altitude volcanic gas monitoring.
In response to several key lessons learnt during prior field-based testing, we implemented specific customizations to thedrone platform:
– use of stronger motors and propellers with a larger di-ameter to increase payload and battery weight capacityand thereby improve range and height performance;
– change of operative system to overcome altitude andrange restrictions and enable access to flight logs forposterior analysis;
– use of a race drone ESC (electronic speed control) toimprove manoeuvrability during flight;
– change in frame design to facilitate swapping of modu-lar payloads.
The different payloads include the following:
– an anemometer for measurement of wind/plume speedat plume height
– a MobileDOAS instrument that, combined with plumespeed data, can measure total SO2 emission rate bytraversing below the plume;
– a MultiGAS instrument that can measure in situ concen-trations of SO2, CO2 and H2S in the plume, by flyingclose to the crater;
– a bag sampling unit by which the gas in the plume canbe sampled in Tedlar bags for subsequent analysis ofcarbon isotopes on the ground;
– a denuder system that can sample the plume for lateranalysis of different halogens in the laboratory.
During the 1-week field campaign at Manam volcano,we used all these instrument payloads to perform a total of19 successful flights to the plume of Manam (one for SO2flux, four for CO2/SO2 molar ratio, nine for wind speed,three for C isotopic analysis and two for halogen composi-tion). All these measurements could be carried out with only
Atmos. Meas. Tech., 14, 4255–4277, 2021 https://doi.org/10.5194/amt-14-4255-2021
B. Galle et al.: A drone system for long-range and high-altitude volcanic gas plume measurements 4271
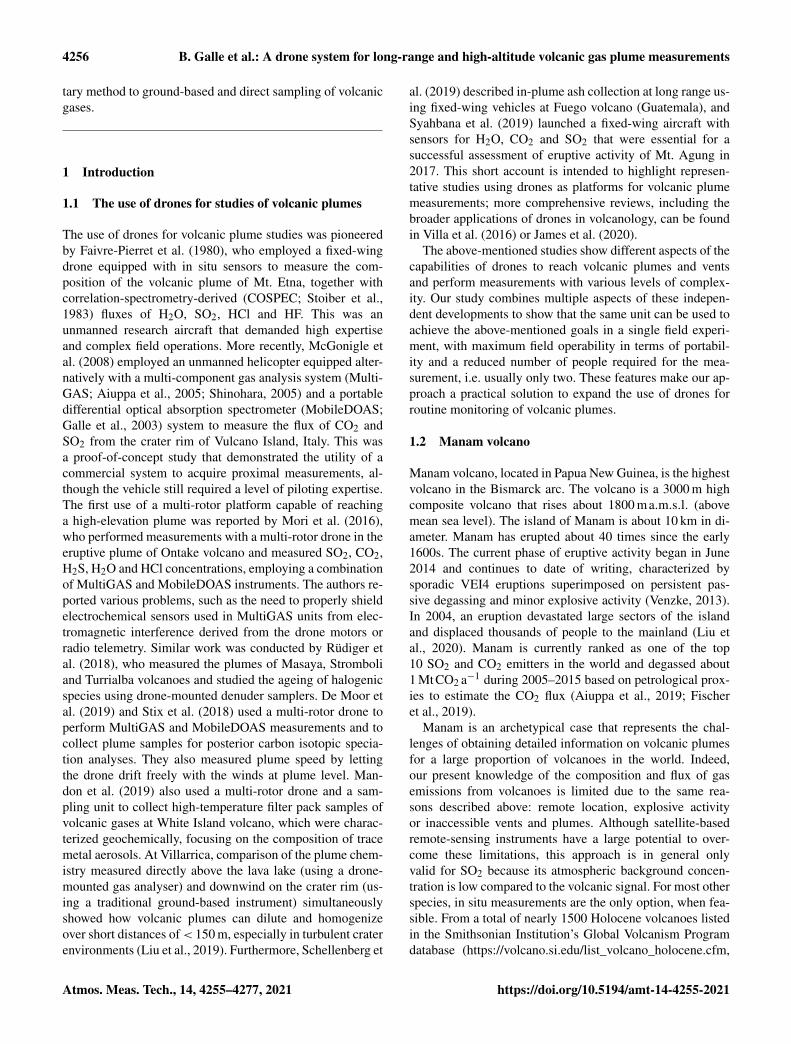
Figure 15. Map with flight trajectories of measurements reported in this study. Wind measurement flights occurred from launch Sites 2and 1 on 22 and 27 May, respectively. Isotopic sampling and MultiGAS flights launched from Site 3 on 26 May. MobileDOAS and Sunkistmeasurement flights launched from Site 1 on 27 May. Sentinel imagery shown was selected based on minimal cloud cover and may notrepresent the location of vents and plumes present in May 2019. The thickness of the trajectory markers is proportional to the altitude of thedrone.
two people (one flying the drone and one supervising themeasurements). Figure 15 shows the trajectories of all flightsfor which data are presented here.
The results presented here represent a subset of the to-tal dataset obtained during a collaborative international fieldcampaign at Manam volcano, involving multiple researchteams and instruments. A complete synthesis of all mea-sured data and their uncertainties, together with detailed vol-canological interpretation, is presented in Liu et al. (2020).The fluxes of SO2 and CO2 were found to be 5200± 660/180and 3220± 500/90 td−1, respectively, based solely on themulti-rotor measurements reported in this study. The δ13C of−3.7± 9.5 ‰ suggests that the CO2 source of Manam cratergas is mantle-dominated with a possible carbonate contribu-tion and a likely insignificant contribution from subductedsedimentary organic carbon. While the range of possible val-ues is large due to the low CO2 concentrations and hencelarge extrapolation to pure CO2, these data are generally con-sistent with a measured plume C/S ratio of 0.9± 0.2, indi-cating a predominantly mantle-derived carbon source. Thebromine speciation and concentration in the plume point to ahigh Br/S ratio.
It was found that an adaptive flight path is essential forsuccessful measurements, through either full manual controlat long distances or adaptable automated waypoint missions.
Access to real-time data of a plume tracer, such as SO2, iscrucial, both when flying visual and when flying beyond vi-sual line of sight, in order for the pilot to refine the position ofthe drone within the plume. Further, prior information aboutthe approximate position of the plume from ground-based in-struments, such as ScanDOAS, is very informative during theflight planning stage to maximize the chance of successfulsampling and should be incorporated into field workflows.Finally, to facilitate at long range and high altitude, underlimited power capacity, the flight path in approaching andreturning from the target is crucial to conserve battery; fly-ing in clouds should be avoided, wind speed and directionshould be taken into account and used to their advantage andthe angle between horizontal and vertical motion should beoptimized for low power consumption.
We have demonstrated that the combination of a multi-rotor with modular payloads is a versatile solution to obtainthe flux and composition of volcanic plumes, even for thecase of a highly active volcano with a high-altitude plumesuch as Manam. We propose that drone-based measurementsoffer a valuable solution for volcano research and monitoringapplications at inaccessible volcanoes globally.
https://doi.org/10.5194/amt-14-4255-2021 Atmos. Meas. Tech., 14, 4255–4277, 2021

4272 B. Galle et al.: A drone system for long-range and high-altitude volcanic gas plume measurements
Appendix A: Technical specifications of the payloads
Table A1. Specifications of payloads of the drone system.
MobileDOAS MultiGAS+ anemometer Bag sampling unit Denuders+Sunkist
Measurement mode Up-looking, traverseremote sensing
In situ sensing In situ sampling In situ sampling
Main purpose Flux of SO2 Molar ratio of CO2/SO2 and H2S/SO2Gas sampling (for post-analysis)Wind velocity
Collect samples for pos-terior analysis of isotopicand gas composition
Gas sampling (for post-analysisof molar ratio of HBr/SO2 andBrX/SO2)
Measured quantities SO2 column densitydistributionPlume speed
SO2 mixing ratioH2S mixing ratioCO2 concentrationRelative humidityTemperaturePressureAir velocityBr compoundsδ13C
δ13C SO2 mixing ratioHBr mixing ratioBrX mixing ratioPressure
Size (L×W ×H ) (cm) 22× 15× 9 21× 14× 14 Inside MultiGAS Sunkist 14× 13× 14Denuders50× 3× 3+micropump
Weight (kg) 0.8 1 Inside MultiGAS Sunkist 0.5Denuders 0.15
Power and voltage (W, V) 12, 5 V 4, 12 V Inside MultiGAS Sunkist: 9V for sensor, 3.7 LiPofor Arduino9 V for micropump
Radio link 433 MHz 433 MHz 433 MHz NA
Components Micro-computer(Azulle QuantumAccess Mini PC Stick)UV grating spectrome-ter (OceanOpticsFlame)Telescope (25 mm di-ameter, FOV 11 mrad)Quartz optics (window,prism, fiber)GPS antenna (Global-Sat BU353S4)
Micro-computer (Arduino Mega2560 with addi-tional ADC of 16 bits ADS1115)Electrochemical sensors (Alphasense SO2-A, re-sponse time t90 20 s, Alphasense H2S-A, responsetime t90 20 s)Dual-band IR radiometer (SmartGas FlowEVO F3-212205-05000 CO2, response time t90 30 s)Environmental sensor (Bosch BME280, RH, T , P )GPS antenna (Adafruit Ultimate)Anemometer, FT Technologies Ltd (FT205EV)Pump (0.5 L min−1)Tedlar bags (1 L)
Micro-computer (Arduino)Pump (1 Lmin−1)Four Tedlar bags (1 L)
Micro-computer (Arduino withmicro SD card logger)Electrochemical sensors(CiTiceL 3MST/F, responsetime< 20 s (SO2)Environmental sensor(BMP180 by BoschSensortec)Pump (200 mLmin−1/denuder)Denuders (brown borosilicateglass tubes, 50 cm, i.d. 0.7 cm)
Sampling frequency (Hz) 1 1 On/off set by timer 2 (SO2)Denuders: no time resolution,one sample/flight
Precision 5 ppmm (SO2)a 2 ppb (SO2)1 ppm (CO2)b
2 ppb (H2S)3 % (RH)0.01 K (temperature)0.2 Pa (pressure)0.1 ms−1 (wind speed)1◦ (wind direction)
0.15 ‰ (δ13C, analysed byDelta Ray IR spectrome-ter)
Accuracy 10 ppmm (SO2)a 15 ppb (SO2)1 ppm (CO2)b
5 ppb (H2S)3 % (RH)1 K (temperature)120 Pa (pressure)0.3 ms−1 (wind speed)4◦ (wind direction)
± 0.5 ‰ (δ13C) ± 1 ppm ± 1 % signal (SO2)Halogen species: for each sam-ple separately (see Table 2).
Range 0–20 000 ppmm (SO2) 0–50 ppm (SO2)0–1000 ppm (CO2)0–50 ppm (H2S)0 %–100 % (RH)243–358 K (temperature)300–1100 hPa (pressure)0–75 ms−1 (wind speed)0–360◦ (wind direction)
200 ppm – 2500 ppm CO2 0–200 ppm (SO2)Halogen species: LOD andLOQ for each sampleseparately (see Table 2).
a For S/N∼ 500 : 1 assuming 50 % of intensity saturation for an average of 15 spectra taken at 0.5 s exposure time. b In lab conditions. In field conditions, accuracyand precision may be considerably disturbed by electric interference. See Figs. S1 and S2 in the Supplement. NA: not available.
Atmos. Meas. Tech., 14, 4255–4277, 2021 https://doi.org/10.5194/amt-14-4255-2021
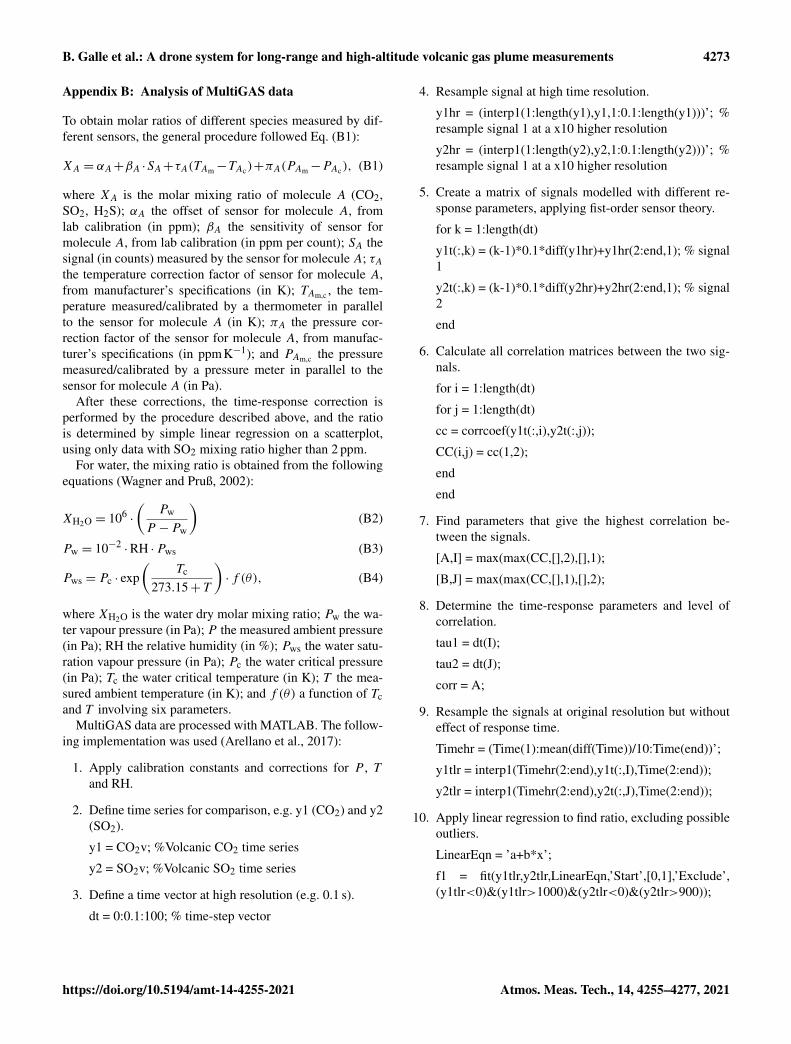
B. Galle et al.: A drone system for long-range and high-altitude volcanic gas plume measurements 4273
Appendix B: Analysis of MultiGAS data
To obtain molar ratios of different species measured by dif-ferent sensors, the general procedure followed Eq. (B1):
XA = αA+βA ·SA+τA(TAm−TAc)+πA(PAm−PAc), (B1)
where XA is the molar mixing ratio of molecule A (CO2,SO2, H2S); αA the offset of sensor for molecule A, fromlab calibration (in ppm); βA the sensitivity of sensor formolecule A, from lab calibration (in ppm per count); SA thesignal (in counts) measured by the sensor for molecule A; τAthe temperature correction factor of sensor for molecule A,from manufacturer’s specifications (in K); TAm,c , the tem-perature measured/calibrated by a thermometer in parallelto the sensor for molecule A (in K); πA the pressure cor-rection factor of the sensor for molecule A, from manufac-turer’s specifications (in ppmK−1); and PAm,c the pressuremeasured/calibrated by a pressure meter in parallel to thesensor for molecule A (in Pa).
After these corrections, the time-response correction isperformed by the procedure described above, and the ratiois determined by simple linear regression on a scatterplot,using only data with SO2 mixing ratio higher than 2 ppm.
For water, the mixing ratio is obtained from the followingequations (Wagner and Pruß, 2002):
XH2O = 106·
(Pw
P −Pw
)(B2)
Pw = 10−2·RH ·Pws (B3)
Pws = Pc · exp(
Tc
273.15+ T
)· f (θ), (B4)
where XH2O is the water dry molar mixing ratio; Pw the wa-ter vapour pressure (in Pa); P the measured ambient pressure(in Pa); RH the relative humidity (in %); Pws the water satu-ration vapour pressure (in Pa); Pc the water critical pressure(in Pa); Tc the water critical temperature (in K); T the mea-sured ambient temperature (in K); and f (θ) a function of Tcand T involving six parameters.
MultiGAS data are processed with MATLAB. The follow-ing implementation was used (Arellano et al., 2017):
1. Apply calibration constants and corrections for P , Tand RH.
2. Define time series for comparison, e.g. y1 (CO2) and y2(SO2).
y1 = CO2v; %Volcanic CO2 time series
y2 = SO2v; %Volcanic SO2 time series
3. Define a time vector at high resolution (e.g. 0.1 s).
dt = 0:0.1:100; % time-step vector
4. Resample signal at high time resolution.
y1hr = (interp1(1:length(y1),y1,1:0.1:length(y1)))’; %resample signal 1 at a x10 higher resolution
y2hr = (interp1(1:length(y2),y2,1:0.1:length(y2)))’; %resample signal 1 at a x10 higher resolution
5. Create a matrix of signals modelled with different re-sponse parameters, applying fist-order sensor theory.
for k = 1:length(dt)
y1t(:,k) = (k-1)*0.1*diff(y1hr)+y1hr(2:end,1); % signal1
y2t(:,k) = (k-1)*0.1*diff(y2hr)+y2hr(2:end,1); % signal2
end
6. Calculate all correlation matrices between the two sig-nals.
for i = 1:length(dt)
for j = 1:length(dt)
cc = corrcoef(y1t(:,i),y2t(:,j));
CC(i,j) = cc(1,2);
end
end
7. Find parameters that give the highest correlation be-tween the signals.
[A,I] = max(max(CC,[],2),[],1);
[B,J] = max(max(CC,[],1),[],2);
8. Determine the time-response parameters and level ofcorrelation.
tau1 = dt(I);
tau2 = dt(J);
corr = A;
9. Resample the signals at original resolution but withouteffect of response time.
Timehr = (Time(1):mean(diff(Time))/10:Time(end))’;
y1tlr = interp1(Timehr(2:end),y1t(:,I),Time(2:end));
y2tlr = interp1(Timehr(2:end),y2t(:,J),Time(2:end));
10. Apply linear regression to find ratio, excluding possibleoutliers.
LinearEqn = ’a+b*x’;
f1 = fit(y1tlr,y2tlr,LinearEqn,’Start’,[0,1],’Exclude’,(y1tlr<0)&(y1tlr>1000)&(y2tlr<0)&(y2tlr>900));
https://doi.org/10.5194/amt-14-4255-2021 Atmos. Meas. Tech., 14, 4255–4277, 2021

4274 B. Galle et al.: A drone system for long-range and high-altitude volcanic gas plume measurements
Appendix C: Analysis of MobileDOAS data
To obtain the SO2 flux, the integral of SO2 column densitiesacross a surface perpendicular to the plume direction is mul-tiplied by plume speed. Plume direction is obtained from thevector joining the source (crater) and the peak column den-sity in the traverse. Plume speed is obtained preferably by thedrone drift method.
To obtain the SO2 column densities, each spectrum in thetraverse is divided by a spectrum from a region outside ofthe plume (which could be identified a posteriori as one withminimum column density). The transmittance spectrum is fit-ted to a model following the DOAS method (Platt and Stutz,2008). The model includes absorption cross-sections of SO2(Vandaele et al., 1994) and O3 (Voigt et al., 2001), a syn-thetic Ring-effect pseudo-absorber (from Chance and Ku-rucz, 2010) and a polynomial of fifth order to account forbroadband extinction due mainly to scattering. The fitting isperformed between 310 and 325 nm, and the shift is allowedfor a spectrum with high SO2 signal and then fixed for therest of the spectra in the same traverse.
Data are processed with MobileDOAS software (Johans-son et al., 2019).
Atmos. Meas. Tech., 14, 4255–4277, 2021 https://doi.org/10.5194/amt-14-4255-2021

B. Galle et al.: A drone system for long-range and high-altitude volcanic gas plume measurements 4275
Data availability. All data files presented in this article can befound at https://doi.org/10.5878/q3wv-ty69 (Galle and Arellano,2021).
Supplement. The supplement related to this article is available on-line at: https://doi.org/10.5194/amt-14-4255-2021-supplement.
Author contributions. SA, NB, TPF, AG, BG, GG, EJL, KM, SN,JR, TR and KW participated in the field measurements. GG pilotedthe drone. SA and BG collected and analysed Chalmers data (Multi-GAS and MobileDOAS). TPF and SN collected and analysed UNMdata (Isotope analysis). NB, AG, TH and JR collected and analysedUM data (Sunkist and denuders). GG and TK built the drone. SA,VC and JX built and calibrated the Chalmers payloads. SN built theUNM payload. NB, AG, TH and JR built and calibrated the UMpayload. EJL coordinated the field campaign with support from II,KM, TR and KW. All authors contributed to writing the article.
Competing interests. The authors declare that they have no conflictof interest.
Acknowledgements. We thank the Rabaul Volcano Observatory(RVO) and the community of Baliau village on Manam island fortheir assistance and hospitality. We thank the PX4 autopilot devel-opment team for their open-source flight control software.
The main funding for this work comes from the Aerial Based Ob-servations of Volcanic Emissions (ABOVE) project, funded by theAlfred P. Sloan Foundation through their support of the Deep Car-bon Observatory (DCO) project. The drone and Chalmers payloadswere supported by FORMAS, the Swedish Research Council forSustainable Development. Santiago Arellano was supported by theSwedish National Space Agency (Dnr 149/18). Kieran Wood wassupported by the NCNR EPSRC grant (EP/R02572X/1). Emma J.Liu acknowledges support from a Leverhulme Early Career Fellow-ship. Tom Richardson was supported by the EPSRC CASCADEprogramme grant (EP/R009953/1).
Financial support. This research has been supported by the Al-fred P. Sloan Foundation (Aerial Based Observations of VolcanicEmissions (ABOVE) project), the Swedish Research Council forSustainable Development (FORMAS), the Swedish National SpaceAgency (grant non. Dnr 149/18), the NCNR EPSRC grant (grantno. EP/R02572X/1), Leverhulme Early Career Fellowship, and theEPSRC CASCADE programme grant (grant no. EP/R009953/1).
Review statement. This paper was edited by Francis Pope and re-viewed by Peter Kelly and one anonymous referee.
References
Aiuppa, A., Federico, C., Giudice, G., and Gurrieri, S.: Chemi-cal mapping of a fumarolic field: La Fossa Crater, Vulcano Is-land (Aeolian Islands, Italy), Geophys. Res. Lett., 32, L13309,https://doi.org/10.1029/2005GL023207, 2005.
Aiuppa, A., Fischer, T. P., Plank, T., and Bani, P.: CO2 flux emis-sions from the Earth’s most actively degassing volcanoes, 2005–2015, Sci. Rep., 9, 5442, https://doi.org/10.1038/s41598-019-41901-y, 2019.
Arellano, S., Galle, B., Mulina, K., Wallius, J., McCormick, B.,Salem, L., D’aleo, R., Barry, P., and Itikarai, I.: Report on vol-canic plume measurements on volcanoes in Papua New Guinea,Chalmers University of Technology, Gothenburg, Sweden, avail-able at: https://research.chalmers.se/publication/254380 (last ac-cess: 3 June 2021), 2017.
Beecken, J., Mellqvist, J., Salo, K., Ekholm, J., Jalkanen, J.-P., Jo-hansson, L., Litvinenko, V., Volodin, K., and Frank-Kamenetsky,D. A.: Emission factors of SO2, NOx and particles from shipsin Neva Bay from ground-based and helicopter-borne measure-ments and AIS-based modeling, Atmos. Chem. Phys., 15, 5229–5241, https://doi.org/10.5194/acp-15-5229-2015, 2015.
Carn, S., Fioletov, V., McLinden, C. A., Li, C., and Krotkov, N.A.: A decade of global volcanic SO2 emissions measured fromspace, Sci. Rep., 7, 44095, https://doi.org/10.1038/srep44095,2017.
Chance, K. and Kurucz, R. L.: An improved high-resolution solarreference spectrum for Earth’s atmosphere measurements in theultraviolet, visible, and near infrared, J. Quant. Spectrosc. Ra.,111, 1289–1295, 2010.
Chiodini, G., Caliro, S., Aiuppa, A., Avino, R., Granieri, D.,Moretti, R., and Parello F.: First 13C/12C isotopic characterisa-tion of volcanic plume CO2, B. Volcanol., 73, 531–542, 2011.
de Moor, J. M., Stix, J., Avard, G., Muller, C., Cor-rales, E., Diaz, J. A., Alan, A., Brenes, J., Pacheco, J.,Aiuppa, A., and Fischer, T. P.: Insights on Hydrothermal-Magmatic Interactions and Eruptive Processes at Poás Vol-cano (Costa Rica) From High-Frequency Gas Monitoring andDrone Measurements, Geophys. Res. Lett., 46, 1293–1302,https://doi.org/10.1029/2018gl080301, 2019.
Edmonds, M., Herd, H., Galle, B., and Oppenheimer, C.: Au-tomated, high time-resolution measurements of SO2 flux atSoufrière Hills Volcano, Montserrat, West Indies, B. Volcanol.,65, 578–586, https://doi.org/10.1007/s00445-003-0286-x, 2003.
Faivre-Pierret, R., Martin, D., and Sabroux, J. C.: Contributiondes Sondes Aérologiques Motorisées à l’Etude de la Physico–Chimie des Panaches Volcaniques, B. Volcanol., 43, 473–485,https://doi.org/10.1007/BF02597686, 1980.
Fischer, T. P. and Chiodini, G.: Volcanic, Magmatic andHydrothermal Gas Discharges, in: Encyclopedia of Vol-canoes, Elsevier Science Direct, 2nd edn., 779–797,https://doi.org/10.1016/B978-0-12-385938-9.00045-6, 2015.
Fischer, T. P. and Lopez, T. M.: First airborne samples of a volcanicplume for δ13C of CO2 determinations, Geophys Res. Lett., 43,3272–3279, https://doi.org/10.1002/2016GL068499, 2016.
Fischer, T. P., Arellano, S., Carn, S., Aiuppa, A., Galle, B., Allard,P., Lopez, T., Shinohara, H., Kelly, P., Werner, C., Cardellini,C., and Chiodini, G.: The emissions of CO2 and other volatilesfrom the world’s subaerial volcanoes, Sci. Rep., 9, 18716,https://doi.org/10.1038/s41598-019-54682-1, 2019.
https://doi.org/10.5194/amt-14-4255-2021 Atmos. Meas. Tech., 14, 4255–4277, 2021

4276 B. Galle et al.: A drone system for long-range and high-altitude volcanic gas plume measurements
Galle, B. and Arellano, S.: Volcanic gas measurements withdrones on Manam Papua, Nya Guinea, Chalmers Univer-sity of Technology, Department of Space, Earth and Environ-ment, Swedish National Data Service [data set], Version 1,https://doi.org/10.5878/q3wv-ty69, 2021.
Galle, B., Oppenheimer, C., Geyer, A., McGonigle, A., Ed-monds, M., Horrocks, L.: A miniaturised ultraviolet spectrom-eter for remote sensing of SO2 fluxes: a new tool for vol-cano surveillance, J. Volcanol. Geoth. Res., 119, 241–254,https://doi.org/10.1016/S0377-0273(02)00356-6, 2003.
Galle, B., Johansson, M., Rivera, C., Zhang, Y., Kihlman, M.,Kern, C., Lehmann, T., Platt, U., Arellano S., and Hidalgo, S.:Network for Observation of Volcanic and Atmospheric Change(NOVAC)—A global network for volcanic gas monitoring: Net-work layout and instrument description, J. Geophys. Res., 115,D05304 https://doi.org/10.1029/2009JD011823, 2010.
Gutmann, A., Bobrowski, N., Roberts, T. J., Rüdiger,J., and Hoffmann, T.: Advances in Bromine Speci-ation in Volcanic Plumes, Front. Earth Sci., 6, 213,https://doi.org/10.3389/feart.2018.00213, 2018.
Gutmann, A., Bobrowski, N., Liotta, M., and Hoffmann, T.:Bromine Speciation in Volcanic Plumes: New in-situ Derivati-zation LC-MS Method for the Determination of Gaseous Hydro-gen Bromide by Gas Diffusion Denuder Sampling, Atmos. Meas.Tech. Discuss. [preprint], https://doi.org/10.5194/amt-2020-357,in review, 2020.
James, M. R., Carr, B., D’Arcy, F., Diefenbach, A., Dietterich,H., Fornaciai, A., Lev, E., Liu, E., Pieri, D., Rodgers, M.,Smets, B., Terada, A., von Aulock, F., Walter, T., Wood, K.,and Zorn, E.: Volcanological applications of unoccupied aircraftsystems (UAS): Developments, strategies, and future challenges,Volcanica, 3, 67–114. https://doi.org/10.30909/vol.03.01.67114,2020.
Johansson, M.: Application of Passive DOAS for Studies ofMegacity Air Pollution and Volcanic Gas Emissions, PhD the-sis, Chalmers University of Technology, Gothenburg, Sweden,64 pp., 2009.
Johansson, M., Galle, B., Zhang, Y., Rivera, C., and Chen, D.:The Dual-Beam technique – single instrument measurementsof plume height and plume speed, B. Volcanol., 71, 747–751,https://doi.org/10.1007/s00445-008-0260-8, 2009.
Johansson, M., Yang, Z., and Norgaard, D.: MobileDOAS soft-ware v. 6.2, available at: https://github.com/NOVACProject/MobileDOAS (last access: 4 June 2021), 2019.
Kelly, P. J., Kern, C., Roberts, T. J., Lopez, T., Werner,C., and Aiuppa, A.: Rapid chemical evolution of tro-pospheric volcanic emissions from Redoubt Volcano,Alaska, based on observations of ozone and halogen-containing gases, J. Volcanol. Geoth. Res., 259, 317–333,https://doi.org/10.1016/J.JVOLGEORES.2012.04.023, 2013.
Liu, E. J., Wood, K., Mason, E., Edmonds, M., Aiuppa, A., Giu-dice, G., Bitetto, M., Francofonte, V., Burrow, S., Richard-son, T., Watson, M., Pering, T. D., Wilkes, T. C., McGonigle,A. J. S., Velasquez, G., Melgarejo, C., and Bucarey, C.: Dy-namics of outgassing and plume transport revealed by prox-imal unmanned aerial system (UAS) measurements at Vol-cán Villarrica, Chile, Geochem. Geophy. Geosy., 20, 730–750,https://doi.org/10.1029/2018GC007692, 2019.
Liu, E., Aiuppa, A., Alan, A., Arellano, S., Bitetto, M., Bobrowski,N., Carn, S., Clarkes, R., Corrales, E., de Moor, J., Diaz, J., Ed-monds, M., Fischer, T., Freer, J., Fricke, G., Galle, B., Gerdes,G., Giudice, G., Gutmann, A., Hayer, C., Itikarai, I., Jones, J.,Mason, E., McCormick, B., Mulina, K., Nowicki, S., Rahilly, K.,Richardson, T., Rüdiger, J., Schipper, I., Watson, I., and Woods,K.: Aerial strategies advance volcanic gas measurements at in-accessible, strongly degassing volcanoes, Science Advances, 6,eabb9103, https://doi.org/10.1126/sciadv.abb9103, 2020.
Lucic, G., Stix, J., and Wing, B.: Structural controls on theemission of magmatic carbon dioxide gas, Long ValleyCaldera, USA, J. Geophys. Res.-Sol Ea., 120, 2262–2278,https://doi.org/10.1002/2014JB011760, 2015.
Lübcke, P., Bobrowski, N., Arellano, S., Galle, B., Garzón, G.,Vogel, L., and Platt, U.: BrO/SO2 molar ratios from scanningDOAS measurements in the NOVAC network, Solid Earth, 5,409–424, https://doi.org/10.5194/se-5-409-2014, 2014.
Mandon, C., Christenson, B., Schipper, I., Seward, T., andGaraebiti, E.: Metal transport in volcanic plumes: A case studyat White Island and Yasur volcanoes, J. Volcanol. Geoth. Res.,369, 155–171, https://doi.org/10.1016/j.jvolgeores.2018.11.024,2019.
Marty, B. and Zimmermann, L.: Volatiles (He, C, N, Ar) inmid-ocean ridge basalts: assessment of shallow-level fractiona-tion and characterization of source composition, Geochim. Cos-mochim. Ac., 63, 3619–3633, 1999.
Mason, E., Edmonds, M., and Turchyn, A. V.: Remobilization ofcrustal carbon may dominate volcanic arc emissions, Science,357, 290–294, 2017.
McGonigle, A. J. S., Aiuppa, A., Giudice, G., Tamburello, G., Hod-son, A. J., and Gurrieri, S., Unmanned aerial vehicle measure-ments of volcanic carbondioxide fluxes, Geophys. Res. Lett., 35,L06303, https://doi.org/10.1029/2007GL032508, 2008.
Mellqvist, J., Beecken, J., Conde, V., and Ekholm, J.: Surveil-lance of Sulfur Emissions from Ships in Danish Wa-ters, final report to Danish Environmnetal Protecion agency,https://doi.org/10.17196/DEPA.001, 2018.
Millán, M. M.: Remote sensing of air pollutants. A study of someatmospheric scattering effects, Atmos. Environ., 14, 1241–1253,1980.
Mori, T., Kazahaya, K., Ohwada, M., Hirabayashi, J., andYoshikawa, S.: Effect of UV scattering on SO2 emis-sion rate measurements. Geophys. Res. Lett., 33, L17513,https://doi.org/10.1029/2006GL026285, 2006.
Mori, T., Hashimoto, T., Terada, A., Yoshimoto, M., Kazahaya, R.,Shinohara, H., and Tanaka, R.: Volcanic plume measurementsusing a UAV for the 2014 Mt. Ontake eruption, Earth PlanetsSpace, 68, 49, https://doi.org/10.1186/s40623-016-0418-0, 2016.
Pallas-Areny, R. and Webster, J. G.: Sensors and Signal Condition-ing, Wiley, New York, 1991.
Platt, U. and Stutz, J.: Differential Optical Absorption Spec-troscopy, Principles and Applications, Physics of Earth andSpace Environments, Springer, Berlin, Germany, 597 pp.,ISBN 978-3-540-75776-4, 2008.
Rizzo, A. L., Jost, H.-J., Caracausi, A., Paonita, A., Liotta, M., andMartelli, M.: Real-time measurements of the concentration andisotope composition of atmospheric and volcanic CO2 at MountEtna (Italy), Geophys. Res. Lett., 41, 2382–2389, 2014.
Atmos. Meas. Tech., 14, 4255–4277, 2021 https://doi.org/10.5194/amt-14-4255-2021

B. Galle et al.: A drone system for long-range and high-altitude volcanic gas plume measurements 4277
Rizzo, A. L., Liuzzo, M., Ancellin, M. A., and Jost, H. J.: Real-time measurements of δ13C, CO2 concentration, and CO2/SO2in volcanic plume gases at Mount Etna, Italy, over 5 consecutivedays, Chem. Geol., 411, 182–191, 2015.
Roberts, T. J., Martin, R. S., and Jourdain, L.: Reactive brominechemistry in Mount Etna’s volcanic plume: the influence oftotal Br, high-temperature processing, aerosol loading andplume–air mixing, Atmos. Chem. Phys., 14, 11201–11219,https://doi.org/10.5194/acp-14-11201-2014, 2014.
Roberts, T. J., Lurton, T., Giudice, G., Liuzzo, M., Aiuppa, A.,Coltelli, M., Vignelles, D., Salerno, G., Couté, B., Chartier,M., Baron, R., Saffell, J. R., and Scaillet, B.: Validationof a novel Multi-Gas sensor for volcanic HCl alongsideH2S and SO2 at Mt. Etna, B. Volcanol., 79, 11201–11219,https://doi.org/10.1007/s00445-017-1114-z, 2017.
Rüdiger, J., Bobrowski, N., Liotta, M., and Hoffmann, T.:Development and application of a sampling method forthe determination of reactive halogen species in volcanicgas emissions, Anal. Bioanal. Chem., 409, 5975–5985,https://doi.org/10.1007/s00216-017-0525-1, 2017.
Rüdiger, J., Tirpitz, J.-L., de Moor, J. M., Bobrowski, N., Gutmann,A., Liuzzo, M., Ibarra, M., and Hoffmann, T.: Implementationof electrochemical, optical and denuder-based sensors and sam-pling techniques on UAV for volcanic gas measurements: ex-amples from Masaya, Turrialba and Stromboli volcanoes, At-mos. Meas. Tech., 11, 2441–2457, https://doi.org/10.5194/amt-11-2441-2018, 2018.
Rüdiger, J., Gutmann, A., Bobrowski, N., Liotta, M., de Moor,J. M., Sander, R., Dinger, F., Tirpitz, J.-L., Ibarra, M., Sa-ballos, A., Martínez, M., Mendoza, E., Ferrufino, A., Stix, J.,Valdés, J., Castro, J. M., and Hoffmann, T.: Halogen activa-tion in the plume of Masaya volcano: field observations andbox model investigations, Atmos. Chem. Phys., 21, 3371–3393,https://doi.org/10.5194/acp-21-3371-2021, 2021.
Ryan, W. B. F., Carbotte, S. M., Coplan, J. O., O’Hara, S., Melko-nian, A., Arko, R., Weissel, R. A., Ferrini, V., Goodwillie, A.,Nitsche, F., Bonczkowski, J., and Zemsky, R.: Global Multi-Resolution Topography synthesis, Geochem. Geophy. Geosy.,10, Q03014, https://doi.org/10.1029/2008GC002332, 2009.
Sano, Y. and Marty, B.: Origin of carbon in fumarolic gas from is-land arcs, Chem. Geol., 119, 265–274, 1995.
Sano, Y. and Williams, S. N.: Fluxes of mantle and subducted car-bon along convergent plate boundaries, Geophys. Res. Lett., 23,2749–2752, https://doi.org/10.1029/96GL02260, 1996.
Schellenberg, B., Richardson, T., Watson, M., Greatwood, C.,Clarke, R., Thomas, R., Wood, K., Freer, J., Thomas, H., Liu,E., Salama, F., and Chigna, G.: Remote sensing and identifi-cation of volcanic plumes using fixed-wing UAVs over Vol-cán de Fuego, Guatemala, J. Field Robot., 36, 1192—1211,https://doi.org/10.1002/rob.21896, 2019.
Sharp, Z. D.: Principles of Stable Isoptope Geochemistry, PearsonPrentice Hall, New Jersey, 344 pp., 2007.
Shinohara, H.: A new technique to estimate volcanic gas composi-tion: plume measurements with a portable multi-sensor system,J. Volcanol. Geoth. Res., 143, 319–333, 2005.
Stix, J., de Moor, J. M., Rüdiger, J., Alan, A., Corrales, E., D’Arcy,F., Diaz, J. A., and Liotta, M.: Using Drones and Miniaturized In-strumentation to Study Degassing at Turrialba and Masaya Vol-canoes, Central America, J. Geophys. Res.-Sol. Ea., 123, 6501–6520, https://doi.org/10.1029/2018jb015655, 2018.
Stoiber, R., Malinconico Jr., L., Williams, S. N.: Use of the cor-relation spectrometer at volcanoes, in: Forecasting VolcanicEvents. Developments in Volcanology, edited by: Tazieff, H.and Sabroux, J. C., Elsevier Science Publisher, Amsterdam, theNetherlands, 425-444, 1983.
Syahbana, D. K., Kasbani, K., Suantika, G., Prambada, O., Andreas,A. S., Saing, U. B., Kunrat, S. L., Andreastuti, S., Martanto, M.,Kriswati, E., Suparman, Y., Humaida, H., Ogburn, S., Kelly, P. J.,Wellik, J., Wright, H. M. N., Pesicek, J. D., Wessels, R., Kern, C.,Lisowski, M., Diefenbach, A., Poland, M., Beauducel, F., Pallis-ter, J., Vaughan, R. G., and Lowenstern, J. B.: The 2017–19 activ-ity at Mount Agung in Bali (Indonesia): Intense unrest, monitor-ing, crisis response, evacuation, and eruption, Sci. Rep., 9, 8848,https://doi.org/10.1038/s41598-019-45295-9, 2019.
Textor, C., Graf, H.-F., Timmreck, C., and Robock, A. (Eds.): Emis-sions from volcanoes: Emissions of Atmospheric Trace Com-pounds, Advances in Global Change Research, 18, SpringerNetherlands, Dordrecht, 2004.
Vandaele, A. C., Simon, P. C., Guilmot, J. M., Carleer, M., andColin, R.: SO2 Absorption cross-section measurement in the UVusing a Fourier transform spectrometer, J. Geophys. Res., 99,25599–25605, 1994.
van Geldern, R., Nowak, M. E., Zimmer, M., Szizybalski, A., Myrt-tinen, A., Barth, J. A., and Jost, H. J.: Field-based stable isotopeanalysis of carbon dioxide by mid-infrared laser spectroscopy forcarbon capture and storage monitoring, Anal. Chem., 86, 12191–12198, 2014.
Venzke, E. (Ed.): Volcanoes of the World v. 4.8.3.,Global_Volcanism_Program, Manam (251020), Smithso-nian Institution, https://doi.org/10.5479/si.GVP.VOTW4-2013,2013.
Villa, T. F., Gonzalez, F., Miljievic, B., Ristovski, Z. D.,and Morawska, L: An Overview of Small UnmannedAerial Vehicles for Air Quality Measurements: PresentApplications and Future Prospectives, Sensors, 16, 1072,https://doi.org/10.3390/s16071072, 2016.
Voigt, S., Orphal, J., Bogumil, K., and Burrows, J. P.: The temper-ature dependence (203–293 K) of the absorption cross sectionsof O3 in the 230–850 nm region measured by Fourier-Transformspectroscopy, J. Photoch. Photobio. A, 143, 1–9, 2001.
Wagner, W. and Pruß, A.: The IAPWS Formulation 1995 for theThermodynamic Properties of Ordinary Water Substance forGeneral and Scientific Use, J. Phys. Chem. Ref. Data, 31, 387–535, 2002.
https://doi.org/10.5194/amt-14-4255-2021 Atmos. Meas. Tech., 14, 4255–4277, 2021
Related Documents