A Mirror of the Present Business Scene in Foundry Industry. Financial Performance figures of first 9 months (ended 31-12-2020) of the current FY, when compared to similar 9 month period (ended 31-12-2019) of the previous FY indicate “worrisome” situation. To help foundrymen to correctly assess the business scene, we have also compared only 3 rd Quarter (Oct-Nov-Dec 2020)’s figures with similar figures of previous year’s 3rd Quarter, as also with 2 nd Quarter of the current year. Both these comparisons create improved confidence among the foundrymen about the revival of metal-casting business post lockdown of Covid-19 pandemic. As these results are shared by listed companies late, we could not highlight in March/April,2021 issue. These will be highlighted in May/June,2021 issue. To support the Readers for timely information, these are placed in advance at our website. (More details about each of the three comparisons will appear at the website one by one after one week.)

Welcome message from author
This document is posted to help you gain knowledge. Please leave a comment to let me know what you think about it! Share it to your friends and learn new things together.
Transcript

A Mirror of the Present Business Scene in Foundry Industry. Financial Performance figures of first 9 months (ended 31-12-2020) of the current FY, when compared to similar 9 month period (ended 31-12-2019) of the previous FY indicate “worrisome” situation. To help foundrymen to correctly assess the business scene, we have also compared only 3rd Quarter (Oct-Nov-Dec 2020)’s figures with similar figures of previous year’s 3rd Quarter, as also with 2nd Quarter of the current year. Both these comparisons create improved confidence among the foundrymen about the revival of metal-casting business post lockdown of Covid-19 pandemic. As these results are shared by listed companies late, we could not highlight in March/April,2021 issue. These will be highlighted in May/June,2021 issue. To support the Readers for timely information, these are placed in advance at our website. (More details about each of the three comparisons will appear at the website one by one after one week.)
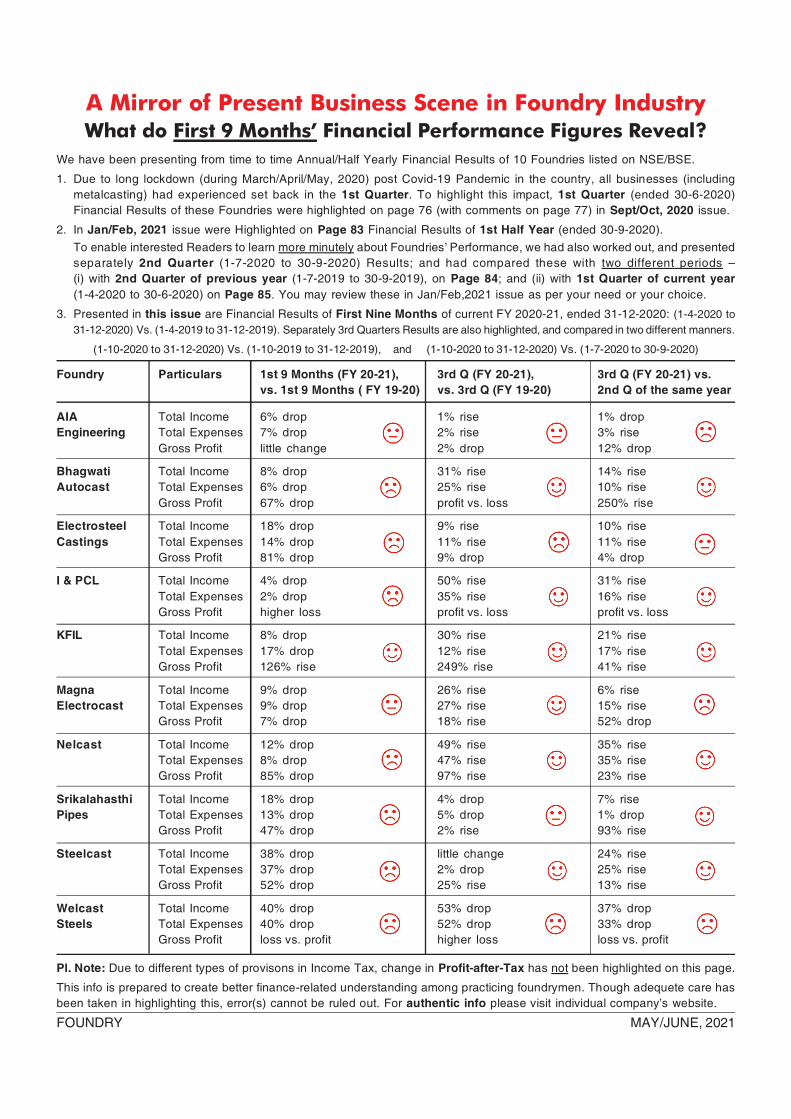

FY 2020-21 First 9 Months’ Financial Results of Ten Foundries Listed on Bombay/National Stock Exchange
For the Period : First 9 Months of FY 2020-21, ended 31-12-2020 (Vs. First 9 Months of FY 2019-20, ended 31-12-2019) (Rs. in Lakh)
AIA Engineering Bhagwati Autocast Electrosteel Castings Inv. & Prec. Castings Kirl. Ferrous Inds.
Sr. Particulars 9 Months ended 31-12-20 31-12-19 31-12-20 31-12-19 31-12-20 31-12-19 31-12-20 31-12-19 31-12-20 31-12-19No. (below)
1 Total Income 194705 206082 7107 7686 155726 189372 6878 7191 129122 140285Change compared to previous year (-6%) (-8%) (-18%) (-4%) (-8%)
2 Total Expenses 142090 153526 7028 7446 153399 177367 7218 7328 109900 131796Change compared to previous year (-7%) (-6%) (-14%) (-2%) (-17%)
3 Gross Profit 52615 52557 79 240 2327 12005 (340) (137) 19222 8489Change compared to previous year little change (-67%) (-81%) higher loss loss (+126%)
4 Profit After Tax 39368 44270 57 173 2300 8880 (244) (94) 16678 5488Change compared to previous year (-11%) (-67%) (-74%) higher loss loss (+204%)
Note : All figures have been rounded off to nearest integer (Unit : Rs. in lakh)Caution : This information is presented to create interest in “Financial Aspects of Foundry Operations” among Foundrymen. Care has been taken to select and present appropriate figuresfrom the sources indicated below. Yet possibility of mistake(s) cannot be ruled out. Interested readers must refer to the original source for ascertaining correctness of the figures. – Editor(Source : This information has been taken from the Results appearing at the website of BSE/NSE, and/or in leading News Papers, and/or from the websites of these companies.)
Magna Electrocast. Nelcast Srikalahasthi Pipes Steelcast Welcast Steels
Sr. Particulars 9 Months ended 31-12-20 31-12-19 31-12-20 31-12-19 31-12-20 31-12-19 31-12-20 31-12-19 31-12-20 31-12-19No. (below)
1 Total Income 7033 7737 39408 44624 107423 130715 10349 16823 7352 12283Change compared to previous year (-9%) (-12%) (-18%) (-38%) (-40%)
2 Total Expenses 6282 6932 39119 42707 98351 113462 9423 14900 7372 12246Change compared to previous year (-9%) (-8%) (-13%) (-37%) (-40%)
3 Gross Profit 751 806 289 1917 9072 17253 926 1922 (19) 37Change compared to previous year (-7%) (-85%) (-47%) (-52%) loss
4 Profit After Tax 501 641 240 1312 6388 13655 759 1013 (58) 23Change compared to previous year (-22%) (-82%) (-53%) (-25%) loss
Overall ObservationDuring 1st Quarter (ended 30-06-2020) of current FY 2020-21, due to long lockdown post Covid-19 pandemic, Foundries had experienced drastic drop in castings production, and hencebusiness volume. (Performance Results were highlighted in a Table on page 76, with Comments on page 77, in Sept/Oct, 2020 issue)...... With good recovery during 2nd & 3rd Quarters(ended 31-12-2020), the combined first Nine Months’ results of Current FY 2020-21 are highlighted on this (a) page. It seems metalcasting business is slowly returning to normal.Two separate Quarterly performance comparisons appear in other two Tables on next 2 pages:(b) Traditional Performance comparison between 3rd Quarter (FY 2020-21), with 3rd Quarter (FY 2019-20) on the next page.(c) As a special case, comparison between 3rd Quarter (FY 2020-21), with 2nd Quarter of the same year (FY 2020-21) appear on the page thereafter.
A M
irror of Present B
usiness Scene in Foundry
FOU
ND
RY
MA
Y/JU
NE
, 2021
(Table 1 of 3)
(Table 1 of 3)

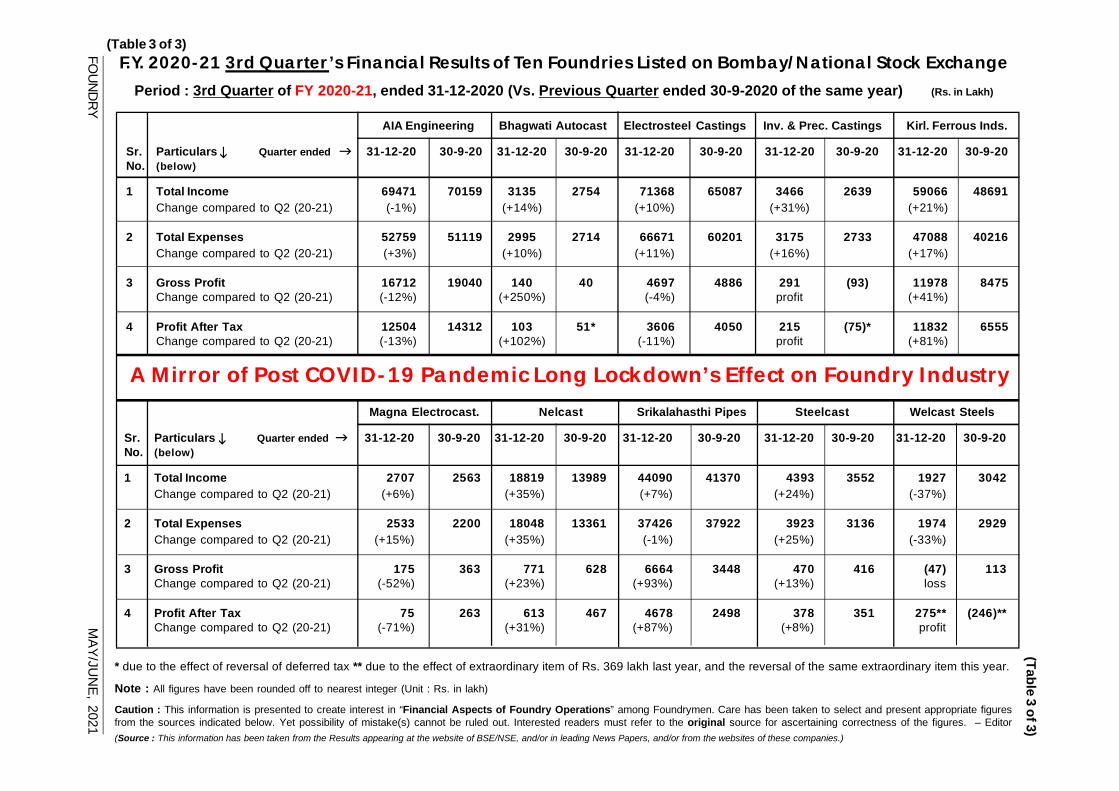
A Mirror of Post COVID-19 Pandemic Long Lockdown’s Effect on Foundry Industry
F.Y. 2020-21 3rd Quarter’s Financial Results of Ten Foundries Listed on Bombay/National Stock Exchange
Period : 3rd Quarter of FY 2020-21, ended 31-12-2020 (Vs. 3rd Quarter of FY 2019-2020, ended 31-12-2019) (Rs. in Lakh)
AIA Engineering Bhagwati Autocast Electrosteel Castings Inv. & Prec. Castings Kirl. Ferrous Inds.
Sr. Particulars Quarter ended 31-12-20 31-12-19 31-12-20 31-12-19 31-12-20 31-12-19 31-12-20 31-12-19 31-12-20 31-12-19No. (below)
1 Total Income 69471 68855 3135 2390 71368 65204 3466 2315 59066 45571Change compared to Q3 (19-20) (+1%) (+31%) (+9%) (+50%) (+30%)
2 Total Expenses 52759 51802 2995 2394 66671 60044 3175 2344 47088 42135Change compared to Q3 (19-20) (+2%) (+25%) (+11%) (+35%) (+12%)
3 Gross Profit 16712 17053 140 (4) 4697 5160 291 (30) 11978 3436Change compared to Q3 (19-20) (-2%) profit vs. loss loss (-9%) profit loss (+249%)
4 Profit After Tax 12504 13327 103 (1) 3606 4050 215 (19) 11832 2333Change compared to Q3 (19-20) (-6%) profit vs. loss loss (-11%) profit loss (+407%)
Magna Electrocast. Nelcast Srikalahasthi Pipes Steelcast Welcast Steels
Sr. Particulars Quarter ended 31-12-20 31-12-19 31-12-20 31-12-19 31-12-20 31-12-19 31-12-20 31-12-19 31-12-20 31-12-19No. (below)
1 Total Income 2707 2147 18819 12663 44090 46070 4393 4388 1927 4128Change compared to Q3 (19-20) (+26%) (+49%) (-4%) little change (-53%)
2 Total Expenses 2533 1999 18048 12271 37426 39557 3923 4011 1974 4154Change compared to Q3 (19-20) (+27%) (+47%) (-5%) (-2%) (-52%)
3 Gross Profit 175 148 771 392 6664 6513 470 377 (47) (26)Change compared to Q3 (19-20) (+18%) (+97%) (+2%) (+25%) higher loss
4 Profit After Tax 75** 148 613 270 4678 6766* 378 165 275** (15)Change compared to Q3 (19-20) (-49%) (+127%) (-31%) (+129%) profit
* effect of reversal of deferred tax ** due to the effect of exceptional or extraordinary item.
Note : All figures have been rounded off to nearest integer (Unit : Rs. in lakh)
Caution : This information is presented to create interest in “Financial Aspects of Foundry Operations” among Foundrymen. Care has been taken to select and present appropriate figuresfrom the sources indicated below. Yet possibility of mistake(s) cannot be ruled out. Interested readers must refer to the original source for ascertaining correctness of the figures. – Editor(Source : This information has been taken from the Results appearing at the website of BSE/NSE, and/or in leading News Papers, and/or from the websites of these companies.)
(Table 2 of 3)
(Table 2 of 3)
FOU
ND
RY
MA
Y/JU
NE
, 2021
A Mirror of Post COVID-19 Pandemic Long Lockdown’s Effect on Foundry Industry
F.Y. 2020-21 3rd Quarter’s Financial Results of Ten Foundries Listed on Bombay/National Stock Exchange
Period : 3rd Quarter of FY 2020-21, ended 31-12-2020 (Vs. Previous Quarter ended 30-9-2020 of the same year) (Rs. in Lakh)
AIA Engineering Bhagwati Autocast Electrosteel Castings Inv. & Prec. Castings Kirl. Ferrous Inds.
Sr. Particulars Quarter ended 31-12-20 30-9-20 31-12-20 30-9-20 31-12-20 30-9-20 31-12-20 30-9-20 31-12-20 30-9-20No. (below)
1 Total Income 69471 70159 3135 2754 71368 65087 3466 2639 59066 48691Change compared to Q2 (20-21) (-1%) (+14%) (+10%) (+31%) (+21%)
2 Total Expenses 52759 51119 2995 2714 66671 60201 3175 2733 47088 40216Change compared to Q2 (20-21) (+3%) (+10%) (+11%) (+16%) (+17%)
3 Gross Profit 16712 19040 140 40 4697 4886 291 (93) 11978 8475Change compared to Q2 (20-21) (-12%) (+250%) (-4%) profit (+41%)
4 Profit After Tax 12504 14312 103 51* 3606 4050 215 (75)* 11832 6555Change compared to Q2 (20-21) (-13%) (+102%) (-11%) profit (+81%)
Magna Electrocast. Nelcast Srikalahasthi Pipes Steelcast Welcast Steels
Sr. Particulars Quarter ended 31-12-20 30-9-20 31-12-20 30-9-20 31-12-20 30-9-20 31-12-20 30-9-20 31-12-20 30-9-20No. (below)
1 Total Income 2707 2563 18819 13989 44090 41370 4393 3552 1927 3042Change compared to Q2 (20-21) (+6%) (+35%) (+7%) (+24%) (-37%)
2 Total Expenses 2533 2200 18048 13361 37426 37922 3923 3136 1974 2929Change compared to Q2 (20-21) (+15%) (+35%) (-1%) (+25%) (-33%)
3 Gross Profit 175 363 771 628 6664 3448 470 416 (47) 113Change compared to Q2 (20-21) (-52%) (+23%) (+93%) (+13%) loss
4 Profit After Tax 75 263 613 467 4678 2498 378 351 275** (246)**Change compared to Q2 (20-21) (-71%) (+31%) (+87%) (+8%) profit
* due to the effect of reversal of deferred tax ** due to the effect of extraordinary item of Rs. 369 lakh last year, and the reversal of the same extraordinary item this year.
Note : All figures have been rounded off to nearest integer (Unit : Rs. in lakh)
Caution : This information is presented to create interest in “Financial Aspects of Foundry Operations” among Foundrymen. Care has been taken to select and present appropriate figuresfrom the sources indicated below. Yet possibility of mistake(s) cannot be ruled out. Interested readers must refer to the original source for ascertaining correctness of the figures. – Editor(Source : This information has been taken from the Results appearing at the website of BSE/NSE, and/or in leading News Papers, and/or from the websites of these companies.)
FOU
ND
RY
MA
Y/JU
NE
, 2021
(Table 3 of 3)
(Table 3 of 3)
Related Documents