Medical Imaging and Diagnostic Radiology Received 14 October 2013; revised 6 February 2014; accepted 3 March 2014. Date of publication 3 April 2014; date of current version 2 April 2014. Digital Object Identifier 10.1109/JTEHM.2014.2312191 A Method to Standardize Quantification of Left Atrial Scar From Delayed-Enhancement MR Images RASHED KARIM 1 , ARUNA ARUJUNA 1 , RICHARD JAMES HOUSDEN 1 , JASPAL GILL 1 , HANNAH CLIFFE 1 , KAVIR MATHARU 1 , JASWINDER GILL 2 , CHRISTOPHER ALDO RINDALDI 2 , MARK O’NEILL 2 , DANIEL RUECKERT 3 , REZA RAZAVI 1 , TOBIAS SCHAEFFTER 1 , AND KAWAL RHODE 1 1 Division of Imaging Sciences and Biomedical Engineering. King’s College London, London SE1 7EH, U.K. 2 Department of Cardiology, Guy’s and St. Thomas’ Hospital, King’s College London, London SE1 7EH, U.K. 3 Department of Computing, Imperial College London, London SW7 2BZ, U.K. CORRESPONDING AUTHOR: R. KARIM ([email protected]) This work was supported in part by the Kings College London Centre, Excellence in Medical Engineering through the Welcome Trust and EPSRC under Grant WT088641/Z/09/Z, and in part by the National Institute for Health Research, Biomedical Research Centre Award to Guy’s and St Thomas’ NHS Foundation Trust and King’s College London. ABSTRACT Delayed-enhancement magnetic resonance imaging (DE-MRI) is an effective technique for detecting left atrial (LA) fibrosis both pre and postradiofrequency ablation for the treatment of atrial fibrillation. Fixed thresholding models are frequently utilized clinically to segment and quantify scar in DE-MRI due to their simplicity. These methods fail to provide a standardized quantification due to inter- observer variability. Quantification of scar can be used as an endpoint in clinical studies and therefore standardization is important. In this paper, we propose a segmentation algorithm for LA fibrosis quantification and investigate its performance. The algorithm was validated using numerical phantoms and 15 clinical data sets from patients undergoing LA ablation. We demonstrate that the approach produces good concordance with expert manual delineations. The method offers a standardized quantification technique for evaluation and interpretation of DE-MRI scans. INDEX TERMS Delayed-enhancement MRI, left atrium, image segmentation, fibrosis. I. INTRODUCTION Atrial fibrillation (AF) affects approximately 2.3 million peo- ple in the USA with significant comorbidity and mortality [1], [2]. It is a condition that increases the risk of stroke by a factor of six-fold and doubles the mortality rate of patients when compared to age-matched controls. Since it was shown that ectopic beats from the pulmonary veins (PV) give rise to AF [3] the treatment of AF using radiofrequency catheter ablation (RFCA) has become an important and common pro- cedure. In this procedure, ablation lesions are created in a circular fashion around the PV ostia to electrically isolate the PVs, and thus the ectopic focal points, from the rest of the left atrium (LA). This treatment can provide a cure for the majority of patients and prevent the requirement for long-term pharmacotherapy. However, for a high proportion of patients (15%–46%) [4]–[6], there is recurrence of AF. This normally requires a second or third re-do ablation procedure and thus has a high burden on health care. It is important to select patients who will respond better to RFCA to reduce recurrence rates. Several studies have shown that it is possible to predict the outcome of RFCA procedures from the fibrosis extent in LA [7]–[10]. A scoring system based on the degree of fibrosis has been developed, leading to treatment stratification [8]. Other recent studies have also highlighted the significance of the extent of fibrosis or scar in LA post-ablation for predicting outcome [11], evaluate effectiveness of ablation technologies [12] and helping to gain a better understanding of the left atrial substrate [13]. In this context, magnetic resonance imaging (MRI) has been shown to be effective for non-invasive imaging of the LA. In particular, Gadolinium delayed-enhancement (DE) MRI has the ability to detect changes that take place in the LA VOLUME 2, 2014 2168-2372 2014 IEEE. Translations and content mining are permitted for academic research only. Personal use is also permitted, but republication/redistribution requires IEEE permission. See http://www.ieee.org/publications_standards/publications/rights/index.html for more information. 1800615

Welcome message from author
This document is posted to help you gain knowledge. Please leave a comment to let me know what you think about it! Share it to your friends and learn new things together.
Transcript

Medical Imaging and Diagnostic Radiology
Received 14 October 2013; revised 6 February 2014; accepted 3 March 2014. Date of publication 3 April 2014;date of current version 2 April 2014.
Digital Object Identifier 10.1109/JTEHM.2014.2312191
A Method to Standardize Quantification of LeftAtrial Scar From Delayed-Enhancement
MR ImagesRASHED KARIM1, ARUNA ARUJUNA1, RICHARD JAMES HOUSDEN1, JASPAL GILL1,
HANNAH CLIFFE1, KAVIR MATHARU1, JASWINDER GILL2, CHRISTOPHER ALDO RINDALDI2,MARK O’NEILL2, DANIEL RUECKERT3, REZA RAZAVI1, TOBIAS SCHAEFFTER1,
AND KAWAL RHODE11Division of Imaging Sciences and Biomedical Engineering. King’s College London, London SE1 7EH, U.K.2Department of Cardiology, Guy’s and St. Thomas’ Hospital, King’s College London, London SE1 7EH, U.K.
3Department of Computing, Imperial College London, London SW7 2BZ, U.K.
CORRESPONDING AUTHOR: R. KARIM ([email protected])
This work was supported in part by the Kings College London Centre, Excellence in Medical Engineering through the Welcome Trust andEPSRC under Grant WT088641/Z/09/Z, and in part by the National Institute for Health Research, Biomedical Research Centre Award to
Guy’s and St Thomas’ NHS Foundation Trust and King’s College London.
ABSTRACT Delayed-enhancement magnetic resonance imaging (DE-MRI) is an effective technique fordetecting left atrial (LA) fibrosis both pre and postradiofrequency ablation for the treatment of atrialfibrillation. Fixed thresholding models are frequently utilized clinically to segment and quantify scar inDE-MRI due to their simplicity. These methods fail to provide a standardized quantification due to inter-observer variability. Quantification of scar can be used as an endpoint in clinical studies and thereforestandardization is important. In this paper, we propose a segmentation algorithm for LAfibrosis quantificationand investigate its performance. The algorithm was validated using numerical phantoms and 15 clinical datasets from patients undergoing LA ablation. We demonstrate that the approach produces good concordancewith expert manual delineations. The method offers a standardized quantification technique for evaluationand interpretation of DE-MRI scans.
INDEX TERMS Delayed-enhancement MRI, left atrium, image segmentation, fibrosis.
I. INTRODUCTIONAtrial fibrillation (AF) affects approximately 2.3 million peo-ple in the USA with significant comorbidity and mortality[1], [2]. It is a condition that increases the risk of stroke bya factor of six-fold and doubles the mortality rate of patientswhen compared to age-matched controls. Since it was shownthat ectopic beats from the pulmonary veins (PV) give riseto AF [3] the treatment of AF using radiofrequency catheterablation (RFCA) has become an important and common pro-cedure. In this procedure, ablation lesions are created in acircular fashion around the PV ostia to electrically isolate thePVs, and thus the ectopic focal points, from the rest of theleft atrium (LA). This treatment can provide a cure for themajority of patients and prevent the requirement for long-termpharmacotherapy. However, for a high proportion of patients(15%–46%) [4]–[6], there is recurrence of AF. This normally
requires a second or third re-do ablation procedure and thushas a high burden on health care.It is important to select patients who will respond better to
RFCA to reduce recurrence rates. Several studies have shownthat it is possible to predict the outcome of RFCA proceduresfrom the fibrosis extent in LA [7]–[10]. A scoring systembased on the degree of fibrosis has been developed, leadingto treatment stratification [8]. Other recent studies have alsohighlighted the significance of the extent of fibrosis or scarin LA post-ablation for predicting outcome [11], evaluateeffectiveness of ablation technologies [12] and helping togain a better understanding of the left atrial substrate [13].In this context, magnetic resonance imaging (MRI) has beenshown to be effective for non-invasive imaging of the LA.In particular, Gadolinium delayed-enhancement (DE) MRIhas the ability to detect changes that take place in the LA
VOLUME 2, 2014
2168-2372 2014 IEEE. Translations and content mining are permitted for academic research only.Personal use is also permitted, but republication/redistribution requires IEEE permission.
See http://www.ieee.org/publications_standards/publications/rights/index.html for more information. 1800615
Karim et al.: Method to Standardize Quantification of Left Atrial Scar
both pre- and post-ablation and recent studies have shownthat it could potentially be useful for selecting suitable candi-dates for RFCA [8]. DE-MRI is acquired with an inversion-recovery gradient echo sequence performed after administra-tion of Gadolinium yielding an image at an inversion timewhich is chosen to null the signal from healthy myocardium.Due to the differential washout kinetics of Gadolinium,scar or fibrotic areas are differentiated from heatlhy tissue.Fibrotic or scar tissues in the myocardium appear with asignal intensity (SI) above normal myocardium. Fig. 1 showssome examples of DE-MRI with intensities significantlyhigher than myocardium.
FIGURE 1. DE-MRI images from three separate patients taken 3 monthspost-ablation. Arrows indicate areas of enhancement. Abbreviations:AO - aorta, LA - left atrium.
Quantification of scar or fibrosis from DE-MRI is chal-lenging due to various reasons [14]. The thin myocardium ofthe LA wall leads to low singal-to-noise ratio. Contrast varia-tion in these images can be an issue due to choice of inversiontime. Also the complex geometry of the LA results in sometransverse slices where a very small section of the anatomyis visible, making manual quantification in these areas highlyobserver-dependent. Finally, patients suffering fromAF oftenhave an irregular heart rate and breathing making it hard toacquire good quality respiratory- and cardiac-gated images.Quantification from such images become difficult to auto-mate and manual quantification tends to be highly observer-dependent.
In this work, a scar quantification approach is proposedand investigated. The method exploits a well-known imagesegmentation approach known as graph-cuts [15]. Segmenta-tion is achieved using a combination of scar intensity modelpriors and Gaussian-fitting to tissues in the unseen image tobe segmented. The final labelling is achieved by optimizing acost function using graph-cuts.
A. PREVIOUS WORKSQuantification and segmentation of ventricular scar fromDE-MRI images have been studied in several investigations.Refer to Table 1 for a brief summary. A common methodfor detecting scar or fibrosis is to use a fixed model ofthresholding between two and six standard deviations (SD)above the mean intensity of healthy myocardium [16]–[19].This requires the user to manually outline remote or healthymyocardium. Another common method is the Full-Width-At-Half-Maximum (FWHM) which sets scar to be intensi-ties greater than 50% of manually outlined hyper-enhancedmyocardium [19]. Other approaches exist to compute the
threshold automatically [17] or by applying clustering[20], [21], or with graph-cuts [22].The aforementioned works were primarily developed for
the left ventricle. For the LA,methods have been proposed forendocardial surface-based segmentation [23] and threshold-based volumetric segmentation [7], [14], [24]. In [23], themaximum intensity projection (MIP) of theDE-MRI SI on thesegmented LA shell is used to visualise enhancing intensitieson the surface. This technique has an important drawback: itis only a visualisation of intensities and thus not a segmen-tation technique with no volumetric segmentation as output.In [7], a volumetric segmentation of pre-ablation LA fibrosisis proposed by obtaining suitable measurements from theintensity histogramwithin atrial wall. This has a disadvantagethat the LA wall is thin and thus its manual segmentationcan have significant inter-observer variation. Other methodshave employed fixedmodels for pre-ablation fibrosis [24] andpost-ablation scar [25] with variable thresholding.In summary, a fixed thresholding model cannot handle all
the different variabilities encountered in LA DE-MRI andthese are both from the varied internal factors (size, distri-bution and heterogeneity of scar) and varied external factors(resolution, image noise, inversion time, surface coil inten-sity variation). The inversion time choice can generate theappearance of more or less scar, and change the appropriatescar threshold. Motion blurring also reduces the appearanceof scar.
B. CONTRIBUTIONSIn this work, we present a method for segmenting and thusquantifying LA fibrosis in DE-MRI. It is based on a prob-abilistic tissue intensity model of DE-MRI data, which isderived from both training and the unseen data. It offerstwo advantages: 1) It does not require manual outlining ofbase-line healthy myocardium, and 2) It provides greateraccuracy than fixed models with no inter-observer variation.The algorithm was evaluated and compared with existingclinically-used methods using local pixel overlap measures.Performance was analyzed by exploring various scar contrastlevels.An abbreviated version of this work was published in
[31] and [32]. In this current version, we present the approachwith more details including additional experiments and val-idation. We also include an automated adaptive step thatallows for variation in the scar signal level and avoids sub-optimal scar intensity models. Furthermore, we present amuch more comprehensive validation of the algorithm on alarger clinical cohort. The algorithm was also used recentlyin a segmentation challenge [33], segmenting sixty DE-MRIdatasets from three imaging centres.
II. CLINICAL AND IMAGING PROTOCOLSA. PATIENTS15 patients were followed up at 6 months following their firstablation for the treatment of paroxysmal AF. The procedures
1800615 VOLUME 2, 2014

Karim et al.: Method to Standardize Quantification of Left Atrial Scar
TABLE 1. Overview of previously published methods for scar detection, quantification and segmentation.
were carried out in the cardiac catheterization laboratory atSt. Thomas Hospital, London, U.K. All patients gave writ-ten permission to take part in this local ethics committeeapproved study.
B. ABLATION PROCEDUREA catheter was placed in the coronary sinus to provide areference for electroanatomic mapping and to enable LApacing. Two trans-septal punctures were made to access theLA using standard long sheaths (St. Jude Medical,MN, USA). A three-dimensional (3D) LA geometry was cre-ated using either Ensite NavX (St. Jude Medical, MN, USA)or CARTO (Biosense Webster, Diamond Bar, CA, USA).A circular mapping catheter was then placed in each PV inturn while the corresponding LA-PV ostium was targetedwithwide area circumferential ablation. Energywas deliveredthrough a 3.5 mm irrigated tip catheter with flow limited to17 ml/min, power limited to 30 W on the anterior wall and20 W on the posterior wall and temperature limited to 50◦C.Ablation lesions weremarked on the LA geometrywhen therehad been an 80% reduction in the local electrogram voltageor after 30 seconds of energy delivery. The clinical endpointwas electrical isolation of all PVs.
C. MRI SCANNING PROCEDUREMRI scanning was performed before and after the ablationprocedure. Pre-ablation scanning was performed 24 hoursprior to the procedure and post-ablation scanning was per-formed 6months after the procedure. The proposed algorithmin this work was developed and evaluated primarily for post-ablation images.
All scanning was performed on a 1.5T Achieva scan-ner (Philips Healthcare, The Netherlands). The examina-tion began with a survey and reference scans, and an
interactive scan to determine the four-chamber orientation ofthe heart. For anatomical information, a 3D magnetic reso-nance angiography (MRA) scan with whole-heart coverage(1×1×2mm3 acquired, 1×1×1mm3 reconstructed, 20 secsduration) was acquired following the injection of 0.4 ml/kgdouble dose of a gadolinium-diethylenetriaminepentaacetate(Gd-DTPA) contrast agent. This scan was not cardiac-gated.This scan was followed by a 3D respiratory navigatedand cardiac-gated, 3D balanced steady-state free precession(b-SSFP) acquisition in a sagittal orientation with whole-heart coverage (1.3 × 1.3 × 2.6mm3 acquired, 1.3 ×1.3 × 1.3mm3 reconstructed, 6 mins duration). The scan forthe visualization of delayed-enhancement was a 3D ECG-triggered, free breathing inversion recovery (IR) turbo fieldecho (TFE) with respiratory-navigated and cardiac-gatedwith whole heart coverage (0.6 × 0.6 × 4mm3 acquired,0.6×0.6× 2mm3 reconstructed, 3 mins duration). Data wereacquired within a window of 150 ms every one RR interval,with a low-high k-space ordering and spatial pre-saturationwith inversion recovery (SPIR) fat suppression. The IR timedelay was determined from the Look-Locker sequence, andwas set at an inversion time (TI) intermediate between theoptimal TIs to null myocardium and blood. This scan was per-formed approximately 20 mins after contrast administration.The slices were set for complete coverage of both left andright atria. Slice orientation was in the four-chamber view forAF ablation to optimize visualization of the pulmonary veins.Note that the scan times quoted above are actual scan times.Typical respiratory gating efficiency is 50% but this variesconsiderably in this particular patient population.
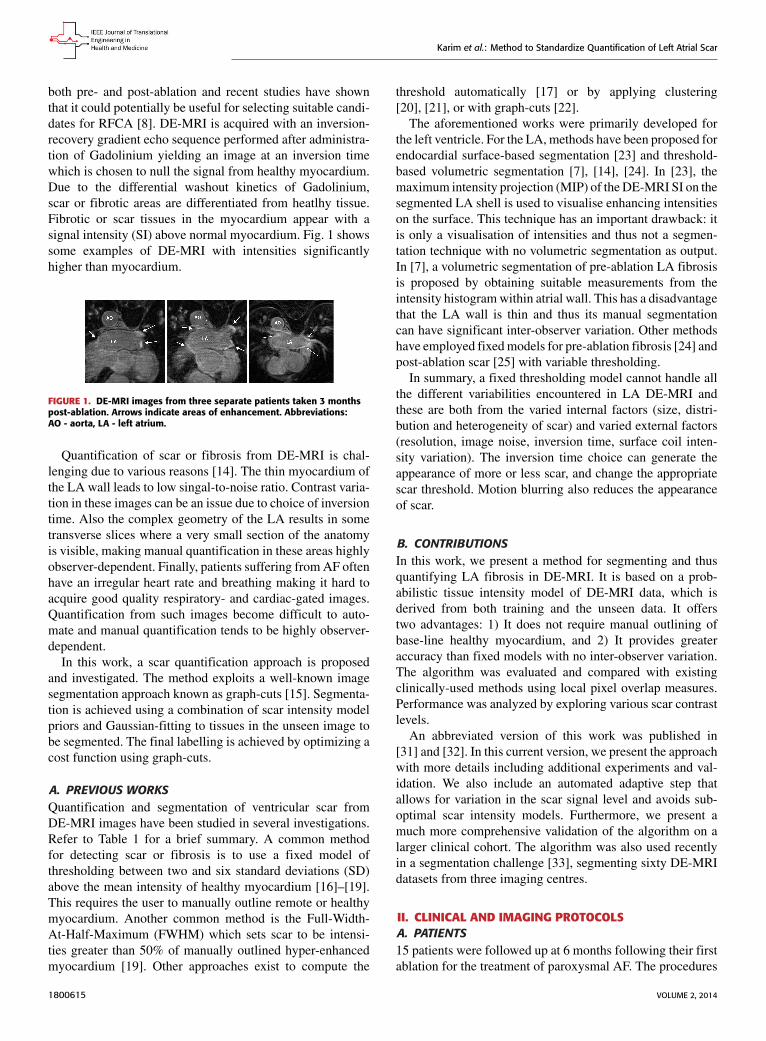
D. SEGMENTATION ALGORITHMFig. 2 shows an overview of the algorithm. The inputs werea DE-MRI image and a segmentation of the LA from an
VOLUME 2, 2014 1800615
Karim et al.: Method to Standardize Quantification of Left Atrial Scar
FIGURE 2. An overview of the steps involved in the segmentation process.The pipeline takes as input MRI images and outputs binarysegmentations (rounded boxes). The processing pipeline is illustratedhere with each separate stage in the algorithm. Smaller boxes representsub-stages. The scar segmentation stage is iterative as indicated by thebi-directional arrows.
anatomical scan. The LA segmentation was obtained fromthe b-SSFP whole-heart scan by an automatic approach basedon a statistical shape model [34], and was followed wherenecessary by manual correction by a human rater (throughoutthis paper, the terms human rater or observer refer to someonewho has experience viewing tomographic images and cancorrectly identify the LA endocardium and fibrosis in theLA myocardium). The b-SSFP image was chosen over MRAas it was acquired at the same phase in the cardiac cycle asthe DE-MRI. The MRA, though it provides better anatomicalvisualization, was not cardiac gated and it can be difficult toresolve the differences between this and the DE-MRI withregistration. The anatomical images were registered to theDE images using the DICOM header data, and then refinedby rigid and affine registration steps [35]. Affine registrationwas necessary to account for the differing PV angles inthe scans. This defined the endocardial LA boundary in theDE images.
E. SCAR SEGMENTATIONSegmentation of scars from DE-MRI images can be definedas assigning a label fp ∈ {non-scar, scar} for every voxel p inthe search space of the image. The search space is defined as aregion±3 mm from the endocardial border obtained from theatrial geometry extraction. This is within the limits of atrialwall [23]. Given the observed intensities in the atrial walland prior knowledge of scars, the segmentation problem issolved using a probabilistic framework where the maximuma posteriori (MAP) estimate is computed using Bayes’theorem:
argmaxfp(f|I) =
p(I|f)p(f)p(I)
(1)
where f is the total label configuration and I are all observedintensities in the image. The image likelihood p(I|f) describeshow likely is the observed image given a label configuration f.The prior p(f) encodes any prior knowledge of the healthy andscar tissue classes.
The MAP estimate allows to determine the most likelylabel configuration f of the observed image I. Tomake numer-ical computation more convenient, the MAP formulationis transformed to one involving only summations. This is
possible by taking the negative logarithm of Eq. 1:
f = argminf{− ln p(I|f)− ln p(f)} (2)
where f is the optimal labelling. The prior probability p(I)can be ignored as it is independent from the labelling f. Notethat the segmentation problem is now an energy minimizationproblem, following from (2):
f = argminf{λEdata(f)+ Eprior(f)} (3)
where λ weights the influence of the two terms. The intensityenergy Edata measures the disagreement between a proba-bilistic tissue model and the observed data, and Eprior isa smoothness term penalizing any discontinuities within atissue class. In the following sections, the intensity modelsthat contribute towards Edata and Eprior are described in thefollowing sections.
F. INTENSITY MODELSThe likelihood p(I|f) of the observed intensities in the imagecan be estimated. Assuming that the voxel intensities areindependent, the total likelihood for the image is given as:
p(I|f) =∏p∈I
p(Ip|fp) (4)
The negative logarithm or the log-likelihood gives the totalintensity energy contributed by each voxel:
Edata = −∑p∈I
ln p(Ip|fp) (5)
We first consider the intensity energy contribution from thescar tissue class, i.e. for the function p(I|fp = 1) and then forthe non-scar class.
1) INTENSITY MODEL FOR SCAR TISSUEEnhancements in DE-MRI can vary greatly depending on anumber of reasons: choice of inversion time, scanner vendor,protocol, operator experience, motion-blurring and patientbreathing. Modelling variation in enhancement is thus impor-tant. When examining atrial DE-MRI images, the contrast-to-noise ratio (CNR) of scar to left atrial blood pool is oftencompared. This is simply due to the fact that normal atrialmyocardium is not sufficiently visible to the naked eye inDE-MRI. Atrial blood pool is the single largest neighbouringtissue block sufficiently visible to the naked eye in the axialview. In this work, to exploit the nature of scar-blood CNRin DE-MRI, the scar to blood pool (SC-BP) intensity ratio ismodelled and in the rest of paper we refer to normalizationof DE-MRI intensities in this context as taking the ratio ofDE-MRI voxel’s intensity to blood pool.To model enhancement, human raters delineated scar in
training images. The blood pool was also delineated. The scarto blood pool ratio was determined for every voxel labelled asscar. This ratio could be modelled suitably with a Gaussian
1800615 VOLUME 2, 2014
Karim et al.: Method to Standardize Quantification of Left Atrial Scar
distribution:
p(I|fp = 1) =1
√2πσ 2
exp[−
12
(r − µσ
)2](6)
Here r is normalized intensity of labelled scar. Re-trainingthis model allows it to adapt to images from a different sourcewhich may exhibit different scar-blood CNR levels due to itsinversion times.
2) INTENSITY MODEL FOR NON-SCAR TISSUEThis is based on some prior knowledge about different tissueclasses that could possibly interface with scar. As scar tis-sue normally borders with blood pool, normal myocardiumand pericardial regions, a multi-modal mixture distribution isused:
n∑i=1
aiGi(µi, σi) (7)
where Gi is a Gaussian distribution for non-scar tissue iwith mean µi and variance σi for some mixture proportionai ∈ [0, 1].The model parameters were obtained from the image to be
segmented (i.e. unseen image). However, as scar tissue is alsopart of myocardium, the mixture most likely to correspondto scar was identified and eliminated. This was the mixturewith the highest mean. Following the elimination of themixture Gt , the weights of the remaining Gaussians of themixture model were normalized to sum to one. The non-scartissue model is given by:
p(I|fp = 0) =n−{t}∑i=1
aiGi(µi, σi) (8)
where t is the eliminated distribution. The parameters of theGaussian mixture model (ai, µi, σi) were obtained using theExpectation-Maximization (EM)-algorithm [36]. The num-ber of tissue classes used was 4 pertaining to: blood pool,myocardium, scar and pericardial region. Starting with aninitial estimate of the mean and variance for the four classes,the EM-algorithm iteratively computed the multimodal dis-tribution parameters until convergence. This was followed bya truncation of the distribution pertaining to scar.
In summary, the algorithm extracted and incorporatedknowledge both from the training dataset and the unseenimage. The SC-BP contrast ratio was modelled from thetraining and intensity distributions of non-scar tissue weremodelled from the unseen. This made the algorithm betterequipped to handle contrast variations commonly encoun-tered in DE-MRI.
G. SMOOTHNESS CONSTRAINTTo ensure smoothness and avoid discontinuities in the finalsegmentation, the Eprior term of the MRF energy function inEq. 3 penalised for assigning different labels to neighbouringvoxels sharing similar intensity levels. The Lorentzian error
norm was employed, which is a robust metric for measuringintensity differences within a neighbourhood:
ϕ(p, q) = 1+12
(|Ip − Iq|σ
)2
(9)
The scale σ can be estimated from the DE-MRI image anddepends on the variance of the actual scar and non-scartissue class intensity distributions. With decreasing scale,the algorithm becomes less forgiving to small differences inintensities. Given that it is technically challenging to acquirehigh quality DE-MRI scans that show a clear distinctionbetween scar and non-scar tissue, a larger value for the scaleσ is almost always preferred. For convenience, to boundEpriorabove and below by [0,1] it is re-adjusted by 1/(1+ ϕ(p, q)).This allows, if necessary, some adaptation of the trainingmodel to the unseen image.
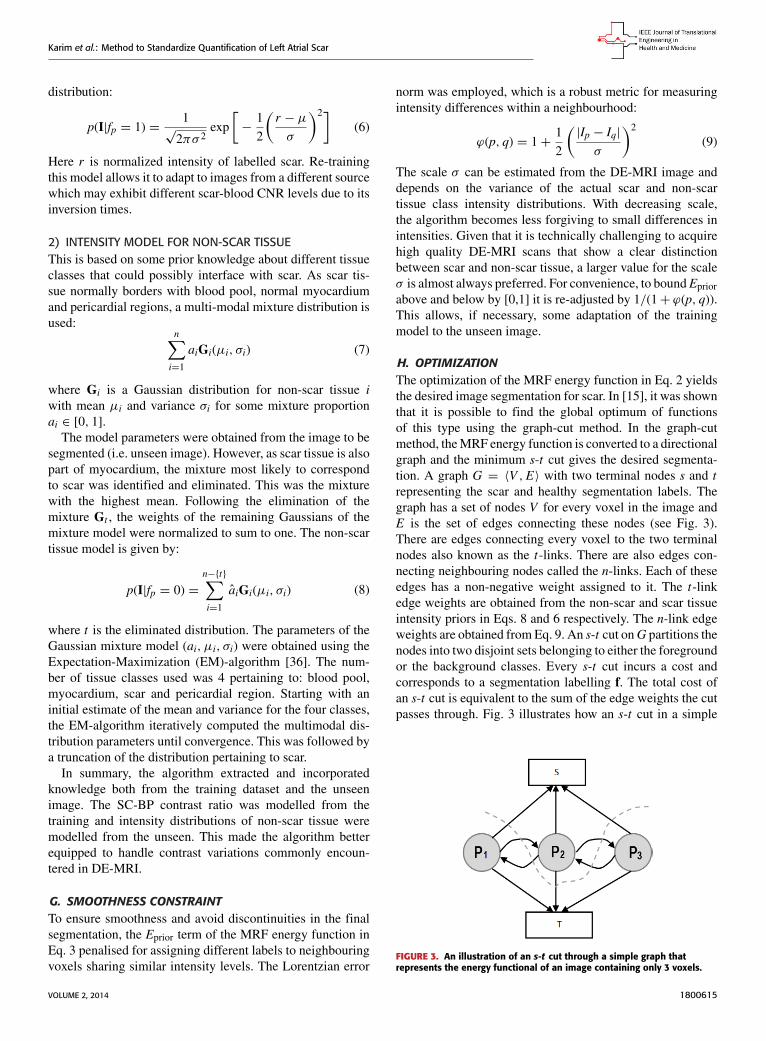
H. OPTIMIZATIONThe optimization of the MRF energy function in Eq. 2 yieldsthe desired image segmentation for scar. In [15], it was shownthat it is possible to find the global optimum of functionsof this type using the graph-cut method. In the graph-cutmethod, theMRF energy function is converted to a directionalgraph and the minimum s-t cut gives the desired segmenta-tion. A graph G = 〈V ,E〉 with two terminal nodes s and trepresenting the scar and healthy segmentation labels. Thegraph has a set of nodes V for every voxel in the image andE is the set of edges connecting these nodes (see Fig. 3).There are edges connecting every voxel to the two terminalnodes also known as the t-links. There are also edges con-necting neighbouring nodes called the n-links. Each of theseedges has a non-negative weight assigned to it. The t-linkedge weights are obtained from the non-scar and scar tissueintensity priors in Eqs. 8 and 6 respectively. The n-link edgeweights are obtained from Eq. 9. An s-t cut onG partitions thenodes into two disjoint sets belonging to either the foregroundor the background classes. Every s-t cut incurs a cost andcorresponds to a segmentation labelling f. The total cost ofan s-t cut is equivalent to the sum of the edge weights the cutpasses through. Fig. 3 illustrates how an s-t cut in a simple
FIGURE 3. An illustration of an s-t cut through a simple graph thatrepresents the energy functional of an image containing only 3 voxels.
VOLUME 2, 2014 1800615
Karim et al.: Method to Standardize Quantification of Left Atrial Scar
graph of an image with only 3 voxels computes a possiblesegmentation. Note how the t-links are assigned a value basedon the affinity of the node to the particular class label. In asimilar way, the n-links represent affinity for neighbouringvoxels, holding nodes with similar intensities together andresisting to a cut passing through them resulting in a labellingof neighbouring voxels into two separate tissue classes.
1) ADAPTIVE FEEDBACKThe algorithm iteratively improved the segmentation resultby incorporating new intensity information about scar. Thisstep is shown in Fig. 2 as ’Adapting training model’. Startingfrom the initial training model for scar (see section II-F.1),this prior model may be sub-optimal since scar-blood CNRtypically varies between DE-MRI images. It was iterativelyadapted by incorporating the mean and SD of intensities inthe segmentation:
µk+1 = µk + ω · µk ; σk+1 = σk + ω · σk (10)
where k is the k-th iteration of adapting the scar trainingmodel with present parameters (µk , σk ) and those obtainedfrom the new segmentation (µk , σk ); ω is the learningrate and empirically set to 0.2. The iterative process wasstopped when the difference in consecutive means was small:1k = (µk+1 − µk )/µk .
III. EXPERIMENTSThe algorithm was evaluated on both numerical phantom andreal patient MRI datasets as described below.
A. NUMERICAL PHANTOM DATAIn the rest of the paper, the true location of scar is referredto as the ground-truth for scar. The extent of scarring duringablation is non-deterministic and there is also confoundingpre-ablation fibrosis. Therefore, identifying locations whereablations were made is not sufficient to be a surrogate forthe ground truth for scar. Moreover, there is a high degree ofinter- and intra-observer variability in manual segmentationsof scar. These make evaluating algorithms more difficult andchallenging. To overcome these issues, numerical phantomswere employed to extensively validate the algorithm.
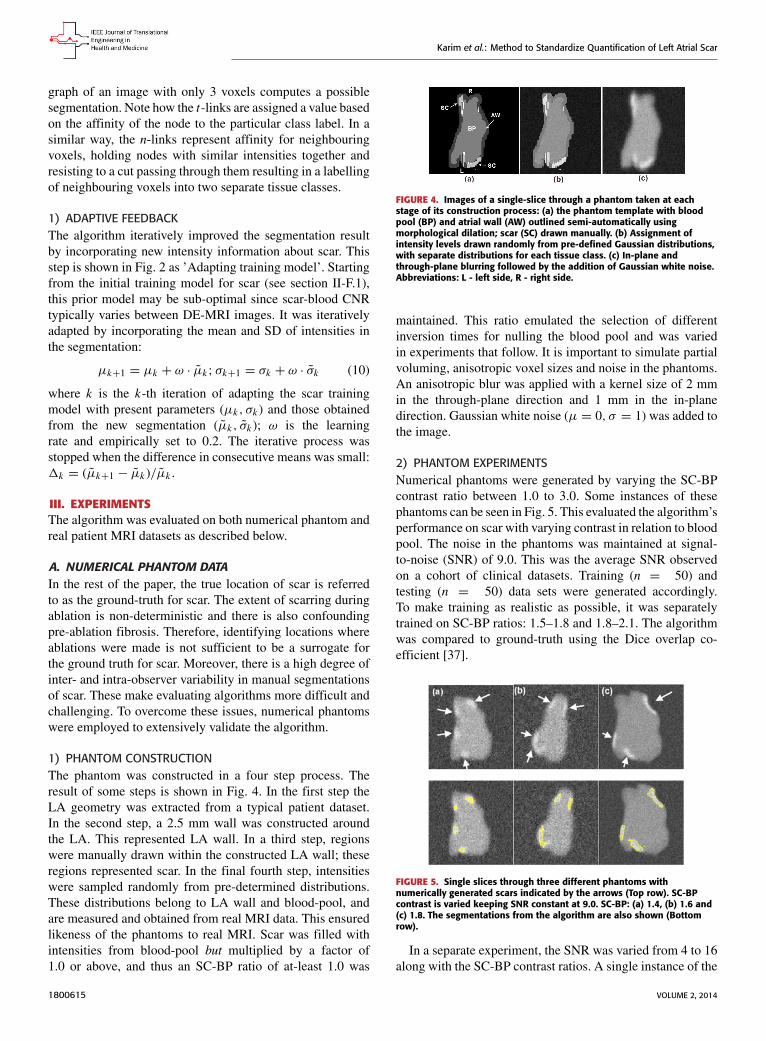
1) PHANTOM CONSTRUCTIONThe phantom was constructed in a four step process. Theresult of some steps is shown in Fig. 4. In the first step theLA geometry was extracted from a typical patient dataset.In the second step, a 2.5 mm wall was constructed aroundthe LA. This represented LA wall. In a third step, regionswere manually drawn within the constructed LA wall; theseregions represented scar. In the final fourth step, intensitieswere sampled randomly from pre-determined distributions.These distributions belong to LA wall and blood-pool, andare measured and obtained from real MRI data. This ensuredlikeness of the phantoms to real MRI. Scar was filled withintensities from blood-pool but multiplied by a factor of1.0 or above, and thus an SC-BP ratio of at-least 1.0 was
FIGURE 4. Images of a single-slice through a phantom taken at eachstage of its construction process: (a) the phantom template with bloodpool (BP) and atrial wall (AW) outlined semi-automatically usingmorphological dilation; scar (SC) drawn manually. (b) Assignment ofintensity levels drawn randomly from pre-defined Gaussian distributions,with separate distributions for each tissue class. (c) In-plane andthrough-plane blurring followed by the addition of Gaussian white noise.Abbreviations: L - left side, R - right side.
maintained. This ratio emulated the selection of differentinversion times for nulling the blood pool and was variedin experiments that follow. It is important to simulate partialvoluming, anisotropic voxel sizes and noise in the phantoms.An anisotropic blur was applied with a kernel size of 2 mmin the through-plane direction and 1 mm in the in-planedirection. Gaussian white noise (µ = 0, σ = 1) was added tothe image.
2) PHANTOM EXPERIMENTSNumerical phantoms were generated by varying the SC-BPcontrast ratio between 1.0 to 3.0. Some instances of thesephantoms can be seen in Fig. 5. This evaluated the algorithm’sperformance on scar with varying contrast in relation to bloodpool. The noise in the phantoms was maintained at signal-to-noise (SNR) of 9.0. This was the average SNR observedon a cohort of clinical datasets. Training (n = 50) andtesting (n = 50) data sets were generated accordingly.To make training as realistic as possible, it was separatelytrained on SC-BP ratios: 1.5–1.8 and 1.8–2.1. The algorithmwas compared to ground-truth using the Dice overlap co-efficient [37].
FIGURE 5. Single slices through three different phantoms withnumerically generated scars indicated by the arrows (Top row). SC-BPcontrast is varied keeping SNR constant at 9.0. SC-BP: (a) 1.4, (b) 1.6 and(c) 1.8. The segmentations from the algorithm are also shown (Bottomrow).
In a separate experiment, the SNR was varied from 4 to 16along with the SC-BP contrast ratios. A single instance of the
1800615 VOLUME 2, 2014

Karim et al.: Method to Standardize Quantification of Left Atrial Scar
algorithm was tested and this was trained on the SC-BP range1.8–2.1. The Dice overlap of the segmentation with groundtruth was compared.
In addition to the above experiments on scar enhance-ment and noise variation, the performance of the algorithmand fixed models (FWHM and n-SD) were compared onthe same dataset. Five separate phantoms were used fromwhich 200 different scarred regions were identified and theirSC-BP contrast ratio noted. The accuracy with each methodsegmented each of the 200 regions was measured with Diceand reported.
3) CLINICAL DATAA total of 15 clinical human datasets were available. In theseset of experiments, segmentations from the algorithm werecompared to the combined manual segmentations of threeobservers. In addition to this, the algorithm was also com-pared to fixed models: FWHM and n-SD methods. Trainingfor the algorithm was accomplished using the leave-one-outprinciple, where 14/15 datasets were used for training and1/15 used for testing. In the test scan, segmentation perfor-mance was measured both locally and globally for the image.For local comparison, performance on individual sections ofscar was measured (a total of 155 regions were considered)and for a global comparison, total scar volume was measured.The pre-processing (left atrium geometry extraction and reg-istration) was the same for each approach.
Three experienced observers manually segmented scars ineach DE-MRI scan. They were combined to generate a con-sensus segmentation or pseudo-ground truth for each scan.This is necessary in order to consolidate inter-observer vari-abilities. Segmentations were combined using the STAPLEalgorithm described in [38]. For each voxel, a probabilityestimate for the scar label could be computed. The STAPLEground-truth was then be obtained by considering voxels tobe scar if their probability is greater than 0.7, or 70%. This isa reasonable threshold capable of generating a strong consen-sus segmentation (In [38] the authors chose a lower consensusat 50%). To explore this threshold further, an experimentwas performed by varying the threshold. Segmentations wereavailable from five experienced observers on a random sub-set of the clinical datasets. The segmentations were com-bined using STAPLE and three thresholds were considered:1) < 20%, 2) ≥ 20% and 3) ≥ 70%. This generateddifferent consensus segmentations with varying degrees ofconsensus against which the algorithm’s performance wasmeasured. Finally, to further explore whether better trainingof the algorithm leads to better segmentations and thus betterperformance, different instances of the algorithm are evalu-ated by incrementing the number of training set.
It is important to note that segmentations from the pro-posed algorithm were obtained without any user interac-tion necessary at any step of the algorithm. The most com-putationally demanding step was that of graph-cuts. Onimages of the resolution described above, there are typically50 000–100 000 nodes that require processing. However, each
step of the iterative process took less than a minute. The totalrunning time of the proposed approach is less than a minuteon a 2.5 GHz PC.
B. EVALUATION METRICSTo our experience, there is no single metric which works bestfor comparing segmentation overlaps. We chose two differentmetrics to quantify segmentation overlap.
1) REGIONAL OVERLAPThe Dice co-efficient of similarity is a well-knownmetric [37]. It is given by:
D =2|X ∩ Y ||X | + |Y |
× 100 (11)
whereX is the region in ground-truth and Y is the region in thealgorithm. |X ∩ Y | is total overlapping pixels and |X |, |Y | aretotal number of pixels in each region. A Dice of 100 denotesperfect overlap.
2) SENSITIVITY AND SPECIFICITYThe proportion of true positives and true negatives in thedetection process was analyzed by means of Receiver Oper-ating Characteristic (ROC) curves where possible.
3) TOTAL SCAR VOLUMESegmentations were also compared by measuring the totalscar volume. This is mostly how scar is quantified and inter-preted in clinical studies [39] and also serves as an importantindicator for the total scar burden on the atrium.
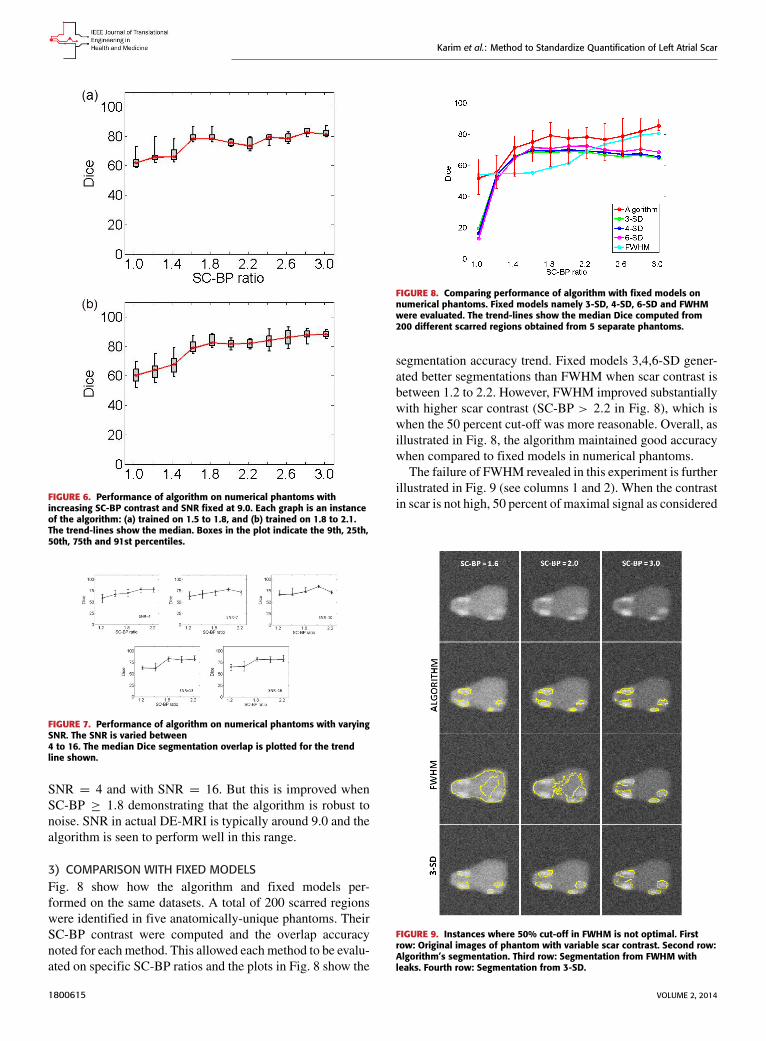
IV. RESULTSA. NUMERICAL PHANTOMS1) SCAR CONTRASTFig. 6 show results from testing the algorithm on phantomsgenerated by varying the SC-BP contrast. Segmentation over-lapwith known true location of scar wasmeasured usingDice.The algorithm performs well within its training range withmedian Dice ≥ 80 in both ranges: 1.5 ≤ SC-BP ≤ 1.8[Fig. 6(a)] and 1.8 ≤ SC-BP ≤ 2.2 [Fig. 6(b)]. Outside itstraining area, the algorithm showed that it is able to adaptto excellent SC-BP contrast (≥ 2.2) and good segmentationswere achieved. Values of SC-BP explored in this experimentincluded realistic DE-MRI values but SC-BP ≥ 3.0 is verydifficult to achieve in practice. To summarise, this experimentevaluated the algorithm across a wide dynamic SC-BP con-trast range and the algorithm’s approximation of ground truthwas found to be good.
2) NOISE VARIATIONFig. 7 show results from testing the algorithm on phantomsgenerated by varying SNR. The SNR is varied between 4and 16. The algorithm is trained on datasets generated withSC-BP ranging between 1.8 ≤ SC-BP ≤ 2.1. Results showthat SC-BP dictates over SNR for achieving good segmenta-tions. Note segmentations are poor with SC-BP = 1.2 when
VOLUME 2, 2014 1800615
Karim et al.: Method to Standardize Quantification of Left Atrial Scar
FIGURE 6. Performance of algorithm on numerical phantoms withincreasing SC-BP contrast and SNR fixed at 9.0. Each graph is an instanceof the algorithm: (a) trained on 1.5 to 1.8, and (b) trained on 1.8 to 2.1.The trend-lines show the median. Boxes in the plot indicate the 9th, 25th,50th, 75th and 91st percentiles.
FIGURE 7. Performance of algorithm on numerical phantoms with varyingSNR. The SNR is varied between4 to 16. The median Dice segmentation overlap is plotted for the trendline shown.
SNR = 4 and with SNR = 16. But this is improved whenSC-BP ≥ 1.8 demonstrating that the algorithm is robust tonoise. SNR in actual DE-MRI is typically around 9.0 and thealgorithm is seen to perform well in this range.
3) COMPARISON WITH FIXED MODELSFig. 8 show how the algorithm and fixed models per-formed on the same datasets. A total of 200 scarred regionswere identified in five anatomically-unique phantoms. TheirSC-BP contrast were computed and the overlap accuracynoted for each method. This allowed eachmethod to be evalu-ated on specific SC-BP ratios and the plots in Fig. 8 show the
FIGURE 8. Comparing performance of algorithm with fixed models onnumerical phantoms. Fixed models namely 3-SD, 4-SD, 6-SD and FWHMwere evaluated. The trend-lines show the median Dice computed from200 different scarred regions obtained from 5 separate phantoms.
segmentation accuracy trend. Fixed models 3,4,6-SD gener-ated better segmentations than FWHM when scar contrast isbetween 1.2 to 2.2. However, FWHM improved substantiallywith higher scar contrast (SC-BP > 2.2 in Fig. 8), which iswhen the 50 percent cut-off was more reasonable. Overall, asillustrated in Fig. 8, the algorithm maintained good accuracywhen compared to fixed models in numerical phantoms.The failure of FWHM revealed in this experiment is further
illustrated in Fig. 9 (see columns 1 and 2). When the contrastin scar is not high, 50 percent of maximal signal as considered
FIGURE 9. Instances where 50% cut-off in FWHM is not optimal. Firstrow: Original images of phantom with variable scar contrast. Second row:Algorithm’s segmentation. Third row: Segmentation from FWHM withleaks. Fourth row: Segmentation from 3-SD.
1800615 VOLUME 2, 2014

Karim et al.: Method to Standardize Quantification of Left Atrial Scar
in FWHM, is not optimal and leaks in segmentation areinevitable [Fig. 9 (row 3)].
B. CLINICAL DATA1) COMPARISON WITH FIXED MODELS USINGOVERLAP METRICIn the clinical datasets, performance of algorithm and fixedmodels were tested by measuring overlap with pseudoground-truth (STAPLE) and comparing segmentation outputsin terms of scar volumes. For assessing performance based onoverlap, eachmethodwas tested on individual SC-BP contrastlevels: 1.0, 1.4, 1.8, 2.2, 2.6 and 3.0. This was possible bysampling 155 individual scarred regions from the clinicalscans, measuring their SC-BP contrast ratio and testing howwell each method segmented it. Results are given in Fig. 10.
FIGURE 10. Comparing performance of fixed models with algorithm onpatient scans. The performance over a total of 155 scarred regions areshown here. The trend-lines show the median. Five example snapshots ofscar are also given to illustrate SC-BP contrast levels. Note SC-BP ratiosanalysed range from 1.4 to 3.0.
Fixed models perform less accurately than the algorithmwhen SC-BP is less than 2.5. At excellent and rarely attainableSC-BP levels (>> 2.5), this trend changes and all modelsperform equally well. FWHM and the algorithm performconsistently across the entire SC-BP range used in this exper-iment, with 3- and 4-SD models outputting less accuratesegmentations on scar at certain SC-BP contrast levels (1.6,2.2). This is because scar is not adequately segmented by 3- or4-SD due to non-overlapping intensities between model andactual. These results highlight that the algorithm performsconsistently on actual DE-MRI and across realistic SC-BPlevels. Performance of fixed models is found to be variable.
2) COMPARISON WITH FIXED MODELS USINGQUANTIFIED VOLUMEAssessment of performance using total scar volume reportedby each method is important as this is mostly how scaris quantified and interpreted for clinical studies. Resultsobtained from scar volume quantified by each run of methodis given in Fig. 11 for six clinical datasets. Each methodwas run three separate times with inputs (i.e. normal and
FIGURE 11. Assessment of inter-observer variation in fixed models,manual segmentation and algorithm. Six clinical cases are illustratedhere.
hyper-enhanced myocardium) fed from three independentobservers. Volume reported by each method was comparedto the volume reported by three independent experiencedobservers (see Manual method in Fig. 11). The algorithmcorrelated well with manual scar volumes. All three runsof the algorithm produced the same result as depicted bythe single bar in Fig. 11. All other methods showed vari-ations in the quantified volume. This variation was pri-marily due to observer variability in selecting normal orhyper-enhanced tissue required for fixed models. This high-lights that a standardized quantification for scar using afixed model approach (FWHM and SD) can be difficult toachieve.
3) QUALITATIVE COMPARISON ON DE-MRI SCANSSegmentation quality was assessed by overlaying regioncontours over the original DE-MRI slices. It was generallyobserved that in images with excellent SC-BP contrast, con-tours followed scar boundaries accurately in both algorithmand fixed models. Fixed models 3 and 6-SD were less accu-rate. An example is shown in Fig. 15 where segmentationssimilar to the consensus segmentation [Fig. 15(b)] could beobtained. Fixed models showed poor correlation when theSC-BP contrast is not sufficiently high. An example is shownin Fig. 16 where FWHMand the algorithm fared well with thealgorithm providing a better approximation to the consensussegmentation. Fixed models 3 and 6-SD have gross errorsin their segmentations due to a large overlap of intensitiesbetween their scar model and actual healthy tissue. Such seg-mentations are not usable for clinical studies and the operatorwould require to resort to threshold re-adjustment.
VOLUME 2, 2014 1800615
Karim et al.: Method to Standardize Quantification of Left Atrial Scar
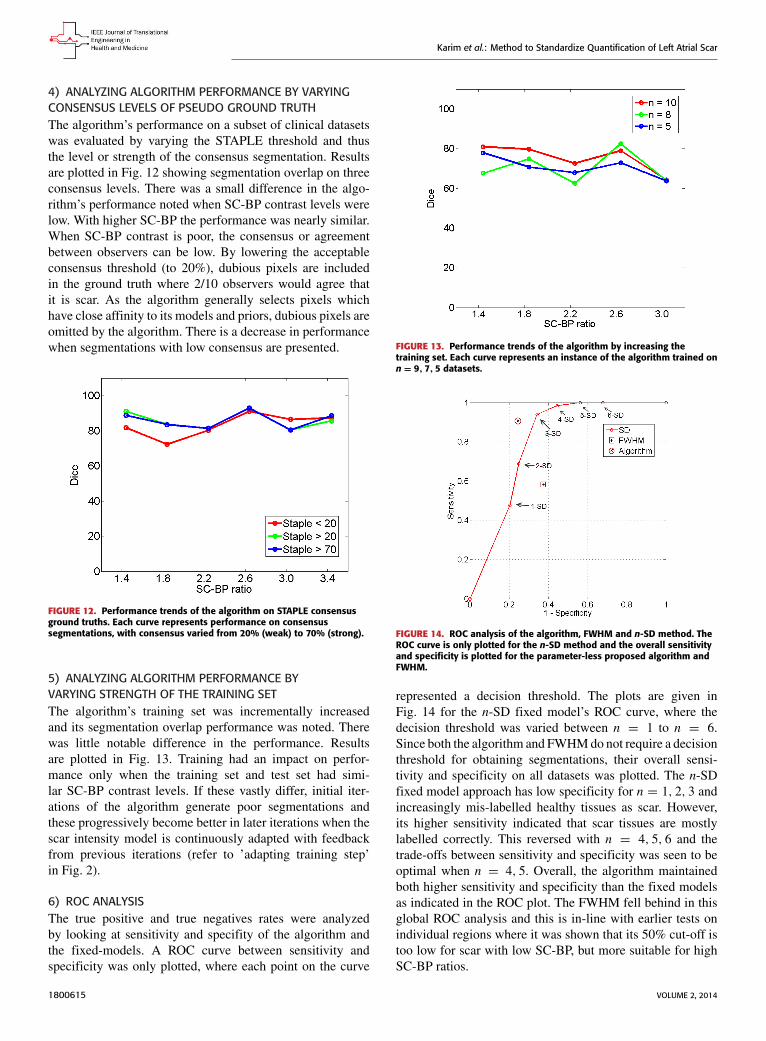
4) ANALYZING ALGORITHM PERFORMANCE BY VARYINGCONSENSUS LEVELS OF PSEUDO GROUND TRUTHThe algorithm’s performance on a subset of clinical datasetswas evaluated by varying the STAPLE threshold and thusthe level or strength of the consensus segmentation. Resultsare plotted in Fig. 12 showing segmentation overlap on threeconsensus levels. There was a small difference in the algo-rithm’s performance noted when SC-BP contrast levels werelow. With higher SC-BP the performance was nearly similar.When SC-BP contrast is poor, the consensus or agreementbetween observers can be low. By lowering the acceptableconsensus threshold (to 20%), dubious pixels are includedin the ground truth where 2/10 observers would agree thatit is scar. As the algorithm generally selects pixels whichhave close affinity to its models and priors, dubious pixels areomitted by the algorithm. There is a decrease in performancewhen segmentations with low consensus are presented.
FIGURE 12. Performance trends of the algorithm on STAPLE consensusground truths. Each curve represents performance on consensussegmentations, with consensus varied from 20% (weak) to 70% (strong).
5) ANALYZING ALGORITHM PERFORMANCE BYVARYING STRENGTH OF THE TRAINING SETThe algorithm’s training set was incrementally increasedand its segmentation overlap performance was noted. Therewas little notable difference in the performance. Resultsare plotted in Fig. 13. Training had an impact on perfor-mance only when the training set and test set had simi-lar SC-BP contrast levels. If these vastly differ, initial iter-ations of the algorithm generate poor segmentations andthese progressively become better in later iterations when thescar intensity model is continuously adapted with feedbackfrom previous iterations (refer to ’adapting training step’in Fig. 2).
6) ROC ANALYSISThe true positive and true negatives rates were analyzedby looking at sensitivity and specifity of the algorithm andthe fixed-models. A ROC curve between sensitivity andspecificity was only plotted, where each point on the curve
FIGURE 13. Performance trends of the algorithm by increasing thetraining set. Each curve represents an instance of the algorithm trained onn = 9, 7, 5 datasets.
FIGURE 14. ROC analysis of the algorithm, FWHM and n-SD method. TheROC curve is only plotted for the n-SD method and the overall sensitivityand specificity is plotted for the parameter-less proposed algorithm andFWHM.
represented a decision threshold. The plots are given inFig. 14 for the n-SD fixed model’s ROC curve, where thedecision threshold was varied between n = 1 to n = 6.Since both the algorithm and FWHMdo not require a decisionthreshold for obtaining segmentations, their overall sensi-tivity and specificity on all datasets was plotted. The n-SDfixed model approach has low specificity for n = 1, 2, 3 andincreasingly mis-labelled healthy tissues as scar. However,its higher sensitivity indicated that scar tissues are mostlylabelled correctly. This reversed with n = 4, 5, 6 and thetrade-offs between sensitivity and specificity was seen to beoptimal when n = 4, 5. Overall, the algorithm maintainedboth higher sensitivity and specificity than the fixed modelsas indicated in the ROC plot. The FWHM fell behind in thisglobal ROC analysis and this is in-line with earlier tests onindividual regions where it was shown that its 50% cut-off istoo low for scar with low SC-BP, but more suitable for highSC-BP ratios.
1800615 VOLUME 2, 2014

Karim et al.: Method to Standardize Quantification of Left Atrial Scar
FIGURE 15. Segmentations on clinical scans I: (a) original scan, (b) consensus STAPLEsegmentation, (c) Algorithm, (d) FWHM, (e) 3-SD, (f) 6-SD. Arrows show enhancement. This scanhas excellent SC-BP contrast and all methods except 3-SD and 6-SD demonstrate good accuracy.Abbreviations: AO - Aorta, LA - Left atrium, R - Right side, L - left side.
FIGURE 16. Segmentations on clinical scans II: (a) original scan, (b) consensus STAPLEsegmentation, (c) Algorithm, (d) FWHM, (e) 3-SD, (f) 6-SD. Arrows show enhancement. This scanhas excellent SC-BP contrast and all methods except 3-SD and 6-SD demonstrate good accuracy.Abbreviations: AO - Aorta, LA - Left atrium, R - Right side, L - left side.
V. DISCUSSIONIn this work a segmentation algorithm was investigated forfast quantification of fibrosis in DE-MRI scans. The proposedalgorithm offers the following advantages: 1) Segments fibro-sis without requiring a manual outline of remote or healthymyocardium. This is beneficial since remote myocardiumtends to have low SNR and manual selection suffers fromhigh observer variability. 2) The algorithm does not rou-tinely generate false positives as was observed in existing
fixed model methods: FWHM and n-SD. 3) The algorithmis developed particularly for left atrial fibrosis segmentationand all present approacheswere developed for ventricle scans.4) Analysis of DE-MRI scans was shortened to an averageof 30 seconds when compared to existing semi-automaticapproaches requiring 2 minutes per scan on average.The algorithm along with existing approaches was tested
on both numerical phantoms and clinical datasets. Numericalphantoms provided with a wide dynamic range of variation
VOLUME 2, 2014 1800615
Karim et al.: Method to Standardize Quantification of Left Atrial Scar
in scar contrast otherwise not possible in clinical datasets.Furthermore, in present literature, methods were validatedon images using global overlap measures and not on indi-vidual regions and nor on individual SC-BP ratios. In thiswork, these together have allowed existing approaches to beinvestigated more thoroughly and results have revealed wherethey fail to perform. Both FWHM and SD methods can havegross errors in its segmentations when scar contrast is not highenough causing significant overlap of intensities between thescar and healthy tissue. On the clinical datasets, the variabilityin scar volume from FWHM and SD when operated by threedifferent experienced operators meant no standard quantifi-cation was possible. The algorithm reported the same volumein each run and this was also consistently found to be close tothe consensus segmentation of experienced observers.
The algorithm incorporates knowledge both from its train-ing dataset and the unseen image. The SC-BP contrast ratiois modelled from the training and intensity distributions ofnon-scar tissue is modelled from the unseen. The SC-BPmodel is automatically adapted iteratively where necessary.These made the algorithm better equipped to handle con-trast variations commonly encountered in DE-MRI. Built-insmoothness constraints and the graph-cuts approach allow itto consider neighbouring regions for inclusion or exclusioneven when they do not fit the model. This enabled it toproduce accurate scar boundaries.
The absence of ground truth for scar in DE-MRI is animportant issue for segmentation methods and this has notbeen properly addressed in literature. One approach is touse voltage as a surrogate for scar [30]. In this work, threeexperienced observers manually segmented scars in eachDE-MRI scan. These were then combined to generate a con-sensus segmentation or pseudo-ground truth for each scanusing a statistical approach. This consolidated inter-observervariabilities commonly encountered in such scans. The degreeof agreement of the consensus was also varied to show that astrong consensus was needed, especially when SC-BP levelswere poor. A 70% threshold was overall deemed appropriateand this meant pixels with 7/10 consensus or above wereincluded in the pseudo ground truth on which all tests wereperformed. Furthermore, numerical phantoms are employedin this work to evaluate the algorithm, FWHM and SD over awider dynamic range of SC-BP contrast ratios.
The training step is also further explored in this work.A decrease in algorithm performance was noted when a smalltraining set was used. However, there might come a pointwhere increasing the training set would not substantiallyincrease the accuracy of the algorithm but this is dependenton the variation of the image population. The algorithm wasevaluated using the leave-one-out approach, with 14/15 of thedatasets used for training and 1/15 for testing. This wouldalways be applicable with unseen data always being left out ofthe training and any previous data being added to the training.
A. CLINICAL TRANSLATION AND APPLICATIONSeveral recent studies [7]–[11] have highlighted the impor-tance of quantifying LAfibrosis in DE-MRI and these includeits use in deciding treatment strategy and thus selectingpatients whowill respond better to RFCAprocedures. Quanti-fying using fixedmodels such as FWHMand SD is frequentlyutilised clinically due to its simplicity. In this work, bothSD and FWHM were shown to have several disadvantages.The FWHM had overall equally low sensitivity and speci-ficity than SD; it is more reliable in segmenting scar withhigh SC-BP than low SC-BP. The SD fixed model was overallmore sensitive with a higher true positive rate than FWHM,but this comes at the expense of reduced specificity. In scardetection, a higher true positive rate and thus detecting mostscar pixels is more desirable. This is because rectifying quan-tified volumes by manually removing mis-labelled healthypixels is relatively simpler and less time-consuming thanmanually labelling and including scar pixels that are missed.The algorithm is shown to have good true positive and truenegative rates in the ROC analysis, and higher than FWHMin all decision thresholds explored for SD. Moreover, stan-dardization is impossible to achieve in fixed models such asSD with several choices of thresholds left to the operator totweak. The clinical translation of the proposed algorithm thusbecomes clear - it aims to provide a reliable and standardizedmethod of quantifying scar.Quantification algorithms such as the one proposed, which
can potentially be used in deciding treatment strategy, shouldbe evaluated on a wide randomized spectrum of datasetsfrom different imaging centres. To this end, the algorithmwas recently evaluated in a segmentation challenge organizedto compare quantification algorithms from seven differentcentres [33]. It was evaluated on sixty datasets obtained fromthree different imaging centres. A similar level of perfor-mance was achieved in these datasets. Dice segmentationoverlap scores were comparable to those obtained from semi-automatic methods.
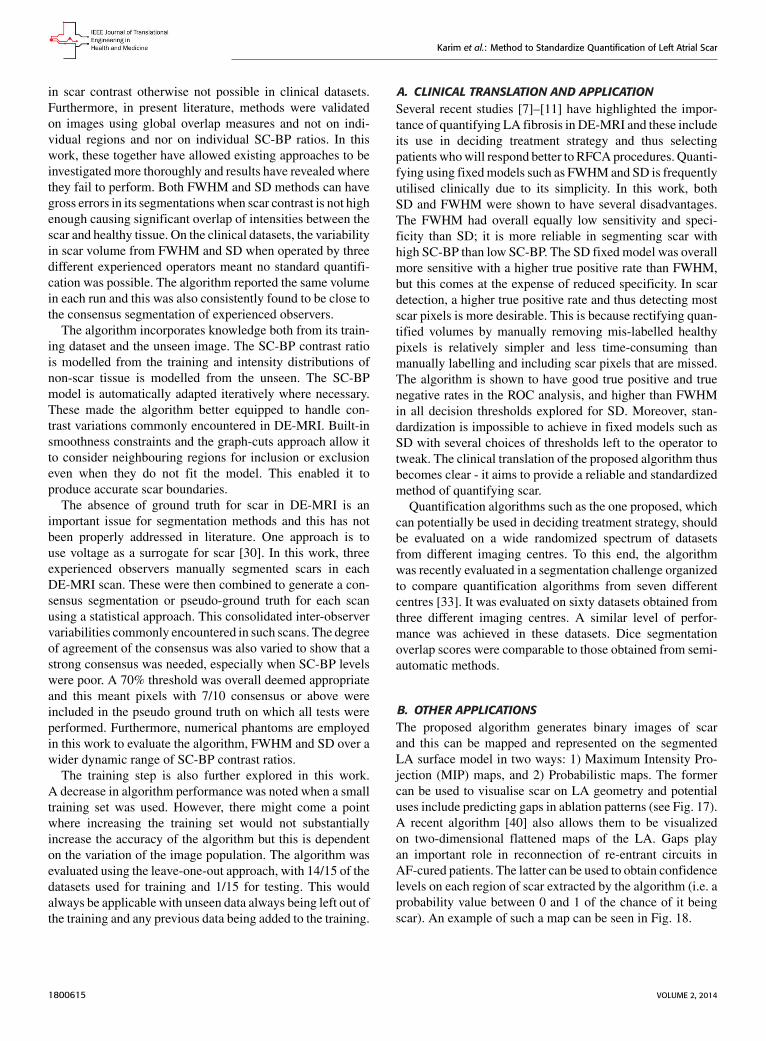
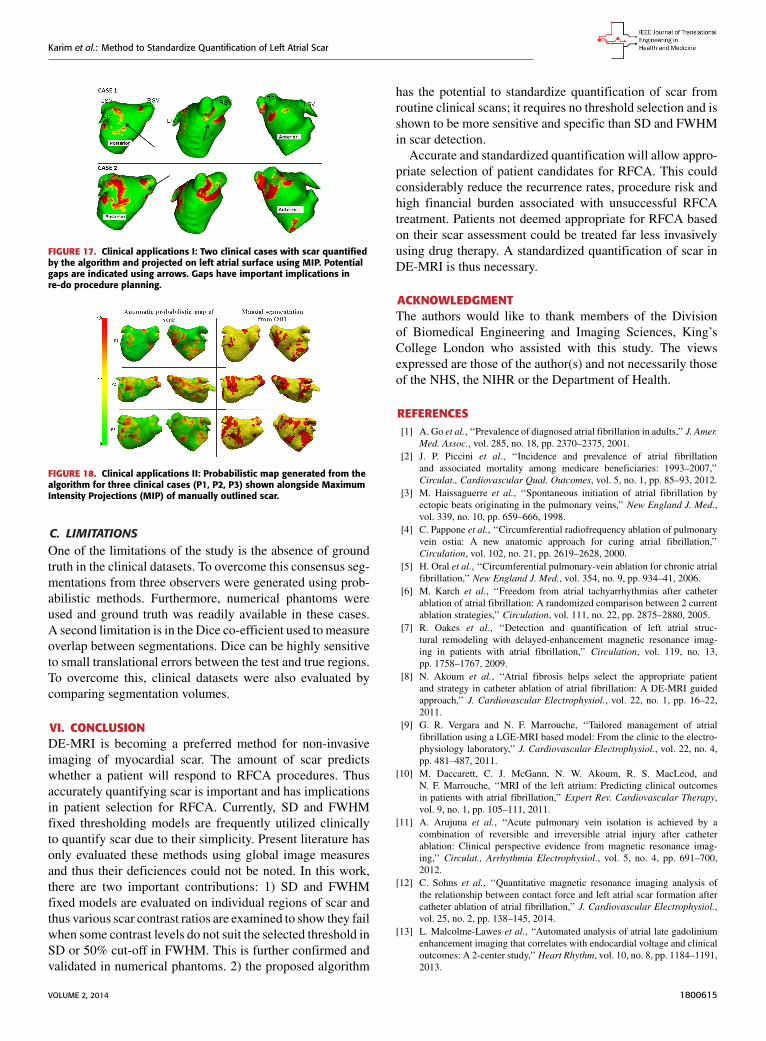
B. OTHER APPLICATIONSThe proposed algorithm generates binary images of scarand this can be mapped and represented on the segmentedLA surface model in two ways: 1) Maximum Intensity Pro-jection (MIP) maps, and 2) Probabilistic maps. The formercan be used to visualise scar on LA geometry and potentialuses include predicting gaps in ablation patterns (see Fig. 17).A recent algorithm [40] also allows them to be visualizedon two-dimensional flattened maps of the LA. Gaps playan important role in reconnection of re-entrant circuits inAF-cured patients. The latter can be used to obtain confidencelevels on each region of scar extracted by the algorithm (i.e. aprobability value between 0 and 1 of the chance of it beingscar). An example of such a map can be seen in Fig. 18.
1800615 VOLUME 2, 2014
Karim et al.: Method to Standardize Quantification of Left Atrial Scar
FIGURE 17. Clinical applications I: Two clinical cases with scar quantifiedby the algorithm and projected on left atrial surface using MIP. Potentialgaps are indicated using arrows. Gaps have important implications inre-do procedure planning.
FIGURE 18. Clinical applications II: Probabilistic map generated from thealgorithm for three clinical cases (P1, P2, P3) shown alongside MaximumIntensity Projections (MIP) of manually outlined scar.
C. LIMITATIONSOne of the limitations of the study is the absence of groundtruth in the clinical datasets. To overcome this consensus seg-mentations from three observers were generated using prob-abilistic methods. Furthermore, numerical phantoms wereused and ground truth was readily available in these cases.A second limitation is in the Dice co-efficient used tomeasureoverlap between segmentations. Dice can be highly sensitiveto small translational errors between the test and true regions.To overcome this, clinical datasets were also evaluated bycomparing segmentation volumes.
VI. CONCLUSIONDE-MRI is becoming a preferred method for non-invasiveimaging of myocardial scar. The amount of scar predictswhether a patient will respond to RFCA procedures. Thusaccurately quantifying scar is important and has implicationsin patient selection for RFCA. Currently, SD and FWHMfixed thresholding models are frequently utilized clinicallyto quantify scar due to their simplicity. Present literature hasonly evaluated these methods using global image measuresand thus their deficiences could not be noted. In this work,there are two important contributions: 1) SD and FWHMfixed models are evaluated on individual regions of scar andthus various scar contrast ratios are examined to show they failwhen some contrast levels do not suit the selected threshold inSD or 50% cut-off in FWHM. This is further confirmed andvalidated in numerical phantoms. 2) the proposed algorithm
has the potential to standardize quantification of scar fromroutine clinical scans; it requires no threshold selection and isshown to be more sensitive and specific than SD and FWHMin scar detection.Accurate and standardized quantification will allow appro-
priate selection of patient candidates for RFCA. This couldconsiderably reduce the recurrence rates, procedure risk andhigh financial burden associated with unsuccessful RFCAtreatment. Patients not deemed appropriate for RFCA basedon their scar assessment could be treated far less invasivelyusing drug therapy. A standardized quantification of scar inDE-MRI is thus necessary.
ACKNOWLEDGMENTThe authors would like to thank members of the Divisionof Biomedical Engineering and Imaging Sciences, King’sCollege London who assisted with this study. The viewsexpressed are those of the author(s) and not necessarily thoseof the NHS, the NIHR or the Department of Health.
REFERENCES[1] A. Go et al., ‘‘Prevalence of diagnosed atrial fibrillation in adults,’’ J. Amer.
Med. Assoc., vol. 285, no. 18, pp. 2370–2375, 2001.[2] J. P. Piccini et al., ‘‘Incidence and prevalence of atrial fibrillation
and associated mortality among medicare beneficiaries: 1993–2007,’’Circulat., Cardiovascular Qual. Outcomes, vol. 5, no. 1, pp. 85–93, 2012.
[3] M. Haissaguerre et al., ‘‘Spontaneous initiation of atrial fibrillation byectopic beats originating in the pulmonary veins,’’ New England J. Med.,vol. 339, no. 10, pp. 659–666, 1998.
[4] C. Pappone et al., ‘‘Circumferential radiofrequency ablation of pulmonaryvein ostia: A new anatomic approach for curing atrial fibrillation,’’Circulation, vol. 102, no. 21, pp. 2619–2628, 2000.
[5] H. Oral et al., ‘‘Circumferential pulmonary-vein ablation for chronic atrialfibrillation,’’ New England J. Med., vol. 354, no. 9, pp. 934–41, 2006.
[6] M. Karch et al., ‘‘Freedom from atrial tachyarrhythmias after catheterablation of atrial fibrillation: A randomized comparison between 2 currentablation strategies,’’ Circulation, vol. 111, no. 22, pp. 2875–2880, 2005.
[7] R. Oakes et al., ‘‘Detection and quantification of left atrial struc-tural remodeling with delayed-enhancement magnetic resonance imag-ing in patients with atrial fibrillation,’’ Circulation, vol. 119, no. 13,pp. 1758–1767, 2009.
[8] N. Akoum et al., ‘‘Atrial fibrosis helps select the appropriate patientand strategy in catheter ablation of atrial fibrillation: A DE-MRI guidedapproach,’’ J. Cardiovascular Electrophysiol., vol. 22, no. 1, pp. 16–22,2011.
[9] G. R. Vergara and N. F. Marrouche, ‘‘Tailored management of atrialfibrillation using a LGE-MRI based model: From the clinic to the electro-physiology laboratory,’’ J. Cardiovascular Electrophysiol., vol. 22, no. 4,pp. 481–487, 2011.
[10] M. Daccarett, C. J. McGann, N. W. Akoum, R. S. MacLeod, andN. F. Marrouche, ‘‘MRI of the left atrium: Predicting clinical outcomesin patients with atrial fibrillation,’’ Expert Rev. Cardiovascular Therapy,vol. 9, no. 1, pp. 105–111, 2011.
[11] A. Arujuna et al., ‘‘Acute pulmonary vein isolation is achieved by acombination of reversible and irreversible atrial injury after catheterablation: Clinical perspective evidence from magnetic resonance imag-ing,’’ Circulat., Arrhythmia Electrophysiol., vol. 5, no. 4, pp. 691–700,2012.
[12] C. Sohns et al., ‘‘Quantitative magnetic resonance imaging analysis ofthe relationship between contact force and left atrial scar formation aftercatheter ablation of atrial fibrillation,’’ J. Cardiovascular Electrophysiol.,vol. 25, no. 2, pp. 138–145, 2014.
[13] L. Malcolme-Lawes et al., ‘‘Automated analysis of atrial late gadoliniumenhancement imaging that correlates with endocardial voltage and clinicaloutcomes: A 2-center study,’’Heart Rhythm, vol. 10, no. 8, pp. 1184–1191,2013.
VOLUME 2, 2014 1800615
Karim et al.: Method to Standardize Quantification of Left Atrial Scar
[14] D. Peters et al., ‘‘Detection of pulmonary vein and left atrial scar aftercatheter ablation with three-dimensional navigator-gated delayed enhance-ment MR imaging: Initial experience 1,’’ Radiology, vol. 243, no. 3,pp. 690–695, 2007.
[15] Y. Boykov, O. Veksler, and R. Zabih, ‘‘Fast approximate energy minimiza-tion via graph cuts,’’ IEEE Trans. Pattern Anal. Mach. Intell., vol. 23,no. 11, pp. 1222–1239, Nov. 2001.
[16] R. Kim et al., ‘‘Relationship of MRI delayed contrast enhancement to irre-versible injury, infarct age, and contractile function,’’Circulation, vol. 100,no. 19, pp. 1992–2002, 1999.
[17] A. Kolipaka, G. P. Chatzimavroudis, R. D. White, T. P. O’Donnell,and R. M. Setser, ‘‘Segmentation of non-viable myocardium in delayedenhancement magnetic resonance images,’’ Int. J. Cardiovascular Imag.,vol. 21, nos. 2–3, pp. 303–311, 2005.
[18] A. Schmidt et al., ‘‘Infarct tissue heterogeneity by magnetic reso-nance imaging identifies enhanced cardiac arrhythmia susceptibility inpatients with left ventricular dysfunction,’’ Circulation, vol. 115, no. 15,pp. 2006–2014, 2007.
[19] L. Amado et al., ‘‘Accurate and objective infarct sizing by contrast-enhanced magnetic resonance imaging in a canine myocardial infarc-tion model,’’ J. Amer. College Cardiol., vol. 44, no. 12, pp. 2383–2389,2004.
[20] V. Positano et al., ‘‘A fast and effective method to assess myocardial necro-sis by means of contrast magnetic resonance imaging,’’ J. CardiovascularMagn. Resonan., vol. 7, no. 2, pp. 487–494, 2005.
[21] J. Detsky, G. Paul, A. Dick, and G. Wright, ‘‘Reproducible classificationof infarct heterogeneity using fuzzy clustering on multicontrast delayedenhancement magnetic resonance images,’’ IEEE Trans. Med. Imag.,vol. 28, no. 10, pp. 1606–1614, Oct. 2009.
[22] Y. Lu, G. Wright, and P. E. Radau, ‘‘Automatic myocardium segmentationof LGE MRI by deformable models with prior shape data,’’ J. Cardiovas-cular Magn. Reson., vol. 15, no. 1, p. P14, 2013.
[23] B. Knowles et al., ‘‘3-D visualization of acute RF ablation lesions usingMRI for the simultaneous determination of the patterns of necrosis andedema,’’ IEEE Trans. Biomed. Eng., vol. 57, no. 6, pp. 1467–1475,Jun. 2010.
[24] J. Wylie, D. Peters, V. Essebag, W. Manning, M. Josephson, and T. Hauser,‘‘Left atrial function and scar after catheter ablation of atrial fibrillation,’’Heart Rhythm, vol. 5, no. 5, pp. 656–662, 2008.
[25] D. Peters et al., ‘‘Recurrence of atrial fibrillation correlates withthe extent of post-procedural late gadolinium enhancement: A pilotstudy,’’ J. Amer. College Cardiol., Cardiovascular Imag., vol. 2, no. 3,pp. 308–316, 2009.
[26] A. Yan et al., ‘‘Characterization of the peri-infarct zone by contrast-enhanced cardiac magnetic resonance imaging is a powerful predictor ofpost-myocardial infarction mortality,’’ Circulation, vol. 114, no. 1, p. 32,2006.
[27] A. Hennemuth et al., ‘‘A comprehensive approach to the analysis ofcontrast enhanced cardiac MR images,’’ IEEE Trans. Med. Imag., vol. 27,no. 11, pp. 1592–1610, Nov. 2008.
[28] Q. Tao et al., ‘‘Automated segmentation of myocardial scar in late enhance-ment MRI using combined intensity and spatial information,’’ Magn.Reson. Med., vol. 64, no. 2, pp. 586–594, 2010.
[29] Y. Lu, Y. Yang, K. A. Connelly, G. A. Wright, and P. E. Radau,‘‘Automated quantification of myocardial infarction using graph cuts oncontrast delayed enhanced magnetic resonance images,’’ Quant. Imag.Med. Surgery, vol. 2, no. 2, pp. 81–86, 2012.
[30] D. Ravanelli et al., ‘‘A novel skeleton based quantification and 3D volumet-ric visualization of left atrium fibrosis using late gadolinium enhancementmagnetic resonance imaging,’’ IEEE Trans. Med. Imag., vol. 33, no. 2,pp. 566–576, Feb. 2014.
[31] R. Karim et al., ‘‘Validation of a novel method for the automatic segmenta-tion of left atrial scar from delayed-enhancement magnetic resonance,’’ inInternational Workshop on Statistical Atlases and Computational Modelsof the Heart. New York, NY, USA: Springer-Verlag, 2012, pp. 254–262.
[32] R. Karim et al., ‘‘Automatic segmentation of left atrial scar from delayed-enhancement magnetic resonance imaging,’’ in International Workshop onFunctional Imaging and Modeling of the Heart. New York, NY, USA:Springer-Verlag, 2011, pp. 63–70.
[33] R. Karim et al., ‘‘Evaluation of current algorithms for segmentation ofscar tissue from late gadolinium enhancement cardiovascular magneticresonance of the left atrium: An open-access grand challenge,’’ J. Cardio-vascular Magn. Reson., vol. 15, no. 105, 2013.
[34] J. Peters et al., ‘‘Automatic whole heart segmentation in static magneticresonance image volumes,’’ in Proc. MICCAI, 2007, pp. 402–410.
[35] J. Schnabel et al., ‘‘A generic framework for non-rigid registration based onnon-uniformmulti-level free-form deformations,’’ in Proc. MICCAI, 2010,pp. 573–581.
[36] A. Dempster, N. Laird, and D. Rubin, ‘‘Maximum likelihood from incom-plete data via the EM algorithm,’’ J. R. Statist. Soc. Ser. B, vol. 39, no. 1,pp. 1–38, 1977.
[37] L. Dice, ‘‘Measures of the amount of ecologic association betweenspecies,’’ Ecology, vol. 26, no. 3, pp. 297–302, 1945.
[38] S. Warfield, K. Zou, and W. Wells, ‘‘Simultaneous truth and performancelevel estimation (STAPLE): An algorithm for the validation of imagesegmentation,’’ IEEE Trans. Med. Imag., vol. 23, no. 7, pp. 903–921,Jul. 2004.
[39] A. S. Flett et al., ‘‘Evaluation of techniques for the quantification ofmyocardial scar of differing etiology using cardiac magnetic resonance,’’JACC, Cardiovascular Imag., vol. 4, no. 2, pp. 150–156, 2011.
[40] R. Karim et al., ‘‘Surface flattening of the human left atrium and proof-of-concept clinical applications,’’ Comput. Med. Imag. Graph., Feb. 2014, tobe published.
RASHED KARIM received the B.Sc. degree incomputer science from the University of Toronto,the M.Sc. (Hons.) degree from Queen Mary, Uni-versity of London, and the Ph.D. degree in com-puter science from Imperial College London work-ing under Prof. Daniel Rueckert. Since 2010, hehas been a Post-Doctoral Research Fellow with theKing’s College London Medical Engineering Cen-tre. His current research interests include myocar-dial scar classification from MR, image-guided
robotics, and left atrial surface parameterization.
ARUNA ARUJUNA received the M.B.Ch.B.degree from the University of Bristol and the M.D.degree from the King’s College London, in 2002and 2013, respectively. Following gaining mem-bership into the Royal College of Physicians in2006, he pursued a career in cardiology. From 2009to 2012, he was a Clinical Research Fellow withthe Department of Imaging Sciences and Biomed-ical Engineering, King’s College London. He wasinvolved in image-guided interventions, robotic
catheter-based electrophysiology procedures, and cardiac MR imaging. Hisresearch interests include image-guided cardiovascular interventions, cardiacelectromechanical modeling, advanced pacing, and advanced imaging.
RICHARD JAMES HOUSDEN received the B.A.and M.Eng., and M.A. degrees in engineering andthe Ph.D. degree in ultrasound imaging from theUniversity of Cambridge, U.K., in 2004, 2007, and2008, respectively. From 2008 to 2011, he waswith the Department of Engineering, University ofCambridge, where he was involved in ultrasoundelasticity imaging. He is currently a Post-DoctoralResearcher with the Division of Imaging Sciencesand Biomedical Engineering, King’s College Lon-
don, involved primarily in image guidance systems for minimally invasivecardiac catheterization. His research interests include ultrasound imaging,image processing, and surgical guidance systems.
1800615 VOLUME 2, 2014
Karim et al.: Method to Standardize Quantification of Left Atrial Scar
JASPAL GILL, photograph and biography not available at the time of publi-cation.
HANNAH CLIFFE is in her penultimate year ofreading medicine at King’s College, London, hav-ing received a Distinction for Pre-clinical Sci-ences. She received a First with Honours in herintercalated degree in Imaging Sciences, also atKing’s College, London. She is currently study-ing for a Diploma in Conflict and CatastropheMedicine at the Worshipful Society of Apothe-caries of London, and is a Medical Cadet, spon-sored through her studies by the Royal Air Force.
KAVIR MATHARU, photograph and biography not available at the time ofpublication.
JASWINDER GILL, photograph and biography not available at the time ofpublication.
CHRISTOPHER ALDO RINDALDI, photograph and biography not availableat the time of publication.
MARK O’NEILL is a Consultant Cardiologist andElectrophysiologist with the St. Thomas’ HospitalLondon, and a Reader of clinical cardiac electro-physiology with the King’s College London. Hereceived the Hons. Degree from the UniversityCollege Dublin Medical School, and the D.Phil.degree in physiology from Oxford University in1995. From 2005 to 2006, he completed a clin-ical research fellowship in Bordeaux with Prof.M. Hassaguerre and Prof. P. Jas, where he gained
particular expertise in atrial fibrillation. He was a Senior Lecturer withthe Imperial College and an Honorary Consultant Cardiologist with the St.Mary’s Hospital in 2008. In 2009, he joined St. Thomas’ Hospital and King’sCollege London, Department of Cardiology, Division of Imaging Sciencesand Biomedical Engineering, and was promoted to Reader in 2011. He isa Clinical Lead of the King’s Health Partners Clinical Academic Group,Departmental Lead for Arrhythmias in Adult Congenital Heart Disease, andthe Divisional Research Lead for electrophysiology. His primary researchinterests are the development and use of advanced signal processing andimaging technologies to improve arrhythmia characterization and treatmentin patients with heart rhythm disturbances.
DANIEL RUECKERT is a Professor of VisualInformation Processing and heads the BiomedicalImage Analysis Group with the Department ofComputing, Imperial College London. He receivedthe Diploma (M.Sc.) degree in computer sciencefrom Technical University Berlin and the Ph.D.degree in computer science from the Imperial Col-lege London. Before moving to Imperial College,he was a Post-Doctoral Research Fellow with theDivision of Radiological Sciences and Medical
Engineering, King’s College London, where he has been involved in thedevelopment of nonrigid registration algorithms for the compensation of tis-sue motion and deformation. During his doctoral and post-doctoral research,he has authored more than 300 journal and conference articles in medicalimage computing. He is an Associate Editor of the IEEE Transactions onMedical Imaging, an Editorial Board Member of Medical Image Analysis,Image and Vision Computing, and a Referee for a number of internationalmedical imaging journals and conferences. He has served as a member oforganizing and program committees at numerous international conferences.
REZA RAZAVI received the M.D. degree in MR-guided cardiac catheterization from the King’sCollege London, London, U.K, and studiedmedicine from the St. Bartholomew’s HospitalMedical School, University of London, London.He trained in pediatrics and pediatric cardiologywith Guy’s and St. Thomas’ Hospital London. Hewas a Clinical Research Fellow. He was appointedas a Lecturer and an Honorary Consultant of pedi-atric cardiology in 2001, and a Professor of pedi-
atric cardiovascular science in 2004. He has been the Deputy Head of theDivision of Imaging Sciences since 2005 and the Head of Division since2007. He is the Director of the KCL Centre for Excellence in MedicalEngineering funded by the Welcome Trust and the Engineering and PhysicalSciences Research Council. His current research interests include cardiovas-cular magnetic resonance imaging and MR-guided cardiac catheterization.
TOBIAS SCHAEFFTER studied electrical engi-neering in Berlin and received the Ph.D. degreein magnetic resonance imaging (MRI) from theUniversity of Bremen (Prof. Leibfritz), Bremen,Germany. From 1996 to 2006, he was a Princi-pal Scientists with the Philips Research Labora-tories, Hamburg, Germany. In 2006, he was thePhilip Harris Professor of imaging sciences withthe Kings College London, London, U.K. His cur-rent research interests include the investigation of
new acquisition and reconstruction techniques for cardiovascular and quan-titative MRI. In particular, he is involved in new techniques for MR-guidedelectrophysiology procedures and the quantitative assessment of ablationprocedures. He is interested in minimally invasive surgery and robotics. Hehas also pioneered a technique for Botulinum toxin injection for the treatmentof overactive bladders.
KAWAL RHODE received the bachelor’s degreein basic medical sciences and radiological sciencesfrom the King’s College London and the Doctoraldegree from the Department of Surgery, UniversityCollege London, investigating quantitative bloodflow analysis using X-ray angiography, in 1992and 2001, respectively. From 2001 to 2007, hewas with the Division of Imaging Sciences, King’sCollege London, as a Post-Doctoral Research Fel-low, involved in image-guided interventions, in
particular, catheter-based electrophysiology procedures. In 2007, he was aLecturer of image processing with the King’s College London and a SeniorLecturer in 2011. His research interests include image-guided cardiovascularinterventions, cardiac electromechanical modeling, computer simulation ofminimally invasive procedures, and medical robotics. He specializes in trans-lation of novel technologies into the clinical environment via collaborativeresearch programs with leading clinical and industrial partners. He hasauthored 125 peer-reviewed papers in journals and conference proceedings,and 100 conference abstracts.
VOLUME 2, 2014 1800615
Related Documents