PDHonline Course H144 (4 PDH) A Hydrology Primer for Engineers & Hydrologists 2012 Instructor: Patrick C. Garner, Hydrologist PDH Online | PDH Center 5272 Meadow Estates Drive Fairfax, VA 22030-6658 Phone & Fax: 703-988-0088 www.PDHonline.org www.PDHcenter.com An Approved Continuing Education Provider

Welcome message from author
This document is posted to help you gain knowledge. Please leave a comment to let me know what you think about it! Share it to your friends and learn new things together.
Transcript

PDHonline Course H144 (4 PDH)
A Hydrology Primer for Engineers & Hydrologists
2012
Instructor: Patrick C. Garner, Hydrologist
PDH Online | PDH Center5272 Meadow Estates Drive
Fairfax, VA 22030-6658Phone & Fax: 703-988-0088
www.PDHonline.orgwww.PDHcenter.com
An Approved Continuing Education Provider

www.PDHcenter.com PDH Course H144 www.PDHonline.org
© Patrick C. Garner Page 2 of 39
A Hydrology Primer for Engineers & Hydrologists
Patrick C. Garner, PLS 1.0 The Hydrologic Cycle Water is found in the earth’s atmosphere, on the earth’s surface (surface water), and within its subsurface (groundwater). The hydrologic cycle is the continuous process of water moving among these three general locations. Figure 1 shows the basic components of the hydrologic cycle.
Figure 1. Hydrologic Cycle (from Solcomhouse)
Water, which exists in the atmosphere as water vapor, falls on the earth’s surface by precipitation (which can be rain, snow, hail or fog). Water then moves on the surface by the force of gravity, and may follow a number of paths. As precipitation falls on the ground, a percentage of the water remains caught on the surfaces of plants, a process known as interception. In addition, some of the precipitation is stored in irregularities and depressions on the land surface. This is known as depression storage (see Figure 2).
www.PDHcenter.com PDH Course H144 www.PDHonline.org
© Patrick C. Garner Page 3 of 39
Figure 2. Depression storage can vary tremendously in size. The example here is a small pond; depression storage may be as small as logging truck ruts in a forest and
as large as multi-acre ponds in scrub-shrub meadows.
During winter months in temperate climates, some precipitation may be stored on the surface as snow, ice, and frost. Precipitation may also enter the ground through soil pores, and is called infiltration. A portion of this infiltrated water may be stored in the soil, as soil moisture. Within the root zone, soil moisture becomes available for plants. The remainder of the water entering below the root zone is referred to as recharge, and moves through the soil as interflow (unsaturated flow through the soil) or groundwater flow (saturated flow through the soil). The zone in which groundwater flow occurs is commonly referred to as the groundwater table, which may vary in depth from as little as a few inches in depth to well below 100-feet. When precipitation exceeds the combined effects of interception, depression storage and infiltration, the remaining water flows over the surface of the ground as direct runoff (or commonly known in the engineering field as stormwater runoff). Runoff flows over the surface without concentration for anywhere between 50 and 300-feet, then into natural channels such as rills, swales, gullies, intermittent streams, perennial streams, and rivers (see Figures 3 and 4 below). Some of this water is also stored on the earth’s surface in wetland systems, ponds, lakes, reservoirs and oceans.
www.PDHcenter.com PDH Course H144 www.PDHonline.org
© Patrick C. Garner Page 4 of 39
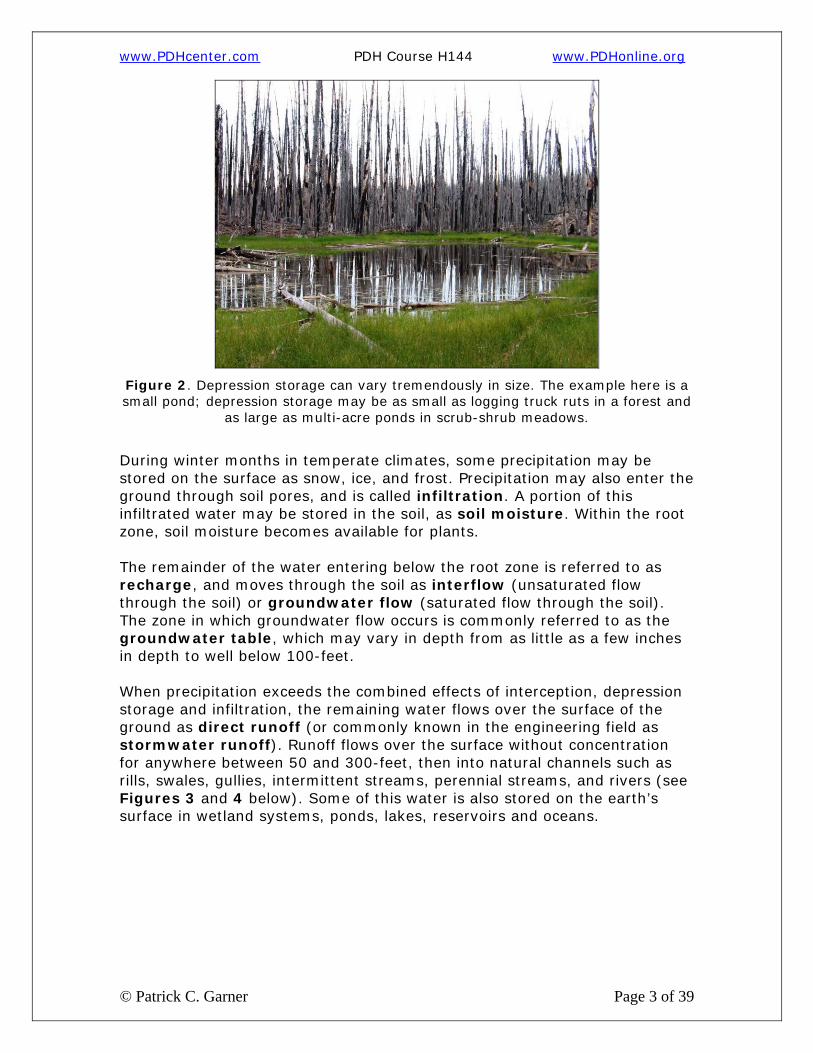
Figure 3. Runoff through a scrub meadow.
Groundwater may also flow to these various water resources through the processes of interflow and groundwater flow. The portion of flow in streams and other water bodies that originate from interflow and groundwater contact with these resources is called base flow.
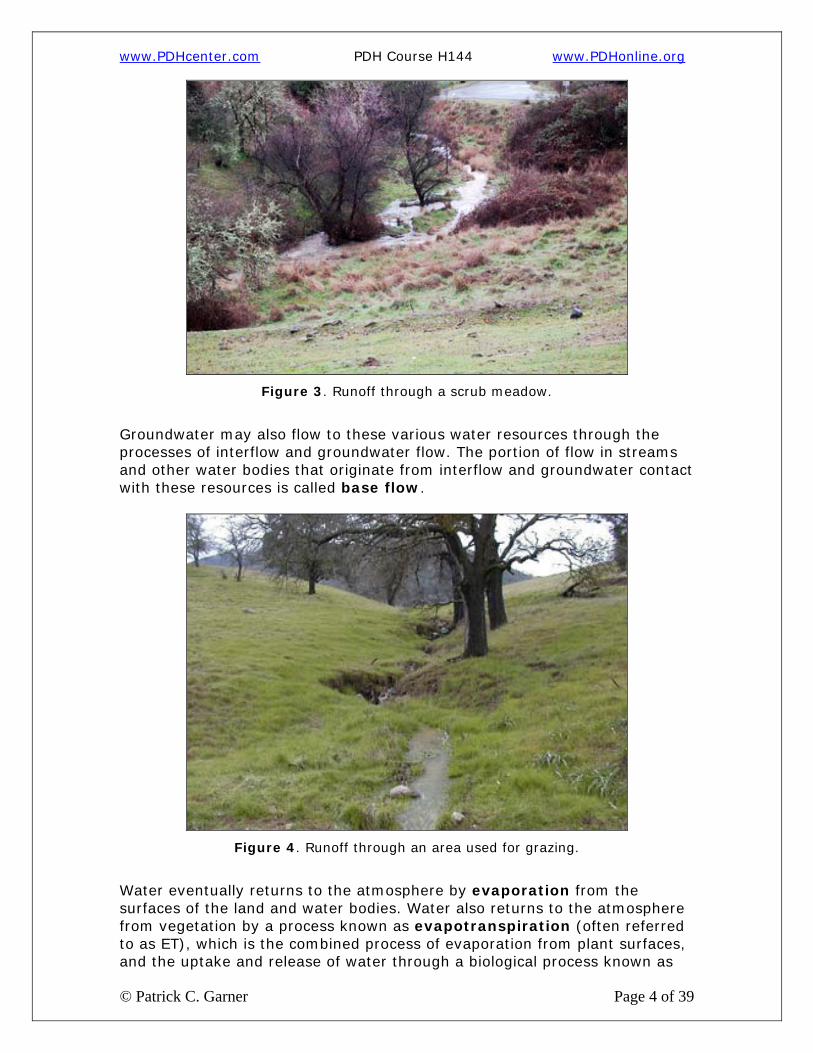
Figure 4. Runoff through an area used for grazing.
Water eventually returns to the atmosphere by evaporation from the surfaces of the land and water bodies. Water also returns to the atmosphere from vegetation by a process known as evapotranspiration (often referred to as ET), which is the combined process of evaporation from plant surfaces, and the uptake and release of water through a biological process known as
www.PDHcenter.com PDH Course H144 www.PDHonline.org
© Patrick C. Garner Page 5 of 39
transpiration. This course deals primarily with the components of surface water flows. The behavior of subsurface flows is referenced only to the extent of describing relationships to surface water flows. Similarly, the behavior of water in the atmosphere is considered only to the extent of its effect on inputs to or losses from the surface water system--that is, as it is quantified as precipitation.
Hydrologic Factors of Concern to Engineers & Hydrologists Several hydrologic factors must be identified to be able to model stormwater. These factors are identified below, and treated in greater detail as this course progresses. Those factors include: Surface Runoff During a precipitation event, some of the water falling on the earth’s surface is retained on vegetative surfaces and in shallow depressions. Some additional water infiltrates into the ground. The remaining water flows over the ground surface as direct runoff (or, stormwater runoff, or simply runoff). The volume of runoff that will occur on a site during a given rainfall event depends on a number of factors:
• The area of land from which runoff occurs (known as the watershed); • The amount of precipitation over a given time period; • The duration and intensity (volume per unit of time) at which
precipitation falls; • The soils at and near the land surface; and • The surface cover (combination of exposed earth, vegetation and
impervious areas). The rate at which runoff discharges from a given site is known as the runoff rate or discharge rate. The peak rate of runoff from a given site (also referred to as the peak flow rate, peak runoff rate, or peak discharge rate) is the maximum rate of runoff that occurs during a particular storm event. The rate of runoff depends on the following factors in addition to those affecting

www.PDHcenter.com PDH Course H144 www.PDHonline.org
© Patrick C. Garner Page 6 of 39
runoff volume:
• The roughness of the surface, determined by the type of surface cover (type of vegetation, bare ground, pavement);
• The location of the impervious area in the watershed in relation to the point of analysis;
• Slope of the ground surface (flatter slopes result in slower rates of flow over the ground, while steeper slopes result in faster rates of flow); and
• The total distance runoff must travel to arrive at a given point of analysis.
The alteration or development of a site for another use often alters the physical features affecting runoff. The development of a wooded site, for instance, into an urban land use usually involves the creation of impervious surfaces (pavement and roofs), which may have significant effects on the volume and rate of runoff. Some of the primary effects of urban development include:
• Increase in volume of runoff. The volume of water available for runoff increases because the impervious area provided by roofs, parking lots, streets and other impervious surfaces reduces the amount of infiltration that may occur. This increase in runoff volume is often directly associated with a decrease in the recharge of the groundwater.
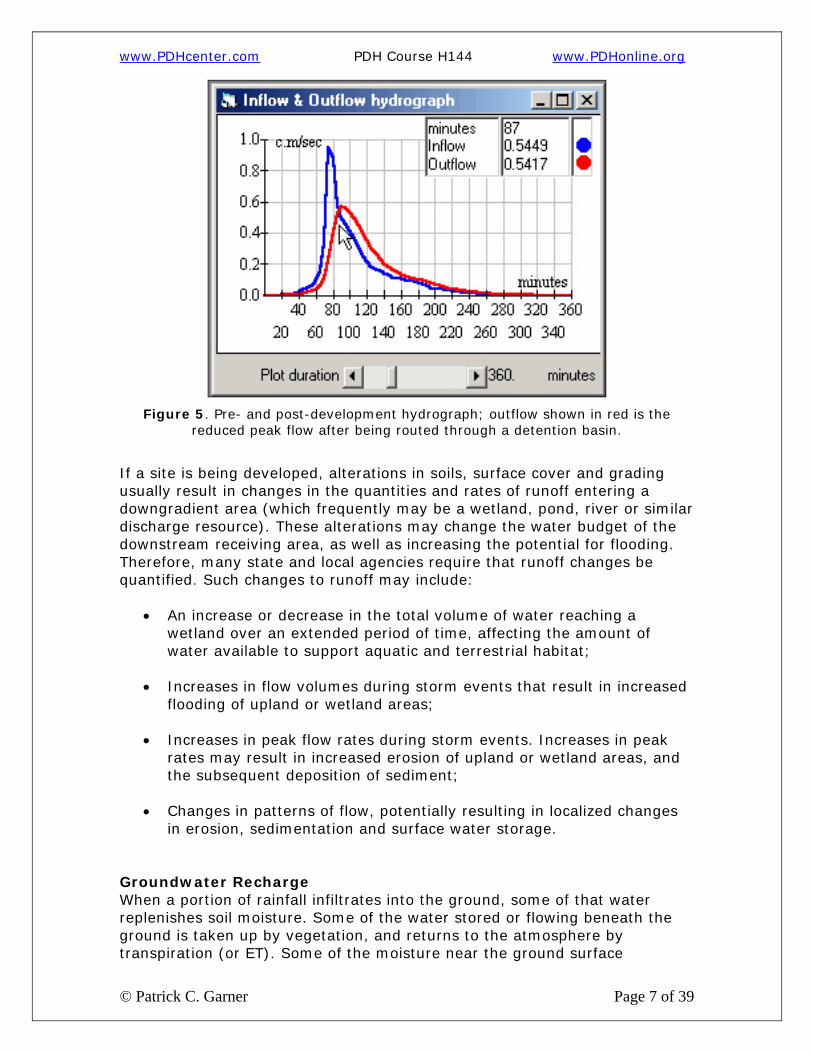
• Increase in runoff rates. Urban development involves changes in
surface cover, and the introduction of channels, curbing and storm drainage collection systems. These alterations result in concentrated flows, or hydraulic efficiencies, that increases the velocity of runoff as it flows to a downgradient watershed outlet. Urban development typically results in higher peak rates of stormwater discharge (see Figure 5).
www.PDHcenter.com PDH Course H144 www.PDHonline.org
© Patrick C. Garner Page 7 of 39
Figure 5. Pre- and post-development hydrograph; outflow shown in red is the
reduced peak flow after being routed through a detention basin.
If a site is being developed, alterations in soils, surface cover and grading usually result in changes in the quantities and rates of runoff entering a downgradient area (which frequently may be a wetland, pond, river or similar discharge resource). These alterations may change the water budget of the downstream receiving area, as well as increasing the potential for flooding. Therefore, many state and local agencies require that runoff changes be quantified. Such changes to runoff may include:
• An increase or decrease in the total volume of water reaching a wetland over an extended period of time, affecting the amount of water available to support aquatic and terrestrial habitat;
• Increases in flow volumes during storm events that result in increased
flooding of upland or wetland areas;
• Increases in peak flow rates during storm events. Increases in peak rates may result in increased erosion of upland or wetland areas, and the subsequent deposition of sediment;
• Changes in patterns of flow, potentially resulting in localized changes
in erosion, sedimentation and surface water storage. Groundwater Recharge When a portion of rainfall infiltrates into the ground, some of that water replenishes soil moisture. Some of the water stored or flowing beneath the ground is taken up by vegetation, and returns to the atmosphere by transpiration (or ET). Some of the moisture near the ground surface

www.PDHcenter.com PDH Course H144 www.PDHonline.org
© Patrick C. Garner Page 8 of 39
evaporates into the atmosphere. The water that remains after these losses becomes groundwater recharge (see Figure 6 below).
Figure 6. Groundwater recharge cross-section.
Groundwater recharge is important for replenishing of aquifers used as water supplies or for irrigation and for sustaining base flow. Some of the water moving beneath the surface as unsaturated flow (interflow) and saturated flow (groundwater flow) discharges to wetlands, streams, rivers, ponds, lakes and other water bodies, thereby sustaining the base flow of water to those natural resources. Thus, resource areas and drinking water supplies are dependent on groundwater recharge. The amount of groundwater recharge depends on the following factors:
• Quantity of rainfall;
• Soil characteristics (some soils are highly permeable, while other soils have a low infiltration capacity);
• Surface cover (vegetated surfaces help promote infiltration, whereas
impervious surfaces such as pavements and roofs prevent water from penetrating the ground surface); and
• The amount of water that may be stored on the surface during a
rainfall event (such as depression storage) and that remains available for infiltration for a period of time during or after the event.
www.PDHcenter.com PDH Course H144 www.PDHonline.org
© Patrick C. Garner Page 9 of 39
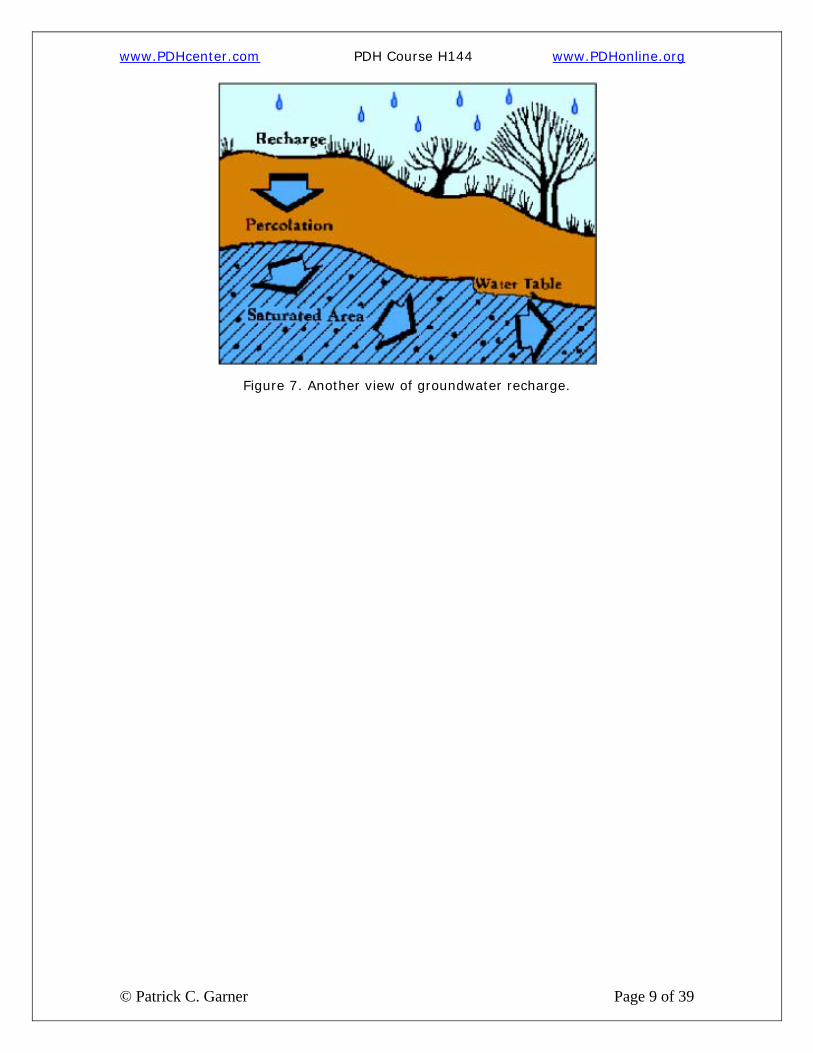
Figure 7. Another view of groundwater recharge.

www.PDHcenter.com PDH Course H144 www.PDHonline.org
© Patrick C. Garner Page 10 of 39
2.0 HYDROLOGY SPECIFICS Surface hydrology analysis considers rainfall and the resultant surface flows from that precipitation. Surface runoff flows, volumes and how they interact with the earth’s surface provide the core data to evaluate and size storm sewers and culverts, detention and retention ponds, and open channels. RAINFALL Determining rainfall data is a fundamental requirement to calculate stormwater quantities and other information. Note that precipitation is usually measured in inches of depth (or watershed inches). Rainfall Characteristics Depending on the method used for estimating runoff, certain information is needed to determine depth (or volume). The following precipitation information is required:
• Design frequency of the event (that is, 2-year, 10-year, or 100-year frequency storms); and
• The duration of the event. For example, with the Rational Method (discussed below), the rainfall duration is considered equal in length to the time of concentration. NRCS studies often use a 24-hour event.
Other considerations are the area (or watershed), the recurrence interval of the rainfall amount, and the temporal and spatial distributions of rainfall. Figure 7 below shows differences in rainfall distribution across the United States. To fully describe a precipitation event, four parameters are used. They are: (1) the amount (2) the duration; (3) the distribution; and (4) the return frequency. For example, a fully described storm would be: 5.3 inches of rain for a 24-hour duration, having a type III distribution and a return frequency of 10 years.
www.PDHcenter.com PDH Course H144 www.PDHonline.org
© Patrick C. Garner Page 11 of 39
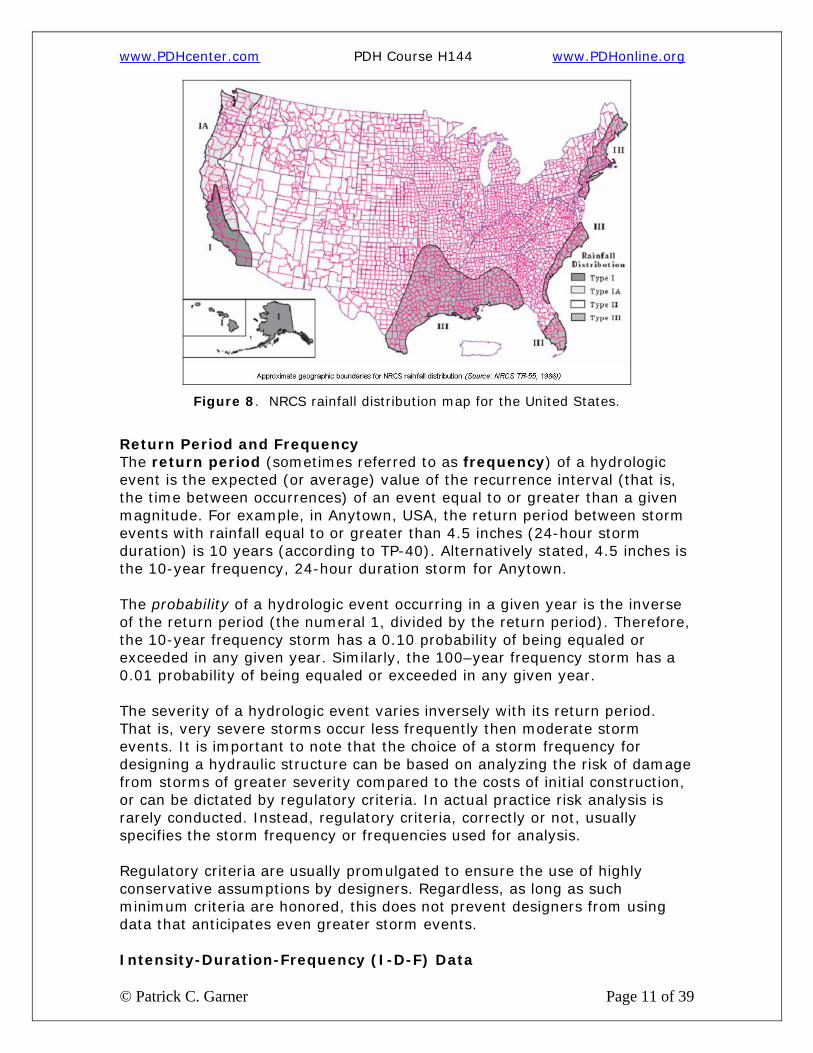
Figure 8. NRCS rainfall distribution map for the United States.
Return Period and Frequency The return period (sometimes referred to as frequency) of a hydrologic event is the expected (or average) value of the recurrence interval (that is, the time between occurrences) of an event equal to or greater than a given magnitude. For example, in Anytown, USA, the return period between storm events with rainfall equal to or greater than 4.5 inches (24-hour storm duration) is 10 years (according to TP-40). Alternatively stated, 4.5 inches is the 10-year frequency, 24-hour duration storm for Anytown. The probability of a hydrologic event occurring in a given year is the inverse of the return period (the numeral 1, divided by the return period). Therefore, the 10-year frequency storm has a 0.10 probability of being equaled or exceeded in any given year. Similarly, the 100–year frequency storm has a 0.01 probability of being equaled or exceeded in any given year. The severity of a hydrologic event varies inversely with its return period. That is, very severe storms occur less frequently then moderate storm events. It is important to note that the choice of a storm frequency for designing a hydraulic structure can be based on analyzing the risk of damage from storms of greater severity compared to the costs of initial construction, or can be dictated by regulatory criteria. In actual practice risk analysis is rarely conducted. Instead, regulatory criteria, correctly or not, usually specifies the storm frequency or frequencies used for analysis. Regulatory criteria are usually promulgated to ensure the use of highly conservative assumptions by designers. Regardless, as long as such minimum criteria are honored, this does not prevent designers from using data that anticipates even greater storm events. Intensity-Duration-Frequency (I-D-F) Data
www.PDHcenter.com PDH Course H144 www.PDHonline.org
© Patrick C. Garner Page 12 of 39
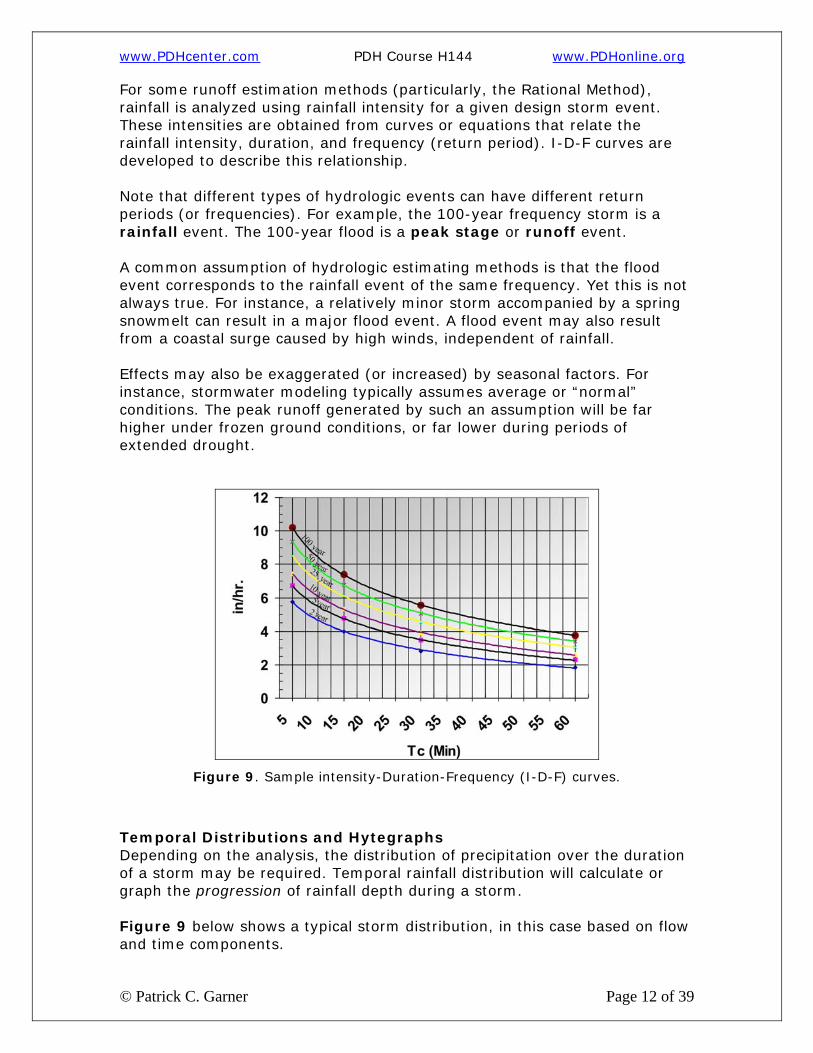
For some runoff estimation methods (particularly, the Rational Method), rainfall is analyzed using rainfall intensity for a given design storm event. These intensities are obtained from curves or equations that relate the rainfall intensity, duration, and frequency (return period). I-D-F curves are developed to describe this relationship. Note that different types of hydrologic events can have different return periods (or frequencies). For example, the 100-year frequency storm is a rainfall event. The 100-year flood is a peak stage or runoff event. A common assumption of hydrologic estimating methods is that the flood event corresponds to the rainfall event of the same frequency. Yet this is not always true. For instance, a relatively minor storm accompanied by a spring snowmelt can result in a major flood event. A flood event may also result from a coastal surge caused by high winds, independent of rainfall. Effects may also be exaggerated (or increased) by seasonal factors. For instance, stormwater modeling typically assumes average or “normal” conditions. The peak runoff generated by such an assumption will be far higher under frozen ground conditions, or far lower during periods of extended drought.
Figure 9. Sample intensity-Duration-Frequency (I-D-F) curves.
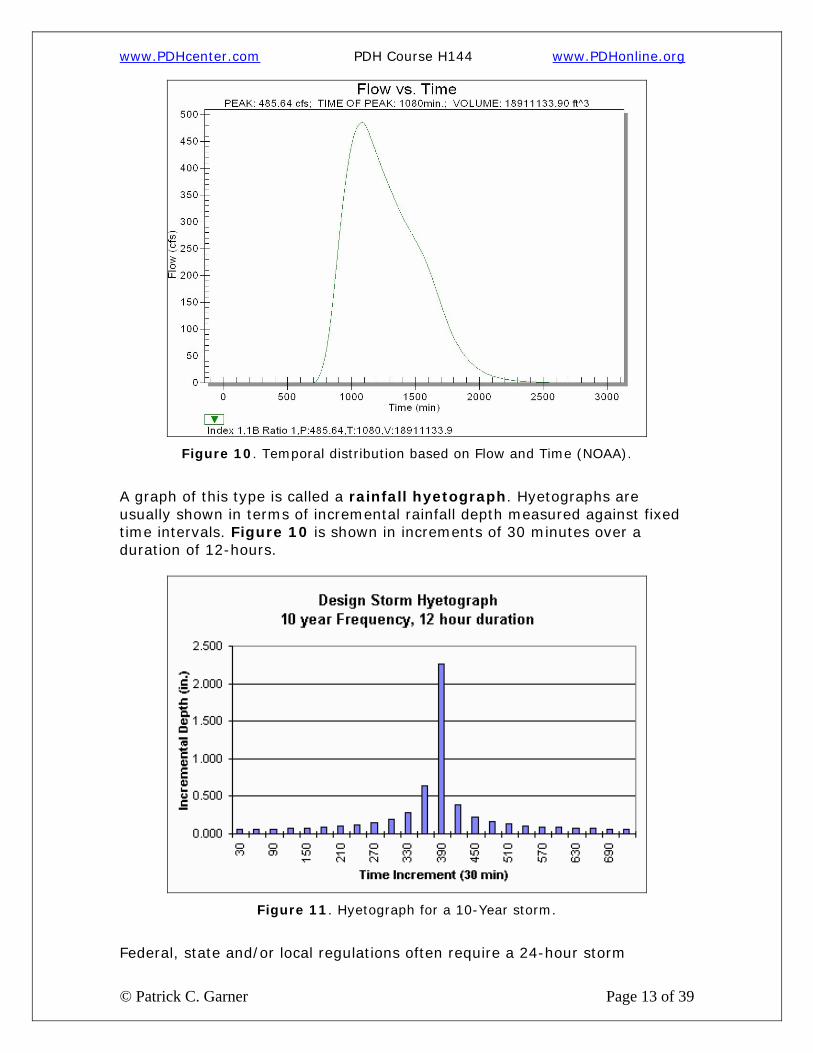
Temporal Distributions and Hytegraphs Depending on the analysis, the distribution of precipitation over the duration of a storm may be required. Temporal rainfall distribution will calculate or graph the progression of rainfall depth during a storm. Figure 9 below shows a typical storm distribution, in this case based on flow and time components.
www.PDHcenter.com PDH Course H144 www.PDHonline.org
© Patrick C. Garner Page 13 of 39
Figure 10. Temporal distribution based on Flow and Time (NOAA).
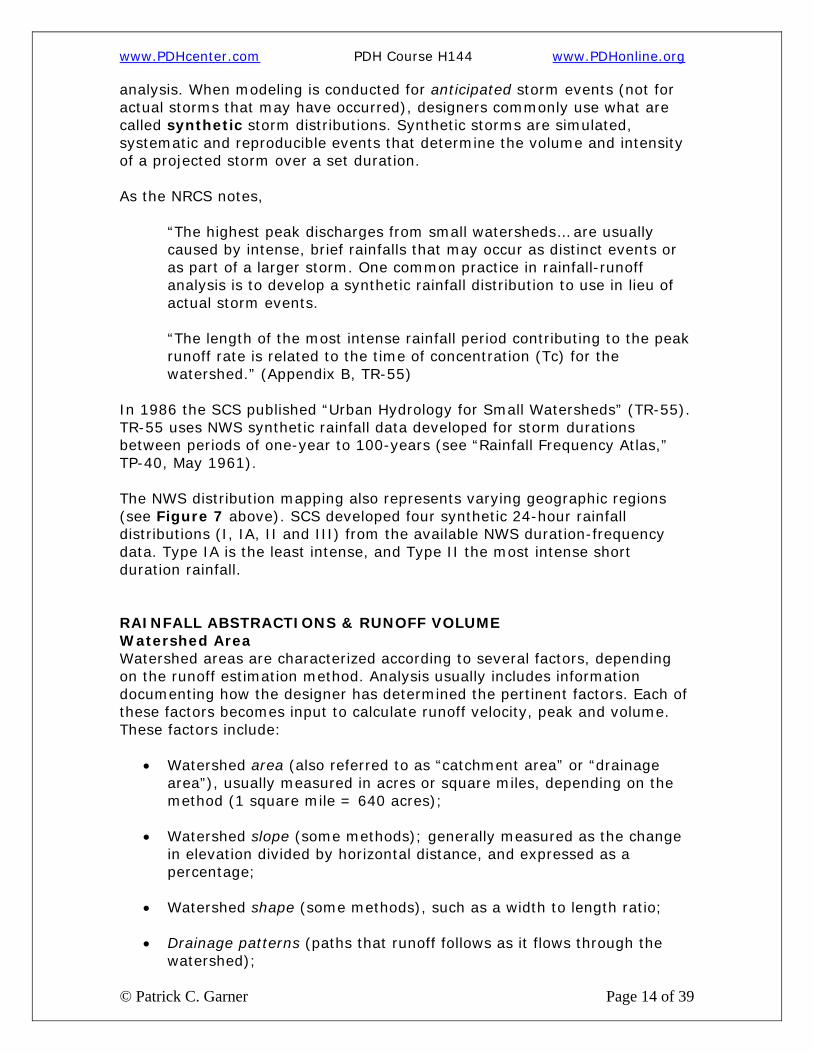
A graph of this type is called a rainfall hyetograph. Hyetographs are usually shown in terms of incremental rainfall depth measured against fixed time intervals. Figure 10 is shown in increments of 30 minutes over a duration of 12-hours.
Figure 11. Hyetograph for a 10-Year storm.
Federal, state and/or local regulations often require a 24-hour storm
www.PDHcenter.com PDH Course H144 www.PDHonline.org
© Patrick C. Garner Page 14 of 39
analysis. When modeling is conducted for anticipated storm events (not for actual storms that may have occurred), designers commonly use what are called synthetic storm distributions. Synthetic storms are simulated, systematic and reproducible events that determine the volume and intensity of a projected storm over a set duration. As the NRCS notes,
“The highest peak discharges from small watersheds… are usually caused by intense, brief rainfalls that may occur as distinct events or as part of a larger storm. One common practice in rainfall-runoff analysis is to develop a synthetic rainfall distribution to use in lieu of actual storm events. “The length of the most intense rainfall period contributing to the peak runoff rate is related to the time of concentration (Tc) for the watershed.” (Appendix B, TR-55)
In 1986 the SCS published “Urban Hydrology for Small Watersheds” (TR-55). TR-55 uses NWS synthetic rainfall data developed for storm durations between periods of one-year to 100-years (see “Rainfall Frequency Atlas,” TP-40, May 1961). The NWS distribution mapping also represents varying geographic regions (see Figure 7 above). SCS developed four synthetic 24-hour rainfall distributions (I, IA, II and III) from the available NWS duration-frequency data. Type IA is the least intense, and Type II the most intense short duration rainfall. RAINFALL ABSTRACTIONS & RUNOFF VOLUME Watershed Area Watershed areas are characterized according to several factors, depending on the runoff estimation method. Analysis usually includes information documenting how the designer has determined the pertinent factors. Each of these factors becomes input to calculate runoff velocity, peak and volume. These factors include:
• Watershed area (also referred to as “catchment area” or “drainage area”), usually measured in acres or square miles, depending on the method (1 square mile = 640 acres);
• Watershed slope (some methods); generally measured as the change
in elevation divided by horizontal distance, and expressed as a percentage;
• Watershed shape (some methods), such as a width to length ratio;
• Drainage patterns (paths that runoff follows as it flows through the
watershed);

www.PDHcenter.com PDH Course H144 www.PDHonline.org
© Patrick C. Garner Page 15 of 39
• Soil characteristics of the watershed; and
• Land-use cover types of the watershed.
Many of these factors will be described later in the course.
Figure 12. Watershed is shown as a white polygon.
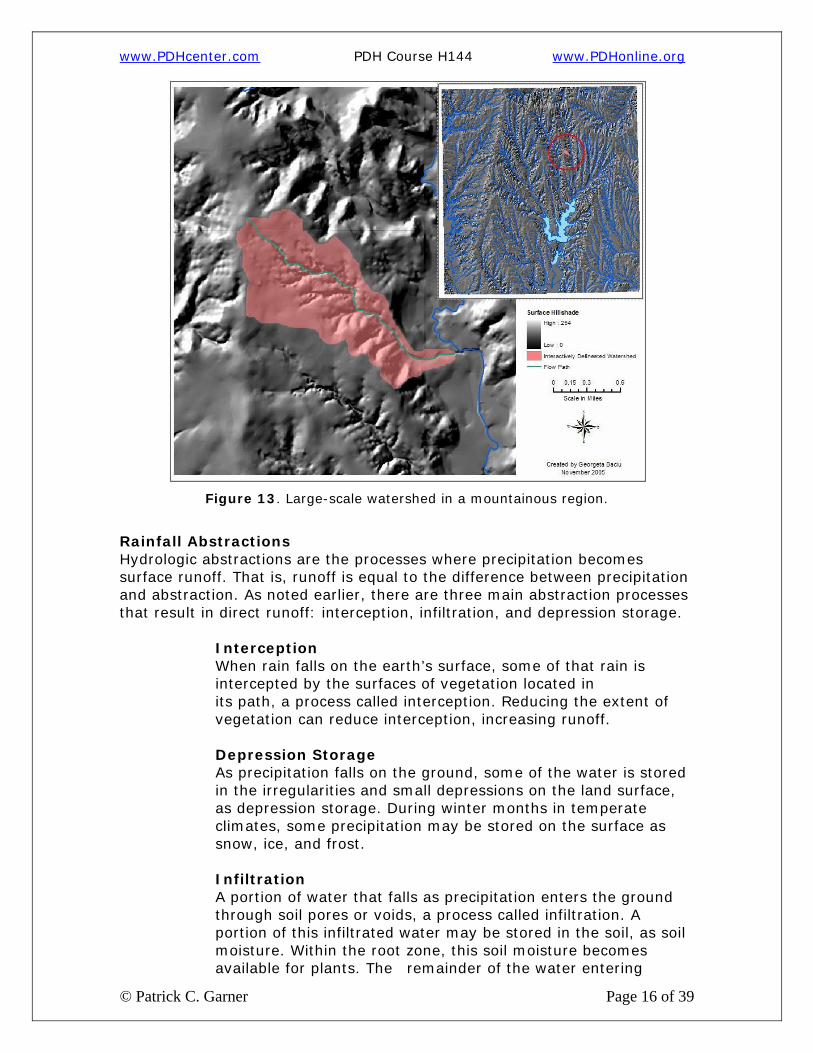
Figure 12 shows a watershed in a moderately developed area. Streams and ponds are depicted, as well as land-use cover types and watershed shape. Drainage patterns and areas of impervious cover may be determined from this type of mapping. Figure 13 below shows a far larger watershed in a mountainous region. Using topographic GIS data for the same watershed, a designer could determine watershed area, watershed slope and probable runoff paths.
www.PDHcenter.com PDH Course H144 www.PDHonline.org
© Patrick C. Garner Page 16 of 39
Figure 13. Large-scale watershed in a mountainous region.
Rainfall Abstractions Hydrologic abstractions are the processes where precipitation becomes surface runoff. That is, runoff is equal to the difference between precipitation and abstraction. As noted earlier, there are three main abstraction processes that result in direct runoff: interception, infiltration, and depression storage. Interception When rain falls on the earth’s surface, some of that rain is intercepted by the surfaces of vegetation located in its path, a process called interception. Reducing the extent of vegetation can reduce interception, increasing runoff. Depression Storage As precipitation falls on the ground, some of the water is stored in the irregularities and small depressions on the land surface, as depression storage. During winter months in temperate climates, some precipitation may be stored on the surface as snow, ice, and frost. Infiltration
A portion of water that falls as precipitation enters the ground through soil pores or voids, a process called infiltration. A portion of this infiltrated water may be stored in the soil, as soil moisture. Within the root zone, this soil moisture becomes available for plants. The remainder of the water entering
www.PDHcenter.com PDH Course H144 www.PDHonline.org
© Patrick C. Garner Page 17 of 39
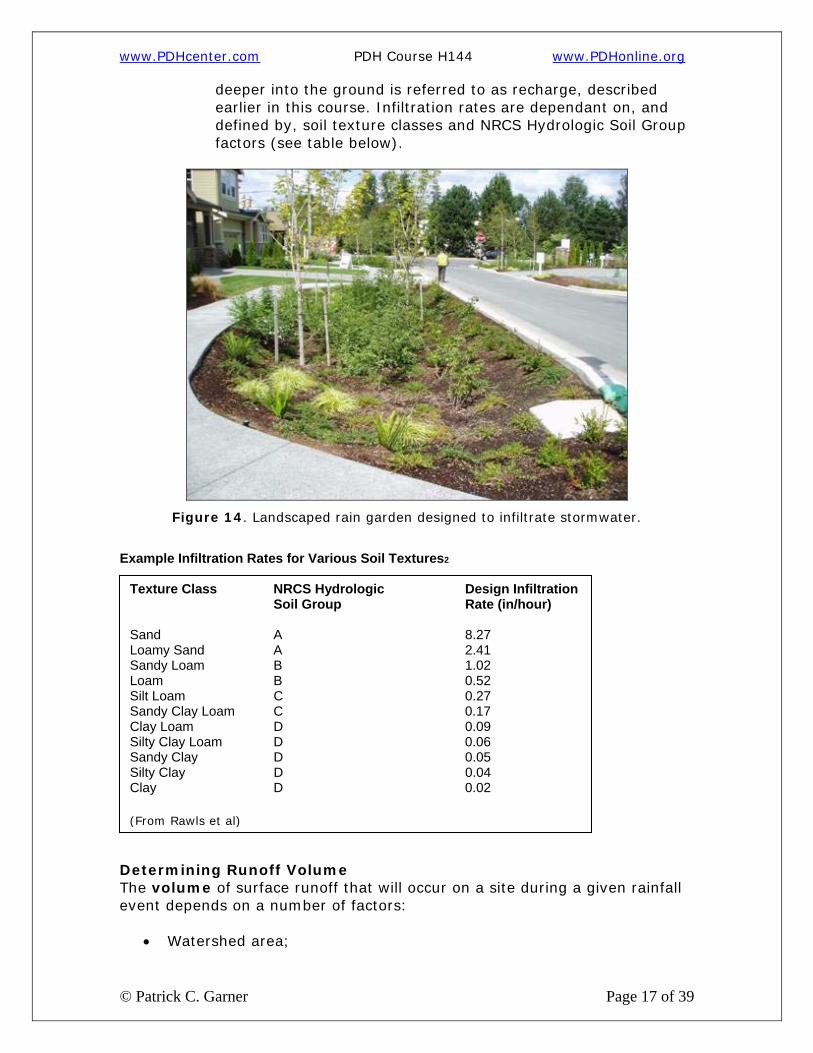
deeper into the ground is referred to as recharge, described earlier in this course. Infiltration rates are dependant on, and defined by, soil texture classes and NRCS Hydrologic Soil Group factors (see table below).
Figure 14. Landscaped rain garden designed to infiltrate stormwater.
Example Infiltration Rates for Various Soil Textures2
Determining Runoff Volume The volume of surface runoff that will occur on a site during a given rainfall event depends on a number of factors:
• Watershed area;
Texture Class NRCS Hydrologic Design Infiltration Soil Group Rate (in/hour) Sand A 8.27 Loamy Sand A 2.41 Sandy Loam B 1.02 Loam B 0.52 Silt Loam C 0.27 Sandy Clay Loam C 0.17 Clay Loam D 0.09 Silty Clay Loam D 0.06 Sandy Clay D 0.05 Silty Clay D 0.04 Clay D 0.02 (From Rawls et al)
www.PDHcenter.com PDH Course H144 www.PDHonline.org
© Patrick C. Garner Page 18 of 39
• Amount of precipitation;
• Rainfall event duration and intensity (volume per unit of time);
• Surface soils characteristics; and
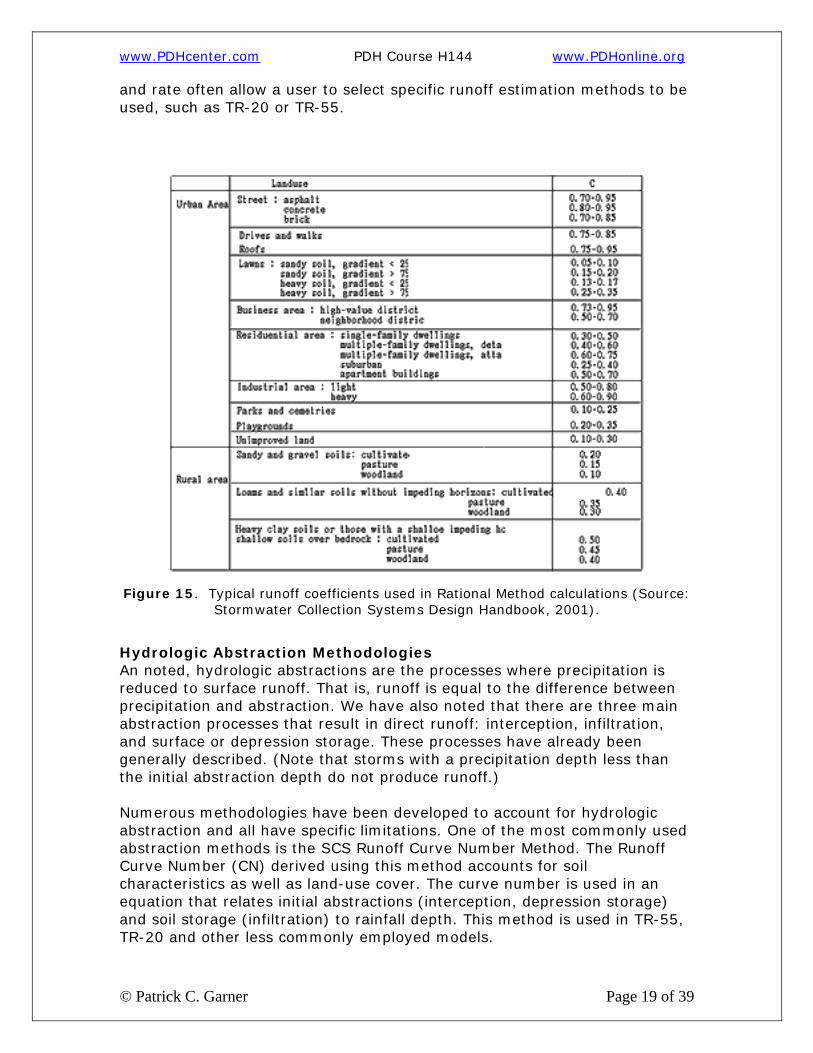
• Land-use surface cover. Runoff volumes are generally estimated in terms of “watershed inches”, cubic feet (ft3), or acre-feet. A “watershed inch” is equivalent to a one-inch depth of water spread over the entire contributing watershed. An “acre-foot” is equivalent to one foot of water spread over an acre of area. Runoff Coefficient Runoff coefficients (C) are associated with the Rational Method. The Rational Method runoff coefficient indirectly accounts for abstractions, and also accounts for the diffusion of runoff. Diffusion is the process where runoff spreads over the surface as it flows toward an outlet. The Rational Method coefficient C therefore represents a “runoff rate coefficient”, and does not represent a percentage of rainfall. For this reason, the Rational Method is of limited use in estimating volumes of runoff, or in developing hydrographs. Another way of expressing this is: C = Runoff coefficient, which is an empirical coefficient representing a relationship between rainfall and runoff. See Figure 15 for a table of C-values for urban areas. Complete tables of C-values are listed in many hydrology and civil engineering texts, some of which are referenced at the end of this course. NRCS (SCS) Curve Number Method This method is described in detail in the SCS National Engineering Handbook, Section 4–Hydrology, and is frequently required by federal, state or local agencies to estimate runoff volumes and rates, assuming the necessary underlying assumptions of the SCS models are satisfied. The SCS developed this method, as well as the following models that use the method:
• TR-20: Computer Program for Project Formulation, Hydrology (SCS)
• TR-55: Urban Hydrology for Small Watersheds (SCS). This method is a simplified procedure that does not require the use of a computer; it is based on TR-20.
Please note that proprietary computer software for estimating runoff volume
www.PDHcenter.com PDH Course H144 www.PDHonline.org
© Patrick C. Garner Page 19 of 39
and rate often allow a user to select specific runoff estimation methods to be used, such as TR-20 or TR-55.
Figure 15. Typical runoff coefficients used in Rational Method calculations (Source:
Stormwater Collection Systems Design Handbook, 2001).
Hydrologic Abstraction Methodologies An noted, hydrologic abstractions are the processes where precipitation is reduced to surface runoff. That is, runoff is equal to the difference between precipitation and abstraction. We have also noted that there are three main abstraction processes that result in direct runoff: interception, infiltration, and surface or depression storage. These processes have already been generally described. (Note that storms with a precipitation depth less than the initial abstraction depth do not produce runoff.) Numerous methodologies have been developed to account for hydrologic abstraction and all have specific limitations. One of the most commonly used abstraction methods is the SCS Runoff Curve Number Method. The Runoff Curve Number (CN) derived using this method accounts for soil characteristics as well as land-use cover. The curve number is used in an equation that relates initial abstractions (interception, depression storage) and soil storage (infiltration) to rainfall depth. This method is used in TR-55, TR-20 and other less commonly employed models.
www.PDHcenter.com PDH Course H144 www.PDHonline.org
© Patrick C. Garner Page 20 of 39
Soil Group Soil characteristics affect the volume and rate of storm runoff. Some hydrologic estimating methods specifically account for soil types (for instance, the SCS Runoff Curve Number method used in TR-55 and TR-20); others may not (some references for the runoff coefficient used in the Rational Method do not relate the coefficient to soil type). The choice of a hydrologic model for a specific application may be governed by the extent to which the model accounts for soil conditions. An extensive description of soil characteristics and relationship to hydrology is not offered here. However, many related runoff models use the NRCS classification of soils by Hydrologic Soil Group in the estimation of runoff volume, so this classification is explained below. NRCS Soil Surveys, generally available for most of the United States, classify soils by soil type. Each type has a corresponding Hydrologic Soil Group (HSG), except for unclassified urban or disturbed soils. If the NRCS has not classified soils for a particular site, an on-site soil investigation should be performed. The HSG reflects the infiltration rate of the soil, the permeability of any restrictive layers, and the potential moisture capacity of the soil to a depth of 60-inches. The infiltration rate of the soil affects runoff. Generally, the higher the rate of infiltration, the lower the quantity of stormwater runoff (that is, rapid permeability leaves little time for runoff treatment). Fine soils such as clays produce a greater rate of runoff than coarse-grained soils like sand. The hydrologic soils groups are defined by NEH-4 follows:
• HSG A (Low runoff potential): Soils having a low runoff potential and high infiltration rates even when thoroughly wetted. These soils consist of deep, well to excessively drained sands or gravels having a high rate of water transmission.
• HSG B: Soils having moderate infiltration rates when thoroughly
wetted. These soils consist of moderately deep to deep, moderately well to well-drained soils with moderately fine to moderately coarse textures having a moderate rate of water transmission.
• HSG C: Soils having slow infiltration rates when thoroughly wetted and
consisting chiefly of soils with a layer that impedes downward movement of water, or soils with moderately fine to fine textures. C-type soils have a slow rate of water transmission.
• HSG D (High runoff potential): Soils having very slow infiltration rates
when thoroughly wetted and consisting chiefly of clay soils with a high swelling potential, soils with a permanent high water table, soils with a clay pan or clay layer at or near the surface, and shallow soils over nearly impervious material. D-type soils have a very slow rate of water transmission. Note that hydric soils generally fall into this category, and are commonly found in swamps and deep wetland areas.
www.PDHcenter.com PDH Course H144 www.PDHonline.org
© Patrick C. Garner Page 21 of 39
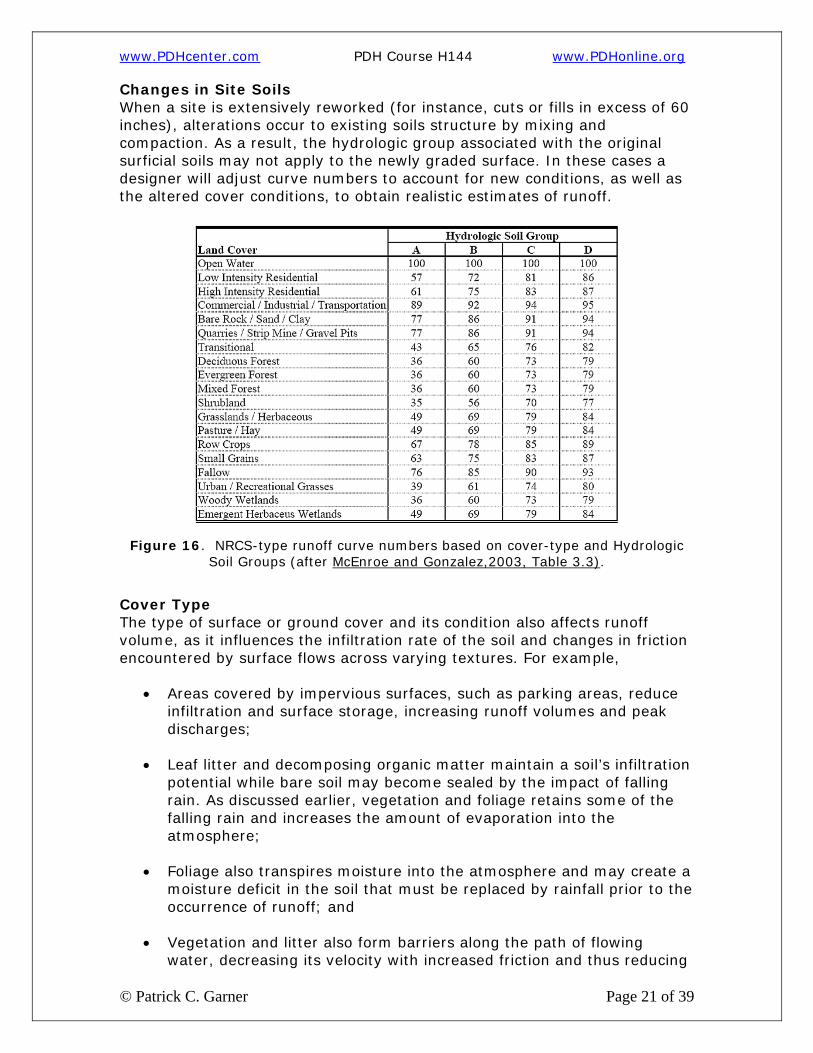
Changes in Site Soils When a site is extensively reworked (for instance, cuts or fills in excess of 60 inches), alterations occur to existing soils structure by mixing and compaction. As a result, the hydrologic group associated with the original surficial soils may not apply to the newly graded surface. In these cases a designer will adjust curve numbers to account for new conditions, as well as the altered cover conditions, to obtain realistic estimates of runoff.
Figure 16. NRCS-type runoff curve numbers based on cover-type and Hydrologic
Soil Groups (after McEnroe and Gonzalez,2003, Table 3.3).
Cover Type The type of surface or ground cover and its condition also affects runoff volume, as it influences the infiltration rate of the soil and changes in friction encountered by surface flows across varying textures. For example,
• Areas covered by impervious surfaces, such as parking areas, reduce infiltration and surface storage, increasing runoff volumes and peak discharges;
• Leaf litter and decomposing organic matter maintain a soil’s infiltration
potential while bare soil may become sealed by the impact of falling rain. As discussed earlier, vegetation and foliage retains some of the falling rain and increases the amount of evaporation into the atmosphere;
• Foliage also transpires moisture into the atmosphere and may create a
moisture deficit in the soil that must be replaced by rainfall prior to the occurrence of runoff; and
• Vegetation and litter also form barriers along the path of flowing
water, decreasing its velocity with increased friction and thus reducing

www.PDHcenter.com PDH Course H144 www.PDHonline.org
© Patrick C. Garner Page 22 of 39
the peak rate of runoff. This so-called “duff layer” also maintains the microtopography of the natural surface.
Hydrologic Condition This term is simply used to describe the existing and proposed physical conditions on a site, including whenever curve numbers are composites, and whether the sub-watersheds are homogenous or heterogeneous.
• A common error is to use a curve number corresponding to “Woods in poor hydrologic condition”. Most woods have forest litter and brush covering the soil, and should be considered in “good hydrologic condition”. A few trails on the forest floor should not change this.
• Another common error when there are multiple sub-watersheds and
when the hydrologic conditions within the sub-watersheds are not homogenous is the development of a composited curve number. In accordance with the procedures outlined in TR-55, curve numbers should only be composited between sub-watersheds if hydrologic conditions are homogenous.
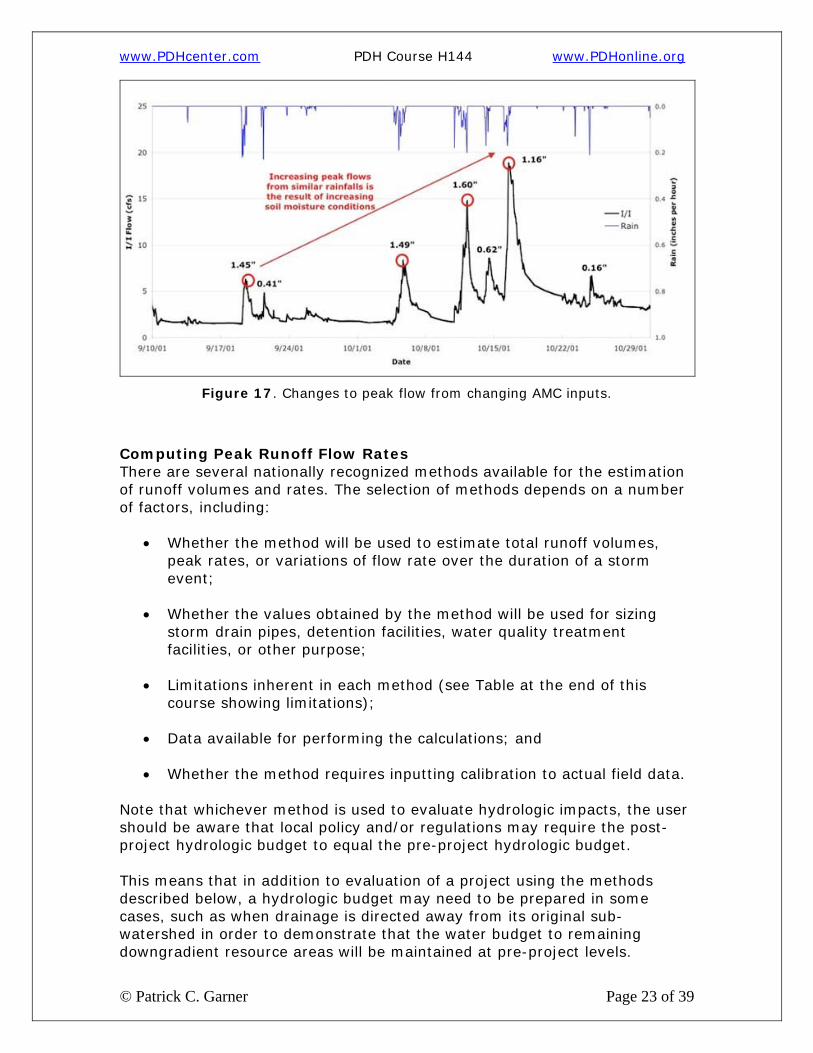
Antecedent Moisture Condition Antecedent Moisture Condition (AMC) is a qualitative indication of the moisture content of surficial soils at the beginning of a storm event. AMC is generally shown as condition I, II or III, with I being dry, II being normal and III being wetter. AMC II is generally used for design analysis. The adjustment of curve numbers to account for dry or wet conditions is normally only applicable when analyzing a particular event “after the fact”, or for some other specialized study. Always be cognizant that using an AMC II yields “normal” projections, not worst-case moisture as might occur following lengthy periods of precipitation.
www.PDHcenter.com PDH Course H144 www.PDHonline.org
© Patrick C. Garner Page 23 of 39
Figure 17. Changes to peak flow from changing AMC inputs.
Computing Peak Runoff Flow Rates There are several nationally recognized methods available for the estimation of runoff volumes and rates. The selection of methods depends on a number of factors, including:
• Whether the method will be used to estimate total runoff volumes, peak rates, or variations of flow rate over the duration of a storm event;
• Whether the values obtained by the method will be used for sizing
storm drain pipes, detention facilities, water quality treatment facilities, or other purpose;
• Limitations inherent in each method (see Table at the end of this
course showing limitations);
• Data available for performing the calculations; and
• Whether the method requires inputting calibration to actual field data. Note that whichever method is used to evaluate hydrologic impacts, the user should be aware that local policy and/or regulations may require the post-project hydrologic budget to equal the pre-project hydrologic budget. This means that in addition to evaluation of a project using the methods described below, a hydrologic budget may need to be prepared in some cases, such as when drainage is directed away from its original sub-watershed in order to demonstrate that the water budget to remaining downgradient resource areas will be maintained at pre-project levels.
www.PDHcenter.com PDH Course H144 www.PDHonline.org
© Patrick C. Garner Page 24 of 39
The methods most commonly used to evaluate and to design components of stormwater management systems are:
• The Rational Method
• The SCS Curve Number/Unit Hydrograph Method (including both TR-55 and TR-20.
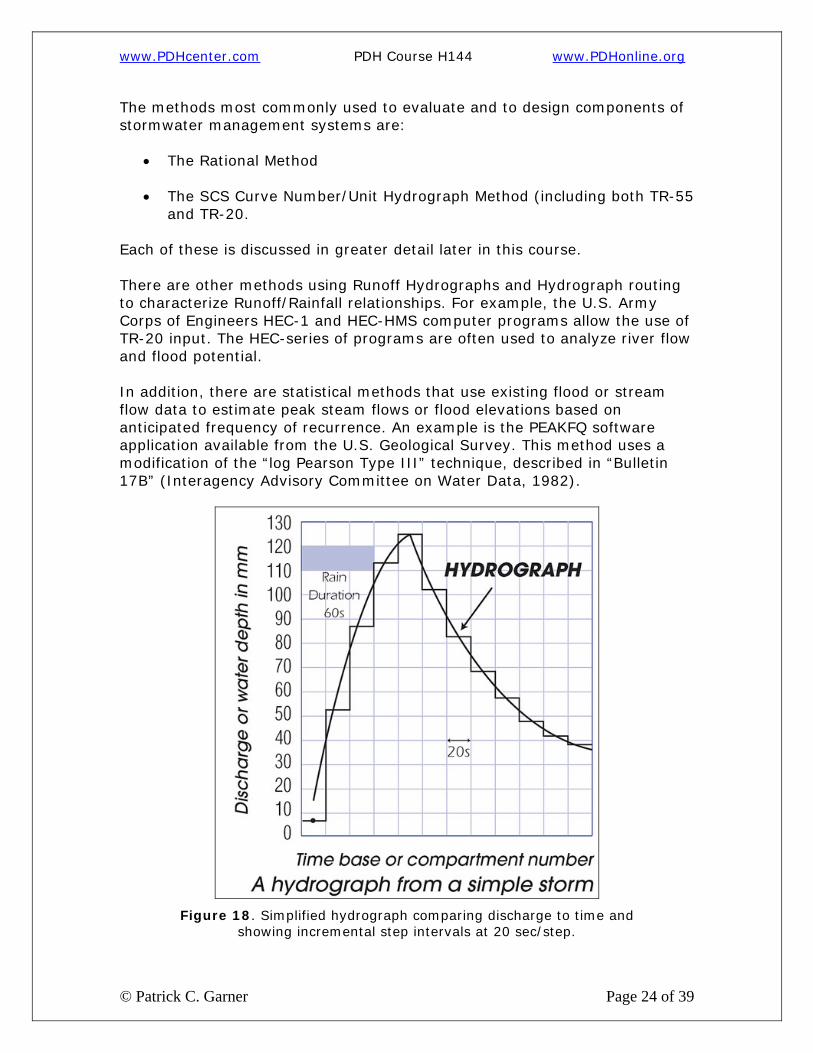
Each of these is discussed in greater detail later in this course. There are other methods using Runoff Hydrographs and Hydrograph routing to characterize Runoff/Rainfall relationships. For example, the U.S. Army Corps of Engineers HEC-1 and HEC-HMS computer programs allow the use of TR-20 input. The HEC-series of programs are often used to analyze river flow and flood potential. In addition, there are statistical methods that use existing flood or stream flow data to estimate peak steam flows or flood elevations based on anticipated frequency of recurrence. An example is the PEAKFQ software application available from the U.S. Geological Survey. This method uses a modification of the “log Pearson Type III” technique, described in “Bulletin 17B” (Interagency Advisory Committee on Water Data, 1982).
Figure 18. Simplified hydrograph comparing discharge to time and
showing incremental step intervals at 20 sec/step.
www.PDHcenter.com PDH Course H144 www.PDHonline.org
© Patrick C. Garner Page 25 of 39
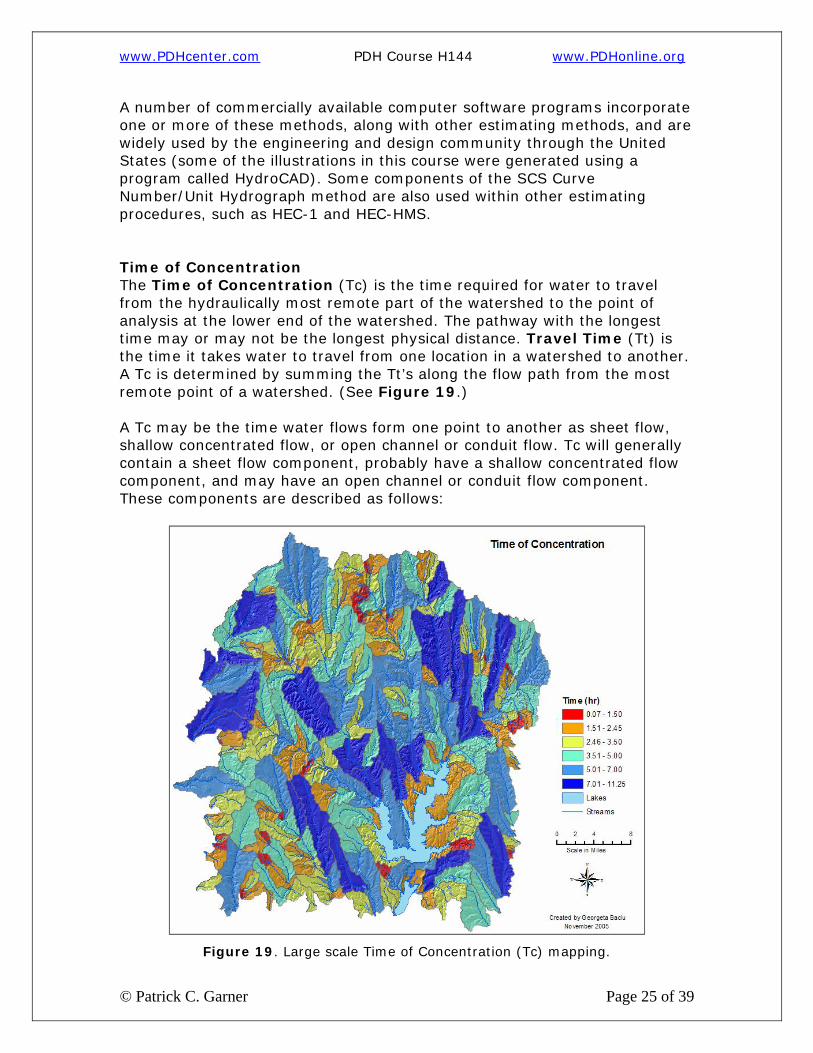
A number of commercially available computer software programs incorporate one or more of these methods, along with other estimating methods, and are widely used by the engineering and design community through the United States (some of the illustrations in this course were generated using a program called HydroCAD). Some components of the SCS Curve Number/Unit Hydrograph method are also used within other estimating procedures, such as HEC-1 and HEC-HMS. Time of Concentration The Time of Concentration (Tc) is the time required for water to travel from the hydraulically most remote part of the watershed to the point of analysis at the lower end of the watershed. The pathway with the longest time may or may not be the longest physical distance. Travel Time (Tt) is the time it takes water to travel from one location in a watershed to another. A Tc is determined by summing the Tt’s along the flow path from the most remote point of a watershed. (See Figure 19.) A Tc may be the time water flows form one point to another as sheet flow, shallow concentrated flow, or open channel or conduit flow. Tc will generally contain a sheet flow component, probably have a shallow concentrated flow component, and may have an open channel or conduit flow component. These components are described as follows:
Figure 19. Large scale Time of Concentration (Tc) mapping.
www.PDHcenter.com PDH Course H144 www.PDHonline.org
© Patrick C. Garner Page 26 of 39
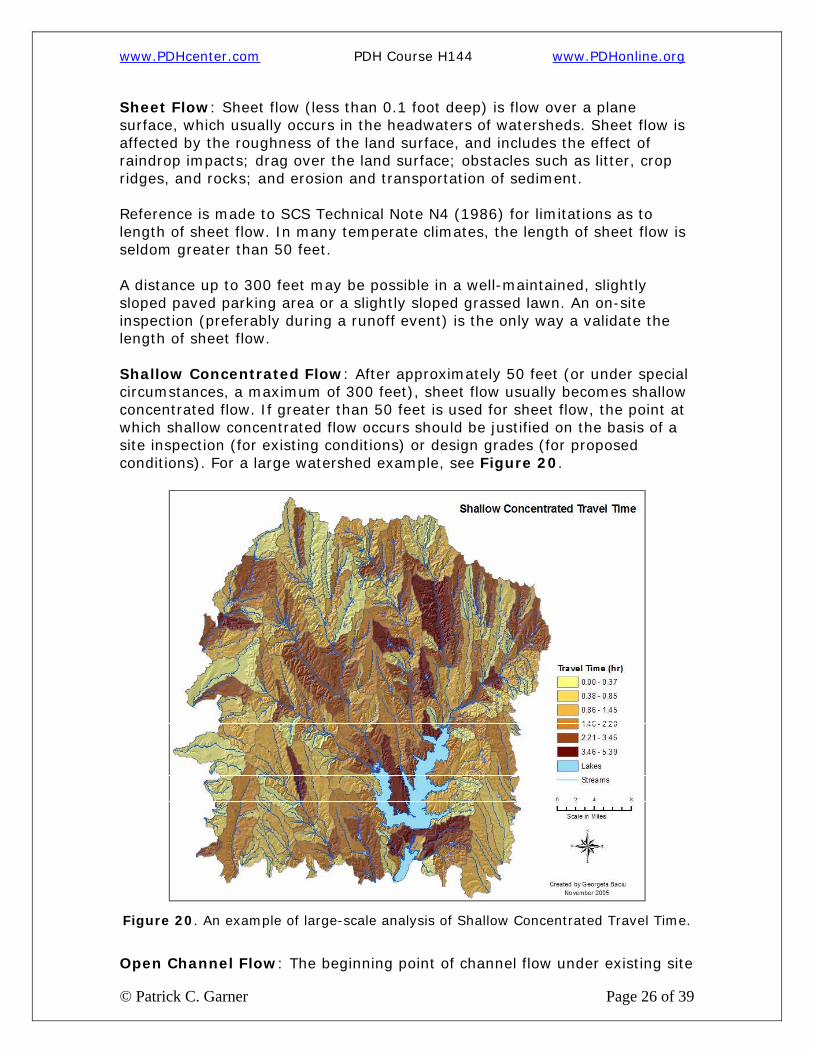
Sheet Flow: Sheet flow (less than 0.1 foot deep) is flow over a plane surface, which usually occurs in the headwaters of watersheds. Sheet flow is affected by the roughness of the land surface, and includes the effect of raindrop impacts; drag over the land surface; obstacles such as litter, crop ridges, and rocks; and erosion and transportation of sediment. Reference is made to SCS Technical Note N4 (1986) for limitations as to length of sheet flow. In many temperate climates, the length of sheet flow is seldom greater than 50 feet. A distance up to 300 feet may be possible in a well-maintained, slightly sloped paved parking area or a slightly sloped grassed lawn. An on-site inspection (preferably during a runoff event) is the only way a validate the length of sheet flow. Shallow Concentrated Flow: After approximately 50 feet (or under special circumstances, a maximum of 300 feet), sheet flow usually becomes shallow concentrated flow. If greater than 50 feet is used for sheet flow, the point at which shallow concentrated flow occurs should be justified on the basis of a site inspection (for existing conditions) or design grades (for proposed conditions). For a large watershed example, see Figure 20.
Figure 20. An example of large-scale analysis of Shallow Concentrated Travel Time.
Open Channel Flow: The beginning point of channel flow under existing site
www.PDHcenter.com PDH Course H144 www.PDHonline.org
© Patrick C. Garner Page 27 of 39
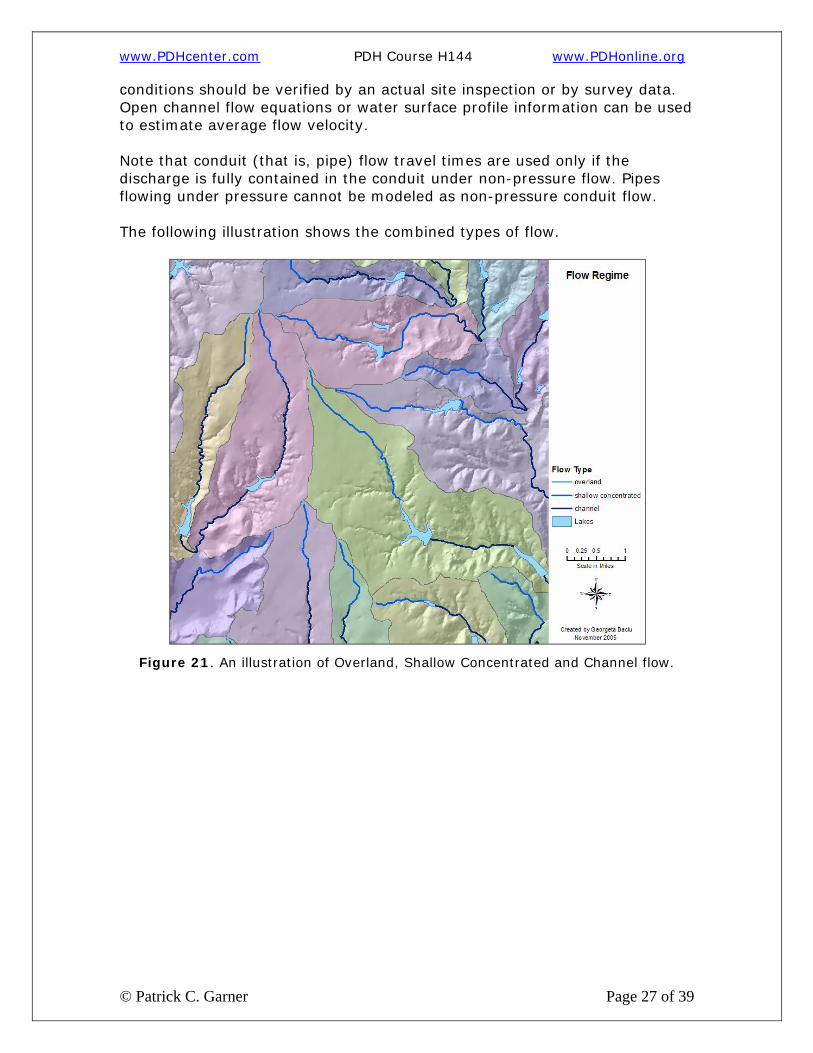
conditions should be verified by an actual site inspection or by survey data. Open channel flow equations or water surface profile information can be used to estimate average flow velocity. Note that conduit (that is, pipe) flow travel times are used only if the discharge is fully contained in the conduit under non-pressure flow. Pipes flowing under pressure cannot be modeled as non-pressure conduit flow. The following illustration shows the combined types of flow.
Figure 21. An illustration of Overland, Shallow Concentrated and Channel flow.
www.PDHcenter.com PDH Course H144 www.PDHonline.org
© Patrick C. Garner Page 28 of 39
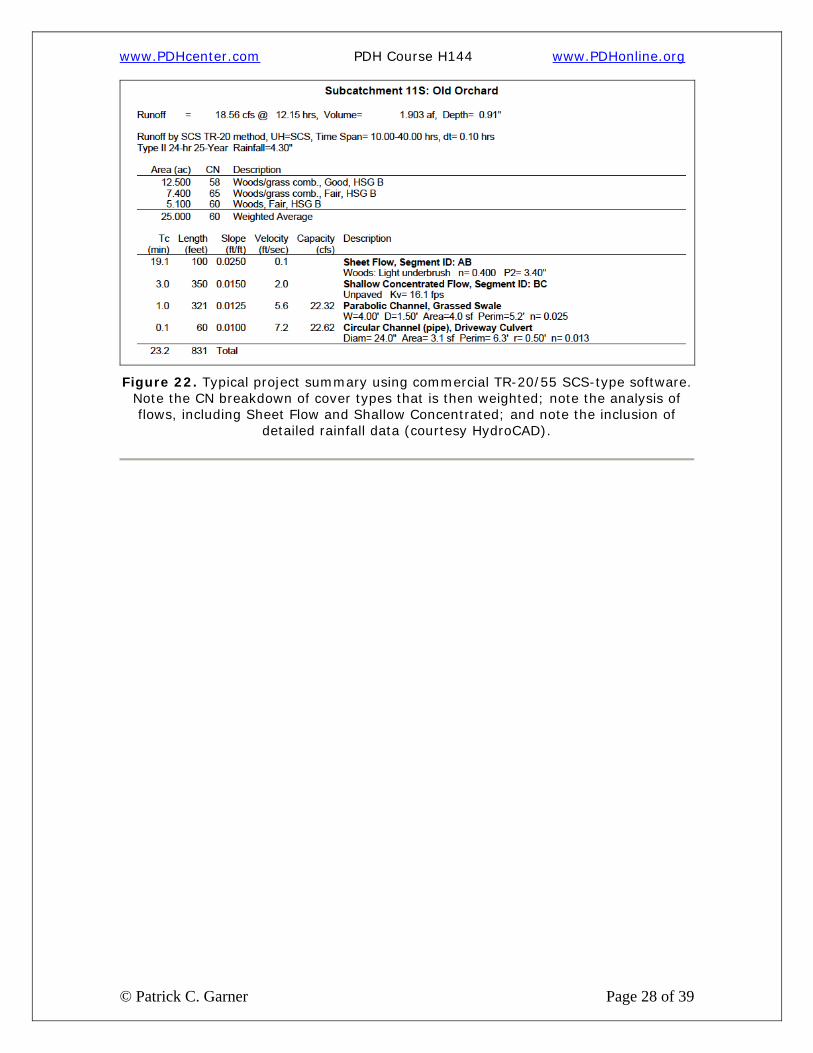
Figure 22. Typical project summary using commercial TR-20/55 SCS-type software.
Note the CN breakdown of cover types that is then weighted; note the analysis of flows, including Sheet Flow and Shallow Concentrated; and note the inclusion of
detailed rainfall data (courtesy HydroCAD).

www.PDHcenter.com PDH Course H144 www.PDHonline.org
© Patrick C. Garner Page 29 of 39
3.0 USING THE RATIONAL METHOD The Rational Method is widely used to calculate the peak storm water runoff rate for a variety of storm water management applications such as estimating peak flows, and to develop designs for conveyance systems such as culverts, piped storm drains, and open channel systems that handle runoff from drainage areas of less than 20 acres. The drainage area, runoff coefficient, and design rainfall intensity are needed for storm water runoff calculation. While there is an adaptation of the rational method that may be used for estimating detention storage volumes, the method is cumbersome to use in comparison to other available modeling tools. Also, it is not generally appropriate for development of peak rate control devices such as detention and retention basins. The classic Rational Formula is expressed as Q = C*i*A where: Q = Peak rate of runoff in cubic feet per second C = Runoff coefficient, an empirical coefficient representing a relationship between rainfall and runoff i = Average intensity of rainfall in inches per hour for the time of concentration (Tc) for a selected frequency of occurrence or return period. (Tc = The rainfall intensity averaging time usually referred to as the time of concentration, equal to the time required for water to flow from the hydraulically most distant point in the watershed to the point of design.) A = The watershed area in acres Note that in this equation, with “i" expressed in inches/hour and A expressed in acres, these units dimensionally yield a resulting “Q” in cubic feet per second (cfs). To calculate Q, a designer follows the following steps:
1. Apply I-D-F Data 2. Determine Watershed Area 3. Determine C Coefficient 4. Calculate Peak Flow
Please review the assumptions and limitations below (Section 5.0) for using this method. In addition to being inapplicable for watersheds greater than 20 acres, it is not recommended for sizing detention/retention facilities.
Rational Method Assumptions (Adapted from Rossmiller, 1980) 1. The peak rate of runoff at any point is a direct function of the tributary drainage area and the average rainfall intensity during the Tc to that point. 2. The return period of the peak discharge rate is the same as the return
www.PDHcenter.com PDH Course H144 www.PDHonline.org
© Patrick C. Garner Page 30 of 39
period of the average rainfall intensity or rainfall event. 3. The rainfall is uniformly distributed over the watershed. 4. The rainfall intensity remains constant during the time period equal to Tc. 5. The relationship between rainfall and runoff is linear. 6. The runoff coefficient, C, is constant for storms of any duration or frequency on the watershed. Note that these Rational Method assumptions represent a simplification of what actually occurs during a rainfall event, and that they therefore limit the use of the method to relatively small, homogeneous land areas. Limitations 1. The Rational Formula only produces one point on the runoff hydrograph, the peak discharge rate. Where a hydrograph is required, other methods must be used. 2. When basins become complex, and where sub-basins combine, the Rational Formula will tend to overestimate the actual flow. The overestimation will result in the over-sizing of stormwater management systems. For this reason, the formula should not be used for larger developments, or as a basis for establishing predevelopment flow rates, which are used to define the restrictions needed for peak rate control. Artificially high estimates could result in release rates higher than existing conditions, resulting in adverse effects downstream. 3. The method assumes that the rainfall intensity is uniform over the entire watershed. This assumption is true only for small watersheds and time periods, thus limiting the use of the formula to small watersheds of less than 20 acres. 4. The results of using the formula are frequently not replicable from user to user. There are considerable variations in interpretation and methodology in the use of the formula. The simplistic approach of the formula permits, and in fact requires, wide latitude of subjective judgment in its application.

www.PDHcenter.com PDH Course H144 www.PDHonline.org
© Patrick C. Garner Page 31 of 39
www.PDHcenter.com PDH Course H144 www.PDHonline.org
© Patrick C. Garner Page 32 of 39
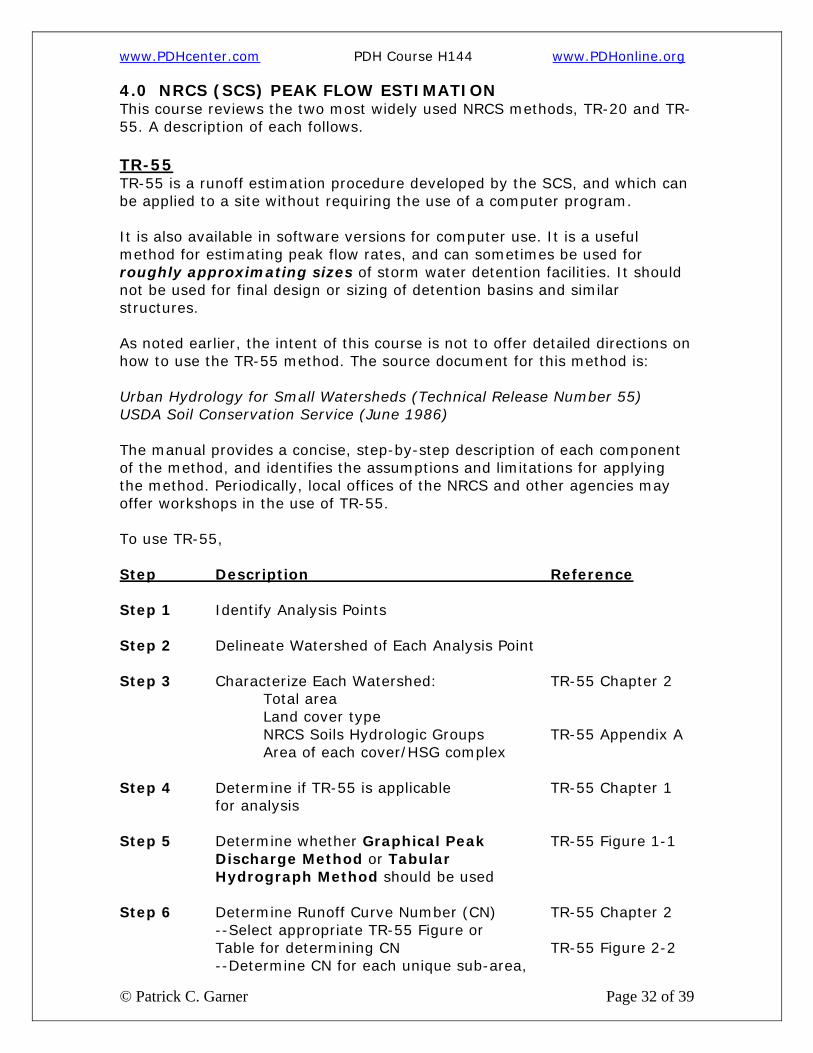
4.0 NRCS (SCS) PEAK FLOW ESTIMATION This course reviews the two most widely used NRCS methods, TR-20 and TR-55. A description of each follows. TR-55 TR-55 is a runoff estimation procedure developed by the SCS, and which can be applied to a site without requiring the use of a computer program. It is also available in software versions for computer use. It is a useful method for estimating peak flow rates, and can sometimes be used for roughly approximating sizes of storm water detention facilities. It should not be used for final design or sizing of detention basins and similar structures. As noted earlier, the intent of this course is not to offer detailed directions on how to use the TR-55 method. The source document for this method is: Urban Hydrology for Small Watersheds (Technical Release Number 55) USDA Soil Conservation Service (June 1986) The manual provides a concise, step-by-step description of each component of the method, and identifies the assumptions and limitations for applying the method. Periodically, local offices of the NRCS and other agencies may offer workshops in the use of TR-55. To use TR-55, Step Description Reference Step 1 Identify Analysis Points Step 2 Delineate Watershed of Each Analysis Point Step 3 Characterize Each Watershed: TR-55 Chapter 2 Total area Land cover type NRCS Soils Hydrologic Groups TR-55 Appendix A Area of each cover/HSG complex Step 4 Determine if TR-55 is applicable TR-55 Chapter 1 for analysis Step 5 Determine whether Graphical Peak TR-55 Figure 1-1 Discharge Method or Tabular Hydrograph Method should be used Step 6 Determine Runoff Curve Number (CN) TR-55 Chapter 2 --Select appropriate TR-55 Figure or Table for determining CN TR-55 Figure 2-2 --Determine CN for each unique sub-area,
www.PDHcenter.com PDH Course H144 www.PDHonline.org
© Patrick C. Garner Page 33 of 39
based on cover/HSG complex --Determine weighted CN for each watershed TR-55 Worksheet 2 Step 7 Determine Volume of Runoff (Q) TR-55 Chapter 2 Step 8 Determine Time of Concentration and Travel Time TR-55 Chapter 3 Step 9 Determine Peak Discharge (q, expressed in cfs) --Graphical Peak Discharge Method TR-55 Chapter 4 --Tabular Hydrograph Method TR-55 Chapter 5 TR-55 Program Assumptions These are complex and varied. A user should refer to primary reference material. Limitations Same as above. Please refer to primary reference material. Also, see Section 6.0 below.)
TR-20 This method is applicable for drainage areas up to 20 square miles. The TR-20 hydrologic model or an equivalent must be used for watershed analysis where any of the following conditions are applicable: 1. Sub-areas are significantly different in size (greater than 5:1 ratio of one sub-area to another), land use (cover), or hydrologic soil groups. 2. An outflow hydrograph from a detention pond is needed. 3. A detention basin has multiple sub-areas in its drainage area, requiring accurate peak discharge values and composite runoff volumes. 4. Multiple detention structures are used either in parallel or in series. 5. Conveyance channel storage is large. 6. Calibration of the model using actual rainfall amounts and distribution is needed. 7. Flow (splitting) diversions are required. 8. Detention basins designed for extended detention are required. Description Of Method The TR-20 Hydrologic Model is a watershed computer model, which uses the
www.PDHcenter.com PDH Course H144 www.PDHonline.org
© Patrick C. Garner Page 34 of 39
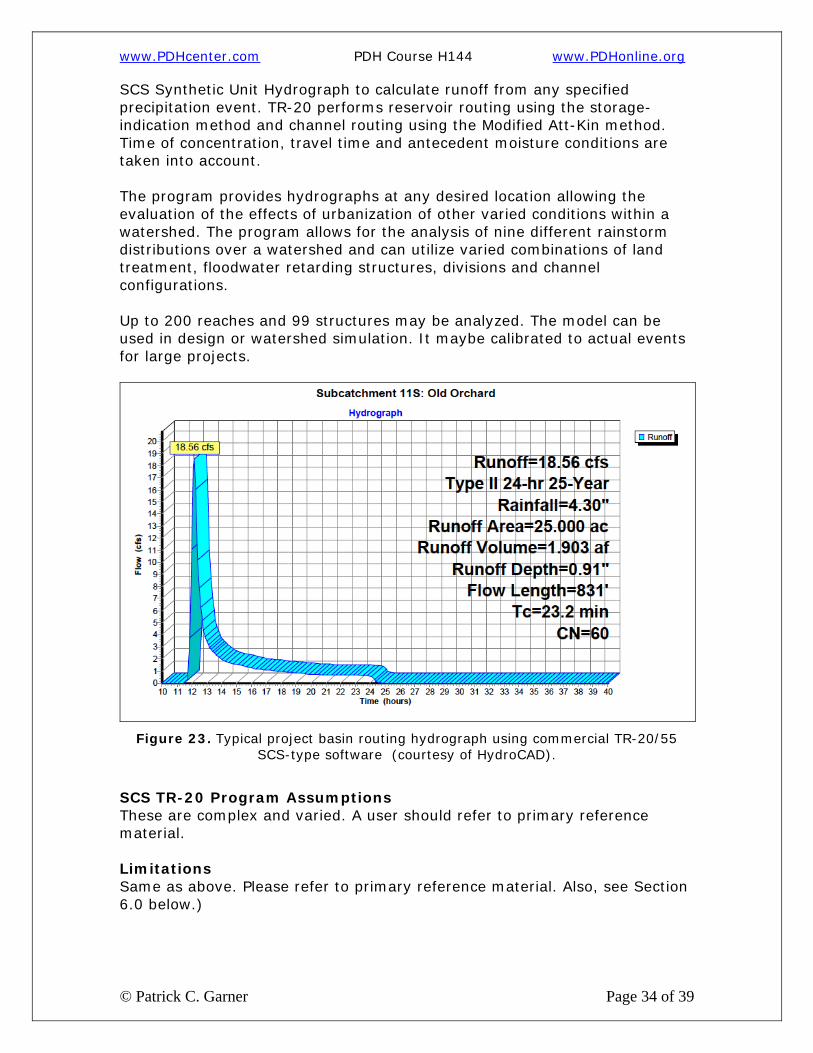
SCS Synthetic Unit Hydrograph to calculate runoff from any specified precipitation event. TR-20 performs reservoir routing using the storage-indication method and channel routing using the Modified Att-Kin method. Time of concentration, travel time and antecedent moisture conditions are taken into account. The program provides hydrographs at any desired location allowing the evaluation of the effects of urbanization of other varied conditions within a watershed. The program allows for the analysis of nine different rainstorm distributions over a watershed and can utilize varied combinations of land treatment, floodwater retarding structures, divisions and channel configurations. Up to 200 reaches and 99 structures may be analyzed. The model can be used in design or watershed simulation. It maybe calibrated to actual events for large projects.
Figure 23. Typical project basin routing hydrograph using commercial TR-20/55
SCS-type software (courtesy of HydroCAD).
SCS TR-20 Program Assumptions These are complex and varied. A user should refer to primary reference material. Limitations Same as above. Please refer to primary reference material. Also, see Section 6.0 below.)
www.PDHcenter.com PDH Course H144 www.PDHonline.org
© Patrick C. Garner Page 35 of 39
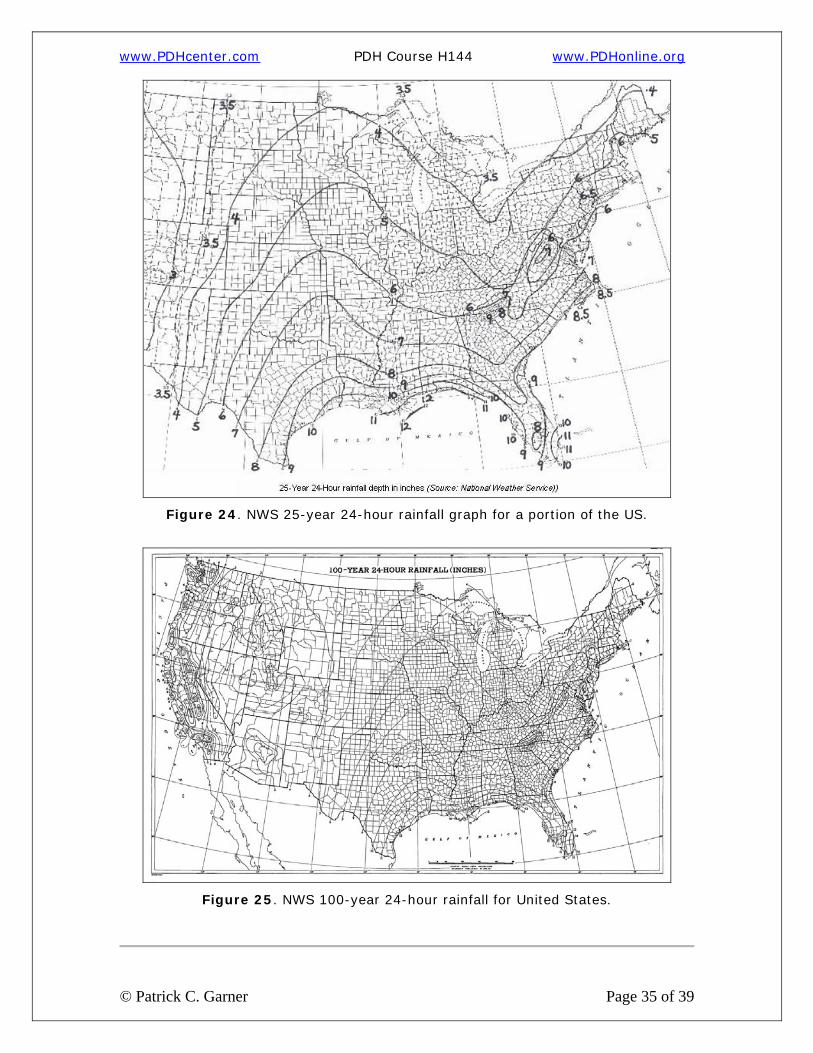
Figure 24. NWS 25-year 24-hour rainfall graph for a portion of the US.
Figure 25. NWS 100-year 24-hour rainfall for United States.
www.PDHcenter.com PDH Course H144 www.PDHonline.org
© Patrick C. Garner Page 36 of 39
More Details about the Technical Components of Runoff Estimation Methods As discussed previously, a number of methods (or models) are available for estimating the volume of runoff from a storm event (or from a series of events), and for estimating the peak discharge rate associated with a given event. A full explanation of these methods is beyond the scope or intent of this course. However, as we have now seen, all methods use some or all of the following components:
• A determination of watershed characteristics;
• Selection of a precipitation event and its properties;
• A method of hydrologic abstraction (determination of how much rainfall becomes runoff);
• The generation of one or more runoff hydrographs; and usually
• The routing of the hydrograph(s) through hydraulic structures.
See the section below for further detail about the applicability and limitations of using the three major estimation methods.

www.PDHcenter.com PDH Course H144 www.PDHonline.org
© Patrick C. Garner Page 37 of 39
5.0 REVIEW OF LIMITATIONS
Note that a number of commercially available software packages combine the features of the Rational Method, TR-55 and TR-20, so that a designer may now seamlessly determine peak rates, volumes, storage capacities and detention/retention structures without having to perform numerous calculations, or having to work between different programs. These packages also commonly allow the use of watershed areas that exceed 20 acres in size, thus overcoming one of the most significant limitations of the two NRCS programs described here.
Runoff Estimation Methods, Applicability, and Limitations
Method or Model Acceptable Application Limitations
Rational Method Sizing drainage pipes, Should not be used culverts, & drainage channels. when detention storage structures are required. TR-55 Model Urban Hydrology Estimating runoff curve number Should not be used for Small Watersheds and runoff volume. Estimating for final design of time of concentration. Estimating detention storage peak rates (when detention structures. storage is not required). Estimating peak rates and “rough sizing” of detention structures. TR-20 Model Computer Model for Estimating runoff curve numbers Requires use of a Project Formulation, and runoff volumes. Estimating computer. Not applicable Hydrology peak rates of discharge. Developing to determine river flood hydrographs. Performing runoff peaks or velocity. calculations that account for existing storage within watershed. Performing routing calculations for proposed detention structures.

www.PDHcenter.com PDH Course H144 www.PDHonline.org
© Patrick C. Garner Page 38 of 39
[CONCLUSION] Concepts discussed in the course included the variables of the hydrologic cycle, including rainfall and evaporation; precipitation; types of natural storage and infiltration; recharge and base flow; surface runoff and its iterations; peak rates of flow; rainfall definitions and characteristics; return periods and occurrence intervals; I-D-F curves; hyetographs and their uses; and hydrographs and their components. In addition, the course covered watersheds; runoff rates and volume; NRCS hydrologic soil groups; coefficients; curve numbers; cover types; times of travel (Tt) and concentration (Tc); as well as a lengthy discussion on the differences between the Rational Method and the SCS peak flow methods (that is, TR-20 and 55). Assumptions and limitations for each method were listed in a table of comparisons. Students completing this course are now familiar with the broad concepts and data parameters required to model storm events and design stormwater infrastructure. Many courses exist on-line that discuss the step-by-step input for this software. In addition, NRCS occasionally offers hands-on courses in the use of TR-20 and TR-55. Practice with the NRCS programs, or with commercially available packages is recommended before trying to design proposed stormwater infrastructure, as each program has limitations and peculiarities that can influence the design outcome.
----- END -----

www.PDHcenter.com PDH Course H144 www.PDHonline.org
© Patrick C. Garner Page 39 of 39
6.0 Literature References American Society of Civil Engineers, 1992 Design and Construction of Urban Stormwater Management Systems, ASCE – Manuals and Reports on Engineering Practice No. 77. Bedient, P.B. and W.C. Huber. 1992. Hydrology and Floodplain Analysis (2nd Edition). Addison-Wesley Publishing Company. Reading, MA Chow, V.T., D.R. Maidment, and L.W. Mays. 1988. Applied Hydrology. McGraw-Hill Book Company. New York, NY. Hershfield, D.M. 1961. Rainfall Frequency Atlas of the United States. Technical Paper 40. U.S. Department of Commerce. Washington, D.C. HydroCAD Stormwater Modeling System, HydroCAD Software Solutions LLC Maryland Department of the Environment. 2000. 2000 Maryland Stormwater Design Manual, Volumes I & II. Prepared by the Center for Watershed Protection and the Maryland Department of the Environment, Water Management Administration. Baltimore, MD MassDEP. 1997a. Stormwater Management Volume One: Stormwater Policy Handbook. (March 1997), MA Department of Environmental Protection and MA Office of Coastal Zone Management, Boston, MA. MassDEP. 1997b. Stormwater Management Volume Two: Stormwater Technical Handbook. (March 1997), MA Department of Environmental Protection and MA Office of Coastal Zone Management, Boston, MA. MassDEP, 2002. Hydrology Handbook for Conservation Commissioners Ponce, V.M. 1989. Engineering Hydrology, Principles and Practices. Prentice Hall. Englewood Cliffs, NJ. Rossmiller, July 1980 "The Rational Formula Revisited". In: International Symposium on Urban Storm Runoff. University of Kentucky, Lexington, KY Schueler, T. 1987. Controlling Urban Runoff: A Practical Manual for Planning and Designing Urban BMPs. Department of Environmental Programs, Metropolitan Washington Council of Governments, Washington, DC Soil Conservation Service. 1985. National Engineering Handbook, Section 4 - Hydrology. Engineering Division, Soil Conservation Service, USDA. Washington, DC. Soil Conservation Service. 1986. Technical Release 55: Urban Hydrology for Small Watersheds, 2nd Edition. Engineering Division, Soil Conservation Service, USDA. Washington, DC Walker, W.W., Jr. 1990. P8 Urban Catchment Model Program Documentation. Prepared for IEP, Inc. and the Narragansett Bay Project. Concord, MA. Wilks, D.S. and R.P. Cember. 1993. Atlas of Precipitation Extremes for the Northeastern United States and Southeastern Canada. Northeast Regional Climate Center Research Series, Publication No. RR 93-5. Cornell University, Ithaca, NY
Related Documents