Molecular Cell Article A High-Throughput Chromatin Immunoprecipitation Approach Reveals Principles of Dynamic Gene Regulation in Mammals Manuel Garber, 1,7,8, * Nir Yosef, 1,2,8 Alon Goren, 1 Raktima Raychowdhury, 1 Anne Thielke, 1 Mitchell Guttman, 1,3 James Robinson, 1 Brian Minie, 1 Nicolas Chevrier, 1 Zohar Itzhaki, 4 Ronnie Blecher-Gonen, 4 Chamutal Bornstein, 4 Daniela Amann-Zalcenstein, 4 Assaf Weiner, 5 Dennis Friedrich, 1 James Meldrim, 1 Oren Ram, 1 Christine Cheng, 1,4 Andreas Gnirke, 1 Sheila Fisher, 1 Nir Friedman, 5 Bang Wong, 1 Bradley E. Bernstein, 1,6 Chad Nusbaum, 1 Nir Hacohen, 1,2 Aviv Regev, 1,3,6 and Ido Amit 1,4, * 1 Broad Institute of MIT and Harvard, Cambridge, MA 02142, USA 2 Harvard Medical School, Boston, MA 02115, USA 3 Department of Biology, Massachusetts Institute of Technology, Cambridge, MA 02142, USA 4 Weizmann Institute, Department of Immunology, Rehovot 76100, Israel 5 School of Computer Science & Engineering, and Silberman Institute of Life Sciences, Hebrew University, Jerusalem 91904, Israel 6 Howard Hughes Medical Institute 7 University of Massachusetts Medical School, Bioinformatics and Integrative Biology, Worcester, MA 01605, USA 8 These authors contributed equally to this work *Correspondence: [email protected] (M.G.), [email protected] (I.A.) http://dx.doi.org/10.1016/j.molcel.2012.07.030 SUMMARY Understanding the principles governing mammalian gene regulation has been hampered by the difficulty in measuring in vivo binding dynamics of large numbers of transcription factors (TF) to DNA. Here, we develop a high-throughput Chromatin Immuno- Precipitation (HT-ChIP) method to systematically map protein-DNA interactions. HT-ChIP was applied to define the dynamics of DNA binding by 25 TFs and 4 chromatin marks at 4 time-points following path- ogen stimulus of dendritic cells. Analyzing over 180,000 TF-DNA interactions we find that TFs vary substantially in their temporal binding landscapes. This data suggests a model for transcription regula- tion whereby TF networks are hierarchically orga- nized into cell differentiation factors, factors that bind targets prior to stimulus to prime them for induction, and factors that regulate specific gene programs. Overlaying HT-ChIP data on gene-expres- sion dynamics shows that many TF-DNA interactions are established prior to the stimuli, predominantly at immediate-early genes, and identified specific TF ensembles that coordinately regulate gene- induction. INTRODUCTION The complex gene expression programs that underlie develop- ment, differentiation, and environmental responses are primarily determined by binding of sequence-specific transcription fac- tors (TFs) to DNA (Graf and Enver, 2009; Laslo et al., 2006; Struhl, 2001). While it is clear that TFs play a critical role in gene regula- tion, how these factors work together to control gene expression responses in complex organisms is still not fully understood (Davidson, 2010). To date, systematic efforts to understand the mammalian regulatory code have mostly relied on generalization from studies on simple model organisms (Capaldi et al., 2008; Harbi- son et al., 2004), in vitro experiments, and studies of individual gene loci (Bossard and Zaret, 1998; Cirillo et al., 2002; Thanos and Maniatis, 1992). Genomic approaches, such as correlation analysis of gene expression profiles (Segal et al., 2003), and more recently RNAi perturbation followed by gene expression readouts (Amit et al., 2009), have provided an initial glimpse into the complexity of mammalian gene regulation. However, such approaches cannot distinguish direct from indirect effects and cannot address network redundancy and temporal regula- tion, thus they provide limited insight into the underlying regula- tory mechanisms. A complementary approach is to measure the temporal in vivo binding of TFs to cis-regulatory regions under relevant stimuli. Recent advances in genomic technologies allow for unbiased and accurate genome-wide characterization of TF binding using ChIP followed by DNA sequencing (ChIP-Seq) (Barski et al., 2007; Johnson et al., 2007; Mikkelsen et al., 2007). Despite these advances in detection, ChIP remains relatively low throughput (Barski et al., 2007; Gerstein et al., 2010; Johnson et al., 2007; Mikkelsen et al., 2007; Ne ` gre et al., 2011; Roy et al., 2010). As a result, little is known about the genome-wide dynamics of protein-DNA interaction networks. To address these challenges we developed HT-ChIP, a repro- ducible, high-throughput and cost-effective method for ChIP coupled to multiplexed massively parallel sequencing. We used HT-ChIP to investigate the principles of gene regulation in the Molecular Cell 47, 1–13, September 14, 2012 ª2012 Elsevier Inc. 1 Please cite this article in press as: Garber et al., A High-Throughput Chromatin Immunoprecipitation Approach Reveals Principles of Dynamic Gene Regulation in Mammals, Molecular Cell (2012), http://dx.doi.org/10.1016/j.molcel.2012.07.030

Welcome message from author
This document is posted to help you gain knowledge. Please leave a comment to let me know what you think about it! Share it to your friends and learn new things together.
Transcript
Please cite this article in press as: Garber et al., A High-Throughput Chromatin Immunoprecipitation Approach Reveals Principles of Dynamic GeneRegulation in Mammals, Molecular Cell (2012), http://dx.doi.org/10.1016/j.molcel.2012.07.030
Molecular Cell
Article
A High-Throughput ChromatinImmunoprecipitation Approach RevealsPrinciples of Dynamic Gene Regulation in MammalsManuel Garber,1,7,8,* Nir Yosef,1,2,8 Alon Goren,1 Raktima Raychowdhury,1 Anne Thielke,1 Mitchell Guttman,1,3
James Robinson,1 Brian Minie,1 Nicolas Chevrier,1 Zohar Itzhaki,4 Ronnie Blecher-Gonen,4 Chamutal Bornstein,4
Daniela Amann-Zalcenstein,4 Assaf Weiner,5 Dennis Friedrich,1 James Meldrim,1 Oren Ram,1 Christine Cheng,1,4
Andreas Gnirke,1 Sheila Fisher,1 Nir Friedman,5 Bang Wong,1 Bradley E. Bernstein,1,6 Chad Nusbaum,1 Nir Hacohen,1,2
Aviv Regev,1,3,6 and Ido Amit1,4,*1Broad Institute of MIT and Harvard, Cambridge, MA 02142, USA2Harvard Medical School, Boston, MA 02115, USA3Department of Biology, Massachusetts Institute of Technology, Cambridge, MA 02142, USA4Weizmann Institute, Department of Immunology, Rehovot 76100, Israel5School of Computer Science & Engineering, and Silberman Institute of Life Sciences, Hebrew University, Jerusalem 91904, Israel6Howard Hughes Medical Institute7University of Massachusetts Medical School, Bioinformatics and Integrative Biology, Worcester, MA 01605, USA8These authors contributed equally to this work
*Correspondence: [email protected] (M.G.), [email protected] (I.A.)
http://dx.doi.org/10.1016/j.molcel.2012.07.030
SUMMARY
Understanding the principles governing mammaliangene regulation has been hampered by the difficultyin measuring in vivo binding dynamics of largenumbers of transcription factors (TF) to DNA. Here,we develop a high-throughput Chromatin Immuno-Precipitation (HT-ChIP) method to systematicallymap protein-DNA interactions. HT-ChIP was appliedto define the dynamics of DNA binding by 25 TFs and4 chromatin marks at 4 time-points following path-ogen stimulus of dendritic cells. Analyzing over180,000 TF-DNA interactions we find that TFs varysubstantially in their temporal binding landscapes.This data suggests a model for transcription regula-tion whereby TF networks are hierarchically orga-nized into cell differentiation factors, factors thatbind targets prior to stimulus to prime them forinduction, and factors that regulate specific geneprograms. Overlaying HT-ChIP data on gene-expres-sion dynamics shows that many TF-DNA interactionsare established prior to the stimuli, predominantlyat immediate-early genes, and identified specificTF ensembles that coordinately regulate gene-induction.
INTRODUCTION
The complex gene expression programs that underlie develop-
ment, differentiation, and environmental responses are primarily
determined by binding of sequence-specific transcription fac-
M
tors (TFs) to DNA (Graf and Enver, 2009; Laslo et al., 2006; Struhl,
2001). While it is clear that TFs play a critical role in gene regula-
tion, how these factors work together to control gene expression
responses in complex organisms is still not fully understood
(Davidson, 2010).
To date, systematic efforts to understand the mammalian
regulatory code have mostly relied on generalization from
studies on simple model organisms (Capaldi et al., 2008; Harbi-
son et al., 2004), in vitro experiments, and studies of individual
gene loci (Bossard and Zaret, 1998; Cirillo et al., 2002; Thanos
and Maniatis, 1992). Genomic approaches, such as correlation
analysis of gene expression profiles (Segal et al., 2003), and
more recently RNAi perturbation followed by gene expression
readouts (Amit et al., 2009), have provided an initial glimpse
into the complexity of mammalian gene regulation. However,
such approaches cannot distinguish direct from indirect effects
and cannot address network redundancy and temporal regula-
tion, thus they provide limited insight into the underlying regula-
tory mechanisms.
A complementary approach is to measure the temporal in vivo
binding of TFs to cis-regulatory regions under relevant stimuli.
Recent advances in genomic technologies allow for unbiased
and accurate genome-wide characterization of TF binding using
ChIP followed by DNA sequencing (ChIP-Seq) (Barski et al.,
2007; Johnson et al., 2007; Mikkelsen et al., 2007). Despite these
advances in detection, ChIP remains relatively low throughput
(Barski et al., 2007; Gerstein et al., 2010; Johnson et al., 2007;
Mikkelsen et al., 2007; Negre et al., 2011; Roy et al., 2010). As
a result, little is known about the genome-wide dynamics of
protein-DNA interaction networks.
To address these challenges we developed HT-ChIP, a repro-
ducible, high-throughput and cost-effective method for ChIP
coupled to multiplexed massively parallel sequencing. We used
HT-ChIP to investigate the principles of gene regulation in the
olecular Cell 47, 1–13, September 14, 2012 ª2012 Elsevier Inc. 1
Molecular Cell
The Transcriptional Landscape of Dendritic Cells
Please cite this article in press as: Garber et al., A High-Throughput Chromatin Immunoprecipitation Approach Reveals Principles of Dynamic GeneRegulation in Mammals, Molecular Cell (2012), http://dx.doi.org/10.1016/j.molcel.2012.07.030
model system of primary innate immune dendritic cells (DCs)
stimulated with the pathogen component lipopolysaccharide
(LPS). In response to stimulation, DCs activate a robust, specific,
and reproducible response that unfolds over several hours,
involves changesof thousands of genes (Amit et al., 2009; Rabani
et al., 2011), and plays a critical role in directing the host immune
response. We used HT-ChIP to build genome-wide dynamic
maps of TF localization to DNA during response of DCs to LPS.
We screened antibodies for the most expressed transcription
factors and identified ChIP-Seq grade antibodies for 25 TFs,
RNA polymerase II (Pol II), and 3 epigenetic modifications. Using
these validated antibodies we performed HT-ChIP across four
time points upon LPS stimulation. Surprisingly, we find that
much of the binding of TFs is precoded during differentiation
and prior to stimulation, predominantly on immediate early
genes. Many of the immediate early genes are associated with
High Occupancy Target (HOT) regions similarly to those recently
reported in flies and worms (Gerstein et al., 2010; Negre et al.,
2011; Roy et al., 2010). By focusing on dynamics of expression
and binding, our work further expands the functional role of these
HOT regions as potential stimulus dependent induction hubs in
mammals.
Our data shows that TFs vary substantially in their binding
dynamics, number of binding events, preferred genomic loca-
tions and interactions with other TFs. Analysis of these different
binding properties together with temporal gene expression and
epigenetic marks shows that TFs fall into at least three broad
classes, suggesting a multilayered architecture. Pioneer TF
described recently (Bossard and Zaret, 1998; Cirillo et al.,
2002; Ghisletti et al., 2010; Heinz et al., 2010; Lupien et al.,
2008) are coded during differentiation, are unchanged in
binding location during stimulus and correlate with the cell
epigenetic state (Ghisletti et al., 2010; Heinz et al., 2010). A
second prominent layer of TF binds thousands of genes in
the un-stimulated state and is highly correlated with future
stimulus dependent gene induction. A third set of TFs bind
dynamically in a stimulus dependent manner and control induc-
tion of gene sets enriched for a shared biological activity (e.g.,
Inflammatory, antiviral response and cell cycle). Together, our
findings demonstrate the importance of global TF dynamic
maps in uncovering the principles of the regulatory code. For
visual exploration of the data, we developed an extension
to the Integrative Genomics Viewer (IGV (Robinson et al.,
2011)), geared specifically toward viewing time course data.
The entire data can be viewed from: http://www.weizmann.
ac.il/immunology/AmitLab/data-and-method/HT-ChIP.
RESULTS
HT-ChIP: AHigh-ThroughputMethod forMapping In VivoProtein-DNA InteractionsWe developed HT-ChIP, an automated method for systematic
mapping of in vivo protein-DNA binding that increases the
throughput and sensitivity, while reducing the labor and cost
required for ChIP-Seq. Unlike the standard ChIP assay per-
formed in individual tubes, which involves over 25 steps of
chromatin washing, reverse crosslinking, DNA purification, gel
extraction and library construction (Barski et al., 2007; Johnson
2 Molecular Cell 47, 1–13, September 14, 2012 ª2012 Elsevier Inc.
et al., 2007; Mikkelsen et al., 2007); HT-ChIP uses magnetic
solid phase beads for the immunoprecipitation of protein-DNA
complexes, DNA purification, size-selection and library con-
struction eliminating laborious manual processes (Figure 1 and
Experimental Procedures). Furthermore, the entire HT-ChIP
process is performed in the same well reducing sample loss of
precipitated DNA material allowing a significant reduction in
the required number of cells (Figures S1A and S1B and Experi-
mental Procedures). HT-ChIP further leverages the yield of
current next-generation sequencing by multiplexing an arbitrary
number of different indexed sequencing adapters, 96 in our
case, to combine samples in a single sequencing flow cell (Fig-
ure 1A). The data produced by HT-ChIP-Seq is highly correlated
with traditional ChIP-Seq data generated both in our labs and
by others (Ghisletti et al., 2010; Heinz et al., 2010) (Figures S1C
and S1D).
We used HT-ChIP to reconstruct the dynamic binding network
of 25 TFs in primary mouse dendritic cells (DCs) following LPS
stimulation (Figure 1C and Table S1). We used RNA-Seq of
DCs activated with LPS at five time points (0, 1, 2, 4, 6 hr) to iden-
tify the most highly expressed TFs in DCs (RPKM > 15, totaling
184; see Supplemental Information). We then collected 271
commercially available antibodies targeting theseTFs (Figure 1B;
Experimental Procedures). We tested each antibody using
a signature readout (Ram et al., 2011) (‘ChIP-String’) that
measures selected genomic DNA regions with high regulatory
activity (Ghisletti et al., 2010). We identified 29 antibodies
(25 TFs, 3 histone modifications, and Pol II) that passed our
selection criteria as ‘ChIP grade’, based on their enrichment on
the signature regions and performance in Western blots. These
antibodies were then used for HT-ChIP at four time points
(0, 0.5, 1, 2 hr) post LPS stimulation, during which most of the
transcriptional changes occur (Figures S1F and S1G).
Comprehensive Map of Active Enhancersand Promoters in DCsRecent studies have demonstrated that the ratio between
H3K4me3 and H3K4me1 histone marks can be used to identify
promoter and enhancer regions (Heintzman and Ren, 2009): pro-
moters are associated with a higher proportion of H3K4me3-
marked histones (H3K4me3+), while enhancers have a higher
proportion of H3K4me1 marked histones (H3K4me1+). We iden-
tified promoter candidates as H3K4me3+ regions, and retained
those that overlapped a known (Pruitt et al., 2007) or recon-
structed transcription start sites as identified from the RNA-
Seq data (Guttman et al., 2010) (Figures 2A and S2 and Experi-
mental Procedures). Notably, �75% of the identified promoters
were bound by at least one of the TFs. To define enhancers, we
identified candidates containing H3K4me1+ and retained those
that were also bound by at least one TF (See for example the
Il1a loci in Figure 2A; Experimental Procedures). Altogether, we
identified 38,439 enhancers and 11,505 promoters.
Consistent with previous observations (Ghisletti et al., 2010),
we found that different chromatin marks exhibit different
dynamics during stimulation (Figures S2C–S2I). For example
H3K4me3 is remarkably stable during the first 2 hr of LPS
response. The few exceptions are in�30 loci which are lowly ex-
pressed prestimulation and become strongly induced after
A B
C
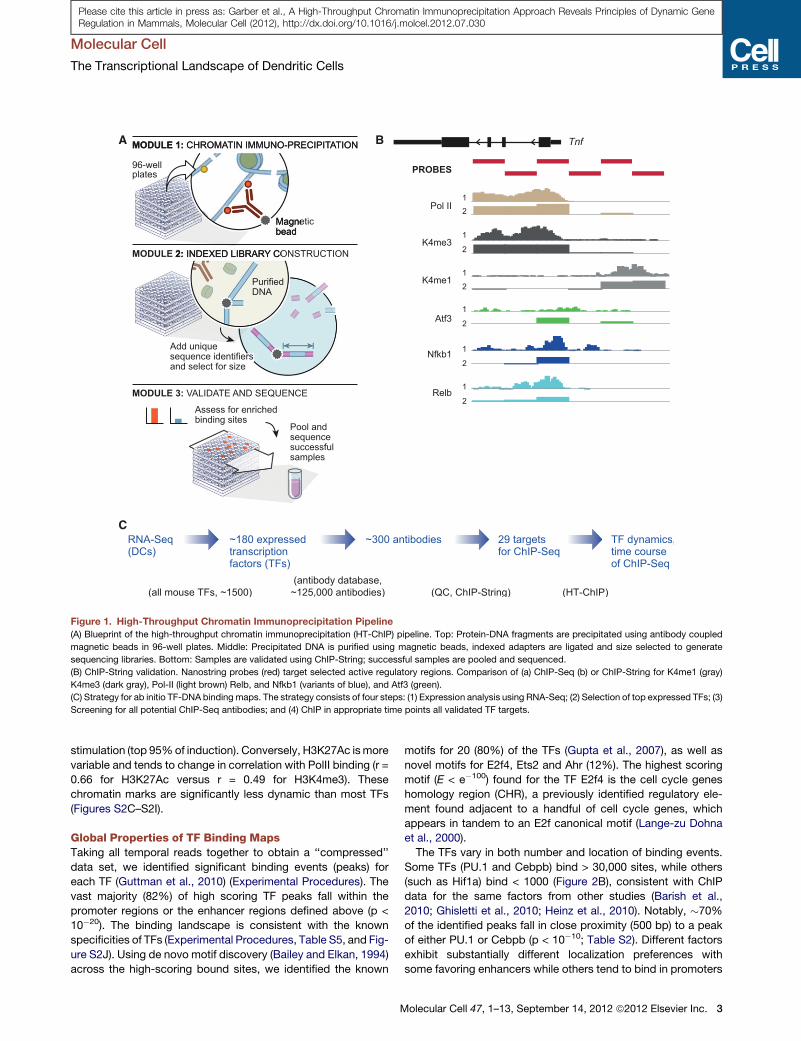
Figure 1. High-Throughput Chromatin Immunoprecipitation Pipeline
(A) Blueprint of the high-throughput chromatin immunoprecipitation (HT-ChIP) pipeline. Top: Protein-DNA fragments are precipitated using antibody coupled
magnetic beads in 96-well plates. Middle: Precipitated DNA is purified using magnetic beads, indexed adapters are ligated and size selected to generate
sequencing libraries. Bottom: Samples are validated using ChIP-String; successful samples are pooled and sequenced.
(B) ChIP-String validation. Nanostring probes (red) target selected active regulatory regions. Comparison of (a) ChIP-Seq (b) or ChIP-String for K4me1 (gray)
K4me3 (dark gray), Pol-II (light brown) Relb, and Nfkb1 (variants of blue), and Atf3 (green).
(C) Strategy for ab initio TF-DNA binding maps. The strategy consists of four steps: (1) Expression analysis using RNA-Seq; (2) Selection of top expressed TFs; (3)
Screening for all potential ChIP-Seq antibodies; and (4) ChIP in appropriate time points all validated TF targets.
Molecular Cell
The Transcriptional Landscape of Dendritic Cells
Please cite this article in press as: Garber et al., A High-Throughput Chromatin Immunoprecipitation Approach Reveals Principles of Dynamic GeneRegulation in Mammals, Molecular Cell (2012), http://dx.doi.org/10.1016/j.molcel.2012.07.030
stimulation (top 95%of induction). Conversely, H3K27Ac ismore
variable and tends to change in correlation with PolII binding (r =
0.66 for H3K27Ac versus r = 0.49 for H3K4me3). These
chromatin marks are significantly less dynamic than most TFs
(Figures S2C–S2I).
Global Properties of TF Binding MapsTaking all temporal reads together to obtain a ‘‘compressed’’
data set, we identified significant binding events (peaks) for
each TF (Guttman et al., 2010) (Experimental Procedures). The
vast majority (82%) of high scoring TF peaks fall within the
promoter regions or the enhancer regions defined above (p <
10�20). The binding landscape is consistent with the known
specificities of TFs (Experimental Procedures, Table S5, and Fig-
ure S2J). Using de novo motif discovery (Bailey and Elkan, 1994)
across the high-scoring bound sites, we identified the known
M
motifs for 20 (80%) of the TFs (Gupta et al., 2007), as well as
novel motifs for E2f4, Ets2 and Ahr (12%). The highest scoring
motif (E < e�100) found for the TF E2f4 is the cell cycle genes
homology region (CHR), a previously identified regulatory ele-
ment found adjacent to a handful of cell cycle genes, which
appears in tandem to an E2f canonical motif (Lange-zu Dohna
et al., 2000).
The TFs vary in both number and location of binding events.
Some TFs (PU.1 and Cebpb) bind > 30,000 sites, while others
(such as Hif1a) bind < 1000 (Figure 2B), consistent with ChIP
data for the same factors from other studies (Barish et al.,
2010; Ghisletti et al., 2010; Heinz et al., 2010). Notably, �70%
of the identified peaks fall in close proximity (500 bp) to a peak
of either PU.1 or Cebpb (p < 10�10; Table S2). Different factors
exhibit substantially different localization preferences with
some favoring enhancers while others tend to bind in promoters
olecular Cell 47, 1–13, September 14, 2012 ª2012 Elsevier Inc. 3
A
B
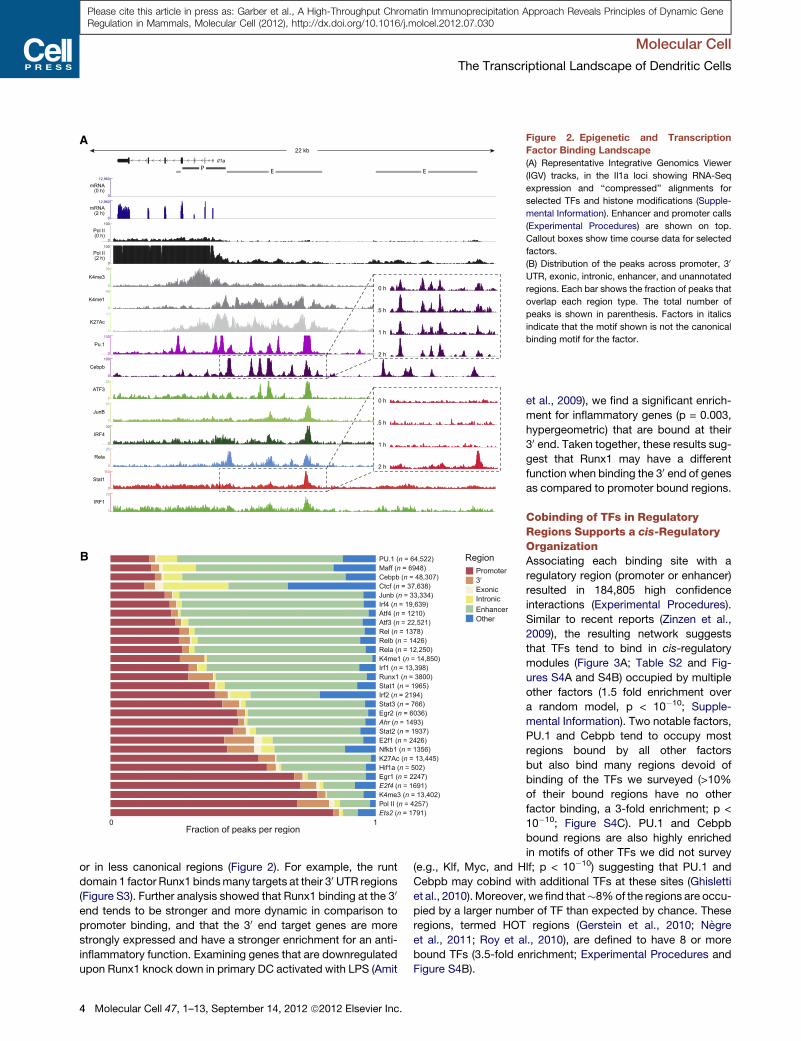
Figure 2. Epigenetic and Transcription
Factor Binding Landscape
(A) Representative Integrative Genomics Viewer
(IGV) tracks, in the Il1a loci showing RNA-Seq
expression and ‘‘compressed’’ alignments for
selected TFs and histone modifications (Supple-
mental Information). Enhancer and promoter calls
(Experimental Procedures) are shown on top.
Callout boxes show time course data for selected
factors.
(B) Distribution of the peaks across promoter, 30
UTR, exonic, intronic, enhancer, and unannotated
regions. Each bar shows the fraction of peaks that
overlap each region type. The total number of
peaks is shown in parenthesis. Factors in italics
indicate that the motif shown is not the canonical
binding motif for the factor.
Molecular Cell
The Transcriptional Landscape of Dendritic Cells
Please cite this article in press as: Garber et al., A High-Throughput Chromatin Immunoprecipitation Approach Reveals Principles of Dynamic GeneRegulation in Mammals, Molecular Cell (2012), http://dx.doi.org/10.1016/j.molcel.2012.07.030
or in less canonical regions (Figure 2). For example, the runt
domain 1 factor Runx1 bindsmany targets at their 30 UTR regions
(Figure S3). Further analysis showed that Runx1 binding at the 30
end tends to be stronger and more dynamic in comparison to
promoter binding, and that the 30 end target genes are more
strongly expressed and have a stronger enrichment for an anti-
inflammatory function. Examining genes that are downregulated
upon Runx1 knock down in primary DC activated with LPS (Amit
4 Molecular Cell 47, 1–13, September 14, 2012 ª2012 Elsevier Inc.
et al., 2009), we find a significant enrich-
ment for inflammatory genes (p = 0.003,
hypergeometric) that are bound at their
30 end. Taken together, these results sug-
gest that Runx1 may have a different
function when binding the 30 end of genes
as compared to promoter bound regions.
Cobinding of TFs in RegulatoryRegions Supports a cis-RegulatoryOrganizationAssociating each binding site with a
regulatory region (promoter or enhancer)
resulted in 184,805 high confidence
interactions (Experimental Procedures).
Similar to recent reports (Zinzen et al.,
2009), the resulting network suggests
that TFs tend to bind in cis-regulatory
modules (Figure 3A; Table S2 and Fig-
ures S4A and S4B) occupied by multiple
other factors (1.5 fold enrichment over
a random model, p < 10�10; Supple-
mental Information). Two notable factors,
PU.1 and Cebpb tend to occupy most
regions bound by all other factors
but also bind many regions devoid of
binding of the TFs we surveyed (>10%
of their bound regions have no other
factor binding, a 3-fold enrichment; p <
10�10; Figure S4C). PU.1 and Cebpb
bound regions are also highly enriched
in motifs of other TFs we did not survey
(e.g., Klf, Myc, and Hlf; p < 10�10) suggesting that PU.1 and
Cebpb may cobind with additional TFs at these sites (Ghisletti
et al., 2010).Moreover, we find that�8%of the regions are occu-
pied by a larger number of TF than expected by chance. These
regions, termed HOT regions (Gerstein et al., 2010; Negre
et al., 2011; Roy et al., 2010), are defined to have 8 or more
bound TFs (3.5-fold enrichment; Experimental Procedures and
Figure S4B).
A
B
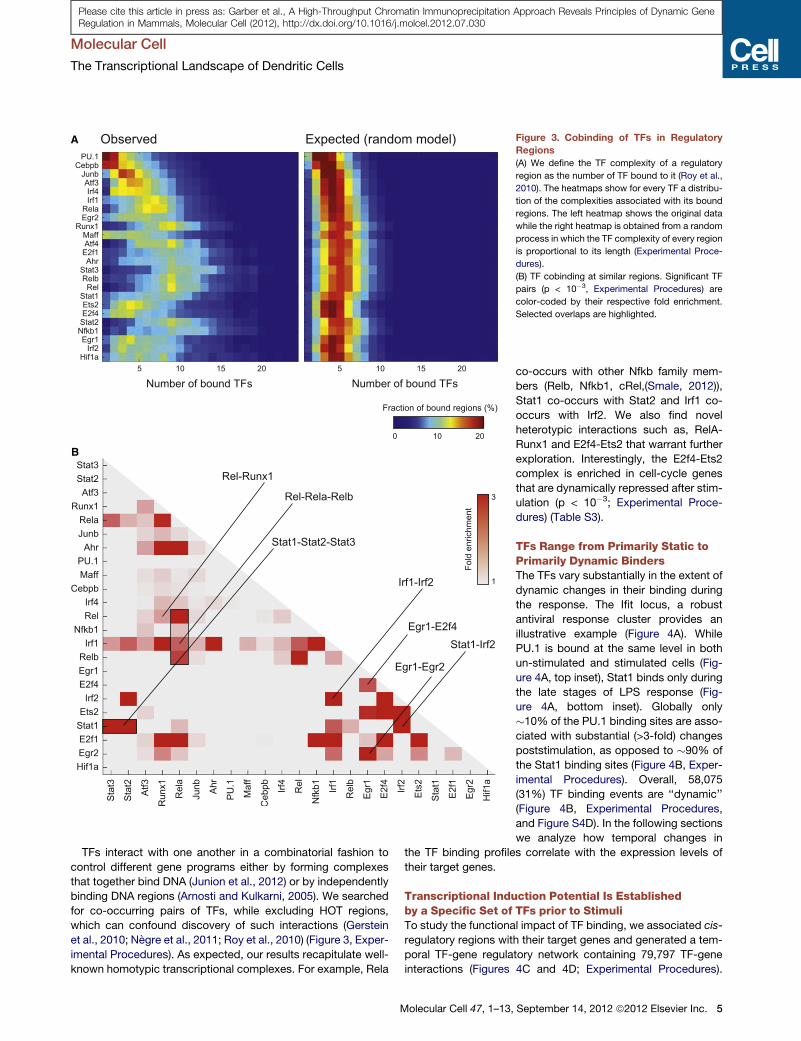
Figure 3. Cobinding of TFs in Regulatory
Regions
(A) We define the TF complexity of a regulatory
region as the number of TF bound to it (Roy et al.,
2010). The heatmaps show for every TF a distribu-
tion of the complexities associated with its bound
regions. The left heatmap shows the original data
while the right heatmap is obtained from a random
process in which the TF complexity of every region
is proportional to its length (Experimental Proce-
dures).
(B) TF cobinding at similar regions. Significant TF
pairs (p < 10�3, Experimental Procedures) are
color-coded by their respective fold enrichment.
Selected overlaps are highlighted.
Molecular Cell
The Transcriptional Landscape of Dendritic Cells
Please cite this article in press as: Garber et al., A High-Throughput Chromatin Immunoprecipitation Approach Reveals Principles of Dynamic GeneRegulation in Mammals, Molecular Cell (2012), http://dx.doi.org/10.1016/j.molcel.2012.07.030
TFs interact with one another in a combinatorial fashion to
control different gene programs either by forming complexes
that together bind DNA (Junion et al., 2012) or by independently
binding DNA regions (Arnosti and Kulkarni, 2005). We searched
for co-occurring pairs of TFs, while excluding HOT regions,
which can confound discovery of such interactions (Gerstein
et al., 2010; Negre et al., 2011; Roy et al., 2010) (Figure 3, Exper-
imental Procedures). As expected, our results recapitulate well-
known homotypic transcriptional complexes. For example, Rela
Molecular Cell 47, 1–13,
co-occurs with other Nfkb family mem-
bers (Relb, Nfkb1, cRel,(Smale, 2012)),
Stat1 co-occurs with Stat2 and Irf1 co-
occurs with Irf2. We also find novel
heterotypic interactions such as, RelA-
Runx1 and E2f4-Ets2 that warrant further
exploration. Interestingly, the E2f4-Ets2
complex is enriched in cell-cycle genes
that are dynamically repressed after stim-
ulation (p < 10�3; Experimental Proce-
dures) (Table S3).
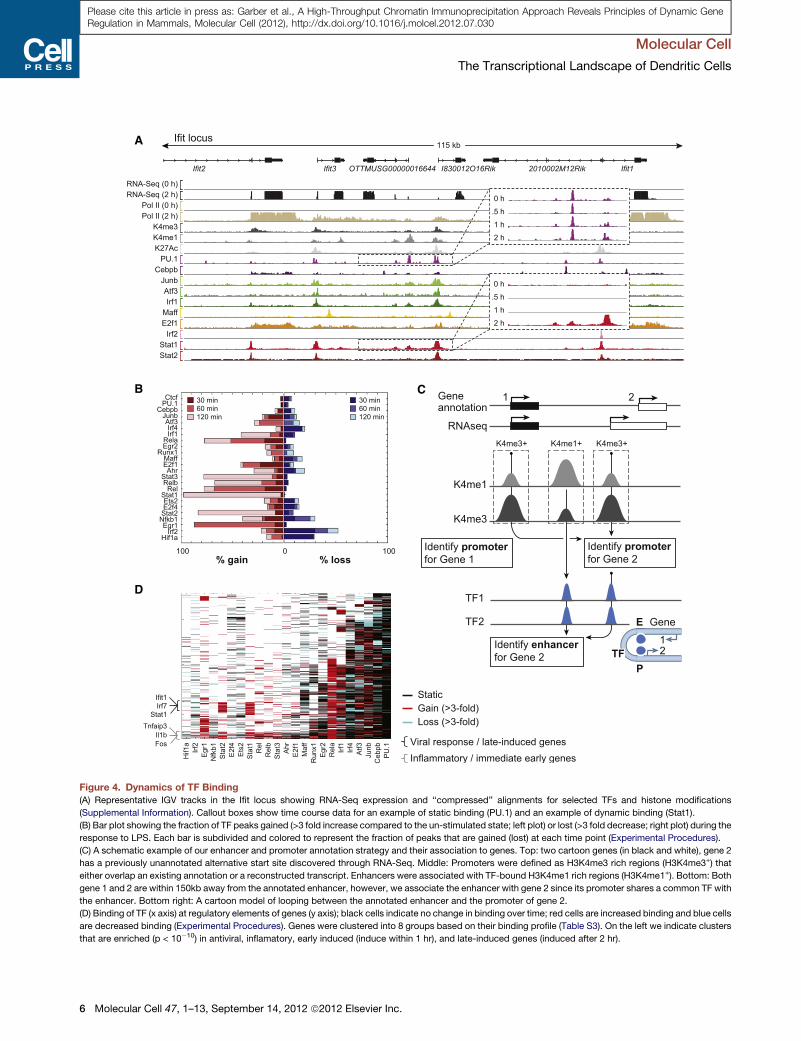
TFs Range from Primarily Static toPrimarily Dynamic BindersThe TFs vary substantially in the extent of
dynamic changes in their binding during
the response. The Ifit locus, a robust
antiviral response cluster provides an
illustrative example (Figure 4A). While
PU.1 is bound at the same level in both
un-stimulated and stimulated cells (Fig-
ure 4A, top inset), Stat1 binds only during
the late stages of LPS response (Fig-
ure 4A, bottom inset). Globally only
�10% of the PU.1 binding sites are asso-
ciated with substantial (>3-fold) changes
poststimulation, as opposed to �90% of
the Stat1 binding sites (Figure 4B, Exper-
imental Procedures). Overall, 58,075
(31%) TF binding events are ‘‘dynamic’’
(Figure 4B, Experimental Procedures,
and Figure S4D). In the following sections
we analyze how temporal changes in
the TF binding profiles correlate with the expression levels of
their target genes.
Transcriptional Induction Potential Is Establishedby a Specific Set of TFs prior to StimuliTo study the functional impact of TF binding, we associated cis-
regulatory regions with their target genes and generated a tem-
poral TF-gene regulatory network containing 79,797 TF-gene
interactions (Figures 4C and 4D; Experimental Procedures).
September 14, 2012 ª2012 Elsevier Inc. 5
A
B C
D
Figure 4. Dynamics of TF Binding
(A) Representative IGV tracks in the Ifit locus showing RNA-Seq expression and ‘‘compressed’’ alignments for selected TFs and histone modifications
(Supplemental Information). Callout boxes show time course data for an example of static binding (PU.1) and an example of dynamic binding (Stat1).
(B) Bar plot showing the fraction of TF peaks gained (>3 fold increase compared to the un-stimulated state; left plot) or lost (>3 fold decrease; right plot) during the
response to LPS. Each bar is subdivided and colored to represent the fraction of peaks that are gained (lost) at each time point (Experimental Procedures).
(C) A schematic example of our enhancer and promoter annotation strategy and their association to genes. Top: two cartoon genes (in black and white), gene 2
has a previously unannotated alternative start site discovered through RNA-Seq. Middle: Promoters were defined as H3K4me3 rich regions (H3K4me3+) that
either overlap an existing annotation or a reconstructed transcript. Enhancers were associated with TF-bound H3K4me1 rich regions (H3K4me1+). Bottom: Both
gene 1 and 2 are within 150kb away from the annotated enhancer, however, we associate the enhancer with gene 2 since its promoter shares a common TF with
the enhancer. Bottom right: A cartoon model of looping between the annotated enhancer and the promoter of gene 2.
(D) Binding of TF (x axis) at regulatory elements of genes (y axis); black cells indicate no change in binding over time; red cells are increased binding and blue cells
are decreased binding (Experimental Procedures). Genes were clustered into 8 groups based on their binding profile (Table S3). On the left we indicate clusters
that are enriched (p < 10�10) in antiviral, inflamatory, early induced (induce within 1 hr), and late-induced genes (induced after 2 hr).
Molecular Cell
The Transcriptional Landscape of Dendritic Cells
6 Molecular Cell 47, 1–13, September 14, 2012 ª2012 Elsevier Inc.
Please cite this article in press as: Garber et al., A High-Throughput Chromatin Immunoprecipitation Approach Reveals Principles of Dynamic GeneRegulation in Mammals, Molecular Cell (2012), http://dx.doi.org/10.1016/j.molcel.2012.07.030
Molecular Cell
The Transcriptional Landscape of Dendritic Cells
Please cite this article in press as: Garber et al., A High-Throughput Chromatin Immunoprecipitation Approach Reveals Principles of Dynamic GeneRegulation in Mammals, Molecular Cell (2012), http://dx.doi.org/10.1016/j.molcel.2012.07.030
Overall, we find that genes bound by few TFs (<5) are enriched
for basic cellular processes (p < 10�5), while genes targeted by
many TFs (>15) are enriched for inflammatory response path-
ways (p < 10�7; Figure 4D, Table S3). The targets of individual
TFs are also enriched for specific functional classes (Table S4).
For example, E2f4 binding is enriched for cell cycle genes (p <
10�10); Nfkb binding is enriched for inflammatory response
genes (p < 10�10); and Stat TF binding is enriched for antiviral
response genes (p < 10�10; Figure S5, Table S4).
To explore the relationship between binding dynamics and
expression patterns we used temporal gene expression data
using RNA-Seq for 5 different time-points (0, 1, 2, 4, 6 hr)
following LPS stimulation. We divided the 4,993 genes that re-
sponded to LPS stimulation (2-fold change compared to the
un-stimulated state, Experimental Procedures) into five clusters
(Figure 5A, Table S6, Figure S5A, and Experimental Procedures):
The �1,300 induced genes constituted three clusters: imme-
diate early induced genes whose expression peaks before the
first hour (293 genes), intermediate induced genes with peak
expression prior to the second hour (227 genes), and late
induced genes whose expression peaks after two hours (808
genes). Over 3,500 repressed genes comprised two additional
clusters, genes that are gradually repressed and those that are
rapidly repressed.
Genes in the LPS-induced clusters are bound by more TFs
prior to the stimulus than noninduced genes (p < 10�10, Supple-
mental Information). Furthermore, some of the factors (e.g.,
Junb, Atf3, Irf4) are specifically enriched at the promoters or
enhancers of these induced genes even prior to exposure to
stimulus (p < 10�3, Figures 5A, S5A, and S5B; Experimental
Procedures). In contrast, PU.1 and Cebpb bind a larger number
of genes in the prestimulated state, but are not enriched for LPS-
induced genes. These results suggest that transcriptional induc-
tion potential is established prior to stimulation via preferential
binding of a selective set of TFs to inducible genes.
TF Binding Correlates with Transcription DynamicsWe next compared TF dynamics and gene expression following
stimulation, finding multiple cases in which the timing of gain or
loss of TF binding at genes in the induced clusters significantly
precedes or coincides with the timing of transcriptional induction
(p < 10�3; Figures S5C and S5D; Experimental Procedures). We
therefore further sub-clustered the genes within each expression
profile by the similarity of their dynamic binding profiles, resulting
in 19 clusters, each representing a unique combination of
expression and binding profiles (Figures 5A and S5E, Table S3,
and Experimental Procedures).
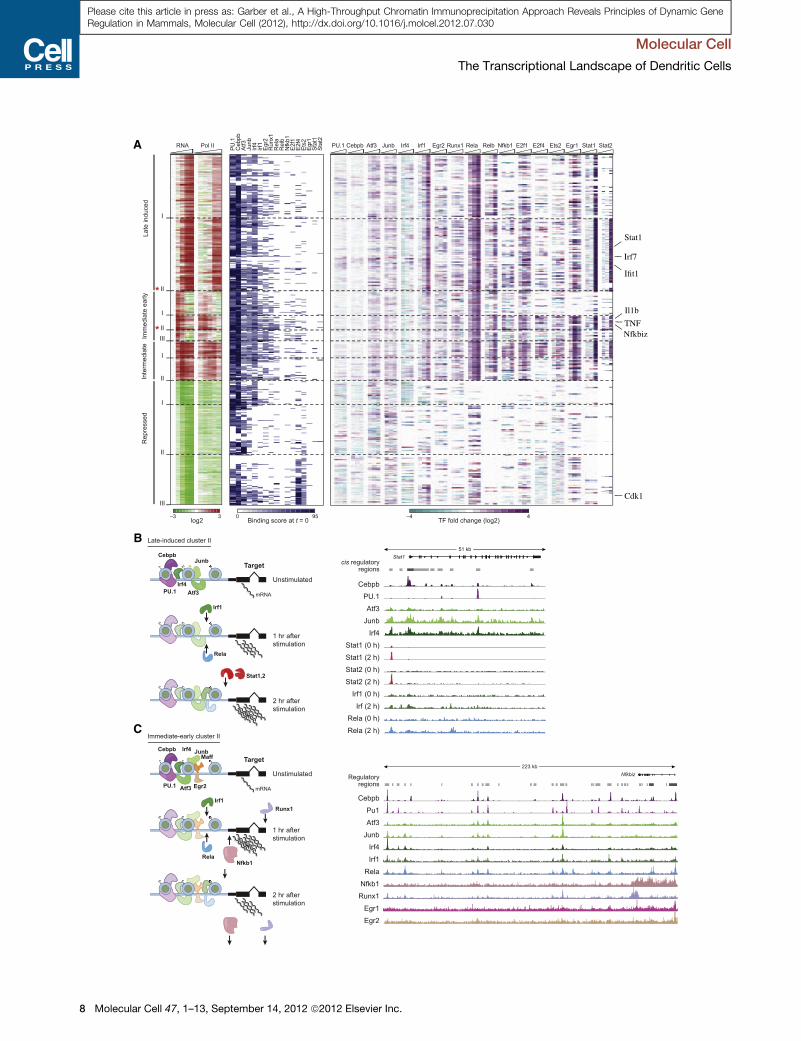
The 19 binding/expression clusters uncover different regula-
tory programs activated by innate immune DCs challenged
with LPS. For instance, the late induced gene cluster is parti-
tioned into two sub-groups. Late induced cluster II is strongly
associated with late binding of Stat1 and Stat2 (Figures 5A and
5B, p < 10�3; Experimental Procedures), and consists of highly
expressed genes (average RPKM 250) that are enriched in in-
terferon signaling and other antiviral pathways (p < 10�10). In
contrast, late induced cluster I is only weakly bound by the
Stat factors, genes in this cluster have lower absolute expression
levels (average RPKM 100) and are enriched mainly in leukocyte
M
proliferation pathways and also in lowly expressed antiviral
genes (p < 10�5 and p < 10�10 respectively; Table S3). This parti-
tion suggests two different regulatory modes of late LPS gene
activation: a high expression Stat-bound antiviral response arm
(Figures 5A and 5B), and a Stat-independent response arm,
which orchestrates a second wave of inflammatory response
genes (e.g., CD86 that plays a critical role in T cell activation
and survival (Sharpe and Freeman, 2002)).
Immediate early genes play a critical role in rapid response to
changes in the environment, yet their mode of regulation is not
fully understood (Amit et al., 2007; Hargreaves et al., 2009; Ram-
irez-Carrozzi et al., 2009; Weake and Workman, 2010). The
immediate early genes are partitioned into three clusters, each
associated with a distinct binding profile and enriched for genes
from different pathways (Figure 5A). Immediate early cluster I is
defined by strong binding of Rela and Egr1 during the first hour
of stimulation, has a relatively low maximal expression (average
RPKM 50) and is enriched for transcription factor genes,
including Egr1, Egr2 and Egr3. In contrast, immediate early
cluster II (Figure 5C) consists of highly expressed genes (average
RPKM 300) that are targeted by a large number of TFs, many of
which bind their targets prior to stimulation, and are enriched for
inflammatory response genes (both TFs and cytokines, e.g.,
Nfkbiz, Tnfaip3, Junb, Klf6 and TNF, p < 10�5; Figure S5E and
Table S3). The low conservation together with the high degree
of redundancy observed on immediate early genes (Figure S6;
Supplemental Information) suggests regulation via a ‘billboard’
or collective model rather than an enhanceosomemodel (Arnosti
and Kulkarni, 2005). In this model, the billboard/collective is
preassembled prior to stimuli and recruits, possibly without great
specificity, many different factors on relatively nonconserved
and weak binding sites to achieve high expression levels.
While induced genes are generally associated with gain of
binding poststimulation (p < 10�10), repressed clusters are en-
riched for loss of TF binding or for no binding gain (p < 10�10,
Supplemental Information). For instance, repressed cluster III
(Figure 5A) is strongly enriched in cell cycle genes (e.g., Cdk1)
and is primarily associated with static binding of the cell-cycle
related factor E2f4 and Ets2 while it is depleted of binding of
Junb, Irf4 and Atf3 which bind most of the induced genes.
In another example, the histone gene locus is bound by Nfkb
and E2f family members in the basal state, followed by loss of
Nfkb factors immediately poststimulation (Figure S5F). Together
this suggests that genes that are not bound by priming
factors prestimulation (Junb, Atf3 and Irf4) are more prone to
repression following stimulation. A second alternative is that
circuits involved in repression, like recruitment of the Smart/
Ncor complex by Bcl6 (Barish et al., 2010), may be less profiled
in our study.
A Layered Architecture of the TF NetworkThe temporal structure of the TF network is consistent with
a model of hierarchical organization and temporal dependencies
between the different TFs where some TFs are bound prior to or
concomitantly with other TFs. Such ‘‘layered architecture’’ of
regulation has been described previously where Pioneer factors
bind compacted chromatin, initiate chromatin remodeling during
differentiation, and enable subsequent binding of nonpioneers
olecular Cell 47, 1–13, September 14, 2012 ª2012 Elsevier Inc. 7
A
B
C
Molecular Cell
The Transcriptional Landscape of Dendritic Cells
8 Molecular Cell 47, 1–13, September 14, 2012 ª2012 Elsevier Inc.
Please cite this article in press as: Garber et al., A High-Throughput Chromatin Immunoprecipitation Approach Reveals Principles of Dynamic GeneRegulation in Mammals, Molecular Cell (2012), http://dx.doi.org/10.1016/j.molcel.2012.07.030
Molecular Cell
The Transcriptional Landscape of Dendritic Cells
Please cite this article in press as: Garber et al., A High-Throughput Chromatin Immunoprecipitation Approach Reveals Principles of Dynamic GeneRegulation in Mammals, Molecular Cell (2012), http://dx.doi.org/10.1016/j.molcel.2012.07.030
factors (Bossard and Zaret, 1998; Cirillo et al., 2002; Lupien et al.,
2008).
To analyze the patterns of binding dependencies between the
different TFs, we constructed a hierarchy graph (Figure 6A),
where an edge is directed from factor A to factor B if factor A
binds at least 30% of the regions bound by factor B at the
same or earlier time. The graph reveals a clear organization
that supports and extends the basic distinction between
pioneers and nonpioneers. Not surprisingly, the top-most tier
consists of the two factors in our set (PU.1 and Cebpb) previ-
ously described as pioneers (Ghisletti et al., 2010; Heinz et al.,
2010). A second tier consists of three TFs (Junb, Irf4, Atf3), which
bind prestimulation at LPS induced genes that later become
associated with more specific and dynamic factors. Interest-
ingly, in macrophages AP-1 binding motifs are also enriched at
enhancers of LPS induced genes bound by the Pioneer factor
PU.1 (Ghisletti et al., 2010). Our results suggest that Junb and
Atf3 may be the AP-1 components at these sites. At the bottom
tier we find factors that are more dynamic and control more
specific sets of genes that have common biological functions.
For instance, the Stat TFs target the late induced anti viral genes,
while the Nfkb factors Rel, Relb and Nfkb1 target the inflamma-
tory program.
To better characterize the TFs in the hierarchy we consoli-
dated the various binding properties discussed above: (1)
number of bound regions, (2) ratio of enhancer to promoter
binding, (3) percent of dynamic binding events, (4) fraction of
regions bound in isolation, (5) fraction of all DNA motifs in the
genome bound by the factor, (6) Conservation of binding sites
(see Supplemental Information) (7) number of outgoing edges
in the hierarchy, and (8) number of incoming edges in the hier-
archy. Using Principal Component Analysis (Figure 6B) we found
that the Pioneer factors, PU.1 and Cebpb clearly separate from
all other factors. Both Cebpb and PU.1 are abundantly bound
already in un-stimulated cells and cover the majority of sites
bound by other TFs, but are also found in ‘‘isolated’’ sites with
no binding by any of the analyzed TF. Furthermore, the binding
of Cebpb and PU.1 is relatively static during the response,
comparable to the histone marks and Ctcf (Figures 4B and
S2C–S2I). The remaining factors form at least two additional
sub-groups. Factors in one group (Figure 6B green) bind many
genes, but rarely bind in isolation (average 5% alone), have
a larger proportion of dynamic binding events (36% versus
12%) compared to the pioneers, and form an intermediate layer
in the network, between the pioneers and the nonpioneer factors
(Figure 6A). The remaining factors (Figure 6B, red) tend to bind
fewer genes, are mostly dynamic, tend to preferentially bind
promoters, and are located lower in the hierarchy.
Figure 5. Associating TF Binding Dynamics with gene Expression
(A) Differentially expressed genes were clustered by expression (RNA-Seq) and T
repressed clusters. The x axis of the left heatmap shows fold change in RNA exp
compared with the un-stimulated levels. Similarly, the second heatmap on the l
60 min, 120 min and 240 min). The third heatmap displays binding enrichment s
binding over time relative to the un-stimulated state.
(B and C) Left: Cartoon model depicting the transcriptional regulation of the lat
significant binding enrichment on genes in the cluster (Experimental Procedures).
and Nfkbiz (Immediate early cluster II).
M
The factor classes are also distinguished by their effect on
gene expression in a manner consistent with a ‘layered’ hierar-
chical organization. Pioneer binding correlates to a lesser degree
with gene induction levels than factors in other tiers. Binding of
second tier factors in the un-stimulated state correlates with
the potential for induction (Figures S5A and S5B), but has lower
enrichment for specific functional categories (Table S4). The re-
maining factors tend to bind a smaller number of regions from
specific functional categories (e.g., Stat1 with antiviral genes,
E2f4 with cell cycle genes, Runx1 with Inflammatory genes)
and dynamically coincide with the induction of genes poststim-
ulation (Figures 5, S5C, and S5D).
DISCUSSION
Our results indicate that the response of DCs to a pathogenic
stimulus is encoded by a multilayered TF network that has at
least three major layers (Figure 6): Pioneer factors potentiate
binding by opening previously inaccessible sites (Bossard and
Zaret, 1998; Cirillo et al., 2002; Heinz et al., 2010; Lupien et al.,
2008). These new elements are occupied in a relatively static
manner by second tier of TFs (e.g., Junb) that prime the response
and set the basal expression levels of thousands of genes, and
thus term them ‘‘Primer’’ factors. The final tier consists of TFs
that bind subsets of genes, often in a very dynamic fashion,
and usually at genes of a shared biological process (Smale,
2012).
The layer architecture we propose helps explain how the cell’s
expression potential is set during lineage commitment: while
Pioneer factors initiate chromatin remodeling, Primer factors
may serve as beacons, which upon stimulation direct other
TFs or posttranslation modifying enzymes to the appropriate
genomic sites, a role previously suggested for pioneer factors
such as Cebpb, PU.1, E2a and Ebf (Cirillo et al., 2002; Heinz
et al., 2010).
Future work will be required to elucidate the exact mecha-
nisms and nuclear complexes that these different classes of
factors associate with to execute their diverse functions. For
instance, in several cases we observe a Primer factor from one
homotypic family joined or replaced by another factor from the
same family (e.g., Egr1-Egr2, Irf members and several AP-1
factors) this may suggest that a partial role of the priming factors
is to maintain the binding site or serve as a docking point for the
dynamic partners from the same family. This proposed model
may generalize to other transcriptional responses in different
cell types (Mullen et al., 2011; Trompouki et al., 2011).
Our understanding of mammalian regulatory circuits is cur-
rently limited by technical constraints such as differences in
F binding. The heat map depicts all the induced clusters and 3 representative
ression (RNA-Seq) for 4 time-points (1hr, 2hrs, 4hrs and 6hrs) post stimulation
eft shows fold changes in Pol-II enrichment for 5 time-points (15 min, 30 min,
cores at the un-stimulated state. The fourth heatmap shows fold changes of
e induced cluster II (B) and immediate early cluster II (C). Shown are TF with
Right: IGV tracks, showing the loci of representative genes: Stat1 (Late induced)
olecular Cell 47, 1–13, September 14, 2012 ª2012 Elsevier Inc. 9
A
B
C
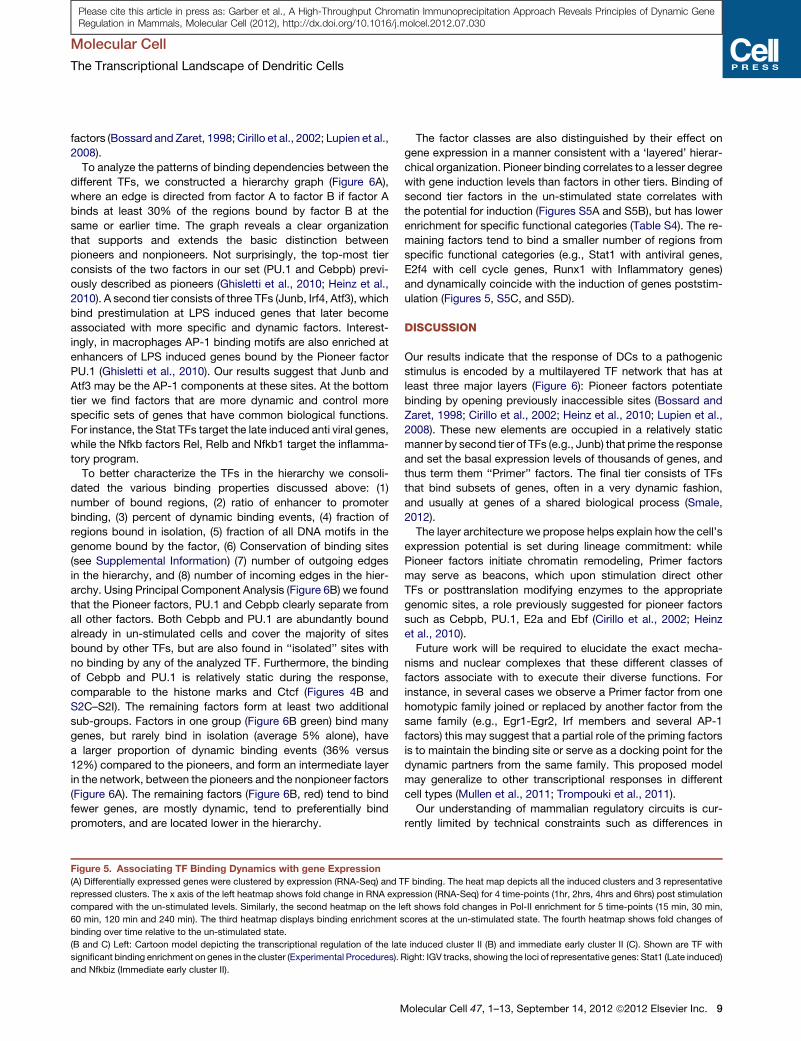
Figure 6. Diversity of Binding Properties Suggests
a Layered TF Architecture
(A) The TF hierarchy graph. A directed edge goes from
a TF X to a TF Y if X binds in at least 30% of the regions
bound by Y at the same or earlier time. Edge color is
determined by the coverage of X over Y (30%–100%; see
Table S5 for coverage values). The nodes are color coded
according to the percentage of binding sites that were
already bound prestimulation. For clarity of presentation
we employed a pruning strategy (Experimental Proce-
dures) that removes direct links between nodes at the top
of the hierarchy to nodes at the bottom of the hierarchy.
Each connected component in the network (rooted at
PU.1 or Cebpb) represents a unique combination of TF.
The combinations in the trimmed network cover 78% of
the TF-region binding data. The number of out-going
edges in the nonpruned hierarchy graph (out degree) for
nodes at different layers is provided on the left (presented
values are the fraction of the maximum out degree).
(B) Principal Components Analysis was performed with
several binding characteristics (Experimental Proce-
dures). The plot depicts the projections of the TFs and the
loading of the different covariates for the first two principal
components.
(C) Model depicting the layered TF network architecture:
Pioneer factors initially bind and initiate remodeling of the
epigenome, strong binders prime targets for expression
and specific TFs control expression of smaller subsets of
genes.
Molecular Cell
The Transcriptional Landscape of Dendritic Cells
10 Molecular Cell 47, 1–13, September 14, 2012 ª2012 Elsevier Inc.
Please cite this article in press as: Garber et al., A High-Throughput Chromatin Immunoprecipitation Approach Reveals Principles of Dynamic GeneRegulation in Mammals, Molecular Cell (2012), http://dx.doi.org/10.1016/j.molcel.2012.07.030
Molecular Cell
The Transcriptional Landscape of Dendritic Cells
Please cite this article in press as: Garber et al., A High-Throughput Chromatin Immunoprecipitation Approach Reveals Principles of Dynamic GeneRegulation in Mammals, Molecular Cell (2012), http://dx.doi.org/10.1016/j.molcel.2012.07.030
the efficiency of antibodies or TF-DNA crosslinking. To over-
come these limitations it will be important to generate refer-
ence-binding maps using tagged TFs, to directly benchmark
antibody efficiency. The resulting inventory of ChIP antibodies
and tagged TF libraries will enable the exploration of differences
in TF physical networks under different conditions, cell types,
or individuals in a population, and provide insights into the
mammalian regulatory code and the role of specific cis-binding
elements in disease (Kasowski et al., 2010). Such efforts will
likely extend our proposed layered organization to other cellular
states, and may enable efficient engineering of cellular identities
by controlling the expression and timing of different regulatory
layers.
EXPERIMENTAL PROCEDURES
HT-ChIP
20 million DC were used for each ChIP experiment. Cells were fixed for 10 min
with 1% formaldehyde, quenched with glycine and washed with ice-cold PBS
and pellets where flash frozen in liquid nitrogen. Cross-linked DC where
thawed on ice and resuspended in RIPA lysis buffer supplemented with
protease inhibitor. Cells were lysed for 10 min on ice and the chromatin was
sheared. The sonicated cell lysate was cleared by centrifugation and mixed
with 75 ul of protein G magnetic dynabeads (Invitrogen) coupled to target anti-
body in 96 well plates and incubated over night at 4 degrees. Using 96 well
magnets unbound cell lysate was removed and samples was washed 5 times
with cold RIPA, twice with high salt RIPA, twice with LiCl buffer, twice with TE,
and then eluted in 50 ul of elution buffer. The eluate was reverse crosslinked at
65C for 4 hr and then treated sequentially with 2ul of RNaseA for 30min and 2.5
ul of Proteinase K for two hours. Solid-phase reversible immobilization (SPRI)
cleanup steps were performed in 96 well plates using the Bravo liquid
handling platform (Agilent) using a modified version of (Fisher et al., 2011).
120ul SPRI beads were added to the reverse-crosslinked samples mixed
and incubated for 2 min. Supernatant were separated from the beads using
a 96-well magnet for 4 min. Beads were washed twice on the magnet with
70% ethanol and then air-dried for 4 min. The DNA was eluted in 40 ul EB
buffer. For the remainder of the library construction process (DNA end-repair,
A-base addition, adaptor ligation and enrichment) a general SPRI cleanup
involves addition of buffer containing 20% PEG and 2.5 M NaCl to the DNA
reaction products (without moving the sample from the original well position).
All enzymatic steps are carried out using enzymes from New England Biolabs.
A more detailed description of the methods is provided in the Supplemen-
tal Experimental Procedures and http://www.weizmann.ac.il/immunology/
AmitLab/data-and-method/HT-ChIP/.
Antibody Quality Control, Nanostring Probe Design and Enrichment
Validation
We designed �4 probes targeting regulatory regions of �200 genes centered
at the TSS and complemented this set with two probes tiling of any significant
PolII peak or K4me3 peak that lied within the gene body or any significant
K4me3 peak that lied within 30Kb of the TSS of the genes we targeted. The
final probeset consisted of 786 probes. See Experimental Procedures for
more information.
Dendritic Cell Isolation, Culture, and LPS Stimulation
To obtain sufficient number of cells, we implemented a modified version of the
DCs isolation used in (Lutz et al., 1999). See Experimental Procedures for more
detailed information.
RNA Extraction and RNA-Seq Library Preparation
Total RNA was extracted with QIAzol reagent following the miRNeasy kit’s
procedure (QIAGEN), and sample quality was tested on a 2100 Bioanalyzer
(Agilent). We prepared the RNA-A+-Seq libraries using the ‘dUTP second
strand (strand specific) protocol as described in (Levin et al., 2010).
M
Sequencing and Read Alignments
ChIP libraries were indexed, pooled and sequenced on Illumina HiSeq-2000
sequencers at the Broad Institute sequencing center. Reads were aligned to
the reference mouse genome NCBI37, using BWA (Li and Durbin, 2009)
version 0.5.7. RNA sequencing reads were aligned to the mouse reference
genome (NCBI 37, MM9) using the TopHat aligner, version 1.1.4 (Trapnell
et al., 2009) See Supplemental Information for more information.
Peak Calling
We implemented our contiguous segmentation algorithm, described in (Gutt-
man et al., 2009) as part of the Scripture package (available from http://www.
broadinstitute.org/software/scripture/) and used it to call, score and filter
peaks for both chromatin and TF libraries. See Supplemental Information for
more information.
Transcriptome Annotation and Quantification (RNA-Seq)
Top-Hat alignments were processed by Scripture (Guttman et al., 2010) to
obtain significantly expressed transcripts for each time course. Only multi-
exonic transcripts were retained. Quantification was used using the constit-
uent model (Garber et al., 2011 and Supplemental Information).
Motif Analysis
We performed both de novo motif discovery and known motif matching using
theMEME-ChIP pipeline (http://meme.nbcr.net/meme4_6_1/memechip-intro.
html).
Defining TF-region and TF-Gene Associations
The binding value of a TF in a region is the sum of enrichment scores over all
the peaks that pass the detection cutoff during at least one time point. Gain or
loss of binding are defined when there is at least 3-fold change in the binding
value compared to the basal state (at t = 0). We associate a gene with a gain
(loss) event if at least 50% of its enhancers or 50% its promoters are associ-
ated with gain (loss). The association of regulatory regions with genes is
described in the Supplemental Information.
A Random Model for Binding Complexity
We compared the observed TF complexities (Figure 4A) to a random model
under which the complexity of a region is proportional to its length (Supple-
mental Information). We use this analysis to define the cutoff for HOT regions
as the minimal complexity value (x > 2) for which the observed frequency is
higher by at least two fold than the random one. The selected cutoff was
x = 8 (Figure S8).
Clustering
We employ a two-step k-means clustering process: first the genes were clus-
tered by their temporal expression profiles, then each cluster is partitioned
using the TF binding data. We used a randomization test in order to evaluate
the dependency between the expression and binding data, as captured by
the cluster analysis. To this end, we compared the distribution of cluster sizes
obtained with the original data to that obtained from randomized instances,
shuffling the binding data while retaining the expression levels and the number
of binding TF per-gene. We find the original clusters to be larger (Kolmogorov-
Smirnov p < 10�10).
ACCESSION NUMBERS
Complete sequencing data sets are available at theGene ExpressionOmnibus
(accession number GSE36104).
SUPPLEMENTAL INFORMATION
Supplemental Information includes six figures, six tables, Supplemental
Experimental Procedures, and Supplemental References and can be found
with this article online at http://dx.doi.org/10.1016/j.molcel.2012.07.030.
olecular Cell 47, 1–13, September 14, 2012 ª2012 Elsevier Inc. 11
Molecular Cell
The Transcriptional Landscape of Dendritic Cells
Please cite this article in press as: Garber et al., A High-Throughput Chromatin Immunoprecipitation Approach Reveals Principles of Dynamic GeneRegulation in Mammals, Molecular Cell (2012), http://dx.doi.org/10.1016/j.molcel.2012.07.030
ACKNOWLEDGMENTS
We thank Schraga Schwartz, Tommy Kaplan, Ami Citri, Kevin Struhl, Gioac-
chino Natoli, Richard Young, and John Rinn for valuable discussions and
comments; Leslie Gaffney for artwork; Jim Bochicchio for project manage-
ment; and the Broad Sequencing Platform. This project was supported by
the Human Frontiers Science Program; Career Development Award; an ISF;
Bikura Institutional Research Grant Program; ERC starting grant 309788
(I.A.); by the Broad Institute (M.G., N.Y., I.A., A.R.); and by DARPA
D12AP00004 (M.G.). HHMI, NHGRI grant 1P01HG005062-01; an NIH
PIONEER award DP1-OD003958-01; a Burroughs-Wellcome Fund Career
Award at the Scientific Interface; and a Center for Excellence in Genome
Science from the NHGRI 1P50HG006193 (A.R.); A.R. is a fellow of the Merkin
Foundation for Stem Cell Research at the Broad Institute and by the New
England Regional Center for Excellence/Biodefense and Emerging Infectious
Disease U54 AI057159 (N.H.). EU FP7Model-In (N.F.) and US-Israel Binational
Science Foundation (N.F. and A.R.)
Received: April 12, 2012
Revised: July 3, 2012
Accepted: July 27, 2012
Published online: August 30, 2012
REFERENCES
Amit, I., Citri, A., Shay, T., Lu, Y., Katz, M., Zhang, F., Tarcic, G., Siwak, D.,
Lahad, J., Jacob-Hirsch, J., et al. (2007). A module of negative feedback regu-
lators defines growth factor signaling. Nat. Genet. 39, 503–512.
Amit, I., Garber, M., Chevrier, N., Leite, A.P., Donner, Y., Eisenhaure, T.,
Guttman, M., Grenier, J.K., Li, W., Zuk, O., et al. (2009). Unbiased reconstruc-
tion of a mammalian transcriptional network mediating pathogen responses.
Science 326, 257–263.
Arnosti, D.N., and Kulkarni, M.M. (2005). Transcriptional enhancers: Intelligent
enhanceosomes or flexible billboards? J. Cell. Biochem. 94, 890–898.
Bailey, T.L., and Elkan, C. (1994). Fitting a mixture model by expectation maxi-
mization to discover motifs in biopolymers. Proc. Int. Conf. Intell. Syst. Mol.
Biol. 2, 28–36.
Barish, G.D., Yu, R.T., Karunasiri, M., Ocampo, C.B., Dixon, J., Benner, C.,
Dent, A.L., Tangirala, R.K., and Evans, R.M. (2010). Bcl-6 and NF-kappaB cis-
tromes mediate opposing regulation of the innate immune response. Genes
Dev. 24, 2760–2765.
Barski, A., Cuddapah, S., Cui, K., Roh, T.Y., Schones, D.E., Wang, Z., Wei, G.,
Chepelev, I., and Zhao, K. (2007). High-resolution profiling of histone methyl-
ations in the human genome. Cell 129, 823–837.
Bossard, P., and Zaret, K.S. (1998). GATA transcription factors as potentiators
of gut endoderm differentiation. Development 125, 4909–4917.
Capaldi, A.P., Kaplan, T., Liu, Y., Habib, N., Regev, A., Friedman, N., and
O’Shea, E.K. (2008). Structure and function of a transcriptional network acti-
vated by the MAPK Hog1. Nat. Genet. 40, 1300–1306.
Cirillo, L.A., Lin, F.R., Cuesta, I., Friedman, D., Jarnik, M., and Zaret, K.S.
(2002). Opening of compacted chromatin by early developmental transcription
factors HNF3 (FoxA) and GATA-4. Mol. Cell 9, 279–289.
Davidson, E.H. (2010). Emerging properties of animal gene regulatory
networks. Nature 468, 911–920.
Fisher, S., Barry, A., Abreu, J., Minie, B., Nolan, J., Delorey, T.M., Young, G.,
Fennell, T.J., Allen, A., Ambrogio, L., et al. (2011). A scalable, fully automated
process for construction of sequence-ready human exome targeted capture
libraries. Genome Biol. 12, R1.
Garber, M., Grabherr, M.G., Guttman, M., and Trapnell, C. (2011).
Computational methods for transcriptome annotation and quantification using
RNA-seq. Nat. Methods 8, 469–477.
Gerstein, M.B., Lu, Z.J., Van Nostrand, E.L., Cheng, C., Arshinoff, B.I., Liu, T.,
Yip, K.Y., Robilotto, R., Rechtsteiner, A., Ikegami, K., et al; modENCODE
12 Molecular Cell 47, 1–13, September 14, 2012 ª2012 Elsevier Inc.
Consortium. (2010). Integrative analysis of the Caenorhabditis elegans
genome by the modENCODE project. Science 330, 1775–1787.
Ghisletti, S., Barozzi, I., Mietton, F., Polletti, S., De Santa, F., Venturini, E.,
Gregory, L., Lonie, L., Chew, A., Wei, C.L., et al. (2010). Identification and char-
acterization of enhancers controlling the inflammatory gene expression
program in macrophages. Immunity 32, 317–328.
Graf, T., and Enver, T. (2009). Forcing cells to change lineages. Nature 462,
587–594.
Gupta, S., Stamatoyannopoulos, J.A., Bailey, T.L., and Noble, W.S. (2007).
Quantifying similarity between motifs. Genome Biol. 8, R24.
Guttman, M., Amit, I., Garber, M., French, C., Lin, M.F., Feldser, D., Huarte, M.,
Zuk, O., Carey, B.W., Cassady, J.P., et al. (2009). Chromatin signature reveals
over a thousand highly conserved large non-coding RNAs in mammals. Nature
458, 223–227.
Guttman, M., Garber, M., Levin, J.Z., Donaghey, J., Robinson, J., Adiconis, X.,
Fan, L., Koziol, M.J., Gnirke, A., Nusbaum, C., et al. (2010). Ab initio recon-
struction of cell type-specific transcriptomes in mouse reveals the conserved
multi-exonic structure of lincRNAs. Nat. Biotechnol. 28, 503–510.
Harbison, C.T., Gordon, D.B., Lee, T.I., Rinaldi, N.J., Macisaac, K.D., Danford,
T.W., Hannett, N.M., Tagne, J.B., Reynolds, D.B., Yoo, J., et al. (2004).
Transcriptional regulatory code of a eukaryotic genome. Nature 431, 99–104.
Hargreaves, D.C., Horng, T., and Medzhitov, R. (2009). Control of inducible
gene expression by signal-dependent transcriptional elongation. Cell 138,
129–145.
Heintzman, N.D., and Ren, B. (2009). Finding distal regulatory elements in the
human genome. Curr. Opin. Genet. Dev. 19, 541–549.
Heinz, S., Benner, C., Spann, N., Bertolino, E., Lin, Y.C., Laslo, P., Cheng, J.X.,
Murre, C., Singh, H., and Glass, C.K. (2010). Simple combinations of lineage-
determining transcription factors prime cis-regulatory elements required for
macrophage and B cell identities. Mol. Cell 38, 576–589.
Johnson, D.S., Mortazavi, A., Myers, R.M., andWold, B. (2007). Genome-wide
mapping of in vivo protein-DNA interactions. Science 316, 1497–1502.
Junion, G., Spivakov, M., Girardot, C., Braun, M., Gustafson, E.H., Birney, E.,
and Furlong, E.E. (2012). A transcription factor collective defines cardiac cell
fate and reflects lineage history. Cell 148, 473–486.
Kasowski, M., Grubert, F., Heffelfinger, C., Hariharan, M., Asabere, A.,
Waszak, S.M., Habegger, L., Rozowsky, J., Shi, M., Urban, A.E., et al.
(2010). Variation in transcription factor binding among humans. Science 328,
232–235.
Lange-zu Dohna, C., Brandeis, M., Berr, F., Mossner, J., and Engeland, K.
(2000). A CDE/CHR tandem element regulates cell cycle-dependent repres-
sion of cyclin B2 transcription. FEBS Lett. 484, 77–81.
Laslo, P., Spooner, C.J.,Warmflash, A., Lancki, D.W., Lee, H.J., Sciammas, R.,
Gantner, B.N., Dinner, A.R., and Singh, H. (2006). Multilineage transcriptional
priming and determination of alternate hematopoietic cell fates. Cell 126,
755–766.
Levin, J.Z., Yassour, M., Adiconis, X., Nusbaum, C., Thompson, D.A.,
Friedman, N., Gnirke, A., and Regev, A. (2010). Comprehensive comparative
analysis of strand-specific RNA sequencing methods. Nat Methods 7,
709–715.
Li, H., and Durbin, R. (2009). Fast and accurate short read alignment with
Burrows-Wheeler transform. Bioinformatics 25, 1754–1760.
Lupien, M., Eeckhoute, J., Meyer, C.A., Wang, Q., Zhang, Y., Li, W., Carroll,
J.S., Liu, X.S., and Brown, M. (2008). FoxA1 translates epigenetic signatures
into enhancer-driven lineage-specific transcription. Cell 132, 958–970.
Lutz, M.B., Kukutsch, N., Ogilvie, A.L., Rossner, S., Koch, F., Romani, N., and
Schuler, G. (1999). An advanced culture method for generating large quantities
of highly pure dendritic cells from mouse bone marrow. J. Immunol. Methods
223, 77–92.
Mikkelsen, T.S., Ku, M., Jaffe, D.B., Issac, B., Lieberman, E., Giannoukos, G.,
Alvarez, P., Brockman, W., Kim, T.K., Koche, R.P., et al. (2007). Genome-wide
maps of chromatin state in pluripotent and lineage-committed cells. Nature
448, 553–560.
Molecular Cell
The Transcriptional Landscape of Dendritic Cells
Please cite this article in press as: Garber et al., A High-Throughput Chromatin Immunoprecipitation Approach Reveals Principles of Dynamic GeneRegulation in Mammals, Molecular Cell (2012), http://dx.doi.org/10.1016/j.molcel.2012.07.030
Mullen, A.C., Orlando, D.A., Newman, J.J., Loven, J., Kumar, R.M., Bilodeau,
S., Reddy, J., Guenther, M.G., DeKoter, R.P., and Young, R.A. (2011). Master
transcription factors determine cell-type-specific responses to TGF-
b signaling. Cell 147, 565–576.
Negre, N., Brown, C.D., Ma, L., Bristow, C.A., Miller, S.W., Wagner, U.,
Kheradpour, P., Eaton, M.L., Loriaux, P., Sealfon, R., et al. (2011). A cis-regu-
latory map of the Drosophila genome. Nature 471, 527–531.
Pruitt, K.D., Tatusova, T., andMaglott, D.R. (2007). NCBI reference sequences
(RefSeq): a curated non-redundant sequence database of genomes, tran-
scripts and proteins. Nucleic Acids Res. 35 (Database issue), D61–D65.
Rabani, M., Levin, J.Z., Fan, L., Adiconis, X., Raychowdhury, R., Garber, M.,
Gnirke, A., Nusbaum, C., Hacohen, N., Friedman, N., et al. (2011). Metabolic
labeling of RNA uncovers principles of RNA production and degradation
dynamics in mammalian cells. Nat. Biotechnol. 29, 436–442.
Ram, O., Goren, A., Amit, I., Shoresh, N., Yosef, N., Ernst, J., Kellis, M.,
Gymrek, M., Issner, R., Coyne, M., et al. (2011). Combinatorial patterning of
chromatin regulators uncovered by genome-wide location analysis in human
cells. Cell 147, 1628–1639.
Ramirez-Carrozzi, V.R., Braas, D., Bhatt, D.M., Cheng, C.S., Hong, C., Doty,
K.R., Black, J.C., Hoffmann, A., Carey, M., and Smale, S.T. (2009). A unifying
model for the selective regulation of inducible transcription by CpG islands and
nucleosome remodeling. Cell 138, 114–128.
Robinson, J.T., Thorvaldsdottir, H., Winckler, W., Guttman, M., Lander, E.S.,
Getz, G., and Mesirov, J.P. (2011). Integrative genomics viewer. Nat.
Biotechnol. 29, 24–26.
Roy, S., Ernst, J., Kharchenko, P.V., Kheradpour, P., Negre, N., Eaton, M.L.,
Landolin, J.M., Bristow, C.A., Ma, L., Lin, M.F., et al; modENCODE
M
Consortium. (2010). Identification of functional elements and regulatory
circuits by Drosophila modENCODE. Science 330, 1787–1797.
Segal, E., Shapira, M., Regev, A., Pe’er, D., Botstein, D., Koller, D., and
Friedman, N. (2003). Module networks: identifying regulatory modules and
their condition-specific regulators from gene expression data. Nat. Genet.
34, 166–176.
Sharpe, A.H., and Freeman, G.J. (2002). The B7-CD28 superfamily. Nat. Rev.
Immunol. 2, 116–126.
Smale, S.T. (2012). Dimer-specific regulatory mechanisms within the NF-kB
family of transcription factors. Immunol. Rev. 246, 193–204.
Struhl, K. (2001). Gene regulation. A paradigm for precision. Science 293,
1054–1055.
Thanos, D., andManiatis, T. (1992). The highmobility group protein HMG I(Y) is
required for NF-kappa B-dependent virus induction of the human IFN-beta
gene. Cell 71, 777–789.
Trapnell, C., Pachter, L., and Salzberg, S.L. (2009). TopHat: discovering splice
junctions with RNA-Seq. Bioinformatics 25, 1105–1111.
Trompouki, E., Bowman, T.V., Lawton, L.N., Fan, Z.P., Wu, D.C., DiBiase, A.,
Martin, C.S., Cech, J.N., Sessa, A.K., Leblanc, J.L., et al. (2011). Lineage regu-
lators direct BMP andWnt pathways to cell-specific programs during differen-
tiation and regeneration. Cell 147, 577–589.
Weake, V.M., and Workman, J.L. (2010). Inducible gene expression: diverse
regulatory mechanisms. Nat. Rev. Genet. 11, 426–437.
Zinzen, R.P., Girardot, C., Gagneur, J., Braun, M., and Furlong, E.E. (2009).
Combinatorial binding predicts spatio-temporal cis-regulatory activity.
Nature 462, 65–70.
olecular Cell 47, 1–13, September 14, 2012 ª2012 Elsevier Inc. 13
Related Documents