MOLECULAR AND CELLULAR BIOLOGY, July 2004, p. 5923–5936 Vol. 24, No. 13 0270-7306/04/$08.000 DOI: 10.1128/MCB.24.13.5923–5936.2004 Copyright © 2004, American Society for Microbiology. All Rights Reserved. Evaluation of Myc E-Box Phylogenetic Footprints in Glycolytic Genes by Chromatin Immunoprecipitation Assays† Jung-whan Kim, 1 Karen I. Zeller, 2 Yunyue Wang, 3 Anil G. Jegga, 4,5,6 Bruce J. Aronow, 4,5,6 Kathryn A. O’Donnell, 7 and Chi V. Dang 1,2,3,7 * Graduate Program of Pathobiology, 1 Department of Medicine, 2 Graduate Program in Cellular and Molecular Medicine, 3 and Program in Human Genetics and Molecular Biology, 7 The Johns Hopkins University School of Medicine, Baltimore, Maryland 21205, and Division of Pediatric Informatics 4 and Division of Molecular Developmental Biology, 5 Children’s Hospital Research Foundation, Children’s Hospital Medical Center, and Department of Biomedical Engineering, University of Cincinnati, 6 Cincinnati, Ohio 45229 Received 23 January 2004/Returned for modification 15 March 2004/Accepted 8 April 2004 Prediction of gene regulatory sequences using phylogenetic footprinting has advanced considerably but lacks experimental validation. Here, we report whether transcription factor binding sites predicted by dot plotting or web-based Trafac analysis could be validated by chromatin immunoprecipitation assays. MYC overexpres- sion enhances glycolysis without hypoxia and hence may contribute to altered tumor metabolism. Because the full spectrum of glycolytic genes directly regulated by Myc is not known, we chose Myc as a model transcription factor to determine whether it binds target glycolytic genes that have conserved canonical Myc binding sites or E boxes (5-CACGTG-3). Conserved canonical E boxes in ENO1, HK2, and LDHA occur in 31- to 111-bp islands with high interspecies sequence identity (>65%). Trafac analysis revealed another region in ENO1 that corresponds to a murine region with a noncanonical E box. Myc bound all these conserved regions well in the human P493-6 B lymphocytes. We also determined whether Myc could bind nonconserved canonical E boxes found in the remaining human glycolytic genes. Myc bound PFKM, but it did not significantly bind GPI, PGK1, and PKM2. Binding to BPGM, PGAM2, and PKLR was not detected. Both GAPD and TPI1 do not have conserved E boxes but are induced and bound by Myc through regions with noncanonical E boxes. Our results indicate that Myc binds well to conserved canonical E boxes, but not nonconserved E boxes. However, the binding of Myc to unpredicted genomic regions with noncanonical E boxes reveals a limitation of phylogenetic footprinting. In aggregate, these observations indicate that Myc is an important regulator of glycolytic genes, suggesting that MYC plays a key role in a switch to glycolytic metabolism during cell proliferation or tumorigenesis. Defining transcriptional regulatory networks is essential for our understanding of embryonic development, cell growth, and tumorigenesis. Throughout evolution, biologically important genes and their regulatory elements have been selectively con- served (34). Completing sequencing the genomes of a variety of species provides a unique opportunity for the identification of transcriptional regulatory regions through interspecies se- quence comparison, also known as phylogenetic footprinting. In particular, noncoding sequences with interspecies sequence identity approaching that of exonic sequences are enriched with putative transcription factor binding sites. A number of approaches that allow the prediction of tran- scriptional regulatory regions in any genomic region through comparisons of mouse and human sequences have been re- ported (4, 19, 21, 24). These approaches identify conserved regions that contain putative transcription factor binding sites. However, a purely computational approach tends to be replete with the uncertainty as to whether a predicted cis-regulatory module is biologically functional. Several algorithms have been developed and experimentally evaluated for the discovery of candidate regulatory regions, such as those in the Drosophila genome (2, 26). In mammalian systems, we and other groups have evaluated the functionality of the transcriptional regulation of conserved cis elements. These studies, however, addressed individual genes or a small set of genes rather than a series of functionally related genes, such as those encoding a specific biochemical pathway. In our previous studies, putative direct Myc target genes were ran- domly selected and subjected to chromatin immunoprecipita- tion (ChIP) assays to identify Myc binding sites (43). In addi- tion to class I genes in which Myc binding regions are highly conserved among species, we identified another group of genes termed class II genes, in which Myc binding regions do not contain conserved sequences (18). Thus, experimental valida- tion of these computational approaches is particularly impor- tant in a well-defined model system involving a set of coordi- nately regulated genes, such as those encoding components of a metabolic pathway. Although Myc and its target genes have been studied at a broader genome-wide level (6, 7, 14, 16, 17, 23, 25, 27, 29–31, 35, 41), the coupling of comparative interspecies sequence analysis and experimental validation of Myc target genes in- volved in a single metabolic pathway has not been thoroughly studied. It is particularly intriguing to note that ODC is not * Corresponding author. Mailing address: Ross Research Building, Room 1032, The Johns Hopkins University School of Medicine, 720 Rutland Ave., Baltimore, MD 21205. Phone: (410) 955-2773. Fax: (410) 955-0185. E-mail: [email protected]. † Supplemental material for this article may be found at http://mcb .asm.org/. 5923 on February 12, 2016 by guest http://mcb.asm.org/ Downloaded from

Welcome message from author
This document is posted to help you gain knowledge. Please leave a comment to let me know what you think about it! Share it to your friends and learn new things together.
Transcript

MOLECULAR AND CELLULAR BIOLOGY, July 2004, p. 5923–5936 Vol. 24, No. 130270-7306/04/$08.00�0 DOI: 10.1128/MCB.24.13.5923–5936.2004Copyright © 2004, American Society for Microbiology. All Rights Reserved.
Evaluation of Myc E-Box Phylogenetic Footprints in Glycolytic Genesby Chromatin Immunoprecipitation Assays†
Jung-whan Kim,1 Karen I. Zeller,2 Yunyue Wang,3 Anil G. Jegga,4,5,6 Bruce J. Aronow,4,5,6
Kathryn A. O’Donnell,7 and Chi V. Dang1,2,3,7*Graduate Program of Pathobiology,1 Department of Medicine,2 Graduate Program in Cellular and Molecular Medicine,3 and
Program in Human Genetics and Molecular Biology,7 The Johns Hopkins University School of Medicine, Baltimore,Maryland 21205, and Division of Pediatric Informatics4 and Division of Molecular Developmental Biology,5
Children’s Hospital Research Foundation, Children’s Hospital Medical Center, and Departmentof Biomedical Engineering, University of Cincinnati,6 Cincinnati, Ohio 45229
Received 23 January 2004/Returned for modification 15 March 2004/Accepted 8 April 2004
Prediction of gene regulatory sequences using phylogenetic footprinting has advanced considerably but lacksexperimental validation. Here, we report whether transcription factor binding sites predicted by dot plottingor web-based Trafac analysis could be validated by chromatin immunoprecipitation assays. MYC overexpres-sion enhances glycolysis without hypoxia and hence may contribute to altered tumor metabolism. Because thefull spectrum of glycolytic genes directly regulated by Myc is not known, we chose Myc as a model transcriptionfactor to determine whether it binds target glycolytic genes that have conserved canonical Myc binding sites orE boxes (5�-CACGTG-3�). Conserved canonical E boxes in ENO1, HK2, and LDHA occur in 31- to 111-bpislands with high interspecies sequence identity (>65%). Trafac analysis revealed another region in ENO1 thatcorresponds to a murine region with a noncanonical E box. Myc bound all these conserved regions well in thehuman P493-6 B lymphocytes. We also determined whether Myc could bind nonconserved canonical E boxesfound in the remaining human glycolytic genes. Myc bound PFKM, but it did not significantly bind GPI, PGK1,and PKM2. Binding to BPGM, PGAM2, and PKLR was not detected. Both GAPD and TPI1 do not haveconserved E boxes but are induced and bound by Myc through regions with noncanonical E boxes. Our resultsindicate that Myc binds well to conserved canonical E boxes, but not nonconserved E boxes. However, thebinding of Myc to unpredicted genomic regions with noncanonical E boxes reveals a limitation of phylogeneticfootprinting. In aggregate, these observations indicate that Myc is an important regulator of glycolytic genes,suggesting that MYC plays a key role in a switch to glycolytic metabolism during cell proliferation ortumorigenesis.
Defining transcriptional regulatory networks is essential forour understanding of embryonic development, cell growth, andtumorigenesis. Throughout evolution, biologically importantgenes and their regulatory elements have been selectively con-served (34). Completing sequencing the genomes of a varietyof species provides a unique opportunity for the identificationof transcriptional regulatory regions through interspecies se-quence comparison, also known as phylogenetic footprinting.In particular, noncoding sequences with interspecies sequenceidentity approaching that of exonic sequences are enrichedwith putative transcription factor binding sites.
A number of approaches that allow the prediction of tran-scriptional regulatory regions in any genomic region throughcomparisons of mouse and human sequences have been re-ported (4, 19, 21, 24). These approaches identify conservedregions that contain putative transcription factor binding sites.However, a purely computational approach tends to be repletewith the uncertainty as to whether a predicted cis-regulatorymodule is biologically functional.
Several algorithms have been developed and experimentallyevaluated for the discovery of candidate regulatory regions,such as those in the Drosophila genome (2, 26). In mammaliansystems, we and other groups have evaluated the functionalityof the transcriptional regulation of conserved cis elements.These studies, however, addressed individual genes or a smallset of genes rather than a series of functionally related genes,such as those encoding a specific biochemical pathway. In ourprevious studies, putative direct Myc target genes were ran-domly selected and subjected to chromatin immunoprecipita-tion (ChIP) assays to identify Myc binding sites (43). In addi-tion to class I genes in which Myc binding regions are highlyconserved among species, we identified another group of genestermed class II genes, in which Myc binding regions do notcontain conserved sequences (18). Thus, experimental valida-tion of these computational approaches is particularly impor-tant in a well-defined model system involving a set of coordi-nately regulated genes, such as those encoding components ofa metabolic pathway.
Although Myc and its target genes have been studied at abroader genome-wide level (6, 7, 14, 16, 17, 23, 25, 27, 29–31,35, 41), the coupling of comparative interspecies sequenceanalysis and experimental validation of Myc target genes in-volved in a single metabolic pathway has not been thoroughlystudied. It is particularly intriguing to note that ODC is not
* Corresponding author. Mailing address: Ross Research Building,Room 1032, The Johns Hopkins University School of Medicine, 720Rutland Ave., Baltimore, MD 21205. Phone: (410) 955-2773. Fax:(410) 955-0185. E-mail: [email protected].
† Supplemental material for this article may be found at http://mcb.asm.org/.
5923
on February 12, 2016 by guest
http://mcb.asm
.org/D
ownloaded from

only the first identified bona fide Myc target gene, but it alsocontains a phylogenetically conserved intronic region bearingtandem canonical E boxes (1). MYC overexpression has beensuggested to aberrantly enhance tumor glycolysis even in the
presence of oxygen, a phenomenon termed the Warburg effect(8, 39). Thus, we chose Myc as a model transcription factor andthe glycolytic genes as model target genes to predict Mycbinding regulatory regions, which can then be experimentally
FIG. 1. Locations of canonical E boxes in the human and mouse genomic sequences and phylogenetic footprinting analysis. Genomic sequencescontaining 5 kb upstream of the transcriptional start site through intron 1 were screened for the presence of the canonical E box. The positionsof canonical E boxes and exons are mapped in the human (top of each pair) and mouse (bottom of each pair) genomic sequences. The maps showphylogenetically conserved canonical E boxes in ENO1, HK2, and LDHA genes. Conserved canonical E boxes were identified using the dot plotfeatures of OMIGA software. Conservation of the canonical E box and its extended flanking region with more than 65% sequence identity forlonger than 30 bp is indicated. The percentages of sequence identity between the two sequences are also indicated in the maps. Sequencealignments of the conserved E box and its extended flanking regions are shown below the maps. Canonical E boxes are boxed in each sequencealignment. Conserved nucleotides are shown in bold type. The regions that are amplified for the ChIP assay are indicated by the lines above thehuman gene and labeled A, B, or C in the maps.
5924 KIM ET AL. MOL. CELL. BIOL.
on February 12, 2016 by guest
http://mcb.asm
.org/D
ownloaded from

tested. We have previously found that Myc specifically trans-activates LDHA and increases the expression of other glyco-lytic enzyme genes (32, 37). Numerous studies using globalgene expression profiling methods, such as serial analysis ofgene expression (SAGE) and DNA microarrays, have foundthat Myc increases the expression of specific glycolytic enzymegenes, though these increases may be direct or indirect effectsof Myc (27–29, 35).
To identify the direct target genes of Myc and its bindingsites, we and other groups have applied various assays, includ-ing an in vitro reporter assay, electrophoresis mobility shiftassay (EMSA), and the Myc-estrogen receptor (MYC-ER)system (11). Through the use of the MYC-ER system, severalglycolytic genes, such as ENO1, GPI, HK2, LDHA, and PFKM,have been identified as direct targets of Myc (7, 29, 32, 35).However, these experimental approaches did not provide phys-
FIG. 2. (A) Organization of human and mouse glycolytic genes, which do not contain conserved canonical E-box regions. Mouse Gpi, Pfkm,and Pklr genes do not contain a canonical E box. The sequences in or around the canonical E boxes of BPGM, PFKM, PGAM2, PGK1, and PKM2were not conserved. Note that most sequences for the mouse Pfkm promoter region are not available. (B) Organization of GAPD and TPI1 genes.Human GAPD and TPI1 genes do not contain a canonical E box. The regions that are amplified for the ChIP assay are indicated by the lines abovethe human gene and labeled A, B, or C.
VOL. 24, 2004 Myc GLYCOLYTIC TARGET GENE NETWORK 5925
on February 12, 2016 by guest
http://mcb.asm
.org/D
ownloaded from
ical evidence that Myc directly activates the transcription ofthese genes through its association with specific genomic re-gions. The MYC-ER fusion protein system has been particu-larly used as a standard for the study of direct Myc targetgenes, as it allows the identification of MYC-ER-induced tar-gets upon estrogenic ligand stimulation in the presence of
cycloheximide, which prevents secondary transcriptionalevents (11). However, estrogenic ligands and cycloheximideused in these experiments may confound the effects of Myc,and the MYC-ER system is unable to reveal Myc target genesthat are in feed-forward loops. In these loops, the expression ofterminal target genes are dependent on both Myc and an
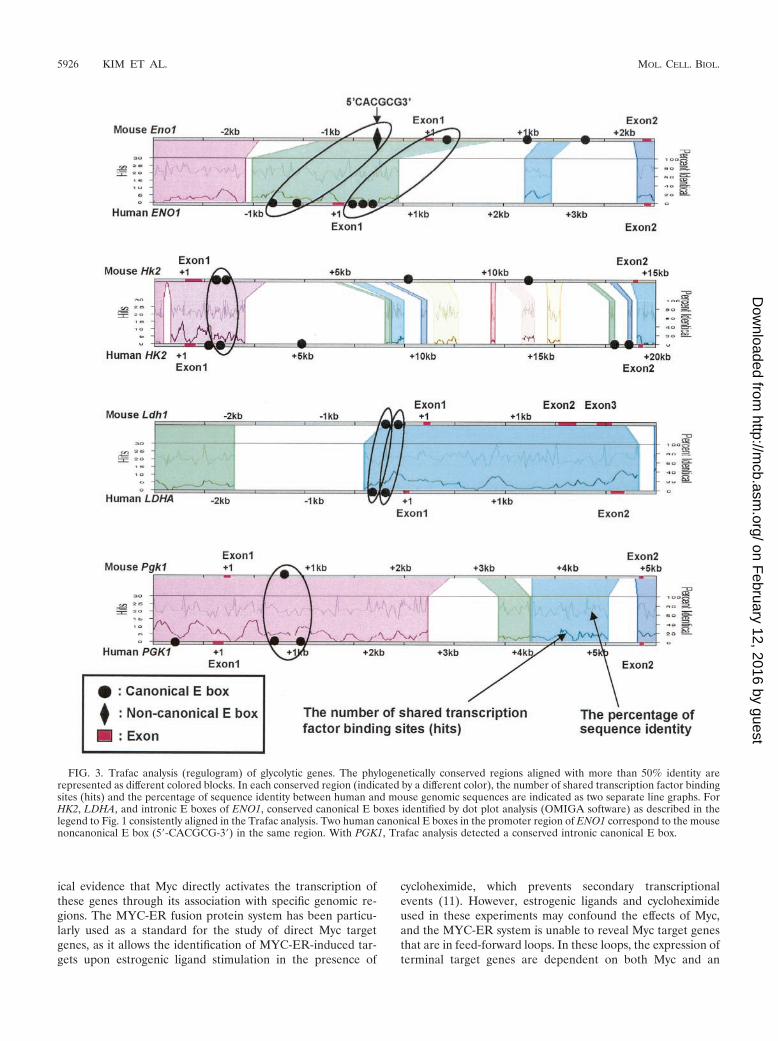
FIG. 3. Trafac analysis (regulogram) of glycolytic genes. The phylogenetically conserved regions aligned with more than 50% identity arerepresented as different colored blocks. In each conserved region (indicated by a different color), the number of shared transcription factor bindingsites (hits) and the percentage of sequence identity between human and mouse genomic sequences are indicated as two separate line graphs. ForHK2, LDHA, and intronic E boxes of ENO1, conserved canonical E boxes identified by dot plot analysis (OMIGA software) as described in thelegend to Fig. 1 consistently aligned in the Trafac analysis. Two human canonical E boxes in the promoter region of ENO1 correspond to the mousenoncanonical E box (5�-CACGCG-3�) in the same region. With PGK1, Trafac analysis detected a conserved intronic canonical E box.
5926 KIM ET AL. MOL. CELL. BIOL.
on February 12, 2016 by guest
http://mcb.asm
.org/D
ownloaded from

intermediate transcription factor that is also a direct target ofMyc.
We reasoned that functionally important genomic regionsfor Myc binding have been preferentially conserved in thedirect target genes. Given that exonic sequence identity in thehuman and mouse genomes is estimated at about 85% (40), wehave performed manual sequence alignments using dot plot-ting to identify nonexonic regions with at least 65% sequenceidentity in 30-bp segments. These cutoff criteria are adequatelystringent to predict a particular class of Myc target genes, aspreviously reported (18, 43). We also used the Trafac server toidentify potential Myc binding sites in glycolytic genes (19). Anumber of programs, including RepeatMasker (masking outrepeat elements), PipMaker-BLASTZ (sequence alignment al-gorithm), and MatInspector Professional (transcription factorbinding sequence scan), are integrated into the Trafac systemto perform phylogenetic footprinting analysis (19). Trafacanalysis predicts both canonical and noncanonical E boxes thatreside in regions that have at least 50% sequence identity inthe human and mouse genomes. Within these conserved seg-ments, we sought to identify canonical Myc binding sites or Eboxes with the consensus sequence 5�-CACGTG-3� and deter-mine whether Myc could bind these regions by ChIP assays (10,14, 23). By performing a ChIP assay, we can identify immuno-precipitated regions of the genome that are cross-linked to thebound Myc protein by amplifying the Myc-associated DNAfragments by PCR.
Our approach using Myc and 14 glycolytic genes as a modelprovides a unique opportunity not only to evaluate phyloge-netic footprinting and determine the architecture of the Myctarget glycolytic gene network but also to dissect the molecularbasis of Myc-induced altered glucose metabolism. Our resultsprovide evidence that MYC enhances aerobic glycolysis by di-rectly up-regulating the expression of ENO1, GAPD, HK2,LDHA, PFKM, and TPI1 genes, whereas Myc binding to GPI,PGK1, and PKM is diminished or absent in the cases of BPGM,PGAM2 (muscle specific), and PKLR (liver specific). Thisstudy indicates that conserved, canonical E boxes are predic-tive of significant Myc binding to glycolytic target genes, butthe absence of canonical E boxes does not exclude the possi-bility of significant Myc association.
MATERIALS AND METHODS
Phylogenetic footprinting analysis. Genomic or cDNA sequences were down-loaded from the University of California at Santa Cruz Genome Bioinformaticswebsite (http://genome.ucsc.edu), Ensembl Genome Browser (http://www.ensembl.org), or National Center for Biotechnology Information (NCBI) Ref-erence Sequence database (http://www.ncbi.nlm.nih.gov/RefSeq/). Canonical (5�-
CACGTG-3�) or noncanonical (5�-CATGTG-3�, 5�-CACGCG-3�, 5�-CATGCG-3�, 5�-CACGAG-3�, 5�-CTCGCG-3�, and 5�-CACGTTG-3�) Myc binding sites(E boxes) (3) were identified within the 5 kb upstream of the transcriptional startsite through intron 1 using the user-defined nucleic acid motifs feature ofOMIGA software (Oxford Molecular Limited, Oxford, United Kingdom). Com-putational comparison of phylogenetically conserved canonical E boxes andextended flanking sequences was performed using the dot plot feature ofOMIGA software with the parameters of a 30-bp window and more than 65%sequence identity. These parameters are less stringent than the criterion of 70%sequence identity in 50-bp windows, which has a sensitivity of only 65% (21).Identifying and visualizing shared transcription factor binding sites in the phy-logenetically conserved regulatory regions were performed using a web-basedphylogenetic footprinting analysis called Trafac (http://trafac.cchmc.org) as de-scribed previously (19).
Cell lines. The human Burkitt’s lymphoma cell line P493-6 carrying an induc-ible MYC repression system (35) and human breast epithelial A1N4 cells (22)were used for ChIP analysis. P493-6 cells were maintained in RPMI 1640 me-dium with 10% fetal bovine serum (GIBCO/BRL) and 1% streptomycin andpenicillin (Invitrogen). A1N4 cells were maintained in Improved MEM ZincOption medium (Invitrogen) with 0.5% fetal bovine serum (GIBCO/BRL), 10 ngof epidermal growth factor (EGF) (Invitrogen) per ml, 0.5 ng of hydrocortisone(Clonetics) per ml, and 5 ng of insulin (Clonetics) per ml. Incubating P493-6 cellswith 0.1 �g of tetracycline per ml for 72 h led to significant repression of MYC.
ChIP assay. P493-6 cells left untreated or treated with tetracycline for 72 h andhuman breast epithelial A1N4 cells stimulated by 20 ng of EGF (Invitrogen) perml for 24 h were used for all ChIP assays. Cells were cross-linked by formalde-hyde, and chromatin was immunoprecipitated as described previously (5). Therabbit polyclonal Myc antibody (sc-764; Santa Cruz Biotechnology) and humanhepatocyte growth factor (HGF) antibody (sc-7949; Santa Cruz Biotechnology)were used to precipitate chromatin. The total input was the supernatant from theno-antibody control. For a control, some samples were treated the same as theother samples, but these samples had no chromatin (mock control samples).Real-time PCR quantitation of precipitated chromatin fragments was performedusing a SYBR green core reagent kit (PE Applied Biosystems) on an ABI 7700sequence detection system (PE Applied Biosystems) according to the manufac-turer’s instructions. Primers were designed using Primer Express software (PEApplied Biosystems) (see Table S1 in the supplemental material for the primersequences for the ChIP assay). The data were analyzed by SDS 1.91 software (PEApplied Biosystems). Four serial 10-fold dilutions of total input DNA were usedto generate a standard curve for each primer pair. Relative amounts of eachchromatin fragment were then extrapolated on the basis of their threshold cyclevalues and determined by the percentage of the total input DNA. For eachamplification, melting curves and gel electrophoresis of the PCR product wereused to verify the identities of the PCR products. All real-time PCRs wereperformed in triplicate.
RNA analysis. MYC and glycolytic mRNA levels were determined by Northernblot analysis or quantitative real-time reverse transcription-PCR (RT-PCR).Total RNA was isolated from P493-6 cells using Trizol (Invitrogen). Five micro-grams of RNA was used in Northern blot analysis. RNA was subjected to 1.2%agarose electrophoresis and transferred to a nylon membrane (Nytran). Themembrane was probed with a human MYC gene probe or a glycolytic gene probewhich had been labeled with 32P using a random primer labeling kit (Stratagene).An ethidium bromide-stained agarose gel of 18S rRNA was used as a loadingcontrol.
Quantitative real-time RT-PCR was performed using TaqMan one-step RT-PCR master mix kit (PE Applied Biosystems) with probes and primers. Alter-natively, cDNA was reverse transcribed from the total RNA (2 �g) using Taq-Man reverse transcription reagents (PE Applied Biosystems), and subsequentreal-time PCR of cDNA was performed using the SYBR green core reagent kiton an ABI 7700 sequence detection system. Primers and probes were designed bythe Primer Express software (see Table S2 in the supplemental material for theprimers and probes). Amplified fragments span intron/exon boundaries in thecDNA sequences. The expression level of human 18S RNA was determined bya predeveloped mixture of TaqMan probe and primers (PE Applied Biosystems)and used for normalization. All PCRs were performed in triplicate.
Western blotting. Equal amounts of protein extracted from P493-6 cells weresubjected to electrophoresis on sodium dodecyl sulfate–10% polyacrylamidegels. Monoclonal anti-Myc antibody (9E10; Oncogene Research Products) andanti-�-tubulin antibody (CP06; Oncogene Research Products) were used forimmunoblotting.
FIG. 4. (A) Western blot analysis of Myc expression in P493-6 cellsleft untreated (�) or treated (�) with tetracycline (Tet) for 72 h.(B) Western blot analysis of Myc expression in A1N4, human breastepithelial cells treated with 20 ng of EGF per ml. The number of hoursafter incubation with EGF is indicated. Tubulin is shown as a loadingcontrol in both panels.
VOL. 24, 2004 Myc GLYCOLYTIC TARGET GENE NETWORK 5927
on February 12, 2016 by guest
http://mcb.asm
.org/D
ownloaded from

FIG. 5. ChIP assay of glycolytic genes in the P493-6 cell system. Glycolytic genes displaying strong Myc binding (A), moderate or weak Myc binding(B), or no Myc binding (C) are shown. Labeled regions (as shown in Fig. 1; region A, B, or C) of each gene were quantitatively amplified by real-time
5928 KIM ET AL. MOL. CELL. BIOL.
on February 12, 2016 by guest
http://mcb.asm
.org/D
ownloaded from

RESULTS
Identification of canonical E boxes in glycolytic genes. Thegenomic sequences spanning 5 kb upstream of the transcrip-tional start site through the first exon and including the entireintron 1 of 14 human glycolytic genes (except LDHB) and theirmurine orthologs were analyzed to identify canonical E boxes(5�-CACGTG-3�). Although it is possible that Myc bindingsites may occur outside the regions we studied, this coveragewas determined from the precedence that bona fide Myc bind-ing sites appear to cluster within 2 kb of the start site, and thereis a prevalence of Myc binding sites in many first introns (14).The analysis shows the locations of canonical E boxes in hu-man and mouse glycolytic genes (Fig. 1 and 2). As summarizedin Table 1, canonical E boxes occur in 12 human glycolyticgenes but not in GAPD and TPI1. Among the mouse glycolyticgenes, Gpi, Pfkm, and Pklr have no canonical E boxes. Introniccanonical E boxes occur in several glycolytic genes. Glycolyticgenes in which canonical E boxes were found in both humanand mouse genomic sequences were subjected to phylogeneticfootprinting to determine whether these human E boxes arephylogenetically conserved.
Phylogenetic footprinting analysis. We chose manual se-quence alignment using the dot plot function of OMIGA soft-ware and the Trafac server for phylogenetic footprinting topredict Myc binding sites. The ALDOA, BPGM, ENO1, HK1,HK2, LDHA, PFKM, PGAM, PGK1, and PKM2 genes wereselected for the phylogenetic footprinting analysis, as canonicalE boxes for these genes occur in both human and mousegenomic sequences. Using the parameters of a 30-bp windowand a minimum of 65% sequence identity, we identified threegenes, ENO1, HK2, and LDHA, whose E boxes and their ex-tended flanking sequences showed 66 to 82% sequence identitybetween the human and mouse genomic sequences for longerthan 30 bp (31 to 111 bp) (Fig. 1). Moreover, as shown in aregulogram of a web-based Trafac analysis, a visual represen-tation of common binding sites (hits), conserved canonical Eboxes identified with these parameters were consistently de-tected in the conserved sequence blocks (Fig. 3).
Through manual alignment, the promoter and intron 1 re-gions of HK2 and LDHA display very high sequence conserva-tion. These regions extend over 70 bp, with more than 70%sequence identity (Fig. 1). In ENO1, however, the conservedsequences are not parallel; one human canonical E box in thepromoter region aligns with an intronic mouse canonical E boxthat lies 1 kb downstream of the transcriptional start site (Fig.1). Both conserved regions in ENO1 are about 30 bp, which isshorter than those in HK2 or LDHA. Trafac analysis furtherreveals two human ENO1 canonical E boxes that correspond toa mouse noncanonical E box (Fig. 3). Despite manually low-ering the stringency to 50% sequence identity with dot plotting,we are unable to align either of the two human ENO1 pro-moter E boxes with the mouse noncanonical E box (data not
shown). The increased sensitivity of Trafac analysis is due tothe less stringent criterion of including noncanonical E boxesthat occur in larger regions with at least 50% interspeciessequence identity. Trafac analysis does not require local se-quence alignment of the E boxes for inclusion as predictedtranscription factor binding sites.
Predicted conserved canonical E-box regions bind to Myc invivo. To determine whether Myc binds conserved canonical Eboxes, we performed ChIP assays. In addition to ENO1, HK2,and LDHA, which display significant conservation (Fig. 1), weselected additional human glycolytic genes to determinewhether nonconserved canonical E boxes might be bound byMyc. Human GPI, PFKM, and PKLR genes contain canonicalE boxes that are not found in the mouse orthologs. BPGM,PGAM, PGK1, and PKM2 do not have conserved E boxes (Fig.
FIG. 6. ChIP assay of glycolytic genes in the A1N4 cell system.Chromatin precipitated from A1N4 cells at the indicated times withanti-Myc antibody or without antibody (no Ab) were subjected toreal-time PCR as described in the legend to Fig. 5.
PCR. PCR was performed on the fragmented chromatin precipitated from P493-6 cells left untreated (�) or treated (�) with tetracycline (Tet)for 72 h with anti-Myc or HGF, without antibody (no Ab), or mock control samples as indicated at the bottom of the graph. The white barsrepresent the percentage of total input of control regions (region A). The black and hatched bars represent the percentage of total input of thechromatin regions that contain conserved canonical E boxes (ENO1, HK2, and LDHA) or nonconserved canonical E boxes (BPGM, GPI, PFKM,PGAM2, PGK1, and PKM2).
VOL. 24, 2004 Myc GLYCOLYTIC TARGET GENE NETWORK 5929
on February 12, 2016 by guest
http://mcb.asm
.org/D
ownloaded from

2A). It should be noted, however, that intronic PGK1 con-served canonical E boxes were detected by Trafac analysis (Fig.3). By lowering the stringency of our manual alignment to 50%identity, we were able to align these E boxes (data not shown).The P493-6 B-cell line was chosen for the ChIP assay (35, 36).These cells carry a tetracycline-responsive MYC expressionsystem. Tetracycline significantly represses ectopic Myc pro-tein expression, resulting only in residual endogenous Mycexpression (Fig. 4A). MYC mRNA level was also significantlyrepressed, as previously reported (43). Removal of tetracyclineresulted in a significant induction of MYC and enhancement ofglycolysis (36).
Chromatin fractions from untreated and tetracycline-treatedP493-6 cells were immunoprecipitated with polyclonal anti-Myc antibody. For each gene, two or three primer pairs weredesigned to amplify the DNA regions that contained conservedcanonical E boxes (ENO1, HK2, and LDHA), nonconserved Eboxes (BPGM, GPI, PFKM, PGAM, PGK1, PKLR, and PKM2),or control regions that are at least 1 kb away from the E boxes(Fig. 1 and 2). Region A represents the control region at least1 kb away from the E boxes, and regions B and C are thechromatin fragments that contain nonconserved and conservedcanonical E boxes, respectively. We observe that all conservedcanonical E-box regions in ENO1, HK2, and LDHA displayedstrong Myc binding (0.7 to 1.5% of total input DNA), whereascontrol regions showed only background signal (Fig. 5A). Mycbinding to GPI, PGK1, and PKM2 (region B or C) was dimin-ished (Fig. 5B). The canonical E-box region of the humanPFKM gene, which is not conserved in the rat Pfkm gene (mostsequences for mouse Pfkm promoter region are not available),
was bound by Myc but to a lesser extent than the highly con-served E-box regions of ENO1, HK2, and LDHA (Fig. 5B).Myc did not bind the nonconserved E-box regions of BPGM,PGAM2, and PKLR (region B) (Fig. 5C). We confirmed thespecificity of ChIP assay by performing immunoprecipitationwith anti-HGF antibody, without antibody, and with mock con-trol samples. In all these conditions, we observed only back-ground signals (Fig. 5 and 6).
Moderate Myc binding to ENO1, HK2, and LDHA canonicalE boxes were detected with endogenous Myc (Fig. 5A) inP493-6 cells treated with tetracycline, which suppresses onlyectopic MYC expression. We further confirmed that endoge-nous Myc could bind chromatin fragments that contain con-served canonical E boxes in another experimental system. Weused the A1N4 human breast epithelial cell line (22), whichwhen treated with EGF for 24 h, expresses a significantlyhigher level of endogenous Myc than EGF-starved A1N4 cells(Fig. 4B). All regions spanning conserved canonical E boxes(regions B and C) displayed strong Myc binding, whereas con-trol regions (region A) showed only background signals (Fig.6). While we do not know the basis for the relatively high levelof Myc binding to target sequences in A1N4 cells, it is intrigu-ing to note that the levels of recovered chromatin from endog-enous Myc reproducibly reached approximately 2 to 4%, whichis higher than those from exogenous Myc in P493-6 cell system(0.7 to 1.5%). Furthermore, for the ENO1 gene, region Cspanning the conserved intronic canonical E box was bound byendogenous Myc at a significantly higher level than the con-served canonical E box in the promoter region (region B).Taken together, these observations suggest that conserved ca-
TABLE 1. Summary of data on conservation of canonical E boxes, in vivo Myc binding, and expression profiles of glycolytic gene expression
Gene
This study Data from previous studiesa
No. of canonical Eboxesb Conservation of
E-box regionIn vivo Myc
bindingcInduction by
MycdInductionby Myce
Inductionby MYC-
ERMyc DNA binding
Human Mouse
ENO1 5 3 Yes ��� (0.80) 8.05 (�0.11) Up (M, S) Yes Yes (ChIP)HK2 5 4 Yes ��� (1.47) 3.66 (�1.28) Up (M) YesLDHA 2 3 Yes ��� (0.75) 14.98 (�0.88) Up (M, S) Yes Yes (ChIP, EMSA)
GAPD 0 2 No ��� (0.76) 3.72 (�0.36) Up (G, S) No Yes (ChIP)PFKM 1 1 (rat)f No �� (0.29) 8.68 (�0.03) Up (M, S) YesTPI1 0 1 Yesg �� (0.34) 5.19 (�2.29) No
GPI 1 0 No �/� (0.11) 9.84 (�3.23) Up (M) Yes/Noh
PGK1 3 4 No �/� (0.17) 2.85 (�1.24) Up NDi
PKM2 1 2 No �/� (0.13) 3.20 (�0.94) ND Yes (ChIP)BPGM 1 4 No � (0.03) 0.74 (�0.12) NDPGAM2 1 3 No � (0.02) NA NDPKLR 1 0 No � (0.02) NA No
ALDOA 2 2 No NA 6.73 (�0.08) NoHK1 4 8 No NA 1.93 (�0.03) ND
a Data adapted from the MYC target gene database (http://www.MYCcancergene.org) and previous publications (7, 29, 32).b Number of canonical E boxes within the 5 kb upstream of the transcriptional start site through intron 1.c In vivo Myc binding is indicated as follows: ���, strong binding; ��, moderate binding; �/�, weak binding; �, no binding; NA, not available. The percentage
of total input is shown in parentheses.d Fold induction in P493-6 cells not treated with tetracycline.e The method is given in parentheses as follows: M, microarray; S, SAGE; G, guess.f Most sequences for the mouse Pfkm reporter region are not available.g Conservation of noncanonical E boxes.h Yes/No, discrepant reports.i ND, not determined.
5930 KIM ET AL. MOL. CELL. BIOL.
on February 12, 2016 by guest
http://mcb.asm
.org/D
ownloaded from

nonical E boxes are bound by ectopic Myc and that they arealso significantly bound by endogenous levels of Myc.
The binding of Myc to the promoter or intron 1 regions ofENO1, HK2, and LDHA also correlated with gene expression.Using P493-6 cells, we observed that the mRNA levels of thesethree genes were also significantly higher in untreated P493-6cells (high MYC) than in tetracycline-treated P493-6 cells (lowMYC) (Table 1). The increased expression of these genes inresponse to elevated Myc provides further evidence that thesegenes are functional direct Myc targets.
Identification of Myc binding regions not predicted by phy-logenetic footprinting in GAPD and TPI1. Myc induces theexpression of both GAPD and TPI1, although they do notcontain canonical E boxes (Fig. 2B and Table 1). To determinewhether Myc could directly bind to regions in the promoter orintron 1, we used scanning ChIP assay (42). First, we used fivePCR primer pairs to scan the human GAPD locus at approx-imately 1-kb intervals (regions A, B, C, E, and G) (Fig. 7A).Using the P493-6 cell system, significant Myc binding wasfound in region G that spans approximately 40 bp upstream of
the transcriptional start site through the entire exon 1 (Fig.7B). We then considered the role of noncanonical E boxes, aswe previously demonstrated Myc binding to conserved, nonca-nonical E boxes in vivo (43). We identify four noncanonical Eboxes in the human GAPD gene and seven noncanonical Eboxes in the mouse Gapd gene (Fig. 7A) (see Materials andMethods for the sequence variations of noncanonical E boxes).Two pairs of human noncanonical E boxes are located eitherwithin 0.4 kb or within 2 kb upstream of the transcriptionalstart site. However, these noncanonical E boxes were not sig-nificantly conserved. We then performed an extended scanwith additional PCR primer pairs to pinpoint the fragmentsthat lie within 100 bp of the noncanonical E boxes (regions Dand F) (Fig. 7). Region H was used as an additional control.Figure 7B demonstrates Myc binding to region F (0.8% of totalinput) and region D (0.3% of total input). These results sug-gest that Myc binds a GAPD promoter region containing non-canonical E boxes that are not conserved in the mouse Gapdgene.
The human TPI1 gene was scanned by ChIP assay with five
FIG. 7. Scanning ChIP assay of the human GAPD gene. (A) Locations of canonical E boxes, noncanonical E boxes, and exons in the humanand mouse genomic sequences. Canonical E boxes in the mouse gene are indicated by black circles. The lead (�) or complement (�) sequencesof noncanonical E boxes are also indicated. The regions that are amplified for the scanning ChIP assay are indicated by the lines above the humangene and labeled A to H. (B) The human GAPD gene was scanned by ChIP assay in the P493-6 cell system. P493-6 cells were either not treated(� Tet) or treated with tetracycline (� Tet) for 72 h. ChIP was performed with anti-Myc or HGF, without antibody (no Ab), or mock controlsamples as indicated at the bottom of the graph.
VOL. 24, 2004 Myc GLYCOLYTIC TARGET GENE NETWORK 5931
on February 12, 2016 by guest
http://mcb.asm
.org/D
ownloaded from

FIG. 8. Phylogenetic footprinting analysis and scanning ChIP assay of TPI1. (A) Noncanonical E boxes and exons are indicated in the humanand mouse genomic sequences. The lead (�) or complement (�) sequences of noncanonical E boxes are also indicated. One canonical E box in
5932 KIM ET AL. MOL. CELL. BIOL.
on February 12, 2016 by guest
http://mcb.asm
.org/D
ownloaded from

PCR primer pairs at approximately 1-kb intervals (Fig. 8A).Myc bound region E, which lies in intron 1 (approximately 800bp downstream of the transcriptional start site) (Fig. 8D). Wefound 14 noncanonical E boxes in human TPI1 (11 in thepromoter region and 3 in intron 1) and analyzed them byphylogenetic footprinting (Fig. 8A). Through dot plot analysis,we detected two highly conserved promoter and intron 1 re-gions. The conserved intron 1 region, however, does not con-tain perfectly matched noncanonical E box (5�-CAAGGTG-3�in human TPI1). Both conserved regions extend over 100 bpwith more than 80% sequence identity (Fig. 8A and B). How-ever, in the Trafac analysis, an intronic canonical E box in themouse Tpi1 gene is conserved and corresponds to two humannoncanonical E boxes (Fig. 8C). It is intriguing that this con-
served intronic region, but not the upstream region, was boundby Myc in the scanning ChIP assay (Fig. 8D, region E). Ourdata provide evidence that Myc could associate with nonca-nonical E boxes or unknown new binding sites in these genes.These studies indicate that GAPD and TPI1 are direct targetsof Myc with binding sites that are largely unpredicted by phy-logenetic footprinting.
Induction of glycolytic gene expression by Myc correlateswith predicted canonical Myc binding sites. To determinewhether in vivo Myc binding correlates with the expression ofglycolytic genes, we subjected tetracycline-treated and un-treated P493-6 cells to quantitative real-time RT-PCR (for all14 glycolytic genes) and Northern blot analysis (for HK2,GAPD, and PFKM [data not shown]). The changes in expres-
FIG. 9. Regulation of the glycolytic gene network by HIF-1 and Myc. Arrows emanating from HIF-1 indicate regulation of specific glycolyticgenes by HIF-1 in response to hypoxia. Arrows emanating from Myc are shown with different thicknesses. The thickest arrows represent strongbinding by Myc, whereas dashed arrows represent diminished binding. HIF-1 is shown downstream of oncogenic Ras and Src as well as beingnegatively regulated by von Hippel-Lindau protein (pVHL).
mouse intron 1 is indicated as a black circle. The dotted areas represent the conservation of the noncanonical E box and its extended flankingregion with more than 65% sequence identity for longer than 30 bp. The percentage of sequence identity is also shown. The regions that areamplified for the scanning ChIP assay are indicated as the lines above the human gene and labeled A to E. (B) Sequence alignments of theconserved E box and its extended flanking regions are shown. Noncanonical E boxes are boxed in each sequence alignment. Conserved nucleotidesare shown in bold type. (C) Trafac analysis (regulogram) of human and mouse genomic sequences. (D) Scanning ChIP assay of human TPI1 inP493-6 cell system. P493-6 cells were either not treated (� Tet) or treated with tetracycline (� Tet) for 72 h. ChIP was performed with anti-Mycor HGF, without antibody (no Ab), or mock control samples as indicated at the bottom of the graph.
VOL. 24, 2004 Myc GLYCOLYTIC TARGET GENE NETWORK 5933
on February 12, 2016 by guest
http://mcb.asm
.org/D
ownloaded from
sion of 14 human glycolytic genes are listed in Table 1. ThemRNA expression levels of all genes that showed strong Mycbinding (ENO1, GAPD, HK2, LDHA, PFKM, and TPI1) weresignificantly elevated by Myc. Note that ENO1, HK2, andLDHA are among the highest Myc binding targets that werepredicted by phylogenetic footprinting. However, the induc-tion of gene expression is less well correlated with Myc bindingin GAPD and TPI1, in which Myc binds noncanonical E-boxregions. ALDOA, GPI, PFKM, PGK1, and PKM2 were inducedby Myc, but we could not detect E-box conservation or Mycbinding, suggesting that these genes are regulated by Mycindirectly or that Myc may bind ALDOA, GPI, PFKM, PGK1,and PKM2 in regions that we did not examine.
DISCUSSION
Our present studies using Myc and glycolytic genes as amodel system provide not only a critical analysis of phyloge-netic footprinting but also a comprehensive evaluation of Mycand the glycolytic target gene network. Our findings indicatethat most glycolytic genes are directly regulated by Myc, sup-porting the notion that deregulated MYC can contribute toaltered tumor glucose metabolism under normal oxygen levels.
Phylogenetic footprinting analyses by both manual align-ment and Trafac analysis predicted evolutionarily conserved,canonical Myc binding sites in ENO1, HK2, and LDHA, whichwere all confirmed by ChIP assay results. We observed that invivo, Myc binding correlated with the induction of glycolytictarget gene expression by Myc. These genes belong to what wepreviously termed class I Myc target genes, which contain con-served canonical E boxes (18). Since promoter-reporter assaysand EMSA do not reflect in situ Myc binding, we had notincluded these assays in the present study. Nevertheless, wepreviously demonstrated for LDHA that Myc binds the highlyconserved LDHA E boxes in EMSA as well as in promoter-reporter assays and that mutation of the E boxes rendered thepromoter unresponsive to Myc (37). Given the limitations ofEMSA (18) and considering the fact that even artificial pro-moters bearing E boxes are responsive to Myc in transient-transfection assays (20), we have focused on ChIP as a measureof in vivo Myc binding.
All other glycolytic genes studied do not have evolutionarilyconserved canonical E boxes, although most of the glycolyticgenes we studied were up-regulated in the presence of highlevels of Myc. Because human GAPD and TPI1 genes areinduced by MYC but do not contain predicted Myc bindingsites or canonical E boxes, we sought to determine whetherMyc binds these genes by scanning ChIP assays. The ChIPassay identified strong Myc binding to the regulatory regions ofGAPD and TPI1, providing evidence that GAPD and TPI1 aredirect Myc targets. However, the correlation between Mycbinding and phylogenetic conservation in GAPD and TPI1 isless clear. TPI1, which is induced by Myc, has a conservednoncanonical E box (5�-CACATG-3�) in the upstream region.However, Myc bound best to the intron 1 region that containstwo noncanonical E boxes (5�-CACATG-3� and 5�-CGCGTG-3�) that correspond to a mouse canonical E box. These intron1 regions were aligned by Trafac analysis, but not by dot plot-ting. Instead, dot plotting identified different areas of nonca-nonical E-box conservation in the intron 1 regions (Fig. 8A and
C). GAPD, which is also induced by Myc, has no conservedcanonical or noncanonical E boxes. With GAPD, Myc boundbest to the human promoter region F that is near two noncon-served, noncanonical E boxes (5�-CGCGTG-3� and 5�-CGCGAG-3�). Hence, both GAPD and TPI1 belong to what we pre-viously termed class II direct Myc target genes, whose Mycbinding sites either drifted during evolution or are newly ac-quired (18).
The human PFKM gene contains a canonical E box in thepromoter region, which is bound well by Myc, although thiscanonical E-box region is not conserved in the rat Pfkm gene.Most of the corresponding mouse sequence is currently un-available. Myc slightly bound the human PGK1 region with oneupstream and two intron 1 canonical E boxes. Myc bound thehuman GPI promoter region with one canonical E box. It isless clear whether Myc bound the human PKM2 region near anintron 1 canonical E box, when a control region several kilo-bases upstream is considered (Fig. 5B). No Myc binding wasdetected in the canonical E-box regions of human BPGM,PKLR, and PGAM2 genes. We were unable to identify suitableprimers for quantitative PCR in the ALDOA and HK1 loci. Inaggregate, these observations indicate that Myc binds weaklyto glycolytic genes that do not contain conserved Myc canon-ical binding sites. Because we examined Myc binding only incanonical E-box regions for the remaining genes (Fig. 2A), wecannot exclude the possibility that Myc may bind noncanonicalE boxes or unknown novel binding sites.
Since tetracycline treatment suppresses only ectopic Mycexpression in P493-6 cells and does not affect endogenous Mycexpression, this study provides a unique opportunity to exam-ine endogenous Myc and ectopic Myc binding to the samegenes. Only class I (ENO1, HK2, and LDHA) and class II(GAPD and TPI1) genes demonstrate binding by endogenousMyc (Fig. 5A, 7B, and 8D). Intriguingly, while both HK2 andLDHA displayed a corresponding enhanced binding of ectopicMyc to the same regions, ectopic Myc binding to ENO1 ishigher in promoter region B than in the intronic region C thatis bound well by endogenous Myc (Fig. 5A and 6). Throughstudying the human A1N4 breast epithelial cells, in whichendogenous Myc is induced by the growth factor EGF, we alsoobserved that intronic region C of ENO1 is better bound byendogenous Myc than the promoter region B. High basal Mycbinding to ENO1 region C was observed compared to eitherLDHA or HK2. With GAPD, there was significant binding ofectopic Myc to region D, which was not bound by endogenousMyc, although this level of binding might be at the threshold ofdetection. With PFKM, PGK1, GPI, and PKM2, moderate todiminished binding was detected only with ectopic Myc. Withendogenous Myc, phylogenetic footprinting was highly predic-tive of Myc binding to the conserved regions bearing canonicalE boxes.
So why are these specific regions conserved in ENO1, HK2,and LDHA? As less than 20% of nonexonic sequence is con-served in the human and mouse genomes, significantly highlevel of conservation, which is more than 65% sequence iden-tity at and around Myc binding regions extending 30 to morethan 100 bp, shown in ENO1, HK2, LDHA, and TPI1 genesmay have an impact on Myc-mediated transcriptional regula-tion. One possibility is that these extended conserved se-quences may contain binding sites for other transcription fac-
5934 KIM ET AL. MOL. CELL. BIOL.
on February 12, 2016 by guest
http://mcb.asm
.org/D
ownloaded from

tors or chromatin remodeling proteins, which could affect thetranscriptional activity of Myc (12). Our preliminary Trafacanalysis suggests that conserved binding sites for the transcrip-tion factors ETS, AP4, Sp1, CREB, and HIF-1 are foundoverrepresented near conserved Myc E boxes in glycolyticgenes (A. G. Jegga, unpublished data). In particular, amongthe 10 glycolytic genes with more than three other conservedtranscription factor binding sites near a conserved E box, onlyENO1, HK2, and LDHA lack clusters containing AP4 sites withan E box (Jegga, unpublished). It will be intriguing to deter-mine whether the lack of AP4 sites in ENO1, HK2, and LDHAcontributes to their robust response to Myc. At this time, weare evaluating these candidate transcription factors, but thefindings are beyond the scope of this report.
While previous studies reveal that hypoxia induces glycolysisthrough the HIF-1 transcription factor, our studies demon-strate that in normoxia, Myc can induce most glycolytic genesincluding ALDOA, ENO1, GAPD, GPI, LDHA, HK2, PFKM,PGK1, PKM, and TPI1 (Fig. 9). This supports the hypothesisthat the propensity for some tumors to undergo aerobic glyco-lysis (Warburg effect), in which glucose is converted to lactatedespite the availability of oxygen, could be the result of Mycactivation of glycolytic gene expression independent of hyp-oxia. Of the Myc-induced genes, HK2, PFKM, and PKM werepreviously considered to be important rate-limiting regulatorypoints in glycolysis. However, according to metabolic controlanalysis, there are no so-called rate-limiting enzymes in a path-way. Rather, the control of metabolic flux through a pathway isshared between all enzymes in different proportions such thatcoordinate regulation of a number of enzymes in a specificpathway is sufficient to affect overall metabolic flux. Hence, theinduction of genes encoding key enzymes by Myc appearssufficient for enhanced glycolytic flux.
In addition to bearing evolutionarily conserved regulatoryMyc binding sites, these glycolytic genes may share some otherfunctional features that are important for mammalian cellgrowth and development. Recent studies suggest that glycolyticenzymes may not only be involved in glucose metabolism butthey may also influence other biological processes. Severalisoforms of hexokinase play a key role in mitochondrion-me-diated apoptosis by modulating proapoptotic molecules includ-ing Bax and Bad, suggesting that the glycolytic pathway andapoptosis are integrated (9, 15, 33). The roles of LDHA andGAPD proteins in glycolysis are well-established, yet the nu-clear localization of these proteins suggest additional biologi-cal functions (45). Recently, GAPD and LDH were both foundin a transcriptional coactivator complex that assists the Oct-1transcription factor in regulating histone H2B expression (44).GAPD, in particular, alters the coactivator activity as a func-tion of NAD�/NADH ratio. Several studies suggest thatENO1 and MYC promoter-binding protein 1 (MBP-1) areencoded by the same gene (13, 38). MBP-1, which results froman internal translational initiation site of the ENO1 mRNA, isa negative transcriptional regulator of MYC transcription.These findings imply that a negative-feedback loop exists be-tween MYC and ENO1. It is notable that while there is overlapbetween glycolytic genes that are responsive to hypoxia via theHIF-1 transcription factor and those that are regulated by Myc,a hierarchy of glycolytic genes preferentially regulated byHIF-1 is not apparent, since HIF-1 appears to uniformly affect
genes encoding many enzymes of the entire pathway (13, 38).In aggregate, these observations suggest that glycolytic genes,which serve other biological functions, may have preferentiallyconserved regulatory sequences that are responsive to partic-ular transcription factors or stimuli. In particular, we demon-strate here that Myc serves as a regulator of many key glyco-lytic genes, providing additional insight into the complexity oftranscriptional control of glycolytic genes in normoxic condi-tions (Fig. 9).
ACKNOWLEDGMENTS
This work was supported in part by NIH grants CA51497 (C.V.D.),CA57341 (C.V.D.), LM07515 (C.V.D.), T32HL07525 (K.I.Z.), andT32GM07819 (K.A.O.). J. Kim is a Howard Hughes Medical InstitutePredoctoral Fellow.
We thank L. Lee, A. Chakravarti, and J. Yustein for helpful com-ments, D. Eick for P493-6 cells, and P. Farnham for ChIP protocols.
REFERENCES
1. Bello-Fernandez, C., G. Packham, and J. L. Cleveland. 1993. The ornithinedecarboxylase gene is a transcriptional target of c-Myc. Proc. Natl. Acad. Sci.USA 90:7804–7808.
2. Berman, B. P., Y. Nibu, B. D. Pfeiffer, P. Tomancak, S. E. Celniker, M.Levine, G. M. Rubin, and M. B. Eisen. 2002. Exploiting transcription factorbinding site clustering to identify cis-regulatory modules involved in patternformation in the Drosophila genome. Proc. Natl. Acad. Sci. USA 99:757–762.
3. Blackwell, T. K., J. Huang, A. Ma, L. Kretzner, F. W. Alt, R. N. Eisenman,and H. Weintraub. 1993. Binding of Myc proteins to canonical and nonca-nonical DNA sequences. Mol. Cell. Biol. 13:5216–5224.
4. Blanchette, M., and M. Tompa. 2003. FootPrinter: a program designed forphylogenetic footprinting. Nucleic Acids Res. 31:3840–3842.
5. Boyd, K. E., J. Wells, J. Gutman, S. M. Bartley, and P. J. Farnham. 1998.c-Myc target gene specificity is determined by a post-DNA binding mecha-nism. Proc. Natl. Acad. Sci. USA 95:13887–13892.
6. Cole, M. D., and S. B. McMahon. 1999. The Myc oncoprotein: a criticalevaluation of transactivation and target gene regulation. Oncogene 18:2916–2924.
7. Coller, H. A., C. Grandori, P. Tamayo, T. Colbert, E. S. Lander, R. N.Eisenman, and T. R. Golub. 2000. Expression analysis with oligonucleotidemicroarrays reveals that MYC regulates genes involved in growth, cell cycle,signaling, and adhesion. Proc. Natl. Acad. Sci. USA 97:3260–3265.
8. Dang, C. V., and G. L. Semenza. 1999. Oncogenic alterations of metabolism.Trends Biochem. Sci. 24:68–72.
9. Danial, N. N., C. F. Gramm, L. Scorrano, C. Y. Zhang, S. Krauss, A. M.Ranger, S. R. Datta, M. E. Greenberg, L. J. Licklider, B. B. Lowell, S. P.Gygi, and S. J. Korsmeyer. 2003. BAD and glucokinase reside in a mito-chondrial complex that integrates glycolysis and apoptosis. Nature 424:952–956.
10. Eberhardy, S. R., and P. J. Farnham. 2001. c-Myc mediates activation of thecad promoter via a post-RNA polymerase II recruitment mechanism. J. Biol.Chem. 276:48562–48571.
11. Eilers, M., D. Picard, K. R. Yamamoto, and J. M. Bishop. 1989. Chimaerasof myc oncoprotein and steroid receptors cause hormone-dependent trans-formation of cells. Nature 340:66–68.
12. Elkon, R., C. Linhart, R. Sharan, R. Shamir, and Y. Shiloh. 2003. Genome-wide in silico identification of transcriptional regulators controlling the cellcycle in human cells. Genome Res. 13:773–780.
13. Feo, S., D. Arcuri, E. Piddini, R. Passantino, and A. Giallongo. 2000. ENO1gene product binds to the c-myc promoter and acts as a transcriptionalrepressor: relationship with Myc promoter-binding protein 1 (MBP-1).FEBS Lett. 473:47–52.
14. Fernandez, P. C., S. R. Frank, L. Wang, M. Schroeder, S. Liu, J. Greene, A.Cocito, and B. Amati. 2003. Genomic targets of the human c-Myc protein.Genes Dev. 17:1115–1129.
15. Gottlob, K., N. Majewski, S. Kennedy, E. Kandel, R. B. Robey, and N. Hay.2001. Inhibition of early apoptotic events by Akt/PKB is dependent on thefirst committed step of glycolysis and mitochondrial hexokinase. Genes Dev.15:1406–1418.
16. Grandori, C., S. M. Cowley, L. P. James, and R. N. Eisenman. 2000. TheMyc/Max/Mad network and the transcriptional control of cell behavior.Annu. Rev. Cell Dev. Biol. 16:653–699.
17. Grandori, C., and R. N. Eisenman. 1997. Myc target genes. Trends Biochem.Sci. 22:177–181.
18. Haggerty, T. J., K. I. Zeller, R. C. Osthus, D. R. Wonsey, and C. V. Dang.2003. A strategy for identifying transcription factor binding sites reveals two
VOL. 24, 2004 Myc GLYCOLYTIC TARGET GENE NETWORK 5935
on February 12, 2016 by guest
http://mcb.asm
.org/D
ownloaded from

classes of genomic c-Myc target sites. Proc. Natl. Acad. Sci. USA 100:5313–5318.
19. Jegga, A. G., S. P. Sherwood, J. W. Carman, A. T. Pinski, J. L. Phillips, J. P.Pestian, and B. J. Aronow. 2002. Detection and visualization of composi-tionally similar cis-regulatory element clusters in orthologous and coordi-nately controlled genes. Genome Res. 12:1408–1417.
20. Kretzner, L., E. M. Blackwood, and R. N. Eisenman. 1992. Myc and Maxproteins possess distinct transcriptional activities. Nature 359:426–429.
21. Lenhard, B., A. Sandelin, L. Mendoza, P. Engstrom, N. Jareborg, and W. W.Wasserman. 22 May 2003, posting date. Identification of conserved regula-tory elements by comparative genome analysis. J. Biol. 2:13. [Online.] http://jbiol.com/content/2/2/13.
22. Li, Q., and C. V. Dang. 1999. c-Myc overexpression uncouples DNA repli-cation from mitosis. Mol. Cell. Biol. 19:5339–5351.
23. Li, Z., S. Van Calcar, C. Qu, W. K. Cavenee, M. Q. Zhang, and B. Ren. 2003.A global transcriptional regulatory role for c-Myc in Burkitt’s lymphomacells. Proc. Natl. Acad. Sci. USA 100:8164–8169.
24. Loots, G. G., I. Ovcharenko, L. Pachter, I. Dubchak, and E. M. Rubin. 2002.rVista for comparative sequence-based discovery of functional transcriptionfactor binding sites. Genome Res. 12:832–839.
25. Mao, D. Y., J. D. Watson, P. S. Yan, D. Barsyte-Lovejoy, F. Khosravi, W. W.Wong, P. J. Farnham, T. H. Huang, and L. Z. Penn. 2003. Analysis of Mycbound loci identified by CpG island arrays shows that Max is essential forMyc-dependent repression. Curr. Biol. 13:882–886.
26. Markstein, M., P. Markstein, V. Markstein, and M. S. Levine. 2002. Ge-nome-wide analysis of clustered Dorsal binding sites identifies putative tar-get genes in the Drosophila embryo. Proc. Natl. Acad. Sci. USA 99:763–768.
27. Menssen, A., and H. Hermeking. 2002. Characterization of the c-MYC-regulated transcriptome by SAGE: identification and analysis of c-MYCtarget genes. Proc. Natl. Acad. Sci. USA 99:6274–6279.
28. Neiman, P. E., A. Ruddell, C. Jasoni, G. Loring, S. J. Thomas, K. A. Brand-vold, R. Lee, J. Burnside, and J. Delrow. 2001. Analysis of gene expressionduring myc oncogene-induced lymphomagenesis in the bursa of Fabricius.Proc. Natl. Acad. Sci. USA 98:6378–6383.
29. O’Connell, B. C., A. F. Cheung, C. P. Simkevich, W. Tam, X. Ren, M. K.Mateyak, and J. M. Sedivy. 2003. A large scale genetic analysis of c-Myc-regulated gene expression patterns. J. Biol. Chem. 278:12563–12573.
30. Orian, A., B. van Steensel, J. Delrow, H. J. Bussemaker, L. Li, T. Sawado, E.Williams, L. W. Loo, S. M. Cowley, C. Yost, S. Pierce, B. A. Edgar, S. M.Parkhurst, and R. N. Eisenman. 2003. Genomic binding by the DrosophilaMyc, Max, Mad/Mnt transcription factor network. Genes Dev. 17:1101–1114.
31. Oster, S. K., C. S. Ho, E. L. Soucie, and L. Z. Penn. 2002. The myc oncogene:marvelously complex. Adv. Cancer Res. 84:81–154.
32. Osthus, R. C., H. Shim, S. Kim, Q. Li, R. Reddy, M. Mukherjee, Y. Xu, D.Wonsey, L. A. Lee, and C. V. Dang. 2000. Deregulation of glucose transporter1 and glycolytic gene expression by c-Myc. J. Biol. Chem. 275:21797–21800.
33. Pastorino, J. G., N. Shulga, and J. B. Hoek. 2002. Mitochondrial binding ofhexokinase II inhibits Bax-induced cytochrome c release and apoptosis.J. Biol. Chem. 277:7610–7618.
34. Pennacchio, L. A., and E. M. Rubin. 2001. Genomic strategies to identifymammalian regulatory sequences. Nat. Rev. Genet. 2:100–109.
35. Schuhmacher, M., F. Kohlhuber, M. Holzel, C. Kaiser, H. Burtscher, M.Jarsch, G. W. Bornkamm, G. Laux, A. Polack, U. H. Weidle, and D. Eick.2001. The transcriptional program of a human B cell line in response to Myc.Nucleic Acids Res. 29:397–406.
36. Schuhmacher, M., M. S. Staege, A. Pajic, A. Polack, U. H. Weidle, G. W.Bornkamm, D. Eick, and F. Kohlhuber. 1999. Control of cell growth byc-Myc in the absence of cell division. Curr. Biol. 9:1255–1258.
37. Shim, H., C. Dolde, B. C. Lewis, C. S. Wu, G. Dang, R. A. Jungmann, R.Dalla-Favera, and C. V. Dang. 1997. c-Myc transactivation of LDH-A: im-plications for tumor metabolism and growth. Proc. Natl. Acad. Sci. USA94:6658–6663.
38. Subramanian, A., and D. M. Miller. 2000. Structural analysis of alpha-enolase. Mapping the functional domains involved in down-regulation of thec-myc proto-oncogene. J. Biol. Chem. 275:5958–5965.
39. Warburg, O. 1956. On the origin of cancer cells. Science 123:309–314.40. Waterston, R. H., K. Lindblad-Toh, E. Birney, J. Rogers, J. F. Abril, P.
Agarwal, R. Agarwala, R. Ainscough, M. Alexandersson, P. An, S. E. An-tonarakis, J. Attwood, R. Baertsch, J. Bailey, K. Barlow, S. Beck, E. Berry,B. Birren, T. Bloom, P. Bork, M. Botcherby, N. Bray, M. R. Brent, D. G.Brown, S. D. Brown, C. Bult, J. Burton, J. Butler, R. D. Campbell, P.Carninci, S. Cawley, F. Chiaromonte, A. T. Chinwalla, D. M. Church, M.Clamp, C. Clee, F. S. Collins, L. L. Cook, R. R. Copley, A. Coulson, O.Couronne, J. Cuff, V. Curwen, T. Cutts, M. Daly, R. David, J. Davies, K. D.Delehaunty, J. Deri, E. T. Dermitzakis, C. Dewey, N. J. Dickens, M.Diekhans, S. Dodge, I. Dubchak, D. M. Dunn, S. R. Eddy, L. Elnitski, R. D.Emes, P. Eswara, E. Eyras, A. Felsenfeld, G. A. Fewell, P. Flicek, K. Foley,W. N. Frankel, L. A. Fulton, R. S. Fulton, T. S. Furey, D. Gage, R. A. Gibbs,G. Glusman, S. Gnerre, N. Goldman, L. Goodstadt, D. Grafham, T. A.Graves, E. D. Green, S. Gregory, R. Guigo, M. Guyer, R. C. Hardison, D.Haussler, Y. Hayashizaki, L. W. Hillier, A. Hinrichs, W. Hlavina, T. Holzer,F. Hsu, A. Hua, T. Hubbard, A. Hunt, I. Jackson, D. B. Jaffe, L. S. Johnson,M. Jones, T. A. Jones, A. Joy, M. Kamal, E. K. Karlsson, et al. 2002. Initialsequencing and comparative analysis of the mouse genome. Nature 420:520–562.
41. Watson, J. D., S. K. Oster, M. Shago, F. Khosravi, and L. Z. Penn. 2002.Identifying genes regulated in a Myc-dependent manner. J. Biol. Chem.277:36921–36930.
42. Zeller, K. I., T. J. Haggerty, J. F. Barrett, Q. Guo, D. R. Wonsey, and C. V.Dang. 2001. Characterization of nucleophosmin (B23) as a Myc target byscanning chromatin immunoprecipitation. J. Biol. Chem. 276:48285–48291.
43. Zeller, K. I., A. G. Jegga, B. J. Aronow, K. A. O’Donnell, and C. V. Dang. 11September 2003, posting date. An integrated database of genes responsive tothe Myc oncogenic transcription factor: identification of direct genomictargets. Genome Biol. 4:R69. [Online.] http://genomebiology.com/2003/4/10/R69.
44. Zheng, L., R. G. Roeder, and Y. Luo. 2003. S phase activation of the histoneH2B promoter by OCA-S, a coactivator complex that contains GAPDH as akey component. Cell 114:255–266.
45. Zhong, X. H., and B. D. Howard. 1990. Phosphotyrosine-containing lactatedehydrogenase is restricted to the nuclei of PC12 pheochromocytoma cells.Mol. Cell. Biol. 10:770–776.
5936 KIM ET AL. MOL. CELL. BIOL.
on February 12, 2016 by guest
http://mcb.asm
.org/D
ownloaded from
Related Documents


![Research Paper JNK/AP1 Pathway Regulates MYC ...Chromatin immunoprecipitation assays (ChIP) ChIP analysis was performed as previously described [11]. Chromatin solutions were precipitated](https://static.cupdf.com/doc/110x72/608625bcea8a6a2e9165f1fb/research-paper-jnkap1-pathway-regulates-myc-chromatin-immunoprecipitation-assays.jpg)