http://yvj.sagepub.com/ Justice Youth Violence and Juvenile http://yvj.sagepub.com/content/9/4/313 The online version of this article can be found at: DOI: 10.1177/1541204011402854 2011 9: 313 originally published online 28 March 2011 Youth Violence and Juvenile Justice Kristina Childs, Richard Dembo, Steven Belenko, Christopher Sullivan and John Cochran Sample of Newly Arrested Juvenile Offenders Association Among Risky Sexual Behavior, Drug Use, and Criminal Involvement in a A Group-Based Modeling Approach to Examining Sociodemographic Variation in the Published by: http://www.sagepublications.com On behalf of: Academy of Criminal Justice Sciences can be found at: Youth Violence and Juvenile Justice Additional services and information for http://yvj.sagepub.com/cgi/alerts Email Alerts: http://yvj.sagepub.com/subscriptions Subscriptions: http://www.sagepub.com/journalsReprints.nav Reprints: http://www.sagepub.com/journalsPermissions.nav Permissions: http://yvj.sagepub.com/content/9/4/313.refs.html Citations: What is This? - Mar 28, 2011 OnlineFirst Version of Record - Oct 7, 2011 Version of Record >> at UNIV OF SOUTH FLORIDA on July 15, 2013 yvj.sagepub.com Downloaded from

Welcome message from author
This document is posted to help you gain knowledge. Please leave a comment to let me know what you think about it! Share it to your friends and learn new things together.
Transcript

http://yvj.sagepub.com/Justice
Youth Violence and Juvenile
http://yvj.sagepub.com/content/9/4/313The online version of this article can be found at:
DOI: 10.1177/1541204011402854
2011 9: 313 originally published online 28 March 2011Youth Violence and Juvenile JusticeKristina Childs, Richard Dembo, Steven Belenko, Christopher Sullivan and John Cochran
Sample of Newly Arrested Juvenile OffendersAssociation Among Risky Sexual Behavior, Drug Use, and Criminal Involvement in a A Group-Based Modeling Approach to Examining Sociodemographic Variation in the
Published by:
http://www.sagepublications.com
On behalf of:
Academy of Criminal Justice Sciences
can be found at:Youth Violence and Juvenile JusticeAdditional services and information for
http://yvj.sagepub.com/cgi/alertsEmail Alerts:
http://yvj.sagepub.com/subscriptionsSubscriptions:
http://www.sagepub.com/journalsReprints.navReprints:
http://www.sagepub.com/journalsPermissions.navPermissions:
http://yvj.sagepub.com/content/9/4/313.refs.htmlCitations:
What is This?
- Mar 28, 2011 OnlineFirst Version of Record
- Oct 7, 2011Version of Record >>
at UNIV OF SOUTH FLORIDA on July 15, 2013yvj.sagepub.comDownloaded from

A Group-Based ModelingApproach to ExaminingSociodemographic Variationin the Association AmongRisky Sexual Behavior,Drug Use, and CriminalInvolvement in a Sample ofNewly Arrested JuvenileOffenders
Kristina Childs,1 Richard Dembo,2 Steven Belenko,3
Christopher Sullivan4 and John Cochran2
AbstractThis study examined sociodemographic variation in the interrelationships between risky sexualpractices, substance use, and arrest history. The sample consisted of 948 newly arrested juvenileoffenders processed at a centralized intake facility in 2006. A series of confirmatory factoranalysis and structural equation modeling techniques were used to (a) determine if risky sexualbehavior, marijuana and cocaine use, and arrest history form a unidimensional latent factor, (b)examine the direct effect of age on the latent factor, and (c) compare the factor structure, aswell as the effect of age on the latent factor, across four demographic subgroups based on raceand gender. Important similarities, as well as differences, in the factor structure across the fourgroups were found. The results highlight the importance of accounting for sociodemographicfactors when examining the association among adolescent problem behaviors.
1Department of Psychology, University of New Orleans, New Orleans, LA, USA2Department of Criminology, University of South Florida, Tampa, FL, USA3Department of Criminal Justice, Temple University, Philadelphia, PA, USA4Department of Criminal Justice, University of Cincinnati, Cincinnati, OH, USA
Corresponding Author:
Kristina Childs, Department of Psychology, University of New Orleans, 2001 Geology and Psychology Bldg., New Orleans,
LA 70148, USA
Email: [email protected]
Youth Violence and Juvenile Justice9(4) 313-332ª The Author(s) 2011Reprints and permission:sagepub.com/journalsPermissions.navDOI: 10.1177/1541204011402854http://yvj.sagepub.com
at UNIV OF SOUTH FLORIDA on July 15, 2013yvj.sagepub.comDownloaded from

Keywordsproblem behavior syndrome, risky sexual behavior, drug use, delinquency, group-based CFAmodeling
It is well established that juvenile offenders are disproportionately involved in a variety of
risk-taking, problem behaviors. Compared to adolescent nonoffenders, studies document that juvenile
offenders report substantially higher levels of truancy (Gottfredson, 2001), reckless driving
(Tremblay, Boulerice, Junger, & Arseneault, 1995), gambling (Welte, Barnes, & Hoffman, 2004),
running away from home (Chapple, Johnson, & Whitbeck, 2004), and, most notably, substance use
(Elliott, Huizinga, & Menard, 1989; Huizinga & Jakob-Chien, 1998). In fact, the higher levels of sub-
stance use among juvenile offenders have been considered a critical problem for well over 25 years.
Public health research also suggests that juvenile offenders are engaging in risky sexual behaviors
at a substantially higher rate than nonoffenders (Barthlow, Horan, DiClemente, & Lanier, 1995),
which has resulted in disproportionately higher rates of sexually transmitted diseases (STDs) among
this population (Joesof, Kahn, & Weinstock, 2006). For example, Kingree, Braithwaite, and
Woodring (2000) estimate that 15% of male and 30% of female juvenile detainees are infected with
an STD. Studies also show that drug use and risky sexual behavior are interrelated phenomena. Youth
who report substance use are substantially more likely to report risky sexual behavior (Bryan &
Stallings, 2002; Harwell, Trino, Rudy, Yorkman, & Gollub, 1999) and adolescents are more likely
to report engaging in risky sexual behavior while high on drugs or alcohol (Castrucci & Martin, 2002).
These findings suggest that delinquency, drug use, and risky sexual practices may be part of a
general disposition toward deviant behavior. As a result, several researchers have suggested that the
tendency to engage in any one form of problem behavior is part of a general syndrome of deviance.
That is, engaging in a particular form of deviant behavior is actually one symptom of the larger
‘‘general syndrome’’ of deviance, commonly referred to as problem behavior syndrome (PBS; Jessor
& Jessor, 1977). For instance, Osgood, Johnston, O’Malley, and Bachman (1988, p. 82) refer to this
concept as, ‘‘a variety of deviant behaviors that form a ‘syndrome,’ which is directly caused by a
general latent variable of unconventionality.’’
Overall, research has provided support for this argument. Adolescents who report engaging in a
specific form of deviant behavior are significantly more likely to report engaging in other deviant
behaviors. LeBlanc and Bouthillier (2003) reviewed the findings from 21 published studies using
various forms of deviant behavior and a range of factor analytic techniques. All 21 studies included
some form of delinquent behavior, 18 included some form of substance use, and 8 included beha-
viors related to sexual activity. A latent construct representative of PBS was identified in every
study. Consequently, LeBlanc and Bouthillier concluded that the unidimensional construct of
deviance is universal.
Despite overall support for a unidimensional latent construct, some researchers have reported
findings inconsistent with the concept of PBS (Gillmore et al., 1991; Krueger et al., 2002; LeBlanc
& Girard, 1997). For example, White and Labouvie (1994) and Hemphill et al. (2007) found that
delinquency and drug use represent two distinct dimensions of problem behavior in adolescence.
Using a variety of adolescent problem behaviors, McGee and Newcomb (1992) and Farrell, Kung,
White, and Valois (2000) found support for a higher second-order latent construct representative of
PBS. Similarly, Little, Weaver, King, Liu, and Chassin (2008) examined historical trends in the
association among marijuana use and deviance proneness across 13 two-year cohorts of the Moni-
toring the Future Survey (1979–2004). Across this 26-year time span, they found support for a
second-order factor of deviance proneness comprised of three first-order factors (e.g., criminal beha-
vior, thrill-seeking, and marijuana use). Based on these results, it has been suggested that deviance is
not a unitary phenomenon but instead should be categorized into types of behavior within which the
specific behaviors are more closely related to each other than they are to other forms of deviance.
314 Youth Violence and Juvenile Justice 9(4)
at UNIV OF SOUTH FLORIDA on July 15, 2013yvj.sagepub.comDownloaded from

Furthermore, a major limitation of this body of research is an insufficient understanding of the
variation in PBS across sociodemographic subgroups of adolescents. Typically, studies examine
PBS on an entire sample of community adolescents and fail to examine subsamples based on
individual-level characteristics. This is unfortunate because a small number of studies have docu-
mented sociodemographic differences in both the strength of the correlation among specific deviant
behaviors and in the structure of the latent construct.
For example, studies indicate that the association among juvenile delinquency, risky sexual prac-
tices, and substance use is stronger for female adolescents compared to male adolescents (Oh et al.,
1998; Tapert, Aarons, Sedlar, & Brown, 2001). However, Bartlett, Holditch-Davis, and Belyea
(2005) found a significantly higher number of male than female adolescents display PBS. White
(1992) analyzed separate factor analytic models for males and females based on 11 different forms
of problem behavior. Although both gender-specific models revealed a one factor solution, the beha-
viors that loaded on each factor differed. Racial variation in PBS has not received a great deal of
attention. Some studies have found that the covariation among problem behaviors is stronger for
white adolescents, compared to minority adolescents (Costa, Jessor, Donovan, & Fortenberry,
1995; Welte et al., 2004). Dembo et al. (1992) failed to find any significant differences in PBS across
racial categories among a sample of justice involved youth, but Bartlett et al. (2005) found that Black
adolescents were 1.5 times more likely to display PBS.
Variations in the strength of the correlation among problem behaviors have also been documen-
ted across race and gender subgroups. Using data from the National Longitudinal Study of Adoles-
cent Health, Zweig, Lindberg, and McGinley (2001) found that participation in problem behaviors
clustered into four distinct risk profiles. However, these profiles differed for males and females. For
males, the four risk profiles were: low risk, moderate risk—substance use and sexual activity, mod-
erate risk—marijuana use and suicide, and high risk. Black males were more likely to be in the low-
risk group while White males were more likely to be in the sexual activity and substance use group.
For females, the four risk profiles were: low risk, low risk—suicide and fighting, moderate risk—
sexual activity and substance use, and high risk. Black females were more likely to be in both
low-risk groups and White females were more likely to be in the moderate- and high-risk groups.
Another study found important race and gender subgroup differences in the factor structure of
PBS. Based on a large sample of high school students, Basen-Engquist, Edmundson, and Parcel
(1996) examined the structure of 25 health risk behaviors. Preliminary analyses revealed a four
dimensional model fit the data best. However, when examined across demographic subgroups,
Basen-Engquist et al. found significant differences. The model fit the data well for the White male
group, but a poor fit was obtained for the Black female, White female, and Black male groups.
Based on these findings, it is likely that the intersection of race and gender influences variations
in the level and/or structure of PBS. Both race and gender have multiple correlates that may account
for these differences, including cultural expectations, racial and gender bias, socioeconomic status,
education, and poor family environment. Therefore, the failure to account for these sociodemo-
graphic characteristics could lead to erroneous conclusions regarding the nature of the syndrome
by generalizing findings to all adolescents, when they may be representing only one particular sub-
group of youth.
In addition to understanding variations in PBS across demographic subgroups, it is also important
to understand how age influences these relationships. Longitudinal studies indicate that the covar-
iation among problem behaviors is stronger in early to mid adolescence (Newcomb & McGee, 1991;
White, 1992). These findings suggest that, as youth progress into young adulthood, specialization in
problem behaviors tends to become more common and the covariation among deviant behaviors
weakens (Newcomb & Bentler, 1986; Osgood et al., 1988). However, a major limitation of these
studies is the failure to account for race and gender when examining how age influences PBS. Ado-
lescence is a critical time for the development of self-identity and self-esteem. As youth progress
Childs et al. 315
at UNIV OF SOUTH FLORIDA on July 15, 2013yvj.sagepub.comDownloaded from

through adolescence, acceptance of their racial and/or gender status is an integral part of developing
a positive identity. This is the time when individuals begin to learn about their cultural background
and become aware of the effects of social stratification including monetary possessions, opportuni-
ties to achieve goals, and racial and/or gender biases. Empirical evidence suggests that youth
who possess a positive self-identity are substantially less likely to engage in problem behaviors
(Donnellan, Trzesniewski, Robins, Moffitt, & Caspi, 2005). Thus, as minority youth progress
through adolescence, they may become more vulnerable to the development of PBS. Hence, it is
possible that the association between age and PBS varies across sociodemographic subgroups.
Current Study
The present study contributes to research on adolescent problem behaviors in a number of important
ways. First, although previous studies consistently support a one-factor solution representative of
PBS, they also reveal moderate correlations among the latent construct and the specific forms of
deviant behaviors and relatively low levels of explained variance (Osgood et al., 1988; White,
1992). These shortcomings may be related to the use of standard factor analytic techniques that rely
on a weighted average of covariation across the entire dataset. That is, most studies fail to account
for nested subgroups. This study applies a group-based approach to examine the possibility that dif-
ferences in the factor–item relations across groups nested within a sample account for the relatively
low levels of explained variance characteristic of existing research. As Widaman and Reise (1997)
point out, when there is evidence to suggest that groups within the population exist for whom the
indicator variables are differentially related to the latent factor, group-based modeling is a powerful
tool for accounting for these differences. With multiple-group analytic techniques, one can compare
the factor structure, or covariation, among a number of observed variables across specified sub-
groups. Given the preliminary evidence on variations in PBS across sociodemographic characteris-
tics, group-based modeling seems to be the appropriate technique to use when examining the
interrelationships among a variety of problem behaviors. Accordingly, this study examines differ-
ences in the level and structure of PBS across subgroups based on race and gender.1
Second, this study is based on a sample of recently arrested adolescents. The majority of evidence
in support of PBS is based on community samples of adolescents which contain low rates of youth
heavily involved in problem behaviors. Indeed, adolescent offenders report heightened levels of
problem behaviors, most notably substance use and risky sexual practices. Therefore, relying on
adolescent offending populations to study PBS enhances the variability in the observed behaviors
which provides a more powerful test of their interrelationships. Because the sample used in this
study involves recently arrested juveniles, the behaviors of a diverse sample of adolescents including
first-time offenders, serious and nonserious offenders, and repeat offenders were analyzed. Thus,
this sample includes greater variation in the type and level of problem behaviors compared to
community-based samples. If the covariation among the behaviors remains strong, greater support
for the existence of these relationships will be provided, in turn, supplementing the results from gen-
eral population studies.
Third, the results of this study inform the development of prevention and intervention services.
Examining the variation in the strength of the association among risky sexual behavior, criminal
involvement, and substance use across demographic characteristics provides valuable information
regarding the similarities and differences in the service needs of at-risk adolescents. Furthermore,
understanding how age influences PBS, as well as identifying variations in the effect of age on PBS
across demographic subgroups, helps identify which adolescents are most in need of early interven-
tion services and which behaviors should be targeted. Understanding race and/or gender disparity in
the service needs of juvenile offenders, or adolescents at risk for justice system involvement, is crit-
ical to ensuring that communities are able to effectively address the needs of all adolescents in the
316 Youth Violence and Juvenile Justice 9(4)
at UNIV OF SOUTH FLORIDA on July 15, 2013yvj.sagepub.comDownloaded from

community, not just one particular subgroup of adolescents. Three main hypotheses guided the
current study:
1. Engagement in risky sexual practices, substance use, and delinquent behavior will form a
unified latent construct representative of PBS among a sample of newly arrested juvenile offenders.
2. Age will have a positive, direct effect on this latent factor.
3. The factor structure, as well as the effect of age on the latent factor, will vary across demo-
graphic subgroups of newly arrested juvenile offenders.
Method
Sample
Data for this study were collected in a National Institute on Drug Abuse (NIDA) funded research
project located in Hillsborough County, Florida. The project involved a successful collaboration
among the Hillsborough County Juvenile Assessment Center (HJAC), the Florida Department of
Health (DOH), Hillsborough County Health Department (HCHD), and the Florida Department of
Juvenile Justice (DJJ).
All youth under the age of 18 who are arrested in Hillsborough County are transported to the
HJAC for intake screening and assessment procedures. Standard HJAC processing involves trained
staff completing a Detention Risk Assessment Instrument (DRAI) to determine if an arrested youth
will be released to the community, placed on nonsecure home detention, or sent to secure detention.
In addition, youth are asked to voluntarily participate in a psychosocial risk assessment and to pro-
vide a urine specimen for drug testing.
Data collection for the project began in June 2006 and ended in December 2006. All juvenile arrestees
taken to the HJAC who were over the age of 11 and agreed to provide a urine sample for drug testing were
eligible for participation in the study.2 A protocol was established involving three major steps (discussed
in more detail in Belenko et al., 2008). First, project-trained HJAC assessors provided brief STD
counseling. Second, HJAC assessors asked eligible youth to consent to their urine specimens being split
for Chlamydia and Gonorrhea testing and to complete a short STD risk assessment questionnaire asking
about previous STD-related behaviors and services. Last, DOH laboratory staff informed Disease
Intervention Specialist (DIS) staff of STD-positive youths who DIS staff would then seek to locate and
treat. Among the eligible youths, 70.5% of males and 72.7% of females (71.5% of assessed youth over-
all) consented to participate in the study. In total, 948 youth, 506 males and 442 females, agreed to par-
ticipate in the project.3
The data used for this study were weighted. Females account for about 25% of the overall HJAC
population. However, to ensure sufficient power for gender-specific analyses, they were overenrolled
in the project to account for approximately half of study participants. Therefore, weighting was needed
to adjust the sample to represent the targeted population (i.e., the newly arrested juvenile population in
Hillsborough County). Accordingly, the proportion of potential male enrollees per month from June
through September 2006 was used to estimate the number of eligible males booked over the entire
recruitment period and to calculate a weighting factor of 1.901 for eligible males (n¼ 506, weighted
n ¼ 961). In all analyses, the male cohort was weighted to provide estimates for the full population
during the recruitment period. The female cohort, based on all eligible females, was not weighted.
Thus, the total weighted sample used in the current study involves 1,403 newly arrested adolescents.
MeasuresDrug Test Analysis. Drug use was measured with two separate indicators: marijuana use and
cocaine use. Drug use data are based on the urine specimen that was voluntarily provided by study
Childs et al. 317
at UNIV OF SOUTH FLORIDA on July 15, 2013yvj.sagepub.comDownloaded from

participants. At the testing lab, the split urine specimens were tested for drugs using the Enzyme
Multiplied Immunoassay Technique(EMIT) procedure. The cutoff level for a positive marijuana
test result was 50 ng/ml and the cutoff level for a positive cocaine test result was 300 ng/ml. Both
variables were dichotomous, coded 0 ¼ negative and 1 ¼ positive.
Risky sexual behavior. Data on sexual practices was obtained from the self-report STD risk assess-
ment questionnaire. Three types of risky sexual behavior were included in this study. Sex without a
condom was measured with the question ‘‘Have you ever had unprotected sexual intercourse with
the opposite sex?’’ Sex on drugs/alcohol was measured with the question ‘‘Have you ever had sexual
intercourse while using alcohol or other drugs?’’ Multiple partners was an open-ended question ask-
ing respondents to reveal the number of sex partners in their lifetime. Responses were recoded into a
dichotomous variable representing ‘‘four or more lifetime partners.’’4 Each risky sexual behavior
item was dichotomous, coded 0 ¼ no and 1 ¼ yes. The three sexual risk items were summed into
one overall risky sexual behavior index ranging from 0 (no risky sexual behavior) to 3 (all three risky
sexual behaviors).
Criminal history. Criminal involvement was obtained from official arrest history records. This
information was obtained via the Department of Juvenile Justice’s tracking system ( JJIS). Arrest
history represents the number of all prior arrests listed for each juvenile included in the study. This
includes arrests for felony and misdemeanor charges, as well as noncriminal arrests (e.g., violation
of probation). Descriptive statistics revealed a skewed distribution. Therefore, ‘‘prior arrests’’ was
truncated at the 90th percentile, which equaled seven arrests. This item is a categorical variable rang-
ing from 0 to 7 (i.e., seven represents seven or more lifetime arrests).
Demographic characteristics. Three demographic characteristics were used in the analyses: gender,
race, and age. Less than 1% of the respondents were identified as a race other than White or African
American (e.g., Native American, Asian, other). Therefore, race was dichotomized distinguishing
between African American youth and non-African American (mostly White) youth.5 Table 1 pro-
vides a description of the weighted sample.
Analytic Plan
This study is based on the assumption that engaging in risky sexual practices, substance use, and
delinquent behavior form an underlying factor representing PBS. Thus, a priori assumptions regard-
ing the factor structure of PBS guided the current study. As such, confirmatory factor analysis (CFA)
was used to address the first research question because it allows for the specification of these
expected relationships prior to analyzing the model. The first step in the analyses examined a CFA
model involving the four observed variables using all 1,403 cases. The results of this model laid the
groundwork for all subsequent analyses.
A second goal of the current study was to examine how age influences PBS. Therefore, structural
equation modeling (SEM) techniques were used to incorporate a path reflecting the effect of age on
the latent factor. The SEM involves a standard CFA (measurement model), and path analysis, which
focuses on the directional relationships between two or more latent factors and/or additional covari-
ates posited to be related to the latent factor (structural model; Byrne, 2001). Including age as a cov-
ariate, rather than a grouping variable, enabled the preservation of the continuous nature of the
variable and allowed for the estimation of this linear relationship. The SEM-based model is pre-
sented in Figure 1.
The third objective of this study was to compare the factor structure of the latent factor across
different subgroups of recently arrested adolescents based on the intersection of race and gender.
The four subgroups examined in this study are: African American males (AAM; n ¼ 517), African
318 Youth Violence and Juvenile Justice 9(4)
at UNIV OF SOUTH FLORIDA on July 15, 2013yvj.sagepub.comDownloaded from

American females (AAF; n ¼ 219), non-African American males (NAAM; n ¼ 445), and
non-African American females (NAAF; n ¼ 223).
The purpose of group-based factor analytic techniques is to determine whether groups differ in
interpretable ways on one or more latent factors by testing the invariance of the relations among the
observed variables across groups. Model invariance reflects the assumption that the relationship
between the latent factor and the observed variables is equal across the groups (Widaman & Reise,
1997).
The first step involves identifying a baseline model that adequately fits the data. The baseline
model is an unconstrained (i.e., free) measurement model allowing the model parameters to be freely
estimated for each group. In subsequent analyses, this baseline model serves as a benchmark to com-
pare more constrained (i.e., invariant) models. The next step involves testing measurement invar-
iance. This step entails examining a constrained CFA, which consists of fixing parameter
estimates (e.g., factor loadings, factor variances, factor means) to be equal across the groups. The
Table 1. Sample Characteristics of the Weighted Sample (n ¼ 1403)
Variable N % of Sample
GenderMale 961 68.5Female 442 31.5
RaceAfrican American 736 52.4Non African American (82% Caucasian) 664 47.3
Age12 40 2.813 132 9.414 194 13.815 273 19.516 345 24.617 364 26.018 54 3.9Mean age ¼ 15.5 (SD ¼ 1.48)
Post-HJAC placementRelease 849 60.5Nonsecure home detention 217 15.5Secure detention 335 23.9
Prior arrests0 584 41.61 234 16.72 161 11.53 110 7.94 77 5.55 62 4.46 32 2.37 or more 141 10.0
Risky sexual practicesSex without a condom 302 21.5More than four lifetime partners 392 28.0Sex while using drugs/alcohol 110 7.9
Drug test positiveMarijuana positive 529 37.7Cocaine positive 75 5.3
Childs et al. 319
at UNIV OF SOUTH FLORIDA on July 15, 2013yvj.sagepub.comDownloaded from

modification indices based on the results of the constrained model provide suggestions for ways to
improve the model fit. These suggestions indicate which parameter estimates should be allowed to
vary across the groups (freed), by identifying disparities in the observed variable–latent factor rela-
tions. The value of the modification indices represents the expected drop in chi-square if the para-
meter is freed (Muthen & Muthen, 2007). Finally, a chi-square test of model difference is used to
determine which model is the best-fitting model. This statistic tests the baseline model (i.e., uncon-
strained model) against the more restricted (i.e., invariant) model. A nonsignificant chi-square indi-
cates that constraining the model parameters does not worsen the fit of the model to the data, thus,
suggesting that a higher degree of measurement invariance is appropriate.
Based on the group-based modeling process outlined above, the multigroup analyses pro-
ceeded in several steps. For exploratory purposes, a separate CFA for each subgroup was per-
formed to assess whether the PBS model fit the data for each group separately. Then, three
group-based CFA models were examined: (a) the unconstrained group-based CFA, (b) fully con-
strained group-based CFA, based on the modification indices of the constrained model, and (c) a
partially constrained model. Finally, a chi-square difference test was used to identify which of
these models fit the data best. The best-fitting model served as the measurement model of the
final group-based SEM.
All of the models were estimated using Mplus version 5.1 (Muthen & Muthen, 2007). Several
fit indices were used to assess how well the prespecified models fit the data. The chi-square of
model fit (w2) indicates whether the specified model’s covariance structure is significantly differ-
ent from the observed covariance matrix (Byrne, 2001). A nonsignificant p-value is desirable.
Root Mean Square Error of Approximation (RMSEA) values of .05 or less indicate a close model
fit, and values between .05 and .08 indicate an adequate model fit (Browne & Cudeck, 1993; Hu
& Bentler, 1999). The Comparative Fit Index (CFI) and the Tucker Lewis Index (TLI) measure
the covariation among the observed variables in the data (Tucker & Lewis, 1973). The typical
range for both TLI and CFI is between 0 and 1 with values greater than .90 indicating an accep-
table model fit (Browne & Cudeck, 1993). Finally, with categorical variables, the weighted root
mean square residual (WRMR) is used to represent the weighted difference between the predicted
and observed variances and covariances. The WRMR values of less than .90 indicate a good
model fit (Yu & Muthen, 2001).6
MarijuanaTest Result
CocaineTest Result
CriminalHistory
Sexual RiskIndex
e
e
e
e
F
Age
Figure 1. General structural equation model.
320 Youth Violence and Juvenile Justice 9(4)
at UNIV OF SOUTH FLORIDA on July 15, 2013yvj.sagepub.comDownloaded from

Results
The bivariate correlations among the four observed variables are shown in Table 2. All correlations
were significant and positive, indicating that participation in any one of the behaviors was signifi-
cantly related to participation in the other three problem behaviors.
Confirmatory Factor Analysis
The results of the CFA model are presented in Table 3.7
The model fit indices highlighted a good fit of the model to the data. The chi-square test of model
fit was nonsignificant, both CFI and TLI were close to 1, and the WRMR was low. The RMSEA
equaled zero, which means that the model fit the data so well that the RMSEA could not be esti-
mated. Based on these results, it can be concluded that, the risky sexual behavior index, marijuana
and cocaine test result, and arrest history formed a unidimensional factor reflecting PBS. Therefore,
this CFA model served as the measurement model for all subsequent analyses reported in this study.
Basic Structural Equation Model
Prior to analyzing the SEM, the bivariate relationship between age and each of the four observed
variables was assessed. Results indicated older participants were significantly more likely to
test positive for marijuana and cocaine and report a greater number of risky sexual practices
(p < .001). Older adolescents were also somewhat more likely to have a higher number of arrests
(p < .05).
The results of the basic structural equation model are presented in Table 4. Introducing age as a
direct effect on the PBS latent factor reduced the quality of the fit of the model to the data (compared
to the CFA results in Table 3). The fit of the overall model was marginally acceptable. The direct
effect of age on the latent factor revealed a significant, positive effect which suggests that the
Table 2. Polychoric Correlations between the Observed Indicators (n ¼ 1,403)
1 2 3 4
1. Marijuana —2. Cocaine 0.559* —3. Sexual risk index 0.356* 0.322* —4. Arrest history 0.277* 0.273* 0.203* —
* p < .01.
Table 3. Confirmatory Factor Analysis (n ¼ 1,403)
Variable Estimate SE Critical Ratio
F1 bySex risk 1.000 — —Marijuana 1.554* 0.286 5.427Cocaine 1.511* 0.243 6.222Arrest history 0.801* 0.149 5.370
Residual varianceF1 0.231* 0.054 3.780
Model fit statistics: w2 [2] ¼ .539, p ¼ .76; CFI ¼ 1.000; TLI ¼ 1.021; RMSEA ¼ .00; WRMR ¼ .151.* p < .001.
Childs et al. 321
at UNIV OF SOUTH FLORIDA on July 15, 2013yvj.sagepub.comDownloaded from
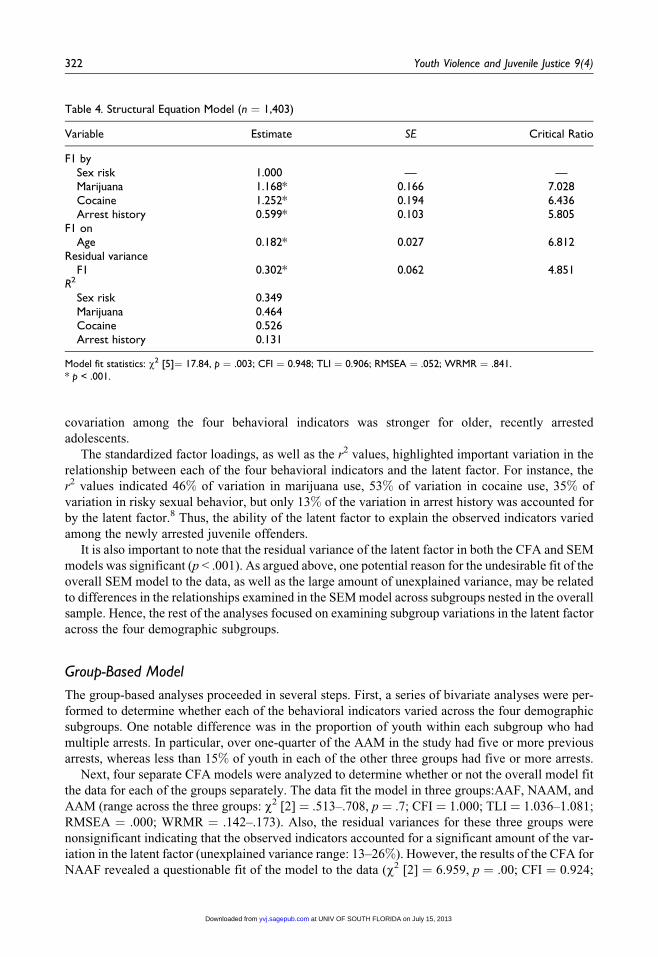
covariation among the four behavioral indicators was stronger for older, recently arrested
adolescents.
The standardized factor loadings, as well as the r2 values, highlighted important variation in the
relationship between each of the four behavioral indicators and the latent factor. For instance, the
r2 values indicated 46% of variation in marijuana use, 53% of variation in cocaine use, 35% of
variation in risky sexual behavior, but only 13% of the variation in arrest history was accounted for
by the latent factor.8 Thus, the ability of the latent factor to explain the observed indicators varied
among the newly arrested juvenile offenders.
It is also important to note that the residual variance of the latent factor in both the CFA and SEM
models was significant (p < .001). As argued above, one potential reason for the undesirable fit of the
overall SEM model to the data, as well as the large amount of unexplained variance, may be related
to differences in the relationships examined in the SEM model across subgroups nested in the overall
sample. Hence, the rest of the analyses focused on examining subgroup variations in the latent factor
across the four demographic subgroups.
Group-Based Model
The group-based analyses proceeded in several steps. First, a series of bivariate analyses were per-
formed to determine whether each of the behavioral indicators varied across the four demographic
subgroups. One notable difference was in the proportion of youth within each subgroup who had
multiple arrests. In particular, over one-quarter of the AAM in the study had five or more previous
arrests, whereas less than 15% of youth in each of the other three groups had five or more arrests.
Next, four separate CFA models were analyzed to determine whether or not the overall model fit
the data for each of the groups separately. The data fit the model in three groups:AAF, NAAM, and
AAM (range across the three groups: w2 [2] ¼ .513–.708, p ¼ .7; CFI ¼ 1.000; TLI ¼ 1.036–1.081;
RMSEA ¼ .000; WRMR ¼ .142–.173). Also, the residual variances for these three groups were
nonsignificant indicating that the observed indicators accounted for a significant amount of the var-
iation in the latent factor (unexplained variance range: 13–26%). However, the results of the CFA for
NAAF revealed a questionable fit of the model to the data (w2 [2] ¼ 6.959, p ¼ .00; CFI ¼ 0.924;
Table 4. Structural Equation Model (n ¼ 1,403)
Variable Estimate SE Critical Ratio
F1 bySex risk 1.000 — —Marijuana 1.168* 0.166 7.028Cocaine 1.252* 0.194 6.436Arrest history 0.599* 0.103 5.805
F1 onAge 0.182* 0.027 6.812
Residual varianceF1 0.302* 0.062 4.851
R2
Sex risk 0.349Marijuana 0.464Cocaine 0.526Arrest history 0.131
Model fit statistics: w2 [5]¼ 17.84, p ¼ .003; CFI ¼ 0.948; TLI ¼ 0.906; RMSEA ¼ .052; WRMR ¼ .841.* p < .001.
322 Youth Violence and Juvenile Justice 9(4)
at UNIV OF SOUTH FLORIDA on July 15, 2013yvj.sagepub.comDownloaded from

TLI ¼ 0.810; RMSEA ¼ .105; WRMR ¼ .475). In addition, the residual variance for this subgroup
was significant; 37% of the variation in the PBS latent factor was not explained by the behavioral
indicators. Interestingly, the residual variance was significant (p < .001) in the overall CFA model
(Table 2), but in three of the four group-specific CFA models, it was nonsignificant. Thus, further
investigation of the structure of the latent factor across these groups was warranted.
Unconstrained group-based CFA. The first model that was analyzed involved an unconstrained (i.e.,
free) model in which the factor loadings and thresholds were free to vary across the groups, while the
intercepts were held at zero.9 Results of this model indicated a good fit of the model to the data. The
chi-square test of model fit was nonsignificant (w2 [8] ¼ 7.52, p ¼ .48), CFI and TLI were greater
than 0.90 (CFI¼ 1.00, TLI¼ 1.01), RMSEA was low (.000), and the WRMR was less than .90 (.55).
All of the factor loadings were significant (p < .05) and in the same direction across the four groups.
Constrained group-based CFA. This step involved examining measurement invariance. In the con-
strained CFA, the factor loadings and thresholds were held equal across the groups. The results of
this model revealed a poor fit of the model to the data. The chi-square test of model fit was signif-
icant (w2 [26] ¼ 58.94, p ¼ .0002), CFI and TLI were less than 0.90 (CFI ¼ 0.87, TLI ¼ 0.89), and
RMSEA and WRMR were high (RMSEA¼ .07, WRMR¼ 1.74). These results indicate that impor-
tant differences in the factor structure of the latent construct existed across the four groups.
The modification indices for the constrained CFA provided two important changes to the model.
The first suggestion involved freeing the arrest history factor loading for the AAM (MI ¼ 15.043).
As noted above, preliminary bivariate analyses indicated that this group displayed the largest pro-
portion of youths with a high number of prior arrests (three or more arrests). The second suggestion
involved freeing the threshold of the sexual risk index for NAAF (MI¼ 15.943). Preliminary bivari-
ate analyses suggested this group represented a high-risk group for risky sexual behavior. Thus, it is
possible that these associations influenced the relationships between arrest history and the PBS
latent factor for AAM, and risky sexual behavior and the PBS latent factor for NAAF. Substantively,
these modifications also seemed justified. The AAM are disproportionately overrepresented in offi-
cially recorded delinquency which suggests that this item may be differentially related to PBS com-
pared to the other three groups. Similarly, research suggests that female offenders are at a heightened
risk for engaging in risky sexual practices and testing STD positive (Kingree et al., 2000).
Final group-based CFA. Based on the modification indices, the next CFA that was performed
involved freeing the thresholds of the sexual risk index for the NAAF and freeing the arrest
history factor loading for the AAM. The fit indices highlighted a good fit of the model to the data
(w2 [23] ¼ 26.95, p ¼ .26; CFI ¼ 0.985; TLI ¼ 0.986; RMSEA ¼ .027; WRMR ¼ 1.150).
To determine the best-fitting CFA model, the chi-square difference test was used. Because the
fully constrained model revealed a poor fit, it was not necessary to include this model in the chi-
square difference test. Thus, this step involved comparing the unconstrained model (baseline model)
to the partially constrained model (i.e., freed factor loading for arrest history for AAM and sexual
risk thresholds for NAAF). Results of the chi-square difference test indicated that constraining the
model did not worsen the fit of the model (w2 [16]¼ 20.27, p¼ .21). Therefore, the final CFA model
used in the SEM analyses was the partially constrained model.
Final group-based SEM. The results of the final group-based SEM (Table 5) show that the model fit
the data (w2 [17] ¼ 21.68, p ¼ .20; CFI ¼ 0.986; TLI ¼ 0.970; RMSEA ¼ .034; WRMR ¼ 1.134).
The factor loadings for each of the observed variables were positive and highly significant
(p < .001), except for the freed arrest history factor loading for AAM, which remained moderately
significant (p < .05). The standardized estimates for each of the subgroups’ arrest history factor load-
ing were: AAM¼ 0.329, NAAM¼ 0.426, NAAF¼0.574, AAF¼0.394. Thus, compared to the other
Childs et al. 323
at UNIV OF SOUTH FLORIDA on July 15, 2013yvj.sagepub.comDownloaded from

Tab
le5.G
roup-B
ased
Stru
ctura
lEquat
ion
Model
Non
AA
Fem
ales
AA
Fem
ales
Non
AA
Mal
esA
AM
ales
Est
imat
eSE
CR
Est
imat
eSE
CR
Est
imat
eSE
CR
Est
imat
eSE
CR
F1by
Sex
risk
1.0
00
——
1.0
00
——
1.0
00
——
1.0
00
——
Mar
ijuan
a0.9
42**
0.2
39
3.9
41
0.9
42**
0.2
39
3.9
41
0.9
42**
0.2
39
3.9
41
0.9
42**
0.2
39
3.9
41
Coca
ine
1.1
66**
0.3
08
3.7
81
1.1
66**
0.3
08
3.7
81
1.1
66**
0.3
08
3.7
81
1.1
66**
0.3
08
3.7
81
Arr
est
his
tory
0.6
85**
0.1
80
3.7
96
0.6
85**
0.1
80
3.7
96
0.6
85**
0.1
80
3.7
96
0.6
98*
0.2
26
2.6
22
Mea
nF1
�3.6
02
2.5
32
�1.4
23
0.4
84
1.4
46
0.3
34
0.0
00
——
0.5
78
1.1
91
0.4
85
Res
idual
vari
ance
F10.6
08
0.4
29
1.4
17
0.1
82
0.1
44
1.2
61
0.3
45**
0.1
18
2.9
21
0.1
19
0.0
85
1.4
04
Thre
shold
sM
ariju
ana1
2.4
05**
0.8
01
3.0
33
2.4
05**
0.8
01
3.0
33
2.4
05**
0.8
01
3.0
33
2.4
05**
0.8
01
3.0
33
Coca
ine1
3.0
81**
1.1
59
2.6
58
3.0
81**
1.1
59
2.6
58
3.0
81**
1.1
59
2.6
58
3.0
81**
1.1
59
2.6
58
Sex
risk
11.2
46
1.7
47
0.7
13
3.8
68**
0.8
48
4.5
64
3.8
68**
0.8
48
4.5
64
3.8
68**
0.8
48
4.5
64
Sex
risk
22.3
05
1.7
91
1.2
87
4.7
15**
0.9
22
5.1
15
4.7
15**
0.9
22
5.1
15
4.7
15**
0.9
22
5.1
15
Sex
risk
33.1
63
1.8
96
1.6
68
5.4
66**
1.0
25
5.3
34
5.4
66**
1.0
25
5.3
34
5.4
66**
1.0
25
5.3
34
Arr
est
his
tory
10.8
33
0.7
51
1.1
09
0.8
33
0.7
51
1.1
09
0.8
33
0.7
51
1.1
09
0.8
33
0.7
51
1.1
09
Arr
est
his
tory
21.2
68
0.7
45
1.7
03
1.2
68
0.7
45
1.7
03
1.2
68
0.7
45
1.7
03
1.2
68
0.7
45
1.7
03
Arr
est
his
tory
31.6
05*
0.7
48
2.1
46
1.6
05*
0.7
48
2.1
46
1.6
05*
0.7
48
2.1
46
1.6
05*
0.7
48
2.1
46
Arr
est
his
tory
41.8
42*
0.7
54
2.4
43
1.8
42*
0.7
54
2.4
43
1.8
42*
0.7
54
2.4
43
1.8
42*
0.7
54
2.4
43
Arr
est
his
tory
52.0
28*
0.7
64
2.6
55
2.0
28*
0.7
64
2.6
55
2.0
28*
0.7
64
2.6
55
2.0
28*
0.7
64
2.6
55
Arr
est
his
tory
62.2
02**
0.7
74
2.8
47
2.2
02**
0.7
74
2.8
47
2.2
02**
0.7
74
2.8
47
2.2
02**
0.7
74
2.8
47
Arr
est
his
tory
72.3
28**
0.7
82
2.9
78
2.3
28**
0.7
82
2.9
78
2.3
28**
0.7
82
2.9
78
2.3
28**
0.7
82
2.9
78
F1on
Age
0.2
84*
0.1
17
2.4
26
0.1
22*
0.0
55
2.2
09
0.1
60**
0.0
48
3.3
75
0.1
33*
0.0
53
2.5
23
R2
Sex
risk
0.4
04
0.4
46
0.3
77
0.2
39
Mar
ijuan
a0.2
38
0.5
81
0.3
36
0.5
49
Coca
ine
0.7
02
0.7
47
0.5
04
0.5
11
Arr
est
his
tory
0.3
29
0.0
87
0.1
81
0.1
08
Model
fitst
atis
tics
:w2
[17]¼
21.6
8,p¼
.20;C
FI¼
0.9
86;T
LI¼
0.9
70;R
MSE
A¼
.034;W
RM
R¼
1.1
34.
Sign
ifica
nce
leve
ls:*p
<.0
5;**
p<
.01.
324 at UNIV OF SOUTH FLORIDA on July 15, 2013yvj.sagepub.comDownloaded from

three groups, the relationship between number of prior arrests and the latent factor was not as strong for
newly arrested AAM. Also, all three sexual risk (freed) thresholds for the NAAF revealed nonsigni-
ficant effects, whereas all three sexual risk thresholds for the other three groups were highly significant
(p < .001). Hence, the number of risky sexual behaviors reported did not influence the strength of the
relationship between risky sexual behavior and the latent factor for newly arrested NAAF.
The effect of age on the latent factor was significant and positive in all four groups. However, the
effect of age on the latent factor was somewhat stronger for the NAAM (NAAM: bstdYX¼ 0.560), com-
pared to the other groups (AAF: bstdYX¼ 0.423, NAAF: bstdYX¼ 0.444, AAM: bstdYX¼ 0.494).10 Inter-
estingly, significant differences in the factor means were found in the final, partially constrained CFA
(NAAF: –.623, p < .01; AAF: –.124, p < .05; AAM: .202, p < .01; NAAM: reference group). However,
these mean differences disappeared in the group-based SEM. Hence, the introduction of age into the
model accounted for differences in the average level of the latent factor across the groups.
The residual variances reported in Table 5 also revealed some important findings. For NAAM,
there was a significant amount of variance in the latent factor that was not accounted for by the beha-
vioral indicators. The residual variance was nonsignificant for the other three groups. Taken as a
whole, these findings indicate that, although the overall fit of the model was similar, the association
between the latent factor and each behavioral indicator was somewhat different across the groups.
Discussion
The findings of this study provided support for all three hypotheses. The CFA provided support for a
strong association among risky sexual practices, substance use, and criminal offending among a
sample of newly arrested juvenile offenders (i.e., unidimensional latent factor representative of
PBS). Thus, this study adds to the literature on adolescent problem behaviors by providing further
support for the existence of PBS among offenders. Age revealed a significant, direct effect on the
later factor. This finding suggests that the association among risky sexual practices, substance use,
and delinquency was stronger for older, recently arrested adolescents involved in this study. Finally,
the results of this study also suggest that important similarities, as well as differences, exist in the
manifestation of PBS across subgroups of adolescent offenders based on race and gender.
One important difference found was in regard to the relationship between arrest history and the latent
factor for AAM. Freeing the arrest history factor loading improved the fit of the model, which signifies
differences in the relationship between arrest history and PBS for this subgroup of youth. Specifically,
the association between arrest history and the latent factor representative of PBS was not as strong for
AAM as it was for the other three groups. Two plausible explanations for this finding exist.
First, preliminary bivariate analyses suggested that a disproportionate number of AAM included
in this study had a high number of arrests. For example, 15% of AAM had seven or more arrests,
while 9% of NAAM, 6% of AAF, and 5% of NAAF had seven or more arrests. Similarly, 26%of AAM had no prior arrests, while 48% of NAAM, 45% of AAAAF, and 61% of NAAF had no
prior arrests. Therefore, it is possible that this behavior is not as strong an indicator of additional
behavioral problems compared to the other three groups. That is, if engaging in delinquent behavior
is considered ‘‘less deviant’’ behavior for this group of adolescents, then arrest history may not be a
critical component of PBS for AAM. The second possible explanation is related to the reliance on
officially recorded juvenile delinquency. It is widely argued that racial bias exists in the arrest pro-
cedures of juvenile offenders (Lieber, 2003; OJJDP, 1999). Thus, the weaker relationship between
PBS and criminal involvement may not suggest delinquency is ‘‘more normative’’ behavior for this
subgroup, but rather an indicator of bias in arrest procedures. Future research is needed to tease out
the subgroup differences in the association between delinquent behavior and PBS based on different
measurement strategies, as well as to determine if the findings of this study can be replicated using
self-reported delinquency.
Childs et al. 325
at UNIV OF SOUTH FLORIDA on July 15, 2013yvj.sagepub.comDownloaded from

Another important difference found in this study was related to the relationship between risky
sexual practices and the latent factor. Results indicated that freeing the sexual risk thresholds for the
NAAF further improved the fit of the model to the data. Once the thresholds were freed for this
group, they became nonsignificant. It is important to note that the sexual risk factor loading
remained significant across the four groups. This means that the overall strength of the association
between risky sexual practices and the latent factor was similar across the groups; however, for
NAAF, the specific number of risky sexual practices reported did not influence this association.
Thus, for the NAAF included in this sample, distinguishing between those who reported one versus
three risky sexual practices did not influence the strength of the relationship between the sexual
behavior index and the latent factor.
These findings suggest that, for the NAAF, what is important is whether or not she engaged in the
behavior. Risk of PBS was similar across the extent to which a NAAF was involved in risky sexual
practices (i.e., number of items reported). Based on these results, level of risky sexual behavior may
not be an effective tool for identifying NAAF most likely to display PBS. However, the extent of
engagement in risky sexual practices seems to be an appropriate indicator for identifying youth who
manifest PBS in the other three groups. For NAAF, initiation of risk-taking sexual behavior may be a
more appropriate indicator of multiple problem behaviors.
The concept of relative deviance may partially explain the subgroup differences found in this study.
According to this view, persons who are more deviant from the norms of their social and cultural set-
ting tend to exhibit more serious behavior problems (Kaufman, 1978). As mentioned earlier, because
being arrested was more common among the AAM in this study, it is likely that this behavior is con-
sidered more normative to the cultural and social surroundings of these adolescents, in turn, reducing
the strength of its relationship with more serious problem behaviors (Dembo & Shern, 1982). Simi-
larly, there are important gender differences in the expectations of sexual behavior during adoles-
cence. It is substantially more common for young men to talk or boast about their sexual
encounters, and less likely that they will be judged, ridiculed, or scolded for engaging in these beha-
viors. At the same time, AAAAF adolescents are more likely to experience teenage pregnancy, as well
as test STD positive, compared to the other three groups (CDC, 2008). Thus, engaging in risky sexual
practices for NAAF may be somewhat ‘‘more deviant’’ compared to the other three groups. This
would explain the finding that, whether or not a NAAF engaged in risky sexual practices, not the level
of engagement, was related to PBS. For this subgroup of adolescents, even minimal involvement in
risky sexual practices may be a sign of more serious problem behaviors.
This study also sought to explore the issue of relatively low levels of explained variance reported in
previous studies. In particular, it was argued that the low levels of explained variation could be a result
of the failure to account for group differences in the associations among the observed variables and the
latent factor. The findings of this study provide a measure of support for this argument. Similar to a
number of previous studies examining PBS (see LeBlanc & Bouthillier, 2003), the overall SEM model
using the entire sample revealed a significant factor variance. But, the results of the group-based SEM
highlighted differences in the ability of the observed variables to explain the latent factor. Specifically,
NAAM were the only group for which there was a significant amount of variation that was not
accounted for by the four observed variables. Thus, in order to fully understand PBS among this demo-
graphic subgroup, future research is needed to identify which additional problem behaviors are impor-
tant components of the syndrome.
Implications of the Current Study
Over the past decade, the reliance on global needs assessment tools (also referred to as
treatment-focused instruments) to identify the ‘‘problem areas’’ or service needs of juvenile
offenders has dramatically increased (Skowyra & Cocozza, 2010). Researchers have already
326 Youth Violence and Juvenile Justice 9(4)
at UNIV OF SOUTH FLORIDA on July 15, 2013yvj.sagepub.comDownloaded from

begun to question whether these tools are equally effective in determining the services needs
of adolescents belonging to different race and/or gender groups (Brumbaugh, Walters, &
Winterfield, 2010). If future research confirms that the nature of PBS differs across important
sociodemographic factors, then this information also carries important policy implications for
juvenile justice agencies relying on these types of instruments. Differences in the level or types
of behaviors that represent PBS imply that PBS manifests itself differently across subgroups of
adolescents. Therefore, assessment tools that are designed to identify behavioral problems and
service needs should be standardized to account for these races and/or gender differences and
validated on each particular subgroup of adolescents to ensure that they are effectively capturing
the manifestation of problem behavior for all adolescents.
In addition, a wealth of empirical evidence suggests that intervention programs that are specifi-
cally tailored and delivered to a particular subgroup of adolescents are the most successful in
decreasing high-risk behaviors (e.g., NAAF) (DiClemente et al., 2004; Jemmott, Jemmott, & Fong,
1998; Orr, Langefeld, Katz, & Caine, 1996). The reason for the effectiveness of tailored intervention
programs stems from the acknowledgement that ‘‘adolescents are a heterogeneous mosaic of sub-
groups of different ethnicities/cultures, behavioral risk characteristics, developmental levels, sexual
preferences, and gender differences’’ (DiClemente et al., 2008, p. 600). Thus, adapting prevention
and intervention strategies to meet the developmental and social needs of each particular subgroup
of adolescents at risk for PBS seems to be the most effective intervention strategy. Accordingly, if
the subgroup differences in the associations among problem behaviors found in this study are repli-
cated in other jurisdictions and on other samples of youth, these findings cannot be ignored.
The significant effect of age on the latent factor across the four groups, as well as the disappear-
ance of the significant PBS factor mean differences once age was included in the model, also under-
scores the importance of early intervention for at-risk adolescents. The strongest effect of age on the
latent factor was found among the AAM. Early prevention strategies may be particularly effective
for this subgroup of adolescents. Based on a review of effective intervention strategies, Farrington
and Welsh (2006) recommend that early intervention should (a) begin by early adolescence,
(b) intervene before the onset of misbehavior, and (c) target children who are identified as being
at risk for behavioral problems. The findings of this study support these recommendations, as well
as represent a preliminary step in determining which subgroups of adolescents (i.e., AAM) would
benefit the most from early intervention efforts. That is, understanding how age influences the
strength of the item–factor relations differently for different subgroups of adolescents is critical
to identifying which adolescents are most in need or prevention services, as well as which develop-
mental stage should be targeted for each particular subgroup.
Limitations to the Current Study
The use of already collected data limited the measurement of key variables used in the current study.
As mentioned above, the measure of delinquent behavior used in this study only captures behaviors
for which the participant was caught and apprehended. Using biological measures of substance use
also has its shortcomings due to the short time period for which drug use is detectable in urine. For
heavy users, marijuana stays in the system for approximately 20 days and cocaine remains in the
system for less than 4 days (Dembo et al., 1999). Therefore, the substance use measures used in the
current study only capture recent drug use.
On the other hand, the risky sexual behavior measures used in this study were based on self-
reports. Because engaging in sexual behavior, particularly unsafe sexual behavior, is considered a
private matter, the participants may not have felt comfortable fully disclosing their sexual history
to screeners whom they have never met before. Therefore, underreporting of this behavior is likely.
Finally, the data were collected at one site, which limits the generalizability of these results. There is
Childs et al. 327
at UNIV OF SOUTH FLORIDA on July 15, 2013yvj.sagepub.comDownloaded from

a need to determine if these findings can be replicated in centralized intake centers in other locations,
serving different populations of juvenile arrestees.
The inconsistency in the time frame included in the measurement of the observed behaviors is
also a shortcoming. For example, officially recorded delinquency encompasses delinquent behavior
across the youths’ lifespan. Similarly, the risky sexual practice items asked respondents if they had
‘‘ever’’ engaged in the behavior, again, referring to lifetime behavior. Yet, relying on drug test
results to measure substance use only includes recent or current use. Therefore, it is uncertain
whether or not the youths involved in this study were simultaneously engaging in these behaviors.
Furthermore, because the arrest history and risky sexual practice items measure lifetime participa-
tion, the meaningfulness of the significant effect of age on the latent factor is also questionable.
It was determined that older study participants were engaging in the four problem behaviors at a
substantially higher rate than younger study participants. On one hand, this signifies an important
direct effect of age. On the other hand, however, it is also likely that the older adolescents had a more
extensive time window during which to engage in such behaviors. Future research is needed to tease
out these possibilities to better understand the relative effect of age on the latent factor across
different developmental time periods.
An additional limitation to the findings of this study is the failure to consider social class as an
individual-level factor that has the potential to influence PBS. Some researchers have argued that
racial differences found in behavior may actually be as a proxy for social class differences in
behavior (Kawachi, Daniels, & Robinson, 2005). According to the US Census Bureau, in
2008, 12% of white adolescents lived in poverty, whereas 35% of black adolescents lived in
poverty (DeNavas-Walt, Proctor & Smith, US Census Bureau, 2010). This disparity is even more
pronounced for youth involved in the juvenile justice system. Due to class opportunity structures,
lower class adolescents may be more likely to engage in deviant behaviors as a result of blocked
opportunities, or the perception of blocked opportunities, to achieve desired goals. At the same time,
lower class adolescents are more likely to live in communities characterized by violence, poor role
models, and unsupervised socializing among peers. In addition, a wealth of research suggests that
underprivileged Black adolescents experience a double disadvantage due to race and class (Hawkins,
Laub, Lauritsen, & Cothern, 2000; Sampson & Laub, 1993). Therefore, future studies should
examine variations in PBS across different groups of adolescents based on race, class, and gender.
Despite these limitations, this study provides preliminary information on the similarities and
differences in the intervention needs of adolescents at the front end of the juvenile justice system.
Intervention efforts targeted at multiple behaviors at this phase of the process may prove to be more
effective than services at the back end of the system which affects a much smaller proportion of
adolescents, typically the most serious offenders. A wealth of research has indicated that serious
juvenile offenders are the most resistant to intervention strategies (Welsh, 2005). Therefore, intake
screening centers provide a great avenue for screening and assessment of a large, diverse number of
youths who may be more responsive to strategies targeted at PBS.
Acknowledgment
We would also like to thank the Hillsborough County, Florida Juvenile Assessment Center and the Hillsborough
County Health Department. We are grateful for Dr Paul Greenbaum’s advice on the analyses for this article.
Declaration of Conflicting Interests
The author(s) declared no conflicts of interest with respect to the authorship and/or publication of this article.
Funding
The author(s) disclosed receipt of the following financial support for the research and/or authorship of this arti-
cle: Preparation of this manuscript was supported by Grant # DA020346, funded by the National Institute on
328 Youth Violence and Juvenile Justice 9(4)
at UNIV OF SOUTH FLORIDA on July 15, 2013yvj.sagepub.comDownloaded from

Drug Abuse. The authors are grateful for their support. However, the research results reported and the views
expressed in the article do not necessarily imply any policy or research endorsement by our funding agency.
Notes1. Due to the noted differences in the correlation among problem behaviors across race and gender, as well as
the intersection of race and gender, it was decided to rely solely on race–gender subgroups.
2. Under Florida law, youth 12 and older do not need parental consent for sexually transmitted disease (STD)
testing.
3. No significant differences were found in consent rates by gender, race, age, or post-Hillsborough County
Juvenile Assessment Center (HJAC) placement.
4. The decision to use a cut-off of ‘‘four or more’’ lifetime partners was based on previous public health
research on adolescent offenders (Rickman et al., 1994; Teplin, Mericle, McClelland, & Abram,
2003).
5. Health Insurance Portability and Privacy Act(HIPPA) laws protected the privacy of the study participants,
so the research team did not have access to identifying information. The intake staff at the HJAC did not
collect ethnicity in a valid manner and typically left it blank. For example, less than 10% of the final sample
was Hispanic, but over 26% of the youth population (ages of 10 and 17) in Hillsborough County was His-
panic during the study time period. Thus, the proportion of study participants identified as Hispanic did not
seem representative (US Census Bureau, 2008). As a result, ethnicity was not included in these analyses.
6. Standard confirmatory factor analysis (CFA) and structural equation modeling (SEM) models rely on
general maximum likelihood (ML) estimation which assumes the observed variables are continuous
and normally distributed. These assumptions are not met when the observed variables are categorical.
Therefore, CFA and SEM with weighted least squares (WLS) regression were used. Based on the rec-
ommendation of Muthen, Du Toit, and Spisic (1997), the specific WLS estimator used in all analyses
was WLSMV, a type of weighted least squares regression that uses a diagonal weight matrix with
standard errors and with a mean and variance adjusted chi-square. This type of WLS estimation
involves WLS parameter estimates using a diagonal weight matrix with standard errors and a mean-
and variance-adjusted chi-square test statistic (Muthen & Muthen, 2007). This type of estimation
accounts for nonnormality, as well as sample size (Muthen et al., 1997).
7. The regression estimates and standard errors reported are unstandardized estimates.
8. The lower level of explained variance for arrest history may be partially explained by the restricted
variance in the arrest history variable (Table 1). Nearly 42% of the cases had zero prior arrests, 17% had
only one arrest, and 10% had seven or more arrests. Thus, there was little variation in the ‘‘middle range’’
categories for this item.
9. For categorical models, thresholds are modeled instead of means. A threshold is a z-score reflecting
the probability of falling in a given category, based on the latent factor (Muthen & Muthen, 2007).
10. Based on evidence supporting the age–crime curve, an additional group-based SEM was analyzed to assess
the quadratic relationship between age and the latent factor (i.e., model parameters were exactly the same as
the group-based SEM reported in Table 5 with the addition of the quadratic function of age regressed onto
the latent factor). The model fit indices did not substantially change and the direct effect of the quadratic func-
tion of age was nonsignificant for all four groups. This is likely due to the age range included in the sample
(range ¼ 12–18, mean ¼ 15.5, SD ¼ 1.48). In particular, the age range included in this study does not
involve the extended period from adolescence through early adulthood age range typically observed in stud-
ies examining the age–crime curve.
References
Barthlow, D. J., Horan, P. F., DiClemente, R. J., & Lanier, M. M. (1995). Correlates of condom use among
incarcerated adolescents in a rural state. Journal of Criminal Justice Behavior, 22, 295-306.
Childs et al. 329
at UNIV OF SOUTH FLORIDA on July 15, 2013yvj.sagepub.comDownloaded from

Bartlett, R., Holditch-Davis, D., & Belyea, M. (2005). Clusters of problem behaviors. Research in Nursing &
Health, 28, 230-239.
Basen-Engquist, K., Edmundson, E. W., & Parcel, G. S. (1996). Structure of health risk behavior among high
school students. Journal of Consulting & Clinical Psychology, 74, 764-775.
Belenko, S., Dembo, R., Weiland, D., Rollie, M., Salvatore, C., Hanlon, A., & Childs, K. (2008). Recently arrested
adolescents are at high-risk for sexually transmitted diseases. Sexually Transmitted Diseases, 35, 758-763.
Browne, M. W., & Cudeck, R. (1993). Alternative ways of assessing model fit. In K. Bollen & S. Long (Eds.),
Structural equation models (pp. 136-162). Newbury Park, CA: SAGE.
Brumbaugh, S., Walters, J. L. H., & Winterfield, L. A. (2010). Suitability of assessment instruments for delin-
quent girls. Washington DC: Bulletin. US Department of Justice, Office of Justice Programs, Office of
Juvenile Justice and Delinquency Prevention.
Bryan, A., & Stallings, M. C. (2002). A case control study of adolescent risky sexual behavior and its relationship to
personality dimensions, conduct disorder, and substance use. Journal of Youth and Adolescence, 31, 387-393.
Byrne, B. M. (2001). Structural equation modeling with AMOS. Mahwah, NJ: Lawrence Elbaum.
Castrucci, B. C., & Martin, S. L. (2002). The association between substance use and risky sexual behaviors
among incarcerated adolescents. Maternal and Child Health Journal, 6, 43-47.
Centers for Disease Control and Prevention (CDC). (2008). Sexually transmitted disease surveillance 2007 sup-
plement, Chlamydia prevalence monitoring project annual report 2006. Atlanta, GA: US Department of
Health and Human Services, Centers for Disease Control and Prevention.
Chapple, C., Johnson, K. D., & Whitbeck, L. B. (2004). Gender and arrest among homeless and runaway youth:
An analysis of background, family, and situational factors. Youth Violence and Juvenile Justice, 2, 129-147.
Costa, F. M., Jessor, R., Donovan, J. E., & Fortenberry, J. D. (1995). Early initiation of sexual intercourse: The
influence of psychosocial unconventionality. Journal of Research in Crime and Delinquency, 5, 93-121.
Dembo, R., Shemwell, M., Guida, J., Schmeidler, J., Baumgartner, W., Ramirez Garnica, G., & Seeberger, W.
(1999). Comparison of self-report, urine sample and hair testing for drug use: A longitudinal study. In
T.. Mieczkowski (Ed.), Drug testing methods: Assessment and evaluation (pp. 92-106). New York, NY:
CRC Press.
Dembo, R., & Shern, D. (1982). Relative deviance and the process of drug involvement among inner-city
youths. International Journal of Addictions, 17, 1373-1399.
Dembo, R., Williams, L., Wothke, W., Schmeidler, J., Getreu, A., Berry, E., & Wish, E. (1992). The generality
of deviance: Replication of a structural model among high risk youths. Journal of Research in Crime and
Delinquency, 29, 200-216.
DeNavas-Walt, C., Proctor, B. D., & Smith, J. C. (2010). Income, Poverty, and Health Insurance Coverage
in the United States: 2009. U.S. Census Bureau: Current Population Reports, Report # P60-238, U.S.
Government Printing Office, Washington, DC.
DiClemente, R. J., Crittenden, C. P., Rose, E., Sales, J. M., Wingood, G. M., Crosby, R. A., & Salazar, L. F.
(2008). Psychosocial predictors of HIV-associated sexual behaviors and the efficacy of prevention interven-
tions in adolescents at-risk for HIV infections: What works and what doesn’t work? Psychosomatic Medi-
cine, 70, 598-605.
DiClemente, R. J., Wingood, G. M., Harrington, K. F., Lang, D. L., Davies, S. L., Hook, E. W., . . .
Robillard, A. (2004). Efficacy of an HIV prevention intervention for African American adolescent girls:
A randomized clinical trial. Journal of the American Medical Association, 292, 171-179.
Donnellan, K. H., Trzesniewski, R. W., Robins, R., Moffitt, T. E., & Caspi, A. (2005). Low self-esteem is
related to aggression, antisocial behavior, and delinquency. Psychological Science, 16, 328-335.
Elliott, D. S., Huizinga, D., & Menard, S. (1989). Multiple problem youth. New York, NY: Springer.
Farrell, A. D., Kung, E. M., White, K. S., & Valois, R. F. (2000). The structure of self-reported aggression, drug
use, and delinquent behavior during early adolescence. Journal of Clinical Child Psychology, 29, 282-293.
Farrington, D. P., & Welsh, B. C. (2006). Saving children from a life of crime: Early risk factors and effective
interventions. New York, NY: Oxford University Press.
330 Youth Violence and Juvenile Justice 9(4)
at UNIV OF SOUTH FLORIDA on July 15, 2013yvj.sagepub.comDownloaded from

Gillmore, M. R., Hawkins, J. D., Catalano, R. F., Day, L. E., Moore, M., & Abbott, R. (1991). Structure of
problem behaviors in preadolescence. Journal of Consulting and Clinical Psychology, 59, 599-506.
Gottfredson, D. C. (2001). Schools and delinquency. Cambridge: Cambridge University Press.
Harwell, T. S., Trino, R., Bret, R., Yorkman, S., & Gollub, E. L. (1999). Sexual activity, substance use, and
HIV/STD knowledge among detained male adolescents with multiple versus first admissions. Sexually
Transmitted Diseases, 26, 265-271.
Hawkins, D. F., Laub, J. H., Lauritsen, J. L., & Cothern, L. (2000). Race, ethnicity, and serious and violent
offending. Bulletin. Washington, DC: US Department of Justice, Office of Justice Programs, Office of
Juvenile Justice Delinquency and Prevention.
Hemphill, S. A., Herrenkohl, T. I., LaFazia, A. N., McMOrris, B. J., Toumbourou, J. W., Arthur, . . . & Bond, L.
(2007). Comparison of the structure of adolescent problem behavior in the United States and Australia. Crime
& Delinquency, 53, 303-321.
Hu, L., & Bentler, P. M. (1999). Cutoff criteria for fit indexes in covariance structure analysis: Conventional
criteria versus new alternatives. Structural Equation Modeling, 6, 1-55.
Huizinga, D., & Jakob-Chien, C. (1998). The contemporaneous co-occurrence of serious and violent juvenile
offender and other problem behaviors. In R. Loeber & D. P. Farrington (Eds.), Serious and violent juvenile
offenders: Risk factors and successful interventions (pp. 47-67). Thousand Oaks, CA: SAGE.
Jemmott, J. B., Jemmott, L. S., & Fong, G. T. (1998). Abstinence and safer sex HIV risk-reduction interventions
for African American adolescents: A randomized clinical trial. Journal of the American Medical Associa-
tion, 292, 1529-1536.
Jessor, R., & Jessor, S. L. (1977). Problem behavior and psychosocial development: A longitudinal study of
youth. New York, NY: Academic Press.
Joesof, M. R., Kahn, R., & Weinstock, H. S. (2006). Sexually transmitted diseases in incarcerated adolescents.
Current Opinion in Infectious Diseases, 19, 44-48.
Kaufman, R. (1978). The relationship of social class and ethnicity to drug abuse. In D. E. Smith, S.
M. Anderson, M. Burton, N. Gottlieb, W. Harney & T. Chung (Eds.), A multicultural view of drug abuse
(pp. 158-164). Cambridge, MA: Schenkman.
Kawachi, I., Daniels, N., & Robinson, D. E. (2005). Health disparities by race and class: Why both matter.
Health Affairs, 24, 343-352.
Kingree, J. B., Braithwaite, R., & Woodring, T. (2000). Unprotected sex as a function of alcohol and marijuana
among adolescent detainees. Journal of Adolescent Health, 27, 179-185.
Krueger, R. F., Hicks, B. M., Patrick, C. J., Carlson, S. R., Iacono, W. G., & McGue, M. (2002). Etiologic
connections among substance dependence, antisocial behavior, and personality: Modeling the externalizing
spectrum. Journal of Abnormal Psychology, 111, 411-424.
LeBlanc, M. L., & Bouthillier, C. (2003). A developmental test of the general deviance syndrome with
adjudicated girls and boys using hierarchical confirmatory factor analysis. Criminal Behavior and Mental
Health, 13, 81-105.
LeBlanc, M., & Girard, S. (1997). The generality of deviance: Replication over two decades with a Canadian
sample of adjudicated boys. Canadian Journal of Criminology, 39, 171-183.
Lieber, M. J. (2003). The contexts of juvenile justice decision making: When race matters. Albany, NY: State
University of New York Press.
Little, M., Weaver, S. R., King, K. M., Lui, F., & Chassin, L. (2008). Historical change in the link between
adolescent deviance proneness and marijuana use, 1979-2004. Prevention Science, 9, 4-16.
McGee, L., & Newcomb, M. D. (1992). General deviance syndrome: Expanded hierarchical evaluations at four
ages from early adolescent to adulthood. Journal of Consulting and Clinical Psychology, 60, 766-776.
Muthen, L. K., & Muthen, B. O. (2007). Mplus user’s guide (5th ed.). Los Angeles, CA: Author.
Muthen, B., DuToit, S. H. C., & Spisic, D. (1997). Robust inference using weighted least squares and quadratic
estimating equations in latent variable modeling with categorical and continuous outcomes. Unpublished
technical report. Retrieved from http://www.statmodel.com
Childs et al. 331
at UNIV OF SOUTH FLORIDA on July 15, 2013yvj.sagepub.comDownloaded from

Newcomb, M. D., & Bentler, P. M. (1986). Frequency and sequence of serious drug use: A longitudinal study
from early adolescence to young adulthood. Journal of Drug Education, 16, 101-120.
Newcomb, M. D., & McGee, L. (1991). Influence of sensation seeking on general deviance and specific problem
behaviors from adolescence to young adulthood. Journal of Personality and Social Psychology, 61, 614-628.
Office of Juvenile Justice Delinquency Prevention (OJJDP). (1999). Minorities in the juvenile justice system.
Juvenile Justice Bulletin, 1999. Department of Justice, Washington, DC: Office of Juvenile Justice
Delinquency and Prevention. Report No: NCJ-178257.
Oh, K. M., Smith, K. R., O’Cain, M., Kilmer, D., Johnson, J., & Hook, E. W. (1998). Urine-based screening of
adolescents in detention to guide treatment for Gonococcal and Chlamydial infections: Translating research
into intervention. Archives of Pediatrics & Adolescent Medicine, 152, 52-56.
Orr, D. P., Langefeld, C. D., Katz, B. P., & Caine, V. A. (1996). Behavioral intervention to increase condom
use among high-risk female adolescents. Journal of Pediatrics, 128, 288-295.
Osgood, D. W., Johnston, L. D., O’Malley, P. M., & Bachman, J. G. (1988). The generality of deviance in
adolescence and early adulthood. American Sociological Review, 53, 81-93.
Rickman, R. L., Lodico, M., DiClimente, R. J., Morris, R., Baker, C., & Huscroft, S. (1994). Sexual commu-
nication is associated with condom use by sexually active incarcerated adolescents. Journal of Adolescent
Research, 15, 383-388.
Sampson, R. J., & Laub, J. H. (1993). Structural variations in juvenile court processing: Inequality, the under-
class, and social control. Law & Society Review, 27, 285-312.
Skowyra, K. R., & Cocozza, J. J. (2010). Mental health screening within juvenile justice: The next frontier.
Delmar, NY: National Center for Mental Health and Juvenile Justice, Models for Change in Juvenile Justice
Reform, MacArthur Foundation.
Tapert, S. F., Aarons, G. A., Sedlar, G. R., & Brown, S. A. (2001). Adolescent substance use and sexual
risk-taking behavior. Journal of Adolescent Health, 28, 181-189.
Teplin, L. A., Mericle, A. A., McClelland, G. M., & Abram, K. M. (2003). HIV and AIDS risk behaviors in
juvenile detainees: Implications for public health policy. American Journal of Public Health, 93, 906-912.
Tremblay, R. E., Boulerice, B., Junger, M., & Arseneault, L. (1995). Does low self-control during childhood
explain the association between delinquency and accidents in early adolescence? Criminal Behavior and
Mental Health, 5, 439-451.
Tucker, L. R., & Lewis, C. (1973). A reliability coefficient for maximum likelihood factor analysis. Psychome-
trika, 38, 1-10.
Welsh, B. C. (2005). Public health and the prevention of juvenile criminal violence. Youth Violence and
Juvenile Justice, 3, 23-40.
Welte, J. W., Barnes, G. M., & Hoffman, J. H. (2004). Gambling, substance use, and other problem behaviors
among youth: A test of general deviance models. Journal of Criminal Justice, 32, 297-306.
White, H. R. (1992). Early problem behaviors and later drug problems. Journal of Research in Crime &
Delinquency, 29, 412-429.
White, H. R., & Labouvie, E. W. (1994). Generality vs. specificity of problem behavior: Psychological and
functional differences. Journal of Drug Issues, 24, 55-74.
Widaman, K. F., & Reise, S. P. (1997). Exploring the measurement invariance of psychological instruments:
Applications in the substance use domain. In K. J. Bryant, M. Windle & S. B. West (Eds.), The science
of prevention. Washington, DC: American Psychological Association.
Yu, C. Y., & Muthen, B. (2001). Evaluation of model fit indices for latent variable models with categorical and
continuous outcomes (Technical Report). Los Angeles, CA: University of California, Los Angeles, Graduate
School of Education and Information Studies.
Zweig, J. M., Lindberg, L. D., & McGinley, K. L. (2001). Adolescent health risk profiles: The co-occurrence of
health risks among females and males. Journal of Youth and Adolescence, 30, 707-728.
332 Youth Violence and Juvenile Justice 9(4)
at UNIV OF SOUTH FLORIDA on July 15, 2013yvj.sagepub.comDownloaded from
Related Documents