Sociodemographic Differences and Infant Dietary Patterns WHAT’S KNOWN ON THIS SUBJECT: Despite breastfeeding recommendations by the World Health Organization and the American Academy of Pediatrics, there is less agreement on appropriate use of infant solid foods. There are currently no well- established dietary guidelines for US infants that are similar to the Dietary Guidelines for Americans (aged .2 years). WHAT THIS STUDY ADDS: Distinct dietary patterns exist among US infants and have differential influences on growth. Use of “Infant guideline solids” (vegetables, fruits, baby cereal, and meat) with prolonged breastfeeding is a promising healthy dietary pattern for infants after age 6 months. abstract OBJECTIVES: To identify dietary patterns in US infants at age 6 and 12 months, sociodemographic differences in these patterns, and their associations with infant growth from age 6 to 12 months. METHODS: We analyzed a subsample (760 boys and 795 girls) of the Infant Feeding Practices Study II (2005–2007). Mothers reported their infants’ intakes of 18 types of foods in the past 7 days, which were used to derive dietary patterns at ages 6 and 12 months by principal component analysis. RESULTS: Similar dietary patterns were identi fied at ages 6 and 12 months. At 12 months, infants of mothers who had low education or non-Hispanic African American mothers (vs non-Hispanic white) had a higher score on “High sugar/fat/protein” dietary pattern. Both “High sugar/fat/protein” and “High dairy/regular cereal” patterns at 6 months were associated with a smaller increase in length-for-age z score (adjusted b per 1 unit dietary pattern score, 21.36 [95% confidence interval (CI), 22.35 to 20.37] and 20.30 [20.54 to 20.06], respectively), while with greater increase in BMI z score (1.00 [0.11 to 1.89] and 0.32 [0.10 to 0.53], respectively) from age 6 to 12 months. The “Formula” pattern was associated with greater increase in BMI z score (0.25 [0.09 to 0.40]). The “Infant guideline solids” pattern (vegetables, fruits, baby cereal, and meat) was not associated with change in length-for-age or BMI z score. CONCLUSIONS: Distinct dietary patterns exist among US infants, vary by maternal race/ethnicity and education, and have differential influences on infant growth. Use of “Infant guideline solids” with prolonged breastfeeding is a promising healthy diet for infants after age 6 months. Pediatrics 2014;134:e1387–e1398 AUTHORS: Xiaozhong Wen, MD, PhD, a Kai Ling Kong, PhD, a Rina Das Eiden, PhD, b Neha Navneet Sharma, c and Chuanbo Xie, MD, PhD a a Division of Behavioral Medicine, Department of Pediatrics, School of Medicine and Biomedical Sciences, b Research Institute on Addictions, and c Department of Psychology, State University of New York at Buffalo, Buffalo, New York KEY WORDS infant, dietary patterns, feeding, nutrition, growth, epidemiology ABBREVIATIONS AAP—American Academy of Pediatrics CDC—Centers for Disease Control and Prevention CI—confidence interval IFPS II—Infant Feeding Practices Study II WHO—World Health Organization WIC—Special Supplemental Nutrition Program for Women, Infants, and Children Dr Wen initiated and developed the research question, led the analytic plan, conducted all data analyses, and drafted the manuscript; Drs Kong and Eiden contributed to the development of research question and the analytic plan, interpreted the results, and made major contributions to revising the manuscript; Ms Sharma and Dr Xie contributed to the development of research question, result interpretation, and revision of the manuscript; and all authors approved the final manuscript as submitted. www.pediatrics.org/cgi/doi/10.1542/peds.2014-1045 doi:10.1542/peds.2014-1045 Accepted for publication Aug 11, 2014 Address correspondence to Xiaozhong Wen, MD, PhD, Division of Behavioral Medicine, Department of Pediatrics, School of Medicine and Biomedical Sciences, State University of New York at Buffalo, 3435 Main St, G56 Farber Hall, Buffalo, NY 14214-3000. E-mail: [email protected] PEDIATRICS (ISSN Numbers: Print, 0031-4005; Online, 1098-4275). Copyright © 2014 by the American Academy of Pediatrics FINANCIAL DISCLOSURE: The authors have indicated they have no financial relationships relevant to this article to disclose. FUNDING: This work was supported by a seed funding (awarded to Dr Wen) from the Department of Pediatrics, State University of New York at Buffalo. POTENTIAL CONFLICT OF INTEREST: The authors have indicated they have no potential conflicts of interest to disclose. PEDIATRICS Volume 134, Number 5, November 2014 e1387 ARTICLE at State Univ Of Ny at Buffalo on April 17, 2015 pediatrics.aappublications.org Downloaded from

Welcome message from author
This document is posted to help you gain knowledge. Please leave a comment to let me know what you think about it! Share it to your friends and learn new things together.
Transcript

Sociodemographic Differences and InfantDietary Patterns
WHAT’S KNOWN ON THIS SUBJECT: Despite breastfeedingrecommendations by the World Health Organization and theAmerican Academy of Pediatrics, there is less agreement onappropriate use of infant solid foods. There are currently no well-established dietary guidelines for US infants that are similar tothe Dietary Guidelines for Americans (aged .2 years).
WHAT THIS STUDY ADDS: Distinct dietary patterns exist amongUS infants and have differential influences on growth. Use of“Infant guideline solids” (vegetables, fruits, baby cereal, andmeat) with prolonged breastfeeding is a promising healthydietary pattern for infants after age 6 months.
abstractOBJECTIVES: To identify dietary patterns in US infants at age 6 and 12months, sociodemographic differences in these patterns, and theirassociations with infant growth from age 6 to 12 months.
METHODS: We analyzed a subsample (760 boys and 795 girls) of theInfant Feeding Practices Study II (2005–2007). Mothers reported theirinfants’ intakes of 18 types of foods in the past 7 days, which wereused to derive dietary patterns at ages 6 and 12 months by principalcomponent analysis.
RESULTS: Similar dietary patternswere identified at ages 6 and 12months.At 12 months, infants of mothers who had low education or non-HispanicAfrican American mothers (vs non-Hispanic white) had a higher score on“High sugar/fat/protein” dietary pattern. Both “High sugar/fat/protein”and “High dairy/regular cereal” patterns at 6 months were associatedwith a smaller increase in length-for-age z score (adjusted b per 1 unitdietary pattern score, 21.36 [95% confidence interval (CI), 22.35to 20.37] and 20.30 [20.54 to 20.06], respectively), while withgreater increase in BMI z score (1.00 [0.11 to 1.89] and 0.32 [0.10to 0.53], respectively) from age 6 to 12 months. The “Formula” patternwas associated with greater increase in BMI z score (0.25 [0.09 to0.40]). The “Infant guideline solids” pattern (vegetables, fruits, babycereal, and meat) was not associated with change in length-for-age orBMI z score.
CONCLUSIONS: Distinct dietary patterns exist among US infants, varyby maternal race/ethnicity and education, and have differentialinfluences on infant growth. Use of “Infant guideline solids” withprolonged breastfeeding is a promising healthy diet for infants afterage 6 months. Pediatrics 2014;134:e1387–e1398
AUTHORS: Xiaozhong Wen, MD, PhD,a Kai Ling Kong, PhD,a
Rina Das Eiden, PhD,b Neha Navneet Sharma,c andChuanbo Xie, MD, PhDa
aDivision of Behavioral Medicine, Department of Pediatrics,School of Medicine and Biomedical Sciences, bResearch Instituteon Addictions, and cDepartment of Psychology, State University ofNew York at Buffalo, Buffalo, New York
KEY WORDSinfant, dietary patterns, feeding, nutrition, growth, epidemiology
ABBREVIATIONSAAP—American Academy of PediatricsCDC—Centers for Disease Control and PreventionCI—confidence intervalIFPS II—Infant Feeding Practices Study IIWHO—World Health OrganizationWIC—Special Supplemental Nutrition Program for Women,Infants, and Children
Dr Wen initiated and developed the research question, led theanalytic plan, conducted all data analyses, and drafted themanuscript; Drs Kong and Eiden contributed to the developmentof research question and the analytic plan, interpreted theresults, and made major contributions to revising themanuscript; Ms Sharma and Dr Xie contributed to thedevelopment of research question, result interpretation, andrevision of the manuscript; and all authors approved the finalmanuscript as submitted.
www.pediatrics.org/cgi/doi/10.1542/peds.2014-1045
doi:10.1542/peds.2014-1045
Accepted for publication Aug 11, 2014
Address correspondence to Xiaozhong Wen, MD, PhD, Division ofBehavioral Medicine, Department of Pediatrics, School ofMedicine and Biomedical Sciences, State University of New Yorkat Buffalo, 3435 Main St, G56 Farber Hall, Buffalo, NY 14214-3000.E-mail: [email protected]
PEDIATRICS (ISSN Numbers: Print, 0031-4005; Online, 1098-4275).
Copyright © 2014 by the American Academy of Pediatrics
FINANCIAL DISCLOSURE: The authors have indicated they haveno financial relationships relevant to this article to disclose.
FUNDING: This work was supported by a seed funding (awardedto Dr Wen) from the Department of Pediatrics, State Universityof New York at Buffalo.
POTENTIAL CONFLICT OF INTEREST: The authors have indicatedthey have no potential conflicts of interest to disclose.
PEDIATRICS Volume 134, Number 5, November 2014 e1387
ARTICLE
at State Univ Of Ny at Buffalo on April 17, 2015pediatrics.aappublications.orgDownloaded from
Infancy is a critical period for learningabout foods including milk and solids.1
Most infants experience a rapid tran-sition from a diet of predominantlymilk (breast milk and/or formula) to amixed diet from various food groups con-sumed by other family members.2,3 TheWorld Health Organization (WHO) and theAmerican Academy of Pediatrics (AAP)recommend exclusive breastfeedingfor 6 months with continuation ofbreastfeeding for 12months or longer,4,5
but there is less agreement on the ap-propriate use (ie, introduction timingand types) of solid foods.6–8 As a result,there are currently no well-establisheddietary guidelines for infants and toddlersthat are similar to the Dietary Guidelinesfor Americans, which apply only to indi-viduals older than age 2 years.9 Age-specific dietary guidelines are neededfor infants and toddlers, because theyhave different nutrient needs fromolder children and adults.10
However, more research is needed tobetter understand the effects of foodson thehealthanddevelopmentof infantsand toddlers to develop evidenced-based dietary guidelines for them. Itis difficult to study the health effect ofindividual solid foods on infants be-cause solid foods consumed by infantsare often inter-correlated with eachotherandwith the typeofmilkconsumedby the infants.11 For example, fruits areusually eaten together with vegetables,and baby cereal with formula. Thismethodological challenge may be par-tially solved by dietary pattern analysis,a relatively new tool in nutrition re-search that examines one’s whole dietrather than individual foods.12,13 To date,only 3 studies examined dietary patternsamong infants and toddlers. They wereconducted in the United Kingdom(Southampton Women’s Survey),14 Aus-tralia (NORISHandSouthAustralian InfantsDietary Intake Study),15 and France (Etudedes Déterminants pré et post natalsprécoces du dévelopement et de la santé
de l’Enfant).16 These non-US studiesreported that distinct dietary patternsalready existed among infants andtoddlers, suggesting disparities ineating behaviors begin at a very youngage. It is very likely that infant dietarypatterns from other countries cannotbe generalized to US infants, given theconsiderable differences in culture,food availability, and parental feedingpractices. Little is known on the role ofinfant dietary patterns in child growthand development. In the UK study men-tioned previously, infants who had ahigh score on the “infant guidelines”dietary pattern (fruit, vegetables, andhome-prepared foods) at 6 monthsgained body weight more rapidly fromage 6 to 12 months, whereas infantswho had high consumption of “adultfoods” (bread, savory snacks, biscuits,and chips) gained weight less rapidly.17
In the same cohort, a higher score of“infant guidelines” dietary pattern atage 12 months was associated withhigher lean mass index and IQ at age4 years, but not with BMI or fat massindex at age 4 years.18,19 The Australianstudy found that “core foods” (fruit,grains, vegetables, cheese, and nuts/seeds) and “basic combination” (whitebread,milk, spreads, juice, and ice cream)pattern scores at age 14monthswere notassociated with BMI z score at age 14or 24 months.15
To the best of our knowledge, there isno known published study on dietarypatterns among US infants. Given theimportance of this area of research, wetherefore conducted a secondary dataanalysis on infant dietary patterns inthe Infant Feeding Practices Study II.20
We aimed to (1) identify infant dietarypatterns among US infants, (2) exploresociodemographic differences in thesedietary patterns, and (3) examine theassociations between dietary patternsand infant growth. Accordingly, we hy-pothesized that (1) several distinct di-etary patterns, such as breastfeeding,
formula, healthy solids, and unhealthysolids, were prevalent among US infants,(2) these dietary patterns varied bymaternal education, race/ethnicity, andhousehold income, and (3) formula andunhealthy solids (energy dense) patternswere associated with fast growth ininfant adiposity.
METHODS
Sample and Subjects
We analyzed data from a subsample ofthe Infant Feeding Practices Study II(IFPS II), aUS longitudinalpre-birthcohortstudy conducted from 2005 to 2007. TheIFPS II was conducted by the US Food andDrug Administration in collaborationwiththe Centers for Disease Control and Pre-vention (CDC). Details on the study designhave been published elsewhere.20 Briefly,this longitudinal study followed pregnantwomen from late pregnancy throughtheir infant’s first year of life.
The original full study sample consistedof 4902 pregnant women and 3033full-term newborns (gestational age$37 complete weeks); 2095 of mother-child dyadswere followedat age 6monthsand1807were followedat age12months.20
For the purpose of this analysis, we onlyconsidered the 3030 newborns who hadcompleted data on gender. The de-scriptive analysis (Aim 1) on dietarypatterns included 1555 infants whohad age 6 month diet information and1445 infants who had age 12 monthdiet information. The exploratory analysis(Aim 2) of sociodemographic and othercorrelates of diet patterns included 1378infants at age 6 months and 1275 infantsat age 12 months. The final growth anal-ysis (Aim 3) of the associations betweendietary patterns and infant growth out-comes only included the 530 infants whohad complete data on infant growth out-comes at both age 6 and 12 months. Werecognized the considerable differencesin sample size across analytic Aims 1 to 3.We chose to use these overlapping butdifferent subsamples because (1) a larger,
e1388 WEN et al at State Univ Of Ny at Buffalo on April 17, 2015pediatrics.aappublications.orgDownloaded from
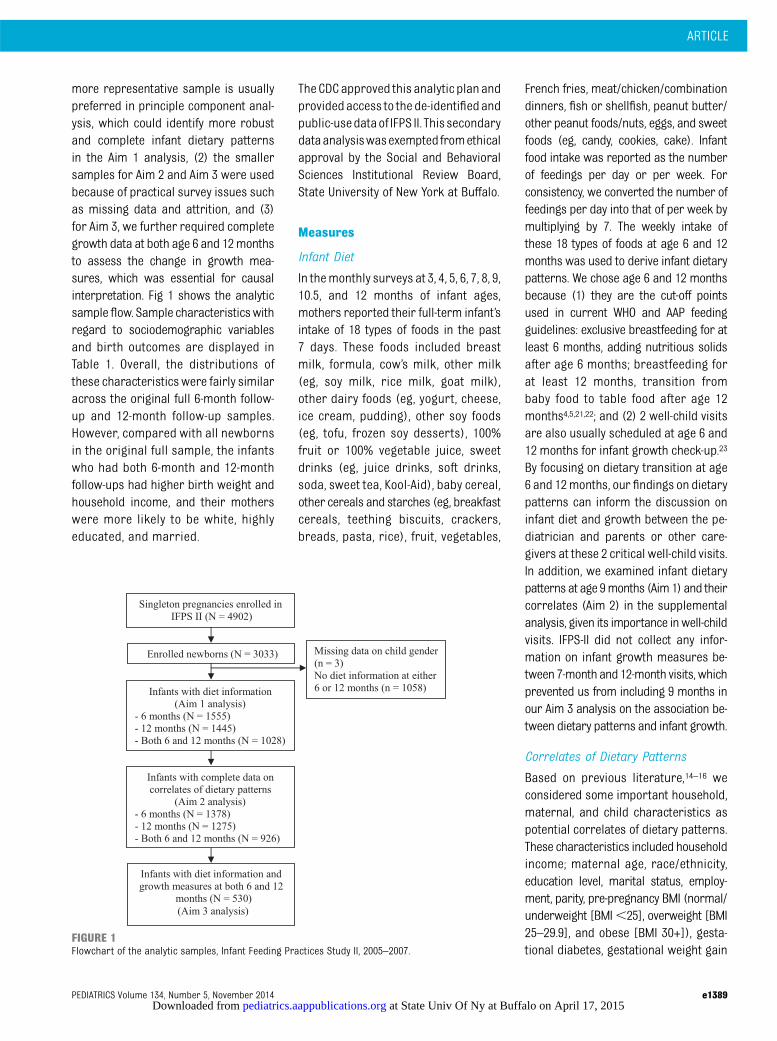
more representative sample is usuallypreferred in principle component anal-ysis, which could identify more robustand complete infant dietary patternsin the Aim 1 analysis, (2) the smallersamples for Aim 2 and Aim 3 were usedbecause of practical survey issues suchas missing data and attrition, and (3)for Aim 3, we further required completegrowth data at both age 6 and 12monthsto assess the change in growth mea-sures, which was essential for causalinterpretation. Fig 1 shows the analyticsampleflow. Sample characteristicswithregard to sociodemographic variablesand birth outcomes are displayed inTable 1. Overall, the distributions ofthese characteristicswere fairly similaracross the original full 6-month follow-up and 12-month follow-up samples.However, compared with all newbornsin the original full sample, the infantswho had both 6-month and 12-monthfollow-ups had higher birth weight andhousehold income, and their motherswere more likely to be white, highlyeducated, and married.
TheCDCapproved this analytic planandprovidedaccess to the de-identifiedandpublic-usedataof IFPS II. This secondarydataanalysiswasexemptedfromethicalapproval by the Social and BehavioralSciences Institutional Review Board,State University of New York at Buffalo.
Measures
Infant Diet
In themonthly surveys at 3, 4, 5, 6, 7, 8, 9,10.5, and 12 months of infant ages,mothers reported their full-term infant’sintake of 18 types of foods in the past7 days. These foods included breastmilk, formula, cow’s milk, other milk(eg, soy milk, rice milk, goat milk),other dairy foods (eg, yogurt, cheese,ice cream, pudding), other soy foods(eg, tofu, frozen soy desserts), 100%fruit or 100% vegetable juice, sweetdrinks (eg, juice drinks, soft drinks,soda, sweet tea, Kool-Aid), baby cereal,other cereals and starches (eg, breakfastcereals, teething biscuits, crackers,breads, pasta, rice), fruit, vegetables,
French fries, meat/chicken/combinationdinners, fish or shellfish, peanut butter/other peanut foods/nuts, eggs, and sweetfoods (eg, candy, cookies, cake). Infantfood intake was reported as the numberof feedings per day or per week. Forconsistency, we converted the number offeedings per day into that of per week bymultiplying by 7. The weekly intake ofthese 18 types of foods at age 6 and 12months was used to derive infant dietarypatterns. We chose age 6 and 12 monthsbecause (1) they are the cut-off pointsused in current WHO and AAP feedingguidelines: exclusive breastfeeding for atleast 6 months, adding nutritious solidsafter age 6 months; breastfeeding forat least 12 months, transition frombaby food to table food after age 12months4,5,21,22; and (2) 2 well-child visitsare also usually scheduled at age 6 and12 months for infant growth check-up.23
By focusing on dietary transition at age6 and 12months, our findings on dietarypatterns can inform the discussion oninfant diet and growth between the pe-diatrician and parents or other care-givers at these 2 critical well-child visits.In addition, we examined infant dietarypatterns at age 9months (Aim1) and theircorrelates (Aim 2) in the supplementalanalysis, given its importance inwell-childvisits. IFPS-II did not collect any infor-mation on infant growth measures be-tween 7-month and 12-month visits, whichprevented us from including 9 months inour Aim 3 analysis on the association be-tween dietary patterns and infant growth.
Correlates of Dietary Patterns
Based on previous literature,14–16 weconsidered some important household,maternal, and child characteristics aspotential correlates of dietary patterns.These characteristics included householdincome; maternal age, race/ethnicity,education level, marital status, employ-ment, parity, pre-pregnancy BMI (normal/underweight [BMI,25], overweight [BMI25–29.9], and obese [BMI 30+]), gesta-tional diabetes, gestational weight gain
FIGURE 1Flowchart of the analytic samples, Infant Feeding Practices Study II, 2005–2007.
ARTICLE
PEDIATRICS Volume 134, Number 5, November 2014 e1389 at State Univ Of Ny at Buffalo on April 17, 2015pediatrics.aappublications.orgDownloaded from

TABLE1
Child,M
aternal,andHouseholdCharacteristicsof
theOriginal
FullandFollow-UpSamples
AllIFPSIINewborns
(N=3030)
Infantsat6-moFollow-up
(n=1555)a
Infantsat12-moFollow-up
(n=1445)a
InfantsatBoth
6-moand
12-moFollow-up(n=530)
b6-moVersus
AllP
value
12-moVersus
AllP
value
6-moand12-mo
Versus
AllP
value
n(%
)cMean(SD)
n(%
)cMean(SD)
n(%
)cMean(SD)
n(%
)cMean(SD)
Child Femalegender
1529
(50.5)
—795(51.1)
—734(50.8)
—267(50.4)
—0.671
0.835
0.971
Birthweight,g
—3453
(467)
—3468
(462)
—3480
(467)
—3504
(474)
0.295
0.070
0.021
Gestationalage,w
k—
39.3(1.3)
—39.3(1.3)
—39.3(1.2)
—39.3(1.2)
0.936
0.782
0.840
Methodofbirth
——
——
——
——
0.494
0.197
0.159
Vaginal,non-induced
1156
(38.2)
—612(39.4)
—578(40.0)
—211(39.8)
——
——
Vaginal,induced
1017
(33.6)
—496(31.9)
—449(31.1)
—155(29.3)
——
——
Plannedcesarean
section
489(16.1)
—269(17.3)
—256(17.7)
—101(19.1)
——
——
Emergencycesarean
section
361(11.9)
—176(11.3)
—161(11.1)
—63
(11.9)
——
——
EnrolledinWICprogram
589(19.4)
—394(25.3)
—313(21.7)
—95
(17.9)
—0.058
0.010
,0.001
Household
Income,USD
——
——
——
——
0.001
0.002
,0.001
,$25000
659(21.8)
—271(17.4)
—259(17.9)
—76
(14.3)
——
——
$25000to$39999
707(23.3)
—352(22.6)
—320(22.2)
—100(18.9)
——
——
$40000to$59999
710(23.4)
—374(24.1)
—338(23.4)
—139(26.2)
——
——
$60000+
954(31.5)
—558(35.9)
—528(36.5)
—215(40.6)
——
——
Mother
Age,y
—28.8(5.5)
—29.6(5.2)
—29.7(5.3)
—30.3(5.0)
,0.001
,0.001
,0.001
18to
24702(23.2)
—264(17.0)
—228(15.8)
—59
(11.1)
—,0.001
,0.0001
,0.001
25to
291019
(33.6)
—519(33.4)
—500(34.6)
—186(35.1)
——
——
30to
34833(27.5)
—501(32.2)
—444(30.7)
—178(33.6)
——
——
35+
471(15.5)
—270(17.4)
—273(18.9)
107(20.2)
——
——
Race/ethnicity
——
——
——
——
,0.001
0.013
,0.001
White,non-Hispanic
2484
(82.0)
—1346
(86.6)
—1246
(86.2)
—483(91.1)
——
——
AfricanAm
erican,non-Hispanic
143(4.7)
—36
(2.3)
—43
(3.0)
—6(1.1)
——
——
Hispanic
183(6.0)
—66
(4.2)
—71
(4.9)
—18
(3.4)
——
——
Asian/PacificIslander
78(2.6)
—48
(3.1)
—32
(2.2)
—15
(2.8)
——
——
Others
57(1.9)
—24
(1.5)
—22
(1.5)
8(1.5)
——
——
Educationallevel
——
——
——
——
,0.001
,0.001
,0.001
High
schoolor
lower
584(19.3)
—245(15.8)
—232(16.1)
—66
(12.5)
——
——
1to3yofcollege
1119
(36.9)
—536(34.5)
—494(34.2)
—163(30.8)
——
——
College
graduate
802(26.5)
—506(32.5)
—476(32.9)
—217(40.9)
——
——
Post-graduate
276(9.1)
—193(12.4)
—176(12.2)
—84
(15.9)
——
——
Married
2213
(73.0)
—1254
(80.6)
—1164
(80.6)
—456(86.0)
—,0.001
,0.001
,0.001
Employed
1998
(65.9)
1007
(64.8)
—948(65.6)
—354(66.8)
—0.366
0.727
0.799
Parity
——
——
——
——
0.988
0.555
0.003
Nulliparous
861(28.4)
—450(28.9)
—415(28.7)
—194(36.6)
——
——
1previous
birth
1194
(39.4)
—617(39.7)
—596(41.3)
—200(37.7)
——
——
2+previous
births
879(29.0)
—458(29.5)
—403(27.9)
—136(25.7)
——
——
Pre-pregnancyBM
I,kg/m
2—
26.5(6.7)
—26.4(6.6)
—26.8(6.9)
—26.3(6.7)
0.648
0.321
0.497
Norm
al/underweight(,25)
1497
(49.4)
—786(50.6)
—699(48.4)
—271(51.1)
—0.724
0.466
0.748
Overweight(25–29.9)
779(25.7)
—403(25.9)
—374(25.9)
—145(27.4)
——
——
Obese($
30)
716(23.6)
—353(22.7)
—355(24.6)
—114(21.5)
——
——
e1390 WEN et al at State Univ Of Ny at Buffalo on April 17, 2015pediatrics.aappublications.orgDownloaded from

(low, normal, and excessive)24; and childgender, birth weight, gestational age,method of birth, and enrollment in theSpecial Supplemental Nutrition ProgramforWomen, Infants, and Children (WIC) atage 6 and 12 months. Mothers reportedthe information on these correlates atprenatal survey, birth screeners (phoneinterview), or neonatal surveys.
Infant Growth Outcomes
Mothers reported their infant’s weight,length, and age at their most recentdoctor’s visit at the 3-month (mean ageat the most recent visit, 2.28 [SD, 0.48]months), 5-month (4.21 [SD, 0.43]months),7-month (6.34 [SD, 0.48] months), and12-month (12.02 [SD, 0.61] months)surveys. For the purpose of this analysis,we only included infant growth data at7-month and 12-month surveys. Becausethe infants’actual age at themost recentdoctor’s visit reported at the 7-monthsurvey was closer to 6 months, werenamed these measures as 6-monthgrowth measures. We calculated in-fant BMI as weight in kilograms/lengthin meters,2 and used it as an indirectmeasure for infant adiposity. For bothage 6 and 12 months, we calculatedgender- and age-specific length-for-agez score and BMI z score by gender andage for children using WHO ChildGrowth Standards.25 To quantify thelongitudinal change in infant growthmeasures, we further calculated thedifferences in their z scores from age6 to 12months (eg, length-for-age z scoreat age 12 months minus length-for-agez score at age 6 months), which wereused as our key growth outcomes inthe following analyses.
Although the literature is inconclusive,we operationally defined optimal infantgrowth as length-for-age z score andBMI z score being ∼0 (equivalent topopulation average) based on WHOChild Growth Standards.25 WHO ChildGrowth Standards are believed toreflect the optimal or ideal childgrowth, as they were derived from an
international, longitudinal sample ofhealthy, breastfed infants and youngchildren raised in environments (eg,no maternal smoking) that do notconstrain growth.25,26 In developedsocieties such as the United States,infancy fast adiposity growth measuredby the gain in BMI z score or weight-for-length z score is unfavorable because itis a strong risk factor for later obesityand cardio-metabolic disorders, espe-cially in an obesogenic environment.27,28
Statistical Analyses
Despite the well-documented evidencefor the obesogenic effect of formula (vsbreastfeeding), little is knownabout therole of different solids in infant growth.Because this was the very first study ondietary patterns in US infants, we de-cided to apply an exploratory ratherthan confirmatory approach, whichcould offer more flexibility for gener-ating hypotheses for future replicationand confirmation. Specifically, based oninfants’ intake of 18 types of foods, wederived infant dietary patterns at theages of 6, 9, and 12 months usingprinciple component analysis (FACTORPROCEDURE in SAS; SAS Institute, Inc,Cary, NC).29 We applied orthogonaltransformation (Varimax) to rotate theoriginal derived components, whichcould lead to uncorrelated componentswith a greater interpretability.30 We onlyretained the derived components withan eigenvalue.1.00 and also containing2 or more original foods with loadingfactor$0.4. An infant’s individual factorscore for each dietary pattern (compo-nent) was constructed by summing hisor her intakes of the component fooditems weighted by factor loadings. Ahigher factor score indicated higheradherence to the corresponding dietarypattern. These factor scores (continu-ous variables) were then used for thefollowing analyses on their correlatesand associations with infant growth.
For each dietary pattern (dependentvariable), we fit a multivariable linearTA
BLE1
Continued
AllIFPSIINewborns
(N=3030)
Infantsat
6-moFollow-up
(n=1555)a
Infantsat12-moFollow-up
(n=1445)a
InfantsatBoth
6-moand
12-moFollow-up(n=530)
b6-moVersus
AllP
value
12-moVersus
AllP
value
6-moand12-mo
Versus
AllP
value
n(%
)cMean(SD)
n(%
)cMean(SD)
n(%
)cMean(SD)
n(%
)cMean(SD)
Gestationaldiabetes
186(6.1)
—97
(6.2)
—93
(6.4)
—39
(7.4)
—0.895
0.701
0.287
GWG
—14.2(6.5)
—14.2(6.2)
—14.(6.3)
—14.3(6.0)
0.772
0.543
0.563
Low
568(18.8)
—294(18.9)
—261(18.1)
—93
(17.6)
—0.967
0.615
0.136
Norm
al858(28.3)
—453(29.1)
—432(29.9)
—180(34.0)
——
——
Excessive
1453
(48.0)
—754(48.5)
—696(48.2)
—257(48.5)
——
——
GWG,gestationalw
eightgain;—
,indicates
notapplicable.
aWith
completedata
oninfant
diet.
bWith
completedataon
infant
dietandgrow
thmeasures.
cThesumofsomecategories
wereless
than
thetotalowingtomissing
data.
ARTICLE
PEDIATRICS Volume 134, Number 5, November 2014 e1391 at State Univ Of Ny at Buffalo on April 17, 2015pediatrics.aappublications.orgDownloaded from

regression model to examine sociodemo-graphic and other correlates. Becausemostof thesecorrelatesweresuggestedby the literature and have individualpredefined hypotheses (rather than 1universal null hypothesis), we chose notto adjust P values for multiple compar-isons in the same multivariable linearregression model.31,32 Guided by a hier-arch approach, we fit 3 multivariablelinear regression models to examinethe associations between each of dietarypatterns (predictor) at 6 months andeach of infant growth variables (out-come). The key growth outcomes in-cluded differences in length-for-agez score and BMI z score from age 6to 12 months. In the Model 1 (basicmodel) we adjusted for the z score ofthe corresponding growth measure atage 6 months to yield “conditionalgrowth” from age 6 to 12 months. Theuse of conditional growth could mea-sure the deviation in an infant’s sub-sequent growth from its expectedlevel, given his or her baseline growthstatus.33 In the Model 2 (other-dietary-
patterns-adjusted model) we addition-ally adjusted for the other 3 dietarypatterns at age 6 months. In the Model3 (confounders-adjusted model) we fur-ther adjusted for the significant corre-lates of dietary patterns. We completedall data analyses in SAS version 9.3. Thesignificant level a was set as 0.05.
RESULTS
Sample Characteristics
Table 1 shows child, household, andmaternal characteristics of the originalfull sample (N = 3030) and the 2 analyticsamples followed at age 6 months (n =1555), 12 months (n = 1445), and both 6and 12 months (n = 530), respectively.
Dietary Patterns
Based on the infants’ intake of 18 typesof foods, we derived 4 dietary patternswith an eigenvalue.1.00 and also 2 ormore original foods with loading factor$0.4 at age 6 months, which couldexplain 50.0% of the total variance(Table 2). Based on the included foods
in each pattern, they were named as“High sugar/fat/protein,” “Infant guide-line solids,” “Formula,” and “High dairy/regular cereal.” Although breast milkwas not literally reflected by any of these4 patterns at age 6 months, it was highlyinversely correlated with the “Formula”pattern (loading factor = 20.93). Wealso derived 4 dietary patterns at age12 months, which explained 40.1% of thetotal variance (Table 3). Theywere namedas “High sugar/fat/protein,” “Infantguideline solids,” “Formula/baby cereal,”and “High dairy.” The included food typeswere similar to those at age 6 monthsexcept that “babycereal non-babycereals/starches” replaced “baby cereal” to bein “Infant guideline solids.” “Baby cereal”was combined with “Formula” as the“Formula/baby cereal” pattern. Similarly,breast milk was not literally reflected byany of these 4 patterns at age 12months,but it was inversely correlated with the“Formula/baby cereal” pattern (loadingfactor = 20.93) and the “High dairy”pattern (loading factor =20.40). Overall,the dietary patterns at age 9 months
TABLE 2 Infant Food Intake and Dietary Patterns at Age 6 Months (N = 1555)
Weekly Eater,n (%)
Mean Intake (SD),Serving/Week
Factor Loading on Dietary Patterna
1 - HighSugar/Fat/Protein
2 - InfantGuideline Solids
3 - Formula 4 - High Dairy/RegularCereal
Food groupBreast milk 828 (53.3) 3.25 (3.42) — — 20.93 —
Formula 996 (64.1) 2.80 (2.71) — — 0.95 —
Cow’s milk 16 (1.0) 0.02 (0.28) — — — 0.49Other milk (eg, soy, rice, goat) 6 (0.4) 0.01 (0.21) — — — —
Other dairy foods 104 (6.7) 0.04 (0.18) — — — 0.48Other soy foods 3 (0.2) 0.004 (0.13) — — — —
100% fruit/vegetable juice 383 (24.6) 0.23 (0.56) — — — 0.60Sweet drinks 38 (2.4) 0.03 (0.24) 0.78 — — —
Baby cereal 1293 (83.2) 1.28 (1.12) — 0.57 — —
Non-baby cereals/starches 258 (16.6) 0.14 (0.41) — — — 0.60Fruit 1033 (66.4) 0.88 (0.96) — 0.83 — —
Vegetables 1090 (70.1) 0.88 (0.89) — 0.86 — —
French fries 28 (1.8) 0.007 (0.07) 0.67 — — —
Meat/chicken 232 (14.9) 0.14 (0.40) — 0.40 — —
Fish/shellfish 2 (0.1) 0.001 (0.03) 0.85 — — —
Nut foods 7 (0.5) 0.002 (0.04) 0.88 — — —
Eggs 26 (1.7) 0.01 (0.10) 0.48 — — —
Sweet foods 32 (2.1) 0.01 (0.07) 0.71 — — —
Eigenvalue — — 3.41 2.10 1.82 1.67Variance explained — — 18.9% 11.7% 10.1% 9.3%a Only show loading factors 0.4 or greater.—, indicates not applicable or factor loading ,0.4.
e1392 WEN et al at State Univ Of Ny at Buffalo on April 17, 2015pediatrics.aappublications.orgDownloaded from

were similar to those at age 6 and 12months (Supplemental Table 7), exceptthat nut foods and eggs were includedin the “High dairy/protein” patterns ratherthan the “High sugar/fat” pattern.
Significant Correlates of DietaryPatterns
Table 4 shows significant correlates of6-month dietary patterns. SupplementalTable 8 shows significant correlates of9-month dietary patterns. Table 5 showssignificant correlates of 12-month dietarypatterns. At age 12 months, a high scoreon “High sugar/fat/protein” pattern wascorrelated with low household income,maternal non-Hispanic African Americanrace/ethnicity, and low education. Incontrast, a high score on “Infant guide-line solids” pattern was correlated withhigh household income, maternal non-Hispanic white race/ethnicity, and higheducation. A high score on “Formula/baby cereal” pattern was correlatedwith emergency cesarean section,infant’s enrollment in WIC program,maternal olderage, Asian/Pacific Islander
race/ethnicity, first childbirth, and lowgestational weight gain. A high score on“High dairy” pattern was correlated withlower birth weight, methods of birthsother than vaginal–non-induced, mater-nal non-Hispanicwhite race/ethnicity, loweducation, being employed, and obesity.
Dietary Patterns and Infant Growth
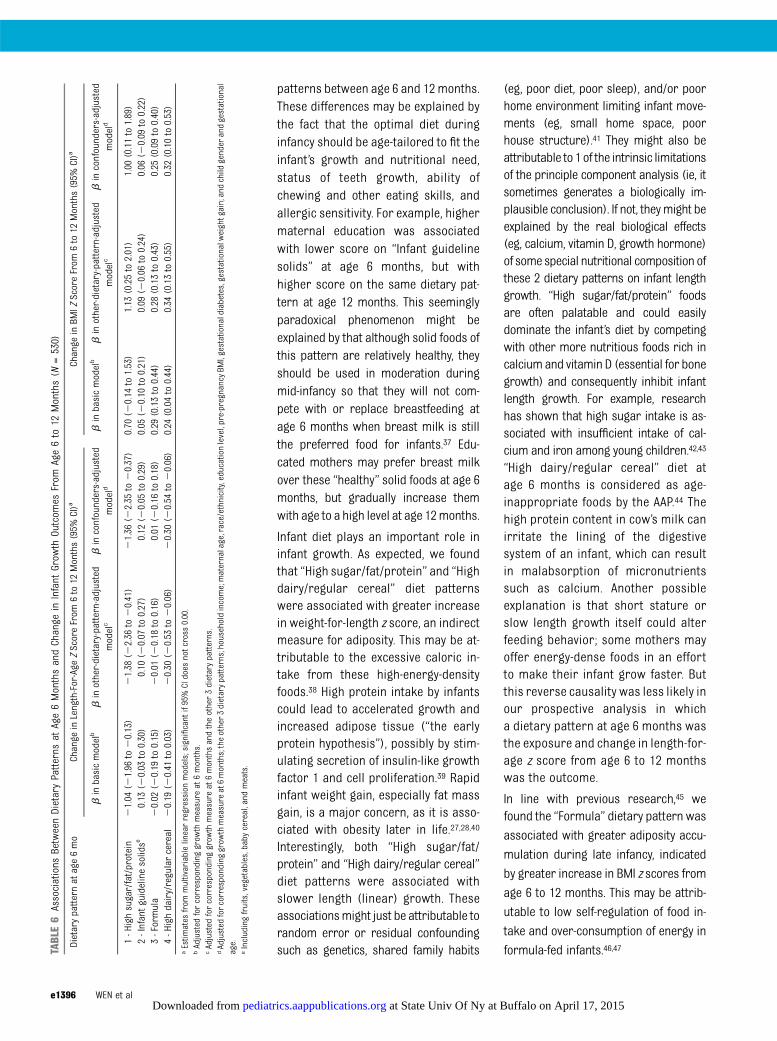
Table 6 shows the estimated associa-tions between 6-month dietary patternsand change in infant growth outcomesfrom age 6 to 12 months from multi-variable linear regression models.Both “High sugar/fat/protein” and “Highdairy/regular cereal” dietary patternsat age 6 months were associatedunfavorable infant growth patterns(ie, being shorter and fatter). Specifi-cally, they were associated with smallerincrease in length-for-age z score(adjusted b per 1 unit dietary patternscore,21.36 [95% CI,22.35 to20.37]and 20.30 [20.54 to 20.06], res-pectively), while greater increase inBMI z score (1.00 [0.11 to 1.89] and 0.32[0.10 to 0.53], respectively) from age
6 to 12 months, after adjusting forthe corresponding growth measure atage 6 months, other dietary patterns,and potential confounders. The “Formula”dietary pattern at age 6 months was as-sociated with greater increase in BMIz score (0.25 [0.09 to 0.40]) from age 6 to12 months (fatter); but it was not associ-ated with change in length-for-age z score(0.01 [20.16 to 0.18]) from age 6 to 12months (normal linear growth). The“Infant guideline solids” pattern was notassociated with change in length-for-age z score (0.12 [20.05 to 0.29]) (normallinear growth) or BMI z score (0.06 [20.09to 0.22]) (normal body mass growth) fromage 6 to 12 months.
DISCUSSION
In this national andprospective sample,we identified 4 dietary patterns at age 6and 12 months from the 18 originaltypes of foods commonly consumed byUS infants. As we expected, 1 patternwas milk-based (“Formula,” or notbreastfeeding), 2 contained unhealthysolids (“High sugar/fat/protein,” “High
TABLE 3 Infant Food Intake and Dietary Patterns at Age 12 Months (N = 1445)
Weekly Eater,n (%)
Mean Intake (SD),Serving/Week
Factor Loading on Dietary Patterna
1 - HighSugar/Fat/Protein
2 - Infant GuidelineSolids
3 - Formula/BabyCereal
4 - High Dairy
Food groupBreast milk 374 (25.9) 0.97 (1.96) — — 20.40 20.75Formula 486 (33.6) 0.96 (1.66) — — 0.79 —
Cow’s milk 1191 (82.4) 2.31 (1.70) — — — 0.76Other milk (eg, soy, rice, goat) 97 (6.7) 0.12 (0.58) — — — —
Other dairy foods 1224 (84.7) 1.04 (0.83) — 0.42 — —
Other soy foods 66 (4.6) 0.03 (0.21) — — — —
100% fruit/vegetable juice 1095 (75.8) 0.94 (0.89) — — — 20.42Sweet drinks 223 (15.4) 0.11 (0.38) 0.58 — — —
Baby cereal 662 (45.8) 0.53 (0.86) — — 0.60 —
Non-baby cereals/starches 1376 (95.2) 1.87 (1.14) — 0.49 — —
Fruit 1424 (98.6) 1.81 (0.86) — 0.82 — —
Vegetables 1426 (98.7) 1.72 (0.79) — 0.83 — —
French fries 651 (45.1) 0.11 (0.19) 0.58 — — —
Meat/chicken 1358 (94.0) 1.22 (0.78) — 0.54 — —
Fish/shellfish 287 (19.9) 0.05 (0.13) — — — —
Nut foods 404 (28.0) 0.13 (0.33) 0.49 — — —
Eggs 910 (63.0) 0.27 (0.37) 0.59 — — —
Sweet foods 817 (56.5) 0.25 (0.37) 0.56 — — —
Eigenvalue — — 2.04 2.19 1.46 1.55Variance explained — — 11.3% 12.1% 8.1% 8.6%a Only show loading factors with absolute values 0.4 or greater.—, indicates not applicable or factor loading ,0.4.
ARTICLE
PEDIATRICS Volume 134, Number 5, November 2014 e1393 at State Univ Of Ny at Buffalo on April 17, 2015pediatrics.aappublications.orgDownloaded from

dairy”), and the other contained healthysolids (“Infant guideline solids”). Con-sistent with our previous knowledge,these dietary patterns varied sub-stantially by maternal education andrace/ethnicity. As we hypothesized, “Highsugar/fat/protein,” “High dairy/regular,”and “Formula”were associated with fastgain in infant adiposity reflected by BMIz score. An unexpected finding was that“High sugar/fat/protein” and “High dairy/
regular” were associated with slowergrowth in infant length.
In line with the literature, we foundevidence on sociodemographic dis-parities in infant dietary patterns.14,16
Maternal education seems to be animportant correlate for infant dietarypatterns, as mothers who had a loweducation level tended to feed theirinfant with “High sugar/fat/protein”diet at age 12 months. In previous
studies, mothers who had low educa-tion level tended to feed their infantwith “adult” diet (bread, savory snacks,biscuits, and chips)14 or “basic combi-nation” diet (white bread, milk, spreads,juice, and ice-cream),15 which were alsounhealthy or age-inappropriate dietarypatterns. Mothers of low education levelmight lack the needed nutrition knowl-edge for their infant, which could causethem topractice unhealthy infant feeding,
TABLE 4 Significant Correlates of Infant Dietary Patterns at Age 6 Months (N = 1378)
Correlate Difference in the Score of Dietary Pattern at Age 6 Months (95% CI)a
1 - High Sugar/Fat/Protein 2 - Infant Guideline Solidsb 3 - Formula 4 - High Dairy/Regular Cereal
ChildFemale gender — 20.14 (20.24 to 20.04) — 20.12 (20.21 to 20.03)Birth weight, g — — 20.20 (20.30 to 20.10) —
Gestational age, wk — — — —
Method of birthVaginal, non-induced — Reference Reference —
Vaginal, induced — 0.14 (0.02 to 0.26) 0.13 (0.01 to 0.24) —
Planned cesarean section — 20.02 (20.17 to 0.12) 0.19 (0.05 to 0.33) —
Emergency cesarean section — 0.22 (0.05 to 0.40) 0.25 (0.07 to 0.42) —
Enrolled in WIC program — — 0.51 (0.37 to 0.66) —
HouseholdIncome, USD — — — —
,$25 000 — Reference Reference Reference$25 000 to $39 999 — 0.06 (20.11 to 0.23) 0.16 (20.01 to 0.33) 20.20 (20.35 to 20.05)$40 000 to $59 999 — 0.15 (20.02 to 0.32) 0.19 (0.01 to 0.36) 20.29 (20.45 to 20.14)$60 000+ — 0.21 (0.05 to 0.38) 0.38 (0.21 to 0.56) 20.26 (20.41 to 20.11)
MotherAge, y18 to 24 Reference — — —
25 to 29 20.04 (20.10 to 0.02) — — —
30 to 34 20.06 (20.12 to 0.00) — — —
35+ 20.05 (20.11 to 0.02) — — —
Race/ethnicityWhite, non-Hispanic Reference Reference — ReferenceAfrican American, non-Hispanic 0.08 (20.04 to 0.20) 0.01 (20.33 to 0.34) — 0.31 (0.01 to 0.61)Hispanic 0.09 (0.00 to 0.18) 0.11 (20.14 to 0.37) — 20.05 (20.28 to 0.18)Asian/Pacific Islander 0.05 (20.05 to 0.15) 20.32 (20.61 to 20.03) — 20.15 (20.42 to 0.11)Others 20.07 (20.22 to 0.08) 20.47 (20.90 to 20.04) — 0.05 (20.34 to 0.43)
Educational levelHigh school or lower — Reference Reference Reference1 to 3 y of college — 20.15 (20.31 to 0.00) 20.13 (20.28 to 0.02) 20.15 (20.29 to 20.01)College graduate — 20.19 (20.36 to 20.03) 20.20 (20.37 to 20.04) 20.31 (20.45 to 20.16)Post-graduate — 20.33 (20.53 to 20.12) 20.33 (20.54 to 20.13) 20.23 (20.42 to 20.05)
Unmarried 0.07 (0.02 to 0.12) — 0.28 (0.13 to 0.43) —
Employed — 0.16 (0.05 to 0.27) 0.17 (0.06 to 0.28) —
ParityNulliparous — — Reference —
1 previous birth — — 20.03 (20.16 to 0.10) —
2+ previous births — — 20.21 (20.36 to 20.07) —
Pre-pregnancy BMI, kg/m2
Normal/underweight (,25) — — Reference —
Overweight (25–29.9) — — 20.16 (20.30 to 20.01) —
Obese ($30) — — 20.07 (20.20 to 0.07) —
a Estimates from multivariable linear regression model; significant if 95% CI does not cross 0.00.b Including fruits, vegetables, baby cereal, and meats.—, indicates not in the final regression model due to non-significant association.
e1394 WEN et al at State Univ Of Ny at Buffalo on April 17, 2015pediatrics.aappublications.orgDownloaded from

which emulates their own poor personaldietary choices.14,34 Additionally, ouranalysis also showed that non-HispanicAfrican American women tended to feedtheir infant with unfavorable diet (ie,“High dairy/regular cereal” at age 6months and “High sugar/fat/protein” atage 12 months). Most foods in these 2dietary patterns, such as cow’s milk andother dairy foods, non-baby cereals,
sweet drinks, French fries, and sweetfoods, are discouraged by the AAPguidelines to be offered to infants.22,35
Infant formula is on the list of WIC-eligible food and is free to low-incomehouseholds.36 This might explain ourobservation that enrollment in the WICprogram was associated with highconsumption of “Formula” pattern at age6 months and “Formula/baby cereal”
pattern at age 12 months. After ad-justing for WIC enrollment and othersociodemographics, we found that in-fants from low-income householdsweremore likely to be fed “High sugar/fat/protein” diet, possibly because of therelatively low price of these foods andfamily dietary habit.
In addition, we observed notable dif-ferences in the correlates of dietary
TABLE 5 Significant Correlates of Infant Dietary Patterns at Age 12 Months (N = 1275)
Correlate Difference in the Score of Dietary Pattern at Age 12 Months (95% CI)a
1 - High Sugar/Fat/Protein 2 - Infant Guideline Solidsb 3 - Formula/Baby Cereal 4 - High Dairy
ChildBirth weight, g — — — 20.10 (20.30 to 0.00)Method of birthVaginal, non-induced Reference — Reference ReferenceVaginal, induced 0.14 (0.03 to 0.26) — 0.05 (20.07 to 0.18) 0.22 (0.10 to 0.35)Planned cesarean section 20.03 (20.17 to 0.10) — 0.03 (20.11 to 0.18) 0.21 (0.06 to 0.36)Emergency cesarean section 20.03 (20.20 to 0.13) — 0.32 (0.13 to 0.50) 0.25 (0.07 to 0.44)
Enrolled in WIC program — — 0.24 (0.12 to 0.37) —
HouseholdIncome, USD,$25 000 Reference Reference — —
$25 000 to $39 999 20.33 (20.49 to 20.18) 0.00 (20.17 to 0.18) — —
$40 000 to $59 999 20.35 (20.51 to 20.19) 0.22 (0.04 to 0.39) — —
$60 000+ 20.43 (20.58 to 20.27) 0.17 (0.00 to 0.34) — —
MotherAge, y18 to 24 — — Reference —
25 to 29 — — 20.07 (20.23 to 0.10) —
30 to 34 — — 0.22 (0.04 to 0.39) —
35+ — — 0.40 (0.21 to 0.60) —
Race/ethnicityWhite, non-Hispanic Reference Reference Reference ReferenceAfrican American, non-Hispanic 0.41 (0.13 to 0.70) 20.19 (20.50 to 0.12) 0.15 (20.15 to 0.45) 20.10 (20.41 to 0.22)Hispanic 0.12 (-0.11 to 0.35) 20.26 (20.50 to 20.01) 0.12 (20.12 to 0.36) 0.14 (20.11 to 0.40)Asian/Pacific Islander 0.17 (20.15 to 0.49) 20.51 (20.85 to 20.16) 0.38 (0.05 to 0.71) 20.46 (20.81 to 20.10)Others 20.02 (20.41 to 0.38) 0.60 (0.17 to 1.03) 0.21 (20.21 to 0.62) 20.44 (20.88 to 0.00)
Educational levelHigh school or lower Reference Reference — Reference1 to 3 y of college 20.20 (20.35 to 20.06) 0.15 (0.00 to 0.31) — 20.21 (20.37 to 20.05)College graduate 20.34 (20.49 to 20.19) 0.25 (0.08 to 0.41) — 20.33 (20.49 to 20.17)Post-graduate 20.42 (20.62 to 20.23) 0.39 (0.18 to 0.60) — 20.54 (20.74 to 20.33)
Employed — — — 0.23 (0.12 to 0.35)ParityNulliparous — — Reference —
1 previous birth — — 20.26 (20.39 to 20.13) —
2+ previous births — — 20.47 (20.61 to 20.33) —
Pre-pregnancy BMI, kg/m2
Normal/underweight (,25) — — — ReferenceOverweight (25–29.9) — — — 0.03 (20.10 to 0.16)Obese ($30) — — — 0.14 (0.01 to 0.28)
GWGLow — — Reference —
Normal — — 20.15 (20.30 to 20.01) —
Excessive — — 20.12 (20.26 to 0.02) —
a Estimates from multivariable linear regression model; significant if 95% CI does not cross 0.00.b Including fruits, vegetables, dairy, regular cereal, and meats.“—” indicates not in the final regression model due to non-significant association.
ARTICLE
PEDIATRICS Volume 134, Number 5, November 2014 e1395 at State Univ Of Ny at Buffalo on April 17, 2015pediatrics.aappublications.orgDownloaded from
patterns between age 6 and 12 months.These differences may be explained bythe fact that the optimal diet duringinfancy should be age-tailored to fit theinfant’s growth and nutritional need,status of teeth growth, ability ofchewing and other eating skills, andallergic sensitivity. For example, highermaternal education was associatedwith lower score on “Infant guidelinesolids” at age 6 months, but withhigher score on the same dietary pat-tern at age 12 months. This seeminglyparadoxical phenomenon might beexplained by that although solid foods ofthis pattern are relatively healthy, theyshould be used in moderation duringmid-infancy so that they will not com-pete with or replace breastfeeding atage 6 months when breast milk is stillthe preferred food for infants.37 Edu-cated mothers may prefer breast milkover these “healthy” solid foods at age 6months, but gradually increase themwith age to a high level at age 12months.
Infant diet plays an important role ininfant growth. As expected, we foundthat “High sugar/fat/protein” and “Highdairy/regular cereal” diet patternswere associated with greater increasein weight-for-length z score, an indirectmeasure for adiposity. This may be at-tributable to the excessive caloric in-take from these high-energy-densityfoods.38 High protein intake by infantscould lead to accelerated growth andincreased adipose tissue (“the earlyprotein hypothesis”), possibly by stim-ulating secretion of insulin-like growthfactor 1 and cell proliferation.39 Rapidinfant weight gain, especially fat massgain, is a major concern, as it is asso-ciated with obesity later in life.27,28,40
Interestingly, both “High sugar/fat/protein” and “High dairy/regular cereal”diet patterns were associated withslower length (linear) growth. Theseassociationsmight just be attributable torandom error or residual confoundingsuch as genetics, shared family habits
(eg, poor diet, poor sleep), and/or poorhome environment limiting infant move-ments (eg, small home space, poorhouse structure).41 They might also beattributable to 1 of the intrinsic limitationsof the principle component analysis (ie, itsometimes generates a biologically im-plausible conclusion). If not, theymight beexplained by the real biological effects(eg, calcium, vitamin D, growth hormone)of somespecial nutritional composition ofthese 2 dietary patterns on infant lengthgrowth. “High sugar/fat/protein” foodsare often palatable and could easilydominate the infant’s diet by competingwith other more nutritious foods rich incalciumand vitamin D (essential for bonegrowth) and consequently inhibit infantlength growth. For example, researchhas shown that high sugar intake is as-sociated with insufficient intake of cal-cium and iron among young children.42,43
“High dairy/regular cereal” diet atage 6 months is considered as age-inappropriate foods by the AAP.44 Thehigh protein content in cow’s milk canirritate the lining of the digestivesystem of an infant, which can resultin malabsorption of micronutrientssuch as calcium. Another possibleexplanation is that short stature orslow length growth itself could alterfeeding behavior; some mothers mayoffer energy-dense foods in an effortto make their infant grow faster. Butthis reverse causality was less likely inour prospective analysis in whicha dietary pattern at age 6 months wasthe exposure and change in length-for-age z score from age 6 to 12 monthswas the outcome.
In line with previous research,45 wefound the “Formula” dietary pattern was
associated with greater adiposity accu-
mulation during late infancy, indicated
by greater increase in BMI z scores from
age 6 to 12 months. This may be attrib-
utable to low self-regulation of food in-
take and over-consumption of energy in
formula-fed infants.46,47TABLE6
Associations
BetweenDietaryPatterns
atAge6MonthsandChange
inInfant
Grow
thOutcom
esFrom
Age6to
12Months(N
=530)
Dietarypatternatage6mo
Change
inLength-For-Age
ZScoreFrom
6to12
Months(95%
CI)a
Change
inBM
IZScoreFrom
6to12
Months(95%
CI)a
binbasicmodelb
binother-dietary-pattern-adjusted
modelc
binconfounders-adjusted
modeld
binbasicmodelb
binother-dietary-pattern-adjusted
modelc
binconfounders-adjusted
modeld
1-H
ighsugar/fat/protein
21.04
(21.96
to20.13)
21.38
(22.36
to20.41)
21.36
(22.35
to20.37)
0.70
(20.14
to1.53)
1.13
(0.25to2.01)
1.00
(0.11to1.89)
2-Infantguidelinesolidse
0.13
(20.03
to0.30)
0.10
(20.07
to0.27)
0.12
(20.05
to0.29)
0.05
(20.10
to0.21)
0.09
(20.06
to0.24)
0.06
(20.09
to0.22)
3-Formula
20.02
(20.19
to0.15)
20.01
(20.18
to0.16)
0.01
(20.16
to0.18)
0.29
(0.13to0.44)
0.28
(0.13to0.43)
0.25
(0.09to0.40)
4-H
ighdairy/regularcereal
20.19
(20.41
to0.03)
20.30
(20.53
to20.06)
20.30
(20.54
to20.06)
0.24
(0.04to0.44)
0.34
(0.13to0.55)
0.32
(0.10to0.53)
aEstim
ates
from
multivariablelinearregression
models;significant
if95%CIdoes
notcross0.00.
bAdjusted
forcorrespondinggrow
thmeasure
at6months.
cAdjusted
forcorrespondinggrow
thmeasure
at6monthsandtheother3dietarypatterns.
dAdjusted
forcorrespondinggrow
thmeasure
at6months;theother3dietarypatterns;householdincome;maternalage,race/ethnicity,educationlevel,pre-pregnancyBM
I,gestationaldiabetes,gestationalw
eightgain;andchild
genderandgestational
age.
eIncludingfruits,vegetables,baby
cereal,and
meats.
e1396 WEN et al at State Univ Of Ny at Buffalo on April 17, 2015pediatrics.aappublications.orgDownloaded from

We found the “Infant guideline solids”pattern was not associated with length-for-age or BMI z score from age 6 to 12months in our sample, suggesting that itcould promote normal linear and bodymass growth in infancy that met WHOChild Growth Standards. The UK studyreported that infants who had highconsumption of “infant feeding guide-lines” foods (fruit, vegetables, andhome-prepared foods) at age 6 monthsgained weight more rapidly from age 6to 12 months,17 but in a later study theyfound that “infant guidelines” dietarypattern at age 12 months was associ-ated with higher lean mass index, butnot with BMI or fat mass index at age 4years.18 Taken together, it seems that“Infant guideline solids” dietary patternis beneficial to infant growth by selec-tively promoting lean mass growthwithout increasing the risk for obesity.
This analysis had several limitations.First, although the IFPS II sample wasnational, itmight not represent the totalUS population, because the sample wasnot randomly obtained, rather it wasbased on customer opinion panel.20
Secondly, the IFPS II only collected theinformation on the frequency of 18 com-mon food groups, not specific foods con-
sumed or portion size.20 Thirdly, maternalreports of infant diet and clinically mea-sured growth outcomes were subject torecall bias.48 Fourthly, there was consid-erable attrition and missing data at age 6and 12 months, which could threaten thegeneralizability of our findings. Particu-larly, our analytic sample for the finalgrowth analysis over-represented non–low-income households and white andmore educated mothers. Fifthly, theprinciple component analysis was per-formed in an overlapping but different(larger) subsample than the final growthanalysis. Although this approach wasneeded to generate more robust dietarypatterns, it was subject to mismatch ofmain dietary patterns between the 2subsamples. Sixthly, we did not includematernal diet in the analysis owing toits large amount of missing data(.50%) by study design.20 Lastly, ouranalysis did not adjust for paternal ge-netic contribution (eg, weight andheight) to infant growth.
CONCLUSIONS
In summary, distinct dietary patternscould be identified among US infants asearly as age 6 months. These patternsvaried considerably by sociodemo-
graphics, especially by maternal edu-cation and race/ethnicity. Althoughexisting evidence is insufficient for usto make a solid recommendation onthe optimal dietary pattern(s) for USinfants, a combination of prolongedbreastfeedingandgradual introductionof “Infant guideline solids” (vegetables,fruits, baby cereal, and meat) can bea promising candidate of healthy di-etary pattern for infants after 6monthsof age based on our analysis and others.Our advice to parents is to introduce“Infant guideline solids” gradually afterage 6months so that these solidswill notcompletely replace breastfeeding (whichshould be continued until at least age 12months). For example, at each meal themother can try to breastfeed the infantfirst and then use these guideline solidsif the infant is still hungry.
ACKNOWLEDGMENTSThe authors appreciate Dr Leonard H.Epstein for providing critical commentson data analysis and the manuscript.The authors thank the CDC staff for pro-viding access to raw data and guidanceof data use. The IFPS II study was con-ducted by the US Food and Drug Admin-istration and the CDC.
REFERENCES
1. Hetherington MM, Cecil JE, Jackson DM,Schwartz C. Feeding infants and youngchildren. From guidelines to practice. Ap-petite. 2011;57(3):791–795
2. Grummer-Strawn LM, Scanlon KS, Fein SB.Infant feeding and feeding transitionsduring the first year of life. Pediatrics.2008;122(suppl 2):S36–S42
3. Smithers LG, Golley RK, Brazionis L, LynchJW. Characterizing whole diets of youngchildren from developed countries and theassociation between diet and health: a sys-tematic review. Nutr Rev. 2011;69(8):449–467
4. World Health Organization. The OptimalDuration of Exclusive Breastfeeding. Report ofthe Expert Consultation. Geneva, Switzerland:World Health Organization; 2002
5. Eidelman AI, Schanler RJ, Johnston M, et al;Section on Breastfeeding. Breastfeedingand the use of human milk. Pediatrics.
2012;129(3). Available at: www.pediatrics.org/cgi/content/full/129/3/e827
6. Huh SY, Rifas-Shiman SL, Taveras EM, Oken E,Gillman MW. Timing of solid food intro-duction and risk of obesity in preschool-aged children. Pediatrics. 2011;127(3).Available at: www.pediatrics.org/cgi/content/full/127/3/e544
7. van Rossem L, Kiefte-de Jong JC, LoomanCW, et al. Weight change before and after theintroduction of solids: results from a longitudi-nal birth cohort. Br J Nutr. 2013;109(2):370–375
8. Burdette HL, Whitaker RC, Hall WC, DanielsSR. Breastfeeding, introduction of comple-mentary foods, and adiposity at 5 y of age.Am J Clin Nutr. 2006;83(3):550–558
9. US Department of Agriculture. HumanUDoHa, Services. Dietary Guidelines forAmericans, 2010, 7th ed. Washington, DC:US Government Printing Office; 2010
10. Birch LL, Doub AE. Learning to eat: birth toage 2 y. Am J Clin Nutr. 2014;99(3):723S–728S
11. Noble S, Emmett P. Differences in weaningpractice, food and nutrient intake betweenbreast- and formula-fed 4-month-oldinfants in England. J Hum Nutr Diet. 2006;19(4):303–313
12. Hu FB. Dietary pattern analysis: a new di-rection in nutritional epidemiology. CurrOpin Lipidol. 2002;13(1):3–9
13. Newby PK, Tucker KL. Empirically derivedeating patterns using factor or clusteranalysis: a review. Nutr Rev. 2004;62(5):177–203
14. Robinson S, Marriott L, Poole J, et al;Southampton Women’s Survey Study Group.Dietary patterns in infancy: the impor-tance of maternal and family influenceson feeding practice. Br J Nutr. 2007;98(5):1029–1037
ARTICLE
PEDIATRICS Volume 134, Number 5, November 2014 e1397 at State Univ Of Ny at Buffalo on April 17, 2015pediatrics.aappublications.orgDownloaded from

15. Bell LK, Golley RK, Daniels L, Magarey AM.Dietary patterns of Australian childrenaged 14 and 24 months, and associationswith socio-demographic factors and adi-posity. Eur J Clin Nutr. 2013;67(6):638–645
16. Betoko A, Charles MA, Hankard R, et al;EDEN mother-child cohort study group. In-fant feeding patterns over the first year oflife: influence of family characteristics. EurJ Clin Nutr. 2013;67(6):631–637
17. Baird J, Poole J, Robinson S, et al; South-ampton Women’s Survey Study Group. Milkfeeding and dietary patterns predict weightand fat gains in infancy. Paediatr PerinatEpidemiol. 2008;22(6):575–586
18. Robinson SM, Marriott LD, Crozier SR, et al;Southampton Women’s Survey Study Group.Variations in infant feeding practice areassociated with body composition in child-hood: a prospective cohort study. J ClinEndocrinol Metab. 2009;94(8):2799–2805
19. Gale CR, Martyn CN, Marriott LD, et al;Southampton Women’s Survey Study Group.Dietary patterns in infancy and cognitiveand neuropsychological function in child-hood. J Child Psychol Psychiatry. 2009;50(7):816–823
20. Fein SB, Labiner-Wolfe J, Shealy KR, Li R,Chen J, Grummer-Strawn LM. Infant FeedingPractices Study II: study methods. Pediatrics.2008;122(suppl 2):S28–S35
21. World Health Organization. ComplementaryFeeding: Report of the Global Consultation,and Summary of Guiding Principles forComplementary Feeding of the BreastfedChild. Geneva, Switzerland: World HealthOrganization; 2002
22. American Academy of Pediatrics. Infant—food and feeding. Available at: www.aap.org/en-us/advocacy-and-policy/aap-health-initiatives/HALF-Implementation-Guide/Age-Specific-Content/Pages/Infant-Food-and-Feeding.aspx. Accessed January 31, 2014
23. Bright Futures/American Academy of Pediat-rics. Periodicity schedule—recommendationsfor preventive pediatric health care. Availableat: www.aap.org/en-us/professional-resources/practice-support/Pages/PeriodicitySchedule.aspx. Accessed July 8, 2014
24. Institute of Medicine and National ResearchCouncil. Weight Gain During Pregnancy:Reexamining the Guidelines. Washington,DC: The National Academies Press; 2009
25. WHO Multicentre Growth Reference StudyGroup. WHO Child Growth Standards basedon length/height, weight and age. ActaPaediatr Suppl. 2006;450:76–85
26. Grummer-Strawn LM, Reinold C, Krebs NF;Centers for Disease Control and Prevention(CDC). Use of World Health Organizationand CDC growth charts for children aged
0-59 months in the United States. MMWRRecomm Rep. 2010;59(RR-9):1–15
27. Sovio U, Kaakinen M, Tzoulaki I, et al. Howdo changes in body mass index in in-fancy and childhood associate withcardiometabolic profile in adulthood? Find-ings from the Northern Finland Birth Cohort1966 Study. Int J Obes (Lond). 2014;38(1):53–59
28. Taveras EM, Rifas-Shiman SL, Belfort MB,Kleinman KP, Oken E, Gillman MW. Weightstatus in the first 6 months of life andobesity at 3 years of age. Pediatrics. 2009;123(4):1177–1183
29. Joliffe IT, Morgan BJ. Principal componentanalysis and exploratory factor analysis.Stat Methods Med Res. 1992;1(1):69–95
30. Hu FB, Rimm EB, Stampfer MJ, Ascherio A,Spiegelman D, Willett WC. Prospective studyof major dietary patterns and risk of cor-onary heart disease in men. Am J Clin Nutr.2000;72(4):912–921
31. Perneger TV. What’s wrong with Bonferroniadjustments. BMJ. 1998;316(7139):1236–1238
32. Feise RJ. Do multiple outcome measuresrequire p-value adjustment? BMC Med ResMethodol. 2002;2:8
33. Adair LS, Martorell R, Stein AD, et al. Size atbirth, weight gain in infancy and childhood,and adult blood pressure in 5 low- andmiddle-income-country cohorts: when doesweight gain matter? Am J Clin Nutr. 2009;89(5):1383–1392
34. Vereecken CA, Keukelier E, Maes L. In-fluence of mother’s educational level onfood parenting practices and food habitsof young children. Appetite. 2004;43(1):93–103
35. Greer FR, Sicherer SH, Burks AW; AmericanAcademy of Pediatrics Committee on Nu-trition; American Academy of PediatricsSection on Allergy and Immunology. Effectsof early nutritional interventions on thedevelopment of atopic disease in infantsand children: the role of maternal dietaryrestriction, breastfeeding, timing of intro-duction of complementary foods, andhydrolyzed formulas. Pediatrics. 2008;121(1):183–191
36. United States Department of Agriculture.WIC food packages—regulatory require-ments for WIC-eligible foods. Available at:www.fns.usda.gov/wic/wic-food-packages-regulatory-requirements-wic-eligible-foods.Accessed July 8, 2014
37. Heinig MJ, Nommsen LA, Peerson JM,Lonnerdal B, Dewey KG. Intake and growthof breast-fed and formula-fed infants inrelation to the timing of introduction ofcomplementary foods: the DARLING study.Davis Area Research on Lactation, Infant
Nutrition and Growth. Acta Paediatr. 1993;82(12):999–1006
38. Ong KK, Emmett PM, Noble S, Ness A,Dunger DB, Team AS; ALSPAC Study Team.Dietary energy intake at the age of 4months predicts postnatal weight gain andchildhood body mass index. Pediatrics.2006;117(3). Available at: www.pediatrics.org/cgi/content/full/117/3/e503
39. Koletzko B, von Kries R, Closa R, et al;European Childhood Obesity Trial StudyGroup. Lower protein in infant formula isassociated with lower weight up to age 2 y:a randomized clinical trial. Am J Clin Nutr.2009;89(6):1836–1845
40. Ong KK, Loos RJ. Rapid infancy weight gainand subsequent obesity: systematic reviewsand hopeful suggestions. Acta Paediatr. 2006;95(8):904–908
41. Liu YX, Jalil F, Karlberg J. Risk factors forimpaired length growth in early life viewedin terms of the infancy-childhood-puberty(ICP) growth model. Acta Paediatr. 1998;87(3):237–243
42. Kranz S, Smiciklas-Wright H, Siega-Riz AM,Mitchell D. Adverse effect of high addedsugar consumption on dietary intake inAmerican preschoolers. J Pediatr. 2005;146(1):105–111
43. Ruottinen S, Niinikoski H, Lagstrom H, et al.High sucrose intake is associated withpoor quality of diet and growth between 13months and 9 years of age: the special TurkuCoronary Risk Factor Intervention Project.Pediatrics. 2008;121(6). Available at: www.pe-diatrics.org/cgi/content/full/121/6/e1676
44. American Academy of Pediatrics. AmericanAcademy of Pediatrics Committee on Nu-trition: the use of whole cow’s milk ininfancy. Pediatrics. 1992;89(6 pt 1):1105–1109
45. Dewey KG, Heinig MJ, Nommsen LA, PeersonJM, Lönnerdal B. Growth of breast-fed andformula-fed infants from 0 to 18 months:the DARLING Study. Pediatrics. 1992;89(6 pt 1):1035–1041
46. Bartok CJ, Ventura AK. Mechanisms un-derlying the association between breast-feeding and obesity. Int J Pediatr Obes.2009;4(4):196–204
47. Hester SN, Hustead DS, Mackey AD, SinghalA, Marriage BJ. Is the macronutrient intakeof formula-fed infants greater than breast-fed infants in early infancy? J Nutr Metab.2012;2012:891201
48. Li R, Fein SB, Grummer-Strawn LM. Associ-ation of breastfeeding intensity and bottle-emptying behaviors at early infancy withinfants’ risk for excess weight at late in-fancy. Pediatrics. 2008;122(suppl 2):S77–S84
e1398 WEN et al at State Univ Of Ny at Buffalo on April 17, 2015pediatrics.aappublications.orgDownloaded from

DOI: 10.1542/peds.2014-1045; originally published online October 13, 2014;Pediatrics
Chuanbo XieXiaozhong Wen, Kai Ling Kong, Rina Das Eiden, Neha Navneet Sharma and
Sociodemographic Differences and Infant Dietary Patterns
ServicesUpdated Information &
/peds.2014-1045http://pediatrics.aappublications.org/content/early/2014/10/08including high resolution figures, can be found at:
Supplementary Material
8/peds.2014-1045.DCSupplemental.htmlhttp://pediatrics.aappublications.org/content/suppl/2014/10/0Supplementary material can be found at:
Permissions & Licensing
tmlhttp://pediatrics.aappublications.org/site/misc/Permissions.xhtables) or in its entirety can be found online at: Information about reproducing this article in parts (figures,
Reprints http://pediatrics.aappublications.org/site/misc/reprints.xhtml
Information about ordering reprints can be found online:
rights reserved. Print ISSN: 0031-4005. Online ISSN: 1098-4275.Grove Village, Illinois, 60007. Copyright © 2014 by the American Academy of Pediatrics. All and trademarked by the American Academy of Pediatrics, 141 Northwest Point Boulevard, Elkpublication, it has been published continuously since 1948. PEDIATRICS is owned, published, PEDIATRICS is the official journal of the American Academy of Pediatrics. A monthly
at State Univ Of Ny at Buffalo on April 17, 2015pediatrics.aappublications.orgDownloaded from
DOI: 10.1542/peds.2014-1045; originally published online October 13, 2014;Pediatrics
Chuanbo XieXiaozhong Wen, Kai Ling Kong, Rina Das Eiden, Neha Navneet Sharma and
Sociodemographic Differences and Infant Dietary Patterns
http://pediatrics.aappublications.org/content/early/2014/10/08/peds.2014-1045
located on the World Wide Web at: The online version of this article, along with updated information and services, is
of Pediatrics. All rights reserved. Print ISSN: 0031-4005. Online ISSN: 1098-4275.Boulevard, Elk Grove Village, Illinois, 60007. Copyright © 2014 by the American Academy published, and trademarked by the American Academy of Pediatrics, 141 Northwest Pointpublication, it has been published continuously since 1948. PEDIATRICS is owned, PEDIATRICS is the official journal of the American Academy of Pediatrics. A monthly
at State Univ Of Ny at Buffalo on April 17, 2015pediatrics.aappublications.orgDownloaded from
Related Documents