A Generalized Procedure for the Devolatilization of Biomass Fuels Based on the Chemical Components Enrico Biagini* and Leonardo Tognotti Dipartimento di Ingegneria Civile e Industriale, Universita ̀ di Pisa, Largo Lazzarino 1, 56122, Pisa, Italy ABSTRACT: The devolatilization is a basic mechanism for all thermochemical processes (pyrolysis, combustion, gasification), especially for biomasses that contain a large amount of volatile matter. Because of the wide variety in origin, structure, and composition, it is desirable to study these renewable fuels starting from their chemical composition, which is referring to the organic fractions of cellulose, hemicellulose, extractives, and lignin. An optimization procedure based on a summative law and first-order reaction model is validated in this work with uniform experimental data on 37 biomasses, such as woods, energy crops, and agricultural and food residues, selected as potential energy sources on a regional scale. The thermogravimetric (TG) weight loss and its derivative (dtg) curves are accurately predicted (discrepancy between 0.4 and 1.4%) in the entire temperature range with kinetic parameters for common biocomponents, defined as the unseparated fractions of the biomasses with the original content of ash. The kinetic parameters obtained are within the ranges of values obtained in the literature for the activation energy of synthesized components. The procedure developed here is also successfully extended to further tests under different heating rates and biomasses outside the data set used for the validation and literature data. Finally, it can be used for obtaining the chemical composition of lignocellulosic materials based on a simple TG run. 1. INTRODUCTION Many modeling approaches based on chemical composition have been proposed to simulate the pyrolysis of biomass fuels. 1−5 An acceptable point is that the behavior of the lignin- cellulosic biomasses can be sufficiently well predicted by a weighted sum of the behavior of the chemical components cellulose, hemicellulose, extractives, and lignin (CHEL). It is assumed that these components react independently with negligible influence due to their interactions, 4,6,7 so the devolatilization of the biomass can be represented by a set of parallel reactions. Simple as well as complex kinetic schemes were successfully applied. 8,9 The problem moves to the realistic characterization of the single components and a reliable method to elaborate the kinetic parameters. The number of components or pseudocomponents used in the majority of the approaches is three (CHL), while in a few cases the contribution of extractives or more than one reaction stage in the decomposition of hemicellulose and/or lignin is also taken into account. 10 The chemical composition of biomasses can be analyzed with traditional methods (for instance, leaching with hot water and/ or organic solvents for the extractives and sequential basic and acid washings for the hemicellulose, cellulose, and lignin fractions, according to the procedures 11−13 ), which quantify the fractions of CHEL. As a matter of fact, these methods are not standardized, are scarcely reproducible and accurate, and give a poor closure of the balance; that is, the sum of the four fractions (on a dry and ash-free basis) can give much less than 100%. The fraction of the extractives is not often found in literature works, and sometimes it is added to that of the hemicellulose. As for this latter component, sometimes it is added to the cellulose, and only the holocellulose fraction is indicated. These issues represent strong limitations and give significant experimental errors due to the existence of different analytical methods, the presence of ash (that can be partially removed or persist during the determination of a specific fraction), the imperfect separation of the organic polymers, or their modification during the treatments. Cellulose is a linear polymer with a very high molecular weight and forms fibers with different degrees of crystallinity. 4 Hemicellulose is a more branched polymer with a relatively lower molecular weight that interconnects the cellulose fibers. Different monomeric units are recognized, such as xylose, galactose, and arabinose. It is hardly separated from the biomass without modifying its structure. Extractives are low molecular weight compounds such as terpenes, tannins, fatty acids, resins, sugars, and proteins. Finally, lignin is a reticulate polymer with a heterogeneous structure. Synthetic components or the ones separated from a particular biomass can be not representative of the lignocellulosic materials. For instance, it was proved that the lignin of hardwoods differs from lignin of softwoods in composition and reactivity. 14 Analogously, some researchers 6,15 found different devolatilization behaviors from the hemi- celluloses of several woods. It depends on the chemical composition but also on the molecular structure. For instance, the higher the cellulose crystallinity degree, the lower the reactivity during the devolatilization. 4 Furthermore, it is universally recognized the crucial role of ash, 4,16−18 catalyzing decomposition or recombination reactions, in the devolatiliza- tion of “real” biomasses, although a quantification of its effect is not achieved yet. Also, the numerical methods applied to the experimental data can give significant differences in the results of the devolatilization studies and elaboration of kinetic parameters. So, in general, wide ranges of chemical composition and kinetic parameters can be found for biomasses and their Received: October 28, 2013 Revised: December 30, 2013 Published: January 1, 2014 Article pubs.acs.org/EF © 2014 American Chemical Society 614 dx.doi.org/10.1021/ef402139v | Energy Fuels 2014, 28, 614−623

Welcome message from author
This document is posted to help you gain knowledge. Please leave a comment to let me know what you think about it! Share it to your friends and learn new things together.
Transcript

A Generalized Procedure for the Devolatilization of Biomass FuelsBased on the Chemical ComponentsEnrico Biagini* and Leonardo Tognotti
Dipartimento di Ingegneria Civile e Industriale, Universita ̀ di Pisa, Largo Lazzarino 1, 56122, Pisa, Italy
ABSTRACT: The devolatilization is a basic mechanism for all thermochemical processes (pyrolysis, combustion, gasification),especially for biomasses that contain a large amount of volatile matter. Because of the wide variety in origin, structure, andcomposition, it is desirable to study these renewable fuels starting from their chemical composition, which is referring to theorganic fractions of cellulose, hemicellulose, extractives, and lignin. An optimization procedure based on a summative law andfirst-order reaction model is validated in this work with uniform experimental data on 37 biomasses, such as woods, energy crops,and agricultural and food residues, selected as potential energy sources on a regional scale. The thermogravimetric (TG) weightloss and its derivative (dtg) curves are accurately predicted (discrepancy between 0.4 and 1.4%) in the entire temperature rangewith kinetic parameters for common biocomponents, defined as the unseparated fractions of the biomasses with the originalcontent of ash. The kinetic parameters obtained are within the ranges of values obtained in the literature for the activation energyof synthesized components. The procedure developed here is also successfully extended to further tests under different heatingrates and biomasses outside the data set used for the validation and literature data. Finally, it can be used for obtaining thechemical composition of lignocellulosic materials based on a simple TG run.
1. INTRODUCTIONMany modeling approaches based on chemical compositionhave been proposed to simulate the pyrolysis of biomassfuels.1−5 An acceptable point is that the behavior of the lignin-cellulosic biomasses can be sufficiently well predicted by aweighted sum of the behavior of the chemical componentscellulose, hemicellulose, extractives, and lignin (CHEL). It isassumed that these components react independently withnegligible influence due to their interactions,4,6,7 so thedevolatilization of the biomass can be represented by a set ofparallel reactions. Simple as well as complex kinetic schemeswere successfully applied.8,9 The problem moves to the realisticcharacterization of the single components and a reliablemethod to elaborate the kinetic parameters. The number ofcomponents or pseudocomponents used in the majority of theapproaches is three (CHL), while in a few cases thecontribution of extractives or more than one reaction stage inthe decomposition of hemicellulose and/or lignin is also takeninto account.10
The chemical composition of biomasses can be analyzed withtraditional methods (for instance, leaching with hot water and/or organic solvents for the extractives and sequential basic andacid washings for the hemicellulose, cellulose, and ligninfractions, according to the procedures11−13), which quantify thefractions of CHEL. As a matter of fact, these methods are notstandardized, are scarcely reproducible and accurate, and give apoor closure of the balance; that is, the sum of the fourfractions (on a dry and ash-free basis) can give much less than100%. The fraction of the extractives is not often found inliterature works, and sometimes it is added to that of thehemicellulose. As for this latter component, sometimes it isadded to the cellulose, and only the holocellulose fraction isindicated. These issues represent strong limitations and givesignificant experimental errors due to the existence of differentanalytical methods, the presence of ash (that can be partially
removed or persist during the determination of a specificfraction), the imperfect separation of the organic polymers, ortheir modification during the treatments.Cellulose is a linear polymer with a very high molecular
weight and forms fibers with different degrees of crystallinity.4
Hemicellulose is a more branched polymer with a relativelylower molecular weight that interconnects the cellulose fibers.Different monomeric units are recognized, such as xylose,galactose, and arabinose. It is hardly separated from the biomasswithout modifying its structure. Extractives are low molecularweight compounds such as terpenes, tannins, fatty acids, resins,sugars, and proteins. Finally, lignin is a reticulate polymer with aheterogeneous structure. Synthetic components or the onesseparated from a particular biomass can be not representative ofthe lignocellulosic materials. For instance, it was proved that thelignin of hardwoods differs from lignin of softwoods incomposition and reactivity.14 Analogously, some researchers6,15
found different devolatilization behaviors from the hemi-celluloses of several woods. It depends on the chemicalcomposition but also on the molecular structure. For instance,the higher the cellulose crystallinity degree, the lower thereactivity during the devolatilization.4 Furthermore, it isuniversally recognized the crucial role of ash,4,16−18 catalyzingdecomposition or recombination reactions, in the devolatiliza-tion of “real” biomasses, although a quantification of its effect isnot achieved yet. Also, the numerical methods applied to theexperimental data can give significant differences in the resultsof the devolatilization studies and elaboration of kineticparameters. So, in general, wide ranges of chemical compositionand kinetic parameters can be found for biomasses and their
Received: October 28, 2013Revised: December 30, 2013Published: January 1, 2014
Article
pubs.acs.org/EF
© 2014 American Chemical Society 614 dx.doi.org/10.1021/ef402139v | Energy Fuels 2014, 28, 614−623
components.10 Until now, a generalized procedure for theseissues, though desirable, was not attained. The present workgoes in this direction.It is important to develop methods starting from the
chemical components in the same form they are in the virginbiomass, with their natural structure and the presence of theoriginal ash in it. The term “biocomponents” will be usedhereafter to circumscribe these characteristics. It is not the caseof synthesized materials that have a different structure and ashcontent with respect to the unseparated ones. Also, thechemical and physical alterations introduced during theseparation procedure and the impossibility to reproduce theinteractions among the components10 give significant differ-ences between single components and those effectively presentinside the biomass. Besides, several celluloses, lignins, andsurrogated hemicelluloses (such as xylans) exist in commerceor can be separated from different biomasses, so that thecharacteristics obtained from them (kinetic parameters, forinstance) can represent only the components of specificbiomasses, with no possibility of generalization.Here a simple weighted sum model (based on the CHEL
biocomponents) is coupled with an optimization procedure tofind the generalized kinetic parameters of decomposition andthe chemical fractions of “real” biomasses. The procedure isbased on the TG biomassdevo database containing the resultsof thermogravimetric (TG) tests of around 50 biomassmaterials. A selection of 37 biomasses is operated amongthose potentially valuable as energy sources on a regional area,as this work is developed in the frame of the Italian RegionalProject “BPT-BioPower in Tuscany”. The aim of the project isto study the possibility of producing biomasses (from energycrops and agro-food residues) in a regional area for thedistributed generation through small−medium size gasifiers andcombustors, and the reconversion of a power plant. The activitydescribed in the present work aims at providing a tool forpredicting the composition and kinetics of every biomass usedin the plants, even in blends.
2. METHODOLOGY2.1. Selection of the Experimental Data. The TG biomassdevo
database developed at DICI-UNIPI contains the results ofthermogravimetric tests performed in the last 10 years on biomassmaterials. Different TG balances (Mettler TA-3000, Netzsch STA409/C, TA Instruments TG Q500 V6.1), different gas environments(nitrogen, air, O2/N2 mixtures) and thermal programs (heating ratefrom 5 to 80 K/min) were used. For the application of the proceduredescribed in the next section, a restricted number of tests in the globaldatabase were selected to constitute a data set of uniform data. Theywere carried out in the same TG balance (Q500 TA Instruments) withthe same thermal program (from 400 to 1070 at 20 K/min) under aninert flow of nitrogen (100 mL/min). The biomasses were previouslydried, pulverized, and sieved (90−150 μm), and an initial mass of thesamples around 10 mg was tested to limit the thermal gradients in theconditions used. For each material, the data are the average values of atleast two TG tests under the same conditions. No significantdifferences are observed in the replication of the tests for the materialsin the selected data set.As for the biomass selection, 37 materials were chosen among those
available on the regional area and potentially usable as energy sources.Some derive from energy crops or are potential energy crops inTuscany; others are residues of agricultural/food activities or woodindustry. The entire harvested plant as well as parts of it are tested. Inall cases, they are untreated biomasses.2.2. Development of the Optimization Procedure. The
optimization procedure aims at providing the kinetic parameters of
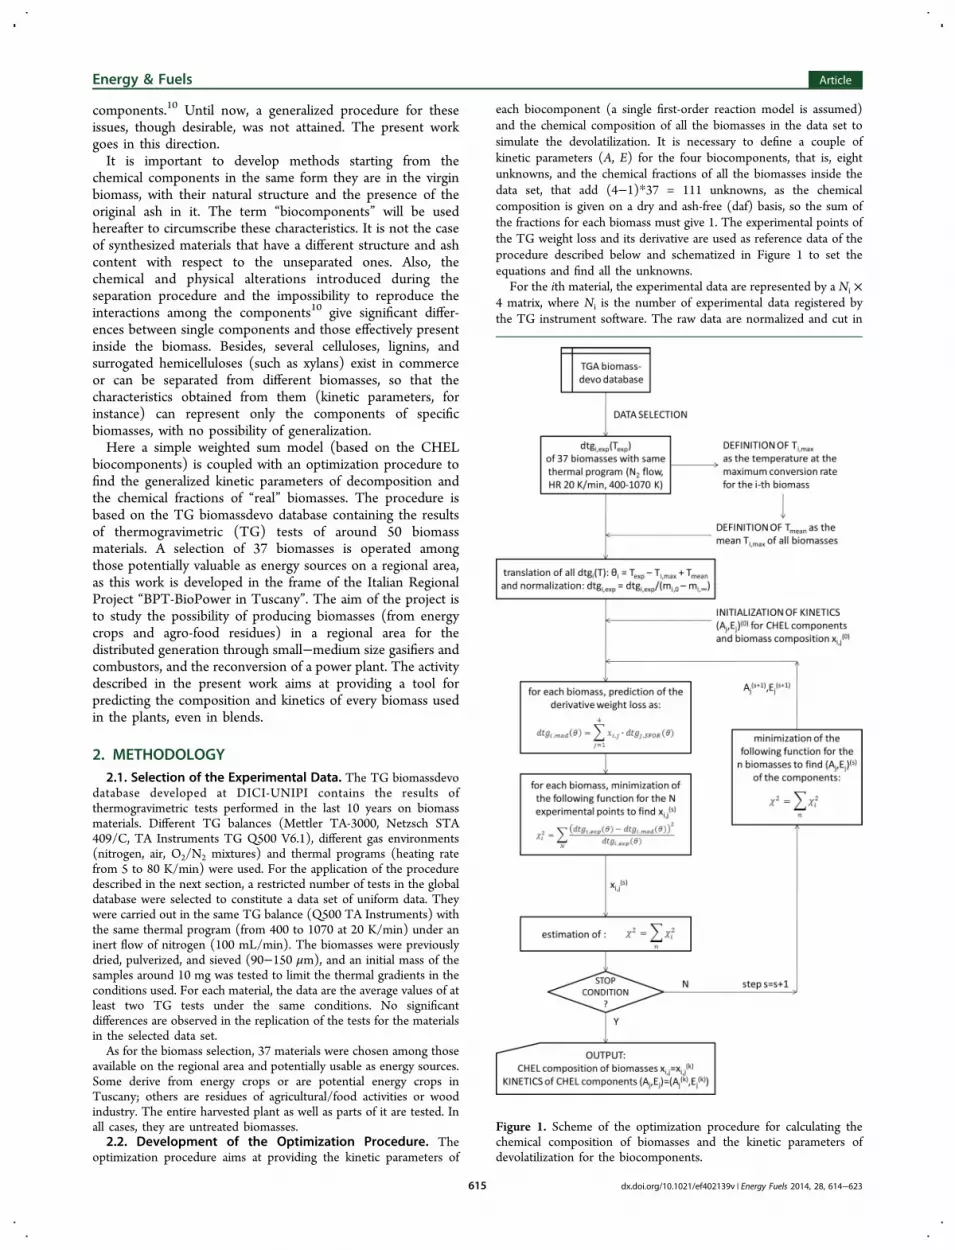
each biocomponent (a single first-order reaction model is assumed)and the chemical composition of all the biomasses in the data set tosimulate the devolatilization. It is necessary to define a couple ofkinetic parameters (A, E) for the four biocomponents, that is, eightunknowns, and the chemical fractions of all the biomasses inside thedata set, that add (4−1)*37 = 111 unknowns, as the chemicalcomposition is given on a dry and ash-free (daf) basis, so the sum ofthe fractions for each biomass must give 1. The experimental points ofthe TG weight loss and its derivative are used as reference data of theprocedure described below and schematized in Figure 1 to set theequations and find all the unknowns.
For the ith material, the experimental data are represented by a Ni ×4 matrix, where Ni is the number of experimental data registered bythe TG instrument software. The raw data are normalized and cut in
Figure 1. Scheme of the optimization procedure for calculating thechemical composition of biomasses and the kinetic parameters ofdevolatilization for the biocomponents.
Energy & Fuels Article
dx.doi.org/10.1021/ef402139v | Energy Fuels 2014, 28, 614−623615

the same temperature range (400−1070 K), so that the four columnsare time t (s), temperature T (K), normalized weight loss (α),normalized derivative weight loss dtg (−dα/dt, s−1), where α isdefined as
α =−−
∞
∞
m mm m0 (1)
where m is the actual mass of the sample registered by the TG balance,and m0 and m∞ are the initial and final mass, respectively. It is worthnoting that the initial mass is taken at T0 = 400 K, that is, after thedrying step, while the final mass is taken at the end of thedevolatilization step Tf, that is, before the incineration step. The dtgvalues are positive, so the respective curves will be represented in the Iquadrant of plots shown in the next sections.For the ith material, the parameter Ti,max is defined as the
temperature for the maximum value of the dtg (or alternatively themaximum rate of devolatilization) in the temperature rangeconsidered. The mean temperature Tmean is defined as the averagevalue of all the Ti,max. For the selected data set Tmean was 620 K. Thisvalue depends on the biomasses considered as well as the thermalprogram used. In general, the higher the heating rate used in the TGbalance, the higher the temperature for the maximum rate ofdecomposition.19 All the dtg experimental data are then translatedwith the following transformation of the temperature:
θ = − +
=⎪⎪
⎧⎨⎩
T T T
dtg dtg
i i i
i i
,max mean
,exp ,exp (2)
In such a way, all the materials are shifted along the temperature axisto have the maximum derivative weight loss curve at the sametemperature. It is necessary to ensure that all the cellulosedecomposition peaks coincide.As stated in the introduction, four chemical components (instead of
the classical three components model) are considered: cellulose,hemicellulose, extractives, and lignin. The extractives are included herebecause many agricultural and food residues contain some organicmatter that decomposes at very low temperature. A single first-orderreaction (SFOR) model is assumed for the devolatilization of the jthcomponent, with the Arrhenius parameters Aj and Ej (here moreproperly called pre-exponential and exponential factors, respectively,instead of frequency factor and activation energy, because they areapplied to a complex chemical mechanism instead of a single reaction):
αα− = = −−
tA
d
ddtg e (1 )j
jE RT
j,SFOR/j
(3)
The approximation of Coats and Redfern20 is assumed toanalytically solve the single differential eq 3:
αβ
− = − −⎛⎝⎜
⎞⎠⎟
⎛⎝⎜⎜
⎛⎝⎜⎜
⎞⎠⎟⎟⎞⎠⎟⎟T
A R
ERTE
E
RTln
ln( )ln 1
2j
j j
j2
(4)
where β is the constant heating rate during the TG test, thus assuminga linear dependency between time and temperature:
β= +T T t0 (5)
The optimization procedure starts with the initial values of Aj(0) and
Ej(0) adopted from literature works10 and common values for the
massive fraction of the jth component in the ith biomass xi,j.Therefore, the dtg of the ith biomass can be expressed as the weightedsum of the dtg of the four biocomponents according to
∑==
xdtg dtgij
i j j,mod1
4
, ,SFOR(6)
with the constraints:
∑ = ∀=
x i1,j
i j1
4
,(7)
≥ ∀x i j0, ,i j, (8)
Given the values of the kinetic parameters and once ith is fixed, thefour fractions xi,j can be determined by minimizing the following chi-squared function:
∑χ = =−
xfunction ( )(dtg dtg )
dtgi i jN
i i
i
2,
,exp ,mod2
,expi (9)
where the sum is extended to all the Ni experimental points availablefor the ith biomass. The optimization is based on the differentialmeasurements because the details of the devolatilization submechan-isms are better recognized. The matrix xi,j
(0) of the chemicalcomposition is then obtained for all the biomasses. With thesecompositions, the kinetic parameters of the subsequent iterative stepcan be calculated by minimizing the following overall function:
∑χ χ= =A Efunction ( , )j jn
i2 2
(10)
where the sum is extended to all the n biomasses of the data set. Theset of kinetics Aj
(1) and Ej(1) for the four biocomponents are then
obtained. The iterative procedure is repeated according to the schemeof Figure 1. The stopping condition of the procedure is reached whenthe relative difference between χ2(k) in the kth step and the value in theprevious step is lower than 0.005 for at least five consecutive times. Inother words, the final step is reached when the following expression:
χ χχ− <
−0.005
k k
k
2( ) 2( 1)
2( )(11)
is verified for five consecutive iterations.
3. RESULTS3.1. Convergence and Optimized Kinetic Parameters.
With the selected data set and the initialization assumptions, 12iterations were sufficient to match the stopping criteriondescribed above. The convergence results are shown in Figure2. The overall chi-squared curve (sum of the chi-squared
functions of all the biomasses inside the data set) variesstrongly in the first four iterations and then levels to anasymptotic value. No oscillation around this value is observed.In the same figure, also the variations of the exponential
factor E for the four components are plotted against thenumber of iterations. The largest variations with respect to theinitial assumptions are experienced by cellulose and extractives.All the parameters tend to a substantial constant value in the
Figure 2. Evolution of the exponential factor for the decomposition ofthe four biocomponents and the overall chi-squared function(extended to all biomasses in the data set) during the iterations ofthe optimization procedure.
Energy & Fuels Article
dx.doi.org/10.1021/ef402139v | Energy Fuels 2014, 28, 614−623616

last iterations. A similar trend is observed for the pre-exponential factor A (plot not reported here).The exponential factor for the cellulose was 155 MJ/kmol,
which is relatively low with respect to common values found inliterature works (based on separated components): Antal etal.21 noted a range of activation energy between 210 and 250MJ/kmol for decoupled tests (that is, sample and instrumentthermocouples are not coupled), although similar values arefound by Milosavljevic and Suuberg22 that recognized a rangebetween 128 and 160 MJ/kmol and recommended a value of140 MJ/kmol for relatively high temperature (>600 K) andheating rate (>10 K/min) runs. The same Antal et al.21 noted arange between 135 and 210 MJ/kmol for gas coupled tests. Theexponential factor for the hemicellulose was 105 MJ/kmol,which is within the common values found in literature works:Di Blasi10 indicated a range of values between 80 and 116 MJ/kmol. The exponential factor for extractives was 90 MJ/kmol,which is within the range indicated for the hemicellulose to
which they are often joined. Finally, the exponential factor forthe lignin was 32 MJ/kmol, which is within the common rangesfound in literature works: Di Blasi10 indicated a range of valuesbetween 18 and 65 MJ/kmol, while Varhegyi et al.23 reported arelatively higher range (34−65 MJ/kmol).
3.2. Optimized Chemical Composition of Biomasses.The results of the chemical composition (daf basis) obtained atthe end of the optimization procedure are given in Table 1. Theaverage difference ave Da between the experimental data αexpand the prediction of the model αmod is also listed in the table.For the ith biomass it is defined as
α α=
∑ | − |
Nave Da
N
i
exp modi
(12)
This parameter quantifies the adequacy of the fittingprocedure, as the higher the value of ave Da, the lower theaccuracy of the model prediction. It represents the averagediscrepancy that can be expected when predicting the
Table 1. Chemical Composition (daf basis) Obtained with the Optimization Procedure for the Biomasses Inside the Data Setand Average Discrepancy Ave Da between Predicted and Experimental Weight Loss Data
biomass part/notes cellulose hemicellulose extractives lignin ave Da
minimum value 0.282 0.057 0 0.158 0.00366mean value 0.452 0.187 0.043 0.318 0.00755maximum value 0.588 0.279 0.272 0.57 0.01407Arundo donax leaves 0.376 0.138 0.067 0.419 0.00945Arundo donax stems 0.407 0.196 0.111 0.287 0.00600beech wood 0.541 0.247 0.052 0.16 0.00366carthamus stems 0.474 0.133 0 0.393 0.01234carthamus husks 0.373 0.206 0 0.421 0.01086lignin from steam explosion 0.418 0.057 0.111 0.414 0.00791linum stems 0.541 0.108 0 0.351 0.01234linum husks 0.399 0.08 0 0.522 0.01407miscanthus 0.555 0.241 0.034 0.169 0.00462miscanthus flowers 0.433 0.279 0.013 0.276 0.00520miscanthus leaves 0.429 0.217 0.016 0.337 0.00805miscanthus stems 0.508 0.21 0.028 0.254 0.00387olive cake A 0.382 0.219 0 0.399 0.00840olive cake B 0.406 0.225 0.001 0.369 0.00837olive cake C 0.405 0.21 0 0.385 0.00896olive cake D 0.441 0.192 0.01 0.357 0.00817olive cake E 0.341 0.168 0.054 0.436 0.00884pine wood 0.465 0.241 0.043 0.251 0.00562pine shells 0.509 0.187 0.041 0.262 0.00459poplar biennal 0.449 0.215 0.121 0.216 0.00618poplar triennal 0.471 0.235 0.094 0.2 0.00522poplar leaves 0.282 0.13 0.018 0.57 0.01320poplar stems 0.439 0.173 0.067 0.321 0.00553rice husks A 0.455 0.247 0.01 0.287 0.00391rice husks B 0.529 0.235 0 0.235 0.00393rice husks C 0.569 0.176 0 0.254 0.00444sorghum leaves 0.466 0.164 0.006 0.364 0.00647sorghum stems 0.342 0.089 0.272 0.297 0.00574sunflower seeds cake A 0.444 0.177 0.055 0.325 0.01330sunflower seeds cake B 0.456 0.164 0.051 0.329 0.01358sunflower seeds cake C 0.447 0.188 0.051 0.314 0.01185vitis stems 0.415 0.208 0.023 0.354 0.00668wheat straw 0.588 0.148 0 0.265 0.00760wood pellet A 0.457 0.224 0.034 0.284 0.00545wood pellet B 0.495 0.115 0.096 0.294 0.00679wood pellet C 0.543 0.266 0.033 0.158 0.00410wood pellet D 0.466 0.222 0.068 0.244 0.00409
Energy & Fuels Article
dx.doi.org/10.1021/ef402139v | Energy Fuels 2014, 28, 614−623617

normalized weight loss for a specific biomass. A maximumdiscrepancy of 1.4% can be observed for linum husks, while themaximum accuracy is for beech wood (an average discrepancyof only 0.37% can be observed). The average discrepancy is lessthan 0.8%, which is a good fit for the biomasses in the selecteddata set and the temperature range considered.As an example, the experimental dtg curve of a biomass, the
predicted dtg curve, and the subpeaks of the fourbiocomponents (each one weighted for the respective chemicalfraction) are superimposed in Figure 3 for the case ofmiscanthus. A good agreement for the dtg curves and a gooddeconvolution of the subpeaks can be observed. Similar graphscan be plotted for all the biomasses in the selected data set. It isworth noting that the kinetic parameters of the biocomponentsare the same in all the cases.For the same material, the experimental weight loss curve
and that predicted by the model are compared, as observable inFigure 4. The agreement between the model predictions andthe experimental data is good for the specific case as well as theother biomasses of the data set. In the same figure, the weightloss curves of the biocomponents are also superimposed toappreciate the devolatilization behavior of the differentfractions. The typical temperature range of decompositionand the different reactivity of the components can becompared. As stated by Di Blasi10 in her review, for heatingrates at sufficiently slow temperatures, the cellulose decom-
poses at 598−648 K (in the present work, the temperaturerange is 567−644 K), hemicellulose decomposes at 498−598 K(here 517−597 K), and lignin decomposes gradually over therange 523−773 K (here from 470 to 926 K). Therefore, a goodagreement is found for the decomposition temperatures ofcellulose and hemicellulose. As for the lignin, there is somediscordance, although wider ranges of decomposition temper-ature can be found in the literature: Orfao et al.5 observed apyrolysis range for the lignin almost up to 1170 K.As for the chemical fractions, significant differences can be
observed for various parts of the same plant (see, for instance,the different parts of miscanthus), for the same biomass ofdifferent origins (see, for instance, the different samples of olivecakes) or preparations (see, for instance, the different samplesof wood pellets). The minimum, mean, and maximum valuesfor the four biocomponents in the data set are also listed inTable 1. A common value around 27% is the maximum valuepredicted for both the hemicellulose and extractives of thebiomasses inside the selected data set. The results arereasonable, although higher values can be found in theliterature for these two components. Maximum values up to59% and 57% for the cellulose and lignin fractions, respectively,are obtained. Such high values for these fractions can be indeedfound in literature works. However, a possible superimpositionof two close dtg subpeaks could have made the deconvolutionprocedure difficult. For instance, common values of wheat
Figure 3. Comparison of the predicted and experimental dtg curves, superimposition of dtg curves of biocomponents with the optimizedcomposition of mischantus (20 K/min).
Figure 4. Comparison of the predicted and experimental normalized weight loss curves for mischantus (20 K/min), superimposition of curves ofbiocomponents decomposition.
Energy & Fuels Article
dx.doi.org/10.1021/ef402139v | Energy Fuels 2014, 28, 614−623618

straw24 are in the range 32−44% for cellulose and 22−32% forhemicellulose, while those found here are 58.8 and 14.8%,respectively. The single fractions disagree, although their sum(73.6%) is in line with mean values found in the literature(around 74%). The results of traditional analysis for theselected biomasses are not available in the TG biomassdevodatabase, so a direct comparison with the chemical compositionobtained in this work is not possible. However, the chemicalcomposition of similar biomasses can be found in literatureworks, and these values will be compared with those predictedby the model. This will give also an idea of the range of valuesthat can be expected for the chemical composition of a specificbiomass (see more exhaustive case studies in ref 9 for differentvarieties of the same biomass). It is worth noting that(i) The comparison is only indicative as the samples are not
the same, and divergences due to the different origin,composition, and ash content are unavoidable.(ii) The chemical analysis is affected by experimental errors
that depend on the method used, as mentioned in theintroduction.(iii) The balance from the traditional chemical analysis may
close with a large discrepancy (sum of CHEL fractions of 80−90% or less) due to loss of material, uncertainties, and presenceof ash, and it is not appropriate to normalize the results orascribe the complement to one fraction or another.(iv) Differences between the results of the traditional analysis
and the procedure developed here to find the chemicalcomposition of biomasses may derive from the fact that thislatter does not require the separation of the components so thatthey are analyzed in the original form they are in the virginbiomass, while they are separated and in some cases alsomodified during the traditional analysis.(v) Interconnections between the biopolymers and inter-
actions among them during the decomposition are accountedfor only if no separation is operated.Some representative examples are given in Table 2, where
the results obtained for some biomasses inside the selected dataset and the chemical composition of similar biomasses found inthe literature are compared. It is worth noting that if zero isindicated for the fraction of extractives, it is likely that they arenot analyzed in that work. The note * means that the balancedoes not close; that is, the sum of CHEL is less than 98%.
Many data are taken from the Phyllis2 database for biomass andwaste by ECN.24
The first material considered is poplar wood. Excludingleaves, the mean composition of poplar wood samples studiedhere is in good agreement with the first reference, but on theextractives. The second reference is quite in line with the resultsobtained here if the fractions of hemicellulose and extractivesare added.The second example is for beech wood. In this case, the
cellulose fraction predicted by the model is higher, and thelignin one is lower than those found in the two referencesshown in Table 2. As for miscanthus, the cellulose fractionpredicted by the model is overpredicted by the model, while thelignin is quite lower compared to those found in the literaturewith traditional analysis. The chemical composition of Arundodonax is in line with those found in the literature25 for thecellulose and the sum (hemicellulose + extractives), while aremarked difference can be seen for the lignin.The average composition of rice husk samples found here
differs significantly from those shown in Table 2. This maydepends on the variety of these residues, as also Mansaray etal.26 found wide ranges of cellulose (34−43% daf), hemi-cellulose (24−26%), and lignin (30−42%). In all the casesabove, the balances are very low (70−75%), so only aqualitative agreement with the model predictions can be seen.Finally, the average composition of olive cake samples
obtained here is quite in line with the first reference, althoughthe balance is only at 77%, while the comparison with the othertwo references gives a lower fraction of cellulose.
4. APPLICATION OF THE CHEL PROCEDURE TOFURTHER DATA
The optimization procedure developed in the previous sectiongave the chemical composition of the biomasses andgeneralized kinetic parameters for the devolatilization of theCHEL biocomponents. The application of the procedure wasgood for all the biomasses in the selected data set, as seenabove. The aim of this section is to extend the procedure tofurther data and verify the adequacy of the fit. In particular, thedata of interest are
Table 2. Comparison of the Chemical Composition Predicted by the Model and Those Found in Literature for SimilarBiomassesa
model predictions literature results
fuel C H E L C H E L note/ref
poplar wood 0.45 0.21 0.094 0.25 0.455 0.19 0 0.25 * 240.48 0.3 0 0.22 24
beech wood 0.54 0.25 0.05 0.16 0.49 0.22 0 0.24 * 240.48 0.28 0 0.24 24
miscanthus 0.555 0.241 0.034 0.169 0.441 0.178 0.032 0.216 * 240.45 0.3 0 0.21 * 24
Arundo donax 0.407 0.196 0.111 0.287 0.438 0.274 0.065 0.168 * 25rice husks 0.52 0.22 0.003 0.26 0.313 0.243 0 0.143 * 24
0.361 0.197 0 0.194 * 240.339 0.165 0 0.214 * 24
olive cake 0.395 0.203 0.013 0.389 0.284 0.203 0 0.281 * 240.24 0.236 0 0.484 * 240.22 0.21 0 0.45 * 24
aThe note * indicates that the sum of components is less than 98%.
Energy & Fuels Article
dx.doi.org/10.1021/ef402139v | Energy Fuels 2014, 28, 614−623619

(1) Same biomasses of the data set tested under differentthermal programs: in this case, the same composition obtainedin the previous section is adopted.(2) “New” materials or materials tested in different
instruments: in this case, the generalized kinetic parametersobtained in the previous section are adopted to find thechemical composition of these materials by minimizing themean difference between experimental and model results.(3) Data from literature works: also in this case, the
generalized kinetic parameters are adopted to find the chemicalcomposition of these materials by minimizing the meandifference between experimental and model results.4.1. Application of the Procedure to Different
Thermal Programs. The TG biomassdevo database containsfurther data on some biomasses included in the selected dataset but tested under different heating rates. The CHELprocedure is applied to these data by adopting the generalizedkinetic parameters of the biocomponents and the respectivechemical fractions obtained in the previous section, and simplychanging the value of β in the kinetic expression (eq 4). Thecomparison of TG and dtg curves obtained with the model andthe experimental ones can be observed in Figure 5 for the caseof beech wood devolatilized under 10 and 40 K/min. A goodagreement can be observed in the entire range of temperaturesexcept for the last interval at high temperature (correspondingto the devolatilization of lignin). The average discrepancy aveDa for the results under 10 K/min is 0.0138, and the one under40 K/min is 0.0266. The value of ave Da in the reference case(20 K/min used in the optimization procedure) was 0.0037,and thus a worsening of the performance can be noted,although the fit can be considered good.Similar results can be found for other materials tested under
different heating rates. For instance, the ave Da value for
miscanthus was 0.0174 for the TG results under 10 K/min,0.0295 for those under 40 K/min, and 0.045 for those under 60K/min, while the accuracy in the reference case (20 K/min)was quite better (ave Da 0.0046).In general, the accuracy in predicting the late stages for
different heating rate tests is weaker with respect to thereference case. Therefore, a better representation of the ligninsubpeak could give a substantial improvement for predictingthe devolatilization in the entire temperature range. Also theintroduction of secondary reactions could be useful forsimulating the late stage of devolatilization.
4.2. Application of the Procedure to New Materials.Among the “homemade” experimental data available, twomaterials not included in the selected data set were testedunder the same thermal program (20 K/min) but in a differentTG balance (Netzsch STA 409/C). So, to apply theoptimization procedure it is necessary to define the chemicalcomposition by adopting the kinetic parameters obtained fromthe previous section and minimizing the χ2 of each biomass tofind the relative fractions. In the first case of hazelnut shells, thechemical composition (daf basis) obtained is 0.416 cellulose,0.283 hemicellulose, 0.031 extractives, and 0.269 lignin. Thecomparison of the weight loss and its derivative curves for themodel prediction and the experimental data is shown in Figure6a. The agreement is good, with a discrepancy ave Da 0.010 onthe weight loss, although a visible difference can be observed inthe subpeaks of hemicellulose and cellulose that are likely tobalance each other.In the second case, the residue of the cacao production is
considered. The dtg curve is peculiar with three close relativemaxima (see Figure 6b). The absolute maximum of the dtgtakes place at a relatively low temperature corresponding to thedecomposition of extractives and not to the decomposition of
Figure 5. Comparison of the CHEL model predictions and experimental data for beech wood (biomass inside the data set) under different heatingrates: (a) normalized weight loss and (b) dtg curves.
Figure 6. Comparison of normalized weight loss (thin dotted black curve) and dtg (thin dotted gray curve) predicted by the CHEL model and theexperimental weight loss (thick black curve) and dtg (thick gray curve) for (a) hazelnut shells and (b) cacao shells (biomasses not included in thedata set).
Energy & Fuels Article
dx.doi.org/10.1021/ef402139v | Energy Fuels 2014, 28, 614−623620

cellulose, as occurred in all the biomasses studied so far. Thisoccurrence can make the optimization procedure lessautomatic, as the translation of the dtg curve for theoptimization should be done with the right term, which is
referring to the cellulose subpeak. The chemical composition(daf basis) obtained is 0.153 cellulose, 0.145 hemicellulose,0.132 extractives, and 0.570 lignin. Although the large fractionof the extractives makes the devolatilization start early, with a
Figure 7. (a−f) Comparison of normalized weight loss (thin dotted black curves) and dtg (thin dotted gray curves) predicted by the CHEL modeland the experimental normalized weight loss (thick black curves) and dtg (thick gray curves) for different biomasses studied in literature works.
Energy & Fuels Article
dx.doi.org/10.1021/ef402139v | Energy Fuels 2014, 28, 614−623621
significant discrepancy in the initial temperatures, the maindevolatilization step is well predicted. The largest discrepancy isactually at a high temperature, that is, during the decompositionof lignin: this could be attributed to experimental errors orsecondary reactions as the experimental dtg curve does not endasymptotically to the axis. Globally, the fit is quite good with anaverage discrepancy ave Da 0.027.4.3. Application of the Procedure to Literature Data.
Among the numerous data found in literature works, someexamples have been selected to verify the applicability of theoptimization procedure. The selected papers provide sufficientinformation on the thermal profile used during the devolatiliza-tion test (initial and final temperatures, heating rate, carriergas), data or plots of both the TG and dtg as functions of timeor temperature, composition of the biomass, especially tonormalize the raw data.A precious source of reliable data was found in the work by
Gaur and Reed,27 where a lot of uniform TG tests are reportedfor a variety of biomasses. In all the tests, the heating rate was10 K/min. It is interesting to apply the CHEL procedure tosome biomasses that have different origins with respect to thoseincluded in the selected data set, based essentially on biomassesfound on a regional area. As in the previous point, the methodis applied by translating opportunely the dtg data, adopting thekinetic parameters of section 3.1 and thus minimizing the χ2 ofeach biomass to find the chemical composition. The fit isgenerally good: some examples are shown in the first plots ofFigure 7a−d, where the predicted and experimental curves arecompared.Also some biomass materials studied by Raveendran et al.4
are considered for comparison. In these tests, the heating ratewas 50 K/min. Two examples are shown in Figure 7e,f, wherethe model and experimental curves are compared. Theagreement is good for rice straw (ave Da 0.013), with asignificant divergence in the late stage of the devolatilization,that is, for temperatures above 670 K. The agreement is lessgood for coir pith (ave Da 0.026) with a more evidentdiscrepancy in the same temperature range.Finally, the TG tests under 10 K/min for two biomasses
studied by Li et al.28 are also considered for comparison. Themethod is applied with a good agreement between model andexperimental data, as shown in Figure 7g,h. In both cases, anundervaluation of the lignin decomposition can be observed,thus giving some discrepancy at high temperature. Globally, theaccuracy is good, with values of ave Da around 0.015. In thatwork, the results of the traditional chemical analysis are alsoprovided. The agreement is good for lignin and extractives,while remarked differences can be observed for the first two
components: for instance, the chemical composition of legumestraw obtained by the authors was CHEL = 0.28, 0.34, 0.02,0.34, while that obtained with the procedure developed here isCHEL = 0.45, 0.16, 0.0, 0.38. The comparison is good only ifthe holocellulose fraction is considered. Similar conclusionsderives from the second biomass tested by Li et al.28
5. DISCUSSION AND CONCLUSIONS
An optimization procedure was developed starting from theexperimental data of TG devolatilization tests performed underuniform conditions (same instrument, same thermal program)on 37 biomasses valuable as energy sources in the Italian regionof Tuscany. The procedure gave the kinetic parameters of thefour CHEL (cellulose, hemicellulose, extractives, lignin)biocomponents and the chemical composition. The agreementof model predictions and experimental data was accurate for allthe biomasses inside the selected data set, with an averagediscrepancy around 0.8%.The CHEL procedure was used also for tests under different
thermal programs (with heating rates in the range 10−60 K/min) and biomasses outside the selected data set (otherhomemade materials as well as literature works). In general, theagreement with “external” data is good under the followingspecifications:(i) The late stage in devolatilization is sometimes predicted
with a scarce accuracy, and this can be due to secondaryreactions (not accounted for in the model), effect of ash at hightemperature (not quantified in the model), or the extremecomplexity of lignin in specific biomasses. The introduction ofmore complex kinetic models (for instance, consecutivereactions) or the inclusion of a further component (forinstance two kinds of lignins) could give a more accurateprediction, though the complexity of the procedure wouldincrease.(ii) It is possible that some compensation effects could have
played a role during the optimization procedure that was basedon data obtained under the same thermal program, althoughthe data set was formed of a lot of different tests. The approachcould be repeated with minor modification to the optimizationprocedure, by including also the data of biomasses studiedunder different thermal programs. This was not done herebecause these data at present do not cover a sufficient widerange of biomasses.(iii) Although some agreements have been verified, the
results for the chemical composition obtained with the CHELprocedure may differ from that obtained with the traditionalseparation treatments. This is plausible if one considers that theapproaches are different. As said above, the separation
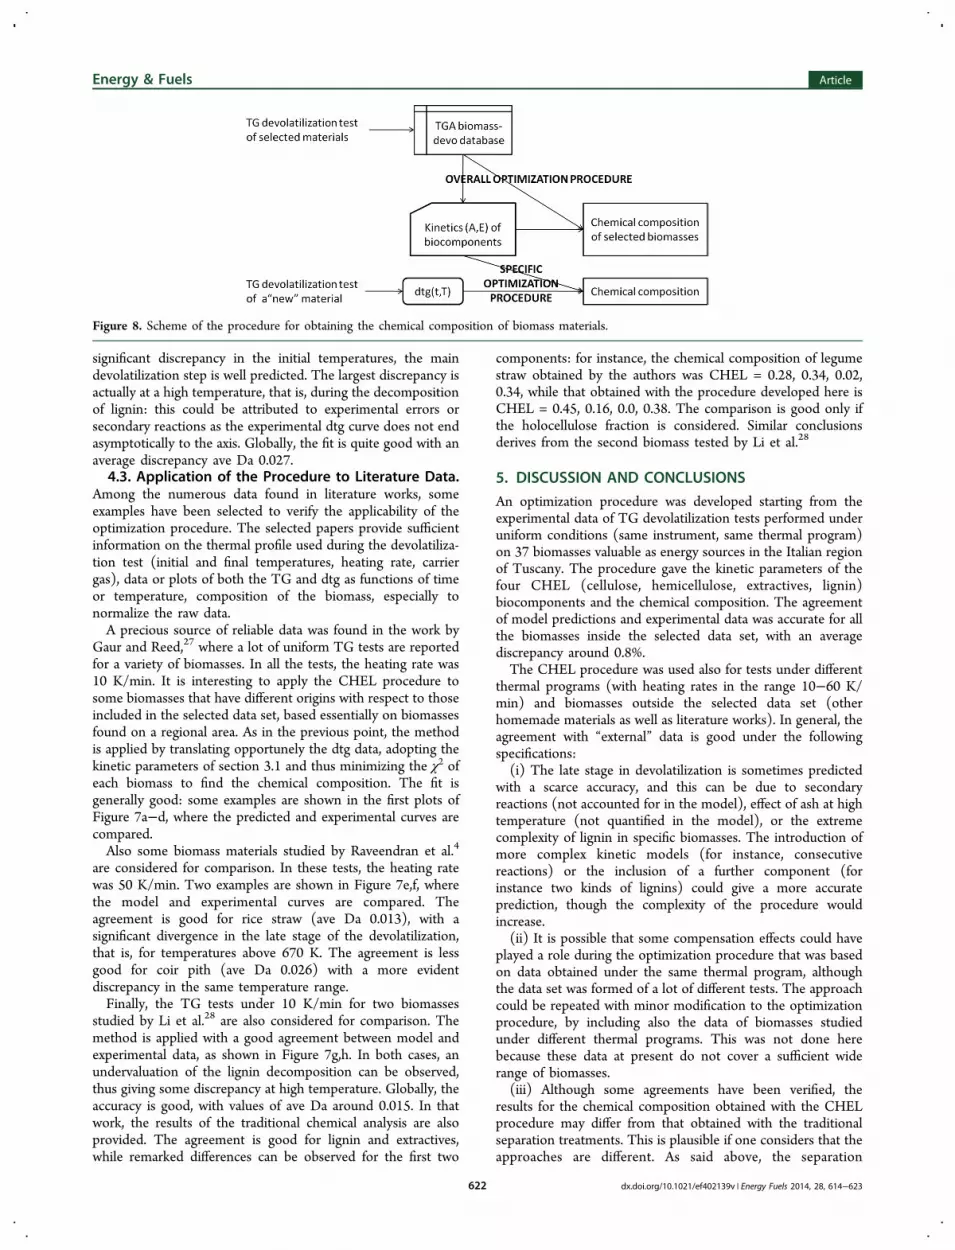
Figure 8. Scheme of the procedure for obtaining the chemical composition of biomass materials.
Energy & Fuels Article
dx.doi.org/10.1021/ef402139v | Energy Fuels 2014, 28, 614−623622

procedures or those based on synthetic components can bescarcely reproducible, give incomplete balance closure, modifythe structure and reactivity of the components, and do notconsider the effect of ash and interactions of components. Theadequacy of the procedure developed in this work and based onthe four biocomponents (avoiding the above-mentionedlimitations) was evidenced in the examples shown above andis proposed as a valid alternative to the traditional chemicalanalysis.Indeed, the set of kinetic parameters (that are within the
ranges of values obtained in the literature for the activationenergy of synthesized or separated components) for the fourbiocomponents and the optimization procedure developed inthis work can be used for obtaining the chemical compositionof any new material (Figure 8). The overall optimizationprocedure is described in this work and gives the couples of (E,A) for the four biocomponents. These parameters can be usedin the specific optimization procedure to determine thechemical composition of a “new” material. It is necessary toprovide only the derivative weight loss curve from a TGdevolatilization run, instead of complex and onerous treatmentsto separate the chemical fractions according to the traditionalchemical analysis. The chemical fractions can be obtained byminimizing the chi-squared function, which compares themodel and experimental dtg points in the entire temperaturerange, according to the steps described in section 4.
■ AUTHOR INFORMATIONCorresponding Author*E-mail: [email protected] authors declare no competing financial interest.
■ ACKNOWLEDGMENTSThis work was funded by the Project “BPT - BioPower inTuscany”, POR CREO FESR 2007/2013 − Bando Unico R&S− Anno 2012 − Regione Toscana.
■ REFERENCES(1) Ward, S. M.; Braslaw, J. Experimental weight loss kinetics ofwood pyrolysis under vacuum. Combust. Flame 1985, 61, 261−269.(2) Koufopanos, C. A.; Lucchesi, A.; Maschio, G. Kinetic modeling ofthe pyrolysis of biomass and biomass components. Can. J. Chem. Eng.1989, 67, 75−84.(3) Bilbao, R.; Millera, A.; Arauzo, J. Thermal decomposition oflignocellulosic materials: influence of the chimica composition.Thermochim. Acta 1989, 143, 149−159.(4) Raveendran, K.; Ganesh, A.; Khilar, K. C. Pyrolysis characteristicsof biomass and biomass components. Fuel 1996, 75, 987−998.(5) Orfao, J. J. M.; Antunes, F. J. A.; Figueiredo, J. L. Pyrolysiskinetics of lignocellulosic materials − three independent reactionsmodel. Fuel 1999, 78, 349−358.(6) Cozzani, V.; Lucchesi, A.; Stoppato, G.; Maschio, G. A newmethod to determine the composition of biomass by thermogravi-metric analysis. Can. J. Chem. Eng. 1997, 75, 127−133.(7) Singh, K.; Risse, M.; Das, K. C.; Worley, J. Determination ofcomposition of cellulose and lignin mixtures using thermogravimetricanalysis. J. Energy Resour. Technol. 2009, 131 (022201), 1−6.(8) Burnham, A. K.; Braun, R. L. Global kinetic analysis of complexmaterials. Energy Fuels 1999, 13, 1−22.(9) White, J. E.; Catallo, W. J.; Legendre, B. L. Biomass pyrolysiskinetics: A Comparative critical review with relevant agriculturalresidue case studies. J. Anal. Appl. Pyrolysis 2011, 91, 1−33.(10) Di Blasi, C. Modeling chemical and physical processes of woodand biomass pyrolysis. Prog. Energy Combust. Sci. 2008, 34, 47−90.
(11) Van Soest, P. J.; Wine, R. H. Use of detergents in the analysis offibrous feeds. J. Assoc. Off. Anal. Chem. 1967, 50, 50−55.(12) Jung, H. G.; Mertens, D. R.; Payne, A. J. Correlation of aciddetergent lignin and klason lignin with digestibility of forage drymatter and neutral detergent fiber. J. Dairy Sci. 1997, 80, 1622−1628.(13) Yang, H.; Yan, R.; Chen, H.; et al. In-depth investigation ofbiomass pyrolysis based on three major components: hemicellulose,cellulose and lignin. Energy Fuels 2006, 20, 388−393.(14) Asmadi, M.; Kawamoto, H.; Saka, S. Gas- and solid/liquid-phasereactions during pyrolysis of softwood and hardwood lignins. J. Anal.Appl. Pyrolysis 2011, 92, 417−425.(15) Gronli, M. G.; Varhegyi, G.; Di Blasi, C. Thermogravimetricanalysis and devolatilization kinetics of wood. Ind. Eng. Chem. Res.2002, 41, 4201−4208.(16) Evans, R. J.; Milne, T. A. Molecular characterization of thepyrolysis of biomass. 1. Fundam., Energy Fuels 1987, 1, 123−137.(17) Williams, P. T.; Horne, P. A. The role of metal salts in thepyrolysis of biomass. Renewable Energy 1994, 4, 1−13.(18) Jensen, A.; Dam-Johansen, K.; Wojtowicz, M. A.; Serio, M. A.TG-FTIR study of the influence of potassium chloride on wheat strawpyrolysis. Energy Fuels 1998, 12, 929−938.(19) Biagini, E.; Guerrini, L.; Nicolella, C. Development of a variableactivation Energy model for biomass devolatilization. Energy Fuels2009, 23, 3300−3306.(20) Coats, A. W.; Redfern, J. P. Kinetic parameters fromthermogravimetric data. Nature 1964, 201, 68−69.(21) Antal, M. J.; Friedman, H. L.; Rogers, F. E. Kinetics of cellulosepyrolysis in nitrogen and steam. Combust. Sci. Technol. 1980, 21, 141−152.(22) Milosavljevic, I.; Suuberg, E. M. Cellulose thermal decom-position kinetics: global mass loss kinetics. Ind. Eng. Chem. Res. 1995,34, 1081−1091.(23) Varhegyi, G.; Antal, M. J.; Jakab, E.; Szabo, P. Kinetic modelingof biomass pyrolysis. J. Anal. Appl. Pyrolysis 1997, 42, 73−87.(24) Phyllis2, database for biomass and waste; http://www.ecn.nl/phyllis2, Energy research Center of the Netherlands, last accessed 30thJuly 2013.(25) Neto, C. P.; Seca, A.; Nunes, A. M.; et al. Variations in chemicalcomposition and structure of macromolecular components in differentmorphological regions and maturity stages of Arundo donax. Ind.Crops Products 1997, 6, 51−58.(26) Mansaray, K. G.; Ghaly, A. E. Thermal degradation of rice husksin nitrogen atmosphere. Bioresour. Technol. 1998, 65, 13−20.(27) Gaur, S.; Reed, T. B. Thermal Data for Natural and SyntheticFuels; Marcel Dekker: New York, 1998.(28) Li, S.; Xu, S.; Liu, S.; et al. Fast pyrolysis of biomass in free-fallreactor for hydrogen-rich gas. Fuel Process. Technol. 2004, 85, 1201−1211.
Energy & Fuels Article
dx.doi.org/10.1021/ef402139v | Energy Fuels 2014, 28, 614−623623
Related Documents