Int. J. Information and Decision Sciences, Vol. 5, No. 4, 2013 331 Copyright © 2013 Inderscience Enterprises Ltd. A fuzzy-QFD approach to balanced scorecard using an analytic network process Madjid Tavana* Business Systems and Analytics, Lindback Distinguished Chair of Information Systems and Decision Sciences, La Salle University, Philadelphia, PA 19141, USA E-mail: [email protected] *Corresponding author Nasim Mousavi and Sina Golara Department of Industrial Engineering, KNT University of Technology, Tehran, 14658 Iran E-mail: [email protected] E-mail: [email protected] Abstract: The balanced scorecard (BSC) is a strategic management method that links performance measurement to vision and strategies using a multidimensional set of financial and non-financial performance metrics. Although several studies have combined the BSC method with multi-criteria decision analysis methodologies, most of the research efforts do not consider the essentials of strategic and performance management in a systematic and holistic framework capable of handling imprecision and vagueness. The purpose of this study is to present a novel approach for structuring and prioritising the performance measures in the BSC method. The contribution of the proposed approach is fivefold: 1) we use the quality function deployment (QFD) technique to create a linkage between the BSC perspectives; 2) we use the analytic network process (ANP) technique to consider the interactions between the performance measures in each BSC perspective; 3) we integrate the QFD and the ANP techniques to help decision makers understand the relations between the performance measures in different perspectives and the correlations among the performance measures in the same perspective; 4) we handle the vagueness and ambiguity in decision makers’ judgements with the fuzzy set theory; 5) we present a case study to demonstrate the applicability of the proposed approach and exhibit the efficacy of the procedures. Keywords: balanced scorecard; BSC; quality function deployment; QFD; analytic network process; ANP; fuzzy sets theory. Reference to this paper should be made as follows: Tavana, M., Mousavi, N. and Golara, S. (2013) ‘A fuzzy-QFD approach to balanced scorecard using an analytic network process’, Int. J. Information and Decision Sciences, Vol. 5, No. 4, pp.331–363.

Welcome message from author
This document is posted to help you gain knowledge. Please leave a comment to let me know what you think about it! Share it to your friends and learn new things together.
Transcript
Int. J. Information and Decision Sciences, Vol. 5, No. 4, 2013 331
Copyright © 2013 Inderscience Enterprises Ltd.
A fuzzy-QFD approach to balanced scorecard using an analytic network process
Madjid Tavana* Business Systems and Analytics, Lindback Distinguished Chair of Information Systems and Decision Sciences, La Salle University, Philadelphia, PA 19141, USA E-mail: [email protected] *Corresponding author
Nasim Mousavi and Sina Golara Department of Industrial Engineering, KNT University of Technology, Tehran, 14658 Iran E-mail: [email protected] E-mail: [email protected]
Abstract: The balanced scorecard (BSC) is a strategic management method that links performance measurement to vision and strategies using a multidimensional set of financial and non-financial performance metrics. Although several studies have combined the BSC method with multi-criteria decision analysis methodologies, most of the research efforts do not consider the essentials of strategic and performance management in a systematic and holistic framework capable of handling imprecision and vagueness. The purpose of this study is to present a novel approach for structuring and prioritising the performance measures in the BSC method. The contribution of the proposed approach is fivefold: 1) we use the quality function deployment (QFD) technique to create a linkage between the BSC perspectives; 2) we use the analytic network process (ANP) technique to consider the interactions between the performance measures in each BSC perspective; 3) we integrate the QFD and the ANP techniques to help decision makers understand the relations between the performance measures in different perspectives and the correlations among the performance measures in the same perspective; 4) we handle the vagueness and ambiguity in decision makers’ judgements with the fuzzy set theory; 5) we present a case study to demonstrate the applicability of the proposed approach and exhibit the efficacy of the procedures.
Keywords: balanced scorecard; BSC; quality function deployment; QFD; analytic network process; ANP; fuzzy sets theory.
Reference to this paper should be made as follows: Tavana, M., Mousavi, N. and Golara, S. (2013) ‘A fuzzy-QFD approach to balanced scorecard using an analytic network process’, Int. J. Information and Decision Sciences, Vol. 5, No. 4, pp.331–363.
332 M. Tavana et al.
Biographical notes: Madjid Tavana is a Professor of Business Systems and Analytics and the Lindback Distinguished Chair of Information Systems and Decision Sciences at La Salle University where he served as the Chairman of the Management Department and Director of the Center for Technology and Management. He has been a Distinguished NASA Research Fellow at Kennedy Space Center, Johnson Space Center, Naval Research Laboratory – Stennis Space Center, and Air Force Research Laboratory. He was recently honoured with the prestigious Space Act Award by NASA. He holds an MBA, a PMIS, and a PhD in Management Information Systems and received his Postdoctoral Diploma in Strategic Information Systems from the Wharton School of the University of Pennsylvania. He is the Editor-in-Chief for Decision Analytics, the International Journal of Strategic Decision Sciences, the International Journal of Enterprise Information Systems, and the International Journal of Applied Decision Sciences. He has published over 100 research papers in academic journals such as Decision Sciences, Information Systems, Interfaces, Annals of Operations Research, Omega, Information and Management, Expert Systems with Applications, European Journal of Operational Research, Journal of the Operational Research Society, Computers and Operations Research, Knowledge Management Research and Practice, Computers and Industrial Engineering, Applied Soft Computing, Journal of Advanced Manufacturing Technology, and Advances in Engineering Software, among others.
Nasim Mousavi is a post-graduate Researcher at the KNT University of Technology and a founding member of the Environmental Strategy Research Group at the New Mexico State University – Management Department. She is a graduate of the Industrial Engineering Department at the KNT University of Technology. She is also an active Quality Assurance Consultant in the water and power industry. Her research interests are strategic decision making and sustainable supply chain management, supply network design and optimisation. Her current research is focused on green supply network design and effective decision making models in strategic management.
Sina Golara is a post-graduate Researcher at the KNT University of Technology and a founding member of the Environmental Strategy Research Group at the New Mexico State University – Management Department. He received an MSc in e-Commerce and a BSc in Industrial Engineering from the KNT University of Technology. His research interests are supply chain and operations management, sustainability, decision support systems, and applications of information technology in business. His current research projects are focused on closed-loop supply network design and optimisation, proactive environmental strategy and decision making models in information technology and e-commerce.
1 Introduction
The need for alternative strategic measurement systems has attracted much attention due to the fast-paced business climate and the increased global competition. The balanced scorecard (BSC) is a strategic measurement system that is used extensively in business and industry, government, and non-profit organisations to align business activities with the vision and strategy of the organisation, improve internal and external communications, and monitor organisation performance against strategic goals. When integrated carefully and in a ‘balanced’ manner in a ‘scorecard’, the BSC can provide managers with a comprehensive snapshot of their organisation. The BSC suggests that we
A fuzzy-QFD approach to balanced scorecard using an ANP 333
view the organisation from four perspectives, namely, financial, customer, internal processes, and growth and learning. Determining the contents and weights of a BSC evaluation system constitutes a major challenge in its implementation (Schneiderman, 1999).
Conjoining the quality function deployment (QFD) methodology and the BSC concept produces a systematic and holistic strategic management system with the BSC attributes identified as the ‘Whats’ on the vertical axis, and the major strategies of The Art of Business Management Sun Tzu’s as the ‘Hows’ on the horizontal axis. The ‘Whats’ and the ‘Hows’ in QFD can be translated into the four perspectives under the BSC model. Combining the QFD and BSC help organisations better understand how they can contribute to their business goals. While the BSC method provides the elements within a framework that assesses strategic performance within four generic management perspectives, the analytic network process (ANP) in turn can provide a structure and process to guide the decision maker (DM) in weighing the various criteria and choosing actions intended to achieve the stated objectives. To consider the correlation between the objectives in each perspective of the BSC model, we use the ANP technique to adjust the priorities of the ‘Hows’ in the QFD matrix. Relations between ‘Hows’ and ‘Whats’ in the QFD matrix are measured through expert opinion as linguistic variables which are then transformed into fuzzy triangular numbers in the model. Typically, real evaluation problems are not crisply defined because human judgements are uncertain and vague thus many researchers have adopted the fuzzy approach in QFD to grasp the inherent vagueness in such problems.
We present a novel approach for structuring and prioritising the performance measures in the BSC method. We combine BSC with QFD and fuzzy ANP to consider the interactions between and within the performance measures in each BSC perspective and present a case study to demonstrate the applicability of the proposed approach. This paper is organised as follows: in Section 2, we present the preliminaries of our work, namely the BSC, the QFD, the conjunction of the BSC and the QFD, fuzzy sets, and fuzzy ANP. In Section 3, we present the details of the proposed method. Following this presentation, we illustrate the results from a numerical example in Section 4. In Section 5, we discuss the managerial implications of our model for programme evaluation. We finish the paper with our conclusions and future research directions in Section 6.
2 Preliminaries
2.1 Balanced scorecard
The BSC is a performance measurement framework that adds non-financial measures to traditional financial metrics to give managers and executives a more ‘balanced’ view of the strategic performance of an organisation. The concept measures organisational performance from four perspectives, including financial, customer, internal business process, and learning and growth (Kaplan and Norton, 1992, 1996). The essential principle of the BSC is that standard financial measures must be balanced with non-financial measures (Ballou et al., 2003; Norton et al., 1997; Sinclair and Zairi, 2001). The virtues of BSC lie in its simplicity and generic format for describing the organisational strategies. It is used whenever ideas about causes and effects and/or priorities are to be
334 M. Tavana et al.
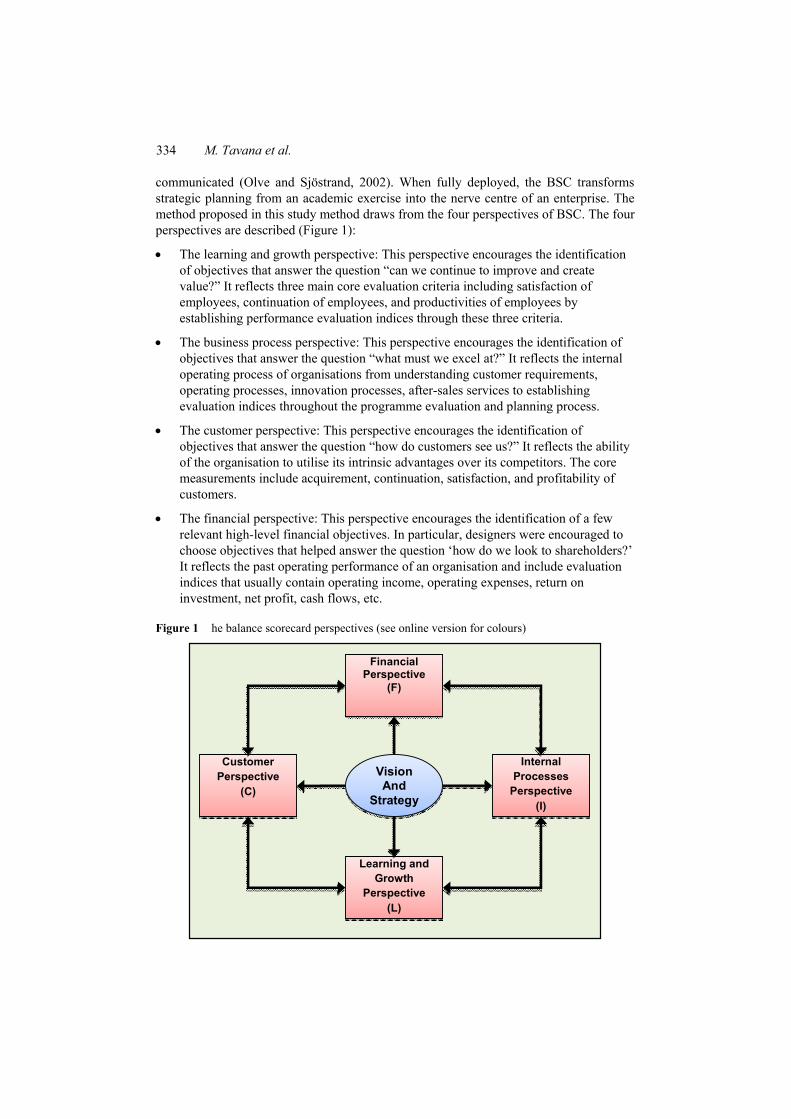
communicated (Olve and Sjöstrand, 2002). When fully deployed, the BSC transforms strategic planning from an academic exercise into the nerve centre of an enterprise. The method proposed in this study method draws from the four perspectives of BSC. The four perspectives are described (Figure 1):
• The learning and growth perspective: This perspective encourages the identification of objectives that answer the question “can we continue to improve and create value?” It reflects three main core evaluation criteria including satisfaction of employees, continuation of employees, and productivities of employees by establishing performance evaluation indices through these three criteria.
• The business process perspective: This perspective encourages the identification of objectives that answer the question “what must we excel at?” It reflects the internal operating process of organisations from understanding customer requirements, operating processes, innovation processes, after-sales services to establishing evaluation indices throughout the programme evaluation and planning process.
• The customer perspective: This perspective encourages the identification of objectives that answer the question “how do customers see us?” It reflects the ability of the organisation to utilise its intrinsic advantages over its competitors. The core measurements include acquirement, continuation, satisfaction, and profitability of customers.
• The financial perspective: This perspective encourages the identification of a few relevant high-level financial objectives. In particular, designers were encouraged to choose objectives that helped answer the question ‘how do we look to shareholders?’ It reflects the past operating performance of an organisation and include evaluation indices that usually contain operating income, operating expenses, return on investment, net profit, cash flows, etc.
Figure 1 he balance scorecard perspectives (see online version for colours)
Financial
Perspective (F)
Internal Processes
Perspective (I)
Customer Perspective
(C)
Learning and Growth
Perspective (L)
Vision And
Strategy
A fuzzy-QFD approach to balanced scorecard using an ANP 335
The BSC is a popular tool used by many organisations to enhance their performance system with non-financial metrics (Frigo et al., 2000; Fu and Yang, 2012; Kim and Davidson, 2004; Kuo and Chen, 2008; Leung et al., 2006; Said et al., 2003). Sandstrom and Toivanen (2002) connected product development and design to the management system and used the BSC concepts and advanced cost accounting techniques for analysing performance. Davis and Albright (2004) investigated whether bank branches implementing the BSC outperform bank branches not implementing the BSC within the same banking organisation on key financial measures. They found evidence of superior financial performance for branches implementing the BSC when compared to non-BSC implementing branches. Banker et al. (2000) used time-series data in the hospitality industry to study the impact of non-financial measures on the performance of the firms. Their results indicated that non-financial measures of customer satisfaction are significantly associated with future financial performance and contain additional information that is not reflected in the past financial measures. Banker et al. (2004) further implemented performance metrics of the BSC and investigated the best practice frontier relationship between a financial performance metric and three non-financial performance metrics used in the US telecommunications industry. Michalska (2005) introduced the construction and implementation of the BSC in a firm and estimated the effectiveness of specific technological processes. Eilat et al. (2008) presented a multi-criteria approach for evaluating research and development projects in different stages of their life cycle by integrating the BSC with data envelopment analysis.
Bhagwat and Sharma (2007) developed a BSC for supply chain management that evaluated the day-to-day business operations from the four perspectives of BSC. McPhail et al. (2008) conducted a study in the hospitality industry to examine the extent to which performance measures, that align with the ‘learning and growth’ dimension of BSC, are applied in the hotel industry. Their findings suggested a significant schism between BSC theory and the application of human resources-oriented measures in the hospitality industry. Valderrama et al. (2009) proposed a framework for the analysis of the relationships between the four perspectives of the BSC by employing DEA. Cebeci (2009) presented a model for selecting a suitable enterprise resource planning system in the textile industry by evaluating the strategies of the organisation with BSC. Wong et al. (2009) used BSC to develop an optimisation approach for design management. Wu et al. (2009) used BSC and fuzzy AHP with three other multi-criteria decision analysis tools for banking performance evaluation. Bobillo et al. (2009) proposed a generic framework for BSC with semantic fuzzy expert systems. Wiersma (2009) examined the purposes for which managers use the BSC and found that managers use the concept for decision-making, decision-rationalising, coordination, and self-monitoring. Huang (2009) proposed an intellectual BSC knowledge-based system for strategic planning by integrating the BSC with a knowledge-based system using the AHP method. Yuan and Chiu (2009) developed a case-based reasoning system to assist in assigning the suitable weights to each level of the BSC.
Yüksel and Dağdeviren (2010) integrated the BSC concepts into a fuzzy ANP technique to assess the performance of a business on the basis of its vision and strategies. Asosheh et al. (2010) combined two well-established managerial methodologies, the BSC and the DEA, and proposed a new approach for information technology project selection. Huang et al. (2011) proposed the use of the AHP to prioritise all of the measures and strategies in a BSC framework. They found related strategies and objectives from four
336 M. Tavana et al.
perspectives of the BSC and illustrated selection or design of the most appropriate and helpful measures of the BSC in the pharmaceutical firm in an emerging market. Amado et al. (2012) developed a conceptual framework which aimed at assessing decision making units from multiple perspectives. Their proposed conceptual framework combined the BSC method with the data envelopment analysis by using various interconnected models which encapsulated four perspectives of performance (financial, customers, internal processes, learning and growth). Grigoroudis et al. (2012) presented a performance measurement system for public health care organisations, in the context of the BSC methodology. Their proposed approach considers the distinguished characteristics of the non-profit sector (e.g., lack of competition, social character of organisations, etc.) and contains the most important financial performance indicators, as well as non-financial performance indicators that are able to examine the quality of the provided services, the satisfaction of internal and external customers, the self-improvement system of the organisation and the ability of the organisation to adapt and change.
2.2 Quality function deployment
QFD is a customer-driven approach that allows the needs of the customer to be communicated through the various stages of product planning, design, engineering, and manufacturing into a final product (Chen and Ko, 2008). The QFD model has been successfully used in many industries to improve design processes, customer satisfaction, and to create a competitive advantage (Hauser and Clausing, 1988). A manufacturing organisation that correctly implements QFD can improve engineering knowledge, productivity and quality and reduce costs, product development time, and engineering changes (Besterfield et al., 2003). QFD is accomplished through a series of charts called ‘house of quality’ (HoQ). A HoQ is a conceptual map providing information such as ‘what to do’ (performance characteristics) or ‘how to do it’ (engineering characteristics). Typically, a QFD system can be broken down into four inter-linked phases to fully deploy the customer needs phase by phase (Chan and Wu, 2005). A simplified form of the HoQ matrix as suggested by Lowe et al. (2000) was utilised in this study. The technical correlations and planning matrices were removed and only the prioritised requirements row was included at the base. QFD belongs to the sphere of quality management methods, offering a linear and structured guideline for converting the customer’s needs into specifications, and characteristics of new products and services (Bhattacharya et al., 2005; Chen, 2009; Chen and Ngai, 2008; Chen et al., 2005; Delice and Güngör, 2009; Han et al., 2001; Liu, 2005; Karsak et al., 2002; Liu and Wu, 2008; Matook and Indulska, 2009).
QFD and its applications have attracted a great deal of interest among researchers. Bevilacqua et al. (2006) used QFD and fuzzy numbers to solve supplier selection problems. Kim and Kim (2009) used QFD to prioritise engineering characteristics by considering the uncertainty of input information. Şen and Baraçlı (2010) used fuzzy QFD to determine which non-functional requirements are important to software selection decisions. Zhai et al. (2010) used fuzzy QFD methodology and rough set theory to present a QFD-based expert system for product design. Zarei et al. (2011) presented an approach to increase the leanness of the food chain by using QFD to identify viable lean enablers and fuzzy logic. Chan and Wu (2002) provided a literature review of QFD based on a reference bank of about 650 QFD publications which established and accounted for
A fuzzy-QFD approach to balanced scorecard using an ANP 337
the origination and historical development of QFD and also presented a categorical analysis of QFD’s functional fields, applied industries and methodological development. Carnevalli and Miguel (2008) presented a review, analysis, classification and codification of the literature on QFD produced between 2002 and 2006. Sharma and Rawani (2008) presented a detailed literature review on the topic and application of QFD based on a reference bank of more than 400 QFDs and its allied publications, organisations, software, tools and web sources. The literature review was extended with detailed descriptions of the adopted methodologies, including an elaborate and categorical application analysis of its varied functional areas, namely, primary, secondary and tertiary fields, industrial, non-industrial and service applications and methodological progressions.
Let us consider a highway expansion programme. Engineers have always examined the performance history of the current roads. They look at field test data and they examine any driver (customer) satisfaction information that might happen to be available. By contrast, QFD uses a matrix format to capture a number of issues that are vital to the planning process. The HoQ translates driver requirements, based on research and benchmarking data, into an appropriate number of programme targets. The HoQ is made up of six major components. These include: customer requirements, technical requirements, a planning matrix, an interrelationship matrix, a technical correlation matrix, and a technical priorities/benchmarks and targets section.
The initial step in forming the HoQ includes determining, clarifying, and specifying the drivers’ needs. Then, the driver needs are clarified and clearly stated. It is of extremely importance to translate the wishes of the drivers into some tangible values that can be turned into road specifications. The next step involves identifying what the drivers want and what must be achieved to satisfy their needs. In addition, requirements dictated by management must be identified. Once all requirements are identified it is important to answer what must be done to the road to fulfill the necessary requirements.
The next step in the QFD process is forming a planning matrix. The main purpose of the planning matrix is to compare how well the decision makers met the driver requirements. The planning matrix shows the weighted importance of each requirement that the decision makers are attempting to fulfill. The next step is forming an interrelationship matrix. The main function of the interrelationship matrix is to establish a connection between the driver’s need and the performance measures designed to improve the road. The first step in constructing the interrelationship matrix involves obtaining the opinions of the drivers as far as what they need and require from a road. These views are drawn from the planning matrix and placed in the interrelationship matrix. With this driver overview, the decision makers can begin to formulate a strategy to improve their road. In doing this, the strengths and weaknesses of the company are weighted against the driver priorities to determine what aspects need to be changed and what aspects should be left unchanged.
Knowing what improvements need to be made allows the list of performance measures to be generated and displayed in the interrelationship matrix. By definition, a performance measure is a technical measure evaluating the road’s performance. The matrix will have at least one performance measure for each demanded quality. After setting up the basic matrix, it is necessary to assign relationships between the driver requirements and the performance measures. These relationships are portrayed by
338 M. Tavana et al.
symbols indicating a strong relationship, a medium relationship, or a weak relationship between the elements in the interrelationship matrix.
The next step in the QFD process is forming a technical correlation matrix. Performance measures in the existing programmes often conflict with each other. The technical correlation matrix, which is more often referred to as the roof, is used to aid in developing relationships between driver requirements and road requirements. It identifies where these units must work together otherwise they will be in a design conflict. If there is a negative impact between requirements, the design must be compromised unless the negative impact can be eliminated. Some conflicts cannot be resolved, which leaves it up to the decision makers to decide how to deal with them. Negative impacts can also represent constraints, which may be bi-directional.
According to step-by-step QFD, asking the following question when working with this part of the HoQ helps to clarify the relationships. Many technical requirements are related to each other so working to improve one may help a related requirement. On the other hand, working to improve another requirement may negatively affect a related requirement. One of the principal benefits of the roof in a HoQ is that it flags these negative relationships so they can be resolved. If these issues are not resolved satisfactorily, some aspects of the final road will dissatisfy the drivers.
The next step in the QFD process is forming a technical properties matrix. This matrix uses specific items to record the priorities assigned to technical requirements. The final output of the matrix is a set of target values for each technical requirement to be met by the new highway expansion programme. In some cases, organisations are not able to create the most optimum design because of constraints related to cost, technology, or other related items. The driver requirements are then distributed across the relationships to the quality characteristics. This gives an organisation prioritised quality characteristics. High priority quality characteristics usually indicate that working on this technical issue will deliver great value to the drivers. A high quality characteristic weight indicates strong relationships with high priority demanded quality items.
2.3 Conjoined BSC and QFD
Conjoining the BSC and the QFD can provide a powerful strategic management tool. Koo (1998) combined QFD and the BSC and showed that The ‘Whats’ and the ‘Hows’ in QFD can be translated into the four perspectives under the BSC model. Lee and Lo (2000) presented a framework for strategy formulation in vocational education by linking the strengths, weaknesses, opportunities, and threats (SWOT) matrix with BSC to identify the four critical successful perspectives and analysing the quality of graduate business education. Lee and SaiOnKo (2000) presented an approach for developing and implementing a corporate business strategic plan. The framework has two steps. Initially, they conjoined the SWOT matrix with the BSC to construct a systematic and holistic strategic management system, and then they used the QFD methodology with the BSC attributes as the ‘Whats’ on the vertical axis and the major strategies of Sun Tzu’s ‘The Art of Business Management’ on the horizontal ‘Hows’ axis. SaiOnKo and Lee (2000) applied a new strategy formulation tool to develop a set of strategies for the banking industry in Hong Kong. Their framework is a combination of SWOT analysis, the BSC, and Sun Tzu’s Art of Business Management in Strategic Planning, via the QFD methodology. Tan et al. (2004) proposed an e-business planning framework which linked both strategic and operations management by applying QFD. They used BSC to provide
A fuzzy-QFD approach to balanced scorecard using an ANP 339
an organisational approach to setting objectives and ensuring that the e-initiatives are aligned with the organisational vision and objectives. Ip and Koo (2004) presented a methodology based on an integrated framework composed of BSC, SWOT and QFD for translating vague strategies into actions. They used a case study to demonstrate how to delineate the aforesaid translation of strategy. Chen et al. (2008) presented an integrated fuzzy approach to service process design for air cargo transportation. Fuzzy set theory, BSC, and the theory of constraints were integrated to ensure that the internal process design satisfies the measures of employees, shareholders and customers. Dror (2008) presented a structured methodological approach based on QFD to improve the implementation of the BSC in an individual organisation. He demonstrated that the QFD systematic approach assists in organising the BSC, thus promoting continuous improvement for achieving strategic goals. Li et al. (2011) proposed a comprehensive and systematic approach that combined QFD with the BSC and AHP by using a least deviation based approach and presented a case study to illustrate the effectiveness of the proposed approach.
2.4 Fuzzy sets and fuzzy numbers
Fuzzy set theory, introduced by Zadeh (1965), is widely used to handle the imprecise and uncertain information in the real-world problems (Yager, 1995). Especially, it is more suitable for subjective judgement and qualitative assessment than other classical evaluation methods applying crisp values (Lin and Chen, 2004; Wang and Chuu, 2004). In this section we review some basic notions of fuzzy sets as follows:
Definition 1. A fuzzy set à in a universe of discourse X is characterised by a membership function μÃ(x) which associates with each element x in X a real number in the interval [0,1]. The function value μÃ(x) is termed the grade of membership of x in Ã.
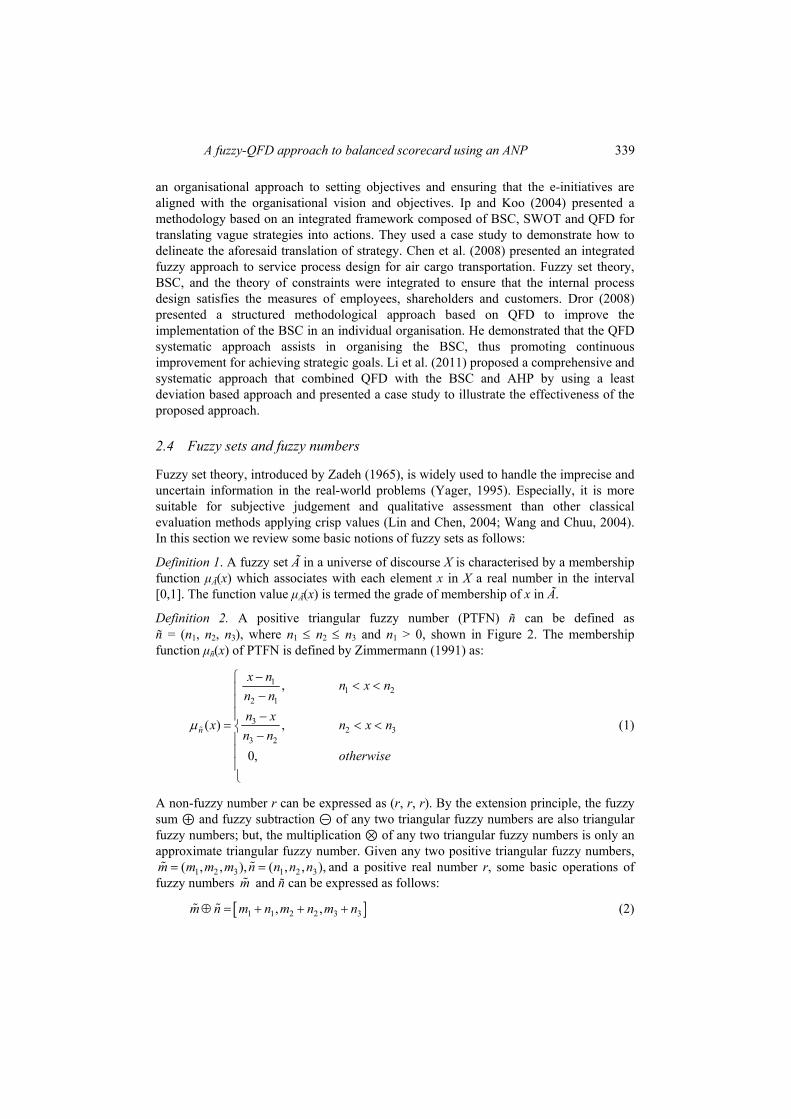
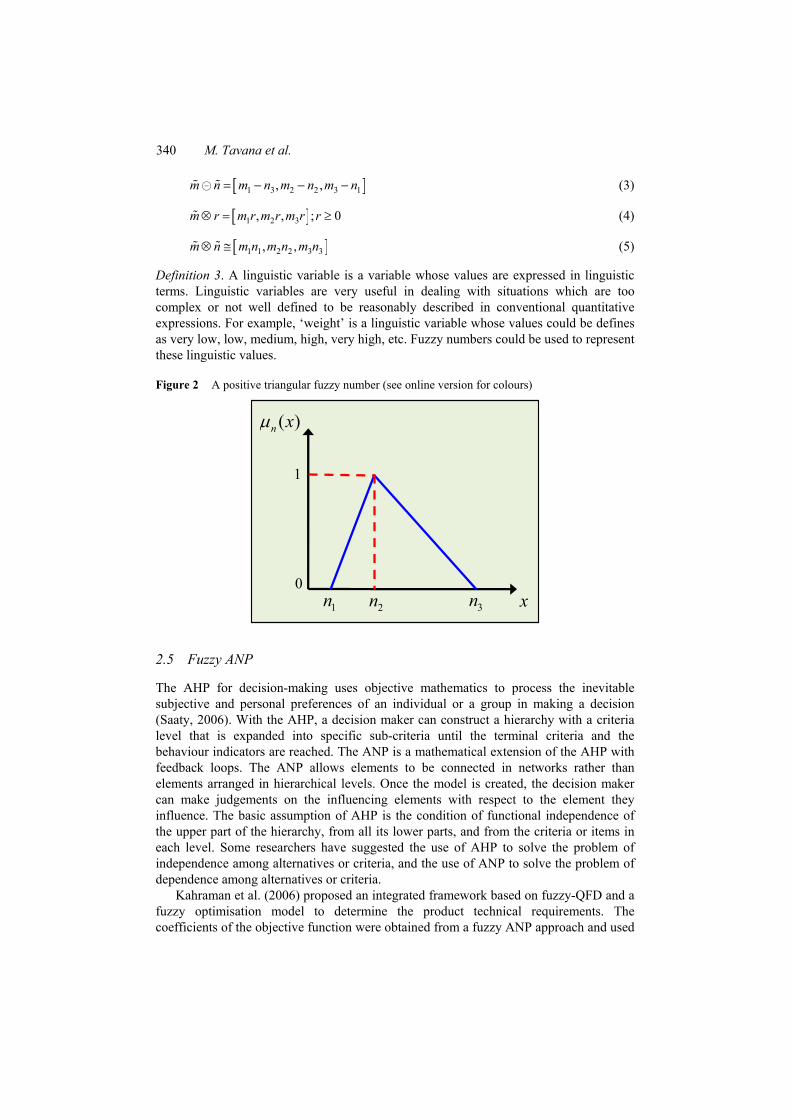
Definition 2. A positive triangular fuzzy number (PTFN) ñ can be defined as ñ = (n1, n2, n3), where n1 ≤ n2 ≤ n3 and n1 > 0, shown in Figure 2. The membership function μñ(x) of PTFN is defined by Zimmermann (1991) as:
11 2
2 1
32 3
3 2
,
( ) ,
0,
n
x nn x n
n nn x
x n x nn n
otherwise
μ
−⎧ < <⎪ −⎪⎪ −
= < <⎨ −⎪⎪⎪⎩
(1)
A non-fuzzy number r can be expressed as (r, r, r). By the extension principle, the fuzzy sum and fuzzy subtraction of any two triangular fuzzy numbers are also triangular fuzzy numbers; but, the multiplication of any two triangular fuzzy numbers is only an approximate triangular fuzzy number. Given any two positive triangular fuzzy numbers,
1 2 3 1 2 3( , , ), ( , , ),m m m m n n n n= = and a positive real number r, some basic operations of fuzzy numbers m and ñ can be expressed as follows:
[ ]1 1 2 2 3 3, ,m n m n m n m n⊕ = + + + (2)
340 M. Tavana et al.
[ ]1 3 2 2 3 1, ,m n m n m n m n= − − − (3)
[ ]1 2 3, , ; 0m r m r m r m r r⊗ = ≥ (4)
[ ]1 1 2 2 3 3, ,m n m n m n m n⊗ ≅ (5)
Definition 3. A linguistic variable is a variable whose values are expressed in linguistic terms. Linguistic variables are very useful in dealing with situations which are too complex or not well defined to be reasonably described in conventional quantitative expressions. For example, ‘weight’ is a linguistic variable whose values could be defines as very low, low, medium, high, very high, etc. Fuzzy numbers could be used to represent these linguistic values.
Figure 2 A positive triangular fuzzy number (see online version for colours)
0
( )n xμ
1
1n 2n 3n x
2.5 Fuzzy ANP
The AHP for decision-making uses objective mathematics to process the inevitable subjective and personal preferences of an individual or a group in making a decision (Saaty, 2006). With the AHP, a decision maker can construct a hierarchy with a criteria level that is expanded into specific sub-criteria until the terminal criteria and the behaviour indicators are reached. The ANP is a mathematical extension of the AHP with feedback loops. The ANP allows elements to be connected in networks rather than elements arranged in hierarchical levels. Once the model is created, the decision maker can make judgements on the influencing elements with respect to the element they influence. The basic assumption of AHP is the condition of functional independence of the upper part of the hierarchy, from all its lower parts, and from the criteria or items in each level. Some researchers have suggested the use of AHP to solve the problem of independence among alternatives or criteria, and the use of ANP to solve the problem of dependence among alternatives or criteria.
Kahraman et al. (2006) proposed an integrated framework based on fuzzy-QFD and a fuzzy optimisation model to determine the product technical requirements. The coefficients of the objective function were obtained from a fuzzy ANP approach and used
A fuzzy-QFD approach to balanced scorecard using an ANP 341
with AHP in the proposed framework. Büyüközkan et al. (2007) introduced an extended product planning HoQ by using a least deviation based approach and the BSC. They developed a comprehensive and systematic approach to determine the aggregated priority ratings of engineering characteristics. Lee et al. (2008) proposed an integrated fuzzy AHP and BSC method for evaluating an information technology department in the manufacturing industry. The BSC concept was applied to define the hierarchy with four major perspectives (i.e., financial, customer, internal business process, and learning and growth), and performance indicators were selected for each perspective. A fuzzy AHP approach was then used to represent vagueness and ambiguity in the information. Dağdeviren and Yüksel (2008) studied the work safety issue using the AHP approach which allowed both multi-criteria and simultaneous evaluation. They proposed a fuzzy AHP approach to determine the level of faulty behaviour risk in work systems. Their proposed method was applied in a manufacturing company. In the application, factors causing faulty behaviour were weighted with triangular fuzzy numbers in pairwise comparisons. Tuzkaya and Önüt (2008) used a fuzzy ANP method to examine the different modes for the transportation of freight by a logistics-service provider company based on a number of conflicting qualitative and quantitative criteria. They evaluated a large number of detailed criteria that interacted with each other.
Promentilla et al. (2008) proposed a fuzzy ANP approach with an interval arithmetic and optimism index to transform the fuzzy comparative judgement matrix into set of crisp matrices for an uncontrolled landfill. They also conducted a comprehensive sensitivity analysis to study how the fuzziness in judgement could affect the solution robustness of the prioritisation method. Guneri et al. (2009) used a fuzzy ANP model for shipyard location decisions. Yang et al. (2009) proposed an integrated process for constructing performance measurement models in manufacturing based on performance criteria from the literature and expert questionnaires. The AHP and the ANP were utilised to determine the weight of each criterion in the performance measurement system. Ayağ and Özdemir (2009) introduced a fuzzy ANP model for evaluating conceptual design alternatives in a new product development environment and reaching the best design satisfying both the needs and expectations of customers, and the engineering specifications of company. Gumus and Yilmaz (2010) proposed an integrated fuzzy AHP-ANP method for sea vessel type selection for short and medium distances. Lin et al. (2010) applied a fuzzy QFD model and represented its interdependence with an ANP model. Dağdeviren and Yüksel (2010) proposed a hybrid method to measure the sectoral competition level of an organisation within the framework of Porter’s five forces analysis by using fuzzy ANP. Yüksel and Dağdeviren (2010) used the BSC approach in conjunction with the fuzzy ANP technique to determine the performance level of a business on the basis of its vision and strategies. Their proposed model showed that the performance indicators included in the BSC approach can be consolidated with the help of fuzzy ANP technique. Li et al. (2012) proposed a systematic and operational method based on the integration of a minimal deviation based method, BSC, AHP, and a scale method to determine the final priority ratings of customer requirements. Sevkli et al. (2012) proposed a quantitative basis to analytically determine the ranking of the factors in SWOT analysis via ANP in the airline industry.
Consider a simple example of selecting the best highway expansion programme. Two selection criteria, road safety and effects on landscape, are used where road safety is strongly preferred to effects on landscape. Road A is safe and improves the landscape
342 M. Tavana et al.
significantly; Road B is safer but does not improve the landscape much. Which road is best, given both the extreme importance of road safety relative to effects on landscape and the features of the two roads? Let us approach this problem with two methods: AHP and its general form, ANP.
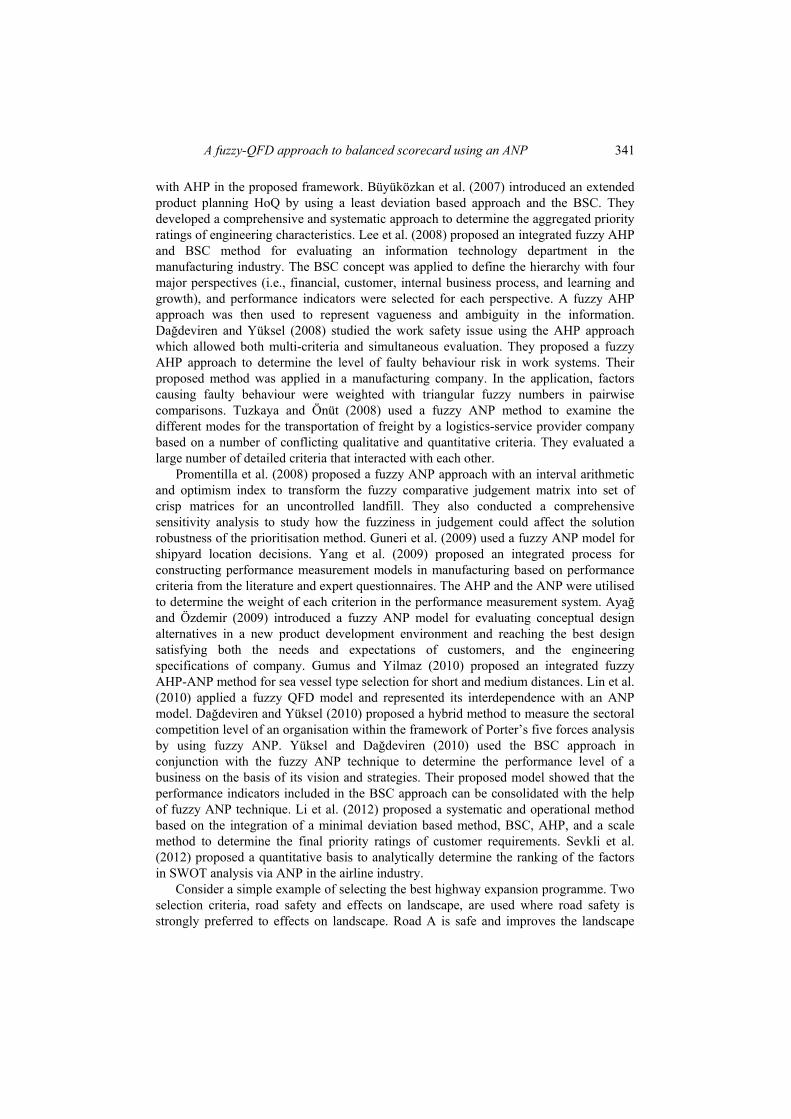
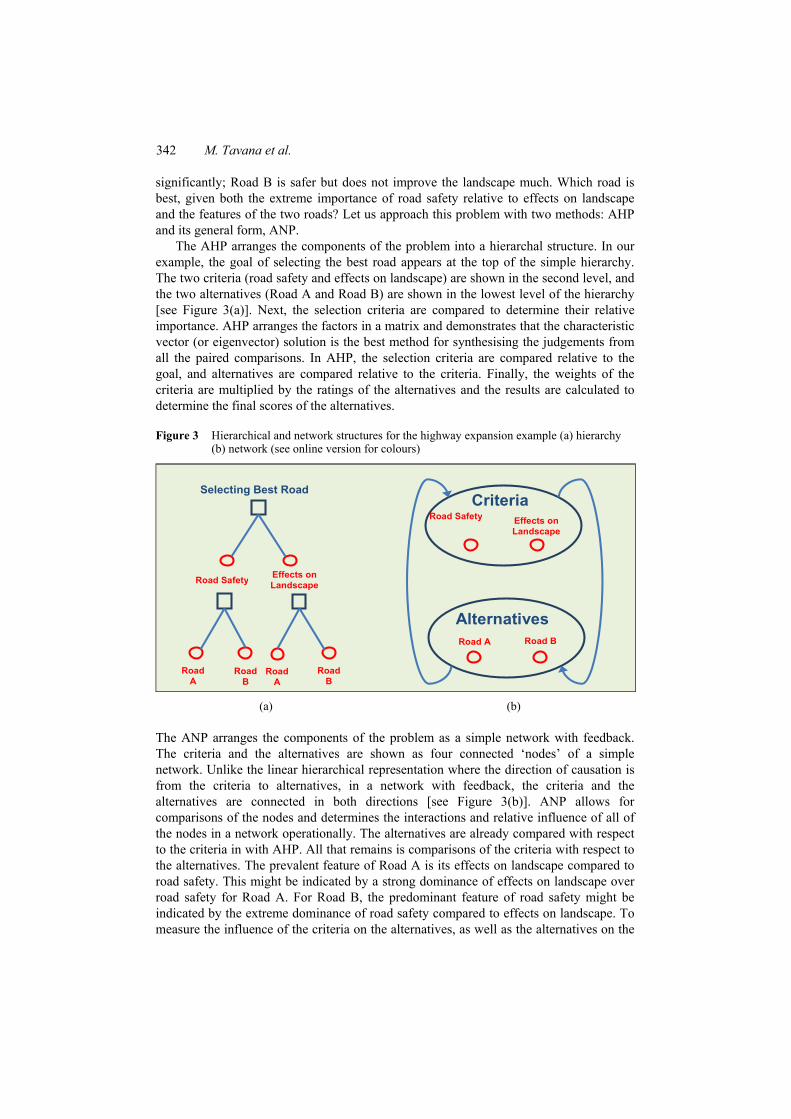
The AHP arranges the components of the problem into a hierarchal structure. In our example, the goal of selecting the best road appears at the top of the simple hierarchy. The two criteria (road safety and effects on landscape) are shown in the second level, and the two alternatives (Road A and Road B) are shown in the lowest level of the hierarchy [see Figure 3(a)]. Next, the selection criteria are compared to determine their relative importance. AHP arranges the factors in a matrix and demonstrates that the characteristic vector (or eigenvector) solution is the best method for synthesising the judgements from all the paired comparisons. In AHP, the selection criteria are compared relative to the goal, and alternatives are compared relative to the criteria. Finally, the weights of the criteria are multiplied by the ratings of the alternatives and the results are calculated to determine the final scores of the alternatives.
Figure 3 Hierarchical and network structures for the highway expansion example (a) hierarchy (b) network (see online version for colours)
Effects on Landscape
Criteria
Road B
Alternatives
Road A
Selecting Best Road
Road Safety Effects on Landscape
Road A
Road A
Road B
Road B
Road Safety
(a) (b)
The ANP arranges the components of the problem as a simple network with feedback. The criteria and the alternatives are shown as four connected ‘nodes’ of a simple network. Unlike the linear hierarchical representation where the direction of causation is from the criteria to alternatives, in a network with feedback, the criteria and the alternatives are connected in both directions [see Figure 3(b)]. ANP allows for comparisons of the nodes and determines the interactions and relative influence of all of the nodes in a network operationally. The alternatives are already compared with respect to the criteria in with AHP. All that remains is comparisons of the criteria with respect to the alternatives. The prevalent feature of Road A is its effects on landscape compared to road safety. This might be indicated by a strong dominance of effects on landscape over road safety for Road A. For Road B, the predominant feature of road safety might be indicated by the extreme dominance of road safety compared to effects on landscape. To measure the influence of the criteria on the alternatives, as well as the alternatives on the
A fuzzy-QFD approach to balanced scorecard using an ANP 343
criteria, a ‘supermatrix’ is formed. The row and column headings simply list the alternatives and criteria, and the columns contain the computed relative weights. The supermatrix is the operational method of determining the impacts of weights of the alternative on the weights of the criteria. A similar set of impacts is determined for the effect of the criteria on the alternatives by simply multiplying the supermatrix by itself repeatedly. This procedure is equivalent to raising the supermatrix to powers. When all of the columns are identical, the stopping point is reached and the final scores of the alternatives are determined.
In this study, we adopted ANP to find the importance weight of the financial, customer, internal processes, and learning and growth perspectives in the BSC based on the following motivations:
1 ANP uses ratio scale by human judgement instead of arbitrary scales to establish criteria weights or priorities
2 ANP can measure all intangible and tangible criteria in the model
3 ANP considers the interdependencies among the program criteria
4 ANP sets priorities and trade-offs among the program criteria through a structured evaluation system
5 ANP promotes clear understanding and consensus among decision makers through its simple and intuitive evaluation system.
3 Proposed approach
Consider a fuzzy prioritisation problem with n elements, the problem is to transform a fuzzy pairwise comparison matrix to the crisp priority vector w = (w1, w2, …, wn)T. We use the fuzzy prioritisation method proposed by Mikhailov (2000, 2003) and construct a comparison matrix using m ≤ n(n – 1)/2 pairwise comparisons expressed with linguistic variables. The transformation of the linguistic judgements into triangular fuzzy numbers ãij = (lij, mij, uij) results in the set F = {ãij|i = 1,2,…, n – 1; j = 2,3,…n, j > i}. If the pairwise comparisons are consistent, the priority ratios wi / wj should be close to mij and approximately within the lower and upper elements of the initial fuzzy judgements. We represent this preference as follows:
iij ij
j
wl uw
≤ ≤ (6)
where the symbol ≤ denotes the statement ‘fuzzy less or equal to’. The degree to which the wi / wj
ratios satisfy the double-side inequality (6) is measured by the following membership function:
( )
( )
( )
/
/ /
i j ij iij
ij ij jij i j
ij i j iij
ij ij j
w w l w nn l w
w wu w w w n
u l w
β
⎧ −≤⎪
−⎪= ⎨
−⎪≥⎪ −⎩
(7)

344 M. Tavana et al.
The maximum satisfaction level, βij = 1, is reached when wi / wj = mij. For wi / wj < lij or wi > uij, the function is negative and suggests unsuitability of the calculated weights. To measure the overall satisfaction level, the following aggregate membership function is defined:
( ) { }min ( ) 1, , 1 ; 2, , ;ijijw w i n j n j iβ β= = … − = … > (8)
To maximise the satisfaction level, we use a mathematical programme. Since the goal is the satisfactory calculation of all the wis, the model is defined as follows:
{ }S
max ( ) min ( ) ijijww wβ β
∈= (9)
where
( ){ }1 2 1S , , , | 0, 1
nn i ii
w w w w w=
= … > =∑ (10)
It can easily be proved that β(w) is a convex set, so there is always a priority vector w*∈ S that maximises the objective. The model can be represented as follows:
1
MaximiseSubject to:
( ), 1, 2,. . . , ( 1); 2, . . . , ;
1 , 0 ; 1,2,
,n
l ll
ij w i n j n j i
w w l n
λ
λ β
=
≤ = − = >
= > = …∑ (11)
Model (11) can be further transformed into the following bilinear programme:
1
) 0,
( 0,
1 , 0 ; 1,2, ,
MaximiseSubjec o:(
)
.
t t
ij ij j i ij j
ij ij j i ij j
nk kk
m l w w l w
u m w w u w
w w k n
λ
λ
λ
=
− − + ≤
− + − ≤
= > = …∑
(12)
In this paper we use Lingo 10 software to obtain the optimal solution (λ*, w*). λ* is the consistency measure of the fuzzy pairwise comparisons. A positive λ* indicates that all βij(w*) are positive and consequently * *( ) ; /ij i j ijl w w u i≤ ≤ ∀ (i.e., the fuzzy judgements are consistent and a good set of weights can be derived from the pairwise comparison matrix). On the other hand, a negative λ* shows that the double-side inequalities (6) are not satisfied and the fuzzy judgements are inconsistent.
In this paper, we present an integrated approach by using the QFD and the BSC with the fuzzy ANP. We start by identifying the objectives in each of the four BSC perspectives. The QFD technique is used to organise and prioritise these objectives. The AHP and ANP are used to weight these objectives based on the interdependencies among them in each perspective. The decision makers’ judgements are captured with linguistic variables and represented with triangular fuzzy numbers. Figure 4 shows the BSC perspectives and their interdependencies.
A fuzzy-QFD approach to balanced scorecard using an ANP 345
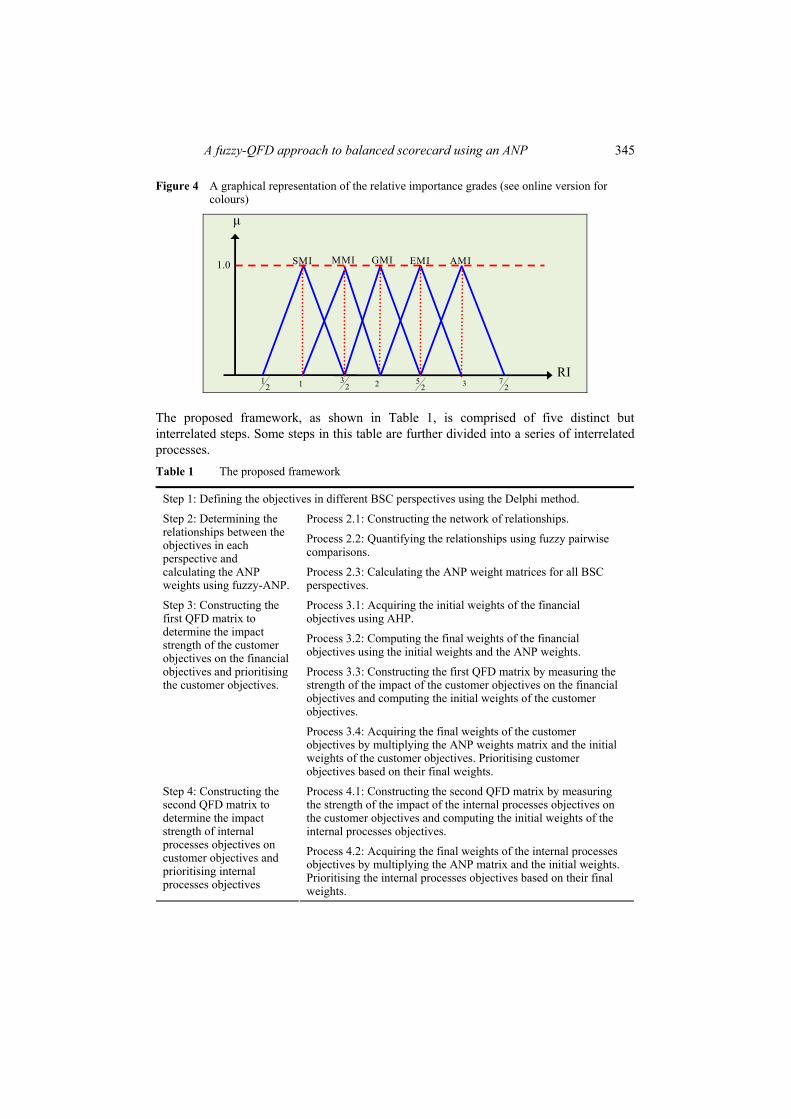
Figure 4 A graphical representation of the relative importance grades (see online version for colours)
RI
μ
1.0
12
32
721 2 35
2
SMI MMI GMI EMI AMI
The proposed framework, as shown in Table 1, is comprised of five distinct but interrelated steps. Some steps in this table are further divided into a series of interrelated processes. Table 1 The proposed framework
Step 1: Defining the objectives in different BSC perspectives using the Delphi method.
Process 2.1: Constructing the network of relationships.
Process 2.2: Quantifying the relationships using fuzzy pairwise comparisons.
Step 2: Determining the relationships between the objectives in each perspective and calculating the ANP weights using fuzzy-ANP.
Process 2.3: Calculating the ANP weight matrices for all BSC perspectives.
Process 3.1: Acquiring the initial weights of the financial objectives using AHP.
Process 3.2: Computing the final weights of the financial objectives using the initial weights and the ANP weights.
Process 3.3: Constructing the first QFD matrix by measuring the strength of the impact of the customer objectives on the financial objectives and computing the initial weights of the customer objectives.
Step 3: Constructing the first QFD matrix to determine the impact strength of the customer objectives on the financial objectives and prioritising the customer objectives.
Process 3.4: Acquiring the final weights of the customer objectives by multiplying the ANP weights matrix and the initial weights of the customer objectives. Prioritising customer objectives based on their final weights.
Process 4.1: Constructing the second QFD matrix by measuring the strength of the impact of the internal processes objectives on the customer objectives and computing the initial weights of the internal processes objectives.
Step 4: Constructing the second QFD matrix to determine the impact strength of internal processes objectives on customer objectives and prioritising internal processes objectives
Process 4.2: Acquiring the final weights of the internal processes objectives by multiplying the ANP matrix and the initial weights. Prioritising the internal processes objectives based on their final weights.
346 M. Tavana et al.
Table 1 The proposed framework (continued)
Process 5.1: Constructing the third QFD matrix by measuring the strength of the impact of the learning and growth processes objectives on the internal processes objectives and computing the initial weights of the learning and growth objectives.
Step 5: Constructing the third QFD matrix to determine the impact strength of learning and growth objectives on internal processes and prioritising learning and growth objectives
Process 5.2: Acquiring the final weights of the learning and growth objectives by multiplying the ANP matrix and the initial weights. Prioritising the learning and growth objectives based on their final weights.
4 Case study
The case study presented in this section was used at Semicon Technologies1, a large manufacturer of semiconductor equipment, memory chips, microprocessors and microcontrollers located in Jersey City.
Step 1 In this step, we utilised the Delphi method to determine the corporate objectives in different BSC perspectives. After four rounds of Delphi, a consensus was reached among the DMs. They identified the following four financial objectives (F): overall profit (F1), maximise utilisation (F2), increase current customer revenues (F3), and increase new customer revenues (F4); the following five customer objectives (C): increase customer satisfaction (C1), reduce delivery costs (C2), reduce delivery errors (C3), improve delivery times (C4), and improve post-sales services (C5); the following six internal process objectives: improve supplier relations (I1), improve production processes (I2), establish a traceable delivery system (I3),improve departmental coordination (I4),enhance ordering systems (I5), and increase number of customer services (I6); and the following six learning and growth objectives (L): personnel satisfaction (L1) personnel training (L2) improve inter-departmental communication systems (L3), promote teamwork (L4), promote customer-oriented personnel (L5), and establish performance related compensation (L6).
Step 2 In this step, we determined the relationships between the objectives in each BSC perspective and calculated their importance weights with fuzzy ANP by utilising Processes 2.1, 2.2, and 2.3.
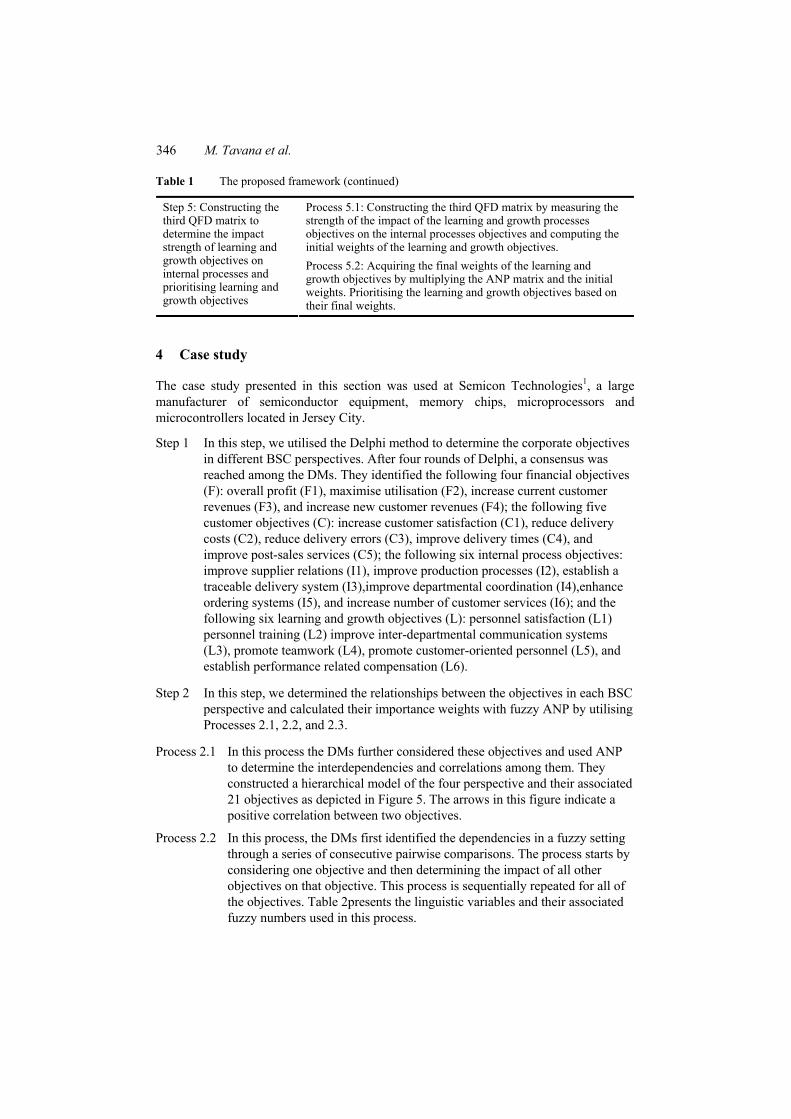
Process 2.1 In this process the DMs further considered these objectives and used ANP to determine the interdependencies and correlations among them. They constructed a hierarchical model of the four perspective and their associated 21 objectives as depicted in Figure 5. The arrows in this figure indicate a positive correlation between two objectives.
Process 2.2 In this process, the DMs first identified the dependencies in a fuzzy setting through a series of consecutive pairwise comparisons. The process starts by considering one objective and then determining the impact of all other objectives on that objective. This process is sequentially repeated for all of the objectives. Table 2presents the linguistic variables and their associated fuzzy numbers used in this process.
A fuzzy-QFD approach to balanced scorecard using an ANP 347
Figure 5 The performance objectives and their dependencies in the BSC perspectives (see online version for colours)
FINANCIAL PERSPECTIVE (F)
Increase Overall Profit
(F1) Increase
Present Customer Revenues
(F3)
Increase New Customer Revenues
(F4)
Maximize Utilization
(F2)
Increase Customer Satisfaction
(C1)
ReduceDelivery Errors
(C3)
ImproveDelivery Times
(C4)
Reduce Delivery Costs
(C2)
Improve Production Processes
(I2)
Improve Departmental Coordination
(I4)
Enhance Ordering Systems
(I5)
Establish aTraceable
Delivery System (I3)
Increase Number of
Customer Services (I6)
Improve Supplier Relations
(I1)
Promote Teamwork
(L4) Promote
Customer‐Oriented
Personnel (L5)
Improve Inter‐Departmental Communication Systems (L3)
Establish Performance
Related Compensation (L6)
Personnel Satisfaction
(L1)
ImprovePost‐Sales Services
(C5)
LEARNING AND GROWTH PERSPECTIVE (L)
INTERNAL PROCESS PERSPECTIVE (I)
CUSTOMER PERSPECTIVE (C)
Personnel Training (L2)
Table 2 The fuzzy representation of the relative importance grades
Relative importance Fuzzy representation
Equally important (EI) (1,1,1) Slightly more important (SMI) (1/2,1,3/2) Moderately more important (MMI) (1,3/2,2) Greatly more important (GMI) (3/2,2,5/2) Extremely more important (EMI) (2,5/2,3) Absolutely more important (AMI) (5/2,3,7/2)

348 M. Tavana et al.
Table 3 presents the result of the pairwise comparisons between the financial objectives. In Matrix 3.1, F1 is considered as the reference objective. According to the network of relationships we constructed earlier in Figure 5, the objectives that have influence on F1 are F1itself, F2, F3 and F4 whose relative impacts are compared pairwise. For instance, the impact of F3 on F1 is greatly more important (GMI) than the impact of F4 on F1 which is represented by the fuzzy number (3/2,2,5/2) in Matrix 3.1. Matrix 3.2 presents the pairwise comparison for the impacts of F2 and F3 on F3. F1 and F4 have not been identified as having influence on F3. Similarly, Matrix 3.3 presents the pairwise comparison for the impacts of F2 and F4 on F4. We do not construct a comparison matrix for F2 since none of the financial objectives have any impact on this objective. Table 3 The pairwise comparison matrices for the financial perspective measures
Matrix 3.1 (F1) F1 F2 F3 F4
F1 (1,1,1) (2,5/2,3) (1,3/2,2) (3/2,2,5/2)
F2 (1/3,2/5,1/2) (1,1,1) (1/3,2/5,1/2) (2/5,1/2,2/3)
F3 (1/2,2/3,1) (2,5/2,3) (1,1,1) (3/2,2,5/2)
F4 (2/5,1/2,2/3) (3/2,2,5/2) (2/5,1/2,2/3) (1,1,1)
Matrix 3.2 (F3) F2 F3
F2 (1,1,1) (1,3/2,2)
F3 (1/2,2/3,1) (1,1,1)
Matrix 3.3 (F4) F2 F4
F2 (1,1,1) (3/2,2,5/2)
F4 (2/5,1/2,2/3) (1,1,1)
Table 4 The pairwise comparison matrices for the customer perspective measures
Matrix 4.1 (C1) C1 C2 C3 C4 C5
C1 (1,1,1) (2/7,1/3,2/5) (1/3,2/5,1/2) (2/5,1/2,2/3) (2/5,1/2,2/3) C2 (5/2,3,7/2) (1,1,1) (3/2,2,5/2) (5/2,3,7/2) (2,5/2,3) C3 (2,5/2,3) (2/5,1/2,2/3) (1,1,1) (1,3/2,2) (3/2,2,5/2) C4 (3/2,2,5/2) (2/7,1/3,2/5) (1/2,2/3,1) (1,1,1) (1,3/2,2) C5 (3/2,2,5/2) (1/3,2/5,1/2) (2/5,1/2,2/3) (1/2,2/3,1) (1,1,1)
Matrix 4.2 (C2) C2 C3 C4
C2 (1,1,1) (1/3,2/5,1/2) (1/3,2/5,1/2) C3 (2,5/2,3) (1,1,1) (1,3/2,2) C4 (2,5/2,3) (1/2,2/3,1) (1,1,1)
A fuzzy-QFD approach to balanced scorecard using an ANP 349
Similarly, pairwise comparisons are made for the objectives in other perspectives. Table 4 provides the results of pairwise comparisons of the customer objectives. In this table Matrix 4.1 compares the influences of customer objectives on C1 and Matrix 4.2 compares the influences on C2.
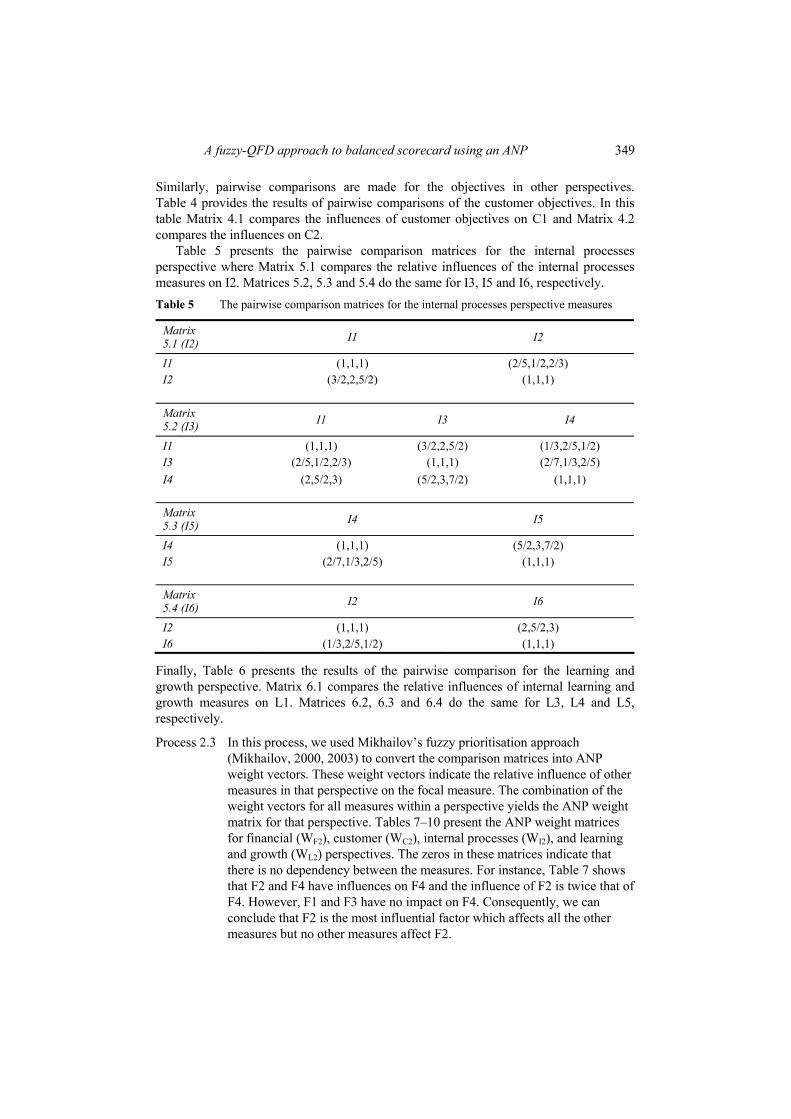
Table 5 presents the pairwise comparison matrices for the internal processes perspective where Matrix 5.1 compares the relative influences of the internal processes measures on I2. Matrices 5.2, 5.3 and 5.4 do the same for I3, I5 and I6, respectively. Table 5 The pairwise comparison matrices for the internal processes perspective measures
Matrix 5.1 (I2) I1 I2
I1 (1,1,1) (2/5,1/2,2/3) I2 (3/2,2,5/2) (1,1,1) Matrix 5.2 (I3) I1 I3 I4
I1 (1,1,1) (3/2,2,5/2) (1/3,2/5,1/2) I3 (2/5,1/2,2/3) (1,1,1) (2/7,1/3,2/5) I4 (2,5/2,3) (5/2,3,7/2) (1,1,1) Matrix 5.3 (I5) I4 I5
I4 (1,1,1) (5/2,3,7/2) I5 (2/7,1/3,2/5) (1,1,1) Matrix 5.4 (I6) I2 I6
I2 (1,1,1) (2,5/2,3) I6 (1/3,2/5,1/2) (1,1,1)
Finally, Table 6 presents the results of the pairwise comparison for the learning and growth perspective. Matrix 6.1 compares the relative influences of internal learning and growth measures on L1. Matrices 6.2, 6.3 and 6.4 do the same for L3, L4 and L5, respectively.
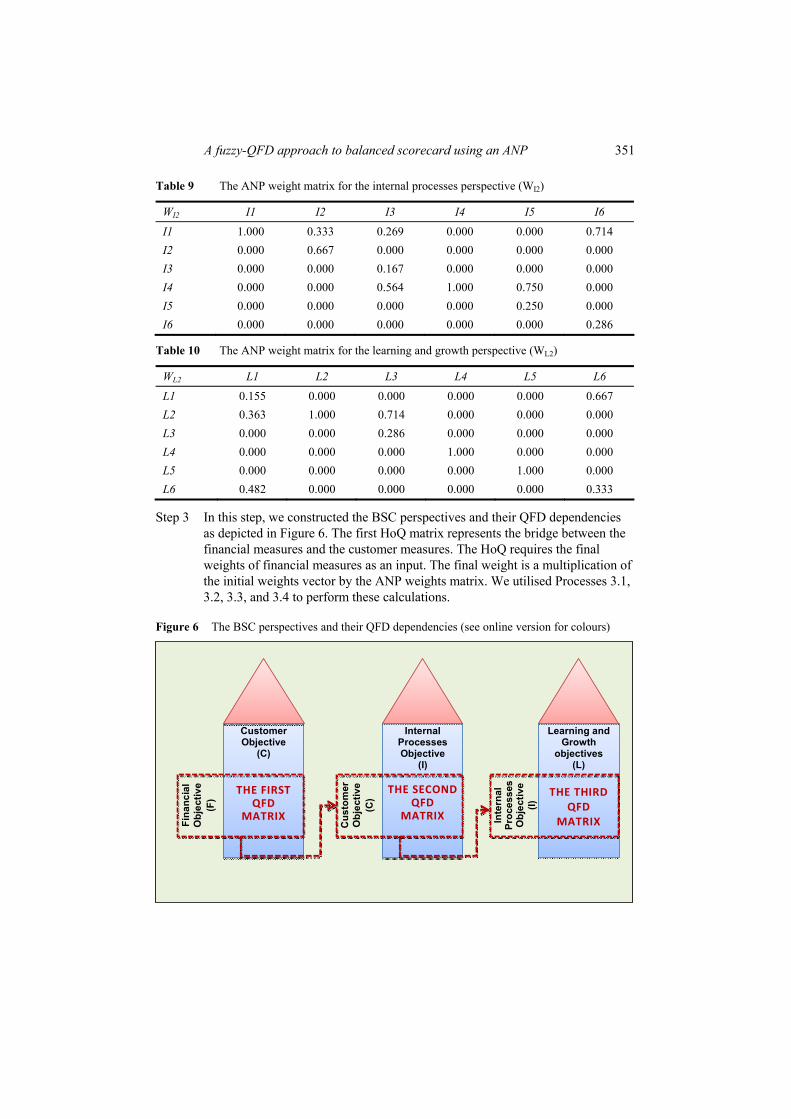
Process 2.3 In this process, we used Mikhailov’s fuzzy prioritisation approach (Mikhailov, 2000, 2003) to convert the comparison matrices into ANP weight vectors. These weight vectors indicate the relative influence of other measures in that perspective on the focal measure. The combination of the weight vectors for all measures within a perspective yields the ANP weight matrix for that perspective. Tables 7–10 present the ANP weight matrices for financial (WF2), customer (WC2), internal processes (WI2), and learning and growth (WL2) perspectives. The zeros in these matrices indicate that there is no dependency between the measures. For instance, Table 7 shows that F2 and F4 have influences on F4 and the influence of F2 is twice that of F4. However, F1 and F3 have no impact on F4. Consequently, we can conclude that F2 is the most influential factor which affects all the other measures but no other measures affect F2.

350 M. Tavana et al.
Table 6 The pairwise comparison matrices for the learning and growth perspective measures
Matrix 6.1 (L1) L1 L2 L6
L1 (1,1,1) (1/3,2/5,1/2) (2/7,1/3,2/5)
L2 (2,5/2,3) (1,1,1) (1/2,2/3,1)
L6 (5/2,3,7/2) (1,3/2,2) (1,1,1)
Matrix 6.2 (L3) L2 L3
L2 (1,1,1) (2,5/2,3)
L3 (1/3,2/5,1/2) (1,1,1)
Matrix 6.3 (L4) L2 L4
L2 (1,1,1) (2,5/2,3)
L4 (1/3,2/5,1/2) (1,1,1)
Matrix 6.4 (L5) L2 L5
L2 (1,1,1) (3/2,2,5/2)
L5 (2/5,1/2,2/3) (1,1,1)
Table 7 The ANP weight matrix for the financial perspective (WF2)
WF2 F1 F2 F3 F4
F1 0.358 0.000 0.000 0.000
F2 0.124 1.000 0.600 0.667
F3 0.320 0.000 0.400 0.000
F4 0.198 0.000 0.000 0.333
Table 8 The ANP weight matrix for the customer perspective (WC2)
WC2 C1 C2 C3 C4 C5
C1 0.080 0.000 0.000 0.000 0.000
C2 0.368 0.168 0.000 0.000 0.000
C3 0.236 0.460 1.000 0.000 0.000
C4 0.165 0.372 0.000 1.000 0.000
C5 0.151 0.000 0.000 0.000 1.000
A fuzzy-QFD approach to balanced scorecard using an ANP 351
Table 9 The ANP weight matrix for the internal processes perspective (WI2)
WI2 I1 I2 I3 I4 I5 I6 I1 1.000 0.333 0.269 0.000 0.000 0.714 I2 0.000 0.667 0.000 0.000 0.000 0.000 I3 0.000 0.000 0.167 0.000 0.000 0.000 I4 0.000 0.000 0.564 1.000 0.750 0.000 I5 0.000 0.000 0.000 0.000 0.250 0.000 I6 0.000 0.000 0.000 0.000 0.000 0.286
Table 10 The ANP weight matrix for the learning and growth perspective (WL2)
WL2 L1 L2 L3 L4 L5 L6
L1 0.155 0.000 0.000 0.000 0.000 0.667 L2 0.363 1.000 0.714 0.000 0.000 0.000 L3 0.000 0.000 0.286 0.000 0.000 0.000 L4 0.000 0.000 0.000 1.000 0.000 0.000 L5 0.000 0.000 0.000 0.000 1.000 0.000 L6 0.482 0.000 0.000 0.000 0.000 0.333
Step 3 In this step, we constructed the BSC perspectives and their QFD dependencies as depicted in Figure 6. The first HoQ matrix represents the bridge between the financial measures and the customer measures. The HoQ requires the final weights of financial measures as an input. The final weight is a multiplication of the initial weights vector by the ANP weights matrix. We utilised Processes 3.1, 3.2, 3.3, and 3.4 to perform these calculations.
Figure 6 The BSC perspectives and their QFD dependencies (see online version for colours)
Customer Objective
(C)
THE FIRST QFD
MATRIX
Fina
ncia
l O
bjec
tive
(F)
Internal Processes Objective
(I)
THE SECONDQFD
MATRIX
Cus
tom
er
Obj
ectiv
e (C
)
Learning and Growth
objectives (L)
THE THIRD QFD
MATRIX Inte
rnal
Pr
oces
ses
Obj
ectiv
e (I)

352 M. Tavana et al.
Process 3.1 In this process, we used the AHP to calculate the initial weights of the financial measures with regards to their contribution to the overall business success. Table 11 presents the pairwise comparison matrix constructed for the financial measures to calculate their independent weight. Note that this matrix assesses the relative importance of the financial measures with regards to the overall business success, i.e., the influence of measures on realising the vision (rather than influences on each other which was the case in step 2.2).
Table 11 The pairwise comparison matrix for the impact of financial measures on the vision
F1 F2 F3 F4
F1 (1,1,1) (5/2,3,7/2) (2,5/2,3) (3/2,2,5/2)
F2 (2/7,1/3,2/5) (1,1,1) (1/3,2/5,1/2) (2/5,1/2,2/3)
F3 (1/3,2/5,1/2) (2,5/2,3) (1,1,1) (3/2,2,5/2)
F4 (2/5,1/2,2/3) (3/2,2,5/2) (2/5,1/2,2/3) (1,1,1)
Applying the AHP with Mikhailov’s techniques on Table 11 yields the following initial weights vector (WF1) for the financial objectives:
[ ]F1 0.420 .0121 0.27W 7 0.182=
Process 3.2 In this process, the final weights vector (WF) of the financial objectives is calculated by multiplying the independent weights vector by the ANP weights matrix and normalising the result:
( )
[ ]
F F2 F1
F2 F1
F
0.358 0 0 0 0.4200.124 1 0.6 0.667 0.0121
*0.32 0 0.4 0 0.2770.198 0 0 0.333 0.1
W Normali
82
0.150 0.461 0.245 0.1
se W * W
W * W
44W
⎡ ⎤ ⎡ ⎤⎢ ⎥ ⎢ ⎥⎢ ⎥ ⎢ ⎥⎢ ⎥ ⎢ ⎥⎢ ⎥ ⎢ ⎥⎣ ⎦ ⎣
=
⎦=
=
Process 3.3 In this process, WF is used as the weights of the financial objectives in the first QFD matrix. The impact strengths of the customer measures (‘Hows’) on the financial measures (‘Whats’) are provided through expert opinion in form of linguistic variables which has been transformed into triangular fuzzy numbers. Table12 presents the first fuzzy QFD matrix whose output is the fuzzy initial weights of the customer measures, denoted as 1cw .

A fuzzy-QFD approach to balanced scorecard using an ANP 353
Table 12 The first QFD matrix reflecting the impact of the customer objectives on the financial objectives (see online version for colours)
WF C1 C2 C3 C4 C5
F1 0.15 (5/2,3,7/2) (1,3/2,2) (1,3/2,2) (1,3/2,2) (1,3/2,2) F2 0.46 (1/2,1,3/2) (2,5/2,3) (1,3/2,2) (1,3/2,2) (1,3/2,2) F3 0.25 (5/2,3,7/2) (2,5/2,3) (5/2,3,7/2) (5/2,3,7/2) (2,5/2,3) F4 0.14 (2,5/2,3) (5/2,3,7/2) (2,5/2,3) (3/2,2,5/2) (2,5/2,3)
1cw (1.51,2.01,2.51) (1.92,2.42,2.92) (1.51,2.01,2.51) (1.44,1.94,2.44) (1.39,1.89,2.39)
By defuzzyfying and normalising 1cw , the initial weights vector for customer objectives (WC1) is obtained:
( )( ) [ ]C11 Normalise defuzzify 0.195 0.236 0.196 0.189 0.184cw w ==
Process 3.4 In this process, the final weights vector of the customer objectives (WC) is obtained by multiplying WC1 by the ANP weights matrix and normalising the result:
WC= Normalise (WC2 * WC1)
[ ]
C2 C1
C
0.08 0 0 0 0 0.1950.368 0.168 0 0 0 0.236
*0.236 0.46 1 0 0 0.1960.165 0.372 0 1 0 0.1890.151 0
W * W
0 0 1 0.184
0.213 0.205 0.201 0.193 0
W .188
⎡ ⎤ ⎡ ⎤⎢ ⎥ ⎢ ⎥⎢ ⎥ ⎢ ⎥⎢ ⎥ ⎢ ⎥⎢ ⎥ ⎢ ⎥⎢ ⎥ ⎢ ⎥⎢ ⎥ ⎢ ⎥⎣ ⎦ ⎣ ⎦
=
=
Step 4 In this step we construct the second QFD matrix by utilising processes 4.1 and 4.2.
Process 4.1 In this process, we construct the second HoQ to bridge between the customer measures and the internal processes measures (Table 13). The HoQ requires the final weights of the customer measures (WC) as an input which was obtained in the previous step.

354 M. Tavana et al.
Table 13 The second QFD matrix reflecting the impact of the internal processes objectives on the customer objectives (see online version for colours)
WC I1 I2 I3 I4 I5 I6
C1 0.21 (1/2,1,3/2) (5/2,3,7/2) (2,5/2,3) (3/2,2,5/2) (2,5/2,3) (2,5/2,3)
C2 0.20 (2,5/2,3) (2,5/2,3) (1,3/2,2) (3/2,2,5/2) (1,3/2,2) (1/2,1,3/2)
C3 0.20 (2,5/2,3) (2,5/2,3) (2,5/2,3) (3/2,2,5/2) (1/2,1,3/2) (1/2,1,3/2)
C4 0.19 (5/2,3,7/2) (2,5/2,3) (2,5/2,3) (5/2,3,7/2) (1,3/2,2) (1/2,1,3/2)
C5 0.19 (2,5/2,3) (3/2,2,5/2) (1,3/2,2) (3/2,2,5/2) (1,3/2,2) (1,3/2,2)
1IW (1.78,2.28,2.78) (2.01,2.52,3.02) (1.61,2.11,2.61) (1.70,2.20,2.70) (1.11,1.61,2.12) (0.92,1.42,1.92)
The output of this HoQ is the fuzzy initial weights of the internal processes measures
( )1IW . By defuzzyfying and normalising 1IW , the initial weights vector for the internal
processes objectives (WI1) is obtained:
( )( )[ ]
II1 1Normalise defuzzify
0.188&,0.207,&0.174&,0.181,&0.133&,0 117
W W
.
=
=
Process 4.2 In this process, the final weights vector of the internal processes objectives (WI) is obtained by multiplying the initial weights (WI1) by the ANP weights matrix (WI2) and normalising the result:
( )I I2 I1
I2 I1
I
1 0.333 0.269 0 0 0.714 0.1880 0.667 0 0 0 0 0.2070 0 0.167 0 0 0 0.174
*0 0 0.564 1 0.75 0 0.1810 0 0 0 0.25 0 0.1330 0 0 0 0 0.286 0.117
W Normal
0.173 0.184 0.167 0.167 0.
ise W * W
W * W
155 0.1
W
⎡ ⎤ ⎡ ⎤⎢ ⎥ ⎢ ⎥⎢ ⎥ ⎢ ⎥⎢ ⎥ ⎢ ⎥⎢ ⎥ ⎢ ⎥⎢ ⎥ ⎢ ⎥⎢ ⎥ ⎢ ⎥⎢ ⎥ ⎢ ⎥⎣ ⎦ ⎣
=
=
⎦
=
[ ]54
Step 5 In this step, we constructed the third QFD matrix by utilising Processes 5.1 and 5.2:
Process 5.1 In this process, we constructed the third HoQ to bridge between the internal processes measures and the learning and growth measures (Table 14). The HoQ uses the final weights of the internal processes measures (WI) which were obtained in the previous step.

A fuzzy-QFD approach to balanced scorecard using an ANP 355
Table 14 The third QFD matrixreflecting the impact of learning and growth objectives on the internal processes objectives (see online version for colours)
WI L1 L2 L3 L4 L5 L6
I1 0.173 (1,3/2,2) (2,5/2,3) (3/2,2,5/2) (1,3/2,2) (3/2,2,5/2) (1/2,1,3/2)
I2 0.184 (5/2,3,7/2) (5/2,3,7/2) (2,5/2,3) (2,5/2,3) (2,5/2,3) (3/2,2,5/2)
I3 0.167 (5/2,3,7/2) (5/2,3,7/2) (2,5/2,3) (2,5/2,3) (5/2,3,7/2) (3/2,2,5/2)
I4 0.167 (2,5/2,3) (5/2,3,7/2) (5/2,3,7/2) (2,5/2,3) (3/2,2,5/2) (3/2,2,5/2)
I5 0.155 (3/2,2,5/2) (2,5/2,3) (5/2,3,7/2) (1,3/2,2) (5/2,3,7/2) (3/2,2,5/2)
I6 0.154 (2,5/2,3) (5/2,3,7/2) (1,3/2,2) (2,5/2,3) (5/2,3,7/2) (2,5/2,3)
1LW (1.93,2.44,2.94) (2.35,2.85,3.35) (1.93,2.43,2.93) (1.68,2.18,2.68) (2.08,2.58,3.08) (1.41,1.91,2.41)
The output of this HoQ is the fuzzy initial weights of the learning and growth measures ( )1LW . By defuzzyfying and normalising 1LW , the initial weights vector for the
learning and growth objectives (WL1) is obtained:
( )( ) [ ]LL1 1Normalise defuzzify 0.169 0.198 0.169 0.152 0.179 0 3W W .1 3= =
Process 5.2 In this process, the final weights vector of the learning and growth objectives (WL) was obtained through multiplying the initial weights (WL1) by the ANP weights matrix (WL2) and normalising the result:
( )
[ ]
L L2 L1
L2 L1
L
0.155 0 0 0 0 0.667 0.1690.363 1 0.714 0 0 0 0.198
0 0 0.286 0 0 0 0.169*
0 0 0 1 0 0 0.1520 0 0 0 1 0
W Normalise W *
0.1790.482 0 0 0 0 0.333 0.133
0.171 0.191 0.162 0.154 0.16
W
W
1 0.161
* W
W
⎡ ⎤ ⎡ ⎤⎢ ⎥ ⎢ ⎥⎢ ⎥ ⎢ ⎥⎢ ⎥ ⎢ ⎥⎢ ⎥ ⎢ ⎥⎢ ⎥ ⎢ ⎥⎢ ⎥ ⎢ ⎥⎢ ⎥ ⎢ ⎥⎣ ⎦ ⎣ ⎦
=
=
=
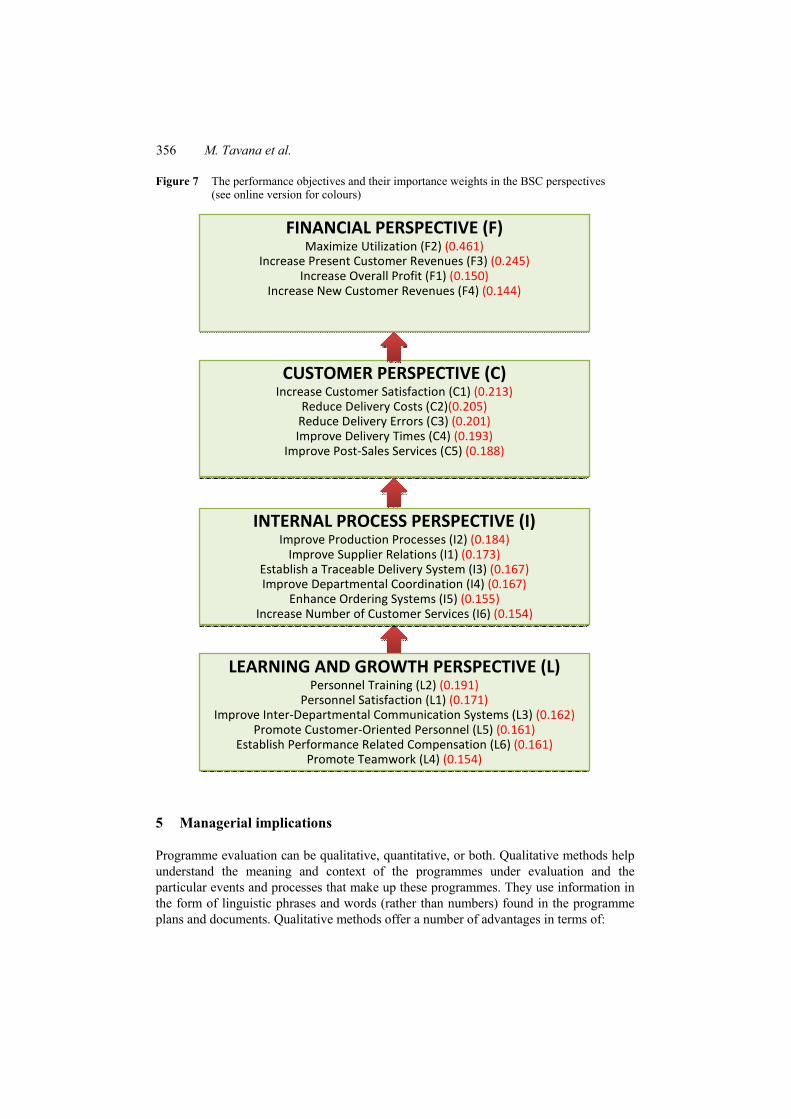
Upon the completion of this step, we acquired the final weights of the objectives in the four BSC perspectives, namely, WF, WC, WI, and WL. We prioritised the objectives in each perspective based on the final weight, as illustrated in Figure 7.
356 M. Tavana et al.
Figure 7 The performance objectives and their importance weights in the BSC perspectives (see online version for colours)
FINANCIAL PERSPECTIVE (F) Maximize Utilization (F2) (0.461)
Increase Present Customer Revenues (F3) (0.245) Increase Overall Profit (F1) (0.150)
Increase New Customer Revenues (F4) (0.144)
CUSTOMER PERSPECTIVE (C) Increase Customer Satisfaction (C1) (0.213)
Reduce Delivery Costs (C2)(0.205) Reduce Delivery Errors (C3) (0.201) Improve Delivery Times (C4) (0.193)
Improve Post‐Sales Services (C5) (0.188)
INTERNAL PROCESS PERSPECTIVE (I)Improve Production Processes (I2) (0.184) Improve Supplier Relations (I1) (0.173)
Establish a Traceable Delivery System (I3) (0.167) Improve Departmental Coordination (I4) (0.167)
Enhance Ordering Systems (I5) (0.155) Increase Number of Customer Services (I6) (0.154)
LEARNING AND GROWTH PERSPECTIVE (L) Personnel Training (L2) (0.191)
Personnel Satisfaction (L1) (0.171) Improve Inter‐Departmental Communication Systems (L3) (0.162)
Promote Customer‐Oriented Personnel (L5) (0.161) Establish Performance Related Compensation (L6) (0.161)
Promote Teamwork (L4) (0.154)
5 Managerial implications
Programme evaluation can be qualitative, quantitative, or both. Qualitative methods help understand the meaning and context of the programmes under evaluation and the particular events and processes that make up these programmes. They use information in the form of linguistic phrases and words (rather than numbers) found in the programme plans and documents. Qualitative methods offer a number of advantages in terms of:
A fuzzy-QFD approach to balanced scorecard using an ANP 357
1 understanding how decision makers perceive and evaluate programmes
2 providing useful and relevant information to decision makers
3 understanding the influence of social and institutional context on the programmes
4 investigating casual processes and providing information that can be used to evaluate or improve a programme.
Quantitative methods on the other hand apply when selected features of the programme are objective and could be defined or explained with numerical values or expressions. For example, highway expansion programmes have for many years been evaluated using quantitative procedures that take into consideration impacts measured with numerical units, such as construction costs or time savings. However, there are also social and environmental impacts that cannot be quantified with numerical values, such as the potential effects on congestion, road safety, pollution, or landscape.
The traditional programme evaluation methods focus on efficiency and well-known financial measures including but not limited to ratio analysis, payback method, return on investment, net present value, and the internal rate of return. These methods are best suited to measure the value of simple programmes. Unfortunately, evaluation methods that rely exclusively on financial metrics are not well-suited for newer generations of programmes. Newer programmes typically focus on effectiveness and less-known multi-criteria methods such as AHP, ANP, BSC, decision making trial and evaluation laboratory (DEMATEL), preference ranking organisation method for enrichment evaluation (PROMETHEE), technique for order preference by similarity to ideal solutions (TOPSIS), elimination EtChoixTraduisant la REalité (ELECTRE), and data envelopment analysis (DEA) among others. The programme evaluation and planning process must consider difficult to measure actions even though efficiency (doing things right) is much easier to measure than effectiveness (doing the right things).
The evaluation model proposed in this study uses:
1 the BSC technique to organise qualitative and quantitative data into empirical indicators of multiple outcome criteria
2 the QFD technique to create a linkage between the BSC perspectives
3 the ANP technique to consider the interactions between the performance measures in each BSC perspective.
The proposed method integrates the BSC with QFD and ANP to help decision makers understand the relations between the performance measures in different perspectives and the correlations among the performance measures in the same perspective. This understanding is intended to enhance effectiveness in organisational decision making and programme evaluation.
6 Conclusions and future research directions
Performance measurement is an essential activity of effective strategic planning and control as well as decision-making. The BSC is a popular tool that is applied by many businesses to assess their performance in diverse aspects of their organisation. The
358 M. Tavana et al.
method suggests that business performance should be evaluated not only by using financial indicators but also simultaneously considering non-financial indicators. We presented a novel approach for structuring and prioritising the performance measures in the BSC method. We combined BSC with QFD and fuzzy ANP to consider the interactions between and within the performance measures in each BSC perspective and presented a case study to demonstrate the applicability of the proposed approach. Our proposed approach considered the essentials of strategic and performance management in a systematic and holistic framework capable of handling imprecision and vagueness. We also considered the correlations among the objectives in each perspective using the ANP technique. The objectives in the BSC model were translated into the ‘Whats’ and ‘Hows’ of the QFD technique. We used QFD matrices to translate a set of objectives for a specific perspective in the BSC model to another set of objectives in order to quantify the causal relationships and the strength of association between them.
Despite its promising features, managers should be aware that the proposed approach does not automatically improve company performance. In addition, the translation of vision and strategy into operational measures is a complicated and dynamic process. While the proposed approach provides managers with a powerful analytical tool for putting their organisational strategy into action, they should be careful of the requirements for its implementation and use.
While more recent BSC systems are substantial improvements over the original concept, there is still room for improvement. Potential topics for future research into the field include:
1 additional studies on the comparison of the results obtained in this study with those that might be obtained with other methods
2 a consideration of the relationship between the BSC application in small, medium, and large organisations
3 an examination of the most appropriate ways to translate advances in measurement concepts efficiently and effectively into the framework proposed in this study
4 an examination of how different aspects of involvement in the implementation of the proposed method affect strategy-evaluation judgements.
Acknowledgements
The authors would like to thank the anonymous reviewers and the editor for their insightful comments and suggestions.
References Amado, C.A.F., Santos, S.P. and Marques, P.M. (2012) ‘Integrating the data envelopment analysis
and the balanced scorecard approaches for enhanced performance assessment’, Omega, Vol. 40, No. 3, pp.390–403.
Asosheh, A., Nalchigar, S., Jamporazmey, M. (2010) ‘Information technology project evaluation: an integrated data envelopment analysis and balanced scorecard approach’, Expert Systems with Applications, Vol. 37, No. 8, pp.5931–5938.
A fuzzy-QFD approach to balanced scorecard using an ANP 359
Ayağ, Z. and Özdemir, R.G. (2009) ‘A hybrid approach to concept selection through fuzzy analytic network process’, Computers & Industrial Engineering, Vol. 56, No. 1, pp.368–379.
Ballou, B., Heitger, D.I. and Tabor, R. (2003) ‘Nonfinancial performance measures in the healthcare industry’, Management Accounting Quarterly, Vol. 5, No. 1, pp.11–16.
Banker, R.D., Chang, H., Janakiraman, S.N. and Konstans, C. (2004) ‘A balanced scorecard analysis of performance metrics’, European Journal of Operational Research, Vol. 154, No. 2, pp.423–436.
Banker, R.D., Potter, G. and Srinivasan, D. (2000) ‘An empirical investigation of an incentive plan that includes nonfinancial performance measures’, Accounting Review, Vol. 75, No. 1, pp.65–92.
Besterfield, D.H., Besterfield-Michna, C., Besterfield, G.H. and Besterfield-Sacre, M. (2003) Total Quality Management, 3rd ed., Prentice Hall, NJ.
Bevilacqua, M., Ciarapica, F.E. and Giacchetta, G. (2006) ‘A fuzzy QFD approach to supplier selection’, Journal Purchasing and Supply Management, Vol. 12, No. 1, pp.14–27.
Bhagwat, R. and Sharma, M.K. (2007) ‘Performance measurement of supply chain management: a balanced scorecard approach’, Computers & Industrial Engineering, Vol. 53, No. 1, pp.43–62.
Bhattacharya, A., Sarkar, B. and Mukherjee, S.K. (2005) ‘Integrating AHP with QFD for robot selection under requirement perspective’, International Journal of Production Research, Vol. 43, No. 17, pp.3671–3685.
Bobillo, F., Delgado, M., Romero, J.G. and Lopez, E. (2009) ‘A semantic fuzzy expert system for a fuzzy balanced scorecard’, Expert Systems with Applications, Vol. 36, No.1, pp.423–433.
Büyüközkan, G., Feyzioğlu, O. and Ruan, D. (2007) ‘Fuzzy group decision-making to multiple preference formats in quality function deployment’, Computers in Industry, Vol. 58, No. 5, pp.392–402.
Carnevalli, J.A. and Miguel, P.C. (2008) ‘Review, analysis and classification of the literature on QFD – types of research, difficulties and benefits’, International Journal of Production Economics, Vol. 114, No. 2, pp.737–754.
Cebeci, U. (2009) ‘Fuzzy AHP-based decision support system for selecting ERP systems in textile industry by using balanced scorecard’, Expert Systems with Applications, Vol. 36, No. 5, pp.8900–8909.
Chan, L.K. and Wu, M.L. (2002) ‘Quality function deployment: a literature review’, European Journal of Operational Research, Vol. 143, No. 3, pp.463–497.
Chan, L.K. and Wu, M.L. (2005) ‘A systematic approach to quality function deployment with a full illustrative example’, Omega, Vol. 33, No. 2, pp.119–139.
Chen, C.H., Chang, Y.H. and Chou, S.Y. (2008) ‘Enhancing the design of air cargo transportation services via an integrated fuzzy approach’, Total Quality Management, Vol. 19, No. 6, pp.661–680.
Chen, C-C. (2009) ‘Integration of quality function deployment and process management in the semiconductor industry’, International Journal of Production Research, Vol. 47, No. 6, pp.1469–1484.
Chen, L.H. and Ko, W.C. (2008) ‘A fuzzy nonlinear model for quality function deployment considering Kano’s concept’, Mathematical and Computer Modelling, Vol. 48, Nos. 3–4, pp.581–593.
Chen, Y., Fung, R.Y.K. and Tang, J. (2005) ‘Fuzzy expected value modelling approach for determining target values of engineering characteristics in QFD’, International Journal of Production Research, Vol. 43, No. 17, pp.3583–3604.
Chen, Y.Z. and Ngai, E.W.T. (2008) ‘A fuzzy QFD program modelling approach using the method of imprecision’, International Journal of Production Research, Vol. 46, No. 24, pp.6823–6840.

360 M. Tavana et al.
Dağdeviren, M. and Yüksel, I. (2008) ‘Developing a fuzzy analytic hierarchy process (AHP) model for behavior-based safety management’, Information Sciences, Vol. 178, No. 6, pp.1717–1733.
Dağdeviren, M. and Yüksel, I. (2010) ‘A fuzzy analytic network process (ANP) model for measurement of the sectoral competition level (SCL)’, Expert Systems with Applications, Vol. 37, No. 2, pp.1005–1014.
Davis, S. and Albright, T. (2004) ‘An investigation of the effect of the balanced scorecard implementation on financial performance’, Management Accounting Research, Vol. 15, No. 2, pp.135–153.
Delice, E.K. and Güngör, Z. (2009) ‘A new mixed integer linear programming model for product development using quality function deployment’, Computers and Industrial Engineering, Vol. 57, No. 3, pp.906–912.
Dror, S. (2008) ‘The balanced scorecard versus quality award models as strategic frameworks’, Total Quality Management & Business Excellence, Vol. 19, No. 6, pp.583–593.
Eilat, H., Golany, B. and Shtub, A. (2008) ‘R&D project evaluation: an integrated DEA and balanced scorecard approach’, Omega, Vol. 36, No. 5, pp.895–912.
Frigo, M.L., Pustorino, P.G. and Krull, G.W. (2000) ‘The balanced scorecard for community banks: translating strategy into action’, Bank Accounting and Finance, Vol. 13, No. 3, pp.17–29.
Fu, C. and Yang, S. (2012) ‘The combination of dependence-based interval-valued evidential reasoning approach with balanced scorecard for performance assessment’, Expert Systems with Applications, Vol. 39, No. 3, pp.3717–3730.
Grigoroudis, E., Orfanoudaki, E. and Zopounidis, C. (2012) ‘Strategic performance measurement in a healthcare organisation: a multiple criteria approach based on balanced scorecard’, Omega, Vol. 40, No. 1, pp.104–119.
Gumus, A.T. and Yilmaz, G. (2010) ‘Sea vessel type selection via an integrated VAHP–ANP methodology for high-speed public transportation in Bosphorus’, Expert Systems with Applications, Vol. 37, No. 6, pp.4182–4189.
Guneri, A.F., Cengiz, M. and Seker, S. (2009) ‘A fuzzy ANP approach to shipyard location selection’, Expert Systems with Applications, Vol. 36, No. 4, pp.7992–7999.
Han, S.B., Chen, S.K., Ebrahimpour, M. and Sodhi, M.S. (2001) ‘A conceptual QFD planning model’, International Journal of Quality & Reliability Management, Vol. 18, No. 8, pp.796–812.
Hauser, J.R. and Clausing, D. (1988) ‘The house of quality’, Harvard Business Review’, Vol. 66, No. 3, pp.63–73.
Huang, H.C. (2009) ‘Designing a knowledge-based system for strategic planning: a balanced scorecard perspective’, Expert Systems with Applications, Vol. 36, No. 1, pp.209–218.
Huang, H.C., Lai, M.C. and Lin, L.H. (2011) ‘Developing strategic measurement and improvement for the biopharmaceutical firm: using the BSC hierarchy’, Expert Systems with Applications, Vol. 38, No. 5, pp.4875–4881.
Ip, Y.K. and Koo, L.C. (2004) ‘BSQ strategic formulation framework: a hybrid of balanced scorecard, SWOT analysis and quality function deployment’, Managerial Auditing Journal’, Vol. 19, No. 4, pp.533–543.
Kahraman, C., Ertay, T. and Büyüközkan, G. (2006) ‘A fuzzy optimization model for QFD planning process using analytic network approach’, European Journal of Operational Research, Vol. 171, No. 2, pp.390–411.
Kaplan, R.S. and Norton, D.P. (1992) ‘The balanced scorecard: measures that drive performance’, Harvard Business Review, Vol. 70, No. 1, pp.71–79.
Kaplan, R.S. and Norton, D.P. (1996) The Balanced Scorecard: Translating Strategy into Action, Harvard Business School Press, Boston, MA.

A fuzzy-QFD approach to balanced scorecard using an ANP 361
Karsak, E.E., Sozer, S. and Alptekin, S.E. (2002) ‘Product planning in quality function deployment using a combined analytic network process and goal programming approach’, Computers and Industrial Engineering, Vol. 44, No. 1, pp.171–190.
Kim, C.S. and Davidson, L.F. (2004) ‘The effects of IT expenditures on banks’ business performance: using a balanced scorecard approach’, Managerial Finance, Vol. 30, No. 6, pp.28–45.
Kim, D.H. and Kim, K.J. (2009) ‘Robustness indices and robust prioritization in QFD’, Expert Systems with Applications, Vol. 36, No. 2, pp.2651–2658.
Koo, L.C. (1998) ‘Building balanced scorecard on the house of quality’, The 1st Industrial Engineering and Management (IEM) Symposium Transformational Strategy Towards the 21st Century, Hong Kong.
Kuo, Y.F. and Chen, P.C. (2008) ‘Constructing performance appraisal indicators for mobility of the service industries using fuzzy Delphi method’, Expert Systems with Applications, Vol. 35, No. 4, pp.1930–1939.
Lee, A.H.I., Chen, W.C. and Chang, C.J. (2008) ‘A fuzzy AHP and BSC approach for evaluating performance of IT department in the manufacturing industry in Taiwan’, Expert Systems with Applications, Vol. 34, No. 1, pp.96–107.
Lee, S.F. and Lo, K.K. (2000) ‘Strategy formulation framework for vocational education: integrating SWOT analysis, balanced scorecard, QFD methodology and MBNQA education criteria’, Managerial Auditing Journal, Vol. 15, No. 8, pp.407–423.
Lee, S.F. and SaiOnKo, A. (2000) ‘Building balanced scorecard with SWOT analysis, and implementing Sun Tzu’s the art of business management strategies on QFD methodology’, Managerial Auditing Journal, Vol. 15, Nos. 1/2, pp.68–76.
Leung, L.C., Lam, K.C. and Cao, D. (2006) ‘Implementing the balanced scorecard using the analytic hierarchy process and the analytic network process’, Journal of the Operational Research Society, Vol. 57, No. 6, pp.682–691.
Li, Y.L., Chin, K.S. and Luo, X.G. (2012) ‘Determining the final priority ratings of customer requirements in product planning by MDBM and BSC’, Expert Systems with Applications, Vol. 39, No. 1, pp.1243–1255.
Li, Y.L., Huang, M., Chin, K.S., Luo, X.G. and Han, Y. (2011) ‘Integrating preference analysis and balanced scorecard to product planning house of quality’, Computers & Industrial Engineering, Vol. 60, No. 2, pp.256–268.
Lin, C.T. and Chen, Y.T. (2004) ‘Bid/no-bid decision-making: a fuzzy linguistic approach’, International Journal of Project Management, Vol. 22, No. 7, pp.585–593.
Lin, Y.H., Cheng, H.P., Tseng, M.L. and Tsai, J.C.C. (2010) ‘Using QFD and ANP to analyze the environmental production requirements in linguistic preferences’, Expert Systems with Applications, Vol. 37, No. 3, pp.2186–2196.
Liu, C.H. and Wu, H.H. (2008) ‘A fuzzy group decision-making approach in quality function deployment’, Quality and Quantity, Vol. 42, No. 4, pp.527–540.
Liu, S-T. (2005) ‘Rating design requirements in fuzzy quality function deployment via a mathematical programming approach’, International Journal of Production Research, Vol. 43, No. 3, pp.497–513.
Lowe, A., Ridgway, K. and Atkinson, H. (2000) ‘QFD in new production technology evaluation’, International Journal of Production Economics, Vol. 67, No. 2, pp.103–112.
Matook, S. and Indulska, M. (2009) ‘Improving the quality of process reference models: a quality function deployment-based approach’, Decision Support Systems, Vol. 47, No. 1, pp.60–71.
McPhail, R., Heringtonb, C. and Guilding, C. (2008) ‘Human resource managers’ perceptions of the applications and merit of the balanced scorecard in hotels’, International Journal of Hospitality Management, Vol. 27, No. 4, pp.623–631.
362 M. Tavana et al.
Michalska, J. (2005) ‘The usage of the balanced scorecard for the estimation of the enterprise’s effectiveness’, Journal of Materials Processing Technology, 15 May, Vols. 162–163, pp.751–758.
Mikhailov, L. (2000) ‘A fuzzy programming method for deriving priorities in the analytic hierarchy process’, Journal of the Operational Research Society, Vol. 51, No. 3, pp.341–349.
Mikhailov, L. (2003) ‘A fuzzy approach to deriving priorities from interval pairwise comparison judgements’, European Journal of Operational Research, Vol. 159, No. 3, pp.687–704.
Norton, D.P., Contrada, M.G. and LoFrumento, T. (1997) ‘Case study: how chase Manhattan Bank uses the balanced scorecard’, Banking Accounting and Finance, Vol. 11, No. 1, pp.3–11.
Olve, N. and Sjöstrand, A. (2002) The Balanced Scorecard, Capstone Publishing, Oxford. Promentilla, M.A.B., Furuichi, T., Ishii, K. and Tanikawa, N. (2008) ‘A fuzzy analytic network
process for multi-criteria evaluation of contaminated site remedial counter-measures’, Journal of Environmental Management, Vol. 88, No. 3, pp.479–495.
Saaty, T.L. (2006) ‘Rank from comparisons and from ratings in the analytic hierarchy/network processes’, European Journal of Operational Research, Vol. 168, No. 2, pp.557–570.
Said, A.A., HassabElnaby, H.R. and Wier, B. (2003) ‘An empirical investigation of the performance consequences of nonfinancial measures’, Journal of Management Accounting Research’, Vol. 15, No. 1, pp.193–223.
SaiOnKo, A. and Lee, S.F. (2000) ‘Implementing the strategic formulation framework for the banking industry of Hong Kon’, Managerial Auditing Journal, Vol. 115, No. 9, pp.469–477.
Sandstrom, J. and Toivanen, J. (2002) ‘The problem of managing product development engineers: can the balanced scorecard be an answer?’, International Journal of Production Economics, Vol. 78, No. 1, pp.79–90.
Schneiderman, A.M. (1999) ‘Why balanced scorecards fail’, Journal of Strategic Performance Measurement, Special edition, pp.6–11.
Şen, C.G. and Baraçlı, H. (2010) ‘Fuzzy quality function deployment based methodology for acquiring enterprise software selection requirements’, Expert Systems with Applications, Vol. 37, No. 4, pp.3415–3426.
Sevkli, M., Oztekin, A., Uysal, O., Torlak, G., Turkyilmaz, A. and Delen, D. (2012) ‘Development of a fuzzy ANP based SWOT analysis for the airline industry in Turkey’, Expert Systems with Applications, Vol. 39, No. 1, pp.14–24.
Sharma, J.R. and Rawani, A.M. (2008) ‘Quality function deployment: a comprehensive literature review’, International Journal of Data Analysis Techniques and Strategies, Vol. 1, No. 1, pp.178–103.
Sinclair, D. and Zairi, M. (2001) ‘An empirical study of key elements of total quality based performance systems: a case study approach in the service industry sector’, Total Quality Management, Vol. 12, No. 4, pp.535–550.
Tan, B.L., Tang, N.K.H. and Forrester, P.L. (2004) ‘Application of QFD for e-business planning’, Production Planning & Control, Vol. 15, No. 8, pp.802–818.
Tuzkaya, U.R. and Önüt, S. (2008) ‘A fuzzy analytic network process based approach to transportation-mode selection between Turkey and Germany: a case study’, Information Sciences, Vol. 178, No. 15, pp.3133–3146.
Valderrama, T.G., Mendigorri, E.M. and Bordoy, D.R. (2009) ‘Relating the perspectives of the balanced scorecard for R&D by means of DEA’, European Journal of Operational Research, Vol. 196, No. 3, pp.1177–1189.
Wang, R.C. and Chuu, S.J. (2004) ‘Group decision-making using a fuzzy linguistic approach for evaluating the flexibility in a manufacturing system’, European Journal of Operational Research, Vol. 154, No. 3, pp.563–572.
Wiersma, E. (2009) ‘For which purposes do managers use balanced scorecards? An empirical study’, Management Accounting Research, Vol. 20, No. 4, pp.239–251.
A fuzzy-QFD approach to balanced scorecard using an ANP 363
Wong, F.W.H., Lam, P.T.I. and Chan, Es.H.W. (2009) ‘Optimising design objectives using the balanced scorecard approach’, Design Studies, Vol. 30, No. 4, pp.369–392.
Wu, H.Y., Tzeng, G.H. and Chen, Y.H. (2009) ‘A fuzzy MCDM approach for evaluating banking performance based on balanced scorecard’, Expert Systems with Applications, Vol. 36, No. 6, pp.10135–10147.
Yager, R.R. (1995) ‘An approach to ordinal decision making’, International Journal of Approximate Reasoning, Vol. 12, Nos. 3–4, pp.237–261.
Yang, C.L., Chuang, S.P. and Huang, R.H. (2009) ‘Manufacturing evaluation system based on AHP/ANP approach for wafer fabricating industry’, Expert Systems with Applications, Vol. 36, No. 8, pp.11369–11377.
Yuan, F.C. and Chiu, C. (2009) ‘A hierarchical design of case-based reasoning in the balanced scorecard application’, Expert Systems with Applications, Vol. 13, No. 1, pp.333–342.
Yüksel, i. and Dağdeviren, M. (2010) ‘Using the fuzzy analytic network process (ANP) for balanced scorecard (BSC): a case study for a manufacturing firm’, Expert Systems with Applications, Vol. 37, No. 2, pp.1270–1278.
Zadeh, L.A. (1965) ‘Fuzzy sets’, Information and Control, Vol. 8, No. 3, pp.338–353. Zarei, M., Fakhrzad, M.B. and JamaliPaghaleh, M. (2011) ‘Food supply chain leanness using a
developed QFD model’, Journal of Food Engineering, Vol. 102, No. 1, pp.25–33. Zhai, L.Y., Khoo, L.P. and Zhong, Z.W. (2010) ‘Towards a QFD-based expert system: a novel
extension to fuzzy QFD methodology using rough set theory’, Expert Systems with Applications, Vol. 37, No. 12, pp.8888–8896.
Zimmermann, H.J. (1991) Fuzzy Set Theory and Its Applications, 2nd ed., Kluwer Academic Publishers, Boston/Dordrecht/London.
Notes 1 Some of the names and data presented in this study are changed to protect the anonymity of
the company.
Related Documents