Delft University of Technology A forward collision avoidance algorithm based on driver braking behavior Xiong, Xiaoxia; Wang, Meng; Cai, Yingfeng; Cheng, Long; Farah, Haneen; Hagenzieker, Marjan DOI 10.1016/j.aap.2019.05.004 Publication date 2019 Document Version Final published version Published in Accident Analysis and Prevention Citation (APA) Xiong, X., Wang, M., Cai, Y., Cheng, L., Farah, H., & Hagenzieker, M. (2019). A forward collision avoidance algorithm based on driver braking behavior. Accident Analysis and Prevention, 129, 30-43. https://doi.org/10.1016/j.aap.2019.05.004 Important note To cite this publication, please use the final published version (if applicable). Please check the document version above. Copyright Other than for strictly personal use, it is not permitted to download, forward or distribute the text or part of it, without the consent of the author(s) and/or copyright holder(s), unless the work is under an open content license such as Creative Commons. Takedown policy Please contact us and provide details if you believe this document breaches copyrights. We will remove access to the work immediately and investigate your claim. This work is downloaded from Delft University of Technology. For technical reasons the number of authors shown on this cover page is limited to a maximum of 10.

Welcome message from author
This document is posted to help you gain knowledge. Please leave a comment to let me know what you think about it! Share it to your friends and learn new things together.
Transcript

Delft University of Technology
A forward collision avoidance algorithm based on driver braking behavior
Xiong, Xiaoxia; Wang, Meng; Cai, Yingfeng; Cheng, Long; Farah, Haneen; Hagenzieker, Marjan
DOI10.1016/j.aap.2019.05.004Publication date2019Document VersionFinal published versionPublished inAccident Analysis and Prevention
Citation (APA)Xiong, X., Wang, M., Cai, Y., Cheng, L., Farah, H., & Hagenzieker, M. (2019). A forward collision avoidancealgorithm based on driver braking behavior. Accident Analysis and Prevention, 129, 30-43.https://doi.org/10.1016/j.aap.2019.05.004
Important noteTo cite this publication, please use the final published version (if applicable).Please check the document version above.
CopyrightOther than for strictly personal use, it is not permitted to download, forward or distribute the text or part of it, without the consentof the author(s) and/or copyright holder(s), unless the work is under an open content license such as Creative Commons.
Takedown policyPlease contact us and provide details if you believe this document breaches copyrights.We will remove access to the work immediately and investigate your claim.
This work is downloaded from Delft University of Technology.For technical reasons the number of authors shown on this cover page is limited to a maximum of 10.

Green Open Access added to TU Delft Institutional Repository
‘You share, we take care!’ – Taverne project
https://www.openaccess.nl/en/you-share-we-take-care
Otherwise as indicated in the copyright section: the publisher is the copyright holder of this work and the author uses the Dutch legislation to make this work public.
Contents lists available at ScienceDirect
Accident Analysis and Prevention
journal homepage: www.elsevier.com/locate/aap
A forward collision avoidance algorithm based on driver braking behaviorXiaoxia Xionga, Meng Wangb, Yingfeng Caia,⁎, Long Chena, Haneen Farahb, Marjan Hagenziekerba School of Automotive and Traffic Engineering, Jiangsu University, 301 Xuefu Road, 212013, Zhenjiang, Jiangsu, ChinabDepartment of Transport and Planning, Faculty of Civil Engineering and Geosciences, Delft University of Technology, Stevinweg 1, 2628 CN Delft, Netherlands
A R T I C L E I N F O
Keywords:Collision avoidanceDeceleration curveCluster analysisFuzzy logicDriver braking behavior profileDynamic time warping
A B S T R A C T
Measuring risk is critical for collision avoidance. The paper aims to develop an online risk level classificationalgorithm for forward collision avoidance systems. Assuming risk levels are reflected by braking profiles, de-celeration curves from critical evasive braking events from the Virginia “100-car” database were first extracted.The curves are then clustered into different risk levels based on spectrum clustering, using curve distance andcurve changing rate as dissimilarity metrics among deceleration curves. Fuzzy logic rules of safety indicators atcritical braking onset for risk classification were then extracted according to the clustered risk levels. The safetyindicators include time to collision, time headway, and final relative distance under emergency braking, whichcharacterizes three kinds of uncertain critical conditions respectively. Finally, the obtained fuzzy risk levelclassification algorithm was tested and compared with other Automatic Emergency Braking (AEB) algorithmsunder Euro-NCAP testing scenarios in simulation. Results show the proposed algorithm is promising in balancingthe objectives of avoiding collision and reducing interference with driver’s normal driving compared with otheralgorithms.
1. Introduction
Traffic accidents cause approximately 1.25 million deaths per yearworldwide and between 20–50 million non-fatal injuries with manyresulting in disabilities according to the World Health Organization(WHO) (World Health Organization, 2016). To reduce traffic accidents,collision avoidance system (CAS) has received much attention and ef-forts from industry and research community over the past years(Cabrera et al., 2012; Wang et al., 2013; Brännström et al., 2014). CASis one of the active safety technologies that could identify hazardousdriving situations and actively assist drivers in avoiding or mitigatingaccidents (like Automatic Emergency Braking, AEB, as well as Auto-matic Emergency Steering, AES) (Brännström et al., 2014). To de-termine when the automatic overriding/intervention should be evoked(only automatic braking is considered in the current study), a robustreal time risk level classification algorithm is needed, which serves asthe core part of a CAS. However, to date risk level classification is stillan open question in the literature due to the uncertainty and complexityof the interacting driver-vehicle-road-environment system (Halim et al.,2016; Mullakkal-Babu et al., 2017)
For online CAS implementation, risk associated with a driving si-tuation (situational urgency/criticality) is generally measured usingsafety indicators based on the initial or predicted state of vehicle
interaction (Mullakkal-Babu et al., 2017). These safety indicators can betypically categorized into three main types: distance-based, time-basedand deceleration-based indicators. Distance-based indicators usuallycalculate critical braking distance dbr based on vehicle kinematics anddynamics, and have been widely used in AEB algorithms (Fujita et al.,1995; Doi et al., 1994; Seiler et al., 1998). Time-based safety indicatorshave also been well researched thanks to their intuitive accordancewith human natural judgment of situational urgency/criticality. Typicaltime-based safety indicators include Time To Collision (TTC), TimeHeadWay (THW) or time gap, Time to Brake (TTB), and Time to Last-Second-Brake (TLSB) (Hayward, 1972; Goodrich et al., 1999; Kelleret al., 2011; Zhang et al., 2006). Deceleration-based indicator typicallymeasures the required deceleration level areq for the subject vehicle tosuccessfully avoid a potential forward collision with its leading vehicle(Hillenbrand et al., 2006; Brannstrom et al., 2008). However, thesesafety indicators are usually calculated under different assumptions(such as constant vehicle speed and/or acceleration/deceleration),which may lead to poor risk estimation performance under situationsinconsistent with the assumption. For example, TTC does not reflectwell the collision risk when the leading vehicle suddenly brakes(especially in small relative distance scenario), while the performanceof THW suffers when the relative speed between the two vehicles ishigh (with subject vehicle speed being higher). Recently, a field-based
https://doi.org/10.1016/j.aap.2019.05.004Received 11 January 2019; Received in revised form 3 April 2019; Accepted 5 May 2019
⁎ Corresponding author.E-mail address: [email protected] (Y. Cai).
Accident Analysis and Prevention 129 (2019) 30–43
Available online 16 May 20190001-4575/ © 2019 Elsevier Ltd. All rights reserved.
T
safety indicator was proposed by regarding driving risk as a spatial field(Wang et al., 2015a) However, the auxiliary parameters under thiscomplex safety field assumption (such as driver physiological indices)can vary due to different road conditions and driving styles, makingsuch field-based indicators difficult to calibrate and validate (Liu andWu, 2009). For all these reasons, no clear/definite quantitative re-lationship between these safety indicators and risk levels has been es-tablished so far.
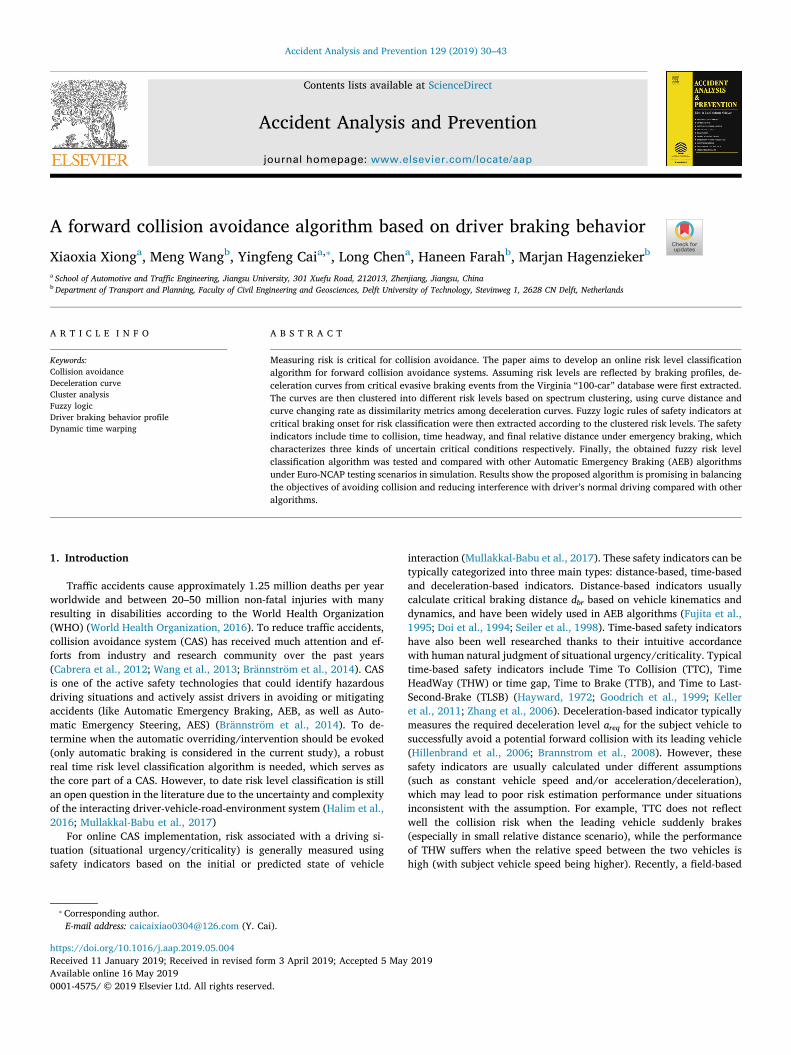
Another stream of literature attempts to measure situational ur-gency/criticality from driver’s braking profiles. MacCall, et al. developsa Bayesian framework to evaluate situation criticality by jointly asses-sing the need for braking and the probability of performing braking bydriver based on real-world driver baking behavior data (MacCall andTrivedi, 2007). Wang, et al. took average deceleration, maximum de-celeration, and maximum kinetic energy difference during decelerationas feature variables and clustered observed deceleration profiles intodifferent risk levels for risk causation analysis using K-means clusteringtechnique (Wang et al., 2015b). Kluger et al. extracted feature variablesfrom Discrete Fourier Transformed (DFT) longitudinal accelerationtime series and used K-means clustering to identify critical events fromnaturalistic driving data (NDS) (Kluger et al., 2016). As these decel-eration measures are actually consistent with the initial state measuresin characterizing the risk of a driving situation (in other words, a morecritical braking deceleration profile (like with higher deceleration level)generally indicates the initial state of the situation is at higher risk,assuming drivers have made evasive braking reaction to the situation,see Fig. 1), indices developed from naturalistic deceleration profileshave also been used for online driving risk level classification study.
Wada et al. obtained a series of proximity index KdB and relativedistance data at brake initiation (of expert drivers using experimentalcar) and established a brake judgement line based on these two in-dicators using least squares method (Wada et al., 2010). Lee et al. usedcumulative frequency diagram of acceleration/deceleration at a roadsection for measuring risk levels of deceleration profiles, and trained aneural network model using NGSIM trajectory data to predict potentialsevere deceleration for collision warning (Lee and Yeo, 2016). Moonet al. classified offline driving sequence samples into safe (decelera-tion> -2m/s2), medium risk (-2m/s2≥deceleration>−4m/s2), anddangerous (deceleration<−4m/s2) levels according to predefinedthresholds and determined TTC and Warning Index thresholds of dif-ferent hazard levels using confusion matrix method (Moon et al., 2009).However, the classified risk levels of the deceleration profiles in thesestudies were not validated by human inspectors (e.g., validating if anear-crash indeed happens or not by checking video footages in nat-uralistic driving study (Kluger et al., 2016)), meaning no true risk labelswere available for the selected deceleration samples. This can questionthe validity of the classification results.
As discussed above, the quantification of safety indicator and risk
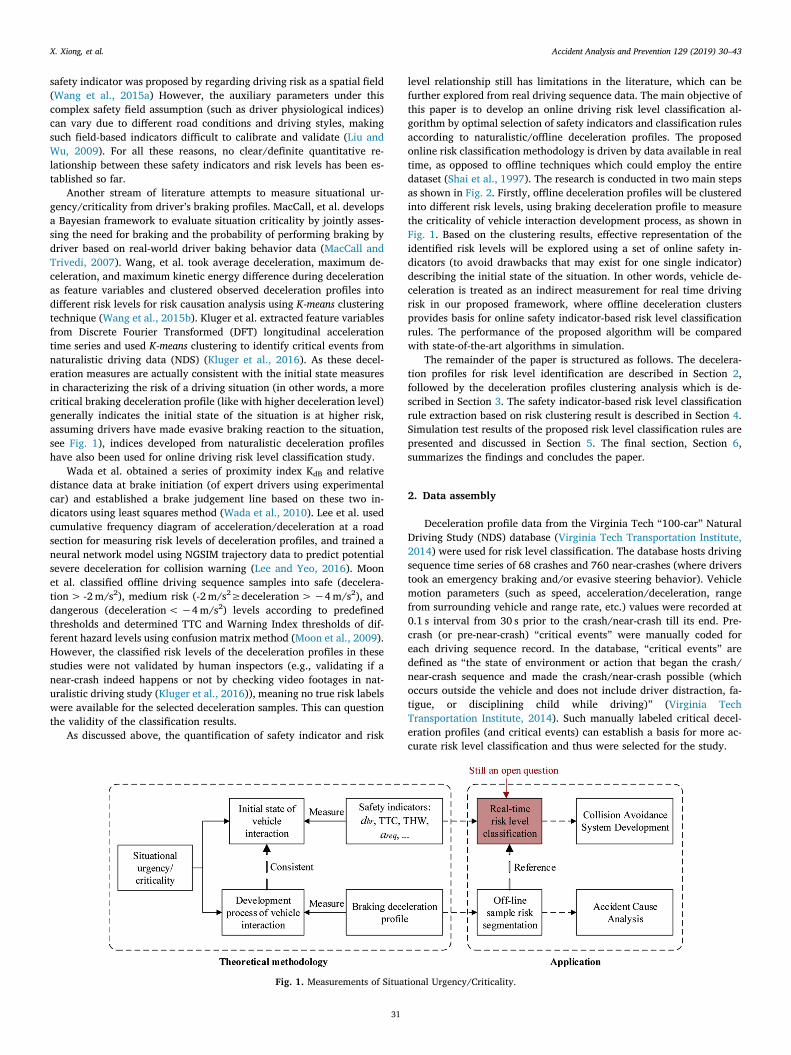
level relationship still has limitations in the literature, which can befurther explored from real driving sequence data. The main objective ofthis paper is to develop an online driving risk level classification al-gorithm by optimal selection of safety indicators and classification rulesaccording to naturalistic/offline deceleration profiles. The proposedonline risk classification methodology is driven by data available in realtime, as opposed to offline techniques which could employ the entiredataset (Shai et al., 1997). The research is conducted in two main stepsas shown in Fig. 2. Firstly, offline deceleration profiles will be clusteredinto different risk levels, using braking deceleration profile to measurethe criticality of vehicle interaction development process, as shown inFig. 1. Based on the clustering results, effective representation of theidentified risk levels will be explored using a set of online safety in-dicators (to avoid drawbacks that may exist for one single indicator)describing the initial state of the situation. In other words, vehicle de-celeration is treated as an indirect measurement for real time drivingrisk in our proposed framework, where offline deceleration clustersprovides basis for online safety indicator-based risk level classificationrules. The performance of the proposed algorithm will be comparedwith state-of-the-art algorithms in simulation.
The remainder of the paper is structured as follows. The decelera-tion profiles for risk level identification are described in Section 2,followed by the deceleration profiles clustering analysis which is de-scribed in Section 3. The safety indicator-based risk level classificationrule extraction based on risk clustering result is described in Section 4.Simulation test results of the proposed risk level classification rules arepresented and discussed in Section 5. The final section, Section 6,summarizes the findings and concludes the paper.
2. Data assembly
Deceleration profile data from the Virginia Tech “100-car” NaturalDriving Study (NDS) database (Virginia Tech Transportation Institute,2014) were used for risk level classification. The database hosts drivingsequence time series of 68 crashes and 760 near-crashes (where driverstook an emergency braking and/or evasive steering behavior). Vehiclemotion parameters (such as speed, acceleration/deceleration, rangefrom surrounding vehicle and range rate, etc.) values were recorded at0.1 s interval from 30 s prior to the crash/near-crash till its end. Pre-crash (or pre-near-crash) “critical events” were manually coded foreach driving sequence record. In the database, “critical events” aredefined as “the state of environment or action that began the crash/near-crash sequence and made the crash/near-crash possible (whichoccurs outside the vehicle and does not include driver distraction, fa-tigue, or disciplining child while driving)” (Virginia TechTransportation Institute, 2014). Such manually labeled critical decel-eration profiles (and critical events) can establish a basis for more ac-curate risk level classification and thus were selected for the study.
Fig. 1. Measurements of Situational Urgency/Criticality.
X. Xiong, et al. Accident Analysis and Prevention 129 (2019) 30–43
31
2.1. Preliminary data selection
Based on the “100-car” database, specific deceleration profile sam-ples were chosen following two main criteria as following:
1) Type of conflict/driver reaction399 cases of rear-end conflict type were first chosen to extract
sample deceleration profiles, as they fall within the scope of forwardcollision avoidance study. Among them, 385 near-crash cases wereselected as they have complete deceleration curves (braking process)that may be interrupted by crash occurrence otherwise. Since the cur-rent study only focuses on collision avoidance timing by automaticbraking, 121 cases of near-crashes avoided by steering or braking-and-steering were not considered. In addition, 86 cases of rear-end nearcrashes involving the subject vehicle (SV) changing lane or other ve-hicle cutting in were dropped from analysis, leading to 178 cases foranalysis. The excluded events may feature different driver risk per-ception processes and result in different deceleration patterns, whichmay affect deceleration profile-based risk level classification results.
2) Data ValidityCases without valid and complete vehicle speed, acceleration/de-
celeration, or range value (i.e., distance from the subject vehicle toleading vehicles), like negative or zero values recorded for missingvalue cases, were dropped as the analysis method used in this studyrequires such valid and complete data. Speed and range data were alsomanually checked via a visualized tool “Natware” (developed byChalmers University of Technology for “100-car” database analysis)(Dozza, 2013) to validate driving data of the leading vehicle (i.e.,principle other vehicle, POV). For example, the range rate between SVand POV should be negative when the subject driver starts to brake inreaction to the recorded “critical event”. A total of 127 rear-end nearcrashes (from 45 different drivers) were obtained following the twodata selection criteria above.
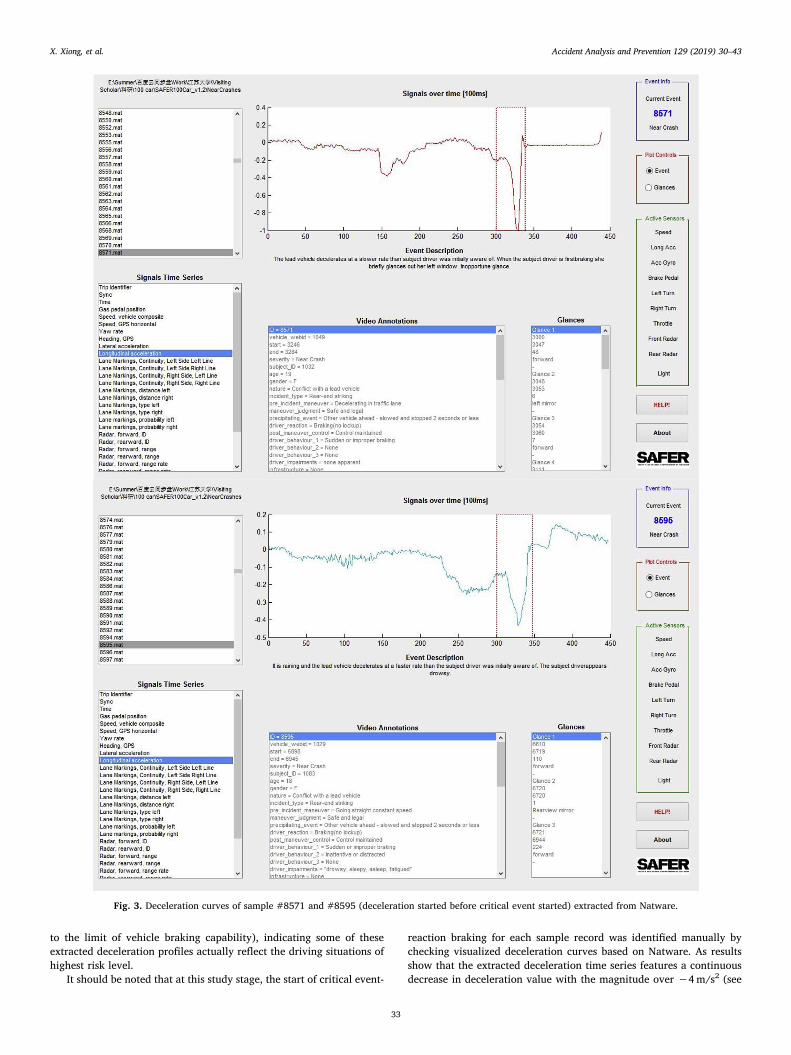
Note that some braking may have already been applied prior to thestart of the critical event (probably due to other non-critical eventreasons like normal speed adjustment when a SV approaches an inter-section/toll booth) and such braking onsets are irrelevant to the re-search topic (see Fig. 3, where the left red dashed line represents thestart of a “critical event”). To maintain consistent analysis of the de-celeration profiles, a notation of “critical event-reaction braking” wasdefined in the next section to identify the start of braking in reaction tothe recorded “critical event”. Situational urgency/criticality (measuredby online safety indicators) at the start of “critical event-reactionbraking” is regarded as the initial state of vehicle interaction.
2.2. Critical braking profile extraction
Specifically, a “critical event-reaction braking” was defined as asudden increase in brake pedal pressure resulting in a sharp drop indeceleration curve (i.e., the “elbow” point of the deceleration curveafter the start of critical event in Fig. 3). To illustrate this concept,consider a typical car-following scenario (near-crash) as an example:
Phase I – subject driver starts normal braking (within -1˜-2 m/s2
deceleration level) as POV decelerated;Phase II - subject driver brakes much harder (over -3˜−4m/s2 de-
celeration level) to avoid rear-end striking as POV decelerated at afaster rate (even to a full stop) than the subject driver’s initial ex-pectation.
In this case example, the moment when the driver started brakingcould be regarded as “normal event-reaction braking”, with the normalevent being POV decelerating at a driver-expected moderate rate; incontrast, the moment when the driver braked much harder refers to thestart of “critical event-reaction braking”, with the critical event beingPOV decelerating at a fast rate. It could be noted that the time intervalbetween the start of normal event-reaction braking and critical event-reaction braking could vary (may even overlap) from case to case de-pending on the driver’s perceived risk level of events (commonly knownas hazard perception) (Crick and McKenna, 1992; Haworth et al., 2005;Evans and Macdonald, 2002). As such, it could be believed that the startof “critical event-reaction braking” actually represents the momentwhen the driver deems the current deceleration level to be unsafe andtakes evasive reaction.
Accordingly, in developing a collision avoidance algorithm, to avoidpotential driver aversion, the timing of a normal event-reaction brakingis expected to be determined by a driver, that is no warning/overridingis needed at this stage; whereas a critical event-reaction braking in-dicates an unsafe situation and an automatic emergency braking isexpected to be implemented by CAS when a critical event-reactionbraking of highest risk level is predicted (under the assumption thatcritical event-reaction braking of highest risk level in a near-crash re-presents the final “successful” last-second braking, which would bediscussed in more details in Section 4 and validated via simulation inSection 5). Thus it is important to distinguish normal vs. critical event-reaction braking for collision avoidance algorithm development.
Based on the “critical event-reaction braking” notation above, thestart of critical event-reaction braking were manually identified andchecked via Natware. Deceleration profiles with no clear sign of evasivereaction to the critical event (i.e., with no clear “elbow” point in thedeceleration curve after critical event started, as shown in Fig. 3) wereexcluded from analysis to avoid biasness in determining the startingpoint of “critical event-reaction braking” (a total of 30 such cases wereexcluded from the 127 rear-end near crashes sample cases obtainedabove). Finally, deceleration time series for each chosen sample recordwere extracted from the start of “critical event-reaction braking” to themoment when deceleration value reaching its maximum, yielding atotal of 97 such deceleration time series (from 43 different drivers) asthe final deceleration profile sample space (for situational urgency/criticality assessment). The statistical measures of the decelerationprofile sample are presented in Fig. 4. It could be seen that the initialdeceleration of some critical event-reaction braking sequences arebelow zero, indicating these sample drivers had already started normalevent-reaction braking prior to critical event-reaction braking; also, themaximum deceleration in the sample could reach -10m/s2 level (close
Fig. 2. Risk level classification methodology proposed in the paper.
X. Xiong, et al. Accident Analysis and Prevention 129 (2019) 30–43
32
to the limit of vehicle braking capability), indicating some of theseextracted deceleration profiles actually reflect the driving situations ofhighest risk level.
It should be noted that at this study stage, the start of critical event-
reaction braking for each sample record was identified manually bychecking visualized deceleration curves based on Natware. As resultsshow that the extracted deceleration time series features a continuousdecrease in deceleration value with the magnitude over −4m/s2 (see
Fig. 3. Deceleration curves of sample #8571 and #8595 (deceleration started before critical event started) extracted from Natware.
X. Xiong, et al. Accident Analysis and Prevention 129 (2019) 30–43
33
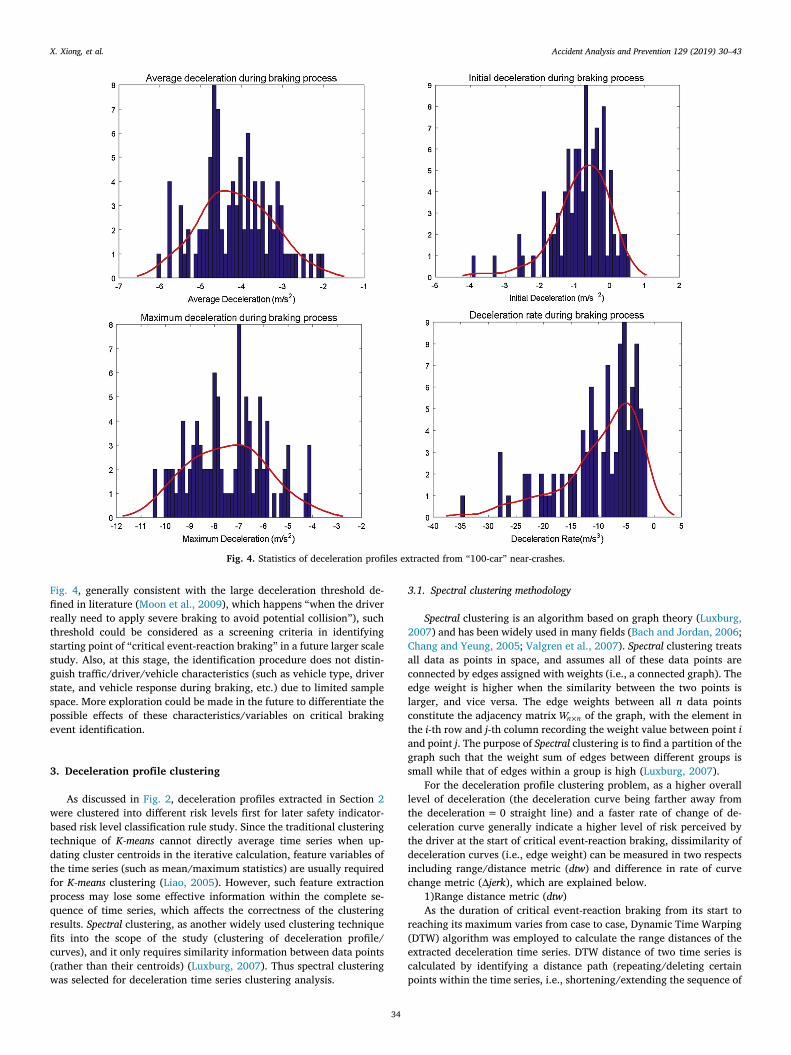
Fig. 4, generally consistent with the large deceleration threshold de-fined in literature (Moon et al., 2009), which happens “when the driverreally need to apply severe braking to avoid potential collision”), suchthreshold could be considered as a screening criteria in identifyingstarting point of “critical event-reaction braking” in a future larger scalestudy. Also, at this stage, the identification procedure does not distin-guish traffic/driver/vehicle characteristics (such as vehicle type, driverstate, and vehicle response during braking, etc.) due to limited samplespace. More exploration could be made in the future to differentiate thepossible effects of these characteristics/variables on critical brakingevent identification.
3. Deceleration profile clustering
As discussed in Fig. 2, deceleration profiles extracted in Section 2were clustered into different risk levels first for later safety indicator-based risk level classification rule study. Since the traditional clusteringtechnique of K-means cannot directly average time series when up-dating cluster centroids in the iterative calculation, feature variables ofthe time series (such as mean/maximum statistics) are usually requiredfor K-means clustering (Liao, 2005). However, such feature extractionprocess may lose some effective information within the complete se-quence of time series, which affects the correctness of the clusteringresults. Spectral clustering, as another widely used clustering techniquefits into the scope of the study (clustering of deceleration profile/curves), and it only requires similarity information between data points(rather than their centroids) (Luxburg, 2007). Thus spectral clusteringwas selected for deceleration time series clustering analysis.
3.1. Spectral clustering methodology
Spectral clustering is an algorithm based on graph theory (Luxburg,2007) and has been widely used in many fields (Bach and Jordan, 2006;Chang and Yeung, 2005; Valgren et al., 2007). Spectral clustering treatsall data as points in space, and assumes all of these data points areconnected by edges assigned with weights (i.e., a connected graph). Theedge weight is higher when the similarity between the two points islarger, and vice versa. The edge weights between all n data pointsconstitute the adjacency matrix ×Wn n of the graph, with the element inthe i-th row and j-th column recording the weight value between point iand point j. The purpose of Spectral clustering is to find a partition of thegraph such that the weight sum of edges between different groups issmall while that of edges within a group is high (Luxburg, 2007).
For the deceleration profile clustering problem, as a higher overalllevel of deceleration (the deceleration curve being farther away fromthe deceleration=0 straight line) and a faster rate of change of de-celeration curve generally indicate a higher level of risk perceived bythe driver at the start of critical event-reaction braking, dissimilarity ofdeceleration curves (i.e., edge weight) can be measured in two respectsincluding range/distance metric (dtw) and difference in rate of curvechange metric (Δjerk), which are explained below.
1)Range distance metric (dtw)As the duration of critical event-reaction braking from its start to
reaching its maximum varies from case to case, Dynamic Time Warping(DTW) algorithm was employed to calculate the range distances of theextracted deceleration time series. DTW distance of two time series iscalculated by identifying a distance path (repeating/deleting certainpoints within the time series, i.e., shortening/extending the sequence of
Fig. 4. Statistics of deceleration profiles extracted from “100-car” near-crashes.
X. Xiong, et al. Accident Analysis and Prevention 129 (2019) 30–43
34
time series) where the sum of pairwise point distances along the path isminimized. Take two K-dimensional signal time series X and Y as anexample (whereas the deceleration profile in our case is one-dimen-sional signal time series, i.e., K= 1):
=……
… … … ……
x x xx x x
x x xX
MM
K K K M
1,1 1,2 1,2,1 2,2 2,
,1 ,2 , (1)
=
……
… … … ……
y y yy y y
y y yY
N
N
K K K N
1,1 1,2 1,
2,1 2,2 2,
,1 ,2 , (2)
That is, the two time series X and Y have M and N sampling points(sample points) respectively. Define the distance between the m thsampling point of X (i.e., the m th column of X, m=1,2,…,M) and the nth sampling point of Y (i.e., the n th column of Y, n=1,2,…,N) as aEuclidean distance X Yd ( , )mn :
==
d x yX Y( , ) ( )mnk
K
k m k n1
, ,2
(3)
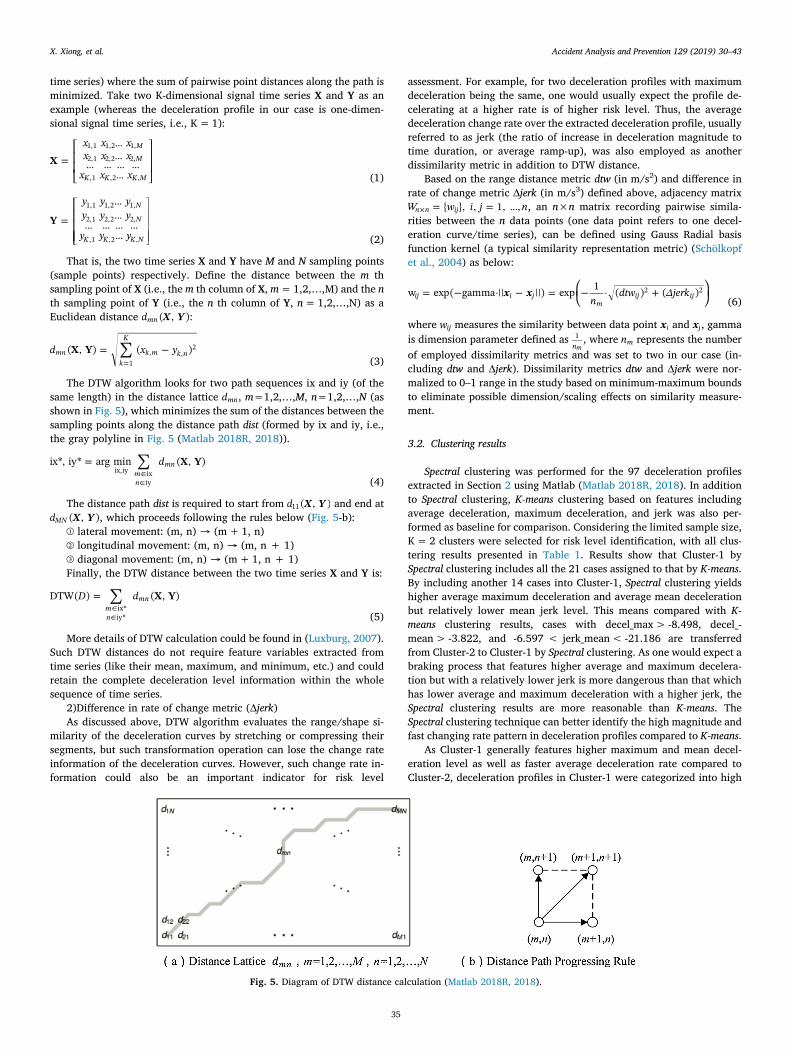
The DTW algorithm looks for two path sequences ix and iy (of thesame length) in the distance lattice dmn, m=1,2,…,M, n=1,2,…,N (asshown in Fig. 5), which minimizes the sum of the distances between thesampling points along the distance path dist (formed by ix and iy, i.e.,the gray polyline in Fig. 5 (Matlab 2018R, 2018)).
= d X Yix*, iy* arg min ( , )mn
mnix,iy ix
iy (4)
The distance path dist is required to start from X Yd ( , )11 and end atX Yd ( , )MN , which proceeds following the rules below (Fig. 5-b):
① lateral movement: (m, n) → (m+1, n)② longitudinal movement: (m, n) → (m, n + 1)③ diagonal movement: (m, n) → (m+1, n + 1)Finally, the DTW distance between the two time series X and Y is:
=D d X YDTW( ) ( , )mn
mnix*iy* (5)
More details of DTW calculation could be found in (Luxburg, 2007).Such DTW distances do not require feature variables extracted fromtime series (like their mean, maximum, and minimum, etc.) and couldretain the complete deceleration level information within the wholesequence of time series.
2)Difference in rate of change metric (Δjerk)As discussed above, DTW algorithm evaluates the range/shape si-
milarity of the deceleration curves by stretching or compressing theirsegments, but such transformation operation can lose the change rateinformation of the deceleration curves. However, such change rate in-formation could also be an important indicator for risk level
assessment. For example, for two deceleration profiles with maximumdeceleration being the same, one would usually expect the profile de-celerating at a higher rate is of higher risk level. Thus, the averagedeceleration change rate over the extracted deceleration profile, usuallyreferred to as jerk (the ratio of increase in deceleration magnitude totime duration, or average ramp-up), was also employed as anotherdissimilarity metric in addition to DTW distance.
Based on the range distance metric dtw (in m/s2) and difference inrate of change metric Δjerk (in m/s3) defined above, adjacency matrix
= = …×W w i j n{ }, , 1, ,n n ij , an n×n matrix recording pairwise simila-rities between the n data points (one data point refers to one decel-eration curve/time series), can be defined using Gauss Radial basisfunction kernel (a typical similarity representation metric) (Schölkopfet al., 2004) as below:
= = +x xn
dtw jerkw exp( gamma || ||) exp 1 ( ) ( )ij i jm
ij ij2 2
(6)
where wij measures the similarity between data point xi and xj, gammais dimension parameter defined as
n1m, where nm represents the number
of employed dissimilarity metrics and was set to two in our case (in-cluding dtw and Δjerk). Dissimilarity metrics dtw and Δjerk were nor-malized to 0–1 range in the study based on minimum-maximum boundsto eliminate possible dimension/scaling effects on similarity measure-ment.
3.2. Clustering results
Spectral clustering was performed for the 97 deceleration profilesextracted in Section 2 using Matlab (Matlab 2018R, 2018). In additionto Spectral clustering, K-means clustering based on features includingaverage deceleration, maximum deceleration, and jerk was also per-formed as baseline for comparison. Considering the limited sample size,K=2 clusters were selected for risk level identification, with all clus-tering results presented in Table 1. Results show that Cluster-1 bySpectral clustering includes all the 21 cases assigned to that by K-means.By including another 14 cases into Cluster-1, Spectral clustering yieldshigher average maximum deceleration and average mean decelerationbut relatively lower mean jerk level. This means compared with K-means clustering results, cases with decel_max> -8.498, decel_-mean> -3.822, and -6.597 < jerk_mean< -21.186 are transferredfrom Cluster-2 to Cluster-1 by Spectral clustering. As one would expect abraking process that features higher average and maximum decelera-tion but with a relatively lower jerk is more dangerous than that whichhas lower average and maximum deceleration with a higher jerk, theSpectral clustering results are more reasonable than K-means. TheSpectral clustering technique can better identify the high magnitude andfast changing rate pattern in deceleration profiles compared to K-means.
As Cluster-1 generally features higher maximum and mean decel-eration level as well as faster average deceleration rate compared toCluster-2, deceleration profiles in Cluster-1 were categorized into high
Fig. 5. Diagram of DTW distance calculation (Matlab 2018R, 2018).
X. Xiong, et al. Accident Analysis and Prevention 129 (2019) 30–43
35
risk level (i.e., their corresponding initial states of vehicle interaction atthe start of critical event-reaction braking were also classified to highrisk), while those in Cluster-2 were categorized into sub-high/mediumrisk level (as all sample deceleration profiles were extracted from “100-car” near-crash records, the extracted profiles should not be assigned tolow risk).
4. Risk level rule extraction
In this section, given the identified risk levels of the decelerationprofiles in Section 3, online risk level classification rules are exploredusing safety indicators at the onset of critical event-reaction braking.
4.1. Safety indicator selection
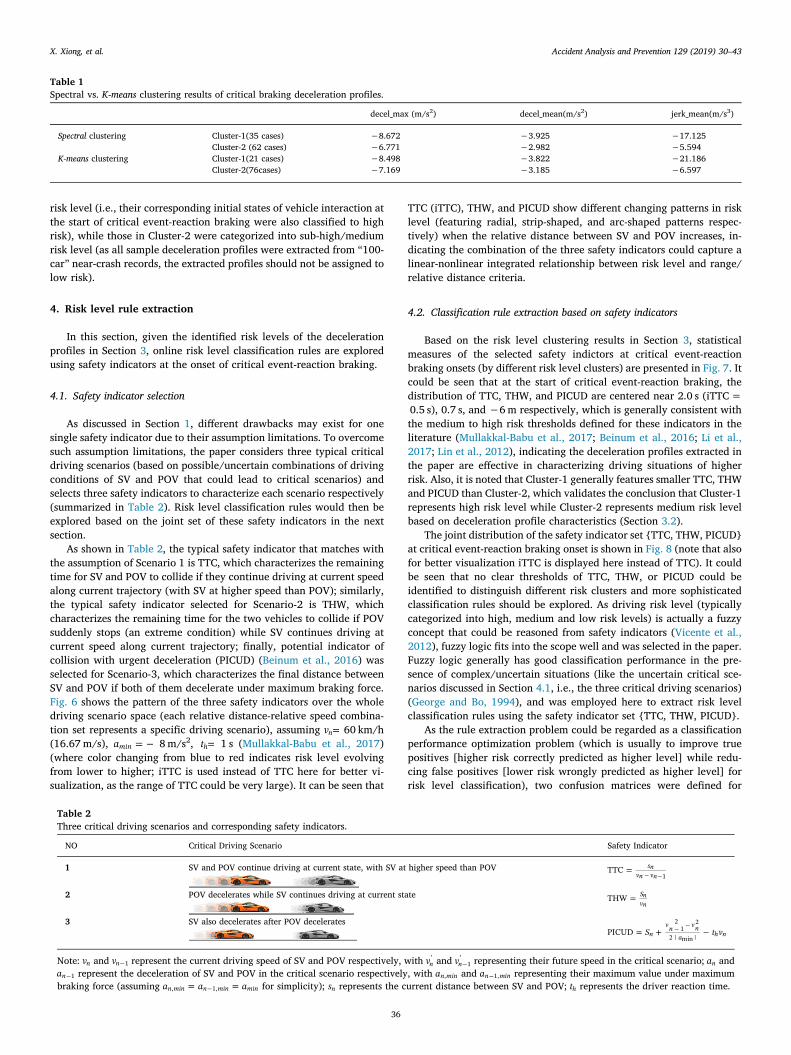
As discussed in Section 1, different drawbacks may exist for onesingle safety indicator due to their assumption limitations. To overcomesuch assumption limitations, the paper considers three typical criticaldriving scenarios (based on possible/uncertain combinations of drivingconditions of SV and POV that could lead to critical scenarios) andselects three safety indicators to characterize each scenario respectively(summarized in Table 2). Risk level classification rules would then beexplored based on the joint set of these safety indicators in the nextsection.
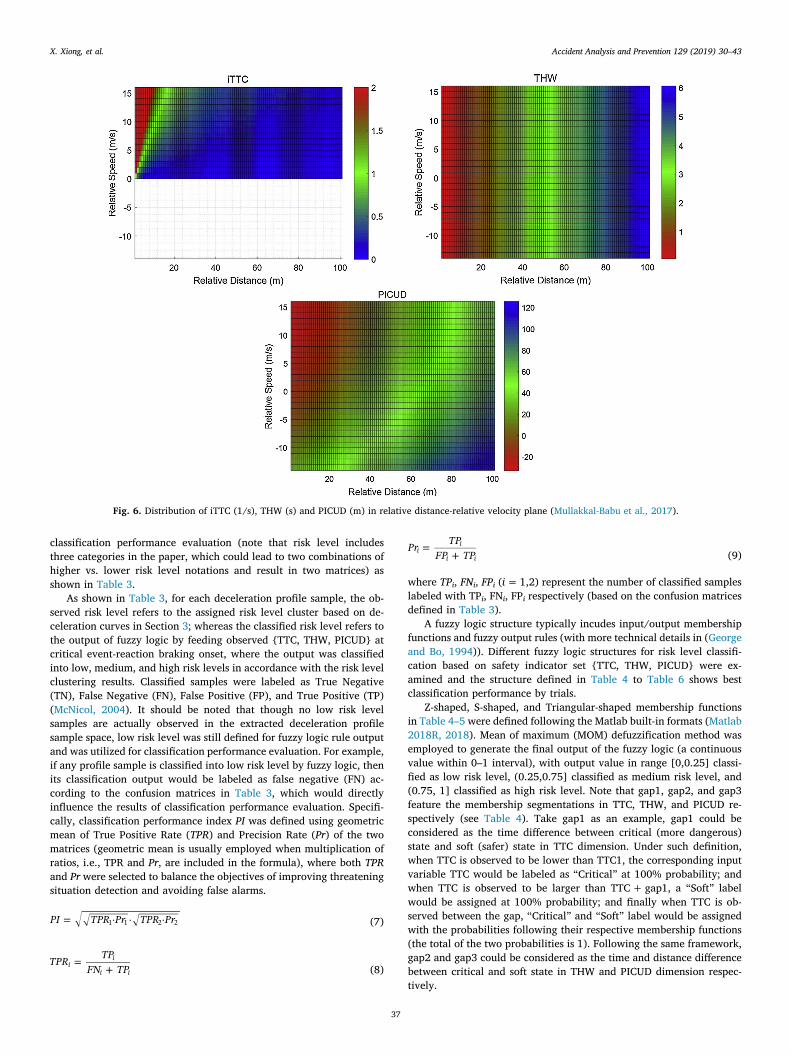
As shown in Table 2, the typical safety indicator that matches withthe assumption of Scenario 1 is TTC, which characterizes the remainingtime for SV and POV to collide if they continue driving at current speedalong current trajectory (with SV at higher speed than POV); similarly,the typical safety indicator selected for Scenario-2 is THW, whichcharacterizes the remaining time for the two vehicles to collide if POVsuddenly stops (an extreme condition) while SV continues driving atcurrent speed along current trajectory; finally, potential indicator ofcollision with urgent deceleration (PICUD) (Beinum et al., 2016) wasselected for Scenario-3, which characterizes the final distance betweenSV and POV if both of them decelerate under maximum braking force.Fig. 6 shows the pattern of the three safety indicators over the wholedriving scenario space (each relative distance-relative speed combina-tion set represents a specific driving scenario), assuming =vn 60 km/h(16.67m/s), =amin 8m/s2, =th 1 s (Mullakkal-Babu et al., 2017)(where color changing from blue to red indicates risk level evolvingfrom lower to higher; iTTC is used instead of TTC here for better vi-sualization, as the range of TTC could be very large). It can be seen that
TTC (iTTC), THW, and PICUD show different changing patterns in risklevel (featuring radial, strip-shaped, and arc-shaped patterns respec-tively) when the relative distance between SV and POV increases, in-dicating the combination of the three safety indicators could capture alinear-nonlinear integrated relationship between risk level and range/relative distance criteria.
4.2. Classification rule extraction based on safety indicators
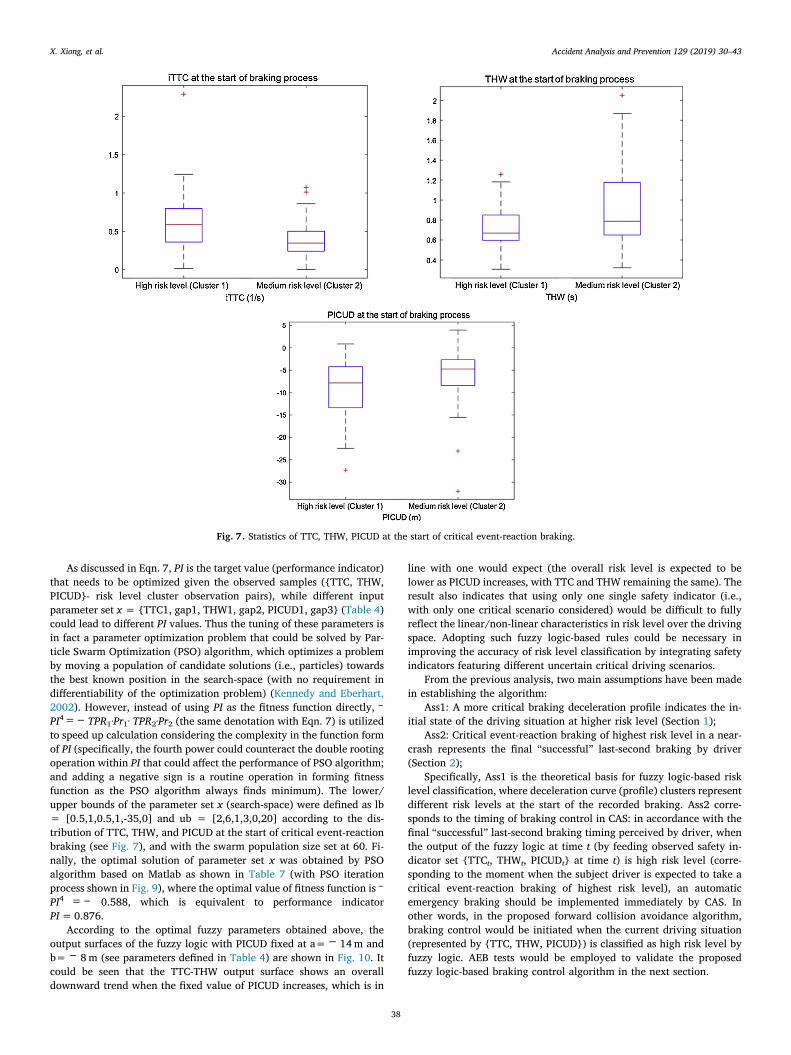
Based on the risk level clustering results in Section 3, statisticalmeasures of the selected safety indictors at critical event-reactionbraking onsets (by different risk level clusters) are presented in Fig. 7. Itcould be seen that at the start of critical event-reaction braking, thedistribution of TTC, THW, and PICUD are centered near 2.0 s (iTTC=0.5 s), 0.7 s, and −6m respectively, which is generally consistent withthe medium to high risk thresholds defined for these indicators in theliterature (Mullakkal-Babu et al., 2017; Beinum et al., 2016; Li et al.,2017; Lin et al., 2012), indicating the deceleration profiles extracted inthe paper are effective in characterizing driving situations of higherrisk. Also, it is noted that Cluster-1 generally features smaller TTC, THWand PICUD than Cluster-2, which validates the conclusion that Cluster-1represents high risk level while Cluster-2 represents medium risk levelbased on deceleration profile characteristics (Section 3.2).
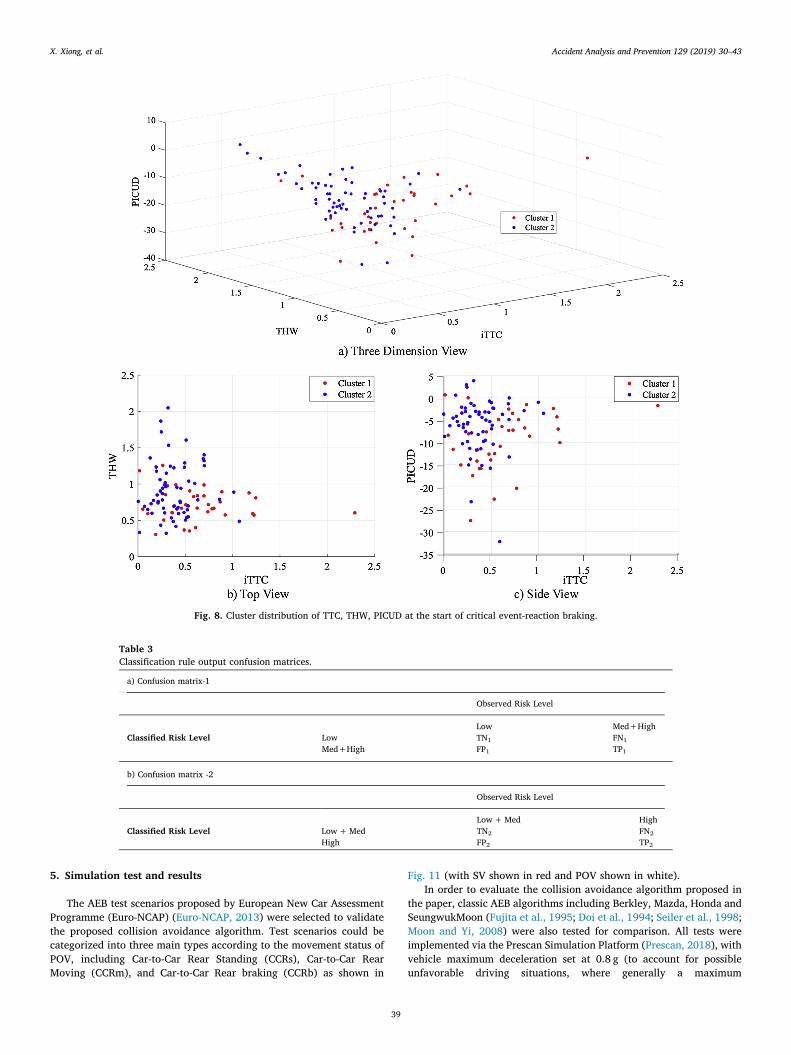
The joint distribution of the safety indicator set {TTC, THW, PICUD}at critical event-reaction braking onset is shown in Fig. 8 (note that alsofor better visualization iTTC is displayed here instead of TTC). It couldbe seen that no clear thresholds of TTC, THW, or PICUD could beidentified to distinguish different risk clusters and more sophisticatedclassification rules should be explored. As driving risk level (typicallycategorized into high, medium and low risk levels) is actually a fuzzyconcept that could be reasoned from safety indicators (Vicente et al.,2012), fuzzy logic fits into the scope well and was selected in the paper.Fuzzy logic generally has good classification performance in the pre-sence of complex/uncertain situations (like the uncertain critical sce-narios discussed in Section 4.1, i.e., the three critical driving scenarios)(George and Bo, 1994), and was employed here to extract risk levelclassification rules using the safety indicator set {TTC, THW, PICUD}.
As the rule extraction problem could be regarded as a classificationperformance optimization problem (which is usually to improve truepositives [higher risk correctly predicted as higher level] while redu-cing false positives [lower risk wrongly predicted as higher level] forrisk level classification), two confusion matrices were defined for
Table 1Spectral vs. K-means clustering results of critical braking deceleration profiles.
decel_max (m/s2) decel_mean(m/s2) jerk_mean(m/s3)
Spectral clustering Cluster-1(35 cases) −8.672 −3.925 −17.125Cluster-2 (62 cases) −6.771 −2.982 −5.594
K-means clustering Cluster-1(21 cases) −8.498 −3.822 −21.186Cluster-2(76cases) −7.169 −3.185 −6.597
Table 2Three critical driving scenarios and corresponding safety indicators.
NO Critical Driving Scenario Safety Indicator
1 SV and POV continue driving at current state, with SV at higher speed than POV =TTC snvn vn 1
2 POV decelerates while SV continues driving at current state =THW Snvn
3 SV also decelerates after POV decelerates= +S t vPICUD n
vn vna h n
21
2
2 | min |
Note: vn and vn 1 represent the current driving speed of SV and POV respectively, with vn and vn 1 representing their future speed in the critical scenario; an andan 1 represent the deceleration of SV and POV in the critical scenario respectively, with an min, and an min1, representing their maximum value under maximumbraking force (assuming = =a a an min n min min, 1, for simplicity); sn represents the current distance between SV and POV; th represents the driver reaction time.
X. Xiong, et al. Accident Analysis and Prevention 129 (2019) 30–43
36
classification performance evaluation (note that risk level includesthree categories in the paper, which could lead to two combinations ofhigher vs. lower risk level notations and result in two matrices) asshown in Table 3.
As shown in Table 3, for each deceleration profile sample, the ob-served risk level refers to the assigned risk level cluster based on de-celeration curves in Section 3; whereas the classified risk level refers tothe output of fuzzy logic by feeding observed {TTC, THW, PICUD} atcritical event-reaction braking onset, where the output was classifiedinto low, medium, and high risk levels in accordance with the risk levelclustering results. Classified samples were labeled as True Negative(TN), False Negative (FN), False Positive (FP), and True Positive (TP)(McNicol, 2004). It should be noted that though no low risk levelsamples are actually observed in the extracted deceleration profilesample space, low risk level was still defined for fuzzy logic rule outputand was utilized for classification performance evaluation. For example,if any profile sample is classified into low risk level by fuzzy logic, thenits classification output would be labeled as false negative (FN) ac-cording to the confusion matrices in Table 3, which would directlyinfluence the results of classification performance evaluation. Specifi-cally, classification performance index PI was defined using geometricmean of True Positive Rate (TPR) and Precision Rate (Pr) of the twomatrices (geometric mean is usually employed when multiplication ofratios, i.e., TPR and Pr, are included in the formula), where both TPRand Pr were selected to balance the objectives of improving threateningsituation detection and avoiding false alarms.
=PI TPR Pr TPR Pr1 1 2 2 (7)
=+
TPR TPFN TPi
i
i i (8)
=+
Pr TPFP TPi
i
i i (9)
where TPi, FNi, FPi (i=1,2) represent the number of classified sampleslabeled with TPi, FNi, FPi respectively (based on the confusion matricesdefined in Table 3).
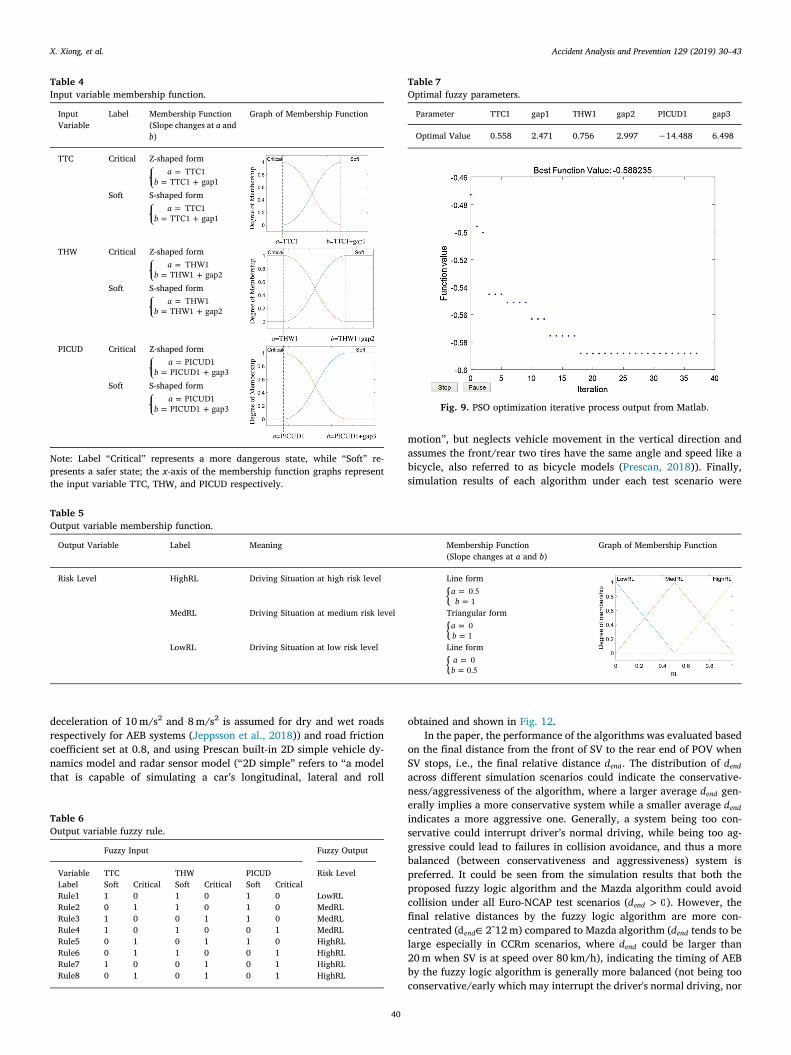
A fuzzy logic structure typically incudes input/output membershipfunctions and fuzzy output rules (with more technical details in (Georgeand Bo, 1994)). Different fuzzy logic structures for risk level classifi-cation based on safety indicator set {TTC, THW, PICUD} were ex-amined and the structure defined in Table 4 to Table 6 shows bestclassification performance by trials.
Z-shaped, S-shaped, and Triangular-shaped membership functionsin Table 4–5 were defined following the Matlab built-in formats (Matlab2018R, 2018). Mean of maximum (MOM) defuzzification method wasemployed to generate the final output of the fuzzy logic (a continuousvalue within 0–1 interval), with output value in range [0,0.25] classi-fied as low risk level, (0.25,0.75] classified as medium risk level, and(0.75, 1] classified as high risk level. Note that gap1, gap2, and gap3feature the membership segmentations in TTC, THW, and PICUD re-spectively (see Table 4). Take gap1 as an example, gap1 could beconsidered as the time difference between critical (more dangerous)state and soft (safer) state in TTC dimension. Under such definition,when TTC is observed to be lower than TTC1, the corresponding inputvariable TTC would be labeled as “Critical” at 100% probability; andwhen TTC is observed to be larger than TTC+gap1, a “Soft” labelwould be assigned at 100% probability; and finally when TTC is ob-served between the gap, “Critical” and “Soft” label would be assignedwith the probabilities following their respective membership functions(the total of the two probabilities is 1). Following the same framework,gap2 and gap3 could be considered as the time and distance differencebetween critical and soft state in THW and PICUD dimension respec-tively.
Fig. 6. Distribution of iTTC (1/s), THW (s) and PICUD (m) in relative distance-relative velocity plane (Mullakkal-Babu et al., 2017).
X. Xiong, et al. Accident Analysis and Prevention 129 (2019) 30–43
37
As discussed in Eqn. 7, PI is the target value (performance indicator)that needs to be optimized given the observed samples ({TTC, THW,PICUD}- risk level cluster observation pairs), while different inputparameter set x= {TTC1, gap1, THW1, gap2, PICUD1, gap3} (Table 4)could lead to different PI values. Thus the tuning of these parameters isin fact a parameter optimization problem that could be solved by Par-ticle Swarm Optimization (PSO) algorithm, which optimizes a problemby moving a population of candidate solutions (i.e., particles) towardsthe best known position in the search-space (with no requirement indifferentiability of the optimization problem) (Kennedy and Eberhart,2002). However, instead of using PI as the fitness function directly, –PI4 = TPR1∙Pr1∙ TPR2∙Pr2 (the same denotation with Eqn. 7) is utilizedto speed up calculation considering the complexity in the function formof PI (specifically, the fourth power could counteract the double rootingoperation within PI that could affect the performance of PSO algorithm;and adding a negative sign is a routine operation in forming fitnessfunction as the PSO algorithm always finds minimum). The lower/upper bounds of the parameter set x (search-space) were defined as lb= [0.5,1,0.5,1,-35,0] and ub = [2,6,1,3,0,20] according to the dis-tribution of TTC, THW, and PICUD at the start of critical event-reactionbraking (see Fig. 7), and with the swarm population size set at 60. Fi-nally, the optimal solution of parameter set x was obtained by PSOalgorithm based on Matlab as shown in Table 7 (with PSO iterationprocess shown in Fig. 9), where the optimal value of fitness function is –PI4 = 0.588, which is equivalent to performance indicatorPI=0.876.
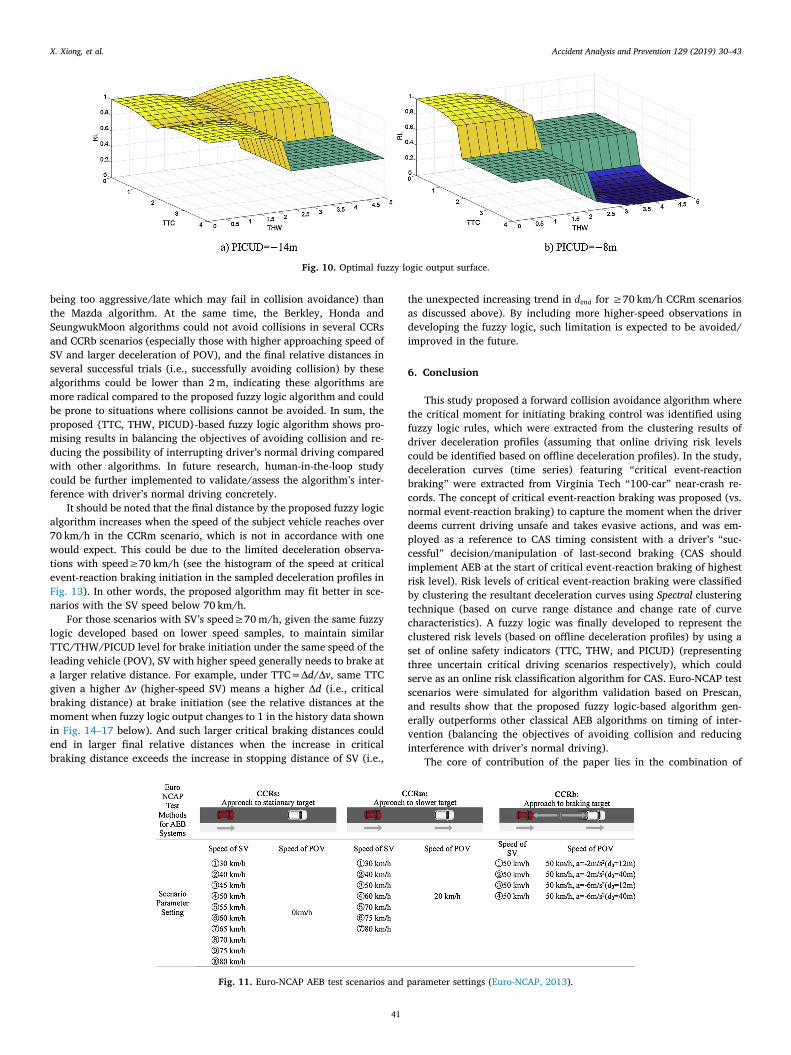
According to the optimal fuzzy parameters obtained above, theoutput surfaces of the fuzzy logic with PICUD fixed at a= 14m andb= 8m (see parameters defined in Table 4) are shown in Fig. 10. Itcould be seen that the TTC-THW output surface shows an overalldownward trend when the fixed value of PICUD increases, which is in
line with one would expect (the overall risk level is expected to belower as PICUD increases, with TTC and THW remaining the same). Theresult also indicates that using only one single safety indicator (i.e.,with only one critical scenario considered) would be difficult to fullyreflect the linear/non-linear characteristics in risk level over the drivingspace. Adopting such fuzzy logic-based rules could be necessary inimproving the accuracy of risk level classification by integrating safetyindicators featuring different uncertain critical driving scenarios.
From the previous analysis, two main assumptions have been madein establishing the algorithm:
Ass1: A more critical braking deceleration profile indicates the in-itial state of the driving situation at higher risk level (Section 1);
Ass2: Critical event-reaction braking of highest risk level in a near-crash represents the final “successful” last-second braking by driver(Section 2);
Specifically, Ass1 is the theoretical basis for fuzzy logic-based risklevel classification, where deceleration curve (profile) clusters representdifferent risk levels at the start of the recorded braking. Ass2 corre-sponds to the timing of braking control in CAS: in accordance with thefinal “successful” last-second braking timing perceived by driver, whenthe output of the fuzzy logic at time t (by feeding observed safety in-dicator set {TTCt, THWt, PICUDt} at time t) is high risk level (corre-sponding to the moment when the subject driver is expected to take acritical event-reaction braking of highest risk level), an automaticemergency braking should be implemented immediately by CAS. Inother words, in the proposed forward collision avoidance algorithm,braking control would be initiated when the current driving situation(represented by {TTC, THW, PICUD}) is classified as high risk level byfuzzy logic. AEB tests would be employed to validate the proposedfuzzy logic-based braking control algorithm in the next section.
Fig. 7. Statistics of TTC, THW, PICUD at the start of critical event-reaction braking.
X. Xiong, et al. Accident Analysis and Prevention 129 (2019) 30–43
38
5. Simulation test and results
The AEB test scenarios proposed by European New Car AssessmentProgramme (Euro-NCAP) (Euro-NCAP, 2013) were selected to validatethe proposed collision avoidance algorithm. Test scenarios could becategorized into three main types according to the movement status ofPOV, including Car-to-Car Rear Standing (CCRs), Car-to-Car RearMoving (CCRm), and Car-to-Car Rear braking (CCRb) as shown in
Fig. 11 (with SV shown in red and POV shown in white).In order to evaluate the collision avoidance algorithm proposed in
the paper, classic AEB algorithms including Berkley, Mazda, Honda andSeungwukMoon (Fujita et al., 1995; Doi et al., 1994; Seiler et al., 1998;Moon and Yi, 2008) were also tested for comparison. All tests wereimplemented via the Prescan Simulation Platform (Prescan, 2018), withvehicle maximum deceleration set at 0.8 g (to account for possibleunfavorable driving situations, where generally a maximum
Fig. 8. Cluster distribution of TTC, THW, PICUD at the start of critical event-reaction braking.
Table 3Classification rule output confusion matrices.
a) Confusion matrix-1
Observed Risk Level
Low Med+HighClassified Risk Level Low TN1 FN1
Med+High FP1 TP1
b) Confusion matrix -2
Observed Risk Level
Low+Med HighClassified Risk Level Low+Med TN2 FN2
High FP2 TP2
X. Xiong, et al. Accident Analysis and Prevention 129 (2019) 30–43
39
deceleration of 10m/s2 and 8m/s2 is assumed for dry and wet roadsrespectively for AEB systems (Jeppsson et al., 2018)) and road frictioncoefficient set at 0.8, and using Prescan built-in 2D simple vehicle dy-namics model and radar sensor model (“2D simple” refers to “a modelthat is capable of simulating a car’s longitudinal, lateral and roll
motion”, but neglects vehicle movement in the vertical direction andassumes the front/rear two tires have the same angle and speed like abicycle, also referred to as bicycle models (Prescan, 2018)). Finally,simulation results of each algorithm under each test scenario were
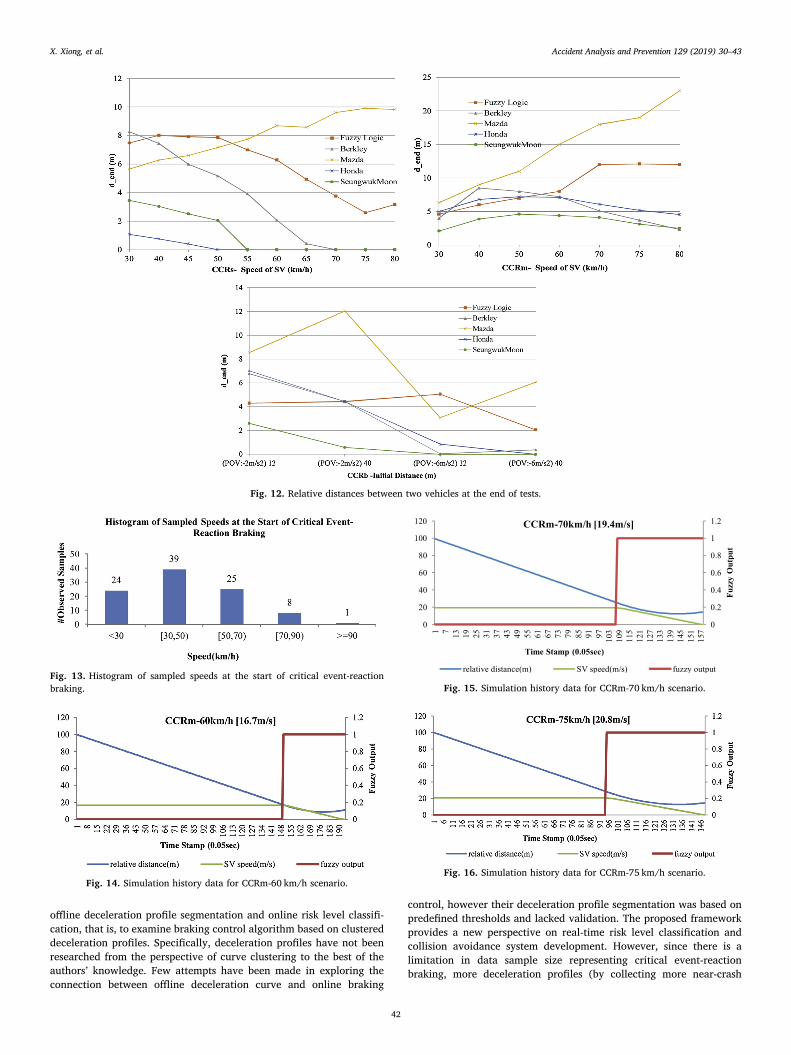
obtained and shown in Fig. 12.In the paper, the performance of the algorithms was evaluated based
on the final distance from the front of SV to the rear end of POV whenSV stops, i.e., the final relative distance dend. The distribution of dendacross different simulation scenarios could indicate the conservative-ness/aggressiveness of the algorithm, where a larger average dend gen-erally implies a more conservative system while a smaller average dendindicates a more aggressive one. Generally, a system being too con-servative could interrupt driver’s normal driving, while being too ag-gressive could lead to failures in collision avoidance, and thus a morebalanced (between conservativeness and aggressiveness) system ispreferred. It could be seen from the simulation results that both theproposed fuzzy logic algorithm and the Mazda algorithm could avoidcollision under all Euro-NCAP test scenarios ( >d 0end ). However, thefinal relative distances by the fuzzy logic algorithm are more con-centrated (dend 2˜12m) compared to Mazda algorithm (dend tends to belarge especially in CCRm scenarios, where dend could be larger than20m when SV is at speed over 80 km/h), indicating the timing of AEBby the fuzzy logic algorithm is generally more balanced (not being tooconservative/early which may interrupt the driver's normal driving, nor
Table 4Input variable membership function.
InputVariable
Label Membership Function(Slope changes at a andb)
Graph of Membership Function
TTC Critical Z-shaped form=
= +a
bTTC1
TTC1 gap1Soft S-shaped form
== +
ab
TTC1TTC1 gap1
THW Critical Z-shaped form=
= +a
bTHW1
THW1 gap2Soft S-shaped form
== +
ab
THW1THW1 gap2
PICUD Critical Z-shaped form=
= +a
bPICUD1
PICUD1 gap3Soft S-shaped form
== +
ab
PICUD1PICUD1 gap3
Note: Label “Critical” represents a more dangerous state, while “Soft” re-presents a safer state; the x-axis of the membership function graphs representthe input variable TTC, THW, and PICUD respectively.
Table 6Output variable fuzzy rule.
Fuzzy Input Fuzzy Output
Variable TTC THW PICUD Risk LevelLabel Soft Critical Soft Critical Soft CriticalRule1 1 0 1 0 1 0 LowRLRule2 0 1 1 0 1 0 MedRLRule3 1 0 0 1 1 0 MedRLRule4 1 0 1 0 0 1 MedRLRule5 0 1 0 1 1 0 HighRLRule6 0 1 1 0 0 1 HighRLRule7 1 0 0 1 0 1 HighRLRule8 0 1 0 1 0 1 HighRL
Table 5Output variable membership function.
Output Variable Label Meaning Membership Function(Slope changes at a and b)
Graph of Membership Function
Risk Level HighRL Driving Situation at high risk level Line form=={a
b0.51
MedRL Driving Situation at medium risk level Triangular form=={a
b01
LowRL Driving Situation at low risk level Line form=
={ ab
00.5
Table 7Optimal fuzzy parameters.
Parameter TTC1 gap1 THW1 gap2 PICUD1 gap3
Optimal Value 0.558 2.471 0.756 2.997 −14.488 6.498
Fig. 9. PSO optimization iterative process output from Matlab.
X. Xiong, et al. Accident Analysis and Prevention 129 (2019) 30–43
40
being too aggressive/late which may fail in collision avoidance) thanthe Mazda algorithm. At the same time, the Berkley, Honda andSeungwukMoon algorithms could not avoid collisions in several CCRsand CCRb scenarios (especially those with higher approaching speed ofSV and larger deceleration of POV), and the final relative distances inseveral successful trials (i.e., successfully avoiding collision) by thesealgorithms could be lower than 2m, indicating these algorithms aremore radical compared to the proposed fuzzy logic algorithm and couldbe prone to situations where collisions cannot be avoided. In sum, theproposed {TTC, THW, PICUD}-based fuzzy logic algorithm shows pro-mising results in balancing the objectives of avoiding collision and re-ducing the possibility of interrupting driver’s normal driving comparedwith other algorithms. In future research, human-in-the-loop studycould be further implemented to validate/assess the algorithm’s inter-ference with driver’s normal driving concretely.
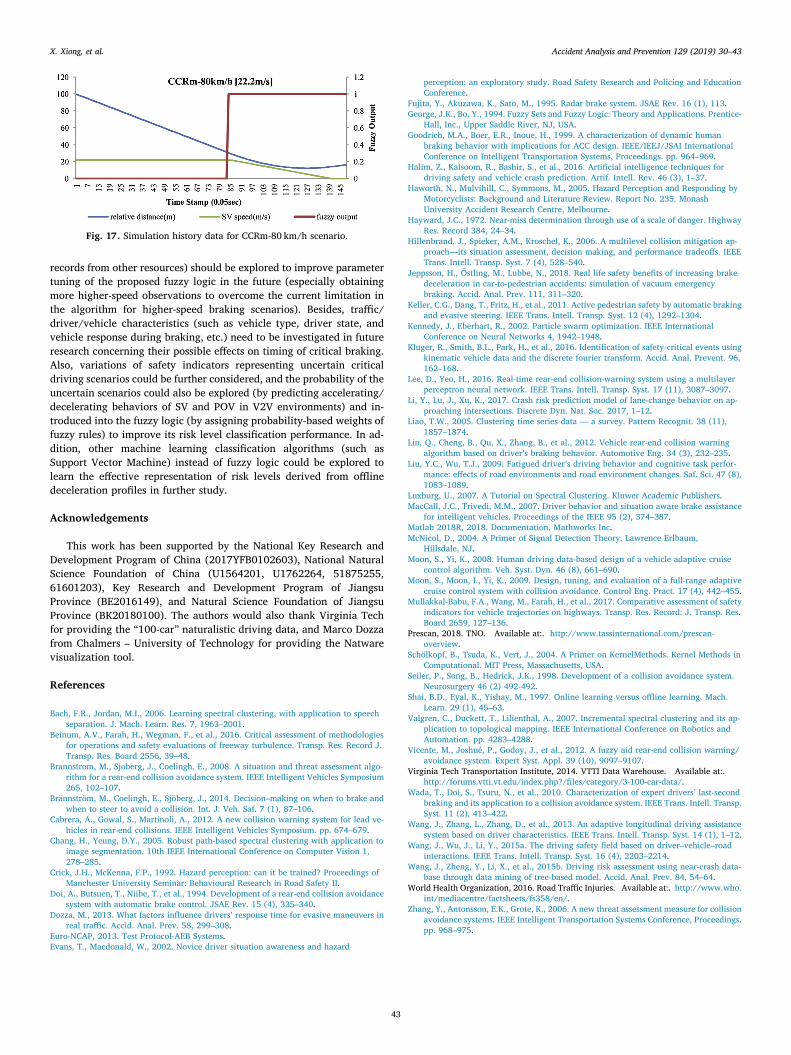
It should be noted that the final distance by the proposed fuzzy logicalgorithm increases when the speed of the subject vehicle reaches over70 km/h in the CCRm scenario, which is not in accordance with onewould expect. This could be due to the limited deceleration observa-tions with speed≥70 km/h (see the histogram of the speed at criticalevent-reaction braking initiation in the sampled deceleration profiles inFig. 13). In other words, the proposed algorithm may fit better in sce-narios with the SV speed below 70 km/h.
For those scenarios with SV’s speed≥70m/h, given the same fuzzylogic developed based on lower speed samples, to maintain similarTTC/THW/PICUD level for brake initiation under the same speed of theleading vehicle (POV), SV with higher speed generally needs to brake ata larger relative distance. For example, under TTC=Δd/Δv, same TTCgiven a higher Δv (higher-speed SV) means a higher Δd (i.e., criticalbraking distance) at brake initiation (see the relative distances at themoment when fuzzy logic output changes to 1 in the history data shownin Fig. 14–17 below). And such larger critical braking distances couldend in larger final relative distances when the increase in criticalbraking distance exceeds the increase in stopping distance of SV (i.e.,
the unexpected increasing trend in dend for ≥70 km/h CCRm scenariosas discussed above). By including more higher-speed observations indeveloping the fuzzy logic, such limitation is expected to be avoided/improved in the future.
6. Conclusion
This study proposed a forward collision avoidance algorithm wherethe critical moment for initiating braking control was identified usingfuzzy logic rules, which were extracted from the clustering results ofdriver deceleration profiles (assuming that online driving risk levelscould be identified based on offline deceleration profiles). In the study,deceleration curves (time series) featuring “critical event-reactionbraking” were extracted from Virginia Tech “100-car” near-crash re-cords. The concept of critical event-reaction braking was proposed (vs.normal event-reaction braking) to capture the moment when the driverdeems current driving unsafe and takes evasive actions, and was em-ployed as a reference to CAS timing consistent with a driver’s “suc-cessful” decision/manipulation of last-second braking (CAS shouldimplement AEB at the start of critical event-reaction braking of highestrisk level). Risk levels of critical event-reaction braking were classifiedby clustering the resultant deceleration curves using Spectral clusteringtechnique (based on curve range distance and change rate of curvecharacteristics). A fuzzy logic was finally developed to represent theclustered risk levels (based on offline deceleration profiles) by using aset of online safety indicators {TTC, THW, and PICUD} (representingthree uncertain critical driving scenarios respectively), which couldserve as an online risk classification algorithm for CAS. Euro-NCAP testscenarios were simulated for algorithm validation based on Prescan,and results show that the proposed fuzzy logic-based algorithm gen-erally outperforms other classical AEB algorithms on timing of inter-vention (balancing the objectives of avoiding collision and reducinginterference with driver’s normal driving).
The core of contribution of the paper lies in the combination of
Fig. 10. Optimal fuzzy logic output surface.
Fig. 11. Euro-NCAP AEB test scenarios and parameter settings (Euro-NCAP, 2013).
X. Xiong, et al. Accident Analysis and Prevention 129 (2019) 30–43
41
offline deceleration profile segmentation and online risk level classifi-cation, that is, to examine braking control algorithm based on clustereddeceleration profiles. Specifically, deceleration profiles have not beenresearched from the perspective of curve clustering to the best of theauthors’ knowledge. Few attempts have been made in exploring theconnection between offline deceleration curve and online braking
control, however their deceleration profile segmentation was based onpredefined thresholds and lacked validation. The proposed frameworkprovides a new perspective on real-time risk level classification andcollision avoidance system development. However, since there is alimitation in data sample size representing critical event-reactionbraking, more deceleration profiles (by collecting more near-crash
Fig. 12. Relative distances between two vehicles at the end of tests.
Fig. 13. Histogram of sampled speeds at the start of critical event-reactionbraking.
Fig. 14. Simulation history data for CCRm-60 km/h scenario.
Fig. 15. Simulation history data for CCRm-70 km/h scenario.
Fig. 16. Simulation history data for CCRm-75 km/h scenario.
X. Xiong, et al. Accident Analysis and Prevention 129 (2019) 30–43
42
records from other resources) should be explored to improve parametertuning of the proposed fuzzy logic in the future (especially obtainingmore higher-speed observations to overcome the current limitation inthe algorithm for higher-speed braking scenarios). Besides, traffic/driver/vehicle characteristics (such as vehicle type, driver state, andvehicle response during braking, etc.) need to be investigated in futureresearch concerning their possible effects on timing of critical braking.Also, variations of safety indicators representing uncertain criticaldriving scenarios could be further considered, and the probability of theuncertain scenarios could also be explored (by predicting accelerating/decelerating behaviors of SV and POV in V2V environments) and in-troduced into the fuzzy logic (by assigning probability-based weights offuzzy rules) to improve its risk level classification performance. In ad-dition, other machine learning classification algorithms (such asSupport Vector Machine) instead of fuzzy logic could be explored tolearn the effective representation of risk levels derived from offlinedeceleration profiles in further study.
Acknowledgements
This work has been supported by the National Key Research andDevelopment Program of China (2017YFB0102603), National NaturalScience Foundation of China (U1564201, U1762264, 51875255,61601203), Key Research and Development Program of JiangsuProvince (BE2016149), and Natural Science Foundation of JiangsuProvince (BK20180100). The authors would also thank Virginia Techfor providing the “100-car” naturalistic driving data, and Marco Dozzafrom Chalmers – University of Technology for providing the Natwarevisualization tool.
References
Bach, F.R., Jordan, M.I., 2006. Learning spectral clustering, with application to speechseparation. J. Mach. Learn. Res. 7, 1963–2001.
Beinum, A.V., Farah, H., Wegman, F., et al., 2016. Critical assessment of methodologiesfor operations and safety evaluations of freeway turbulence. Transp. Res. Record J.Transp. Res. Board 2556, 39–48.
Brannstrom, M., Sjoberg, J., Coelingh, E., 2008. A situation and threat assessment algo-rithm for a rear-end collision avoidance system. IEEE Intelligent Vehicles Symposium265, 102–107.
Brännström, M., Coelingh, E., Sjöberg, J., 2014. Decision–making on when to brake andwhen to steer to avoid a collision. Int. J. Veh. Saf. 7 (1), 87–106.
Cabrera, A., Gowal, S., Martinoli, A., 2012. A new collision warning system for lead ve-hicles in rear-end collisions. IEEE Intelligent Vehicles Symposium. pp. 674–679.
Chang, H., Yeung, D.Y., 2005. Robust path-based spectral clustering with application toimage segmentation. 10th IEEE International Conference on Computer Vision 1,278–285.
Crick, J.H., McKenna, F.P., 1992. Hazard perception: can it be trained? Proceedings ofManchester University Seminar: Behavioural Research in Road Safety II.
Doi, A., Butsuen, T., Niibe, T., et al., 1994. Development of a rear-end collision avoidancesystem with automatic brake control. JSAE Rev. 15 (4), 335–340.
Dozza, M., 2013. What factors influence drivers’ response time for evasive maneuvers inreal traffic. Accid. Anal. Prev. 58, 299–308.
Euro-NCAP, 2013. Test Protocol-AEB Systems.Evans, T., Macdonald, W., 2002. Novice driver situation awareness and hazard
perception: an exploratory study. Road Safety Research and Policing and EducationConference.
Fujita, Y., Akuzawa, K., Sato, M., 1995. Radar brake system. JSAE Rev. 16 (1), 113.George, J.K., Bo, Y., 1994. Fuzzy Sets and Fuzzy Logic: Theory and Applications. Prentice-
Hall, Inc., Upper Saddle River, NJ, USA.Goodrich, M.A., Boer, E.R., Inoue, H., 1999. A characterization of dynamic human
braking behavior with implications for ACC design. IEEE/IEEJ/JSAI InternationalConference on Intelligent Transportation Systems, Proceedings. pp. 964–969.
Halim, Z., Kalsoom, R., Bashir, S., et al., 2016. Artificial intelligence techniques fordriving safety and vehicle crash prediction. Artif. Intell. Rev. 46 (3), 1–37.
Haworth, N., Mulvihill, C., Symmons, M., 2005. Hazard Perception and Responding byMotorcyclists: Background and Literature Review. Report No. 235. MonashUniversity Accident Research Centre, Melbourne.
Hayward, J.C., 1972. Near-miss determination through use of a scale of danger. HighwayRes. Record 384, 24–34.
Hillenbrand, J., Spieker, A.M., Kroschel, K., 2006. A multilevel collision mitigation ap-proach—its situation assessment, decision making, and performance tradeoffs. IEEETrans. Intell. Transp. Syst. 7 (4), 528–540.
Jeppsson, H., Östling, M., Lubbe, N., 2018. Real life safety benefits of increasing brakedeceleration in car-to-pedestrian accidents: simulation of vacuum emergencybraking. Accid. Anal. Prev. 111, 311–320.
Keller, C.G., Dang, T., Fritz, H., et al., 2011. Active pedestrian safety by automatic brakingand evasive steering. IEEE Trans. Intell. Transp. Syst. 12 (4), 1292–1304.
Kennedy, J., Eberhart, R., 2002. Particle swarm optimization. IEEE InternationalConference on Neural Networks 4, 1942–1948.
Kluger, R., Smith, B.L., Park, H., et al., 2016. Identification of safety-critical events usingkinematic vehicle data and the discrete fourier transform. Accid. Anal. Prevent. 96,162–168.
Lee, D., Yeo, H., 2016. Real-time rear-end collision-warning system using a multilayerperceptron neural network. IEEE Trans. Intell. Transp. Syst. 17 (11), 3087–3097.
Li, Y., Lu, J., Xu, K., 2017. Crash risk prediction model of lane-change behavior on ap-proaching intersections. Discrete Dyn. Nat. Soc. 2017, 1–12.
Liao, T.W., 2005. Clustering time series data — a survey. Pattern Recognit. 38 (11),1857–1874.
Lin, Q., Cheng, B., Qu, X., Zhang, B., et al., 2012. Vehicle rear-end collision warningalgorithm based on driver’s braking behavior. Automotive Eng. 34 (3), 232–235.
Liu, Y.C., Wu, T.J., 2009. Fatigued driver’s driving behavior and cognitive task perfor-mance: effects of road environments and road environment changes. Saf. Sci. 47 (8),1083–1089.
Luxburg, U., 2007. A Tutorial on Spectral Clustering. Kluwer Academic Publishers.MacCall, J.C., Trivedi, M.M., 2007. Driver behavior and situation aware brake assistance
for intelligent vehicles. Proceedings of the IEEE 95 (2), 374–387.Matlab 2018R, 2018. Documentation. Mathworks Inc.McNicol, D., 2004. A Primer of Signal Detection Theory. Lawrence Erlbaum,
Hillsdale, NJ.Moon, S., Yi, K., 2008. Human driving data-based design of a vehicle adaptive cruise
control algorithm. Veh. Syst. Dyn. 46 (8), 661–690.Moon, S., Moon, I., Yi, K., 2009. Design, tuning, and evaluation of a full-range adaptive
cruise control system with collision avoidance. Control Eng. Pract. 17 (4), 442–455.Mullakkal-Babu, F.A., Wang, M., Farah, H., et al., 2017. Comparative assessment of safety
indicators for vehicle trajectories on highways. Transp. Res. Record: J. Transp. Res.Board 2659, 127–136.
Prescan, 2018. TNO. Available at:. http://www.tassinternational.com/prescan-overview.
Schölkopf, B., Tsuda, K., Vert, J., 2004. A Primer on KernelMethods. Kernel Methods inComputational. MIT Press, Massachusetts, USA.
Seiler, P., Song, B., Hedrick, J.K., 1998. Development of a collision avoidance system.Neurosurgery 46 (2) 492-492.
Shai, B.D., Eyal, K., Yishay, M., 1997. Online learning versus offline learning. Mach.Learn. 29 (1), 45–63.
Valgren, C., Duckett, T., Lilienthal, A., 2007. Incremental spectral clustering and its ap-plication to topological mapping. IEEE International Conference on Robotics andAutomation. pp. 4283–4288.
Vicente, M., Joshué, P., Godoy, J., et al., 2012. A fuzzy aid rear-end collision warning/avoidance system. Expert Syst. Appl. 39 (10), 9097–9107.
Virginia Tech Transportation Institute, 2014. VTTI Data Warehouse. Available at:.http://forums.vtti.vt.edu/index.php?/files/category/3-100-car-data/.
Wada, T., Doi, S., Tsuru, N., et al., 2010. Characterization of expert drivers’ last-secondbraking and its application to a collision avoidance system. IEEE Trans. Intell. Transp.Syst. 11 (2), 413–422.
Wang, J., Zhang, L., Zhang, D., et al., 2013. An adaptive longitudinal driving assistancesystem based on driver characteristics. IEEE Trans. Intell. Transp. Syst. 14 (1), 1–12.
Wang, J., Wu, J., Li, Y., 2015a. The driving safety field based on driver–vehicle–roadinteractions. IEEE Trans. Intell. Transp. Syst. 16 (4), 2203–2214.
Wang, J., Zheng, Y., Li, X., et al., 2015b. Driving risk assessment using near-crash data-base through data mining of tree-based model. Accid. Anal. Prev. 84, 54–64.
World Health Organization, 2016. Road Traffic Injuries. Available at:. http://www.who.int/mediacentre/factsheets/fs358/en/.
Zhang, Y., Antonsson, E.K., Grote, K., 2006. A new threat assessment measure for collisionavoidance systems. IEEE Intelligent Transportation Systems Conference, Proceedings.pp. 968–975.
Fig. 17. Simulation history data for CCRm-80 km/h scenario.
X. Xiong, et al. Accident Analysis and Prevention 129 (2019) 30–43
43
Related Documents