ANP Source Terms July 2005 DRAFT A CRITICAL REVIEW OF SOURCE TERMS FOR SELECT INITIAL ENGINE TESTS ASSOCIATED WITH THE AIRCRAFT NUCLEAR PROPULSION PROGRAM AT INEL Contract No. 200-2002-00367 Task Order No. 1, Subtask 2 Final Report to the Centers for Disease Control and Prevention Atlanta, Georgia 30335 SC&A, Inc. 6858 Old Dominion Drive, Suite 301 McLean, Virginia 22101 SENES Oak Ridge, Inc. 102 Donner Drive Oak Ridge, Tennessee 37830 Authors: U. Hans Behling John Mauro SC&A, Inc. July 2005

Welcome message from author
This document is posted to help you gain knowledge. Please leave a comment to let me know what you think about it! Share it to your friends and learn new things together.
Transcript

ANP Source Terms July 2005
DRAFT
A CRITICAL REVIEW OF SOURCE TERMS FOR SELECT INITIAL ENGINE TESTS
ASSOCIATED WITH THE AIRCRAFT NUCLEAR PROPULSION PROGRAM AT INEL
Contract No. 200-2002-00367 Task Order No. 1, Subtask 2
Final Report to the Centers for Disease Control and Prevention
Atlanta, Georgia 30335
SC&A, Inc. 6858 Old Dominion Drive, Suite 301
McLean, Virginia 22101
SENES Oak Ridge, Inc. 102 Donner Drive
Oak Ridge, Tennessee 37830
Authors:
U. Hans Behling John Mauro SC&A, Inc.
July 2005
ANP Source Terms July 2005
TABLE OF CONTENTS
EXECUTIVE SUMMARY .......................................................................................................ES-1
1.0 RELEVANT BACKGROUND INFORMATION .......................................................... 1-1 1.1 Overview of Aircraft Nuclear Propulsion Program ............................................. 1-1 1.2 Previous Assessment of Radioactive Releases and Resultant Doses
from Aircraft Nuclear Propulsion ........................................................................ 1-6 1.3 The Purpose of This Report: Task 2 .................................................................. 1-10
1.3.1 Objectives .............................................................................................. 1-10 1.3.2 Revised Scope for Task 2 ...................................................................... 1-11 1.3.3 Approach ............................................................................................... 1-11
1.4 Radionuclides Considered in Initial Engine Test Releases................................ 1-12
2.0 INITIAL ENGINE TEST #3 ............................................................................................ 2-1 2.1 Relevant Background Data .................................................................................. 2-1
2.1.1 Initial Engine Test #3 Operational History .............................................. 2-1 2.2 Early Estimates of Radioactive Releases From Initial Engine Test #3................ 2-7 2.3 Limitations of Early Release Estimates ............................................................... 2-8
2.3.1 Spot Sampling and Its Limitations........................................................... 2-9 2.3.2 Uncertainty of the Physical State of Iodines in the Stack Effluent ........ 2-15
2.4 Post-Operation Evaluation of Fuel Cartridges for Initial Engine Test #3.......... 2-16 2.5 Approach by the Historical Dose Evaluation Task Group for Estimating
Radioactive Releases for Initial Engine Test #3 ................................................ 2-20 2.6 A Critical Review of the Historical Dose Evaluation Model............................. 2-23
2.6.1 Assumption that Fuel Damage was Limited to the Equivalent of 1.63 Fuel Cartridges............................................................................... 2-24
2.6.2 The Assumption of a Uniform Power Level Throughout the Reactor Core .......................................................................................... 2-26
2.6.3 Assumed Release Fractions for Severely Damaged Fuel....................... 2-32 2.6.4 Assumptions Regarding Release from Undamaged Nuclear Fuel ......... 2-35
2.7 Summary Conclusions Regarding Initial Engine Test #3 .................................. 2-37
3.0 INITIAL ENGINE TEST #4 ............................................................................................ 3-1 3.1 Relevant Background Data .................................................................................. 3-1 3.2 Early Estimates of Radioactive Releases for Initial Engine Test #4.................... 3-6 3.3 Limitations of Early Release Estimates ............................................................... 3-8 3.4 Post-Operation Evaluation of Fuel Cartridges for Initial Engine Test #4............ 3-9 3.5 Approach by the Historical Dose Evaluation Task Group for Estimating
Radioactive Releases for Initial Engine Test #4 ................................................ 3-14 3.5.1 Period #1: Reactor Operation at Lower Power ...................................... 3-14 3.5.2 Period #2: Reactor Operation at Higher Power ..................................... 3-17 3.5.3 Period #3: Last Day of Operation When Fuel Damage Assumedly
Occurred................................................................................................. 3-18 3.6 Critical Evaluation of the Historical Dose Evaluation Model and Summary
Conclusions Regarding Initial Engine Test #4.................................................. 3-21
ii

ANP Source Terms July 2005
TABLE OF CONTENTS (Continued)
4.0 INITIAL ENGINE TEST #10 .......................................................................................... 4-1 4.1 Relevant Background Data .................................................................................. 4-1
4.1.1 General Description of the Heat Transfer Reactor Experiment No. 2 ..... 4-1 4.1.2 Physical Design of Insert 2B.................................................................... 4-3 4.1.3 Operational History of Initial Engine Test #10...................................... 4-10
4.2 Early Estimates of Radioactive Releases ........................................................... 4-11 4.3 Limitations of Early Release Estimates ............................................................. 4-22
4.3.1 Limitations of Iodine and Barium Data ................................................. 4-22 4.3.2 Limitations of Total Effluent Releases Estimates Cited by Foster ........ 4-27
4.4 Post-Operational Examination of Initial Engine Test #10 Insert 2-B ................ 4-30 4.5 Approach by the Historical Dose Evaluation Task Group for Estimating
Radioactive Releases for Initial Engine Test #10 .............................................. 4-35 4.5.1 Historical Dose Evaluation Task Group-Derived Effluent
Releases of Iodine-131 and Other Radionuclides .................................. 4-36 4.5.2 Total Effluent Releases .......................................................................... 4-44
4.6 A Critical Review of the Historical Dose Evaluation Model............................. 4-47 4.6.1 A Revised Interpretation of Leakage Rates............................................ 4-47 4.6.2 Beryllium as a Surrogate for the Release of Iodines and Other
Fission Products ..................................................................................... 4-52 4.6.3 Uranium as a Surrogate for the Release of Iodines and Other
Fission Products ................................................................................... 4-57 4.6.4 Evidence that Suggests Release Estimates for Noble Gases and Solids
Derived by the Historical Dose Evaluation were Underestimated......... 4-60 4.7 Summary Conclusions Regarding Initial Engine Test #10 ................................ 4-64 4.8 Uncertainty Regarding Initial Engine Test #10 Source Terms .......................... 4-68
REFERENCES ............................................................................................................................R-1
APPENDICES
APPENDIX A An Overview of HTRE No. 1 Fuel Element Thermodynamics APPENDIX B Summary Data for Release Fractions Estimated for Operation BOOT APPENDIX C HDE-Derived Estimates for the Release of Radionuclides for Initial
Engine Test #10 Using the RSAC-4 Computer Code
iii
ANP Source Terms July 2005
LIST OF TABLES
Table ES-1 Summary of Radioactive Releases Associated with Aircraft Nuclear Propulsion Initial Engine Tests as Reported by the Idaho National Engineering Laboratory Historical Dose Evaluation .........................................ES-5
Table ES-2 Summary of Dose Estimated Associated with Aircraft Nuclear Propulsion Initial Engine Tests as Reported by the Idaho National Engineering Laboratory Historical Dose Evaluation..............................................................ES-6
Table ES-3 Alternate Parameter Values Recommended for Modeling Initial EngineTest #3 Releases.................................................................................................ES-9
Table ES-4 Adjusted Radionuclide Release Estimates.........................................................ES-9 Table ES-5 Summary Data Used to Revise Releases for Period #3 of
Initial Engine Test #4 .......................................................................................ES-12 Table ES-6 Radionuclide Release Quantities Estimated by SC&A for Initial Engine Test #4 .................................................................................................ES-13 Table ES-7 Revised Estimates for Releases from Initial Engine Test #10 .........................ES-15 Table 1-1 Summary of Radioactive Releases Associated with Aircraft Nuclear
Propulsion Initial Engine Tests as Reported by the Idaho National Engineering Laboratory Historical Dose Evaluation ........................................... 1-8
Table 1-2 Summary of Dose Estimates Associated with Aircraft Nuclear Propulsion Initial Engine Tests as Reported by the Idaho National Engineering Laboratory Historical Dose Evaluation.............................................................. 1-10
Table 1-3 Radionuclides Considered in Episodic Initial Engine Test Releases................. 1-14 Table 2-1 Summary of Initial Engine Test #3 Reactor Operation........................................ 2-2 Table 2-2 Gross Active Core Parameters ............................................................................. 2-5 Table 2-3 Distribution of Gaseous and Particulate Iodine Activity in Stack Effluents...... 2-16 Table 2-4 Reactor Operation, Initial Engine Test #3.......................................................... 2-21 Table 2-5 Release Quantities Aged to 10 Minutes for Initial Engine Test #3 as
Estimated by Historical Dose Evaluation .......................................................... 2-23 Table 2-6 Local to Average Gross Radial Power Distribution, D101 A2 .......................... 2-27 Table 2-7 Release Fractions Recommended in ANSI N46.1 - 1980.................................. 2-33 Table 2-8 Fractional Releases Under Simulated Conditions of Fuel Melt......................... 2-35 Table 2-9 Summary of Release Rates From General Electric-ANP Metallic Fuel Element
Low Intensity Test Reactor Tests....................................................................... 2-36 Table 2-10 Alternate Parameter Values Recommended for Modeling Initial Engine
Test #3 Releases................................................................................................. 2-38 Table 2-11 Adjusted Radionuclide Release Estimates......................................................... 2-39 Table 3-1 A2 Core Loading for Initial Engine Test #4 ........................................................ 3-2 Table 3-2 History of Reactor Operation for Initial Engine Test #4...................................... 3-3 Table 3-3 Heat Transfer Reactor Experiment No. 1 Data Comparison Between Initial
Engine Test #3 and Initial Engine Test #4 ........................................................... 3-5 Table 3-4 Stack Activity Test Data ...................................................................................... 3-7 Table 3-5 Operational Data for First Period of Initial Engine Test #4............................... 3-15 Table 3-6 Operational Data for Second Period of Initial Engine Test #4 .......................... 3-18 Table 3-7 Radionuclides Release Quantities for Initial Engine Test #4............................. 3-20
iv
ANP Source Terms July 2005
LIST OF TABLES (Continued)
Table 3-8 Summary Data Used to Revise Releases for Period #3 of Initial Engine Test #4 ...................................................................................................3-24
Table 3-9 Radionuclides Release Quantities Estimated by SC&A for Initial Engine Test #4 ...................................................................................................3-25
Table 4-1 Operational Summary of Initial Engine Test Runs ............................................ 4-12 Table 4-2 Leakage Rates from Vault Carbon Traps........................................................... 4-16 Table 4-3 Leakage Rates from Hot Duct Carbon Traps ..................................................... 4-19 Table 4-4 Total Effluent Activity During Endurance Run ................................................. 4-28 Table 4-5 Release Rate and Release Quantities of Iodine-131 for Initial Engine
Test #10 as Derived by the Historical Dose Evaluation Task Group ................ 4-38 Table 4-6 Release Rates Based on Insert 2-B Inventories.................................................. 4-40 Table 4-7 Radionuclide Releases for Initial Engine Test #10 as Estimated by the
Historical Dose Evaluation Task Group ............................................................ 4-46 Table 4-8 Derived Release Quantities of Iodine-131 Based on Two Interpretations of “Leakage Rate” ............................................................................................. 4-51 Table 4-9 Uranium Oxide Data for Three Fuel Tubes as Reported by Flagella (1960) ..... 4-58 Table 4-10 Estimated Values for the Loss of Uranium Oxide from Insert 2-B ................... 4-60 Table 4-11 Total Effluent Activity During Initial Engine Test #10 Endurance Run ........... 4-61 Table 4-12 Total Particulate Releases Based on Foster et al. 1958 Spot Sample Data........ 4-64 Table 4-13 A Comparative Summary of Release Estimates for Initial Engine Test #10 ..... 4-66
v

ANP Source Terms July 2005
LIST OF FIGURES
Figure 1-1 Schematic Drawing of Heat Transfer Reactor Experiment No. 1 Test Assembly...................................................................................................... 1-3
Figure 1-2 Core Test Facility................................................................................................. 1-4 Figure 1-3 The Idaho National Engineering Laboratory Site Facility Showing Location of
Test Area North.................................................................................................... 1-5 Figure 2-1 Schematic Drawing of Reactor Assembly ........................................................... 2-3 Figure 2-2 D101A2 Active Core Dimensions and Tube Layout ........................................... 2-4 Figure 2-3 D101A2 Fuel Element and Cartridge Assembly.................................................. 2-6 Figure 2-4 150-foot Exhaust Stack ...................................................................................... 2-10 Figure 2-5 Effluent Beta Decay Curves............................................................................... 2-12 Figure 2-6 Filter Efficiency Versus Chemical Fuel Flow.................................................... 2-14 Figure 2-7 Reactor Core Showing Boric Acid Leakage, Burned Cartridge, and Several
Undamaged Cartridges....................................................................................... 2-17 Figure 2-8 Cartridge Showing Discoloration, Burning and Melting ................................... 2-18 Figure 2-9 Insulation Liner Showing Wrinkling ................................................................. 2-18 Figure 2-10 Insulation Liner Showing Burning Effects......................................................... 2-18 Figure 2-11 Fuel Element Melting Effects, Rail Buckling, and Breaking............................. 2-19 Figure 2-12 Fuel Element Melting Effects ............................................................................ 2-19 Figure 2-13 Local to Average Longitudinal Power Curve, D101 A2.................................... 2-26 Figure 2-14 Rod Pattern for Series-28 Runs, Initial Engine Test #3 ..................................... 2-29 Figure 2-15 Rod Pattern for Series-30 Runs (Initial Engine Test #3) ................................... 2-30 Figure 2-16 Air Temperature and Plate Temperature Distribution ....................................... 2-31 Figure 2-17 Experiment BOOT: Plug and Residue from Tail Cone of Damaged Tube........ 2-34 Figure 2-18 Alternate View of Element Residue Shown in Figure 2-17............................... 2-34 Figure 3-1 Eighteenth-stage Temperature Versus Percent Nuclear Power............................ 3-4 Figure 3-2 Fuel Cartridge 5 ................................................................................................. 3-10 Figure 3-3 Damage to Stage 18, Cartridge 5 ....................................................................... 3-11 Figure 3-4 Damage to Stages 10 and 11 of Cartridge 20..................................................... 3-12 Figure 3-5 Damage to Stages 13, 14, and 15 of Fuel Cartridge 24...................................... 3-13 Figure 3-6 Initial Engine Test #4 Release Rates of Particulate Radionuclides ................... 3-16 Figure 4-1 Heat Transfer Reactor Experiment No. 2 Top Tube Sheet Showing the
Hexagonal Test Hole and the Remaining 30 Fuel Cartridges.............................. 4-2 Figure 4-2 Insert #2-B Cross Section .................................................................................... 4-4 Figure 4-3 Insert #2-B Fueled Beryllium Oxide Tubes ......................................................... 4-4 Figure 4-4 Insert #2-B Moderator Slabs ................................................................................ 4-5 Figure 4-5 Completely Stacked Insert 2-B ............................................................................ 4-6 Figure 4-6 Insert 2-B, Relative Power Density Versus Core Radius..................................... 4-8 Figure 4-7 Relative Longitudinal Power Distribution for Insert 2-B .................................... 4-9 Figure 4-8 Sampling Locations from the Exhaust Duct and Stack...................................... 4-14 Figure 4-9 Iodine-131 Leakage Rates and Iodine-131 Inventories on Insert 2-B During
Phase III of Initial Engine Test #10.................................................................... 4-26 Figure 4-10 Effluent Activity During Initial Engine Test #10/Insert 2-B Endurance Run ... 4-29 Figure 4-11 Deposits on the Downstream Face of Stage 9 Tubes ........................................ 4-32
vi

ANP Source Terms July 2005
LIST OF FIGURES (Continued)
Figure 4-12 Deposits on the Downstream Face of Stage 10 ................................................. 4-33 Figure 4-13 Release of Beryllium in Effluent as Measured at the 80-foot Stack Height by
Figure 4-15 Nomenclature and Location of Limited Melt Experiment-II
Figure 4-16 Total Release of I-131 from Uncoated Fuel Tubes (dry air) as a Function of
Means of Vault Carbon Traps............................................................................ 4-34 Figure 4-14 Reproduction of Figure 20 from Bake 1961 ...................................................... 4-48
Sampling Stations .............................................................................................. 4-54
Maximum Test Temperature ............................................................................. 4-57
vii

ANP Source Terms July 2005
EXECUTIVE SUMMARY
Introduction
Interest in the use of nuclear energy for the propulsion of aircrafts began officially in 1956 under the project known as NEPA (Nuclear Energy for the Propulsion of Aircraft). Motivation for substituting conventional propulsion systems with nuclear power largely centered around the limited range and time-in-air of conventional aircrafts that relied on fossil fuel. Because nuclear power reactors could be operated continuously for long periods of time at high power output, preliminary studies were conducted under NEPA for several years to develop an indirect cycle, single reactor propulsion system.
In 1951, NEPA was replaced by the joint Atomic Energy Commission (AEC)/United States Air Force (USAF) Aircraft Nuclear Propulsion (ANP) program, which employed the General Electric Company (GE) as the principal contractor. The GE-ANP approach focused on a direct-air-cycle turbojet design in which a compressor forces ambient air directly through the core of the reactor. The heated air is delivered to a turbine, which generates the forward thrust from its exhaust nozzle.
Between 1953 and 1961, three reactor assemblies were used for a variety of tests that evaluated reactor control systems, various nuclear fuels, and the consequences of potential system failures. The three experimental reactors were referred to as the Heat Transfer Reactor Experiments series or HTRE No. 1, HTRE No. 2, and HTRE No. 3. The testing program for the three HTRE assemblies was designated as Initial Engine Tests (IETs). There were a total of 26 IETs, which were numbered sequentially from IET #1 through IET #26. However, several IETs, inclusive of IET #1 and IET #2, involved tests that did not require nuclear power and, therefore, had no significant potential for the release of radioactivity.
The first IET with reactor operation and environmental releases occurred in January 1956 and involved IET #3. With the conclusion of IET #26 on March 30, 1961, President John F. Kennedy terminated the ANP program before the airplane and the actual reactors to be used to power it were ever constructed.
Due to the very nature of unprecedented engineering designs and ANP test objectives at INEL,1
controlled2 but substantial radioactive releases to the environment were clearly expected from IETs for the following reasons:
• Reactor prototypes were designed for high power densities in order to minimize shielding requirements
1In this report, we refer to the site by its historical name at the time the releases of concern to this report
occurred, rather than its current name, which is the Idaho National Engineering and Environmental Laboratory (INEEL).
2 AControlled@ is used here to acknowledge that releases were mitigated by predetermined test constraints
and specified meteorological conditions.
ES-1

ANP Source Terms July 2005
• Fuel configuration consisted of wafer thin (0.013 to 0.21 inches) concentric ribbons of UO2 enriched materials that maximized heat transfer in the direct-air-cycle reactor
• Under full power, sustained airflows of 100 pounds per second and temperatures of 1,250EF flowed through the reactor
• Fuel inserts were operated at material temperatures in excess of 3,000EF for extended periods of time
• Besides the parent fuel core consisting of nickel-chromium, a host of fuel inserts were tested in which UO2 was homogeneously incorporated into a ceramic matrix consisting of BeO,UO2,Y2O3 without cladding
• Once released from the fuel elements, all radioactivity was discharged directly into the atmosphere without intervention by engineering designs such as filters, scrubbers, electrostatic precipitators, etc.
Previous Assessment of Radioactive Releases
Early Estimates. Over the 5-year ANP testing period, effluent monitoring was a learning and evolving process. At the time, instrumentation for the detection and analysis of radioactive constituents in effluents was primitive by contemporary standards, and the interpretation of data was further compromised by the limited understanding of complex decay chains that represent many fission products. For the first several IETs, effluent monitoring was confined to periodic spot sampling. This method involved 1-minute air sample collection through a millipore filter that was subsequently analyzed for gross beta activity. Because filter paper sampling can only remove particles entrained in the effluent exhaust, periodic spot sampling could not account for (1) noble gases and volatile fission products that include radioiodines, (2) the relative contribution of individual radionuclides to the observed gross beta activity, and (3) releases that occurred during the time intervals between successive spot samples.
With time, effluent monitoring included the use of carbon traps, sample analysis by radiochemical means, and the use of gamma spectroscopy. Nevertheless, even these methods yielded data that were incomplete, inconsistent/inaccurate, and frequently difficult to interpret.
A major limitation that characterizes ANP monitoring data and early estimates of radioactive releases is the fact that these data are currently only available in the form of summary reports. These summary reports neither contain primary sample monitoring data nor make reference to logbooks on which summary data were based. A thorough search of available documents shows that, for IETs, logbooks and other primary sampling data either no longer exist or have not been declassified for public use.
ES-2

ANP Source Terms July 2005
Recent Assessment by the Idaho National Engineering Laboratory-Historical Dose Evaluation Task Group
Because of renewed concerns about potential radiological consequences to the public from past activities at INEL and the limitations of earlier assessments, the INEL Historical Dose Evaluation (INEL-HDE) Task Group was formed in December 1988. Its charter was to conduct a comprehensive review of all INEL activities, assess the magnitude of radioactive releases, and derive associated dose estimates to members of the public. In 1991, the INEL-HDE Task Group issued a two-volume report that quantified radioactive releases as either operational or episodic. Operational releases are continuous, somewhat uniform releases that occur over extended periods of time and reflect average meteorological conditions corresponding to a full year or a large portion of a year.
In contrast, episodic releases generally reflect tests, experiments, and/or accidents that span relatively shorter periods of time (i.e., hours). A large fraction of the IETs were performed intermittently over periods of time ranging from a few weeks to several months; depending on the test protocols, the HTRE was operated in a non-continuous manner at different times during the day and for varying durations of time. Release rates during IET test runs, therefore, reflected radionuclide mixtures that were affected by past reactor fuel burn-up and decay, as well as concurrent production rates and reactor operational parameters. Under these conditions, it must be assumed that the relative composition of the radionuclides in the effluent changed over time, along with changes in total release rates. Calculating source terms (and atmospheric dispersion coefficients) for episodic releases associated with some of the ANP IETs, therefore, posed challenging technical problems for the HDE Task Group. If sufficient information concerning reactor operations, release rates, and release times was not available, the test was divided into one or a few operational periods and releases were assumed to be uniform for the duration of each period. The HDE Task Group used this approach for IETs #4, #6, and #16.
When sufficient information concerning reactor operations and effluent monitoring data was available, attempts were made to identify changes and peak period(s) of release during a given test run and apply a time-weighted dispersion coefficient. Weighted-average dispersion coefficients were calculated and applied for IETs #3, #8, #10, #11, #14, #15, #17 through #21, #23, #25, and #26. Initial Engine Tests #12, #13, #22 and #24 were of short duration and could, therefore, be modeled by meteorological data that specifically corresponded to the short time period.
Table ES-1 summarizes the episodic release quantities associated with the IETs. It should be noted that several of the 26 IETs were non-nuclear and resulted in no releases since they were limited to operational aspects of valves, ducts, and other peripheral components of the aircraft propulsion system.
From radionuclide release quantities, radionuclide composition, and meteorological parameters, the HDE Task Group derived dose estimates for a hypothetical offsite adult, child, and infant for each IET (Table ES-2).
ES-3

ANP Source Terms July 2005
A review of Tables ES-1 and ES-2 reveals that the magnitude of radioactive release and their offsite exposure doses were highly variable. By far, the highest releases resulted from IET #3, IET #4, and IET #10. In brief, the combined estimated release of 682,000 curies by IETs #3, #4, and #10 is nearly seven times the combined release of 99,440 curies estimated for all other IETs that employed reactor power during the test. Of interest is that the HDE Task Group identified IET #3 as having caused the highest offsite exposure, even though the estimated release of 46,000 curies for IET #3 is only a fraction of the release quantities associated with IET #4 and IET #10.
ES-4

ANP Source Terms July 2005
Table ES-1 Summary of Radioactive Releases Associated with Aircraft Nuclear Propulsion Initial Engine Tests as Reported By the Idaho National Engineering Laboratory Historical Dose Evaluation
IET No. Test Dates (d/mo/yr) Release Quantity (Curies)
IET #3 2/11 - 2/24/56 46,000 IET #4 $ IET #4A 5/1 - 5/23/56 6,800 $ IET #4B 5/24 - 6/29/56 210,000 $ IET #4C 6/29/56 150,000
IET #6 12/18/56 9,000 IET #8 7/31 - 8/28/57 1,700 IET #10 $ IET #10A 12/20/57 - 2/25/58 130,000 $ IET #10B 3/1- 3/6/58 140,000
IET #11 3/20 - 4/14/58 4,200 IET #12 5/2/58 4,000 IET #13 11/18/58 940 IET #14 4/24 - 5/19/59 7,500 IET #15 $ IET #15A 6/3 - 6/15/59 2,000 $ IET #15B 6/16 - 6/24/59 1,200
IET #16 10/9/59 300 IET #17 $ IET #17A 11/2 - 11/30/59 2,400 $ IET #17B 12/1 - 12/12/59 2,200
IET #18 1/6 - 2/7/60 14,000 IET #19 $ IET #19A 2/17 - 2/29/60 1,200 $ IET #19B 3/1 - 4/30/60 8,400
IET #20 5/14 - 6/10/60 7,500 IET #21 6/29 - 8/6/60 2,000 IET #22 8/25/60 4,100 IET #23 9/7 - 10/14/60 1,700 IET #24 10/26/60 4,800 IET #25 $ IET #25A 11/22 - 11/30/60 2,400 $ IET #25B 12/1 - 12/15/60 7,800
IET #26 $ IET #26A 12/23/60 - 2/28/61 7,000 $ IET #26B 3/1 - 3/30/61 3,100
ES-5
ANP Source Terms July 2005
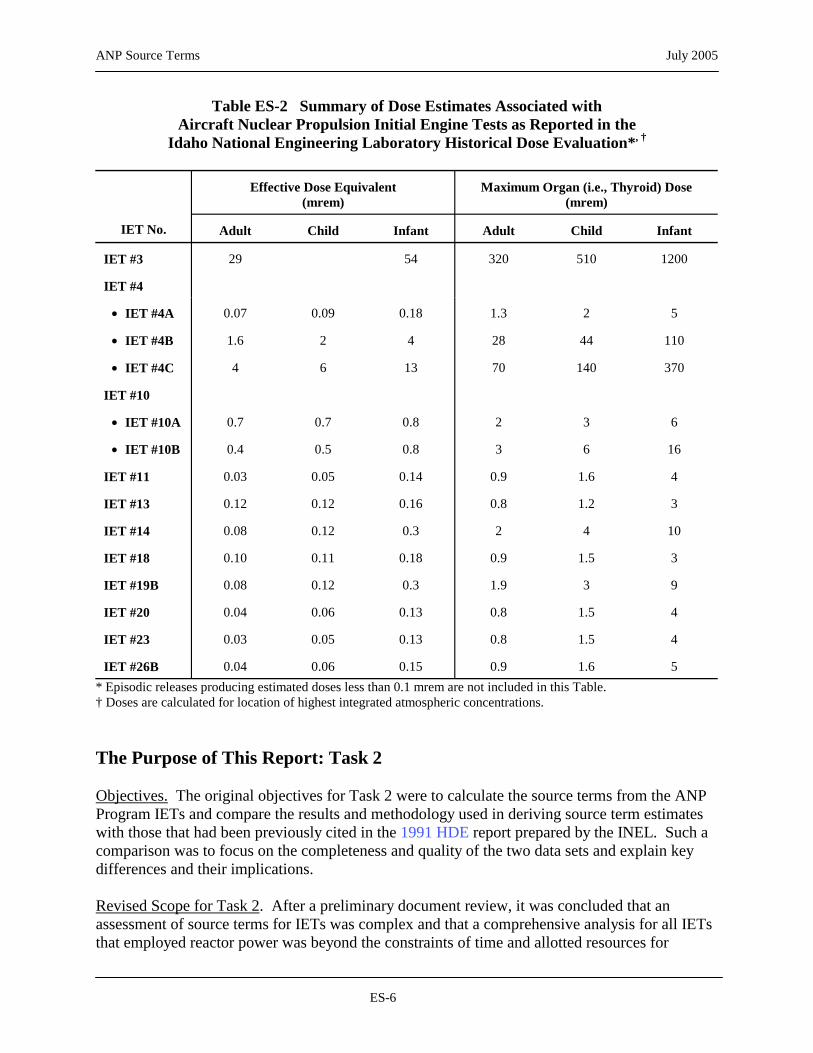
Table ES-2 Summary of Dose Estimates Associated with Aircraft Nuclear Propulsion Initial Engine Tests as Reported in the
Idaho National Engineering Laboratory Historical Dose Evaluation*, †
Effective Dose Equivalent Maximum Organ (i.e., Thyroid) Dose
IET No.
(mrem) (mrem)
Adult Child Infant Adult Child Infant
IET #3 29 54 320 510 1200
IET #4
$ IET #4A 0.07 0.09 0.18 1.3 2 5
$ IET #4B 1.6 2 4 28 44 110
$ IET #4C 4 6 13 70 140 370
IET #10
$ IET #10A 0.7 0.7 0.8 2 3 6
$ IET #10B 0.4 0.5 0.8 3 6 16
IET #11 0.03 0.05 0.14 0.9 1.6 4
IET #13 0.12 0.12 0.16 0.8 1.2 3
IET #14 0.08 0.12 0.3 2 4 10
IET #18 0.10 0.11 0.18 0.9 1.5 3
IET #19B 0.08 0.12 0.3 1.9 3 9
IET #20 0.04 0.06 0.13 0.8 1.5 4
IET #23 0.03 0.05 0.13 0.8 1.5 4
IET #26B 0.04 0.06 0.15 0.9 1.6 5 * Episodic releases producing estimated doses less than 0.1 mrem are not included in this Table. † Doses are calculated for location of highest integrated atmospheric concentrations.
The Purpose of This Report: Task 2
Objectives. The original objectives for Task 2 were to calculate the source terms from the ANP Program IETs and compare the results and methodology used in deriving source term estimates with those that had been previously cited in the 1991 HDE report prepared by the INEL. Such a comparison was to focus on the completeness and quality of the two data sets and explain key differences and their implications.
Revised Scope for Task 2. After a preliminary document review, it was concluded that an assessment of source terms for IETs was complex and that a comprehensive analysis for all IETs that employed reactor power was beyond the constraints of time and allotted resources for
ES-6

ANP Source Terms July 2005
Task 2. Because data suggested that the largest releases and/or doses were those of IET #3, IET #4, and IET #10 and whose test objectives included (1) testing that determined bounding operating parameter limits of sustained reactor power and fuel temperature levels, and (2) intentional destructive testing of fuel elements and reactor components that evaluated the kind and magnitude of material/component failures, it was decided that a reduced but, nevertheless, meaningful assessment could limit the scope of Task 2 to IETs #3, #4, and #10.
Approach. As a starting point for our assessment of source terms, SC&A critically reviewed key aspects of the test objectives and operating parameters that may have been relevant to the integrity of fuel and the interpretation of monitoring methods and their data. For IET#3, the objectives had been to determine the characteristics of the reactor core, cooling systems, and control rod system. For IET #4, the principle objectives were to assess several modifications that were made to HTRE-1 since the first test series (i.e., IET #3). For IET #10 that employed HTRE-2, the primary test objectives focused on power testing of a ceramic insert (designated Insert 2-B).
As part of our evaluation of previous monitoring data, it was critically important to correlate effluent data relative to chemical fuel consumption rate, reactor power levels, reactor plate temperature, and fuel configuration for the following reasons:
• Effect of Chemical Fuel Flow. An important aspect of the aircraft nuclear propulsion system is that it is linked to a normal jet engine and combustion of jet fuel.
The concurrent consumption of fossil fuel during reactor power operations introduced particulates into the effluent exhaust gases, which profoundly affected monitoring data. Data showed that the combustion of fossil fuel and the entrainment of particulate matter greatly determined whether volatile radioiodines (and even noble gases) were in a gaseous or particulate state at effluent sampling points (Holtslag 1956, Ebersole 1956).
• Effect of Reactor Power. Increases in reactor power levels (at a constant chemical/fuel flow) showed significant but modest increases in effluent activity.
• Effect of Reactor Plate Temperature. Particulate activity showed no significant dependency over a range of temperatures considered low (i.e., < 1,500EF), but increased sharply at higher temperatures. Thus, it was concluded that temperature level is by far the most critical parameter affecting the integrity of the ANP fuel elements and their release of fission products. During destructive test runs, temperatures well above 3,000EF were reached and resulted in fuel damage and large releases.
• Effect of Reactor Fuel Type. A variety of nuclear fuels were tested that included metallic and ceramic fuels. Moreover, early ceramic fuels were unclad and were uniquely prone to release fission products as a result of water vapor corrosion and by direct recoil.
ES-7
ANP Source Terms July 2005
The INEL-HDE Task Group identified a total of 51 radioisotopes as having the potential for significant release and radiation exposure. Selection of these nuclides was based on their production yields, radiological half-lives, and biological significance for uptake by plants, animals, and humans. SC&A reviewed the HDE Task Group selection criteria, which required the list of selected nuclides to contribute (1) 99% of the cumulative inhalation dose and (2) 99.9% of the cumulative immersion dose using DOE=s dose conversion factors (DOE 1988a and 1988b). On the basis of a thorough review, SC&A concluded that the list of 51 radionuclides is sufficiently inclusive for the reassessment of source terms involving IETs #3, #4, and #10.
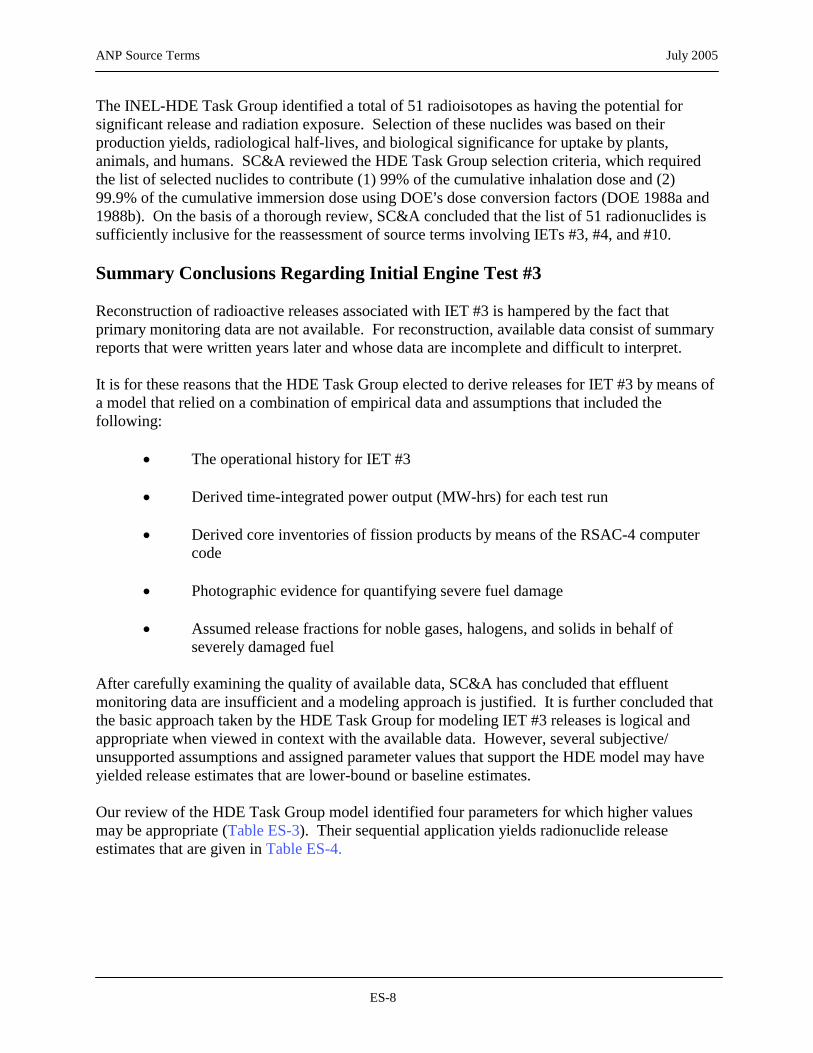
Summary Conclusions Regarding Initial Engine Test #3
Reconstruction of radioactive releases associated with IET #3 is hampered by the fact that primary monitoring data are not available. For reconstruction, available data consist of summary reports that were written years later and whose data are incomplete and difficult to interpret.
It is for these reasons that the HDE Task Group elected to derive releases for IET #3 by means of a model that relied on a combination of empirical data and assumptions that included the following:
• The operational history for IET #3
• Derived time-integrated power output (MW-hrs) for each test run
• Derived core inventories of fission products by means of the RSAC-4 computer code
• Photographic evidence for quantifying severe fuel damage
• Assumed release fractions for noble gases, halogens, and solids in behalf of severely damaged fuel
After carefully examining the quality of available data, SC&A has concluded that effluent monitoring data are insufficient and a modeling approach is justified. It is further concluded that the basic approach taken by the HDE Task Group for modeling IET #3 releases is logical and appropriate when viewed in context with the available data. However, several subjective/ unsupported assumptions and assigned parameter values that support the HDE model may have yielded release estimates that are lower-bound or baseline estimates.
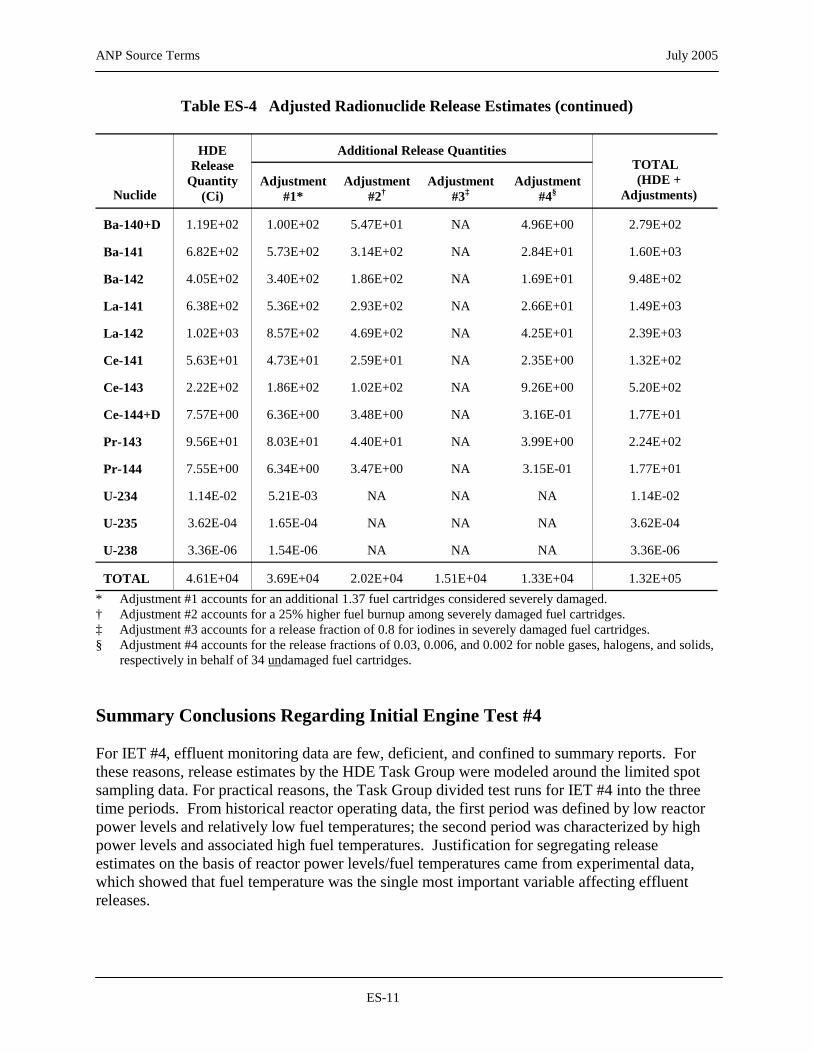
Our review of the HDE Task Group model identified four parameters for which higher values may be appropriate (Table ES-3). Their sequential application yields radionuclide release estimates that are given in Table ES-4.
ES-8

ANP Source Terms July 2005
Table ES-3 Alternate Parameter Values Recommended for Modeling Initial Engine Test #3 Releases
Parameter HDE Model Suggested Value
(1) No. of severely damaged fuel cartridges 1.63 3.0
(2) Relative power distribution 1.0 1.25 Pdamaged fuel/Pcore average
(3) Release fractions for severely damaged fuel: Noble Gases 1.0 1.0 Halogens 0.5 0.8 Solids 0.1 0.1
(4) Release fraction for undamaged fuel: Noble Gases Not considered 0.03 Halogens Not considered 0.006 Solids Not considered 0.002
Table ES-4 Adjusted Radionuclide Release Estimates
HDE Additional Release Quantities
Nuclide
Release Quantity
(Ci)
TOTAL (HDE +
Adjustments) Adjustment
#1* Adjustment
#2† Adjustment
#3‡ Adjustment
#4§
Ar-41 2.25E+03 NA NA NA NA 2.25E+03
Br-84 7.50E+02 6.30E+02 3.45E+02 1.04E+03 9.39E+01 2.85E+03
Kr-85m 8.49E+02 7.13E+02 3.91E+02 NA 5.31E+02 2.48E+03
Kr-87 4.28E+03 3.60E+03 1.97E+03 NA 2.68E+03 1.25E+04
Kr-88+D 4.67E+03 3.92E+03 2.15E+03 NA 2.92E+03 1.37E+04
Rb-89 1.63E+03 1.37E+03 7.50E+02 NA 6.80E+01 3.82E+03
Sr-89 3.37E+01 2.83E+01 1.55E+01 NA 1.41E+00 7.89E+01
Sr-90+D 2.28E-01 1.92E-01 1.05E-01 NA 9.51E-03 5.34E-01
Sr-91+D 3.69E+02 3.10E+02 1.70E+02 NA 1.54E+01 8.64E+02
Sr-92 7.90E+02 6.64E+02 3.63E+02 NA 3.30E+01 1.85E+03
Y-91 3.38E+01 2.84E+01 1.55E+01 NA 1.41E+00 7.92E+01
Y-92 3.48E+02 2.92E+02 1.60E+02 NA 1.45E+01 8.15E+02
Y-93 3.84E+02 3.23E+02 1.77E+02 NA 1.60E+01 8.99E+02
ES-9

ANP Source Terms July 2005
Table ES-4 Adjusted Radionuclide Release Estimates (continued)
Nuclide
HDE Release
Quantity (Ci)
Additional Release Quantities TOTAL (HDE +
Adjustments) Adjustment
#1* Adjustment
#2† Adjustment
#3‡ Adjustment
#4§
Zr-95+D 3.66E+01 3.07E+01 1.68E+01 NA 1.53E+00 8.57E+01
Zr-97 2.83E+02 2.38E+02 1.30E+02 NA 1.18E+01 6.63E+02
Nb-96 2.51E-02 2.11E-02 1.15E-02 NA 1.05E-03 5.88E-02
Mo-99 1.79E+02 1.50E+02 8.23E+01 NA 7.47E+00 4.19E+02
Ru-103 +D 2.72E+01 2.28E+01 1.25E+01 NA 1.13E+00 6.37E+01
Ru-105 1.06E+02 8.90E+01 4.88E+01 NA 4.42E+00 2.48E+02
Ru-106+D 4.52E-01 3.80E-01 2.08E-01 NA 1.89E-02 1.06E+00
Sb-129 7.04E+01 5.91E+01 3.24E+01 NA 2.94E+00 1.65E+02
Te-131 5.06E+02 4.25E+02 2.33E+02 NA 2.11E+01 1.18E+03
Te-131m 1.40E+01 1.18E+01 6.44E+00 NA 5.84E-01 3.28E+01
Te-132+D 1.25E+02 1.05E+02 5.75E+01 NA 5.22E+00 2.93E+02
Te-133m 4.98E+02 4.18E+02 2.29E+02 NA 2.08E+01 1.17E+03
Te-134 1.05E+03 8.82E+02 4.83E+02 NA 4.38E+01 2.46E+03
I-131 3.21E+02 2.70E+02 1.48E+02 4.43E+02 4.02E+01 1.22E+03
I-132 5.19E+02 4.36E+02 2.39E+02 7.17E+02 6.50E+01 1.98E+03
I-133 1.33E+03 1.12E+03 6.12E+02 1.84E+03 1.67E+02 5.06E+03
I-134 5.55E+03 4.66E+03 2.55E+03 7.66E+03 6.95E+02 2.11E+04
I-135 2.45E+03 2.06E+03 1.13E+03 3.38E+03 3.07E+02 9.33E+03
Xe-129m 1.30E-06 1.09E-06 5.98E-07 NA 8.14E-07 3.80E-06
Xe-135 1.78E+03 1.50E+03 8.19E+02 NA 1.11E+03 5.21E+03
Xe-135m 7.42E+02 6.23E+02 3.41E+02 NA 4.64E+02 2.17E+03
Xe-138 5.79E+03 4.86E+03 2.66E+03 NA 3.62E+03 1.69E+04
Cs-137+D 2.34E-01 1.97E-01 1.08E-01 NA 9.76E-03 5.48E-01
Cs-138 3.89E+03 3.27E+03 1.79E+03 NA 1.62E+02 9.11E+03
Ba-139 1.22E+03 1.02E+03 5.61E+02 NA 5.09E+01 2.86E+03
ES-10
ANP Source Terms July 2005
Table ES-4 Adjusted Radionuclide Release Estimates (continued)
HDE Additional Release Quantities
Nuclide
Release Quantity
(Ci)
TOTAL (HDE +
Adjustments) Adjustment
#1* Adjustment
#2† Adjustment
#3‡ Adjustment
#4§
Ba-140+D 1.19E+02 1.00E+02 5.47E+01 NA 4.96E+00 2.79E+02
Ba-141 6.82E+02 5.73E+02 3.14E+02 NA 2.84E+01 1.60E+03
Ba-142 4.05E+02 3.40E+02 1.86E+02 NA 1.69E+01 9.48E+02
La-141 6.38E+02 5.36E+02 2.93E+02 NA 2.66E+01 1.49E+03
La-142 1.02E+03 8.57E+02 4.69E+02 NA 4.25E+01 2.39E+03
Ce-141 5.63E+01 4.73E+01 2.59E+01 NA 2.35E+00 1.32E+02
Ce-143 2.22E+02 1.86E+02 1.02E+02 NA 9.26E+00 5.20E+02
Ce-144+D 7.57E+00 6.36E+00 3.48E+00 NA 3.16E-01 1.77E+01
Pr-143 9.56E+01 8.03E+01 4.40E+01 NA 3.99E+00 2.24E+02
Pr-144 7.55E+00 6.34E+00 3.47E+00 NA 3.15E-01 1.77E+01
U-234 1.14E-02 5.21E-03 NA NA NA 1.14E-02
U-235 3.62E-04 1.65E-04 NA NA NA 3.62E-04
U-238 3.36E-06 1.54E-06 NA NA NA 3.36E-06
TOTAL 4.61E+04 3.69E+04 2.02E+04 1.51E+04 1.33E+04 1.32E+05 * Adjustment #1 accounts for an additional 1.37 fuel cartridges considered severely damaged. † Adjustment #2 accounts for a 25% higher fuel burnup among severely damaged fuel cartridges. ‡ Adjustment #3 accounts for a release fraction of 0.8 for iodines in severely damaged fuel cartridges. § Adjustment #4 accounts for the release fractions of 0.03, 0.006, and 0.002 for noble gases, halogens, and solids,
respectively in behalf of 34 undamaged fuel cartridges.
Summary Conclusions Regarding Initial Engine Test #4
For IET #4, effluent monitoring data are few, deficient, and confined to summary reports. For these reasons, release estimates by the HDE Task Group were modeled around the limited spot sampling data. For practical reasons, the Task Group divided test runs for IET #4 into the three time periods. From historical reactor operating data, the first period was defined by low reactor power levels and relatively low fuel temperatures; the second period was characterized by high power levels and associated high fuel temperatures. Justification for segregating release estimates on the basis of reactor power levels/fuel temperatures came from experimental data, which showed that fuel temperature was the single most important variable affecting effluent releases.
ES-11

ANP Source Terms July 2005
Thus, for Periods #1 and #2, release estimates were derived by (1) means of the operational history for IET #4, (2) correlating release quantities of particulates to plate temperatures (3) the assumption that reactor power levels are a credible surrogate for plate temperature, (4) the assumption that the release fractions of spot-sample-particulates to volatile halogens and noble gases correspond to ratios of 1:1,000 and 1:2,000, respectively, and (5) the RSAC-4 computer code.
The third and final period for modeling releases was assumed to represent the last day of IET #4 operations. Release estimates were based on failed fuel. From photographic evidence taken during the post-operational inspection of fuel cartridges, the HDE Task Group (1) concluded that 1.27% of reactor fuel was missing, (2) determined total reactor core inventories of all fission products, and (3) assumed the proportional release of 1.27% of fission products.
In context with the quality of available data, it is our opinion that, for Periods #1 and #2, the HDE Task Group model is logical and appropriate. Furthermore, release estimates are likely to represent higher than actual values, since the HDE Task Group applied conservative assumptions for model parameters where empirical data were lacking.
For Period #3 of IET #4, SC&A, however, concluded that the HDE Task Group model may have significantly underestimated actual releases for the following reasons. In addition to releases associated with the missing 1.27% reactor fuel, additional releases must be assumed for (1) accountable fuel contained in six fuel assemblies that had suffered physical damage and (2) intact and accountable fuel in the remaining 31 fuel assemblies of the HTRE No. 1 reactor core. Table ES-5 summarizes assumptions employed by the HDE model and the additional releases from damaged and undamaged fuel assumed by SC&A.
Table ES-5 Summary Data Used to Revise Releases for Period #3 of Initial Engine Test #4
Percent Released from Individual Equivalent Percent Released from Total No. of Fuel Fuel Stages Rx Inventory
Fuel Status Stages Noble Gases Halogens Solids Noble Gases Halogens Solids
8.46*Missing fuel* 100%* 100%* 100%* 1.27%* 1.27%* 1.27%*
Damaged fuel 99.54 100%
Undamaged fuel 558 5%
Total 666
50% 10% 14.94% 7.47% 1.49%
1% 0.1% 4.19% 0.84% 0.084%
20.4% 9.58% 2.84%
* Shaded portion of Table ES-5 represents assumptions by the HDE Task Group.
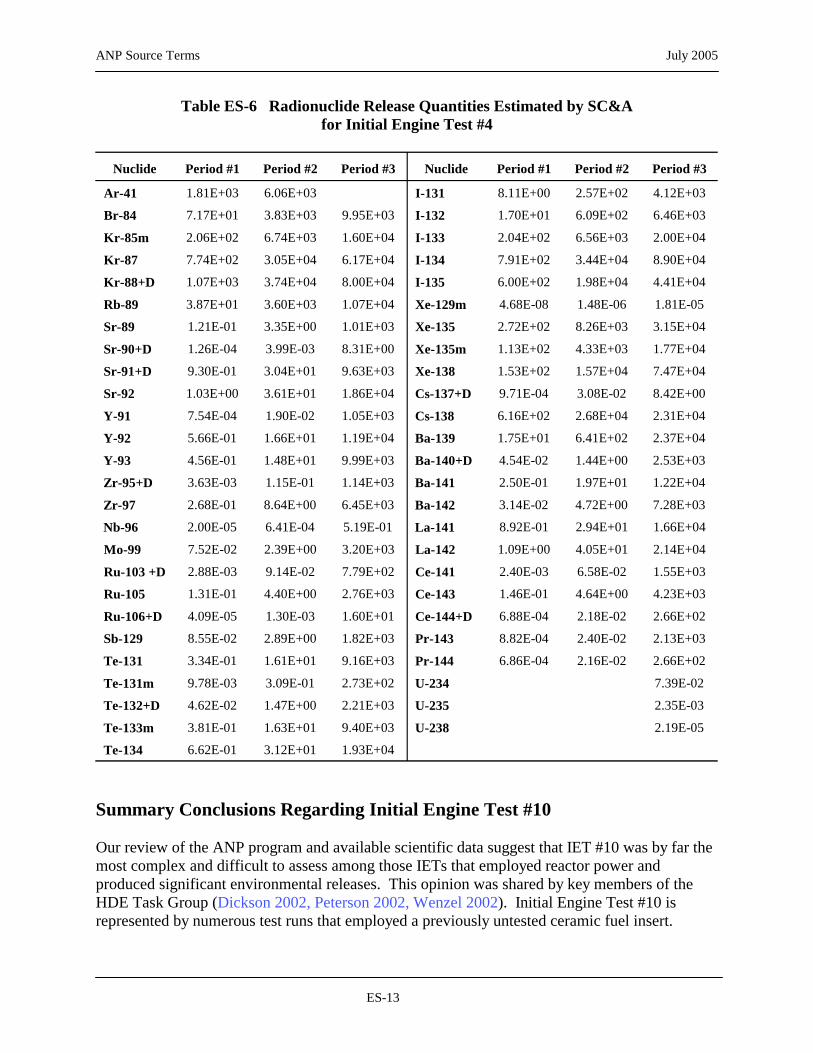
Inspection of Table ES-5 indicates that for the more inclusive SC&A model, the largest contribution to source term releases was likely to have been from damaged fuel corresponding to six fuel assemblies with 99.54 accountable fuel stages out of 108. Table ES-6 summarizes radionuclide-specific releases for Periods #1 and #2 as derived by the HDE Task Group model, and for Period #3 as revised by the SC&A model.
ES-12
ANP Source Terms July 2005
Table ES-6 Radionuclide Release Quantities Estimated by SC&A for Initial Engine Test #4
Nuclide Period #1 Period #2 Period #3 Nuclide Period #1 Period #2 Period #3
Ar-41 1.81E+03 6.06E+03 I-131 8.11E+00 2.57E+02 4.12E+03
Br-84 7.17E+01 3.83E+03 9.95E+03 I-132 1.70E+01 6.09E+02 6.46E+03
Kr-85m 2.06E+02 6.74E+03 1.60E+04 I-133 2.04E+02 6.56E+03 2.00E+04
Kr-87 7.74E+02 3.05E+04 6.17E+04 I-134 7.91E+02 3.44E+04 8.90E+04
Kr-88+D 1.07E+03 3.74E+04 8.00E+04 I-135 6.00E+02 1.98E+04 4.41E+04
Rb-89 3.87E+01 3.60E+03 1.07E+04 Xe-129m 4.68E-08 1.48E-06 1.81E-05
Sr-89 1.21E-01 3.35E+00 1.01E+03 Xe-135 2.72E+02 8.26E+03 3.15E+04
Sr-90+D 1.26E-04 3.99E-03 8.31E+00 Xe-135m 1.13E+02 4.33E+03 1.77E+04
Sr-91+D 9.30E-01 3.04E+01 9.63E+03 Xe-138 1.53E+02 1.57E+04 7.47E+04
Sr-92 1.03E+00 3.61E+01 1.86E+04 Cs-137+D 9.71E-04 3.08E-02 8.42E+00
Y-91 7.54E-04 1.90E-02 1.05E+03 Cs-138 6.16E+02 2.68E+04 2.31E+04
Y-92 5.66E-01 1.66E+01 1.19E+04 Ba-139 1.75E+01 6.41E+02 2.37E+04
Y-93 4.56E-01 1.48E+01 9.99E+03 Ba-140+D 4.54E-02 1.44E+00 2.53E+03
Zr-95+D 3.63E-03 1.15E-01 1.14E+03 Ba-141 2.50E-01 1.97E+01 1.22E+04
Zr-97 2.68E-01 8.64E+00 6.45E+03 Ba-142 3.14E-02 4.72E+00 7.28E+03
Nb-96 2.00E-05 6.41E-04 5.19E-01 La-141 8.92E-01 2.94E+01 1.66E+04
Mo-99 7.52E-02 2.39E+00 3.20E+03 La-142 1.09E+00 4.05E+01 2.14E+04
Ru-103 +D 2.88E-03 9.14E-02 7.79E+02 Ce-141 2.40E-03 6.58E-02 1.55E+03
Ru-105 1.31E-01 4.40E+00 2.76E+03 Ce-143 1.46E-01 4.64E+00 4.23E+03
Ru-106+D 4.09E-05 1.30E-03 1.60E+01 Ce-144+D 6.88E-04 2.18E-02 2.66E+02
Sb-129 8.55E-02 2.89E+00 1.82E+03 Pr-143 8.82E-04 2.40E-02 2.13E+03
Te-131 3.34E-01 1.61E+01 9.16E+03 Pr-144 6.86E-04 2.16E-02 2.66E+02
Te-131m 9.78E-03 3.09E-01 2.73E+02 U-234 7.39E-02
Te-132+D 4.62E-02 1.47E+00 2.21E+03 U-235 2.35E-03
Te-133m 3.81E-01 1.63E+01 9.40E+03 U-238 2.19E-05
Te-134 6.62E-01 3.12E+01 1.93E+04
Summary Conclusions Regarding Initial Engine Test #10
Our review of the ANP program and available scientific data suggest that IET #10 was by far the most complex and difficult to assess among those IETs that employed reactor power and produced significant environmental releases. This opinion was shared by key members of the HDE Task Group (Dickson 2002, Peterson 2002, Wenzel 2002). Initial Engine Test #10 is represented by numerous test runs that employed a previously untested ceramic fuel insert.
ES-13

ANP Source Terms July 2005
Unique features of Insert 2-B were its fuel, which consisted of a homogeneous ceramic mixture of BeO, UO2, and Y2O3, and the fact that this fuel was without cladding. Attempts to test the insert at the specified temperature of 2,750EF proved difficult and necessitated the plugging of a substantial number of air passages through the insert.
Due to comprehensive failures of thermocouples that involved the melting of wire leads, actual temperatures within the ceramic insert were not measured. It was estimated that temperatures of at least 3,200EF were experienced by the insert=s fuel.
Post-operation inspection of Insert 2-B supported the likelihood of severely elevated temperatures. The inspection revealed fused fuel tubes and the presence of a substantial amount of white crystalline deposits on the inside surfaces of fuel tubes. The deposits were most pronounced for stages 6 through 10 and served possibly as a contributing factor to reduced airflow and resultant excessive temperatures among the failed fuel tubes.
Analysis of the white deposits confirmed the presence of beryllium and uranium, which had been removed from upstream fuel by the action of water vapor hydrolysis; beryllium was also found in effluent air by vault carbon traps that were located about 400 feet downstream from the ceramic fuel insert. However, no attempt was made to quantify the substantial quantities of BeO deposits that had been found downstream within the ceramic fuel insert.
Effluent monitoring for IET #10 consisted principally of carbon traps at various downstream locations and filter paper spot sampling. Available effluent monitoring data were confined to summary data that were incomplete, inconsistent, and difficult to interpret. For these reasons the HDE Task Group elected to model IET #10 releases by (1) reinterpreting earlier summary data, (2) using a present-day computer code, and (3) making assumptions that the Task Group considered reasonable.
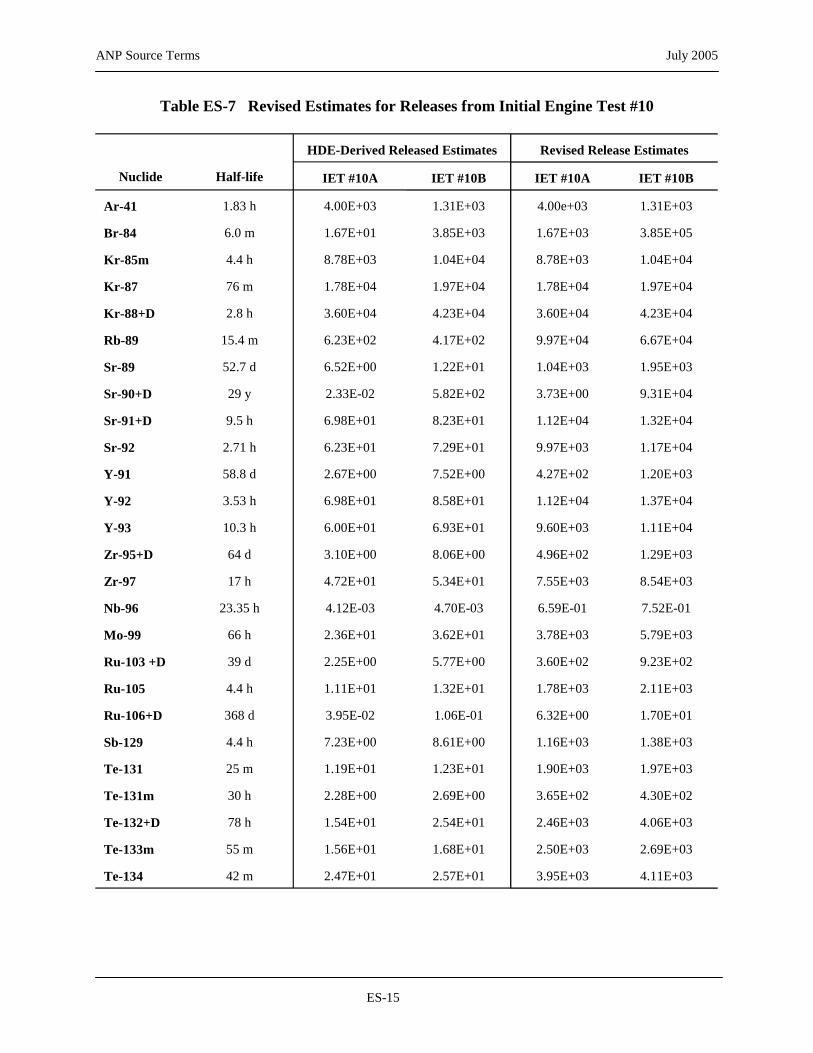
Our review of available information for IET #10 and its interpretation by the Task Group suggest that the HDE Task Group model may have underestimated the release of radioiodines by about 10-fold. Support for this conclusion was based on (1) photographic evidence and modeled calculation of BeO deposits, and (2) empirical weight measurements of select ceramic fuel tubes that showed UO2 fuel losses of up to 84%. SC&A’s revised release estimates for IET #10 are summarized in Table ES-7.
ES-14
ANP Source Terms July 2005
Table ES-7 Revised Estimates for Releases from Initial Engine Test #10
Nuclide Half-life
HDE-Derived Released Estimates Revised Release Estimates
IET #10A IET #10B IET #10A IET #10B
Ar-41 1.83 h 4.00E+03 1.31E+03 4.00e+03 1.31E+03
Br-84 6.0 m 1.67E+01 3.85E+03 1.67E+03 3.85E+05
Kr-85m 4.4 h 8.78E+03 1.04E+04 8.78E+03 1.04E+04
Kr-87 76 m 1.78E+04 1.97E+04 1.78E+04 1.97E+04
Kr-88+D 2.8 h 3.60E+04 4.23E+04 3.60E+04 4.23E+04
Rb-89 15.4 m 6.23E+02 4.17E+02 9.97E+04 6.67E+04
Sr-89 52.7 d 6.52E+00 1.22E+01 1.04E+03 1.95E+03
Sr-90+D 29 y 2.33E-02 5.82E+02 3.73E+00 9.31E+04
Sr-91+D 9.5 h 6.98E+01 8.23E+01 1.12E+04 1.32E+04
Sr-92 2.71 h 6.23E+01 7.29E+01 9.97E+03 1.17E+04
Y-91 58.8 d 2.67E+00 7.52E+00 4.27E+02 1.20E+03
Y-92 3.53 h 6.98E+01 8.58E+01 1.12E+04 1.37E+04
Y-93 10.3 h 6.00E+01 6.93E+01 9.60E+03 1.11E+04
Zr-95+D 64 d 3.10E+00 8.06E+00 4.96E+02 1.29E+03
Zr-97 17 h 4.72E+01 5.34E+01 7.55E+03 8.54E+03
Nb-96 23.35 h 4.12E-03 4.70E-03 6.59E-01 7.52E-01
Mo-99 66 h 2.36E+01 3.62E+01 3.78E+03 5.79E+03
Ru-103 +D 39 d 2.25E+00 5.77E+00 3.60E+02 9.23E+02
Ru-105 4.4 h 1.11E+01 1.32E+01 1.78E+03 2.11E+03
Ru-106+D 368 d 3.95E-02 1.06E-01 6.32E+00 1.70E+01
Sb-129 4.4 h 7.23E+00 8.61E+00 1.16E+03 1.38E+03
Te-131 25 m 1.19E+01 1.23E+01 1.90E+03 1.97E+03
Te-131m 30 h 2.28E+00 2.69E+00 3.65E+02 4.30E+02
Te-132+D 78 h 1.54E+01 2.54E+01 2.46E+03 4.06E+03
Te-133m 55 m 1.56E+01 1.68E+01 2.50E+03 2.69E+03
Te-134 42 m 2.47E+01 2.57E+01 3.95E+03 4.11E+03
ES-15

ANP Source Terms July 2005
Table ES-7 Revised Estimates for Releases from Initial Engine Test #10 (continued)
Nuclide Half-life
HDE-Derived Released Estimates Revised Release Estimates
IET #10A IET #10B IET #10A IET #10B
I-131 8.05 d 3.42E+01 2.07E+01 3.42E+03 2.07E+03
I-132 2.3 h 6.00E+01 3.18E+01 6.00E+03 3.18E+03
I-133 20.3 h 3.00E+02 8.62E+01 3.00E+04 8.62E+03
I-134 52.0 m 2.53E+02 9.00E+01 2.53E+04 9.00E+03
I-135 6.68 h 4.11E+02 1.20E+02 4.11E+04 1.20E+04
Xe-129m 8.0 d 1.13E-05 2.54E-05 1.13E-05 2.54E-05
Xe-135 9.14 h 4.50E+04 4.72E+04 4.50E+04 4.72E+04
Xe-135m 15.6 m 4.74E+02 3.18E+02 4.74E+02 3.18E+02
Xe-138 17.5 m 2.51E+03 1.52E+03 2.51E+03 1.52E+03
Cs-137+D 30 y 4.86E-02 9.14E-02 7.78E+00 1.46E+01
Cs-138 32.2 m 1.08E+04 1.15E+04 1.73E+06 1.84E+06
Ba-139 82.9 m 4.17E+02 4.69E+02 6.67E+04 7.50E+04
Ba-140+D 13 d 1.06E+01 2.42E+01 1.70E+03 3.87E+03
Ba-141 18 m 6.39E+00 4.97E+00 1.02E+03 7.95E+02
Ba-142 11 m 1.08E+00 4.15E-01 1.73E+02 6.64E+01
La-141 3.87 h 6.80E+01 8.11E+01 1.09E+04 1.30E+04
La-142 92.5 m 5.44E+01 6.14E+01 8.70E+03 9.82E+03
Ce-141 32.5 d 4.57E+00 1.21E+01 7.31E+02 1.94E+03
Ce-143 33 h 3.53E+01 4.24E+01 5.65E+03 6.78E+03
Ce-144+D 284 d 6.60E-01 1.76E+00 1.06E+02 2.82E+02
Pr-143 13.59 d 5.91E+00 1.89E+01 9.46E+02 3.02E+03
Pr-144 17 m 6.60E-01 1.76E+00 1.06E+02 2.82E+02
U-234 2.47x10⁵ y 3.06E-04 1.23E-04 1.53E-03 6.15E-04
U-235 7x10⁸ y 9.74E-06 3.91E-06 4.87E-05 1.96E-05
U-238 4.5x10⁹ y 9.06E-08 3.64E-08 4.53E-07 1.82E-07
TOTAL 1.28E+05 1.41E+05 2.22E+06 2.74E+06
ES-16

ANP Source Terms July 2005
1.0 RELEVANT BACKGROUND INFORMATION
1.1 Overview of Aircraft Nuclear Propulsion Program
Soon after the early development of nuclear weapons and their use in World War II, there was interest in other uses of nuclear energy that included its use in the propulsion of ships, aircrafts, and rockets. Interest in atomic aircraft began officially in 1946 under the project known as NEPA (Nuclear Energy for the Propulsion of Aircraft). Because the NEPA project was controlled by the United States Air Force (USAF), it was oriented towards developing an atomic-powered long-range strategic bomber. Nuclear power showed promise in both fields because of its dual nature of long-lasting fuel supply and high power levels theoretically possible using a reactor.
The NEPA contract was with the Fairchild Engine & Airframe Co., and the work was conducted at Oak Ridge, TN. Extensive studies were conducted under NEPA from 1946 until 1951. The 5-year NEPA project was a study and research effort culminating in the proposal for active development of nuclear propulsion for manned aircraft. Thus, in 1951, NEPA was replaced by the joint Atomic Energy Commission (AEC)/USAF Aircraft Nuclear Propulsion (ANP) program, which employed the General Electric Company (GE) as the principal contractor (Thornton 1962a).
Although the ANP program was largely based on NEPA recommendations to develop an indirect cycle, single reactor propulsion system, the power plant design concept selected for development by GE was the direct-air-cycle turbojet in which air is the only working fluid. In the direct-air-cycle design, the reactor receives air from the jet engine compressor, heats it directly, and delivers it to the turbine. The high-temperature air then generates the forward thrust as it exhausts through the engine nozzle. The direct-air-cycle concept was selected on the basis of studies that suggested it would provide a relatively simple, dependable, and serviceable power plant with high-performance potential (Thornton 1962a).
Approval was granted to proceed with the development of a power plant, designated the P-1, to meet the early flight objective. The initial ground test was scheduled for 1954 and a flight test for 1957. The P-1 project and the early flight objective were withdrawn in March 1953 on the basis that early flight demonstration with a system not fitting a specific military requirement was no longer warranted. A key element in the early phase of the ANP program was the X-6 program. Beginning in 1952, the designated goal of the X-6 program was to produce two flying testbeds powered by atomic energy. A B-36 bomber was converted for this purpose. This aircraft was referred to as the Nuclear Test Aircraft (NTA). The NTA began its life as a Convair B-36H bomber, but after conversion, it was redesignated as an NB–36H (Thornton 1962a).
Upon termination of the P-1 program, GE-ANP activities were redirected toward a broad component development program. Thus, during the summer of 1953, a General Electric Program Task Force was formed for the purpose of establishing a method to give direction for the component development program in the absence of a specific power plant objective. In brief, the materials program encompassed the development of metallic and ceramic fuel elements, hydrided metallic moderators and shield, controls, and structural materials for use in both subsonic and supersonic aircraft. This was supported by extensive in-pile test programs.
1-1

ANP Source Terms July 2005
Engineering analysis techniques were developed in reactor and shield nuclear physics, aerothermodynamics, controls, mechanics, and nuclear safety. In addition, the Task Force recommended the construction of a Core Test Facility (CTF), which could serve as a test vehicle for a variety of reactor types of potential interest in actual propulsion systems. After consideration of air supply requirements for the CTF, a turbojet engine was selected rather than a system utilizing a compressor driven by electric motors, diesel engines, or other power sources. The selection of the turbojet engine as an air supply permitted the incorporation of all the principal elements of a nuclear propulsion system, such as reactor, shield, engine, and controls (Layman 1962).
Heat Transfer Reactor Experiments. A series of experimental reactors was built and operated using materials and methods developed in the applied research activity. These were referred to as the Heat Transfer Reactor Experiment (HTRE) series. The series involved three reactors designated as HTRE No. 1, HTRE No. 2, and HTRE No. 3. Key features of the three experimental reactors included the following:
• HTRE No. 1 was a reactor using metallic nickel-chromium, uranium-oxide-dispersion fuel elements, with water serving the combined function of moderator and structural coolant. The HTRE No. 1 reactor first operated a modified GE J47 turbojet engine exclusively on nuclear power in January 1956. Operation of the HTRE No. 1 continued throughout the Calendar Year 1956, accumulating a total of 150.8 hours of operation at high nuclear power levels, exceeding the design requirement of 100 hours (Thornton 1962b).
• The HTRE No. 2 reactor was a modification of HTRE No. 1, providing a hexagonal center hole, 11 inches across with an active length of 30 inches, for use in testing insert sections for advanced reactors. The HTRE-2 operation started in July 1957 and continued during the remainder of the program, accumulating 1,299 hours of high power nuclear operation. Insert test sections consisted of metallic fuel elements combined with air-cooled hydrided zirconium moderators and beryllium oxide fuel elements for use in ceramic reactors. Inserts were operated at material temperatures up to 2,800EF for extended periods and at higher temperatures for short periods (Blake et al. 1961, Blake et al. 1962).
• The HTRE No. 3 reactor was built in a full-scale aircraft reactor configuration using Ni–Cr fuel elements of the HTRE No. 1-type and an air-cooled hydrided zirconium moderator. Two modified J47 turbojets were operated by the reactor, with full nuclear power being achieved in 1959. The system operated for a total of 126 hours; the design objective was 100 hours of operation (Schoenberger 1958).
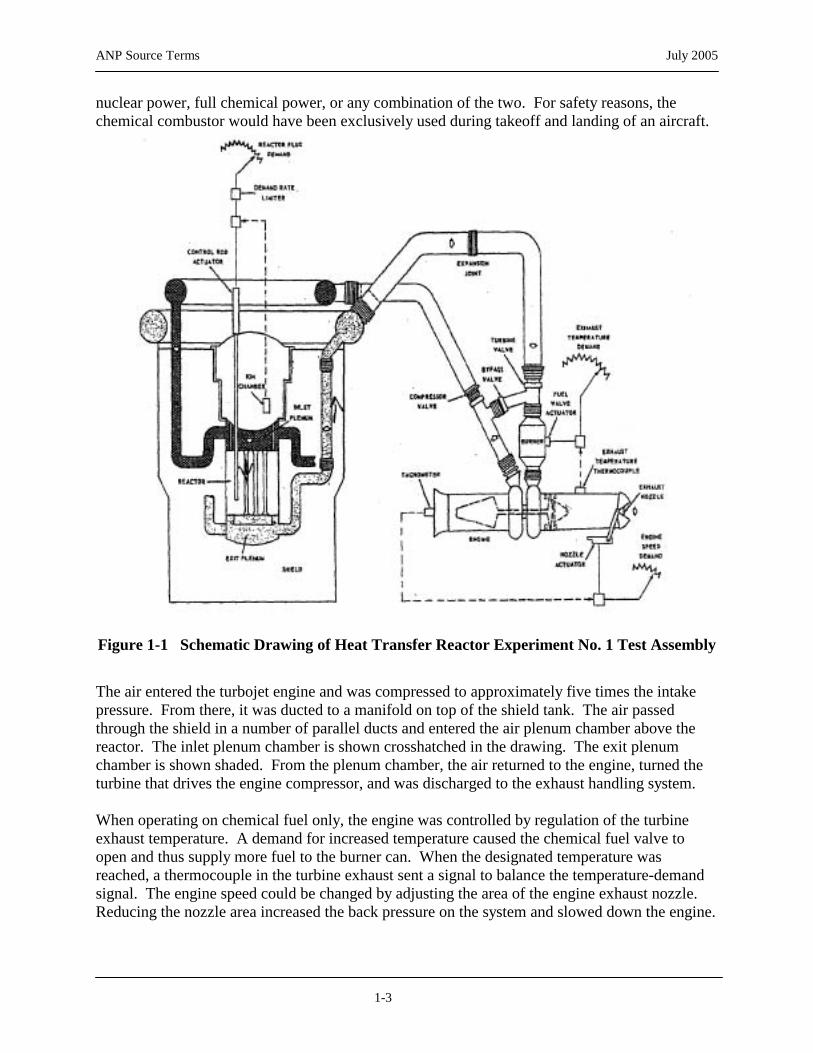
All three HTRE reactors were of the standard direct cycle configuration (Figure 1-1). The general method for controlling an air-cooled reactor was by means of a chemical burner just upstream from the turbines. This chemical combustor would allow the reactor to be started and achieve full power with gradual switching to nuclear power. Under aircraft operational conditions, this control mechanism would have allowed full power operation either at full
1-2
ANP Source Terms July 2005
nuclear power, full chemical power, or any combination of the two. For safety reasons, the chemical combustor would have been exclusively used during takeoff and landing of an aircraft.
Figure 1-1 Schematic Drawing of Heat Transfer Reactor Experiment No. 1 Test Assembly
The air entered the turbojet engine and was compressed to approximately five times the intake pressure. From there, it was ducted to a manifold on top of the shield tank. The air passed through the shield in a number of parallel ducts and entered the air plenum chamber above the reactor. The inlet plenum chamber is shown crosshatched in the drawing. The exit plenum chamber is shown shaded. From the plenum chamber, the air returned to the engine, turned the turbine that drives the engine compressor, and was discharged to the exhaust handling system.
When operating on chemical fuel only, the engine was controlled by regulation of the turbine exhaust temperature. A demand for increased temperature caused the chemical fuel valve to open and thus supply more fuel to the burner can. When the designated temperature was reached, a thermocouple in the turbine exhaust sent a signal to balance the temperature-demand signal. The engine speed could be changed by adjusting the area of the engine exhaust nozzle. Reducing the nozzle area increased the back pressure on the system and slowed down the engine.
1-3

ANP Source Terms July 2005
The reactor power was controlled by the insertion or withdrawal of control rods. The neutron flux level in the top plug was used as a measure of reactor power.
The power plant was started on chemical fuel alone with compressor air passing through the cold reactor. Then, with the engine speed and turbine exhaust temperature controls set at a predetermined level, the reactor was started and the power increased. When the nuclear heat added to the air was detected by the turbine exhaust thermocouple, the chemical fuel valve would start to close in an attempt to maintain the exhaust temperature at the predetermined level. As the reactor power was increased, the chemical fuel valve closed completely. Engine speed was held constant throughout. Further increase in reactor power caused an increase in exhaust temperature. Temperature limiters caused automatic scram if the reactor operator allowed an excessive temperature increase while on nuclear power.
During the 8-year period from 1953 to 1961, the 3 reactor assemblies were used to evaluate reactor control systems, nuclear fuels and moderators, and the feasibility of operating a nuclear-powered aircraft. The HTRE assemblies were mounted on a 4-track railroad dolly and were operated at the CTF located at the Test Area North (TAN) at the Idaho National Engineering Laboratory1 (INEL) (Figures 1-2 and 1-3). The CTF provided the shielded control room, the support utilities required for testing (e.g., electrical power, water, etc.), and the instrument reactor exhaust system. The testing program for the HTRE assemblies was designated as the Initial Engine Tests (IETs). There were a total of 26 IETs, which were numbered sequentially from IET #1 through IET #26.
Figure 1-2 Core Test Facility
1In this report, we refer to the site by its historical name at the time the releases of concern to this report
occurred, rather than its current name, which is the Idaho National Engineering and Environmental Laboratory (INEEL).
1-4

ANP Source Terms July 2005
Figure 1-3 The Idaho National Engineering Laboratory Site Facility Showing Location of Test Area North
1-5

ANP Source Terms July 2005
While the HTRE tests were generally viewed as successful by having demonstrated the feasibility of a nuclear-powered aircraft, the ANP program was terminated by President John F. Kennedy in March of 1961 before the airplane and the actual reactors to be used to power it were ever constructed.
Radioactive Releases. Although releases were mitigated by predetermined test constraints and specified meteorological conditions, due to the very nature of ANP test objectives at the INEL, controlled but significant radioactive releases to the environment were clearly expected from IETs. The ANP Program at INEL involved reactor designs, reactor fuel configuration, and fuel materials that were unprecedented and included the following:
• Reactor prototypes were designed for high power densities in order to minimize shielding requirements
• Fuel configuration consisting of wafer thin (0.013 to 0.21 inches) concentric ribbons of UO2 enriched materials that maximized heat transfer in the direct-air-cycle reactor
• Under full power, sustained airflows of 100 pounds per second and reaching temperatures of 1,250EF flowed through the reactor
• Fuel inserts were operated at material temperatures in excess of 3,000EF for extended periods of time
• Besides the parent fuel core consisting of nickel-chromium, uranium oxide dispersion fuel elements, a host of fuel inserts were tested in which UO2 was homogeneously incorporated into a ceramic matrix consisting of BeO,UO2,Y2O3 without cladding
Once released from the fuel elements, all radioactivity was discharged directly into the atmosphere.
1.2 Previous Assessment of Radioactive Releases and Resultant Doses from Aircraft Nuclear Propulsion
In December 1988, the Idaho National Engineering Laboratory Historical Dose Evaluation (INEL-HDE) Task Group was chartered in response to concerns about potential radiological consequences to the public from past activities at INEL that included the ANP tests. In 1991, the HDE Task Group issued a comprehensive two-volume report that quantified radioactive releases (and associated doses) from activities categorized as either operational or episodic. Operational releases are continuous, somewhat uniform releases that occur over extended periods of time and reflect average meteorological conditions corresponding to a full year or a large portion of a year.
In contrast, episodic releases generally reflect tests, experiments, and/or accidents that span relatively shorter periods of time (i.e., hours). A large fraction of the IETs were performed intermittently over extended periods of time ranging from a few weeks to several months;
1-6
ANP Source Terms July 2005
depending on the test protocols, the HTRE was operated in a non-continuous manner at different times during the day and for varying durations of time. Release rates during IET test runs, therefore, reflected radionuclide mixtures that were affected by past reactor fuel burnup and decay, as well as concurrent production rates and reactor operational parameters. Under these conditions, it must be assumed that the relative composition of the radionuclides in the effluent changed over time along with changes in total release rates. Calculating source terms (and atmospheric dispersion coefficients) for episodic releases associated with some of the ANP IETs, therefore, posed challenging technical problems for the HDE. If sufficient information concerning reactor operations, release rates, and release times was not available, the test was divided into one or a few operational periods and releases were assumed to be uniform for the duration of each period. The HDE Task Group used this approach for IETs #4, #6, and #16.
When sufficient information concerning reactor operations and effluent monitoring data was available, attempts were made to identify changes and peak period(s) of release during a given test run and apply a time-weighted dispersion coefficient. Weighted-average dispersion coefficients were calculated and applied for IETs #3, #8, #10, #11, #14, #15, #17 through #21, #23, #25, and #26. Initial Engine Tests #12, #13, #22 and #24 were of short duration and could, therefore, be modeled by meteorological data that specifically corresponded to the short time period.
It should be pointed out that the need to address meteorological factors in behalf of Task 2, which is concerned with IETs radiological source terms, is due to the fact that the HDE Task Group reported release quantities in terms of curies that reached the INEL site boundary. Depending on wind speed and wind direction, the time interval and associated radioactive decay during transport was, therefore, variable. Table 1-1 summarizes the episodic release quantities associated with the IETs. It should be noted that several of the 26 IETs were non-nuclear and resulted in no releases, since they were limited to operational aspects of valves, ducts, and other peripheral components of the aircraft propulsion system.
1-7

ANP Source Terms July 2005
Table 1-1 Summary of Radioactive Releases Associated with Aircraft Nuclear Propulsion Initial Engine Tests as Reported by the Idaho National Engineering Laboratory Historical Dose Evaluation
IET No. Test Dates (d/mo/yr) Release Quantity (Curies) Time to Site Boundary (h)
IET #3 2/11 - 2/24/56 46,000 0.8
IET #4
$ IET #4A 5/1 - 5/23/56 6,800 1.1
$ IET #4B 5/24 - 6/29/56 210,000 0.7
$ IET #4C 6/29/56 150,000 0.3
IET #6 12/18/56 9,000
IET #8 7/31 - 8/28/57 1,700
IET #10
$ IET #10A 12/20/57 - 2/25/58 130,000 Varies
$ IET #10B 3/1- 3/6/58 140,000 Varies
IET #11 3/20 - 4/14/58 4,200 Varies
IET #12 5/2/58 4,000
IET #13 11/18/58 940 1.4
IET #14 4/24 - 5/19/59 7,500 Varies
IET #15
$ IET #15A 6/3 - 6/15/59 2,000
$ IET #15B 6/16 - 6/24/59 1,200
IET #16 10/9/59 300
IET #17
$ IET #17A 11/2 - 11/30/59 2,400
$ IET #17B 12/1 - 12/12/59 2,200
IET #18 1/6 - 2/7/60 14,000 Varies
IET #19
$ IET #19A 2/17 - 2/29/60 1,200
$ IET #19B 3/1 - 4/30/60 8,400 Varies
IET #20 5/14 - 6/10/60 7,500 Varies
IET #21 6/29 - 8/6/60 2,000
IET #22 8/25/60 4,100
1-8

ANP Source Terms July 2005
Table 1-1 Summary of Radioactive Releases Associated with Aircraft Nuclear Propulsion Initial Engine Tests as Reported by
Idaho National Engineering Laboratory Historical Dose Evaluation (continued)
IET No. Test Dates (d/mo/yr) Release Quantity (Curies) Time to Site Boundary (h)
IET #23 9/7 - 10/14/60 1,700 Varies
IET #24 10/26/60 4,800
IET #25
$ IET #25A 11/22 - 11/30/60 2,400
$ IET #25B 12/1 - 12/15/60 7,800
IET #26
$ IET #26A 12/23/60 - 2/28/61 7,000
$ IET #26B 3/1 - 3/30/61 3,100 Varies
On the basis of radionuclide release quantities, radionuclide composition, and meteorological parameters, the HDE derived dose estimates for a hypothetical offsite adult, child, and infant for each IET (Table 1-2).
A review of Tables 1-1 and 1-2 reveals that the magnitude of radioactive releases and their offsite exposure doses were highly variable. By far, the highest releases resulted from IET #3, IET #4, and IET #10. In brief, the combined estimated release of 682,000 curies by IETs #3, #4, and #10 is nearly seven times the combined release of 99,440 curies estimated for all other IETs that employed reactor power during the test.
Of interest is that the HDE Task Group identified IET #3 as having caused the highest offsite exposure, even though the estimated release of 46,000 curies for IET #3 is only a fraction of the release quantities associated with IET #4 and IET #10. Of further interest is that in 1956, when IETs #3 and #4 were conducted for the HTRE No. 1 test series, instrumentation and analytical methods used to monitor effluent released from IET test runs were in their early stages of development. Thus, effluent release estimates for IET #3 were principally based on photographic evidence of fuel damage and assumed release fractions for noble gases, halogens, and solids.
1-9
ANP Source Terms July 2005
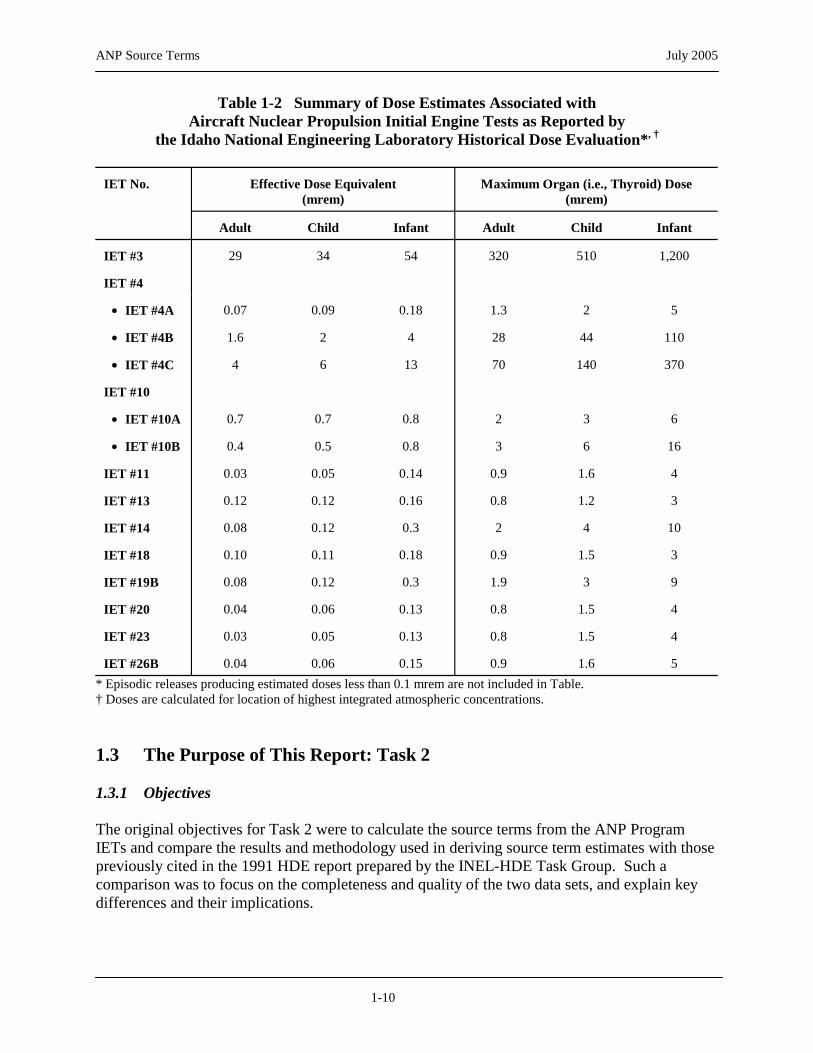
Table 1-2 Summary of Dose Estimates Associated with Aircraft Nuclear Propulsion Initial Engine Tests as Reported by
the Idaho National Engineering Laboratory Historical Dose Evaluation*, †
IET No. Effective Dose Equivalent Maximum Organ (i.e., Thyroid) Dose (mrem) (mrem)
Adult Child Infant Adult Child Infant
IET #3 29 34 54 320 510 1,200
IET #4
$ IET #4A 0.07 0.09 0.18 1.3 2 5
$ IET #4B 1.6 2 4 28 44 110
$ IET #4C 4 6 13 70 140 370
IET #10
$ IET #10A 0.7 0.7 0.8 2 3 6
$ IET #10B 0.4 0.5 0.8 3 6 16
IET #11 0.03 0.05 0.14 0.9 1.6 4
IET #13 0.12 0.12 0.16 0.8 1.2 3
IET #14 0.08 0.12 0.3 2 4 10
IET #18 0.10 0.11 0.18 0.9 1.5 3
IET #19B 0.08 0.12 0.3 1.9 3 9
IET #20 0.04 0.06 0.13 0.8 1.5 4
IET #23 0.03 0.05 0.13 0.8 1.5 4
IET #26B 0.04 0.06 0.15 0.9 1.6 5 * Episodic releases producing estimated doses less than 0.1 mrem are not included in Table. † Doses are calculated for location of highest integrated atmospheric concentrations.
1.3 The Purpose of This Report: Task 2
1.3.1 Objectives
The original objectives for Task 2 were to calculate the source terms from the ANP Program IETs and compare the results and methodology used in deriving source term estimates with those previously cited in the 1991 HDE report prepared by the INEL-HDE Task Group. Such a comparison was to focus on the completeness and quality of the two data sets, and explain key differences and their implications.
1-10

ANP Source Terms July 2005
1.3.2 Revised Scope for Task 2
After a preliminary document review, it was concluded that an assessment of source terms for IETs was complex and that a comprehensive analysis for all IETs that employed reactor power was beyond the constraints of time and allotted resources for Task 2. Because data suggested that the largest releases and/or doses were those of IET #3, IET #4, and IET #10, and whose test objectives included (1) testing that determined bounding operating parameter limits of sustained reactor power and fuel temperature levels, and (2) intentional destructive testing of fuel elements and reactor components that evaluated the kind and magnitude of material/component failures, it was decided that a reduced but, nevertheless, meaningful assessment could limit the scope of Task 2 to IETs #3, #4, and #10.
1.3.3 Approach
As a starting point for our assessment of source terms, SC&A conducted a site visit to INEL and critically reviewed all available information relating to the ANP program. Our search revealed that, among available documents, there was no primary data, such as health physics logbooks, that quantified specific effluent measurements. Useful data were limited to a series of summary reports, which described key aspects of each IET’s test objectives, operating parameters, and resultant fuel integrity/failure. For IET#3, the objectives had been to determine the characteristics of the reactor core, cooling systems, and control rod system; for IET #4, the principle objectives were to assess several modifications that were made to HTRE No. 1 since the first test series (i.e., IET #3); and for IET #10 that employed HTRE No. 2, the primary test objectives focused on power testing of the ceramic fuel insert (designated Insert 2B).
Summary reports acknowledged that effluent monitoring throughout the ANP testing period was by no means constant, but reflected an evolving learning process. Thus, the early IETs #3, #4, and #10 coincided with effluent monitoring methods (and data) that were both incomplete and difficult to interpret. Since SC&A’s evaluation of ANP source terms included a critical review of source terms cited in the 1991 report issued by the HDE Task Group, meetings and discussions were held with key investigators of the Task Group, as well as individuals who had been directly affiliated with the ANP program.
As part of our evaluation of previous monitoring data, it was critically important to correlate effluent data relative to chemical fuel consumption rate, reactor power levels, reactor plate temperature, and fuel configuration for the following reasons:
• Effect of Chemical Fuel Flow. An important aspect of the aircraft nuclear propulsion system is that it is linked to a normal jet engine and combustion of jet fuel.
The concurrent consumption of fossil fuel during reactor power operations introduced particulates into the effluent exhaust gases, which profoundly affected monitoring data. Data showed that the combustion of fossil fuel and the entrainment of particulate matter greatly determined whether volatile radioiodines (and even noble gases) were in a gaseous or particulate state at effluent sampling points (Holtslag 1956, Ebersole 1956).
1-11

ANP Source Terms July 2005
• Effect of Reactor Power. Increases in reactor power levels (at a constant chemical/fuel flow) showed significant but modest increases in effluent activity.
• Effect of Reactor Plate Temperature. Particulate activity showed no significant dependency over a range of temperatures considered low (i.e., < 1,500EF), but increased sharply at higher temperatures. Thus, it was concluded that temperature level is by far the most critical parameter affecting the integrity of the ANP fuel elements and their release of fission products. During destructive test runs, temperatures well above 3,000EF were reached and resulted in fuel damage and large releases.
• Effect of Reactor Fuel Type. A variety of nuclear fuels were tested that included metallic and ceramic fuels. Moreover, early ceramic fuels were unclad and were uniquely prone to release fission products as a result of water vapor corrosion and by direct recoil.
As part of SC&A’s quality assurance protocol, an earlier draft of this report was subjected to an internal and external review that included the CDC and INEL. The review process resulted in significant changes to source terms estimated in behalf of IET #4 and IET #10.
Lastly, SC&A presented its final estimates of source terms for IETs #3, #4, and #10 to the CDC in an oral presentation in Atlanta, Georgia, on June 16 and 17, 2003 and subsequently to the Health Effects Subcommittee (HES) in Boise, Idaho, on July 1, 2003. Key members of the HDE Task Group attended both meetings.
1.4 Radionuclides Considered in Initial Engine Test Releases
The HTRE employed enriched uranium. In the fission process, there are many different ways in which a uranium-235 nucleus can split to form fission products and release energy through the emission of ionizing radiation.
At the time of fission, about 60 different radioisotopes are formed, representing some 35 elements. In turn, many of these give rise to one or more radioactive daughter product(s), so that eventually more than 170 isotopes are produced. These primary and secondary fission products are largely beta-gamma emitters and represent isotopes of elements in the middle range of atomic weights of about 100 and 140 daltons. The relative production or yield of radioactive fission products, however, is highly variable; in addition to fission yield, the radioactive half-lives of fission products range from fractions of a second to over a hundred years and also have a pronounced impact on the composition of radionuclides in effluents.
For these reasons, fission products that are produced in relatively limited amounts and/or are short-lived will not significantly contribute to human exposure and may, therefore, be ignored. A third factor affecting the relative importance of a radionuclide pertains to its chemical/ biological properties. Radioisotopes of elements with biological significance may be metabolically taken up and result in exposures that are internal to the body.
1-12

ANP Source Terms July 2005
In addition to fission products, there are two other sources of potential radioisotopes. The first involves the induced radioactivity in elements subjected to fission neutrons. For the direct air cycle design of the HTRE, a significant contribution to radioactivity in the exhaust comes from Ar-41, the activation of argon gas that is normally present in air. The other source of radioactivity is from radionuclides originally present in the nuclear fuel, which includes U-234, U-235, and U-238.
Based on production yields, half-life, and biological significance, the HDE Task Group identified a total of 51 radioisotopes as having the potential for significant release and radiation exposure (Table 1-3). SC&A reviewed the HDE Task Group’s selection criteria, which required the list of selected nuclides to contribute (1) 99% of the cumulative inhalation dose and (2) 99.9% of the cumulative immersion dose using DOE=s dose conversion factors (DOE 1988a and 1988b). On the basis of this thorough review, SC&A concluded that the list of 51 radionuclides is sufficiently inclusive for the reassessment of source terms involving IETs #3, #4, and #10.
Sections 2.0, 3.0, and 4.0 of this report present information and data for IET #3, IET #4, and IET #10, respectively. For each IET, relevant background information is provided that is followed by (1) monitoring data published in previous INEL summary reports, (2) INEL-HDE=s approach to quantifying radioactive releases, (3) a critical assessment of the HDE Task Group approach, and (4) summary conclusions and revised estimates of releases where appropriate.
1-13

ANP Source Terms July 2005
Table 1-3 Radionuclides Considered in Episodic Initial Engine Test Releases
Primary Daughter Primary Daughter Nuclide Half-life Nuclides Half-life Nuclide Half-life Nuclides Half-life
Ar-41 1.83 h I-131 8.05 d
Br-84 6.0 m I-132 2.3 h
Kr-85m 4.4 h I-133 20.3 h
Kr-87 76 m I-134 52.0 m
Kr-88+D 2.8 h Rb-88 18 m I-135 6.68 h
Rb-89 15.4 m Xe-129m 8.0 d
Sr-89 52.7 d Xe-135 9.14 h
Sr-90+D 29 y Y-90 64 h Xe-135m 15.6 m
Sr-91+D 9.5 h Y-91 50 m Xe-138 17.5 m
Sr-92 2.71 h Cs-137+D 30 y Ba-137m 3.5 m
Y-91 58.8 d Cs-138 32.2 m
Y-92 3.53 h Ba-139 82.9 m
Y-93 10.3 h Ba-140+D 13 d La-140 40 h
Zr-95+D 64 d Nb-95 35 d Ba-141 18 m
Zr-97+D 17 h Nb-97m Ba-142 11 m
Nb-96 23.35 h La-141 3.87 h
Mo-99+D 66 h Tc-99m 6 h La-142 92.5 m
Ru-103 +D 39 d Rh-103m 56 m Ce-141 32.5 d
Ru-105+D 4.4 h Rh-105m 45 s Ce-143 33 h
Ru-106+D 368 d Rh-106 30 s Ce-144+D 284 d Pr-144 17 m
Sb-129 4.4 h Te-129 70 m Pr-143 13.59 d
Te-131 25 m Pr-144 17 m
Te-131m+D 30 h Te-131 25 m U-234 2.47x10⁵ y Th-231 26 h
Te-132+D 78 h I-132 2.3 h U-235 7x10⁸ y Th-234 24 h
Te-133m+D 55 m Te-133 12 m U-238 4.5x10⁹ y
Te-134 42 m
1-14

ANP Source Terms July 2005
2.0 INITIAL ENGINE TEST #3
2.1 Relevant Background Data
2.1.1 Initial Engine Test #3 Operational History
The first series of tests that employed reactor power operation of the Heat Transfer Reactor Experiment (HTRE) No. 1 power plant test assembly was Initial Engine Test (IET) #3. The test operation, 44 runs in all, began December 27, 1955, and ended February 25, 1956. The earliest runs involved a series of cold-flow, low-power tests in which the reactor was operated without forced-air cooling. This was followed by (1) low-power tests in which the coolant air was supplied by auxiliary blowers, (2) tests in which the coolant air was supplied by the engine that was operated both by the reactor and the auxiliary chemical (jet-fuel) source, and (3) transfer of operation of the engine system to exclusive reactor power (Thornton et al. 1962b, Gamertsfelder 1954).
The HTRE No. 1 reactor was first operated at substantial power (above 200 kilowatts) on January 17, 1956, and was operated at powers above this level on 18 different days for a total of 40.21 hours. The reactor operated for a total output of 349 megawatt-hours (8.7 MW average power level and a maximum power level of 16.9 MW).
For the first all-nuclear run on January 31, 1956, the reactor-engine system was successfully operated for about 37 minutes, during which time exhaust air monitors indicated possible fuel element rupture.
On February 11, 1956, during a second failed attempt to transfer to full nuclear power, a burst of stack activity was detected. The presence of fission fragments was established during subsequent runs in which I-131 was detected in the stack gas. Following the test run on February 24, 1956, the IET #3 test series was terminated to assess the extent of fuel damage.
A summary of test run dates and key parameters associated with IET #3 reactor operation is presented in Table 2-1.
Reactor Assembly and Fuel Configuration. The first reactor for the HTRE No. 1 was also identified as the D101A reactor. The reactor was air-cooled and had metallic fuel elements and a water moderator (Thornton et al. 1962b). The reactor and shield plug assembly is shown in Figure 2-1. The active core of the reactor was a hexagonal bank of 37 four-inch OD (0.080-inch wall) aluminum tubes containing 80 Ni–20 Cr fuel elements impregnated with UO2. Each fuel element had a loaded length of 29.125 inches. The detailed nuclear design of the fuel elements is reported in Minnich (1955) and APEX-398. The tube layout with dimensions is shown in Figure 2-2.
2-1

ANP Source Terms July 2005
Table 2-1 Summary of Initial Engine Test #3 Reactor Operation
Time at 100% Time Above 200 Maximum Power Total Nuclear Power
Date Kilowatts (hr) (MW) Megawatt (hours) (hr: min)
1/17/56 2.00 0.4 0.50 1/18/56 2.00 1.5 1.13 1/19/56 1.50 2.0 1.62 1/26/56 1.00 3.0 3.30 1/27/56 1.25 8.6 4.00 1/28/56 2.50 12.0 25.35 1/31/56 2.50 16.9 30.00 0:37 2/2/56 0.98 12.7 7.80 2/6/56 1.25 16.9 17.67 Transfer unsuccessful 2/7/56 0.65 13.6 4.44 2/8/56 6.40 13.2 68.25 2/9/56 0.30 16.9 0.60 2/11/56 1.78 15.2 8.81 Transfer unsuccessful 2/13/56 5.48 16.9 78.96 3:43 2/18/56 1.87 16.9 15.43 2/21/56 2.03 14.3 17.61 Transfer unsuccessful 2/22/56 2.87 15.8 40.29 1:43 2/24/56 3.85 12.8 23.32
Total 40.21 349.08 6:3
2-2
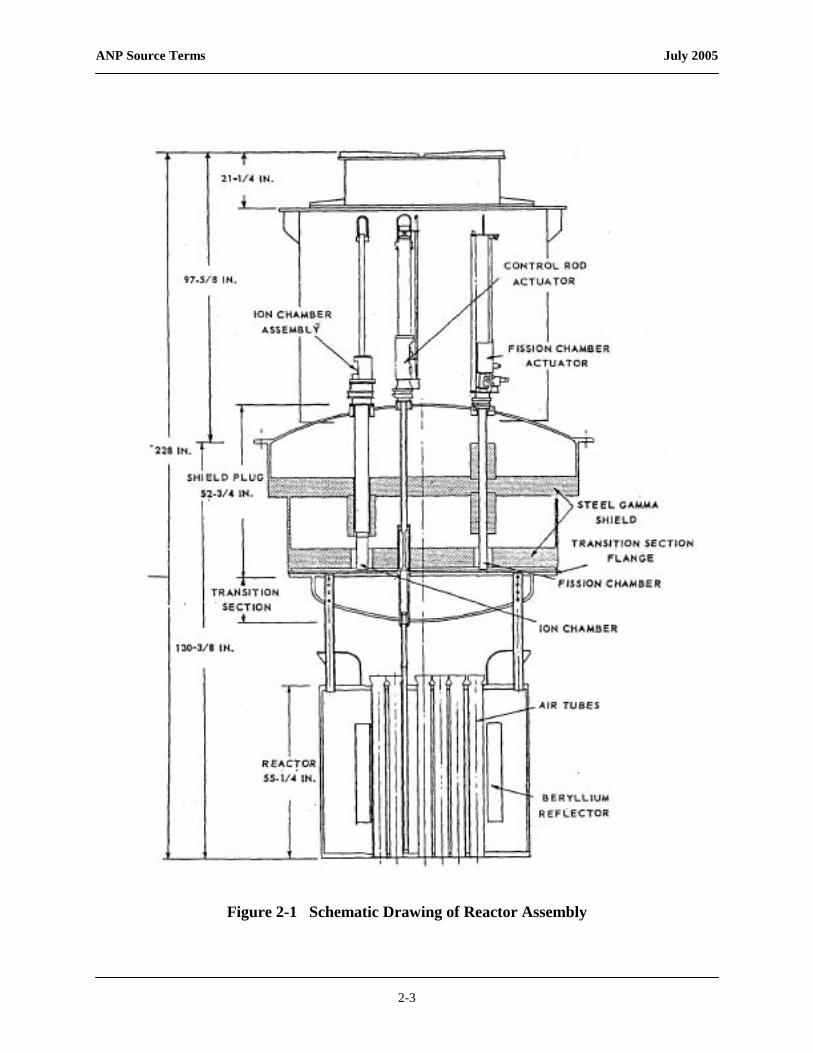
ANP Source Terms July 2005
Figure 2-1 Schematic Drawing of Reactor Assembly
2-3

ANP Source Terms July 2005
Figure 2-2 D101A2 Active Core Dimensions and Tube Layout
Fuel for the reactor was supplied by 93.4% enriched UO2 mixed with an 80 Ni - 20 Cr alloy. The weight ratio of this mixture (UO2/total) was 42% on all rings except for the innermost ring of all elements for which the ratio was reduced to 40%. The fuel mixture was clad with a modified nickel-chromium alloy with a thickness of 0.004 inches (0.1 mm) and was fabricated in ribbon form. Table 2-2 provides key data for the HTRE No. 1 reactor core parameters.
2-4

ANP Source Terms July 2005
Table 2-2 Gross Active Core Parameters
Length: 29.125 inches
Diameter: across flats 30.758 inches
Diameter: across corners 35.516 inches
Volume: 13.809 ft3
Diameter of right circular cylinder of equivalent volume: 32.298 inches
Active Core Materials Effective Volume Fraction Weight (lb) Specific Gravity
Water 0.402 334.8 1.00
Aluminum and insulation equivalent* 0.0531 117.60 2.7
80 Ni–20 Cr 0.0576 407.65 8.62
Uranium, 93.4% enriched 0.00588 90 18.68
Stainless steel 0.00942 60.16 7.78
Core volume 13.22 ft3
* Since the Thermoflex insulation consists of aluminum and magnesium oxides, it was lumped, for convenience, with the aluminum in fuel tubes and control rod guide tubes on a weight basis.
A typical fuel cartridge is shown in Figure 2-3. Its total weight was calculated at 18.7 pounds. The cartridge was composed of 18 stages or elements, a forward ring assembly of 11 stages, and an aft assembly of 7 stages. Eighteen elements, together with the forward ring assembly and the aft assembly, form a single fuel cartridge.
In turn, each element consisted of a number of concentric fuel rings joined and spaced at the leading edge by brazed channels and spaced at the trailing edge by trapezoidal spacers. Each ring was composed of fueled ribbon nominally 1-1/2 inches wide and sealed at each end with braze-coated wire equal in diameter to the thickness of the fueled ribbon.
The design of the fuel cartridge and its 18 stages of concentric ribbons provided the necessary surface area for efficient heat transfer. The fuel-element heat transfer surface was designed for a nominal maximum fuel element temperature of 1,700EF, with the assumption that the reactor discharge air would attain a temperature of 1,335EF. During actual operation, however, considerably higher local transient temperatures (up to 1,900EF) could be tolerated.
2-5
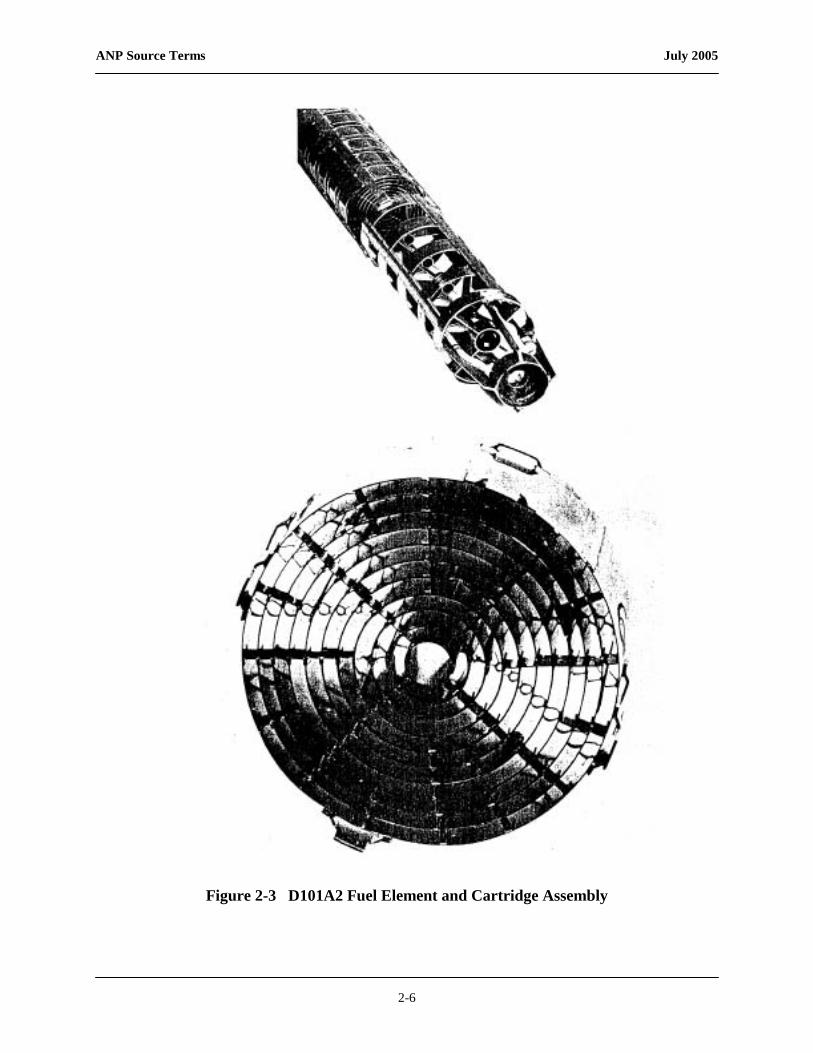
ANP Source Terms July 2005
Figure 2-3 D101A2 Fuel Element and Cartridge Assembly
2-6

ANP Source Terms July 2005
2.2 Early Estimates of Radioactive Releases From Initial Engine Test #3
A review of the Centers for Disease Control and Prevention’s (CDC) Idaho National Engineering Laboratory (INEL) Phase II database failed to identify any primary effluent monitoring data (i.e., logbooks) that quantified releases having dates that coincided with those of individual test runs/IETs. For the HTRE No. 1, which included IETs #1 through #6, the most definitive, useful data appear to be that of Thornton, Minnich, and Heddleson in 1962 (Thornton et al. 1962b).
In his report, Thornton noted that all IET operations were under meteorological control, which frequently forced postponement or limited operations to only a few hours each day. For this reason, the buildup of fission products were minimized and A. . . operations were never limited by the maximum downstream dose regulations (lung dose not to exceed 3.9 rem, with escape rate assumed as 1% of the total reactor fission products).@
For IET #3, Thornton=s assessment of radioactive releases was semi-quantitative, however, and was limited to the following summary statements:
#1 During early partial-nuclear-power operations, some low-level beta emitting particles were measured by the stack monitor. This type of activity decreased as operation continued and was never identified with certainty. It may have been associated with leakage of the shield solution in to the reactor.
#2 The release of radioactive material during IET No. 3 was first detected February 11, 1956, during an attempted transfer to full nuclear power. Fuel cartridge damage was suspected and later verified, during disassembly of the A2 core, as the cause.
#3 The presence of fission products in the exhaust was definitely proved later in the test series when I131 was found in the particles carried out of the stack during the second 100% nuclear operation [i.e., February 13, 1956]. The radioactive material released from the stack during this operation was estimated at 2000 curies over a 4-hour period. [Emphasis added.]
#4 The measured radioactivity released from the stack during the third 100% nuclear power operation was about 1000 curies over a 2-hour period. There was some fallout from this operation at the IET area, the ANPD Administration area, and the A and M area, but not enough to seriously limit use of any of these areas. [Emphasis added.]
#5 During the last day of operation [February 24, 1956], an attempt was made to verify the location of the damaged fuel cartridges by observing the released radioactivity when control rods proximate to suspected tubes were withdrawn. The comparative activity levels of the rupture-detecting filters had indicated that tubes 26 and 30 were the most radioactive. A
2-7
ANP Source Terms July 2005
short run at about 60% nuclear power was made to locate the damaged fuel element. The wind was from the southwest at 30 miles per hour, and the Idaho site-survey crew was located downwind from the IET. The survey crew radioed that they were picking up a maximum air activity of about 1 mr per hour on the Salmon Highway and at Monteview but that most readings were near zero. At the request of the Idaho Operations Director of Health and Safety the operation was continued to allow the survey crew to get a better air sample. A short while later the control rods adjacent to tube 30 were pulled, and both the rupture detector and the stack monitor indicated a slight burst of activity. Twenty minutes later a portion of the monitoring crew located in Monteview, 10 miles away, detected some activity, apparently a result of this burst. At this point, with the concurrence of the Idaho Operations Director of Health and Safety, the reactor operation was terminated. About 100 curies was released during these tests. [Emphasis added.]
On the basis of data provided by Thornton et al. (1962b), it may be assumed that for about 10 of the 40.21 hours of IET #3 test runs, the total amount of radioactive fission products released to the environment was about 3,100 ten-minute-decayed curies.
2.3 Limitations of Early Release Estimates
A search for available data suggests that the report by Thornton et al. (1962b) is the principal document that attempts to quantify radioactive releases associated with IET #3. However, Thornton=s estimated release quantity of about 3,100 Ci of particulate fission products has limited value as indicated or suggested for the following reasons:
#1 Thornton et al. (1962b) cite neither reference(s) for these values nor provide any raw effluent monitoring data that support their values and would allow for verification; furthermore, their report makes no reference to the type of effluent sampling method(s) that was employed during IET #3. The assumption that effluent monitoring during the IET #3 test runs was limited to the spot sampler method can be deduced from the summary statement #3 in Section 2.2 above, which makes reference to “particles” in behalf of radioiodines.
#2 Thornton=s estimated release of 2,000 Ci, 1,000 Ci, and 100 Ci correspond to 3 discreet time frames of fewer than 10 hours out of a total of 40.21 hours during which the reactor was operated at power levels in excess of 200 kW. It should be noted, however, stack effluent monitoring showed only minor releases during the first 22 hours of power operations.
#3 Effluent monitoring that is principally limited to radioactive particulate fission products in the exhaust airstream is incomplete inasmuch as critical fission products—notably, the iodines, bromines, xenons, and kryptons—are present in a gaseous state. In addition to fission products, reactor exhaust gases may also contain activation products that include gaseous argon (Ar-41).
2-8

ANP Source Terms July 2005
#4 The accuracy of radioactive particulate sampling data is further handicapped by several unaccounted variables. As explained in Section 2.3.1, most notable among these is the concentration of particulates introduced in the exhaust gases. In subsequent IETs, it was found that the presence of small particles in effluent gases severely affect the distribution of volatile fission product contaminants as particulates or in gaseous form.
#5 Inspection of the HTRE No. 1 fuel elements following IET #3 identified significant fuel failure that suggests radioactive release quantities well in excess of the 3,100 curies cited by Thornton et al. (1962b).
Presented below is a brief explanation of issues #3, #4, and #5 cited above.
2.3.1 Spot Sampling and Its Limitations
Effluent monitoring methods varied significantly over the time frames of the ANP tests. (Effluent monitoring techniques employed in later IET test runs are described elsewhere in the report.) During the HTRE No. 1 testing that included IETs #3 and #4, effluent monitoring was principally confined to the spot sampler. A detailed description of sampling equipment, techniques, and parameters for the spot sampling technique is provided by Boone et al. (1959) and Foster et al. (1960) and is summarized below.
Spot Sampling Equipment. Exhaust gases from the test engine were passed through a 200-foot-long horizontal pipe to a 150-foot vertical stack (Figure 2-4). The exhaust gas was sampled at the 80-foot level of the stack at point of maximum velocity by means of a sampling probe having an inside diameter of 0.478 inches. The probe was connected to a 110-foot stainless steel sampling line with an outside diameter of 0.5 inches.
Particulates were collected on a 1.4-inch diameter filter paper (MSA 1106B) with a filter face velocity of ~200 feet per minute. Activity on the filter was counted by means of a gas flow, end window, proportional detection tube and a TMC Model SG-2A scaler.
One-minute spot samples were collected at discreet times on the fixed filter paper assembly, transferred to the counting shield, and subjected to several 1-minute counts.
2-9

ANP Source Terms July 2005
Figure 2-4 150-foot Exhaust Stack
Critical parameters that were needed to convert the observed counts per minute to activity normalized to a decay value of 10 minutes in air releases included the following:
• Beta counting efficiency (estimated at 5.1% for the MSA 1106B).
• Filter paper particle collection efficiency (variable from about 40% to >80%).
• Sampling line loss factor of 1.56 (subsequently determined during IETs #4 and #8).
• Exhaust stack coolant augmentation factor (because ambient external air enters the stack through the porous fire brick liner and mixes with the reactor exhaust air, the air sampled at the 80-foot level is Adiluted@ and must, therefore, be corrected). An augmentation factor of 1.25 was determined during IET #4.
• Decay correction that accounts for the sampling and counting intervals in generating the normalized release aged to 10 minutes.
2-10

ANP Source Terms July 2005
In brief, the release rate of radioactive particulates in curies per unit time normalized to a decayed value of 10 minutes could be calculated from raw filter sample counting data by the following equation (Boone et al. 1959) and knowledge of key parameter values:
−1Ar =
C (1− K)(2 − K) [(Tf + Ts + Td + Tc)2− K − (Tf + Ts + Ta)2− K + (Tf + Ta)2− K ] Eq. 2-1Kα Tr
Where: Ar = Release rate (curies/unit time) referenced to age (Tr) (600 secs) C = Total counts recorded on scaler during counting interval (Tc) K = Decay constant (slope of decay curve - see discussion below)
air sampling rate filtering eff . x countinge eff . x unit conv . factor α = engine compressor rate x stack augmentation factor x line loss factor
Tr = age to which release rate is normalized (600 secs) Tf = Time of flight from reactor to sampling unit (3 secs) Ts = Sampling interval (usually 60 secs)Td = Time delay from end of Ts to beginning of Tc (537 secs)
However, even if the raw counting data for a sufficient number of IET #3 spot samples were available, converting such raw data to release rates of radioactive particulates would pose a problem since several parameters cited in Equation 2-1 are time-/IET-specific. Critical among these are the decay constant K and particulate filter collection efficiency.
• The decay constant (slope of decay curve) was shown to vary between 0.8 to 1.5 and reflects the complex dynamics in fission product composition and their release over time. Thus, significant deviations in decay rates were subsequently observed during IET #14 from the theoretical values predicted by the Way-Wigner equation or Equation 2-1 cited above. Deviations were most significant for releases that occurred in later test runs and reflect the buildup of longer-lived isotopes among the fission product inventory at time of release. For example, Figure 2-5 compares four decay curves that represent theoretical values defined by Way-Wigner and the observed empirical values of IETs #14 and #15. From Figure 2-5, it is seen that the ratios of activities at 10 minutes to 10 hours vary from 28.6 to 67.8, as summarized below:
Theoretical Ratio of 10 minutes/600 minutes Way-Wigner: 60.5 Boone 1959: 67.8
Observed IET #14 - Early in test: 43.0 Late in test: 39.5 IET #15 - Early in test: 52.9 Late in test: 28.5
2-11

ANP Source Terms July 2005
Figure 2-5 Effluent Beta Decay Curves (Source: Boone 1959)
2-12

ANP Source Terms July 2005
Figure 2-5 Effluent Beta Decay Curves (continued) (Source: Boone 1959)
2-13

ANP Source Terms July 2005
• Filtering efficiency of the MSA106B filter paper used in the spot sampler and stack monitor was shown to vary depending among other factors on the carbon particle loading in the effluent. Beyond the baseline particulate matter contained in ambient air at the point of introduction by the compressor, the largest contributor of airborne particulate matter was shown to come from jet engine chemical fuel combustion. Figure 2-6 cites a representative filtration response as a function of chemical fuel combustion. Beyond affecting filter efficiency, chemical fuel combustion even more significantly affects the shift of normally volatile/gaseous fission products to radioactive particulates, as discussed in greater detail in Section 2.3.2.
Figure 2-6 Filter Efficiency Versus Chemical Fuel Flow
2-14

ANP Source Terms July 2005
2.3.2 Uncertainty of the Physical State of Iodines in the Stack Effluent
Numerous difficulties for the analysis/interpretation of IET monitoring data involves the uncertainty of the physical state of iodines (and potentially other volatile radionuclides) in the stack effluent. Specifically, the question centers around whether the iodine fraction is in a gaseous or a particulate phase at the point of sampling. Owing to the high temperatures of the IET exhaust gas, a reasonable assumption would hold that the overwhelming fraction of radioiodines would exist in gaseous phase.
To test this assumption, a series of monitoring experiments were conducted during IET #4 that quantified the gaseous and particulate forms of iodine in stack effluents (Ebersole 1956). Effluent samples at the 80-foot stack level were drawn through a sampling train consisting of two 4-inch millipore filters and two scrubber traps. The scrubbing solution consisted of 4 grams Na2CO3, 4 grams of Na2S2O3 $ 5H2O, and 25 milligrams of NaI per liter of distilled water. The first millipore filter was used to collect particulates and the second millipore was used to verify the collection efficiency of the first; similarly, the first scrubber was used to trap the gaseous iodine and the second scrubber verified the collection efficiency of the first. (The results of the experiments showed efficiencies of grater than 95% for both the millipore and scrubber traps.) Effluent analyses were done under the following conditions:
Experiment 1: IET operated on 85% nuclear power with no jet fuel
Experiment 2: IET operated on 85% nuclear power and 15% jet fuel
Experiment 3: IET operated on 85% nuclear power and smoke bombs were released at bottom of stack
Both millipore samples and scrubber samples were analyzed for radioiodines by radiochemical means. Table 2-3 gives the distribution of iodine. (It must be noted that sampling duration was varied among the three experiments, which resulted in substantial differences in absolute activity levels.) Based on the assumption that iodine found on the first millipore filter was particulate and the iodine found in the first scrubber solution was gaseous, the ratio given in the last column provides the ratio of gaseous to particulate iodine. From these data, it is clear that the physical state of radioiodines is profoundly affected by the variable concentration of particulates entrained in effluent gases. Sources of particles include (1) the ambient airborne dust at the IET compressor air intake, (2) abrasion of particles from the interior wall of the exhaust stack, and (3) the variable combustion of jet fuel during IET runs.
The uncertainty regarding the physical state of radioiodines as either a gas or particulate is one of the major limitations in the analysis of effluent data that involve activated charcoal traps and filter paper spot samples.
2-15

ANP Source Terms July 2005
Table 2-3 Distribution of Gaseous and Particulate Iodine Activity in Stack Effluents
Experiment I2 in First Millipore I2 in First Scrubber I2 as Gas/I2 as Particulate (cpm) (cpm) (ratio)
#1 77,000 1,030,000 13.4 #2 7,100 15,400 2.16 #3 1,790,000 294,000 0.16
2.4 Post-Operation Evaluation of Fuel Cartridges for Initial Engine Test #3
On February 25, 1956, an investigation was initiated to determine how and why the fuel damage phenomenon occurred. Apparently, a complete photographic record of the condition of core components on disassembly was given by Tuck and Hoover (1956a, 1956b, 1956c, 1956d, and 1957); however, attempts to obtain copies of these reports were unsuccessful. The following is a summary account of these reports as described by Thornton et al. (1962b).
Noticeable structural damage was observed even before the core was dismantled. Incrustations thought to be a residue from borated shield water were found in the core. Figure 2-7 shows this incrustation around several of the 37 fuel cartridges. It was speculated that this solution could have come from leaks that developed at three different locations. Figure 2-7 also shows a damaged cartridge (Cartridge 26) in the core prior to dismantling.
Fuel Liners. Inspection of the insulation liners of fuel cartridges showed heat oxidation accompanied by discoloration on a few of the insulation liners (Figure 2-8). Wrinkling also occurred on several other liners (Figure 2-9). Damages of varying intensity caused by burning are shown in Figures 2-8 and 2-10.
Cartridge Rails. Damage to the cartridge rails appeared either in the form of dimpling or breaking, as shown in Figure 2-11. Broken rails occurred in only a very few instances.
Fuel Elements. In the fuel elements, the damage ranged from ring buckling, shown in Figure 2-12, to burning and melting, shown in Figures 2-8, 2-11, and 2-12. Two cartridges were severely damaged, while one other cartridge showed evidence of melting or burning.
Only 24 of the 37 cartridges used in IET #3 were described as being in “fair to good condition” and were reused in later tests. Thus, it can be inferred that, in addition to the 3 cartridges that experienced fuel melting/burning, there were 10 other fuel cartridges that were not considered for reuse.
2-16

ANP Source Terms July 2005
Figure 2-7 Reactor Core Showing Boric Acid Leakage, Burned Cartridge, and Several Undamaged Cartridges
2-17

ANP Source Terms July 2005
Figure 2-8 Cartridge Showing Discoloration, Burning and Melting
Figure 2-9 Insulation Liner Showing Wrinkling
Figure 2-10 Insulation Liner Showing Burning Effects
2-18

ANP Source Terms July 2005
Figure 2-11 Fuel Element Melting Effects, Rail Buckling, and Breaking
Figure 2-12 Fuel Element Melting Effects
2-19

ANP Source Terms July 2005
The severe damage was most evident in the latter stages where the oxidation had completely penetrated through the outer ribbons. The rails on most of the cartridges were bent, although this condition was not limited to those cartridges that had the severe oxidation.
It was theorized (but not proven) that the severe oxidation was the result of high plate temperatures due to mal-distribution of cooling air, which was caused by a blockage of the airflow path through the fuel element. Factors contributing to localized high plate temperatures among select fuel cartridges/elements were likely to have been caused by (1) buckling failure of the insulation sleeve leading to mal-distribution/reduced coolant airflow through fuel element and/or (2) non-uniform reactor fuel burnup caused by control rod positioning (Thornton et al. 1962b).
2.5 Approach by the Historical Dose Evaluation Task Group for Estimating Radioactive Releases for Initial Engine Test #3
To determine radioactive releases to the environment for IET #3, the HDE Task Group critically reviewed the operating history as described by Thornton et al. (1962b) and summarized in Table 2-1. Due to the limitation of the operating data, inventory calculations by means of the RSAC-4 computer code were simplified by breaking the operating history into two discrete periods: the first period of operation was defined as the 21-day period starting January 17, 1956, and ending February 7, 1956; the second period was the 16-day period of February 8 through February 24, 1956 (Table 2-4).
In order to model IET #3 operations for the RSAC-4 computer code,2 each of the two periods was further simplified by means of the following assumptions:
• Period 1 (Jan. 17-Feb. 7) - Period #1 was further broken into three segments of operations:
- 22 hours at 200 kW for a total of 4.40 MW-hr - 11.03 hours at 8.7 MW for a total of 95.96 MW-hr - 17.6 hours at 200 kW for a total of 3.52 MW-hr
Sub-Total = 103.9 MW-hr
• Period 2 (Feb. 8-Feb. 24) - For the 16-day period starting with February 8, 1956, the reactor was operated for a total of 24.58 hours Aabove 200 kW;@ for this period, the HDE Task Group assumed an average power level of 8.7 MW for a total of 213.8 MW-hours. For periods between power runs, an additional 61.4 MW-hours were assumed.
2 The Radiological Safety Analysis Code (RSAC-4) is a computer code developed by INEL that calculates the fission product inventory from a reactor operating history.
2-20

ANP Source Terms July 2005
Table 2-4 Reactor Operation, Initial Engine Test #3
Total Time at 100% Time Above 200 Maximum Power megawatt-hours Nuclear Power
Date kilowatts (hr) (MW) (MW-hrs) (hr:min) Period #1: 1/17/56 2.00 0.4 0.50 1/18/56 2.00 1.5 1.13 1/19/56 1.50 2.0 1.62 1/26/56 1.00 3.0 3.30 1/27/56 1.25 8.6 4.00 1/28/56 2.50 12.0 25.35 1/31/56 2.50 16.9 30.00 0:37 2/2/56 0.98 12.7 7.80 2/6/56 1.25 16.9 17.67 Transfer unsuccessful 2/7/56 0.65 13.6 4.44 Period #2: 2/8/56 6.40 13.2 68.25 2/9/56 0.30 16.9 0.60 2/11/56 1.78 15.2 8.81 Transfer unsuccessful 2/13/56 5.48 16.9 78.96 3:43 2/18/56 1.87 16.9 15.43 2/21/56 2.03 14.3 17.61 Transfer unsuccessful 2/22/56 2.87 15.8 40.29 1:43 2/24/56 3.85 12.8 23.32
Total 40.21 349.08 6:3
In brief, the HDE Task Group conservatively modeled IET #3 operations that yielded about 30 MW-hours more than the official 349.08 MW-hours cited by Thornton et al. (1962b) and applied these revised operational data to RSAC-4 to derive reactor core fission product inventories.
HDE Task Group Release Estimates. Radioactive releases for IET #3 were based on the following three sources: (1) fission products produced during reactor operation, (2) uranium released from damaged fuel, and (3) argon-41 (Ar-41) created by neutron activation.
• Argon-41. This radionuclide is created by neutron activation of stable argon in the air that passes through the core. On the basis of its natural abundance in air and with a neutron cross-section of 0.65 barns, the production of Ar-41 was calculated at 2.8 Ci/MW-hr of reactor operation. However, instead of employing the above-cited cumulative power-levels (which correspond to 379 MW-hr and the production of about 1,061 Ci of Ar-41), the HDE Task Group assumed that
2-21
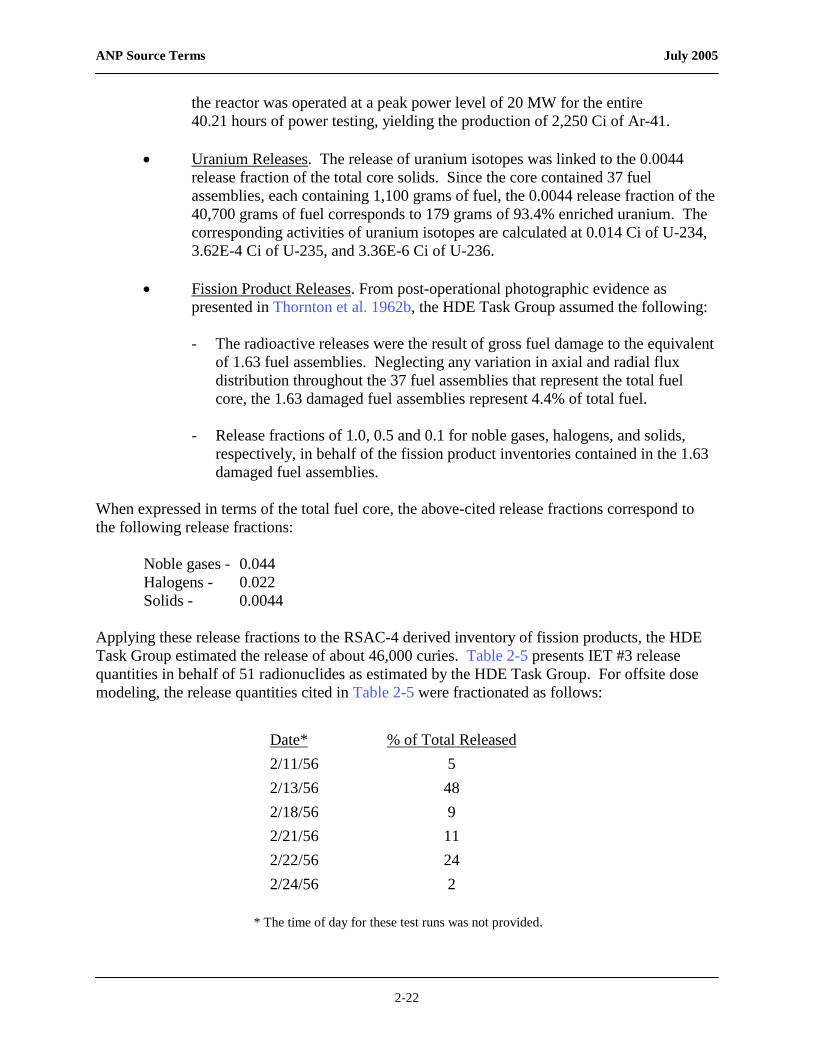
ANP Source Terms July 2005
the reactor was operated at a peak power level of 20 MW for the entire 40.21 hours of power testing, yielding the production of 2,250 Ci of Ar-41.
• Uranium Releases. The release of uranium isotopes was linked to the 0.0044 release fraction of the total core solids. Since the core contained 37 fuel assemblies, each containing 1,100 grams of fuel, the 0.0044 release fraction of the 40,700 grams of fuel corresponds to 179 grams of 93.4% enriched uranium. The corresponding activities of uranium isotopes are calculated at 0.014 Ci of U-234, 3.62E-4 Ci of U-235, and 3.36E-6 Ci of U-236.
• Fission Product Releases. From post-operational photographic evidence as presented in Thornton et al. 1962b, the HDE Task Group assumed the following:
- The radioactive releases were the result of gross fuel damage to the equivalent of 1.63 fuel assemblies. Neglecting any variation in axial and radial flux distribution throughout the 37 fuel assemblies that represent the total fuel core, the 1.63 damaged fuel assemblies represent 4.4% of total fuel.
- Release fractions of 1.0, 0.5 and 0.1 for noble gases, halogens, and solids, respectively, in behalf of the fission product inventories contained in the 1.63 damaged fuel assemblies.
When expressed in terms of the total fuel core, the above-cited release fractions correspond to the following release fractions:
Noble gases - 0.044 Halogens - 0.022
Solids - 0.0044
Applying these release fractions to the RSAC-4 derived inventory of fission products, the HDE Task Group estimated the release of about 46,000 curies. Table 2-5 presents IET #3 release quantities in behalf of 51 radionuclides as estimated by the HDE Task Group. For offsite dose modeling, the release quantities cited in Table 2-5 were fractionated as follows:
Date* % of Total Released 2/11/56 5 2/13/56 48 2/18/56 9 2/21/56 11 2/22/56 24 2/24/56 2
* The time of day for these test runs was not provided.
2-22

ANP Source Terms July 2005
Table 2-5 Release Quantities Aged to 10 Minutes for Initial Engine Test #3 as Estimated by Historical Dose Evaluation
Release Release Nuclide Half-life Quantity (Ci) Nuclide Half-life Quantity (Ci) Ar-41 1.83 h 2.25E+03* I-131 8.05 d 3.21E+02*
Br-84 6.0 m 7.50E+02* I-132 2.3 h 5.19E+02* Kr-85m 4.4 h 8.49E+02† I-133 20.3 h 1.33E+03* Kr-87 76 m 4.28E+03† I-134 52.0 m 5.55E+03* Kr-88+D 2.8 h 4.67E+03† I-135 6.68 h 2.45E+03* Rb-89 15.4 m 1.63E+03‡ Xe-129m 8.0 d 1.30E-06†
Sr-89 52.7 d 3.37E+01‡ Xe-135 9.14 h 1.78E+03†
Sr-90+D 29 y 2.28E-01‡ Xe-135m 15.6 m 7.42E+02†
Sr-91+D 9.5 h 3.69E+02‡ Xe-138 17.5 m 5.79E+03†
Sr-92 2.71 h 7.90E+02‡ Cs-137+D 30 y 2.34E-01‡
Y-91 58.8 d 3.38E+01‡ Cs-138 32.2 m 3.89E+03‡
Y-92 3.53 h 3.48E+02‡ Ba-139 82.9 m 1.22E+03‡
Y-93 10.3 h 3.84E+02‡ Ba-140+D 13 d 1.19E+02‡
Zr-95+D 64 d 3.66E+01‡ Ba-141 18 m 6.82E+02‡
Zr-97 17 h 2.83E+02‡ Ba-142 11 m 4.05E+02‡
Nb-96 23.35 h 2.51E-02‡ La-141 3.87 h 6.38E+02‡
Mo-99 66 h 1.79E+02‡ La-142 92.5 m 1.02E+03‡
Ru-103 +D 39 d 2.72E+01‡ Ce-141 32.5 d 5.63E+01‡
Ru-105 4.4 h 1.06E+02‡ Ce-143 33 h 2.22E+02‡
Ru-106+D 368 d 4.52E-01‡ Ce-144+D 284 d 7.57E+00‡
Sb-129 4.4 h 7.04E+01‡ Pr-143 13.59 d 9.56E+01‡
Te-131 25 m 5.06E+02‡ Pr-144 17 m 7.55E+00‡
Te-131m 30 h 1.40E+01‡ U-234 2.47x10⁵ y 1.14E-02‡
Te-132+D 78 h 1.25E+02‡ U-235 7x10⁸ y 3.62E-04‡
Te-133m 55 m 4.98E+02‡ U-238 4.5x10⁹ y 3.36E-06‡
Te-134 42 m 1.05E+03‡ TOTAL 46,128.67 * Based on total reactor fuel release fraction of 0.022. † Based on total reactor fuel release fraction of 0.044. ‡ Based on total reactor fuel release fraction of 0.0044.
2.6 A Critical Review of the Historical Dose Evaluation Model
Initial Engine Test #3 was the first series of test runs that involved reactor power operation of the HTRE No. 1. Effluent monitoring over the 5-year period of power testing was a learning process. For IET #3, effluent monitoring had been limited to spot sampling of radioactive
2-23

ANP Source Terms July 2005
particulates released from a stack and only at discrete times during the 40.21 hours of reactor power operations, as summarized by Thornton et al. (1962b). Correspondingly, Thornton=s data are not only incomplete, but encompass uncertainties that preclude simple interpretation for deriving time-integrated release quantities of individual radioactive species.
The HDE Task Group acknowledged the absence of available raw effluent data, as well as the deficiencies/limitations of summary data contained in the report by Thornton et al. (1962b). The HDE Task Group, therefore, modeled release estimates that were principally based on historical operating records and photographic evidence, which characterized the extent of fuel damage to the HTRE No. 1 reactor core. In brief, the HDE Task Group=s estimates were based on the following parameters and assumptions:
• From the operating history for IET #3, the time-integrated reactor power levels were used to determine fission product inventories by means of the RSAC-4 computer code.
• From reports and photographic records, it was concluded that the source of releases was due to severely damaged fuel (as cited by photographic evidence) that collectively was estimated to represent 1.63 fuel assemblies out of a total of 37 fuel assemblies.
• Fission products produced and accumulated in the damaged 1.63 fuel assemblies were assumed identical to undamaged fuel assemblies and, therefore, represented 0.044 (or 1.63/37) of the fission products produced by all 37 fuel assemblies.
• Radioactive fission products in effluent were assumed to have been exclusively released from the 1.63 damaged fuel assemblies.
• Release fractions from the damaged 1.63 fuel cartridges were assumed at 1.0, 0.5, and 0.1 for noble gases, halogens, and solids, respectively.
Embedded in the HDE Task Group model of radioactive releases are several assumptions that potentially may have underestimated the true release quantities of fission products. To estimate realistic but near maximum release values, SC&A identified four key model parameters whose values differed significantly from those assumed by the HDE Task Group as described below.
2.6.1 Assumption that Fuel Damage was Limited to the Equivalent of 1.63 Fuel Cartridges
The HDE Task Group’s assumption that the collective fuel damage was equivalent to 1.63 fuel cartridges out of a total of 37 cartridges was based on the brief description and limited photographic evidence presented in APEX-904 by Thornton et al. (1962b, Section 3.5, pages 136-142). These data, therefore, only summarize the more detailed information contained in six reports authored by Tuck and Hoover and Holowach.
Tuck, G. and Hoover, B.J., Photographic Investigation of A2- Fuel Elements, First Unloading, GE-ANPD, DC 56-6-706, 1956.
2-24

ANP Source Terms July 2005
Tuck, G. and Hoover, B.J., Photographic Investigation of A2- Fuel Elements, First Unloading, GE-ANPD, DC 56-6-729, 1956.
Tuck, G. and Hoover, B.J., Photographic Investigation of A2- Fuel Elements, First Unloading, GE-ANPD, DC 56-6-730, 1956.
Tuck, G. and Hoover, B.J., Photographic Investigation of A2- Fuel Elements, First Unloading, GE-ANPD, DC 56-6-711, 1956.
Tuck, G. and Hoover, B.J., Photographic Investigation of A2- Fuel Elements, First Unloading, GE-ANPD, DC 56-6-725, 1956.
Holowach, J., General Engineering Development Report No. 206, Investigation of the Failure of an Insulating Sleeve, GE-ANPD, DC 56-4-137, 1956.
All attempts to obtain copies of the six reports failed and key members of the HDE Task Group (i.e., Messrs. Henry Peterson, Doug Wenzel, and Richard Dickson) acknowledged that they, too, were unsuccessful in obtaining copies at the time of the HDE Task Group=s investigation.
From the limited summary information provided by Thornton et al. (1962b), it is difficult to validate the HDE Task Group=s assumption of 1.63 damaged fuel cartridges. Statements by Thornton et al. (1962b) imply that damage may have been more extensive, as suggested by the following statements (Thornton et al. 1962b, page 138):
Two cartridges were severely damaged, while only one other showed any melting or burning. [Emphasis added.]
Twenty-four of the 37 cartridges used in IET #3 were in fair to good condition and were re-used in later tests, an indication that the heat damage was localized and did not extend over the complete system. [Emphasis added.]
In summary, Thornton=s statements suggest that 3 fuel cartridges suffered significant to severe damage and an additional 10 cartridges showed evidence of damage that precluded their subsequent use.
From the limited data, SC&A concluded that it would not be unreasonable to conclude that (1) the 3 heavily damaged fuel cartridges represented the equivalent fuel of at least 2 fuel cartridges and (2) perhaps 10% of the 10 lesser-damaged fuel cartridges contributed the equivalent of 1 additional fuel cartridge, yielding a total equivalent of 3 fuel cartridges instead of the 1.63 assumed by the HDE Task Group.
The alternative assumption of fuel damage to the equivalence of 3 fuel cartridges would yield release estimates of fission products that are 1.84 higher than those derived by the HDE Task Group.
2-25

ANP Source Terms July 2005
2.6.2 The Assumption of a Uniform Power Level Throughout the Reactor Core
In behalf of their model, the HDE Task Group assumed a uniform flux distribution throughout the reactor (Peterson 1991, page 2). In other words, the production and inventory of fission products for the 1.63 damaged fuel cartridges was assumed to be the same as for undamaged fuel.
Near uniform flux distribution is desirable, since it ensures a more constant fuel burnup, which in turn minimizes the risk of fuel damage and prolongs the life of the core. Flux distribution is determined by the relative concentration/amount of fuel in individual fuel elements, the relative distribution of the fuel within the core, and the position of control rods. Design specifications for the HTRE No. 1 reactor, however, suggest significant gross longitudinal and smaller radial power distribution under conditions of normal reactor operations (Figure 2-13 and Table 2-6).
Figure 2-13 Local to Average Longitudinal Power Curve, D101 A2
Reactor design features that were intended to create a near homogeneous power level among the 37 fuel assemblies involved (1) variable spacing between adjacent fuel assemblies, (2) variable volumes of water around individual fuel assemblies that served as a moderator (a greater volume of water increases the number of thermalized neutrons that induce nuclear fission), and (3) the use of beryllium reflectors. However, there is no empirical evidence that proves that these design features achieved their intended objectives.
2-26

ANP Source Terms July 2005
Table 2-6 Local to Average Gross Radial Power Distribution, D101 A2
Fuel Cartridge No. P/Pay 1 1.044
2-7 1.053 8-13 1.044
14-19 inclusive 1.009 20, 21, 23, 24, 26, 27 0.978 29, 30, 32, 33, 35, 36 0.978 22, 25, 28, 31, 34, 37 0.931
Besides potential deviations from reactor design specifications, non-uniform power levels among fuel assemblies may also be the result of operational factors. During IET #3, operation series 28 and 30 specifically evaluated the effects of control rod movement on temperature distribution and tube power. By their very nature, these tests intentionally induced non-uniform fluctuations in power among fuel cartridges by repositioning select control rods as described in the following statements (Thornton et al. 1962b, pages 129-133):
Data from operation series 28 and 30 were analyzed to determine the effects of control rod movement on temperature distribution. The reactor was operated at a power approximately 10 megawatts to air to deliver an exit air temperature or about 1000EF. Chemical power was added to maintain engine speed at 7000 rpm.
Series 27, runs 3-12, involved the complete interchange of rod frames 1 and 4 in increments of 3 to 5 inches. These runs were performed to determine the effect of the movement of a large number of rods on power distribution. Figure 2-14 shows the location of these frames in the initial positions, along with the number of rods in each frame.
Series 30, runs 1-8, involved the complete interchange of individual rods 44 and 45 with rods 50 and 51 in increments of 3 to 5 inches. These runs were performed to determine the effect of individual rod movement on tube power. Figure 2-15 shows the location of the rods and the initial position, along with the complete rod configuration for the reactor. The numbers in the fuel tube locations of Figure 2-15 indicate the relative change in exit air temperature associated with the insertion of rods 44 and 45 and the concurrent withdrawal of rods 50 and 51. The relative change in exit air temperature is expressed as a percentage of the average air-temperature rise across the reactor. Although there are minor inconsistencies, it is apparent that the change in position of these four rods warped or tilted the flux distribution of the reactor about the line of symmetry passing midway between the rods that were moved. The change in temperature does not imply the same change in flux because of possible flow change. The tests show that the power in a tube was affected by control rods remote from the tube.
2-27

ANP Source Terms July 2005
. . . Figure 2-16 identifies the measured air temperatures and plate temperatures for each of the 37 fuel cartridges in response to control rod pattern selected for Series 21, test run 3 of IET #3.
Analysis showed that although the general trend of reactor behavior was in accord with expectations, some effects were observed that required further investigation. One of these was the influence of control rods on temperature rise (or power) in the tubes remote from the rods. It was assumed in design work that a control rod would affect only the power in proximate tubes. Data indicate that power in remote tubes could also be affected, although changes in airflow may have been involved.
Since flow distribution varies simultaneously with power distribution, the air temperature variations could be expected to exceed the nuclear power variations in a particular cartridge; e.g., a tube showing 10% excess power would tend to show greater than 10% excess temperature rise. Because the experimental tube-tube power determinations were made exclusively on the basis of air temperature measurements, in the absence of flow measurements, nuclear power distribution could not be defined exactly. Data indicated that disparities existed between predicted and actual control rod effects. In general, the temperature deviations were of greater magnitude than the predicted nuclear power variations; however, significant scatter appeared to exist.
2-28
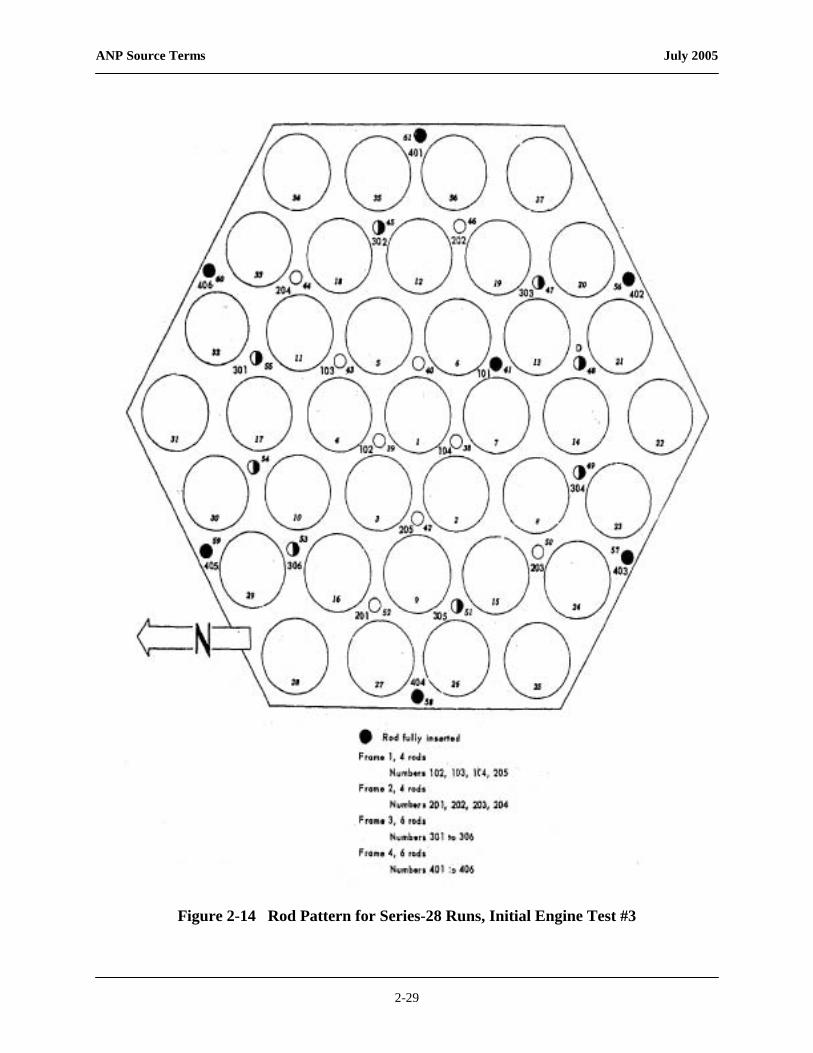
ANP Source Terms July 2005
Figure 2-14 Rod Pattern for Series-28 Runs, Initial Engine Test #3
2-29

ANP Source Terms July 2005
Figure 2-15 Rod Pattern for Series-30 Runs (Initial Engine Test #3) Showing the Relative Change in Exit Air Temperature Associated withthe Insertion of Rods 44 and 45 and the Withdrawal of Rods 50 and 51
2-30

ANP Source Terms July 2005
Figure 2-16 Air Temperature and Plate Temperature Distribution
The above-cited data support the assumption that power levels (and, therefore, fuel burnup) varied significantly among fuel cartridges and for a given cartridge among its 18 stages. These variations in power level were likely the result of (1) the core=s design and (2) specific operational test runs that evaluated temperature impacts of control rod positions.
The significance of a heterogeneous power/temperature distribution within the reactor core to the relative contribution of fission products to core inventory are obvious: (1) fuel assemblies that showed indications of severe burning/melting were assumed to be the primary sources of radioactive releases, (2) fuel in select cartridges/stages were likely damaged as a result of
2-31
ANP Source Terms July 2005
elevated localized heating, (3) in turn, a reasonable assumption is to attribute the higher temperatures to higher power levels within theses fuel cartridges/stages, and (4) fuel subject to higher neutron fluences must be assumed to have contributed a proportionately higher fraction to the fission product inventory. Assumptions regarding non-uniform power levels are supported by the following statement (page 137, Thornton et al. 1962b):
The comparative activity levels of the rupture-detecting filters had indicated that tubes 26 and 30 were the most radioactive. A short run at about 60 percent nuclear power was made to locate the damaged fuel element. . . A short while later the control rods adjacent to tube 30 were pulled, and both the rupture detector and the stack monitor indicated a slight burst of activity. [Emphasis added.]
Post-operation evaluation of the fuel cartridges provided by Thornton et al. (1962b) does not specify cartridges 26 and 30 as the “. . . two cartridges [that] were severely damaged. . .”, but at a minimum may be reasonably assumed from the above-cited passage and the photograph shown in Figure 2-7 of this report, which clearly identifies cartridge 26 as a “burned cartridge.”
In the absence of more definitive data, a reasonable guestimate may assume that a Afailed@ fuel cartridge contributed fission products to the core inventory that was 25% higher than the average cartridge value assumed in the HDE Task Group model.
2.6.3 Assumed Release Fractions for Severely Damaged Fuel
In behalf of the severely damaged fuel (quantified by the HDE Task Group as the equivalent of 1.63 fuel cartridges, and estimated by the authors of this report to be the equivalent of 3.0 fuel cartridges), the HDE Task Group model assumed release fractions of 1.0, 0.5, and 0.1 for noble gases, halogens, and solids, respectively. Although the HDE Task Group Report provides no reference or technical basis for these values, verbal communication with Task Group members (Messrs. R. Dickson, H. Peterson, and D. Wenzel, December 3, 2002) identified two principal sources:
• U.S. Atomic Energy Commission (AEC), 1962, ACalculation of Distance Factors for Power and Test Reactor Sites,@ Technical Information Document-14844. Data provided in this document is in behalf of maximum credible accidents for a pressurized water reactor. The TID recommends release fractions into the reactor containment building of 100% of noble gases, 50% of halogens, and 1% of the solids.
• American National Standards Institute (ANSI), AGuidance for Defining Safety-Related Features of Nuclear Fuel Cycle Facilities,@ ANSI N46.1 - 1980. Appendix A of this standard identifies recommended assumptions and parameters that may be used to model the consequences of airborne releases from a variety of unplanned incidents in nuclear fuel cycle facilities. Among the incidents covered is Aheated fuel release.@ Table 2-7 provides the corresponding data.
2-32

ANP Source Terms July 2005
Table 2-7 Release Fractions Recommended in ANSI N46.1 - 1980
Range of Current Recommended Release Safety Analysis Observations Practice Values
Mechanism Parameter (Fraction Released) (Fraction Released) (Fraction Released) Heated Fuel (a) Noble Gas 0.12 - 0.86 0.90 0.90
Release (b) Halogens 0.12 - 0.95 0.90 0.25 (c) Volatile Solids 2x10⁻⁴ - 0.999 NA 0.01 (d) Non-Volatile Solids <10-5 - 7x10⁻³ NA 0.01
Release fractions selected by the HDE Task Group clearly conform with recommendations issued by the AEC and the ANSI. However, AEC and ANSI recommendations were intended for a pressurized-water reactor in which fission products not only have to breach fuel cladding, but additional barriers that at a minimum include the reactor coolant water and reactor vessel (or other primary system components).
Because of the unique features of the direct-air-cycle reactor design, recommended release fractions for PWR accident conditions may not apply. More appropriate values may be experimental measurements involving other IET experiments and simulation tests with the ANP-type fuels.
As part of the ANP Program, the General Electric Company (GE) conducted safety studies that assessed fission product releases in behalf of (1) accident conditions that employed the direct-gas-cycle reactor and (2) in-pile simulated conditions. Results of these tests are discussed in detail in Appendix B of this report, with only summary data presented below.
Operation BOOT. As part of Operation BOOT (Burn-out-One-Tube), experiments were performed to determine the type and fraction of fission products released when irradiated fuel elements were melted or burned (Devens et al. 1962, Baker et al. 1959, Baker et al. 1962). This experiment involved installation of a valve, which limited coolant air to one fuel element while the reactor was operating at full power. Fifteen seconds after the valve was closed, an unexpected reactor scram occurred. Nevertheless, air samplers at the 80-foot level of the stack indicated a burst of radioactive releases and the reactor was returned to the hot shop for disassembly and examination. Wilks et al. 1962 provided the following summary observations:
Although the reactor had remained at power for only 15 seconds after the valve was closed, the damage to the element was extensive and had proceeded to about the limit predicted by the thermodynamic studies. Figures [2-17] and [2-18] are photographs of some of the residue of the fuel element. Radiochemical analyses of residue samples indicated that the most heavily oxidized portions of the fuel element had released as much as 80% of the I-131 inventory, which is consistent with the results of preliminary laboratory studies by Creek and Parker of ORNL with similar material. [Emphasis added.]
2-33

ANP Source Terms July 2005
Figure 2-17 Experiment BOOT: Plug and Residue from Tail Cone of Damaged Tube
Figure 2-18 Alternate View of Element Residue Shown in Figure 2-17
2-34

ANP Source Terms July 2005
In-Pile Simulated Test Data for Release Fractions. Prior to the planning of the BOOT experiment, ANP-type fuel samples of Ni-Cr fuel elements were sent to the Oak Ridge National Laboratory (ORNL) where they were irradiated in the graphite pile and subsequently melted and analyzed to determine the fractional release of some of the fission products. Fractional release estimates were made for two conditions: (1) a single, very quick melt (~ 30 seconds) with subsequent cooling and (2) a sustained melt over a period of several hours until the sample was essentially entirely oxidized. The experimental conditions and results of these experiments are summarized below.
In the experiments, flat, thin specimens of metallic fuel about one-square centimeter in area and weighing approximately 0.1 gram were subject to induction heating inside a quartz crucible. The crucible was surrounded by a vertical quartz tube through which the released fission products were transported to several trapping media that included millipore filters, activated charcoal, and chemical absorbents (Parker 1960).
In the two experiments, fuel samples were brought to the melting point over a period of about 30 seconds and held in a molten state for only an instant or samples were held molten for about 4 hours. The results of these experiments are given in Table 2-8 below. For the Aquick melt,@ only about 4% of the iodine present was released along with 10% of the rare gases, 0.5% of cesium, and negligible amounts of strontium. When samples were held molten for several hours, nearly 80% of the iodine was released with similar levels for xenon.
Table 2-8 Fractional Releases Under Simulated Conditions of Fuel Melt
Quick Melt Prolonged Melt Gross gamma 0.004 0.08 Xenon 0.10 0.77 Iodine 0.04 0.77 Cesium 0.005 0.016 Strontium 10-6 10-4
In summary, if the above-cited experimental data sets in which the observed release fractions from molten fuel can be regarded as suitable surrogates for the severely damaged fuel of IET #3, release fractions of about 0.8 may be appropriate for radioiodines.
2.6.4 Assumptions Regarding Release from Undamaged Nuclear Fuel
By assuming that releases for IET #3 were the result of severe damage to the equivalent of 1.63 fuel cartridges, the HDE Task Group model further assumed that the balance of undamaged fuel (or 35.37 fuel cartridges) did not significantly contribute to any releases. Experimental evidence suggests smaller, but nevertheless significant, releases for “undamaged” fuel.
ORNL Test Data. Fission product release rates for ANP metallic fuel elements were performed in the Low Intensity Test Reactor (LITR) at ORNL (Conn 1959). Release rates cited by Conn (1959) were defined: “. . . as the ratio of the number of atoms of a species released to the
2-35

ANP Source Terms July 2005
theoretical number of atoms of the same species formed during the collection period. For uniformity, this ratio is expressed as a percentage. Calculation of fission product release rates were done with IBM 704 computer programs developed for this purpose.”
Fission products were collected by passing a portion of the effluent air used to cool the test specimen through activated charcoal traps. These traps, maintained at a temperature of approximately -50EF, were removed from the lines, and the carbon was extracted from the traps; both the carbon and the trap were leached chemically for analysis of particular radioactive species. In total, six metallic fuels were tested that differed in the metal composition of the clad. Table 2-9 summarizes release fractions for I-131, Xe-132, and several solids.
Table 2-9 Summary of Release Rates From General Electric-Aircraft Nuclear Propulsion Metallic Fuel Element Low Intensity Test Reactor Tests
Release Rates*
Test Fuel Duration of Test (hrs) Range* Average*
LTNCMR-1 90 I-131 0.21 - 1.8 0.7 Xe-133 0.0047 - 0.18 0.056 LTFCRR-1 41 I-131 0.048 - 3.70 0.85 Te-132 0.23 - 1.64 0.62 Xe-133 0.070 - 1.14 0.55 LTFCC-2 48 I-131 0.044 - 1.3 0.32 Te-132 0.022 - 0.72 0.18 Xe-133 0.038 - 43.0 10.2 LTFCRR-3 125 I-131 0.0027 - 0.02 0.008 Xe-133 0.0084 - 7.1 1.06 Te-132 0.002 - 0.1 0.027 LTFCRR-4 134 I-131 0.033 - 35.0 1.74
Sr-89 0.56 - 0.18 0.10 Ce-144 0.00027 - 0.18 0.04 LTFCRR-6 140 I-131 0.0011 - 0.12 0.023
* Release rates are given as percentage values; to obtain the release fraction, values must be multiplied by 0.01.
The measured trap values demonstrate significant but variable release rates from Aundamaged@ metallic fuel elements like those used in HTRE No. 1. In all cases, traps with the highest release rates were assumed to have been online during sampling times that coincided with the development of Apin-hole@ type leaks. Because these tests were single tests of relatively long duration, the cited “release rates” are essentially equal to release fractions when multiplied by 0.01. For LTFCRR-4, the highest I-131 release rate of 35% was thought to have been the result of a microscopic fissure in the fuel element. Conn (1959) further speculated that fluctuations
2-36

ANP Source Terms July 2005
from trap to trap were also likely to have been caused by faulty/inaccurate flow-measuring equipment and differences in sampling line plate-out.
On the basis of the six fuel sample types and their data sets, the release rates from Aundamaged@ metallic fuel elements may assume the following release rates that can reasonably be applied to the undamaged IET #3 fuel:
Iodines/Halogens: Noble Gases: Solids:
Release Rates0.006 0.03 0.002
2.7 Summary Conclusions Regarding Initial Engine Test #3
Reconstruction of radioactive releases associated with IET #3 are hampered by the fact that original logbooks and primary monitoring data are not available. For reconstruction, available data consist of summary reports that were written years later and whose data are frequently incomplete and difficult to interpret.
It is for these reasons that the HDE Task Group elected to derive releases for IET #3 by means of a model that relied on a combination of empirical data and assumptions that included (1) the operational history for IET #3, (2) derived time-integrated power output (MW-hrs) for each test run, (3) derived core inventories of fission products by means of the RSAC-4 computer code, (4) photographic evidence for quantifying severe fuel damage, and (5) assumed release fractions for noble gases, halogens, and solids in behalf of severely damaged fuel.
After carefully examining the quality of available data, SC&A has also concluded that effluent monitoring data are insufficient and a modeling approach is justified. It is further concluded that the basic approach taken by the HDE Task Group for modeling IET #3 releases is logical and appropriate when viewed in context with the available data. However, several subjective/ unsupported assumptions and assigned parameter values that support the HDE Task Group model may have yielded release estimates that are non-conservative or baseline estimates.
Our review of the HDE Task Group model identified four parameters for which higher values may be appropriate (Table 2-10). Their sequential application yields radionuclide release estimates that are given in Table 2-11.
2-37

ANP Source Terms July 2005
Table 2-10 Alternate Parameter Values Recommended for Modeling Initial Engine Test #3 Releases
Parameter HDE Task Group Model
SC&A Suggested Value
(1) Equivalent No. of severely damaged fuel 1.63 3.0 cartridges
(2) Relative power distribution of severely 1.0 1.25 damaged fuel Pdamaged fuel/Pcore average
(3) Release fractions for severely damaged fuel: Noble Gases 1.0 1.0 Halogens 0.5 0.8 Solids 0.1 0.1
(4) Release fraction for undamaged fuel: Noble Gases Not considered 0.03 Halogens Not considered 0.006 Solids Not considered 0.002
2-38

ANP Source Terms July 2005
Table 2-11 Adjusted Radionuclide Release Estimates
Nuclide
HDE Release
Quantity (Ci)
Additional Release Quantities
TOTAL (HDE +
Adjustments) Adjustment
#1* Adjustment
#2† Adjustment
#3‡ Adjustment
#4§
Ar-41 2.25E+03 NA NA NA NA 2.25E+03
Br-84 7.50E+02 6.30E+02 3.45E+02 1.04E+03 9.39E+01 2.85E+03
Kr-85m 8.49E+02 7.13E+02 3.91E+02 NA 5.31E+02 2.48E+03
Kr-87 4.28E+03 3.60E+03 1.97E+03 NA 2.68E+03 1.25E+04
Kr-88+D 4.67E+03 3.92E+03 2.15E+03 NA 2.92E+03 1.37E+04
Rb-89 1.63E+03 1.37E+03 7.50E+02 NA 6.80E+01 3.82E+03
Sr-89 3.37E+01 2.83E+01 1.55E+01 NA 1.41E+00 7.89E+01
Sr-90+D 2.28E-01 1.92E-01 1.05E-01 NA 9.51E-03 5.34E-01
Sr-91+D 3.69E+02 3.10E+02 1.70E+02 NA 1.54E+01 8.64E+02
Sr-92 7.90E+02 6.64E+02 3.63E+02 NA 3.30E+01 1.85E+03
Y-91 3.38E+01 2.84E+01 1.55E+01 NA 1.41E+00 7.92E+01
Y-92 3.48E+02 2.92E+02 1.60E+02 NA 1.45E+01 8.15E+02
Y-93 3.84E+02 3.23E+02 1.77E+02 NA 1.60E+01 8.99E+02
Zr-95+D 3.66E+01 3.07E+01 1.68E+01 NA 1.53E+00 8.57E+01
Zr-97 2.83E+02 2.38E+02 1.30E+02 NA 1.18E+01 6.63E+02
Nb-96 2.51E-02 2.11E-02 1.15E-02 NA 1.05E-03 5.88E-02
Mo-99 1.79E+02 1.50E+02 8.23E+01 NA 7.47E+00 4.19E+02
Ru-103 +D 2.72E+01 2.28E+01 1.25E+01 NA 1.13E+00 6.37E+01
Ru-105 1.06E+02 8.90E+01 4.88E+01 NA 4.42E+00 2.48E+02
Ru-106+D 4.52E-01 3.80E-01 2.08E-01 NA 1.89E-02 1.06E+00
Sb-129 7.04E+01 5.91E+01 3.24E+01 NA 2.94E+00 1.65E+02
Te-131 5.06E+02 4.25E+02 2.33E+02 NA 2.11E+01 1.18E+03
Te-131m 1.40E+01 1.18E+01 6.44E+00 NA 5.84E-01 3.28E+01
Te-132+D 1.25E+02 1.05E+02 5.75E+01 NA 5.22E+00 2.93E+02
2-39

ANP Source Terms July 2005
Table 2-11 Adjusted Radionuclide Release Estimates (continued)
HDE Release
Additional Release Quantities TOTAL
NUCLIDE Quantity
(Ci) Adjustment
#1* Adjustment
#2† Adjustment
#3‡ Adjustment
#4§ (HDE +
Adjustments)
Te-133m 4.98E+02 4.18E+02 2.29E+02 NA 2.08E+01 1.17E+03
Te-134 1.05E+03 8.82E+02 4.83E+02 NA 4.38E+01 2.46E+03
I-131 3.21E+02 2.70E+02 1.48E+02 4.43E+02 4.02E+01 1.22E+03
I-132 5.19E+02 4.36E+02 2.39E+02 7.17E+02 6.50E+01 1.98E+03
I-133 1.33E+03 1.12E+03 6.12E+02 1.84E+03 1.67E+02 5.06E+03
I-134 5.55E+03 4.66E+03 2.55E+03 7.66E+03 6.95E+02 2.11E+04
I-135 2.45E+03 2.06E+03 1.13E+03 3.38E+03 3.07E+02 9.33E+03
Xe-129m 1.30E-06 1.09E-06 5.98E-07 NA 8.14E-07 3.80E-06
Xe-135 1.78E+03 1.50E+03 8.19E+02 NA 1.11E+03 5.21E+03
Xe-135m 7.42E+02 6.23E+02 3.41E+02 NA 4.64E+02 2.17E+03
Xe-138 5.79E+03 4.86E+03 2.66E+03 NA 3.62E+03 1.69E+04
Cs-137+D 2.34E-01 1.97E-01 1.08E-01 NA 9.76E-03 5.48E-01
Cs-138 3.89E+03 3.27E+03 1.79E+03 NA 1.62E+02 9.11E+03
Ba-139 1.22E+03 1.02E+03 5.61E+02 NA 5.09E+01 2.86E+03
Ba-140+D 1.19E+02 1.00E+02 5.47E+01 NA 4.96E+00 2.79E+02
Ba-141 6.82E+02 5.73E+02 3.14E+02 NA 2.84E+01 1.60E+03
Ba-142 4.05E+02 3.40E+02 1.86E+02 NA 1.69E+01 9.48E+02
La-141 6.38E+02 5.36E+02 2.93E+02 NA 2.66E+01 1.49E+03
La-142 1.02E+03 8.57E+02 4.69E+02 NA 4.25E+01 2.39E+03
Ce-141 5.63E+01 4.73E+01 2.59E+01 NA 2.35E+00 1.32E+02
Ce-143 2.22E+02 1.86E+02 1.02E+02 NA 9.26E+00 5.20E+02
Ce-144+D 7.57E+00 6.36E+00 3.48E+00 NA 3.16E-01 1.77E+01
Pr-143 9.56E+01 8.03E+01 4.40E+01 NA 3.99E+00 2.24E+02
Pr-144 7.55E+00 6.34E+00 3.47E+00 NA 3.15E-01 1.77E+01
U-234 1.14E-02 5.21E-03 NA NA NA 1.66E-02
2-40
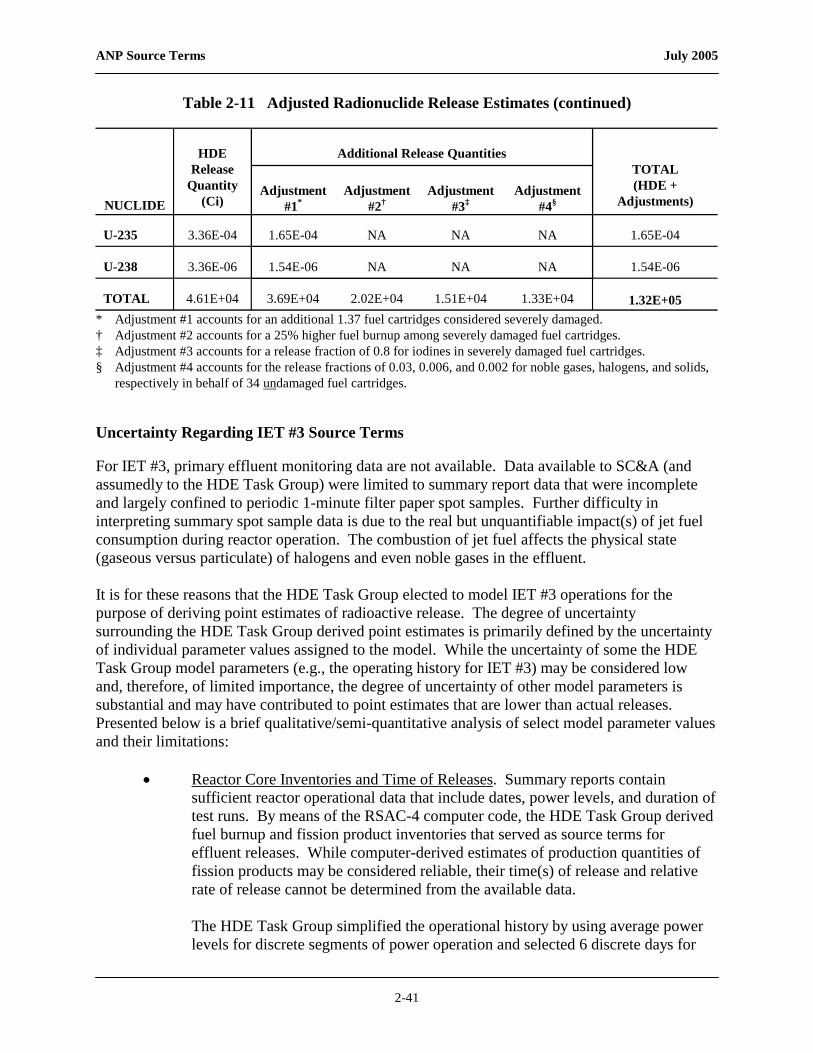
ANP Source Terms July 2005
Table 2-11 Adjusted Radionuclide Release Estimates (continued)
NUCLIDE
HDE Release
Quantity (Ci)
Additional Release Quantities TOTAL (HDE +
Adjustments) Adjustment
#1* Adjustment
#2† Adjustment
#3‡ Adjustment
#4§
U-235 3.36E-04 1.65E-04 NA NA NA 1.65E-04
U-238 3.36E-06 1.54E-06 NA NA NA 1.54E-06
TOTAL 4.61E+04 3.69E+04 2.02E+04 1.51E+04 1.33E+04 1.32E+05 * Adjustment #1 accounts for an additional 1.37 fuel cartridges considered severely damaged. † Adjustment #2 accounts for a 25% higher fuel burnup among severely damaged fuel cartridges. ‡ Adjustment #3 accounts for a release fraction of 0.8 for iodines in severely damaged fuel cartridges. § Adjustment #4 accounts for the release fractions of 0.03, 0.006, and 0.002 for noble gases, halogens, and solids,
respectively in behalf of 34 undamaged fuel cartridges.
Uncertainty Regarding IET #3 Source Terms
For IET #3, primary effluent monitoring data are not available. Data available to SC&A (and assumedly to the HDE Task Group) were limited to summary report data that were incomplete and largely confined to periodic 1-minute filter paper spot samples. Further difficulty in interpreting summary spot sample data is due to the real but unquantifiable impact(s) of jet fuel consumption during reactor operation. The combustion of jet fuel affects the physical state (gaseous versus particulate) of halogens and even noble gases in the effluent.
It is for these reasons that the HDE Task Group elected to model IET #3 operations for the purpose of deriving point estimates of radioactive release. The degree of uncertainty surrounding the HDE Task Group derived point estimates is primarily defined by the uncertainty of individual parameter values assigned to the model. While the uncertainty of some the HDE Task Group model parameters (e.g., the operating history for IET #3) may be considered low and, therefore, of limited importance, the degree of uncertainty of other model parameters is substantial and may have contributed to point estimates that are lower than actual releases. Presented below is a brief qualitative/semi-quantitative analysis of select model parameter values and their limitations:
• Reactor Core Inventories and Time of Releases. Summary reports contain sufficient reactor operational data that include dates, power levels, and duration of test runs. By means of the RSAC-4 computer code, the HDE Task Group derived fuel burnup and fission product inventories that served as source terms for effluent releases. While computer-derived estimates of production quantities of fission products may be considered reliable, their time(s) of release and relative rate of release cannot be determined from the available data.
The HDE Task Group simplified the operational history by using average power levels for discrete segments of power operation and selected 6 discrete days for
2-41

ANP Source Terms July 2005
modeling IET #3 releases. Such model assumptions are vulnerable inasmuch as releases/release rates may be highly time-dependent and coincide with power-excursions and the induction of localized fuel damage.
• Amount of Damaged Fuel. Central to the HDE Task Group model=s estimates were summary data cited by Thornton et al. (1962b) that characterized fuel damage obtained during the post-operational inspection of HTRE No. 1 reactor core (see Section 2.4). These summary data (see Section 2.6) reflect information that was extracted from six separate reports that unfortunately were not available to the HDE Task Group or SC&A. While photographs and verbal descriptions provide inarguable evidence of severe fuel failure, the summary report by Thornton et al. (1962) provides no quantitative estimate of the amount of severely failed fuel.
It must further be emphasized that large releases may also involve fuel damage that only entails minor fissures, pinholes, and other imperfections in fuel cladding. Such damage may not be obvious to the naked eye or discernable in the photographic evidence presented by Thornton et al. (1962b).
On the basis of the limited summary data, the HDE Task Group concluded (but without explanation) that the amount of failed fuel was the equivalent of 1.63 fuel cartridges, which represented the collective source term of radioactive releases.
Our review of summary data led us to conclude that the collective damage may have represented the equivalent of three fuel cartridges. This estimate was based on descriptions provided in behalf of 3 severely damaged fuel cartridges and 10 additional cartridges that showed evidence of more localized damage (that precluded their subsequent use).
Admittedly, neither the HDE Task Group’s estimate of 1.63 failed fuel cartridges nor SC&A=s estimate of 3 failed fuel cartridges can be supported by robust scientific evidence. From the limited available evidence, however, SC&A=s higher estimate of failed fuel that is equivalent to 3 fuel cartridges is not unreasonable.
In brief, the HDE Task Group based its estimates of radioactive releases on photographic evidence of severely damaged/missing fuel. Empirical data have shown that substantial releases of noble gases, volatile halogens, and select other fission products occur as a result of microscopic lesions/imperfections in fuel cladding that are clearly not discernable as photographic evidence. Thornton et al. (1962b) described that in addition to three severely damaged/burned cartridges “. . . only 24 of the 37 cartridges were in fair to good condition and were . . . re-used in later test.”
2-42

ANP Source Terms July 2005
• Homogeneity of Fuel Burnup Within HTRE No. 1. The HDE Task Group model assumed that power levels and fuel burnup were uniform throughout the reactor core and, therefore, identical between damaged and undamaged fuel.
Data presented in Section 2.6.2, however, suggest that power levels, even when engineering designs are employed, may not be constant. Incorrect spacing among fuel assemblies and/or water flow volumes that moderate fast neutrons may readily account for the observed differences among fuel plate temperatures, which are suggestive of non-homogeneous power levels. Equally important were specific test runs that assessed the impacts of control rod positions on fuel plate temperatures, which serve as surrogate indicators of power distribution within the core.
It is logical to conclude that localized heating (induced by higher power levels) was a contributing factor to fuel failure. A 25% higher than core average fuel burnup among the damaged fuel is likely to represent a value that falls within the range of a best estimate and a 90th percentile upper-bound value.
• Release Fractions for Damaged Fuel. Release fractions of 1.0, 0.5, and 0.1 were employed by the HDE Task Group in behalf of damaged fuel for noble gases, halogens, and solids, respectively. Given the design of nuclear fuel and reactor design, few arguments can be made against the assumed release fraction of 1.0 for noble gases from severely damaged/missing fuel.
In-pile experimental data and data obtained from Operation BOOT (see Section 2.6.3) support a release fraction of 0.8 for iodine/halogens. Since our recommended value of 0.8 is within 20% of its theoretical upper limit, there is marginal concern for assuming that the actual release fraction was significantly higher.
Release fractions for individual radioelements that are collectively classified as solids are likely to exhibit a wide range of values. Release rates are not only determined by the complex relationship of fuel temperature, diffusion, and physical dimensions of individual fuel elements, but also the integrity of the fuel and its cladding, which may experience pin-hole leaks, fissures, or total failure. From data presented in Tables 2-7, 2-8, and 2-9, the release fraction of 0.1 (representing an average value for all solid fission products) appears reasonable.
• Release Fractions for Undamaged Fuel. The HDE Task Group model did not consider the contribution of release from undamaged fuel. The release fractions of 0.03, 0.006, and 0.002 selected by SC&A for undamaged fuel reflect the limited empirical values cited by in-pile ANP fuel element studies, such as those in Table 2-9. These values are representative of the most probable or central values.
2-43

ANP Source Terms July 2005
3.0 INITIAL ENGINE TEST #4
3.1 Relevant Background Data
The second series of operational tests using the Heat Transfer Reactor Experiment (HTRE) No. 1/D102A test assembly was run at the Idaho Test Station during the period from April 17, 1956, through June 29, 1956, and was designated Initial Engine Test (IET) #4.
Initial Engine Test #4 utilized the A2 core in which several significant repairs and modifications were made as a result of IET #3 operation. Thirteen new fuel cartridges with extra rails were installed. Fifteen control rods were replaced. Another modification entailed redesign of the insulation sleeves to provide more assurance against liner collapse and subsequent fuel cartridge damage that had occurred during IET #3.
Table 3-1 gives the old and new cartridge numbers and their locations for the IET #4 operations. During this test series, the reactor was operated for a total energy release to the air of 191.94 megawatt-hours. The maximum sustained plate temperature recorded was 1,991EF, with a maximum sustained average of 1,701EF. The maximum core discharge air temperature was 1,394EF. The total operating time at power levels above 200 kW was 2,064.98 hours. Table 3-2 presents a summary of reactor operation. Complete operating data for the series are presented in the following references: Hansjergen 1956, Masson 1956, McClure 1956, Noakes 1956, Orillion 1956, and Scarborough 1956.
The primary purpose of the IET #4 test series was to determine whether the modifications based on the results of the first IET #3 test series had significantly improved the capabilities of the reactor. Additional objectives were to (1) make complete measurements of the power-plant performance, (2) measure xenon poisoning, and (3) study and improve servo control of the reactor.
In summary, the IET #4 test runs corresponding to a total of nearly 192 hours of reactor operation with a total system heat release of 2064.98 MW-hours was substantially greater than the 40 hours and 349 MW-hours representing IET #3.
3-1

ANP Source Terms July 2005
Table 3-1 A2 Core Loading for Initial Engine Test #4
Previous Tube Location Tube Serial Age of Cartridge for IET #3
1 206 New 2 244 New 3 214 Used 3 4 204 Used 4 5 243 New 6 245 New 7 201 Used 31 8 215 New 9 202 Used 12
10 248 New 11 235 Used 21 12 231 Used 24 13 233 Used 13 14 249 New 15 238 Used 15 16 240 New 17 242 New 18 250 New 19 246 New 20 222 Used 6 21 221 Used 29 22 224 Used 22 23 213 Used 23 24 211 Used 11 25 219 Used 25 26 216 Used 28 27 212 Used 27 28 227 Used 33 29 207 Used 32 30 241 New 31 217 Used 20 32 234 Used 14 33 239 Used 8 34 247 New 35 208 Used 35 36 229 Used 37 37 228 Used 19
3-2
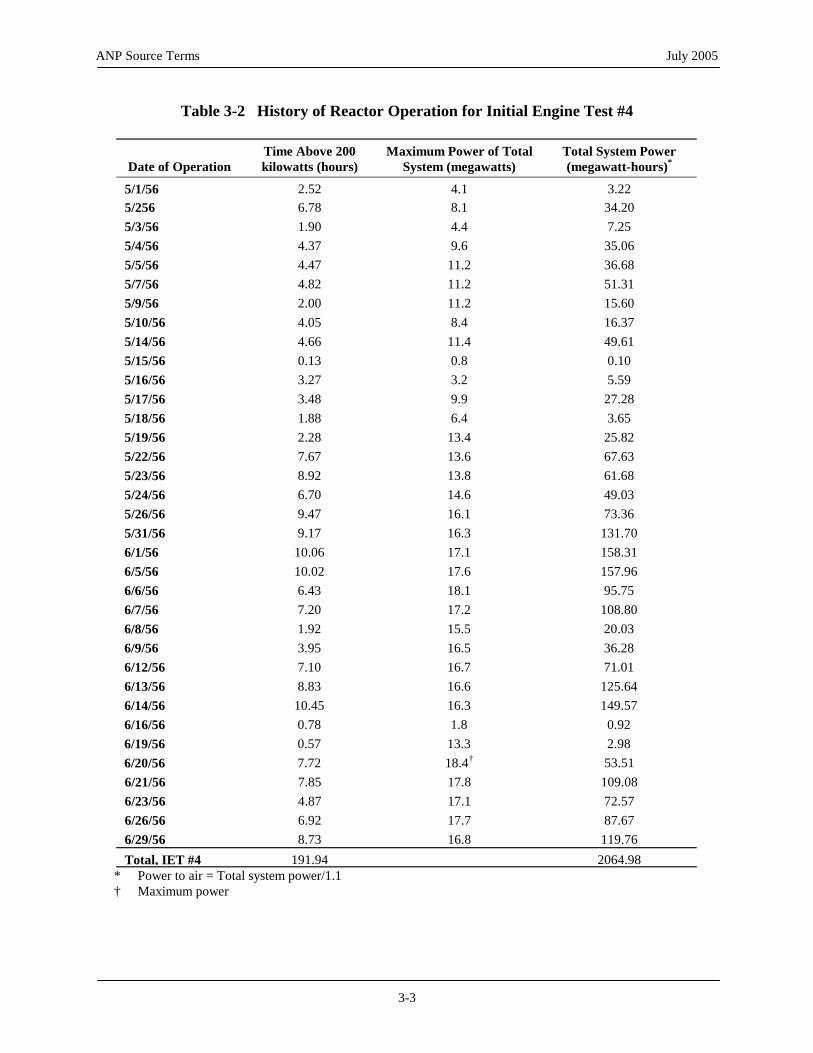
ANP Source Terms July 2005
Table 3-2 History of Reactor Operation for Initial Engine Test #4
Date of Operation Time Above 200 kilowatts (hours)
Maximum Power of Total System (megawatts)
Total System Power (megawatt-hours)*
5/1/56 2.52 4.1 3.22 5/256 6.78 8.1 34.20 5/3/56 1.90 4.4 7.25 5/4/56 4.37 9.6 35.06 5/5/56 4.47 11.2 36.68 5/7/56 4.82 11.2 51.31 5/9/56 2.00 11.2 15.60 5/10/56 4.05 8.4 16.37 5/14/56 4.66 11.4 49.61 5/15/56 0.13 0.8 0.10 5/16/56 3.27 3.2 5.59 5/17/56 3.48 9.9 27.28 5/18/56 1.88 6.4 3.65 5/19/56 2.28 13.4 25.82 5/22/56 7.67 13.6 67.63 5/23/56 8.92 13.8 61.68 5/24/56 6.70 14.6 49.03 5/26/56 9.47 16.1 73.36 5/31/56 9.17 16.3 131.70 6/1/56 10.06 17.1 158.31 6/5/56 10.02 17.6 157.96 6/6/56 6.43 18.1 95.75 6/7/56 7.20 17.2 108.80 6/8/56 1.92 15.5 20.03 6/9/56 3.95 16.5 36.28 6/12/56 7.10 16.7 71.01 6/13/56 8.83 16.6 125.64 6/14/56 10.45 16.3 149.57 6/16/56 0.78 1.8 0.92 6/19/56 0.57 13.3 2.98 6/20/56 7.72 18.4† 53.51 6/21/56 7.85 17.8 109.08 6/23/56 4.87 17.1 72.57 6/26/56 6.92 17.7 87.67 6/29/56 8.73 16.8 119.76 Total, IET #4 191.94 2064.98
* Power to air = Total system power/1.1 † Maximum power
3-3

ANP Source Terms July 2005
Thermodynamic and Fuel Temperature Data for IET #4. During IET #4, the system was operated under conditions that permitted extensive power mapping of the system. Data were obtained over the range from full chemical fuel operation to reactor powers requiring as little as 300 pounds per hour fuel flow. It should be noted that for IET #4, no data were obtained without some chemical fuel assist. The method chosen for obtaining thermodynamic data was to hold a constant indicated power on the linear flux meter and to vary engine speed by changing chemical fuel flow.
Unfortunately, thermocouple readings were clouded by the number of inoperative thermocouples. At the beginning of this series of tests, 17 fuel tubes had no usable 15th- or 16th-plate thermocouples at the 18th stage, and 10 fuel tubes had defective outlet air thermocouples. At the completion of the partial power mapping, these numbers rose to 24 and 25, respectively. Thus, the arithmetic average of the eighteenth-stage thermocouples and of the core outlet air thermocouples involved fewer measurements than in IET #3. The fuel element temperature-time history for IET #4 is given in Jacoby (1956b) and Noyes (1956).
Figure 3-1 is a representation of IET #4 plate and reactor-discharge-temperature data for the complete speed range (Thornton et al. 1962b).
Figure 3-1 Eighteenth-stage Temperature Versus Percent Nuclear Power
3-4

ANP Source Terms July 2005
Table 3-3 compares typical operating conditions at high power levels and associated temperatures observed for IET #3 with those of IET #4. Significant differences between IET #3 and IET #4 include (1) the ªt values between core temperature and torus exit temperature (i.e., T3.54 - T3.65), which was 75EF greater in IET #4 than in IET #3; and (2) the temperature differences between average fuel-plate 18 and the exit torus air temperature (i.e., T18 avg - T3.65), which for IET #4 was 90EF less than it was in IET #3.
Table 3-3 Heat Transfer Reactor Experiment No. 1 Data Comparison Between Initial Engine Test #3 and Initial Engine Test #4
IET #3 IET #4
T ªT ªT T ªT ªT
T18, max 1975 1914
215 236
T18, avg 1760 1678
472 307
T3.54 1288 494 1371 404
22 97
T3.65 1266 1274
31 20
T3.8 1235 1254
74
T4.0 1231 1328
N 7096 7070
Q 14,671 14,746
% NP 100 92.76
where: T18, max = Maximum 18th-stage plate temperature, EF T18, avg = Average 18th-stage temperature, EF T3.54 = Core discharge temperature, EF T3.65 = Hot torus exit temperature, EF T4 = Turbine inlet temperature, EF Q = Nuclear power to air, Btu/sec %NP = (Nuclear Power) : (Total Power) x 100 N = Engine speed, rpm
3-5
ANP Source Terms July 2005
3.2 Early Estimates of Radioactive Releases for Initial Engine Test #4
During the high-power operation of the HTRE No. 1 A2 reactor in IET #4, tests were conducted to correlate IET exhaust-gas activity to fuel flow, reactor power, and reactor plate temperature. The tests were conducted by setting constant chemical-fuel flow and constant reactor flux while varying the reactor plate temperature by changing the position of the jet engine nozzle. For each setting of these parameters, stack activity was determined by measuring the count rate of filters through which a portion of the stack gas flowed. The total particulate activity was computed by proportioning the filter-sample flow reading to the total volumetric flow of gases up the stack. The sample filter flow was regulated to provide isokinetic sampling. In this manner, measurements were taken to separate the effects of such parameters as power, fuel flow, and temperature. Results of the tests are summarized in the following paragraphs, as reported by Holtslag (1956).
Effect of Reactor Power. An increase in reactor power from 11.7 to 13.5 megawatts, with a fuel flow of 1,080 pounds per hour at mean plate temperatures of 1,326EF and 1,335EF and maximum plate temperatures of 1,620EF and 1,603EF, showed no measurable increase in activity. The total activity was computed as 24 curies per hour for each condition. A similar increase of reactor power from 13.5 to 15.5 megawatts, with a fuel flow of 930 pounds per hour at mean plate temperatures of 1,408EF and 1,474EF and maximum plate temperatures of 1,676EF and 1,773EF, showed a slight increase in activity from 25 to 33 curies per hour. Since plate temperature was also inadvertently increased, this activity increase may not have been entirely due to power effects.
Effect of Chemical Fuel Flow. Reduction of fuel flow from 1,080 to 930 pounds per hour at a reactor power of 13.5 megawatts, mean plate temperatures of 1,335EF and 1,332EF, and maximum plate temperatures of 1,603EF and 1,600EF gave a slight decrease in activity from 24 to 16 curies per hour. A similar change from 930 to 730 pounds per hour at a reactor power of 15.5 megawatts, mean plate temperature of 1,474EF and 1,496EF, and maximum plate temperatures of 1,773EF and 1,805EF showed a decrease in activity from 33 to 27 curies per hour.
Effect of Plate Temperature. At a reactor power of 11.7 megawatts and a fuel flow of 1,080 pounds per hour, with an increase of mean plate temperature from 1,207EF to 1,326EF and a corresponding increase in maximum plate temperature from 1,395EF to 1,620EF, values of activity ranged from 23 to 26 curies per hour. At a power of 13.5 megawatts and a fuel flow of 930 pounds per hour, with an increase of mean plate temperature from 1,600EF to 1,676EF, values of activity ranged from 16 to 25 curies per hour.
At a power of 15.5 megawatts, a fuel flow of 730 pounds per hour, an increase in mean plate temperature from 1,496EF to 1,538EF, and a corresponding increase in maximum plate temperature from 1,805EF to 1,893EF, activity increased from 27 to 70 curies per hour. At this same fuel flow and reactor power, further increase in mean plate temperature to 1,605EF with a corresponding maximum plate temperature of 1,942EF gave an increase to 186 curies per hour. Table 3-4 summarizes the results of these tests.
3-6

ANP Source Terms July 2005
In summary, test data show that the particulate activity showed no significant dependency on plate temperature at low temperature levels, but increased sharply at high temperatures. The activity showed a moderate dependency on fuel flow, decreasing with reduction of fuel flow; the effect of power on activity was not detectable at low powers, but showed minor increase at the maximum power tests. Therefore, it was concluded that the temperature level is by far the most critical parameter affecting the release of fission products.
Table 3-4 Stack Activity Test Data
Mean Plate Highest Plate Particulate Stack Gas Fuel Total Reactor Sample Temperature Temperature Activity Temperature Flow Power
No. (EF) (EF) (curies/ h) (EF) (lb/h) (MW)
70 1,207 1,395 26 520 1,080 11.7
71 1,223 1,476 23 525 1,080 11.7
72 1,326 1,620 24 540 1,080 11.7
73 1,335 1,603 24 530 1,080 13.5
74 1,332 1,600 16 525 930 13.5
75 1,361 1,600 22 540 930 13.5
76 1,408 1,676 25 550 930 13.5
77 1,474 1,773 33 550 930 15.5
78 1,496 1,805 27 560 730 15.5
80 1,538 1,893 70 585 730 15.5
81 1,605 1,942 186 600 730 15.5
It should be noted that radiological effluent monitoring for IET #4 was limited to particulate radionuclides; and as previously discussed, the interpretation of particulate radioactivity in effluents associated with IETs is complicated by the concurrent combustion of jet fuel during reactor operations. For IET #4, test runs ran from total chemical fuel operations to 8% of full reactor power that required as little as 300 pounds per hour fuel flow. The following description of effluent releases/monitoring for IET #4 is provided by Thornton et al. (1962b, page 26). As a benefit to the reader, several key words/phrases are underlined.
From the start of power operation, radioactivity was observed on the stack monitor and rupture detector. Tests to pinpoint the cause of this release indicated that the measured particulate activity did not depend significantly upon fuel element plate temperature at low temperature levels but increased sharply at high plate temperatures. The activity showed a moderate dependency on fuel flow, since it decreased when the fuel flow was reduced. The effect of power on activity was not detectable at low powers, but showed a minor increase at the maximum
3-7

ANP Source Terms July 2005
power tested, 15.5 megawatts. It was therefore concluded that fuel element temperature level was the most significant parameter in determining release of radioactivity.
The release of radioactivity in stack gas was further investigated by the introduction of smoke in the base of the stack. The increase in measured particulate activity amounted to over 1000 curies per hour, the highest level observed during this test series. When the smoke had dissipated, the measured activity decreased to an average level of 135 curies per hour, a typical value for the conditions. It was believed that the smoke may have absorbed the radioactive gases in a manner that affected the efficiency of the detecting equipment.
The stack gas was sampled periodically by passing a small amount through a millipore filter and occasionally through a liquid scrubber to remove iodine. At high fractional nuclear powers, over 90 percent of the activity passed through the filters (99.99 percent efficiencies were achieved for particles 0.3 microns or over in diameter).
The filters that sample each fuel tube were removed and examined. Those connected to tubes 5, 26, 30, and 11 contained appreciable radioactivity. I131, I132, and I133 were detected in all of these filters, and uranium was detected in all but tube 5. . . .
The nature of the radioactivity release in this test series was different from that observed during IET No. 3. The radioactivity was emitted either as a gas or in the form of extremely small particles. The emission was relatively steady and continuous. There was no sudden onset of large-scale emission. . . . [Emphasis added.]
3.3 Limitations of Early Release Estimates
As cited previously in Table 3-1, the IET #4 reactor operation above 200 kW started May 1, 1956, and ended June 29, 1956, for a total non-continuous period of 60 days. During this interval, the reactor operated for a cumulative period of about 192 hours with a total system power output of 2,065 MW-hours. Effluent monitoring as summarized by Thornton et al. (1962b) consisted of the following:
• Stack gas was only sampled Aperiodically@ and was largely confined to particulates collected on millipore filters: filters had a 99.99% collection efficiency for particles 0.3 microns and larger.
• Radioactive releases were observed from the very “start” of power operation and continued throughout the 60-day test period. This suggest that the 24 fuel assemblies that had been used previously during IET #3 (and which had been described as being in “fair to good condition”) may have been the source of early
3-8
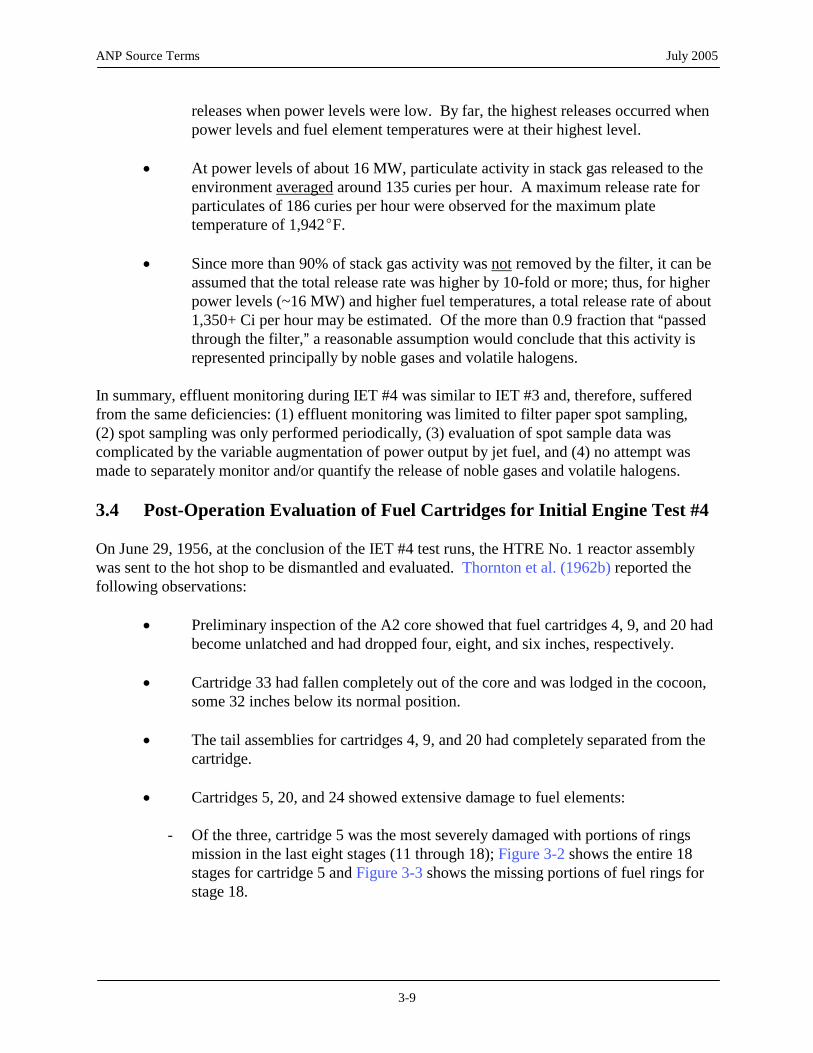
ANP Source Terms July 2005
releases when power levels were low. By far, the highest releases occurred when power levels and fuel element temperatures were at their highest level.
• At power levels of about 16 MW, particulate activity in stack gas released to the environment averaged around 135 curies per hour. A maximum release rate for particulates of 186 curies per hour were observed for the maximum plate temperature of 1,942EF.
• Since more than 90% of stack gas activity was not removed by the filter, it can be assumed that the total release rate was higher by 10-fold or more; thus, for higher power levels (~16 MW) and higher fuel temperatures, a total release rate of about 1,350+ Ci per hour may be estimated. Of the more than 0.9 fraction that Apassed through the filter,@ a reasonable assumption would conclude that this activity is represented principally by noble gases and volatile halogens.
In summary, effluent monitoring during IET #4 was similar to IET #3 and, therefore, suffered from the same deficiencies: (1) effluent monitoring was limited to filter paper spot sampling, (2) spot sampling was only performed periodically, (3) evaluation of spot sample data was complicated by the variable augmentation of power output by jet fuel, and (4) no attempt was made to separately monitor and/or quantify the release of noble gases and volatile halogens.
3.4 Post-Operation Evaluation of Fuel Cartridges for Initial Engine Test #4
On June 29, 1956, at the conclusion of the IET #4 test runs, the HTRE No. 1 reactor assembly was sent to the hot shop to be dismantled and evaluated. Thornton et al. (1962b) reported the following observations:
• Preliminary inspection of the A2 core showed that fuel cartridges 4, 9, and 20 had become unlatched and had dropped four, eight, and six inches, respectively.
• Cartridge 33 had fallen completely out of the core and was lodged in the cocoon, some 32 inches below its normal position.
• The tail assemblies for cartridges 4, 9, and 20 had completely separated from the cartridge.
• Cartridges 5, 20, and 24 showed extensive damage to fuel elements:
- Of the three, cartridge 5 was the most severely damaged with portions of rings mission in the last eight stages (11 through 18); Figure 3-2 shows the entire 18 stages for cartridge 5 and Figure 3-3 shows the missing portions of fuel rings for stage 18.
3-9

ANP Source Terms July 2005
- Cartridge 20 showed heavily oxidized areas on stages 10 and 11 (Figure 3-4).
- Cartridge 24 showed a heavily oxidized area on stage 15 as well as visible circumferential striations (Figure 3-5).
Figure 3-2 Fuel Cartridge 5
3-10

ANP Source Terms July 2005
Figure 3-3 Damage to Stage 18, Cartridge 5
3-11

ANP Source Terms July 2005
Figure 3-4 Damage to Stages 10 and 11 of Cartridge 20
3-12

ANP Source Terms July 2005
Figure 3-5 Damage to Stages 13, 14, and 15 of Fuel Cartridge 24
3-13

ANP Source Terms July 2005
3.5 Approach by the Historical Dose Evaluation Task Group for Estimating Radioactive Releases for Initial Engine Test #4
The Historical Dose Evaluation (HDE) Task Group relied primarily on information and data provided by Thornton et al. (1962b) for deriving fission product release quantities for IET #4. Consistent with observations reported by Thornton et al. (1962b), the HDE Task Group model assumed that releases for IET #4 occurred continuously over the entire 192-hour reactor operation period at rates that were proportionately linked to reactor power levels/fuel temperatures.
For deriving fission product release quantities, the HDE Task Group divided the 60-day operational period (as summarized in Table 3-2) into three discrete periods and employed a combination of empirical effluent data and assumptions. The following provides a quantitative summary in behalf of the three periods designated as (1) relatively low power levels; (2) high power levels, and (3) last day of operation when fuel damage was assumed to have occurred.
3.5.1 Period #1: Reactor Operation at Lower Power
From Table 3-2, the period of lower power operation was defined by the first 23 days starting May 1 through May 23, 1956. Operational data for this subset of IET #4 are reproduced in the first four columns of Table 3-5. HDE-modeled power output values are given in the last column.
The first conservative assumption made by the HDE Task Group model was to assume that the maximum power level identified for each of the 16 test runs prevailed for the entire duration. For example, Table 3-5 shows that for the first day (i.e., May 1, 1956), Thornton had identified a test run of 2.52 hours with a maximum power level of 4.1 MW; for the full test run, Thornton et al. (1962b) reported the time-integrated power output of 3.22 MW-h. For modeling, the HDE Task Group assumed the maximum power level of 4.1 MW for the full duration, which yielded the significantly higher value of 10.33 MW-h. For all 15 test runs representing the first period, the HDE Task Group model yields a time-integrated power output of 644.14 MW-h which, when divided by cumulative operating time of 63.2 hours, yields an average reactor power level of 10.2 MW.
Because particulate activity from stack sampling had shown that release rates were most affected by fuel plate temperature (see Table 3-4), the HDE Task Group correlated this temperature dependency as illustrated in Figure 3-6. For calculational purposes, it was assumed that there was a direct correlation between fuel plate temperature and the reactor power level.
3-14
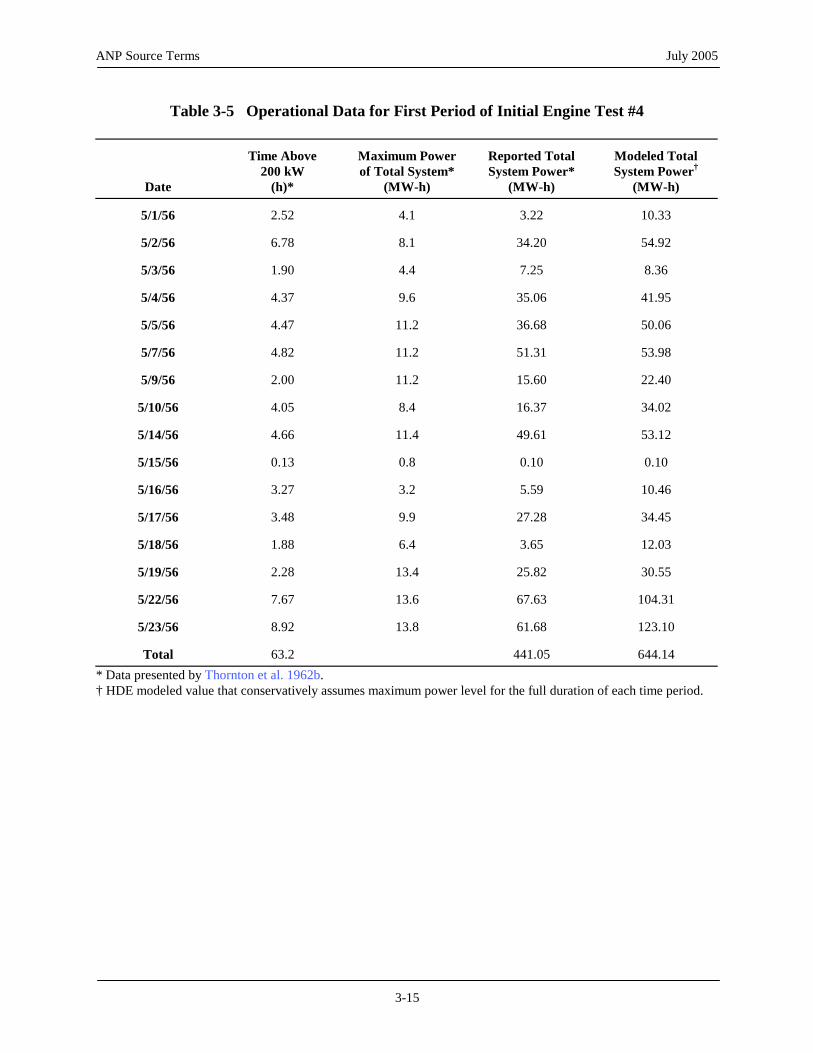
ANP Source Terms July 2005
Table 3-5 Operational Data for First Period of Initial Engine Test #4
Time Above 200 kW
Maximum Power of Total System*
Reported Total System Power*
Modeled Total System Power†
Date (h)* (MW-h) (MW-h) (MW-h)
5/1/56 2.52 4.1 3.22 10.33
5/2/56 6.78 8.1 34.20 54.92
5/3/56 1.90 4.4 7.25 8.36
5/4/56 4.37 9.6 35.06 41.95
5/5/56 4.47 11.2 36.68 50.06
5/7/56 4.82 11.2 51.31 53.98
5/9/56 2.00 11.2 15.60 22.40
5/10/56 4.05 8.4 16.37 34.02
5/14/56 4.66 11.4 49.61 53.12
5/15/56 0.13 0.8 0.10 0.10
5/16/56 3.27 3.2 5.59 10.46
5/17/56 3.48 9.9 27.28 34.45
5/18/56 1.88 6.4 3.65 12.03
5/19/56 2.28 13.4 25.82 30.55
5/22/56 7.67 13.6 67.63 104.31
5/23/56 8.92 13.8 61.68 123.10
Total 63.2 441.05 644.14 * Data presented by Thornton et al. 1962b. † HDE modeled value that conservatively assumes maximum power level for the full duration of each time period.
3-15

ANP Source Terms July 2005
Figure 3-6 Initial Engine Test #4 Release Rates of Particulate Radionuclides
3-16

ANP Source Terms July 2005
For example, a plate temperature of 1,400EF could be assumed to be equivalent to a power level of 14 MW. From Figure 3-6, the empirical effluent data identify a particulate release rate of 26 curies per hour for a reactor power level of 10.2 MW; for the 63.2 hours of Period 1 operation at an average power level of 10.2 MW, the HDE Task Group derived a total release of 1,643 curies of particulate fission products. The HDE Task Group model assumed that the 1,643 curies of particulates represented only particulate solid fission products and no halogens or noble gases. Furthermore, the release of fission products from the fuel matrix was assumed to represent a diffusion/migration process that on average required a 4-hour time period. In other words, the release was assumed to originate from fission products present after 4 hours of reactor operation, which conservatively favors the release of longer-lived fission products.
Because effluent sampling did not include the volatile halogens and noble gases, their activity levels in the stack effluent were estimated by means of scaling; the HDE Task Group derived quantitative release values by means of the RSAC-4 code. The RSAC-4 code was programmed so that the 1,643 curies of released solids represented a release fraction that was 1,000 and 2,000 times smaller than the concurrent release fractions of halogens and noble gases, respectively. These relative release fractions (or ratios of release fractions) must be considered conservative since the common default release fractions of 0.01, 0.5, and 1.0 for solids, halogens, and nobles gases, respectively, would yield release fraction ratios of 50 and 100 (instead of the 1,000 and 2,000 ratio values assumed by the HDE Task Group model).
On the basis of these assumptions, the RSAC-4 code derived the following releases (decayed to 10 minutes) in behalf of the first period of IET #4:
Solids: 1,643 curies Halogens: 2,950 curies Noble Gases: 6,810 curies
3.5.2 Period #2: Reactor Operation at Higher Power
Between May 24 and June 26, 1956, the reactor was operated at significantly higher power levels that corresponded to higher fuel plate temperatures and higher release rates (Table 3-6).
All assumptions made in behalf of Period #1 were equally applied to Period #2 for modeling releases: thus, for the average power level of 16.8 MW, a release rate of 405 curies per hour was determined from Figure 3-6; and for the total 128.74-hour period that the reactor was assumed to operate at 16.8 MW, the following 10-minute decayed releases were derived:
Solids: 52,200 curies Halogens: 93,600 curies Noble Gases: 216,000 curies
3-17

ANP Source Terms July 2005
Table 3-6 Operational Data for Second Period of Initial Engine Test #4
Time Above 200 kW
Maximum Power of Total System*
Reported Total System Power*
Modeled Total System Power†
Date (h)* (MW-h) (MW-h) (MW-h)
5/24/56 6.70 14.5 49.03 97.82
5/26/56 9.47 16.1 73.36 152.47
5/31/56 9.17 16.3 131.70 149.47
6/1/56 10.06 17.1 158.31 172.03
6/5/56 10.02 17.6 157.96 176.35
6/6/56 6.43 18.1 95.75 116.38
6/7/56 7.20 17.2 108.80 123.84
6/8/56 1.92 15.5 20.03 29.76
6/9/56 3.95 16.5 36.28 65.18
6/12/56 7.10 16.7 71.01 118.57
6/13/56 8.83 16.6 125.64 146.58
6/14/56 10.45 16.3 149.57 170.34
6/16/56 0.78 1.8 0.92 1.40
6/19/56 0.57 13.3 2.98 7.58
6/20/56 7.72 18.4 53.51 142.05
6/21/56 7.85 17.8 109.08 139.73
6/23/56 4.87 17.1 72.57 83.28
6/26/56 6.92 17.7 87.67 122.48
Total 120.01 1,504.17 2,015.31 * Data presented by Thornton et al. 1962b. † HDE modeled value that conservatively assumes maximum power level for the full duration of each time period.
3.5.3 Period #3: Last Day of Operation When Fuel Damage Assumedly Occurred
For IET #4, the last day of reactor operation was on June 29, 1956. The fuel damage that was subsequently documented during disassembly of the reactor core was conservatively assumed to have occurred on the last day, when there was a maximum buildup of fission products in the core.
To model the total core inventory of fission products on June 29, 1956, the HDE Task Group employed the following operating history:
3-18

ANP Source Terms July 2005
• Between June 12 and June 29, the actual time periods of operation were assumed.
• For the period before June 12, the reactor operation was assumed to be constant and continuous at a power level of 1.325 MW for 40 days.
Modeling the operational history in this manner provides a fuel burnup that is modestly conservative in relation to the actual burnup as reported by Thornton et al. (1962b) (i.e., 2,142 MW-h for the HDE Task Group model versus Thornton=s documented value of 2,065 MW-h).
On the last day of reactor operation for IET #4 when fuel degradation was assumed, the RSAC-4 code identified the following core inventory of fission products:
Solids: 4.18 x 10⁶ curies Halogens: 4.34 x 10⁵ curies Noble Gases: 5.50 x 10⁶ curies
The HDE Task Group reviewed the description along with photographs of the fuel assemblies taken after the final period of operation (Hoover and Brekken 1956a and 1956b) and concluded that severe damage occurred to 1.27% of the reactor fuel. The release of 1.27% of the core inventory is equivalent to the inventory release of 47.1% of one of the 37 fuel assemblies. When normalized to a 10-minute decay value, the release of 1.27% of the core inventory equates to the following release quantities:
Solids: 2.24 x 10⁴ curies Halogens: 2.48 x 10³ curies Noble Gases: 2.49 x 10³ curies
IET #4 Uranium Release. In addition to fission products, fuel damage to the 1.27% of core fuel was assumed to have released 100% of the damaged fuel or the equivalent of 52.0 grams of 93.4% enriched uranium with the following activities:
U-234: 3.30 x 10⁻² curies U-235: 1.05 x 10⁻³ curies U-238: 9.78 x 10⁻⁶ curies
IET #4 Argon Release. Based on a generation rate of 2.8 curies per MW-h, the power output of 644.6 MW-h during the first period produced/released 1,805 curies of Ar-41; for the second period, the power output of 2,162.8 MW-h produced/released 6,056 curies of Ar-41.
Table 3-7 below presents radionuclides-specific release data in behalf of the three operation periods as modeled by the HDE Task Group. All activities are normalized to a ten-minute decay time following their release from the reactor fuel.
3-19

ANP Source Terms July 2005
Table 3-7 Radionuclides Release Quantities Estimated by the Historical Dose Evaluation Task Group for Initial Engine Test #4
Nuclide Period #1 Period #2 Period #3 Nuclide Period #1 Period #2 Period #3
Ar-41 1.81E+03 6.06E+03 I-131 8.11E+00 2.57E+02 5.47E+02
Br-84 7.17E+01 3.83E+03 1.32E+03 I-132 1.70E+01 6.09E+02 8.57E+02
Kr-85m 2.06E+02 6.74E+03 9.94E+02 I-133 2.04E+02 6.56E+03 2.65E+03
Kr-87 7.74E+02 3.05E+04 3.84E+03 I-134 7.91E+02 3.44E+04 1.18E+04
Kr-88+D 1.07E+03 3.74E+04 4.98E+03 I-135 6.00E+02 1.98E+04 5.85E+03
Rb-89 3.87E+01 3.60E+03 4.78E+03 Xe-129m 4.68E-08 1.48E-06 1.13E-06
Sr-89 1.21E-01 3.35E+00 4.50E+02 Xe-135 2.72E+02 8.26E+03 1.96E+03
Sr-90+D 1.26E-04 3.99E-03 3.71E+00 Xe-135m 1.13E+02 4.33E+03 1.11E+03
Sr-91+D 9.30E-01 3.04E+01 4.30E+03 Xe-138 1.53E+02 1.57E+04 4.65E+03
Sr-92 1.03E+00 3.61E+01 8.33E+03 Cs-137+D 9.71E-04 3.08E-02 3.76E+00
Y-91 7.54E-04 1.90E-02 4.70E+02 Cs-138 6.16E+02 2.68E+04 1.03E+04
Y-92 5.66E-01 1.66E+01 5.32E+03 Ba-139 1.75E+01 6.41E+02 1.06E+04
Y-93 4.56E-01 1.48E+01 4.46E+03 Ba-140+D 4.54E-02 1.44E+00 1.13E+03
Zr-95+D 3.63E-03 1.15E-01 5.11E+02 Ba-141 2.50E-01 1.97E+01 5.45E+03
Zr-97 2.68E-01 8.64E+00 2.88E+03 Ba-142 3.14E-02 4.72E+00 3.25E+03
Nb-96 2.00E-05 6.41E-04 2.32E-01 La-141 8.92E-01 2.94E+01 7.41E+03
Mo-99 7.52E-02 2.39E+00 1.43E+03 La-142 1.09E+00 4.05E+01 9.57E+03
Ru-103 +D 2.88E-03 9.14E-02 3.48E+02 Ce-141 2.40E-03 6.58E-02 6.94E+02
Ru-105 1.31E-01 4.40E+00 1.23E+03 Ce-143 1.46E-01 4.64E+00 1.89E+03
Ru-106+D 4.09E-05 1.30E-03 7.16E+00 Ce-144+D 6.88E-04 2.18E-02 1.19E+02
Sb-129 8.55E-02 2.89E+00 8.11E+02 Pr-143 8.82E-04 2.40E-02 9.52E+02
Te-131 3.34E-01 1.61E+01 4.09E+03 Pr-144 6.86E-04 2.16E-02 1.19E+02
Te-131m 9.78E-03 3.09E-01 1.22E+02 U-234 3.30E-02
Te-132+D 4.62E-02 1.47E+00 9.89E+02 U-235 1.05E-03
Te-133m 3.81E-01 1.63E+01 4.20E+03 U-238 9.78E-06
Te-134 6.62E-01 3.12E+01 8.62E+03
3-20

ANP Source Terms July 2005
3.6 Critical Evaluation of the Historical Dose Evaluation Model and Summary Conclusions Regarding Initial Engine Test #4
For IET #4, effluent monitoring data are few, deficient, and confined to summary reports. For these reasons, release estimates by the HDE Task Group were modeled around the limited spot sampling data by (1) means of the operational history for IET #4, (2) correlating release quantities of particulates to plate temperatures (3) the assumption that plate temperature is a credible surrogate for reactor power levels, (4) the assumption that the release fractions of spot-sample-particulates to volatile halogens and noble gases correspond to ratios of 1:1000 and 1:2000, respectively, and (5) the RSAC-4 computer code.
In context with the quality of available data, it is SC&A’s opinion that the need for a modeling approach is justified. A comparison of release estimates that were derived by the HDE Task Group model to statements cited by Thornton et al. (1962b) suggests that the modeled HDE Task Group estimates for Periods #1 and #2 are consistent with empirical observations. For Period #3, however, estimates derived by the HDE Task Group appear too low.
Periods #1 and #2. Sections 3.5.1 and 3.5.2 described the HDE Task Group’s modeling approach for Periods #1 and #2. Common to both periods were empirical release rates taken during IET #4 for fission product particulates. Thus, for Period #1, which lasted 63.2 hours at an average power level of 10.2 MW, the empirical release rate of 26 Ci/hr was used to derive a total particulate release of 1,643 curies; for Period #2, the reactor operated for 128.74 hours with an average particulate release rate of 405 Ci/hr and yielding a total particulate release of 52,200 curies. In turn, the above-cited release quantities of particulates were scaled to the (1) inventories of fission products and (2) release fractions of halogens and noble gases that were assumed 1,000 and 2,000 times higher than for solids. On the basis of these assumptions, the HDE Task Group derived the following releases for Periods #1 and #2 of IET #4:
Period #1 Period #2 Solids 1,643 Ci 52,200 Ci Halogens 2,950 Ci 93,600 Ci Noble Gases 6,810 Ci 216,000 Ci
Total 11,403 Ci 361,800 Ci
Thus for Period #1, the estimated release of 1,643 Ci of particulates represented 14.4% of the total release of fission products; similarly, for Period #2, the estimated release of 52,200 Ci of particulates also represented 14.4% of the total quantity of fission products. In brief, the gaseous and volatile fission products can be assumed to represent 86% of the total release to the environment. The HDE Task Group value of 86% is in close agreement with observed values of about 90%, as cited by Thornton et al. (1962b) in the following statements:
The release of radioactivity in stack gas was further investigated by the introduction of smoke in the base of the stack. The increase in measured particulate activity amounted to over 1000 curies per hour, the highest level observed during this test series. When the smoke had dissipated, the measured
3-21
ANP Source Terms July 2005
activity decreased to an average level of 135 curies per hour, a typical value for the conditions. It was believed that the smoke may have absorbed the radioactive gases in a manner that affected the efficiency of the detecting equipment.
The stack gas was sampled periodically by passing a small amount through a millipore filter and occasionally through a liquid scrubber to remove iodine. At high fractional nuclear powers, over 90 percent of the activity passed through the filters (99.99 percent efficiencies were achieved for particles 0.3 microns or over in diameter).
. . . The radioactivity was emitted either as a gas or in the form of extremely small particles. The emission was relatively steady and continuous. There was no sudden onset of large-scale emission. . . . [Emphasis added.]
Period #3. As summarized in Section 3.5.3, the HDE Task Group defined Period #3 as the last day of operation when fuel damage assumedly occurred. By means of the RSAC-4 code and fuel burnup, the following reactor core fission product inventory was derived:
Solids: 4.18 x 10⁶ Ci Halogens: 4.34 x 10⁵ Ci Noble Gases: 5.50 x 10⁶ Ci
From photographic evidence documented during the disassembly of the reactor core, the HDE Task Group concluded the following (page 114, HDE Task Group Report):
Based on pictures of the fuel assemblies taken after the final period of operation, it was estimated that 1.27% of the core fuel and fission products were released to the environment. This quantity is equivalent to the release of 47.1% of one of the 37 fuel assemblies. [Emphasis added.]
Thus, the HDE Task Group derived release quantities by (1) multiplying the total reactor inventory of solids, halogens, and noble gases at the end of IET #4 operation by 0.0127 and (2) normalizing releases by a 10-minute decay value.
Imbedded in the HDE Task Group model is the assumption that, for Period #3, the release of all fission products resulted exclusively from the 1.27% of missing or unaccounted fuel. While this unconservative assumption may at best apply to uranium and a limited number of other refractory fission products, it cannot be assumed to apply to noble gases and the highly volatile radioiodines and other halogens. As was previously described, even microscopic imperfections in fuel cladding are frequently the cause of substantial releases of noble gases and halogens from nuclear fuel. In brief, for Period #3, the HDE Task Group model fails to account for releases from (1) damaged but accountable fuel and (2) fuel showing no photographic evidence of damage. Release estimates for damaged but residual fuel and “undamaged” fuel are presented below.
3-22

ANP Source Terms July 2005
Estimate of Damaged Fuel and Revised Releases
The following is a verbatim description of fuel damage provided by Thornton et al. (1962b), which suggests that in addition to missing fuel, there was a substantial amount of damaged fuel that remained within the reactor core or in its proximity (page 166-167):
At the conclusion of the IET No. 4 test series, the CTF was returned to the hot shop and the A2 core was removed. Inspection revealed that cartridges 4, 9, and 20 had become unlatched and had dropped several inches. Cartridge 33 fell completely out of the core and remained in the cocoon during the core removal operation. In addition, the tail assembly was missing from cartridge 9 and was not found until later.
Complete unloading of the fuel cartridges required 6 two-shift working days, It was not possible to strip cartridges 4, 9, and 20 on the tube-loading machine because the tail assembly had been pulled off the first two and was missing from the third. These three cartridges and cartridge 33, which was wedged tight in the liner, had to be stripped in the Radioactive Materials Laboratory.
Damage to the cartridges consisted mainly of rail dents with some quadrant dents and some broken rails. Cartridges 5, 20, and 24 were the three most severely damaged. Of these, cartridge 5 suffered the most damage; portions of rings were missing from eight stages, 11 through 18. Figure [3-2] shows the entire cartridge; Figure 3-3 shows a closeup of stage 18. Photos of other typical cartridges are shown in references 13 and 14. It was significant that the burnout appeared to result from high-temperature oxidation rather than from fusion as noted after IET No. 3 operation. Cartridge 24 displayed a heavily oxidized area on stage 15, as shown in Figure 3-4. Circumferential striations corresponding to the corrugations on the insulation sleeve were plainly visible. This indicated that insulation-sleeve collapse was still occurring. Cartridge 20 was heavily oxidized on stages 10 and 11, and small portions of the heavily oxidized area were gone. Figure 3-5 illustrates the damage to this cartridge. A number of cracks extended from the holes, indicating the brittleness of the heavily oxidized area. [Emphasis added.]
From the limited description at least six fuel cartridges experienced fuel loss and/or physical damage that was attributed to burnout from high temperature oxidation. A modestly conservative model (that accepts the HDE Task Group’s value of 1.27 of missing fuel) might further assume the following releases for the fission product inventory contained the six fuel cartridges representing 108 fuel stages:
Noble Gases: 100 % release for all 108 fuel stages
Halogens: (1) 100% for 8.46 stages of missing fuel; and
3-23

ANP Source Terms July 2005
(2) 50% for 99.54 damaged but accountable fuel stages Solids: (1) 100% for the 8.46 stages of mission fuel; and
(2) 10% for 99.54 damaged but accountable fuel stages.
Releases from Undamaged Fuel
If missing and damaged fuel represents 6 fuel cartridges or 108 fuel stages out of a total of 37 fuel cartridges and 666 fuel stages, we are left with 558 fuel stages that are assumed to have suffered no overt or visible damage. (It should be noted that the assumption of 558 undamaged fuel stages following IET #4 may not be true and may, therefore, not be considered conservative since (1) 24 fuel assemblies had been previously used during IET #3 and (2) none of the 37 fuel cartridges used in IET #4 were ever reused in subsequent IET test runs.)
For the 558 “undamaged” fuel stages, reasonable release fractions for fission products may assume the following:
Noble Gases: 5% Halogens: 1%
Solids: 0.1%
Table 3-8 provides a summary of the three types of reactor fuel, release fractions assumed for missing/damaged/undamaged fuel, and their equivalent percentages of total reactor inventories released to the environment.
Table 3-8 Summary Data Used to Revise Releases for Period #3 of Initial Engine Test #4
Percent Released from Equivalent Percent Released No. of Fuel Individual Fuel Stages from Total Rx Inventory
Fuel Status Noble Gases Solids Noble Gases Solids 8.46* Stages Halogens Halogens
Missing fuel* 100%* 100%* 100%* 1.27%* 1.27%* 1.27%* Damaged fuel 99.54 100% 50% 10% 14.94% 7.47% 1.49%Undamaged fuel 558 5% 1% 0.1% 4.19% 0.84% 0.084% Total 666 20.4% 9.58% 2.84%* Shaded portion of Table 3-8 represents assumptions by the HDE Task Group.
Inspection of Table 3-8 indicates that for the SC&A model, the largest contribution to source term releases was likely to have been from damaged but accountable fuel. For noble gases, halogens, and solids, our model suggests that up to 20.4%, 9.58%, and 2.84%, respectively, of the total reactor inventory escaped. These release values are 2 to 16 times higher than the single release value of 1.27% assumed by the HDE Task Group model for all fission products. Table 39 summarized radionuclide-specific releases for IET #4 that reflect SC&A’s revised release estimates for Period #3. Values are normalized to a 10-minute decay time.
3-24

ANP Source Terms July 2005
Table 3-9 Radionuclides Release Quantities Estimated by SC&A for Initial Engine Test #4
Nuclide Period #1 Period #2 Period #3 Nuclide Period #1 Period #2 Period #3
Ar-41 1.81E+03 6.06E+03 I-131 8.11E+00 2.57E+02 4.12E+03
Br-84 7.17E+01 3.83E+03 9.95E+03 I-132 1.70E+01 6.09E+02 6.46E+03
Kr-85m 2.06E+02 6.74E+03 1.60E+04 I-133 2.04E+02 6.56E+03 2.00E+04
Kr-87 7.74E+02 3.05E+04 6.17E+04 I-134 7.91E+02 3.44E+04 8.90E+04
Kr-88+D 1.07E+03 3.74E+04 8.00E+04 I-135 6.00E+02 1.98E+04 4.41E+04
Rb-89 3.87E+01 3.60E+03 1.07E+04 Xe-129m 4.68E-08 1.48E-06 1.81E-05
Sr-89 1.21E-01 3.35E+00 1.01E+03 Xe-135 2.72E+02 8.26E+03 3.15E+04
Sr-90+D 1.26E-04 3.99E-03 8.31E+00 Xe-135m 1.13E+02 4.33E+03 1.77E+04
Sr-91+D 9.30E-01 3.04E+01 9.63E+03 Xe-138 1.53E+02 1.57E+04 7.47E+04
Sr-92 1.03E+00 3.61E+01 1.86E+04 Cs-137+D 9.71E-04 3.08E-02 8.42E+00
Y-91 7.54E-04 1.90E-02 1.05E+03 Cs-138 6.16E+02 2.68E+04 2.31E+04
Y-92 5.66E-01 1.66E+01 1.19E+04 Ba-139 1.75E+01 6.41E+02 2.37E+04
Y-93 4.56E-01 1.48E+01 9.99E+03 Ba-140+D 4.54E-02 1.44E+00 2.53E+03
Zr-95+D 3.63E-03 1.15E-01 1.14E+03 Ba-141 2.50E-01 1.97E+01 1.22E+04
Zr-97 2.68E-01 8.64E+00 6.45E+03 Ba-142 3.14E-02 4.72E+00 7.28E+03
Nb-96 2.00E-05 6.41E-04 5.19E-01 La-141 8.92E-01 2.94E+01 1.66E+04
Mo-99 7.52E-02 2.39E+00 3.20E+03 La-142 1.09E+00 4.05E+01 2.14E+04
Ru-103 +D 2.88E-03 9.14E-02 7.79E+02 Ce-141 2.40E-03 6.58E-02 1.55E+03
Ru-105 1.31E-01 4.40E+00 2.76E+03 Ce-143 1.46E-01 4.64E+00 4.23E+03
Ru-106+D 4.09E-05 1.30E-03 1.60E+01 Ce-144+D 6.88E-04 2.18E-02 2.66E+02
Sb-129 8.55E-02 2.89E+00 1.82E+03 Pr-143 8.82E-04 2.40E-02 2.13E+03
Te-131 3.34E-01 1.61E+01 9.16E+03 Pr-144 6.86E-04 2.16E-02 2.66E+02
Te-131m 9.78E-03 3.09E-01 2.73E+02 U-234 7.39E-02
Te-132+D 4.62E-02 1.47E+00 2.21E+03 U-235 2.35E-03
Te-133m 3.81E-01 1.63E+01 9.40E+03 U-238 2.19E-05
Te-134 6.62E-01 3.12E+01 1.93E+04
Uncertainty Regarding IET #4 Source Terms
Although 13 damaged fuel cartridges had been replaced for IET #4, the physical design of HTRE No. 1 remained essentially the same. A key difference between IET #3 and IET #4 was its operating history that was marked by higher power levels and higher fuel burnup. Like IET #3, post-operational inspection showed several fuel cartridges that were severely damaged.
3-25

ANP Source Terms July 2005
Effluent monitoring during IET #4 was similar to IET #3 and therefore suffered the same deficiencies. Unlike the IET #3 model, which based release quantities on the amount of damaged fuel, the HDE Task Group release model for IET #4 was principally based on the very limited spot sampling data and its correlation to fuel plate temperature(s) as a surrogate for reactor power levels for two timeframes designated as Period #1 and Period #2 (see Figure 3-6).
Period #3 of IET #4 was characterized by substantial fuel failure as evidenced by post-operational inspection of the A-2 reactor core. Core damage consisted of not only fuel that was missing (and unaccounted) but also included fuel that was burned, heavily oxidized, cracked, embrittled, and fragmented. On the basis of photographic evidence, the HDE Task Group concluded that about 1.27% of the fuel along with its inventory of fission products was the sole source term for environmental releases for Period #3.
The potential sources for uncertainty for Periods #1 and #2 are numerous but are difficult to quantify. For example, Figure 3-6 identifies particulate release quantities for fuel plate temperatures up to about 1,600EF, above which the relationship between particulate release rates and fuel plate temperatures were assumed to remain log-linear. The potential vulnerability for this assumption would clearly express itself at temperatures that induce microscopic to macroscopic cladding/fuel damage, as was observed among select fuel cartridges during the final phase of IET #4. Under conditions of even modestly breached fuel, significant deviations from the assumed relationship shown in Figure 3-6 would be expected and result in higher release rates.
For Periods #1 and #2, any potential source of error (leading to low release estimates) is likely to be offset by the higher fission product buildup (i.e., higher fission product inventory) going into the final phase or Period #3 of IET #4. In brief, errors leading to either lower or higher than actual releases for Periods #1 and #2 are largely offset by higher and lower fission product inventories defined for the final operating phase or Period #3 of IET #4.
Thus, the largest contribution to the uncertainty of releases for IET #4 centers around Period #3. The HDE Task Group’s model assumption that only the fission product inventory contained in the missing 1.27% of fuel as a source term is clearly a lower-bound and unreasonable assumption.
SC&A’s model included releases from (1) damaged but accountable fuel and (2) fuel that showed no obvious physical damage. The uncertainty of fission product releases associated with these two additional source terms is principally linked to their quantity and to the assigned values of the release fractions for noble gases, halogens, and solids. In view of the limited available data for IET #4 and historical data pertaining to release fractions from ANP fuel elements, SC&A’s model parameters and resultant estimates of releases may be viewed as ranging from best estimate(s) to upper-bound/90th percentile values.
3-26
ANP Source Terms July 2005
4.0 INITIAL ENGINE TEST #10
4.1 Relevant Background Data
For Initial Engine Tests (IETs) #1 through #6, Heat Transfer Reactor Experiment (HTRE) No. 1 had been employed. The status of reactor development achieved in HTRE No. 1, if applied to a prototype aircraft propulsion system, would have made possible the flight of a load-carrying aircraft a distance of approximately 50,000 miles at intermediate subsonic speeds without refueling or touching down. Although this exceeded the range of equivalent chemically powered aircraft by a large factor, military application studies indicated that both higher performance levels and longer endurance were desirable.
Therefore, a materials and component development effort was directed to test a number of moderator and fuel element materials of potentially greater temperature and/or life capability. The only available test facility at the time, however, was the material test reactor (MTR) at INEL.1 Due to the small size of the test hole in the MTR, test assemblies of sufficient size could not be tested. Therefore, it was decided that a reactor core similar to the HTRE No. 1 be redesigned with a test hole in the center for use at the General Electric (GE)-Aircraft Nuclear Propulsion (ANP) Core Test Facility (CTF). This modified core was designated HTRE No. 2. Two identical assemblies were fabricated and designated the D101-B1 and D101-B2, with each consisting of a complete reactor core, fuel elements, shield plug, control rods, and actuators (Blake 1962).
4.1.1 General Description of the Heat Transfer Reactor Experiment No. 2
The HTRE No. 2 is essentially the HTRE No. 1 but redesigned with the center seven tubes replaced by a hexagonal test hole and the 4-inch beryllium reflector replaced with an 8-inch thick beryllium reflector. This portion of the reactor is designated the Aparent core.@ Figure 4-1 shows the hexagonal cavity that was created by the removal of the seven fuel cartridges in the center of the reactor core. The remaining 30 fuel cartridges in HTRE No. 2 were identical in design with those constructed for use in HTRE No. 1, and a description of the parent fuel cartridges will, therefore, not be repeated.
The focus on test materials using the HTRE No. 2 centered largely around ceramic fuel inserts. Earlier studies had shown that, in addition to their high temperature tolerance, ceramics also served as good neutron moderators since they were relatively light elements with low neutron cross sections. The first ceramic insert in the HTRE No. 2 was designated Insert 2-B, and its test purpose was to evaluate the use of ceramic (BeO as fuel carrier and moderator) as core components adaptable to nuclear propulsion of aircraft.
1 In this report, we refer to the site by its historical name at the time the releases of concern to this report occurred, rather than its current name, which is the Idaho National Engineering and Environmental Laboratory (INEEL).
4-1

ANP Source Terms July 2005
Figure 4-1 Heat Transfer Reactor Experiment No. 2 Top Tube Sheet Showing the Hexagonal Test Hole and the Remaining 30 Fuel Cartridges
4-2

ANP Source Terms July 2005
4.1.2 Physical Design of Insert 2-B
The Insert 2-B was designed to fit into the hexagonal test hole of the HTRE No. 2 parent core and measured 10.75 inches across flats with an overall length of 45.35 inches (see Figure 4-2 for a cross-sectional view). The active portion of the insert was 30 inches long with 7.5 inches of reflector at each end (BeO unfueled tubes). The hexagonal shape of the insert was divided into six triangular sections or cells. Each cell contained a bundle of beryllium oxide fuel tubes and was bounded by beryllium oxide moderator slabs (see Figure 4-3 for photographs of fueled tubes). The fueled tubes have an inside diameter (ID) of 0.2 inches and an outside diameter (OD) of 0.28 inches, with a length of 3.75 inches. Moderator slabs had a nominal thickness of 0.75 inches and were grooved to aid heat removal on the inside surface (Figure 4-4). Each triangular cell of the insert was divided longitudinally into 11 layers, each layer being defined by the length of the moderator slab, which was 4.1 inches long (Blake 1961, Flagella 1960).
Figure 4-5 shows a completely stacked insert. The active portion of the insert was made up of 8 banks of 3.75-inch fueled tubes, which were stacked one on top of the other to form a continuous air passage. Each triangular bank contained 120 uncoated beryllium oxide (BeO) fueled tubes for a total of 960 fueled tubes in the triangular cell or a total of 5,760 in the insert. The unfueled BeO tubes would stack on the fueled tubes at both ends of the active region for a total of 480 in each cell and 2,880 in the insert. The entire insert was separated from the parent core by 16 mils of stainless steel clad thermoflex insulation to reduce heat losses from the outer insert BeO slabs.
The fueled tubes are composed of three materials—BeO, UO2, and Y2O3—and were formed in an extrusion process and fired at 3,000EF. The exact composition of the tubes was by weight 85% BeO, 6% UO2, and 9% Y O . The total amount of uranium (enriched to 93.4%) in the 2 3 insert was 2,124 grams. The Y2O3 was added to the mixture to stabilize the UO2 against loss. The tubes are cut to length before firing, such that shrinkage during firing reduced the length to the specified 3.75 inches (Muehlenkamp 1962).
The Insert 2-B test was the first in a series of ceramic HTRE No. 2-type tests, and it is important to note that at that time, little was known of the operational characteristics of ceramic material. Insert 2-B was therefore used as sort of a probe to provide information necessary for a thorough evaluation of ceramic-fueled material for ANP reactors that were operated at higher temperatures.
4-3

A
4-
NP Source Terms July 2005
4
Tubes
Figure 4-2 Insert #2-B Cross Section
Figure 4-3 Insert #2-B Fueled Beryllium Oxide

ANP Source Terms July 2005
4-5
Figure 4-4 Insert #2-B Moderator Slabs

ANP Source Terms July 2005
4-6
Figure 4-5 Completely Stacked Insert 2-B

A Thus, the primary objectives for IET #10 were twofold: (1) operate the HTRE No. 2 reactor system at power and air flows sufficient to produce a maximum Insert 2-B fuel element temperature of 2,750EF and (2) in a post-operational examination, evaluate the Insert 2-B materials for mechanical stability. The following is a list of the design specifications:
Maximum insert fuel tube temperature 2,750EF Maximum insert exit air temperature 2,300EF Moderator slab temperature 2,000 to 2,600EF Support Rod temperature - nominal 1,200EF - max. 1,600EF Fuel tube uranium concentration by weight 6%
In a series of tests with HTRE No. 2 and Insert 2-B, it was established that the insert, which had replaced 7 out of 37 fuel cartridges, only produced about 10% of the HTRE No. 2 power generation. Figure 4-6 shows that the relative power density of the insert was about one-half that of the parent core, and Figure 4-7 shows the relative longitudinal power distribution of Insert 2-B, which reached its maximum value near the vertical centerline of the stacked fuel tubes (Blake et al. 1961). Other thermodynamic data for IET #10 are cited in several reports. The most comprehensive discussion is contained in the report by Foster et al. 1958 (Power Testing Results from D101 D2 Core (IET #10), July 3, 1958, XDCL 58-7-715). Other reports that provide design specifications and operational data include the following:
• HTRE No. 2 Insert-2 Design Data, January 2 1958, DC 58-1-62.
• Summary of Ceramic Fuel Element Tests in the HTRE #2, December 2, 1960, DC-60-12-36.
• Heat Transfer Reactor Experiment, Comprehensive Technical Report, May 25,
1962, APEX-905.
4-
NP Source Terms July 2005
7

ANP Source Terms July 2005
4-8
Figure 4-6 Insert 2-B, Relative Power Density Versus Core Radius

ANP Source Terms July 2005
4-9
dinal Power DiFig 4-7 ative Lon ution for rt 2-Bure Rel gitu strib Inse

ANP Source Terms July 2005
4-10
4.1.3 Operational History of Initial Engine Test #10 Initial Engine Test #10 commenced on December 12, 1957, and was terminated on March 6, 1958, following an endurance test run of 100 hours at insert temperatures of 2,750EF and higher, as recorded on the three highest ceramic fuel tube thermocouples. As stated in the introduction of the Foster report (Foster et al. 1958, pages 8 through 14), the operation of IET #10 can be divided into three phases designated as Phase I, Phase II, and Phase III, which are briefly described below and summarized in Table 4-1.
• Phase I. Phase I of IET #10 began with low power operation on December 20, 1957, at 1.2 kW, which yielded a fission product release rate at the top of the stack of 0.5 Ci/hr to 0.9 Ci/hr. With increasing power levels, the release rate increased linearly to 176 Ci/hr at a power level of 240 kW.
As the test proceeded to higher power levels, thermocouple data revealed that the desired ceramic fuel insert temperature of 2,750EF could not be obtained without grossly exceeding the maximum allowable parent fuel core temperature of 1,750EF. To obtain the desired fuel insert to fuel core temperatures, a change in control rod positions and reduction in engine speed (with concurrent reduction in air flow) was employed. However, these operational changes proved inadequate. At an insert temperature of only 1,980EF and core temperature of 1,668EF, a filter-paper spot sample at the 80-foot stack level showed a particulate release rate of 2,630 Ci/hr. In order to raise the insert temperature to 2,750EF, the CTF was returned to the Hot Shop on January 16, 1958, in order to plug 108 out of the 162 air passage holes through the insert. Inspection of the insert showed only a Ahairline crack@ in the lower support plate. During Phase I, the reactor power level had been increased stepwise from 1.2 kW to 12.2 MW.
• Phase II. With 108 plugged air holes in the insert, the CTF was returned to the test site on January 17, 1958, and power testing resumed on January 19. During test run #25, the maximum parent core temperature of 1,750EF was reached but resulted in an insert temperature of 2,550EF (or 200EF below the desired temperature of 2,750EF).
Although it was apparent that the desired maximum insert temperature could not be attained without exceeding the 1,750EF allowable parent core temperature, test engineers decided to accrue 25 hours of power operation at 16 MW and at the 1,750EF parent core fuel temperature.

ANP Source Terms July 2005
4-11
Upon completion of the 25-hour endurance operation, the CTF was again returned to the Hot Shop for the purpose of plugging an additional 36 of the remaining 54 holes in the upper orifice plate of Insert 2-B. Approximately 550 MW-hours of power operation were accumulated during Phase II of IET #10.
• Phase III. The CTF was returned to the test site on February 4. Power testing
was resumed on February 8 with run #37. During run #38, reactor power was increased until a temperature of approximately 2,750EF was reached for the ceramic insert with a corresponding parent core temperature of 1,535EF.
A total of 100.25 hours was accumulated at these test conditions between February 9 and March 6, 1958. During this period, run #48 was the longest test run at 30.88 hours. The CTF was returned to the Hot Shop on March 7, 1958, for the removal and examination of the ceramic test insert.
4.2 Early Estimates of Radioactive Releases The scope of effluent monitoring during IET #10 increased significantly relative to previous IETs. Sampling was conducted at various points of the reactor loop and its exhaust system (Figure 4-8). These included the use of chilled activated carbon traps, paper filters for spot sampling as well as for a continuous stack monitor, and the Jordan air ionization duct monitor (Smith and Koeppen 1982). Due to the fact that radioiodines represented the limiting radionuclides, charcoal filters were employed at three discreet sampling locations. The first location involved six sampling probes located at the exit of ceramic Insert 2-B, which discharged the exhaust gas to six charcoal filters housed in a refrigerated cooler box. Data from these traps would, therefore, assess releases directly from the ceramic insert. At points downstream of the explosion port in the main exhaust duct, other sampling probes were installed that directed the exhaust gas sample through a carbon trap. A final sampling location was at the 80-foot level in the exhaust stack where a probe directed the effluent to a chilled carbon trap located in the vault at the base on the stack. After each set of samples was collected, samples were taken to INEL=s Radiochemistry Laboratory. From analyses performed on increments of carbon taken at successive depths, it was demonstrated that at least 90% of the iodines were trapped in the first 5 inches of carbon. Thus, during the IET #10 tests, the first 5 inches of carbon were removed from each trap, thoroughly mixed, and aliquots from the mixture were used for analysis.

ANP Source Terms July 2005
4-12
Table 4-1 Operational Summary of Initial Engine Test Runs
Run
Number Da StaTim
StoTim
Insert Fissio
Rate (fissions/min)
Operating Tim
(hrs
Cumulative
Operating Time(hrs)
has
5
19
12
11
142
2.80 x 10
2.9
2.92
9
12/
1022
1034
3.11 x 10
.20 3.12
12
11
141
3.11 x 10
3.1 6.22
11 12
11
1242 1
12 191
150
5.45 x 10
.98
8.22
13
1
13
145
6.15 x 10 1.73 9.95
15
1/
11
130
9.86 x 10 1.4 11.42
17
1
12
142
3.26 x 10 1.4 12.89
19
1
13
145
8.70 x 10 1.8 14.74
20
1
15 1715 1
21
1
152
1.71 x 10 1.7 17.99
hase I
24
1
13
1633
3
25 1
194
6.15 9.65
26 1
12
194
1.93 x 10
7.5
28 1
12
191
2.10 x 10
7.0
29 1/26 1200 1454 2.07 x 10¹⁸
2.90
27.10
32
1/29
1600
1/30 0047
Phase III:
37 2/8 1408 1539 1.36 x 10† 1
te
rt e*
p e
n
e )
P e I: 57/20
30 5
14
2
26 15
/26 05 1 15
0
/30 41 2.12 x 10¹⁶
.02
7.24
58/4
1409
8
16
/5 07 1 16
7 38 6 16
7
/10 57 5 17
7
/12 03 4 17
5
/13 46
1.14 x 10¹⁸
.48
16.22
/14 1334 0 18
7
P I: /19
03 1.23 x 10¹⁸
.50
3.50
/21 1236
5
1.70 x 10¹⁸
/22 13 6
18
5
17.20
/25 13 3 18
0
24.20
2.13 x 10¹⁸
8.79
35.89
8
38
2/9
1308
1930
1.75 x 10¹⁸
6.37
6.37
40
2/13
1550
1813
1.74 x 10¹⁸
2.38
8.75
42‡
2/15
1325
1339
1.57 x 10¹⁸
43§
2/16
1344
1459
1.71 x 10¹⁸
45
2/19
1838
1950
1.63 x 10¹⁸
1.20
9.95

ANP Source Terms July 2005
4-13
Insert Fission Cu
Table 4-1 Operational Summary of IET Test Runs (continued)
Run
Number Date Start Time*
Stop Time Rate
(fissions/min)
Operating Time (hrs)
mulative
Operating Time (hrs)
46
2/20
1629
1952
1.64 x 10¹⁸
3.38
13.33
47
2/22
1026
1121
1.72 x 10¹⁸
.92
14.25
2/22
1244
1930
1.75 x 10¹⁸
6.77
21.02
48
2/23
1020
1140
1.76 x 10¹⁸
1.33
22.35
2/23
1828
2/25
0121
1.86 x 10¹⁸
30.88
53.23
49
2/25
1057
2320
1.67 x 10¹⁸
12.39
65.62
52
3/1
2015
2239
1.76 x 10¹⁸
2.40
68.02
53
3/2
1003
1933
1.78 x 10¹⁸
9.50
77.52
54
3/3
1822
2050
1.79 x 10¹⁸
2.47
79.99
55
3/1
2002
3/5
0158
1.79 x 10¹⁸
5.93
85.92
56
3/5
1058
1245
1.80 x 10¹⁸
1.78
87.70
3/5
1336
3/5
0235
12.99
100.69
57¶
3/6
1852
1927
1.55 x 10¹⁸
.58
3/6
2005
2039
1.71 x 10¹⁸
.57
* Start and stop times listed for Phase I and II testing are the beginning and end of actual operating time above 1% linear flux and, in some cases, include a fairly complex power history. Times listed for Phase III testing are beginning and ending times of steady state operation only.
† Maximum temperature approximately 2,500EF. ‡ Maximum temperature approximately 2,550EF. § Traps collected at approximately 2,500EF. Temperature of 2,770EF attained during last 10 minutes of run. ¶ Two steady state power levels, both below design temperature.

ANP Source Terms July 2005
4-14
Figure 4-8 Sampling Locations from the Exhaust Duct and Stack
ANP Source Terms July 2005
4-15
Phase I. During the first few runs of Phase I testing, the only carbon traps that accumulated sufficient activity to permit analysis were the insert traps located at the exit of ceramic Insert 2-B. With run #12 and successive power increases, the vault and hot duct carbon traps accumulated sufficient activity for effluent data analysis. Phase II. Phase II consisted of test runs #24 through #32. For the 25 hours of endurance testing that principally define Phase II, the Ainsert traps@ (which directed air from the air holes of Insert 2-B) collected so much activity that they could not be handled safely in the Radiochemistry Laboratory. Thus, the carbon traps that specifically sampled effluent air from Insert 2-B were not analyzed in Phase II (and in Phase III), when the vast majority of releases occurred. A comparison between carbon trap sample data from hot duct traps versus the 80-foot vault traps demonstrated that the vault carbon traps were providing the most consistent and reliable results. Phase III. Although Phase III was dominated by the 100 hours of operation during which the Insert 2-B temperature was expected to operate at approximately 2,750EF, there were several test runs during which the insert was operated at lower temperatures (test runs #37, #42, #43, #55, #56, and #57). Among the reports that provide summary effluent data in behalf of IET #10, Foster et al.(1958) provides by far the most detailed sampling data. Among the most relevant data cited by Foster et al. (1958) are two tables that provide information from carbon traps that sampled effluent gases within the 76-inch-diameter hot duct and vault traps that sampled effluents at the 80-foot stack level. As a convenience to the reader, these two tables are reproduced in full as Tables 4-2 and 4-3.
Sampling Results
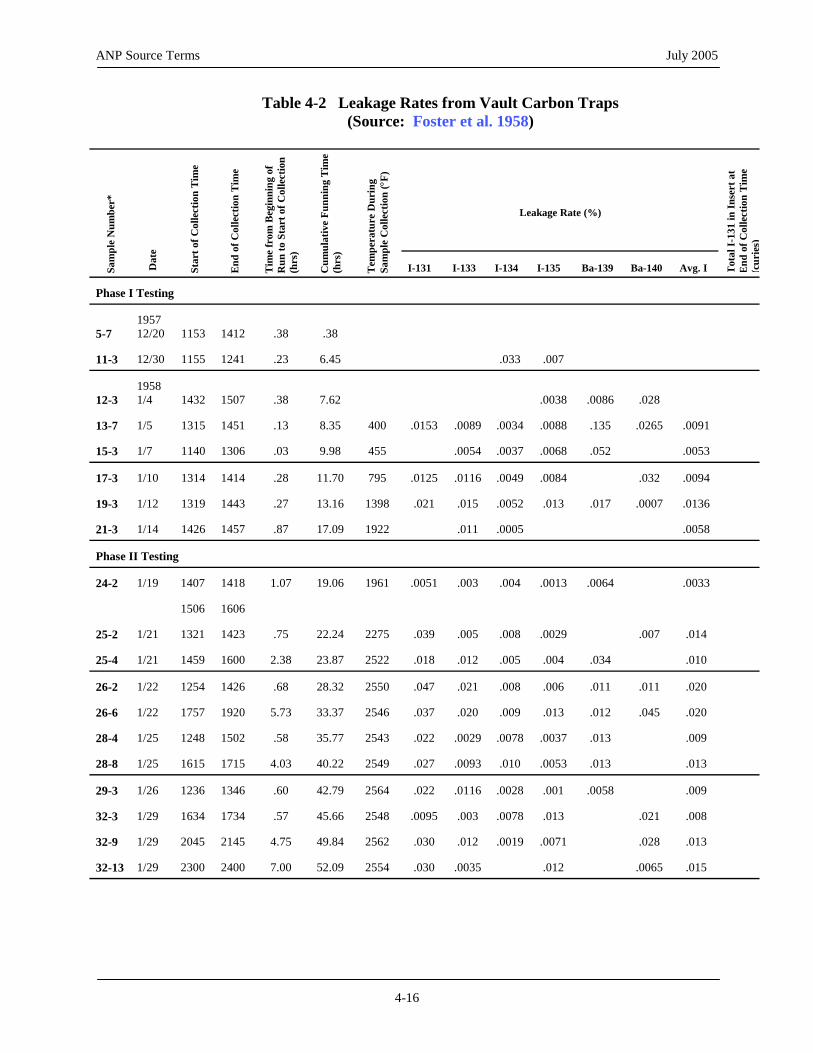
ANP Source Terms July 2005
4-16
Table 4-2 Leakage Rates from Vault Carbon Traps
Leakage Rate (%)
Sam
ple
Num
ber*
Dat
e
Star
t of C
olle
ctio
n Ti
me
End
of C
olle
ctio
n T
ime
Run
to S
tart
of C
olle
ctio
n (h
rs)
Cum
ulat
ive
Funn
ing
Tim
e (h
rs)
Tem
pera
ture
Dur
ing
Sam
ple
Col
lect
io
I-131 I-13 I-13 I-13 Ba-1 Ba-1 Avg. Tot
al I-
131
in In
sert
at
hase I Testing P
5-7
1153
1412
.38
.38
11-3
1155
1241
.23
6.45
.033
.00
2-3 1958
1432
07 15
.38
7.62
.00 .0086
.028
3-7 1 /5
1315
1
451
.13 8.35
400
.015
.008
.003
.008
.13
.02
.00 1
5-3 1 /7 1140 1306
.03
9.98
455
.005
.0
.006
.00 3
7-3 1
1314 1414 .28
11.70
795
.0125
.01
.00
.00
.032
.00 4
9-3 1
1319
14
43 .27 13.16
1398
.021
.015
.00
.013
.017
.0007
.01 6
1-3 2 /14 1426 1457
.87
17.09
1922
.01
.000
.00 8
hasP
4-2 2
407 1 1418
19.06
1961
.0051
.003
.004
.00
.0064
.00 3
506 1 1606
5-2 2
321 1 1423 .75
22.24
2275
.039
.005
.008
.00
.007
.014
5-4 2
459 1 1600 2.38
23.87
2522
.018
.012
.005
.004
.034
.010
6-2 2
254 1 1426 .68
28.32
2550
.047
.021
.008
.006
.011
.011
.020
6-6 2
757 1 1920 5.73
33.37
2546
.037
.020
.009
.013
.012
.045
.020
8-4 2
248 1 1502 .58
35.77
2543
.022
.00
.00
.00
.013
.009
8-8 2
615 1 1715 4.03
40.22
2549
.027
.00
.010
.00
.013
.013
9-3 2
236 1 1346 .60
42.79
2564
.022
.01
.00
.001
.0058
.009
2-3 3
634 1 1734 .57
45.66
2548
.0095
.003
.00
.013
.021
.008
2-9 3
045 2 2145 4.75
49.84
2562
.030
.012
.00
.00
.028
.013
32-13
7.00
52.09
2554
.030
.0035
.012
.0065
.015
(Source: Foster et al. 1958)
Tim
e fr
om B
egin
ning
of
n (°
F)
3 4 5 39 40 I End
of C
olle
ctio
n Ti
me
(cur
ies)
1957 12/20
12/30 7 11/4 38
1 3 9 4 8 5 65 9 1 4 037 8 .052 5 1/10
16 49 84 9
1/12
52 3
1 1 5 5
e II Testing
1/19
1.07 13 3
1/21
29
1/21
1/22
1/22
1/25
29 78 37
1/25
93 53
1/26
16 28
1/29
78
1/29
19 71
1/29 2300
2400

ANP Source Terms July 2005
4-17
Table 4-2 Leakage Rates from Vault Carbon Traps (continu
kage Rate (%)
Sam
ple
Num
ber*
D to S
tart
of C
olle
ctio
n (h
rs)
(hrs
)
Tem
p
I- 1 I- 3 I- 4 I- 5 B 139 B 140 A . I Tot
Phase Testi 37-3† /8 11 15 45 .33 2 9 .0 9 .0 8 .0 2 .0 3 4 4 1 38-3 /9 10 38 3 3 2 0 .1 4 .0 5 .0 3 .0 9 . 4 9 9 1 0 38-5 /9 42 42 0 60
2 3
.0 1
.0 7
.0 6
.0 9
. 5 0 1
1 0
40-7 /13 12 15 37 74 2 1 .0 3 .0 .0 5 .0 4 7 9 4 1270 42-11 /15 32 38 2 75 2 2 .0 0 .0 .0 6 .0 3 4 0 3 43-6† /16 46 16 3 75 2 2 .0 7 .0 4 .0 8 2 9 45-13 /19 16 46 3 38
2 9
.0 8
.0
.0 3
.0 6
5 9
1 0
46-2 /20 33 10 7 .02 2 6 .1 9 .0 .0 3 .0 7 6 0 6 1 0 47-2 /22 34 23 3 .46 2 6 .0 9 .0 .1 0 .0 7 1 1 7 1 0 47-9 /22 15 35 82 .07 2 6 .0 5 .0 .0 7 6 1 0 48-2 /23 23 23 5 .07
2 8
.0
48-15 /23 42 42 23 .58 2 2 .1 8 .0 .0 3 .0 5 8 9 4 1 0 48-19 /23 45 45 .28 .63 2 6 .1 7 .0 .0 6 .0 3 3 3 9 2100 48-30 /24 57 57 .49 .84 2 7 .1 4 .1 .0 9 .0 6 0 0 4 2350 48-40 /24 32 02 5
.0 4
.0 5
9 2
48-49 /24 24 54 0
.0 5
.0 2
2 8
77
2752
.145
.063
.044
.036 48-55 2/24 1553 1623 21.42 43.
4
ed)
Lea
ate
Star
t of C
olle
ctio
n Ti
me
End
of C
olle
ctio
n T
ime
Tim
e fr
om B
egin
ning
of R
un
Cum
ulat
ive
Funn
ing
Tim
e
erat
ure
Dur
ing
Sam
ple
Col
lect
ion
(°F)
13 13 13 13 a- a- vg
al I-
131
in In
sert
at E
nd o
f C
olle
ctio
n Ti
me
(cur
ies)
III ng 2
14
15
1.
55
50
2
04
07
03
.01
.02
.01
2
13
14
.0
.0
73
2
25
37
07
016
.11
.04
20
2
14
15
1.6
1. 73 9 22 43 05 034
.09
.04 26
2
16
17
.
6.
74
8
32
5
06
.01
.14
.04
† 2
13
13
.1
8.
55
3
14
06
01
.02
.19
.01
2
13
14
.0
8.
50
49
04
01
.07
.01
2
19
19
.6
9. 74 2 17 2 4
.05
.02 06
2
16
17
.0
10
76
0
27
4
0
.05
.08
.04
07
2
10
11
.1
13
76
43
15
3
2
.03
.03
.04
23
2
15
16
4.
19
73
7
17
1
.03
56
2
10
11
.0
21 71 94
.014
.044
.010
.017
.190
.040
1620
2
18
19
.
22
73
2
60
5
15
.01
.13
.06
86
2
22
23
4
26
74
6
60
6
2
.02
.14
.08
2
02
03
8
30
73
5
00
6
2
.02
.16
.07
2
06
07
12.07
34.42
2741
.11 48
.07 2 .01
.16
.069
2580
2
11
11
16.94
39.29
2741
.16 61
.08 2 .01
.24
.074
2890
.018
.180
.078
3160
8-62 2/24 1934 2004 25.11 47.46 2742
.226
.080
.129
.045
.043
.284
.130
3410
48-68
2/25
0025
0055
29.96
51.61
2760
.351
.119
.172
.066
.026
.279
.229
3730
49-12
2/25
1146
1216
.82
54.05
2790
.485
.211
.145
.045
.026
.308
.219
3930
49-20
2/25
1557
1627
5.00
58.23
2760
.309
.146
.066
.027
.027
.223
.137
4200
49-27
2/25
2014
2042
9.29
62.52
2740
.245
.110
.32
.022
.026
.238
.103
4400

ANP Source Terms July 2005
4-18
le 4-2 Leakage Rates from Vault Carbon Traps (continu
Sam
ple
Num
b
Star
t of C
olle
ctio
n Ti
m
End
of C
olle
ctio
n T
im
Tim
e fr
om B
egin
ning
of R
to S
tart
of C
olle
ctio
C (hrs
)
Tem
pera
tu°F
)
-1 3/2 10 10
.2
22 68 49 1 . .15 .028 .142 .360 .182
3-22 3/2
31 3/2 1913
193
9.17
.0 .036 .2 .354
1830
1900
.044
1 3/4 1835 1905 -
.008
1924
1954
.011
2010
2040
.041
13 3/4-5
2350
0020
.026
3/5 1140
.039
8 3/5
1516
1546
1.67 89.37
.241
.054
.064
342
13 3/5
1900
1930
5.40 93.10
.384 .229
.068
.080
.760
.472
20 3/5
2300
2330
9.40 97.10
1.164
.349 .196
.083
.006
.566
.448
25 3/6 014 021 12.1 99 85 2740
333 .5 6 .28 .125 .093 .574
30 3/6
0320
1
.077
32
†
3/6
0336
0406
14.
100.69 .178 .045
.085
.0124
.285
1854
1924
.023
3 3/6 2010 2039
.072 .026 .460 The fi st num r of the ample um
eber i the run umber, i.e., 32-9 is a samp e from ru 32.
Traps ollect at belo design pera res.
Tab ed)
Leakage Rate (%) er*
Dat
e
e e
un
n (h
rs)
umul
ativ
e Fu
nnin
g T
ime
re D
urin
g Sa
mpl
e C
olle
ctio
n (
I-131 I-133 I-134 I-135 Ba-139 Ba-140 Avg. I Tot
al I-
131
in In
sert
at E
nd o
f C
olle
ctio
n Ti
me
(cur
ies)
53
15
45 0 .
27
.44
108
0
3690
5
1439
1509
4.60
72.62
2695
.343
.171
.168
.036
.028
.187
.180
3970
53-
4
77.19
2736 .544
.746
.108
19
60
4200
54-11 3/3
.13
77.65
2730 .284
.097
.230
.063
.040
.164
4080
55- †
1.45
79.99
2319 .318
.027
.006
.016
.234
.090
55-5† 3/4
-.63
79.99
2523 .544
.036
.029
.029
.441
.155
55-7
3/4
.13
80.12
2772 1.01
.272
.252
.102
.571
.394
4090
55-
3.80
83.79
2758 .617
.428
.161
.049
.322
.308
4250
56-2 1110
.20
86.12
2696 .777
.176
.234
.112
.569
.307
4330
56-
2723 .827
.243
.592
4520
56-
2709 1.21
4740
56-
2698
4950
56- 5 5
5
. 1.
5 1 1.018
5120
56- † 0250 3.24
100.69
2543 .856
.046 .081
.028
.490 .265
56- †
00
2270
.832
.517
57-1 3/6
.820
.005 .016
.353
57- †
.780
.034
* r be s n s n l n† c ed w t m tu

ANP Source Terms July 2005
4-19
Table 4-3 Leakage Rates from Hot Duct Carbon Traps Sa
mp
Dat
e
Star
t of C
olle
ctio
n T
ime
End
of C
olle
ctio
n T
ime
Tim
e fr
om B
egin
ning
of R
un
to S
tart
of C
olle
cti o
n (h
rs)
Cum
(hrs
) ulat
ive
Funn
ing
Tim
e
Tem
pera
ture
Dur
ing
Sam
ple
Col
lect
ion
(°F)
I-131 I-133 I-134 I-135 a- Ba-14 Avg. I Phase I Testin
6 1
5-957
1308
2 13
1410
-10 9 2/26
124 1 1217
28 12
1315
†
325 1 1411†
1-4 1 2/30
150 1
1242
1 958
2-4 1
33 14
1509
.40
.0008
.0065
.0036
3-8
11 /5
313 1 1445
.10
8.32
400
.0054
.0058
.001
.0049
.017
.0043
9-4 1 /12
332 1
1447
.48
13.37
1398 .
0025
.0007
.0003
.001
.016
.011
.0013
1-4 2 /14
446 1
1503
1.20
17.42
1922
.0034
.002
.012
.0059
hase P Testi g
-3 24
07 14
1421
1.07
19.06
1961 .0021
.0008
.0024
.0012
.0067
.0016
06 15
1610
5-3
12 /21
329 1 1424
0.88
22.37
2275
.
0072
.0020
.000
.0008
.009
.0027
5-4
1/21 2
00 15
1606
2.4
23.89
2522 .0083
.0045
.003
.002
.0045
6-3
12 /22
231 1 1435
.30
27.94
2550 .020
.017
.004
.0185
-5
26
40 14
1740
2.45
30.09
2550 .051
.028
.011
.009
.007 .025
8-5
12 /25
315 1
1519
1.03
36.22
2543
.017
.0023
.002
.001
.008
.0057
8-9
1/25 2
05 16
1727
3.87
39.06
2549
.011
.0037
.0028
.0024
.010
.0050
29-4
1/26
1240 1354
.67
42.86
2564 .042
.0113
.002
.000
.005
.0139
(Source: Foster et al. 1958)
Leakage Rate (%)
le N
umbe
r*
B 139 0
g
12/20 1215
7 †
1 1
1/4 7.64
.0044
2 .0086
1
8 6 4
1 4
II n 1/19
8 5
6
1/22
4 5
2 2 6

ANP Source Terms July 2005
4-20
Table 4-3 Leakage Rates from Hot Duct Carbon Traps (continued)
eakage Rate (%)
Sam
ple
Num
ber*
*
Dat
e
Star
t of C
olle
ctio
n Ti
me
End
of C
olle
ctio
n T
ime
Ti
to S
tart
of C
olle
ctio
n (h
rs)
(h Tem
p
I- 31 I-133 I-134 I-135 Ba-139 Ba-140 Avg. I 32-4
1/29
1645
1743
5 84
25 8
.0 6
.0 17
0 014
.010
.0057
32-10
1/29
2044
2144
73 2
25 2
.0 1
.0 57
85 029
.013
.0095
32-14
1/29
2300
2358
7
00 09
25 4
.0 6
.0 81
059
.016
.0133
Phase II Te ng
37-4
2/8
1415
1519
2 00
25 9
.0055
.0 24
045 029
.0096
.0083
.0038
38-4
2/9
1321
1421
2 2
27 0
.0 2
.0 58
264 060
.
0136
.110
.0326
38-6
2/9
1424
1523
1
27 7
27 3
.0668
.0 27
273 049 .
0069
.034
.0279
40-9
2/13
1605
1710 5 2
27 1
.1 7
. 53
25 058 .010
.057
.0802
42-12
2/15
1331
1403
0
25 2
.1 5
. 10
055 004
.0095
.00012
.0336
43-7
2/16
1345
1415
2
25 2
.1 3
. 05
. 035 0034
.012
.0297
45-15
2/19
1855
1949
8 3
27 9
.0 0
.0 84
11 028
.0428
.0180
46-4
2/20
1651
1740
7 32
27 6
.063
.020
14 005
.016
.020
.0255
47-3
2/22
1035
1132
5 48
27 6
.1 1
. 23
56 011
.083
.038
.0502
47-7
2/22
1518
1626
2
.57
1 82
27 6
.123
.037
39 013
.007
.061
.0530
48-3
2/23
1026
1126 10
2 12
2718
.159
.012
243 027
.040
.071
.0495
48-20
2/23
2247
2347
.32
2 67
2746
.1 4
. 0
44 115
.043
.0425
48-31 2/24 0251 0325 8.3
L
me
from
Beg
inni
ng o
f Run
Cum
ulat
ive
Funn
ing
Tim
e rs
)
erat
ure
Dur
ing
Sam
ple
Col
lect
ion
(°F)
1
.7 45. 4 1 0 .0 37
.0
4. 49.8 6 2 0 .00
.0
. 52. 5 2 0
.0
I sti
.1 54. 0 0 .0
.0
.2
.2 3 8 1 .0 .0
. 1.2 3 1 .0
.0
.2 6.6 4 3 1 .0
.0
.1
5 1 0 .0
.
.0
0 1 0 00 .0
.2 9.0 4 5 0 .0
.0
.3 10. 6 .0
.
.1 13. 6 1 0 .0
.
6. 3 .0
.
. 1. .0 .0
4 6. 4 01 .00 .0
9 30.74 2737 .144 .076 .048 .048
.016
.043 .0790
48-41 2/24 0633 0703 12.09 34.44
2741
.152
.072
.0232
.0214
.013
.043
.0672
48-50
2/24
1123
1153
16.92
39.27
2741
.221
.185
.033
.041
.007
.220
.120
48-56
2/24
1541
1612
21.22
43.57
2752
.261
.143
.0833
.041
.016
.069
.132
48-63
2/24
1936
2014
25.14
47.49
2742
.273
.136
.005
.029
.002
.087
.111
48-69
2/25
0015
0040
29.79
52.14
2760
.567
.037
.083
.104
.015
.111
.198
49-13
2/25
1144
1214
.78
54.01
2790
.490
.223
.043
.068
.019
.065
.206

ANP Source Terms July 2005
4-21
Table 4-3 Leakage Rates from Hot Duct
Leakage Rate (%)
Sam
ple
Num
ber*
*
Dat
e
Star
t of C
olle
ctio
n T
ime
End
of C
olle
ctio
n T
ime
Tim
e fr
om B
egin
ning
of R
un
to S
tart
of C
olle
ctio
n (h
rs)
Cum
ulat
ive
Funn
ing
Tim
e (h
rs)
Tem
pera
ture
Dur
ing
Sam
ple
Col
lect
ion
(°F)
I-131 I-133 I-134 I-135 Ba-139 Ba-140 Avg. I 49-22
52-2
3/1
2021
2053
.10
65.72
2722
.844
53-2
3/2
1025
1055
.37
68.39
2749
.688
.080
.025
.014
.029
.060
.202
53-23
3/2
1440
1510
4.62
72.64
2695
1.019
.101
.090
.067
.017
.028
.319
53-29
3/2
1836
1906
8.55
76.57
2749
.520
.044
.041
.077
.024
.068
.170
54-13
3/4
1840
1910
.30
77.82
2730
1.01
.142
.064
.038
.034
.101
.314
55-8
3/4
2018
2048
.27
80.26
2772
.561
.166
.085
.029
.037
.314
.210
55-14
3/4-5
2345
0015
3.72
83.71
2758
.708
.149
.071
.078
.032
.106
.252
56-4
3/5
1102
1132
.07
85.99
2696
.871
.134
.042
.053
.0246
.102
.275
56-14
3/5
1900
1930
5.40
93.10
2709
5.058
.949
.063
.116
.027
.504
1.546
56-21
3/5
2300
2330
9.40
97.10
2698
2.65
.944
.155
.179
.066
.337
.982
56-26
3/6
0145
0215
12.15
99.85
2740
2.748
.812
.090
56-31 3/6 0253 0322 13.29 100.99 2543 1.461 .425 .018 .053 .016 .093 .489 56-33
3/6
0337
0407
14.02
101.72
2270
.897
.247
.010
.096
.0081
.0164
.313
* The first number of the sample number is the run number, i.e., 11-4 is a sample from run 11. Activity too low to permit analysis. †
Carbon Traps (continued)
2/25 1548 1619 4.85 58.08 2760 .300 .135 .065 .017 .054 .167
49-28 2/25
2000
2031
9.05
62.28
2740
.164
.074
.011
.0081
.146
.034
.0643
.0605
.072
.027
.012
.077
.251
56-9 3/5 1505 1535 1.48 89.18 2723
1.58
.289
.051
.042
.025
.156
.490
.238 .0365 .594 .972

ANP Source Terms July 2005
4-22
Table 4-2 summarizes the derived percent leakage rates for individual radioiodines as determined from the radiochemical analysis of vault carbon traps at the 80-foot level of the stack during all three phases of IET #10. In addition, starting with test run #38 in the beginning of Phase III, estimates are presented for the total I-131 content (curies) in Insert 2-B at end of collection time. For example, based on data presented in Table 4-2, vault carbon sample #7 from test run #40 was taken on February 13, 1958, between 1612 hours and 1,715 hours, for a total sampling time of 63 minutes with a 0.083% Arelease rate@ for I-131. The ceramic Insert 2-B was estimated to have an inventory of 1,270 Ci of I-131 at the end of test run #40. From the previous Table 4-1, it is also noted that test run #40 lasted from 1550 hours to 1813 hours (or 143 minutes), which is 2.27 times the duration of the sampling time. A parallel set of sampling data representing hot duct carbon samples is represented in Table 4-3; thus, for the same test run #40, hot duct sample #9 was taken between 1605 hours and 1,710 hours (for a sampling time of 65 minutes) on February 13, 1958, and on the basis of hot duct sample #9, a Arelease rate@ of 0.137% was calculated for I-131. In addition, Tables 4-2 and 4-3 also provide average Aleakage rates@ for I-133, I-134, and I-135 from carbon traps in the vault and in the hot duct. Of interest are the following comparisons, which must be regarded as indicators of the accuracy and precision of these measurements:
4.3 Limitations of Early Release Estimates Leakage rates that are cited in Table 4-2 and Table 4-3 were defined by Foster (Foster et al. 1958) as A. . . the fraction of the fission products produced in Insert 2-B during a specified time that escaped via the effluent.” Values in Table 4-2 and Table 4-3 are expressed as percentages. The mathematical expression for quantifying leakage rates are provided on pages 21 through 25 of the Foster et al. (1958) report and account for (1) the fission rate/yield in the insert, (2) trap collection efficiency, (3) isotopic decay for the time interval between sample collection and sample analysis, (4) the ratio of flow through the particular trap to the total effluent flow (in either the hot duct or at the 80-foot stack level), and (5) sample loss due to plate-out in sampling line. 4.3.1 Limitations of Iodine and Barium Data
• For a given test run, sample number, and sample location (either a vault or hot
duct), the four leakage rates corresponding to I-131, I-133, I-134, and I-135 would in theory be expected to yield nearly identical release rates since they represent the common element iodine, a common sampling time, and were adjusted for radioactive decay. For example, vault sample #20 of test run #56 yielded a range of leakage values that differed by 14-fold between the high and low values: 1.164% for I-131; 0.349% for I-133, 0.196% for I-134, and 0.083% for I-135, with an average iodine release rate of 0.441. Discrepancies of this magnitude define virtually each and every sample set for both vault and hot duct samples.
• Lastly, the two sampling data sets cited in Table 4-2 and Table 4-3 should, in principle, have yielded nearly identical results since all parameters, except

ANP Source Terms July 2005
4-23
sampling location (vault versus hot duct), were either held constant or accounted for. For illustration, the vault sample #13 of test run #56 may be compared to hot duct sample number 14 of test run #56; both samples were taken on March 5, 1958, between 1900 hours and 1930 hours. Their release rates, however, differed significantly, as shown below:
56-13
56-14
Duc
Comparison of Leakage Rates (percent) I-131 I-133 I-134 I-135 Ba-139 Ba-140
Vault Sample: 1.21 0.384 0.229 0.068 0.080 0.760 Hot Duct Sample: 5.058 0.949 0.063 0.116 0.027 0.504 Ratio: t/Vault 4.2 2.5 0.16 1.7 0.34 0.66
Conclusions Regarding IET #10 Leakage Rates. Summary leakage rates presented in Tables 4-2 and 4-3 are those cited in Foster et al. (1958). The following conclusions apply:
• A comparison between the two release rates of Ba-139 and Ba-140 for a specific
sample frequently differed more than 10-fold. For example, vault sample #32 of test run #56 inexplicably yielded barium release rates that varied by a factor of 41.7 (i.e., 0.517% for Ba-140 versus 0.0124% for Ba-139).
• Iodine is highly volatile and at the high fuel temperatures of the Insert 2-B would have been expected to yield leakage rates well above those of barium. Inspection of Tables 4-2 and 4-3, however, indicates not only comparable values, but frequently show higher leakage rates for barium.
• Under steady state sampling conditions, which essentially defines Phase III samples, the temperatures of Insert 2-B and the parent core, as well as the power level, were maintained at a near constant. Under a steady-state operating condition, the production rate for a given radionuclide must be assumed to remain nearly constant. Therefore, leakage rates should also have remained nearly constant, as defined in Foster et al. (1958). The fact that both Tables 4-2 and 4-3 provide an average iodine leakage rate for each sample period suggests that, on the basis of the given definition, Foster had expected a common leakage rate for all radioiodines.
Inspection of leakage rates for any given radionuclide over the duration of Phase III, however, shows a consistent and steady increase. Thus, for the vault carbon traps beginning with sample #13 of test run #45, the early leakage rate of 0.028% steadily increases with successive runs and peaks at 1.333% during test run #56. A parallel rise in leakage rates is seen for all other radionuclides during Phase III for both sample data sets representing vault and hot duct sample locations.

ANP Source Terms July 2005
4-24
• As the above-cited examples illustrate, leakage rates are highly variable within and among data sets that should have yielded nearly identical values and provide insight to the limited precision/accuracy of these measurements.
• Leakage rates for Ba-139/140 were unexpectedly similar (and frequently higher) than those of the highly volatile radioiodines.
• Leakage rates, when presented only as a percentage value, do not provide any useful information regarding the actual curie quantities that were released for the radionuclides of iodine and barium. (Foster et al. 1958 provides no additional information that would allow the leakage rates cited in Tables 4-2 and 4-3 to be converted to actual curie quantities of radioiodines released.)
• The consistently steep and steady increase in leakage rates over the duration of IET #10 (that includes a 100-hour endurance run under steady-state conditions) suggests that the Foster et al. (1958) definition of Aleakage rate@ is in error: the report defined leakage rate A. . . as the fraction of the fission products produced in Insert 2-B during a specified time that escaped via the effluent.@ This definition, therefore, does not address the buildup and increased inventory of fission products over the operational history, which is largely independent of shorter sampling time and its associated “production rate of newly created fission products.” The reported leak rate values of Tables 4-2 and 4-3, however, clearly support a release rate that reflects not only the quantity of new fission products (i.e., created during the sampling time), but more importantly an existing inventory of fission products that were present prior to the sampling period.
Inspection of Table 4-2 clearly shows differences in leakage rates among the four radioiodines that show a strong positive correlation with their physical half-lives and, thus, their inventory buildup as a function of time. Iodine-131 with the longest half-life of 8.05 days has by far the highest leakage rates, which undoubtedly reflect higher inventories at the start of individual test runs. These variable inventories of radioiodines, when added to newly formed radioiodine during a given sampling period, are the true source terms for the radioiodines found in sample carbon traps. In fact, for I-131, the continuing core buildup that amounted to several thousand curies during Phase III is by far the much larger source term for release than the few tens of curies generated during any individual sampling time. Thus, under Foster’s (1958) definition of leakage rate, values in excess of 100% could be expected under conditions of even modest fuel failure. For illustration, fuel failure representing a 1% I-131 release fraction during a 1-hour sampling period that started out with 3,300 Ci I-131 but only produced 25 Ci of I-131 during the sampling period would have released 33.25 Ci of I-131. Based on Foster’s definition of leakage rate, this would correspond to a leakage rate of 133%. Yet, in spite of extensive fuel failure (as acknowledged by Foster in the following statement), the highest leakage rate reported by Foster et al. (1958) was at 1.33% or a full 100-fold lower:

ANP Source Terms July 2005
4-25
Page 27, Section 2.b. and c. Post-test examination of the insert showed that considerable deposits of beryllium
oxide were built up inside some of the ceramic elements. This would probably reduce the air flow to some extent in these tubes and result in a higher temperature at the same nuclear power level.
Upon visually examining the fuel tubes as the 2b insert was dismantled, it was
noted that some of the tubes in the center of the triangular stage sections at the lower end of the insert were bleached almost completely white. This strongly suggests the possibility that the uranium content of these tubes diffused out. This, in conjunction with the fact that some of the tubes in the same section of the insert were fused together, suggests that temperatures considerably above those reported were attained in portions of the insert.
The observed leakage rate of 1.33% corresponded to test run 56, sample 25, at a time when the core inventory for I-131 was at its maximum of 5,120 curies. Since the production of I-131 during test run 56, sample 25, was only estimated at 3.386 Ci (Peterson and Dickson 1991), Foster’s definition of leakage rate would suggest a release of only 0.045Ci of I-131 (3.386 Ci x 0.0133 = 0.045 Ci). Clearly, this value is not consistent with extensive fuel failure and empirical measurements of beryllium and uranium releases as discussed in greater detail below. Lastly, Foster’s definition of leakage rate and reported values in Tables 4-2 and 4-3 must further be viewed with suspicion based on the following statements (Foster et al. 1958, page 26, Section 2): Figure 4-9, showing the leakage rates from I131 analysis of vault traps, also
presents the amount of I131 calculated to be in the insert at the time the traps were turned off. During IET #10, operating times, shutdown times, and power levels were used as input data to a computer program and a reactor history kept of the amount of each isotope present at the beginning and end of each run. To compute the amount of I131 available at the time of collection of any given trap, a hand calculation was made of the amount produced during the run up until the time the trap was turned off. The amount of I131 in the insert at the beginning of the run (from previous operation) was decayed to the time the trap was turned off. The total I131 calculated to be present in the insert is the sum of that currently produced and that remaining from past operation.
It will be noted from Figure 4-9 that the amount of I131 calculated to be in the insert increased by approximately a factor of 5 from the beginning to the end of the endurance run. During this same time, the leakage rate (from I131 analyses) increased by approximately a factor of 25. [Emphasis added.]
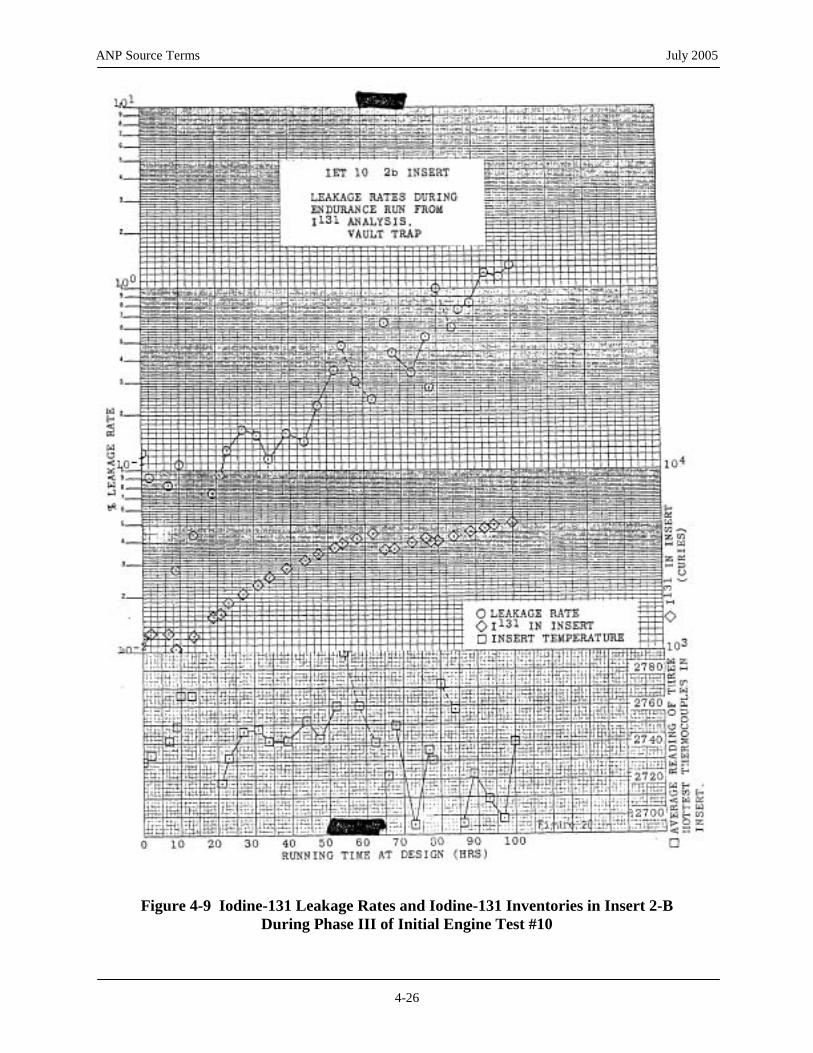
ANP Source Terms July 2005
4-26
Figure 4-9 Iodine-131 Leakage Rates and Iodine-131 Inventories in Insert 2-B During Phase III of Initial Engine Test #10

ANP Source Terms July 2005
4-27
4.3.2 Limitations of Total Effluent Release Estimates Cited by Foster
(4) A total effluent activity calculation was also done following each run
based on the average of the vault and hot duct leakage rates that were immediately available. These were the I-134 and I-135 isotope leakage rates.
The average leakage rates for any given run for I-134 and I-135 were then used by INEL to compute the activity of I-133 at 10 hours after fission. From I-133 at 10 hours, total effluent was derived by INEL from the following assumed relationship:
These statements imply that Foster et al. (1958) understood that the effluent release of I-131 (and other fission products) was dictated by the total inventory of radioiodine present in Insert 2-B during the sampling period, as opposed to the much smaller quantity of I-131 newly produced during the sampling period. In summary, there is ample reason to question whether the “leakage rates in percent” cited in Tables 4-2 and 4-3 apply (1) to the smaller quantities of the radioisotopes produced in Insert 2-B during the sampling period or (2) more correctly to the much larger total inventories of radioisotopes.
On page 28, Foster et al. (1958) cites the following four methods that were used to estimate total effluent releases during the endurance test run that principally defines Phase III. Total release estimates were normalized to 17 seconds post fission:
(1) The stack monitor operated continuously and the presented data are approximate averages for an entire run as scaled off a continuous chart of the dose rate reading.
(2) An ion chamber (referred to in this report as the Duct Jordan) was located
under the large duct at a point about two-thirds of the distance from the test cell to the stack. The chamber is shielded with lead brick so it is affected only by the radiation from the large duct. A continuous monitor of the dose rate reading from this instrument was available. As with the stack monitor the dose rate presented in the tabulation represents an average figure for a given run as scaled off the continuous recording chart.
(3) The Health Physics personnel at IET had a regular program for
determining the total effluent activity at frequent intervals during a run. The procedure consisted of drawing one minute samples of the effluent through a paper sample and following the beta decay of the filter activity from about 30 seconds after collection. By extrapolating the decay curve back to activity at 17 seconds, and assuming the effluent decay is the same as the spot sample decay, the total effluent activity was computed.

ANP Source Terms July 2005
4-28
(Source: Foster et al. 1958)
Cumulative Run Time
(hrs)
Effluent Activity
at 17 Seconds (Ci/hr)*
Effluent Activity
at 17 Seconds (Ci/hr)†
Average Duct
Jordan Reading (R/hr)
Average Sta
Monitor Reading (mR/hr
3.2
19,364
40
7.6
22,289
7,500
3.0
130
45 9.4 21,274 5,600 2.2 95 46
11.6
25,259
6,380
3.0
130
47
17.2
44,283
48-A 37.1 28,051 7,500 3.5 180 48-B
49 59.4 52,081 8,600 5.3 300 52
66.8
69,048
20,150
7.2
640
53
72.8
74,443
17,900
7.3
500
54
78.8
102,567
22,083
10.0
680
55
83.0
109,000
27,000
11.0
730
56
93.3
118,362
* Calculated from average vault and hot duct I-134 and I-135 leakage rates. † Calculated from vault spot sample activity.
Table 4-4 Total Effluent Activity During Endurance Run
Run Number
ck
) 38
5,130
2.2
95
7,100
4.0
220
52.0 52,687 7,500 5.1 280
31,400 11.8 790
• Based on a cited reference (Hunter and Ballou 1951) at 10 hours, I-133 represents 3.9% of total fission product activity.
• According to the average of two theoretical decay curves for gross fission
products, the total effluent activity at 10 minutes post fission was estimated at 68.1 times the gross effluent activity at 10 hours.
Effluent release rate measurements for individual test runs that were based on these four independent monitoring methods are tabulated in Table 4-4 and graphically illustrated in Figure 4-10.

ANP Source Terms July 2005
4-29
Figure 4-10 Effluent Activity During Initial Engine Test #10/Insert 2-B Endurance Run (Source: Foster et al. 1958)
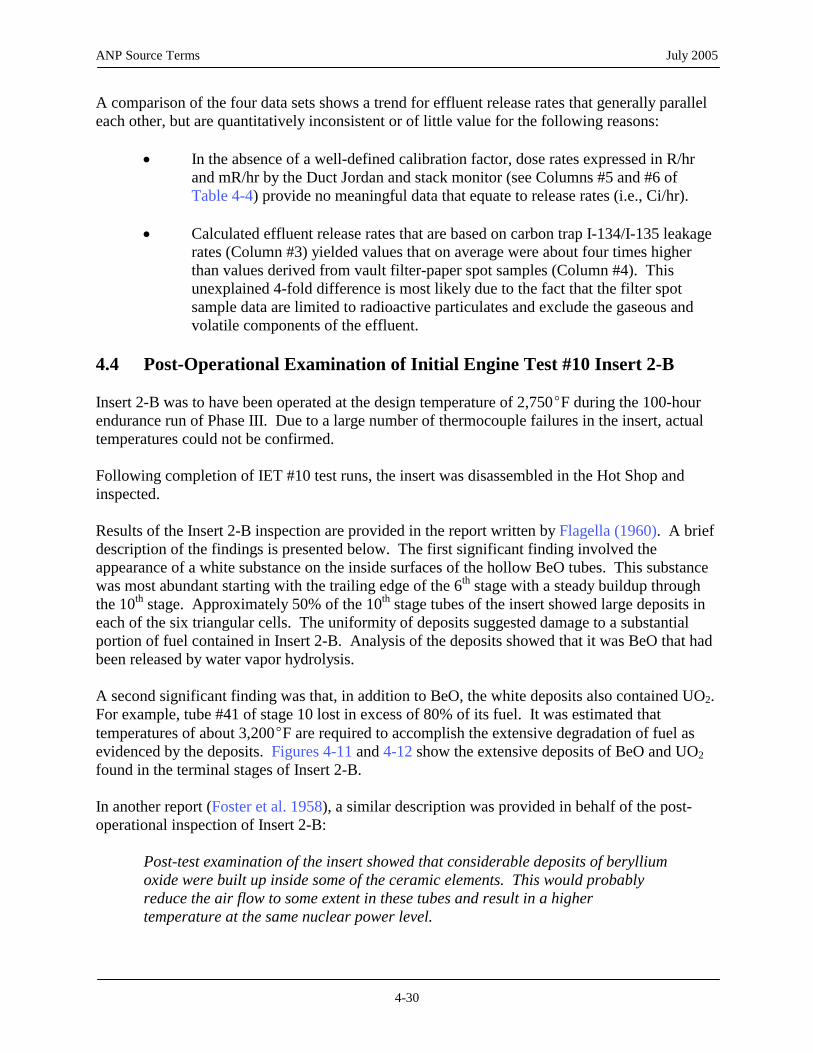
ANP Source Terms July 2005
4-30
A comparison of the four data sets shows a trend for effluent release rates that generally parallel each other, but are quantitatively inconsistent or of little value for the following reasons:
• In the absence of a well-defined calibration factor, dose rates expressed in R/hr and mR/hr by the Duct Jordan and stack monitor (see Columns #5 and #6 of Table 4-4) provide no meaningful data that equate to release rates (i.e., Ci/hr).
• Calculated effluent release rates that are based on carbon trap I-134/I-135 leakage
rates (Column #3) yielded values that on average were about four times higher than values derived from vault filter-paper spot samples (Column #4). This unexplained 4-fold difference is most likely due to the fact that the filter spot sample data are limited to radioactive particulates and exclude the gaseous and volatile components of the effluent.
4.4 Post-Operational Examination of Initial Engine Test #10 Insert 2-B Insert 2-B was to have been operated at the design temperature of 2,750EF during the 100-hour endurance run of Phase III. Due to a large number of thermocouple failures in the insert, actual temperatures could not be confirmed. Following completion of IET #10 test runs, the insert was disassembled in the Hot Shop and inspected. Results of the Insert 2-B inspection are provided in the report written by Flagella (1960). A brief description of the findings is presented below. The first significant finding involved the appearance of a white substance on the inside surfaces of the hollow BeO tubes. This substance was most abundant starting with the trailing edge of the 6th stage with a steady buildup through the 10th stage. Approximately 50% of the 10th stage tubes of the insert showed large deposits in each of the six triangular cells. The uniformity of deposits suggested damage to a substantial portion of fuel contained in Insert 2-B. Analysis of the deposits showed that it was BeO that had been released by water vapor hydrolysis. A second significant finding was that, in addition to BeO, the white deposits also contained UO2. For example, tube #41 of stage 10 lost in excess of 80% of its fuel. It was estimated that temperatures of about 3,200EF are required to accomplish the extensive degradation of fuel as evidenced by the deposits. Figures 4-11 and 4-12 show the extensive deposits of BeO and UO2 found in the terminal stages of Insert 2-B. In another report (Foster et al. 1958), a similar description was provided in behalf of the post-operational inspection of Insert 2-B:
Post-test examination of the insert showed that considerable deposits of beryllium oxide were built up inside some of the ceramic elements. This would probably reduce the air flow to some extent in these tubes and result in a higher temperature at the same nuclear power level.

ANP Source Terms July 2005
4-31
Upon visually examining the fuel tubes as the 2b insert was dismantled, it was noted that some of the tubes in the center of the triangular stage sections at the lower end of the insert were bleached almost completely white. This strongly suggests the possibility that the uranium content of these tubes diffused out. This, in conjunction with the fact that some of the tubes in the same section of the insert were fused together, suggests that temperatures considerably above those reported were attained in portions of the insert. [Emphasis added.]
The steady degradation of the ceramic fuel tubes of Insert 2-B was also monitored in the effluent as described by Foster et al. (1958): Page 25, Section A.4 Beryllium content of the effluent was determined from analysis of the beryllium
content of the first 5 inches of carbon from the vault trap. Results of the laboratory analysis for beryllium were stated in terms of micrograms of beryllium per gram of carbon in the first 5 inches of trap. As previously noted, about 44% of the beryllium was retained in the first 5 inches of carbon.
QwTotal Beryllium in Effluent = micrograms / sec
.44 R t where Q = analysis results in micrograms per gram of carbon.
w = weight of first 5 inches of trap material. R = ratio of the flow through the trap to the total effluent flow. t = sampling time in seconds. Figure 4-13 presents the beryllium loss in the effluent during the 100-hour endurance run that defined Phase III of IET #10. Prior to the endurance run, the beryllium loss in the effluent varied from 2 to 3 micrograms per second to 65 micrograms per second. The average release rate during Phases I and II was 34 micrograms per second. The significance of beryllium and uranium data and their relevance to leakage rates of radioiodine is discussed in Sections 4.6.2 and 4.6.3.

ANP Source Terms July 2005
4-32
Figure 4-11 Deposits on the Downstream Face of Stage 9 Tubes (second to last fueled stage)

ANP Source Terms July 2005
4-33
Figure 4-12 Deposits on the Downstream Face of Stage 10 (last fueled stage)

ANP Source Terms July 2005
4-34
re 3 Release of Beryllium in Effluent as Measured at the 80-foot Stack Heby Means of Vault Carbon Traps (Source: Foster et al . 1958)
Figu 4-1 ight

ANP Source Terms July 2005
4-35
Insert Inventories and Releases
4.5 Approach by the Historical Dose Evaluation Task Group for Estimating Radioactive Releases for Initial Engine Test #10
After critically reviewing available summary reports pertaining to IET #10 that notably included Foster et al. (1958), the HDE Task Group concluded that previous analysis of effluent data and associated conclusions had been based on inappropriate assumptions and over simplifications, as opined in the following statement (Peterson and Dickson 1991, page 8): RELEASE FRACTIONS – In the referenced report, [Foster et al. 1958] it appears
that estimates based on I-133 release rates considerably overestimated the total radionuclide activity released by applying incorrect parameters for the calculation of the total release rate of radioactive material (See column 3 of Table 8, XDCL 58-7-715). The release of iodine isotopes during the test is a more complicated process than assumed in the reports. Review of the data from this test series, as well as from the IET 14 test series, indicate that the amount of iodine released is also a function of the iodine inventory in the insert and a function of the temperature of the insert. These relationships may account from some of the variability within the data. [Emphasis added.]
The INEL=s approach to modeling source terms for IET #10 is only briefly summarized in the 1991 HDE report; a detailed description of the model used for IET #10 is provided by Peterson and Dickson (1991) in the following document:
Source Term Quality Control Tasks (Episodic Releases), IET #10 Source Term Characterization; INEL, HDE Quality Assurance Files, DOE/ID-12119-QAF-026.
The following discussion identifies what the HDE Task Group considered in its assumptions and outlines how the 1958 operation history and monitoring data were used to estimate radioactive material inventories and environmental release quantities.
The overwhelming source of data used by the HDE Task Group for modeling IET #10 releases is Foster et al. 1958. To derive radionuclide production and inventories for Insert 2-B, the HDE Task Group employed information pertaining to the operating history of IET #10 test runs that were previously summarized in Table 4-1; reference is, therefore, made to Table 4-1 data for the derivation of the following:
• Insert Power Levels. For each test run, Table 4-1 provides the insert fission rate (fissions/min). By means of the simple conversion factor of 3.121 x 10¹⁰ fissions/sec per watt (or 1.8726 x 10¹⁵ fissions/min per kW), the HDE Task Group derived an average power output for each test run. For example, test run #21 of Phase I lasted a total of 1.77 hours (or 106.2 minutes), during which the average fission rate in Insert 2-B was 1.71 x 10¹⁸ fissions/min. From these data, the average power level of 913.2 kW and the cumulative power output of 9.70 MW-hr are derived for test run #21.

ANP Source Terms July 2005
4-36
• Production of Fission Products. At the time of the report authored by Foster et al. (1958), only a simplified approach to quantifying radionuclide production and fuel inventories had been used as described in Section 4.2.
• Since that time, several computer codes, including the RSAC-4 code, have been
made available for quantifying radionuclide-specific production rates (and running inventories). In brief, production rates of individual radionuclides are stoichiometrically linked to the fission rate in the fuel, which can also be equated to the average power level generated. Thus, by means of the RSAC-4 code, the HDE Task Group derived radionuclide production quantities for each test run that were based on historical operating data, as summarized in Table 4-1. Computer-generated spread sheet data for each of the IET #10 test runs are contained in the INEL/HDE Quality Assurance Files, No. 18: IET #10 Source Term Characterization, dated February 8, 1991, and are reproduced herein as Appendix C.
4.5.1 Historical Dose Evaluation Task Group-Derived Effluent Releases of Iodine-131 and
Other Radioiodines Because I-131 is considered the critical radionuclide for release, a more definitive explanation of the protocol employed by the HDE Task Group is given below for quantifying (1) the effluent releases of I-131 and (2) the release rates for I-131. An explanation of the HDE Task Group methodology is most efficiently achieved by analyzing spread sheets No. IET 10.1 and IET 10.2, as cited in Attachment III of the Quality Assurance Files DOE/ID-12199-QAF-026 (Peterson and Dickson 1991). These spreadsheets are presented below as Table 4-5 and Table 4-6, respectively. Analysis of Table 4-5 Table 4-5 provides release rates and release quantities of I-131 for the three Phases of IET #10. Values cited under each column provide the following information:
• Column #1: Sample No. The first number identifies the test run; and the second number represents the sample ID number.
• Column #2: Release Fraction. Values cited as “release fractions” are in fact the
identical values cited by Foster et al. as “leakage rates” expressed as a percentage value (see Table 4-2, Column #8). The re-labeling of Foster’s percentage value of a leakage rate to a release fraction is confusing due to the differences in the definitions of leakage rate and release fraction but does not appear to have introduced any calculational errors to values cited in other columns.
• Column #3: Inventory Estimate From RSAC-4 (Ci/kW). Values cited are
computer-derived curie quantities of I-131 that were produced and normalized to a power level of 1 kW.
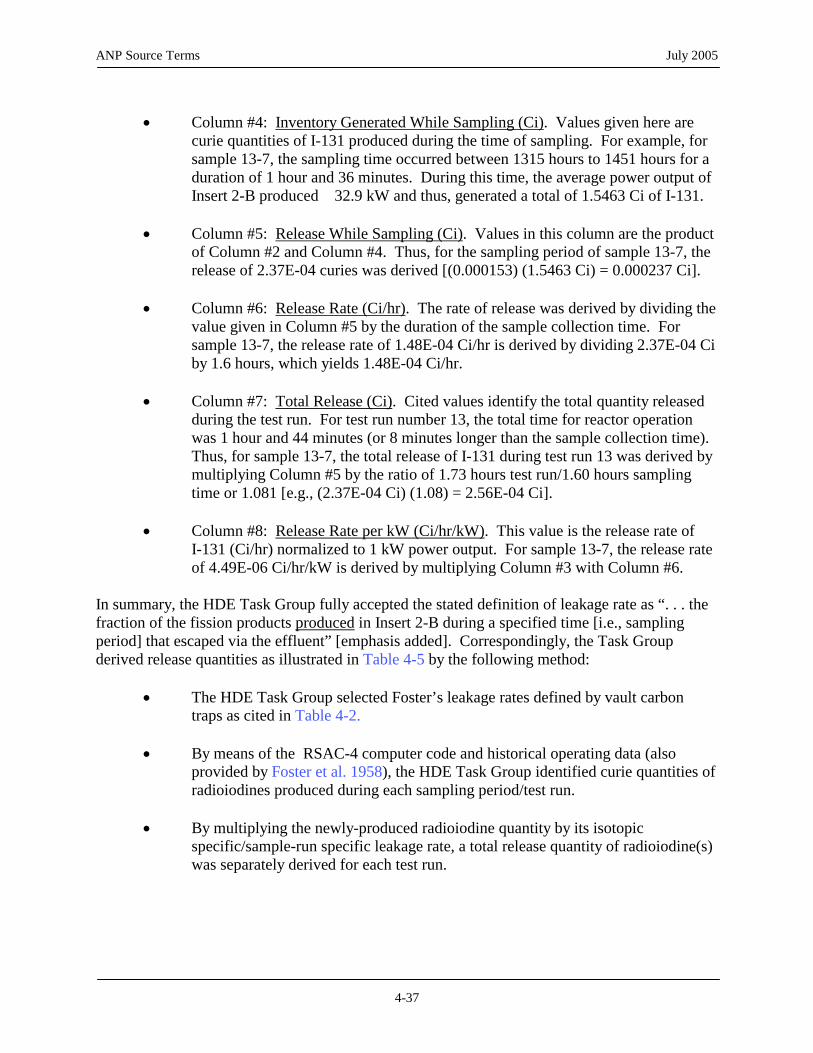
ANP Source Terms July 2005
4-37
• Column #4: Inventory Generated While Sampling (Ci). Values given here are
curie quantities of I-131 produced during the time of sampling. For example, for sample 13-7, the sampling time occurred between 1315 hours to 1451 hours for a duration of 1 hour and 36 minutes. During this time, the average power output of Insert 2-B produced 32.9 kW and thus, generated a total of 1.5463 Ci of I-131.
• Column #5: Release While Sampling (Ci). Values in this column are the product
of Column #2 and Column #4. Thus, for the sampling period of sample 13-7, the release of 2.37E-04 curies was derived [(0.000153) (1.5463 Ci) = 0.000237 Ci].
• Column #6: Release Rate (Ci/hr). The rate of release was derived by dividing the
value given in Column #5 by the duration of the sample collection time. For sample 13-7, the release rate of 1.48E-04 Ci/hr is derived by dividing 2.37E-04 Ci by 1.6 hours, which yields 1.48E-04 Ci/hr.
• Column #7: Total Release (Ci). Cited values identify the total quantity released
during the test run. For test run number 13, the total time for reactor operation was 1 hour and 44 minutes (or 8 minutes longer than the sample collection time). Thus, for sample 13-7, the total release of I-131 during test run 13 was derived by multiplying Column #5 by the ratio of 1.73 hours test run/1.60 hours sampling time or 1.081 [e.g., (2.37E-04 Ci) (1.08) = 2.56E-04 Ci].
• Column #8: Release Rate per kW (Ci/hr/kW). This value is the release rate of
I-131 (Ci/hr) normalized to 1 kW power output. For sample 13-7, the release rate of 4.49E-06 Ci/hr/kW is derived by multiplying Column #3 with Column #6.
In summary, the HDE Task Group fully accepted the stated definition of leakage rate as “. . . the fraction of the fission products produced in Insert 2-B during a specified time [i.e., sampling period] that escaped via the effluent” [emphasis added]. Correspondingly, the Task Group derived release quantities as illustrated in Table 4-5 by the following method:
• The HDE Task Group selected Foster’s leakage rates defined by vault carbon traps as cited in Table 4-2.
• By means of the RSAC-4 computer code and historical operating data (also
provided by Foster et al. 1958), the HDE Task Group identified curie quantities of radioiodines produced during each sampling period/test run.
• By multiplying the newly-produced radioiodine quantity by its isotopic
specific/sample-run specific leakage rate, a total release quantity of radioiodine(s) was separately derived for each test run.

ANP Source Terms July 2005
4-38
e 4 elease Rate and Release Quantities of Iodine-131 for Initial Engine Test #10as Derived by the Historical Dose Evaluation Task Group
Spread Sheet No. 10.1: Operating History and Iodine Release Estimates for IET #10
Tabl -5 R

ANP Source Terms July 2005
4-39
ase Rate and Release Quantities of Iodine-131 for Initial E
Table 4-5 Rele ngine Test #10 as Derived by the Historical Dose Evaluation Task Group (continued)
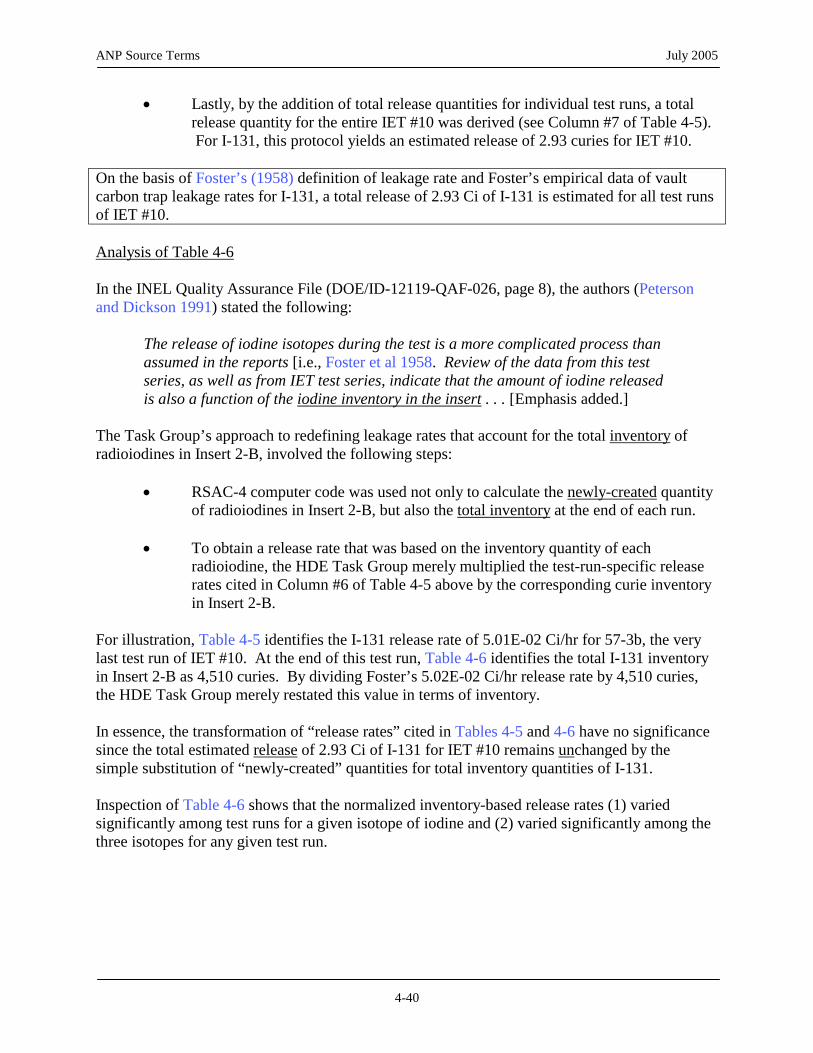
ANP Source Terms July 2005
4-40
• Lastly, by the addition of total release quantities for individual test runs, a total release quantity for the entire IET #10 was derived (see Column #7 of Table 4-5). For I-131, this protocol yields an estimated release of 2.93 curies for IET #10.
On the basis of Foster’s (1958) definition of leakage rate and Foster’s empirical data of vault carbon trap leakage rates for I-131, a total release of 2.93 Ci of I-131 is estimated for all test runs of IET #10. Analysis of Table 4-6 In the INEL Quality Assurance File (DOE/ID-12119-QAF-026, page 8), the authors (Peterson and Dickson 1991) stated the following: The release of iodine isotopes during the test is a more complicated process than
assumed in the reports [i.e., Foster et al 1958. Review of the data from this test series, as well as from IET test series, indicate that the amount of iodine released is also a function of the iodine inventory in the insert . . . [Emphasis added.]
The Task Group’s approach to redefining leakage rates that account for the total inventory of radioiodines in Insert 2-B, involved the following steps:
• RSAC-4 computer code was used not only to calculate the newly-created quantity of radioiodines in Insert 2-B, but also the total inventory at the end of each run.
• To obtain a release rate that was based on the inventory quantity of each
radioiodine, the HDE Task Group merely multiplied the test-run-specific release rates cited in Column #6 of Table 4-5 above by the corresponding curie inventory in Insert 2-B.
For illustration, Table 4-5 identifies the I-131 release rate of 5.01E-02 Ci/hr for 57-3b, the very last test run of IET #10. At the end of this test run, Table 4-6 identifies the total I-131 inventory in Insert 2-B as 4,510 curies. By dividing Foster’s 5.02E-02 Ci/hr release rate by 4,510 curies, the HDE Task Group merely restated this value in terms of inventory. In essence, the transformation of “release rates” cited in Tables 4-5 and 4-6 have no significance since the total estimated release of 2.93 Ci of I-131 for IET #10 remains unchanged by the simple substitution of “newly-created” quantities for total inventory quantities of I-131. Inspection of Table 4-6 shows that the normalized inventory-based release rates (1) varied significantly among test runs for a given isotope of iodine and (2) varied significantly among the three isotopes for any given test run.

ANP Source Terms July 2005
4-41
Table 4-6 Release Rates Based on Insert 2-B Inventories

ANP Source Terms July 2005
4-42
Table 4-6 Release Rates Based on Insert 2-B Inventories (continued)

ANP Source Terms July 2005
4-43
Barring fuel degradation over time and/or drastic changes in Insert 2-B power levels/ temperatures, the normalized release rates cited in Table 4-6 should have remained near constant. For I-131, the release rates normalized to 1 curie inventory varied nearly 300-fold from 1.65E-07 Ci/hr per curie inventory to 4.54-E-05 Ci/hr per curie inventory. More significant (and unexpected), however, is the fact that the highest release rate of 4.54E-05 Ci/hr per Ci inventory not only occurred early in Phase I test run 19-3, but immediately preceded the lowest release rate of 1.65E-07 Ci/hr per Ci inventory during Phase II, test run 24. Since power levels (and assumedly temperatures) remained nearly the same, and only limited fuel failure (as evidenced by beryllium releases) were evident, the observed differences in derived release rates are difficult to explain. Similarly, the normalized release rates among the three radioiodines for any given test run should also have yielded nearly identical values (with exception of the recoil release mechanisms, the two more important release mechanisms of diffusion and loss of fuel must be considered identical among the three radioiodines). Values for any given test run varied between one and two orders of magnitude among the three radioiodines. HDE Task Group’s Final Selection of Release Rates and Release Quantities for Radioiodines For reasons that are not explained, the HDE Task Group elected not to use the test-run-specific and radioiodine-specific release rates defined in Tables 4-5 and 4-6 that would have yielded a total I-131 release of less than 3 curies for all of IET #10. Instead, from release rates cited in Table 4-6, the HDE Task Group derived the average release rate for I-131 as 1.04 x 10⁻⁵ Ci/hr per Ci inventory, for I-133 as 1.4 x 10⁻⁴ Ci/hr per Ci inventory, and for I-135 as 6.49 x 10⁻⁵ Ci/hr per Ci inventory, and made the following decision (page A-126 of the 1991 HDE Task Group Report): . . . On the basis of the analysis of charcoal trap samples from the 80-ft level of
the stack, the largest of the average inventory-normalized release rates for I-131, I-133, and I-135 was determined to be 1.4E-4 Ci/h of I-133 release per curie of I-133 inventory in the insert at the end of a test run for the winter season and the growing season. This value, when multiplied by the test run operating times, represented the halogen release fractions used in the RSAC-4 computer code to estimate iodine releases. . . [Emphasis added.]
In other words, a single value of 1.4 x 10⁻⁴ Ci/hr per Ci inventory that represented the average release rate for I-133 was used for (1) all test runs and (2) all isotopes of iodine. By means of a single release rate, the HDE Task Group derived a total release of 54.9 Ci of I-131 for IET #10. This value is nearly 19 times higher than the I-131 value of 2.93 Ci that was based on (1) the strict interpretation of Foster’s definition of “leakage rate” and (2) Foster’s empirical carbon vault trap leakage rates.

ANP Source Terms July 2005
4-44
The HDE Task Group critically reviewed the methodology that had been employed in the report by Foster et al. (1958) for estimating the release quantities of total fission products and identified major discrepancies. As described previously, Foster et al. (1958) had assumed that A.. . . at 10 hours, I-133 is responsible for 3.9% of total fission product activity; . . . and, based on theoretical decay curves, the gross total fission product activity at 10 minutes was expected to be 68.1 times higher than the 10-hour activity.@ However, these assumptions neither consider residual radionuclide inventories at the beginning of a test run nor the duration of the test run. Not surprisingly, when the HDE Task Group attempted to verify Foster=s earlier assumptions, the RSAC-4 code generated 10 min/10 hour activity ratio values for a subset of test runs that ranged from 4.38 to 17.9 instead of the assumed value of 68.1. For this reason, the following HDE Task Group modeling approach was taken.
• From the historical operational data that included the duration and total power output for each test run, the RSAC-4 code determined the production quantities and corresponding inventories for all 47 radionuclides under consideration.
• Release fractions for the noble gases and solids were selected so that the total
noble gas and solid fission product activity after a decay time of 10 minutes equaled the total activity released as determined by the empirical spot sampling data, as had been reported by Foster et al. (1958) (see Table 4-4, Column 4). The HDE Task Group further assumed that the ratio of the noble gas release fraction to the solids release fraction was a constant and equaled 1000:1.
Release of Uranium. The UO2 in the ceramic fuel insert was uniformly distributed within the matrix of beryllium oxide (BeO). Throughout the IET #10 test runs, the release of beryllium into the effluent was determined from the analysis of the beryllium content collected in the carbon vault traps. From a total of 10,720 grams of beryllium in the insert, a stack release of 30.6 grams was estimated on the basis of vault carbon trap data, which yields the release fraction of 2.854 x 10⁻³. This release fraction was applied to the U-238, U-235, and U-234 content of the insert for estimating effluent release values. (It may be noted that the HDE=s Quality Assurance document, page 10, cites the erroneous release fraction of 3.477 x 10⁻³, which therefore overestimates uranium releases by about 19%.) Argon-41 Releases. The estimated release of Ar-41 was based on total reactor operational power levels as described for IET #3. In summary, the HDE Task Group derived release estimates in behalf of 51 radionuclides for each IET #10 test run employing the methodology described above. A detailed printout of radionuclides and test-run-specific release quantities is provided in Appendix C of this document; a summary of these data is provided in Table 4-7. It should be noted that IET #10 releases were segregated on the basis of time that reflect agricultural planting and growing times;
4.5.2 Total Effluent Releases

ANP Source Terms July 2005
thus, releases designated as IET #10A included winter test runs between December 20, 1957, and March 25, 1958, and IET #10B represents releases for test runs #52 through #57, which were conducted in the first week of March 1958.
4-45

ANP Source Terms July 2005
Table 4-7 Radionuclide Releases for Initial Engine Test #10
8
m 2.47E+01
2.57E+01
as Estimated by the Historical Dose Evaluation Task Group
Nuclide
Half-life
IET #10A
IET #10B
Nuclide
Half-life
IET #10A
IET #10B
Ar-41
1.83 h
4.00E+03
1.31E+03
I-131
8.05 d
3.42E+01
2.07E+01
Br-84
6.0 m
1.67E+01
3.85E+03
I-132
2.3 h
6.00E+01
3.18E+01
Kr-85m
4.4 h
8.78E+03
1.04E+04
I-133
20.3 h
3.00E+02
8.62E+01
Kr-87
76 m
1.78E+04
1.97E+04
I-134
52.0 m
2.53E+02
9.00E+01
Kr-88+D
2.8 h
3.60E+04
4.23E+04
I-135
6.68 h
4.11E+02
1.20E+02
Rb-89
15.4 m
6.23E+02
4.17E+02
Xe-129m
8.0 d
1.13E-05
2.54E-05
Sr-89
52.7 d
6.52E+00
1.22E+01
Xe-135
9.14 h
4.50E+04
4.72E+04
Sr-90+D
29 y
2.33E-02
5.82E+02
Xe-135m
15.6 m
4.74E+02
3.18E+02
Sr-91+D
9.5 h
6.98E+01
8.23E+01
Xe-138
17.5 m
2.51E+03
1.52E+03
Sr-92
2.71 h
6.23E+01
7.29E+01
Cs-137+D
30 y
4.86E-02
9.14E-02
Y-91
58.8 d
2.67E+00
7.52E+00
Cs-138
32.2 m
1.08E+04
1.15E+04
Y-92
3.53 h
6.98E+01
8.58E+01
Ba-139
82.9 m
4.17E+02
4.69E+02
Y-93
10.3 h
6.00E+01
6.93E+01
Ba-140+D
13 d
1.06E+01
2.42E+01
Zr-95+D
64 d
3.10E+00
8.06E+00
Ba-141
18 m
6.39E+00
4.97E+00
Zr-97
17 h
4.72E+01
5.34E+01
Ba-142
11 m
1.08E+00
4.15E-01
Nb-96
23.35 h
4.12E-03
4.70E-03
La-141
3.87 h
6.80E+01
8.11E+01
Mo-99
66 h
2.36E+01
3.62E+01
La-142
92.5 m
5.44E+01
6.14E+01
Ru-103 +D
39 d
2.25E+00
5.77E+00
Ce-141
32.5 d
4.57E+00
1.21E+01
Ru-105
4.4 h
1.11E+01
1.32E+01
Ce-143
33 h
3.53E+01
4.24E+01
Ru-106+D
368 d
3.95E-02
1.06E-01
Ce-144+D
284 d
6.60E-01
1.76E+00
Sb-129
4.4 h
7.23E+00
8.61E+00
Pr-143
13.59 d
5.91E+00
1.89E+01
Te-131
25 m
1.19E+01
1.23E+01
Pr-144
17 m
6.60E-01
1.76E+00
Te-131m
30 h
2.28E+00
2.69E+00
U-234
2.47x10⁵ y
3.06E-04
1.23E-04
Te-132+D
78 h
1.54E+01
2.54E+01
U-235
7x10⁸ y
9.74E-06
3.91E-06
Te-133m
55 m
1.56E+01
1.68E+01
U-238
4.5x10⁹ y
9.06E-08
3.64E-0
Te-134
42
4-46

ANP Source Terms July 2005
4.6 A Critical Review of the Historical Dose Evaluation Model In the absence of logbooks and primary monitoring data, the HDE Task Group relied almost entirely on the Foster et al. (1958) report. Although this summary report provides the most comprehensive assessment of IET #10, the HDE Task Group recognized the report=s deficiencies and limitations, and derived source terms that were based on Foster’s definition of “leakage rate,” but then failed to use Foster’s test-run-specific/radioiodine-specific leakage rates. To do so would have yielded a total release of only 2.93 Ci of I-131 for more than 125 hours of reactor operation, which, moreover, was characterized by substantial fuel failure. Presented in this section is a critical review of HDE Task Group’s approach for defining IET #10 source terms, along with supportive data that the release of radioiodines and other fission products may have been significantly higher. Potentially higher values for radioiodines are indicated by (1) a revised interpretation of Foster’s “leakage rates” and (2) independent data sets of BeO and UO2 releases that can reasonably be regarded as appropriate surrogates for IET #10 effluent sampling data. 4.6.1 A Revised Interpretation of Leakage Rates It is SC&A’s firm opinion that the technical difficulty with data presented by Foster et al (1958) centers around the misuse of the definition for leakage rate. When applied to the complex test series for Insert 2-B of IET #10, Foster’s definition of leakage rate, as “. . . the fraction of the fission products produced in the insert during a given time that escaped via the effluent,” may have been misused. The correct source term for effluent releases of fission products is clearly the total inventory of individual radionuclides that are present during the time of effluent sampling. For this reason, other ANP tests with complex operating histories similar to IET #10 cite effluent release/release rates in terms of total inventory (Baker 1961, Wilks et al. 1962, Deven et al. 1958 ) as illustrated below: Deven et al. 1958, page 27: On Fission Products Release: . . . The average percent release values [for the test insert] . . . were based on 11%
of the total power generation in the insert and on the total amount of the specific isotope in the whole fuel cartridge. [Emphasis added.]
Baker (1961), page 39: . . . Fission product release data is reported in terms of percent of inventory in the
test cartridge. . . . The ratio of the activity in the effluent to the inventory in the insert is defined
to be the fraction released. [Emphasis added.] . . . Figure 4-14 presents the . . . release fractions as normally calculated with
each point being plotted at a time in hours corresponding to the midpoint of the sampling time. [Emphasis added.]
4-47

ANP Source Terms July 2005
For illustration, the figure referenced by Baker, is reproduced herein as Figure 4-14.
Figure 4-14 Reproduction of Figure 20 from Baker 1961
4-48

ANP Source Terms July 2005
A potential contradiction to Foster’s definition of leakage rate (on page 21 of Foster et al. 1958), as “. . . the fraction of the fission products produced in the insert during a given time that escaped via the effluent,” is in the following passage on page 26 of the Foster et al. (1958) report: Figure 28, showing the leakage rates from I131 analysis of vault traps, also
presents the amount of I131 calculated to be in the insert at the time the traps were turned off. During IET #10, operating times, shutdown times, and power levels were used as input data to a computer program and a reactor history kept of the amount of each isotope present at the beginning and end of each run. To compute that amount of I131 available at the time of collection of any given trap, a hand calculation was made of the amount produced during the run up until the time the trap was turned off. The amount of I131 in the insert at the beginning of the run (from previous operation) was decayed to the time the trap was turned off. The total I131 calculated to be present in the insert is the sum of that currently produced and that remaining from past operation. [Emphasis added.]
These statements seem to imply that Foster’s leakage rates may in fact have been based on total inventory “. . . available at the time of collection of any given trap.” Figure 28, as referenced above, was reproduced herein as Figure 4-9. To confuse matters (and in defense of the Task Group’s interpretation), some tests that were conducted on ANP reactor fuels did employ a definition for release rate that parallels the definition of leakage rate cited by Foster et al. (1958). In a comprehensive report entitled Summary of Fission Product Release Data from GE-ANPD Fuel Element Reactor Tests (Conn 1959), the following definition is provided on page 6: This report documents the fission product release rates for all ANPD fuel element
tests performed in the Low Intensity Test Reactor (LITR) at Oak Ridge National Laboratory and the Materials Testing Reactor (MTR) at the National Reactor Testing Station for which data are available through the end of 1958. . . . The fission product release rate is defined as the ratio of the number of atoms of a species released to the theoretical number of atoms of the same species formed during the collection period. For uniformity, the ratio is expressed as a percentage. . . .
Release rates cited by Conn (1959), however, involved small fuel samples that were subjected to neutron bombardment within the Low Intensity Test Reactor (LITR) or MTR. Moreover, Conn’s release rates do not represent instantaneous production rates and concurrent release rates, but represent time-integrated average values over the full duration of the sampling period. Under conditions when the sampling time approaches or is nearly equal to the total time of the test period, then the “. . . theoretical number of atoms of the same species formed during the collection period” in essence is equal to the inventory; and the release rate in reality is the release fraction.
4-49

ANP Source Terms July 2005
In summary, the complete acceptance of Foster’s definition of leakage rate and the cited values for leakage rates for all test runs yield a total release of only 2.93 Ci of I-131. This value, when viewed in context with the duration of reactor operation, fuel failure, and other data presented below, is clearly too low and begs the following obvious questions:
• Was Foster’s definition of leakage rate a simple error of semantics? or • Was there a systematic error that affected the analysis of all carbon trap samples?
Conclusive answers to these questions could reasonably be expected if primary effluent monitoring data were available. Even a few data points involving measured activity levels of radioiodines in vault carbon traps would clearly determine whether Foster’s cited leakage rates were based on (1) total Insert 2-B inventory at time of sampling or (2) the much smaller quantity of radioisotope produced during sampling as alluded to by Foster et al. (1958). Differences between these two interpretations of leakage rate is illustrated in Table 4-8, which provides the following data for I-131: Column #1—identifies the test run sample number for which leakage rates were
provided. Column #2—identifies the leakage rate (in %) for I-131 as provided by Foster et al.
(1958). Column #3—identifies the amount of I-131 generated in Insert 2-B during the sampling
period, as derived by the HDE Task Group using the RSAC-4 computer code. Column #4—identifies the total inventory of I-131 in Insert 2-B at the end of the test run
as calculated by the HDE Task Group using the RSAC-4 computer code. (Values in parenthesis reflect test runs for which the HDE Task Group did not derive an inventory; for a best estimate and screening calculation, the previous test run inventory has been used.)
Column #5—identifies total releases of I-131 for individual test runs that are based on a
leakage rate that is defined by the amount of I-131 generated during the test run. When releases from all test runs are added, the total release of I-131 for IET #10 is estimated at 2.93 Ci.
Column #6—identifies total releases of I-131 for individual test runs that are based on a
leakage rate that is defined by the total inventory of I-131 in Insert 2-B at the end of a test run. For this definition of leakage rate, the total amount of I-131 released for all test runs of IET #10 is estimated at 587.5 Ci.
Data in Table 4-8 suggest that for the alternative interpretation of Foster’s leakage rate values, the release of about 587 Ci of I-131 is 200 times higher than the 2.93 Ci value that was derived by the restrictive definition given by Foster et al. (1958).
4-50
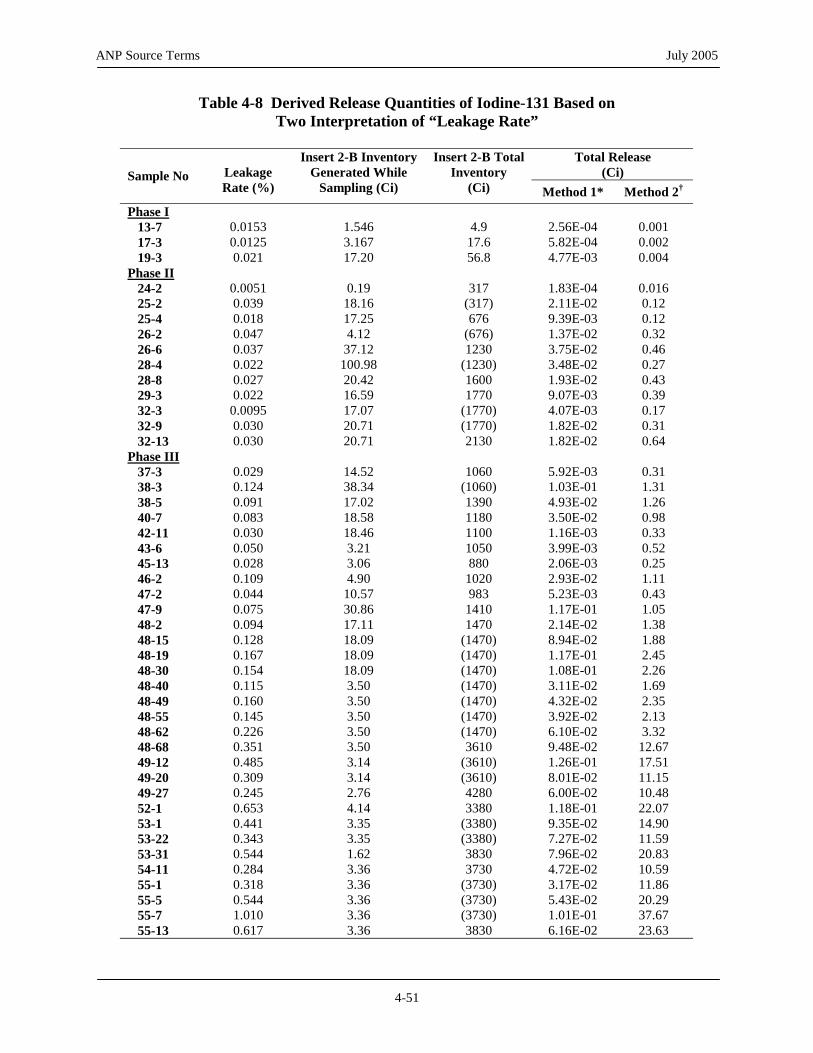
ANP Source Terms July 2005
Table 4-8 Derived Release Quantities of Iodine-131 Based on Two Interpretation of “Leakage Rate”
Insert 2-B Invent
Rate (%) Sampling (Ci) (Ci) Method 1* Method 2†
Phase I 13-7
0.0153
1.546
4.9
2.56E-04
0.001
17-3 0.0125 3.167 17.6 5.82E-04 0.002 19-3 Phase II 24-2
0.0051
0.19
317
1.83E-04
0.016
25-2 0.039 18.16 (317) 2.11E-02 0.12 25-4 0.018 17.25 676 9.39E-03 0.12 26-2 0.047 4.12 (676) 1.37E-02 0.32 26-6 0.037 37.12 1230 3.75E-02 0.46 28-4 0.022 100.98 (1230) 3.48E-02 0.27 28-8 0.027
32-3 0.0095 17.07 (1770) 4.07E-03 0.17 32-9 0.030 20.71 (1770) 1.82E-02 0.31 32-13 0.030 20.71 2130 1.82E-02 0.64 Phase III 37-3
0.029
14.52
1060
8-5 0.091 17.02 1390 4.93E-02 1.20-7 0.083 18.58 1180 3.50E-02 0.98 2-11 0.030 18.46 1100 1.16E-03 0.33 3-6 0.050 3.21 1050 3.99E-03 0.52 5-13 0.028 3.06 880 2.06E-03 0.26-2 0.109 4.90 1020 2.93E-02 1.11 7-2 0.044 10.57
0.075 30.86 1410 1.17E-01 1.08-2 0.094 17.11 1470 2.14E-02 1.38-15 0.128 18.09
48-30 0.154 18.09 (1470) 1.08E-01 2.26 48-40 0.115 3.50 (1470) 3.11E-02 1.69 48-49 0.160 3.50 (1470) 4.32E-02 2.35 48-55 0.145 3.50 (1470) 3.92E-02 2.13 48-62 0.226 3.50 (1470) 6.10E-02 3.32 48-68 0.351 3.50 3610 9.48E-02 12. 49-12 0.485 3.14 (3610) 1.26E-01 17.51 49-20 0.309 3.14 (3610) 8.01E-02 11.15 49-27 0.245 2.76 4280 6.00E-02 10.48 52-1 0.653 4.14 3380 1.18E-01 22.07 53-1 0.441 3.35 (3380) 9.35E-02
53-31 0.544 1.62 3830 7.96E-02 20.83 54-11 0.284 3.36 3730 4.72E-02 10.59 55-1 0.318 3.36 (3730) 3.17E-02 11.86 55-5 0.544 3.36 (3730) 5.43E-02 20.29 55-7 1.010 3.36 (3730) 1.01E-01 37.67 55-13 0.617 3.36 3830 6.16E-02 23.63
Total Release (Ci) Sample No Leakage
ory Generated While
Insert 2-B Total Inventory
0.021 17.20 56.8 4.77E-03 0.004
20.42 1600 1.93E-02 0.43 29-3 0.022 16.59 1770 9.07E-03 0.39
5.92E-03 0.31 38-3 0.124 38.34 (1060) 1.03E-01 1.31 3 6 4 4 4 4 5 4 4 983 5.23E-03 0.43 47-9 5 4 8 4 (1470) 8.94E-02 1.88 48-19 0.167 18.09 (1470) 1.17E-01 2.45
67
14.90 53-22 0.343 3.35 (3380) 7.27E-02 11.59
4-51

ANP Source Terms July 2005
Table 4-8 Derived Release Quantities of Iodine-131 Based on Two Interpretation of “Leakage Rate” (continued)
56-2 0.777 3.39 3840 9.37E-02 29.83
56-13 1.21 3.39 (3840) 1.77E-01 56-20 1.164 3.39 (3840) 1.71E-01 56-25 1.333 3.39 4620 1.95E-01 44.70 56-30 0.856 3.39 (4620) 1.26E-01 39.54 56-32 0.832 3.39 (4620) 1.22E0-1 38.44 57-1 0.52 2.91 4490 1.78E-02 23.35 57-3 0.78 3.10 4510 2.86E-02 35.18 IET #10 Total: 2.93 Ci 587.5 Ci
* Method 1 represents the release quantity based on I-131 generated during test run.
Total Beryllium in Effluent microgramsQwR t= 0 44. / sec
Total Release
(Ci) Sample No
Leakage Rate (%)
Insert 2-B Inventory Generated While
Sampling (Ci)
Insert 2-B Total Inventory
(Ci) Method 1* Method 2†
56-8 0.827 3.39 (3840) 1.21E-01 31.75 46.46 44.69
† Method 2 represents the release quantity based on total I-131 inventory in Insert 2-B. Presented in the next two sections are data that support the higher release of 587 curies of I-131. 4.6.2 Beryllium as a Surrogate for the Release of Iodines and Other Fission Products As previously mentioned, the release of beryllium was monitored by vault carbon traps during IET #10, as described in the following passage (Foster et al. 1958, page 25):
Beryllium content of the effluent was determined from analysis of the beryllium content of the first 5 inches of carbon from the vault trap. Results of the laboratory analysis for beryllium were stated in terms of micrograms of beryllium per gram of carbon in the first 5 inches of trap. As previously noted, about 44% of the beryllium was retained in the first 5 inches of carbon.
where Q = analysis results in micrograms per gram of carbon. w = weight of first 5 inches of trap material. R = ratio of the flow through the trap to the total effluent flow. t = sampling time in seconds.
Since BeO and UO2 were present as a homogeneous mixture in the unclad fuel matrix in concentrations of 85% and 6% by weight, respectively, it must be concluded that any measured loss of beryllium from the fuel matrix is a lower-bound surrogate measurement for the release of uranium, as well as all induced fission products. For this reason, the HDE Task Group had made use of the beryllium effluent data for deriving the release of U-238, U-235, and U-234 (as described in Section 4.5). From the beryllium effluent data provided by Foster et al. (1958), the HDE Task Group had calculated the release of 30.6 grams of beryllium from a total Insert 2-B inventory of 10,720 grams. A release of 30.6 grams of beryllium from an inventory of 10,720 grams corresponds to a beryllium release fraction of 2.85 x 10⁻³.
4-52

ANP Source Terms July 2005
Since nearly all of the beryllium was release during the latter portion of the 100-hour endurance run of Phase III when the time-weighted average inventory of I-131 was about 3,000 Ci, a simple screening calculation in behalf of 30.6 grams of beryllium would predict the release of 8.58 Ci of I-131 [(30.6 g/10,700 g) (3000 Ci) = 8.58 Ci]. Although this amount already exceeds the 2.93 Ci quantity (that would have been predicted by Foster’s definition and data) by nearly three-fold, the estimated release of 30.6 grams of beryllium by the HDE Task Group is only a small fraction of the total amount that was released, as explained below. Limitations of Beryllium Release Measurements. The cumulative release of beryllium was derived from vault carbon trap data, which sampled the effluent gas at the 80-foot level of the exhaust stack and suggest an environmental release of 30.6 grams beryllium. While there is no obvious reason to question the 30.6 grams beryllium as a release quantity to the environment, it is equally obvious that this value does not represent the total amount of beryllium that was lost from the damaged fuel of Insert 2-B. Inarguable evidence for much high quantities comes from the post-operation inspection of the damaged Insert 2-B, which had shown substantial amounts of white deposits. These deposits were subsequently shown to contain beryllium (see Section 4.4 and Figures 4-11 and 4-12). Flagella (1960) had provided the following account (page 36): . . . This substance was observed first on the trailing edge of the 6th stage. And
slightly increased in quantity as the insert was unstacked with a large increase in amount occurring at the trailing edge of stage ten, where deposits apparently completely blocked flow passage in some tubes. . . . Approximately 50% of the tenth stage tubes of the insert showed large deposits with each of the six cells exhibiting the same uniformity of deposit . . .
The deposits observed in the tenth stage and other stages of the 2-B was identified as BeO crystals. [Emphasis added.]
Unfortunately, no attempt was made to quantify the amount of BeO deposits found within the latter stages of Insert 2-B that were only inches removed from the preceding stages of failed fuel. The BeO deposits observed in the insert were subsequently identified as being caused by water hydrolysis. The hydrolyzed BeO was volatized, distilled from the hot surfaces, and was re-deposited a short distance downstream onto cooler surfaces (Flagella 1960). Thus, the corrosion/volatilization of BeO not only released the accumulated inventory of fission products stored within the affected fuel matrix, but also exposed new fission products that had previously been below the surface (Layman 1962). The significance of “newly exposed” surfaces is their further release of fission products by means of molecular diffusion and recoil. The uncertainty regarding the total amount of BeO dislodged from fuel is further enhanced by the fact that there is no data or even a simple qualitative reference to additional BeO that may have also deposited outside of the Insert 2-B. The fact that beryllium was found in vault carbon traps, however, is testimony that about 30.6 grams of beryllium reached not only the 80-foot level of the exhaust stack, but also the more distant location of the carbon traps. To reach the vault carbon traps, beryllium had to travel approximately a distance of 400 linear feet that
4-53
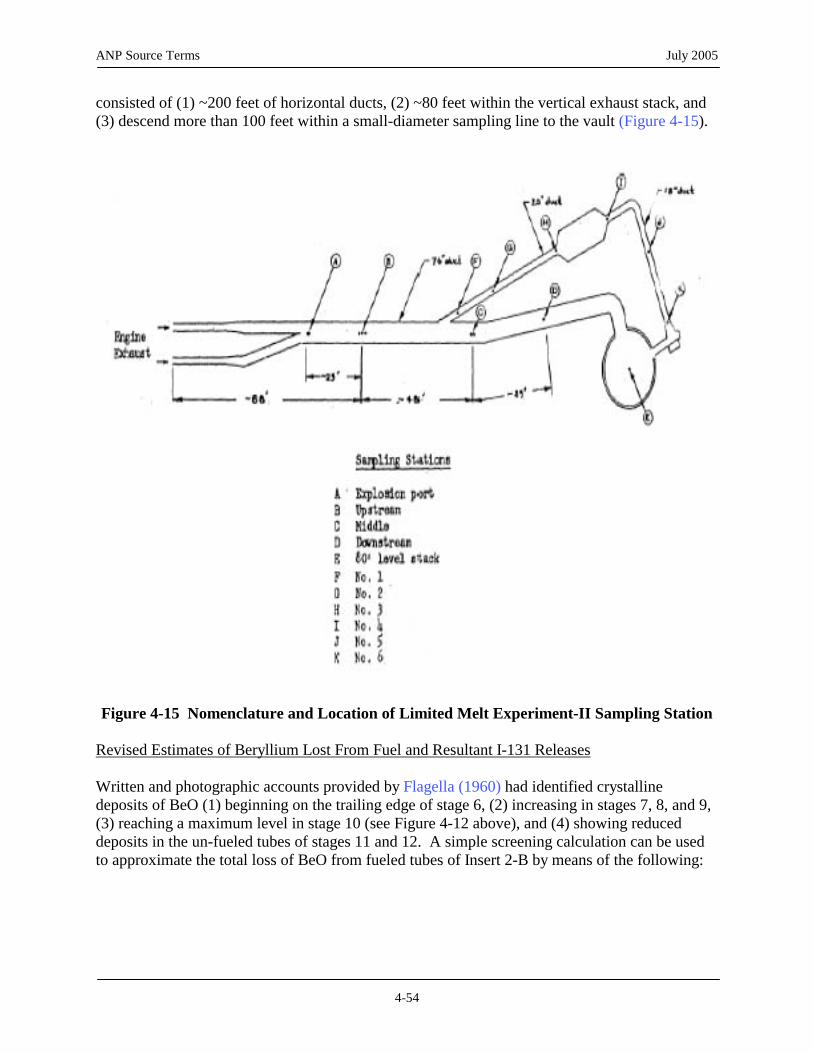
ANP Source Terms July 2005
consisted of (1) ~200 feet of horizontal ducts, (2) ~80 feet within the vertical exhaust stack, and (3) descend more than 100 feet within a small-diameter sampling line to the vault
omenclature and Location of Limited Melt Experiment-II Sampling Station
ates of Beryllium Lost From Fuel and Resultant I-131 Releases
otographic accounts provided by Flagella (1960) had identified crystalline (1) beginning on the trailing edge of stage 6, (2) increasing in stages 7, 8,
maximum level in stage 10 (see Figure 4-12 above), and (4) showing reduced un-fueled tubes of stages 11 and 12. A simple screening calculation can b
(Figure 4-15).
Figure 4-15 N
Revised Estim Written and phdeposits of BeO and 9, (3) reaching a deposits in the e used to approximate the total loss of BeO from fueled tubes of Insert 2-B by means of the following:
4-54

ANP Source Terms July 2005
• BeO Plugged Fuel Tubes of Stage 10. Figure 4-12 and written descriptions provided by Flagella (1960) imply that about 50% of the 760 fuel tubes of stage 10 were plugged with BeO deposits. The amount of BeO is derived from the following parameters:
- Fuel Tube Dimensions:
- ID = 0.2 inches = 0.508 cm - Length = 3.75 inches = 9.525 cm
- Total Interior Volume of 360 Fuel Tubes: 695 cm3 - Density of BeO: 3g/cm3 - Total Weight of BeO for 360 Fuel Plugs: 2,084 g
• Amount of additional BeO deposits observed in stages 6, 7, 8, 9, 11, and 12: 1,500 g
• Total amount of BeO in Insert 2-B: 29,800 g
• The combined deposits of more than 3,500 g of BeO correspond to a 11.74% loss
of beryllium from Insert 2-B.
• Beryllium loss/fuel failure was caused by water vapor hydrolysis that occurred principally during the latter test runs of Phase III. Iodine-131 inventories in Insert 2-B during this time ranged from about 2,000 to more than 4,500 Ci, with an average of about 3,250 Ci.
• The loss of 11.74% of BeO, which served as the principal component of the fuel
matrix, therefore implies the direct loss of about 382 Ci of I-131 from the Insert 2-B inventory.
The estimated release of about 382 Ci of I-131 from the loss of BeO is an incomplete estimate since that value does not account for additional releases of I-131 from intact ceramic fuel remaining in Insert 2-B and metallic fuel elements representing 30 fuel assemblies of the HTRE-2 parent reactor core. Release estimates for these additional sources are described below. Additional Mechanisms for Release of I-131 and Other Fission Products In addition to the direct release caused by the above-described loss of the fuel matrix, I-131 and other fission products must be assumed to have been released from the residual ceramic fuel of Insert 2-B, as well as from the metallic fuel of the parent reactor core. Parent Reactor Fuel. For HTRE No. 2, the parent reactor core of 30 fuel assemblies was identical in composition to the metallic 80 Ni–20 Cr mixture containing UO2 and encapsulated with 0.004-inch modified 80 Ni–20 Cr cladding. Barring severe fuel damage/fuel loss, the
4-55

ANP Source Terms July 2005
principal release of I-131 (and other fission products) would have involved migration/diffusion through the fuel matrix and release through minor imperfections in the cladding. Residual Ceramic Fuel. On the assumption that about 11% of the ceramic fuel of Insert 2-B was lost as a result of water vapor hydrolysis, a balance of 89% of the 5,760 fueled tubes (or about 5,126 fueled tubes) can be assumed to have also contributed to the release of I-131 and other fission products. Important to note is that the ceramic fuel tubes of Insert 2-B were without cladding. This implies that in addition to releases resulting from simple migration/diffusion to the fuel/air interface, there was yet another mechanism: the release of fission products may also occur by direct recoil at the surface-air interface. Two techniques have been used to measure the contribution by recoil: (1) fission fragment emanation studies referred to as Acatcher-foil experiments@ and (2) release measurements from in-pile LITR test assemblies (APEX-914):
• Catcher-foil Experiments. Foils of aluminum were closely wrapped around flat pieces of BeO–10 UO2–12.2 Y2O3 fuel samples irradiated in the LITR at ambient pile temperature of 150EF. Once removed, the foil was analyzed radiochemically for four isotopes and yielded the following release fractions:
Isotope Percent Released Recoil Range
(%) (mg/cm2)
I-131 0.57 3.3
Cs-137 0.54 3.1
Te-129 0.50 2.9
Y-91 0.75 4.4
• In-pile LITR Test Measurements. Recoil release from the internal surface of a BeO fuel tube was measured experimentally in over 20 in-pile LITR tests. Tests indicated that the total release values were about 0.03% for tubes with less than 2% porosity at operating temperatures of up to 2,500EF in dry air. Above 2,500EF, there is a steady increase (as shown in Figure 4-16) that shows an estimated release of about 3% for I-131 from uncoated tubes at 3,000EF. Of significance is the fact that fuel temperatures in Insert 2-B were estimated between 3,000°F and 3,200°F at time of fuel degradation (Flagella 1960). This would imply a release fraction well above 3% for I-131 from recoil alone.
4-56

ANP Source Terms July 2005
Evidence that support much higher releases than (1) implied by data provided by Foster et al. (1958) and (2) derived by the HDE Task Group also comes from descriptive information and
Figure 4-16 Total Release of Iodine-131 from Uncoated Fuel Tubes (dry air) as a Function of Maximum Test Temperature
Summary Conclusions Based on Beryllium Data A robust estimate of the total amount of beryllium released from Insert 2-B is hampered by the fact that no data has been made available that quantities the amount of beryllium hydrolyzed and re-deposited within the insert (and possibly outside the insert). From the description and post-operational photographic evidence of Insert 2-B provided by Flagella (1960), it must reasonably be assumed that the total amount of beryllium released from fuel could easily have reached 11% or more of total Insert 2-B inventory. Fuel loss of this magnitude would have corresponded to a direct release of nearly 400 Ci I-131. Additional releases from the 30 metallic fuel assemblies representing the parent reactor core and residual ceramic fuel of Insert 2-B could readily have released an additional 200 Ci of I-131 over more than 125 hours of full reactor power operations. The combined release of nearly 600 Ci of I-131 as determined from beryllium data supports the previously estimated release of 587.5 Ci cited in Table 4-8. 4.6.3 Uranium as a Surrogate for the Release of Iodines and Other Fission Products
4-57

ANP Source Terms July 2005
quantitative data provided by Flagella (1960) regarding the release of uranium from Insert 2-B fuel tubes. Post-operational inspection of Insert 2-B not only revealed large deposits of BeO that had been hydrolyzed from fuel and re-deposited within the insert as previously stated, but also showed the loss of uranium oxide (UO2) from the fuel matrix. The following description is provided by on page 36 of Flagella (1960): As the insert was unstacked in the Hot Shop two observations were made, one
being the appearance of white substance on the ID of the BeO tubes. . . . The deposit observed in the tenth stage and other stages of the 2-B was identified as BeO crystals. . . . Approximately 50 percent of the tenth stage tubes of the insert showed large deposits within each of the six cells exhibiting the same uniformity of deposit. . . .In addition to the deposits of BeO it was found that a large fraction of the fueled tubes in the tenth stage were white in appearance indicating that UO2 fuel had been lost from the tube. [Emphasis added.]
On page 52, Table 2.3 of the Flagella (1960) report, a limited data set is presented that reveals the amount of UO2 lost from three fuel tubes, representing stages 6 and 9 of Insert Tube #104 and stage 10 of Insert Tube #41. The loss of UO2 was performed by radiochemistry personnel of the remote materials laboratory (RML), who reported the following amounts of remaining UO2 in the three fuel tubes along with the following summary statement: “. . . It is seen from the Table [reproduced herein as Table 4-9] that tube #41 stage 10 lost slightly over 80% of its fuel.”
Table 4-9 Uranium Oxide Data for Three Fuel Tubes as Reported by Flagella (1960)
Insert 2-B Total UO2 Remaining (mg)
Tube 104 – Stage 6 342
Tube 41 – Stage 10 64.1
Tube 104 – Stage 9 302
To fully quantify the total loss of UO2 from the insert, the following information is presented that is contained in several technical reports that describe Insert 2-B (Flagella 1960).
• Total weight of all fueled tubes: 77.189 lbs or 35,043.8 g - total number of fueled tubes: 5760 - weight per fueled tube: 6.084 g/tube
• Total uranium investment for the Insert 2-B (93.2% enriched):
- total uranium per fuel tube: 368.8 mg/tube - total UO2 per fuel tube: 418.98 mg
4-58

ANP Source Terms July 2005
• Insert 2-B design parameters: The insert consisted of 6 triangular cells (Figure 4-3) with each cell contributing 120 cutouts for fuel tubes. There are a total of 720 cutouts per layer. At 4.1 inches in thickness, a total of 11 layers, when stacked, provide a total height of 45.1 inches for the insert fueled and non-fueled tubes.
At 3.75 inches in length per fueled or non-fueled tubes, a total of 12 tubes can be
stacked on top of each other with each tube representing one of 12 stages. In total there are 720 fuel tubes for each of the 12 stages. However, the first two stages (stages 1 and 2) and the last two stages (stages 11 and 12) are filled with BeO non-fueled tubes, which serve as reflectors. Only the middle 8 stages (stages 3 through 10) are fueled tubes and represent a total of 5,760 fueled tubes [i.e., (720 fuel tubes per stage) (8 stages) = 5,760 fueled tubes].
From descriptive information and quantitative data reported by Flagella (1960), Table 4-9 presents estimates of fuel loss that are based on the following reported observations and assumptions considered appropriate:
• Observed/Reported Values:
- Tube 104, stage 6 lost 77 mg of UO2 (or 18.3% of its total inventory) - Tube 104, stage 9 lost 117 mg of UO2 (or 27.0% of its total inventory) - Tube 41, stage 10 lost 355 mg of UO2 (or 84.7% of its total inventory)
• Derived Values: Between stage 6 and stage 9, the fuel loss increased from 77
mg/tube to 117 mg/tube. By simple linear interpolation, the loss of UO2 for stage 8 and stage 9 are estimated at 90 mg and 104 mg, respectively.
• Assumptions: For modeling the total release of UO2 cited for the five fuel tubes
representing stages 6, 7, 8, 9, and 10 are assumed to be representative of other fuel tubes located within each of these stages. Fueled tubes in the remaining stages of 3, 4, and 5 are assumed not to have a significant loss of UO2.
- For a central (or best estimate) 50% of fueled tubes in stages 6, 7, 8, 9, and 10
are assumed to have experienced a loss of UO2 that on average is identical to values cited above.
Table 4-10 summarizes the estimated losses of UO2 from Insert 2-B. The loss of UO2 is thought to have required temperatures of 3,000 to 3,200°F (Flagella 1960), which are well above the design specification of 2,750°F for the ceramic test insert. Root cause of the elevated temperatures was the progressive hydrolysis of BeO, which led to a buildup of BeO deposits on the inside of fuel tubes and a blockage of air flow. The resultant loss of UO2 must, therefore, be assumed to have occurred during latter test runs of Phase III and at a time when inventories of I-131 and other fission products were at or near their maximum levels. A loss of UO2 in the amounts of 267 g represents 11.1% of the total Insert 2-B fuel. Associated with this loss of UO2 are also all fission products contained within the fuel matrix. For illustration, the loss of 11.1%
4-59

ANP Source Terms July 2005
of fuel during a time when the average Insert 2-B inventory of I-131 is estimated at about 3,250 Ci would correspond to a release of 361 Ci of I-131. Additional releases of I-131 would also have resulted from residual inventories of fission products through the independent release mechanisms involving diffusion and recoil, as previously described, for an estimated total release of about 600 Ci of I-131.
Table 4-10 Estimated Values for the Loss of Uranium Oxide from Insert 2-B
Stage No. of Fueled UO2 Remaining UO2 Lost Per Best Estimate UO2
4 720 419† 0† 0†
5 720 419† 0† 0†
6 720 342‡ 77‡ 27.720 7 720 329§ 90§ 32.400 8 720 315§ 104§ 37.440 9 720 302‡ 117‡ 42.120 10 720 64‡ 355‡
* Best estimate assumed that 50% of tubes in a given stage were affected † Assumed no UO2 loss ‡ Empirically determined amount of residual UO2§ Interpolated UO2 loss based on Stages 6 and 9 data
Tubes Per Tube (mg) Tube (g) Lost Per Stage (g)*3 720 419† 0† 0†
127.800 Total 5760 267.480 (11.1%)
4.6.4 Evidence that Suggests Release Estimates for Noble Gases and Solids Derived by the
Historical Dose Evaluation Task Group were Underestimated For total effluent release, Foster et al. (1958) provided only partial data that furthermore is difficult to interpret. In Section 5 (page 28) of the report, the following information and data are provided (Note: the paragraphs have been numbered 1 through 5 here for easy reference in the discussion that follows):
(1) Several measures of the total effluent activity were available during IET #10. Data from four of these systems is presented in Table 4-11 . . .
(2) The stack monitor operated continuously and the presented data are
approximate averages for an entire run as scaled off a continuous chart of the dose rate reading.
(3) An ion chamber (referred to in this report as the Duct Jordan) was located
under the large duct at a point about two-thirds of the distance from the test cell to the stack. The chamber is shielded with lead brick so it is affected only by the radiation from the large duct. A continuous monitor of the dose rate reading from this instrument was available. As with the stack monitor the dose rate presented in the tabulation represents an average figure for a given run as scaled off the continuous recording chart.
4-60
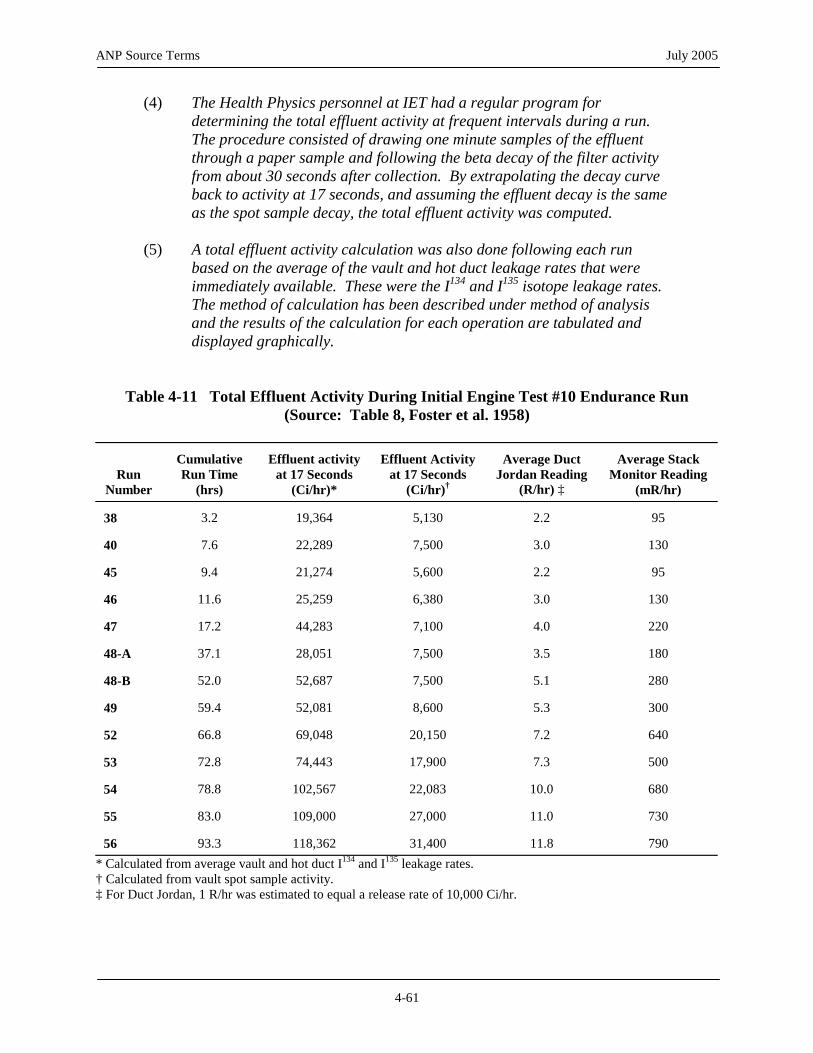
ANP Source Terms July 2005
(4) The Health Physics personnel at IET had a regular program for determining the total effluent activity at frequent intervals during a run. The procedure consisted of drawing one minute samples of the effluent through a paper sample and following the beta decay of the filter activity from about 30 seconds after collection. By extrapolating the decay curve back to activity at 17 seconds, and assuming the effluent decay is the same as the spot sample decay, the total effluent activity was computed.
(5) A total effluent activity calculation was also done following each run
based on the average of the vault and hot duct leakage rates that were immediately available. These were the I134 and I135 isotope leakage rates. The method of calculation has been described under method of analysis and the results of the calculation for each operation are tabulated and displayed graphically.
Table 4-11 Total Effluent Activity During Initial Engine Test #10 En
Run Number
Run Time (hrs)
at 17 Seconds (Ci/hr)*
at 17 Seconds (Ci/hr)†
Jordan Reading (R/hr) ‡
Monitor Reading (mR/hr)
38
3.2
19,364
5,130
2.2
95
40
7.6
22,289
7,500
3.0
130
45
9.4
21,274
5,600
11.6 25,259 6,380 3.0 130
17.2
44,283
7,100
4.0
220
37.1
28,051
7,500
3.5
52.0
52,687
7,500
5.1
28
59.4
52,081
53
72.8
74,443
17,900
7.3
500
54
78.8
102,567
22,083
10.0
680
55
83.0
109,000
27,000
11.0
730
56
* Calculated from average vault and hot duct I and I leakage rates. † Calculated from vault spot sample activity. ‡ For Duct Jordan, 1 R/hr was estimated to equal a release rate of 10,000 Ci/hr.
durance Run (Source: Table 8, Foster et al. 1958)
Cumulative Effluent activity Effluent Activity
Average Duct
Average Stack
2.2 95 46
47 48-A 180 48-B 0 49 8,600 5.3 300 52 66.8 69,048
20,150
7.2
640
93.3 118,362 31,400 11.8 790 134 135
4-61

ANP Source Terms July 2005
Paragraphs #2 and #3 cited above refer to measurements made by a stack air ionization chamber and an ion chamber located under the horizontal 76-inch duct leading to the exhaust stack. Provided in Table 4-10, Columns #5 and #6, are the dose rate responses of the two instruments in R/hr and mR/hr, respectively. For the Duct Jordan air ionization dose rate meter, Foster et al. (1958) provided an equivalence release rate value of 10,000 Ci/h per 1 R/h; no conversion value was given for the continuous stack monitor. However, as previously acknowledged, due to the absence of specific calibration data that take into consideration the geometry, air volume/flow rates, etc., these measurements provide no meaningful data for determining total effluent releases. Understandably, the HDE Task Group did not consider these measurements for its evaluation. Paragraph #5 makes reference to effluent estimates cited in Column 3 of Table 4-11. As previously explained, these estimates were based on (1) Aleakage rate@ derived from vault and hot duct carbon traps that were analyzed for I-133 and I-134, (2) the assumption that at 10-hours decay, I-133 represented 3.9% of total fission product activity, and (3) empirical fission product decay curves, which suggest that the activity at 17 seconds can be estimated by multiplying the 10-hour activity by 3.41 x 10³. For reasons that have already been given, the HDE Task Group also rejected total effluent estimates that were based on this approach. Paragraph #4 describes the methodology of using spot sampling data for estimating total effluent releases in the Foster et al. (1958) report. It was the spot sampling data cited by Foster that provided the basis for estimating total effluents by the HDE Task Group. With minor modifications, the HDE Task Group converted the 17-second spot sample release rates (cited in Column #4 of Table 4-11) to 10-minute decayed release rates. In order to estimate the relative contribution among individual radionuclides to total effluent activity, the Task Group=s approach was described as follows (Peterson and Dickson 1991):
An RSAC-4 run was performed for each run of the test series and release fractions for noble gases and solids were chosen so that the total noble gases and solid activity after a decay time of 10 minutes equaled the total activity released as determined by the spot samples . . . It was assumed that the ratio of the noble gas release fraction to the solids release fraction was constant and equaled 1000:1. (This ratio was selected based on professional engineering judgement and several RSAC-4 test runs. Lower ratio value of 100:1 and 500:1 were also considered. These smaller ratios resulted in release fractions for solids that were greater than those determined for the iodines which was not a reasonable assumption.) [Emphasis added.]
In summary, the Task Group in their calculations had (1) accepted Foster=s spot sampling data (Column 4 of Table 4-11), (2) assumed that the corresponding “total effluent release rates” represented all radionuclides, and (3) further assumed that the ratio of the release fractions of noble gases to solids was equal to 1,000:1. By decaying the 17-second releases (estimated by the HDE Task Group at 1,650,000 Ci), to 10 minutes, the HDE Task Group arrived at the following releases given in Table 4-11. Key data for Table 4-11 include the following:
4-62

ANP Source Terms July 2005
• Total Release: 264,000 Ci • Total Release of Noble Gases: 232,000 Ci • Total Release of Particulates: 32,000 Ci
An obvious concern about the Task Group=s use of Foster=s 1958 spot sampling data as the basis for estimating total effluent centers around the fact that the spot sampling method consisted of a paper filter medium that can only be assumed to have monitored the release of airborne particulates. Clearly missing from filter-paper spot sample data is the contribution of noble gases and other volatized fission products to the total release. From the brief description provided by Foster et al. (1958) (see paragraph #4 above), a presumption that the contribution of noble gases and other volatile fission products was mathematically factored into the spot sampling data (presented as Atotal effluent activity@ in Column #4 of Table 4-11) is not justified. SC&A, therefore, concluded that the HDE Task Group estimates of total effluent releases may only pertain to particulates and do not account for noble gases and other volatile fission products. If it can be assumed that the effluent activity cited in Column #4 of Table 4-11 above in reality only reflects particulates in effluent, then estimates derived by the HDE Task Group for radioactive solids are underestimated by about eight fold, as explained below. SC&A’s Revised Estimates for Total Effluent Releases SC&A concluded that among the four data sets provided by Foster et al. (1958) for estimating total effluent activity, the most credible data set corresponded to vault spot sampling (Column 4 of Table 4-11). Although this data set had also been selected by the HDE Task Group for deriving total effluent releases, SC&A’s position is that these release rates only quantified particulate emission and, therefore, excluded noble gases and volatile halogens as suggested by the following statements (Foster et al. 1958, page 28): The Health Physics personnel at IET had a regular program for determining the
total effluent activity at frequent intervals during a run. The procedure consisted of drawing one minute samples of the effluent through a paper sample and following the beta decay of the filter activity from about 30 seconds after collection. By extrapolating the decay curve back to activity at 17 seconds, and assuming the effluent decay is the same as the spot sample decay, the total effluent activity was computed.
Table 4-12 presents total particulate effluent releases that are based on Foster’s spot sample data for test runs 38 through 57, which principally define Phase III of IET #10. Thus, the data of Table 4-12 do not include particulate emissions during Phase I and Phase II of IET #10. It is estimated that the combined releases from Phases I and II represent about 10% of Phase III releases, which yield a total release of 252,197 Ci of particulate effluents normalized to 10 minutes. By means of the RSAC-4 computer code and a 1,000:1 ratio of noble gas to solids release fraction, the HDE Task Group had determined that the ratio of particulate activity to total effluent activity released to the environment was about 1:8. Thus, the release of 252,197 Ci of particulate radiation would correspond to about 2 million Ci of total effluent activity.
4-63

ANP Source Terms July 2005
Table 4-12 Total Particulate Releases Based on Foster et al. 1958 Spot Sample Data
Run
eTim ) (hrs
ample Spot-S17 n-Seco elease Rate d R
(Ci/hr)
Total Run S17- econd Release (Ci)
Total Run 10-Min. Release (Ci)
38 40 45 46 47
48-A 48-B
49 52 53 54 55 56
(57)
6.37 2.38 1.20 3.38 7.69 1.33
30.88 12.39 2.40 9.50 2.47 5.93
14.77 (1.15)
5,130 7,500 5,600 6,380 7,100 7,500 7,500 8,600
20,150 17,900 22,083 27,000 31,400
(31,400)
32,678 17,850 6,720
21,564 54,599 9,975
231,600 106,554 48,360
170,050 54,545
160,110 463,778 (54,565)
5,228 2,856 1,075 3,450 8,736 1,596
37,056 17,049 7,738
27,208 8,727
25,617 74,204 8,730
Total 1,432,948 229,270 4.7 Summary Conclusions Regarding Initial Engine Test #10 Our review of the ANP program and available scientific data suggest that IET #10 was by far the most complex and difficult to assess among those IETs that employed reactor power and produced significant environmental releases. This opinion was shared by key members of the HDE Task Group (Dickson 2002, Peterson 2002, Wenzel 2002). Initial Engine Test #10 is represented by numerous test runs that employed a previously untested ceramic fuel insert. Unique features of Insert 2-B were its fuel, which consisted of a homogeneous ceramic mixture of BeO, UO2, and Y2O3, and the fact that this fuel was without cladding. Attempts to test the insert at the specified temperature of 2,750EF proved difficult and necessitated the plugging of a majority of holes that served as air passages through the insert. Due to comprehensive failures of thermocouples that involved the melting of wire leads, actual temperatures within the ceramic insert were not measured. It was estimated that temperatures of 3,200EF were experienced by the insert=s fuel. Post-operation inspection of Insert 2-B supported the likelihood of severely elevated temperatures. The inspection revealed fused fuel tubes and the presence of substantial amounts of white crystalline deposits on the inside surfaces of fuel tubes. The deposits were most pronounced for stages 6 through 10, where they blocked the normal flow of air and served as a contributing factor to the excessive temperatures among the failed fuel tubes.
4-64
ANP Source Terms July 2005
Analysis of the white deposits confirmed the presence of beryllium, which had been removed from upstream fuel by the action of water vapor hydrolysis; beryllium was also found in effluent air by vault carbon traps that were located about 400 feet downstream from the ceramic fuel insert. No attempt was made to assess the presence of beryllium in the 200-foot horizontal duct, the exhaust stack, or the vault sampling line. In addition to the loss of BeO from fueled tubes, a limited data set provided a quantitative assessment of lost UO2 from fueled tubes. Effluent monitoring for IET #10 consisted principally of carbon traps at various downstream locations and filter paper spot sampling. Available effluent monitoring data consisted of summary data that was incomplete, inconsistent, and difficult to interpret. For these reasons the HDE Task Group elected to model IET #10 releases by (1) reinterpreting summary effluent data, (2) using a present-day computer code, and (3) making assumptions that the Task Group considered reasonable. Our review of available information for IET #10 and its interpretation by the Task Group suggests that the HDE Task Group model may have underestimated the release of radioiodines and other fission products by as much as 10 fold. Support for this conclusion comes from empirical data that include (1) an alternative interpretation of “leakage rate,” (2) data associated with the release of beryllium from Insert 2-B of IET #10, and (3) data associated with the release of uranium oxide from Insert 2-B of IET #10. Table 4-13 provides summary release data derived by the HDE Task Group and compares these data to revised estimates derived by SC&A. As noted in Table 4-13, SC&A did not attempt to divide IET #10 releases into two time periods A and B, which correspond to winter and spring planting. It is SC&A’s opinion, however, that the majority of releases coincided with fuel failure, which progressively increased in latter test runs of Phase III (i.e., February 15 through March 6, 1956).
4-65

ANP Source Terms July 2005
Table 4-13 A Comparative Summary of Release Estimates for Initial Engine
Test #10 Nuclide
Half-life
HDE-Derived Released Estimates
SC&A’s Revised Release
Estimates for IET #10 IET #10A IET #10B
Ar-41 Br-84 Kr-85m Kr-87 Kr-88+D Rb-89 Sr-89 Sr-90+D Sr-91+D Sr-92 Y-91 Y-92 Y-93 Zr-95+D Zr-97 Nb-96 Mo-99 Ru-103 +D Ru-105 Ru-106+D Sb-129 Te-131 Te-131m Te-132+D Te-133m Te-134
1.83 h
6.0 m
4.4 h
76 m
2.8 h
15.4 m
52.7 d
29 y
9.5 h
2.71 h
58.8 d
3.53 h
10.3 h
64 d
17 h
23.35 h
66 h
39 d
4.4 h
368 d
4.4 h
25 m
30 h
78 h
55 m
42 m
4.00E+03
1.67E+01
8.78E+03
1.78E+04
3.60E+04
6.23E+02
6.52E+00
2.33E-02
6.98E+01
6.23E+01
2.67E+00
6.98E+01
6.00E+01
3.10E+00
4.72E+01
4.12E-03
2.36E+01
2.25E+00
1.11E+01
3.95E-02
7.23E+00
1.19E+01
2.28E+00
1.54E+01
1.56E+01
2.47E+01
1.31E+03
3.85E+00
1.04E+04
1.97E+04
4.23E+04
4.17E+02
1.22E+01
5.82E-02
8.23E+01
7.29E+01
7.52E+00
8.58E+01
6.93E+01
8.06E+00
5.34E+01
4.70E-03
3.62E+01
5.77E+00
1.32E+01
1.06E-01
8.61E+00
1.23E+01
2.69E+00
2.54E+01
1.68E+01
2.57E+01
5.31e+03
2.26e+02
1.50e+05
2.93e+05
6.11e+05
8.11e+03
1.46e+02
1.82e-01
1.19e+03
1.05e+03
7.95e+01
1.21e+03
1.01e+03
8.70e+01
7.85e+02
6.88e-02
4.66e+02
6.26e+01
1.90e+02
1.13e+00
1.24e+02
1.89e+02
3.88e+01
3.18e+02
2.53e+02
3.93e+02
4-66

ANP Source Terms July 2005
Table 4-13 A Comparative Summary of Release Estimates for Initial Engine Test #10 (continued)
HDE-Derived Released Estimates
Nuclide
Half-life IET #10A IET #10B
SC&A’s Revised Release Estimates for IET #10
I-131
8.05 d
3.42E+01
2.07E+01
5.87e+02
I-132
2.3 h
6.00E+01
3.18E+01
9.18e+01
I-133
20.3 h
3.00E+02
8.62E+01
3.80e+03
I-134
52.0 m
2.53E+02
9.00E+01
3.43e+02
I-135
6.68 h
4.11E+02
1.20E+02
5.31e+02
Xe-129m
8.0 d
1.13E-05
2.54E-05
2.86e-04
Xe-135
9.14 h
4.50E+04
4.72E+04
7.19e+05
Xe-135m
15.6 m
4.74E+02
3.18E+02
6.18e+03
Xe-138
17.5 m
2.51E+03
1.52E+03
3.14e+04
Cs-137+D
30 y
4.86E-02
9.14E-02
1.09e+00
Cs-138
32.2 m
1.08E+04
1.15E+04
1.74e+05
Ba-139
82.9 m
4.17E+02
4.69E+02
6.91e+03
Ba-140+D
13 d
1.06E+01
2.42E+01
2.71e+02
Ba-141
18 m
6.39E+00
4.97E+00
8.86e+01
Ba-142
11 m
1.08E+00
4.15E-01
1.17e+01
La-141
3.87 h
6.80E+01
8.11E+01
1.16e+03
La-142
92.5 m
5.44E+01
6.14E+01
9.03e+02
Ce-141
32.5 d
4.57E+00
1.21E+01
1.30e+02
Ce-143
33 h
3.53E+01
4.24E+01
6.06e+02
Ce-144+D
284 d
6.60E-01
1.76E+00
1.89e+01
Pr-143
13.59 d
5.91E+00
1.89E+01
1.94e+02
Pr-144
17 m
6.60E-01
1.76E+00
1.89e+01
U-234
2.47x10⁵ y
3.06E-04
1.23E-04
3.86e-03
U-235
7x10⁸ y
9.74E-06
3.91E-06
1.23e-04
U-238
4.5x10⁹ y
9.06E-08
3.64E-08
1.14e-06
TOTAL
1.28E+05
1.36E+05
2.02e+06
4-67
ANP Source Terms July 2005
4-68
4.8 Uncertainty Regarding Initial Engine Test #10 Source Terms Unique to IET #10 was the high temperature testing of a core insert containing newly-formulated and untested ceramic fuel that furthermore was unclad. In order to raise the temperature of ceramic fuel tubes to the design test temperature of 2,750°F, substantial modifications had to be made that included plugging 144 out of 162 of the air passage holes above the Insert 2-B. It is reasonable to conclude that this modification may have led to the mal-distribution of airflow and raised fuel temperatures up to 3,200°F. An alternative explanation offered by Flagella (1960) cited the action of water vapor hydrolysis of BeO, the downstream deposition of BeO, and the resultant obstruction of airflow. Regardless of which of these explanations is correct, post-operational inspection of Insert 2-B revealed substantial fuel damage that was marked by the loss of BeO and UO2. I-131 Releases. In the absence of more credible sampling data, SC&A’s assessment of I-131 source terms focused on separately quantifying the amounts of BeO and UO2 that had been lost from fuel tubes. Nearly identical values of about 11% suggest the release of about 400 Ci of I-131. Lower- and upper-bound estimates for this value are primarily driven by uncertainty regarding the timing and duration of fuel failure. If fuel failure was a steady linear process that stretched over the entire testing period, lower inventories would have been available and quantities of as little as 100 to 200 Ci might have been released. Conversely, if fuel failure was non-linear, compressed in time, and largely restricted to the final test runs of Phase III, the near-maximum inventory of ~4,500 Ci of I-131 would have been available and resulted in an upper-bound release of ~500 Ci. SC&A had also estimated an additional release of about 200 Ci of I-131 from (1) intact ceramic fuel remaining in Insert 2-B and (2) from the 30 metallic fuel assemblies representing the parent core of HTRE No. 2. Due to the much higher operating temperature and the absence of fuel cladding, the combined release by diffusion and nuclear recoil from Insert 2-B is likely to have contributed the larger fraction. For example, a 0.05 release fraction of I-131 from residual intact ceramic fuel during a time when the average insert inventory contained about 3,300 Ci would have resulted in the release of about 150 Ci of I-131. The balance of 50 Ci of I-131 released from the 30 parent fuel assemblies would have corresponded to a release fraction of less than 0.001. While both release fractions appear reasonable for the conditions that define IET #10, it is our professional judgment that release fractions up to three-fold higher or lower may have defined actual releases. In summary, the total release of about 600 Ci of I-131 represents a best or central estimate, but releases as low as 200 Ci and greater than 1,000 Ci cannot be excluded. Total Effluent Releases. For total effluent releases, SC&A relied on data provided by Foster et al. (1958). In turn, Foster’s data reflect average vault filter paper spot sampling analyses. By far, the greatest contribution to the uncertainty of these data pertains to the unanswerable questions about the inclusion of noble gases and other volatile fission products in the spot sampling data set. The unsupported assumption that Foster’s data set of “total effluent release
B B
U U
B B
U U

ANP Source Terms July 2005
4-69
rates” included noble gases and volatiles would lead to releases that are about eight-fold lower than actual releases if said data did not include noble gases and volatiles. From statements contained in the report by Foster et al. (1958), SC&A concluded that spot sampling data did not account for noble gases and volatiles. SC&A’s estimated total effluent release of about 2,000,000 Ci, normalized to 10 minutes, should be viewed as a best estimate based on a conservative assumption. In summary, our review of available information for IET #10 and its interpretation by the HDE Task Group suggests that the HDE model may have underestimated the releases of I-131 and total effluent releases by as much as 10 fold.
U U

ANP Source Terms July 2005
R-1
REFERENCES American National Standards Institute. 1980. AGuidance for Defining Safety-Related Features of Nuclear Fuel Cycle Facilities.@ ANSI N46.1 - 1980. APEX-268. AHTRE No. 2 Hazards Evaluation,@ General Electric, Atomic Products Division, Aircraft Nuclear Propulsion Department, 1956. APEX-398. AHTRE No. 1 Design and Operational Study.@ General Electric, Atomic Products Division, Aircraft Nuclear Propulsion Department, 1958. Baker, R.E., C.C. Gamertsfelder, and R.F. Gentzler. AFinal Report First Meltdown Experiment (Operation BOOT).@ APEX-445. 1959. Baker, R.E., ASecond Limited Melt Experiment (LIME-II) Final Report.@ APEX-714. 1961. Blake, J.C., P.N. Flagella, D.W. Harris, and L.D. Jordan. AHTRE No.2 Design and Operational Summary.@ General Electric, Nuclear Materials and Propulsion Operation. APEX-731. 1961. Blake, J.C., D.W. Harris, and L.D. Jordan. AHeat Transfer Reactor Experiment No. 2.@ General Electric, Nuclear Materials and Propulsion Operation. APEX-905. 1962. Boone, F.W., J.H. Lofthouse, and L.D. Vanvleck. AGross Activity Stack Monitoring Results and Environmental Hazards Evaluation for the D101-L2A and L101-L2C Test Series.@ General Electric, Atomic Products Division, Aircraft Nuclear Propulsion Department, DC-59-7-722. 1959. Cohen, R.M. ACorrelation of TRA-2 Power Mapping Data.@ General Electric, Atomic Products Division, Aircraft Nuclear Propulsion Department, DC 55-1-113. 1955. Conn, P.K., ASummary of Fission Product Release Data from GE-ANPD Fuel Element Reactor Tests.@ APEX-544. 1959. Devens, F.G., G.D. Pincock, G. St. Leger-Barter, and L.G. Whitlow. AOperation BOOT Test Results (IET #12).@ DC 58-7-728. 1958. Dickson, R.L. Idaho National Environmental and Engineering Laboratory, [personal communication] 2002 December 3. Department of Energy (DOE) (U.S.). “External Dose-Rate Conversion Factors for Calculation of Dose to the Public.” DOE/EH-0070. 1988a. Department of Energy (DOE) (U.S.). “Internal Dose Conversion Factors for Calculation of Dose to the Public.” DOE/EH-0071. 1988b.

ANP Source Terms July 2005
R-2
Department of Energy (DOE) (US) Idaho National Engineering Laboratory Historical Dose Evaluation. DOE/ID-12119 Idaho Falls, ID. 1991. Ebersole, E.R., AAnalysis of Stack and Field Samples During IET Operations.@ U.S. Atomic Energy Commission, Health and Safety Division. IDO-12009. 1956. Flagella, P.N., (Editor). ASummary of Ceramic Fuel Element Tests in the HTRE #2.@ DC 60-12-36. 1960. Foster, D.C., S.W. Gabriel, J.W. Highbert, and N.K. Sowards. APower Testing Results from D 101 D2 Core (IET #10).@ XDCL-58-7-715. 1958 Gamertsfelder C.C., (Editor). AHTRE Hazards Report.@ General Electric, Atomic Products Division, Aircraft Nuclear Propulsion Department, APEX-180. 1954. Hansjergen, J.F. AIET Operating Report 6-24-56 to 7-2-56 Completion of IET #4 Series of Tests Summary of A-2 Reactor Operation.@ General Electric, Atomic Products Division, Aircraft Nuclear Propulsion Department, DC 56-9-723. 1956. Hilverty, N. AGross Radial Power Distribution in the TRA-2.@ General Electric, Atomic Products Division, Aircraft Nuclear Propulsion Department, XDC 55-1-100. 1955. Holtslag, D.J. AStack Gas Activity Correlation.@ General Electric, Atomic Products Division, Aircraft Nuclear Propulsion Department, DC 56-8-720. 1956. Hoover, B.J. and T. Brekken. APhotographic Investigation of A-2 Fuel Elements Second Unloading.@ General Electric, Atomic Products Division, Aircraft Nuclear Propulsion Department, CD 56-8-723. 1956a. Hoover, B.J. and T. Brekken. APhotographic Investigation of A-2 Fuel Elements Second Unloading.@ General Electric, Atomic Products Division, Aircraft Nuclear Propulsion Department, CD 56-8-715. 1956b. Hunter, H.F. and N.E. Ballou, AFission Product Decay Rates.@ Nucleonics. 1951. Jacoby, M.A. ASummary Fuel Element Thermocouple Temperature - Time History and Reactor Power - Time History.@ General Electric, Atomic Products Division, Aircraft Nuclear Propulsion Department, DC 56-6-704. 1956a. Jacoby, M.A. AIET #4 Summary Fuel Element Thermocouple Temperature - Time History and Reactor Power - Time History.@ General Electric, Atomic Products Division, Aircraft Nuclear Propulsion Department, DC 56-7-709. 1956b Lapides, M.E. ASummary Report of Thermodynamic Analysis for Project 100 Part II Fuel Elements.@ General Electric, Atomic Products Division, Aircraft Nuclear Propulsion Department,

ANP Source Terms July 2005
R-3
DC 55-7-28. 1955. Layman, D.C. AXNJ 140E Nuclear Turbojet,@ General Electric Direct-Air-Cycle, Aircraft Nuclear Propulsion Program. APEX-908. 1962. Masson, L. AIET Operating Report 5-11-56 to 5-26-56.@ General Electric, Atomic Products Division, Aircraft Nuclear Propulsion Department, DC 56-9-729. 1956. McClure, J.S. AIET Operating Report 5-28-56 to 6-9-56.@ General Electric, Atomic Products Division, Aircraft Nuclear Propulsion Department, DC 56-9-701. 1956. Minnich, S.H. ADetailed Nuclear Design of HTRE-2 A-2 Fuel Elements.@ General Electric, Atomic Products Division, Aircraft Nuclear Propulsion Department, DC 55-2-86. 1955. Muehlenkamp, G.T. ACeramic Reactor Materials.@ General Electric Direct-Air-Cycle, Aircraft Nuclear Propulsion Program. APEX-914. 1962. Nemzek, T.A. ACritical Experiment Theory Calculation, TRA II.@ General Electric, Atomic Products Division, Aircraft Nuclear Propulsion Department, XDC 55-3-30. 1955. Noakes, J.C. AIET Operating Report 4-30-56 to 5-11-56.@ General Electric, Atomic Products Division, Aircraft Nuclear Propulsion Department, DC 56-8-728. 1956. Noyes, R.N. AGross Radial Fuel Element Temperature Perturbations in the A-2 Reactor.@ General Electric, Atomic Products Division, Aircraft Nuclear Propulsion Department, DC 56-8-8. 1956. Orillion, A.G. AIET Operating Report 4-7-56 to 4-28-56.@ General Electric, Atomic Products Division, Aircraft Nuclear Propulsion Department, DC 56-6-712. 1956. Parker, G.W., G.E. Creek, and W.J. Martin, AExperiments on the Release of Fission Products from Molten Reactor Fuels.@ ORNL-2616. 1959. Parker, G.W., G.E. Creek, and W.J. Martin. APreliminary Report on the Release of Fission Products on Melting GE-ANP Fuel.@ ORNL CF-60-1-50. 1960. Peterson, H. ASource Term Quality Control Tasks (Episodic Releases) (group 5 of 21).@ Idaho National Engineering Laboratory Historical Dose Evaluation Quality Assurance Files. DOE/ID 12119-QAF-019 to -022. 1991. Peterson, H. and R.L. Dickson. ASource Term Quality Control Tasks (Episodic Releases), IET #10 Source Term Characterization.@ Idaho National Engineering Laboratory Historical Dose Evaluation Quality Assurance Files, DOE/ID-12119-QAF-026. 1991. Peterson, H. Idaho National Environmental and Engineering Laboratory, [personal

ANP Source Terms July 2005 communication] 2002 December 3. Rosenthal, H.B. ATRA-III Gamma Survey.@ General Electric, Atomic Products Division, Aircraft Nuclear Propulsion Department, DC 55-8-26. 1955. Scarborough, W.T. AIET Operating Report 6-11-56 to 6-24-56.@ General Electric, Atomic Products Division, Aircraft Nuclear Propulsion Department, DC 56-7-708. 1956. Schoenberger, T.W. A102 Project Data Book - 6th Issue,@ General Electric, Atomic Products Division, Aircraft Nuclear Propulsion Department, DC-2-118. 1958. Smith, D.L. and L.D. Koeppen. AIET Facility Radiological Characterization.@ EG&G Idaho, Inc., WM-F1-82-013. 1982. Thornton, G. and A.J. Rothstein. AProgram Summary and References,@ General Electric, Direct-Air-Cycle Aircraft Nuclear Propulsion Program, APEX-901. 1962a Thornton, G., S.H. Minnich, and C. Heddleson. AHeat Transfer Reactor Experiment No. 1.@ Comprehensive Technical Report, General Electric, Direct-Air-Cycle Aircraft Nuclear Propulsion Program, APEX-904. 1962b. Tuck, G. and B.J. Hoover. APhotographic Investigation of A-2 Fuel Elements, First Unloading.@ General Electric, Atomic Products Division, Aircraft Nuclear Propulsion Department, DC 56-6-706. 1956a. Tuck, G. and B.J. Hoover. APhotographic Investigation of A-2 Fuel Elements, First Unloading.@ General Electric, Atomic Products Division, Aircraft Nuclear Propulsion Department, DC 56-6-729. 1956b. Tuck, G. and B.J. Hoover. APhotographic Investigation of A-2 Fuel Elements, First Unloading.@ General Electric, Atomic Products Division, Aircraft Nuclear Propulsion Department, DC 56-6-730. 1956c. Tuck, G. and B.J. Hoover. APhotographic Investigation of A-2 Fuel Elements, First Unloading.@ General Electric, Atomic Products Division, Aircraft Nuclear Propulsion Department, DC 56-6-711. 1956d. Tuck, G. and B.J. Hoover. APhotographic Investigation of A-2 Fuel Elements, First Unloading.@ General Electric, Atomic Products Division, Aircraft Nuclear Propulsion Department, DC 56-6-725. 1957. U.S. AEC. ACalculation of Distance Factors for Power and Test Reactor Sites.@ Technical Information Document-14844. 1962. Wentzel, D. Idaho National Environmental and Engineering Laboratory, [personal R-4
ANP Source Terms July 2005
R-5
communication] 2002 December 3. Wilks, P.H., R.E. Baker, H.L. Bermanis, C.C. Gamertsfelder, G.P. Kerr, and F.G. Tabb. AComprehensive Technical Report General Electric Direct-Air-Cycle Aircraft Nuclear Propulsion Program.@ APEX-921. 1962.

ANP Source Terms July 2005
APPENDIX A
AN OVERVIEW OF HTRE NO. 1
FUEL ELEMENT THERMODYNAMICS

ANP Source Terms July 2005
HEAT TRANSFER REACTOR EXPERIMENT NO. 1 THERMODYNAMICS A discussion of the thermodynamic data of the Heat Transfer Reactor Experiment (HTRE) No. 1 is contained in APEX-904 and APEX-398. More detailed data are found in Cohen (1955), Hilverty (1955), Nemzek (1955), Rosenthal (1955), Jacoby (1956), and Lapides (1955). Fuel element thermodynamic assessment for the HTRE No. 1 reactor consisted of defining a fuel element structure capable of dissipating a specified heat load within limitations of maximum allowable system pressure loss and maximum fuel element temperature. Checking of these various design criteria required the interrelation of engine variables, aerothermodynamic relations for the fuel element system, nuclear characteristics of the active core, and pressure- and heat-loss characteristics of the auxiliary systems connecting the engine to the reactor. The following summarizes pertinent data used for these variables to check design and predict operating characteristics of the fuel element system. Nuclear Power Distribution Curves. The nuclear power distribution curves for the HTRE No. 1 were derived from data that defined the spatial distribution of heat within the reactor. These data are shown in Figure A-1 and in Table A-1. Since it is generally desirable to maintain a constant value of heat generation per unit of plate surface area, the individual plate fuel loadings were varied to compensate for flux decrease. Table A-1 shows the degree of uniformity in the fine radial power distribution that is possible in the reactor design. The deviations shown were largely caused by fabrication limitations on plate thickness, fuel concentration, and tolerances. An exception is the deviation noted in the outermost fuel plate, which was intentionally overloaded. The following power curve definitions apply to Table A-1: PFn - fraction of total power generated in stage n φAVn - ratio of power generated in stage n to average power per stage, also = PF/0.05556 φTEn - ratio of power generated at trailing edge of stage n to average power in stage n P/Pn - ratio of power generation in a tube to average power per tube.
A-2

ANP Source Terms July 2005
Figure A-1. Design Longitudinal Power Curve, D101A2
A-3

ANP Source Terms July 2005
Table A-1 D101A2 Core Design Power Curves
Gross Longitudinal Stage
φAVn
φTEn
PFn
1
0.7860
0.888
0.0437
2
0.7225
1.067
0.0402
3
0.8445
1.075
0.0469
4
0.9710
1.048
0.0539
5
1.071
1.035
0.0595
6
1.1475
1.028
0.0637
7
1.2115
1.018
0.0673
8
1.2505
1.005
0.0695
9
1.2620
1.001
0.0701
10
1.2515
0.987
0.0695
11
1.2115
0.98
0.0673
12
1.1525
0.971
0.0640
13
1.0735
0.962
0.0596
14
0.9825
0.952
0.0546
15
0.8740
0.943
0.0486
16
0.7655
0.951
0.0425
17
0.6860
0.968
0.0387
18
0.7365
1.274
0.0404
Gross Radial Tube
P/PAV
1
1.044
2-7
1.053
8-13
1.044
14-19
1.009
20, 21, 23, 24, 26, 27
0.978
29, 30, 32, 33, 35, 36
0.978
22, 25, 28, 31, 34, 37
0.931
A-4

ANP Source Terms July 2005
Fuel Element Design Temperatures Allowable maximum temperature depended on stress-oxidation-temperature relations, time at temperature, and location of temperature in the fuel element structure. Specifically, the maximum design temperature had to be one at which the fuel element had adequate strength to withstand aerodynamic loads and thermal stresses. At the same time, the fuel element had to maintain sufficient oxidation resistance to insure that the cladding would retain fission products and prevent oxygen penetration into the fuel material. These criteria were a function of time and of specific location in the fuel element structure; the location was significant since aerodynamic loads varied through the fuel cartridge. Limitations assigned to maximum design temperature were somewhat arbitrary because of the interrelation of stress-oxidation-temperature effects and because fuel element stresses could not be defined or calculated. For HTRE No. 1, the following limitations were assumed:
• Maximum average fuel element temperature for 100 hours operation = 1,750EF • Maximum local temperature continuous = 1,850EF • Maximum transient hot spot = 2,100EF
Proof tests in the MTR and burner rig operations provided data that, in some degree, defined the limitations of allowable fuel element temperature. MTR tests of typical fuel element sections suggested no structural or cladding defects with local temperatures of 1,850EF, aerodynamic loads approximately the same as the D101A2 reactor design maximum, and test times of more than 200 hours. Fuel Element Temperatures Fuel element temperatures are defined by the convective heat transfer relationship, which is a composite function of local air temperatures, air flow rates, and local power generation rates, as given by the following equation.
( )T TFE − =AIR x C( P A h
H)
x
where,
TFE = fuel element temperature TAIR = local air temperature P = reactor power to air AH = surfaces are at location x C = power distribution constant for location x h = heat transfer coefficient
A-5

ANP Source Terms July 2005
The power distribution constant (C) is a relative power distribution among fuel tubes, fuel rings, and fuel stages. Spatial variations in power generation rates may not only be affected by design characteristics as shown previously by the reactor gross longitudinal and radial power curves, but are also influenced by local power perturbations induced by control rod positioning or fabrication tolerances. For illustration, Figure A-2 presents stage-18 fuel element temperatures and average reactor air discharge temperatures as a function of reactor power level/chemical fuel flow/engine speed. The data indicate that, at a fixed engine speed, a 25% increase in reactor power level (i.e., 75% to 100%) increases the stage-18 fuel element temperature by about 375EF.
Figure A-2 Fuel Element and Air Temperatures as a Function of Percent Nuclear Power
A-6
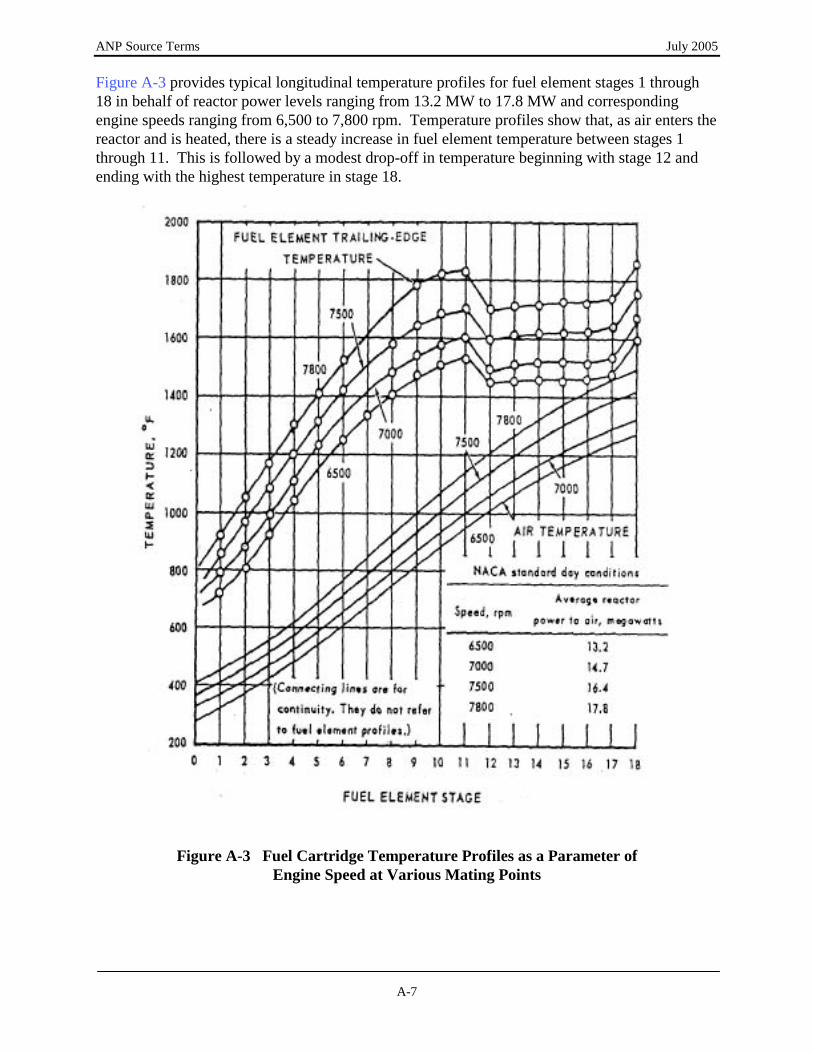
ANP Source Terms July 2005
Figure A-3 provides typical longitudinal temperature profiles for fuel element stages 1 through 18 in behalf of reactor power levels ranging from 13.2 MW to 17.8 MW and corresponding engine speeds ranging from 6,500 to 7,800 rpm. Temperature profiles show that, as air enters the reactor and is heated, there is a steady increase in fuel element temperature between stages 1 through 11. This is followed by a modest drop-off in temperature beginning with stage 12 and ending with the highest temperature in stage 18.
Figure A-3 Fuel Cartridge Temperature Profiles as a Parameter of Engine Speed at Various Mating Points
A-7

ANP Source Terms July 2005
For a single fuel stage, significant temperature variations were also observed among the 16 concentric fuel ribbons. Figure A-4 provides the fine radial temperature profile by means of thermocouple temperature readings on select rings for stage 18 of fuel tube 15 at 4 reactor power levels ranging from 12.3 to 15.2 MW.
Figure A-4 Fine Radial Temperature Profiles
Effect of Control Rod Position on Temperature Distribution Empirical data from operation IET #3 test series 30 were analyzed to determine the effects of control rod movement on temperature distribution. Series 30, runs 1 to 8, involved the complete interchange of individual rods #44 and #45 with rods #50 and #51 in increments of 3 to 5 inches. These test runs were performed to determine the effect of individual rod movement on tube power. Figure A-5 shows the location of the rods and the initial position along with the complete rod configuration for the reactor. The numbers in the fuel tube locations of Figure A-5 indicate the relative change in exit air temperature associated with the insertion of rods #44 and #45 and the concurrent withdrawal of rods #50 and #51. The relative change in exit air temperature is expressed as a percentage of the average air-temperature rise across the reactors. Figure A-6 represents relative air temperature changes (which are equivalent to the changes in relative power) for fuel assemblies in tubes 9, 26, and 33, as a function of the 4 rod positions in series 30 test runs.
A-8

ANP Source Terms July 2005
Figure A-5 Rod Pattern for Series-30 Runs (Initial Engine Test #3) Showing the Relative
Change in Exit Air Temperature Associated with the Insertion of Rods 44 and 45 and the withdrawal of Rods 50 and 51
A-9

ANP Source Terms July 2005
Figure A-6 Percentage Change in Relative Air Temperature Difference
Versus Rod Position Series 30, Initial Engine Test #3
A-10

ANP Source Terms July 2005
Temperature Distribution for Test Run 21 Run 21 of IET #3 was the first operation on 100% nuclear power. No fission product activity was noted during this run. Table A-2 presents the temperature distribution obtained in the reactor during run 21. The actual temperatures are presented in the first and third columns for the eighteenth-stage plate temperatures and the air discharge temperatures, respectively. Also presented in the last column are the deviations of each air temperature from the average temperature expressed as a percentage of the average temperature rise across the reactor. This number is proportional to the relative power in the tube when equal airflow in all tubes is assumed. (In all cases, where values are missing from the table, the absence is due to instrumentation failure.) These data show that, for test run 21 of IET #3 (and its associated control rod configuration), temperatures and/or power levels for several fuel tubes differed significantly from average values. For example, the 18th-stage plate temperature for tube 30 at 1,786EF was 173EF above the average temperature of 1,613EF; tube 30 also operated at a power level that was 15.79% above the average power level for all 37 tubes. Summary Conclusions The most severely damaged fuel elements associated with IET #3 were those that showed compelling evidence of melting or burning, which reflect excessively high fuel temperatures. From data presented above, temperature maldistribution may reflect significant variations of power levels among fuel tubes/fuel elements due to the inherent physical design of the reactor and its operation that includes the configuration of control rods. Fuel temperatures are also heavily affected by local air temperatures and local air flow rates. Thus, structural deviations and/or damage that impedes air flow are clearly linked to elevated fuel temperatures. Accordingly, highly localized power levels and deviation in air flow may independently give rise to elevated fuel temperatures or be causally linked to each other in giving rise to elevated fuel temperatures as explained by the following examples:
Example #1: Elevated local power levels may induce elevated fuel temperatures leading to fuel failure without adversely impacting local air flow/air temperature.
Example #2: Under conditions of uniform power distribution, local structural damage that impedes local air flow may induce excessive localized fuel heating.
Example #3: Elevated local power levels may induce high temperatures in both fuel elements and proximal structural components that subsequently impact air flow. The resultant fuel damage is, therefore, triggered by localized high power levels and amplified by the resultant damage that impedes air flow.
A-11

ANP Source Terms July 2005
Table A-2 Temperature Distribution in the Reactor During Run 21, Initial Engine Test #3
T1 - Tavg
Tube No.
18th-Stage Plate Temperature, EF
T-Tavg
Air Discharge Temperature, EF
Tavg - Tinlet
(Air Discharge) 1
1623
10
1095
-10.73
2
1417
-196
1310
13.08 3
1558
-55
4
1621
8
943
-27.38 5
1233
4.59
6
7
1628
15
1266
8.22
8
1750
137
1305
12.47 9
1603
-10
1175
-1.84
10
1678
65
11
1607
-6
12
1564
-49
1204
1.34 13
1662
49
14
1567
-46
1175
-1.85 15
1708
+95
1234
4.54
16
1286
10.44 17
1571
-42
1344
16.78
18
19
1255
7.02
20
1623
10
1175
-1.83 21
1714
+101
1294
11.32
22
1174
-1.94 23
1597
-16
24
1110
-8.95 25
1242
5.59
26
1206
1.63 27
1671
58
1156
-3.93
28
1523
-90
1166
-2.82 29
1154
-4.30
30
1786
173
1335
15.79 31
1652
39
1110
-9.00
32
1637
24
1165
-2.93 33
965
-24.98
34
1191
-0.03 35
1518
-95
1163
-3.16
36
37
1188
-0.32
A-12

ANP Source Term July 2005
APPENDIX B
UMMARY DATA FOR RELEASE FRACTIONS
ESTIMATED FOR OPERATION BOOT
S

ANP Source Term July 2005
OPERATION BOOT Operation BOOT (burnout one tube) was an experiment that represents IET #12. This experiment was designed to obtain information relative to the radiological hazards associated with the release of fission products from a high-performance air cycle reactor. Fission products may be released as a consequence of reactor malfunctions that result in rupturing, melting, burning, or excursion of the reactor core. This experiment was an attempt to ascertain the consequences of severely restricting the coolant airflow through one fuel cartridge of an operating reactor, thereby causing it to melt or burn with subsequent release of part of the fission product inventory. Monitoring data and estimates of radionuclide release fractions in behalf of BOOT are of relevance to other IETs (specifically IET #3) where high localized temperatures resulted in fuel failure. Data presented in this appendix were taken from the following documents:
• Devens FG, Pincock GD, St. Leger-Barter G, Whitlow LG, 1958. Operation BOOT Test Results (IET #12). DC 58-7-728.
• Baker RE, Gamertsfelder CC, Gentzler RF, 1959. Final Report First Meltdown
Experiment (Operation BOOT). APEX-445.
• Wilks PH, Baker RE, Bermanis HL, Gamertsfelder CC, Kerr GP, Tabb FG, 1962. Comprehensive Technical Report General Electric Direct-Air-Cycle Aircraft Nuclear Propulsion Program. APEX-921.
In order to determine the fractional release of radioiodine that was considered the limiting radioelement, a predetermined fission product inventory was required. Thus, the reactor was operated at full power for two hours two days before the planned release date; the intended test period that would produce the burn-up of one tube was expected to last a full ten minutes at full power. Release Fractions Observed for Simulated Conditions Prior to BOOT Prior to the planning of the BOOT experiment, a few small samples (~ 0.1 gram of UO2) of metallic Ni-Cr fuel elements were sent to ORNL where they were irradiated in the graphite pile and subsequently melted and analyzed to determine the fractional release of some of the fission products. Fractional release estimates were made for two conditions: (1) a single, very quick melt (~ 30 seconds) with subsequent cooling, and (2) a sustained melt over a period of several hours until the sample was essentially entirely oxidized. The experimental conditions and results of these experiments are summarized below. In the experiments conducted at ORNL (Parker 1960), flat, thin specimens of metallic fuel about one-square centimeter in area and weighing approximately 0.1 gram were subject to induction heating inside a quartz crucible. A vertical quartz tube through which the released fission products were transported to several trapping media that included millipore filters, activated charcoal, and chemical absorbents surrounded the crucible.
B-2

ANP Source Term July 2005
B-3
Two experiments were performed in which fuel samples were brought to the melting point over a period of about 30 seconds and held in a molten state for only an instant or samples were held molten for about four hours. The results of these experiments are given in Table B-1. For the Aquick melt,@ only about 4% of the iodine present was released along with 10% of the rare gases, 0.5% of cesium, and negligible amounts of strontium. When samples were held molten for several hours, nearly 80% of the iodine was released with similar levels for xenon. Table B-1 Fractional Release
Quick Melt
Prolonged Melt
Gross gamma
0.004
0.08
Xenon
0.10
0.77
Iodine
0.04
0.77
Cesium
0.005
0.016
Strontium
10-6
10-4
If the difference between the experimental conditions of the Parker (1960) release fraction determination and the condition one might expect in a reactor melt are considered, the Parker (1960) data could only be expected to be approximations of the expected conditions. Critical Design Features For BOOT The complete Heat Transfer Reactor Experiment (HTRE) power plant was used for Operation BOOT. The parent reactor (HTRE No. 2) was used with the Insert 1d to provide the source of fission products for this experiment. A complete description of HTRE No. 2 and the Insert 1b is given in APEX-268. Insert 1d contained six fuel cartridges, three of the set-1 type (11 fuel rings), and three of the set-2 type (10 fuel rings). All cartridges contained 18 stages. Fuel cartridges were installed in insert holes 2 through 7, with the center hole (hole 1) containing a beryllium moderator bar. Figure B-1 is a drawing of the Insert 1d cross section. Insert tubes 2 and 6 were fitted with a remotely controlled air-activated valve, which was used to instantaneously block a fixed fraction (about 0.66) of the air supply to the fuel tube. This air blockage was designed to produce a rapid increase in temperature of the fuel cartridge, culminating in partial destruction of the cartridge, and yet provide sufficient airflow to flush the gaseous fission products from the moderator tube. Amounts of the 93.4% enriched UO2 in the parent core and insert fuel cartridges were as follows:
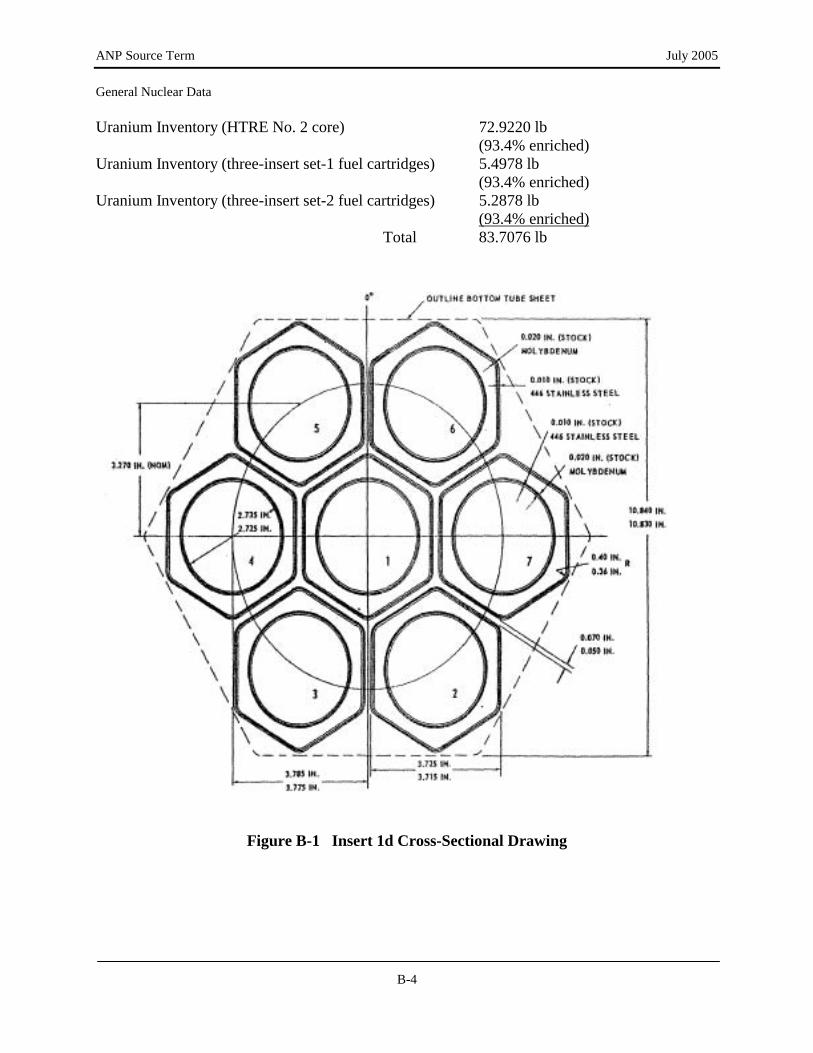
ANP Source Term July 2005
General Nuclear Data Uranium Inventory (HTRE No. 2 core) 72.9220 lb
(93.4% enriched) Uranium Inventory (three-insert set-1 fuel cartridges) 5.4978 lb
(93.4% enriched) Uranium Inventory (three-insert set-2 fuel cartridges) 5.2878 lb
(93.4% enriched)Total 83.7076 lb
Figure B-1 Insert 1d Cross-Sectional Drawing
B-4
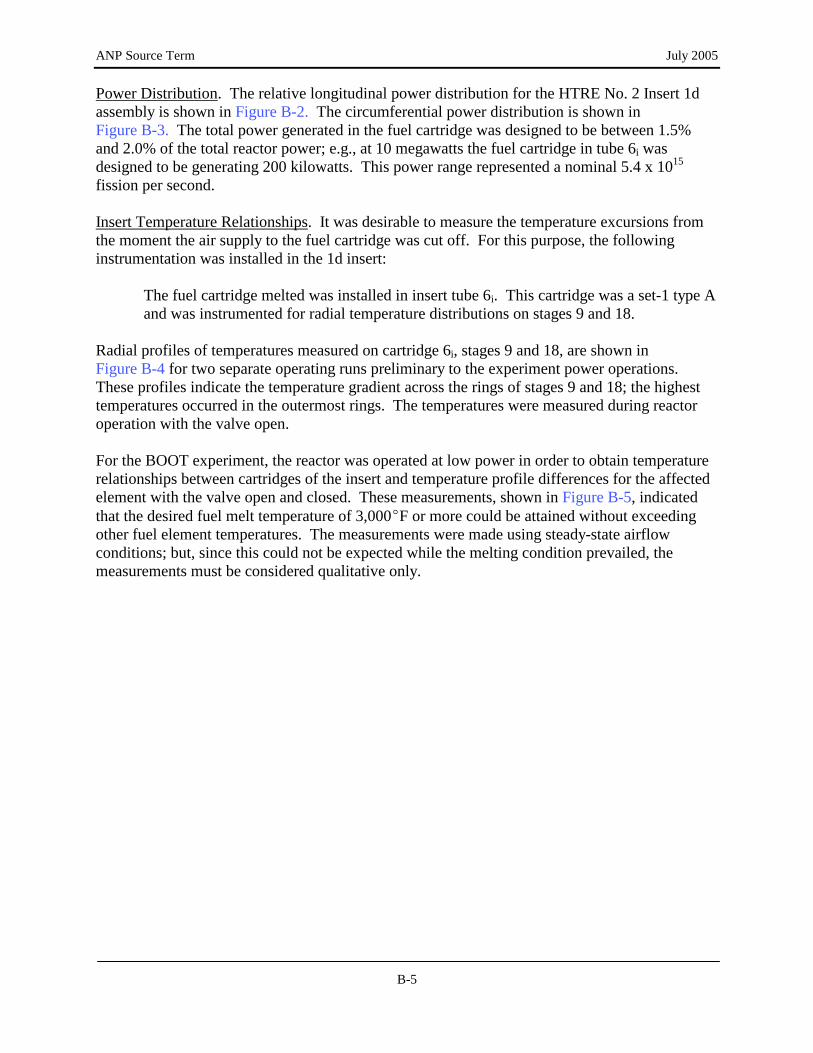
ANP Source Term July 2005
Power Distribution. The relative longitudinal power distribution for the HTRE No. 2 Insert 1d assembly is shown in Figure B-2. The circumferential power distribution is shown in Figure B-3. The total power generated in the fuel cartridge was designed to be between 1.5% and 2.0% of the total reactor power; e.g., at 10 megawatts the fuel cartridge in tube 6i was designed to be generating 200 kilowatts. This power range represented a nominal 5.4 x 10¹⁵ fission per second. Insert Temperature Relationships. It was desirable to measure the temperature excursions from the moment the air supply to the fuel cartridge was cut off. For this purpose, the following instrumentation was installed in the 1d insert: The fuel cartridge melted was installed in insert tube 6i. This cartridge was a set-1 type A
and was instrumented for radial temperature distributions on stages 9 and 18. Radial profiles of temperatures measured on cartridge 6i, stages 9 and 18, are shown in Figure B-4 for two separate operating runs preliminary to the experiment power operations. These profiles indicate the temperature gradient across the rings of stages 9 and 18; the highest temperatures occurred in the outermost rings. The temperatures were measured during reactor operation with the valve open. For the BOOT experiment, the reactor was operated at low power in order to obtain temperature relationships between cartridges of the insert and temperature profile differences for the affected element with the valve open and closed. These measurements, shown in Figure B-5, indicated that the desired fuel melt temperature of 3,000EF or more could be attained without exceeding other fuel element temperatures. The measurements were made using steady-state airflow conditions; but, since this could not be expected while the melting condition prevailed, the measurements must be considered qualitative only.
B-5

ANP Source Terms July 2005
Figure B-2 Longitudinal Power Distribution - Insert 1c, Tube 6
B-6
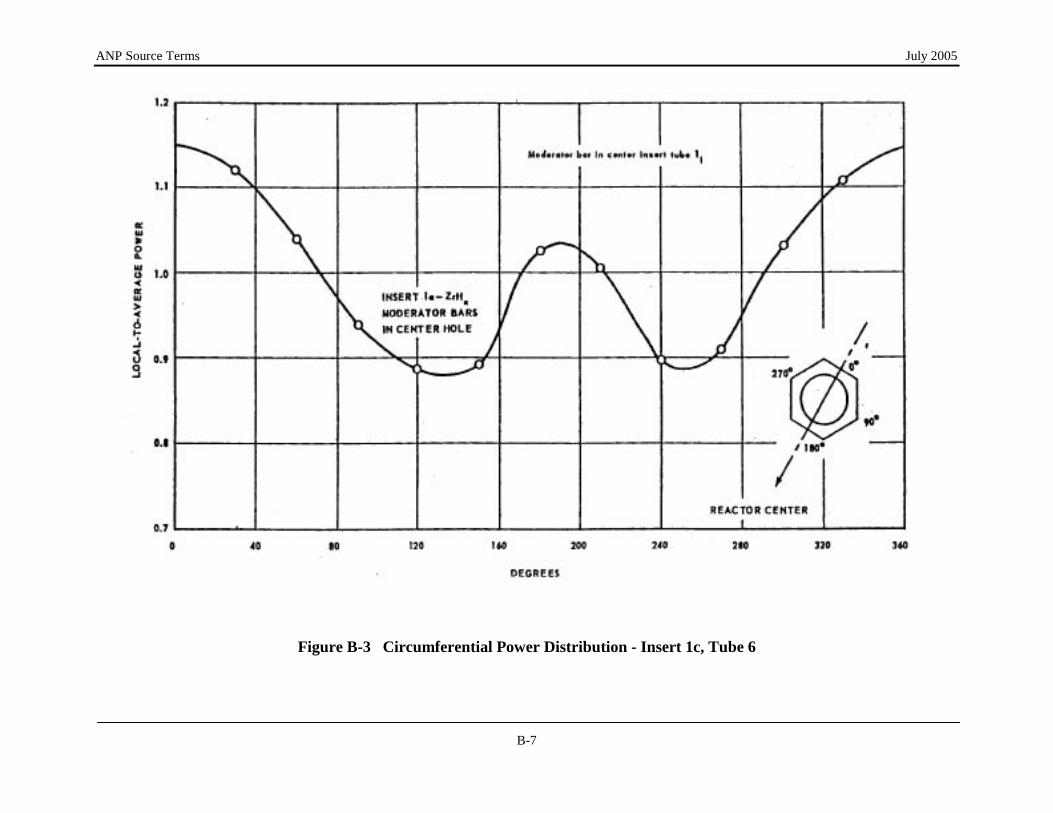
ANP Source Terms July 2005
Figure B-3 Circumferential Power Distribution - Insert 1c, Tube 6
B-7

ANP Source Terms July 2005
Figure B-4 Radial Temperature Profiles - Cartridge 6i, Stage 9 and 18
B-8
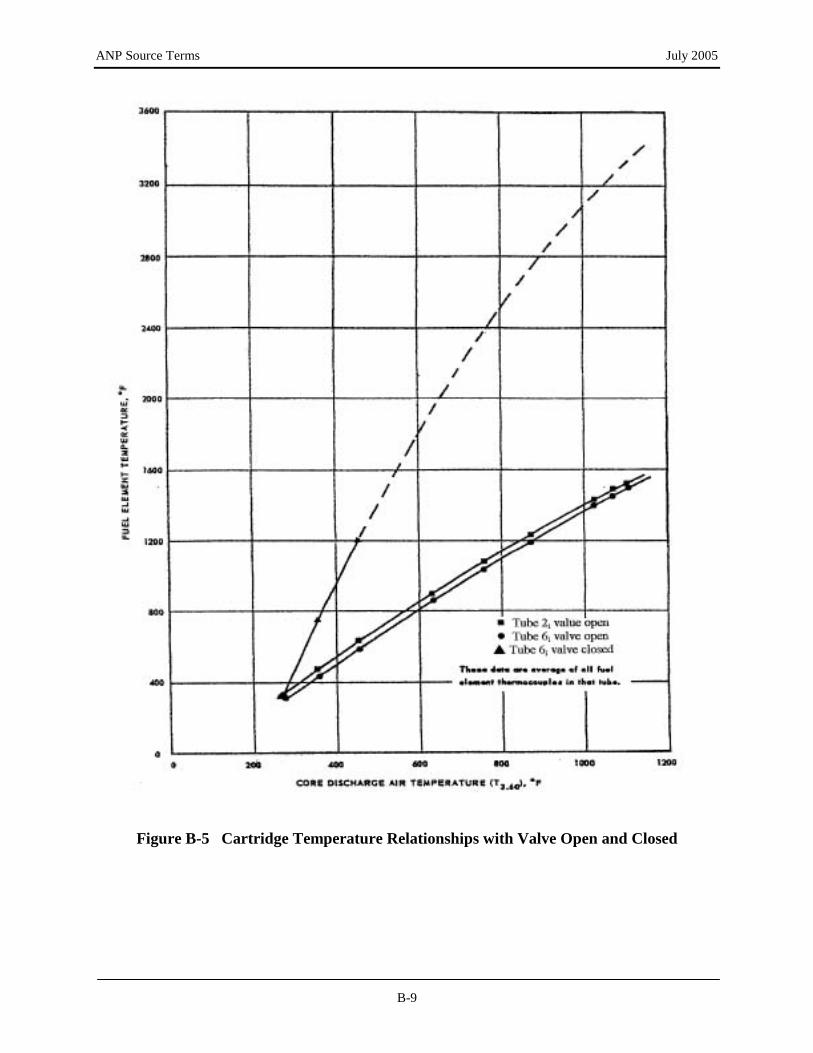
ANP Source Terms July 2005
Figure B-5 Cartridge Temperature Relationships with Valve Open and Closed
B-9

ANP Source Terms July 2005
The following is a list of operating characteristics for the power operation of the 1d insert.
• Total power (parent and insert) 11.4 MW
• Design insert power 11% of total
• Insert moderator temperature (design) 1,000E to 1,500EF
• Insert fuel cartridge temperature (tube 6i) Normal operating maximum 1,750EF
• Insert fuel cartridge temperature (tubes 3, 4, 5, 7) Operating maximum 1,300E to 1,500EF • Insert fuel cartridge temperature Peak during melt > 3,000EF • Parent core fuel cartridge temperature Design maximum average 1,300EF to 1,500EF • Parent core fuel cartridge temperatures Hot spots 1,750EF • Insert center moderator rod temperature Design maximum 900E to 1,100EF
Effluent Sampling and Monitoring Devices Several effluent sampling devices were used in an attempt to determine the magnitude and characteristics of the fission products released from the reactor during the experiment. The type and location of the sampling probes or chambers and collecting devices are given in Table B-2. All carbon traps used in the CTF were 0.86-inch inside diameter and 14 inches long. The traps were filled with 20-30 mesh carbon.
B-10

ANP Source Terms July 2005
Table B-2 Location and Effluent Sampling Devices
Location and Sampling Probe
Collecting Device
76-inch duct between test cell and stack
Six carbon traps in ice baths.
80-foot level of stack
$ Stack monitor (continuous filter) $ Spot sample collector $ Two carbon traps in series - the first in
an ice bath, the second in a liquid nitrogen bath
Below 76-inch duct (chamber)
Duct Jordan - Ionization chamber
In addition to the above-cited CTF sampling and monitoring devices, the BOOT experiment employed a field sampling network that covered a 60-degree angle downwind sector. One of the objectives of field monitoring was to correlate isotope concentrations collected by air sampling devices to effluent monitoring data. Table B-3 identifies type and number of samples and their downwind distances.
Table B-3 Types, Numbers, and Location of Sampling Devices
Radial Distance from IET Stack, feet
Type of Sample
100 1,500
2,000
3,000
4,000
8,250
13,000
20,000
High-volume air samplers
0
0
0
0
17
27
27
33
Carbon traps
0
0
0
3
4
0
0
0
Flat fallout plates
9
17
17
17
17
27
27
33
Pocket ion chambers
9
17
17
17
17
27
27
33
Film badges
9
17
17
17
17
27
27
33
Conduct of the BOOT Experiment and Results The reactor was operated for an equivalence of 2 hours at 11.4 megawatts on April 30, 1958, in order to establish a satisfactory inventory of I-131 and other fission products of relatively long half life in the fresh cartridge to be melted. The reactor was then shut down and allowed to decay until May 2, 1958, when it was once again operated for an equivalence of 12 minutes at full power to establish an inventory of fresh fission products. With the valve open, the power level produced a maximum temperature on fuel tube 6i of 1,750EF; other insert fuel cartridges were operating cooler because of lower resistance to flow (the venturi installed on tube 6i somewhat restricted the flow to these tubes.) The inventory of the various iodine isotopes in the cartridge is shown graphically in Figure B-6 as a function of time since the beginning of the first power operation (assumed to be
B-11

ANP Source Terms July 2005
approximately 1220 hours, April 30, 1958, for purposes of calculations). The valve limiting the coolant air to cartridge 6i was closed at the end of the second (shorter) power operation while the rector was still operating at a total power of 11.4 megawatts. The sequence of events following the closing of the valve was quite significant and rather surprising. Signals from thermocouples from various stages of the cartridge, the moderator surrounding it, and the exit air were recorded simultaneously with linear flux, control rod frame position, duct Jordan response, and other reactor information. The closing of the valve caused the cartridge 6i temperatures to rise about 70EF per second until stages assumedly started melting and losing fission products and uranium. There was a slight loss of power 8 seconds after the valve was closed, but the power remained relatively constant for the first 10 seconds. At 10.5 seconds, there was a sharp loss of about 6% in linear power. At 11.5 seconds, there was another power loss of about 1%, and at 12.5 seconds, there was another loss of about 6% followed by a continuous drop of 3% over the next 1-1/2 seconds. At 15 seconds, the reactor scrammed. Data indicate that the automatic controls attempted to maintain power, but the loss of reactivity overwhelmed the system before the scram occurred. Both power and frame position changes are shown in Figure B-7. The duct Jordan indicated a first sharp peak of activity 13 seconds after the valve was closed. A second peak was recorded at 17 seconds, and a third peak at 21 seconds followed by a rather gradual decrease. The duct Jordan response dropped to Abackground@ by the 56th second. A delay between the time of release and any indication by the duct Jordan may be expected because considerable ducting had to be traversed before the Jordan chamber was affected by the radiation from the airborne residue. The duct Jordan response is shown in Figure B-8. Excessive temperatures and physical changes experienced within the insert during the experiment caused many of the thermocouples to become inoperative. Fortunately, some remained intact, and measurements for some of the locations in cartridge 6i, the moderator block, and the exit air are shown in Figure B-9.
B-12

ANP Source Terms July 2005
Figure B-6 Iodine Inventory in Cartridge 6i as a Function of Time After Startup
B-13

ANP Source Terms July 2005
Figure B-7 Reactor Power and Frame Positions During Melt
B-14

ANP Source Terms July 2005
Figure B-8 Duct Jordan Response During Melt
B-15

ANP Source Terms July 2005
Figure B-9 Cartridge 6i, Air, and Moderator Temperatures During Melt
B-16

ANP Source Terms July 2005
Photographic Analysis of Cartridge No. 6 After cartridge 6i was melted, the valve used to restrict the air to cartridge 6i was opened on May 6, 1958, and the reactor was taken stepwise to 1%, 5%, 20%, and 40% of full power. Thermocouples still in working order on cartridge 6i indicated temperature rises comparable to those noted when the valve restricting the air to tube 6 was closed. Detection instruments also indicated increased activity in the effluent. It was concluded that a restriction somewhere in tube 6 was limiting the coolant so severely that any additional power would cause cartridge 6i to remelt. The decision was then made to return the reactor to the hot shop for dismantling and examination. (In effect, a second and parallel experiment that was to involve Tube #3 was not conducted.) When the insert was removed from the parent core, it was noted that a hole had been burned through the side of the moderator tailcone of tube 6 (Figure B-10). Examination of the aft end of the insert revealed an appreciable plug of molten residue and partial stages in the moderator tailcone. Figure B-11 is a photo of the underside of tube 6i showing the plug. The cartridge was subsequently cut apart to reveal damage to the individual stages. Figure B-12 shows the split moderator block 6i and the cartridge within. The cartridge contained 18 stages. Negligible damage could be detected through the first seven stages. Stage 7 is shown in Figure B-13. Stage 8, Figure B-14, showed the first signs of Ablister@ formation. Stage 9, Figure B-15, was severely blistered to the point that it could have been a major cause of the airflow restriction noted when the reactor was operated at partial power after the melt. Stages 10 through 18, shown in Figures B-17 through B-24, were damaged to the extent that in a few cases, there was not much more than a portion of the outer rings remaining. Most of the inner rings from these stages had partially melted and fused into a mass, which had solidified in the tailcone, forming the plug that had been observed in the hot shop (see Figure B-25). A wire basket, which was placed aft of the tailcone of the tube in an attempt to catch a sample of the slag, was missing when the insert was examined. It was later found in the instrument harness below the insert. The wire had partially melted, but the basket still contained an appreciable sample of stage-18 residue, as shown in Figure B-26.
B-17
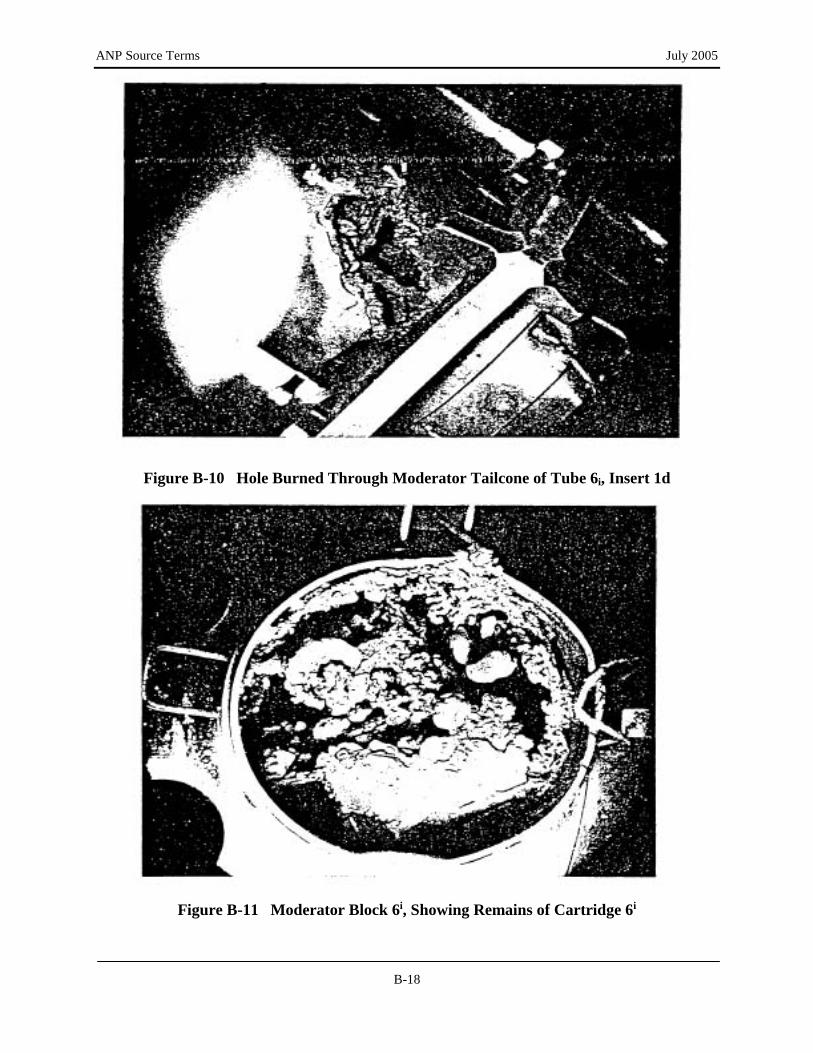
ANP Source Terms July 2005
Figure B-10 Hole Burned Through Moderator Tailcone of Tube 6i, Insert 1d
Figure B-11 Moderator Block 6i, Showing Remains of Cartridge 6i
B-18
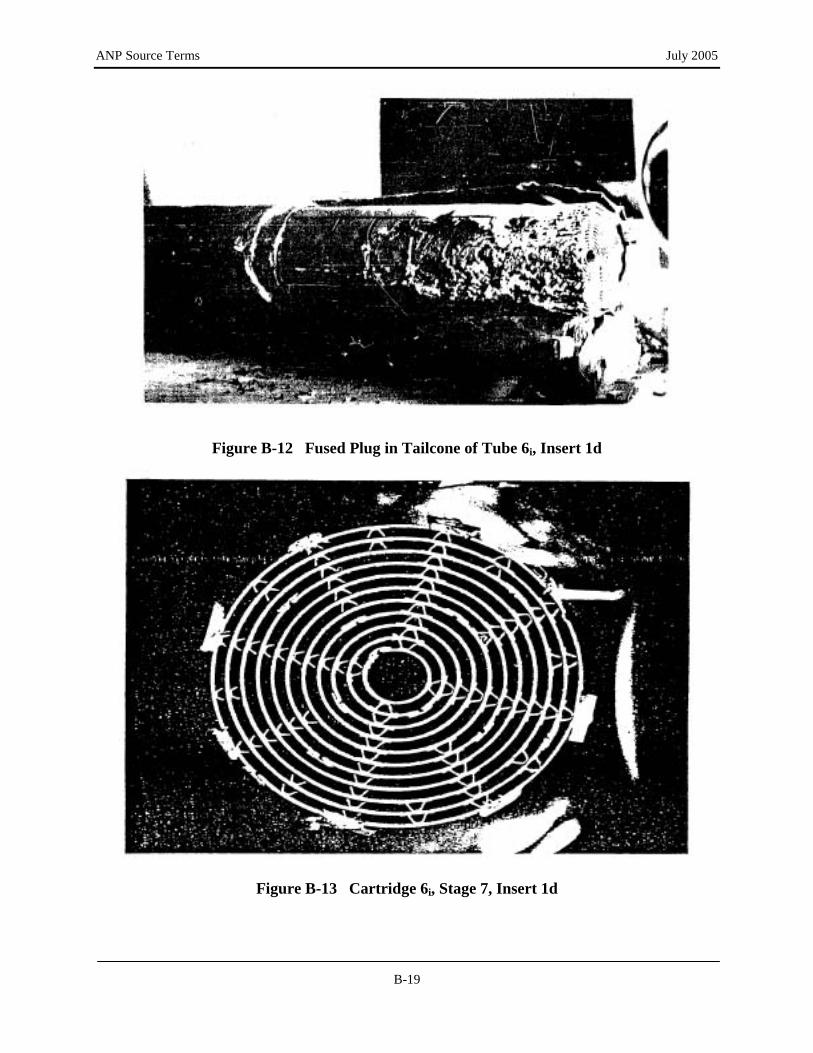
ANP Source Terms July 2005
Figure B-12 Fused Plug in Tailcone of Tube 6i, Insert 1d
Figure B-13 Cartridge 6i, Stage 7, Insert 1d
B-19
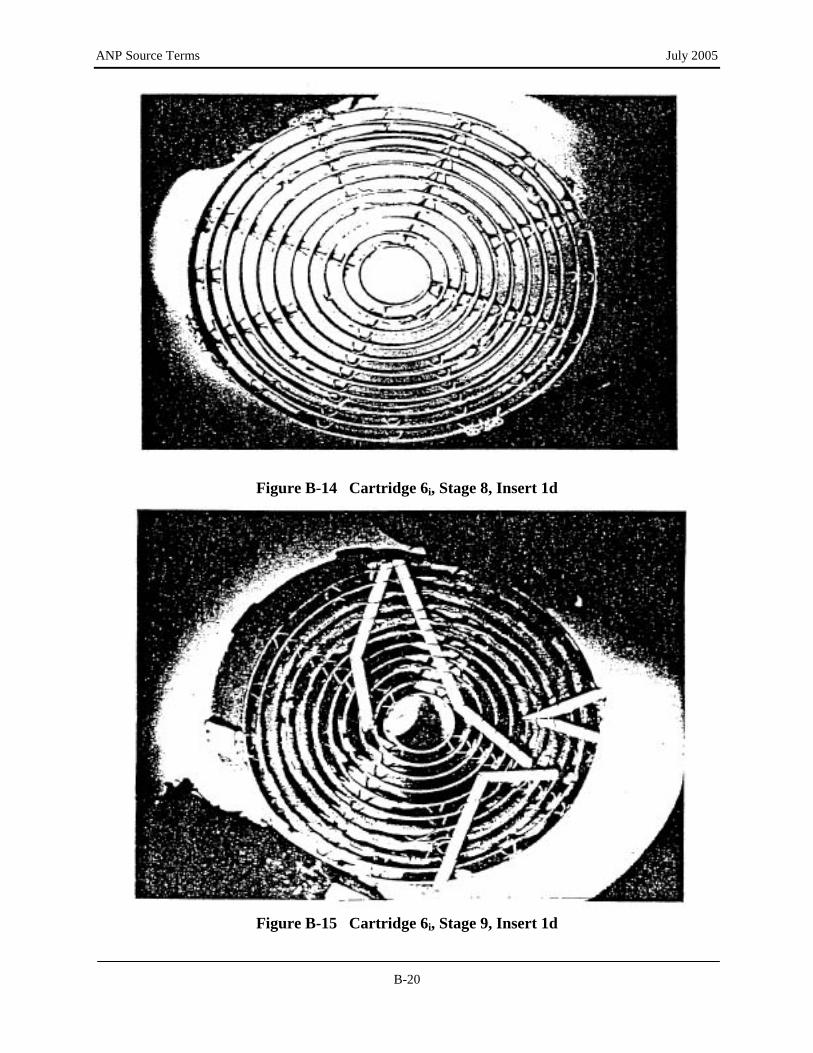
ANP Source Terms July 2005
Figure B-14 Cartridge 6i, Stage 8, Insert 1d
Figure B-15 Cartridge 6i, Stage 9, Insert 1d
B-20

ANP Source Terms July 2005
Figure B-16 Cartridge 6i, Stages 10, 11, 12, 13, 14, and 15, Insert 1d
Figure B-17 Cartridge 6i, Stage 10, Insert 1d
B-21

ANP Source Terms July 2005
Figure B-18 Cartridge 6i, Stage 11, Insert 1d
Figure B-19 Cartridge 6i, Stage 12, Insert 1d
B-22
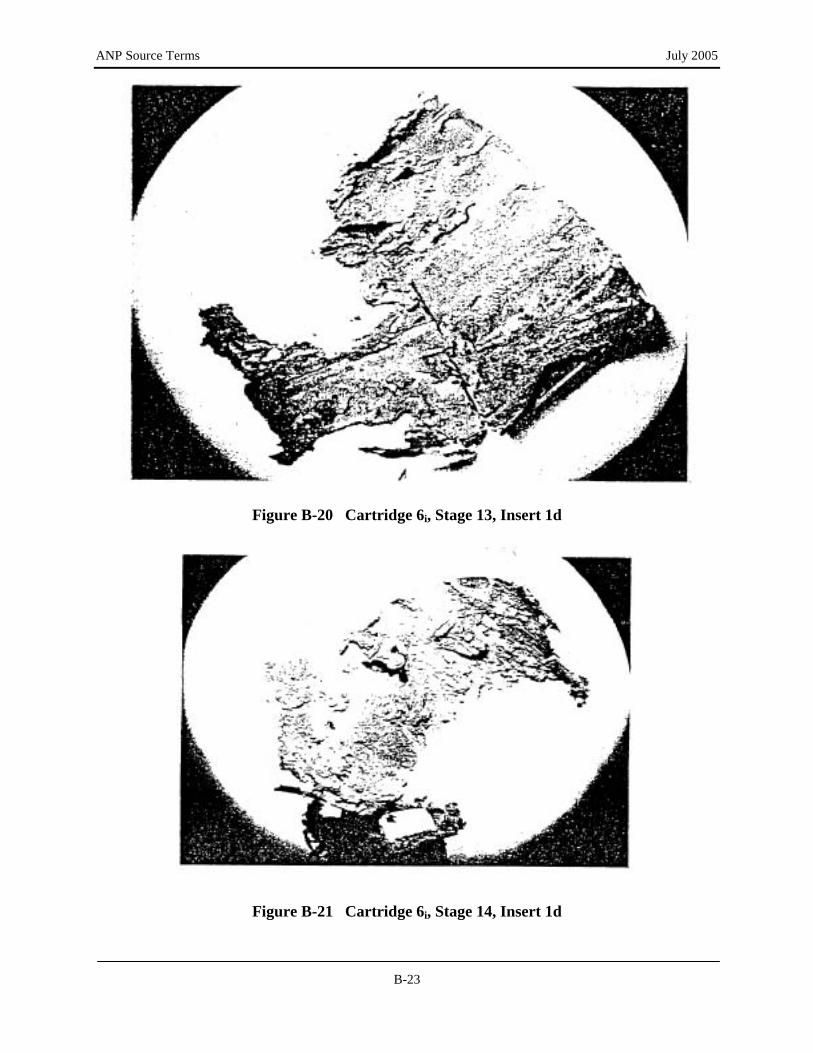
ANP Source Terms July 2005
Figure B-20 Cartridge 6i, Stage 13, Insert 1d
Figure B-21 Cartridge 6i, Stage 14, Insert 1d
B-23

ANP Source Terms July 2005
Figure B-22 Cartridge 6i, Stage 15, Insert 1d
Figure B-23 Cartridge 6i, Stage 16, Insert 1d
B-24

ANP Source Terms July 2005
Figure B-24 Cartridge 6i, Stages 16, 17, 18, Insert 1d
Figure B-25 Plug of Slag and Residue from Tailcone of Tube 6i, Insert 1d
B-25

ANP Source Terms July 2005
Figure B-26 Remains of Wire Basket Containing Residue from Stage 18
Effluent Data Following the test, the carbon traps in the exhaust system were taken to the radiochemical laboratory, where the radioactive iodine, barium, and strontium were separated from an aliquot of the first five inches of the carbon traps. The resulting separations were taken to the counting laboratory where they were counted or analyzed using a 256-channel, gamma-ray-spectrum analyzer. By taking the ratio of the amount of the specific isotope in the effluent to the amount calculated to be present in the whole fuel cartridge, the release fraction was determined. Uranium separations were also performed on the carbon traps. The fractional release of specific fission products, as determined by radiochemical separation and analyses of carbon traps in the CTF are given in Table B-4. The data reveal a significant variation among the six carbon traps as well as variations among radioiodine release fractions for any given trap.
B-26

ANP Source Terms July 2005
Table B-4 Percent Fractional Release*
Location of Sample
I-131
I-133
I-134
I-135
Ba-140
Sr-91
76-in. Duct Loop 1 (carbon trap)
9.20
9.27
26.4
28.8
0.866
2.66
76-in. Duct Loop 2 (carbon trap)
1.70
0.924
11.7
8.64
0.296
1.03
76-in. Duct Loop 3 (carbon trap)
1.66
1.64
6.84
4.32
0.205
0.717
76-in. Duct Loop 4 (carbon trap)
5.76
5.15
1.56
0.984
0.088
0.235
76-in. Duct Loop 5 (carbon trap)
1.26
1.16
2.50
2.35
0.205
0.370
76-in. Duct Loop 6 (carbon trap)
0.274
0.228
0.492
0.286
0.064
0.018
* AFraction Release@ used here is the amount of the isotope released divided by the amount theoretically contained in the entire cartridge and multiplied by 100.
Based on velocity profile measurements made in the 76-inch duct, it was concluded that the sampling probe for duct loop 1 was in a very poor location with respect to obtaining representative samples. Furthermore, the results of the analyses indicated that the sampling device for duct loop 6 was not functioning properly. Thus, if the results of analyses of samples from duct loops 1 and 6 are disregarded, the average and standard deviations for percent fractional release as indicated by duct loops 2, 3, 4, and 5 are as follows:
I-131: 2.60 " 1.84 I-133: 2.22 " 1.71 I-134: 5.65 " 4.01 I-135: 4.07 " 2.90 Sr-91: 0.588 " 0.310
As evidenced by photographic analysis of fuel cartridge 6, however, damage was largely limited to stages 10 through 18. Thus, the percent fractional release values are about twice the above-cited values when expressed in behalf of damaged fuel. For I-131, therefore, effluent sampling data suggest a percent release fraction of 5.2 (or a release fraction of 0.052) for Adamaged fuel.@ An Alternative Method for Estimating the Percent Release Fraction(s) for I-131 A second method was employed by INEL in an attempt to determine the fractional release of I-131 from damaged fuel. Samples of fuel residue were taken from (1) the basket (see Figure B-26), (2) the plug (see Figure B-25), and (3) ring 11 of stage 18 (see Figure B-24) for chemical analyses. Each sample was analyzed for uranium, Zr-95, and I-131. Using the average power of the fuel insert, theoretical activity values were calculated for both I-131 and Zr-95 (i.e., dpm/Fg of U). All experimental determinations for Zr-95 were within (") a factor of two of the theoretical value. The power distributions within the cartridge likewise vary (") by a factor of two (see Figure B-2). Since there was no way of telling where a specific
B-27

ANP Source Terms July 2005
sample of molten slag originated, the experimental findings appeared to be in reasonable agreement with what might be expected theoretically. Assuming that no zirconium was released from the residue, the theoretical I-131 to Zr-95 ratio was determined for the time of the iodine sample counting, and this ratio was used in conjunction with the measured Zr-95 concentrations to give the full I-131 inventory that should have been present in the sample if no I-131 had been released (Figure B-27). The actual concentrations of I-131 were subtracted from the full inventory values, and the difference was divided by the full inventory values to determine the fractional release value for I-131. These data are given in Table B-5. The average fractional release from the basket, plug, and stage-18 samples are 0.672, 0.713, and 0.473, respectively. Since the basket and plug samples are in good agreement, it appears fair to estimate the fractional release as approximately 0.7 for material that has been melted sufficiently to lose its original form and is partially oxidized (as is the condition of the true slag) and the fractional release of 0.5 for the partial stages, which are left apparently (visually) intact after other portions of the stage have been removed by thermal damage. Stages 8 and 9 were not sampled or analyzed. These stages show degrees of blistering—stage 8 slightly, and stage 9 extensively. Fractional release of I-131 was estimated to be 0.04 and 0.25, respectively, for these two stages.
B-28
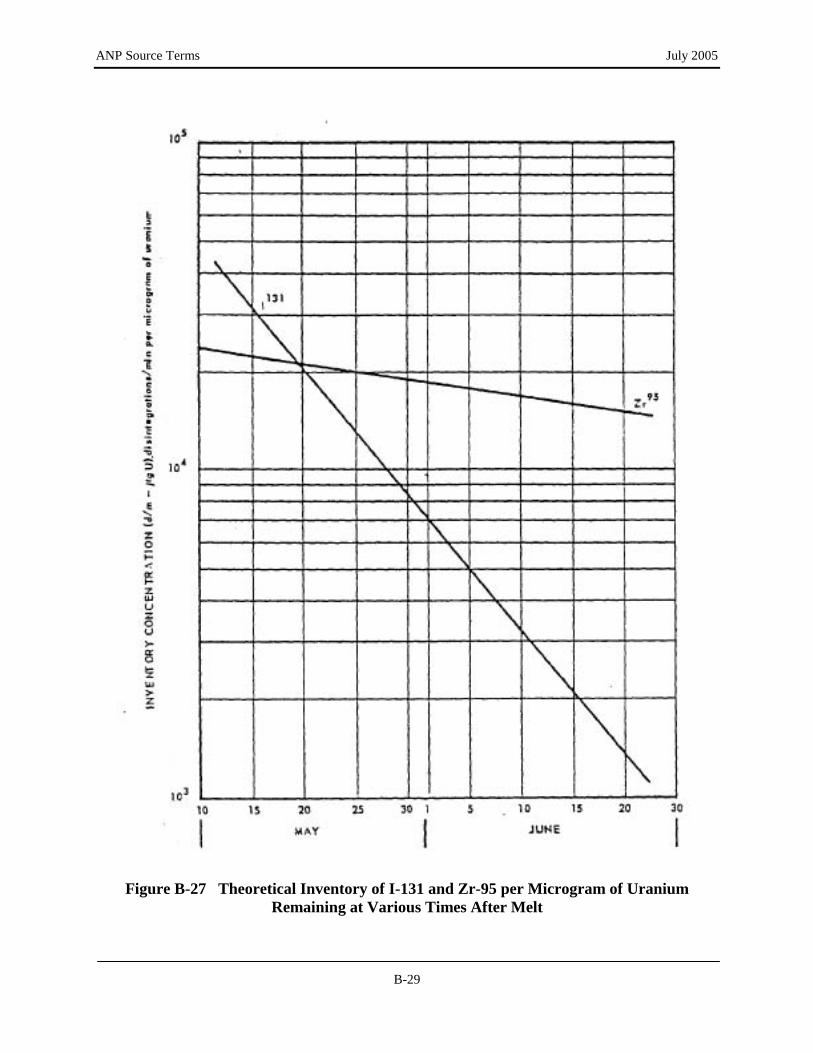
ANP Source Terms July 2005
Figure B-27 Theoretical Inventory of I-131 and Zr-95 per Microgram of Uranium Remaining at Various Times After Melt
B-29

ANP Source Terms July 2005
Table B-5 Determination of Fractional Release Values for I-131 for Damaged Components
Sample No.
Time
Zr-95 (measured)
(dpm/Fg of U)
I-131 (theory) (dpm/Fg of U)
I-131 (measured)
(dpm/Fg of U)
Indicated
Fractional Release Basket: 6-180
5/20/58
2.68 x 10⁴
2.55 x 10⁴
1.13 x 10⁴
0.56 6-181
5/21/58
2.10 x 10⁴
1.86 x 10⁴
4.40 x 10³
0.765
6-182
5/21/58
2.83 x 10⁴
2.50 x 10⁴
7.80 x 10³
0.69
Average Fraction Release
0.672
Plug: 6-183
6/10/58
1.70 x 10⁴
3.27 x 10³
1.00 x 10³
0.693 6-184
6/10/58
1.86 x 10⁴
3.58 x 10³
6.24 x 10²
0.83
6-185
6/10/58
1.58 x 10⁴
3.96 x 10³
3.80 x 10²
0.875
6-186
6/10/58
1.94 x 10⁴
3.74 x 10³
2.04 x 10³
0.455
Average Fraction Release
0.713
Stage 18: 6-187
6/13/58
1.83 x 10⁴
2.79 x 10³
1.17 x 10³
0.58 6-188
6/13/58
1.32 x 10⁴
2.01 x 10³
9.4 x 10²
0.532
6-189
6/13/58
1.86 x 10⁴
2.84 x 10³
1.96 x 10³
0.31
Average Fraction Release
0.473
Summary and Conclusions On May 2, 1958, Operation BOOT was conducted. This experiment was the principal test run under IET #12, which employed the HTRE No. 2 reactor. The deliberate/controlled over-heating of fuel cartridge 6 for Operation BOOT most closely simulates metallic fuel element damage that had been previously observed for IETs #3 and #4. When airflow through fuel cartridge 6 was momentarily blocked by means of an installed valve, ring temperatures for stages 9 through 18 rose rapidly reaching peak temperatures between 2,500EF and 3,000EF after only about 15 seconds at which time the reactor also scrammed and fuel plate temperatures rapidly declined (see Figure B-9). The duct Jordan ionization chamber located directly underneath the 76-inch effluent duct indicated a first sharp peak at 13 seconds after valve closure, a second peak at 17 seconds, and a third peak at 21 seconds, followed by a decrease that in terms of time closely tracked the decline in temperature. By the 56th second, the duct Jordan response dropped to background levels. In their report, the investigators further noted that A. . . A delay between the time of release and any
B-30

ANP Source Terms July 2005
indication by the duct Jordan may be expected because considerable ducting had to be traversed before the Jordan chamber was affected by the radiation from airborne residue.@ On the basis of these observations, it may be concluded that fuel failure and release of radioactivity are likely to have occurred well before the first recorded peak (at 13 seconds) and at temperatures that were well below peak temperatures for insert tube #6. The subsequent rapid decline of the duct Jordan response that followed the reactor scram coincides temporally with the equally rapid decline in fuel temperature and resolidification of molten fuel. Thus, it is concluded that the major release of fission products was confined to a period of less than 10 seconds and coincides with fuel temperatures in excess of about 2,100EF. Resolidification of molten fuel apparently mitigated further releases of fission products. An opposing view might argue that the rapid decline to background levels of the duct Jordan monitor signified the complete release of volatile fission products; however, this interpretation is not supported by the fact that the subsequent analysis of fuel residue from the plug, basket, and stage 18 (see Table B-4) showed that between 13% and 69% of I-131 remained within damaged fuel. Fractional Release Estimates The two primary methods for determining release fractions involved (1) sample analysis of effluent exhaust gases and (2) analysis of fuel residue samples representing damaged fuel stages. From effluent sampling data, a release fraction of 0.052 was determined and from the analysis of damaged fuel residue, an average release fraction of about 0.6 was determined for I-131. Comparison of the I-131 release fractions by these two methods, therefore, yielded more than a ten-fold difference that the investigators were not able or willing to resolve. The use of activated charcoal traps is a standard method for the determination of iodine concentration in effluents that commonly required monitoring. However, the physical conditions that define the reactor operation of the HTRE and resultant exhaust gases must be regarded as unique and uncommon. Experimental data collected during the ANP testing program demonstrated the complex conditions that exist when iodine (and even noble gases) are released in the exhaust gases while chemical augmentation of power is used (Ebersole 1956, Holtslag 1956). During Operation BOOT, reactor power was augmented with 300 pounds per second of jet fuel. Completely oxidized jet fuel introduces substantial amounts of carbon particulates into the exhaust gas onto which radioiodine may be adsorbed or absorbed. Thus, depending on the amount of particulates introduced into the exhaust gas and location of the sampling line(s) along the horizontal exhaust ducts and stack height, the ratio of particulate to gaseous iodine is highly variable. Non-isokinetic sampling, substantial plate-out, preferential entrapment for particulate over gaseous fission products, and variable collection efficiencies for charcoal and filter media are suspected to have contributed to the wide range of observed values among sampling loops and the derived release fraction. Given the extensive destruction of fuel in stages 10 through 18 of cartridge 6, the derived release fraction of 0.052 by means of charcoal trap data cannot be viewed as credible.
B-31

ANP Source Terms July 2005 In contrast, the analysis of damaged fuel residue for determining the release fraction suffers from relatively few uncertainties and must, therefore, be regarded as more robust. In brief, the credibility of this analysis rests principally on the assumption that uranium and zirconium remained together before and after the transient melt occurred. Review of the thermodynamic properties of both elements (Handbook of Chemistry and Physics 1982) support the reasonableness of this assumption; furthermore, if for any reason a certain amount of Zr-95 did indeed leave the fuel residue, the I-131 release fraction would be proportionately higher. At a minimum, therefore, release fractions of up to 0.8 for radioiodines are considered credible and appropriate in behalf of the failed fuel that was damaged in Operation BOOT. The above-cited experimental data for Operation BOOT, in which the most heavily oxidized portions of failed fuel yielded release fractions in excess of 80% for I-131 provides a useful reference value for IET #3 and IET #4. A potential argument against the use of BOOT data for IETs #3 and #4 is that fuel temperatures for the BOOT experiment were undoubtedly higher; however, an offsetting factor to the higher temperature was its short duration. The unexpected reactor scram after only 15 seconds limited the duration of fuel melt and associated release of fission products to about 10 seconds. In contrast, for IETs #3 and #4, releases coincided with periods of fuel reactor power levels that were maintained for hours and more closely mimicked the ORNL experimental conditions described by Parker (1960). For conditions of prolonged fuel melt, Parker (1960) also reported a fractional release of about 0.8 for iodine. For the reconstruction of potential radiation exposures associated with IET #3 and IET #4, the following release fractions may be employed to portions of reactor fuel that showed evidence of overt fuel damage:
Iodines (and other halogens): 0.8 Rare gases: 1.0 Solids: 0.1
B-32

APPENDIX C HDE-DERIVED ESTIMATES FOR THE RELEASE OF RADIONUCLIDES FOR IET #10 USING RSAC-4 COMPUTER CODE

C-1

C-2

C-3
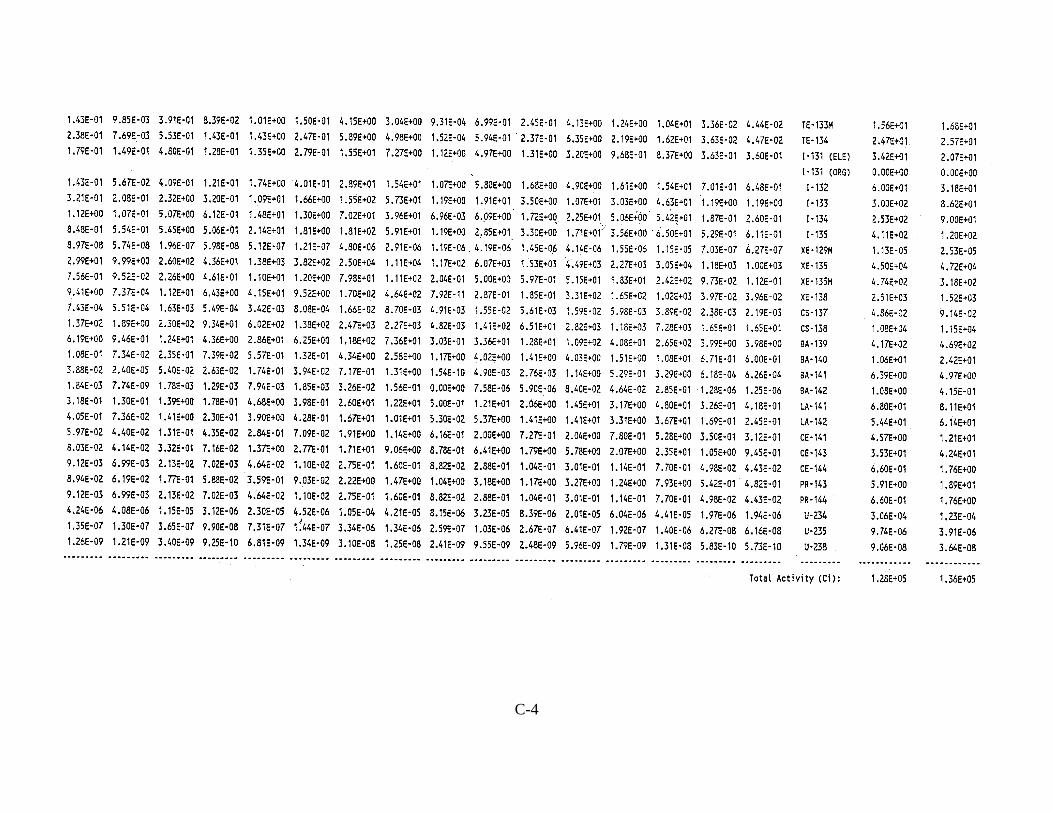
C-4

C-5

Idaho National Engineering and Environmental Laboratory
National Center for Environmental Health
Radiation Studies BranchRadiation Studies Branch | NCEH | Contact Us
Idaho National Engineering and Environmental Laboratory
The INEEL Searchable Bibliographic Database.
This database contains detailed information about all of the documents identified by CDC scientists or CDC contractors as being relevant to dose reconstruction.
Users have nine different search options. Each search produces the same output display. All documents in this database are unclassified. Contact the Department of Energy (DOE) at the INEEL to request any of these documents.
Search options ● Search by title and/or date ● Search by author ● Search by DOE report number ● Search for a document whose abstract contains a specified
character string ● Search for a document whose analysis contains a specified
character string ● Search for a document using one or two key words selected
from pull down menus
For an explanation of the fields in the output display Click here.
The INEEL Database
Please click on two files below to download. Requires Microsoft Access 2000 to open DataBase.
● INEEL Database -- IneelPhase2.zip. (11/06/2002, 2.97MB)● INEEL Database -- IneelPhase2.exe. Self-Extracting version for those who do not have Winzip installed. (11/06/2002, 3.00MB)
Requires Microsoft Visual Foxpro5.0 to open database.
● Phase 1 Database -- INEELPhase1.exe (05/29/2001, 6.83MB). Self-Extracting version.
Click here for more information or recommendations on how to improve this Web page.
http://www2.cdc.gov/nceh/Radiation/INEEL/default.htm (1 of 2)10/12/2005 6:43:06 AM

Idaho National Engineering and Environmental Laboratory
Privacy Policy Notice
Radiation Studies Branch | NCEH | Contact Us
CDC Home | Search | Health Topics A-Z
The local date and time: Wed Oct 12 10:43:06 GMT-0400 (Eastern Daylight Time) 2005
Centers for Disease Control and PreventionNational Center for Environmental Health
Radiation Studies Branch
http://www2.cdc.gov/nceh/Radiation/INEEL/default.htm (2 of 2)10/12/2005 6:43:06 AM
Related Documents