A computational model of in vitro angiogenesis based on extracellular matrix fibre orientation Lowell T. Edgar a , Scott C. Sibole a , Clayton J. Underwood a , James E. Guilkey b and Jeffrey A. Weiss a * a Department of Bioengineering & Scientific Computing and Imaging Institute, University of Utah, 72 South Central Campus Drive, Rm. 2646, Salt Lake City, UT 84112, USA; b Department of Mechanical Engineering & Scientific Computing and Imaging Institute, University of Utah, Salt Lake City, UT, USA (Received 11 August 2011; final version received 29 January 2012) Recent interest in the process of vascularisation within the biomedical community has motivated numerous new research efforts focusing on the process of angiogenesis. Although the role of chemical factors during angiogenesis has been well documented, the role of mechanical factors, such as the interaction between angiogenic vessels and the extracellular matrix, remains poorly understood. In vitro methods for studying angiogenesis exist; however, measurements available using such techniques often suffer from limited spatial and temporal resolutions. For this reason, computational models have been extensively employed to investigate various aspects of angiogenesis. This paper outlines the formulation and validation of a simple and robust computational model developed to accurately simulate angiogenesis based on length, branching and orientation morphometrics collected from vascularised tissue constructs. Microvessels were represented as a series of connected line segments. The morphology of the vessels was determined by a linear combination of the collagen fibre orientation, the vessel density gradient and a random walk component. Excellent agreement was observed between computational and experimental morphometric data over time. Computational predictions of microvessel orientation within an anisotropic matrix correlated well with experimental data. The accuracy of this modelling approach makes it a valuable platform for investigating the role of mechanical interactions during angiogenesis. Keywords: angiogenesis; computational model; tissue engineering; extracellular matrix; fibre orientation; matrix anisotropy 1. Introduction Angiogenesis, the process by which new blood vessels sprout off from existing vasculature, is highly sensitive to both the chemical and the mechanical microenvironment (Ingber 2002; Li et al. 2005; Shiu et al. 2005; Krishnan et al. 2008). During angiogenesis, endothelial cells within existing blood vessels detach from the basement membrane, migrate into the extracellular matrix (ECM) and form sprouts that elongate and eventually mature into new vasculature. Externally applied and cell-generated traction forces affect motility, metabolism, proliferation and differentiation of all anchorage-dependent cells, including endothelial cells and pericytes that participate in angiogenesis (Ives et al. 1986; Carosi et al. 1992; Patrick and McIntire 1995; Chien et al. 1998; Stamatas and McIntire 2001; McCormick et al. 2003; Joung et al. 2006). Mechanical stimuli received by cells via mechanotrans- duction depend on the structure and composition of the ECM (Vernon and Sage 1999; Deroanne et al. 2001), and on cell receptor structures bound to ECM components (Jalali et al. 2001). The mechanism as to how mechanical forces, 3D boundary conditions and ECM structure/composition influence neovessel growth during angiogenesis is poorly understood. Investigating this mechanism is difficult as the ECM is constantly remodelled and reorganised during angiogenesis through protease activity, formation of new cell–matrix adhesions and cellular force generation (Manoussaki et al. 1996; Krishnan et al. 2007). Over- coming these challenges and characterising the mechan- ical interactions between angiogenic microvessels and the ECM would not only provide new insight into the driving forces behind morphogenic processes, but also lead to new design considerations for engineering patterned microvasculature. The role of mechanical factors during angiogenesis has been previously investigated in vitro using a novel 3D culture method (Krishnan et al. 2003, 2005, 2007, 2008, 2009). Using this method, sprouting occurs within microvessel fragments in a spontaneous and consistent manner. Sprouts elongate as patent tubes, branching and forming anastomoses with other vessels (Hoying et al. 1996; Shepherd et al. 2004). In free-floating constructs, microvascular networks were found to have no preferred orientation. When the vascularised constructs were subject to an applied strain or a boundary constraint, microvessels and collagen fibres were found aligned along the constrained axis (Krishnan et al. 2008). It is unclear if ISSN 1025-5842 print/ISSN 1476-8259 online q 2012 Taylor & Francis http://dx.doi.org/10.1080/10255842.2012.662678 http://www.tandfonline.com *Corresponding author. Email: [email protected] Computer Methods in Biomechanics and Biomedical Engineering iFirst article, 2012, 1–12 Downloaded by [Jeffrey Weiss] at 07:33 19 April 2012

Welcome message from author
This document is posted to help you gain knowledge. Please leave a comment to let me know what you think about it! Share it to your friends and learn new things together.
Transcript
A computational model of in vitro angiogenesis based on extracellular matrix fibre orientation
Lowell T. Edgara, Scott C. Sibolea, Clayton J. Underwooda, James E. Guilkeyb and Jeffrey A. Weissa*
aDepartment of Bioengineering & Scientific Computing and Imaging Institute, University of Utah, 72 South Central Campus Drive,Rm. 2646, Salt Lake City, UT 84112, USA; bDepartment of Mechanical Engineering & Scientific Computing and Imaging Institute,
University of Utah, Salt Lake City, UT, USA
(Received 11 August 2011; final version received 29 January 2012)
Recent interest in the process of vascularisation within the biomedical community has motivated numerous newresearch efforts focusing on the process of angiogenesis. Although the role of chemical factors during angiogenesis hasbeen well documented, the role of mechanical factors, such as the interaction between angiogenic vessels and theextracellular matrix, remains poorly understood. In vitro methods for studying angiogenesis exist; however,measurements available using such techniques often suffer from limited spatial and temporal resolutions. For thisreason, computational models have been extensively employed to investigate various aspects of angiogenesis. This paperoutlines the formulation and validation of a simple and robust computational model developed to accurately simulateangiogenesis based on length, branching and orientation morphometrics collected from vascularised tissue constructs.Microvessels were represented as a series of connected line segments. The morphology of the vessels was determined bya linear combination of the collagen fibre orientation, the vessel density gradient and a random walk component.Excellent agreement was observed between computational and experimental morphometric data over time.Computational predictions of microvessel orientation within an anisotropic matrix correlated well with experimentaldata. The accuracy of this modelling approach makes it a valuable platform for investigating the role of mechanicalinteractions during angiogenesis.
Keywords: angiogenesis; computational model; tissue engineering; extracellular matrix; fibre orientation; matrixanisotropy
1. Introduction
Angiogenesis, the process by which new blood vessels
sprout off from existing vasculature, is highly sensitive to
both the chemical and the mechanical microenvironment
(Ingber 2002; Li et al. 2005; Shiu et al. 2005; Krishnan
et al. 2008). During angiogenesis, endothelial cells within
existing blood vessels detach from the basement
membrane, migrate into the extracellular matrix (ECM)
and form sprouts that elongate and eventually mature into
new vasculature. Externally applied and cell-generated
traction forces affect motility, metabolism, proliferation
and differentiation of all anchorage-dependent cells,
including endothelial cells and pericytes that participate
in angiogenesis (Ives et al. 1986; Carosi et al. 1992;
Patrick and McIntire 1995; Chien et al. 1998; Stamatas and
McIntire 2001; McCormick et al. 2003; Joung et al. 2006).
Mechanical stimuli received by cells via mechanotrans-
duction depend on the structure and composition of the
ECM (Vernon and Sage 1999; Deroanne et al. 2001), and
on cell receptor structures bound to ECM components
(Jalali et al. 2001).
The mechanism as to how mechanical forces, 3D
boundary conditions and ECM structure/composition
influence neovessel growth during angiogenesis is poorly
understood. Investigating this mechanism is difficult as the
ECM is constantly remodelled and reorganised during
angiogenesis through protease activity, formation of new
cell–matrix adhesions and cellular force generation
(Manoussaki et al. 1996; Krishnan et al. 2007). Over-
coming these challenges and characterising the mechan-
ical interactions between angiogenic microvessels and the
ECM would not only provide new insight into the driving
forces behind morphogenic processes, but also lead to
new design considerations for engineering patterned
microvasculature.
The role of mechanical factors during angiogenesis has
been previously investigated in vitro using a novel 3D
culture method (Krishnan et al. 2003, 2005, 2007, 2008,
2009). Using this method, sprouting occurs within
microvessel fragments in a spontaneous and consistent
manner. Sprouts elongate as patent tubes, branching and
forming anastomoses with other vessels (Hoying et al.
1996; Shepherd et al. 2004). In free-floating constructs,
microvascular networks were found to have no preferred
orientation. When the vascularised constructs were subject
to an applied strain or a boundary constraint, microvessels
and collagen fibres were found aligned along the
constrained axis (Krishnan et al. 2008). It is unclear if
ISSN 1025-5842 print/ISSN 1476-8259 online
q 2012 Taylor & Francis
http://dx.doi.org/10.1080/10255842.2012.662678
http://www.tandfonline.com
*Corresponding author. Email: [email protected]
Computer Methods in Biomechanics and Biomedical Engineering
iFirst article, 2012, 1–12
Dow
nloa
ded
by [
Jeff
rey
Wei
ss]
at 0
7:33
19
Apr
il 20
12
this alignment arises from microvessel growth being
directed along aligned collagen fibres, from microvessels
being reoriented due to contraction of the matrix and
internal remodelling, or from some combination of both
mechanisms.
Computational models can be utilised to supplement
experimental efforts, often providing investigators with
the ability to view systems at time points not sampled
during the experiment or test hypotheses in ways not
possible in the laboratory. Growth models have proven
useful to investigators studying angiogenesis
(Chaplain 2000; Mantzaris et al. 2004; Namy et al.
2004; Bauer 2007; Capasso et al. 2008; Qutub and Popel
2009). Computational frameworks can be categorised into
different classes depending on how the system of interest
is represented. Continuous models are typically governed
by differential equations based on physical laws, whereas
discrete models assemble a collection of discrete
geometric units that behave according to a particular set
of rules. Continuous–discrete models, or hybrid models,
combine both approaches, often through determining the
behaviour of discrete units by solving a problem governed
by physical laws. A computational model capable of
simulating the interaction between microvessels and the
ECM during angiogenesis would be a valuable platform
for studying the role of mechanical forces, matrix
boundary conditions and ECM composition.
Vascular geometry can be captured in two ways:
imaging data from vascularised constructs (specimen-
specific data) and from computational predictions of
microvessel growth. Since geometry obtained using the
first method is constrained to the time point at which the
culture was imaged, the second method was chosen as it
provides a generalised description of microvascular
geometry at any desired point in time. This paper
proposes such a computational model of vessel growth
designed to provide accurate, up-to-date microvascular
geometry during in vitro angiogenesis. The model was
designed using a continuous–discrete framework. This
involves explicit representation of the microvessels as
discrete structures with the ability to simulate
elongation, branching and anastomosis over a regular
computational grid. The continuous component of the
model is in the differential equations used to govern
field variables that influence neovessel growth.
The growth model will also need to accurately predict
the changes in microvessel growth resulting from ECM
anisotropy and imposed boundary conditions as seen in
the laboratory. The objectives of this study were to
develop such a growth model and to demonstrate its
ability to describe experimental data on microvessel
length, branching and orientation obtained from
vascularised constructs.
2. Methods
2.1 Cell culture experiments: in vitro model
of angiogenesis
Morphometric data were collected from in vitro cultures of
angiogenic microvessels in order to calibrate the
computational growth model and to determine whether
predictions from the simulation framework were valid.
Based on previously described methods (Hoying et al.
1996), 38 microvessel cultures were prepared from five
separate dissections. Microvessel fragments were isolated
from epididymal fat pads harvested from retired breeder
Sprague-Dawley rats while conforming to the Institutional
Animal Care and Use Committee of the University of
Utah. The fat pads were minced, digested with enzymes
and subjected to sequential filtration. The filtration step
allows the removal of large clumps of tissue as well as
single cells from the suspension. The remaining filtrate
was spun down in a centrifuge, and the resulting pellet
consisted of microvessel fragments. Sterile rat tail type I
collagen (BD Biosciences, Franklin Lakes, NJ, USA) was
mixed with concentrated Dulbecco’s modified Eagle
medium (DMEM, GIBCO-Invitrogen, Carlsbad, CA,
USA) to a density of 3.0mg/ml collagen in 1 £ DMEM.
The pellet of microvessel fragments was resuspended in
the collagen/DMEM solution at a density of 15,000 frag-
ments/ml, and the solution was transferred to circular
culture wells (diameter ,15mm). The collagen was
allowed to polymerise at 378C and 95% humidity for
30min. Constructs were incubated in serum-free media
(Bottenstein and Sato 1979) supplemented with rhVEGF
(10 ng/ml, VEGF 165, PeproTech, Rocky Hill, NJ, USA).
The constructs cast within the circular culture wells were
free floating with no applied stretch or imposed boundary
conditions, which created collagen fibres with no preferred
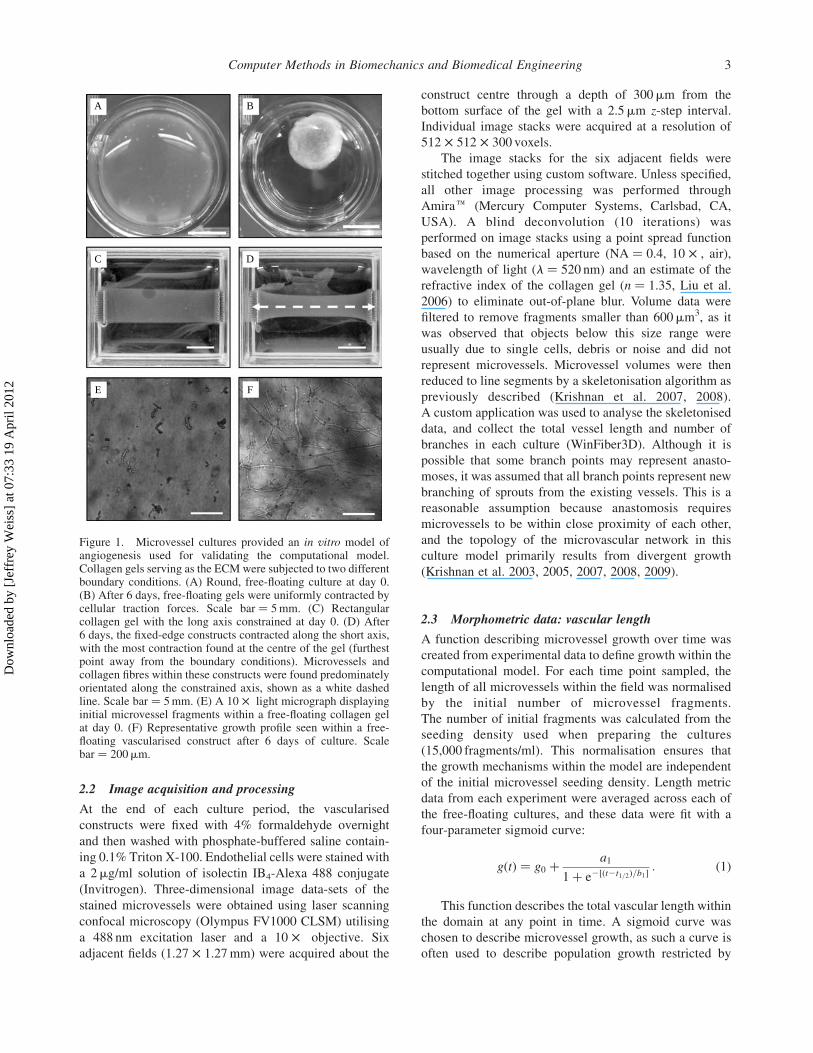
orientation (random) [Figure 1(A),(B)]. Constructs were
incubated at 378C and 95% humidity for 7 days, after
which the microvascular network within each construct
was imaged using confocal microscopy.
To create the anisotropic ECM condition, five
rectangular vascularised constructs were also prepared.
These constructs were subjected to fixed-edge boundary
conditions by allowing the collagen to polymerise within a
stainless steel mesh, preventing contraction of the collagen
gel along the long axis but leaving the rest of the gel free to
contract [Figure 1(C),(D)]. This boundary condition
produces microvessel and collagen fibril alignment along
the long axis of the constructs (Krishnan et al. 2008).
Microvessel orientation data were collected after 6 days of
growth to compare with the simulation results. Collagen
fibre orientation data were also collected to provide the
fibre orientation information for the model when
simulating the anisotropic matrix condition.
L.T. Edgar et al.2
Dow
nloa
ded
by [
Jeff
rey
Wei
ss]
at 0
7:33
19
Apr
il 20
12
2.2 Image acquisition and processing
At the end of each culture period, the vascularised
constructs were fixed with 4% formaldehyde overnight
and then washed with phosphate-buffered saline contain-
ing 0.1% Triton X-100. Endothelial cells were stained with
a 2mg/ml solution of isolectin IB4-Alexa 488 conjugate
(Invitrogen). Three-dimensional image data-sets of the
stained microvessels were obtained using laser scanning
confocal microscopy (Olympus FV1000 CLSM) utilising
a 488 nm excitation laser and a 10 £ objective. Six
adjacent fields (1.27 £ 1.27 mm) were acquired about the
construct centre through a depth of 300mm from the
bottom surface of the gel with a 2.5mm z-step interval.
Individual image stacks were acquired at a resolution of
512 £ 512 £ 300 voxels.
The image stacks for the six adjacent fields were
stitched together using custom software. Unless specified,
all other image processing was performed through
Amirae (Mercury Computer Systems, Carlsbad, CA,
USA). A blind deconvolution (10 iterations) was
performed on image stacks using a point spread function
based on the numerical aperture (NA ¼ 0.4, 10 £ , air),
wavelength of light (l ¼ 520 nm) and an estimate of the
refractive index of the collagen gel (n ¼ 1.35, Liu et al.
2006) to eliminate out-of-plane blur. Volume data were
filtered to remove fragments smaller than 600mm3, as it
was observed that objects below this size range were
usually due to single cells, debris or noise and did not
represent microvessels. Microvessel volumes were then
reduced to line segments by a skeletonisation algorithm as
previously described (Krishnan et al. 2007, 2008).
A custom application was used to analyse the skeletonised
data, and collect the total vessel length and number of
branches in each culture (WinFiber3D). Although it is
possible that some branch points may represent anasto-
moses, it was assumed that all branch points represent new
branching of sprouts from the existing vessels. This is a
reasonable assumption because anastomosis requires
microvessels to be within close proximity of each other,
and the topology of the microvascular network in this
culture model primarily results from divergent growth
(Krishnan et al. 2003, 2005, 2007, 2008, 2009).
2.3 Morphometric data: vascular length
A function describing microvessel growth over time was
created from experimental data to define growth within the
computational model. For each time point sampled, the
length of all microvessels within the field was normalised
by the initial number of microvessel fragments.
The number of initial fragments was calculated from the
seeding density used when preparing the cultures
(15,000 fragments/ml). This normalisation ensures that
the growth mechanisms within the model are independent
of the initial microvessel seeding density. Length metric
data from each experiment were averaged across each of
the free-floating cultures, and these data were fit with a
four-parameter sigmoid curve:
gðtÞ ¼ g0 þa1
1þ e2½ðt2t1=2Þ=b1�: ð1Þ
This function describes the total vascular length within
the domain at any point in time. A sigmoid curve was
chosen to describe microvessel growth, as such a curve is
often used to describe population growth restricted by
A B
C D
E F
Figure 1. Microvessel cultures provided an in vitro model ofangiogenesis used for validating the computational model.Collagen gels serving as the ECMwere subjected to two differentboundary conditions. (A) Round, free-floating culture at day 0.(B) After 6 days, free-floating gels were uniformly contracted bycellular traction forces. Scale bar ¼ 5mm. (C) Rectangularcollagen gel with the long axis constrained at day 0. (D) After6 days, the fixed-edge constructs contracted along the short axis,with the most contraction found at the centre of the gel (furthestpoint away from the boundary conditions). Microvessels andcollagen fibres within these constructs were found predominatelyorientated along the constrained axis, shown as a white dashedline. Scale bar ¼ 5mm. (E) A 10 £ light micrograph displayinginitial microvessel fragments within a free-floating collagen gelat day 0. (F) Representative growth profile seen within a free-floating vascularised construct after 6 days of culture. Scalebar ¼ 200mm.
Computer Methods in Biomechanics and Biomedical Engineering 3
Dow
nloa
ded
by [
Jeff
rey
Wei
ss]
at 0
7:33
19
Apr
il 20
12
limited resources (carrying capacity). In Equation (1), g0 is
the initial microvessel length (bottom of the sigmoid
curve), a1 is the range of the function (top minus bottom),
t1/2 is the time at which g(t) is halfway in between the top
and bottom of the sigmoid curve and b1 describes the
steepness of the curve. The carrying capacity of the system
can be described as g0 þ a1.
2.4 Morphometric data: vascular branching
The computational model also required a function
describing microvessel branching over time. For each
time point, the number of branch points within the field
was averaged together and normalised by the initial
number of microvessel fragments. The branching b(t) was
calculated by fitting the average branching data with a
three-parameter exponential curve:
bðtÞ ¼ b0 þ a2eb2t: ð2Þ
In this equation, b0 describes the initial number of
branches, a2 scales the exponential term and b2 describes
the rate of branch formation. An exponential function was
used to describe branch formation as branching metric data
taken from experimental cultures does not appear to
approach any limit during the 7-day culture period.
2.5 Collagen fibre orientation
The culture and imaging procedure described above were
repeated for the five fixed-edge constructs at day 6 of
culture. Measurements from these constructs included the
angles for all microvessel segments relative to the
constrained axis (long axis). The structural organisation
of the underlying collagen matrix within the fixed-edge
constructs was quantified by imaging collagen fibrils using
confocal reflectance microscopy with a 60X water
objective and a 633 nm laser. For each construct, two
stacks were acquired through a depth of 120mm with a
1-mm z-step interval. An orientation of collagen fibres was
determined from the images by employing a 2D Fourier
transform technique on each image (Pourdeyhimi et al.
1997; Sander and Barocas 2009). The angle distributions
from the five cultures were averaged together and fit with a
Gaussian distribution. This distribution was used to seed a
vector field that represents an anisotropic matrix for the
computational growth model.
2.6 Computational model: overview
The computational model of vessel growth during in vitro
angiogenesis was calibrated and validated with data
obtained using the methods described above. The
formulation and implementation was 3D, although for
simplicity the simulations presented in this paper were
only performed in two dimensions. The simulation
domain, or virtual ECM, was discretised with a regular
quadrilateral mesh with an element spacing of 31.75mm in
each direction. Local field information such as ECM
collagen fibril orientation and microvessel density was
specified at each of the grid nodes. At any position (x, y),
the field described at the nodes could be mapped to that
point via bilinear shape functions:
wðx; yÞ ¼X4i¼1
Siðx; yÞwi; ð3Þ
where w was a field variable and Si(x, y) were the values of
the shape functions for each of the four nodes of the cell,
evaluated at the point (x, y; Figure 2). This approach can be
applied to include any field information deemed pertinent
by the user. The dimensions of the domain were
1.27 £ 1.27mm for all simulations, corresponding to the
10X field of view on the confocal microscope. Periodic
boundary conditions were imposed on all edges of the
simulation domain.
2.7 Computational model: vessel elongation
Initial microvessel fragments were represented as discrete
independent line segments, with lengths corresponding to
the value of the sigmoid growth curve g(t) at time t ¼ 0
(Equation (1)). Twenty-five fragments (average number in
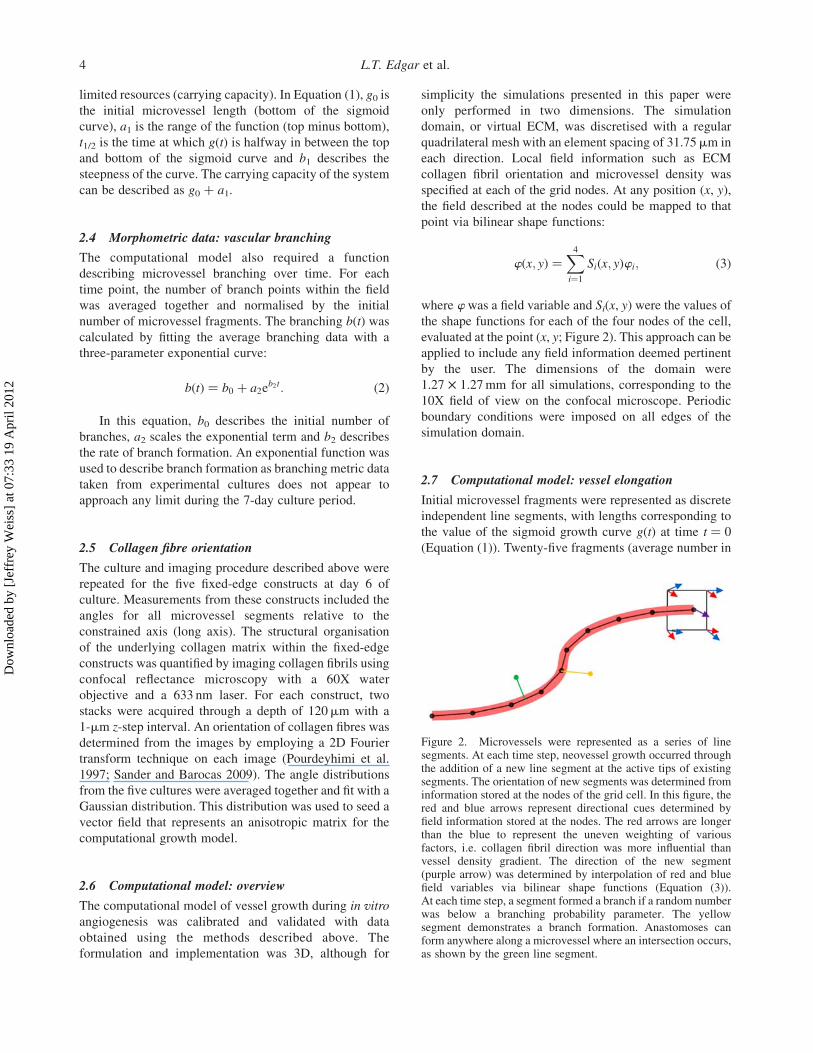
Figure 2. Microvessels were represented as a series of linesegments. At each time step, neovessel growth occurred throughthe addition of a new line segment at the active tips of existingsegments. The orientation of new segments was determined frominformation stored at the nodes of the grid cell. In this figure, thered and blue arrows represent directional cues determined byfield information stored at the nodes. The red arrows are longerthan the blue to represent the uneven weighting of variousfactors, i.e. collagen fibril direction was more influential thanvessel density gradient. The direction of the new segment(purple arrow) was determined by interpolation of red and bluefield variables via bilinear shape functions (Equation (3)).At each time step, a segment formed a branch if a random numberwas below a branching probability parameter. The yellowsegment demonstrates a branch formation. Anastomoses canform anywhere along a microvessel where an intersection occurs,as shown by the green line segment.
L.T. Edgar et al.4
Dow
nloa
ded
by [
Jeff
rey
Wei
ss]
at 0
7:33
19
Apr
il 20
12
the field of view of a confocal image) were seeded
throughout the domain, each at a random position and with
a random orientation.
At each time step, microvessel growth was represented
by the addition of new segments to the free ends of
existing segments. A variable time step was implemented
to limit the growth of any vessel segment to half a grid cell.
The length of each new segment was calculated by
referencing the growth curve g(t) and determining the
change in length over the time step size (Equation (1)).
With this method of vessel elongation, all vessels within
the domain grow by the same amount at each time
step. While this method may not accurately describe real
growth of an individual neovessel, this method does
provide valid predictions of microvascular topology in an
averaged sense. The direction of new segments was
determined by a linear combination of several directional
cues. The orientation vector v for a newly created segment
was found using the following expression:
v ¼ w1ucoll þ w2uvdens þ w3urand: ð4Þ
In Equation (4), the vector ucoll was along the direction
of local collagen fibres, the vector uvdens was calculated
from the vessel density gradient to cause microvessels to
grow away from regions of high microvessel density, and
the vector urand was a random walk component. The scalars
w1, w2 and w3 were the weights for each of these
components. Each of the directional components was
determined by mapping field information stored at the
nodes of the grid to the position of the new segment
(Equation (3)).
2.8 Computational model: branching
Microvessel branching was modelled as a stochastic
process. During each time step, each segment was
assigned a random number between 0 and 1. Branching
occurred when a segment’s random number was less than a
branching probability value:
Bt ¼B0
tDt if rand½0; 1� # Bt; form a new branch
else do not branch:
ð5Þ
The initial branching probability, B0, value was
determined using a golden section, single variable,
bounded optimisation algorithm to minimise the root
mean square (RMS) error between simulated and
experimental length and branch metrics. This probability
value was assigned to all initial fragments at t ¼ 0 where
Equation (5) is undefined. Multiplying by the time step Dt
eliminated dependence of branching behaviour on time
step size. Based on Equation (5), the branching probability
for an individual line segment decreases as time increases.
This particular behaviour was chosen because the rate at
which new segments formed in the model would otherwise
far outpace the rate at which new branches were observed
to form in the experimental cultures.
2.9 Computational model: anastomosis
Growth tips within close proximity to other microvessels
were capable of forming anastomoses. At the end of each
time step, a search for intersections between all active
vessel tips and existing segments was conducted. If the
intersection found was in between two segments within the
same vessel, the intersection was ignored to avoid the
formation of a terminal loop. If the intersecting segments
were not from the same microvessel, a procedure was used
to determine if they would intersect in three dimensions.
This process is necessary because the model represented a
2D projection of vessels in 3D. In 3D, a microvessel could
be positioned at any point throughout the culture thickness
of 300mm. To account for the 3D geometry, a test was
performed based on the probability of the two micro-
vessels being offset by less than 1 microvessel diameter in
the third spatial dimension. This involved taking the ratio
between the microvessel diameter and the culture
thickness. If the random number was less than this ratio,
the microvessels formed an anastomosis and ceased
growth; otherwise, the intersection was ignored.
2.10 Computational model: optimisation of branching
A golden-section line search was used to determine the
optimal value of B0 within the branching mechanism
(Equation (5)) by minimising the RMS error between
simulated and experimental branching data:
minXni¼1
ffiffiffiffiffiffiffiffiffiffiffiffiffiffiffiffiffiffiffiffiffiffiffiffiffiffiffiffiffiffiffiffiffiffiðceðtiÞ2 cmðtiÞÞ
2
n
s: ð6Þ
Here, ce(ti) was branching metric value from
experimental data at a given time point ti, cm(ti) was the
branching metric value from the computational simu-
lations and n was the number of time steps taken.
2.11 Computational model: ECM anisotropy
The computational model was designed with the ability to
simulate microvessel growth under various matrix
boundary conditions. Different boundary conditions were
modelled by changing the orientation of collagen fibrils
within the matrix. For simulations involving a free-floating
collagen gel, a random collagen fibre orientation angle
between 2908 and 908 was generated at each node of the
grid. When simulating angiogenesis within the anisotropic
Computer Methods in Biomechanics and Biomedical Engineering 5
Dow
nloa
ded
by [
Jeff
rey
Wei
ss]
at 0
7:33
19
Apr
il 20
12
matrix condition, nodal collagen fibre orientation values
were seeded using angle distributions collected from the
fixed-edge constructs. The orientation of microvessels
from these simulations was compared to orientation data
from the fixed-edge constructs to verify the model’s ability
to predict angiogenesis within an anisotropic matrix.
2.12 Computational model: optimisation of vesselorientation
Microvessel orientation within the model was optimised to
match experimental data. A routine similar to Equation (6)
was used to determine the optimal values of the weights
describing the strength of directional cues when
determining the orientation of new microvessel segments
(w1, w2, w3) (Equation (4)). These weights were adjusted
to minimise the RMS error between microvessel
orientation in the fixed-edge constructs on day 6 and
microvessel orientation from the anisotropic ECM
simulations:
minXni¼1
ffiffiffiffiffiffiffiffiffiffiffiffiffiffiffiffiffiffiffiffiffiffiffiffiffiffiffiffiffiffiffiffiðfeðiÞ2 fmðiÞÞ
2
n
s; ð7Þ
where feðiÞ was the percentage of microvessels whose
orientation angle fell into discrete angle bin i (08–108,
108–208, . . . , 808–908) measured off the constrained axis.
fmðiÞ was the percentage of microvessels found in bin i
from the simulations, and n was the number of discrete
angle bins.
2.13 Computational model: variation due to stochasticprocesses
While microvessel elongation within the model was a
deterministically governed process, the mechanisms for
branching and anastomosis were stochastically based.
Since branch formation and anastomosis directly affect the
number of active growth tips, stochastic variations
between different simulations can be passed from these
random mechanisms to length metric data. To eliminate
stochastic variations, growth rate was normalised by the
number of active growth tips currently in the model. This
adjustment ensures that the total length in each simulation
will not vary too far away from the value prescribed by
g(t), reducing significant variation in length metric data
over multiple simulations.
The seed used to initialise the random number
generator algorithm prior to each simulation was varied
based on the system clock. In order to assess the degree of
variance across simulations caused by the stochastic
processes, 50 simulations of microvessels growing within
a randomly orientated ECM were conducted, each using a
unique seed. The variance in the length and branch metrics
between these trials was then evaluated using a one-way
ANOVA.
Variations in the simulation results due to the
stochastic components of the model prevented conver-
gence to strict tolerances (1 ¼ 1e 2 7) during the
optimisation routines. Therefore, a constant seed was
used while optimising individual parameters to facilitate
convergence.
3. Results
Microvessel growth profiles were consistent across all
in vitro experiments. Very little growth occurred before the
3–4 days mark, at which point sprouting was observed.
Microvessels grew with a high rate until days 6–7, after
which growth rate began to slow as the system neared its
carrying capacity (Figure 3, top). The sigmoid curve fit to
the averaged length metric data (g(t), Equation (1))
resulted in an R 2 value of 0.998.
The number of branch points measured in the
vascularised constructs increased exponentially through-
out time with no observable limit during the 7-day culture
period (Figure 3, bottom). The exponential curve fit to the
averaged branch metric data (b(t), Equation (2)) achieved
an R 2 value of 0.968. The parameters determined from the
curve fits can be found compiled in Table 1. Variance in
length and branch metric data across in vitro cultures was
high, with maximum standard deviations of 179.7 and
1.74, respectively.
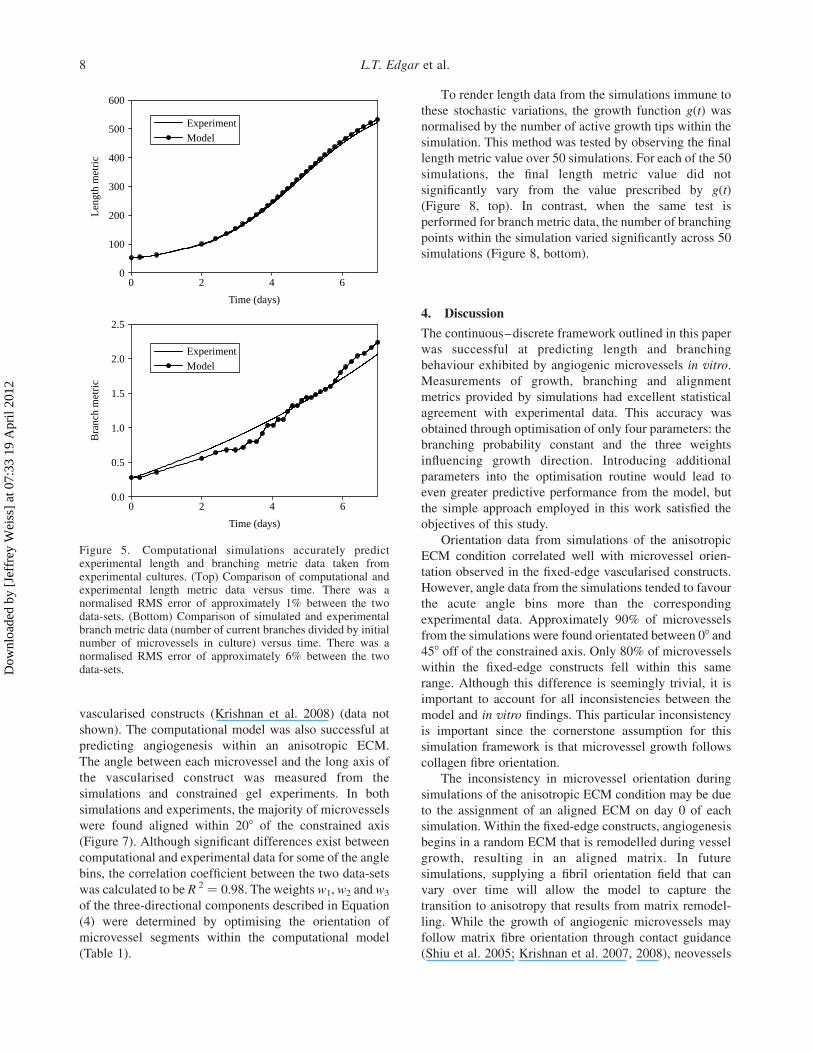
Microvessel growth resulting from computational
simulations resembled growth profiles seen in vitro
(Figure 4). The length of microvascular networks from
the computational simulations correlated well with
experimental data, with approximately 1% normalised
RMS error between computational and experimental
length metric data (Figure 5, top). The optimisation
routine used to determine the branching chance parameter
returned a value of B0 ¼ 0.038 (Equation (5)). This
branching parameter minimised the normalised RMS error
between computational and experimental branching
metric data to roughly 6% (Figure 5, bottom).
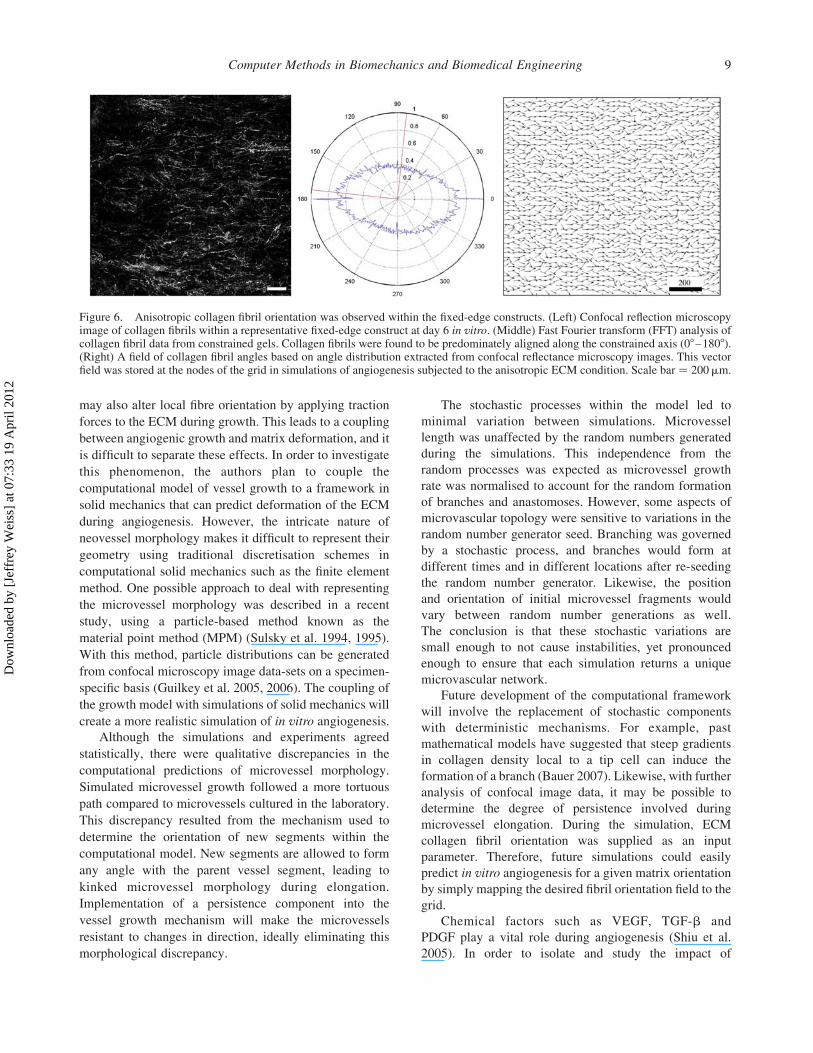
Microvessels within the fixed-edge constructs were
found preferentially aligned along the constrained axis,
consistent with what has been seen in past experiments
(Krishnan et al. 2008). The majority of fibres in the fixed-
edge constructs were found aligned along the constrained
axis. The distributions of fibre angles for all five of the
fixed-edge constructs were averaged together and fit to a
Gaussian distribution which was used to generate a
collagen fibre orientation at each node of the grid node
(Figure 6).
Simulations of angiogenesis within a randomly
oriented ECM produced microvessels with no preferential
alignment, similar to what has been seen in free-floating
L.T. Edgar et al.6
Dow
nloa
ded
by [
Jeff
rey
Wei
ss]
at 0
7:33
19
Apr
il 20
12
A B
C D
E F
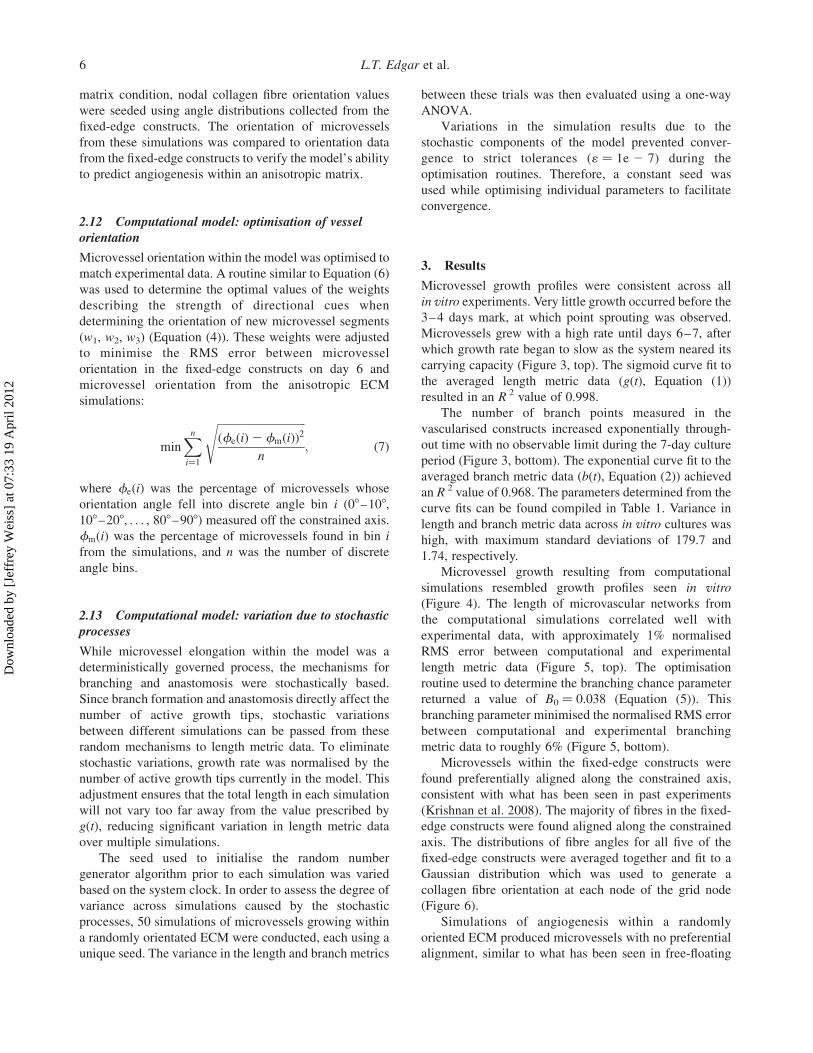
Figure 4. Images from computational simulations presentedfor comparison with experimental data. Confocal images fromvascularised constructs are on the left, while data from simulationsof microvessel growth can be found on the right. The time points atwhich these images were obtained are as follows: day 1 (A,B), day 4(C,D) and day 7 (E,F). Scale bar ¼ 300mm. Predictions ofmicrovasculature from the computational model were similar toimages taken from vascularised constructs. Notice that growthpredicted in the simulations followed a more tortuous pathcompared to microvessels in vitro.
Time (days)
1 2 3 4 5 6 7
Time (days)
1 2 3 4 5 6 7
Len
gth
met
ric
0
100
200
300
400
500
600
700
800B
ranc
h m
etri
c
0
1
2
3
4
5
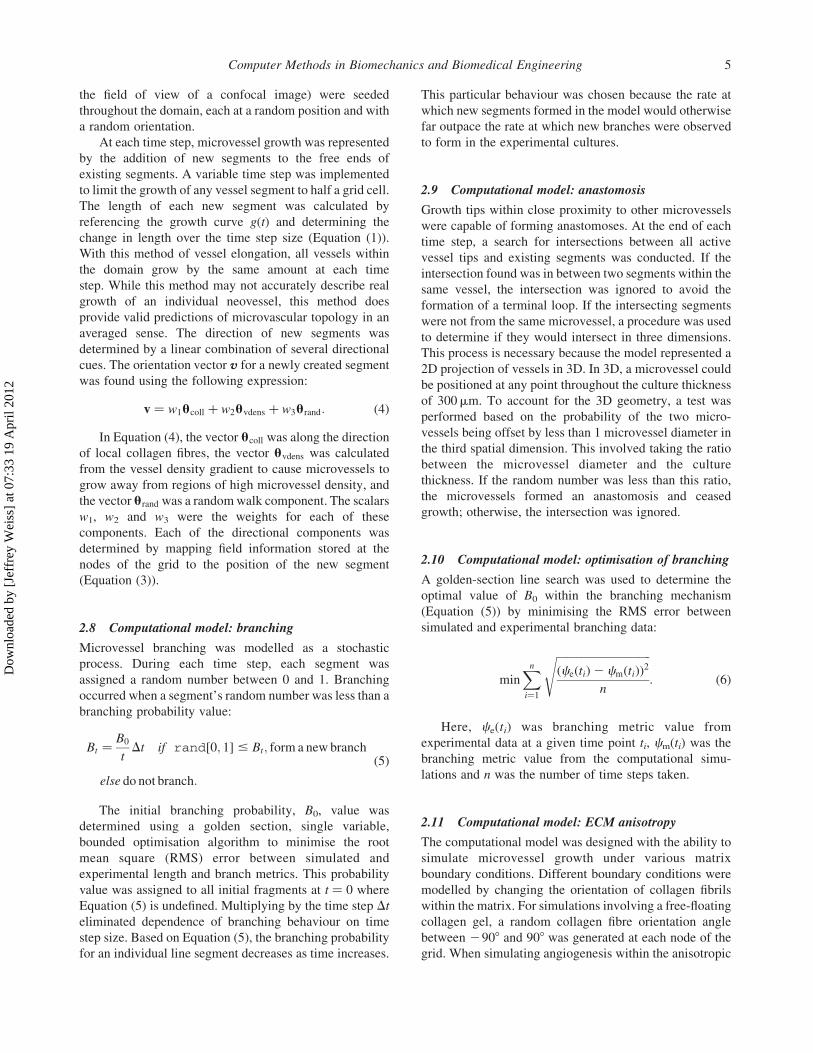
Figure 3. Morphometric data describe microvessel growth andbranching during angiogenesis. (Top) Length metric data(current vessel length/number of vessels at day 1) versus time.The function g(t) was fit to this data (Equation (1)). (Middle)Microvessel branch metric data (current number ofbranches/number of vessels at day 1) versus time. The functionb(t) was fit to this data (Equation (2)). In both the top and middlefigures, points represent experimental data (mean ^ standarddeviation) while solid curves represent regression fits. (Bottom)Z-projection of a representative microvessel culture. Image datawere collected by imaging vascularised constructs at day 6 usinga confocal microscope. Scale bar ¼ 400mm.
Table 1. Values of the parameters used for the growth function,branching function, branching probability and strength ofdirectional queues.
Growth function g(t)a1 568.6g0 38.8b1 1.3t1/2 4.8
Branching function b(t)y0 22.50a2 2.62b2 0.105
Branching probabilityB0 0.038
Strength of directional cuesw1 fibre orientation 0.508w2 vessel density 0.238w3 random walk 0.254
Please see the text for the equations that define these functions and parameters.
Computer Methods in Biomechanics and Biomedical Engineering 7
Dow
nloa
ded
by [
Jeff
rey
Wei
ss]
at 0
7:33
19
Apr
il 20
12
vascularised constructs (Krishnan et al. 2008) (data not
shown). The computational model was also successful at
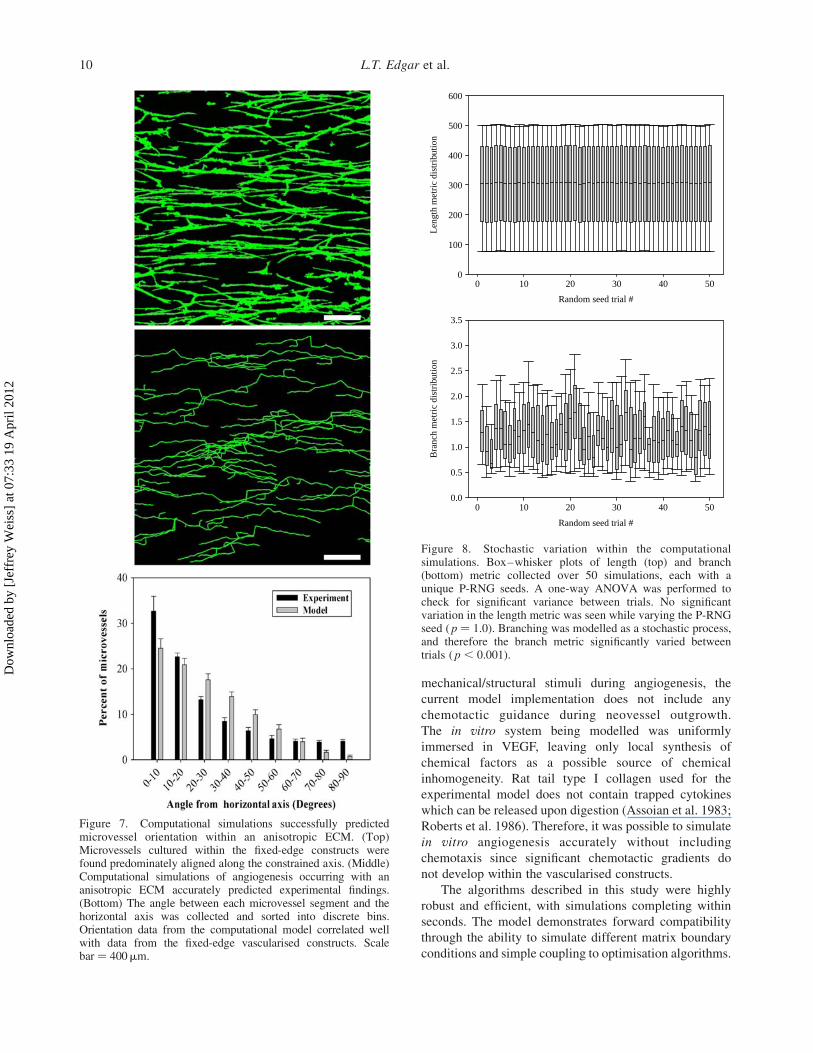
predicting angiogenesis within an anisotropic ECM.
The angle between each microvessel and the long axis of
the vascularised construct was measured from the
simulations and constrained gel experiments. In both
simulations and experiments, the majority of microvessels
were found aligned within 208 of the constrained axis
(Figure 7). Although significant differences exist between
computational and experimental data for some of the angle
bins, the correlation coefficient between the two data-sets
was calculated to be R 2 ¼ 0.98. The weights w1,w2 and w3
of the three-directional components described in Equation
(4) were determined by optimising the orientation of
microvessel segments within the computational model
(Table 1).
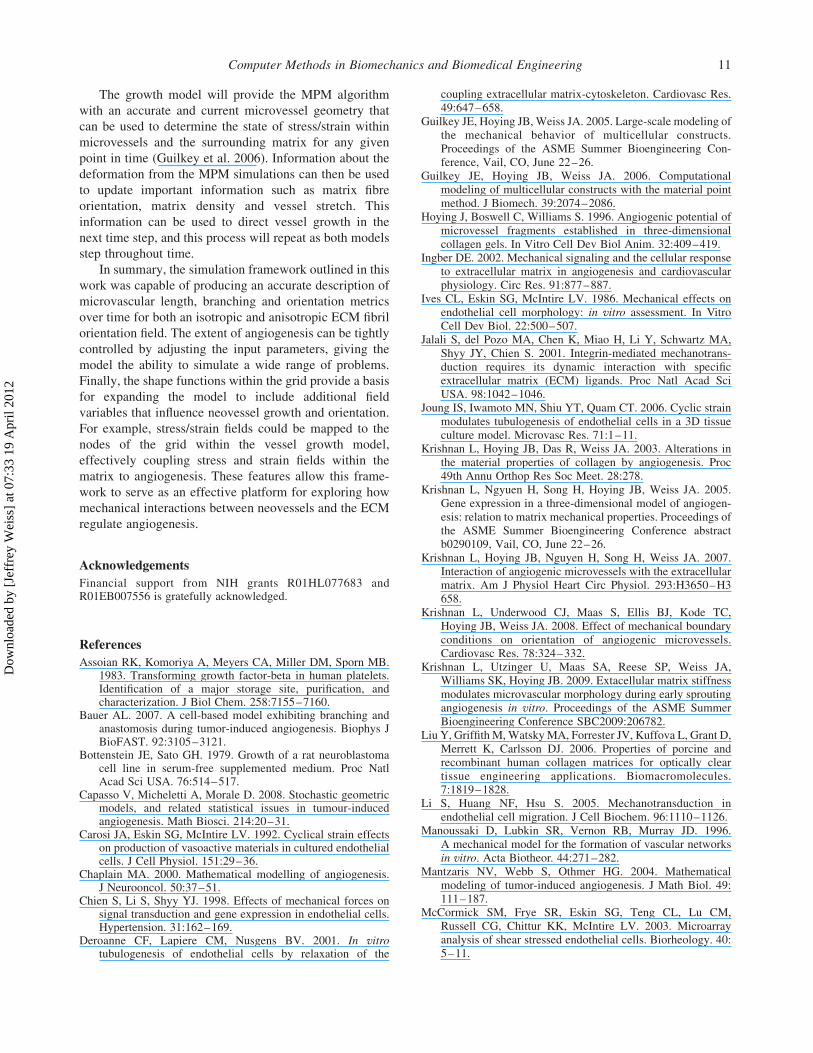
To render length data from the simulations immune to
these stochastic variations, the growth function g(t) was
normalised by the number of active growth tips within the
simulation. This method was tested by observing the final
length metric value over 50 simulations. For each of the 50
simulations, the final length metric value did not
significantly vary from the value prescribed by g(t)
(Figure 8, top). In contrast, when the same test is
performed for branch metric data, the number of branching
points within the simulation varied significantly across 50
simulations (Figure 8, bottom).
4. Discussion
The continuous–discrete framework outlined in this paper
was successful at predicting length and branching
behaviour exhibited by angiogenic microvessels in vitro.
Measurements of growth, branching and alignment
metrics provided by simulations had excellent statistical
agreement with experimental data. This accuracy was
obtained through optimisation of only four parameters: the
branching probability constant and the three weights
influencing growth direction. Introducing additional
parameters into the optimisation routine would lead to
even greater predictive performance from the model, but
the simple approach employed in this work satisfied the
objectives of this study.
Orientation data from simulations of the anisotropic
ECM condition correlated well with microvessel orien-
tation observed in the fixed-edge vascularised constructs.
However, angle data from the simulations tended to favour
the acute angle bins more than the corresponding
experimental data. Approximately 90% of microvessels
from the simulations were found orientated between 08 and
458 off of the constrained axis. Only 80% of microvessels
within the fixed-edge constructs fell within this same
range. Although this difference is seemingly trivial, it is
important to account for all inconsistencies between the
model and in vitro findings. This particular inconsistency
is important since the cornerstone assumption for this
simulation framework is that microvessel growth follows
collagen fibre orientation.
The inconsistency in microvessel orientation during
simulations of the anisotropic ECM condition may be due
to the assignment of an aligned ECM on day 0 of each
simulation. Within the fixed-edge constructs, angiogenesis
begins in a random ECM that is remodelled during vessel
growth, resulting in an aligned matrix. In future
simulations, supplying a fibril orientation field that can
vary over time will allow the model to capture the
transition to anisotropy that results from matrix remodel-
ling. While the growth of angiogenic microvessels may
follow matrix fibre orientation through contact guidance
(Shiu et al. 2005; Krishnan et al. 2007, 2008), neovessels
Bra
nch
met
ric
0.0
0.5
1.0
1.5
2.0
2.5
ExperimentModel
Time (days)
0 2 4 6
Time (days)
0 2 4 6
Len
gth
met
ric
0
100
200
300
400
500
600
ExperimentModel
Figure 5. Computational simulations accurately predictexperimental length and branching metric data taken fromexperimental cultures. (Top) Comparison of computational andexperimental length metric data versus time. There was anormalised RMS error of approximately 1% between the twodata-sets. (Bottom) Comparison of simulated and experimentalbranch metric data (number of current branches divided by initialnumber of microvessels in culture) versus time. There was anormalised RMS error of approximately 6% between the twodata-sets.
L.T. Edgar et al.8
Dow
nloa
ded
by [
Jeff
rey
Wei
ss]
at 0
7:33
19
Apr
il 20
12
may also alter local fibre orientation by applying traction
forces to the ECM during growth. This leads to a coupling
between angiogenic growth and matrix deformation, and it
is difficult to separate these effects. In order to investigate
this phenomenon, the authors plan to couple the
computational model of vessel growth to a framework in
solid mechanics that can predict deformation of the ECM
during angiogenesis. However, the intricate nature of
neovessel morphology makes it difficult to represent their
geometry using traditional discretisation schemes in
computational solid mechanics such as the finite element
method. One possible approach to deal with representing
the microvessel morphology was described in a recent
study, using a particle-based method known as the
material point method (MPM) (Sulsky et al. 1994, 1995).
With this method, particle distributions can be generated
from confocal microscopy image data-sets on a specimen-
specific basis (Guilkey et al. 2005, 2006). The coupling of
the growth model with simulations of solid mechanics will
create a more realistic simulation of in vitro angiogenesis.
Although the simulations and experiments agreed
statistically, there were qualitative discrepancies in the
computational predictions of microvessel morphology.
Simulated microvessel growth followed a more tortuous
path compared to microvessels cultured in the laboratory.
This discrepancy resulted from the mechanism used to
determine the orientation of new segments within the
computational model. New segments are allowed to form
any angle with the parent vessel segment, leading to
kinked microvessel morphology during elongation.
Implementation of a persistence component into the
vessel growth mechanism will make the microvessels
resistant to changes in direction, ideally eliminating this
morphological discrepancy.
The stochastic processes within the model led to
minimal variation between simulations. Microvessel
length was unaffected by the random numbers generated
during the simulations. This independence from the
random processes was expected as microvessel growth
rate was normalised to account for the random formation
of branches and anastomoses. However, some aspects of
microvascular topology were sensitive to variations in the
random number generator seed. Branching was governed
by a stochastic process, and branches would form at
different times and in different locations after re-seeding
the random number generator. Likewise, the position
and orientation of initial microvessel fragments would
vary between random number generations as well.
The conclusion is that these stochastic variations are
small enough to not cause instabilities, yet pronounced
enough to ensure that each simulation returns a unique
microvascular network.
Future development of the computational framework
will involve the replacement of stochastic components
with deterministic mechanisms. For example, past
mathematical models have suggested that steep gradients
in collagen density local to a tip cell can induce the
formation of a branch (Bauer 2007). Likewise, with further
analysis of confocal image data, it may be possible to
determine the degree of persistence involved during
microvessel elongation. During the simulation, ECM
collagen fibril orientation was supplied as an input
parameter. Therefore, future simulations could easily
predict in vitro angiogenesis for a given matrix orientation
by simply mapping the desired fibril orientation field to the
grid.
Chemical factors such as VEGF, TGF-b and
PDGF play a vital role during angiogenesis (Shiu et al.
2005). In order to isolate and study the impact of
Figure 6. Anisotropic collagen fibril orientation was observed within the fixed-edge constructs. (Left) Confocal reflection microscopyimage of collagen fibrils within a representative fixed-edge construct at day 6 in vitro. (Middle) Fast Fourier transform (FFT) analysis ofcollagen fibril data from constrained gels. Collagen fibrils were found to be predominately aligned along the constrained axis (08–1808).(Right) A field of collagen fibril angles based on angle distribution extracted from confocal reflectance microscopy images. This vectorfield was stored at the nodes of the grid in simulations of angiogenesis subjected to the anisotropic ECM condition. Scale bar ¼ 200mm.
Computer Methods in Biomechanics and Biomedical Engineering 9
Dow
nloa
ded
by [
Jeff
rey
Wei
ss]
at 0
7:33
19
Apr
il 20
12
mechanical/structural stimuli during angiogenesis, the
current model implementation does not include any
chemotactic guidance during neovessel outgrowth.
The in vitro system being modelled was uniformly
immersed in VEGF, leaving only local synthesis of
chemical factors as a possible source of chemical
inhomogeneity. Rat tail type I collagen used for the
experimental model does not contain trapped cytokines
which can be released upon digestion (Assoian et al. 1983;
Roberts et al. 1986). Therefore, it was possible to simulate
in vitro angiogenesis accurately without including
chemotaxis since significant chemotactic gradients do
not develop within the vascularised constructs.
The algorithms described in this study were highly
robust and efficient, with simulations completing within
seconds. The model demonstrates forward compatibility
through the ability to simulate different matrix boundary
conditions and simple coupling to optimisation algorithms.
Bra
nch
met
ric
dist
ribu
tion
0.0
0.5
1.0
1.5
2.0
2.5
3.0
3.5
Random seed trial #
0 2010 30 40 50
Random seed trial #
0 2010 30 40 50
Len
gth
met
ric
dist
ribu
tion
0
100
200
300
400
500
600
Figure 8. Stochastic variation within the computationalsimulations. Box–whisker plots of length (top) and branch(bottom) metric collected over 50 simulations, each with aunique P-RNG seeds. A one-way ANOVA was performed tocheck for significant variance between trials. No significantvariation in the length metric was seen while varying the P-RNGseed (p ¼ 1.0). Branching was modelled as a stochastic process,and therefore the branch metric significantly varied betweentrials (p , 0.001).
Figure 7. Computational simulations successfully predictedmicrovessel orientation within an anisotropic ECM. (Top)Microvessels cultured within the fixed-edge constructs werefound predominately aligned along the constrained axis. (Middle)Computational simulations of angiogenesis occurring with ananisotropic ECM accurately predicted experimental findings.(Bottom) The angle between each microvessel segment and thehorizontal axis was collected and sorted into discrete bins.Orientation data from the computational model correlated wellwith data from the fixed-edge vascularised constructs. Scalebar ¼ 400mm.
L.T. Edgar et al.10
Dow
nloa
ded
by [
Jeff
rey
Wei
ss]
at 0
7:33
19
Apr
il 20
12
The growth model will provide the MPM algorithm
with an accurate and current microvessel geometry that
can be used to determine the state of stress/strain within
microvessels and the surrounding matrix for any given
point in time (Guilkey et al. 2006). Information about the
deformation from the MPM simulations can then be used
to update important information such as matrix fibre
orientation, matrix density and vessel stretch. This
information can be used to direct vessel growth in the
next time step, and this process will repeat as both models
step throughout time.
In summary, the simulation framework outlined in this
work was capable of producing an accurate description of
microvascular length, branching and orientation metrics
over time for both an isotropic and anisotropic ECM fibril
orientation field. The extent of angiogenesis can be tightly
controlled by adjusting the input parameters, giving the
model the ability to simulate a wide range of problems.
Finally, the shape functions within the grid provide a basis
for expanding the model to include additional field
variables that influence neovessel growth and orientation.
For example, stress/strain fields could be mapped to the
nodes of the grid within the vessel growth model,
effectively coupling stress and strain fields within the
matrix to angiogenesis. These features allow this frame-
work to serve as an effective platform for exploring how
mechanical interactions between neovessels and the ECM
regulate angiogenesis.
Acknowledgements
Financial support from NIH grants R01HL077683 andR01EB007556 is gratefully acknowledged.
References
Assoian RK, Komoriya A, Meyers CA, Miller DM, Sporn MB.1983. Transforming growth factor-beta in human platelets.Identification of a major storage site, purification, andcharacterization. J Biol Chem. 258:7155–7160.
Bauer AL. 2007. A cell-based model exhibiting branching andanastomosis during tumor-induced angiogenesis. Biophys JBioFAST. 92:3105–3121.
Bottenstein JE, Sato GH. 1979. Growth of a rat neuroblastomacell line in serum-free supplemented medium. Proc NatlAcad Sci USA. 76:514–517.
Capasso V, Micheletti A, Morale D. 2008. Stochastic geometricmodels, and related statistical issues in tumour-inducedangiogenesis. Math Biosci. 214:20–31.
Carosi JA, Eskin SG, McIntire LV. 1992. Cyclical strain effectson production of vasoactive materials in cultured endothelialcells. J Cell Physiol. 151:29–36.
Chaplain MA. 2000. Mathematical modelling of angiogenesis.J Neurooncol. 50:37–51.
Chien S, Li S, Shyy YJ. 1998. Effects of mechanical forces onsignal transduction and gene expression in endothelial cells.Hypertension. 31:162–169.
Deroanne CF, Lapiere CM, Nusgens BV. 2001. In vitrotubulogenesis of endothelial cells by relaxation of the
coupling extracellular matrix-cytoskeleton. Cardiovasc Res.49:647–658.
Guilkey JE, Hoying JB, Weiss JA. 2005. Large-scale modeling ofthe mechanical behavior of multicellular constructs.Proceedings of the ASME Summer Bioengineering Con-ference, Vail, CO, June 22–26.
Guilkey JE, Hoying JB, Weiss JA. 2006. Computationalmodeling of multicellular constructs with the material pointmethod. J Biomech. 39:2074–2086.
Hoying J, Boswell C, Williams S. 1996. Angiogenic potential ofmicrovessel fragments established in three-dimensionalcollagen gels. In Vitro Cell Dev Biol Anim. 32:409–419.
Ingber DE. 2002. Mechanical signaling and the cellular responseto extracellular matrix in angiogenesis and cardiovascularphysiology. Circ Res. 91:877–887.
Ives CL, Eskin SG, McIntire LV. 1986. Mechanical effects onendothelial cell morphology: in vitro assessment. In VitroCell Dev Biol. 22:500–507.
Jalali S, del Pozo MA, Chen K, Miao H, Li Y, Schwartz MA,Shyy JY, Chien S. 2001. Integrin-mediated mechanotrans-duction requires its dynamic interaction with specificextracellular matrix (ECM) ligands. Proc Natl Acad SciUSA. 98:1042–1046.
Joung IS, Iwamoto MN, Shiu YT, Quam CT. 2006. Cyclic strainmodulates tubulogenesis of endothelial cells in a 3D tissueculture model. Microvasc Res. 71:1–11.
Krishnan L, Hoying JB, Das R, Weiss JA. 2003. Alterations inthe material properties of collagen by angiogenesis. Proc49th Annu Orthop Res Soc Meet. 28:278.
Krishnan L, Ngyuen H, Song H, Hoying JB, Weiss JA. 2005.Gene expression in a three-dimensional model of angiogen-esis: relation to matrix mechanical properties. Proceedings ofthe ASME Summer Bioengineering Conference abstractb0290109, Vail, CO, June 22–26.
Krishnan L, Hoying JB, Nguyen H, Song H, Weiss JA. 2007.Interaction of angiogenic microvessels with the extracellularmatrix. Am J Physiol Heart Circ Physiol. 293:H3650–H3658.
Krishnan L, Underwood CJ, Maas S, Ellis BJ, Kode TC,Hoying JB, Weiss JA. 2008. Effect of mechanical boundaryconditions on orientation of angiogenic microvessels.Cardiovasc Res. 78:324–332.
Krishnan L, Utzinger U, Maas SA, Reese SP, Weiss JA,Williams SK, Hoying JB. 2009. Extacellular matrix stiffnessmodulates microvascular morphology during early sproutingangiogenesis in vitro. Proceedings of the ASME SummerBioengineering Conference SBC2009:206782.
Liu Y, Griffith M, Watsky MA, Forrester JV, Kuffova L, Grant D,Merrett K, Carlsson DJ. 2006. Properties of porcine andrecombinant human collagen matrices for optically cleartissue engineering applications. Biomacromolecules.7:1819–1828.
Li S, Huang NF, Hsu S. 2005. Mechanotransduction inendothelial cell migration. J Cell Biochem. 96:1110–1126.
Manoussaki D, Lubkin SR, Vernon RB, Murray JD. 1996.A mechanical model for the formation of vascular networksin vitro. Acta Biotheor. 44:271–282.
Mantzaris NV, Webb S, Othmer HG. 2004. Mathematicalmodeling of tumor-induced angiogenesis. J Math Biol. 49:111–187.
McCormick SM, Frye SR, Eskin SG, Teng CL, Lu CM,Russell CG, Chittur KK, McIntire LV. 2003. Microarrayanalysis of shear stressed endothelial cells. Biorheology. 40:5–11.
Computer Methods in Biomechanics and Biomedical Engineering 11
Dow
nloa
ded
by [
Jeff
rey
Wei
ss]
at 0
7:33
19
Apr
il 20
12
Namy P, Ohayon J, Tracqui P. 2004. Critical conditions forpattern formation and in vitro tubulogenesis driven bycellular traction fields. J Theor Biol. 227:103–120.
Patrick CW, Jr, McIntire LV. 1995. Shear stress and cyclic strainmodulation of gene expression in vascular endothelial cells.Blood Purif. 13:112–124.
Pourdeyhimi B, Dent R, Davis H. 1997. Measuring fiberorientation in nonwovens Part III: Fourier transform. TextileRes J. 67:143–151.
Qutub AA, Popel AS. 2009. Elongation, proliferation &migration differentiate endothelial cell phenotypes anddetermine capillary sprouting. BMC Syst Biol. 3:13.
Roberts AB, Sporn MB, Assoian RK, Smith JM, Roche NS,Wakefield LM, Heine UI, Liotta LA, Falanga V, Kehrl JHet al., 1986. Transforming growth factor type beta: rapidinduction of fibrosis and angiogenesis in vivo and stimulationof collagen formation in vitro. Proc Natl Acad Sci USA.83:4167–4171.
Sander EA, Barocas VH. 2009. Comparison of 2D fiber networkorientation measurement methods. J Biomed Mater Res A.88:322–331.
Shepherd B, Chen H, Smith C, Gruionu G, Williams S, Hoying J.2004. Rapid perfusion and network remodeling in micro-vascular construct after implantation. Arterioscler ThromVasc Biol. 24:898–904.
Shiu YT, Weiss JA, Hoying JB, Iwamoto MN, Joung IS,Quam CT. 2005. The role of mechanical stresses inangiogenesis. Crit Rev Biomed Eng. 33:431–510.
Stamatas GN, McIntire LV. 2001. Rapid flow-induced responsesin endothelial cells. Biotechnol Prog. 17:383–402.
Sulsky D, Chen Z, Schreyer HL. 1994. A particle method forhistory dependent materials. Comput Methods Appl MechEng. 118:179–196.
Sulsky D, Zhou S, Schreyer HL. 1995. Application of a particle-in-cell method to solid mechanics. Comput Phys Commun.87:236–252.
Vernon RB, Sage EH. 1999. A novel, quantitative model forstudy of endothelial cell migration and sprout formationwithin three-dimensional collagen matrices. Microvasc Res.57:118–133.
WinFiber3D., available at http://mrl.sci.utah.edu/.
L.T. Edgar et al.12
Dow
nloa
ded
by [
Jeff
rey
Wei
ss]
at 0
7:33
19
Apr
il 20
12
Related Documents