A Comparison of Design-Based and Model-Based Analysis of Sample Surveys in Geography David C. Wheeler Emory University Jason E. VanHorn Calvin College Electra Paskett The Ohio State University Sample surveys are routinely used to gather primary data in human geography research. We highlight the difference between design-based analysis and model-based analysis of sample surveys and emphasize the advantages of using the design-based approach with these data. As an example, we demonstrate differences in results from model-based and design-based analyses of cancer prevalence in a population of predominantly minority women in North Carolina and South Carolina. The results from the two approaches reveal differences in population estimates of numerous variables and a different conclusion regarding the significance of an explanatory variable in a logistic regression model to explain colon cancer prevalence. Key Words: cancer, logistic regression, Stata, stratified sample, survey research. Rutinariamente se usan encuestas de muestra para recopilar datos primarios en investigaciones de geograf´ ıa humana. Recalcamos la diferencia entre los an´ alisis basados en el dise ˜ no y los an´ alisis basados en modelos de encuestas a muestras y enfatizamos las ventajas de usar la estrategia basada en el dise ˜ no con estos datos. Como ejemplo, demostramos las diferencias en los resultados de los an ´ alisis basados en modelos y los an ´ alisis basados en dise ˜ no de la prevalencia de c´ ancer en una poblaci ´ on de mujeres predominantemente minoritaria en Carolina del Norte y en Carolina del Sur. Los resultados de estas dos estrategias revelan diferencias en los c´ alculos de numerosas variables de la poblaci ´ on y una conclusi ´ on diferente referente a la importancia de una variable explicativa en un modelo de regresi ´ on log´ ıstica para explicar la prevalencia del c´ ancer del colon. Palabras clave: c ´ ancer, regresi ´ on log´ ıstica, Stata, muestra estratificada, investigaci ´ on por encuestas. S ocial and health scientists frequently turn to survey research to investigate research questions about individual behavior or char- acteristics where any existing data from sec- ondary sources would not adequately address the questions of interest. Survey sampling re- search is a method of data collection where in- dividuals provide some basis for making extrap- olations to a larger population (Manheim and Rich 1995). A sample survey is a study involv- ing a subset of individuals selected from a larger population, where the members of the sample are interviewed and characteristics of interest, or variables, are measured on each observa- tion. Sample surveys are routinely employed in human geography research to gather primary data to address research questions (Yankson 2000; Li and Siu 2001; Takasaki, Barham, and The Professional Geographer, 60(4) 2008, pages 466–477 C Copyright 2008 by Association of American Geographers. Initial submission, August 2007; revised submissions, December 2007 and February 2008; final acceptance, February 2008. Published by Taylor & Francis Group, LLC. Downloaded By: [Calvin College Seminary] At: 14:12 21 October 2008

Welcome message from author
This document is posted to help you gain knowledge. Please leave a comment to let me know what you think about it! Share it to your friends and learn new things together.
Transcript
A Comparison of Design-Based and Model-Based Analysis
of Sample Surveys in Geography
David C. WheelerEmory University
Jason E. VanHornCalvin College
Electra PaskettThe Ohio State University
Sample surveys are routinely used to gather primary data in human geography research. We highlightthe difference between design-based analysis and model-based analysis of sample surveys and emphasizethe advantages of using the design-based approach with these data. As an example, we demonstratedifferences in results from model-based and design-based analyses of cancer prevalence in a population ofpredominantly minority women in North Carolina and South Carolina. The results from the two approachesreveal differences in population estimates of numerous variables and a different conclusion regarding thesignificance of an explanatory variable in a logistic regression model to explain colon cancer prevalence.Key Words: cancer, logistic regression, Stata, stratified sample, survey research.
Rutinariamente se usan encuestas de muestra para recopilar datos primarios en investigaciones de geografıahumana. Recalcamos la diferencia entre los analisis basados en el diseno y los analisis basados en modelosde encuestas a muestras y enfatizamos las ventajas de usar la estrategia basada en el diseno con estos datos.Como ejemplo, demostramos las diferencias en los resultados de los analisis basados en modelos y los analisisbasados en diseno de la prevalencia de cancer en una poblacion de mujeres predominantemente minoritariaen Carolina del Norte y en Carolina del Sur. Los resultados de estas dos estrategias revelan diferencias enlos calculos de numerosas variables de la poblacion y una conclusion diferente referente a la importancia deuna variable explicativa en un modelo de regresion logıstica para explicar la prevalencia del cancer del colon.Palabras clave: cancer, regresion logıstica, Stata, muestra estratificada, investigacion por encuestas.
S ocial and health scientists frequently turnto survey research to investigate research
questions about individual behavior or char-acteristics where any existing data from sec-ondary sources would not adequately addressthe questions of interest. Survey sampling re-search is a method of data collection where in-dividuals provide some basis for making extrap-olations to a larger population (Manheim and
Rich 1995). A sample survey is a study involv-ing a subset of individuals selected from a largerpopulation, where the members of the sampleare interviewed and characteristics of interest,or variables, are measured on each observa-tion. Sample surveys are routinely employed inhuman geography research to gather primarydata to address research questions (Yankson2000; Li and Siu 2001; Takasaki, Barham, and
The Professional Geographer, 60(4) 2008, pages 466–477 C© Copyright 2008 by Association of American Geographers.Initial submission, August 2007; revised submissions, December 2007 and February 2008; final acceptance, February 2008.
Published by Taylor & Francis Group, LLC.
Downloaded By: [Calvin College Seminary] At: 14:12 21 October 2008
A Comparison of Design-Based and Model-Based Analysis of Sample Surveys 467
Coomes 2001; McSweeney 2002, 2004; Sinai2002; Paudel and Thapa 2004; Overmars andVerburg 2005). A sample survey is differentfrom a census, where all individuals in a popu-lation are measured. The motivation for takinga sample instead of a census is primarily theprohibitive expense, in terms of time, capital,and human resources, of enumerating a popu-lation of interest. In some small studies whererelatively few participants are to be measured,it may be possible and worthwhile to performa complete census of the target population. Insome circumstances, the inability to measure alltarget population participants adequately canturn an intended census into a sample of thepopulation (see, for example, Wyllie and Smith1996).
A primary objective of many sample surveysis often description of certain characteristics ofthe population, achieved through sample-basedestimates of the characteristics. Sample esti-mates of population parameters are obtained byaggregating the measurements from sampledindividuals. Inferences about the population arethen based on these summary statistics. The re-liability and validity of the summary statistics,or population parameter estimates, are interre-lated with the design of the sample. Reliabilityis associated with the size of the standard er-ror of an estimate and validity is measured bythe bias, or deviance from the true populationvalue, of an estimate. Reliability of an estimatecan only be assessed if a probability-based sam-ple is taken, so that the probability of select-ing any individual for the sample is known.Levy and Lemeshow (1999) demonstratethe differences between probability-basedand non-probability-based sampling schemes.The distinguishing characteristic is that inprobability-based schemes, each element or in-dividual selected in the sample has a nonzeroprobability of being included in the samplingframe, which is a list of the population fromwhich the sample can be attained. Quota sam-pling or “open-to-the-public” Internet pollingis considered non-probability-based becausethere is no way to achieve a nonzero probabilityof selection for individuals who do not take thesurvey (Weisberg, Krosnick, and Bowen 1996).
There are several types of designs for sam-ple surveys, including simple random sampling,systematic sampling, stratified sampling, clus-ter sampling, and multistage combinations of
these. All of these sampling designs are relevantfor geographers engaged in survey research.The decision on the type of sampling design toemploy is an important one and requires somecareful consideration. Typically, this decisiondepends on the objectives of the study and thedata that are available in the sampling designprocess. Korn and Graubard (1999) and Levyand Lemeshow (1999) provide detailed descrip-tions of the different sampling designs and theproperties associated with each one. In simplerandom sampling, each element in a popula-tion has the same probability of being selectedin the sample. In complex sample designs, suchas cluster or stratified sampling, each elementdoes not necessarily have the same probabilityof being sampled. Instead, the probability ofbeing sampled depends on the type of complexsample design one uses. In addition, the statisti-cal formulas to calculate population parameterestimates, such as means and standard errors ofmean estimates, account for the probability ofselection and hence differ across the numeroustypes of sampling designs.
The different types of sample surveys andassociated estimation methods have not beenwell distinguished in the geography literature.When differentiating between cluster samplingand stratified sampling, Holmes (1967) brieflystates to a geographic audience that scholarshave erroneously applied methods for simplerandom samples to complex samples in errorand thus have reached incorrect conclusions as aresult. This statement was ancillary to Holmes’smain theme and has not been brought to theattention of many geographers. A review of pa-pers dealing with sample surveys in geographicliterature reveals that increased attention to theappropriate analysis of sample data is needed.Others (Poon 2007) have noted an underre-porting of sampling design details in some geo-graphic journals. The work in many papers doesnot explicitly account for the sampling designin the analysis, which requires a design-basedanalysis. A design-based analysis treats the dataas a sample, sometimes a complex one, froma finite population and explicitly considers thesampling design by applying a statistical weightto each observation. In contrast, a model-basedanalysis assumes that the data are a simple ran-dom sample from an infinite population and areindependent and identically distributed (Kott1991). There are numerous examples in the
Downloaded By: [Calvin College Seminary] At: 14:12 21 October 2008
468 Volume 60, Number 4, November 2008
recent geographic literature of using model-based analysis of complex survey sample data,not accounting for sampling from a finite pop-ulation, and not reporting sampling design de-tails. Several commonly used statistical pack-ages in human geography research, such asSPSS, have historically assumed data are a sim-ple random sample from an infinite populationand, therefore, performed model-based analy-ses of sample survey data. A historical dearth ofstatistical software that enabled design-basedanalysis of sample survey data may have con-tributed to the current underutilization of thisanalytical approach. Fortunately, there are sta-tistical software packages, such as SUDAAN(Research Triangle Institute 2001) and Stata(Stata 2005), that enable one to perform design-based analysis of complex sample survey datawith ease. In addition, current versions of SPSS(SPSS Inc. 2006) allow for design-based anal-ysis of sample surveys using a complex sampleadd-on module that specifies the sample de-sign parameters through a complex sample file.Statistical software designed for sample surveyanalysis, such as SUDAAN and Stata, can es-timate variances of parameter estimates withTaylor series expansion linearization or repli-cation techniques, such as balanced repeatedreplication, jackknifing, and bootstrapping. Weuse the linearization approach because it is acommonly used approach for sampling withoutreplacement from a finite population and it isless computationally demanding than replica-tion methods.
While some geographers have not fully rec-ognized the benefits of a design-based approachto sample survey analysis, colleagues outsidethe discipline have been more active in this area.Lemeshow et al. (1998) provide an excellent ex-ample for biostatisticians and epidemiologistsof the difference between design-based anal-ysis and model-based analysis in the study ofthe association between wine consumption anddementia that argues for design-based analysis.Brogan (1998) demonstrates to the biostatis-tics community the difference in results be-tween using SUDAAN (design-based) and SAS(model-based) software to analyze the Behav-ioral Risk Factor Surveillance System (BRFSS)surveys. Both Lemeshow et al. (1998) and Bro-gan (1998) illustrate that biased point estimatesand inappropriate standard errors can resultfrom using nonspecialized statistical software
to analyze sample surveys. Works by Pickleand Su (2002) and Pickle et al. (2007) in pub-lic health journals also adjust for sample surveystatistical weights when analyzing the BRFSShealth surveys over several years. Pickle and Su(2002) produce smoothed maps at the countylevel of certain disease risk factor estimates,such as proportion smoking and proportion atrisk of obesity, using the BRFSS. Pickle et al.(2007) use population estimates of certain riskfactors from the BRFSS as covariates in a statis-tical model to predict new annual cancer cases.Schaible (1996) and Malec (1996) describe themore complicated method of indirect estimatesof population parameters, which rely on infor-mation from other locations or time periodsand are designed to increase accuracy of esti-mates when sample sizes are small.
Regrettably, many geographers have notbeen exposed to either the sample survey lit-erature in biostatistics or statistics or have nothad formal education in sample survey method-ology. This is a situation that should be ad-dressed directly in the geographic literature.The work presented in this article draws onthe existing literature to raise the awarenessof geographers to the importance of using thedesign-based approach when analyzing samplesurvey data and is aimed primarily at an audi-ence of human geography researchers engagedin or planning sample survey research in a rangeof geographic subdisciplines. To illustrate ourpoint, we demonstrate differences in resultsfrom model-based and design-based analyses ofcancer prevalence in a population of predomi-nantly low-income, minority women in urbanenvironments in North Carolina and SouthCarolina using sample survey data from theCarolinas Education and Screening (CARES)study. We compare estimates of populationmeans and proportions and standard errors ofestimates for numerous variables collected inthe study. We also compare the results of logis-tic regression models to measure associationsbetween potential risk factors and colon andnon-colon cancer prevalence. We perform theanalysis in Stata software and describe how todo so. This example is illustrative to the dif-ferent sample survey analysis approaches andshould be substantively stimulating to readersinterested in a variety of human geographic re-search agendas and especially to those in med-ical and health geography, a currently growing
Downloaded By: [Calvin College Seminary] At: 14:12 21 October 2008
A Comparison of Design-Based and Model-Based Analysis of Sample Surveys 469
area of research (for example, see Kolivras 2006;Langford and Higgs 2006; Strait 2006; Xu et al.2006; Sui 2007; Wheeler 2007).
Methods
The CARES StudyIn this section, we present the background foran analysis of a sample survey study. The initialanalysis of the sample survey data by the studyinvestigators did not consider the samplingdesign, but rather treated the complex stratifiedsample as a simple random sample from an infi-nite population. We contrast this model-basedanalysis with the appropriate design-basedanalysis. The CARES study was a three-yearstudy started in 2000 to investigate colorectalcancer screening among women aged fiftyyears and older who resided in subsidized hous-ing communities in cities in North Carolinaand South Carolina. The primary goal ofthe complete study was to assess the impactof an intervention program delivered byAmerican Cancer Society (ACS) volunteers toimprove attitudes, knowledge, and behaviorrelated to colorectal cancer screening. We hadaccess to the baseline data from the principalinvestigator, Dr. Electra Paskett, and analyzedthese data only. The baseline survey includedquestions related to knowledge of colon cancerrisk factors, history of cancer and colon cancerscreening, as well as demographic questionsand medical care questions. The motivation forthe CARES study was the substantial risk forcolorectal cancer among the female populationin the United States, as it is the third most com-mon cancer among women (Landis et al. 1999).In addition, colorectal cancer age-adjustedincidence and mortality rates are higher forAfrican Americans than any other racial orethnic group in the United States, as mortalityrates for colorectal cancer are 20 percent to30 percent higher in African Americans thanfor other ethnicities and five-year survival ratesare 15 percent lower for African Americansthan for Caucasians (Landis et al. 1999).Regarding screening, fewer colorectal cancersare detected at localized stages among AfricanAmericans compared to Caucasians. Colorectalcancer screening is an important preventativemeasure, as improved survival rates have been
linked to the use of early detection tests andchanges in lifestyle factors (Chu et al. 1994).
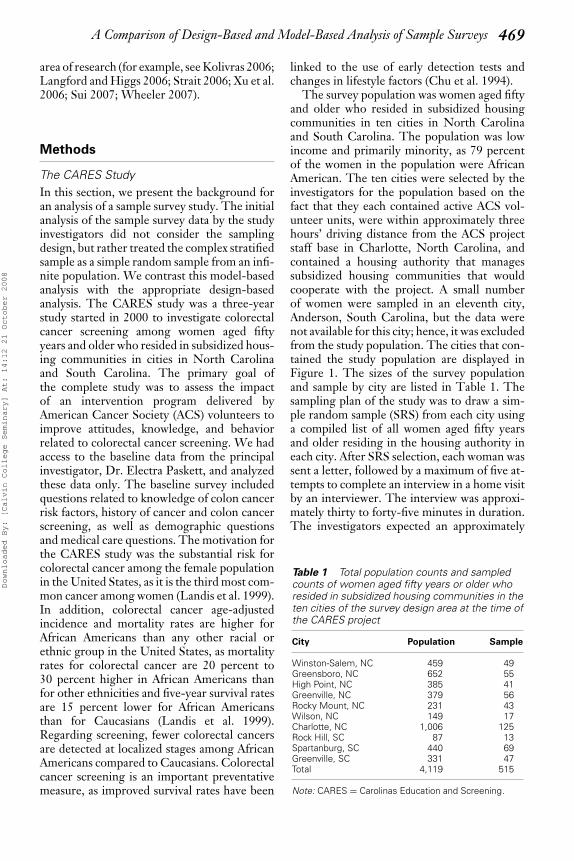
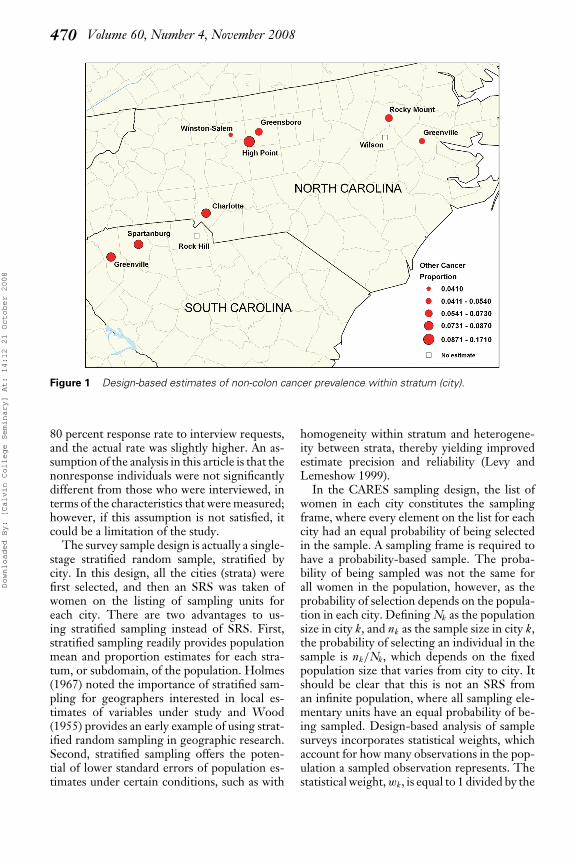
The survey population was women aged fiftyand older who resided in subsidized housingcommunities in ten cities in North Carolinaand South Carolina. The population was lowincome and primarily minority, as 79 percentof the women in the population were AfricanAmerican. The ten cities were selected by theinvestigators for the population based on thefact that they each contained active ACS vol-unteer units, were within approximately threehours’ driving distance from the ACS projectstaff base in Charlotte, North Carolina, andcontained a housing authority that managessubsidized housing communities that wouldcooperate with the project. A small numberof women were sampled in an eleventh city,Anderson, South Carolina, but the data werenot available for this city; hence, it was excludedfrom the study population. The cities that con-tained the study population are displayed inFigure 1. The sizes of the survey populationand sample by city are listed in Table 1. Thesampling plan of the study was to draw a sim-ple random sample (SRS) from each city usinga compiled list of all women aged fifty yearsand older residing in the housing authority ineach city. After SRS selection, each woman wassent a letter, followed by a maximum of five at-tempts to complete an interview in a home visitby an interviewer. The interview was approxi-mately thirty to forty-five minutes in duration.The investigators expected an approximately
Table 1 Total population counts and sampledcounts of women aged fifty years or older whoresided in subsidized housing communities in theten cities of the survey design area at the time ofthe CARES project
City Population Sample
Winston-Salem, NC 459 49Greensboro, NC 652 55High Point, NC 385 41Greenville, NC 379 56Rocky Mount, NC 231 43Wilson, NC 149 17Charlotte, NC 1,006 125Rock Hill, SC 87 13Spartanburg, SC 440 69Greenville, SC 331 47Total 4,119 515
Note: CARES = Carolinas Education and Screening.
Downloaded By: [Calvin College Seminary] At: 14:12 21 October 2008
470 Volume 60, Number 4, November 2008
Figure 1 Design-based estimates of non-colon cancer prevalence within stratum (city).
80 percent response rate to interview requests,and the actual rate was slightly higher. An as-sumption of the analysis in this article is that thenonresponse individuals were not significantlydifferent from those who were interviewed, interms of the characteristics that were measured;however, if this assumption is not satisfied, itcould be a limitation of the study.
The survey sample design is actually a single-stage stratified random sample, stratified bycity. In this design, all the cities (strata) werefirst selected, and then an SRS was taken ofwomen on the listing of sampling units foreach city. There are two advantages to us-ing stratified sampling instead of SRS. First,stratified sampling readily provides populationmean and proportion estimates for each stra-tum, or subdomain, of the population. Holmes(1967) noted the importance of stratified sam-pling for geographers interested in local es-timates of variables under study and Wood(1955) provides an early example of using strat-ified random sampling in geographic research.Second, stratified sampling offers the poten-tial of lower standard errors of population es-timates under certain conditions, such as with
homogeneity within stratum and heterogene-ity between strata, thereby yielding improvedestimate precision and reliability (Levy andLemeshow 1999).
In the CARES sampling design, the list ofwomen in each city constitutes the samplingframe, where every element on the list for eachcity had an equal probability of being selectedin the sample. A sampling frame is required tohave a probability-based sample. The proba-bility of being sampled was not the same forall women in the population, however, as theprobability of selection depends on the popula-tion in each city. Defining Nk as the populationsize in city k, and nk as the sample size in city k,the probability of selecting an individual in thesample is nk/Nk, which depends on the fixedpopulation size that varies from city to city. Itshould be clear that this is not an SRS froman infinite population, where all sampling ele-mentary units have an equal probability of be-ing sampled. Design-based analysis of samplesurveys incorporates statistical weights, whichaccount for how many observations in the pop-ulation a sampled observation represents. Thestatistical weight, wk, is equal to 1 divided by the
Downloaded By: [Calvin College Seminary] At: 14:12 21 October 2008
A Comparison of Design-Based and Model-Based Analysis of Sample Surveys 471
probability of selection of an element; there-fore, it is wk = Nk/nk for sampled observationsin city k. In the CARES example, the statisticalweights are easy to calculate, but this might notalways be the case, such as when the populationcounts are not known. Statistical weights mayalso be more difficult to calculate in more com-plex sampling designs; however, weights are of-ten provided for users of large national surveys,such as the National Health and Nutrition Ex-amination Survey (National Center for HealthStatistics 2006), so that unbiased estimates andproper standard errors may be calculated. Inpractice, some statistical analysis software, suchas Stata, allow the user to specify a variable thatcontains the statistical weights for sampled ob-servations.
The fact that a sample does not come froman infinite population is accounted for by thefinite population correction (FPC). The FPCis a multiplier adjustment to the estimate of astandard error of a population parameter esti-mate and has the effect of reducing the standarderror as the sample size n approaches the popu-lation size N (Levy and Lemeshow 1999). Theformula for the FPC is
√(N − n)/(N − 1). The
FPC can be seen in the equation for the stan-dard error of a sample mean for variable x in astratified random sample,
SE(x)=[
1N2
K∑k=1
(N2
k
) (σ 2
k
nk
) (Nk − nk
Nk − 1
)]1/2
,
(1)
where there are K strata and the population
stratum variance is σ 2k =
∑Nki=1 (Xik−Xk)2
Nk. The use
of the FPC offers notably improved precisionof population parameter estimates under cer-tain conditions, and there is no penalty for us-ing it. Whether the goal is to make statisticalstatements about a sample estimate itself or toinfer about a population parameter, the FPCwill effectively reduce the standard error. Asthe sample size increases relative to the popula-tion size, the effect of the FPC becomes moredramatic in decreasing the standard error, andgains in precision can be nearly 70 percent. Forexample, if N = 100 and n = 90, the FPC willreduce the standard error by approximately 68percent, thereby increasing the reliability of theestimate.
In the CARES study data, there were somemissing values for responses to certain ques-tions of interest. Rather than impute thesemissing values simply, such as using mean im-putation, and artificially decrease the estimatedstandard errors, we chose to delete these ob-servations by variable and account for the dele-tion by adjusting the corresponding statisticalweights. For example, in estimating the pro-portion of people who have been told by adoctor they had colon cancer, there were twoobservations with missing values (skipped thequestion) and these observations were dropped.Multiple imputation would be an alternativeto fill in the missing values and account forthe extra variation in the imputed values (Kornand Graubard 1999), particularly if there weremore missing observations. Using mean im-putation with a binary variable, such as pres-ence of colon cancer, is clearly problematic.As a result of removing some observations, thestatistical weights are different for some vari-ables. In notation, the statistical weights forvariable i in city k are wik = Nk/nik, wherenik = nk − nik0 is the sample size for variablei in city k after removing the nik0 observa-tions with missing values for variable i . Re-moving one observation effectively increasesthe weights of the other sampled observa-tions, as each observation now represents aslightly larger number of individuals in thepopulation.
We made use of the statistical weights tocalculate in Stata version 9 estimates of thepopulation mean and proportion for numerousvariables. To do so in Stata, we first specifythe survey design settings using the svysetcommand. The statistical weights, strata,and FPC are specified using the variablesWEIGHT, CITY, and N, where WEIGHTcontains the statistical weight for each ob-servation, CITY is a number indicating thecity where each observation resides, and Nis the size of the survey population for eachcity. The variable WEIGHT is calculatedusing the population and sample sizes bystrata. After the survey design parametershave been specified, we estimate proportions,means, and standard errors of estimatesfor certain variables. For example, to esti-mate the overall prevalence of colon cancer(CCANCER), we use the following com-mands with the binary variable CCANCER.
Downloaded By: [Calvin College Seminary] At: 14:12 21 October 2008
472 Volume 60, Number 4, November 2008
. svyset n [pw = WEIGHT], strata(CITY)fpc(N)
. svy: prop CCANCER
Results
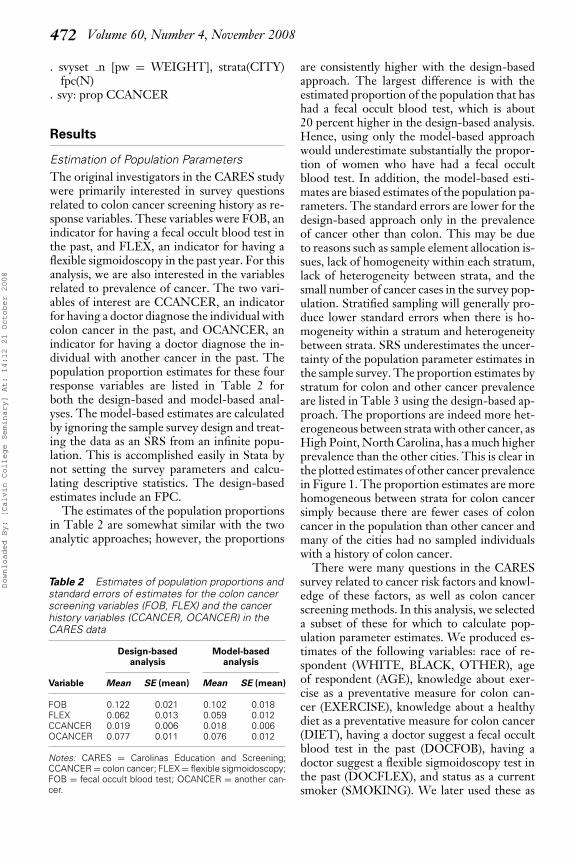
Estimation of Population ParametersThe original investigators in the CARES studywere primarily interested in survey questionsrelated to colon cancer screening history as re-sponse variables. These variables were FOB, anindicator for having a fecal occult blood test inthe past, and FLEX, an indicator for having aflexible sigmoidoscopy in the past year. For thisanalysis, we are also interested in the variablesrelated to prevalence of cancer. The two vari-ables of interest are CCANCER, an indicatorfor having a doctor diagnose the individual withcolon cancer in the past, and OCANCER, anindicator for having a doctor diagnose the in-dividual with another cancer in the past. Thepopulation proportion estimates for these fourresponse variables are listed in Table 2 forboth the design-based and model-based anal-yses. The model-based estimates are calculatedby ignoring the sample survey design and treat-ing the data as an SRS from an infinite popu-lation. This is accomplished easily in Stata bynot setting the survey parameters and calcu-lating descriptive statistics. The design-basedestimates include an FPC.
The estimates of the population proportionsin Table 2 are somewhat similar with the twoanalytic approaches; however, the proportions
Table 2 Estimates of population proportions andstandard errors of estimates for the colon cancerscreening variables (FOB, FLEX) and the cancerhistory variables (CCANCER, OCANCER) in theCARES data
Design-based Model-basedanalysis analysis
Variable Mean SE (mean) Mean SE (mean)
FOB 0.122 0.021 0.102 0.018FLEX 0.062 0.013 0.059 0.012CCANCER 0.019 0.006 0.018 0.006OCANCER 0.077 0.011 0.076 0.012
Notes: CARES = Carolinas Education and Screening;CCANCER = colon cancer; FLEX = flexible sigmoidoscopy;FOB = fecal occult blood test; OCANCER = another can-cer.
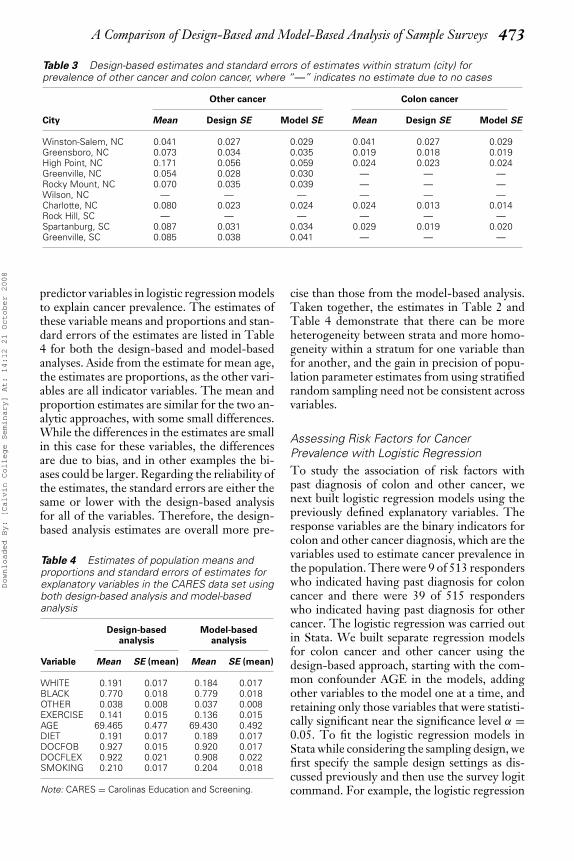
are consistently higher with the design-basedapproach. The largest difference is with theestimated proportion of the population that hashad a fecal occult blood test, which is about20 percent higher in the design-based analysis.Hence, using only the model-based approachwould underestimate substantially the propor-tion of women who have had a fecal occultblood test. In addition, the model-based esti-mates are biased estimates of the population pa-rameters. The standard errors are lower for thedesign-based approach only in the prevalenceof cancer other than colon. This may be dueto reasons such as sample element allocation is-sues, lack of homogeneity within each stratum,lack of heterogeneity between strata, and thesmall number of cancer cases in the survey pop-ulation. Stratified sampling will generally pro-duce lower standard errors when there is ho-mogeneity within a stratum and heterogeneitybetween strata. SRS underestimates the uncer-tainty of the population parameter estimates inthe sample survey. The proportion estimates bystratum for colon and other cancer prevalenceare listed in Table 3 using the design-based ap-proach. The proportions are indeed more het-erogeneous between strata with other cancer, asHigh Point, North Carolina, has a much higherprevalence than the other cities. This is clear inthe plotted estimates of other cancer prevalencein Figure 1. The proportion estimates are morehomogeneous between strata for colon cancersimply because there are fewer cases of coloncancer in the population than other cancer andmany of the cities had no sampled individualswith a history of colon cancer.
There were many questions in the CARESsurvey related to cancer risk factors and knowl-edge of these factors, as well as colon cancerscreening methods. In this analysis, we selecteda subset of these for which to calculate pop-ulation parameter estimates. We produced es-timates of the following variables: race of re-spondent (WHITE, BLACK, OTHER), ageof respondent (AGE), knowledge about exer-cise as a preventative measure for colon can-cer (EXERCISE), knowledge about a healthydiet as a preventative measure for colon cancer(DIET), having a doctor suggest a fecal occultblood test in the past (DOCFOB), having adoctor suggest a flexible sigmoidoscopy test inthe past (DOCFLEX), and status as a currentsmoker (SMOKING). We later used these as
Downloaded By: [Calvin College Seminary] At: 14:12 21 October 2008
A Comparison of Design-Based and Model-Based Analysis of Sample Surveys 473
Table 3 Design-based estimates and standard errors of estimates within stratum (city) forprevalence of other cancer and colon cancer, where “—” indicates no estimate due to no cases
Other cancer Colon cancer
City Mean Design SE Model SE Mean Design SE Model SE
Winston-Salem, NC 0.041 0.027 0.029 0.041 0.027 0.029Greensboro, NC 0.073 0.034 0.035 0.019 0.018 0.019High Point, NC 0.171 0.056 0.059 0.024 0.023 0.024Greenville, NC 0.054 0.028 0.030 — — —Rocky Mount, NC 0.070 0.035 0.039 — — —Wilson, NC — — — — — —Charlotte, NC 0.080 0.023 0.024 0.024 0.013 0.014Rock Hill, SC — — — — — —Spartanburg, SC 0.087 0.031 0.034 0.029 0.019 0.020Greenville, SC 0.085 0.038 0.041 — — —
predictor variables in logistic regression modelsto explain cancer prevalence. The estimates ofthese variable means and proportions and stan-dard errors of the estimates are listed in Table4 for both the design-based and model-basedanalyses. Aside from the estimate for mean age,the estimates are proportions, as the other vari-ables are all indicator variables. The mean andproportion estimates are similar for the two an-alytic approaches, with some small differences.While the differences in the estimates are smallin this case for these variables, the differencesare due to bias, and in other examples the bi-ases could be larger. Regarding the reliability ofthe estimates, the standard errors are either thesame or lower with the design-based analysisfor all of the variables. Therefore, the design-based analysis estimates are overall more pre-
Table 4 Estimates of population means andproportions and standard errors of estimates forexplanatory variables in the CARES data set usingboth design-based analysis and model-basedanalysis
Design-based Model-basedanalysis analysis
Variable Mean SE (mean) Mean SE (mean)
WHITE 0.191 0.017 0.184 0.017BLACK 0.770 0.018 0.779 0.018OTHER 0.038 0.008 0.037 0.008EXERCISE 0.141 0.015 0.136 0.015AGE 69.465 0.477 69.430 0.492DIET 0.191 0.017 0.189 0.017DOCFOB 0.927 0.015 0.920 0.017DOCFLEX 0.922 0.021 0.908 0.022SMOKING 0.210 0.017 0.204 0.018
Note: CARES = Carolinas Education and Screening.
cise than those from the model-based analysis.Taken together, the estimates in Table 2 andTable 4 demonstrate that there can be moreheterogeneity between strata and more homo-geneity within a stratum for one variable thanfor another, and the gain in precision of popu-lation parameter estimates from using stratifiedrandom sampling need not be consistent acrossvariables.
Assessing Risk Factors for CancerPrevalence with Logistic RegressionTo study the association of risk factors withpast diagnosis of colon and other cancer, wenext built logistic regression models using thepreviously defined explanatory variables. Theresponse variables are the binary indicators forcolon and other cancer diagnosis, which are thevariables used to estimate cancer prevalence inthe population. There were 9 of 513 responderswho indicated having past diagnosis for coloncancer and there were 39 of 515 responderswho indicated having past diagnosis for othercancer. The logistic regression was carried outin Stata. We built separate regression modelsfor colon cancer and other cancer using thedesign-based approach, starting with the com-mon confounder AGE in the models, addingother variables to the model one at a time, andretaining only those variables that were statisti-cally significant near the significance level α =0.05. To fit the logistic regression models inStata while considering the sampling design, wefirst specify the sample design settings as dis-cussed previously and then use the survey logitcommand. For example, the logistic regression
Downloaded By: [Calvin College Seminary] At: 14:12 21 October 2008
474 Volume 60, Number 4, November 2008
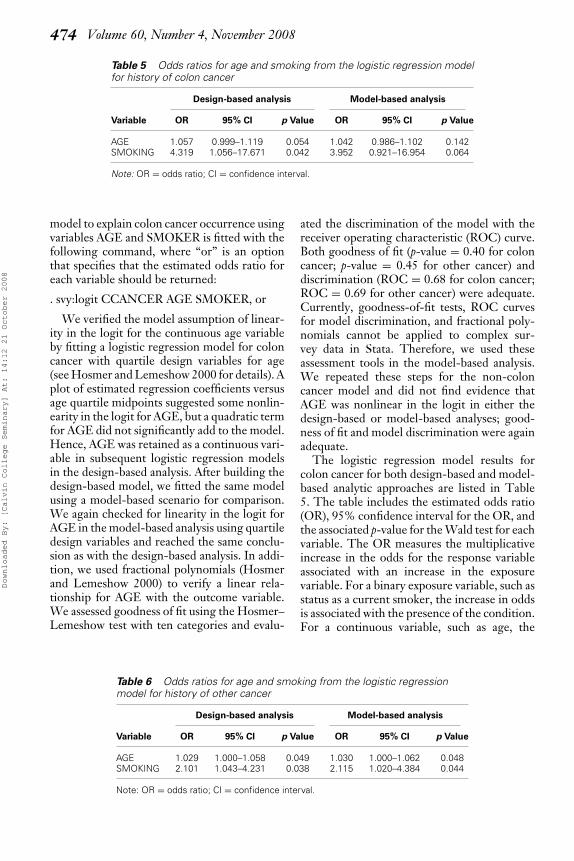
Table 5 Odds ratios for age and smoking from the logistic regression modelfor history of colon cancer
Design-based analysis Model-based analysis
Variable OR 95% CI p Value OR 95% CI p Value
AGE 1.057 0.999–1.119 0.054 1.042 0.986–1.102 0.142SMOKING 4.319 1.056–17.671 0.042 3.952 0.921–16.954 0.064
Note: OR = odds ratio; CI = confidence interval.
model to explain colon cancer occurrence usingvariables AGE and SMOKER is fitted with thefollowing command, where “or” is an optionthat specifies that the estimated odds ratio foreach variable should be returned:
. svy:logit CCANCER AGE SMOKER, or
We verified the model assumption of linear-ity in the logit for the continuous age variableby fitting a logistic regression model for coloncancer with quartile design variables for age(see Hosmer and Lemeshow 2000 for details). Aplot of estimated regression coefficients versusage quartile midpoints suggested some nonlin-earity in the logit for AGE, but a quadratic termfor AGE did not significantly add to the model.Hence, AGE was retained as a continuous vari-able in subsequent logistic regression modelsin the design-based analysis. After building thedesign-based model, we fitted the same modelusing a model-based scenario for comparison.We again checked for linearity in the logit forAGE in the model-based analysis using quartiledesign variables and reached the same conclu-sion as with the design-based analysis. In addi-tion, we used fractional polynomials (Hosmerand Lemeshow 2000) to verify a linear rela-tionship for AGE with the outcome variable.We assessed goodness of fit using the Hosmer–Lemeshow test with ten categories and evalu-
ated the discrimination of the model with thereceiver operating characteristic (ROC) curve.Both goodness of fit (p-value = 0.40 for coloncancer; p-value = 0.45 for other cancer) anddiscrimination (ROC = 0.68 for colon cancer;ROC = 0.69 for other cancer) were adequate.Currently, goodness-of-fit tests, ROC curvesfor model discrimination, and fractional poly-nomials cannot be applied to complex sur-vey data in Stata. Therefore, we used theseassessment tools in the model-based analysis.We repeated these steps for the non-coloncancer model and did not find evidence thatAGE was nonlinear in the logit in either thedesign-based or model-based analyses; good-ness of fit and model discrimination were againadequate.
The logistic regression model results forcolon cancer for both design-based and model-based analytic approaches are listed in Table5. The table includes the estimated odds ratio(OR), 95% confidence interval for the OR, andthe associated p-value for the Wald test for eachvariable. The OR measures the multiplicativeincrease in the odds for the response variableassociated with an increase in the exposurevariable. For a binary exposure variable, such asstatus as a current smoker, the increase in oddsis associated with the presence of the condition.For a continuous variable, such as age, the
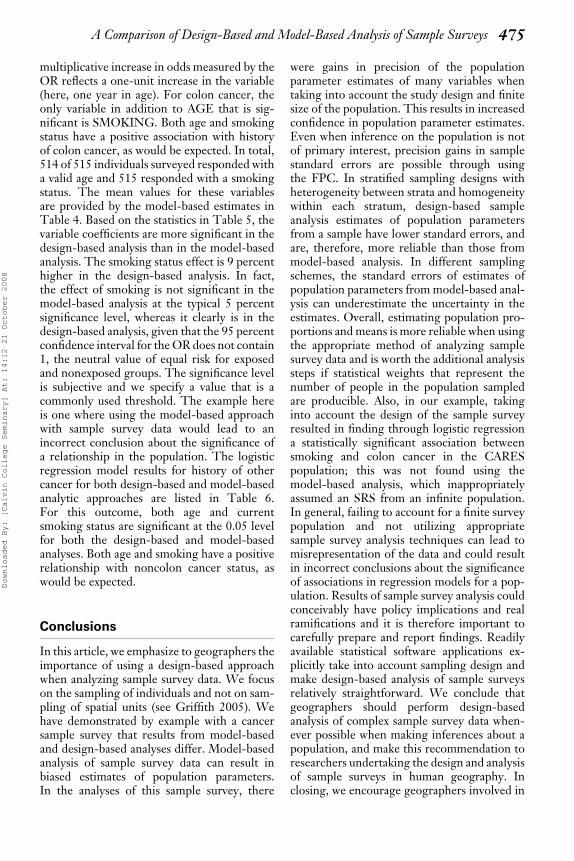
Table 6 Odds ratios for age and smoking from the logistic regressionmodel for history of other cancer
Design-based analysis Model-based analysis
Variable OR 95% CI p Value OR 95% CI p Value
AGE 1.029 1.000–1.058 0.049 1.030 1.000–1.062 0.048SMOKING 2.101 1.043–4.231 0.038 2.115 1.020–4.384 0.044
Note: OR = odds ratio; CI = confidence interval.
Downloaded By: [Calvin College Seminary] At: 14:12 21 October 2008
A Comparison of Design-Based and Model-Based Analysis of Sample Surveys 475
multiplicative increase in odds measured by theOR reflects a one-unit increase in the variable(here, one year in age). For colon cancer, theonly variable in addition to AGE that is sig-nificant is SMOKING. Both age and smokingstatus have a positive association with historyof colon cancer, as would be expected. In total,514 of 515 individuals surveyed responded witha valid age and 515 responded with a smokingstatus. The mean values for these variablesare provided by the model-based estimates inTable 4. Based on the statistics in Table 5, thevariable coefficients are more significant in thedesign-based analysis than in the model-basedanalysis. The smoking status effect is 9 percenthigher in the design-based analysis. In fact,the effect of smoking is not significant in themodel-based analysis at the typical 5 percentsignificance level, whereas it clearly is in thedesign-based analysis, given that the 95 percentconfidence interval for the OR does not contain1, the neutral value of equal risk for exposedand nonexposed groups. The significance levelis subjective and we specify a value that is acommonly used threshold. The example hereis one where using the model-based approachwith sample survey data would lead to anincorrect conclusion about the significance ofa relationship in the population. The logisticregression model results for history of othercancer for both design-based and model-basedanalytic approaches are listed in Table 6.For this outcome, both age and currentsmoking status are significant at the 0.05 levelfor both the design-based and model-basedanalyses. Both age and smoking have a positiverelationship with noncolon cancer status, aswould be expected.
Conclusions
In this article, we emphasize to geographers theimportance of using a design-based approachwhen analyzing sample survey data. We focuson the sampling of individuals and not on sam-pling of spatial units (see Griffith 2005). Wehave demonstrated by example with a cancersample survey that results from model-basedand design-based analyses differ. Model-basedanalysis of sample survey data can result inbiased estimates of population parameters.In the analyses of this sample survey, there
were gains in precision of the populationparameter estimates of many variables whentaking into account the study design and finitesize of the population. This results in increasedconfidence in population parameter estimates.Even when inference on the population is notof primary interest, precision gains in samplestandard errors are possible through usingthe FPC. In stratified sampling designs withheterogeneity between strata and homogeneitywithin each stratum, design-based sampleanalysis estimates of population parametersfrom a sample have lower standard errors, andare, therefore, more reliable than those frommodel-based analysis. In different samplingschemes, the standard errors of estimates ofpopulation parameters from model-based anal-ysis can underestimate the uncertainty in theestimates. Overall, estimating population pro-portions and means is more reliable when usingthe appropriate method of analyzing samplesurvey data and is worth the additional analysissteps if statistical weights that represent thenumber of people in the population sampledare producible. Also, in our example, takinginto account the design of the sample surveyresulted in finding through logistic regressiona statistically significant association betweensmoking and colon cancer in the CARESpopulation; this was not found using themodel-based analysis, which inappropriatelyassumed an SRS from an infinite population.In general, failing to account for a finite surveypopulation and not utilizing appropriatesample survey analysis techniques can lead tomisrepresentation of the data and could resultin incorrect conclusions about the significanceof associations in regression models for a pop-ulation. Results of sample survey analysis couldconceivably have policy implications and realramifications and it is therefore important tocarefully prepare and report findings. Readilyavailable statistical software applications ex-plicitly take into account sampling design andmake design-based analysis of sample surveysrelatively straightforward. We conclude thatgeographers should perform design-basedanalysis of complex sample survey data when-ever possible when making inferences about apopulation, and make this recommendation toresearchers undertaking the design and analysisof sample surveys in human geography. Inclosing, we encourage geographers involved in
Downloaded By: [Calvin College Seminary] At: 14:12 21 October 2008
476 Volume 60, Number 4, November 2008
survey research to invest considerable thoughtinto the sampling design of sample surveys andto provide detailed description when reportingon results of survey research. �
Literature Cited
Brogan, D. J. 1998. Software for sample survey data,misuse of standard packages. In Encyclopedia of bio-statistics. Vol. 5, ed. P. Armitage and T. Colton,4167–74. New York: Wiley.
Chu, K. C., R. E. Tarone, W. H. Chow, B. F.Hankey, and L. A. Ries. 1994. Temporal patternsin colorectal cancer incidence, survival, and mor-tality through 1990. Journal of the National CancerInstitute 87:997.
Griffith D. A. 2005. Effective geographic sample sizein the presence of spatial autocorrelation. Annals ofthe Association of American Geographers 94 (5): 740–60.
Holmes, J. 1967. Problems in location sampling.Annals of the Association of American Geographers47:757–80.
Hosmer, D. W., and S. Lemeshow. 2000. Appliedlogistic regression. 2nd ed. New York: Wiley.
Kolivras, K. N. 2006. Mosquito habitat and denguerisk potential in Hawaii: A conceptual frameworkand GIS application. The Professional Geographer 58(2): 139–54.
Korn, E. L., and B. I. Graubard. 1999. Analysis ofhealth surveys. New York: Wiley.
Kott, P. S. 1991. A model-based look at linear re-gression with survey data. The American Statistician45:107–12.
Landis, S. H., T. Munay, S. Bolden, and P. A. Wingo.1999. Cancer statistics. CA: A Cancer Journal forClinicians 49:8–31.
Langford, M., and G. Higgs. 2006. Measuring po-tential access to primary healthcare services: Theinfluence of alternative spatial representations ofpopulation. The Professional Geographer 58 (3): 294–306.
Lemeshow, S., L. Letenneur, J. F. Dartigues, S.Lafont, J. M. Orgogozo, and D. Commenges.1998. Illustration of analysis taking into accountcomplex survey considerations: The associationbetween wine consumption and dementia in thePAQUID study. American Journal of Epidemiology148:298–306.
Levy, P. S., and S. Lemeshow. 1999. Sampling of pop-ulations: Methods and applications. New York: Wiley.
Li, S. M., and Y. M. Siu. 2001. Residential mobilityand urban restructuring under market transition:A study of Guangzhou, China. The Professional Ge-ographer 53 (2): 219–29.
Malec, D. 1996. Model based state estimates from theNational Health Interview survey. In Indirect esti-
mators in U.S. federal programs, ed. W. L. Schaible,145–67. New York: Springer-Verlag.
Manheim, J., and R. Rich. 1995. Empirical politicalanalysis: Research methods in political science. 4th ed.White Plains, NY: Longman.
McSweeney, K. 2002. Who is “forest-dependent”?Capturing local variation in forest-product sale,Eastern Honduras. The Professional Geographer 54(2): 158–74.
———. 2004. Forest product sale as natural insur-ance: The effects of household characteristics andthe nature of shock in eastern Honduras. Societyand Natural Resources 17:39–56.
National Center for Health Statistics. 2006. Analyticand reporting guidelines: The National Health and Nu-trition Examination Survey (NHANES). Hyattsville,MD: National Center for Health Statistics.
Overmars, K. P., and P. H. Verburg. 2005. Analysisof land use drivers at the watershed and householdlevel: Linking two paradigms at the Philippine for-est fringe. International Journal of Geographical In-formation Science 19:125–52.
Paudel, G. S., and G. B. Thapa. 2004. Im-pact of social, institutional and ecological fac-tors on land management practices in mountainwatersheds of Nepal. Applied Geography 24:35–55.
Pickle, L. W., Y. Hao, A. Jemel, Z. Zou, R. C. Ti-wari, E. Ward, M. Hachey, H. L. Howe, and E. J.Feuer. 2007. A new method of estimating UnitedStates and state-level cancer incidence counts forthe current calendar year. CA: A Cancer Journal forClinicians 57 (1): 30–42.
Pickle, L. W., and Y. Su. 2002. Within-state geo-graphic patterns of health insurance coverage andhealth risk factors in the United States. AmericanJournal of Preventive Medicine 22 (2): 75–83.
Poon, J. 2007. Instrumentation rigor and prac-tice. Environment and Planning A 39 (5): 1017–19.
Research Triangle Institute. 2001. SUDAAN user’smanual, release 8.0. Research Triangle Park, NC:Research Triangle Institute.
Schaible, W. L. 1996. Introduction and summary. InIndirect estimators in U.S. federal programs, ed. W.L. Schaible, 1–15. New York: Springer-Verlag.
Sinai, I. 2002. The determinants of the number ofrooms occupied by compound dwellers in Kumasi,Ghana: Does working at home mean more rooms?Applied Geography 22:77–90.
SPSS, Inc. 2006. Command syntax reference. Chicago:SPSS, Inc.
Stata. 2005. Release 9 user’s guide. College Station,TX: Stata Press.
Strait, J. B. 2006. An epidemiology of neighbor-hood poverty: Causal factors of infant mortal-ity among blacks and whites in the metropolitanUnited States. The Professional Geographer 58 (1):39–53.
Downloaded By: [Calvin College Seminary] At: 14:12 21 October 2008
A Comparison of Design-Based and Model-Based Analysis of Sample Surveys 477
Sui, D. Z. 2007. Geographic information systems andmedical geography: Toward a new synergy. Geog-raphy Compass 1 (3): 556–82.
Takasaki, Y., B. L. Barham, and O. T. Coomes. 2001.Amazonian peasants, rain forest use, and incomegeneration: The role of wealth and geographi-cal factors. Society and Natural Resources 14:291–308.
Weisberg, H. F., J. A. Krosnick, and B. D. Bowen.1996. An introduction to survey research, polling, anddata analysis. 3rd ed. Thousand Oaks, CA: Sage.
Wheeler, D. 2007. A comparison of spatial cluster-ing and cluster detection techniques for childhoodleukemia incidence in Ohio, 1996–2003. Interna-tional Journal of Health Geographics 6:13.
Wood, W. F. 1955. Use of stratified random sam-ples in a land use study. Annals of the Association ofAmerican Geographers 45 (4): 350–67.
Wyllie, D. S., and G. C. Smith. 1996. Effects of ex-troversion on the routine spatial behavior of mid-dle adolescents. The Professional Geographer 48 (2):166–80.
Xu, B., P. Gong, E. Seto, S. Liang, C. Yang, S. Wen,D. Qiu, X. Gu, and R. Spear. 2006. A spatial-temporal model for assessing the effects of intervil-lage connectivity in schistosomiasis transmission.Annals of the Association of American Geographers 96(1): 31–46.
Yankson, P. W. K. 2000. Houses and residentialneighbourhoods as work places in urban areas:The case of selected low income residential ar-eas in Greater Accra Metropolitan Area (GAMA),Ghana. Singapore Journal of Tropical Geography 21(2): 200–14.
DAVID C. WHEELER is a Postdoctoral Re-search Fellow in the Department of Biostatis-tics at Emory University, Atlanta, GA 30322.E-mail: [email protected]. His research in-terests are primarily in the analysis of health us-ing spatial statistics and geographical informationsystems.
JASON E. VANHORN is an Assistant Professor inthe Department of Geology, Geography, and Envi-ronmental Studies at Calvin College, Grand Rapids,MI 49546. E-mail: [email protected]. His re-search interests are at the intersections of GIScience,mapping, and homeland security.
ELECTRA PASKETT is a Professor in theDepartment of Epidemiology at The OhioState University, Columbus, OH 43210. E-mail:[email protected]. Her research interests are incancer control and prevention.
Downloaded By: [Calvin College Seminary] At: 14:12 21 October 2008
Related Documents