Annual Trends and Outlook Report 20 20 SUSTAINING AFRICA'S AGRIFOOD SYSTEM TRANSFORMATION: The Role of Public Policies Edited by Danielle Resnick, Xinshen Diao, and Getaw Tadesse

Welcome message from author
This document is posted to help you gain knowledge. Please leave a comment to let me know what you think about it! Share it to your friends and learn new things together.
Transcript

Kicukiro/Niboye KK 341 St 22 P.O. Box 1855Kigali, RwandaTel.: +221-77-761-73-02Email: [email protected]
Regional Strategic Analysis and Knowledge Support System
AKADEMIYA2063Kicukiro/Niboye KK 341 St 22 P.O. Box 1855Kigali, RwandaTel.: +221-77-761-73-02Email: [email protected] | www.akademiya2063.org
International Food Policy Research Institute1201 Eye Street NWWashington, DC 20005 USATel.: + 1 202.862.5600Fax: +1 202.862.5606www.ifpri.org
AnnualTrends
and OutlookReport
2020
SUSTAINING AFRICA'S AGRIFOOD SYSTEM TRANSFORMATION: The Role of Public Policies
Edited by
Danielle Resnick, Xinshen Diao, and Getaw Tadesse
About ReSAKSS | www.resakss.orgEstablished in 2006 under the Comprehensive Africa Agriculture Development Programme (CAADP), the Regional Strategic Analysis and Knowledge Support System (ReSAKSS) supports efforts to promote evidence- and outcome-based policy planning and implementation. In particular, ReSAKSS provides data and related analytical and knowledge products to facilitate CAADP benchmarking, review, and mutual learning processes. AKADEMIYA2063 leads the work of ReSAKSS in partnership with the African Union Commission, the African Union Development Agency-NEPAD (AUDA-NEPAD), and leading regional economic communities (RECs). AKADEMIYA2063’s mission is to provide data, policy analysis, and capacity strengthening support to enable African Union (AU) Member States to achieve economic transformation and shared prosperity in support of AU’s Agenda 2063.
ReSAKSS is funded by the United States Agency for International Development (USAID) and the Bill & Melinda Gates Foundation. Previously, ReSAKSS also received funding from the International Fund for Agricultural Development (IFAD), the Ministry of Foreign Affairs of Netherlands (MFAN), the UK Department for International Development (DFID), and the Swedish International Development Cooperation Agency (Sida).
AKADEMIYA2063 receives funding from USAID through the Feed the Future Policy LINK program under the Cooperative Agreement 7200AA19CA00019. The authors’ views expressed in this publication do not necessarily reflect the views of USAID.
EditorsDanielle Resnick, Xinshen Diao, and Getaw Tadesse
DOI: https://doi.org/10.2499/9780896293946ISBN: 978-0-89629-394-6
Recommended CitationResnick, D., Diao, X., and Tadesse, G. (Eds.) 2020. Sustaining Africa’s Agrifood System Transformation: The Role of Public Policies. ReSAKSS 2020 Annual Trends and Outlook Report. Washington, DC, and Kigali: International Food Policy Research Institute (IFPRI) and AKADEMIYA2063.
This is a peer-reviewed publication. Any opinions expressed herein are those of the authors and are not necessarily representative of or endorsed by IFPRI or AKADEMIYA2063.
CopyrightCopyright 2020 International Food Policy Research Institute. Except where otherwise noted, this work is licensed under a Creative Commons Attribution 4.0 license (CC-BY-NC-ND), available at http://creativecommons.org/licenses/by-nc-nd/4.0/.http://creativecommons.org/licenses/by-nc-nd/4.0/.
Contributors Mateo Ambrosio, Researcher, University of CordobaGashaw T. Abate, Research Fellow, Markets, Trade, and Institutions Division (MTID), International Food Policy Research Institute (IFPRI)Kibrom A. Abay, Research Fellow, Development Strategy and Governance Division (DSGD), IFPRIPatrick O. Aboagye, Deputy Director, Agricultural Engineering Services Directorate, Ministry of Food & Agriculture, GhanaBenjamin K. Addom, Senior Programme Manager, Digital Agricultural Development, Wageningen University & ResearchOusmane Badiane, Executive Chairperson, AKADEMIYA2063Heike Baumüller, Senior Researcher, Center for Development Research, University of BonnFranck Berthe, Senior Livestock Specialist, World Bank
Antoine Bouët, Senior Research Fellow, MTID, IFPRIJulia Collins, Senior Associate Scientist, AKADEMIYA2063Xinshen Diao, Deputy Division Director, DSGD, IFPRIAmy Faye, Researcher, Bureau d'Analyses Macro-Économique of the Senegalese Institute of Agricultural ResearchDelia Grace, Professor Food Safety Systems, Natural Resources Institute; Contributing Scientist, International Livestock Research InstituteSpencer Henson, Full Professor, University of GuelphSteven Jaffee, Lecturer, Agricultural and Resource Economics, University of MarylandOliver Kirui, Senior Researcher, Center for Development Research, University of BonnTsitsi Makombe, Director, External Relations, AKADEMIYA2063
Greenwell Matchaya, Senior Researcher, ReSAKSS Coordinator for Southern Africa, International Water Management InstituteDawit Mekonnen, Research Fellow, Environment and Production Technology Division (EPTD), IFPRIAdamon N. Mukasa, Senior Research Economist, African Development Bank GroupNjuguna Ndung'u, Executive Director, African Economic Research Consortium (AERC)Sunday Odjo, Deputy Director, Knowledge Systems, AKADEMIYA2063James Oehmke, Senior Food Security and Nutrition Advisor, United States Agency for International Development Danielle Resnick, Senior Research Fellow, DSGD, IFPRIClaudia Ringler, Deputy Division Director, EPTD, IFPRI
Abebe Shimeles, Director of Research, AERCDavid Spielman, Senior Research Fellow/Program Leader-Rwanda, DSGD, IFPRIGetaw Tadesse, Director, Bilateral Programs, AKADEMIYA2063Hiroyuki Takeshima, Senior Research Fellow, DSGD, IFPRIWondwosen Tefera, Senior Associate Scientist, AKADEMIYA2063Agbonlahor Mure Uhunamure, Senior Marketing and Production Officer, Africa Union Semi-Arid Food Grain Research and DevelopmentJohn M.Ulimwengu, Senior Research Fellow, Africa Region, IFPRIFleur Wouterse, Principal Researcher, Global Center on Adaptation Hua Xie, Research Fellow, EPTD, IFPRI
Cover design: Joan Stephens/JKS Design and Shirong Gao/IFPRI
SUSTAINING AFRICA'S AGRIFOOD SYSTEM TRANSFORMATION:
The Role of Public Policies
AnnualTrends
and OutlookReport
2020

ii resakss.org
2020 ReSAKSS Annual Trends and Outlook Report iii
Contents
LIST OF TABLES vii
LIST OF FIGURES viii
LIST OF BOXES x
ABBREVIATIONS xi
ACKNOWLEDGMENTS xiv
FOREWORD xv
EXECUTIVE SUMMARY xvi
1| INTRODUCTION: ACCELERATING POLICY PROGRESS IN UNCERTAIN TIMES 1
Danielle Resnick, Xinshen Diao, and Getaw Tadesse
2| THE PAST, PRESENT AND FUTURE OF AGRICULTURE POLICY IN AFRICA 9
Ousmane Badiane, Julia Collins, and John M. Ulimwengu
3| SEED POLICIES AND REGULATORY REFORMS 26 David Spielman
4| FERTILIZER POLICIES AND IMPLICATIONS FOR AFRICAN AGRICULTURE 33
Gashaw T. Abate, Kibrom A. Abay, and David Spielman
5| POLICIES FOR COMPETITIVE AND SUSTAINABLE AGRICULTURAL PRODUCTION SYSTEMS: A CASE STUDY OF GHANA’S RECENT MECHANIZATION INTERVENTIONS 45
Hiro Takeshima, Xinshen Diao, and Patrick Ohene Aboagye
6| IRRIGATION TO TRANSFORM AGRICULTURE AND FOOD SYSTEMS IN AFRICA SOUTH OF THE SAHARA 57
Claudia Ringlera, Dawit Mekonnena, Hua Xiea, and Agbonlahor Mure Uhunamure

iv resakss.org
7| POLICY RESPONSES TO RAPIDLY TRANSFORMING MIDSTREAM VALUE CHAIN SEGMENTS IN AFRICA: THE CASE OF THE MILLET SECTOR IN SENEGAL 71
Getaw Tadesse and Ousmane Badiane
8| INSTITUTIONS OF COLLECTIVE ACTION AND SMALLHOLDER PERFORMANCE: EVIDENCE FROM SENEGAL 87
Fleur Wouterse and Amy Faye
9| SKILLS DEVELOPMENT FOR VALUE CHAIN ACTORS IN AFRICAN AGRICULTURE 102
Oliver Kirui
10| WHY FOOD SAFETY MATTERS TO AFRICA: MAKING THE CASE FOR POLICY ACTION 112
Steve Jaffee, Spencer Henson, Delia Grace, Mateo Ambrosio, and Franck Berthe
11| THE COMPETITIVENESS OF AFRICAN AGRICULTURE: REVISITING TRADE POLICY REFORM IN AFRICA 130
Antoine Bouët and Sunday Odjo
12| ALIGNING MACROECONOMIC POLICIES FOR AGRICULTURAL TRANSFORMATION IN AFRICA 144
Adamon N. Mukasa, Njuguna Ndung’u, and Abebe Shimeles
13| THE ENABLING ENVIRONMENTS FOR THE DIGITALIZATION OF AFRICAN AGRICULTURE 159
Heike Baumüller and Benjamin K.Addom
14| THE POLITICAL ECONOMY OF AGRICULTURAL POLICY IN AFRICA: IMPLICATIONS FOR AGRIFOOD SYSTEM TRANSFORMATION 174
Danielle Resnick
15| MUTUAL ACCOUNTABILITY IN AFRICAN AGRICULTURAL TRANSFORMATION 182
John M. Ulimwengu, Greenwell Matchaya, Tsitsi Makombe, and James Oehmke
16| TRACKING KEY CAADP INDICATORS AND IMPLEMENTATION PROCESSES 195
Tsitsi Makombe, Wondwosen Tefera, and John M. Ulimwengu
17| CONCLUDING REMARKS 213
Danielle Resnick, Xinshen Diao, and Getaw Tadesse
Contents Continued

2020 ReSAKSS Annual Trends and Outlook Report v
ANNEXES| CORE CAADP M&E AND SUPPLEMENTARY INDICATORS 217
ANNEX 1a: Level 1—Agriculture’s Contribution to Economic Growth and Inclusive Development, Indicator 1.1.1 220
ANNEX 1b: Level 1—Agriculture’s Contribution to Economic Growth and Inclusive Development, Indicator 1.1.2 221
ANNEX 1c: Level 1—Agriculture’s Contribution to Economic Growth and Inclusive Development, Indicator 1.2.1 222
ANNEX 1d: Level 1—Agriculture’s Contribution to Economic Growth and Inclusive Development, Indicator 1.2.2A 223
ANNEX 1e: Level 1—Agriculture’s Contribution to Economic Growth and Inclusive Development, Indicator 1.2.2B 224
ANNEX 1f: Level 1—Agriculture’s Contribution to Economic Growth and Inclusive Development, Indicator 1.2.2C 225
ANNEX 1g: Level 1—Agriculture’s Contribution to Economic Growth and Inclusive Development, Indicator 1.2.3 226
ANNEX 1h: Level 1—Agriculture’s Contribution to Economic Growth and Inclusive Development, Indicator 1.3.1A 227
ANNEX 1i: Level 1—Agriculture’s Contribution to Economic Growth and Inclusive Development, Indicator 1.3.1B 228
ANNEX 1j: Level 1—Agriculture’s Contribution to Economic Growth and Inclusive Development, Indicator 1.3.3 229
ANNEX 1k: Level 1—Agriculture’s Contribution to Economic Growth and Inclusive Development, Indicator 1.3.4 230
ANNEX 2a: Level 2—Agricultural Transformation and Sustained Inclusive Agricultural Growth, Indicator 2.1.1 231
ANNEX 2b: Level 2—Agricultural Transformation and Sustained Inclusive Agricultural Growth, Indicator 2.1.2 232
ANNEX 2c: Level 2—Agricultural Transformation and Sustained Inclusive Agricultural Growth, Indicator 2.1.3 233
ANNEX 2d: Level 2—Agricultural Transformation and Sustained Inclusive Agricultural Growth, Indicator 2.1.4 234
ANNEX 2e: Level 2—Agricultural Transformation and Sustained Inclusive Agricultural Growth, Indicator 2.1.5A 235
ANNEX 2f: Level 2—Agricultural Transformation and Sustained Inclusive Agricultural Growth, Indicator 2.1.5B 236
ANNEX 2g: Level 2—Agricultural Transformation and Sustained Inclusive Agricultural Growth, Indicator 2.1.5C 237
ANNEX 2h: Level 2—Agricultural Transformation and Sustained Inclusive Agricultural Growth, Indicator 2.1.5D 238
ANNEX 2i: Level 2—Agricultural Transformation and Sustained Inclusive Agricultural Growth, Indicator 2.1.5E 239
ANNEX 2j: Level 2—Agricultural Transformation and Sustained Inclusive Agricultural Growth, Indicator 2.2.1A 240
ANNEX 2k: Level 2—Agricultural Transformation and Sustained Inclusive Agricultural Growth, Indicator 2.2.1B 241
ANNEX 3a: Level 3—Strengthening Systemic Capacity to Deliver Results, Indicator 3.5.1 242

vi resakss.org
ANNEXES| CORE CAADP M&E AND SUPPLEMENTARY INDICATORS continued
ANNEX 3b: Level 3—Strengthening Systemic Capacity to Deliver Results, Indicator 3.5.2 243
ANNEX 3c: Level 3—Strengthening Systemic Capacity to Deliver Results, Indicator 3.5.3 244
ANNEX 3d: Level 3—Strengthening Systemic Capacity to Deliver Results 245
ANNEX 4: Country Categories by Geographic Regions, Economic Classification, and Regional Economic Communities 251
ANNEX 5: Distribution of Countries by Year of Signing CAADP Compact and Level of CAADP Implementation Reached by End of 2015 254
ANNEX 6: Distribution of Countries in Formulating First-Generation Investment Plan (NAIP1.0) and Second-Generation Investment Plan (NAIP2.0) Reached by September of 2020 255
ANNEX 7: Supplementary Data Tables 256
REFERENCES 269
Contents Continued
2020 ReSAKSS Annual Trends and Outlook Report vii
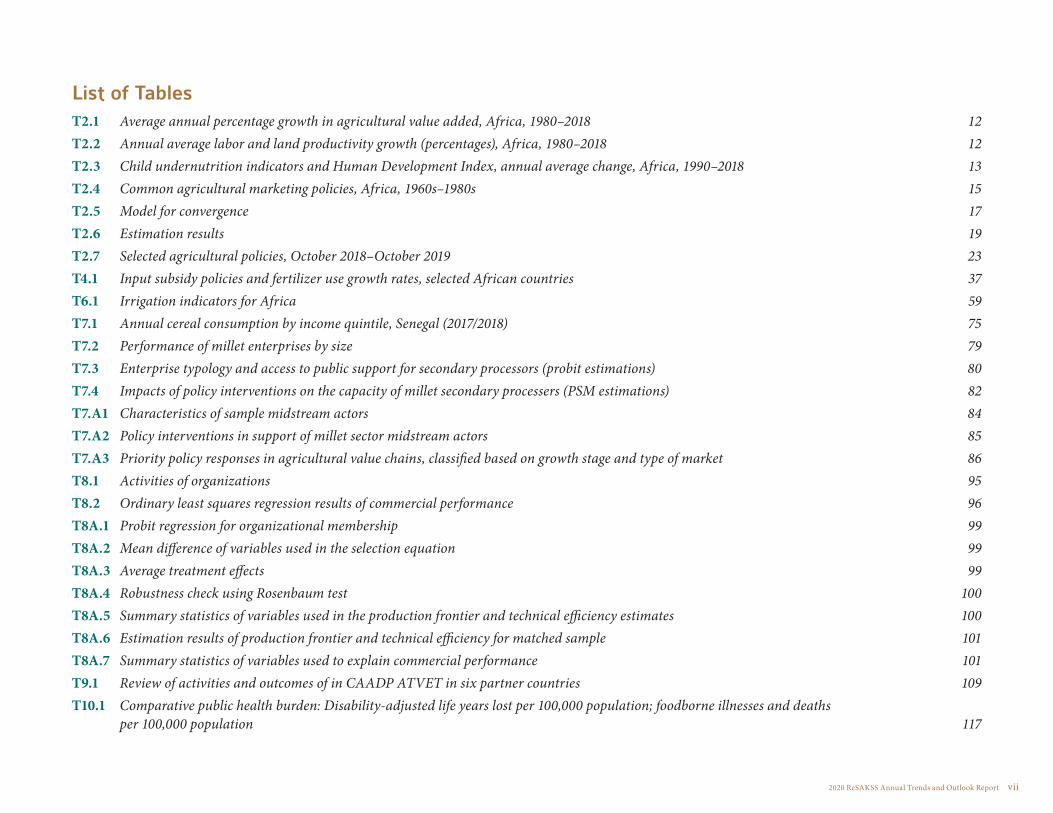
List of TablesT2.1 Average annual percentage growth in agricultural value added, Africa, 1980–2018 12T2.2 Annual average labor and land productivity growth (percentages), Africa, 1980–2018 12T2.3 Child undernutrition indicators and Human Development Index, annual average change, Africa, 1990–2018 13T2.4 Common agricultural marketing policies, Africa, 1960s–1980s 15T2.5 Model for convergence 17T2.6 Estimation results 19T2.7 Selected agricultural policies, October 2018–October 2019 23T4.1 Input subsidy policies and fertilizer use growth rates, selected African countries 37T6.1 Irrigation indicators for Africa 59T7.1 Annual cereal consumption by income quintile, Senegal (2017/2018) 75T7.2 Performance of millet enterprises by size 79T7.3 Enterprise typology and access to public support for secondary processors (probit estimations) 80T7.4 Impacts of policy interventions on the capacity of millet secondary processers (PSM estimations) 82T7.A1 Characteristics of sample midstream actors 84T7.A2 Policy interventions in support of millet sector midstream actors 85T7.A3 Priority policy responses in agricultural value chains, classified based on growth stage and type of market 86T8.1 Activities of organizations 95T8.2 Ordinary least squares regression results of commercial performance 96T8A.1 Probit regression for organizational membership 99T8A.2 Mean difference of variables used in the selection equation 99T8A.3 Average treatment effects 99T8A.4 Robustness check using Rosenbaum test 100T8A.5 Summary statistics of variables used in the production frontier and technical efficiency estimates 100T8A.6 Estimation results of production frontier and technical efficiency for matched sample 101T8A.7 Summary statistics of variables used to explain commercial performance 101T9.1 Review of activities and outcomes of in CAADP ATVET in six partner countries 109T10.1 Comparative public health burden: Disability-adjusted life years lost per 100,000 population; foodborne illnesses and deaths per 100,000 population 117

viii resakss.org
T13.1 Cost of mobile-cellular and broadband baskets in Africa 167T14.1 Illustrative public sector responsibilities in the agrifood system 179T15.1 Variables included in the estimation 191T15.2 Regression results (2008–2018) 192T16.1 Number of indicators in the CAADP results framework and Biennial Review 197T16.2 CAADP Results Framework indicators discussed 197
List of FiguresF1.1 components of agrifood system value chains 3 F2.1 Annual average percentage growth of gross domestic product by decade, 30 African countries, 1960–2018 11F2.2 GDP per capita (in constant 2010 US dollars), Africa, 1960–2018 12F2.3 Agricultural value added per capita, 16 African countries (constant 2010 US dollars), 1965–2018 13F2.4 Expected per capita GDP by policy instrument (PPP, 2011 US dollars), 54 African countries, average 1995–2016 18F2.5 Selected indicators, CAADP 0 and CAADP 4 countries 21F4.1 Fertilizer consumption and application rate by region (2017) 38F4.2 Heterogenous fertilizer application rates across countries (2002–2017) 39F4.A.1 Fertilizer application rates by region (kg of nutrients per ha of cropland, 2002–2017) 44F4.A.2 Fertilizer consumption in selected African countries (total nutrients used in agriculture, 2002–2017) 44F5.1 R-values in African countries, 1960–2017 47F6.1 Irrigated harvested areas, 2010 and projected 2030 and 2050 (in million hectares) 58F6.2 Evolution of Africa’s equipped irrigated area, World Bank lending, and the food price index 63F6.3 Cost-effectiveness of solar versus diesel pumping in southern Africa 63F7.1 The importance of millet in Senegalese cereal value chains 76F7.2 Four-firm concentration ratios in all cereal and millet markets and industries 77F7.3 Growth in number of millet trading and processing enterprises in Senegal, cumulative percentages 78F8.1 Density of membership in farm organizations in Senegal 93F8.2 Producer organizations in Senegal 94F8.3 Kernel density plot of technical efficiency of producer organization members and nonmembers (matched sample) 96F9.1 Actors in technical and vocational education and training in Africa 105
Tables Continued
2020 ReSAKSS Annual Trends and Outlook Report ix
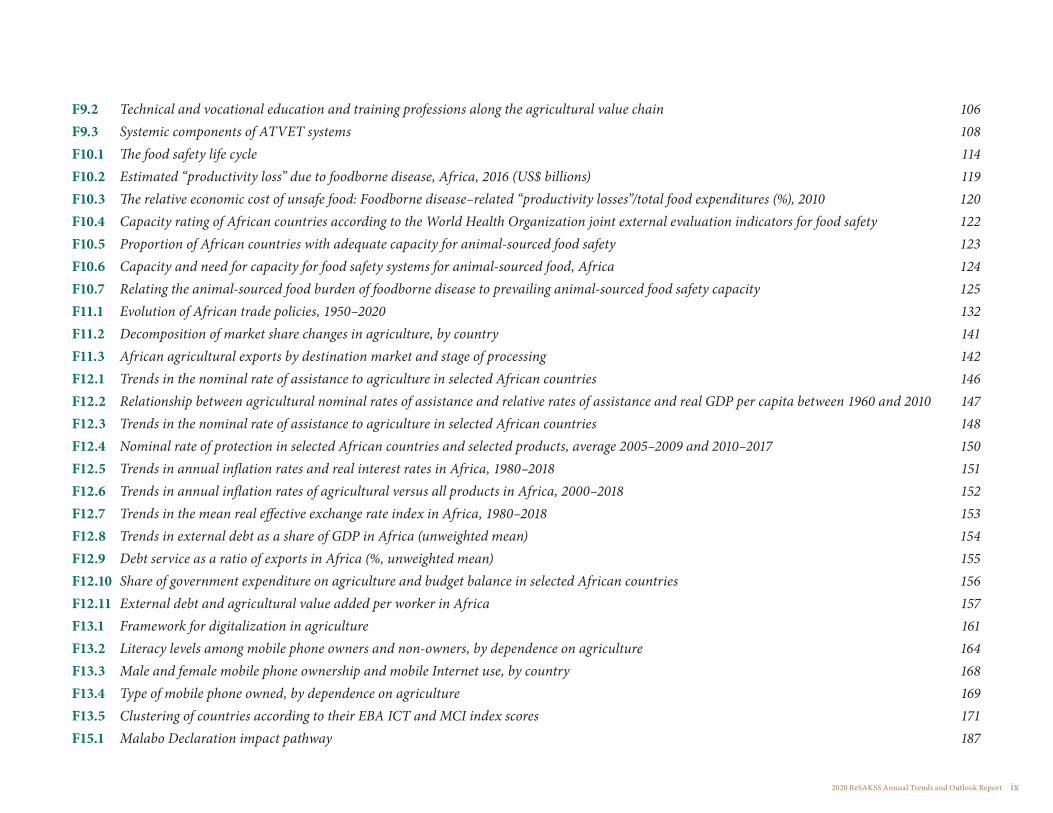
F9.2 Technical and vocational education and training professions along the agricultural value chain 106F9.3 Systemic components of ATVET systems 108F10.1 The food safety life cycle 114F10.2 Estimated “productivity loss” due to foodborne disease, Africa, 2016 (US$ billions) 119F10.3 The relative economic cost of unsafe food: Foodborne disease–related “productivity losses”/total food expenditures (%), 2010 120F10.4 Capacity rating of African countries according to the World Health Organization joint external evaluation indicators for food safety 122F10.5 Proportion of African countries with adequate capacity for animal-sourced food safety 123F10.6 Capacity and need for capacity for food safety systems for animal-sourced food, Africa 124F10.7 Relating the animal-sourced food burden of foodborne disease to prevailing animal-sourced food safety capacity 125F11.1 Evolution of African trade policies, 1950–2020 132F11.2 Decomposition of market share changes in agriculture, by country 141F11.3 African agricultural exports by destination market and stage of processing 142F12.1 Trends in the nominal rate of assistance to agriculture in selected African countries 146F12.2 Relationship between agricultural nominal rates of assistance and relative rates of assistance and real GDP per capita between 1960 and 2010 147F12.3 Trends in the nominal rate of assistance to agriculture in selected African countries 148F12.4 Nominal rate of protection in selected African countries and selected products, average 2005–2009 and 2010–2017 150F12.5 Trends in annual inflation rates and real interest rates in Africa, 1980–2018 151F12.6 Trends in annual inflation rates of agricultural versus all products in Africa, 2000–2018 152F12.7 Trends in the mean real effective exchange rate index in Africa, 1980–2018 153F12.8 Trends in external debt as a share of GDP in Africa (unweighted mean) 154F12.9 Debt service as a ratio of exports in Africa (%, unweighted mean) 155F12.10 Share of government expenditure on agriculture and budget balance in selected African countries 156F12.11 External debt and agricultural value added per worker in Africa 157F13.1 Framework for digitalization in agriculture 161F13.2 Literacy levels among mobile phone owners and non-owners, by dependence on agriculture 164F13.3 Male and female mobile phone ownership and mobile Internet use, by country 168F13.4 Type of mobile phone owned, by dependence on agriculture 169F13.5 Clustering of countries according to their EBA ICT and MCI index scores 171F15.1 Malabo Declaration impact pathway 187

x resakss.org
F16.1 GDP per capita (constant 2010 US$), annual average percent change, 2003-2019 200F16.2 Prevalence of undernourishment in Africa (% of population), 2000-2017 201F16.3 Prevalence of underweight, stunting, and wasting (% of children under 5), 2014–2019 202F16.4 Proportion and number of poor people in Africa (poverty headcount at US $ 1.90 a day), 1995–2019 203F16.5 agriculture value added-percentage share, 2014-2019 204F16.6 Agriculture value added annual average growth (%), 2008–2019 205F16.7 Labor and land productivity in Africa, annual average growth (%) 206F16.8 Intra-African agricultural exports-percentage share 207F16.9 Intra-African agricultural imports-percentage share 208F16.10 Government agriculture expenditure-percentage share 209F16.11 Share of government agriculture expenditure in total public expenditure (%), 2008–2014 and 2014–2019 210
List of BoxesB6.1 The Framework for Irrigation Development and Agricultural Water Management in Africa 62B6.2 Agricultural water management in Africa: A broad field 64B6.3 Solar irrigation in southern Africa: From the frying pan into the fire? 66B6.4 Making a living as an irrigator in Ethiopia 68B6.5 Women, water, and irrigation 69B13.1 Key personal data protections outlined in the African Union Convention on Cyber Security and Personal Data Protection 172
Figures Continued

2020 ReSAKSS Annual Trends and Outlook Report xi
3SLS three-stage least squares
AATS African Agriculture Transformation Scorecard
AEHE agricultural equipment hiring enterprise
AfDB African Development Bank
AIC Akaike’s information criterion
AMSEC agricultural mechanization service enterprise center
AMU Arab Maghreb Union
ASF animal-sourced food
ASPRODEB Association Sénégalaise pour la Promotion du Développement à la Base
ATOR Annual Trends and Outlook Report
ATT average treatment effect on those treated
ATVET agricultural technical and vocational education and training
AU African Union
AUC African Union Commission
AUDA African Union Development Agency
BIC Bayesian information criterion
BMZ German Federal Ministry for Economic Cooperation and Development
BR Biennial Review
CAADP Comprehensive Africa Agriculture Development Programme
CEMAC Central African Economic and Monetary Community
CEN-SAD Community of Sahel-Saharan States
CET common external tariff
CL concessional loan
CNCA CaisseNationale de Credit Agricole
CNCR Comité National de Concertation des Ruraux
COMESA Common Market for Eastern and Southern Africa
CPIA Country Policy and Institutional Assessment (World Bank)
CSO civil society organization
D4Ag digitalization for agriculture
DA development agent
DALY disability-adjusted life year
DAT draft animal technologies
DIIVA Diffusion and Impact of Improved Varieties in Africa (project)
DPA data protection authority
EAC East African Community
EAP East Asia and the Pacific
eBR eBiennial Review
ECCAS Economic Community of Central African States
ECOWAS Economic Community of West African States
EIG economic interest group
ESE East and Southeast Asia
ETLS ECOWAS Trade Liberalization Scheme
FAO Food and Agriculture Organization of the United Nations
FBD foodborne disease
FCFA Financial Community of Africa francs
FDA US Food and Drug Administration
FDI foreign direct investment
FERG Foodborne Disease Burden Epidemiology Reference Group
FOB free on board
FONGS Federation of Non-governmental Organizations of Senegal
FTA free trade agreement
G2G government-to-government
GAE government agriculture expenditure
GAP good agricultural practices
GDP gross domestic product
Abbreviations

xii resakss.org
GIZ German Agency for International Cooperation
GNI gross national income
GPF women’s advancement group
GVC global value chain
HDI Human Development Index
HP horsepower
ICC residual intraclass correlation
ICT information and communications technology
IGAD Intergovernmental Authority on Development
IFPRI International Food Policy Research Institute
IHR International Health Regulations
ILO International Labour Organization
IMF International Monetary Fund
ISI import-substitution industrialization
IWRM integrated water resources management
JEE joint external evaluation
JSR joint sector review
KEPHIS Kenya Plant Health Inspectorate Service
LCU local currency unit
LPA Lagos Plan of Action 1980–2000
LSMS-ISA Living Standards Measurement Survey–Integrated Surveys on Agriculture
M&E monitoring and evaluation
MDGs Millennium Development Goals
MfDR managing for development results
MFN most favored nation
MVCR marginal value cost ratio
NAIP National Agriculture Investment Plan
NARS national agriculture research systems
NEET not in employment, education, or training
NEPAD New Partnership for Africa’s Development
NGO nongovernmental organization
NICI national information and communication infrastructure
NPCA NEPAD Planning and Coordination Agency
NRA nominal rate of assistance
NRP nominal rate of protection
NSA nonstate actor
OAU Organisation of African Unity
ODA official development aid
OECD Organisation for Economic Co-operation and Development
OIE World Organisation for Animal Health
PAPA Projetd’Appui aux Politiques Agricoles
PPP purchasing power parity
PPP public private partnership
PRACAS Programme d’Accélération de la Cadence de l’Agriculture Sénégalaise
PSAOP Agricultural Services and Producer Organizations Program
PSE Plan Senegal Emergent
PSM propensity score matching
PVS performance of veterinary services
QDS quality declared seed
R&D research and development
RCA revealed comparative advantage
REC regional economic community
ReSAKSS Regional Strategic Analysis and Knowledge Support System
RF Results Framework
RIA Research ICT Africa
RRA relative rate of assistance
RTA regional trade agreement
SACU Southern African Customs Union

2020 ReSAKSS Annual Trends and Outlook Report xiii
SADC Southern African Development Community
SAMA Sustainable Agricultural Mechanization in Africa
SAP structural adjustment program
SDG Sustainable Development Goal
SMART specific, measurable, achievable, relevant, and time-bound
SMEs small and medium-sized enterprises
SSA Africa south of the Sahara
TASAI The African Seed Access Index
TBI trade bias index
TVET technical and vocational education and training
UMA Arab Maghreb Union
UNCTAD United Nations Conference on Trade and Development
UNECA United Nations Economic Commission for Africa
USD US dollars
VAT value-added tax
WAEMU West African Economic and Monetary Union
WHO World Health Organization
WTO World Trade Organization
WUA water user association
xiv resakss.org
Acknowledgments
The 2020 Annual Trends and Outlook Report (ATOR) has benefited from the research and dedication of the authors and contributors whose work is presented here. The ReSAKSS team—Paul Guthiga, Joseph Karugia, Greenwell Matchaya, Sibusiso Nhlengethwa, Manson Nwafor, Maurice Taondyandé, and Mbaye Yade—collected and updated
data on CAADP indicators for this report. We are also very grateful to Ousmane Badiane and Tsitsi Makombe for their guidance, feedback, and coordination of the production process. We thank Maybelle Bulan for her superior administrative support.
We express our gratitude to the anonymous reviewers whose expertise enhanced the final report. We also thank Samuel Benin who managed the peer-review process and CAADP indicator data processing, as well as Julia Collins, who supported the peer-review process, and Wondwosen Tefera, who provided data processing support. IFPRI’s Communications and Public Affairs Division provided excellent editorial support to produce this report under the leadership of Pamela Stedman-Edwards. Joan Stephens’s contributions for the design and layout of the report are gratefully acknowledged.
Danielle Resnick, Xinshen Diao, and Getaw Tadesse acknowledge funding from ReSAKSS for their time as co-editors on the report. Danielle Resnick and Xinshen Diao received additional funding for their time from the CGIAR Research Program on Policies, Institutions, and Markets (PIM).
Finally, we would also like to acknowledge the United States Agency for International Development (USAID) for providing financial support for the 2020 ATOR.

2020 ReSAKSS Annual Trends and Outlook Report xv
Foreword
The African Union’s Agenda 2063 is a blueprint for the commitment made by African governments to support a new path for attaining inclusive and sustainable economic growth and development. A dynamic transformation
of African agriculture is imperative for attaining the aspirations of Agenda 2063, including creating jobs for youth, nourishing growing cities with healthy diets, and catalyzing domestic revenue mobilization for public goods and services. The improved performance of the agricultural sector across Africa in recent years, led by increased investment and better policies, shows that progress is possible. But the road to modernized agrifood systems that ensure food and nutrition security for all is still a very long one. Getting there will require continued policy reforms and sustained investments in agriculture.
The role of agriculture in promoting economic transformation is widely known. Indeed, a productive African agriculture with robust food supply chains will contribute immensely to key transformational outcomes of Agenda 2063. While there are tremendous opportunities to leverage the continent’s agricultural sector for broader agrifood system transformation, several policy tradeoffs need to be reconciled across poverty reduction, food security, nutrition, and environ-mental goals. Prioritization of investments to accelerate the transformation of Africa’s agrifood system thus requires renewed attention. Of high importance are investments to harmonize policy tradeoffs, buffer the impacts of unexpected shocks such as the COVID-19 pandemic, and prevent reversion to unproductive policies of the past or erosion of recent gains.
The focus of the 2020 Annual Trends and Outlook Report (ATOR) is on comprehensive and complementary policies needed to harness the potential of African agrifood systems for broader economic transformation. The report reviews achievements in agricultural policy in recent decades, identifies gaps that African decision-makers still need to address, and discusses the broader
institutional, regulatory, and political factors that condition policy choices. As African governments scale up efforts toward the implementation of Agenda 2063 and the Malabo Declaration, the findings of this report are critical to reflect on what has worked in the past and to identify concrete policy approaches required to advance opportunities for sustained agrifood system transformation in the coming decades.
In particular, the 2020 ATOR emphasizes the consolidation of recent successes and learning from past achievements and mistakes. It highlights the need to maintain positive changes attained in recent years and to avoid the growing threat of reversion to past policies that led to decades of economic decline and stagnation. Contributors to this ATOR also highlight the need to find the right mix of policy interventions, some new, some old, that will meet the needs of rapidly modernizing agrifood value chains and fast-transforming economies across Africa. Equally critical is the need to mitigate the risks of policy reversal or the recourse to policies that have failed in the past through strengthened mutual accountability processes. For this reason, the African Union’s promotion of evidence-based policy planning and implementation will continue to be a vital guiding principle for the continent to achieve its transformation goals.
This is a timely report which we hope will trigger the required policies and actions to accelerate the transformation of Africa’s agrifood systems and ensure that they are sustainable and resilient, particularly in the context of shocks such as COVID-19. The effects of the pandemic, including its complex interactions with other stresses such as the locust plague in East Africa, demonstrate to us that even well-intentioned policies can be undermined by sudden shocks. Now more than ever before, it is important to anticipate risks and plan accordingly to ensure that the transformation of Africa’s agrifood systems translates to broader economic transformation on the continent.
Ousmane BadianeExecutive ChairpersonAKADEMIYA2063
H.E. Josefa L. C. SackoCommissioner for Rural Economy and AgricultureAfrican Union Commission

xvi resakss.org
Africa achieved the fastest growth rate in agriculture over the last two decades. This performance needs to be sustained and accelerated if the sector is to play its critical role in helping meet the continent’s
development goals, including creating decent jobs for youth, nourishing growing cities with healthy foods, and catalyzing domestic revenue mobilization for public goods and services. Such goals hold renewed significance as the world grapples with the COVID-19 pandemic, which has revealed the centrality of productive agriculture and robust food supply chains to meeting these goals.
The 2020 Annual Trends and Outlook Report (ATOR) therefore focuses on a series of comprehensive and complementary policies required to transform African agrifood systems to meet their potential. The report begins with an in-depth review of the evolution of agricultural sector policies over the last five decades. The second section offers a systematic analysis of traditional input constraints on agricultural productivity, such as seeds, fertilizer, mechaniza-tion, and irrigation. The subsequent chapters turn to policies needed to bolster competitiveness along value chains. Then, the report considers factors that shape the broader enabling environment underlying the prospects for agrifood system transformation. As detailed below, five major themes collectively emerge from the report.
Learn from Past Mistakes and Achievements A major intention throughout this ATOR is to examine how contemporary policies compare with their historical counterparts and to what degree past mistakes can be avoided as a new generation of policy leaders emerges in Africa. Such reflection is necessary to solidify important contributions achieved in the agricultural sector over the last decade. These contributions include a growing increase in Africa’s share of global agricultural gross domestic product (GDP) and the continued reduction in anti-agriculture fiscal biases that prevailed in the postindependence decades.
A new generation of leaders and the lack of sufficient institutional memory in the context of more open, pluralistic political systems along with strong
populist pressures pose a risk of returning to failed policies of the 1970s and 1980s, when strong government intervention, distorted trade regimes, and macroeconomic imbalances prevailed. For example, in the last five years, there has been renewed government involvement in input supply chains in many coun-tries, through means including price setting, restrictions on private traders, and mandated harvest dates. Export and import bans have been promoted as a way to ensure adequate domestic resources for agro-industrial initiatives, harking back to the period of import-substitution industrialization. Although countries made considerable effort in earlier years to meet the Comprehensive Africa Agriculture Development Programme (CAADP) commitments of achieving 6 percent agricultural growth and allocating 10 percent of the national budget to agricul-ture, there are worrying signs that annual public expentiture for agriculture is stagnating or even declining for the first time in two decades.
In other respects, learning has occurred as a result of refining policy choices and implementation over time. An important example is agricultural input subsidies. New agricultural input subsidies were developed in response to the 2006 Abuja Fertilizer Summit and the food price crisis of 2007–2008. In 2014, the Malabo Declaration pointed to the need to make these programs “smarter,” or better targeted. Increasingly, such programs have responded by including seed along with fertilizer, incorporating fertilizers better-targeted to local soil quality, and integrating information and communications technology (ICT) innovations (such as e-vouchers) to improve beneficiary targeting. Subsidy programs will also need to improve climate resilience and nutritional diversity (rather than just supporting cereal crops) without continuing to dominate agriculture expenditure patterns to the detriment of agricultural research and development. Indeed, public agricultural research spending as a share of agricultural GDP remains far below the 1 percent level recommended by the African Union (AU).
Similarly, increased farming intensity and the rise of medium- to large-scale farmers have expanded the demand for mechanization. As in the past, many African countries are relying on some form of government subsidies to finance the establishment of mechanization centers or access to tractors. Due to evidence
Executive Summary

2020 ReSAKSS Annual Trends and Outlook Report xvii
about challenges to such state-led approaches, including lack of profitability and low demand due to the import of tractors from countries with different agro-ecological conditions, some reforms have followed. In Ghana, for example, the government has provided more variety in tractor offerings based on farmer needs and incorporated maintenance and training initiatives into its mechanization program. These and other lessons will be valuable to the implementation of the AU’s Sustainable Agricultural Mechanization in Africa framework, which aims to promote greater mechanization in an environmentally sustainable manner.
More than ever, the AU’s emphasis under CAADP on evidence-based decision-making is fundamental to ensure that policy decisions are not based simply on political impulses or a reversion to historical precedent. Instead, they must be informed by robust evidence about policies’ consequences for agricul-tural productivity, rural livelihoods, environmental sustainability, private sector growth, and the macroeconomy, among others.
Adopt a Holistic Agenda A second key highlight of this year’s ATOR is the need for holistic agendas. This is most prominently emphasized through the inclusion of chapters that collec-tively span the entire agrifood system. However, it is also relevant to each of the individual subcomponents that are so critical to agrifood systems.
Agricultural InputsThe seed and fertilizer sectors are good examples. Increasing availability of higher-quality, higher-yielding seed varieties requires attention to: (1) improv-ing countries’ ability to access genetic material, needed for breeding programs, that contains traits desired by farmers and consumers; (2) investing in breeding methods that reduce the time required to develop new cultivars with the required traits; (3) ensuring that regulatory systems do not deter the testing, registration, and release of new cultivars; and (4) creating market conditions that allow farmers to generate sufficient returns to their investment. To enhance productivity, increased distribution of fertilizer requires investments in agronomy programs, irrigation development, soil testing, and extension services to educate
farmers about soil fertility management practices, as well as greater encourage-ment of private sector participation in commercial fertilizer markets. Beyond this are a host of supply chain considerations dealing particularly with the need to reduce the cost of operations along the various segments.
Skills Development Agricultural technical and vocational education and training (ATVET) for farmers is another prime area where a comprehensive array of interventions is needed. Vocational training is essential to transform farmers into entrepreneurs and to attract unemployed and underemployed youth into the sector. In general, ATVET has been woefully underprovided in Africa and, where it does exist, typically focuses primarily on the farm level and on topic-specific training aimed at improving farmers’ knowledge of agricultural practices. This ATOR suggests that along with supporting core farming professions, successful ATVET should also target support professions across the entire value chain, including machine technicians for servicing tractors and electricians to ensure functioning agro-processing operations. Cross-cutting training in finance, accounting, insurance, and ICT are also needed for farmers to operate more as competitive businesses.
Digitalization and ICTMore broadly, ICT and digital technologies are viewed as key drivers of innova-tion and productivity for agrifood systems and have received renewed attention during the COVID-19 pandemic. Mobile applications and e-commerce platforms can connect farmers, traders, and consumers; likewise, drones and satellite data can improve national agricultural statistics and planning. As many countries in the region develop their national ICT polices and strategies, further attention is needed to Internet connectivity infrastructure, improving digital literacy among value chain participants, regulations that address digital privacy concerns, and network platforms and innovation hubs. Domestic financing of digitalization, delinked from donor priorities, is also essential to ensure sustainability even as donor preferences change over time.
xviii resakss.org
Agricultural Trade Enhanced agricultural trade is essential for agrifood system transformation, and over the last two decades global value chains have expanded rapidly. African participation is growing, reflected in increased penetration of export markets in emerging economies and a rising share of processed and semi-processed products, which now account for the largest share in exports. According to the report’s contributors, African exporters encounter fewer restrictions in global markets than in intracontinental markets, due to many internal regulatory and administrative barriers that raise the costs of trading for African enterprises. The imminent implementation of the African Continental Free Trade Area will be an important contribution to expanding market opportunities, but it is not a panacea to meet the need for a broader array of interventions. Indeed, lengthy customs procedures, poor transport and communications logistics, insufficient adoption of international sanitary and phytosanitary standards, and general policy volatility will need to be addressed to enhance the region’s export perfor-mance in regional and global markets.
Embrace Nuance for More Effective Policy Targeting The diversity of farmers and consumers within the agrifood system implies a clear need to avoid uniform policy interventions in any segment of the system. Smallholders have different requirements than their commercial counterparts; formal small and medium-size food enterprises face different portfolios of taxes, savings, and capital needs than informal retail businesses; and middle-class consumers often can afford healthier and safer food than their poorer compatriots. Thus, policies in each domain of the agrifood system also need to be targeted properly.
Irrigation and Water ManagementOn the farm, Africa’s vast biophysical differences imply that irrigation interven-tions need to be appropriately differentiated. Recognizing this need, the AU’s Framework for Irrigation Development and Agricultural Water Management identifies four different pathways for improving irrigation and water manage-ment. They range from large-scale irrigation development and modernization to farmer-led irrigation development to improved water control and watershed
management in rainfed environments, as well as wastewater recovery and reuse, which is quite common in peri-urban Africa. Pursuing these different pathways, however, requires attention to trade-offs with other key development objectives that African governments have committed to address through the UN Sustainable Development Goals and other global initiatives. Such trade-offs include issues of equity in access to irrigation exacerbated by socioeconomic status and gender. Environmental goals can be jeopardized by the spread of more affordable irrigation technology (such as solar pump technologies) or undermined if irrigation enables the more intensive use of fertilizer and pesticide chemicals that contribute to water pollution. This report emphasizes that address-ing these trade-offs will require, inter alia, new data tools to help governments measure and monitor irrigation, agricultural water pollution management systems, investments in clean and affordable energy, strengthened national and subnational water institutions and frameworks, and irrigation projects that foster the cultivation of nutrient-dense crops.
Producer Organizations and Collective ActionThough agroecological factors are often given prominence in discussing the diversity of African producer systems, the institutional organization of producers is likewise diverse. Producer organizations, which are membership-based orga-nizations or federations of organizations with elected leaders accountable to their constituents, have long been viewed as conducive to helping farmers access inputs and share information about market opportunities and technical innovations. However, they are not equivalent in structure. Some are commodity-specific organizations that defend their members’ control of a commodity chain, some are advocacy groups that represent producers’ interests, others are associations of users of natural resources, and still others are multipurpose organizations that respond to the needs of their members in the absence of sufficient public goods and services. The ATOR contributors find that technical efficiency is higher for those involved in a producer organization than for those who are not, and such efficiency is particularly strong for members of those organizations that have a board and make collective decisions via a general assembly. Therefore, although governments should encourage such organizations, they should also recognize that they are not functionally equivalent and that particular governance modali-ties appear more conducive to better efficacy.

2020 ReSAKSS Annual Trends and Outlook Report xix
Agricultural Processing and Midstream Value ChainsOff the farm, local food markets offer many opportunities to boost enterprise creation and support agro-industrialization. As this ATOR suggests, policies to boost processing and midchain segments are at the heart of enhancing economic growth and nutrition outcomes in Africa. Indeed, value chain development is one of the key areas of CAADP that emerged from the 2014 Malabo Declaration. Yet Africa’s agro-processors are bifurcated, consisting, on the one hand, of millions of small enterprises that face barriers to technology, skills, financing, and markets, and on the other hand, of large businesses that dominate agro-industrial parks and zones. Moreover, some value chains operating in local and regional markets, especially those targeted at staple goods, face high costs and rapidly changing diet preferences. In contrast, those aimed at global markets, including markets for coffee, fruits, and vegetables, may face stronger competition and more demand-ing consumers. Taking these considerations into account, contributors to the 2020 ATOR delineate six different bundles of policy priorities, revolving around training-related, technological, regulatory, and institutional interventions, while also considering gender implications of these different policies.
Food Safety RisksOn the consumer side, Africa’s agrifood systems cannot expand, either globally or domestically, without greater congruence with food safety standards. Due to urbanization and income growth, consumer demand is increasing for animal products, fruits and vegetables, and processed foods. Yet the safety of such foods, and the capacity to enforce food safety standards, remains woefully insufficient. The AU, recognizing these problems, proposed the Africa Food Safety Index in 2019. This ATOR suggests that identifying food safety priorities requires African governments to consider multiple dimensions, including how a country’s food system is evolving and whether it has the capacity for food safety regulatory oversight and enforcement. For example, some countries have a “traditional” food system with minimal dietary diversity and weak capacity, whereas others have more diverse food systems with good management of food safety risks and stable consumer demand. Many of Africa’s lower-middle-income countries fall between these two extremes, with rapidly changing diets and health risks but lagging capacity and incentives for food safety regulation. Moreover, the food industry structure varies substantially in the region, with modern retail industries
(for instance, supermarkets, e-commerce operations, convenience stores) and informal retail markets (for instance, wet and open-air markets), as well as a range of out-of-home eating options. Each of these modalities presents its own food safety risks and priorities. To address food safety weaknesses, governments should balance investments in laboratories, infrastructure, and processing facilities with support for improved human capital and awareness raising for behavioral change. The portfolio of these investments, and their appropriate sequencing, should be tailored to the circumstances of not only countries but also subnational units, such as cities.
Invest in Accountable Policy Systems Mutual AccountabilityCollectively, this ATOR’s emphasis on learning from past mistakes and achieve-ments, adopting holistic responses, and embracing nuance requires robust policymaking systems that are inclusive, transparent, and accountable. In this regard, the AU’s promotion of mutual accountability will continue to be a neces-sary guiding principle for the region to meet its transformation goals. Mutual accountability is a process by which two or more partners agree to be held jointly responsible for commitments they have willingly made to each other. The principle was adopted by the AU in 2002 and into CAADP in 2003. It has been operationalized through activities that promote dialogue, benchmarking, and peer learning within the agriculture sector. Since the Malabo CAADP summit of 2014, the AU has further formalized the concept through agricultural joint sector reviews whereby progress in the sector is assessed by both state and nonstate actors. Furthermore, African leaders have now held two continental biennial reviews to assess their progress on meeting their commitments, using African Agriculture Transformation Scorecards to track performance against the Malabo target milestones.
Contributions to this ATOR show that after the first biennial review, some countries made notable improvements in data collection, budget allocations, and monitoring and evaluation systems relevant to their agricultural systems. In addition, countries that have conducted a joint sector review within the last five years are found to have higher levels of public agricultural expenditures. In turn, these expenditures have had a positive impact on labor and land productivity,

xx resakss.org
both of which are critical for agricultural transformation. As countries consider a broader agrifood systems agenda that builds on achievements of the agricultural sector but also expands well beyond that sector, this ATOR reaffirms that the process of making quantifiable commitments and subjecting those commitments to public scrutiny is important for avoiding myopic policy planning.
Anticipate Risks and Plan Accordingly The COVID-19 pandemic illustrates vividly that even well-intended policies can be undermined by unexpected shocks. Travel bans as well as quarantines on transporters held up the import and distribution of critical farm inputs. Curfews and lockdowns worsened consumer access to food. Crowded informal markets with poor water and sanitation infrastructure had to be closed, undermining small-scale retailers’ already meager incomes. In parts of the continent, the pandemic exacerbated other stresses encountered by farmers, including fall armyworm and the devastating locust plague in East Africa. All of these shocks transcend boundaries, and mitigation will require cross-national coordination.
Macroeconomic PoliciesSuch shocks have also contributed to depressed economic growth in Africa. For example, in some countries in the region, COVID-19 has worsened already worrying levels of external debt as a share of GDP that resurfaced after 2010 when capital markets expanded. The 2008–2009 global financial crisis led to an expansion of dollar- and euro-denominated sovereign bonds for African countries, offering access to increased borrowing at higher interest rates. With a subsequent contraction of commodity prices, debt services have ballooned and more than a dozen African countries are at risk of debt distress. Undoubtedly, then, countries facing these challenges have increasingly limited fiscal space and will need to make stark decisions about priorities within the agricultural sector and the broader agrifood system. This ATOR therefore provides some evidence about the range of investments that could have sizable impacts.
Political EconomyAt the same time, history shows that political economy challenges—specifically reconciling competing interests and overcoming ideational biases—can stymie the implementation of evidence-based policy recommendations. Political economy considerations can be most pronounced when resources are scarce, and therefore, certain groups are more likely to benefit than others. These issues have long been present in African agricultural policy processes and have been used to explain some distortionary policies prominent in the region in previous decades. This report, however, underlines new political economy risks that need to be con-sidered through an agrifood system agenda that spans the mandates of multiple ministries as well as both national and subnational governments. One implication is that in the absence of established food systems ministries, coordination mecha-nisms will need to be created to promote collaboration across a wide range of government and private sector actors, and to mitigate bureaucratic competition over responsibilities and budgets. Consequently, it will be imperative to consider viable public sector reforms that will enable the complexities of a transformation agenda to be implemented.
Overall, African governments are operating under rapidly changing climatic and economic circumstances but remain firmly focused on meeting their national and regional development aspirations. By touching on the range of agrifood system issues identified by the AU as priorities in recent years, the 2020 ATOR hopes to provide robust policy guidance to navigate the uncertain period ahead.
2020 ReSAKSS Annual Trends and Outlook Report 1
CHAPTER 1
Introduction: Accelerating Policy Progress in Uncertain Times
Danielle Resnick, Xinshen Diao, and Getaw Tadesse

2 resakss.org
African agriculture is at an important crossroads. On the one hand, the role of agriculture in the process of economic transformation is widely recognized (Diao, Hazell, and Thurlow 2010; Diao and McMillan
2018), and there have been important achievements in African agricultural performance and productivity growth in recent years. For instance, between 2005 and 2012, agricultural value-added growth and total factor productivity growth were robust and positive for many countries in the region (IFAD 2016). Although more progress is still needed, long-standing structural reforms have contributed to a more conducive environment for private sector participation in African agriculture, particularly in input value chains (AGRA 2019). At the same time, governments are experimenting with a variety of policy interventions to accelerate agricultural transformation, including the creation of agro-industrial parks, agro-corridors, and special economic zones in more than two dozen countries across the continent (Gálvez Nogales and Webber 2017). These initiatives aim to create economies of scale by coordinating investments in transport, communications, power, and storage to foster linkages between farmers and agribusiness enterprises. There is enormous potential for these and other initiatives to enable agriculture to contribute to larger agrifood system transformation; in fact, evidence suggests that African agribusiness, inclusive of all aspects of the agrifood system except on-farm production, could be a US$1 trillion market by 2030 (Byerlee et al. 2013).
On the other hand, if agriculture is to foster sustainable agrifood system transformation, a number of policy trade-offs need to be reconciled across poverty reduction, food security, nutrition, and environmental goals. This is no easy task. For instance, Picard, Coulibaly, and Smaller (2017) found that agro-based clusters and corridors can have negative impacts on natural resource management and exacerbate inequalities within communities if not accompanied by relevant laws, regulations, and oversight capacity. Furthermore, some African countries are reverting to policies of previous eras that undermine more recent efforts to build resilient, healthier, sustainable food systems. The resurgence of fertilizer input subsidies is one example; although the current generation of subsidies are better targeted, they still are slanted toward grain commodities (Pingali 2015) and are found to disincentivize more sustainable land intensification practices (Morgan et al. 2019). Despite commitments to free trade and the launch of the operational phase of the African Continental Free
Trade Agreement, export bans have become more frequent and particularly concentrated around commodities that are important for meeting domestic agro-processing objectives (Porteous 2017; Schulz 2020).
The direct and indirect impacts of the COVID-19 pandemic on agriculture and food systems further complicate these trade-offs. Restrictions on travel, transport, and business operations have had ripple effects on agricultural value chains and food security in the region. At the outset of the pandemic, one survey across 12 African countries revealed that 80 percent of respondents worried about having sufficient food (Geopoll 2020), and a survey of more than 100 food processors in Africa showed that approximately 60 percent did not feel able to manage the crisis due to effects on supplies, sales, and distribution channels (Technoserve 2020). Even if food supplies appear more resilient than first expected (FAO 2020), the impact of COVID-19 on African economies undoubt-edly has narrowed the fiscal space for investing in agriculture.
Therefore, now more than ever, prioritizing investments to enhance agrifood system transformation will be key in order to harmonize the trade-offs and prevent shocks such as COVID-19, as well as the locust plague in East Africa and recurrent invasions of fall armyworm, from leading to an erosion of recent gains and a reversion to unproductive policies of the past. Consequently, the purpose of the 2020 Annual Trends and Outlook Report (ATOR) is to review achievements in agricultural policy in recent decades; identify gaps that the continent’s decision-makers still need to address; and discuss the broader institutional, regulatory, and political factors that condition the choice of policies.
In particular, as African countries are scaling up efforts toward the imple-mentation of the African Union’s Agenda 2063 and the Malabo Declaration, the 2020 ATOR seeks to answer a number of questions: How have policy regimes evolved during the last two decades of rapid economic growth and agrifood system transformation? To what extent are current policies for agrifood system transformation aligned with the macroeconomic context and changing global trade environment? What possible policy alignments or gaps need to be addressed to sustain and accelerate the recent economic growth? Which insti-tutional and political economy factors are most instrumental in the decision to shape new policy choices rather than revert to old ones?

2020 ReSAKSS Annual Trends and Outlook Report 3
These questions are addressed by adopting a holistic framework that captures many, though not all, of the multiple dimensions of agrifood systems (Figure 1.1).1 At the base of this framework are specific inputs that are essential to improve productivity on the farm, including seeds, fertilizer, mechanization, and irrigation. At the center of the framework lie a number of interventions needed for inclusive development of modern food value chains, including support for small and medium-size enterprises in the distribution, processing, and retailing segments of value chains. Beyond finance and infrastructure, value chain actors need access to cutting-edge training and vocational education, technology to improve their competi-tiveness, and viable export markets. Domestic small and medium-size enterprises (SMEs) are estimated to supply more than 60 percent of all food consumed in rural and urban markets in Africa (AGRA 2019), and these SMEs can play an important role in supplying consumers with nutritious foods (Demmler 2020). However, their potential can be thwarted by lax food safety standards, which thus far in Africa have been more rigorously
1 Due to space constraints, many topics central to agrifood systems in Africa—including land governance, youth employment, and gender equality—are not given adequate attention in this ATOR. However, there are many recent publications on these topics for the interested reader, including Kosec and colleagues (2018); Mueller and Thurlow (2019); and Quisumbing, Meinzen-Dick, and Njuki (2019).
Enabling Environment
Market Functions
Retailing
Markets
Processing
Farming
Inputs
Supply Channels
Supply Channel 1 Non-marketed
Production
Supply Channel 2 Commercial Production
Supply Channel 3Imported Foods
Macroeconomic stability
Broad-based infrastructure
Robust legal frameworks
ICT and skills development
Accountable political systems
Effective cross-sectoral coordination
Retailers
Distributors, processors, traders
Importers, global and regional agribusiness
Household consumption of own production
Subsistence farmers
Recycled seeds, family labor
Commercially oriented farmers
Agro dealers, service providers, R&D institutions
Rural Export
Urban
Source: Adapted from Resnick et al. (2019). Note: ICT = information and communications technology; R&D = research and development.
FIGURE 1.1—COMPONENTS OF AGRIFOOD SYSTEM VALUE CHAINS

4 resakss.org
applied and regulated with respect to export rather than domestic markets (see chapter 10 of this volume).
At the left of the framework are enabling conditions that contextualize the concurrent set of investments required to support well-functioning and effective agriculture and agrifood value chains. These include, among others, a stable macroeconomic foundation; strong and well-regulated information and communications technology (ICT) and digitalization services; coordinating mechanisms with ministries outside agriculture and at the subnational level; and mutual accountability among citizens, governments, and the donor community.
Agrifood System Transformation: A Holistic AgendaThe chapters in this ATOR are organized according to the different aspects of the agrifood system presented in Figure 1.1 while also accounting for current opportunities and historical actions by African policymakers. Specifically, in chapter 2, Badiane, Collins, and Ulimwengu help situate the importance of policy decisions by providing an expansive historical overview of African agricultural decisions since the 1960s. They note that in contrast to the lackluster performance of the 1980s and 1990s, economic and agricultural growth rebounded in the 2000s, which they attribute to an improved regulatory environment, macroeconomic stability, and reforms within the agricultural sector of many countries. Although they attribute some of these developments to the long-term effects of painful structural adjustment programs (SAPs) adopted in the late 1980s and early 1990s, the authors also recognize the role of the Comprehensive Africa Agriculture Development Programme (CAADP) in shifting the priority accorded to agriculture in African and global policy agendas. Importantly, CAADP stresses improving overall policy systems, with an emphasis on accountability, inclusivity, and evidence-based policymaking, whereas SAPs were more narrowly focused on reforming specific policy instru-ments. At the same time, the authors observe that with a new generation of leaders, a lack of institutional memory, and ongoing mistrust of markets, there is a likelihood of reverting to some of the deleterious agricultural policies of the past. The authors present some evidence of renewed government support for policies shown to be problematic for food security and producer incomes, such
as export bans, price setting for certain commodities, and restrictions on the importation of certain inputs. Instead of such options, the authors recommend increased government attention on enabling investments for the agro-processing sector, technology and innovation policy, and productive social protection programs.
Subsequently, chapters 3 through 6 provide a more in-depth analysis of specific issues with respect to agricultural inputs. In chapter 3, Spielman focuses on Africa’s seed systems, which have evolved rapidly since the 2000s, with recent data initiatives revealing the release of many new cultivars. Nonetheless, Spielman argues that Africa suffers from a lack of comprehensive seed policy regimes that encompass, inter alia, public research and development priorities, varietal registration and release procedures, seed quality assurance regulations, and genetic resource policies. To address this challenge, he suggests several areas for intervention by governments, including according more attention to how the design of input subsidy programs influences the uptake of cultivar adoption and varietal turnover by farmers. In addition, complementary efforts are needed to ensure that regional seed trade provisions are incorporated into national legislation, and that African governments can navigate the implications of recent global conventions on biodiversity conservation and genetic resource policies for their own investments in seed system development. Above all, Spielman points to some of the political economy dynamics and contested narratives that bedevil progress in seed system development, including mismatched incentives across government agencies, among donors, and between civil society and private industry.
Chapter 4 assesses the incidence of global, continental, and regional fertil-izer polices in the past that are aimed at promoting increased use of fertilizers in Africa. Abate, Abay, and Spielman review the pros and cons of fertilizer promo-tion policies and programs in Africa, ranging from state-controlled procurement and distribution systems to wholly private sector–led systems, and look at their implications for fertilizer use and agricultural productivity. The chapter also reviews the general trends of fertilizer consumption and application rates in Africa, the marginal returns on fertilizer use, trends in tailored nutrient recom-mendations based on soil tests, and emerging concerns about the unbalanced use of fertilizer in fragile regions of the continent. In addition, the chapter high-lights the focus of national fertilizer policies and regulations on the formulation
2020 ReSAKSS Annual Trends and Outlook Report 5
of instruments that can reduce farmgate fertilizer prices and increase fertilizer application rates, the mixed evidence base on the efficacy and impact of these policies (such as subsidies), and the political economy of fertilizer subsidies. The chapter recommends drawing policy attention toward reducing transport and transaction costs to render lower output and fertilizer prices, and revitalizing the existing and mostly poorly funded research and extension systems.
Chapter 5 focuses on Africa’s agricultural mechanization policy, including a case study of Ghana’s recent mechanization interventions. Takeshima, Diao, and Aboagye review emerging areas of market failures in agricultural mechanization and the risk of new government failures. Ghana’s case study shows that recent growth in mechanization service provision is clearly led by private suppliers, many of which are medium-scale farmers. Considering the spatially diverse agroecological and socioeconomic conditions in African countries, African governments should avoid any direct intervention in mechanization service provision to minimize rent-seeking behavior associated with the government’s distribution of subsidized machinery. Instead, appropriate government interven-tion should include enhancement of information, support for the acquisition of knowledge and skills in the operation and maintenance of various machinery, exploration of multiple tractor functions both on and off farm, and demonstra-tion and introduction of low-cost equipment and implements suitable for local conditions. These public engagements will help private machinery investors improve efficiency and increase returns on investment, thereby attracting more private investment in the mechanization services that are increasingly demanded by smallholders.
Like mechanization, irrigation is critical for enhancing the region’s trans-formation. Although irrigation development is generally slow in Africa, extant systems can be developed for different types of crop production. In chapter 6, Ringler, Mekonnen, Xie, and Uhunamure differentiate among three irrigation systems that are covered by the African Union irrigation framework: large-scale irrigation systems, often publicly constructed and supported by governments; community-managed systems; and small-scale, farmer-led irrigation systems. The viability of small-scale irrigation development is associated with develop-ment of cash and high-value food crops, whereas its potential for staple crops seems to be limited because of low returns. Development of large-scale irriga-tion needs to be part of broader infrastructural investment in dams, roads, and
electricity, and it can be justified as reducing import dependency for key staple crops as well as increasing foreign exchange earnings through the expansion of export crops. All three types of irrigation systems in Africa are weakened by insufficient investment and weak institutional and governance capacity. Public investment and policy are critically lacking in a number of domains, including information collection through new remote sensing technology, capacity development to regulate thousands of individual irrigators, groundwater resource governance, oversight to mitigate water pollution, protection of formal and informal water rights, and promotion of private sector–led solar-powered groundwater irrigation systems.
Chapters 7 through 11 are more focused on how to bolster the competitive-ness of agriculture along the value chain. Chapter 7 examines Africa’s rapidly transforming midstream value chains for traditional staples, which are domi-nated by SMEs in the processing and trading segments. Tadesse and Badiane take an agricultural transformation approach to reviewing the evolution of value-chain development, its policy options, and the pitfalls associated with the planning and implementation of these polices. Using data from the millet sector in Senegal, they further explore the extent of the transformation occurring among the middle actors engaged in the primary and secondary processing, wholesaling, and retailing segments, as well as the incidence and effectiveness of public support to facilitate business start-ups, skills development, and collective action among secondary processors. The chapter proposes to better nuance and align policy interventions according to the type of value chain and its transfor-mative potential. Specifically, it provides differentiated recommendations for value chains dominated by start-ups compared with those possessing a large share of more mature enterprises, as well as for the value chains of traditional staples, such as millet, cassava, or teff, that are catering to emerging regional and domestic urban consumers, vis-à-vis traditional export value chains, including those for oilseeds, cotton, and tropical beverages, that are targeting more sophis-ticated global markets.
Chapter 8 also draws on the experience of Senegal to emphasize the impor-tance of institutionalizing collective action in African agriculture based on the experiences of smallholder producers’ organizations. Wouterse and Faye discuss the historic evolution and economic importance of collective action in agricul-tural commercialization, in Africa generally and in Senegal particularly. This is
6 resakss.org
followed by a quantitative analysis to assess whether membership in producer organizations affects the technical efficiency of smallholders and whether the design and governance of organizations affects their performance. The authors find a strong association between organizational membership and greater efficiency. They also observe a significant relationship between producer organi-zations’ design and governance structure (for instance, established by members with a board and mechanisms for oversight and sanctioning) and the producers’ commercial performance. The chapter concludes by recommending smallholder participation in producer organizations and encouraging such organizations to carefully consider how they are structured and ensure the inclusion of female members.
Beyond modalities of collective action, those involved in the agricultural and food value chains need relevant skills to increase their productivity and stay competitive in domestic and international markets. This need is particu-larly relevant to African youth given that without viable skills, their access to the labor market is limited, and many end up in the informal economy. Consequently, chapter 9 examines opportunities for agricultural technical and vocational education and training (ATVET) in Africa and reviews extant initiatives, such as CAADP’s ATVET pilot program. Kirui argues that ATVET systems need to go beyond a narrow focus on just actors involved directly in the different stages of an agricultural value chain. Instead, he advocates for a more comprehensive approach that simultaneously incorporates those involved in core professions in the value chain (such as logistics and storage technology), support professions (such as machine technicians for tractors), and cross-sectoral professions whose expertise improves the functioning of the entire value chain (such as accountants, insurance specialists, and the like). Above all, Kirui advocates for ATVET curricula that encourage private sector participation, adapt to emerging ICT innovations, and help transform agriculture into a more entrepreneurial activity that attracts the youth.
Chapter 10 turns to a critical component often overlooked in discussions of improving agricultural value chains: food safety. To sustain a market for higher value-added agricultural commodities, governments and the private sector need to build trust and confidence in the quality of such goods among rural and urban consumers. Unsafe foods can also have negative impacts on health, diets, and poverty alleviation efforts. Recognizing these factors, CAADP adopted
a Food Safety Index in 2019 to complement the other indicators embedded within its biennial review (BR) process. According to Jaffee, Henson, Grace, Ambrosio, and Berthe, such efforts are especially needed in Africa, which, along with Asia, has among the highest burdens of foodborne diseases linked to microbiological pathogens and parasites caused by poor hygiene, lack of clean water, close contact with animals, and intense use of agrochemicals and veterinary drugs. Addressing this multifaceted challenge requires developing comprehensive national policies on food safety, data systems to track food safety problems, effective mechanisms for the accreditation and certification of businesses, and investment in capacity for food safety regulatory oversight that is not only export oriented but also covers domestic markets. Given Africa’s dualistic consumer markets, the authors argue that such approaches also need to be varied to account for both informal food channels (for example, street hawking, open-air markets) and modern retail outlets, including supermarkets and e-commerce operations.
Although more attention to food safety is particularly needed with respect to domestically traded foods, the regional and global trade environment plays a key role in shaping the competitiveness of African agriculture. In chapter 11, Bouët and Odjo focus on the competitiveness of African agriculture in regional and global trade. They argue that although trade policy is instrumental for competitiveness, it needs to be accompanied by policies aimed at lowering trans-action costs and improving the business environment for private sector actors along different agricultural value chains. Moreover, trade policy is more likely to improve agricultural competitiveness if it is designed in a way that encourages local producers to import new technologies that can enhance their productivity. In other words, competitiveness derives from productivity in farm production and along the entire value chain, and therefore, policies for promoting trade and enhancing productivity should be designed and implemented in an integrated way. In this respect, policies that foster participation in global value chains are increasingly important for competitiveness, because these chains provide oppor-tunities for African countries to attract foreign investment, for local producers and traders to get access to new technologies and know-how, and for the coun-tries to adopt sanitary and phytosanitary standards required by international markets.

2020 ReSAKSS Annual Trends and Outlook Report 7
Chapters 12 through 15 turn to factors that shape the broader enabling environment for agrifood system transformation. One overriding concern, which is even more pronounced in the wake of COVID-19, is how Africa’s macroeconomic conditions will impact investments in and the competitiveness of agriculture. In chapter 12, Mukasa, Ndung’u, and Shimeles document a wide range of macroeconomic policy distortions, including biases in subsidies, taxes, exchange rates, and trade and monetary policies, that have detrimental impact on the agricultural sector. The chapter emphasizes that the disconnect between macroeconomic realities and agricultural aspirations remains a challenge today for many countries. Moreover, with ratios of external debt service to exports and of debt to GDP rising again in many African countries since 2010, there exists a risk for a significant macroeconomic setback among these countries. Such a setback could limit fiscal space for governments, forcing them to reduce support to agriculture. Thus now, as much as in the past, commitments to enhancing agricultural public investments will require a sound and stable macroeconomic foundation in order to succeed.
Unlike some other policy domains discussed in this ATOR, digitalization lacks a strong historical precedent in the region. As discussed in chapter 13, digitalization for agriculture (D4Ag) specifically encompasses the use of digital technologies, innovations, and data to address bottlenecks in productivity, postharvest handling, market access, finance, and supply chain management. Baumüller and Addom argue that D4Ag has shown great promise for improving smallholder access to financing, building climate resilience among farmers, and boosting productivity along the value chain. Yet taking full advantage of D4Ag’s potential requires a comprehensive set of policies tied to oversight of private sector service providers, as well as digital safety and data privacy; improved data literacy of smallholder farmers, traders, and extension agents; and networking platforms to avoid duplication of scattered knowledge products and resources. Furthermore, D4Ag cannot properly excel in the absence of affordable and equitable access to Internet connectivity and electricity, financing for digital start-ups to make them financially sustainable, and a conducive business envi-ronment that is legally predictable and has low levels of corruption. Baumüller and Addom offer a number of examples in Africa where achievements in these different policy domains are already occurring under the guidance of the African Union.
In chapter 14, Resnick provides some perspective about the political economy considerations—particularly the roles of interests, institutions, and ideas—that need to be accounted for to foster agrifood system transformation. She emphasizes that previous “generations” of political economy research have shown how these three factors jointly explain a variety of historical policy thrusts in the African agricultural sector. These include past trade and price distortions; the preference for investments in visible goods, such as subsidized inputs, over those in agricultural research and development; and the reasons why some commodities have been targeted for agro-industrial policy but others have not. She notes that the growing focus on agrifood system transformation entails attention to a new range of political economy concerns, including how to foster interministerial coordination while still ensuring accountability for delivery. Similarly, because agrifood system transformation involves interven-tions that span multiple administrative boundaries, including those that may be controlled by different political parties, cooperation across different levels of government will also be needed. Resnick reviews some public sector manage-ment approaches that have been adopted in Africa and elsewhere to address some of these central coordination issues in the agricultural sector and beyond.
Chapter 15 returns to some of the themes elaborated on in chapter 2, particularly the impact of the CAADP process and its main tenet of mutual accountability on agricultural policymaking processes and decisions. Ulimwengu, Matchaya, Makombe, and Oehmke review the origins of the mutual accountability concept, pointing out that, through the Paris Declaration on Aid Effectiveness, it became synonymous with a process of dialogue and oversight of commitments from donors, governments, the private sector, and civil society. Agriculture joint sector reviews (JSRs) became the mechanism for operational-izing mutual accountability by articulating milestones and targets mutually agreed to by a range of stakeholders and adopted by CAADP for the agricultural sector. Since 2017, countries have used JSR platforms as part of the CAADP BRs to monitor and report on progress toward achieving Malabo Declaration commitments. The authors review instances in which JSRs and the BRs affected the nature of governments’ agriculture reforms. In addition, they show that countries that conducted a JSR and participated in the CAADP process were more likely to devote more public expenditures to the agricultural sector. In turn, more public expenditures were associated with greater agricultural growth
8 resakss.org
through productivity gains. As a result, the authors conclude that those coun-tries that participated in mutual accountability processes were more likely to experience faster agricultural transformation during the 2008–2018 period.
The importance of the JSRs and BRs underlines the need for high-quality, timely, and credible data to track achievements and identify progress toward agrifood system transformation in Africa. Therefore, in chapter 16, Makombe, Tefera, and Ulimwengu review the progress of countries in establishing or strengthening JSRs and in reporting their progress toward meeting Malabo Declaration commitments as part of the second BR. Because the ATOR serves as the official monitoring and evaluation report for CAADP, the chapter assesses progress on CAADP indicators outlined in the CAADP Results Framework. And in keeping with the policy theme of the 2020 ATOR, chapter 16 also reviews policy responses to COVID-19 in a selected group of African countries.
Although there remains much uncertainty related to COVID-19 and other recent shocks facing the continent, there has been substantial learning about the effectiveness of certain policies relevant to agrifood system transformation, and there is a growing body of evidence about where policy gaps exist. This ATOR intends to provide a platform for dialogue on how to prioritize needed interven-tions for agrifood system transformation and ensure that investments in one area complement, rather than undermine, those in other needed areas.
2020 ReSAKSS Annual Trends and Outlook Report 9
CHAPTER 2
The Past, Present, and Future of Agriculture Policy in Africa
Ousmane Badiane, Julia Collins, and John M. Ulimwengu

10 resakss.org
In the 1990s and early 2000s most studies painted a bleak picture of the economic performance of Africa south of the Sahara (SSA). For Easterly and Levine, Africa’s economic history since the independence era “fits
the classical definition of tragedy: potential unfulfilled, with disastrous consequences” (1997, 1). Likewise, Artadi and Sala-i-Martin (2003) later described Africa’s poor growth performance as an economic tragedy, attributed to insufficient levels of education, health, and investment, as well as conflict, unfavorable geography, and inappropriate policies. The collapse of SSA economies explains the region’s widespread poverty and its consequences. For example, Easterly and Levine (1997) noted that the majority of African mothers could expect to lose at least one child before age five, and that average life expectancy and daily calorie intake were far lower in SSA than in other developing regions.
This somber period of economic decline and stagnation marked a striking contrast with Africa’s healthy growth performance during the 1960s and early 1970s. Equally striking has been the strong recovery observed since the early 2000s, with considerable growth acceleration across the continent. However, African economies have not yet caught up with their growth trajectories of the 1960s (Badiane et al. 2015). The policies chosen by leaders have much to do with the dramatic changes in Africa’s fortunes over the past decades and will continue to shape the continent’s prospects in the decades to come. Weaknesses in agriculture-sector and macroeconomic policies have shaped the performance of African economies, which in turn stifled the capacity of countries to make the necessary growth-enhancing investments in skills, services, and infrastructure in the decades leading to and through the period of decline. Improvement in the same policies and investment decisions have made the longest sustained period of economic growth in the continent’s history possible (Badiane and Makombe 2015; Conway, Badiane, and Glatzel 2019).
There have been plenty of attempts to explain the growth recovery as the result of booms in global export markets or better rainfall conditions. The weakness of such arguments is that these booms and conditions occurred in the past as well, and precisely during the very periods of economic decline. Why did economies respond this time to positive developments, and why did this response result in a two-decades-long growth spell? The reason is that improvement in policy regimes and economic governance—the sum of policies and regulatory measures that define the rules of the game and the roles of different actors, at the
macroeconomic and sector levels—placed economies in a better position to boost agricultural production in response to better weather conditions and to grab opportunities in global markets in order to fuel domestic growth. The geographic spread and sustained character of the current recovery can be explained only by factors that have affected a broad range of countries, not just primary exporters, and have transcended variations in rainfall conditions across countries. These factors are primarily related to the painful and controversial reforms carried out by most African countries during the structural adjustment programs. These reforms helped reduce fiscal deficits, brought inflation under control, created room for the private sector, and cut the level of implicit taxation faced by small-holder farmers. The changes were deep and it took a while for most economies to weather them, but countries emerged strengthened and poised for a remarkable recovery (Badiane et al. 2015; Devarajan and Shetty 2010).
The above lessons are important as we look forward to the next couple of decades. A major economic policy question is how to sustain and broaden the current recovery process in order to further accelerate the pace of improvement in incomes, poverty, and hunger, and continue to enhance prosperity for all Africans. Related questions are how to build on the reforms of the past and continue to improve economic governance and agricultural sector policies. Agricultural policies are key to overall development due to the central role of agriculture in broader economic growth and transformation, which is related to strong linkages between agriculture and other sectors, among other factors (see Conway, Badiane, and Glatzel 2019). At the minimum, there is a need to maintain the positive changes of the past and avoid a return to policies that led to the lost decades of economic decline and stagnation. At best, we need to find the right mix of policies, some new, some old, that will meet the needs of rapidly modernizing agricultural value chains and transforming national economies.
Against the background just discussed, this chapter reviews changes in Africa’s economic and agricultural development, and explores their origins in the types of policies pursued by leaders. It examines the strategies and economic trends of the past, in the decades since independence; discusses the innovations of the current Comprehensive Africa Agriculture Development Programme (CAADP) era; and describes future policy challenges as we approach the third decade of CAADP implementation. In the first section, we review trends over the past decades in economic growth, agricultural production and productivity, and poverty and hunger. Next, we describe the evolution of agricultural and

2020 ReSAKSS Annual Trends and Outlook Report 11
macroeconomic policies in the decades since Africa’s independence. The third section uses econometric analysis to link policy changes and macroeconomic management indicators to economic growth outcomes. The fourth section describes policy renewal efforts under CAADP, and the next section discusses the growing danger of policy reversal and the importance of mutual accountability processes to mitigate this risk. The sixth section discusses new and emerging policy challenges facing policymakers today, and the final section concludes with some remarks on the way forward.
Long-Term Agricultural and Economic Growth TrendsIn this section we briefly describe some of the elements of Africa’s growth trajectory during the decades since independence. At the broadest level, the story of Africa’s economic development is, as mentioned above, marked by episodes of decline and recovery. Figure 2.1 shows average annual growth in gross domestic product (GDP) by decade for a group of 30 African countries that have complete data for all years since 1960.1 For the entire group, GDP grew at around 4 percent annually during the 1960s and 1970s, but growth decelerated sharply, to around 2 percent per year, during the 1980s and 1990s. However, growth rebounded during the 2000s, with GDP increasing at more than 5 percent per year. Growth was less robust during the 2010s, at 3.3 percent per year. Patterns of economic growth differed somewhat by region, but most regions followed the same general trajec-tory of healthy growth early on, very low growth during the 1980s and 1990s, and even faster growth in the 2000s.
1 Unless otherwise stated, statistics for “Africa” refer to the continent as a whole. Tables and graphs showing trends in the first several decades after independence are calculated based on subsets of countries that have complete data for the time period; although results may be affected by the subset of countries to some extent, they echo findings from other literature, and we believe that they are reasonably reflective of trends on the continent as a whole. Tables and graphs covering trends during the 1980s and after are based on most African countries, unless otherwise stated.
The lackluster GDP growth of the 1980s and 1990s fell below population growth, and average incomes declined each year for nearly two decades. Figure 2.2 shows the evolution of GDP per capita for the same group of 30 countries. Growth stalled in the second half of the 1970s and fell thereafter. At the bottom of the trough, in 1994, average incomes in this group of countries were
Source: Authors’ calculations based on World Bank (2020b).Note: Africa = 30 countries, as follows: western Africa = Benin, Burkina Faso, Côte d’Ivoire, Ghana, Niger, Nigeria, Senegal, Sierra Leone, Togo; southern Africa = Botswana, Lesotho, Malawi, South Africa, Zambia, Zimbabwe; northern Africa = Algeria, Egypt, Mauritania; eastern Africa = Kenya, Madagascar, Rwanda, Seychelles, Sudan; central Africa = Burundi, Cameroon, Central African Republic, Chad, Democratic Republic of the Congo, Gabon, Republic of the Congo.
FIGURE 2.1—ANNUAL AVERAGE PERCENTAGE GROWTH OF GDP BY DECADE, 30 AFRICAN COUNTRIES, 1960–2018
-1
0
1
2
3
4
5
6
7
8
Africa Western Africa
Southern Africa
Northern Africa
Eastern Africa
Central Africa
Perc
enta
ge
1960-1969 1970-1979 1980-1989 1990-1999 2000-2009 2010-2018

12 resakss.org
below their 1970 level. However, robust growth resumed from the mid-1990s through the mid-2010s. It is a concern that GDP per capita has remained flat for the period from 2015 to 2018. It remains to be seen whether this is a temporary setback or if the growth recovery has weakened. The long-term trends of economic decline followed by a resurgence of growth have much to do with the changing policy regimes pursued by governments, as discussed in the following section.
Agricultural Production and ProductivityAlthough data on agricultural output from the decades immediately following independence are limited, available data tell a similar story of stagnation and recovery (Badiane et al. 2015). Figure 2.3 shows agriculture value added per capita for a group of 16 countries with complete data from 1965 to 2018. For this group, annual value added remained around US$240 per person for decades
before increasing significantly in the late 1990s. For the larger group of African countries, the agricultural growth recovery likely began during the 1980s. As shown in Table 2.1, agriculture grew at more than 4 percent per year during the 1980s, decelerated in the 1990s, and resumed rapid growth in the 2000s of more than 5 percent per year. Similarly to overall economic growth patterns, agricultural growth in the 2010s has been positive but less robust than that of the 2000s. Agricultural growth trends show significant differences by subregion, with the low average growth rates of the 1990s driven mainly by southern and eastern Africa. The health of Africa’s agricultural sectors over the decades has been strongly affected by sector governance and policy regimes (discussed in the next section).
Although in the past decades Africa’s output growth has been driven by the expansion of agricultural land, land and labor productivity have been
FIGURE 2.2—GDP PER CAPITA (IN CONSTANT 2010 US DOLLARS), AFRICA, 1960–2018
0
500
1,000
1,500
2,000
2,50019
6019
6219
6419
6619
6819
7019
7219
7419
7619
7819
8019
8219
8419
8619
8819
9019
9219
9419
9619
9820
0020
0220
0420
0620
0820
1020
1220
1420
1620
18
Cons
tant
201
0 U
S do
llars
Source: Authors’ calculations based on World Bank (2020b).Note: Africa = Algeria, Benin, Botswana, Burkina Faso, Burundi, Cameroon, Central African Republic, Chad, Côte d’Ivoire, Democratic Republic of the Congo, Egypt, Gabon, Ghana, Kenya, Lesotho, Madagascar, Malawi, Mauritania, Niger, Nigeria, Republic of the Congo, Rwanda, Senegal, Seychelles, Sierra Leone, South Africa, Sudan, Togo, Zambia, and Zimbabwe.
TABLE 2.1—AVERAGE ANNUAL PERCENTAGE GROWTH IN AGRICULTURAL VALUE ADDED, AFRICA, 1980–2018
Region 1980–1989 1990–1999 2000–2009 2010–2018
Africa 4.15 2.81 5.18 3.70
Western Africa 6.86 4.46 6.24 2.14
Southern Africa 0.24 -0.44 2.85 2.72
Northern Africa 5.70 5.33 2.76 6.78
Eastern Africa 2.44 2.06 7.81 6.31
Central Africa 3.41 12.54 2.02 5.75
Source: Authors’ calculations based on ReSAKSS (2020).
TABLE 2.2—ANNUAL AVERAGE LABOR AND LAND PRODUCTIVITY GROWTH (PERCENTAGES), AFRICA, 1980–2018
Variable 1980–1989 1990–1999 2000–2009 2010–2018
Labor productivity 1.33 0.55 1.82 2.03
Land productivity 3.23 1.27 3.52 4.31
Source: Authors’ calculations based on ReSAKSS (2020).Note: Labor and land productivity are measured as agricultural value added (in constant 2010 US dollars) per worker and per hectare, respectively.

2020 ReSAKSS Annual Trends and Outlook Report 13
increasing since the mid-1980s. However, Benin and colleagues (2011) found that productivity growth from the mid-1980s through 2010 had served only to return productivity to its levels of the early 1960s, following sharp declines in the intervening decades. Productivity growth has continued to increase during the 2010s, exceeding that of the three preceding decades for both land and labor productivity (Table 2.2). Land productivity growth was especially high, at more than 4 percent per year.
Poverty and NutritionNearly two decades of economic decline had devastating effects on Africa’s overall development and population welfare. As of 1990, more than half of the population of SSA was poor according to the international poverty line of US$1.90/day, and the region’s poverty rate was second only to that of East Asia and the Pacific (EAP). Poverty in EAP declined rapidly thereafter, whereas in
SSA it rose slightly, only beginning to decline with the economic recovery in the late 1990s and 2000s (World Bank 2020a).
Africa also had very high rates of undernutrition in the early 1990s: 45 percent of children younger than five were stunted, 26 percent were underweight, and 11 percent suffered from wasting in 1991. In the nearly three decades from then until 2018, all three indicators had improved significantly, but rates remained high, at 33 percent, 18 percent, and 8 percent, respectively. Although reductions in undernutrition have not been as rapid as hoped, some countries and regions have shown significant
improvements, and at the continental level the declines in all three indicators have accelerated in each decade (Table 2.3). The average Human Development Index (HDI) score for Africa also improved steadily over time. The improve-ments in hunger and in HDI, and the accelerations of progress in the 2000s, are related both to increasing incomes and to institutional, programmatic, and policy innovations in African countries (Malabo Montpellier Panel 2017).
The erratic changes in economic and agricultural development described above, and their impacts on poverty and hunger, have many causes, including weather shocks, conflict, and changes in the global trade and financial environ-ment. However, governments’ policies are major drivers of the observed trends. In the next section, we review changes in the types of macroeconomic and agricultural policies pursued by African countries in the decades since indepen-dence, and their impacts on growth and welfare.
FIGURE 2.3—AGRICULTURAL VALUE ADDED PER CAPITA, 16 AFRICAN COUNTRIES (CONSTANT 2010 US DOLLARS), 1965–2018
200
220
240
260
280
300
32019
6519
6719
6919
7119
7319
7519
7719
7919
8119
8319
8519
8719
8919
9119
9319
9519
9719
9920
0120
0320
0520
0720
0920
1120
1320
1520
17
Cons
tant
201
0 U
S do
llars
Source: Authors’ calculation based on World Bank (2020b). Note: The countries are Botswana, Burundi, Cameroon, Egypt, Kenya, Mauritania, Morocco, Republic of the Congo, Rwanda, Senegal, Sierra Leone, South Africa, Sudan, Togo, Tunisia, and Zambia.
TABLE 2.3—CHILD UNDERNUTRITION INDICATORS AND HUMAN DEVELOPMENT INDEX, ANNUAL AVERAGE CHANGE, AFRICA, 1990–2018
Variable 1990–1999 2000–2009 2010–2018
Stunting -0.83 -1.21 -1.49
Wasting -0.57 -0.97 -1.57
Underweight -0.64 -1.60 -1.82
HDI 0.67 1.28 0.95
Source: Authors’ calculations based on ReSAKSS 2020 (nutrition indicators) and UNDP 2020 (HDI).Note: HDI = Human Development Index. The third period for wasting is 2010–2017; the first period for HDI is 1990–2000. HDI values are population-weighted averages for 39 African countries that have data starting in 1990.
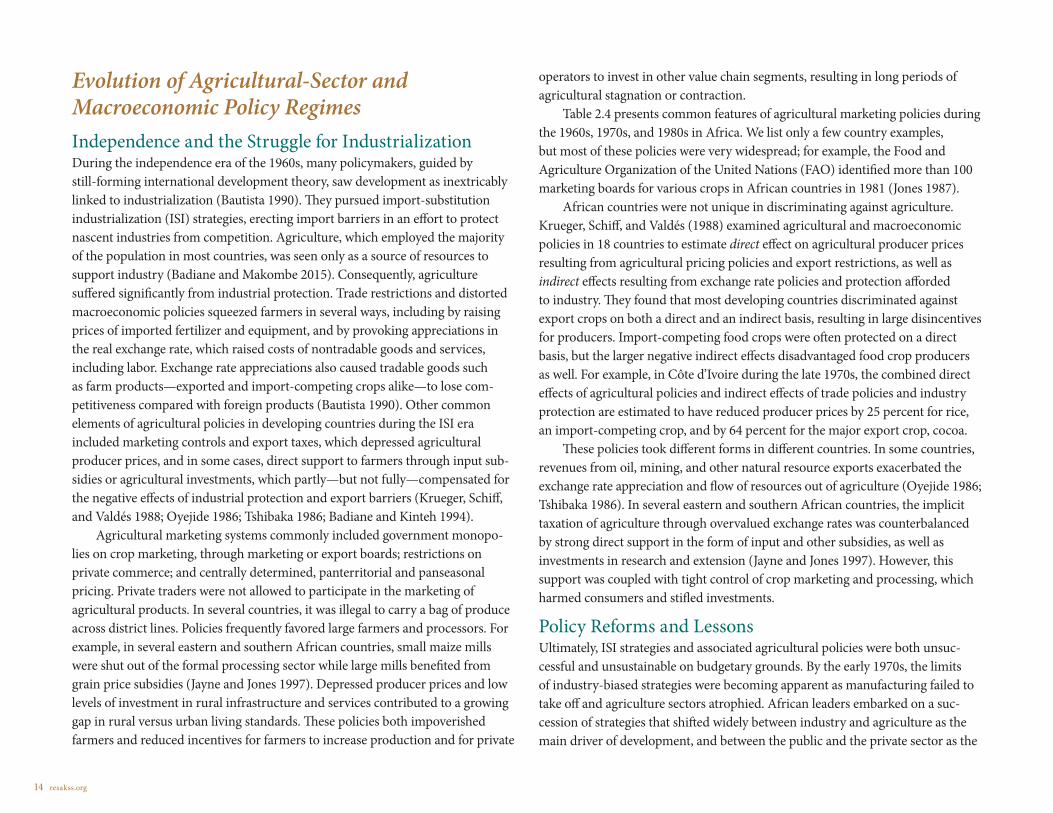
14 resakss.org
Evolution of Agricultural-Sector and Macroeconomic Policy RegimesIndependence and the Struggle for Industrialization During the independence era of the 1960s, many policymakers, guided by still-forming international development theory, saw development as inextricably linked to industrialization (Bautista 1990). They pursued import-substitution industrialization (ISI) strategies, erecting import barriers in an effort to protect nascent industries from competition. Agriculture, which employed the majority of the population in most countries, was seen only as a source of resources to support industry (Badiane and Makombe 2015). Consequently, agriculture suffered significantly from industrial protection. Trade restrictions and distorted macroeconomic policies squeezed farmers in several ways, including by raising prices of imported fertilizer and equipment, and by provoking appreciations in the real exchange rate, which raised costs of nontradable goods and services, including labor. Exchange rate appreciations also caused tradable goods such as farm products—exported and import-competing crops alike—to lose com-petitiveness compared with foreign products (Bautista 1990). Other common elements of agricultural policies in developing countries during the ISI era included marketing controls and export taxes, which depressed agricultural producer prices, and in some cases, direct support to farmers through input sub-sidies or agricultural investments, which partly—but not fully—compensated for the negative effects of industrial protection and export barriers (Krueger, Schiff, and Valdés 1988; Oyejide 1986; Tshibaka 1986; Badiane and Kinteh 1994).
Agricultural marketing systems commonly included government monopo-lies on crop marketing, through marketing or export boards; restrictions on private commerce; and centrally determined, panterritorial and panseasonal pricing. Private traders were not allowed to participate in the marketing of agricultural products. In several countries, it was illegal to carry a bag of produce across district lines. Policies frequently favored large farmers and processors. For example, in several eastern and southern African countries, small maize mills were shut out of the formal processing sector while large mills benefited from grain price subsidies (Jayne and Jones 1997). Depressed producer prices and low levels of investment in rural infrastructure and services contributed to a growing gap in rural versus urban living standards. These policies both impoverished farmers and reduced incentives for farmers to increase production and for private
operators to invest in other value chain segments, resulting in long periods of agricultural stagnation or contraction.
Table 2.4 presents common features of agricultural marketing policies during the 1960s, 1970s, and 1980s in Africa. We list only a few country examples, but most of these policies were very widespread; for example, the Food and Agriculture Organization of the United Nations (FAO) identified more than 100 marketing boards for various crops in African countries in 1981 (Jones 1987).
African countries were not unique in discriminating against agriculture. Krueger, Schiff, and Valdés (1988) examined agricultural and macroeconomic policies in 18 countries to estimate direct effect on agricultural producer prices resulting from agricultural pricing policies and export restrictions, as well as indirect effects resulting from exchange rate policies and protection afforded to industry. They found that most developing countries discriminated against export crops on both a direct and an indirect basis, resulting in large disincentives for producers. Import-competing food crops were often protected on a direct basis, but the larger negative indirect effects disadvantaged food crop producers as well. For example, in Côte d’Ivoire during the late 1970s, the combined direct effects of agricultural policies and indirect effects of trade policies and industry protection are estimated to have reduced producer prices by 25 percent for rice, an import-competing crop, and by 64 percent for the major export crop, cocoa.
These policies took different forms in different countries. In some countries, revenues from oil, mining, and other natural resource exports exacerbated the exchange rate appreciation and flow of resources out of agriculture (Oyejide 1986; Tshibaka 1986). In several eastern and southern African countries, the implicit taxation of agriculture through overvalued exchange rates was counterbalanced by strong direct support in the form of input and other subsidies, as well as investments in research and extension (Jayne and Jones 1997). However, this support was coupled with tight control of crop marketing and processing, which harmed consumers and stifled investments.
Policy Reforms and LessonsUltimately, ISI strategies and associated agricultural policies were both unsuc-cessful and unsustainable on budgetary grounds. By the early 1970s, the limits of industry-biased strategies were becoming apparent as manufacturing failed to take off and agriculture sectors atrophied. African leaders embarked on a suc-cession of strategies that shifted widely between industry and agriculture as the main driver of development, and between the public and the private sector as the

2020 ReSAKSS Annual Trends and Outlook Report 15
predominant economic actor. These shifting policies did not allow the required consistency and continuity for their expected objectives to be met.
Incoherent policy paradigms and unceasing experimentation with agri-cultural development strategies led to slowing growth across African countries throughout the 1970s (see Figure 2.2). The result was worsening budget and foreign exchange deficits, severe debt crises, and declining incomes (Badiane and Makombe 2015). Finally, in efforts to get out of the deep crisis where most countries found themselves after years of unsuccessful strategies, the majority of African countries initiated wide-ranging reform programs as conditions for loans from the International Monetary Fund (IMF) or World Bank. Key conditions included macroeconomic stabilization measures, such as reducing fiscal deficits and reversing overvalued exchange rates, and sectoral policy
and institutional changes, such as eliminating agricultural marketing boards, ending subsidies, deregulating agricultural pricing and marketing, and removing restrictions on private sector participation. The rationale for these reforms, known as structural adjustment programs (SAPs), was that greater macroeconomic stability and the removal of barriers and distortions would increase incentives for producers and allow private sector operators to invest in value chains and thus accel-erate agricultural and overall economic growth.
The literature on the effects of SAPs is mixed. In particular, early studies carried out within the first decade of the reform agree that the programs did not meet expectations. Przeworski and Vreeland (2000) characterized early findings on the effects of IMF loans on economic growth as inconclusive. Tanzi (1989) argued that IMF stabilization programs focused too exclusively on
reduction of fiscal deficits and that often the measures chosen, such as reduc-tions in budgets for education and maintenance of infrastructure, were those with particularly strong growth-reducing effects.
Early studies also found that SAPs had at best ambiguous effects on poverty. Easterly (2003) found that in countries receiving structural adjustment loans, growth was less pro-poor than in other countries. Kherallah and others (2002) pointed out that welfare effects of reforms were complex; whereas some farmers were negatively affected by the removal of input subsidies and other direct support, export crop producers gained from higher prices, and net food buyers benefited from lower food prices due to reductions in marketing margins in many countries.
TABLE 2.4—COMMON AGRICULTURAL MARKETING POLICIES, AFRICA, 1960s–1980s
Type of policy Examples
Marketing boards with monopoly over purchase, sale, and export of commodities
Malawi: Agricultural Development and Marketing Corporation purchases maize and other crops from smallholders.Mali: Compagnie Malienne de Développement des Textiles has exclusive right to purchase and market cotton.
Administratively determined panseasonal and panterritorial pricing
Tanzania: Maize producer prices fixed based on cooperative and National Agricultural Products Board costs.Malawi: Panterritorial pricing introduced to promote production in remote areas. Maize is subsidized, but cash crops are taxed.
Restrictions on private trade Kenya: Movement of grain between districts illegal except for licensed traders. Mali: Private trade in cereals banned.
Restrictions on private processing Kenya, Zambia: Small number of large-scale licensed millers have de facto monopoly on processing and sale of maize meal.Senegal: State-run plants have monopoly on groundnut processing.
Public provision of inputs Benin: Parastatal Société Nationale de Promotion Agricole holds monopoly on fertilizer and pesticide distribution; input prices are subsidized.Ghana: Ministry of Food and Agriculture and parastatals arrange procurement and distribution of fertilizer at subsidized, panterritorial prices.
Control of food retail markets and prices
Madagascar: State organizations responsible for rice wholesale and retail; consumer prices subsidized.Senegal: Caisse de Péréquation et de Stabilisation des Prix has monopoly over import, distribution, and sale of foreign rice.
Source: Badiane and Gaye 1999 (Senegal); Badiane et al. 1997 (Benin, Ghana, Madagascar, Senegal); Dembélé and Staatz 1999 (Mali); Jayne and Jones 1997 (Kenya, Tanzania, Malawi).

16 resakss.org
The reforms resulted in increased production in some countries and for some crops. Cash crops, which saw improved price incentives, showed the largest increases (Kherallah et al. 2002). In Mali, increased rice producer prices and the introduction of quality premiums led to demand for improved production technologies and dramatically increased rice productivity (Dembélé and Staatz 1999). However, in some countries, production decreased due to the withdrawal of previous government support (Jayne and Jones 1997).
In many countries, the production response was hampered by hitherto suppressed and thus underdeveloped input and output markets. One important lesson from the reform experience is that developing efficient markets in such a context was not as simple as withdrawing government involvement. Indeed, despite improvements in market functioning, private operators were not able to quickly fill the gaps in marketing after years of restrictions and underinvestment (Jayne et al. 2002; Kherallah et al. 2002). Market liberalization did give rise to competitive private markets for farm outputs, with extensive entry of small-scale traders in most countries. However, these small traders were usually unable to significantly expand their operations due to constraints related to transport costs, access to credit, limited experience and skills, and in some cases competition from remaining public marketing boards. Badiane (2000) found that trading costs and market integration improved in Benin and Ghana following reforms, but not in Malawi, where the public marketing agency still played a strong role in maize trade. In Mali, where market liberalization was accompanied by provision of credit and market information services for private operators, the availability of grain in markets increased and margins fell, benefiting both consumers and producers (Dembélé and Staatz 1999).
Overall, the SAP period of the 1980s and 1990s was one of poor economic growth in Africa (see Figure 2.1). However, the effects of reforms are difficult to assess, especially in the early years, simply because reforms did not occur to their full extent. In many countries, reforms were partial or later reversed; in some cases, the government made room for the private sector in agricultural marketing but retained control over the environment in which the private sector operated (Jayne et al. 2002). For example, in Senegal, the government removed some groundnut marketing restrictions but retained panseasonal and panterritorial pricing, and maintained control over groundnut processing (Badiane and Gaye 1999). Anderson (2010) suggested that whereas most developing countries had eliminated or reversed anti-agriculture bias by the late 1990s and early 2000s,
these distortions remained in Africa. The countries that implemented reforms most completely and consistently tended to have the most positive effects in terms of market functioning and productivity increases (Badiane 2000; Dembélé and Staatz 1999).
In some cases, reforms occurred but with significantly delayed timelines (Jayne et al. 2002). This reflects findings in later studies suggesting that reforms associated with SAPs did eventually contribute to macroeconomic stabilization and ultimately to the growth recovery, which began around 2000 (Badiane et al. 2015). Many countries made significant progress in improving the macro-economic environment between the mid-1990s and mid-2000s (Devarajan and Shetty 2010). Several studies using data through the mid-2000s found that reforms associated with the SAPs made important contributions to agricultural productivity growth (Fuglie and Rada 2013; Yu and Nin-Pratt 2011; Block 2010). It therefore appears that policy reforms enacted in the 1980s and 1990s took some time to work through the economic systems and yield the anticipated effects on growth and development outcomes, in addition to the effects of continued reforms into the 2000s. The trajectory of agriculture-sector and economic growth in the 25-year period that followed the reform decades is a strong proof of the value of appropriate and effectively implemented national economic policies. In the next section, we attempt to quantify the role of policy factors in explaining economic trends through econometric analysis. Following that, we examine policy developments during the postrecovery period that succeeded the SAPs.
Policy Changes and Economic Recovery: Empirical EvidenceThe economic and agricultural dynamics reviewed in the first section of this chapter have much to do with the policy changes discussed in the second section. However, economic outcomes have multiple causes in addition to policy. In this section, we test empirically how a wide range of policy instruments determine growth outcomes in Africa. To do so, we estimate a convergence model à la Barro and Sala-i-Martin (1990). The concept of macroeconomic convergence is based on the Solow growth model, which predicts that two countries with the same levels of certain parameters—savings rates, population growth rates, rates of technical progress, and so on—must ultimately exhibit similar levels of per capita income, irrespective of the initial state of each of these economies. On the relevance of the convergence model in assessing the impact of policies, Sachs

2020 ReSAKSS Annual Trends and Outlook Report 17
and Warner argued that membership in the “convergence club” is better defined according to policy choices than initial levels of human capital, concluding that “convergent growth can be achieved by all or virtually all countries that follow a reasonable set of political and economic policies, including civil peace, basic adherence to political and civil rights, and an open economy, through the absence of trade quotas, export monopolies, or inconvertible currencies” (1995, 13).
Table 2.5 provides the specifications of the convergence model. Under unconditional convergence, per capita GDP growth is faster in countries with lower initial per capita GDP levels. Under conditional convergence, growth depends not only on initial per capita GDP levels but also on a set of policy variables that literature suggests have an impact on growth. If the two specifica-tions (conditional and unconditional) are equivalent, meaning that jointly added instruments are statistically nonsignificant, then difference in per capita income is solely driven by the initial state. The use of a generalized mixed linear model (which combines fixed and random effects) using panel data not only offers protection against bias arising from reverse causality under a wide range of conditions but also helps to circumvent the problem of misspecified temporal lags (Leszczensky and Wolbring 2019).
We test for unconditional and conditional convergence using per capita GDP growth and other economic data from 54 African countries for the period 1995–2015, taking into account a number of policy variables—including measures of agricultural sector support, macroeconomic management, and governance—that are likely to affect economic growth. Overall, for each
2 There is evidence of convergence if and only if the coefficient associated with the initial value of per capita GDP is significant and negative.
specification, our findings confirm the importance of policy instruments in driving economic recovery. One key variable is the relative rate of assistance, or RRA (see Anderson et al. 2008 for estimation methods), which compares the rate of govern-ment assistance in agriculture with the rate of assistance in the rest of the economy. The RRA represents the combined effects of sectoral and macroeconomic policies. Positive RRA values indicate that agriculture is protected relative to other sectors, whereas negative values indicate discrimination against agri-culture, such as that practiced in many African countries prior to reforms. RRA captures the anti-agricultural bias in a true general equilibrium framework, where economic agents have to
decide in which activity they will work and invest (Baliño et al. 2019). In addition to favorable agricultural policy, proxied by the RRA, we allow for a wide range of policy instruments, including macroeconomic stabilization and governance indi-cators, as major determinants of overall growth recovery. External factors such as official development aid (ODA) and emerging relations with China are also taken into consideration. We also include health and education variables to account for the effects of human capital.
We report expected per capita GDP for each combination of policy instru-ments in Figure 2.4 and estimation results in Table 2.6. Overall, we could not find evidence of unconditional convergence;2 as in Badiane and others (2015), it is only when policy instruments are included in the model that we observe evidence of significant growth convergence. In other words, countries with lower initial levels of per capita GDP are growing faster than those with higher initial per capita GDP, conditional on their policy choices. The negative correlation between initial per capita income levels and subsequent growth in per capita income is in line with the findings of Abramovitz (1986), Baumol (1986), and Barro and Sala-i-Martin (1990). Below we discuss the effect of each relevant policy instrument.
In our estimation, increased assistance to the agricultural sector compared with other sectors, as represented by the RRA, is expected to increase per capita GDP growth, although its significance disappears when coupled with the variables on quality of institutions, foreign aid, and macroeconomic and human
TABLE 2.5—MODEL FOR CONVERGENCE
Type of model Unconditional convergence Conditional convergence
Source: Adapted from Barro and Sala-i-Martin (1990).

18 resakss.org
capital. Moreover, there is evidence of economic convergence whenever the RRA is significant. As pointed out by Baliño and colleagues (2019), prior to the 1980s, developing economies tended to tax their domestic agricultural sectors, whereas advanced economies subsidized their farmers. However, this pattern started to shift in the 1980s, as structural adjustment policies in developing economies ended many of the de facto taxes on agriculture as well as the subsi-dies that had favored industry (Tsakok 2011; Anderson and Valdés 2008).
Although other literature has found mixed effects from rising exports to China in response to booming demand (Busse, Erdogan, and Mühlen 2016; Zhang, Alon, and Chen 2014; Edwards and Jenkins 2014; Drummond and Liu 2015), in our estimation growth in exports to China contributes positively to economic growth. Overall, foreign direct invest-ments from China are also boosting African economies, although concerns have been raised regarding the allegedly deplorable social condi-tions of domestic workers involved in China-funded projects (Nnanna 2015; Khodeir 2016).
Both types of ODA—for social infrastructure and services (ODA 100) and for production sectors (ODA 300)—have significant and positive effects on growth. This result is in line with that of Clemens and others (2012), who found that aid does have a modest positive effect on growth on average, although effects differ by country.
The two variables capturing human capital—life expectancy and average years of schooling—positively affected growth among African countries. This reflects evidence from the literature suggesting that one of the most important factors of economic growth is human capital (Lucas 1988; Mankiw, Romer, and Weil 1992), especially with regard to its impact on production through labor productivity (Romer 1990) and promotion of innovation and technology diffu-sion (Siggel 2000, 2001; Horwitz 2005).
Regarding the quality of institutions, our estimation includes five measures from the World Bank’s Worldwide Governance Indicators: (1) voice and account-ability, (2) government effectiveness, (3) regulatory quality, (4) rule of law, and (5) control of corruption. We also include the measure of transparency, account-ability, and corruption in the public sector from the World Bank’s Country Policy and Institutional Assessment. Our results suggest that the most impactful governance and institutions measures are government effectiveness and regula-tory quality. Government effectiveness represents “perceptions of the quality of public services, the quality of the civil service and the degree of its independence from political pressures, the quality of policy formulation and implementation, and the credibility of the government’s commitment to such policies”; regulatory quality covers the “perceptions of the ability of the government to formulate and implement sound policies and regulations that permit and promote private sector development” (Kaufmann, Kraay, and Mastruzzi 2010, 4).
FIGURE 2.4—EXPECTED PER CAPITA GDP BY POLICY INSTRUMENT (PPP, 2011 US DOLLARS), 54 AFRICAN COUNTRIES, AVERAGE 1995–2016
1,111.7 1,111.7 1,112.3 1,112.3
1,116.5
1,119.9
1,106
1,108
1,110
1,112
1,114
1,116
1,118
1,120
1,122
RRA and macro-economic
environment
RRA and humancapital
RRA RRA andcooperation with
China
RRA and foreign
aid
RRA andinstitutions
quality
Per c
apita
GD
P (P
PP, 2
011
US
dolla
rs)
Source: Authors.Note: GDP = gross domestic product; RRA = relative rate of assistance; PPP = purchasing power parity.
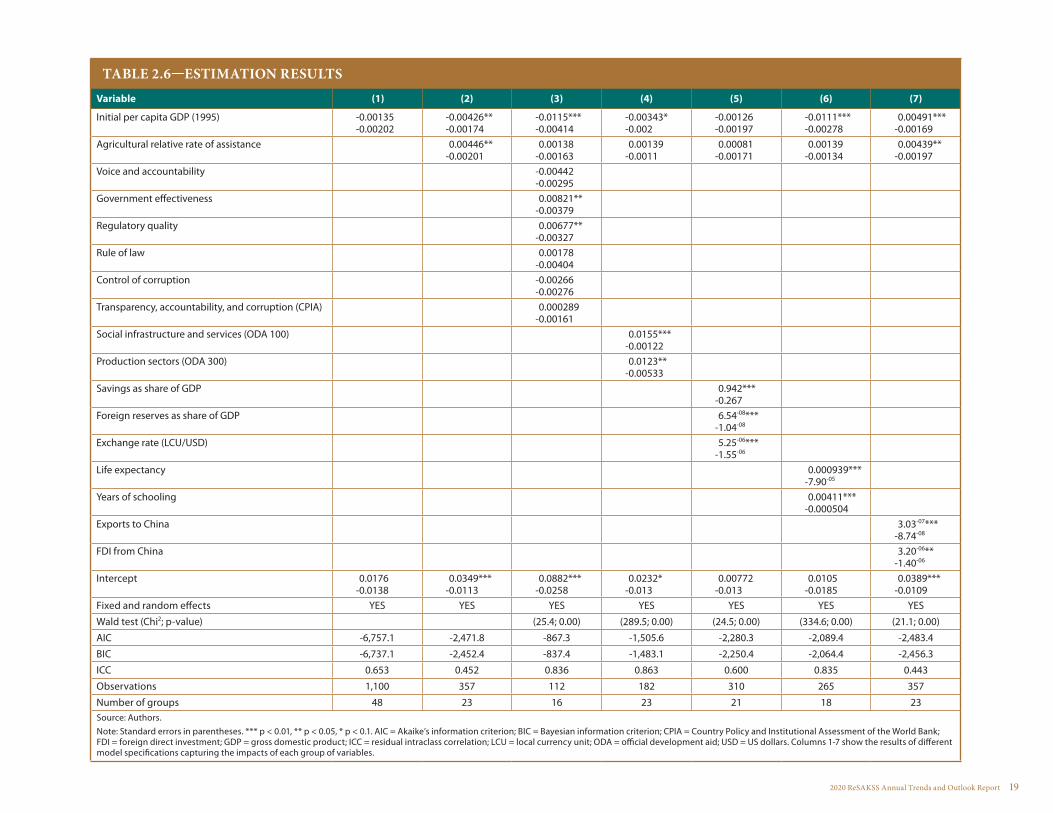
2020 ReSAKSS Annual Trends and Outlook Report 19
TABLE 2.6—ESTIMATION RESULTSVariable (1) (2) (3) (4) (5) (6) (7)
Initial per capita GDP (1995) -0.00135-0.00202
-0.00426**-0.00174
-0.0115***-0.00414
-0.00343*-0.002
-0.00126-0.00197
-0.0111***-0.00278
0.00491***-0.00169
Agricultural relative rate of assistance 0.00446**-0.00201
0.00138-0.00163
0.00139-0.0011
0.00081-0.00171
0.00139-0.00134
0.00439**-0.00197
Voice and accountability -0.00442-0.00295
Government effectiveness 0.00821**-0.00379
Regulatory quality 0.00677**-0.00327
Rule of law 0.00178-0.00404
Control of corruption -0.00266-0.00276
Transparency, accountability, and corruption (CPIA) 0.000289-0.00161
Social infrastructure and services (ODA 100) 0.0155***-0.00122
Production sectors (ODA 300) 0.0123**-0.00533
Savings as share of GDP 0.942***-0.267
Foreign reserves as share of GDP 6.54-08***-1.04-08
Exchange rate (LCU/USD) 5.25-06***-1.55-06
Life expectancy 0.000939***-7.90-05
Years of schooling 0.00411***-0.000504
Exports to China 3.03-07***-8.74-08
FDI from China 3.20-06**-1.40-06
Intercept 0.0176-0.0138
0.0349***-0.0113
0.0882***-0.0258
0.0232*-0.013
0.00772-0.013
0.0105-0.0185
0.0389***-0.0109
Fixed and random effects YES YES YES YES YES YES YES
Wald test (Chi2; p-value) (25.4; 0.00) (289.5; 0.00) (24.5; 0.00) (334.6; 0.00) (21.1; 0.00)
AIC -6,757.1 -2,471.8 -867.3 -1,505.6 -2,280.3 -2,089.4 -2,483.4
BIC -6,737.1 -2,452.4 -837.4 -1,483.1 -2,250.4 -2,064.4 -2,456.3
ICC 0.653 0.452 0.836 0.863 0.600 0.835 0.443
Observations 1,100 357 112 182 310 265 357
Number of groups 48 23 16 23 21 18 23Source: Authors.Note: Standard errors in parentheses. *** p < 0.01, ** p < 0.05, * p < 0.1. AIC = Akaike’s information criterion; BIC = Bayesian information criterion; CPIA = Country Policy and Institutional Assessment of the World Bank; FDI = foreign direct investment; GDP = gross domestic product; ICC = residual intraclass correlation; LCU = local currency unit; ODA = official development aid; USD = US dollars. Columns 1-7 show the results of different model specifications capturing the impacts of each group of variables.

20 resakss.org
Finally, macroeconomic instruments such as savings, foreign reserves, and exchange rates all have significant and positive impacts on per capita GDP growth. The role of macroeconomic stability on overall economic development has been long established in the literature. Montiel and Servén (2006) argued that fiscal solvency and price stability are conducive to growth because macro-economic instability hampers investors’ ability and willingness to undertake investment opportunities. During the period of robust growth, the World Bank (2006) reported an improvement in the overall macroeconomic environment among African countries, with inflation down to historic lows, exchange rate distortions mostly eliminated, and fiscal deficits declining.
It is clear from the above findings that better sectoral and macroeconomic policies in Africa work the same way as they do in all other economies, boosting growth and overall economic performance. Sustaining and deepening the current recovery process will require a continued improvement of the economic policy environment in African countries. More important, as these economies transform, there is a call for an adjustment and refinement of policy regimes in order to respond effectively to emerging opportunities and challenges. In the next section, we review past efforts to renew policy regimes in Africa’s agricultural sectors for lessons to guide future efforts to shape the best policy environment for agricultural and economic growth and enhanced prosperity.
Policy Renewal in Africa’s Agricultural SectorAgricultural Policy Directions from the Lagos Plan of Action to NEPADIn 1980, the Organisation of African Unity (OAU) issued the Lagos Plan of Action 1980–2000 (LPA), a first attempt by African leaders to put in place a continentwide development framework owned and led by Africans. The LPA acknowledged that “rather than result in an improvement in the economic situa-tion of the continent, successive strategies have made it stagnate” (OAU 1980, 4) and noted the urgent need for countries to place a higher priority on agriculture. However, the LPA was more a political document than an action plan, and it largely lacked actionable targets for the agricultural sector and other monitoring and evaluation provisions (Conway, Badiane, and Glatzel 2019; UNECA 1991). Despite good intentions, the LPA was not implemented as intended and the next decade and a half were dominated by the SAPs.
Two decades later, increased skepticism about external development agendas and the advent of a new generation of leaders with pan-African visions paved the way for a more successful attempt to put in place an African-driven development agenda for the continent. During the late 1990s and early 2000s, just as economic and agricultural growth were beginning to rebound, a series of new continental strategy initiatives ultimately formed the basis for the establishment of the New Partnership for Africa’s Development (NEPAD), which was adopted in 2001 by the OAU and in 2002 by the OAU’s successor, the African Union (Conway, Badiane, and Glatzel 2019).
NEPAD provided a blueprint for a new type of relationship between Africa and the global community. It expressed the need for development partners to coordinate their support and align it with African countries’ own priorities and programs, and emphasized the importance of accountability on the part of both donors and recipient countries. NEPAD also called upon African leaders to improve governance and management for better development outcomes. NEPAD values include inclusivity and participation, with multiple stakeholder groups having a role to play in policy formulation and implementation, as well as accountability and review (Conway, Badiane, and Glatzel 2019).
Content, Values, and Principles of CAADP as a New Policy FrameworkThe Comprehensive Africa Agriculture Development Programme (CAADP) was launched in 2003 as NEPAD’s main agricultural development initiative. In adopting CAADP, African leaders committed to two key targets—allocating 10 percent of public expenditures to agriculture and achieving a 6 percent average annual agricultural growth rate—as well as to the principles and values of inclu-sivity, accountability, and review. CAADP also emphasizes the importance of evidence-based agricultural policymaking, including monitoring and evaluating progress and impacts.
The first decade of CAADP implementation culminated with the signing in 2014 of the Malabo Declaration on Accelerated Agricultural Growth and Transformation for Shared Prosperity and Improved Livelihoods. In the declaration, leaders recommitted to the principles and values of CAADP and to the 10 percent agricultural expenditure share and 6 percent agricultural growth targets. In recognition of the strong relationship between agricultural and overall development, they also expanded the CAADP agenda significantly,

2020 ReSAKSS Annual Trends and Outlook Report 21
incorporating additional goals and commitments to be achieved by 2025, including halving poverty and ending hunger, tripling the level of intra-African agricultural trade, and enhancing resilience to climate and other risks, among others. The Malabo Declaration also called for a continentwide accountability and review platform to track and report on progress in meeting agricultural development goals. In response, the first biennial review (BR) was held in 2017 and the second in 2019, with participation from nearly all African countries.
Contribution, Impact, and Limits of Policy Renewal under CAADPCAADP has made significant qualitative contributions to the agricultural policymaking environment in Africa. First and foremost, CAADP has raised the profile and increased the prioritization of agriculture in African and global policy agendas. CAADP’s realization of mutual accountability has been recognized as a best practice internationally, with key CAADP processes emulated in other continents. For example, the Global Agriculture and Food Security Program, a multidonor agricultural financing platform, requires African countries applying for funding in support of agriculture and food security strategies to have com-pleted a CAADP National Agriculture Investment Plan. Non-African countries must have completed and reviewed an investment plan through a CAADP-like
process. Importantly, CAADP has contributed to advancing a culture of evidence-based policymaking in Africa (Badiane, Benin, and Makombe 2016).
CAADP has also provided quantitative benefits for agricultural development goals. Figure 2.5 compares agricultural growth and expenditure outcomes for the countries that are most advanced in CAADP implementation, referred to as CAADP 4 countries, and those that have not engaged with CAADP, known as CAADP 0 countries. The CAADP 4 countries have had stronger agricultural growth and maintained higher agricultural expenditure shares than those not engaged with CAADP. These development outcomes result from numerous drivers, and the trends shown in Figure 2.5 merely suggest correlations between CAADP status and outcomes. However, more rigorous statistical impact analysis by Benin (2018) has shown that CAADP allowed the countries most advanced in implementation to raise land and labor productivity and increase government agricultural expenditure as well as development aid for agriculture.
Source: ReSAKSS (2020).Note: CAADP 0 countries: Algeria, Botswana, Comoros, Egypt, Eritrea, Morocco, Namibia, South Africa, South Sudan, Tunisia. CAADP 4 countries: Benin, Burkina Faso, Côte d’Ivoire, Ethiopia, Ghana, Kenya, Malawi, Mozambique, Rwanda, Senegal, Tanzania. Nigeria is also a CAADP 4 country but is not shown in the figure due to data inconsistencies. CAADP = Comprehensive Africa Agriculture Development Programme; NAIP = National Agriculture Investment Plan; USD = US dollars.
FIGURE 2.5—SELECTED INDICATORS, CAADP 0 AND CAADP 4 COUNTRIES
0
2,000
4,000
6,000
8,000
10,000
12,000
1980
1982
1984
1986
1988
1990
1992
1994
1996
1998
2000
2002
2004
2006
2008
2010
2012
2014
2016
2018
2010
US
dolla
rs, m
illio
n
Agriculture value added (2010 USD, million)
0
1
2
3
4
5
6
7
8
9
1980
1982
1984
1986
1988
1990
1992
1994
1996
1998
2000
2002
2004
2006
2008
2010
2012
2014
2016
2018
Perc
ent
Government agriculture expenditure (% total)
CAADP 0: no compactCAADP 4: compact, NAIP, and > 1 source of external funding - Without Nigeria

22 resakss.org
However, there have been limits to CAADP’s ability to sustain increased investments for agricultural growth and productivity. Undoubtedly the rising prominence of agriculture on continental and national policy agendas enabled some countries to significantly raise funding to the sector. In some cases, however, the bulk of increased expenditures have gone toward input subsidies, rather than investments for long-term productivity growth such as research and development. The majority of countries have fallen short of the CAADP 10 percent agricultural budget allocation target: whereas 12 countries met or surpassed the target in at least one year during the 2014–2018 period, the average expenditure share for the continent as a whole was just 3.2 percent. The 6 percent agricultural growth target has also remained out of reach of the majority of coun-tries, although 15 countries met the goal during the 2014–2018 period.
Overall, nearly all countries had made positive progress toward the Malabo goals and targets between the 2017 and 2019 BRs, but most were not considered on track to meet the goals by 2025 (Makombe and Kurtz 2020). CAADP has made significant achievements in increasing the practice of evidence-based poli-cymaking in the agricultural sector. However, Africa is not immune to a return to failed policies of the past. It is therefore important to build on the achievements of CAADP and pursue efforts to further raise the quality of agricultural-sector and economic policy regimes. Any attempt to roll back the progress toward policy renewal launched under CAADP will risk jeopardizing the ongoing economic recovery process.
The Risk of Policy Reversal and Its AvoidanceRisk Factors and Signs of Policy ReversalUnlike the SAPs, which were focused on the adoption of specific policy instru-ments, CAADP seeks to improve the overall quality of policymaking by ensuring that policies are evidence-based and subject to inclusive review. Where mutual accountability processes are weakened and where policy is driven by populism rather than evidence of impact, countries will become more susceptible to repeating the strategies that resulted in economic stagnation in previous decades. African countries experience a remarkably better situation today than they did at the turn of the millennium, in terms of stronger growth and increased incomes. However, the recovery and other positive developments also present a very real risk of policy reversal. Stronger fiscal positions and more open and pluralistic
political systems, though they are welcome changes, also raise the risk that politicians will succumb to populist pressures to prioritize short-term gains over longer-term growth. A new generation of leaders, a lack of institutional memory, and lingering mistrust of markets increase the chances that government may try to dictate economic activities to an unsustainable degree.
The risk of returning to the types of policies that stifled the agricultural sector and posed barriers to farmers is demonstrated by the rising tendency in many countries to resort to price controls and export bans in an effort to ensure food security, and to rely on input subsidies and public agricultural agencies to support agricultural development. There have been examples of temporary policy reversals in the past in response to crises, such as the protectionist trade policies implemented during the 2007/2008 food price spike (Deason et al. 2014); the policy reversals seen today have more disparate drivers and risk becoming long-term if they are not reversed quickly. Table 2.7 lists examples of agricultural policies proposed or implemented in late 2018 and 2019 alone that indicate the propensity to return to centrally administered agricultural marketing strategies.
Over the period shown in Table 2.7, several countries instituted import bans or put in place import restrictions, usually to protect local producers or industries. For example, Burundi imposed a ban on fertilizer imports in August 2019 in order to promote the development of a Burundian organo-mineral fertil-izer plant (AfricaFertilizer.org 2019); Nigeria tightened restrictions on foreign exchange for food importers in the same month, and in October 2019 issued a complete ban on imports via land borders. Other countries instituted export bans or price controls to support food security. In October 2018, Zambia tempo-rarily banned exports of maize and maize meal following lower-than-average production; Zambia’s periodic export bans are estimated to have cost the country US$1.4 billion in revenue during the 2008–2016 period (Chisanga, Subakanya, and Makungwe 2018).
In other cases, governments took control over key aspects of crop markets. In Uganda, the Ministry of Agriculture set dates for the June and December 2019 vanilla harvests in an effort to improve the quality of vanilla by preventing harvest of immature beans. Harvesting vanilla outside of the set dates was punishable by law; adjusting the dates based on local weather patterns required approval from the ministry (Christopher 2019). In Tanzania, the government banned private traders from purchasing cashew nuts from growers in November
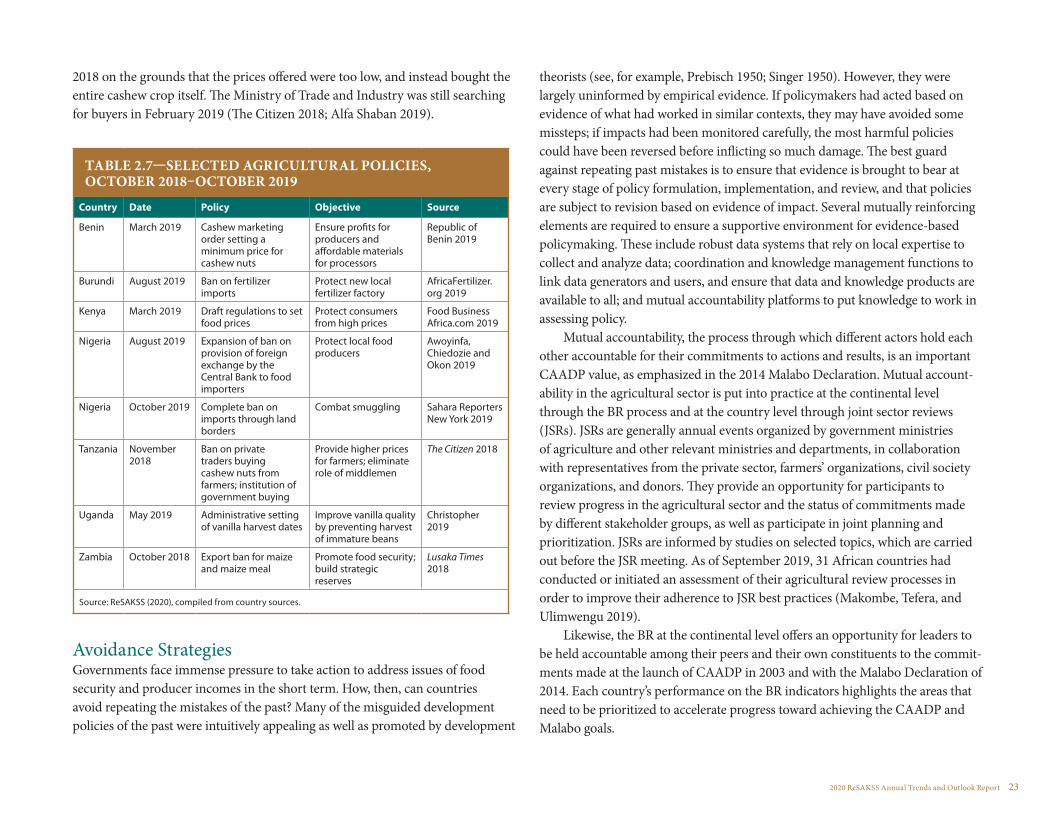
2020 ReSAKSS Annual Trends and Outlook Report 23
2018 on the grounds that the prices offered were too low, and instead bought the entire cashew crop itself. The Ministry of Trade and Industry was still searching for buyers in February 2019 (The Citizen 2018; Alfa Shaban 2019).
TABLE 2.7—SELECTED AGRICULTURAL POLICIES, OCTOBER 2018–OCTOBER 2019
Country Date Policy Objective Source
Benin March 2019 Cashew marketing order setting a minimum price for cashew nuts
Ensure profits for producers and affordable materials for processors
Republic of Benin 2019
Burundi August 2019 Ban on fertilizer imports
Protect new local fertilizer factory
AfricaFertilizer.org 2019
Kenya March 2019 Draft regulations to set food prices
Protect consumers from high prices
Food Business Africa.com 2019
Nigeria August 2019 Expansion of ban on provision of foreign exchange by the Central Bank to food importers
Protect local food producers
Awoyinfa, Chiedozie and Okon 2019
Nigeria October 2019 Complete ban on imports through land borders
Combat smuggling Sahara Reporters New York 2019
Tanzania November 2018
Ban on private traders buying cashew nuts from farmers; institution of government buying
Provide higher prices for farmers; eliminate role of middlemen
The Citizen 2018
Uganda May 2019 Administrative setting of vanilla harvest dates
Improve vanilla quality by preventing harvest of immature beans
Christopher 2019
Zambia October 2018 Export ban for maize and maize meal
Promote food security; build strategic reserves
Lusaka Times 2018
Source: ReSAKSS (2020), compiled from country sources.
Avoidance StrategiesGovernments face immense pressure to take action to address issues of food security and producer incomes in the short term. How, then, can countries avoid repeating the mistakes of the past? Many of the misguided development policies of the past were intuitively appealing as well as promoted by development
theorists (see, for example, Prebisch 1950; Singer 1950). However, they were largely uninformed by empirical evidence. If policymakers had acted based on evidence of what had worked in similar contexts, they may have avoided some missteps; if impacts had been monitored carefully, the most harmful policies could have been reversed before inflicting so much damage. The best guard against repeating past mistakes is to ensure that evidence is brought to bear at every stage of policy formulation, implementation, and review, and that policies are subject to revision based on evidence of impact. Several mutually reinforcing elements are required to ensure a supportive environment for evidence-based policymaking. These include robust data systems that rely on local expertise to collect and analyze data; coordination and knowledge management functions to link data generators and users, and ensure that data and knowledge products are available to all; and mutual accountability platforms to put knowledge to work in assessing policy.
Mutual accountability, the process through which different actors hold each other accountable for their commitments to actions and results, is an important CAADP value, as emphasized in the 2014 Malabo Declaration. Mutual account-ability in the agricultural sector is put into practice at the continental level through the BR process and at the country level through joint sector reviews (JSRs). JSRs are generally annual events organized by government ministries of agriculture and other relevant ministries and departments, in collaboration with representatives from the private sector, farmers’ organizations, civil society organizations, and donors. They provide an opportunity for participants to review progress in the agricultural sector and the status of commitments made by different stakeholder groups, as well as participate in joint planning and prioritization. JSRs are informed by studies on selected topics, which are carried out before the JSR meeting. As of September 2019, 31 African countries had conducted or initiated an assessment of their agricultural review processes in order to improve their adherence to JSR best practices (Makombe, Tefera, and Ulimwengu 2019).
Likewise, the BR at the continental level offers an opportunity for leaders to be held accountable among their peers and their own constituents to the commit-ments made at the launch of CAADP in 2003 and with the Malabo Declaration of 2014. Each country’s performance on the BR indicators highlights the areas that need to be prioritized to accelerate progress toward achieving the CAADP and Malabo goals.

24 resakss.org
Accountability platforms such as the JSR and BR are important for several reasons. First, they provide an essential opportunity for policies to be scrutinized, assessed, and potentially revised, based on perspectives from different groups that the policies affect in distinct ways. For example, Malawi’s JSR offered an oppor-tunity for nonstate actors to voice concerns about the country’s input subsidy program, which led to reforms to make the program more private sector–friendly (Makombe and Collins 2018). In addition, regular and robust accountability platforms build a culture of review and ensure sustained demand for evidence and knowledge, reinforcing the development of country data and knowledge management systems.
Future Policy Options for Transforming African EconomiesThe power of national policies to affect living conditions cannot be overstated, as demonstrated by Africa’s experience of economic decline and recovery in the decades since independence. Getting policies right is not easy—both long-term development goals and the pressure to respond to short-term needs can lead policymakers to adopt ineffective or harmful strategies. Leaders can draw lessons from previous decades on the importance of sound macroeconomic management and the elimination of distortionary sectoral policies. However, there will always be new challenges and opportunities that will require new responses, and a con-ducive policymaking environment is essential to help policymakers both avoid repeating past mistakes and ensure that new missteps are quickly recognized and addressed. New developments in Africa requiring innovative responses include rising opportunities for local agro-industries and risks from climate change and other shocks. In particular, novel shocks such as the COVID-19 pandemic that struck in 2020 further heighten the risk of policy reversal as countries take rapid actions to protect health and food security, sometimes pursuing policies that may prove counterproductive (for example, see Resnick 2020; Bouët and Laborde 2020). Evidence-based policymaking and rigorous and inclusive review as promoted under CAADP are essential to respond adequately to these new chal-lenges. Key emerging areas that policymakers need to address in the short term include agro-industrial policy, technology and innovation strategy, and social protection systems. We discuss each of these areas in turn.
Agro-industrial PolicyAfrica’s more affluent, urbanizing population is contributing to rapidly rising demand for food overall, and especially for higher-value perishable and pro-cessed foods. These developments present a major opportunity for domestic producers, if they are able to connect with urban markets. A subsector of micro and small firms has sprung up to process local staples and market them to urban consumers (Reardon 2015), but these firms face daunting constraints that largely prevent them from growing and increasing production and employment. These constraints include lack of energy, infrastructure, and skills and knowledge, and unstable access to the raw materials required (Hollinger and Staatz 2015).
Action to facilitate development of the emerging agro-processing sector is important both to capitalize on the potential of the large informal sector to contribute more strongly to economic growth, and to allow farmers to realize the benefits from increased productivity by connecting with urban consumers. At this stage governments should focus on improving transport, market, energy, and communications infrastructure in order to lower firms’ operating costs, and on increasing access to skills and knowledge through vocational training, particu-larly on management practices. As firms mature and grow, policymakers should pursue strategies including industrial zones with high-quality infrastructure, transfer of knowledge from abroad, access to credit, and an enabling regulatory environment, including protection of intellectual property (Sonobe and Otsuka 2011; Badiane and McMillan 2015).
Technology and Innovation PolicyTechnology and innovation policy is an important element of support to agro-industries as well as efforts to accelerate broader economic development. An enabling environment for technology development and adoption starts with enhancing national agriculture research systems (NARS), which are too often underfunded as well as poorly coordinated both internally and with counterparts in other countries (Roseboom and Flaherty 2016). Policymakers should facilitate strategic connections between public sector research and development institu-tions and the private sector so as to constitute a single innovation ecosystem, with the public and private sectors playing complementary roles in developing, scaling up, and disseminating innovations (Badiane and Collins 2020). Skills develop-ment and upgrading is required at all levels, from farmers to policymakers to the

2020 ReSAKSS Annual Trends and Outlook Report 25
youth who will constitute the next generation of innovators. Areas of particular need are agricultural extension services, agricultural technical and vocational education and training programs, and undergraduate and graduate programs in agricultural sciences. Skills development initiatives and NARS should place a high priority on new and emerging technologies, including biotechnology and digital technologies, both of which have the potential to significantly increase agricultural productivity.
Technologies to generate and deliver energy are also urgently needed. Africa faces the highest costs of electricity provision in the world, and large shares of the population, particularly in rural areas, remain unconnected to energy grids. Policymakers should explore promising off-grid and mini-grid solutions that could meet the needs of farmers, agro-industries, and households in remote areas (Malabo Montpellier Panel 2019).
Productive Social Protection PoliciesClimate change represents a wide-ranging and severe challenge to African agriculture, and threatens recent progress in increasing productivity and reducing poverty and hunger. A range of policy responses will be required to address the effects of climate change on production and livelihoods.3 One key intervention will be the scaling up of social protection programs, which are vitally important to protect assets in the face of climate-related and other shocks. The effects of the COVID-19 pandemic on employment and poverty, both in Africa and across the world, have underlined the importance of safety nets to ensure well-being in the face of unexpected crises. Social protection policies also ensure that growth is inclusive by supporting the welfare of populations otherwise left behind.
Program design should be based on careful reviews of evidence from effec-tive programs in similar contexts, and must be subject to review and revision (Berhane and Hirvonen 2018). The objectives of social protection programs should be coherent with other development goals, including strategies in the agricultural sector. Social protection programs that contribute to increasing agricultural labor productivity are especially effective at helping to reduce poverty in the longer term (Makombe, Tefera, and Benin 2018).
3 Evidence on climate-smart agriculture policies and practices is summarized in De Pinto and Ulimwengu (2017).
Way ForwardAfrica’s experience has shown that the quality of policymaking has serious consequences for people’s welfare and livelihoods. After decades spent searching for successful policies, during which standards of living declined and poverty rose, Africa has finally begun to realize the potential of its agriculture sector. Policy renewal efforts, increasing prioritization of agriculture, and recognition of the importance of evidence to inform policies have improved the quality of policymaking and led to economic and agricultural recovery. However, there are alarming signs that some African countries are increasingly returning to policies that show unsustainable levels of public control over agricultural sector opera-tions. At the same time, policymakers are called upon to respond to new and emerging issues and opportunities. The best tools to ensure that policies not only avoid past mistakes but also overcome new challenges are a renewed focus on the use of evidence to inform policies and the practice of accountability and review to assess policy effectiveness.

26 resakss.org
CHAPTER 3
Seed Policies and Regulatory Reforms
David Spielman
2020 ReSAKSS Annual Trends and Outlook Report 27
D iscussion about agricultural growth and transformation in Africa south of the Sahara often begins with seed—that mechanism of biological wonderment that feeds families, farms, cities, and nations.
There is a wealth of evidence indicating that where farmers have adopted new cultivars, the gains to yields and incomes have often been significant, albeit with considerable variation across countries, crops, agroecologies, and markets.
The policy environment in Africa greatly influences the production and use of improved cultivars and quality seed,1 and the associated improvements in productivity, incomes, and livelihoods. During the past decade, many countries have pursued wide-ranging policy and regulatory reforms to strengthen the systems and markets though which cultivars and seed are ultimately delivered to farmers.
But are these policy reforms giving sufficient attention to the complexities and nuances that are required to build robust and sustainable seed systems in Africa? And are these reforms sufficiently cognizant of the needs of the small-scale, resource-poor farmers who represent the vast majority of agricultural producers in Africa south of the Sahara, and who often cultivate a diverse mix of crops on their farms?
Until recently, there was relatively little data to systematically track the flow of new cultivars from breeding programs and research stations to farmers’ fields, or to monitor seed sector development and performance (Spielman and Kennedy 2016). Only in the last several years have governments, donors, and researchers made efforts to improve the metrics, data, and analysis on these issues. This shift has led to a number of innovative measurement tools and better evidence on the prevalence and impact of new cultivars and quality seed in farmers’ fields and lives.
For example, several recent initiatives brought new data from surveys of farm households and experts to motivate greater analysis of the patterns, trends, correlates, and determinants of cultivar adoption. The Living Standards Measurement Survey–Integrated Surveys on Agriculture (LSMS-ISA) by the World Bank and Food and Agriculture Organization of the United Nations, and CGIAR’s Diffusion and Impact of Improved Varieties in Africa (DIIVA) highlight this growth in new data sources, as do the analyses that make intensive
1 For simplicity, we use the term “seed” in this chapter to describe any biological material used for the propagation of a cultivated species. This includes true biological seed of plants; asexually, clonally, or vegetatively propagated materials such as plant cuttings, buddings, or tubers; and even propagation materials used in poultry, livestock, and fish production.
use of their content (for example, Sheahan and Barrett 2017; Walker and Alwang 2015). Other studies assemble more bespoke data for similar analytical purposes (Rutsaert and Donovan 2020; Abate et al. 2017) or introduce new empirical methods—most notably the use of randomized controlled trials (Glennerster and Suri 2015)—to improve understanding of the impact of seed system development and improved cultivar adoption.
In the broadest terms, findings from these datasets and studies indicate that national research systems are releasing new cultivars more rapidly than in the 2000s, seed companies are playing a larger role in marketing new cultivars for selected crops, and awareness and adoption among farm households are often higher than conventionally suggested. While these generalizations mask impor-tant crop and country variations, they do highlight the fact that seed systems are evolving rapidly in Africa. That said, the policy, investment, and regulatory dimensions of seed system development remain an important and often over-looked topic in this growing body of work.
In this chapter, we explore how policies, programs, and regulations related to seed and genetic resources are evolving across Africa, and whether these changes have the potential to improve farmers’ access to improved cultivars and quality seed. We highlight several signs of progress in seed system development and identify challenges that still lie ahead. We also caution against a one-size-fits-all approach to seed system development and encourage a more thoughtful discourse on the myriad issues influencing the public policies that shape Africa’s seed systems, including the sensitive political economy issues that influence policies and practices in the seed systems and market development.
Seed Policies and Policy RegimesNowhere in the world does there exist a single, explicit policy that covers every aspect of a seed system. Rather, seed system policy is a tangle of laws, regula-tions, guidelines, programs, schemes, conventions, and investment choices that together shape the acquisition, production, and distribution of materials used for propagation purposes. And while we typically think of seed system policy primarily in terms of food or cash crop reproduction, these policies also pertain to the propagation of livestock, fisheries, and forestry.

28 resakss.org
And at the heart of most seed systems in Africa is, in fact, the absence of policy. By this we mean that farmers’ traditional practices of selecting, storing, sharing, and planting seed from their own fields exist irrespective of the princi-ples and actions of government. For certain crops and countries, these traditional practices may describe more than 95 percent of the seed system, including many of the root, tuber, and banana crops cultivated throughout Africa for both own consumption and sale in local markets. For other crops and countries, traditional practices may be absent, as in the case of high-value floriculture and horticulture production systems that signify the industrialization of agricultural systems. And for other crops and countries, traditional practices may be transitioning toward more market-oriented seed purchasing strategies, as is the case for many African countries where hybrid maize seed purchased each season provides farmers with substantial yield advantages over saved seed.
In an effort to treat seed “policy” more coherently, we define the term as the finite set of government principles and actions related to public research and development (R&D) investment priorities, varietal registration and release proce-dures, seed quality assurance regulations, taxes and subsidies on seed production and use, biodiversity conservation laws, international and regional trade agree-ments, and genetic resource policies. Taken together, these policies—coupled with the actors, relationships, and institutions that influence and are influenced by their execution—constitute what we might refer to as the comprehensive seed policy regime in a given country. We highlight some of the more important patterns, trends, and outlooks in selected seed policy regimes in Africa.
From Breeding to Cultivation: New Varieties, New ModalitiesPublic R&D spending represents one of the most important means of feeding a seed system with a continuous pipeline of products that farmers can experiment with and eventually adopt (or not). Since 2000, R&D spending in Africa has been recovering from a two-decade period of stagnation. Between 2000 and 2014, public research expenditures increased from $1.7 billion to $2.5 billion (measured in constant [2011] US dollars at purchasing power parity) in Africa south of the Sahara. But three-quarters of this growth was largely driven by just five countries—Ethiopia, Ghana, Nigeria, South Africa, and Uganda—where the size of the country’s agricultural sector and the emphasis that the country places on agricultural R&D spending are both significant in comparison to
other countries (Beintema and Stads 2017). For most other countries in Africa, the signs indicate slow growth or stagnation in spending. These figures, along-side studies of research systems reforms across the region, suggest that many countries are not allocating sufficient resources to breeding programs or are not organizing and managing their research and extension systems in a way that ensures a steady flow of new cultivars to drive seed system development.
And for many African countries, efforts to improve public research systems mean more than just securing greater levels of public funding. They also mean strengthening the organization and management of their research systems. Here, at least three priorities emerge: (1) improving countries’ ability to access the genetic material needed for breeding programs to identify and introduce traits adapted for new and emerging abiotic and biotic stresses, or for attributes preferred by consumers, processors, and other market actors; (2) investing in breeding methods and tools that shorten the time it takes to develop new culti-vars embodying these traits; and (3) reducing the regulatory hurdles required to test, register, and release new cultivars (Atlin, Cairns, and Das 2017; Spielman and Smale 2017; Buruchara et al. 2011).
But increasing the flow of new cultivars from breeding programs and national research systems does not necessarily imply that farmers will have new and better choices. Many new studies on seed systems in recent years have highlighted the importance of investigating seed supply chain dynamics, encour-aged by popular concerns about low-quality seed proliferating in local markets and allegations of counterfeit seed purveyed by unscrupulous traders. Uganda has been a lightning rod for this issue, resulting in several influential studies that, indeed, suggest the need for better management of the country’s seed system (Barriga and Fiala 2020; Bold et al. 2017; see also ISSD Uganda 2019). When coupled with the expressed need of governments and donors to better evaluate the impact of their investments in plant breeding, these supply chain issues have given rise to the use of increasingly low-cost genetic fingerprinting techniques to track adoption in farmers’ fields and at other points in the supply chain. Notable examples of this approach are studies by Wineman et al. (2020) on maize in Tanzania, Wossen et al. (2019) on cassava in Nigeria, Yirga et al. (2016) on maize and wheat in Ethiopia, and Maredia et al. (2016) on beans in Zambia and cassava in Ghana. All point to significant problems in supply chain management, begin-ning in research centers charged with maintaining breeder seed and continuing all the way down to the warehouses and shop floors of input dealers.

2020 ReSAKSS Annual Trends and Outlook Report 29
Partly in response to these emerging concerns and partly as a reflection of static seed policy regimes, strict regulations for assuring seed quality remain on the books throughout much of Africa. The regulations may vary from country to country, but there is no dearth of strict zero-tolerance thresholds for pests and disease, inspections of production fields and bagging facilities, and penalties for noncompliance that include fines and/or imprisonment. Laws in 23 African countries forbid trade in “unregulated” seed, setting a tone that is at odds with widespread de facto farmer practice for many crops (Herpers et al. 2017).
Kenya offers a useful case in point. Its seed policy regime dates back to the 1972 Seeds and Plant Varieties Act, augmented by a raft of associated regulations, guidelines, amendments, and revisions, the latest of which dates to 2016. The law states that seed certification is compulsory and the sale of uncertified seed is illegal. Specific standards are prescribed for key plant species and seed classes, and the regulation is implemented by a semiautonomous government agency, the Kenya Plant Health Inspectorate Service (KEPHIS). The seed policy regime, combined with KEPHIS’s proactive approach to quality assurance, has helped create a robust market for hybrid maize seed in the country. But the moment we step away from hybrid maize and consider quality control systems for other crops such as potato and sweet potato, the reality is far less vibrant and more highly dependent on farmer-saved seed, farmer-to-farmer exchanges of seed, and nongovernmental projects to train farmers in “clean” (but inherently illegal) seed production and distribution (Okello et al. 2017; Muthoni, Shimelis, and Melis 2013; Schulte-Geldermann, Gildemacher, and Struik 2012; Gildemacher et al. 2011). There is little evidence to suggest that a stricter or more effective regula-tory regime would necessarily encourage seed sector growth for crops other than maize, given the geographically dispersed, localized, and fragmented nature of these seed markets, and the bulky and perishable nature of the seed.
Uganda has taken a slightly different policy approach to encouraging seed sector growth for crops apart from maize. Although the country’s regulatory starting point was similar to Kenya’s, it deviated from a similar path by intro-ducing a new “quality declared seed” (QDS) standard in 2018 (Uganda, Ministry of Agriculture, Animal Husbandry and Fisheries 2018). In Kenya, this standard does not exist: only “certified” seed can be legally produced for sale to farmers. Yet a QDS standard is, effectively, a more pragmatic quality assurance system that caters to the technical and financial capabilities of small-scale seed entrepreneurs, farmer-based organizations, and other similar seed producers who are generally
informal, small-scale, and quasi-commercial in nature (FAO 2006). QDS stan-dards reduce barriers to entry in local seed markets and impose less-demanding quality thresholds, inspection procedures, and costs in a way that can promote a transition from fully informal systems to more integrated and professional farmer-led seed enterprises. QDS standards can be useful in increasing the number of seed providers available in otherwise fragmented markets, increasing the overall supply of quality seed, encouraging rural entrepreneurship in the seed sector, and ultimately creating the basis for a vibrant seed market where a more comprehensive seed certification system is too costly. While QDS standards favor certain types of crop reproductive biology (open/self-pollinating or vegetatively propagated crops rather than hybrids) and specific farming systems (smallholder systems characterized by highly localized and fragmented markets), they can create the basis for a vibrant seed market.
Projects are using QDS to promote women-led farmer organizations special-ized in bean seed production (see ISSD Uganda 2019). Neighboring Rwanda has a similar QDS standard that actually predates Uganda’s, but the country has yet to leverage it to encourage farmer participation and enterprise development in the seed system. In other countries such as Ghana and Nigeria, QDS approaches are implicit in projects designed to improve the quality of farmer-produced seed for crops such as cassava and yam, for which the costs of a formal seed certification system with armies of seed inspectors and low tolerance thresholds for diseases are prohibitive.
Unfortunately, QDS standards and similar farmer-focused approaches to quality assurance are still relatively rare in Africa. Moreover, there is an implicit tendency among breeders, regulators, and administrators to prefer stricter quality assurance systems—often reflecting a strong sense of paternalism over farmers or an aversion to risk at any level—irrespective of their impact on availability and price. Taken together, Africa’s regulatory experiences to date suggest the need for a fundamental rethink on seed quality assurance systems, not only at the national level but also within regional economic communities.
There is scope for more sensible approaches to regulation through alternative quality assurance systems that can be pursued in parallel or in combination with stricter regimes (see, for example, ISSD Uganda 2019; Joughin 2014Scoones and Thompson 2011). This may be the case, for example, when the crop and reproductive biology in question are not hybrid maize, but rather cassava stem cuttings, sweet potato vines, or banana suckers.

30 resakss.org
Input Subsidy Programs: In Need of Refinement?Subsidy programs have long been used to produce and distribute improved cultivars and seed to farmers in many African countries. Farmer-targeted sub-sidies include an array of schemes, from free seed packs, to discount vouchers redeemable at an input dealer’s shop, to rebates on the purchase of large seed consignments, to free seed distribution through social protection programs and emergency relief. Similarly, subsidies targeted to seed producers include special concessions on credit, transport, warehousing, land leasing, and equipment imports. All are popular ways of encouraging the acceleration of output and yield growth in agriculture, but not all are necessarily appropriate to building a vibrant and sustainable seed system and market.
All subsidy programs incur some cost to government that must be weighed against the social and economic benefits of improved cultivars and seed, but only rarely do subsidy programs take sufficient account of these costs and benefits. Findings from studies on input subsidy programs in Malawi and Zambia demonstrate the importance of such analysis (Chirwa and Dorward 2013; Mason and Ricker-Gilbert 2013; Mason and Smale 2013; Kassie et al. 2013; Holden and Fisher 2015). Taken together, these studies suggest very mixed outcomes at best, indicating that more up-front design thinking and better formative evaluation are required to ensure that input subsidies have favorable impacts on cultivar adoption and varietal turnover. And assuming that subsidy programs will remain a feature of the agricultural development landscape in Africa for the next decade, there is a need for in-depth analysis of the sources and types of cultivars included in these subsidy schemes, the spatial and temporal diversification of their use, and the role and impact of alternative subsidy mechanisms (Spielman and Smale 2017).
The Narrowing Space for Global Exchanges of Genetic ResourcesAdd to this complex situation the challenges facing African countries in navigating the rapidly changing landscape relating to the conservation, use, and exchange of genetic resources—specifically genetic resources for food and agriculture. Many African countries struggle to balance their biodiversity con-servation goals, as shaped by national policies aligned with the 1993 Convention
on Biological Diversity, with their commitments to share and exchange genetic resources for the common good under the 2004 International Treaty on Plant Genetic Resources for Food and Agriculture. Implicitly, this means ensuring that a country has policies in place to conserve genetic resources—natural capital in the form of biodiversity as well as improved cultivars resulting from farmer selec-tion over centuries—while also ensuring that it respects the rules and guidelines that govern how genetic resources are exchanged between countries to support genebanks and breeding programs.
In 2014, these twin goals gained considerable attention as countries began reshaping their biodiversity conservation and genetic resource policies in line with the Nagoya Protocol on Access to Genetic Resources and the Fair and Equitable Sharing of Benefits Arising from their Utilization to the Convention on Biological Diversity. The protocol establishes a mechanism for countries—especially countries in the Global South that are centers of genetic diversity—to be monetarily rewarded for their historic and continued conservation of genetic resources, although the changes also require the introduction of new and poten-tially more complex guidelines on international exchanges of genetic materials for use by genebanks and breeding programs.
As African countries reshape their policies in response to these global conventions and agreements, they must also contend with the continued extension of intellectual property rights into the agricultural space. This exten-sion is largely governed by national policies that aim for compliance with the International Union for the Protection of New Varieties of Plants, which provides the architecture for national laws and regulations that are consistent with the 1995 Trade-Related Aspects of Intellectual Property Rights agreement administered by the World Trade Organization. While intellectual property rights are central to the success of a rules-based global trading system, they can come into conflict within the gray area between the ownership of naturally occurring biodiversity or farmer-selected cultivars, on the one hand, and private breeding investments, on the other hand.
Not surprisingly, a growing body of evidence suggests that these policy and regulatory thickets may constrain scientific advancement through reductions in the global exchange of plant genetic resources (Jinnah and Jungcurt 2009; Welch, Shin, and Long 2013) or overly restrictive intellectual property rights regimes (De Jonge and Munyi 2017), forcing us to rethink the pathway from plant breeding in research centers to genetic gains in farmers’ fields (Spielman and Ma 2016) and
2020 ReSAKSS Annual Trends and Outlook Report 31
the associated incentives for investment in improved cultivars and seed system development (Naseem, Spielman, and Omamo 2010).
Regional Seed TradeThis international dimension to seed systems development also spills over into trade policy, most notably regional trade and economic blocs. Seed trade figures significantly in the language of Africa’s regional trade agreements, conventions, and communities such as the Common Market for Eastern and Southern Africa (COMESA), Economic Community of West African States (ECOWAS), and Southern African Development Community. Mechanisms for integrating regional seed trade include provisions that allow for the free and unfettered movement of seed; mutual recognition of approved varieties; and the harmoniza-tion of variety registration, seed certification, and other regulations between and among member states (Keyser et al. 2015). Progress in incorporating these trade provisions into national legislation has been slow in many countries, and in countries where the provisions exist, uneven implementation and enforcement is not common.
Biosafety Policies: A Continuing Source of UncertaintyIn far too many countries, there are still gaps in seed policy regimes. Too few countries have taken a definitive science-based approach to biosafety regulation that would allow for a more comprehensive assessment of the opportunities and risks associated with advanced technologies such as genetic modification, gene editing, and synthetic biology. To date, only three African countries south of the Sahara—South Africa Sudan, and Eswatini (also known as Swaziland)—are commercially cultivating genetically modified crops under credible and coherent biosafety legislation. At least ten other countries—Burkina Faso,2 Cameroon, Ethiopia, Ghana, Kenya, Malawi, Mozambique, Nigeria, Tanzania, and Uganda—are conducting confined field trials or laboratory research, or are moving toward commercial release (ISAAA 2018). But many countries, including several of those just listed, are suspended in political, legislative, or regulatory stasis, suggesting uncertainty in the way forward.
2 Burkina Faso commercialized GM cotton in 2008, but ceased cultivation in 2016. The country is currently testing new GM cotton varieties and traits, as well as other GM crops.
From Policy Design to ImplementationIt is also important to point out that even with a comprehensive policy regime in place, many African countries struggle to translate policy design into imple-mentation. This is partly due to the lack of clear implementation strategies and steps (for example, national seed plans) for the policies that have been enacted. Implementation failures can also be attributed to a lack of awareness of the trade-offs inherent in any policy change, for instance, between stricter seed quality assurance regulations and seed market growth; between an extension system focused on seed replacement and one focused on varietal turnover; or between a more open trade regime and domestic seed enterprise development (Spielman and Kennedy 2016). That said, new efforts have emerged to monitor the enabling policy environment across countries and over time, providing seed system actors—especially private entrepreneurs and investors—with a better sense of the opportunities offered by Africa’s emerging markets. Most notable are the reports and indices from the World Bank Group’s Enabling the Business of Agriculture initiative and The African Seed Access Index (TASAI).
Contested Narratives and the Political Economy of Seed Policy Change ProcessesFinally, it is important to recognize that Africa’s progress and pitfalls in seed system development are not the result of only benign or peripheral forces (Scoones and Thompson 2011). Actors and coalitions of actors with competing perspectives, interests, and resources are shaping seed policy change processes in each country and for each crop (for example, see Hassena, Hospes, and De Jonge [2016] and Alemu [2011] on Ethiopia). Political elites may leverage commercial seed sector development for political or financial gain regardless of its effect on the development of vibrant and competitive markets. Alternatively, these same elites may simply disregard the sector because there is no observable opportunity for such gains, leading to public underinvestment in the necessary enabling envi-ronment (for example, see Joughin [2014] on Uganda). Government ministries and agencies charged with boosting food production and private investment in the agriculture sector may be pitted against those mandated to protect biodi-versity and the environment. International development organizations, bilateral
32 resakss.org
donors, charitable foundations, and their implementation partners may support specific narratives with project funding, commercial ventures, and heavy rhetoric depending on the interests of their own constituencies or leadership. Civil society and private industry similarly advance their preferred narratives and undertake projects to promote competing visions of African agriculture (for example, see Amanor [2012] on Ghana and Odame and Muange [2011] on Kenya). While competition in ideas is central to the development process, the inequality in resources that translate ideas into action should be of concern for African self-determination in this particular space.
Another political economy concern in these processes is the frequent absence of a key stakeholder: the farmer, especially the small-scale, resource-poor farmer. Among other factors, farmers’ voices are limited by their exclusion from formal decision-making bodies and processes on legal and regulatory issues; weak repre-sentation by farmer and peasant associations that are captured by political elites; the absence of market intelligence mechanisms to identify the heterogeneous needs of farmers; and a lack of open and transparent consultations that provide a vehicle for conveying the distinct and heterogeneous needs of farmers to both public and private decision-makers.
ConclusionSeed systems and markets are central to national and regional efforts to accelerate agricultural productivity growth, promote transformative structural change, and improve livelihoods in Africa south of the Sahara. Recent seed policy reforms have introduced new regulations, programs, and opportunities for a diverse set of seed system actors: private companies, farmer-based organizations, regulators, and researchers. Yet many complex challenges remain. There is a need to continu-ously redefine the roles of the public and private sectors as they jostle for space in emerging seed markets. There is much to be done to better integrate informal and formal seed systems, thereby ensuring that farmers benefit from improved cultivars emerging from breeding programs, providing industry with new opportunities for market growth, and allowing government to extend its regula-tory reach in support of farmers and rural entrepreneurs. There is a further need to consider “seed” on a very crop- and context-specific basis, recognizing that
a single policy and regulatory system covering all commodities is insufficiently responsive to the uniqueness of each crop’s reproductive biology. Most of all, as African countries deepen their policy reform initiatives, greater effort is needed to ensure that policy change processes engender trust and cooperation between farmers, seed companies, regulatory agencies, and other stakeholders, and that national policies are harmonized with regional and global agreements that aim to benefit these same stakeholders.

2020 ReSAKSS Annual Trends and Outlook Report 33
CHAPTER 4 Fertilizer Policies and Implications for African Agriculture
Gashaw T. Abate, Kibrom A. Abay, and David Spielman

34 resakss.org
Agricultural productivity growth has long been recognized as an important instrument to reduce poverty, generate nonfarm employment, and hence trigger structural transformation processes
(see, for example, Timmer 1997; Fan, Hazell, Thorat 1999; Johnson 2000; and Mellor 2000). A central element in increasing agricultural productivity is the adoption of improved inputs, especially improved cultivars and inorganic fertilizer (Rosegrant and Evenson 1992; Ruttan 2002; Evenson and Gollin 2003). When combined with irrigation and improved management practices, these inputs can dramatically enhance yields and the overall returns to farming (see, for example, Evenson 2001).
While the productivity gains of improved input use and its economywide impacts on economic growth and poverty reduction were realized in many parts of Asia beginning in the 1960s, few African countries have enjoyed similar gains. In particular, relatively fewer African farmers have substantially increased their use of improved cultivars or inorganic fertilizers (see, for example, Crawford et al. 2003; Henao and Baanate 2006; Morris et al. 2007; AGRA 2019). This should not imply that farmers are unaware of such inputs and their impacts: there is considerable evidence to indicate that farmers understand how to use improved cultivars and inorganic fertilizer (Sheahan and Barrett 2017), and there is considerable experience to suggest that widespread use can enhance productivity growth under the right conditions (Jayne et al. 2003; Rashid et al. 2013).
But overall, the use rates of these improved inputs remain low throughout much of Africa, particularly for inorganic fertilizer, which is the focus of this chapter. For instance, in 2017, the aggregate application of nutrients (that is, nitrogen, phosphate, and potassium) on the total cropland of the continent was estimated at 23 kilograms per hectare, which is about eightfold lower than the application rates in Asia during the same year (FAO 2020). Several factors explain the low use of fertilizer and other productivity-enhancing improved inputs in the region, including market imperfections, risk and uncertainty, credit constraints, farm size, low yield response, and behavioral factors (Marenya and Barrett 2009; Foster and Rosenzweig 2010; Duflo, Kremer, and Robinson 2011; Suri 2011).
In response to the low adoption of improved inputs, African governments have pursued various fertilizer promotion policies and programs. These initia-tives range from state-controlled procurement and distribution systems to wholly private sector–led systems. This chapter reviews the pros and cons of some of these polices and their implications for fertilizer use and agricultural productivity.
We also review general trends in fertilizer consumption and application rates, marginal returns to fertilizer use, trends in tailored recommendations for nutrients based on soil tests, and emerging concerns regarding unbalanced use of fertilizer in fragile regions of the continent.
A Global and Continental Angle on Fertilizer Polices in AfricaThe need to boost agricultural production and low fertilizer use rates has induced calls for African governments to take more concrete policy actions. For instance, under the Comprehensive Africa Agriculture Development Programme (CAADP), African governments committed to doubling agricultural productivity by focusing on the provision of improved inputs. African policymakers came together in 2006 at the Africa Fertilizer Summit in Abuja, Nigeria, and declared fertilizer a strategic commodity and resolved that African Union member states should promote the use of fertilizer via targeted subsidies (AUC 2006). The Abuja Declaration specifically called for member states to increase their fertilizer consumption to 50 kilograms per hectare by 2015 from 8 kilograms per hectare in 2006 (AUC 2006). The declaration also set forth 10 additional resolutions that identify interventions to be carried out at the regional and country levels to help achieve this target, for example, establishment of policy and regulatory frame-works, introducing targeted subsidies, and improving access to complementary inputs.
This declaration was followed by the Malabo Declaration on Accelerated Agricultural Growth and Transformation for Shared Prosperity and Improved Livelihoods, committed to by African heads of state at the marking of the 10th anniversary of CAADP. The Malabo Declaration affirmed the need to improve access to quality and affordable modern inputs through the provision of “smart” protection—subsidies that are carefully targeted and managed—to smallholder agriculture (AUC 2014).
While these declarations continue to be instrumental in providing over-arching frameworks for fertilizer promotion on the continent, their impacts, as measured by the progress made thus far on the specific resolutions and commit-ments, remain mixed. For instance, the declarations inspired some countries to update or reformulate their fertilizer polices and regulations (for example, Burkina Faso, Ghana, Kenya, Mali, Mozambique, Rwanda, Tanzania, Uganda, and Zambia), but there are still many countries in Africa that do not have a
2020 ReSAKSS Annual Trends and Outlook Report 35
coherent fertilizer policy and, instead, rely on decrees and ad hoc guidelines or statements. Likewise, substantial improvements in fertilizer use, both in total consumption and in application rates, have been made since the Abuja Declaration, but current levels are still remarkably low, lag far behind targets, and vary considerably across countries (AUC 2006; Sheahan and Barrett 2017; FAO 2020). Progress toward meeting the other Abuja resolutions is inadequate, except in the areas of fertilizer production and trade promotion, reducing the distance traveled to purchase fertilizer, and provision of subsidies for smallholder farmers (AGRA 2019).
Sandwiched between the Abuja and Malabo Declarations was what may have been the most important political driver of fertilizer policy in Africa today: the 2007–2008 food price crisis. The crisis reinvigorated the case for state involve-ment in fertilizer procurement, distribution, and pricing. When global prices for agricultural commodities—including food staples—skyrocketed during the crisis, many policymakers turned to fertilizer subsidies as a means of quickly increasing domestic food production (Jayne and Rashid 2013; Resnick and Mather 2016).
Regional Initiatives on Fertilizer Policy and Markets in AfricaCAADP, the Abuja and Malabo Declarations, and the food price crisis both inspired and built upon regional initiatives in Africa that were similarly designed to increase fertilizer use among farmers. Policy initiatives at inter- and intra-regional levels have focused primarily on the implementation of two specific resolutions contained in the Abuja Declaration: (1) the harmonization of fertilizer polices and regulations and (2) the promotion of national/regional fertilizer production and intraregional trade. Some notable initiatives include the following (AGRA 2019).
In 2012, the Economic Community of West African States (ECOWAS) adopted protocols for the harmonization of fertilizer polices and regulations. ECOWAS, through its specialist agency, the Regional Agricultural Investment Plan for Food Security and Nutrition, adopted harmonized input subsidy policies across member states.
The East African Community (EAC) made similar advances in 2014, when it adopted a harmonized regulatory framework and procedures for fertilizer markets. The bloc also reviewed existing policies, standards, legislation, and
regulations and finally developed guidelines on how harmonization of fertilizer policies and regulatory frameworks should be undertaken in the EAC.
In 2014, the Common Market for Eastern and Southern Africa (COMESA) and its agency, the Alliance for Commodity Trade in Eastern and Southern Africa, launched a Joint Program on Fertilizer Policy and Regulatory Harmonization in partnership with the African Fertilizer and Agribusiness Partnership. The program intends to harmonize fertilizer policies and fertil-izer financing mechanisms. Relatedly, the Southern African Development Community (SADC) assessed fertilizer production opportunities in the region in 2010 in collaboration with the International Fertilizer Development Center and recommended regional harmonization of fertilizer standards.
There is also a tripartite initiative among regional economic communities and unions on harmonization of fertilizer polices and regulations and promo-tion of interregional fertilizer trade. However, the main shortfall with regard to regional initiatives is implementation. For instance, according to the Abuja Declaration scorecard, while good progress has been made on fertilizer produc-tion and trade, harmonization of polices and regulations is rated as unsatisfactory (AGRA 2019). Regional economic communities can play a crucial role in advancing the existing initiatives through inducing political commitment among member states.
Fertilizer Promotion Polices in Practice: Mixed Evidence of SuccessIn response to these global, continental, and regional initiatives, a number of African countries have further refined their policy approaches to fertilizer procurement, distribution, and pricing. Some have abandoned state-led fertilizer polices and adopted deep market reform policies, while others have returned to universal subsidies and state-led distribution (Druilhe and Barreiro-Hurlé 2012). A prominent example of the latter is the universal fertilizer subsidy programs in Malawi (Levy 2005; Minot and Benson 2009; Jayne et al. 2018). Although policy changes in some countries suggested that governments were learning from experience and adapting policy to emerging evidence, changes in many other countries were motivated primarily by political exigencies.
Despite this mixed record of progress, a clear typology of fertilizer policy regimes has emerged across Africa. Two broad categories of policies intended to

36 resakss.org
incentivize fertilizer use are noteworthy. The first is state-led fertilizer marketing polices, which are closely associated with universal or near-universal subsidies on fertilizer price. These policies place the state at the center of fertilizer procure-ment, pricing, and distribution, and were common in many African countries from the 1960s to the early 1980s. While there is evidence of increased fertilizer use among farmers, especially in the later years of this period (Eicher 1995; Byerlee and Eicher 1997), the design and implementation of these policies came with high fiscal costs, market-distorting effects, and rent-seeking behavior (Jayne and Jones1997; Morris et al. 2007; Yamano and Arai 2010).
The second category of policies introduced more market-led fertilizer procurement and distribution mechanisms and followed from the structural adjustment programs that many African governments signed on to in the 1980s and 1990s. As these reforms varied across countries in terms of depth, breadth, sophistication, and level of implementation, results were unsurprisingly mixed and often controversial (Jayne et al. 2002, 2003; Minot and Benson 2009).
More important than the question of how to design and implement fertilizer policies in Africa is the emerging evidence on why such policies are insufficient to achieve agricultural productivity growth and its associated gains. Evidence has accumulated in the past decade to suggest that fertilizer subsidies alone are not sufficiently effective to increase the supply of food staples without complementary policies related to investment in roads, irrigation, and other rural infrastructure. In particular, investments in the development of agricultural commodity markets; improvement in extension services and the promotion of integrated soil fertility management practices; encouragement of private sector participation in commercial fertilizer markets; and other policies related to taxes, tariffs, and trade are necessary complements to most subsidy programs.
This immediately suggests that African governments cannot achieve their goals for productivity growth by simply tallying higher figures on volumes of fertilizer distributed or public funds allocated to fertilizer distribution. Rather, governments will need to take the much more challenging, long-term path of investing in crop breeding and agronomy programs, irrigation develop-ment, soil testing, and extension services to educate farmers about soil fertility management practices and the adoption of complementary inputs to increase fertilizer response rates and profitability. While there are examples of best
1 See Jayne et al. (2018) and Holden (2019) for a detailed discussion on the effects of fertilizer subsidy programs on fertilizer use, productivity, and related outcomes in Africa. These studies cover recent innovations and types of subsidies (for example, e-vouchers).
practices for public investment in these areas—African centers of breeding excellence, high-resolution soil mapping and testing programs, large-scale extension services—much more investment is still required. For instance, public agricultural research spending as a share of agricultural gross domestic product (GDP) was only 0.39 percent in Africa south of the Sahara in 2016, far below the minimum investment target of 1 percent of agricultural GDP recommended by the African Union and the United Nations (ASTI 2020).
Another important question relates to the absence of effective fertilizer policy in many countries. While most African countries have a wide variety of fertilizer polices, only about one-third have formal fertilizer policies specifically designed to regulate the sector. Instead of standard regulations, many governments use decrees or ad hoc guidelines, which are subject to frequent changes that create uncertain-ties and thereby disincentivize private sector participation (AGRA 2019). Studies also show that fertilizer polices and legislation in most African countries are (1) outdated and thus insufficient or inappropriate to regulate new fertilizer products and production technologies; (2) generic and include provisions about other agricultural inputs, and as a result lack important details; and (3) characterized by inadequate enforcement (IFDC 2015). Several countries have taken significant steps to reformulate and update their fertilizer policies and regulations, including Burkina Faso, Ghana, Kenya, Mali, Mozambique, Rwanda, Tanzania, Uganda, and Zambia (AGRA 2019). But more evidence will be needed to determine whether these reformulations and updates will have the desired effects on fertilizer use by farmers and, more specifically, among those farmers who stand to gain the most and contribute most significantly to productivity growth.
While reviewing the impact of each and every national policy on fertilizer use is beyond the scope of this chapter, we attempt to assess the types and effects of the most commonly used policy instrument in Africa: fertilizer subsidies.1 Table 4.1 presents the types of subsidy policies adopted by select African coun-tries, the cost of the input subsidy as a share of public spending on agriculture, and the growth in fertilizer consumption and application rates during the period 2006 to 2017. These figures—though dependent on highly aggregated figures from FAOSTAT and insensitive to heterogeneity across crops, farm-household types, farming systems, market conditions, and agroecological context—suggest no particularly close relationship between the type or share of expenditure on

2020 ReSAKSS Annual Trends and Outlook Report 37
input subsidies and growth in fertilizer consumption and application rates. 2 Yet the figures in Table 4.1 also suggest that fertilizer subsidies—regardless of how effective they might be—have major implications for national budgets. On average, fertilizer and input subsidies in Africa amounted to about 14–26 percent of the national budget allocated for agriculture during 2011–2014 (Jayne et al. 2018).
TABLE 4.1—INPUT SUBSIDY POLICIES AND FERTILIZER USE GROWTH RATES, SELECTED AFRICAN COUNTRIES
Type of input subsidy Country
Input subsidy cost as a share
of public agricultural
spending (%, 2014)
Fertilizer consumption
growth rate (%, 2006–2017)
Average fertilizer
application growth rate
(%, 2006–2017)
Universal subsidy
Burkina Faso 13.8 6.0 4.0
Ghanaa NA 11.0 10.0
Mali 9.0 25.0 24.0
Nigeria 10.8 17.0 17.0
Senegal 9.2 30.0 27.0
Targeted subsidy
Côte d’Ivoire NA 14.0 12.0
Kenya 16.1 0.0 -1.0
Malawi 44.5 1.0 0.0
Tanzania 12.8 13.0 10.0
Zambia 19.9 14.0 12.0
Other type of subsidyb Ethiopia 19.9 14.0 12.0
Source: FAO (2020).Note: Fertilizer consumption is based on the amount used in agriculture (that is, agricultural use). The types and costs of input subsidy are adapted from Jayne et al. (2018). a For Ghana, the cost of the input subsidy as a percentage share of public agricultural spending was 31.6 in 2013. b As indicated in Jayne et al. (2018), the Ethiopian government does not consider public spending related to fertilizer procurement and distribution as a subsidy. NA = not available.
2 Consumption refers to the total amount of fertilizer nutrients (that is, nitrogen, phosphate, and potassium) used in agriculture. Application refers to the amount of fertilizer nutrients used per hectare of cropland.
The Returns to Fertilizer UseGiven cross-country variations in fertilizer policy and fertilizer use, it is impor-tant to think more closely about the heterogeneity in application rates and returns in any analysis of fertilizer (for example, Duflo, Kremer, and Robinson 2008, 2011; Minot and Benson 2009; Minten, Koru, and Stifel 2013; Rashid et al. 2013; Sheahan and Barrett 2017; Binswanger-Mkhize and Savastano 2017; Abay et al. 2018). Absolute consumption of fertilizer and application rates per hectare of cropland in Africa lag significantly behind other regions of the world. For instance, in 2017, the continent accounted for only 3.3 percent of global fertilizer used in agriculture (Figure 4.1 and Figure A4.1 in the appendix). This has been the case over the last two decades (Figure A4.2 in the appendix). However, aggre-gate fertilizer consumption has not declined in Africa. On the contrary, fertilizer use on the continent rose from 4.1 million metric tons in 2002 to 6.5 million metric tons in 2017 (Figure A4.2 in the appendix). This represents a 3.5 percent annual growth rate over that period, on average. As one would expect, disag-gregated analysis at (selected) country levels indicates that fertilizer consumption varies significantly across countries. Countries with major shares of fertilizer consumption on the continent include Ethiopia, Kenya, Malawi, Mali, Nigeria, and South Africa (Figure A4.2 in the appendix).
The average fertilizer application rate per hectare of cropland has also been growing over the last two decades in Africa, but at a lower rate than that of absolute consumption (partly because cropland on the continent also increased during the same period). Fertilizer application rates increased from 17.7 kilo-grams of nutrients per hectare of cropland in 2002 to 23.3 kilograms of nutrients per hectare of cropland in 2017. This represents a 2 percent annual growth rate over that period, on average. Again, disaggregated analysis at the country level shows that while application rates overall are low compared to those in other parts of the world, they are not uniformly low across countries. For instance, application rates are relatively higher in Kenya, Mali, Malawi, and Zambia (Figure 4.2). Application rates are also variable across regions (production zones), crops, and households within a country (Jayne and Rashid 2013; Sheahan and Barrett 2017). The aggregate application rates shown in Figure 4.2 are roughly

38 resakss.org
comparable to the micro-level application rates obtained from household surveys (for example, Sheahan and Barrett 2017).
Many socioeconomic and behavioral factors contribute to the low adoption and application rates of fertilizer in Africa, some of which are surmountable with the deployment of appropriate public policies and investments. The most common factors are related to market imperfections (Moser and Barret 2006; Giné and Yang 2009; Foster and Rosenzweig 2010; Duflo, Kremer, and Robinson 2011; Minten, Koru, and Stifel 2013), risks and uncertainty (Kelly and Crawford 2007), and low marginal returns to fertilizer use (Marenya and Barrett 2009; Burke et al. 2017; Liverpool-Tasie 2017; Suri 2011).
The first and best-understood constraint relates to access and supply-related factors. Access and availability of fertilizer continues to be a major factor in the low adoption and application rates of fertilizer in most African countries.
Fertilizer is either not available at all or not supplied at the right time and place and in the right formula-tion (see, for example Croppenstedt, Demeke, and Meschi 2003; Davis et al. 2010; Spielman, Kelemwork, and Alemu 2012). Supply constraints are often linked with poor infrastructure and an unfavorable policy and business environment for private sector participation (Kelly and Crawford 2007; Minten, Koru, and Stifel 2013).
Liquidity and credit constraints are also widely documented in studies on fertilizer and fertilizer policy. Fertilizer application involves significant costs for the purchase of the product itself and its transportation to the farm. For most farmers this requires that they have cash on hand, assets that can be liquidated into cash, or access to credit. However, most smallholder farmers in Africa have few, if any, of these resources: cash is often difficult to accumulate and retain, asset liquidation may be immiserating, and credit may be in short supply due to underdeveloped rural capital markets and financial services (Croppenstedt, Demeke, and Meschi 2003; Moser and Barrett 2006; Dercon and Christiaensen 2011; Karlan et al. 2014).
Even where liquidity or credit constraints are lifted, the high cost of fertilizer may make it simply unaffordable to the farmer. African farmers pay the highest price for fertilizer anywhere in the world. Last-mile fertilizer prices are higher in Africa due to high transaction (logistic and transportation) costs that mainly emanate from poor road and storage infrastructure and long distances from ports to production areas (Kelly and Crawford 2007; Minten, Koru, and Stifel 2013; AGRA 2019). Reductions in transportation costs as a result of improved road infrastructure can reduce fertilizer prices and lift the output–to–fertilizer price ratio to a level that makes higher fertilizer application profitable (Minten, Koru, and Stifel 2013; Liverpool-Tasie 2017).
Because of these costs, several studies show that higher fertilizer prices coupled with low output prices make fertilizer use unprofitable in some African
FIGURE 4.1—FERTILIZER CONSUMPTION AND APPLICATION RATE BY REGION (2017)
23
9581
135
185
123
0
20
40
60
80
100
120
140
160
180
200
0
50,000
100,000
150,000
200,000
250,000
Africa Oceania Europe Americas Asia World
Kilo
gram
s of
fert
ilize
r nut
rient
s pe
r he
ctar
e of
cro
plan
d
Qua
ntiti
es (i
n '0
00 m
etric
tons
)
Consumption (agricultural use) Application rate (kg/ha)
Source: FAO (2020).
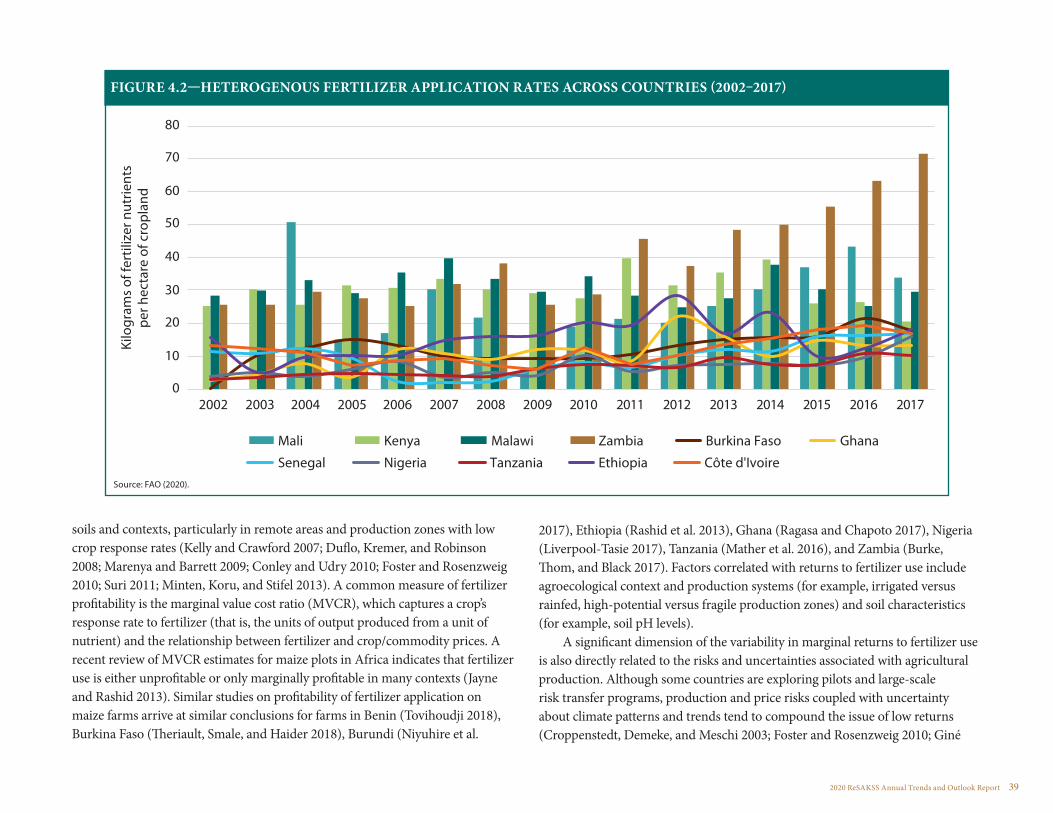
2020 ReSAKSS Annual Trends and Outlook Report 39
soils and contexts, particularly in remote areas and production zones with low crop response rates (Kelly and Crawford 2007; Duflo, Kremer, and Robinson 2008; Marenya and Barrett 2009; Conley and Udry 2010; Foster and Rosenzweig 2010; Suri 2011; Minten, Koru, and Stifel 2013). A common measure of fertilizer profitability is the marginal value cost ratio (MVCR), which captures a crop’s response rate to fertilizer (that is, the units of output produced from a unit of nutrient) and the relationship between fertilizer and crop/commodity prices. A recent review of MVCR estimates for maize plots in Africa indicates that fertilizer use is either unprofitable or only marginally profitable in many contexts (Jayne and Rashid 2013). Similar studies on profitability of fertilizer application on maize farms arrive at similar conclusions for farms in Benin (Tovihoudji 2018), Burkina Faso (Theriault, Smale, and Haider 2018), Burundi (Niyuhire et al.
2017), Ethiopia (Rashid et al. 2013), Ghana (Ragasa and Chapoto 2017), Nigeria (Liverpool-Tasie 2017), Tanzania (Mather et al. 2016), and Zambia (Burke, Thom, and Black 2017). Factors correlated with returns to fertilizer use include agroecological context and production systems (for example, irrigated versus rainfed, high-potential versus fragile production zones) and soil characteristics (for example, soil pH levels).
A significant dimension of the variability in marginal returns to fertilizer use is also directly related to the risks and uncertainties associated with agricultural production. Although some countries are exploring pilots and large-scale risk transfer programs, production and price risks coupled with uncertainty about climate patterns and trends tend to compound the issue of low returns (Croppenstedt, Demeke, and Meschi 2003; Foster and Rosenzweig 2010; Giné
FIGURE 4.2—HETEROGENOUS FERTILIZER APPLICATION RATES ACROSS COUNTRIES (2002–2017)
0
10
20
30
40
50
60
70
80
2002 2003 2004 2005 2006 2007 2008 2009 2010 2011 2012 2013 2014 2015 2016 2017
Kilo
gram
s of
fert
ilize
r nut
rient
s pe
r hec
tare
of c
ropl
and
Mali Kenya Malawi Zambia Burkina Faso Ghana
Senegal Nigeria Tanzania Ethiopia Côte d'IvoireSource: FAO (2020).

40 resakss.org
and Yang 2009; Dercon and Christiaensen 2011). And when combined with the fact that many farmers have limited access to extension services and thus the agronomic knowledge and skills needed to use fertilizer efficiently, it should not be surprising that low use rates and returns are such a prominent part of the African agricultural narrative (see, for example, Kelly and Crawford 2007; Krishnan and Patnam 2014; Jayne et al. 2018).
More recently, evolving research has also turned its attention to other, more behavioral factors limiting fertilizer adoption in Africa. These factors include information asymmetries affecting farmers’ perceptions that the fertilizer they purchase is low quality or counterfeited (see, for example, Bold et al. 2017; Fairbairn 2017), though this situation may not be as widespread as claimed; present-biased behavior that makes it difficult to save for bulky fertilizer purchases (Duflo, Kremer, and Robinson 2011); and other behavioral and psychological explanations such as aspiration failures (Abay, Blalock, and Berhane 2017; Taffesse and Tadesse 2017). These perspectives may not only explain low fertilizer use rates but also suggest that farmers switch back and forth between using and not using fertilizer across seasons in response to new information about marginal returns, for example, information on expected yield response, fertilizer price, and output price (Duflo, Kremer, and Robinson 2008; Conley and Udry 2010; Suri 2011).
Soils, Nutrients, and Fertilizers: Returning to First PrinciplesReturning to first principles, the economic and behavioral dimensions of fertil-izer use and adoption may depend on how we answer basic scientific questions relating to soils and agronomy. Jayne and Rashid (2013) show a constant trend of cereal output–to–fertilizer price ratios over a 20-year period (1990–2012) in several African countries and suggest that changes in returns to fertilizer use and profitability may be driven primarily by crop-specific fertilizer response rates. Efforts to sustainably increase fertilizer response rates hinge on the type of cultivar, the production system and agroecology, soil characteristics, and man-agement practices (Marenya and Barrett 2009; Tittonell and Giller 2013).
Several studies show that heterogeneity in the returns to fertilizer use in Africa can be explained by soil type (for example, Duflo, Kremer, and Robinson 2008; Marenya and Barrett 2009; Suri 2011; Burke, Thom, and Black 2017). For instance, some studies find that low soil fertility and soil acidity can render
inorganic fertilizers unprofitable (Marenya and Barrett 2009; Burke, Thom, and Black 2017). These studies relate the heterogenous adoption of inorganic fertilizers across households and plots to soil properties. This is consistent with well-established agronomic literature showing that yield responses to fertilizers depend heavily on soil nutrient requirements and farmers’ response to these nutrient requirements (for example, Tittonell et al. 2008; Kihara et al. 2016). Different types and brands of chemical fertilizers contain varying types and levels of nutrients, which implies that the profitability of these fertilizers would depend on specific soil nutrient requirements and associated applications. However, a substantial share of fertilizer applied on African soil is nitrogen (Sheahan and Barrett 2017; FAO 2020).
In most cases, objective measures of soil properties and associated agro-nomic requirements are not easily available to and accessible by smallholders in Africa. Traditional soil tests are usually expensive and inaccessible to smallholder farmers in most of Africa, and the tests that do exist are not at high spatial resolu-tion (Gourlay et al. 2017). This implies that farmers lack accurate knowledge about the properties and nutrient requirements of their soil. Furthermore, these soil nutrient requirements are expected to vary significantly across communi-ties, which limits farmers’ ability to learn about their soils (Tjernstrom 2017). In the presence of significant spatial and plot-level variability in soil properties, the usually generic and “blanket” fertilizer recommendations in many African countries are less relevant to many farmers (see, for example, Jayne et al. 2002, 2003). Indeed, as farmers become aware that agronomic recommendations are not site-specific and fertilizer types available in local markets are generic, they usually pay less attention to these blanket recommendations. In the absence of objectively measured soil properties, farmers usually rely on some inaccurate proxies to learn about their soils (Berazneva et al. 2018). Input use responses and associated behavioral adjustments driven by these misperceptions are less likely to be optimal and productivity-enhancing.
To address this information asymmetry associated with soil properties, new innovations in soil testing technologies and associated site-specific fertilizer recommendations are evolving. New and low-cost soil testing kits are being employed to generate site-specific information and provide site-specific agro-nomic recommendations that fit local production conditions. Recent evaluations of the potential of these innovations show encouraging results (for example, Harou et al. 2018; Murphy et al. 2019; Ayalew, Chamberlin, and Newman 2020).
2020 ReSAKSS Annual Trends and Outlook Report 41
These studies find that site-specific recommendations can increase farmers’ investments in agricultural inputs (Harou et al. 2018; Murphy et al. 2019) and boost agricultural yields (Ayalew, Chamberlin, and Newman 2020). The studies also show that individualized soil testing technologies can help address potential information asymmetries relating to soil properties and the associated mismatch between soil nutrient requirements and fertilizer application rates. However, these studies are based on small soil testing experiments, and large-scale site-specific testing facilities are beyond the reach of smallholders in many African countries (Gourlay et al. 2017). Establishing localized soil laboratories and soil testing facilities along with the promotion and supply of multiple products (for example, lime to treat acidic soils, fertilizer blends that are specific to crop and soil type) should be among the main fertilizer policy priorities on the continent. This obviously requires major investments, and some African countries (for example, Ethiopia) are now investing in research and development in these types of facilities. Reviving and revitalizing localized agricultural extension systems may help smallholders obtain customized recommendations and hence maximize local production potential.
This then opens the door to questions about the sustainable use of fertil-izer, or the role of precision nutrient management in African agriculture. Agronomically appropriate and sustainable application of chemical fertilizers is crucial for maximizing the marginal returns from fertilizer applications and for ensuring environmental health. Overuse and underuse of chemical fertilizers is both inefficient from an economic perspective and harmful to soil, water, and environmental health. Population pressure and soil degradation are leading to significant nutrient depletion in many African countries, implying increasing soil nutrient requirements and hence a growing need for appropriate chemical fertil-izer applications (see, for example, Kassie et al. 2008). This situation is further aggravated by increasing soil acidity (Tittonell and Giller 2013), which together with the low application of chemical fertilizers threatens sustainable food security in Africa. Deviations from agronomic recommendations may indicate that farmers are not exploiting the maximum potential of chemical fertilizers or that they are incurring additional fertilizer costs with little yield gain (see, for example, Yadav et al. 1997).
While the overall application of fertilizers in many parts of Africa remains low, there exist significant heterogeneities across countries, including significant overapplication in some African countries (Kurdi et al. 2020). Focusing on Egypt,
Kurdi et al. (2020) document that average nitrogen fertilizer application rates are substantially higher than (crop-specific) agronomic recommendations. This study further highlights that the fertilizer subsidy program in Egypt contributes to this overapplication of chemical fertilizers, suggesting that generous subsidy programs in Africa may encourage farmers to deviate from agronomically recommended fertilizer usage practices, with some important implications for households, the overall economy, and the environment.
While the impact of potential overuse of chemical fertilizers in Africa has yet to be researched, several studies document significant adverse environmental impacts of chemical fertilizer application in European countries (Sutton et al. 2011) and Asian countries (Zhang et al. 2013). Because of the increasing use and production of chemical fertilizers, mainly nitrogen fertilizers, curbing nitrogen-related emissions and the associated environmental impacts will likely be a major challenge of the 21st century (Sutton et al. 2011; Zhang et al. 2013). The annual environmental damage cost associated with nitrogen fertilizer application in the European Union is estimated to be between €70 billion and €320 billion, while the corresponding environmental cost associated with nitrogen fertilizer production and damage in China is expected to be even higher (Zhang et al. 2013). Excessive environmental damage can affect the overall yield gains and marginal returns associated with chemical fertilizers, sometimes to the level that the adverse health and environmental impacts outweigh the economic gains from fertilizer application (van Grinsven et al. 2013).
These pieces of evidence suggest that even though the overall fertilizer appli-cation rates in many African countries remain low, agronomically appropriate and sustainable application of chemical fertilizers is crucial to maximize the yield-enhancing impact of chemical fertilizers. Agronomic and sustainability recommendations should be informed by important investments in research and development, a sector lacking significant spending among many African coun-tries. Strengthening and expanding existing extension systems in Africa can help ensure appropriate adoption of modern agricultural inputs and improve agricul-tural productivity (see, for example, Berhane et al. 2018; Ragasa and Mazunda 2018). These investments in research and development are likely to generate locally appropriate soil information and agronomic recommendations that can minimize potential inefficiencies and damage due to information asymmetries associated with soil properties or recommendations.
42 resakss.org
The Political Economy of Fertilizer PolicyWe know a great deal about the relationships between fertilizer use, public policy, and agricultural productivity growth in Africa. Sheahan and Barrett (2017) argue that differences in the policy and operating environments of countries matter in terms of explaining the observed variation in use of inorganic fertilizer in selected African countries—that is, a combination of policy, institutional, and macroeconomic variables explain a substantial share of the micro-scale variation in fertilizer use more than household-level and agroecological variables. Still, it is somewhat surprising that fertilizer policy remains so prominent in the political, academic, and ideological discourse throughout the continent. Several elements in this discourse are worth noting.
First is the overarching discussion about where to invest in promoting fertil-izer use in Africa. Building on Asia’s experience during the Green Revolution, there is considerable economic logic in concentrating public spending on fertilizer distribution (specifically subsidies) on high-potential areas where the returns to fertilizer use are likely to be highest. These tend to be areas character-ized by favorable agroecological conditions, relatively developed transportation networks, high irrigation potential, and functional market infrastructure, and these areas may depend on agrarian labor that migrates from low-potential areas of the country (Kelly and Crawford 2007; Jayne and Rashid 2013; Rashid et al. 2013). But from the perspective of social equity, many perceive this strategy as biasing public spending toward areas and households that are already better off than more marginal areas and more vulnerable populations in a country.
Second is how the debates are framed. There are strong proponents and critics of fertilizer policy and fertilizer subsidies in Africa, and considerable debate around what constitutes stories of “success” or “failure” in this space (see, for example, Morris et al. 2007; Dugger 2007; Denning et al. 2009; Sachs 2012; Jayne and Rashid 2013; Lunduka, Ricker-Gilbert, and Fisher 2013). For example, advocates of fertilizer subsidies argue that insurmountable market and institutional failures—geographic fragmentation of markets, high transaction costs, inefficient markets for financial services, and information asymmetries—necessitate state intervention in the form of subsidies. Their premise rests on the expectation that once use of subsidized fertilizer becomes widespread, farmers will recognize its profitability and the subsidy can be withdrawn slowly over time without compromising household incomes or national food security. At the opposite end of the spectrum is the neoclassical economists’ argument that
market-driven pricing of fertilizer without state intervention is ultimately the most efficient way to allocate the scarce resources held by both households and governments and will ultimately lead to profitable rates of fertilizer application.
Malawi’s experience with fertilizer policy reforms remains one of the most commonly cited experiments with subsidies, although few truly agree on the design of the policy, the details of how it was actually implemented, or its outcomes (see, for example, Denning et al. 2009; Dorward and Chirwa 2011; Sachs 2012; Jayne and Rashid 2013; Jayne et al. 2018). This experience has inspired impact evaluations of fertilizer subsidies in other African countries, some of which find positive results, while others find far more ambiguous outcomes (see, for example, Chibwana et al. 2014; Jayne et al. 2013; Lunduka, Ricker-Gilbert, and Fisher 2013; Mason and Jayne 2013; Wossen et al. 2017).
In Africa, the reality likely lies somewhere between these ardently held positions in the current discourse. Studies show that in some instances, farmers already apply an optimal level of fertilizer given their constraints, comparative advantages, and expected profits (for example, Conley and Udry 2010; Suri 2011; Liverpool-Tasie 2017). Other studies show that fertilizer subsidies crowd out commercial fertilizer purchases, hamper private sector development, and lead to environmentally damaging overuse and abandonment of other soil fertility management practices (Mason and Jayne 2013; Ricker-Gilbert, Jayne, and Chirwa 2011; Takeshima and Nkonya 2014; Ricker-Gilbert and Jayne 2017; Morgen et al. 2019; Kurdi et al. 2020).
Other studies show that even the best-designed fertilizer policies and subsidy programs are extremely difficult to operationalize and can have severe unin-tended consequences. These challenges relate primarily to inefficient targeting of subsidies and the rent-seeking opportunities created by such targeting. Jayne et al. (2013) find that about 33 percent of subsidized fertilizer does not reach the actual intended beneficiaries in some African countries because of leakages and diver-sions of fertilizer. Similarly, several other studies show that a substantial share of fertilizer and other input subsidies does not reach poor, vulnerable, or marginal-ized farmers because of targeting problems (Lunduka, Ricker-Gilbert, and Fisher 2013; Chibwana et al. 2014; Holden and Lunduka 2012; Ricker-Gilbert, Jayne, and Chirwa 2011). Elite capture in these programs is also well documented (Ricker-Gilbert, Jayne, and Chirwa 2011; Pan and Christiaensen 2012).
Thus, there have been efforts to recast these programs as “smart” subsidies that are astutely managed, carefully targeted, and technologically advanced. For instance, Nigeria recently introduced an innovative mobile phone–based input
2020 ReSAKSS Annual Trends and Outlook Report 43
continued
subsidy program that delivers fertilizer subsidies through electronic vouchers (see, for example, Wossen et al. 2017). Many other countries (for example, Malawi, Mozambique, Rwanda, Zambia, and Zimbabwe) are following this lead and introducing some form of these smart and innovative subsidies (for example, e-wallet, e-voucher). The effectiveness and potential impacts of these recent innovations and smart subsidy programs, some of which are yet to be studied, are likely to depend on the institutional and political contexts in which they are introduced (Jayne et al. 2018).
This opens the door to the political economy dimensions of fertilizer policy and subsidy programs. In Africa, there is a widely held belief that these policies and programs are popular among voters and help politicians secure, consolidate, or retain power. Yet the empirical evidence on such a relationship is mixed at best (Banful 2011; Jayne and Rashid 2013; Ricker-Gilbert et al. 2013; Mason, Jayne, and Van De Walle 2017; Jayne et al. 2018). Unfortunately, such evidence has had very limited influence on the debates about fertilizer policy in Africa.
Conclusions and RecommendationsThere is a common understanding that an “African Green Revolution” requires increased use of improved agricultural inputs such as fertilizer and improved seeds. Adoption of these inputs is particularly crucial for those countries where agriculture remains the major source of livelihoods for poor households and low agricultural yields persist. In these contexts, boosting agricultural productivity remains the most effective strategy to reduce poverty and ensure food security. This has been recognized, as manifested by, for example, the Abuja and Malabo Declarations and calls for improving access to quality and affordable agricultural inputs through the provision of targeted supports.
A wide range of fertilizer and other input promotion polices in most African countries are geared toward improving affordable access to improved agricultural inputs. For instance, national fertilizer policies and regulations mainly focus on the formulation of instruments that can reduce farmgate fertilizer prices and increase fertilizer application rates. However, the evidence base on the efficacy and impact of these policies (for example, subsidies) remains mixed, with success stories for some modalities and countries. The mixed evidence base warrants further refinements and improvements in the modalities and targeting of these policies as well as the institutional contexts in which these policies operate. Continentwide programs such as CAADP and initiatives by regional economic communities can play a vital role in facilitating the refinement and
harmonization of fertilizer policies across borders. Regional communities can also play an indispensable role in promoting inter- and intraregional fertilizer trade, which is long overdue, as are closer scrutiny of and remedial measures to reduce the negative environmental externalities of intensive fertilizer use.
Despite significant increases in aggregate fertilizer consumption and applica-tion rates over the last two decades (due in part to the above-mentioned policies), fertilizer use and application rates remain remarkably low in Africa as compared to other parts of the world, though there is significant variation across countries, agroecological zones, production systems, and households. Lower and variable application rates are often linked with lower and variable returns to fertilizer uses, that is, fertilizer application can be unprofitable (or only marginally profitable) in contexts where output–to–fertilizer price ratios are lower and in production zones with low crop response rates (for example, production zones with acidic or less fertile soils). Poor infrastructure in some African countries and associated high transport and transaction costs further reduce these price ratios and profit margins. This suggests that investment in rural infrastructure could help make fertilizers and other improved inputs more profitable and appealing to farmers.
Generic and “blanket” fertilizer recommendations in the presence of substantial spatial variability in soil properties, which is common in most African countries, are also likely contributing to the low returns and application rates. Cognizant of the generic nature of most recommendations and the spatial variations in nutrient requirements, a few African countries are starting to invest in soil testing infrastructure to generate site-specific information and recom-mendations that fit local production conditions. While the results from tailored fertilizer recommendations are encouraging, coverage remains extremely limited, and this necessitates investment in large-scale soil testing facilities. Site-specific recommendations are crucial for increasing crop response rates and maximizing marginal returns. Site-specific recommendations are also important to ensure the sustainable intensification of African agriculture, including in contexts where subsidy programs have resulted in overuse of fertilizers. Underuse and overuse of fertilizers is both inefficient from an economic perspective and harmful to soil, water, and environmental health. Revitalizing existing (and mostly poorly funded) extension systems can also enable farmers to access integrated soil fertility management practices, including site-specific recommendations, and facilitate the sustainable intensification of African agriculture.

44 resakss.org
Appendix FIGURE 4A.1—FERTILIZER APPLICATION RATES BY REGION (KG OF NUTRIENTS PER HA OF CROPLAND, 2002–2017)
Source: FAO (2020).
0
2550
75100125
150175
200225
2002
2003
2004
2005
2006
2007
2008
2009
2010
2011
2012
2013
2014
2015
2016
2017
Kilo
gram
s of f
ertil
izer
nut
rient
s per
he
ctar
e of
cro
plan
dWorld Africa Americas Asia Europe Oceania
FIGURE 4A.2—FERTILIZER CONSUMPTION IN SELECTED AFRICAN COUNTRIES (TOTAL NUTRIENTS USED IN AGRICULTURE, 2002–2017)
Source: FAO (2020).
0
1000
2000
3000
4000
5000
6000
7000
0
100
200
300
400
500
600
700
2002
2003
2004
2005
2006
2007
2008
2009
2010
2011
2012
2013
2014
2015
2016
2017
Qua
ntiti
es (A
fric
a, in
'000
mt)
Qua
ntiti
es (i
n '0
00 m
t)
Africa Mali Burkina Faso GhanaSenegal Nigeria Kenya MalawiTanzania Zambia Ethiopia Côte d'Ivoire
2020 ReSAKSS Annual Trends and Outlook Report 45
CHAPTER 5 Policies for Competitive and Sustainable Agricultural Production Systems: A Case Study of Ghana’s Recent Mechanization Interventions
Hiroyuki Takeshima, Xinshen Diao, and Patrick Ohene Aboagye1
1 We thank two anonymous reviewers and editors for their constructive comments. This work was undertaken as part of, and funded by, the CGIAR Research Program on Policies, Institutions, and Markets (PIM), led by the International Food Policy Research Institute (IFPRI).

46 resakss.org
Africa south of Sahara (SSA) has witnessed steady economic growth and transformation in the agricultural sector in recent decades, involving significant changes in underlying economic conditions that affect both
the demand and the supply of mechanization. After periods of relatively less attention, interest in agricultural mechanization has resurged in SSA in the past decade. Mechanization has been integrated into the mainstream Africa-wide agenda, including the African Union’s Agenda 2063, the United Nations’ Comprehensive Africa Agriculture Development Programme (CAADP), and the Malabo Declaration, all of which have urged countries to commit to making significant progress on agricultural mechanization by 2025 (Malabo Montpellier Panel 2018; Diao, Takeshima, and Zhang 2020). Recently, the Food and Agriculture Organization of the United Nations (FAO) and the African Union Commission (AUC) developed the Sustainable Agricultural Mechanization in Africa (SAMA) framework, an approach to further mobilize regional and global support for this effort (FAO and AUC 2018).
Governments and international communities have faced steep learning curves in attempting to meet the growing demand for mechanization in SSA, yet gradually they have improved their approaches by drawing on lessons learned over time. Despite the resurgence of medium- to large-scale farmers in SSA in recent years, smallholders remain the dominant players. The demand for mechanization began expanding among a broad class of farmers, including smallholders, in SSA countries before most of these smallholders fully tran-sitioned into the nonfarm sector, and SSA governments have had to face the challenge of meeting the growing demand for mechanization among these smallholders. The indivisibility and the knowledge intensiveness of mechanical technologies such as tractors have led to significant market failures that could not be overcome easily in the short term. In recent decades, developing countries in Asia have been able to accomplish mechanization goals in land preparation, such as primary and secondary tillage, and such experiences have inspired SSA governments. However, unique conditions in SSA, including the
2 For example, the share of farms adopting animal traction, which had been low until the 1990s, increased significantly by the 2000s–2010s, to about 60 percent in northern Nigeria (25 percent for the whole of Nigeria) (Takeshima and Lawal 2018), 80 percent in Burkina Faso (Gray and Dowd-Uribe 2013), 70 percent in Mali (Fonteh 2010), and close to 40 percent in Niger (Sheahan and Barrett 2014). Similarly, by the mid-2010s, about 30 percent of farm households in Ghana were using machines for land preparation (Diao, Takeshima, and Zhang 2020).
dominance of rainfed farming systems and preferences for higher-horsepower tractors, have complicated the challenges faced by SSA governments.
This chapter highlights the emerging areas of market failure associated with agricultural mechanization and how SSA governments, including the Ghanaian government, have adapted their strategies over the years in attempting to overcome these market failures. The chapter focuses more on Ghana, rather than SSA as a whole, while also discussing how Ghana’s experiences are still relevant to other SSA countries. To retain clarity on the policy dynamics aspects, the chapter limits its focus to tractors in the crop subsector, as well as mechanization-specific policies, while leaving other types of mechanization tech-nologies or subsectors, or other broader mechanization-sensitive interventions and policies, to future studies.
General Patterns of Emerging Policy Needs on Mechanization in AfricaSocial, Political, or Macroeconomic Factors and Historical Reasons That Explain the Current Mechanization Policy ChoicesRecent decades have seen noticeable changes in the demand for and use of mechanical technologies, particularly among smallholders.2 Key supply-side factors have also evolved through external forces as well as endogenously in response to the nature of the demand.
Demand-Side FactorsThe demand for mechanization in SSA appears to have grown in peculiar ways that have affected the choices made in policy responses. The overall demand grew in aggregate, with strong seasonality and in an atomistic way. In addition, higher-horsepower (HP) tractors have generally been preferred over lower-HP tractors. Furthermore, governments have faced pressure to speed up their responses to meet time-sensitive goals on mechanization.
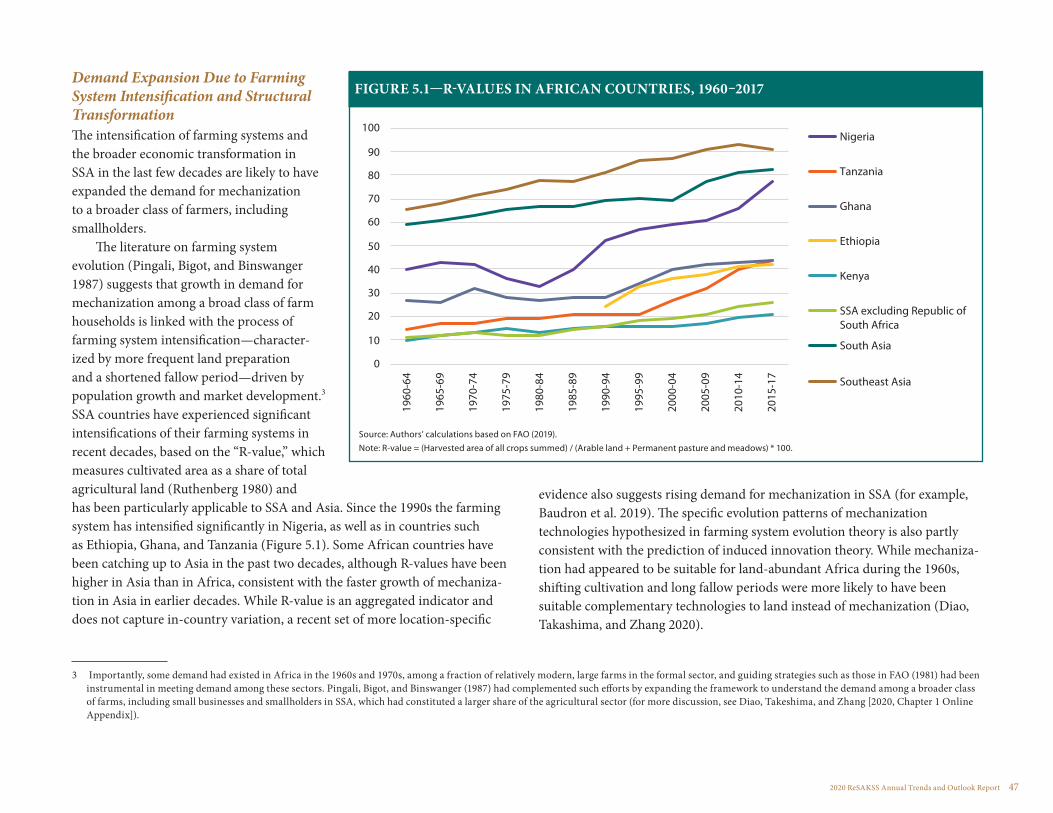
2020 ReSAKSS Annual Trends and Outlook Report 47
Demand Expansion Due to Farming System Intensification and Structural Transformation The intensification of farming systems and the broader economic transformation in SSA in the last few decades are likely to have expanded the demand for mechanization to a broader class of farmers, including smallholders.
The literature on farming system evolution (Pingali, Bigot, and Binswanger 1987) suggests that growth in demand for mechanization among a broad class of farm households is linked with the process of farming system intensification—character-ized by more frequent land preparation and a shortened fallow period—driven by population growth and market development.3 SSA countries have experienced significant intensifications of their farming systems in recent decades, based on the “R-value,” which measures cultivated area as a share of total agricultural land (Ruthenberg 1980) and has been particularly applicable to SSA and Asia. Since the 1990s the farming system has intensified significantly in Nigeria, as well as in countries such as Ethiopia, Ghana, and Tanzania (Figure 5.1). Some African countries have been catching up to Asia in the past two decades, although R-values have been higher in Asia than in Africa, consistent with the faster growth of mechaniza-tion in Asia in earlier decades. While R-value is an aggregated indicator and does not capture in-country variation, a recent set of more location-specific
3 Importantly, some demand had existed in Africa in the 1960s and 1970s, among a fraction of relatively modern, large farms in the formal sector, and guiding strategies such as those in FAO (1981) had been instrumental in meeting demand among these sectors. Pingali, Bigot, and Binswanger (1987) had complemented such efforts by expanding the framework to understand the demand among a broader class of farms, including small businesses and smallholders in SSA, which had constituted a larger share of the agricultural sector (for more discussion, see Diao, Takeshima, and Zhang [2020, Chapter 1 Online Appendix]).
evidence also suggests rising demand for mechanization in SSA (for example, Baudron et al. 2019). The specific evolution patterns of mechanization technologies hypothesized in farming system evolution theory is also partly consistent with the prediction of induced innovation theory. While mechaniza-tion had appeared to be suitable for land-abundant Africa during the 1960s, shifting cultivation and long fallow periods were more likely to have been suitable complementary technologies to land instead of mechanization (Diao, Takashima, and Zhang 2020).
Source: Authors’ calculations based on FAO (2019). Note: R-value = (Harvested area of all crops summed) / (Arable land + Permanent pasture and meadows) * 100.
FIGURE 5.1—R-VALUES IN AFRICAN COUNTRIES, 1960–2017
0
10
20
30
40
50
60
70
80
90
100
1960
-64
1965
-69
1970
-74
1975
-79
1980
-84
1985
-89
1990
-94
1995
-99
2000
-04
2005
-09
2010
-14
2015
-17
Nigeria
Tanzania
Ghana
Ethiopia
Kenya
SSA excluding Republic ofSouth Africa
South Asia
Southeast Asia

48 resakss.org
Increasing farming system intensity has raised the demand for overall farm power inputs, which can be supplied by human, animal, or mechanical power. However, this process is also accompanied by economic transformation, which raises the relative price of rural laborers, who have higher opportunity costs and significant aversion against drudgery, leading to an increased demand for mechanical technologies that can substitute for labor. The growth of a rural nonfarm sector has drawn rural labor away from farming. This shift has been evident particularly among the youth (Mueller and Thurlow 2019), who are key suppliers of on-farm heavy-duty manual labor for tasks such as land clearing and preparation. Recent empirical evidence suggests that, in Africa, the substitution of physical labor with mechanical power has been one of the important processes of rising agricultural labor productivity (Diao, Kweka, and McMillan 2019; Diao et al. 2019).
Seasonality and Atomistic Nature of Demand for Mechanized Land PreparationIn many SSA countries, agriculture is largely rainfed, whereas irrigation can help extend land preparation and other seasonal activities in Asian agricultural production. Crop yields are sensitive to planting timing, leaving only a short window for land preparation. When demand for mechanization services con-centrates on tractors for plowing, the seasonable demand can constrain tractor services from the supply side.
Much of the mechanization demand for land preparation has remained atomistic because demand has grown considerably among smallholders. The gradual rise of medium to large farms (Jayne et al. 2019) has been associated with the growth of tractor ownership in various SSA countries. However, while these medium to large farms have grown in relative terms, they have not yet dominated the sector. Consequently, a significant share of mechanization demand has arisen on farms managed by smallholders who hire mechanization services from farmers with medium to large farms (Jayne et al. 2019; Diao, Takeshima, and Zhang 2020). Because of these patterns, SSA governments’ mechanization support remains centered around smallholders. Support for custom-hiring services faces challenges, including high transaction costs for increasing machine utilization rates by aggregating demand and uncertainty caused by smallholder constraints.
Seeming Preferences for Higher-Horsepower TractorsIn some SSA countries such as Nigeria and Ghana, farmers appear to prefer higher-HP tractors than those demanded in other comparable regions such as Asia. Even for four-wheel tractors, the typical power of tractors operating in SSA countries is more than 50 HP, compared with a typical power of 30 HP in Asia (Diao, Takeshima, and Zhang 2020). Because higher-HP tractors tend to be more expensive, the consequence of credit-market failures has been more severe, and policies in SSA countries often focus more on reducing tractor prices. This relative dominance of higher-HP tractors affects the types of market failures that emerge, as is described in later sections.
Time-Sensitivity of Regional CommitmentsAt the global and regional levels, SSA governments continue to face pressure to meet time-sensitive development goals, which also include goals on mechaniza-tion. For example, the African Union’s Agenda 2063 Aspiration #1, Goal #5, commits countries to banish the hand hoe by 2025 (Malabo Montpellier Panel 2018; Diao, Takeshima, and Zhang 2020), although the viability of this goal remains unclear. In Ethiopia, concerns over imminent climate change and interest in the green economy have induced the promotion of mechanization to substitute draft animals, which officials regard as a contributor to global warming (Berhane et al. 2017; FAO and AUC 2018).
Supply-Side FactorsSome of the earlier literature on agricultural mechanization (see Pingali, Bigot, and Binswanger 1987) hypothesized that the private sector might be able to meet the rising demand for mechanization in SSA even without direct govern-ment intervention. This approach remains feasible, but SSA governments have increasingly recognized that private-sector responses alone can be insufficient in the short term to meet the aforementioned time-sensitive goals. Some of SSA governments’ mechanization policy options seem to be associated with perceptions of various types of market failures. These failures can largely be categorized as risk and uncertainty in private investment in agricultural machinery, and insufficient information and knowledge (Diao, Silver, and Takeshima 2017; Diao, Takeshima, and Zhang 2020).
Risk and uncertainty, particularly in private investments, arise primarily because of the aforementioned nature of demand, including seasonality and

2020 ReSAKSS Annual Trends and Outlook Report 49
the atomistic characteristics of smallholders. As described above, the number of medium-scale farmers has increased in many African countries in recent years, but most have comparatively small farms, and their tractors do not reach sufficient utilization rates from their own-farm use alone. To reach the break-even level of machine utilization rates, such farmers have needed to earn additional revenue by hiring out their services. As a result, returns from hiring-out services significantly determine the returns to machine investments. Uncertainty in the returns from hiring-out services can arise because rainfall uncertainty can make smallholders’ demand for plowing at a specific time period a highly volatile prospect. Further, smallholders’ inability to group themselves to approach service providers makes it risky both for smallholders to find service providers and for service providers to find profitable customers. The consequences of such uncertainty may be magnified because of the lack of credit markets that potential tractor owners are able to access, and lump-sum cash investment often is needed up-front (Takeshima et al. 2015). These factors are expected to lead to underinvestment in agricultural machinery in the absence of effective public policy support.
African countries’ various stakeholders also may lack sufficient informa-tion and knowledge on many mechanization-related issues (Daum and Birner 2017). Modern mechanization technologies have developed rapidly and often are knowledge-intensive. Farmers will require basic knowledge of their equipment for machinery operation and efficient maintenance and repair. To improve the efficiency of their investments, they will need further knowledge about different brands and types of machines, their functions, and their suit-ability for different soils and agroclimatic conditions. Such information and knowledge are similar to public goods, and the private sector alone cannot generate and accumulate enough of such knowledge.
SSA governments also often perceive that the market alone fails to achieve inclusiveness and equality, with smallholders more likely to be excluded from access to mechanization services (for example, in Ghana [Diao et al. 2018]). Where such inclusiveness is part of a public good, the private sector alone may undersupply it. The following section focuses on such issues.
Key Lessons from Past and Recent Policy InterventionsAgricultural mechanization policies and government programs in SSA gener-ally have consisted of promotion policies, as well as trade and import policies;
licensing policies; and policies affecting financial support for machinery purchases and inputs, domestic manufacturing, and regulation/testing, among others.
Earlier Interventions and Lessons 1960s–1980sStarting in the 1960s, African governments and international organizations provided support for agricultural mechanization. However, this support was largely unsuccessful in raising the level of mechanization in SSA agriculture, and in the mid-1980s, many African governments were forced to abandon these support programs under the loan terms of the Structural Adjustment Programs (SAPs) provided by the World Bank and International Monetary Fund. A number of factors explain these initial failures.
Approaches taken by different SSA countries between the 1960s and early 1980s were fairly diverse. Many SSA countries typically increased direct support for tractorization during this period, but several Sahelian or highland francophone countries, including Burkina Faso, Burundi, Niger, and Rwanda, given their ecology more suitable for draft animal technologies (DAT), focused support on DAT (Pingali, Bigot, and Binswanger 1987). Even among countries promoting tractorization, some, such as Ghana (and some lusophone coun-tries), followed a more socialist approach (Twum and Gyarteng 1991), where mechanization was promoted as part of state farms, while other countries such as Nigeria focused on supporting more large-scale commercial farms (Diao, Takeshima, and Zhang 2020). Consequently, the share of government support for tractorization was much higher in Ghana compared to other SSA countries. Similarly, in the 1970s, mechanization support in Ghana and Nigeria was implemented by military regimes, unlike in some other SSA countries. Some SSA countries such as Cameroon, Democratic Republic of the Congo, and Nigeria also financed these programs through resource export revenues (Diao, Takeshima, and Zhang 2020, Appendix 1C), while other countries relied more heavily on international support.
However, despite the diversity of approaches taken by different SSA countries in the 1960s through the early 1980s, there were common lessons. One lesson from these early interventions was that mechanization support can be successful at a broad scale if it is provided in response to sufficient demand
50 resakss.org
among a broad class of farmers (FAO and AUC 2018, 36). In many countries promoting tractorization, the interventions targeted the relatively more formal, modern sectors that were connected with the government. The guiding strate-gies for mechanization developed, such as those of the FAO (1981), were instrumental in informing these formal, modern-sector approaches. However, it was also acknowledged that field-level information on small businesses, including smallholders, which constituted the majority of the farm sector, had been scarce (FAO 2008). Pingali, Bigot, and Binswanger (1987), among others, contributed to analyses of the demand among such broader segments of farm populations. As mentioned above, in the earlier period, mechanization demand for the majority of farmers was likely to have been low if judged based on farming-system intensification. Even in countries where DAT had been promoted more, field-level economic returns to and demand for DAT were mixed until the 1990s, suggesting that realizing effective interventions is difficult without sufficient demand (Diao, Takeshima, and Zhang 2020, Appendix 1C).
Another lesson was that even when demand is sufficient, the government’s direct involvement in machine supply development and financing or the provision of hiring services tends to have limited effects (FAO and AUC 2018, 36), and if these approaches are to be used, they need to be used carefully. The experiences in the 1960s–1980s suggested the general inefficiency of direct government involvement in certain activities such as tractor hiring schemes, associated with low utilization rates and insufficient attention to spare parts and repair and maintenance knowledge and skills. At the same time, the need for the long-term development of and investment in relevant institutions, such as those envisaged by the FAO (1981), remained relatively ignored. These institutions included CGIAR and the Centre for Sustainable Agricultural Mechanization, which have conducted engineering research and development (R&D) and facili-tated cross-country learning in Asia, or in institutions that could harmonize relevant policies at the regional level and build capacity in both engineering and economics to identify key market failures and appropriate interventions that could reduce government failures (Diao, Takeshima, and Zhang 2020; FAO and AUC 2018), as has been showcased in more recent experiences in Ghana and Nigeria, as described below.
1980s–2000sBetween the 1980s and the 2000s, direct government interventions to support tractor-based mechanization decreased significantly, in part because of the aforementioned lack of success and the effects of the SAPs, which led to currency devaluation and a significant increase in the price of imported tractors in many SSA countries. In addition, due in part to studies such as Pingali, Bigot, and Binswanger (1987), some of the earlier mechanization support was replaced by support for intermediate technologies such as DAT.
The lessons learned during these DAT interventions were largely consistent with earlier lessons, indicating that mechanization interventions are generally more successful if demand is sufficient. Similar to support for tractorization up to the earlier 1980s, support for DAT increased post-1985 until the mid-2000s (FAO and AUC 2018). However, unlike tractors, DAT achieved much more extensive diffusion; while tractor adoption rates had stagnated despite the earlier support, DAT adoption rates rose to around 25 percent in Nigeria, 30 percent in Ghana (Fonteh 2010), and up to 80 percent in Burkina Faso and Mali (Diao, Takeshima, and Zhang 2020). Support for DAT might have been more effective because the demand for DAT in the late 1980s was likely rising more than the demand for tractors, as predicted by the farming system hypothesis; the level of intensification had risen enough for DAT to be more profitable than human power only, while at the same time DAT was sufficient to meet the needed frequency and timeliness of tillage, and the labor wage was still relatively low so that DAT (which was relatively more labor-intensive than tractors) was more profitable than tractors.
Recent Policy InterventionsSince the 2000s, interest in mechanization has revived. SSA countries have modified their support approaches based on their earlier experiences. These modifications have led to some improvements, although challenges remain.
Concessional Loan Support In recent years, emerging countries including Brazil, China, and India have promoted policies and programs through concessional loan (CL) facilities. These approaches have featured prominently as major instruments for recent public support for mechanization by SSA governments. Typically, low-interest loans are extended on the condition that the borrowing country import the agricultural

2020 ReSAKSS Annual Trends and Outlook Report 51
machines from the lending country. Such exports and imports of machines through CL facilities have helped recipient countries to import a large number of tractors and exporting countries to sell this equipment and potentially create markets abroad.
The precise nature of the agreements varies. In recent years, Ghana has received CL arrangements from India and Brazil. Lusophone SSA countries, including Mozambique, have also imported tractors through CLs from emerging countries such as Brazil (Cabral 2019). Brazil also has signed memoranda of understanding and technical cooperation agreements with Kenya, Senegal, and Zimbabwe (Veiga and Rios 2017). Benin and Gambia received tractors from India through donation and purchase credits and received assistance to set up a tractor assembly unit (Kragelund 2008). Similarly, in 2009, Cameroon received US$37.65 million in credit from the Exim Bank of India to import made-in-India tractors (Sneyd 2014). Tanzania obtained $40 million in concessionary credit from the Indian government between 2010 and 2011, which was used to import and distribute 1,800 four-wheeled tractors to farmers (Mrema, Kahan, and Agyei-Holmes 2020). The effectiveness of these government programs has not yet been widely evaluated. In countries such as Cameroon, the distribution of tractors under the aforementioned government program reportedly has been less than timely and relatively inefficient (Sneyd 2014).
While these CL-based arrangements have provided opportunities, issues have also emerged over time. Countries offering CLs may not have similar farming systems and practices or similar tropical agroecological conditions to the countries receiving the equipment. As in older programs, the machines themselves have often remained the focal point of these new loan programs, with less attention placed on the supply of complementary resources, including attachments, spare parts, and operation and maintenance skills. The switch from one round of CL agreements to another has sometimes led to the breakdown of the supply network as well as the loss of brand-specific operational skills and knowledge (Diao et al. 2014). Importantly, SSA countries such as Ghana have learned lessons from the earlier phases and have improved their program
4 This chapter covers the case of tractors primarily, but the challenges of insufficient utilization rates are a common problem for mechanization in SSA, including postharvest processing. For example, countries such as Nigeria continue to modernize the rice milling sector by promoting large-scale industrial processing facilities. However, these large rice mills are less economically viable owing to an insufficient supply of paddy, unlike more resilient small- to medium-scale processing enterprises that can cope with an uncertain supply of paddy (Gyimah-Brempong, Johnson, and Takeshima 2016).
designs (see the Ghana case study in the next section for a more detailed example).
Private-Sector-Run Custom-Hiring Service Centers4
One of the models recently promoted by SSA countries has been private-sector-run custom-hiring service centers using the equipment obtained through the aforementioned CLs. These centers include Ghana’s agricultural mechanization service enterprise centers (AMSECs), which are described in greater detail in the next section, and agricultural equipment hiring enterprises (AEHEs) in Nigeria. The Nigerian government, under its Agricultural Transformation Agenda, set up 80 AEHEs in 2011, an additional 31 in 2015, and another 80 by 2018 (Hatzenbuehler et al. 2018).
Recently, Mozambique launched agrarian service centers that have been equipped with agricultural machinery to improve mechanization service offerings for farmers. By 2018, 96 of these centers had been established across the country, consisting of public agencies, private enterprises, and individual farmers (Cabral 2019). Similarly, in Rwanda, the government adopted an Agricultural Mechanization Strategy in 2009 and set up 16 government-led hiring services and training centers called village mechanization service centers, as well as six power-tiller centers (Malabo Montpellier Panel 2018). Under this program, between 2009 and 2013, the Rwandan government also acquired 81 tractors, 250 power tillers, 35 rice planters, five combine harvesters, and farm implements including plows, moldboards, harrows/rotavators, water pumps, and trailers, which were sold to farmers, individuals, and cooperatives (Malabo Montpellier Panel 2018).
Information and Communication Technology Applications for Mechanization Service Provisions. Private-sector-run custom-hiring service centers have been one area where new information and communication tech-nologies have been increasingly integrated. In particular, various SSA countries have promoted “Uber-type” provider-user matching services, as well as other functions such as machine tracking. These services include Hello Tractor in Nigeria and Kenya, Trotro Tractor in Ghana, and “Rent to Own” in Zambia
52 resakss.org
(Daum and Birner 2019). These innovations have significant potential, though one key challenge is how to scale them up. For example, Hello Tractor currently covers several hundred tractors (Birner and Daum 2017), which is less than 5 percent of all tractors used in both countries (FAO 2019). Moreover, few studies have investigated in detail the economics of these new services, which is important in identifying specific areas of support that can enhance their economic viability.
Challenges for Custom-Hiring Service Provision. These government-supported, private-sector-run programs should be monitored and evaluated formally in future research, as experience suggests that challenges remain. For example, in Nigeria, anecdotal evidence suggests that many government-selected service providers (to whom the governments have provided tractors with subsidies) may be less efficient than service providers that operate in purely competitive markets, in terms of keeping fuel consumption low per unit of area plowed (Takeshima et al. 2015; Hatzenbuehler et al. 2018). If AEHEs observe similar patterns, the government should reconsider the selection of beneficiaries and perhaps make subsidies available at lower rates but for wider groups of tractor owners and tractor brands, so that subsidies are better used in more competitive, market-based mechanisms. Over the years, in parallel with AEHEs that are promoted by the Nigerian federal government, some state government mechanization programs (for instance, the Kaduna state program) have completely withdrawn from providing any financial support for tractor acquisitions and shifted toward linking farmers and tractor vendors in the state (Hatzenbuehler et al. 2018). Some of these changes have been made for financial reasons (for example, lack of budget allocations or the high cost of collecting outstanding loan repayments from tractor owners), but states also have become aware of growing evidence of the relative inefficiency among government-selected beneficiaries.
Similarly, the experience in Ghana suggests that because of the afore-mentioned risk and uncertainty, and the transaction costs associated with custom-hiring services, the recovery of the full cost of tractor investment relies on sufficient use of tractors for service provision in addition to owners’ own-farm use (Diao, Takeshima, and Zhang 2020, Chapter 1). Therefore, more support should be provided for the promotion of farmer-to-farmer service provision by medium-scale farmers, instead of (nonfarmer) specialized service providers on which the earlier public supports often focused. Similar
observations have been made in countries such as Mozambique, where farmer-to-farmer service providers have been more effective than larger nonfarmer service providers, with lower prices and more flexible payment terms (Cabral 2019).
Other Mechanization-Related Policies and ProgramsImportantly, many of the recent CL-based interventions described above have been implemented in conjunction with other mechanization-related policies and programs.
Trade and Import Policies. Tariffs and tax policies have been typical government trade considerations related to mechanization (Diao, Silver, and Takeshima 2016). In Nigeria, for example, import duties of approximately 5 to 25 percent have typically been applied to tractors, though value-added tax (VAT) has been less common (Takeshima and Lawal 2018). Similarly, SSA countries have often eliminated import duties and VAT for imported tractors but have subjected completely and semi-knocked-down parts and other spare parts to full tariffs (Diao, Silver, and Takeshima 2016). In some countries such as Ethiopia, machine imports have been constrained because of stringent restrictions on access to foreign exchange (Berhane et al. 2017).
Licensing, Registration, and Testing. Licensing requirements for oper-ating, importing, and distributing tractors, and registration requirements for owning tractors, have been in place in various SSA countries. For example, in Nigeria, since the mid-1980s, the law has required tractor operators to be at least age 18, to have passed a trade test (often equivalent to a technical college certificate), and, more recently, to hold a professional license for “agricultural machines and tractors” (Takeshima and Lawal 2018). Nigerian laws also require that tractor importers and distributers be licensed. In Nigeria, importers and distributors of new tractors are typically authorized as sole agents by the foreign companies, which are all licensed (Takeshima and Lawal 2018). Similarly, many countries apply motor vehicle licensing and registration requirements to agri-cultural tractors. For example, in Nigeria, the Federal Road Safety Commission office and the relevant state motor vehicle registration office license and register tractors (Takeshima and Lawal 2018). The tasks of inspecting the quality of machines, particularly of imported ones, are assigned to relevant bodies in various SSA countries, including the Center for Agricultural Mechanization and Rural Technology in Tanzania and the National Center for Agricultural Mechanization in Nigeria. Enforcement rates in Nigeria, however, have
2020 ReSAKSS Annual Trends and Outlook Report 53
generally been unclear. In Nigeria, despite the federal government’s 1993 direc-tions to establish motor vehicle administration departments in all states, to date only a few states appear to have complied (Takeshima and Lawal 2018).
Financing. Various SSA countries have introduced financing facilities aimed at supporting machine acquisition through deferred payments. In Ghana and Nigeria, such facilities have been tied to government-promoted hiring enterprises such as the AMSECs and AEHEs. Other facilities for general machine purchases include credit facilities within parastatal institutions (for example, Adama Agricultural Machinery Industry in Ethiopia [Berhane et al. 2017]), agricultural windows at investment banks (for example, Tanzania Investment Bank [Mrema, Kahan, and Agyei-Holmes 2020]), agriculture-related trust funds (for example, the Agriculture Inputs Trust Fund in Tanzania [Mrema, Kahan, and Agyei-Holmes 2020]), de-risked support for banks through the provision of guarantees (for example, Nigerian Risk-Sharing Agricultural Lending), and revamped agricultural development banks. However, in Ghana and Nigeria, tractor owners often report that personal savings remain the predominant source of financing for tractor purchases (Takeshima et al. 2015; Diao, Silver, and Takeshima 2016), suggesting that coverage of government financing facilities should be monitored.
Research and Development. SSA countries also have often sought to develop domestic machine manufacturing capacities. In Nigeria, joint ventures were pursued as early as the 1970s between Nigeria Truck Manufacturers and Fiat, and between Steyr Nigeria Ltd. and Steyr tractors (Takeshima and Lawal 2018). Similar joint venture interests considered adapting tractor designs to local conditions, including the Kabanyolo tractor in Uganda and the Tinkabi tractor in Swaziland (FAO 2008). These earlier joint ventures generally were not successful. In Nigeria, the joint ventures faced challenges in using the required amount of locally sourced raw materials due to their low quality (Diao, Silver, and Takeshima 2016). SSA governments’ efforts in establishing local assembly plants have also faced challenges, but some plants have remained operational, including Ethiopia’s Nazareth Tractor Assembly Plant, which accounted for almost half of the tractors entering the country between 2005 and 2010 (World Bank 2012).
Similarly, many SSA countries have assigned local institutions general R&D tasks for the engineering and development of new designs for machines and attachments. In Nigeria, mechanization units of the Agricultural
Development Projects, state and federal governments, and the National Centre for Agricultural Mechanization have been mandated to coordinate R&D conducted by various local organizations (Takeshima and Lawal 2018). International organizations such as the United Nations Industrial Development Organization and the United Nations Economic Commission for Africa have actively contributed to similar R&D efforts. Governments also recognize the need for R&D on other mechanization technologies such as rippers, shredders, and levelers for effective land development and obstacle clearing, as well as the importance of improving the local fabrication and research capabilities of artisans and promoting the local fabrication of basic farm power and posthar-vest equipment. However, monitoring systems for these R&D efforts generally seem weak and need to be strengthened.
Potential areas for further R&D also include environmental issues. Concerns have long existed that the mechanization process can have consider-able environmental impact. Such environmental issues have become more relevant in recent years as tractor adoption has grown in SSA. In October 2018, after intensive expert consultations with a broad range of stakeholders, the AUC and FAO launched the SAMA framework, which has been integrated into CAADP and the Malabo Declaration (FAO and AUC 2018). However, it is generally agreed that more evidence is needed to integrate mechanization policy and environmental sustainability, including in the area of conservation tillage (Giller et al. 2009; Sithole, Magwaza, and Mafongoya 2016; FAO and AUC 2018, 97).
Case Studies from Ghana As described in the previous sections, over the past few decades Ghana has experienced changing conditions that have affected the demand for mechaniza-tion. This section illustrates how the Ghanaian government has tried to fill perceived market failures in farm mechanization services, how it has improved its approaches, and what other challenges remain, with particular focus on AMSECs. As noted, AMSECs have been in operation for more than a decade, and they offer suitable cases that allow us to assess short- to medium-term experiences. They are also relevant to other SSA countries that are increasingly adopting similar institutional models. While future studies will need to provide assessments of other alternative models (for example, block farming), lessons from the AMSECs can offer some guidance.
54 resakss.org
Experiences before the Introduction of AMSECsAs in many other SSA countries, before the SAP in the 1980s direct gov-ernment supports for mechanization in Ghana included state-supported tractor-hiring schemes. Unlike many other SSA countries, however, the Ghanaian government promoted more state farms, and the state-supported tractor-hiring schemes accounted for a greater share of the country’s tractor fleet than in many other SSA countries (Twum and Gyarteng 1991). The then Ministry of Food and Agriculture typically owned and operated about 1,500 tractors in its 32 district mechanization stations in the Savannah Zone. Plowing services were largely provided for farmers irrespective of their loca-tions and often at rates that were subsidized between 30 and 100 percent (Diao, Takeshima, and Zhang 2020, Chapter 1). These state-run tractor-hiring schemes suffered from high machine breakdown rates (often as high as 40 percent), strong political interference, and a weak management structure, leading to low machine utilization rates compared to the private tractor owners who provided similar hiring services (Diao, Takeshima, and Zhang 2020).
Experiences from AMSEC Phase IBy the mid-2000s, the aforementioned perceptions of a supply-demand gap for mechanization had grown to the point where the Ghanaian government launched Phase I of the AMSEC mechanization support program. Utilizing CLs and donor grants as well as its own budget, between 2004 and 2008 the government imported tractors and basic implements for sale to farmers, private entities, and other institutions under subsidy and hire-purchase arrangements. In 2007, some of the stock of equipment was used to support the establishment of 12 AMSECs in some parts of the country (Diao et al. 2014). In 2009–2010, the government established an additional 77 AMSECs across the country through a similar process and under the same financing arrangement.
Recognizing the challenges experienced under the earlier state-run tractor-hiring schemes arising from direct government management and operation of mechanization services, the AMSEC program was designed to be managed by private agents selected by the government to own and operate the machinery services centers. The government provided a subsidy of about 30 percent on the equipment sold to farmers and AMSECs. It further provided hire-purchase arrangements based on about 20 percent down or up-front payment for the
fleet of equipment allocated to an AMSEC, with interest-free repayment on a quarterly installment schedule over a five-year period.
AMSEC Phase I appears to have had mixed effects in the short term; where the centers were successful, they somewhat improved the timely availability of mechanization services and reduced drudgery, but their presence had relatively limited impact on service fees and total area ploughed (Benin 2015). Elsewhere, they faced greater challenges to stay operational. Many AMSECs suffered from low profitability and incurred losses in the first few years of operation, and many defaulted on their repayments, leaving the government responsible for repaying the CLs (Diao, Takeshima, and Zhang 2020). Many AMSECs still suffered from low machine utilization rates, often below the hypothetical break-even points based on subsidized tractor prices, actual operational costs, the typical capital depreciation rate, and interest earnings from a similarly sized savings deposit in a Ghanaian bank account (Houssou et al. 2013).
Various factors contributed to these outcomes. AMSECs, which were selected by the government, often failed to achieve utilization rates that were similar to those of the purely private-sector service providers who mostly used secondhand tractors. At the same time, each AMSEC was equipped with five to seven new tractors, which turned out to be too large a fleet to manage effi-ciently. For many AMSECs, the plowing season, which was largely dependent on rainfall, turned out to be too short in their localities for sufficient utiliza-tion rates. Migration to regions with different plowing seasons could have increased these rates, but the high transportation costs caused by poor road infrastructure and the transaction costs associated with the fragmented nature of customer farmers meant that few AMSECs could explore such options. Similarly, AMSECs often did not do better than the private sector in using tractors for multiple purposes (Benin et al. 2012), further limiting utilization rates. Lastly, the program could not effectively solve the problems of tractor operators’ limited operational and maintenance skills, and poor access to repair services and spare parts; moreover, AMSEC owners and operators did not have sufficient managerial skills to manage the large number of tractors in each center (Diao et al. 2018).
Experiences from the Ongoing AMSEC Phase IIIn 2016, the Ghanaian government secured a CL facility to import Brazilian agricultural machinery. The government, aware of the aforementioned
2020 ReSAKSS Annual Trends and Outlook Report 55
perceptions of market failures in mechanization hiring services and farmers’ poor access to equipment, chose to continue with the second phase of AMSEC. Reflecting on the lessons from AMSEC Phase I, as well as recommendations made by various organizations and studies (Diao et al. 2018), AMSEC Phase II has made a number of modifications. First, whereas AMSEC I restricted the offer to centers that would purchase at least five tractors, AMSEC II dropped that restriction and opened the offer to all would-be buyers at the same price, reducing the risk of government failures in beneficiary selections. This appears to have been effective at least in the short term; of the first tranche of 549 tractors imported from Brazil by 2017, 379 (69 percent) were purchased by indi-viduals who bought only one tractor with accompanying implements. Second, the program incorporated greater support for maintenance; 1,000 engine-hours or one year (whichever comes first) of free scheduled tractor maintenance ser-vicing has been included as part of the support for all tractor beneficiaries. The program identified and included mobile workshop vans in the list of equipment available to beneficiaries for on-field repair work. More concrete arrangements have been made with the Brazilian manufacturers, so that they are required to provide spare parts for two years while the supply network is developing. Third, the program paid more attention to enhancing maintenance knowledge and skills. First-time buyers, including operators, are now required to participate in the training provided by the agriculture ministry’s engineering staff. Fourth, the AMSECs expanded support for exploiting multiple uses of the tractors, both on and off the farm. Various implements and equipment have been imported for purchase and demonstrations, including maize shellers, multicrop threshers, pneumatic and mechanical planters, cassava planters and harvesters, seed drills, boom sprayers, and maize/soya/rice harvesters that can be attached or mounted to tractors. The government also has expanded the tractor brand options by importing three different class “A” brands of tractors: Massey Ferguson, the most popular brand in Ghana’s secondhand tractor market (most over 20 years old); New Holland; and Valtra. Three private companies selected as local agents provide after-sales support for each brand of tractors.
While the outcomes (particularly in the medium to long term) of these modifications should be formally evaluated through further research, these modifications in AMSEC II are generally promising. At the same time, field observations by Diao et al. (2018) suggest that some challenges remain, which can be addressed through further improvements in the program. Notably,
it remains unclear how the program has improved smallholders’ access to mechanization services. As has been observed in the private sector, including in Ghana, farmers’ main motivation for tractor purchases has been primarily for use on their own farm, and hiring out is only a secondary use. This pattern suggests that AMSEC II has yet to achieve the government’s intended goals of improving access for smallholders. The relatively limited mechanization service offered through hiring out, owing to the aforementioned transaction costs, appears to have persisted under AMSEC II. These challenges suggest a potentially important role for complementary government efforts to reduce transaction costs, such as encouraging smallholders to aggregate their demand for services and stimulating demand at intensive margins (such as the second plowing or harrowing in addition to the first plowing). Furthermore, Diao et al. (2018) also have suggested that knowledge of machine operation remains insufficient. For example, tractor owners and operators frequently have insuf-ficient operational and tillage skills. In many cases, operators skip proper pre-inspection of fields for stumps and stones, which means that these obstacles can damage crucial parts of the machines, such as the transmission or hydraulic systems. These incidents often lead to the premature breakdown of machines, since repairs and spare parts are often expensive and not readily available. Although AMSEC II incorporates training as a new program component for first-time buyers, a broader set of beneficiaries will need to access such training.
Concluding RemarksAgricultural mechanization has significant potential to further transform the agricultural sector in SSA, most notably through direct effects on labor produc-tivity. Now that mechanization of farming activities has spread across Asia, SSA is the last frontier, and significant agricultural mechanization growth is expected to continue in the near future.
SSA governments will remain critical players in supporting the growth of agricultural mechanization, though they will need to take care in this delicate process. This chapter has focused on identifying the areas of market failure where the public sector has a role to play, but the private sector also has substan-tial potential to lead the growth of mechanization, particularly in comparison to some other agricultural technologies for which the public sector remains the dominant player. At the same time, the risk is also high that improper government actions could negatively affect this growth potential. It is therefore
56 resakss.org
important for SSA governments to effectively mitigate market failures even as they minimize the risk of government failures. Appropriate involvement of the government is also important to ensure the socioeconomic and environmental sustainability of business models in the mechanization sector, as envisaged in recent initiatives such as the SAMA framework (FAO and AUC 2018).
In conclusion, it is also important to note that, overall, the mechanization process has been affected more profoundly by broad economic policies than pure mechanization policies (Binswanger and Donovan 1987), and this remains largely the case today. In terms of the number of agricultural machines operating in any given SSA country, the share of machines handled by the governments either directly (for example, through state-run tractor-hiring schemes) or indirectly (for example, through hiring-service enterprises) has remained small. In Africa’s spatially diverse agroecological and socioeconomic conditions, implementations of blanket policies and interventions have faced challenges in realizing effective outcomes. For mechanization support policies, SSA governments and the international community must have realistic expectations about the domain of influence of direct mechanization policies, and they must continue to identify policy spheres that have greater multiplier effects, including the generation of information and knowledge relevant to mechanization.

2020 ReSAKSS Annual Trends and Outlook Report 57
CHAPTER 6
Irrigation to Transform Agriculture and Food Systems in Africa South of the Sahara
Claudia Ringler, Dawit Mekonnen, Hua Xie, and Agbonlahor Mure Uhunamure1
1 We acknowledge support from the CGIAR Research Program on Water, Land and Ecosystems and from the Africa Union Commission Semi-Arid Food Grains Research and Development (SAFGRAD) Institute. We also thank Regassa Namara, World Bank, for data underlying Figure 6.2.
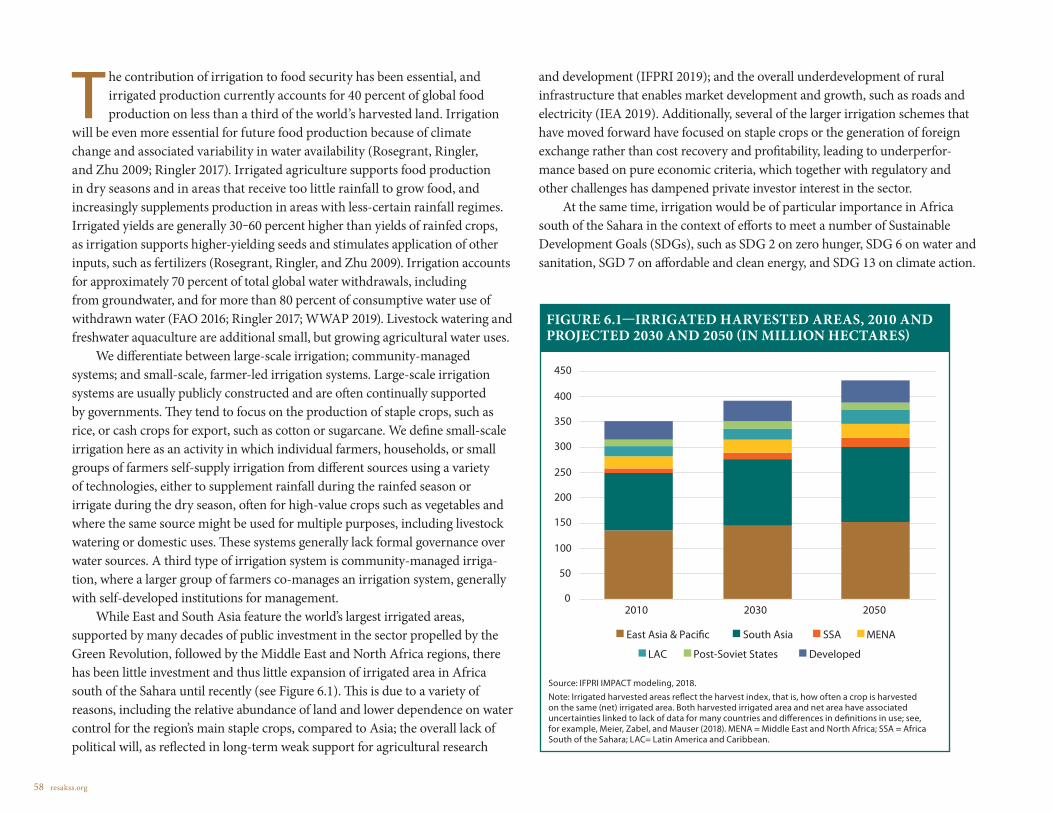
58 resakss.org
The contribution of irrigation to food security has been essential, and irrigated production currently accounts for 40 percent of global food production on less than a third of the world’s harvested land. Irrigation
will be even more essential for future food production because of climate change and associated variability in water availability (Rosegrant, Ringler, and Zhu 2009; Ringler 2017). Irrigated agriculture supports food production in dry seasons and in areas that receive too little rainfall to grow food, and increasingly supplements production in areas with less-certain rainfall regimes. Irrigated yields are generally 30‒60 percent higher than yields of rainfed crops, as irrigation supports higher-yielding seeds and stimulates application of other inputs, such as fertilizers (Rosegrant, Ringler, and Zhu 2009). Irrigation accounts for approximately 70 percent of total global water withdrawals, including from groundwater, and for more than 80 percent of consumptive water use of withdrawn water (FAO 2016; Ringler 2017; WWAP 2019). Livestock watering and freshwater aquaculture are additional small, but growing agricultural water uses.
We differentiate between large-scale irrigation; community-managed systems; and small-scale, farmer-led irrigation systems. Large-scale irrigation systems are usually publicly constructed and are often continually supported by governments. They tend to focus on the production of staple crops, such as rice, or cash crops for export, such as cotton or sugarcane. We define small-scale irrigation here as an activity in which individual farmers, households, or small groups of farmers self-supply irrigation from different sources using a variety of technologies, either to supplement rainfall during the rainfed season or irrigate during the dry season, often for high-value crops such as vegetables and where the same source might be used for multiple purposes, including livestock watering or domestic uses. These systems generally lack formal governance over water sources. A third type of irrigation system is community-managed irriga-tion, where a larger group of farmers co-manages an irrigation system, generally with self-developed institutions for management.
While East and South Asia feature the world’s largest irrigated areas, supported by many decades of public investment in the sector propelled by the Green Revolution, followed by the Middle East and North Africa regions, there has been little investment and thus little expansion of irrigated area in Africa south of the Sahara until recently (see Figure 6.1). This is due to a variety of reasons, including the relative abundance of land and lower dependence on water control for the region’s main staple crops, compared to Asia; the overall lack of political will, as reflected in long-term weak support for agricultural research
and development (IFPRI 2019); and the overall underdevelopment of rural infrastructure that enables market development and growth, such as roads and electricity (IEA 2019). Additionally, several of the larger irrigation schemes that have moved forward have focused on staple crops or the generation of foreign exchange rather than cost recovery and profitability, leading to underperfor-mance based on pure economic criteria, which together with regulatory and other challenges has dampened private investor interest in the sector.
At the same time, irrigation would be of particular importance in Africa south of the Sahara in the context of efforts to meet a number of Sustainable Development Goals (SDGs), such as SDG 2 on zero hunger, SDG 6 on water and sanitation, SGD 7 on affordable and clean energy, and SDG 13 on climate action.
Source: IFPRI IMPACT modeling, 2018.Note: Irrigated harvested areas reflect the harvest index, that is, how often a crop is harvested on the same (net) irrigated area. Both harvested irrigated area and net area have associated uncertainties linked to lack of data for many countries and differences in definitions in use; see, for example, Meier, Zabel, and Mauser (2018). MENA = Middle East and North Africa; SSA = Africa South of the Sahara; LAC= Latin America and Caribbean.
FIGURE 6.1—IRRIGATED HARVESTED AREAS, 2010 AND PROJECTED 2030 AND 2050 (IN MILLION HECTARES)
0
50
100
150
200
250
300
350
400
450
500
2010 2030 2050
East Asia & Paci�c South Asia SSA MENA
LAC Post-Soviet States Developed

2020 ReSAKSS Annual Trends and Outlook Report 59
Irrigation, in fact, is key to agricultural intensification and transformation in Africa south of the Sahara, supporting food security, nutrition, rural incomes, employment, and economic growth goals. As irrigation also contributes to lower food prices, real net incomes of consumers increase; lower costs and increased scale of production boost the competitiveness of products for increased trade. Multiplier effects from increased nonfarm employment associated with irrigation in rural and urban areas are additional benefits from irrigation.
Irrigation has been identified as a key investment to end hunger by 2025 as part of the Malabo Declaration (AUC 2014). As a result, the African Union released a Framework for Irrigation Development and Agricultural Water Management in Africa in 2019 (see additional details below). Finally, the Comprehensive Africa Agriculture Development Programme (CAADP) recognizes the development of sustainable land management and reliable water control systems as one of the four pillars for transforming agri-culture and ensuring sustainable economic development. Most of the 24 countries in Africa south of the Sahara that signed CAADP compacts with investment plans mention the need for irrigation development to achieve the envisioned food security and agricultural transforma-tion goals, and the plans generally call for a variety of irrigation investments. CAADP members’ commitment to substantially increase investment in agricultural and rural development could help cover some of the irrigation investment needs (Rosegrant, Ringler, and De Jong 2009). Similarly, many Nationally Determined Contributions in the region list irrigation development as a key climate adaptation strategy.
As in other regions of the world, irrigation has multi-plier effects in Africa. Beyond its contribution to crop production and food security, irrigation has tempered the high net food import dependency in North Africa and can reduce the growing net food import dependency in Africa south of the Sahara as well. Xie et al. (2018), for example, found that accelerated irrigation investment can effec-tively reduce food import dependency, from 54 percent under a business-as-usual scenario to a much smaller 17–40 percent, depending on irrigation technology cost
and other factors, and can also reduce the share of the population at risk of hunger and child undernutrition.
Additional potential benefits of irrigation include the production of more diverse, high-value, and nutrient-dense crops as well as irrigated fodder to intensify livestock systems, the generation of higher incomes, and the provision of water supply for domestic uses and sanitation. Irrigation can also increase women’s empowerment if women own or can drive decisions on irrigation technologies and irrigated land or if their time spent fetching domestic water and engaging in agri-cultural activities declines as a result of irrigation (Domènech 2015; Passarelli et al. 2018). All these additional benefits can only be achieved if irrigation is developed with these goals in mind.
Table 6.1 presents selected irrigation indicators for the various agroecological
TABLE 6.1—IRRIGATION INDICATORS FOR AFRICA
Total renewable
water resourcesa
Irrigation withdrawalsb
Harvested irrigated
areab
Area equipped
for irrigationa
Share of equipped irrigation potential realizeda
Potential increase in
areac
Total agricultural
water management
areaa
BCM/yr BCM/yr 000 ha 000 ha % 000 ha 000 ha
Northern Africa 103.3 79.3 8,698 6,340 85.4 1,769 7,333
Central Africa 2,856.9 1.0 58 128 0.9 1,625 139
Eastern Africa 337.0 12.1 769 621 11.0 3,450 2,788
Gulf of Guinea 1,110.6 8.8 372 576 7.8 10,005 8,003
Indian Ocean Islands
339.8 16.6 1,102 1,107 71.4 204 1,217
Southern Africa 449.3 15.3 2,076 2,063 48.1 3,655 2,407
Sudano-Sahelian
333.5 38.1 1,370 2,620 41.3 2,884 8,016
Africa South of the Sahara
5,427.0 92.0 5,747 7,115 18.4 21,284 22,570
Total Africa 5,530.3 171.2 14,445 13,455 29.0 23,593 29,903
Source: a FAO (2016); b Frenken and Gillet (2012); c You et al. (2011).Note: BCM = billion cubic meters. Total agricultural water management area is the sum of total area equipped for irrigation, which covers key large-scale irrigation systems and some smaller systems, and areas with other forms of agricultural water management (nonequipped flood recession cropping area and nonequipped cultivated wetlands and inland valley bottoms). This aggregate includes some traditional small-scale irrigation. The latest available data point is taken; some of the most recent data points are from the 1980s, and not all countries have data. Irrigation withdrawals largely refer to areas equipped for irrigation.
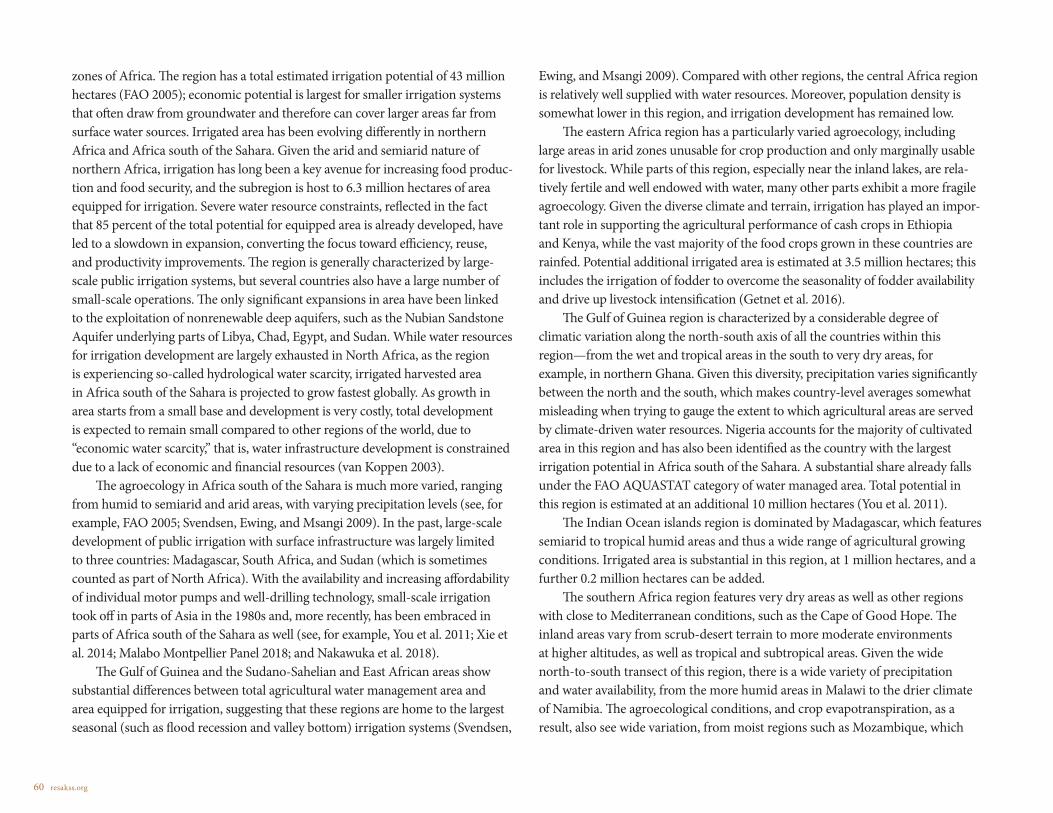
60 resakss.org
zones of Africa. The region has a total estimated irrigation potential of 43 million hectares (FAO 2005); economic potential is largest for smaller irrigation systems that often draw from groundwater and therefore can cover larger areas far from surface water sources. Irrigated area has been evolving differently in northern Africa and Africa south of the Sahara. Given the arid and semiarid nature of northern Africa, irrigation has long been a key avenue for increasing food produc-tion and food security, and the subregion is host to 6.3 million hectares of area equipped for irrigation. Severe water resource constraints, reflected in the fact that 85 percent of the total potential for equipped area is already developed, have led to a slowdown in expansion, converting the focus toward efficiency, reuse, and productivity improvements. The region is generally characterized by large-scale public irrigation systems, but several countries also have a large number of small-scale operations. The only significant expansions in area have been linked to the exploitation of nonrenewable deep aquifers, such as the Nubian Sandstone Aquifer underlying parts of Libya, Chad, Egypt, and Sudan. While water resources for irrigation development are largely exhausted in North Africa, as the region is experiencing so-called hydrological water scarcity, irrigated harvested area in Africa south of the Sahara is projected to grow fastest globally. As growth in area starts from a small base and development is very costly, total development is expected to remain small compared to other regions of the world, due to “economic water scarcity,” that is, water infrastructure development is constrained due to a lack of economic and financial resources (van Koppen 2003).
The agroecology in Africa south of the Sahara is much more varied, ranging from humid to semiarid and arid areas, with varying precipitation levels (see, for example, FAO 2005; Svendsen, Ewing, and Msangi 2009). In the past, large-scale development of public irrigation with surface infrastructure was largely limited to three countries: Madagascar, South Africa, and Sudan (which is sometimes counted as part of North Africa). With the availability and increasing affordability of individual motor pumps and well-drilling technology, small-scale irrigation took off in parts of Asia in the 1980s and, more recently, has been embraced in parts of Africa south of the Sahara as well (see, for example, You et al. 2011; Xie et al. 2014; Malabo Montpellier Panel 2018; and Nakawuka et al. 2018).
The Gulf of Guinea and the Sudano-Sahelian and East African areas show substantial differences between total agricultural water management area and area equipped for irrigation, suggesting that these regions are home to the largest seasonal (such as flood recession and valley bottom) irrigation systems (Svendsen,
Ewing, and Msangi 2009). Compared with other regions, the central Africa region is relatively well supplied with water resources. Moreover, population density is somewhat lower in this region, and irrigation development has remained low.
The eastern Africa region has a particularly varied agroecology, including large areas in arid zones unusable for crop production and only marginally usable for livestock. While parts of this region, especially near the inland lakes, are rela-tively fertile and well endowed with water, many other parts exhibit a more fragile agroecology. Given the diverse climate and terrain, irrigation has played an impor-tant role in supporting the agricultural performance of cash crops in Ethiopia and Kenya, while the vast majority of the food crops grown in these countries are rainfed. Potential additional irrigated area is estimated at 3.5 million hectares; this includes the irrigation of fodder to overcome the seasonality of fodder availability and drive up livestock intensification (Getnet et al. 2016).
The Gulf of Guinea region is characterized by a considerable degree of climatic variation along the north-south axis of all the countries within this region—from the wet and tropical areas in the south to very dry areas, for example, in northern Ghana. Given this diversity, precipitation varies significantly between the north and the south, which makes country-level averages somewhat misleading when trying to gauge the extent to which agricultural areas are served by climate-driven water resources. Nigeria accounts for the majority of cultivated area in this region and has also been identified as the country with the largest irrigation potential in Africa south of the Sahara. A substantial share already falls under the FAO AQUASTAT category of water managed area. Total potential in this region is estimated at an additional 10 million hectares (You et al. 2011).
The Indian Ocean islands region is dominated by Madagascar, which features semiarid to tropical humid areas and thus a wide range of agricultural growing conditions. Irrigated area is substantial in this region, at 1 million hectares, and a further 0.2 million hectares can be added.
The southern Africa region features very dry areas as well as other regions with close to Mediterranean conditions, such as the Cape of Good Hope. The inland areas vary from scrub-desert terrain to more moderate environments at higher altitudes, as well as tropical and subtropical areas. Given the wide north-to-south transect of this region, there is a wide variety of precipitation and water availability, from the more humid areas in Malawi to the drier climate of Namibia. The agroecological conditions, and crop evapotranspiration, as a result, also see wide variation, from moist regions such as Mozambique, which

2020 ReSAKSS Annual Trends and Outlook Report 61
has favorable areas for water-intensive crops such as sugarcane and other tropical agriculture, to other areas such as South Africa, where pastoral areas and dryland agriculture give way to irrigation of both cash and food-security crops. An addi-tional 3.7 million hectares can be irrigated in this region.
The Sudano-Sahelian region includes largely hyperarid and arid countries, such as Mali, Niger, and Sudan, but also wetter areas such as South Sudan. In these countries, irrigation is key to food production, and irrigation has been long established in parts of this region, such as Sudan, and has been expanding over the last several decades in other areas, such as in Mali. The additional irrigation potential is 2.9 million hectares.
The Policy and Institutional Framework for IrrigationWhile policy and institutions for irrigation are still nascent in most African countries, there are several Africa-wide irrigation visioning documents, and in 2019 the African Union developed a Framework for Irrigation Development and Agricultural Water Management (AWM) in Africa (AU 2020). The frame-work attempts to be a “blueprint to align and harmonize regional and national policies to accelerate agricultural growth through sustainable AWM practices,” a “framework to reinvigorate interests, promote strategic thinking and redirect investments in sustainable AWM practices,” and an “articulated continental guidance and vision on irrigation development and AWM” (AU 2020, 2).
The African Union irrigation framework covers the full spectrum of agri-cultural water management, including improved management of soil moisture in rainfed areas and watershed management, which are not addressed in this chapter, as well as farmer-led irrigation; large-scale irrigation moderniza-tion and rehabilitation; and wastewater reuse in agriculture. Specifically, the framework develops a series of pathways for irrigation that are aligned with the CAADP and Agenda 2063 objectives (see Box 6.1). Operationalization of the framework will be reflected in member state National Agricultural Investment Plans. While the framework includes important elements to strengthen irriga-tion on the continent, governance systems and specific irrigation policies will likely differ by country.
According to Svendsen, Ewing, and Msangi (2009), a country’s institu-tional framework for irrigation specifies the location of investment planning and implementation responsibilities; designates the managing entity, or set
of entities, for irrigation system operations; defines regulatory authorities; specifies revenue assessment and collection procedures; establishes dispute resolution processes; and assigns responsibility for allocating and protecting water rights. Svendsen, Ewing, and Msangi also summarize key principles that are supportive of irrigation development. These principles include (1) inte-grated water resources planning, (2) a closed financing loop, (3) beneficiaries sharing in the cost of irrigation development, (4) separating resources manage-ment functions from sector management, (5) involvement of women and men farmers in irrigation development and management, (6) organizing irrigation along hydrologic boundaries, and (7) secure water rights.
For irrigation policy and governance to be successful, various actors must be able to work together for seamless value chain development and profit generation and to ensure equity in and sustainability of water use. These actors include downstream water users, who need to have secure formal or informal water rights; a vibrant private sector and thriving markets that can provide inputs, including irrigation technology, and can absorb outputs; and a strong, highly qualified public sector that can ensure that water resources are managed sustainably and equitably.
Substantial reforms are needed in the area of water rights systems, as was recently described by Schreiner and van Koppen (2020), who noted that while statutory water laws with nationwide permit systems were introduced in several African countries in the 1990s, many of the permit systems are rooted in colonial thinking, widening inequalities in access to productive water use for millions of small-scale water users and irrigators on the continent. They suggest replacing these systems with a hybrid system that recognizes customary law while reserving permits for high-impact, large-scale commercial water users in order to increase equity in access to water for everyone. Bjornlund, van Rooyen, and Stirzaker (2017) propose the development of a business model for small-scale irrigation schemes that focuses on both input and output channels.
To secure investments for or improve the performance of large-scale irrigation systems, several countries have entered into or plan to enter into public-private partnerships for irrigation management. Examples include Dina Farm in Egypt, the Alaotra scheme in Madagascar, and Toula in Niger (World Bank 2007).
No detailed inventory of African irrigation institutions is available, but changes in some associated indicators, such as Integrated Water Resources

62 resakss.org
BOX 6.1 —THE FRAMEWORK FOR IRRIGATION DEVELOPMENT AND AGRICULTURAL WATER MANAGEMENT IN AFRICA
Given the wide variation of biophysical and socioeconomic differences in Africa, the African Union developed four pathways that countries can select and combine to achieve the 2014 Malabo Declaration targets in the recently developed Framework for Irrigation Development and Agricultural Water Management in Africa (AU 2020). Seven cross-cutting themes need to be considered in relation to each pathway.
The pathways consider the full spectrum of agricultural water management, ranging from purely rainfed areas where farmers manage soil moisture through agronomic management practices to fully irrigated areas with advanced irrigation technologies, such as automated center pivot or drip systems (see also Box 6.2). The pathways are as follows:
1. Improved water control and watershed management in a rainfed environmentThis pathway focuses on rainfed food grain areas where methods such as water harvesting and sustainable land-management practices, combined with a range of climate-smart agricultural practices, are implemented within watersheds to ensure optimal and sustainable use of water resources.
2. Farmer-led irrigation developmentThese include individual (private) irrigation systems for high-value crops as well as small groups of farmers jointly managing small irrigated areas. Irrigated areas tend to be small, often draw on groundwater resources, and focus on the production of horticultural crops.
3. Irrigation scheme development and modernization These are often larger irrigation systems, funded publicly or through public-private partnerships, that require upgrading to increase market integration and need to increase cost recovery for the continued operation and maintenance of systems.
4. Wastewater recovery and reuseWastewater reuse is a common practice in peri-urban Africa. Rapid urbanization presents an opportunity to adopt wastewater reuse as an important alterna-tive resource, but reuse is also associated with potential environmental and health impacts and thus requires strong management practices for standards and protection.
Cross-cutting themes:
1. Inclusiveness in irrigation development and agricultural water management
2. Private sector involvement
3. Climate change adaptation and resilience
4. Microcredit and farm financing mechanisms
5. Policies, institutions, and governance arrangements
6. Improving water and soil quality and other environmental problems
7. Research, monitoring, evaluation, and knowledge transfer
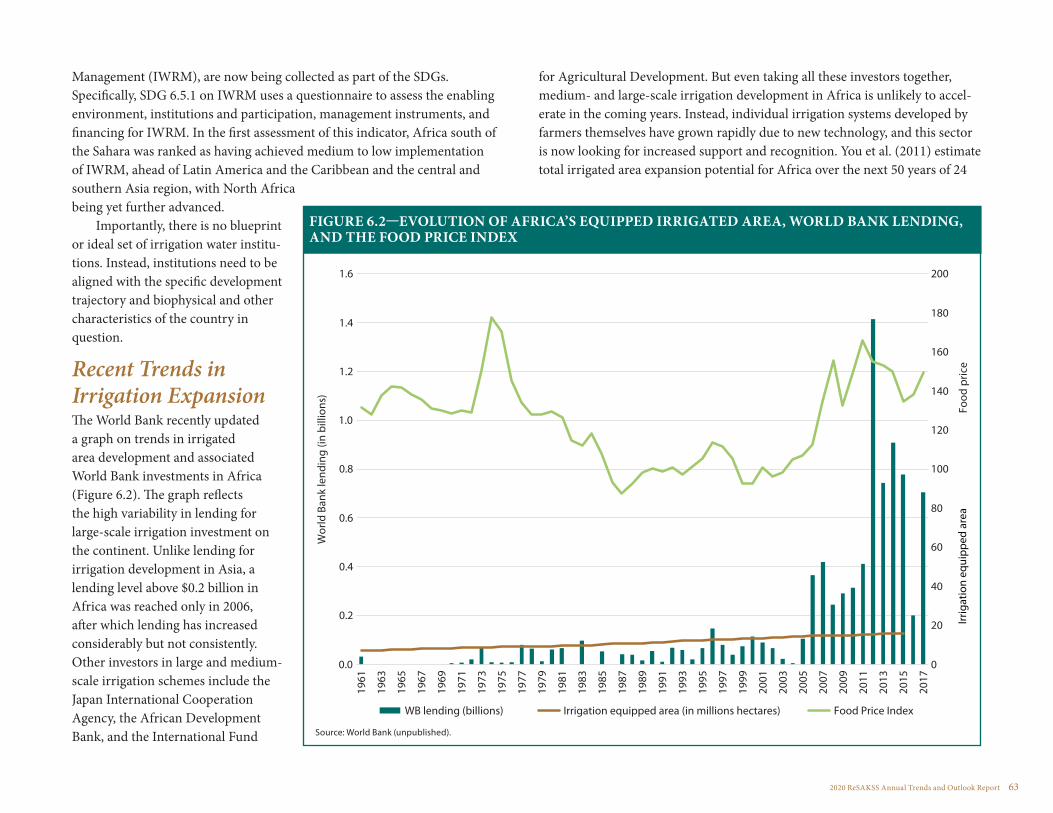
2020 ReSAKSS Annual Trends and Outlook Report 63
Management (IWRM), are now being collected as part of the SDGs. Specifically, SDG 6.5.1 on IWRM uses a questionnaire to assess the enabling environment, institutions and participation, management instruments, and financing for IWRM. In the first assessment of this indicator, Africa south of the Sahara was ranked as having achieved medium to low implementation of IWRM, ahead of Latin America and the Caribbean and the central and southern Asia region, with North Africa being yet further advanced.
Importantly, there is no blueprint or ideal set of irrigation water institu-tions. Instead, institutions need to be aligned with the specific development trajectory and biophysical and other characteristics of the country in question.
Recent Trends in Irrigation ExpansionThe World Bank recently updated a graph on trends in irrigated area development and associated World Bank investments in Africa (Figure 6.2). The graph reflects the high variability in lending for large-scale irrigation investment on the continent. Unlike lending for irrigation development in Asia, a lending level above $0.2 billion in Africa was reached only in 2006, after which lending has increased considerably but not consistently. Other investors in large and medium-scale irrigation schemes include the Japan International Cooperation Agency, the African Development Bank, and the International Fund
for Agricultural Development. But even taking all these investors together, medium- and large-scale irrigation development in Africa is unlikely to accel-erate in the coming years. Instead, individual irrigation systems developed by farmers themselves have grown rapidly due to new technology, and this sector is now looking for increased support and recognition. You et al. (2011) estimate total irrigated area expansion potential for Africa over the next 50 years of 24
FIGURE 6.2—EVOLUTION OF AFRICA’S EQUIPPED IRRIGATED AREA, WORLD BANK LENDING, AND THE FOOD PRICE INDEX
0
20
40
60
80
100
120
140
160
180
200
0.0
0.2
0.4
0.6
0.8
1.0
1.2
1.4
1.6
1961
1963
1965
1967
1969
1971
1973
1975
1977
1979
1981
1983
1985
1987
1989
1991
1993
1995
1997
1999
2001
2003
2005
2007
2009
2011
2013
2015
2017
Food
pric
e
Wor
ld B
ank
lend
ing
(in b
illio
ns)
WB lending (billions) Irrigation equipped area (in millions hectares) Food Price Index
Irrig
atio
n eq
uipp
ed a
rea
Source: World Bank (unpublished).

64 resakss.org
BOX 6.2 —AGRICULTURAL WATER MANAGEMENT IN AFRICA: A BROAD FIELD
Appropriate agricultural water management requires the use of a hydrologically grounded watershed lens. Water availability for irrigation and rainfed agriculture can be improved and variability reduced through judicious management of upstream watersheds, including reforestation and the maintenance of natural vegetation buffers, and the use of conservation agricultural practices (or abandonment of farming) on steep slopes in these important water generation areas. Ethiopia and Kenya are examples of countries that have invested or are heavily investing in upper or total watershed management.
Key technologies for rainfed water management include rainwater harvesting, conservation agriculture, minimum tillage, agroforestry practices and precision agricultural technologies that optimize soil moisture levels, and climate information systems. With increased climate variability and change, improving rainfed water management will become increasingly important but also increasingly challenging, risking the food and livelihood security of farmers relying on rainfed agriculture and requiring supportive extension and social security mechanisms.
In small-scale systems, individual water-lifting devices have advanced from shallow, hand-dug wells and manual water-lifting methods such as buckets to shallow and deep tubewell-supported solar irrigation pump technologies. Farmers tend to prefer solar irrigation technologies over more labor-intensive manual technologies and diesel and electric pumps where variable fuel or electricity costs can be high. However, solar-powered irrigation technologies can also contribute to water degradation and depletion. Like large-scale systems, small-scale irrigation additionally benefits from the use of water management tools such as wetting front detectors to avoid the over- or under-watering of crops and other precision agricultural technologies.
To improve water management, strengthen irrigation management transfer policies, and increase user participation, water user associations have been developed in several African countries for medium-scale and larger irrigation systems (see, for example, Yami 2013), in addition to the development of public-private partnership arrangements. Other systems have incorporated precision agricultural technologies, such as soil moisture sensors, or are providing irrigators with climate information (such as a pilot in the Gash River Basin in Sudan) (Amarnath et al. 2018). Other advanced irrigation technologies, such as drip and sprinkler technologies, can further increase crop production and on-field water use efficiencies regardless of scheme size but might also contribute to water depletion for downstream water users (Grafton et al. 2019). Ensuring collective action around agricultural water management is particularly challenging across large numbers of individual irrigators but can be supported by social and behavioral change interventions, such as experimental games (see, for example, Meinzen-Dick et al. 2018).
Increased investment in the development of machinery that improves profitability and labor productivity would support agricultural transformation, as would continued expansion of electricity access in rural areas, both directly for irrigation and for cold storage of irrigated produce and agro-processing (Borgstein, Mekonnen, and Wade 2020).
Innovation in these systems goes beyond more affordable precision irrigation systems and includes increased investment in agricultural research and development with a focus on crop varieties that are tolerant to drought, heat, submergence, and salt. Development of nutrient-use-efficient varieties with increased transpiration efficiency can also help transform water-stressed agricultural systems in Africa.
All these agricultural water management systems benefit from enhanced soil nutrient information as well as improved fertilizer and pest management to reduce water pollution, including salinization, nitrate pollution, and other forms of toxicity that increasingly reduce access to safe water for downstream agricultural and other uses.

2020 ReSAKSS Annual Trends and Outlook Report 65
million hectares, a 177 percent increase over the existing equipped irrigated area of 13 million hectares. Most of this area, 21 million hectares, would be in Africa south of the Sahara (Table 6.1). Some of this area is currently reflected in flood recession and valley bottom irrigation, but much would draw on new groundwater pumping, using diesel pumps and, increasingly, solar irrigation pumps.
The economic potential for expansion is critically dependent on the cost of irrigation, which includes the costs of the technology used, additional labor, increased agrochemical use, and better seed. Irrigation technology costs for small systems directly owned by individual farmers can range from several hundred to several thousand US dollars per hectare. As a result, small-scale irrigation is most viable for cash crops or high-value food crops that generate revenues in excess of US$2,000 per hectare. The potential for expanding small-scale irrigation by farmers for the irrigation of staple crops is limited. At the same time, public, large-scale systems can cost US$3,000 to US$8,000 per hectare or more if dams, roads, electricity, and agro-processing infrastructure are constructed as part of the irrigation system. Such systems are generally justified by reductions in food import dependency for key staple crops or by earnings of foreign exchange from cash crops, such as cotton, tobacco and sugarcane. These systems also often provide additional services, such as domestic water supply and employment opportunities in associated agro-processing (Rosegrant, Ringler, and De Jong 2009).
Given the slow development and lower cost-effectiveness of large-scale irrigation projects, much effort in Africa south of the Sahara has been placed on analyzing the potential and ways to accelerate small-scale irrigation invest-ment. Moreover, several development partners, including the Bill & Melinda Gates Foundation, USAID, the Alliance for a Green Revolution in Africa, and the World Bank have recognized and are starting to support expansion of this sector.
While this chapter focuses specifically on irrigation, Box 6.2 describes a broader range of water management interventions and practices, ranging from fully rainfed agriculture to intensive, high-tech irrigation. In between are prac-tices such as conservation agriculture, water harvesting, and supplementary irrigation (during the rainy season).
Key Concerns for Future Irrigation Development: Equity and Sustainability Equity ConcernsAll types of irrigation are associated with equity concerns. Even with rapid irriga-tion development over the next two decades, irrigation will remain out of reach for most poor farmers (Lefore et al. 2019). The key reason for this is that water resources are limited and most resources are costly to develop. Construction of roads to transport farm inputs as well as move irrigated products to markets is a typical cost component of African large-scale irrigation systems. The need to construct rural roads, electricity systems, and sometimes storage systems makes large-scale irrigation particularly expensive in Africa south of the Sahara. More remote rainfed or small-scale irrigated areas lack such roads. Large-scale systems also face gender equity challenges. Water user associations are often limited to land title holders in irrigated areas and thus to men. When women do participate in associations or have decision-making roles in irrigation, they some-times behave more altruistically, reducing their own income (see, for example, Lecoutere, D’Exelle, and Van Campenhout 2015).
If water resources are available, or can be developed through storage or another form of harnessing precipitation or drawn from aquifers, then irrigation technologies will be needed to transfer water from the source to the crop field. However, preferred irrigation technologies such as diesel or solar pumps remain out of reach for the poorest farmers, and women farmers face additional chal-lenges in obtaining information on irrigation technologies and securing collateral to finance the technology and benefit from it. The increased labor requirements of irrigation (compared to not growing a crop in the dry season) also pose disad-vantages, particularly for women.
In the small-scale irrigation sector, women tend to use manual irrigation methods, while men use more advanced technologies such as sprinklers and drip kits. In addition, regardless of the system, women have less time available for irrigation activities. This is a particular challenge in individual irrigation, as it limits women’s options for irrigating larger areas, particularly if access to advanced irriga-tion technologies is limited (Lefore et al. 2019; Theis et al. 2018) (see also Box 6.5).
Underdeveloped technology supply chains also hamper progress: private-sector irrigation equipment suppliers have a limited presence in most developing countries and do not target remote areas or smallholder farmers. Finally, women

66 resakss.org
BOX 6.3 —SOLAR IRRIGATION IN SOUTHERN AFRICA: FROM THE FRYING PAN INTO THE FIRE?
Southern Africa has ample capacity to expand solar systems for various purposes, including electricity generation but also solar-powered irrigation. Using renewable energy, solar-powered irrigation systems can offer reliable, relatively low-cost clean energy alternatives to the more commonly found diesel pumps. Solar pumps run with daylight and require limited maintenance, and high-quality solar photovoltaic pumping systems have a lifespan of 20 to 30 years (including the power unit and pump itself ). The cost-effectiveness of solar pumping systems depends on many factors, such as diesel fuel costs and the installed costs of solar pumping systems, and may vary spatially (Malabo Montpellier Panel 2018).
Xie, Ringler, and Mondal (under review) compared the cost-effectiveness of groundwater pumping for irrigation for solar photovoltaic and diesel generators. Specifically, the authors compared costs under a range of crop and irrigation methods. A key factor determining the final results is the diesel price in southern African countries. At a breakeven point of US$2 per watt peak, solar is the preferred solution for more than 80 percent of all crops and irrigation systems considered (see Box 6.3, Figure 1).
While fuel prices add an element of variable cost into irrigation pumping, this cost falls away with the switch to solar irrigation. Solar irrigation thus risks the overdrafting of groundwater resources in southern Africa, a region that is already highly water stressed and was in the news not too long ago for water shortages in Cape Town. Groundwater depletion as a result of “free” energy has been observed at large scale in parts of India, where, among other factors, electricity costs for groundwater pumping were removed.
Addressing this challenge will require sustainable groundwater management to balance supply and demand. Supply-side measures may include artificial recharge, aquifer recovery, or the development of alternative surface water sources, while demand-side measures generally focus on water use rights and permits, collective management, water pricing, legal and regulatory control, and water-saving crops and appropriate technologies. Once groundwater depletion becomes serious, halting expansion of irrigated crop areas and changing crop varieties might be the only options.
FIGURE 6.3—COST-EFFECTIVENESS OF SOLAR VERSUS DIESEL PUMPING IN SOUTHERN AFRICA
0 5 10 15 20 25 30 35
Maize+�ood irrigation
Wheat+�ood irrigation
Tomatoes+drip irrigation
Tomatoes+�ood irrigation
Onions+drip irrigation
Onions+�ood irrigation
Chickpea+drip irrigation
Chickpea+�ood irrigation
Common beans+drip irrigation
Common beans+�ood irrigation
Sugarcane+�ood irrigation
Banana+�ood irrigation
Cropland area with irrigation possibility (million ha)
Solar Diesel
Source: Xie, Ringler, and Mondal (under review).
2020 ReSAKSS Annual Trends and Outlook Report 67
are often excluded from access to information and training, from extension services, and from decision making, all of which reduce their ability and incen-tives to invest in irrigation technologies.
Environmental ConcernsIf not managed and governed within the context of the wider landscape and other water users’ needs, accelerated investments in smallholder irrigation could pose significant risks to environmental and human health. Sustainable development has already been exhausted in much of northern Africa and parts of southern Africa (Altchenko and Villholth 2015; Table 6.1 (FAO 2016)).
The emerging spread of affordable solar-pump technologies in Africa may enable access to irrigation in the more than two-thirds of Africa’s rural areas that are not yet linked to the electric grid, but this increased use could also lead to much more rapid drawdown of groundwater resources as well as to depletion of associated surface water resources and aquatic biodiversity (Box 6.3).
Current projections out to 2050 suggest that Africa will experience the world’s fastest increase in agricultural water pollution, particularly nitrogen and phosphorous pollution, albeit from low levels (Xie and Ringler 2017), with agricultural intensification spurred by irrigation as a key contributor to this trend. Inappropriate use of chemicals for fertilizer and pest management is not uncommon, despite many farmers’ limited access to such inputs. Some pesticides in use by small-scale farmers, including persistent organic pollutants that remain toxic in the food chain long after use (Pretty 2018; Teklu et al. 2016), also pose a high risk to aquatic organisms. Currently, many countries in the region lack national guidelines on allowable levels of agrochemicals in water sources, as well as the technical facilities and experts required for testing and the institutional mechanisms to regulate, monitor, and enforce standards. There is currently no long-term agricultural water quality monitoring in the public domain in Africa south of the Sahara.
According to Lefore et al. (2019), the lack of rural institutions to manage natural resources collectively, including groundwater and surface water, will further restrict access by the resource-poor and will likely contribute to serious environmental degradation in some places. While farmers in some areas do manage irrigation water sources in collective systems, such as in Tanzania and Malawi, few such instances are documented, and potential for expansion is likely
limited (de Bont et al. 2018). Moreover, most countries in Africa south of the Sahara lack effective institutions for water governance from local to watershed levels. While many places have traditional systems in place, these may not be well suited to address new and emerging environmental challenges such as water pollution and groundwater depletion that are complex and costly to measure and monitor, and whose solutions are difficult to enforce for the same reasons. The capacity of such institutions needs to be strengthened and big data and other tools need to be used to enable simplified yet robust measurement and moni-toring. In addition, community involvement in managing water scarcity during drought or when groundwater tables decline has yet to be developed in many places (Nigussie et al. 2018; Stein et al. 2011). At higher levels of governance, absent or ineffective institutions and regulatory mechanisms deepen the threats posed by a rapid increase in irrigated production. This trend may continue in the medium to long term as natural resources become increasingly valuable, and therefore contested.
The Way Forward for Sustainable, Nutrition- and Gender-Sensitive Irrigation Development in the RegionMeasure and Monitor Irrigation and PollutionAs this chapter has shown, information on irrigation development (quantity of water used) remains extremely limited in Africa, particularly in Africa south of the Sahara. It is challenging to support irrigation to become an engine of agricultural transformation without sufficient information on the location, size, and manage-ment of the many small-scale, communal, and public irrigation systems in Africa. New remote sensing and crowdsourcing tools should be used to help governments measure and monitor irrigation. A particular challenge in measuring and monitor-ing irrigation relates to groundwater irrigation, which tends to be more dispersed and often without basic information on aquifer size. Finally, with water pollution rapidly increasing in Africa, it will be essential to develop long-term agricultural water pollution-management systems that are in the public domain as well as to improve precision agricultural technologies for crops under all types of irrigation systems to reduce environmental degradation and pollution.

68 resakss.org
Accelerate Irrigation Development through Linkage with EnergyEnergy use in agriculture has only recently increased in Africa south of the Sahara. Irrigation development, particularly from groundwater resources which represent the largest source for irrigation development in the region, requires concurrent investment in clean and affordable energy. Xie et al. (2014) estimate that Africa south of the Sahara has the potential to profitably irrigate 30 million hectares of land using motor pumps. So far, groundwater pumping has tended to rely on diesel pumps, which have high variable costs as well as adverse impacts on the environ-ment (Box 6.4). As solar panels become more affordable over time, solar photovoltaic technologies, with their low carbon footprint, have been identified as high-potential solu-tions for rural electrification as well as water extraction for both domestic and irrigation purposes in Africa south of the Sahara (Schmitter et al. 2018).
Strengthen Water and Related Institutions to Support Sustain-able Irrigation DevelopmentWhile a growing number of irrigation frame-works and policies have been developed, including the recent African Union irrigation framework, national and local water institu-tions are often weak and not attuned to emerging challenges, such as those involved in supporting and regulating many thousand
BOX 6.4 —MAKING A LIVING AS AN IRRIGATOR IN ETHIOPIA
Abera Tesfaye (name changed) is a 28-year-old farmer who rented 2 hectares of land to produce irrigated tomatoes around Lake Koka, in the Rift Valley of Ethiopia. He uses groundwater, taking advantage of the high groundwater table due to the nearby lake. He uses a small diesel pump (purchased at a cost of US$500) to lift water from the ground and uses furrow irrigation to apply water in the field. It takes Abera two days and 75 liters of diesel to fully irrigate his farm. A liter of diesel costs him 22 birr (US$0.70), or a total of US$53 for one irrigation. For a one-month-old tomato plant, he needs to irrigate twice a week, which amounts to a fuel cost of US$424 per month. However, water requirements almost double at two months, and so does the fuel cost. Over the growing season, Abera spends more than US$1,000 on irrigation, which is more than US$300 above the average income in Ethiopia (US$767 in 2019). Abera currently uses two diesel pumps on his farm; two other pumps broke without anyone being able to repair them. And this does not even consider the costs of other crop inputs, such as labor, fertilizer, and pesticides. Plant diseases and price uncertainties are further challenges for small irrigators that are difficult to overcome.
The arrival of solar and electric motor pumps, however, can change the economics of groundwater irrigation in Africa and can enable farmers like Abera to expand the area they irrigate and attract more farmers to irrigation. Borgstein, Mekonnen, and Wade (2020) recently estimated a daily energy requirement of 0.45 kilowatt-hours to irrigate 0.4 hectares of land using an electric pump in Ethiopia. Using an estimated general tariff rate of 2.124 birr per kilowatt-hour and additional service charges by the utility, with five days of irrigation per week, the total energy cost per month would be less than US$7, about a tenth of what Abera pays for diesel to irrigate a similarly sized piece of land. The cost of energy is further reduced with solar pumps. The key constraint for African farmers not to adopt these technologies is the up-front capital expenditure to purchase such pumps. As the cost of these solar and electric pumps decreases, the recent boom in small-scale irrigation in Africa should flourish further. For this to happen, however, there is a need for intentional programmatic support in extension services, improved supply chains of equipment, enhanced value chain infrastructure, and enabling financial mechanisms (Borgstein, Mekonnen, and Wade 2020). Image source: Dawit Mekonnen.

2020 ReSAKSS Annual Trends and Outlook Report 69
individual irrigators, governing groundwater resources, or addressing water pol-lution. It is important that the public sector invest in these capacities to ensure that irrigation can accelerate the agricultural transformation on the continent.
In particular, the sustainable and profitable development of small and larger solar-powered groundwater irrigation systems requires high-resolution spatial understanding of the potential for shallow groundwater and access to low-cost solar pumps, even in remote areas, as well as access to financing mechanisms and loan products that are flexible in their collateral requirements and repay-ment schedules, reflect local cultures and are accessible to women farmers. Many other measures needed for agricultural intensification and transformation highlighted in this volume can also support the sustainability of irrigation, such as secure land tenure, appropriate near-term climate information, and the use of precision agricultural tools.
Strengthen the Benefits Gained from IrrigationIrrigation, regardless of the type of system, can enhance household dietary diversity and the nutritional status of women and children, in addition to its role in increasing productivity, yields, and farm incomes (see Domènech 2015; Passarelli et al. 2018; Mekonnen et al. 2019; Baye et al. 2019). However, the potential for nutrition impacts is particularly significant for small-scale irriga-tion. To the extent that irrigation can be found to improve nutrition, it should be promoted based on its ability to improve the nutritional status of house-holds, women, and children, and not only as a yield-improving agricultural intervention. To achieve this nutrition impact, a series of measures need to be undertaken during the design of irrigation investments, including (1) mainte-nance and improvement of the natural resource base underlying water and land management; (2) incorporation of nutritional considerations into the design of projects; (3) engagement of cooperatives, agricultural extension services, and water user associations on nutrition and dietary considerations; (4) leveraging of community platforms to deliver nutrition messaging; (5) empowerment of women in irrigation interventions; (6) promotion of nutrient-dense crops and incorporation of home-gardening components into irrigation projects; (7) design of formal multiple-use water systems that are culturally appropriate and safe; and (8) mainstreaming of irrigation into community-based platforms for rural service delivery (Bryan, Chase, and Schulte 2019).
Enable Irrigation for All For irrigation to become available to a larger number of farmers, technology costs need to continue to decline, while other rural infrastructure such as electricity, rural roads, and markets needs to continue to improve. For long-term equity, stronger public sector support will be needed to ensure formal
BOX 6.5 —WOMEN, WATER, AND IRRIGATION
According to Theis et al. (2018), increasing the equity and inclusivity of irrigation will require advances in four areas of the irrigation development cycle:
1. Design. Women’s preferences regarding the design of irrigated areas often differ from those of men. These preferences relate to the location or portability of irrigation technology, its suitability for multiple uses (drinking water, irrigation, livestock watering), associated labor requirements, the social acceptability of use, and up-front and operational costs.
2. Dissemination. There is evidence that traditional channels providing information about irrigation technology do not reach women farmers. Channels that can effectively reach women and thus support adoption and use of irrigation technology include women community leaders, savings groups, frontline health workers, and women-led farmer and producer groups.
3. Adoption. Women face a long list of constraints to the adoption of irrigation technologies. They include lack of or limited access to irrigable land, water, labor, credit, and markets to buy inputs and sell irrigated produce. Additionally, women often need their husbands’ consent to purchase technologies, including irrigation technologies.
4. Use. Ownership of irrigation technology by women does not guarantee access, and use can also be influenced by differential workloads, power to decide the plots on which to use the technology, and differential control over the income from irrigated produce.
70 resakss.org
or informal water rights and to regulate water use and address water pollution. Importantly, the total irrigation potential in Africa remains limited, particularly in arid and semiarid regions of the continent, and only a limited share of farmers will eventually benefit from irrigation.
Irrigation can be associated with women’s empowerment to the extent that it is accompanied by interventions that enable women’s capacity to make decisions on what crops to produce, where to sell the produce, and how to use the increased farm revenues from irrigation. Shifts from irrigation using buckets and watering cans to improved water-lifting technologies such as motorized pumps reduce drudgery and the amount of time women spend on irrigation. In larger systems, quotas and other ways to ensure equitable representation of farmers in decision-making bodies will be essential to ensure that irrigation benefits and empowers all farmers. Theis et al. (2018) describe steps that need to be undertaken to increase the gender sensitivity of irrigation initiatives (Box 6.5).
The ability of irrigation to support agricultural transformation in Africa will thus require a focus on clean energy, combined with good governance, a focus on nutrition sensitivity, and a focus on women’s empowerment. Only then will agricultural systems be able to transform to support improved livelihoods and sustainable and equitable rural growth in the region.

2020 ReSAKSS Annual Trends and Outlook Report 71
CHAPTER 7
Policy Responses to Rapidly Transforming Midstream Value Chain Segments in Africa: The Case of the Millet Sector in Senegal
Getaw Tadesse and Ousmane Badiane
72 resakss.org
Reflecting the faster pace of economic growth and recovery among African countries, African agricultural value chains have been transforming and modernizing rather rapidly over the last two
decades. The regained dynamism of agricultural value chains is observable both in terms of growing foreign export volumes and in expanding local food markets. For instance, the real value of African agricultural exports has increased from less than US$20 billion in 2000 to more than US$60 billion in 2013, a threefold increase in less than two decades (Traore and Sakyi 2018). The volume of marketed food in local markets has expanded sixfold over the last 40 years, with much of that growth taking place in the 1990s and 2000s (Reardon et al. 2015). Moreover, current projections indicate that agrifood markets in Africa will expand by another 600 percent in the next four decades (Haggblade 2011).
Major drivers behind this rapid pace of expansion and transformation include a rapid rate of urbanization (the fastest in the world), an equally rapidly rising middle class, and a still young and growing population, all of which are fueling a booming demand for food, in particular processed food, in local and regional markets (Tadesse 2018). As a result, experts project that by 2040, two-thirds of the demand for traditional staples will consist of processed foods (Badiane and Ulimwengu 2017; Tschirley et al. 2015).
Currently, growth in food demand is far outpacing growth in production, despite record rates of agricultural sector growth, leading to rising food imports and a widening food trade gap in recent times (Traore and Sakyi 2018). The dynamics of local food markets therefore offer considerable opportunities to boost enterprise creation and growth in domestic value chains and promote agro-industrialization. This effort calls for well-thought-out and well-designed public policy interventions that respond to the needs of economic actors along all key segments of agricultural value chains.
While encouraging, the transformation described above is at the very beginning stage and comes in the aftermath of several decades of decline and stagnation in Africa’s agricultural sector. Accelerating and deepening the modernization of traditional value chains must be a key component of national strategies to restore and maintain growth in the agricultural sector on the trajec-tory of rapid growth of the 1960s (Badiane and Makombe 2015). Currently,
1 “Mid-chain segment” is used here to refer to those actors or activities at the midstream of the value chain. Specifically, mid-chain segments are wholesalers (wholesaling), processors (processing), retailers (retailing), and other support-providing activities such as logistics. “Mid-chain” is used synonymously with “midstream.”
processing and other mid-chain segments1 constitute the main bridge linking smallholder farmers to food demand, which is increasingly dominated by middle-income consumers in rapidly growing and advancing urban markets (Tschirley et al. 2015). The performance of the domestic processing sector and related segments will, therefore, determine the performance and future growth potential of smallholder producers. Public policies to boost the performance of the emerging processing sector and other mid-chain segments will be at the heart of efforts to promote rural development, improve nutrition outcomes, and enhance prosperity in African economies.
In principle, value chain development interventions should aim to capitalize and sustain emerging transformations driven by local, regional, and global trends instead of trying to induce transformation from “ground zero” (Stamm 2004). This approach requires the alignment of policy targeting and prioritization with the changing needs of the rapidly transforming value chains, which are charac-terized by a number of features that were less pronounced in the traditionally shorter staples value chains that barely extended beyond production centers and their satellite rural towns (Badiane and Ulimwengu 2017).
Today’s longer value chains reach far beyond larger cities and megapolises into the wider regional markets. They involve a much broader and rapidly growing set of economic actors across old and new segments, including trans-port, processing, packaging, distribution, branding, grading, safety, and so on. They tend to be dominated by a large and rising number of small and informal enterprises engaged primarily in processing and retailing activities that are struggling to meet the equally rapidly changing dietary preferences of a more sophisticated urban middle class. Value chain policies in this context not only need to deal with the complex set of challenges and opportunities across all key segments, but they also need to be able to adapt to changing technology and market trends.
This chapter aims to assess the performance of and policy responses to Africa’s rapidly emerging traditional staples value chains, which are dominated by small and medium-sized enterprises (SMEs) in the processing and trading segments. It addresses questions related to policy process issues such as (1) whether public intervention policies in Africa are in line with the needs and performance of the rapidly transforming value chains, and (2) how African

2020 ReSAKSS Annual Trends and Outlook Report 73
governments should align policy interventions in emerging mid-chain segments to foster effective value chain development. The chapter uses the example of one of the most dynamic and fastest-growing staples value chains in Africa, the millet value chain in Senegal, thus contributing specifically to Senegal’s agro-industrial policy discourse. We begin with a review of value chain development evolution as a concept and in practice in Africa as a whole and outline a comprehensive list of critical policy concerns and priorities that must be addressed to respond to the needs of midstream value chain segments.
Review of Value Chain Development Policies in Africa The concept of value chain development first emerged as a business development strategy of private-sector companies in the 1980s (Girvan 1987; Porter 1985, 2001). The original concept rests on the idea that a firm can develop strategies to improve and maintain its competitive advantage by disaggregating its core activities and quantifying the value of each activity (Stamm 2004). Lately, this firm-level analysis has been extended to entire supply chains and distribution networks. As a result of the shift in focus from firm to system levels and a more evident link between growth driven by the private sector and poverty reduction, the concept of value chain development attracted public investors such as donors and governments in the late 1990s (Altenburg 2007).
Though the idea of developing the entire range of agricultural actors has long existed, value chain development as an agricultural transformation strategy became prominent in the 2000s (Altenburg 2007). The emergence of value chain approaches helped address the long-standing development issue of farmers and other producers of primary commodities receiving only a fraction of the retail price of the end products created from those commodities. This approach has helped policymakers focus on the entire chain, from production to consumption, of a specific commodity and is increasingly seen as an important approach to agricultural development that explicitly recognizes the role of the private sector and the fact that agricultural markets and institutions rarely function efficiently. It goes beyond interventions that develop input and outputs markets in general to making more focused interventions to improve the competitiveness of selected commodities.
In addition to fostering agricultural transformation to meet the ever increasing and diversified urban food demand, value chain development has been praised for its role as a poverty reduction strategy (Horton et al. 2016). It has also helped policymakers rethink the need to transform the long-lived trends of exporting primary products and importing processed food products and creating value and employment opportunities for the rapidly growing young population (Monga, Shimeles, and Woldemichael 2019).
Recognizing all these benefits, the African heads of state, through the Malabo Declaration of 2014, adopted value chain development as one of the key areas of the Comprehensive Africa Agriculture Development Programme agenda (AUC 2014). The strategy advocates the importance of targeted public investment in selected value chains for which a country has a competitive and comparative advantage, focusing around three major objectives: (1) commercializing small-holders, (2) improving agricultural markets, and (3) boosting and sustaining agribusiness and agro-industries.
The first two objectives above are dealt with in other chapters of this report. When it comes to boosting and sustaining agribusiness and agro-industries, public policies have for many decades failed to recognize the central role played by the private sector. The role of the private sector has since been increasingly acknowledged, starting with the major reforms carried out in the 1980s under the structural adjustment programs and accelerating with the recent embrace of the concept of value chain development as an agricultural transformation strategy in the late 1990s (UN 2001; AUC 2014;). Previously, middlemen and other private sector actors were perceived rather negatively as “exploiters” or “rent seekers” (AGRA 2019). Many governments were extremely reluctant to recognize the central and positive role of the private sector in agriculture (Stampini et al. 2013). With acceptance of the role of the private sector well established, more attention is now being paid to issues such as competitiveness, sector transformation, and inclusiveness in agribusiness and agro-industries. As a result, the private sector today accounts for the largest share of actors involved in agricultural trading; processing; and services such as agricultural finance, input distribution, and transport operation, among others (Stampini et al. 2013).
The strong rationale for supporting the private sector in agrifood value chains stems from the need to create jobs for the growing number of unemployed youth and to encourage creativity and innovation (Michael and Pearce 2009;

74 resakss.org
Dodgson 2000). Governments pursue these policy objectives using two types of public interventions. Public policy interventions in the first category, focusing on incubation and other enterprise-level measures, tend to be more adapted to the needs of traditional staples value chains, which are dominated by millions of small enterprises facing a myriad of barriers to access services, technology, financing, or markets. Most of the private enterprises in agricultural value chains are SMEs, the majority of which lack basic experiential and financial capacities. Support strategies often tend to focus on the incubation of SMEs to facilitate access to technology, financial services, and networking. There is strong evidence of the benefits of providing financial intermediation and other support to incu-bated small businesses in the short term (Blattman, Fiala, and Martinez 2018; Blattman, Dercon, and Franklin 2019).
Interventions in the second category are more aligned with the needs of large-scale agro-industrial enterprises in global or traditional export value chains, such as those of vegetable oils, tropical beverages, cotton, sugar, and so on. These interventions are made at the value chain level, targeting job creation for youth. A prominent example is the practice of establishing agro-industrial parks or zones to facilitate linkages among value chain actors, boost access to services, encourage innovation, reduce transaction costs, and enhance competitiveness.
Whether one is dealing with SMEs or large-scale agro-industrial enterprises, public policy interventions can broadly be classified into three domains, which we refer as the three I’s of value chain development policy: infrastructure, institutions, and incentives (Badiane et al. 2015; Donovan et al. 2015). Policy interventions in the infrastructure domain seek to overcome obstacles that impede, and thus raise the cost related to, the provision or movement of goods and services. Ultimately, they reduce firms’ cost of access to needed technologies, services, and markets. The same applies to policy interventions targeting the incentives domain, with the difference that policy measures here focus primarily on rewarding (or sanctioning) desired (or undesired) business operations. Policies in the institutions domain, in contrast, define the rules of the game to facilitate efficient operations and transactions by firms and economic actors.
Policies in the incentives domain tend to be of a corrective nature, as they seek to protect or empower a specific group of actors in some part of a value chain to make business decisions or carry out transactions that would not otherwise take place in the context of existing infrastructural and/or institutional
environments. In that sense, these policy interventions tend to correct or compensate for failures in the infrastructure and institutional spheres. The effectiveness and net welfare benefit of the various polices depend on the extent to which they are effectively targeted to the right segments and actors along the value chain as well as the timing of their rollout over the stages of value chain growth and firm maturation.
In all policy domains, real policy planning and implementation challenges persist and significantly determine the success or failure of the interventions. A first major policy concern relates to the extent of complementarity among infrastructural and institutional support. A classic example is the promotion of extension services to deliver improved production services without accom-panying investments, policies, and regulation to boost transport and market infrastructure. More recent cases include efforts to extend access to mobile technology without the necessary institutional and regulatory arrangement to stimulate ag-tech services and content creation (Tadesse and Bahiigwa 2015); warehouse receipt system and commodity exchanges (Sitko and Jayne 2012); and emerging industrial parks (Boamah and Sumberg 2019; Ulimwengu and Jenane 2019).
A second set of concerns relates to the scalability of successful interventions. Conway, Badiane, and Glatzel (2019) argue that several good practices have contributed to the recent progress in terms of economic growth and poverty reduction in Africa. But sustaining and expanding such growth and poverty reduction depends on the capacity to scale up these innovations and broaden their reach, both at the enterprise level and at the value chain level.
A third concern revolves around the effective combination of public policy interventions to enhance entrepreneurship in agribusiness value chains—for instance, the combination of training with financial support interventions. An experimental study of interventions providing business training with and without financial grants has shown that business training alone improves business practices but not business profits, sales, or capital stock. However, the combina-tion of grants plus training increases business profitability, but only in the very short run (De Mel, McKenzie, and Woodruff 2012). Other evidence confirms that the provision of business grants with training improves the performance of investments in income-generating enterprises, more than do subsidized microcredits with training (Tadesse and Zewdie 2019). Many studies confirm that

2020 ReSAKSS Annual Trends and Outlook Report 75
entrepreneurship business training can generally improve the performance and business practices of youths and SMEs, provided that the training is well targeted and comprehensive (Al-Awlaqi, Aamer, and Habtoor 2018; Gielnik et al. 2017; Krause, McCarthy, and Chapman 2016; Ladzani and Van Vuuren 2002).
The fourth and probably most important concern relates to the adequacy and prioritization of policy responses to emerging and continuing changes in agrifood value chains. As staples value chains continue to transform, new segments and clusters, more and larger enterprises, and a rising number of more diverse and specialized actors enter the chain. This in turn leads to a steadily changing landscape of obstacles, challenges, and opportunities that call for different policy responses. Thus, an effective public policy response must align with emerging needs and constraints in order to sustain and accelerate the transformation process: the prioritization of sectors and market actors must be revisited, new policy solutions identified, and failed policies replaced by successful ones, among other efforts. If these are done, , the timeliness and orderliness of interventions play a significant role in determining policy effectiveness and outcomes (Sonobe and Otsuka 2011).
Performance of Midstream Segments of the Millet Value Chain The Role of Millet in the Senegalese Economy and Policy Millet is one of the main cereals grown under rainfed agriculture in Senegal, in addition to sorghum and maize. It is the first agricultural staple in Senegal and covers 42.9 percent of total harvested areas (Fall and Dièye 2008). Millet and sorghum represent 69 percent of the area planted with cereals (MAER 2018). They are grown either in continuous pure cultivation in box fields, or in rotation with groundnuts, or in mixed crop with cowpea. The main production regions are in the center (Groundnut Basin) and in the south of the country (Casamance, Tambacounda).
Millet has a prominent place in Senegal’s food security strategies.I It has long been the daily food staple for rural populations, despite a notable breakthrough of rice in dietary habits. Millet consumption has been on a downward trend, falling from 78.0 kilograms per capita in 1990 to 48.9 kilograms per capita in 2009. The share of millet in cereal consumption thus dropped from 42 percent to 25 percent in 2008 (ReSAKSS, MSU, and Syngenta 2011). However, this share has remained above 70 percent in the Groundnut Basin area and in the southeast region of Tambacounda (Duteurtre, Faye, and Dièye 2010).
Despite this downward trend, the introduction of mills and equipment for the processing of small quantities of millet has greatly facilitated the preparation of millet-based foods in rural areas and fueled consumption in urban areas, among the wealthier segments of the population, as well as in food-deficit rural towns (Faye and Gueye 2010). The expansion of supply and greater accessibility of processed products, ready-to-cook as well as ready-to-eat, has reversed the above trends in millet consumption. As seen in Table 7.1, per capita consumption of unprocessed millet among the upper two quintiles is higher than among the bottom two. More importantly, the per capita consumption (49.5 kilograms) of processed millet alone in 2018 is higher than the national average of millet
TABLE 7.1—ANNUAL CEREAL CONSUMPTION BY INCOME QUINTILE, SENEGAL (2017/2018)
Income(in CFA francs / capita)
1st quintile[15,834–176,935]
2nd quintile[176,947–267,369]
3rd quintile[267,385–382,103]
4th quintile[382,110–579,781]
5th quintile[580,307–9,729,004]
(in kg/capita) kg share kg Share kg share kg share kg share
All cereals 119.0 100% 156.7 100% 177.1 100% 205.8 100% 290.4 100%
Millet 25.5 21% 25.3 16% 28.4 16% 26.1 13% 33.3 11%
Millet (processed) 12.0 10% 22.3 14% 25.8 15% 40.0 19% 49.5 17%
Maize 9.4 8% 11.8 8% 12.5 7% 13.0 6% 16.8 6%
Maize (processed) 5.9 5% 7.6 5% 9.2 5% 12.0 6% 14.9 5%
Sorghum 3.2 3% 2.4 2% 2.1 1% 2.1 1% 4.4 2%
Sorghum (processed)
1.9 2% 1.4 1% 1.6 1% 1.5 1% 0.8 0%
Fonio 0.2 0% 0.2 0% 0.2 0% 0.2 0% 0.5 0%
Local rice 26.5 22% 41.5 26% 43.8 25% 53.0 26% 78.1 27%
Imported rice 34.1 29% 43.7 28% 53.3 30% 58.0 28% 92.2 32%
Source: Ulimwengu et al. (2020).

76 resakss.org
consumption (48.9 kilograms) in 2009. Millet products’ share of consumption among high-income earners (upper two quintiles) is now close to 30 percent, compared to 32 percent for imported rice(Ulimwengu, et al. 2020)
To better understand the changes that took place along the millet value chain as well as the underlying factors, we use the extensive database constructed under the recent Projet d’Appui aux Politiques Agricoles (PAPA), which covers activities by a sample of 87 cereal wholesalers, 582 retailers, 75 primary processors, and 922 secondary proces-sors. The details of the sample characteristics of the surveys, which were carried out in 2018, are presented in Appendix Table A7.1. Strikingly, nearly all (98 percent) the secondary processing firms are owned and managed by female entrepreneurs. More than 65 percent of them started as self-employing businesses and have no employees. This is particularly the case for secondary processors and retailers, of which more than 85 percent started as self-employing small businesses. At start-up, the average total employee count was as low as 0.19 for retailers and as high as 1.8 for wholesalers. The maximum number of employees was 33 for wholesalers, followed by 30 for secondary proces-sors. The percentage of enterprises hiring employees had also increased by about 15 percentage points since start-up. At start-up, more than 80 percent of the midstream actors were informal businesses. Processors were more informal than traders, a typical characteristic that distinguishes local staples value chains form global value chains. Only 12 percent of the secondary processors and 8 percent of primary processors were formally registered firms. Both the median and average initial capital investments of secondary processors were smaller than those of other segment actors. An average secondary processor invested about 237,000 CFA francs at start-up for equipment, workplace, and other fixed assets.
Most midstream actors appear to be recently established businesses, with the median age of firms around 10 years. At start-up, the median processing capacity was as low as 7 kilograms per day for secondary processors and as high as 800 kilograms per day for wholesalers. Since start-up, capacity has significantly increased for all segments. The median capacity of secondary processors has increased to 12 kilograms per day, which is an increment of more than 70 percent. Currently, half of the sample secondary processors and retailers sell 117,000 CFA francs and 237,000 CFA francs per month, respectively. As expected, the average total sales of traders are higher than those of processors (more in Appendix Table A7.1).
Source: Authors’ estimation based on PAPA data collected in 2018.
FIGURE 7.1—THE IMPORTANCE OF MILLET IN SENEGALESE CEREAL VALUE CHAINS
57.5
97.3
69.563.9
68.2
18.8
62.5
80.0
18.2
52.7
0.0
20.0
40.0
60.0
80.0
100.0
120.0
Wholesaling (87) Primary processing (75)
Secondaryprocessing (922)
Retailing (582) Total
Percentage of enterprises involved in millet Percentage of millet market share out of total cereals sale

2020 ReSAKSS Annual Trends and Outlook Report 77
In addition to commanding the largest share in the processing segment compared to all other cereals, millet processing firms also tend to operate in a much more competitive environment than other cereal processors. Figure 7.2 presents the ratios of the sales of the largest four firms to total sales. The higher the ratio, the lower the degree of competition in the given value chain segment for millet and all cereals. Of all millet enterprises, secondary processing is the most competitive segment. In contrast, more than half of the millet wholesale segment is controlled by the four largest firms. The primary processing segment is the least competitive, most oligopolistic segment of the entire cereal sector. The least competitive millet segment is the wholesale sector.
All these results indicate that, unlike in other cereal value chains, the millet chain is dominated by the highly competitive secondary processing segment, a situation that is likely to become increasingly common among the rapidly trans-forming regional staples value chains across Africa. This trend is likely to accelerate as millet and other traditional staples value chains respond to changing diets among middle-class consumers and modern-izing distribution networks in rapidly growing urban centers.
Evolution of the Modern Millet Value Chain The expansion and transformation of the millet value chain is represented in Figure 7.3. The curve showing the cumulative percentage of enterprises involved in millet trading and processing over the years, arranged by start-up year, indicates a significant boom in the millet business in the last two decades. The figure illustrates the rapid rise of the millet processing sector and the deepening transformation of the millet value chain in Senegal. More than half of the sample millet traders and processors started their businesses after 2010. The trend shows
that the sector has passed through three phases since 1970: a mainly stagnant phase throughout the 1970s until the early 1980s, an initial expansion phase from the middle of the 1980s until the late 1990s, and a rapid transformation phase over the last two decades. This trend cuts across all major segments.
Several factors explain the evolution of the millet value chain. The 1970s were in the middle of the era when operations in the agricultural sector were entirely dominated by the public sector. Prices paid to farmers for their crops and by consumers for food were determined administratively and enforced by the government. State enterprises were in charge of everything from input distribution to crop marketing and transport. Private sector operators had only a limited role to play and that often primarily within the system of public sector
Source: Authors’ estimation based on PAPA data collected in 2018. Note: The four–firm concentration ratio represents the share of the largest four firms in the segment. The higher the ratio, the less competitive the segment or industry.
FIGURE 7.2—FOUR-FIRM CONCENTRATION RATIOS IN ALL CEREAL AND MILLET MARKETS AND INDUSTRIES
0.49
0.85
0.12 0.14
0.56
0.27
0.06
0.15
0.00
0.10
0.20
0.30
0.40
0.50
0.60
0.70
0.80
0.90
Wholesaling Primary processing Secondary processing Retailing
Cereal market Millet market

78 resakss.org
intervention. The absence of a critical mass of private operators in the agricultural sector in general is reflected in the millet value chain.
The situation started to change gradually in the 1980s, thanks to two major developments. The government launched a series of reforms as part of its structural adjustment programs, which began with a change of leadership in 1979. Several of the state enterprises that controlled the agricultural sector were near bankrupt. The government was obliged to restructure them, reform their operations, and adjust the policy regimes that ensured their monopoly positions, thereby gradually creating room for the private sector.
The second factor that triggered the millet sector revolution is also linked to the prevailing government policies in the previous decade and the detrimental effects on overall performance of the agricultural sector. The severe and repeated
droughts of the 1970s made an already bad situation worse, leading to stagnating domestic food production and a rapid increase in food imports, not just in Senegal but in the entire Sahel region. As a response, and under the banner of the Comité Permanent Inter-Etats de Lutte Contre la Secheresse dans le Sahel (Permanent Interstate Committee on Drought Control in the Sahel), a region-wide project was initiated to promote the consumption of local staples in order to slow the rate of growth in food imports and save scarce foreign exchange in the context of acute economic and food security crises. The objective of the Project pour la Promotion des Céréales Locales au Sahel (Project for the Promotion of Local Cereals) was to promote improved cooking and processing technologies and promote small-scale enterprises to encourage the uptake of these technologies. Across several countries in the Sahel, processed millet products started appearing in urban markets.
With the end of the economic crisis in the late 1990s and the onset of the longest
economic recovery in the history of African countries, demand for food in general and local staples in particular began skyrocketing in urban centers. Urban consumers not only demanded more food, they also asked for better quality, improved safety, and greater convenience. This demand fueled the growth of the trading and processing sector, leading to a fivefold increase in the number of enterprises in that sector over the next two decades.
Performance across Enterprises of Different SizesThe definitions of enterprise sizes vary across countries and industries. Most definitions depend on the number of employees, which does not apply to our sample enterprises as most of them (about 80 percent) are self-employing
Source: Authors’ estimation based on PAPA data collected in 2018. Note: The four–firm concentration ratio represents the share of the largest four firms in the segment. The higher the ratio, the less competitive the segment or industry.
FIGURE 7.3—GROWTH IN NUMBER OF MILLET TRADING AND PROCESSING ENTERPRISES IN SENEGAL, CUMULATIVE PERCENTAGES
0
20
40
60
80
100
120
1970
1971
1974
1975
1978
1979
1980
1981
1982
1983
1984
1985
1986
1987
1988
1989
1990
1991
1992
1993
1994
1995
1996
1997
1998
1999
2000
2001
2002
2003
2004
2005
2006
2007
2008
2009
2010
2011
2012
2013
2014
2015
2016
2017
2018
Wholesalers Primary processors Secondary processors Retailers
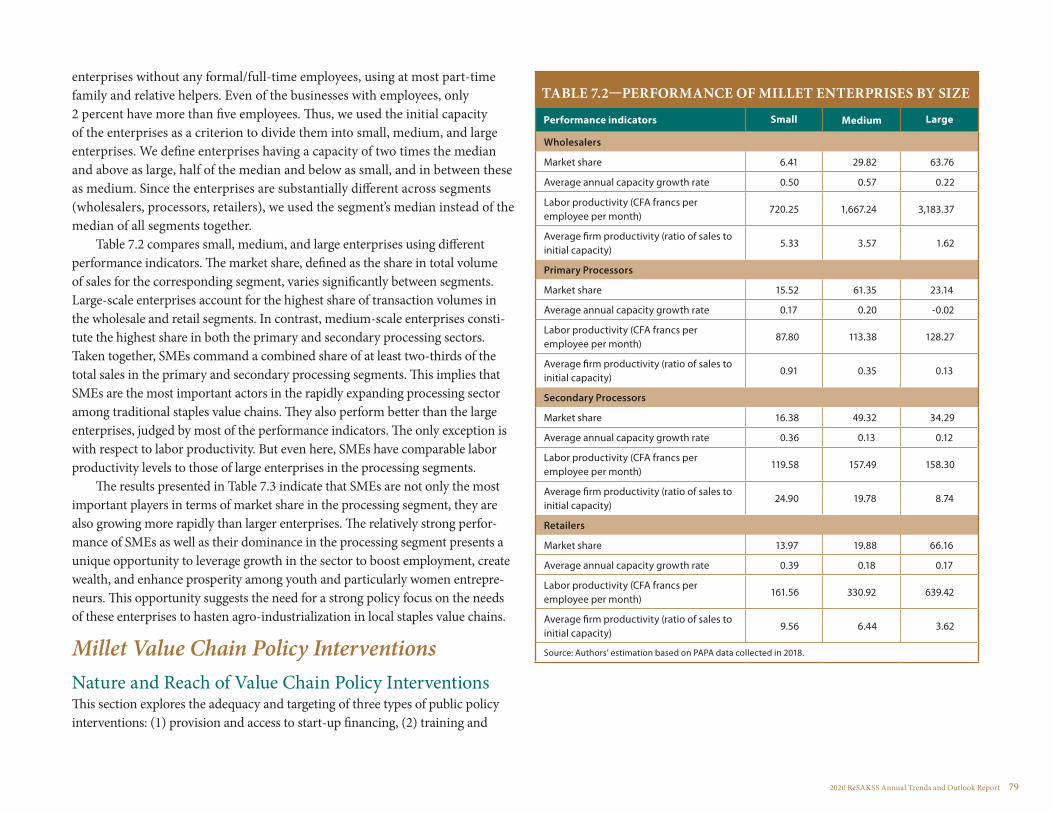
2020 ReSAKSS Annual Trends and Outlook Report 79
enterprises without any formal/full-time employees, using at most part-time family and relative helpers. Even of the businesses with employees, only 2 percent have more than five employees. Thus, we used the initial capacity of the enterprises as a criterion to divide them into small, medium, and large enterprises. We define enterprises having a capacity of two times the median and above as large, half of the median and below as small, and in between these as medium. Since the enterprises are substantially different across segments (wholesalers, processors, retailers), we used the segment’s median instead of the median of all segments together.
Table 7.2 compares small, medium, and large enterprises using different performance indicators. The market share, defined as the share in total volume of sales for the corresponding segment, varies significantly between segments. Large-scale enterprises account for the highest share of transaction volumes in the wholesale and retail segments. In contrast, medium-scale enterprises consti-tute the highest share in both the primary and secondary processing sectors. Taken together, SMEs command a combined share of at least two-thirds of the total sales in the primary and secondary processing segments. This implies that SMEs are the most important actors in the rapidly expanding processing sector among traditional staples value chains. They also perform better than the large enterprises, judged by most of the performance indicators. The only exception is with respect to labor productivity. But even here, SMEs have comparable labor productivity levels to those of large enterprises in the processing segments.
The results presented in Table 7.3 indicate that SMEs are not only the most important players in terms of market share in the processing segment, they are also growing more rapidly than larger enterprises. The relatively strong perfor-mance of SMEs as well as their dominance in the processing segment presents a unique opportunity to leverage growth in the sector to boost employment, create wealth, and enhance prosperity among youth and particularly women entrepre-neurs. This opportunity suggests the need for a strong policy focus on the needs of these enterprises to hasten agro-industrialization in local staples value chains.
Millet Value Chain Policy Interventions Nature and Reach of Value Chain Policy Interventions This section explores the adequacy and targeting of three types of public policy interventions: (1) provision and access to start-up financing, (2) training and
TABLE 7.2—PERFORMANCE OF MILLET ENTERPRISES BY SIZE
Performance indicators Small Medium Large
Wholesalers
Market share 6.41 29.82 63.76
Average annual capacity growth rate 0.50 0.57 0.22
Labor productivity (CFA francs per employee per month)
720.25 1,667.24 3,183.37
Average firm productivity (ratio of sales to initial capacity)
5.33 3.57 1.62
Primary Processors
Market share 15.52 61.35 23.14
Average annual capacity growth rate 0.17 0.20 -0.02
Labor productivity (CFA francs per employee per month)
87.80 113.38 128.27
Average firm productivity (ratio of sales to initial capacity)
0.91 0.35 0.13
Secondary Processors
Market share 16.38 49.32 34.29
Average annual capacity growth rate 0.36 0.13 0.12
Labor productivity (CFA francs per employee per month)
119.58 157.49 158.30
Average firm productivity (ratio of sales to initial capacity)
24.90 19.78 8.74
Retailers
Market share 13.97 19.88 66.16
Average annual capacity growth rate 0.39 0.18 0.17
Labor productivity (CFA francs per employee per month)
161.56 330.92 639.42
Average firm productivity (ratio of sales to initial capacity)
9.56 6.44 3.62
Source: Authors’ estimation based on PAPA data collected in 2018.
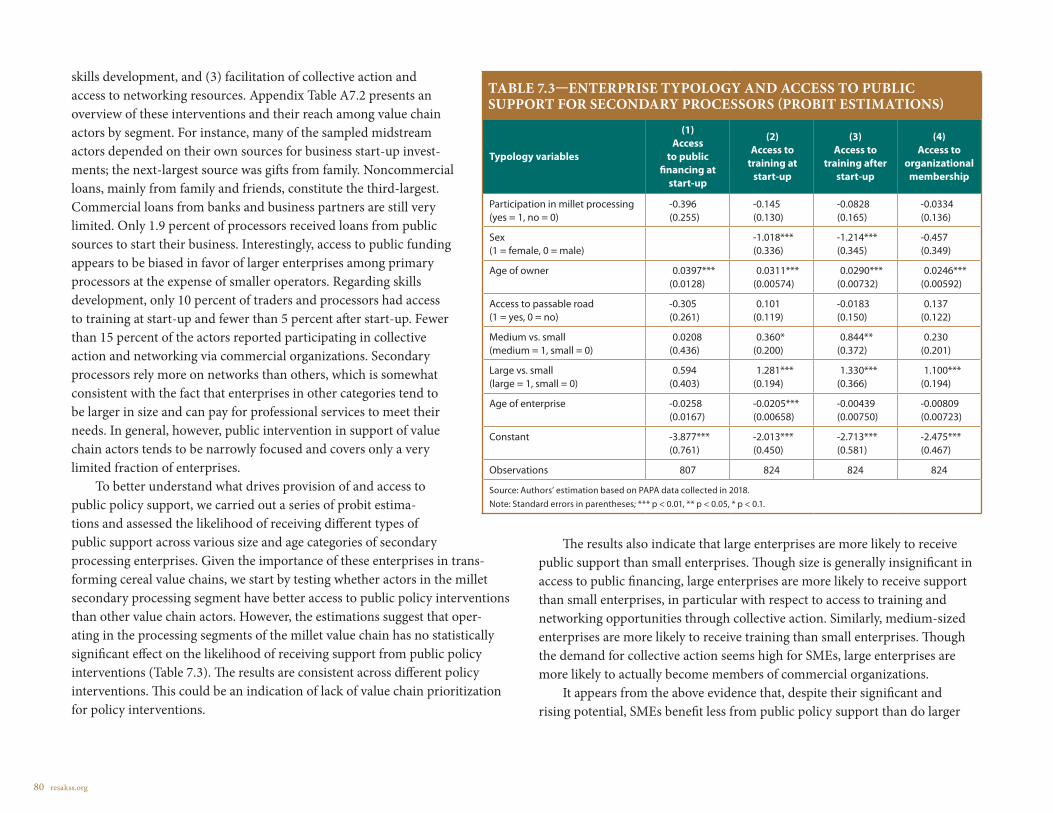
80 resakss.org
skills development, and (3) facilitation of collective action and access to networking resources. Appendix Table A7.2 presents an overview of these interventions and their reach among value chain actors by segment. For instance, many of the sampled midstream actors depended on their own sources for business start-up invest-ments; the next-largest source was gifts from family. Noncommercial loans, mainly from family and friends, constitute the third-largest. Commercial loans from banks and business partners are still very limited. Only 1.9 percent of processors received loans from public sources to start their business. Interestingly, access to public funding appears to be biased in favor of larger enterprises among primary processors at the expense of smaller operators. Regarding skills development, only 10 percent of traders and processors had access to training at start-up and fewer than 5 percent after start-up. Fewer than 15 percent of the actors reported participating in collective action and networking via commercial organizations. Secondary processors rely more on networks than others, which is somewhat consistent with the fact that enterprises in other categories tend to be larger in size and can pay for professional services to meet their needs. In general, however, public intervention in support of value chain actors tends to be narrowly focused and covers only a very limited fraction of enterprises.
To better understand what drives provision of and access to public policy support, we carried out a series of probit estima-tions and assessed the likelihood of receiving different types of public support across various size and age categories of secondary processing enterprises. Given the importance of these enterprises in trans-forming cereal value chains, we start by testing whether actors in the millet secondary processing segment have better access to public policy interventions than other value chain actors. However, the estimations suggest that oper-ating in the processing segments of the millet value chain has no statistically significant effect on the likelihood of receiving support from public policy interventions (Table 7.3). The results are consistent across different policy interventions. This could be an indication of lack of value chain prioritization for policy interventions.
The results also indicate that large enterprises are more likely to receive public support than small enterprises. Though size is generally insignificant in access to public financing, large enterprises are more likely to receive support than small enterprises, in particular with respect to access to training and networking opportunities through collective action. Similarly, medium-sized enterprises are more likely to receive training than small enterprises. Though the demand for collective action seems high for SMEs, large enterprises are more likely to actually become members of commercial organizations.
It appears from the above evidence that, despite their significant and rising potential, SMEs benefit less from public policy support than do larger
TABLE 7.3—ENTERPRISE TYPOLOGY AND ACCESS TO PUBLIC SUPPORT FOR SECONDARY PROCESSORS (PROBIT ESTIMATIONS)
Typology variables
(1)Access
to public financing at
start-up
(2)Access to
training at start-up
(3)Access to
training after start-up
(4)Access to
organizational membership
Participation in millet processing (yes = 1, no = 0)
-0.396(0.255)
-0.145(0.130)
-0.0828(0.165)
-0.0334(0.136)
Sex (1 = female, 0 = male)
-1.018***(0.336)
-1.214***(0.345)
-0.457(0.349)
Age of owner 0.0397***(0.0128)
0.0311***(0.00574)
0.0290***(0.00732)
0.0246***(0.00592)
Access to passable road (1 = yes, 0 = no)
-0.305(0.261)
0.101(0.119)
-0.0183(0.150)
0.137(0.122)
Medium vs. small (medium = 1, small = 0)
0.0208(0.436)
0.360*(0.200)
0.844**(0.372)
0.230(0.201)
Large vs. small (large = 1, small = 0)
0.594(0.403)
1.281***(0.194)
1.330***(0.366)
1.100***(0.194)
Age of enterprise -0.0258(0.0167)
-0.0205***(0.00658)
-0.00439(0.00750)
-0.00809(0.00723)
Constant -3.877***(0.761)
-2.013***(0.450)
-2.713***(0.581)
-2.475***(0.467)
Observations 807 824 824 824
Source: Authors’ estimation based on PAPA data collected in 2018. Note: Standard errors in parentheses; *** p < 0.01, ** p < 0.05, * p < 0.1.

2020 ReSAKSS Annual Trends and Outlook Report 81
enterprises. In other words, our data indicate that value chain development programs and policies in Senegal are not responsive to the needs of the emerging and better-performing value chain enterprises.
The regression results also show that the effect of enterprises’ age on access to public support is statistically insignificant except in the case of access to training at start-up. In an ideal public support system that aims to respond to emerging opportunities, the provision of public financing, for instance, would be expected to show a negative relationship to enterprise age. In other words, as enterprises mature, they rely less on public financial support. Over time, the private sector would take over from the public sector to serve the needs of an increasing number of maturing enterprises. In the context of limited fiscal resources, the seeming lack of substitution of public funding through private sector financing suggests that the financial needs of value chain operators are going largely unmet. In contrast, the negative and statistically significant effect of age on access to training implies that access to start-up training has been increasing over time. While this is a positive trend, the type of training must fit with the needs of value chain actors, an issue that will be further examined in the next section.
The estimations also suggest that although almost all the entrepreneurs in the sample who received access to start-up financing are female (which is why the “sex” variable is dropped), a female entrepreneur still has less likelihood of accessing both start-up and operational training. This is at odds with the role of female entrepreneurs in the secondary processing segment of the millet value chain. We noted previously that 98 percent of the operators in this segment are female entrepreneurs.
Enhancing the Effectiveness of Value Chain Policy Interventions The above evidence suggests that public policy interventions in support of millet value chain development are inadequate and less targeted to emerging enterprises. In particular, SMEs, which make up the dominant and most dynamic segment, tend to have less access, except for training services at start-up. According to Sonobe and Otsuka (2011), the effectiveness of public policy interventions in promoting growth, reducing poverty, and enhancing the competitiveness of nascent enterprises depends on the timing and appropriate
sequencing of intervention and support services. Public interventions should align with the needs of agro-industrial firms in various industrial clusters. In line with this argument, the researchers identify three industrial clusters based on the industrial growth stages: initiation, innovation (emerging), and maturation (developing).
Though targeting interventions according to industrial growth stage repre-sents an important angle, a comprehensive value chain (industrial) development strategy also needs to align policy interventions with the special characteristics of various value chains. Different value chains (1) operate in different market environments, for instance, regional or global; (2) face different demand condi-tions and consumer behaviors, say, tropical beverages versus fruits and vegetables versus regional staples; and (3) present different challenges to private enterprises and actors in midstream segments. For instance, firms operating in regional value chains such as millet, teff, or cassava are confronted with high marketing costs, rapidly changing diet preferences, and relatively unstructured markets. Enterprises operating in global value chains such as those for coffee, fruits, and vegetables, are faced with more mature, better structured markets; stronger competition; and more demanding consumers. Moreover, while midstream actors in traditional regional value chains are usually SMEs owned by local entre-preneurs, the same actors in global value chains are generally large enterprises, often with foreign ownership. Thus, different sets of policy priorities are needed for local/regional staples value chains as compared to global value chains. Public policy interventions for value chain development must therefore be prioritized not only based on growth stages but also in line with the characteristics of the various specific markets. However, within a given value chain, the stage-based approach maintains its full validity.
Using these growth stage and market criteria, we define six groups of value chains and propose different sets of priority policy interventions for midchain development (see Appendix Table A7.3). For instance, for emerging regional staples value chains such as millet, we propose priority policy interventions that reflect market characteristics for the value chain while also considering the various stages of value chain transformation. More specifically, public policy interventions would seek to motivate and equip midstream actors to boost product innovation to, for example, satisfy the growing urban demand for quality, safety, and product sophistication. Applying this concept to public policy

82 resakss.org
interventions relating to skills development in the millet sector as it transformed along the trajectory shown in Figure 7.3 would mean that policy interventions in the 1980s should have focused on vocational training to impart the skills neces-sary to start businesses, followed by policy interventions emphasizing demand creation and skills for market access in the 1990s. Policy interventions since 2000 should then have shifted to product innovation and branding.
We further assess the impact of policy interventions on the performance of secondary processors in the millet value chain to empirically verify the effectiveness of the interventions proposed in Appendix Table A7.3. For that purpose, we estimate a series of average treatment effects using propensity score matching (PSM) for several interventions with respect to two inter-related outcome indicators: one that measures the level and another the growth of installed processing capacity. The results appear to be very mixed across outcome variables and public policy interventions (Table 7.4). For instance, the average treatment effect on processors’ capacity appears to be positive and significant for most institutional interventions such as training and participation in collective action and networking. Also, both start-up and on-the-job training are shown to have a significant effect on the level of processing capacity. This is particularly the case for vocational training. Access to networks through membership in an organization is also shown to have a significant positive impact on processing capacity. However, none of the incentive interventions related to financial support show any significant impact. Noncommercial loans from government, nongovernmental organizations, and family sources demonstrate no significant benefit over loans from other sources. This is consistent with our premise that for emerging value chains such as millet, institutional interventions are more important and effective than incentive-based interventions.
The growth effects of the interventions are quite different from the level effects of the interventions. Start-up training appears to be more important in boosting capacity and accelerating growth than any other intervention. This is in line with our earlier finding that public policy interventions that focus on enterprise-level capacities are more aligned with the needs of the trans-forming SME-dominated staples value chains. Vocational training seems more significant for enhancing capacity growth than does innovational training, which we define to include training on marketing, product development, and business strategy. This is also consistent with our argument that at start-up,
vocational training is more effective than other type of skills development intervention. These findings confirm the importance of prioritizing policy interventions according to the value chain transformation trajectory as well as the characteristics and growth stages of enterprises in individual value chains. This is because the performance and needs of midstream actors vary as these conditions change from a given value chain to the next.
TABLE 7.4—IMPACTS OF POLICY INTERVENTIONS ON THE CAPACITY OF MILLET SECONDARY PROCESSERS (PSM ESTIMATIONS)
Policy interventions (1)
Processing capacity
(2)Growth rate
in processing capacity
Start-up financing
Commercial loan 9.103
(6.833)-0.0778(0.351)
Noncommercial loan from government, nongovernmental organization, or family
-3.309(10.98)
-0.0375(0.0389)
Gifts from family and friends -1.714(4.805)
-0.0734*(0.0397)
Start-up training
Vocational training 44.03***(6.410)
0.238***(0.0578)
Innovational (marketing + product development) training 49.88***(9.945)
0.276**(0.121)
On-the-job training
Vocational training 29.58**(11.99)
0.0744(0.103)
Innovational (marketing + product development) training 6.927
(8.197)-0.00340(0.0315)
Participation in collective action 40.73***(8.455)
0.211(0.131)
Observations 40.73*** 0.211
Source: Authors’ estimation based on PAPA data collected in 2018. Note: Standard errors in parentheses. *** p < 0.01, ** p < 0.05, * p < 0.1. PSM = propensity score matching.

2020 ReSAKSS Annual Trends and Outlook Report 83
Conclusions and Lessons for Value Chain Policy DesignFueled by the longest-lasting economic growth spell in post-independence Africa, traditional staples value chains are undergoing a rapid process of transfor-mation. Millions of SMEs across the continent are entering all segments of these value chains in response to rapidly increasing demand for processed food by the fast-growing middle class. Demand for processed traditional foods in regional and urban markets is growing at such pace that their share in total consumption of domestic staples is projected to reach two-thirds by 2040.
The rising processing sector in staples value chains offers significant potential for job and wealth creation in African countries. The sector is dominated by a large and growing number of young (primarily female) entrepreneurs who are creating millions of jobs. The required future growth to exploit the potential of the sector will depend on countries’ ability to help maintain a healthy rate of enterprise creation. This in turn will requires public policies that can effectively address the multifaceted challenges faced by operators in all value chain segments related to access to services, technology, financing, and markets.
Designing and implementing public intervention polices in the context of rapidly morphing value chains dominated largely by start-ups operated by a rela-tively newly emerged private sector is a very complex undertaking. In particular, aligning polices to the needs of different actors in various value chain segments is a major challenge facing policymakers and researchers.
Insights gained from the analysis of the millet value chain in Senegal offer several valuable lessons for the design of public policy interventions that can be adapted to other staples value chains in other African countries. The most impor-tant of these lessons are summarized below.
1. Value chain development policy interventions need to reflect and align with the transformation trajectory that represents the actual stages of growth and maturity of the various chain segments. Chains dominated by start-ups call for a different policy mix than chains with a large share of more mature enterprises. Chain promotion policies also need to take into consideration the special features of different value chains, such as market and demand characteristics. Traditional staples value chains such as those of millet, cassava, or teff that are catering to emerging regional and
domestic urban markets require different policy emphases than traditional export value chains such as those of oilseeds, cotton, or tropical beverages that are working in more sophisticated global markets.
2. Policy interventions to support emerging regional staples value chains need to emphasize equipping midstream actors with access to services, technology, and skills to foster competitiveness and boost product innovation in order to meet the quality, safety, and product sophistication standards of urban consumers.
3. Public policy interventions that focus more directly on enterprise-level capacities have greater impact than chain-level interventions and better aligned with the needs of the many SMEs that dominate traditional staples value chains. Furthermore, it appears that basic vocational training targeting operational skills for start-ups is more effective at boosting capacity growth than is training on marketing, product development, and business strategy.
4. SMEs are not only by far the most important players in terms of market share in the mid-chain segments of emerging staples value chains; they are also growing more rapidly than larger enterprises. Efforts must be made to ensure that chain development policies are not biased against them in favor of their larger counterparts. On the contrary, care must be taken to ensure that value chain development programs and policies are responsive to the needs of SMEs in the emerging and better-performing value chain segments. Given limited resources, a failure to prioritize public policy interventions that encourage innovation as well as enterprise growth and maturation in the most dynamic value chain segments is likely to reduce their impact and retard progress in transforming staples value chains.
5. Female entrepreneurs are the dominant owners and managers of enter-prises in the millet secondary processing segment, which is a typical characteristic of emerging value chains in Africa. However, there seems to be a gender bias in accessing public support. This calls for a significant effort to align policy interventions, particularly public support for skill development, toward the women entrepreneurs who are the dominant actors of the agro-processing industries and other mid-chain segments.

84 resakss.org
Appendix
TABLE 7A.1—CHARACTERISTICS OF SAMPLE MIDSTREAM ACTORS
Characteristics Wholesalers Primary
processors Secondary processors Retailers All
Sample size 87 75 922 582 1,666
Percentage single owners 93.3 81.9 82.7
Percentage female owners 0.0 4.0 97.9 9.3 57.6
Percentage young owners (<35 years old) 41.4 36.0 14.9 54.6 31.1
Percentage Wolof 67.8 50.7 40.5 37.3 41.2
Percentage Halpulaar 18.4 38.7 20.9 46.6 30.6
Percentage uneducated 34.5 36.0 57.2 37.6 48.2
Percentage family business at start-up 11.5 8.0 3.5 10.8 6.7
Percentage family business current 11.5 9.3 5.2 10.5 7.6
Percentage registered enterprises 63.2 8.0 11.9 27.1 19.7
Percentage self-employed at start-up 43.7 60.0 80.5 85.2 79.3
Percentage self-employed current 13.8 52.0 69.7 68.4 65.5
Median age of enterprise (years) 11.0 10.0 10.0 7.0 9.0
Median investment at start-up (1,000 CFA francs) 1,500.0 1,075.0 24.0 435.0 75.0
Mean investment at start-up (1,000 CFA francs) 8,316.1 1,301.8 236.9 900.0 938.4
Median capacity at start-up (kg per day) 800.0 200.0 7.0 40.0 15.0
Median capacity current (kg per day) 2,000.0 250.0 12.0 50.0 24.0
Median total sales (1,000 CFA francs per month) 2,318.2 68.4 116.7 237.1 166.0
Average total sales (1,000 CFA francs per month) 11,130.6 243.1 257.6 559.91 985.0
Median millet sales (1,000 CFA francs per month) 51.7 30.9 92.7 17.8 55.4
Average millet sales (1,000 CFA francs per month) 847.6 156.2 167.7 110.8 184.4
Source: Authors’ estimation based on PAPA data collected in 2018.

2020 ReSAKSS Annual Trends and Outlook Report 85
Appendix continued
TABLE 7A.2—POLICY INTERVENTIONS IN SUPPORT OF MILLET SECTOR MIDSTREAM ACTORS
Wholesalers Primary
processors Secondary processors Retailers All
Sample size 87 75 922 582 1,666
Sources of start-up financing (%)
Own income 90.8 80.0 49.1 80.9 63.8
Gifts from family and others 10.3 17.3 47.4 18.6 34.0
Commercial loan 11.5 9.3 8.2 4.8 7.3
Noncommercial loan 10.3 10.7 8.9 13.4 10.6
Public loan 4.0 1.7 1.9
Start-up training (%) 1.1 10.7 15.9 1.4 9.8
Nongovernmental organization 0.0 4.0 11.3 0.7 6.7
Government 1.1 8.0 8.6 0.9 5.5
Vocational 1.1 9.3 14.2 0.3 8.5
Marketing 1.1 1.3 5.5 0.7 3.4
Product development 0.0 1.3 9.3 0.0 5.2
Production 0.0 1.3 2.8 0.2 1.7
Administrative 1.1 4.0 5.1 0.7 3.3
On-the-job training 0.0 1.3 6.3 0.3 3.7
Vocational 0.0 1.3 5.7 0.2 3.3
Marketing 0.0 0.0 1.7 0.2 1.0
Product development 0.0 0.0 3.4 0.0 1.9
Production 0.0 0.0 1.3 0.2 0.8
Administrative 0.0 0.0 2.0 0.0 1.1
Membership in 2015 27.3 7.4 13.2 9.0 12.3
Membership current 23.0 6.7 12.6 8.6 11.5
Source: Authors’ estimation based on PAPA data collected in 2018.
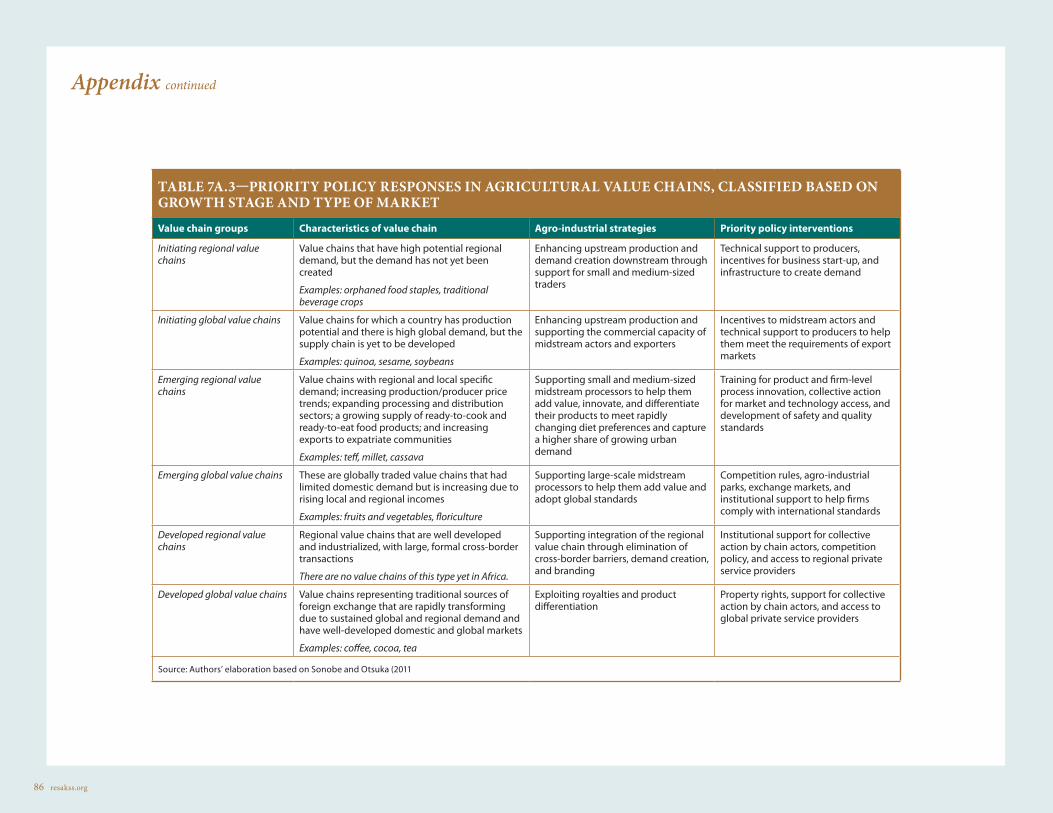
86 resakss.org
Appendix continued
TABLE 7A.3—PRIORITY POLICY RESPONSES IN AGRICULTURAL VALUE CHAINS, CLASSIFIED BASED ON GROWTH STAGE AND TYPE OF MARKET
Value chain groups Characteristics of value chain Agro-industrial strategies Priority policy interventions
Initiating regional value chains
Value chains that have high potential regional demand, but the demand has not yet been created
Examples: orphaned food staples, traditional beverage crops
Enhancing upstream production and demand creation downstream through support for small and medium-sized traders
Technical support to producers, incentives for business start-up, and infrastructure to create demand
Initiating global value chains Value chains for which a country has production potential and there is high global demand, but the supply chain is yet to be developed
Examples: quinoa, sesame, soybeans
Enhancing upstream production and supporting the commercial capacity of midstream actors and exporters
Incentives to midstream actors and technical support to producers to help them meet the requirements of export markets
Emerging regional value chains
Value chains with regional and local specific demand; increasing production/producer price trends; expanding processing and distribution sectors; a growing supply of ready-to-cook and ready-to-eat food products; and increasing exports to expatriate communities
Examples: teff, millet, cassava
Supporting small and medium-sized midstream processors to help them add value, innovate, and differentiate their products to meet rapidly changing diet preferences and capture a higher share of growing urban demand
Training for product and firm-level process innovation, collective action for market and technology access, and development of safety and quality standards
Emerging global value chains These are globally traded value chains that had limited domestic demand but is increasing due to rising local and regional incomes
Examples: fruits and vegetables, floriculture
Supporting large-scale midstream processors to help them add value and adopt global standards
Competition rules, agro-industrial parks, exchange markets, and institutional support to help firms comply with international standards
Developed regional value chains
Regional value chains that are well developed and industrialized, with large, formal cross-border transactions
There are no value chains of this type yet in Africa.
Supporting integration of the regional value chain through elimination of cross-border barriers, demand creation, and branding
Institutional support for collective action by chain actors, competition policy, and access to regional private service providers
Developed global value chains Value chains representing traditional sources of foreign exchange that are rapidly transforming due to sustained global and regional demand and have well-developed domestic and global markets
Examples: coffee, cocoa, tea
Exploiting royalties and product differentiation
Property rights, support for collective action by chain actors, and access to global private service providers
Source: Authors’ elaboration based on Sonobe and Otsuka (2011

2020 ReSAKSS Annual Trends and Outlook Report 872017 ReSAKSS Annual Trends and Outlook Report 87
CHAPTER 8
Institutions of Collective Action and Smallholder Performance: Evidence from Senegal
Fleur Wouterse and Amy Faye1
1 The authors would like to thank Khadim Dia for help with the data, Gian Nicola Francesconi for reading through and commenting on a previous version of this manuscript, and Mohamadou Dieye who provided some of the figures.

88 resakss.org
Senegal is a country where farming has remained largely smallholder based. Although the country’s economy has grown by at least 6 percent annually since 2014 and poverty rates have declined from 45.8 percent
in 2003 to 23.0 percent in 2018, the agricultural growth rate has remained well below the 6.0 percent target of the Comprehensive Africa Agriculture Development Programme, and rural poverty rates have remained high (ReSAKSS 2020). Due to high population growth, increased pressure on land, and precarious climate conditions, rural-urban migration is high and 296,000 young people are said to arrive each year on the labor market, with formal job offers estimated at only 30,000 (Ba et al. 2017. Since 2012, Senegal has reprioritized its investments to catalyze an agriculturally led structural transformation. The Plan Senegal Emergent (PSE) envisages agriculture as an engine of growth that will spur balanced economic and social development across multiple sectors. The Programme d’Accélération de la Cadence de l’Agriculture Sénégalaise (PRACAS)—the agricultural component of PSE—emphasizes the promotion of family farming through intensification, more and better market participation, and quality management.
Arguably Africa’s rural transformation is hampered by the fact that small-holder agriculture is exposed to persistent market failures, culminating in missed opportunities and suboptimal economic behavior. These failures are often rooted in the importance of economies of scale in procuring inputs and marketing produce. Over the past few years, stakeholders throughout Africa south of the Sahara have expressed a renewed interest in collective action mechanisms such as producer organizations as a means to help smallholders address market failures. In theory, by engaging in collective action, smallholders could have better access to and derive more benefits from market participation. Studies have shown that smallholders derive benefits from membership in a producer organization mainly through access to improved inputs and extension (Ma, Abdulai, and Goetz 2018; Abdul-Rahman and Abdulai 2018) but to a lesser extent through more favorable terms for sales of their output (Bernard, Taffesse, and Gabre-Mahdin. 2008; Francesconi and Wouterse 2015a).This poor performance in terms of collective commercialization has been attributed, in part, to weak managerial capacity.
Senegal has a wealth of rural institutions as well as strong national-level orga-nizations representing producer interests. Because objectives of PRACAS such as intensification of family farming and more and better participation in markets require scale, capitalizing on this institutional infrastructure could contribute
to their attainment. However, to be able to advocate for the consideration of producer organizations as going beyond mere channels for subsidized inputs, we need to assess whether membership in an organization is associated with inten-sification of smallholder agriculture and whether these organizations generate economies of scale through collective commercialization.
In this chapter, we use recent data on almost 7,000 smallholders and 395 water user associations (WUAs), along with propensity score matching (PSM) and regression analysis, to quantitatively assess whether membership in producer organizations affects technical efficiency of smallholders and whether the design and governance of such organizations affects the organizations’ performance. Our results reveal that membership is associated with greater efficiency and that the design of organizations and their governance can enhance their commercial performance. Policymakers would thus do well to work with producer organiza-tions and further build their governance capacity and membership base for successful implementation of the country’s agricultural development strategy.
Evolution and Drivers of Collective Action in Agriculture in Africa As pointed out earlier, smallholder agriculture in Africa south of the Sahara is largely exposed to pervasive market failures that are often rooted in a lack of economies of scale in both procuring inputs and marketing outputs. In such a context, developing or capitalizing on an institutional infrastructure that facilitates market exchange for smallholders is critically important. By engaging in collective action, smallholders are likely to have better access to markets and derive more benefits from market participation. Over the past few years, stake-holders throughout Africa south of the Sahara have expressed a renewed interest in collective action mechanisms such as producer organizations as a means to help smallholders address market failures.
Producer organizations are membership-based organizations or federations of organizations with elected leaders accountable to their constituents. They take on various legal forms—such as cooperatives, associations, and groups. They can be grouped into four categories, according to their respective functions: (1) commodity-specific organizations focusing on economic services and defending their members’ interests in a particular commodity; (2) advocacy organizations to represent producers’ interests, such as national producers’ unions; (3) associations of users of a natural resource, such as WUAs; and (4) multipurpose organizations

2020 ReSAKSS Annual Trends and Outlook Report 89
that respond to the diverse economic and social needs of their members, often in the absence of local governments or effective public services (World Bank 2007).
In precolonial Africa, agricultural production was organized into commu-nities of subsistence smallholders, with governance based on kinship and hierarchical principles (Buell 1928). The risk associated with subsistence farming was commonly shared within a community through various revolving or rotating schemes (Strickland 1933). These mechanisms were intended to facilitate the exchange of labor, food, and other resources among community members in times of need and continue to exist in many countries, for example, the tontine (rotating savings and credit associations) in Senegal, grenier villageoise (commu-nity granary) in Burkina Faso and Niger, the idir (funeral society) and iqub (savings club) in Ethiopia, and the nnoboa (mutual help group) and susu (rotating savings and credit association) in Ghana. Although such structures continue to serve important social protection functions, arguably their contribution to agricultural development has been negligible (Francesconi and Ayerakwa 2011; Salifu, Francesconi, and Kolavalli 2010).
Colonial authorities, recognizing the social importance of community-based arrangements for risk-sharing purposes, leveraged them to establish cooperatives that could facilitate the bulking and commercialization of agricultural products (Francesconi and Wouterse 2015b). During that time, cooperatives in Africa were used by the colonial powers as a strategic tool to group rural producers into clusters, so that essential export commodities such as coffee, cocoa, and cotton could be collected more cost-effectively. After independence, the governments of the now sovereign states accorded an essential role to cooperatives, in particular for the development of rural areas. Cooperatives enjoyed preferential treatment and were granted supply and marketing monopolies that protected them from competition. They paid for these privileges, however, with the loss of autonomy, democratic control, and economic efficiency. Cooperatives essentially became tools of government. This was the situation in many African countries at the onset of the era of structural adjustment in the late 1980s. Structural adjust-ment resulted in the withdrawal of the state from economic and development functions, and the sudden liberalization of state-controlled cooperatives. Most development partners promoted the concepts of liberalization, deregulation, and privatization—in this context, cooperatives were considered an obsolete model. The disintegration of many state-controlled cooperative movements in the 1990s seemed to confirm this observation. Yet the more recent liberalization of the
economy does appear to steadily offer many cooperatives the opportunity to reinvent their solidarity and generate collective action among their members to tap into economies of scale and improve the productivity of their members.
Historical Context of Smallholder Cooperation in SenegalIn Senegal, agriculture is largely smallholder based. A peasant movement exists with a vast number of rural institutions in thousands of villages as well as strong national-level farmer organizations. The history of agricultural and development policy in Senegal since its 1959 independence can be divided into two main periods: two decades of state intervention (from independence to the late 1970s) followed by two decades of liberalization (from the late 1970ss to 2000) that has become more and more complete. One of the first issues that preoccupied the newly independent country was the organization of rural producers. The decree of 1959 that proposed the creation of agricultural cooperatives expressed the government’s vision of a mechanized, prosperous agricultural sector. The 800 cooperatives that were formed by the promulgation of the law primarily occupied themselves with the commercialization of groundnuts, Senegal’s most important export crop at the time. These cooperatives were supposed to replace one of the most visible signs of the colonial structure: foreign merchants who bought groundnuts and sold their goods to villagers in exchange. However, rural expan-sion slowed in the early 1960s with the ousting of Prime Minister Mamadou Dia, and without support, the cooperatives ended up as an instrument of imposition for rural producers rather than one of expression. During this time, support from the international community paved the way for the creation and development of regional organizations for rural development with a mission to specialize and transform agricultural systems in the different agroecological zones. These organizations were focused on a particular crop and therefore could not grapple with the reality of rural smallholders, who usually cultivated multiple crops, nor with the socioeconomic logic of the household as production unit. These regional organizations mainly engaged in extension to convince farmers to adopt the technological packages that they were recommending.
At the beginning of the 1970s, this system of rural development came into crisis due to a fall in export prices on the world market—for groundnuts in particular—a heavy bureaucracy, the progressive and serious indebtedness of farmers, and severe droughts that affected the Sahel in 1973/1974. During

90 resakss.org
this period, the first independent farmers’ organizations appeared throughout the country, with farmers deciding to take their fate into their own hands and seeking to solve the problems that the state had apparently been unable to address. In some cases, the initiative was taken by young adults who had traveled and returned to their village of origin with plenty of ideas. Members tended to be women and young people, who were not well represented in traditional structures. Through negotiations for space with village elders and by establishing hard-fought peace with local administrators, these associations became more and more widespread throughout the country.
In 1978 the Federation of Non-governmental Organizations of Senegal (FONGS) was established, with the overall objectives of reinforcing solidarity among farmer groups, communicating with member organizations and fore-seeing their training needs, supporting the development initiatives of village-level organizations, and serving as an interface between its members and the external world. For the first 10 years or so, FONGS limited itself to serving as a framework and managing training and exchange programs for new members, with support from a wide range of donors. The start of the period of structural adjustment and the withdrawal of the state, as well as the drought of 1984/1985, marked the start of a new phase in its history. The new agricultural policy, which followed the near bankruptcy of the country and a bailout by the International Monetary Fund, advocated the complete withdrawal of the state from agriculture and rejected the interventionist policy, which the government had adopted up until then. Regional parastatal development organizations were to be dismantled, extension and other services were to be reduced, prices were to be liberalized and input subsidies reduced or eliminated, credit was to be restricted and reorganized, and farmers were encouraged to take over, together with the private sector, the functions and services previously fulfilled by the state. To do so, the government facilitated the emergence of a new category of organizations, with a more flexible legal status: economic interest groups (EIGs), which could be created by at least two people who wanted to undertake a business activity, obtain credit, and so on. These groups rapidly developed due to the support for their creation and the special treatment they received for obtaining credit from the national agricultural credit fund, or Caisse Nationale de Credit Agricole (CNCA), and started to organize themselves at the national level at the end of the 1980s according to different chains (fish, horticulture, livestock, and so on). FONGS, feeling threat-ened by the powers of this new umbrella and wanting to defend its own interests,
undertook more ambitious initiatives at the national level—such as cereal banks and “triangular” exchanges between village-level organizations in surplus and deficit zones. Confronted with suspension of rural credit subsidized by the government, FONGS also provided inputs and agricultural equipment through a savings and credit arrangement. By the same token, FONGS bought shares and became part of the board of directors of the CNCA.
In 1993, FONGS was instrumental in creating the platform of a national rural consultative committee called Le Comité National de Concertation des Ruraux (CNCR), consisting of seven national federations of farmers, livestock producers, fishers and horticultural producers, and rural women. Two years later, two other federations, of forest exploiters, joined the CNCR, bringing its total number of members up to about 3 million. The objective of the CNCR at the outset was to promote dialogue and the exchange of experience between its members, to encourage the pooling of resources and competencies, and to serve as a voice for the farmer movement, versus the state and donors, regarding ques-tions related to national development. A couple of years later, the CNCR needed to develop a mechanism that could disburse funds from the World Bank, the International Fund for Agricultural Development, and a government-managed program of almost US$30 million, to be used for “small rural projects” and to offer services to rural producers. Negotiations with the government and the World Bank led to the creation, in 1996, of a grassroots development organiza-tion called Association Sénégalaise pour la Promotion du Développement à la Base (ASPRODEB), which aimed to augment the economic resources of rural producers, family enterprises, and their organizations by reinforcing access to finance and markets, and by reinforcing their professional capacities. The association, which has the status of nongovernmental organization, implements its activities through a technical arm (McKeon 2002). ASPRODEB manages the Agricultural Services and Producer Organizations Program, which is essentially a partnership between producer organizations and agricultural services, intended to reduce rural poverty, and was initiated by the CNCR (De Janvry and Sadoulet 2004). Beginning in 2000, CNCR became involved in the creation of a peasant movement for West Africa to provide a platform for representation of producers in the subregion at the regional and international levels. It thus prompted the creation of a West African regional umbrella organization, Réseau des Organisations Paysannes et des Producteurs de l’Afrique de l’Ouest.
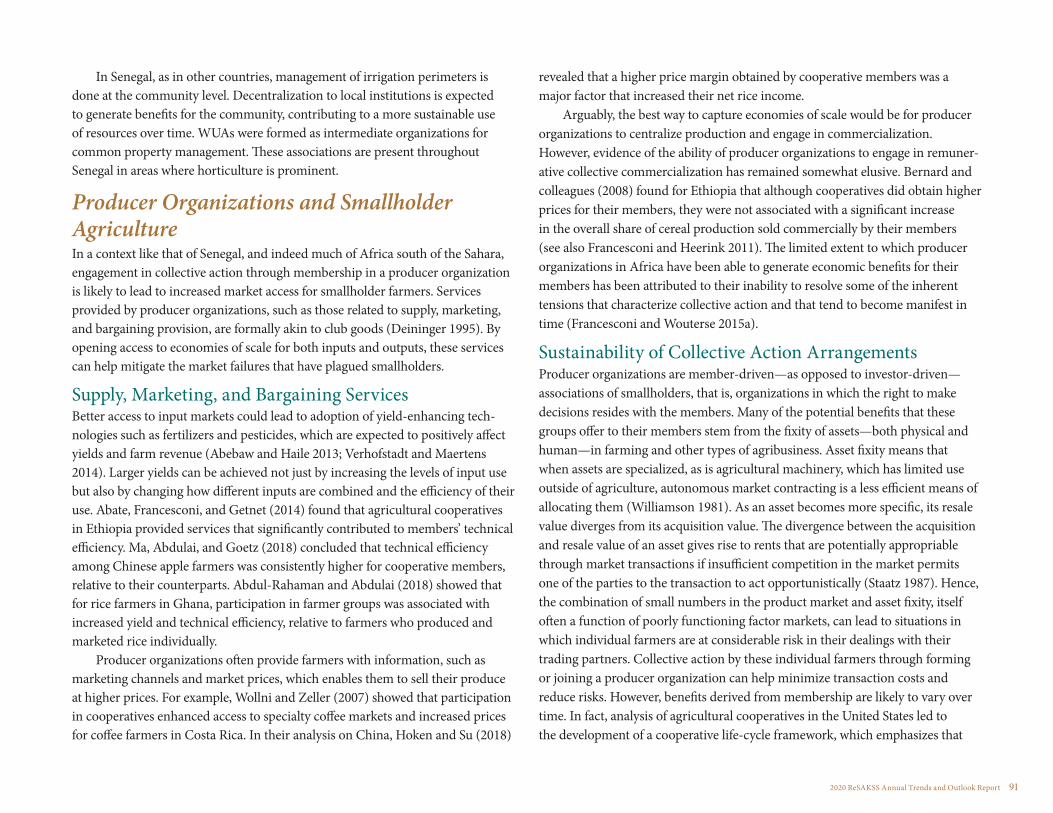
2020 ReSAKSS Annual Trends and Outlook Report 91
In Senegal, as in other countries, management of irrigation perimeters is done at the community level. Decentralization to local institutions is expected to generate benefits for the community, contributing to a more sustainable use of resources over time. WUAs were formed as intermediate organizations for common property management. These associations are present throughout Senegal in areas where horticulture is prominent.
Producer Organizations and Smallholder AgricultureIn a context like that of Senegal, and indeed much of Africa south of the Sahara, engagement in collective action through membership in a producer organization is likely to lead to increased market access for smallholder farmers. Services provided by producer organizations, such as those related to supply, marketing, and bargaining provision, are formally akin to club goods (Deininger 1995). By opening access to economies of scale for both inputs and outputs, these services can help mitigate the market failures that have plagued smallholders.
Supply, Marketing, and Bargaining ServicesBetter access to input markets could lead to adoption of yield-enhancing tech-nologies such as fertilizers and pesticides, which are expected to positively affect yields and farm revenue (Abebaw and Haile 2013; Verhofstadt and Maertens 2014). Larger yields can be achieved not just by increasing the levels of input use but also by changing how different inputs are combined and the efficiency of their use. Abate, Francesconi, and Getnet (2014) found that agricultural cooperatives in Ethiopia provided services that significantly contributed to members’ technical efficiency. Ma, Abdulai, and Goetz (2018) concluded that technical efficiency among Chinese apple farmers was consistently higher for cooperative members, relative to their counterparts. Abdul-Rahaman and Abdulai (2018) showed that for rice farmers in Ghana, participation in farmer groups was associated with increased yield and technical efficiency, relative to farmers who produced and marketed rice individually.
Producer organizations often provide farmers with information, such as marketing channels and market prices, which enables them to sell their produce at higher prices. For example, Wollni and Zeller (2007) showed that participation in cooperatives enhanced access to specialty coffee markets and increased prices for coffee farmers in Costa Rica. In their analysis on China, Hoken and Su (2018)
revealed that a higher price margin obtained by cooperative members was a major factor that increased their net rice income.
Arguably, the best way to capture economies of scale would be for producer organizations to centralize production and engage in commercialization. However, evidence of the ability of producer organizations to engage in remuner-ative collective commercialization has remained somewhat elusive. Bernard and colleagues (2008) found for Ethiopia that although cooperatives did obtain higher prices for their members, they were not associated with a significant increase in the overall share of cereal production sold commercially by their members (see also Francesconi and Heerink 2011). The limited extent to which producer organizations in Africa have been able to generate economic benefits for their members has been attributed to their inability to resolve some of the inherent tensions that characterize collective action and that tend to become manifest in time (Francesconi and Wouterse 2015a).
Sustainability of Collective Action ArrangementsProducer organizations are member-driven—as opposed to investor-driven—associations of smallholders, that is, organizations in which the right to make decisions resides with the members. Many of the potential benefits that these groups offer to their members stem from the fixity of assets—both physical and human—in farming and other types of agribusiness. Asset fixity means that when assets are specialized, as is agricultural machinery, which has limited use outside of agriculture, autonomous market contracting is a less efficient means of allocating them (Williamson 1981). As an asset becomes more specific, its resale value diverges from its acquisition value. The divergence between the acquisition and resale value of an asset gives rise to rents that are potentially appropriable through market transactions if insufficient competition in the market permits one of the parties to the transaction to act opportunistically (Staatz 1987). Hence, the combination of small numbers in the product market and asset fixity, itself often a function of poorly functioning factor markets, can lead to situations in which individual farmers are at considerable risk in their dealings with their trading partners. Collective action by these individual farmers through forming or joining a producer organization can help minimize transaction costs and reduce risks. However, benefits derived from membership are likely to vary over time. In fact, analysis of agricultural cooperatives in the United States led to the development of a cooperative life-cycle framework, which emphasizes that
92 resakss.org
increasing heterogeneity in member preferences may threaten the sustainability of the cooperative organization because competing member-patron interests have the potential to increase collective decision-making costs (Cook and Chambers 2007).
During the process of creating a new cooperative, members tend to be infused with enthusiasm for their new enterprise, with solidarity bred of their common experience, and cohesion shaped by a common background and the sense of successfully overcoming a big challenge. The dedication of these members to their new enterprise and to each other motivates them to act in ways that defy individual rationality based on self-interest. They do not require complicated incentive and monitoring schemes to exercise desirable effort and to refrain from shirking. Such members exert social pressure on each other to ensure that free riders raise their effort levels or leave the cooperative (Ben-Ner and Ellman 2013). However, solidarity may wane over time as the initial condi-tions are replaced by normality and as membership turnover introduces new members, who seldom replicate the energy and values of the original members; new members tend to join the organization one at a time, without the same sense of ownership and togetherness. When financial motivation, centered on individual self-interest, becomes dominant, the organizational design, based on collective decision making and sharing of profits, becomes a source of weakness rather than strength. The design is vulnerable to exploitation by selfish and rela-tively unprincipled members. Over time, shirking in various forms, such as free riding on team contributions, is likely to become increasingly prevalent. When member commitment is affected by heterogeneous preferences, selfish actions may prevail and members may decide not to invest in the organization, that is, to free ride on investments made by others (Staatz 1987). Members can also behave opportunistically by not providing patronage, for example, by side-selling their output to competing traders or processors, to whom they have no repayment obligation (Wouterse and Francesconi 2016).
In her work on common-pool resources, Ostrom (1990) identified some factors that are crucial to the longevity of organizations of collective action. The first is clearly defined boundaries, meaning that those who have the right to withdraw resource units from the common pool must be clearly defined, as must be the boundaries of the common pool itself. Defining the boundaries of the association and specifying those authorized to use it can be thought of as a first step in organizing collective action (Tadesse, Abate, and Ergano 2019).
In general, as a firm or an organization expands its service range, the unit cost of providing those services might fall initially, as expertise, information, and indivisible physical assets are utilized more efficiently. For instance, in the case of agricultural marketing cooperatives, Bernard and Taffesse (2012) showed that expanding the range of activities may not necessarily impair commercial perfor-mance if the newly added activities are closely related to the commercialization purpose. Thus, a variety of complementary services may increase members’ patronage and, hence, the cooperative’s competitiveness. However, scope economies are obtained by enlarging the number of activities that are ultimately bounded. Because each service carries certain (fixed) costs, overdiversification can increase unit costs. For agricultural cooperatives, three main sources of disec-onomies of scope arise: increased cooperative coordination costs (Bernard and Taffesse 2012), increased member transaction costs, and reduced membership commitment. Tadesse, Abate, and Ergano (2019) demonstrated that, for coopera-tives in Ethiopia, a clearly defined boundary—that is, provision of a limited range of appropriate services—was crucial for improving the competitiveness of these organizations.
Ostrom (1990) also emphasized that usage and provision rules need to reflect local conditions. Rules of use, restricting time, place, technology, and/or quantity of resource units, are related to local conditions and to provision rules requiring contributions of labor, materials, money, or some combination of these. The durability of the organization is also influenced by the fact that rules can be modified by those affected. Most production technologies entail some degree of joint production: individual contributions cannot be identified separately from each other. In principle, a monitoring system can resolve the joint production problem (Ben-Ner and Ellman 2013). Ostrom (1990) pointed out that monitors need to be accountable to users of the resource, or even be the users of the resource.
Ostrom (1990) also mentioned that graduated sanctions need to be applied to users who violate operational rules, to avoid shirking or free riding. Member obligations mean that free riding can be avoided and economies of scale can be exploited. Also, by enforcing these obligations, the organization signals to members that excluding noncontributors from services is possible and that members can expect to reap the full returns on their commitments. It should be noted that even if an organization of collective action offers excludable services, it still generates communitywide externalities (Tadesse, Abate, and Ergano 2019).

2020 ReSAKSS Annual Trends and Outlook Report 93
Ostrom (1990) also emphasized the importance of conflict resolution mechanisms: appropriators and their officials should have rapid access to low-cost local arenas to resolve conflicts among appropriators or between users and officials. Profit sharing has been identified as a relatively stable and conflict-reducing distributive rule (Ben-Ner and Ellman 2013). Profit sharing is also valuable for informal agreements. Equal sharing is a particularly clear rule that can be applied quite generally, reducing the scope for self-serving interpretation and misun-derstandings; in addition, its attractive fairness properties make it a salient option for mutual agreement.
A key point that arises from work of Ostrom (1990) and was further emphasized by Francesconi and Wouterse (2015a) is that in “robust” institutions, monitoring and sanctioning are undertaken by the participants themselves. This means that the rights of users to devise their own institutions or rules are not challenged by external governmental authorities.
DataAccording to recent data from a project in Senegal called the Projet d’Appui aux Politiques Agricoles (PAPA), at the national level, 17 percent of smallholders are members of an organiza-tion.2 The membership rate is lower—at around 9 percent—for producers of dry cereals. Producers of horticultural crops, mainly located in the coastal north, and irrigated rice farms in the Senegal River Valley and the Anambe Basin in the south, have higher rates of membership in producer organizations (about 38 percent and 33 percent, respectively). These are slightly higher than the rates found in the literature in earlier years. The country’s national statistics agency, ANSD (2014), reported for the 2013 national census that 11.4 percent of farm households were members of a farmer organization.3 Figure 8.1 displays the density of member-ship, defined as the number of smallholders who are members of an organization,
2 In 2017, a total of 7,000 smallholders were surveyed in a nationally representative survey under PAPA. The survey included all rural departments of Senegal and covered dry cereal, rice, and horticulture producers.
3 This higher rate of membership is, of course, also a result of the sampling strategy that was followed for the horticulture and irrigated rice surveys.
divided by the total number of smallholders in a department. The density of membership in a producer organization is higher in (1) the Senegal River Valley in the departments of Dagana and Podor, in the Saint-Louis region; (2) part of the Niayes area in the coastal north, in the department of Tivaouane in the region of Thies; (3) the groundnut basin in the departments of Nioro du Rip in the region of Kaolack and Koungheul in Kaffrine; and (4) part of south and eastern Senegal in the departments of Kolda and Velingara, both in the region of Kolda,
Source: Data from Projet d’Appui aux Politiques Agricoles survey, Senegal (2017).
FIGURE 8.1—DENSITY OF MEMBERSHIP IN FARM ORGANIZATIONS IN SENEGAL
0 200100 km M. DIE Y E , 2020Données PA PA , 2018
Medium density of membership (0.02 < density < = 0.15)
High density of membership (density > 0.15)
No data
±Density
Low density of membership (density < = .02)

94 resakss.org
as well as Tambacounda region. These data are in line with the latest census of ANSD (2014), which showed these regions to be among the ones that have the highest rates of membership in producer organizations.
If we break down producer organizations by type, as in Figure 8.2, we see that membership in EIGs is most common, with around 9 percent of farms at the national level. As mentioned, EIGs are organizations with a more flexible legal status than that of cooperatives, in that they can be formed by at least two people in order to undertake a business activity, obtain credit, and the like. The rate of membership in EIGs is even higher for irrigated rice and horticulture producers, almost 23 and 17 percent, respectively. This is to be expected because
those engaged in irrigated production tend to have to organize to facilitate access to credit, inputs, and resources such as land and water (Fall 2015).
Figure 8.2 gives a spatial visualization of the institutional infrastructure across the country. In terms of heterogeneity and spatial representativeness of the different types of organizations across the country, we see that all types except federations are found throughout the country. Because federations are composed of lower-level organizations such as unions, which themselves are composed of village-level organizations, this is to be expected. It is also important to note that the density of orga-nizations decreases from west to east. This is also to be expected because population density also decreases in the same manner.
Zooming in on the WUAs for which we have organizational-level data, a first thing to note is that although these associations operate in areas dominated by horticulture and most are involved in water management, their legal form tends to be an EIG or a women’s advancement group (groupe-ment de promotion feminine, or GPF). Average group size is about 100 members, and women tend to be overrepresented in most groups due to their being heavily involved in horticulture. We did not collect data on the timing of group establishment. A study of 50 horticulture organizations in Bakel mentions that these were largely established in the early 2000s and grew in membership at about 5 percent per year (Wouterse and Francesconi 2016). Table 8.1 shows that the WUAs in our sample offer a range of services and not all are involved in water
management. It needs to be noted that most organizations offer more than one service.
Empirical StrategyTechnical efficiency can be defined as the ability of a decision-making unit (such as a farm) to produce maximum output given a set of inputs and technol-ogy. Production technology is commonly modeled by means of a production function. In microeconomic theory a production function is defined in terms of the maximum output that can be produced from a specified set of inputs, given
Source: Data from Projet d’Appui aux Politiques Agricoles survey, Senegal (2017).Note: EIG = economic interest group; GPF = groupement de promotion feminine (women’s advancement group).
FIGURE 8.2—PRODUCER ORGANIZATIONS IN SENEGAL
X
#
"
#^
$
#
!
#
"
$
!#
X^
#
"
$
X
E
!" #$ E
^X$
"#
!# $XEX
!
$
"X
#
$
X
#
"
#
X$
!
"
#
!
!
"
$#E
#^!
"X$
"
#$^
^
$
"
!"#!
^
X
$
#" # !"
^
E
"
$
!
"#
$
^
#
""
^"
#!
^"
$!
#
X
"
$
^#
!
#
X"#
"
$ #^
"
#
X
!
! #
#
!
"
"
$
±
0 210105 km M. DIE Y E , 2020Source: PA PA (2017)
Degree of representation
DepartmentsType of organisation
$ Association
! Coopérative
E Federation
# E IG
XW GPF
" Group of producers
^ Union
High density of membership ( > .040)
Medium density of membership (.008 < density < = .040)
Low density of membership (< = .008)
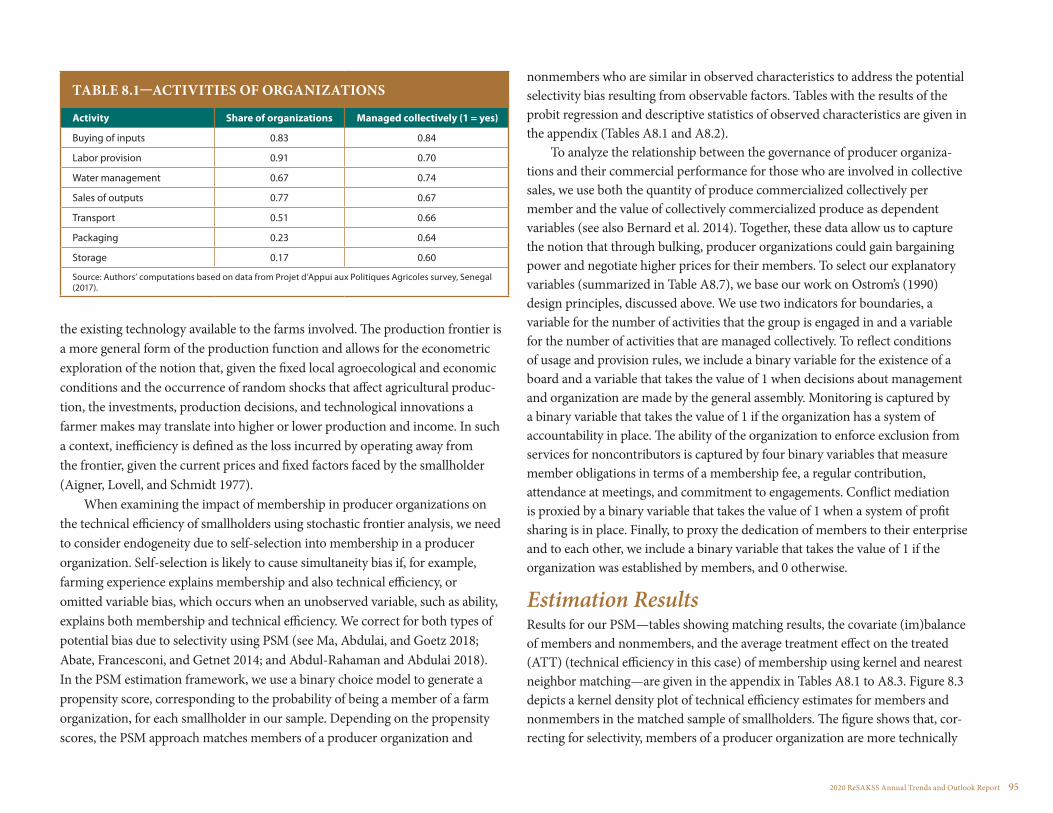
2020 ReSAKSS Annual Trends and Outlook Report 95
the existing technology available to the farms involved. The production frontier is a more general form of the production function and allows for the econometric exploration of the notion that, given the fixed local agroecological and economic conditions and the occurrence of random shocks that affect agricultural produc-tion, the investments, production decisions, and technological innovations a farmer makes may translate into higher or lower production and income. In such a context, inefficiency is defined as the loss incurred by operating away from the frontier, given the current prices and fixed factors faced by the smallholder (Aigner, Lovell, and Schmidt 1977).
When examining the impact of membership in producer organizations on the technical efficiency of smallholders using stochastic frontier analysis, we need to consider endogeneity due to self-selection into membership in a producer organization. Self-selection is likely to cause simultaneity bias if, for example, farming experience explains membership and also technical efficiency, or omitted variable bias, which occurs when an unobserved variable, such as ability, explains both membership and technical efficiency. We correct for both types of potential bias due to selectivity using PSM (see Ma, Abdulai, and Goetz 2018; Abate, Francesconi, and Getnet 2014; and Abdul-Rahaman and Abdulai 2018). In the PSM estimation framework, we use a binary choice model to generate a propensity score, corresponding to the probability of being a member of a farm organization, for each smallholder in our sample. Depending on the propensity scores, the PSM approach matches members of a producer organization and
nonmembers who are similar in observed characteristics to address the potential selectivity bias resulting from observable factors. Tables with the results of the probit regression and descriptive statistics of observed characteristics are given in the appendix (Tables A8.1 and A8.2).
To analyze the relationship between the governance of producer organiza-tions and their commercial performance for those who are involved in collective sales, we use both the quantity of produce commercialized collectively per member and the value of collectively commercialized produce as dependent variables (see also Bernard et al. 2014). Together, these data allow us to capture the notion that through bulking, producer organizations could gain bargaining power and negotiate higher prices for their members. To select our explanatory variables (summarized in Table A8.7), we base our work on Ostrom’s (1990) design principles, discussed above. We use two indicators for boundaries, a variable for the number of activities that the group is engaged in and a variable for the number of activities that are managed collectively. To reflect conditions of usage and provision rules, we include a binary variable for the existence of a board and a variable that takes the value of 1 when decisions about management and organization are made by the general assembly. Monitoring is captured by a binary variable that takes the value of 1 if the organization has a system of accountability in place. The ability of the organization to enforce exclusion from services for noncontributors is captured by four binary variables that measure member obligations in terms of a membership fee, a regular contribution, attendance at meetings, and commitment to engagements. Conflict mediation is proxied by a binary variable that takes the value of 1 when a system of profit sharing is in place. Finally, to proxy the dedication of members to their enterprise and to each other, we include a binary variable that takes the value of 1 if the organization was established by members, and 0 otherwise.
Estimation ResultsResults for our PSM—tables showing matching results, the covariate (im)balance of members and nonmembers, and the average treatment effect on the treated (ATT) (technical efficiency in this case) of membership using kernel and nearest neighbor matching—are given in the appendix in Tables A8.1 to A8.3. Figure 8.3 depicts a kernel density plot of technical efficiency estimates for members and nonmembers in the matched sample of smallholders. The figure shows that, cor-recting for selectivity, members of a producer organization are more technically
TABLE 8.1—ACTIVITIES OF ORGANIZATIONS
Activity Share of organizations Managed collectively (1 = yes)
Buying of inputs 0.83 0.84
Labor provision 0.91 0.70
Water management 0.67 0.74
Sales of outputs 0.77 0.67
Transport 0.51 0.66
Packaging 0.23 0.64
Storage 0.17 0.60
Source: Authors’ computations based on data from Projet d’Appui aux Politiques Agricoles survey, Senegal (2017).

96 resakss.org
efficient, compared with nonmembers. A t-test confirms that this difference is significant. These results are in line with those of, for example, Abdul-Rahaman and Abdulai (2018) for rice farmers in Ghana, underlining that these organiza-tions, by providing supply and marketing services, do address market failures.
Estimation results of the stochastic frontier and technical efficiency for the matched sample, given in Table A8.6 in the appendix, reveal that membership in a producer organization is indeed associated with lower inefficiency. Inefficiency is also explained by sex of the household head, with female heads being less efficient.
Table 8.2 shows results of the estimation of the relationship between gover-nance of producer organizations and their commercial performance for those who are involved in collective sales.
Results in Table 8.2 show that the existence of a board is correlated with better commercial performance. In cooperatives, as in firms, the board’s functions are to set strategic goals and develop an overarching vision for the organization. The finding here points to the role that leadership plays in the
TABLE 8.2—ORDINARY LEAST SQUARES REGRESSION RESULTS OF COMMERCIAL PERFORMANCE
Variable Produce sold (kg/member)
Value of produce sold (FCFA/
member)
Governance
Established by members (1 = yes) -40.30 (23.26)a* -1.09 (0.69)*
Existence of a board (1 = yes) 33.85 (20.22)* 1.42 (0.58)**
Decisions made by general assembly (1 = yes) 39.71 (21.45)* 1.37 (0.75)*
Number of activities -10.63 (6.89) -0.40 (0.25)
Number of collective activities 9.61 (5.89)* 0.42 (0.18)**
Membership fee (1 = yes) -24.68 (17.92) -1.10 (0.68)*
Regular contributions (1 = yes) -44.01 (22.02)** -1.62 (0.75)**
Meeting attendance (1 = yes) 10.58 (27.53) 1.27 (0.80)*
Must honor commitments (1 = yes) 0.71 (28.73) -0.80 (0.80)
Profit sharing (1 = yes) 15.00 (22.34) 0.01 (0.74)
System of accountability (1 = yes) 16.95 (12.50) 0.76 (0.41)*
Controls
Collective investment per member (in FCFA 10,000s)
-0.18 (0.37) 0.02 (0.02)
Land held by PO per member (ha) 0.17 (2.64) 0.05 (0.15)
Collective output (kg) 0.01 (0.00)* 0.00 (0.00)**
Age of PO leader (years) 1.15 (0.73) -0.01 (0.02)
Sex of PO leader (1 = male) -97.35 (30.08)** -1.79 (1.07)*
Number of observations 302 302
R-squared 0.47 0.36
Source: Authors’ computations based on data from Projet d’Appui aux Politiques Agricoles survey, Senegal (2017). Note: a Robust standard errors in parentheses; ** denotes significance at the 5 percent level; * significance at 10 percent level. FCFA = Financial Community of Africa francs; PO = producer organization.
Source: Authors’ computations based on data from Projet d’Appui aux Politiques Agricoles survey, Senegal (2017).
FIGURE 8.3—KERNEL DENSITY PLOT OF TECHNICAL EFFICIENCY OF PRODUCER ORGANIZATION MEMBERS AND NONMEMBERS (MATCHED SAMPLE)
Members
Nonmembers
01
23
4D
ensi
ty
0 .2 .4 .6 .8 1
Technical e�ciency

2020 ReSAKSS Annual Trends and Outlook Report 97
commercial performance of producer organizations, as also highlighted in empirical studies for Senegal by Bernard and colleagues (2014) and by Wouterse and Francesconi (2016). Establishment by members is associated with a smaller volume of collective sales and a lower value of sales. This could be because organizations established or supported by donors and governments usually benefit from more guidance and have access to new technologies including crop varieties and institutional arrangements with buyers. As a robustness check, we interact the level of collective investment with establishment by members, and find that the coefficient for being established by members is no longer significant; meanwhile, the negative, significant coefficient on the interaction term suggests that lower investment levels of organizations established by members explain their smaller volume of sales.
Management and organizational decisions made by the general assembly are associated with better performance. It is possible that decisions made at this level are more reflective of local conditions. Whereas the number of activities in which the organization is engaged has no bearing on performance, a greater number of activities that are managed collectively does. This could be because managing more activities collectively is associated with increased patronage. In terms of member obligations, results are rather mixed. Although financial obliga-tions—membership fees and contributions—are associated with less collective commercialization, the requirement that members participate in meetings does correlate positively with the value of collective sales. Though these meetings are not social occasions, they do contribute to the connections between members and strengthen mutual concern, one of the cornerstones of sustainable collective action (Ben-Ner and Ellman 2013). The existence of a system of accountability is associated with a higher value of collective sales, though not with the volume of sales. It is also important to note that when an organization is headed by a female, this is associated with less produce sold collectively. A breakdown of the control variables by sex of the leader reveals that organizations headed by a woman hold less land, have a lower level of collective investment, and produce much less, compared with their counterparts headed by a male.
Although our results are correlations and should not be interpreted as suggestions of causal relations, it is evident that the design principles, as laid out by Ostrom (1990) and discussed above, and the governance of producer organizations relate to the commercial performance of such organizations in horticulture-producing areas of Senegal. Combining these results with
the individual smallholder results suggests that there are two ways in which membership in producer organizations can improve smallholder productivity and income. First, members of producer organizations tend to be more techni-cally efficient—that is, they are able to produce more output with a given level of inputs. Second, organizations that are carefully designed and governed to balance efficiency and equity objectives perform better economically. And precisely because these organizations are member owned, their performance translates directly into benefits for members.
Conclusion and Policy Implications Senegal is a country with a vast wealth of rural institutions in thousands of villages as well as strong national-level organizations. Smallholder agriculture remains exposed to pervasive market failures that lead to missed opportuni-ties and suboptimal economic behavior. These failures are often rooted in the importance of economies of scale in procuring inputs and marketing produce. Capitalizing on the existing institutional infrastructure that facilitates market exchange for smallholders is thus critically important, especially given that since 2012, Senegal has reprioritized its investments to catalyze an agriculturally led structural transformation. The country’s development plan envisages agriculture as an engine of growth that will spur balanced economic and social development across multiple sectors.
A commonly held notion is that despite their long history and omnipresence, organizations of collective action in rural Senegal are relatively weak at delivering benefits to their members. It has been suggested that when design rules are not put in place, heterogeneity in member preferences threatens the viability of the cooperative organization because competing member-patron interests increase collective decision-making costs. If problems associated with collective action are not addressed, organizations can enter a state of dormancy, not engaging in commercial activities but instead solely serving as distributors of government-subsidized agricultural inputs. In addition, the performance of traditional producer organizations in Senegal is said to be hampered by the bureaucratic procedures and rules that characterize their governance structures. The EIGs and GPFs that were created in the late 1980s, following the onset of structural adjustment, have a more flexible legal status. When considering the role that producer organizations in rural Senegal can play in addressing market failures

98 resakss.org
and enhancing smallholder production, it is thus important to take account of the various legal forms such organizations can take.
This paper has used data on almost 7,000 smallholders active in the cereal, rice, and horticulture value chains, along with organizational-level data for 395 WUAs in horticulture-producing areas of Senegal, to assess how producer organizations affect smallholder welfare. Correcting for selectivity by using PSM, we have shown that technical efficiency in agricultural production is significantly higher for those smallholders who are members of a producer organization. However, not all producer organizations are created equal, and design rules and governance are expected to affect the “robustness” of organizations and their ability to generate lasting benefits for their members. Using data for 395 WUAs—mainly EIGs and often made up solely of women—we show that these organizations are by no means dormant and are involved in several agriculture-related activities. We have also empirically demonstrated, using regression analysis, that the design principles and the governance of these groups affect their commercial performance and thus the generation of benefits for their members.
In terms of policy implications, the role that producer organizations can play in the achievement of the country’s economic and agricultural development is likely to be significant. Encouraging smallholders’ membership in producer organizations is one policy measure that could contribute to the achievement of objectives such as intensification of family farming. Because design features and governance affect the level of benefits that these organizations can provide to their members in terms of collective commercialization, policies can also target the organizations themselves. There is a fine line, however, between interventions that could strengthen organizations and those that could be overly invasive. In general, producer organizations need to balance equity and efficiency objectives, and policymakers need to be sensitive to maintaining that balance. Finally, because female farmers appear significantly less efficient and female-headed producer organizations are less engaged in collective commercialization, policy-makers would do well to adopt policies that are gender sensitive.
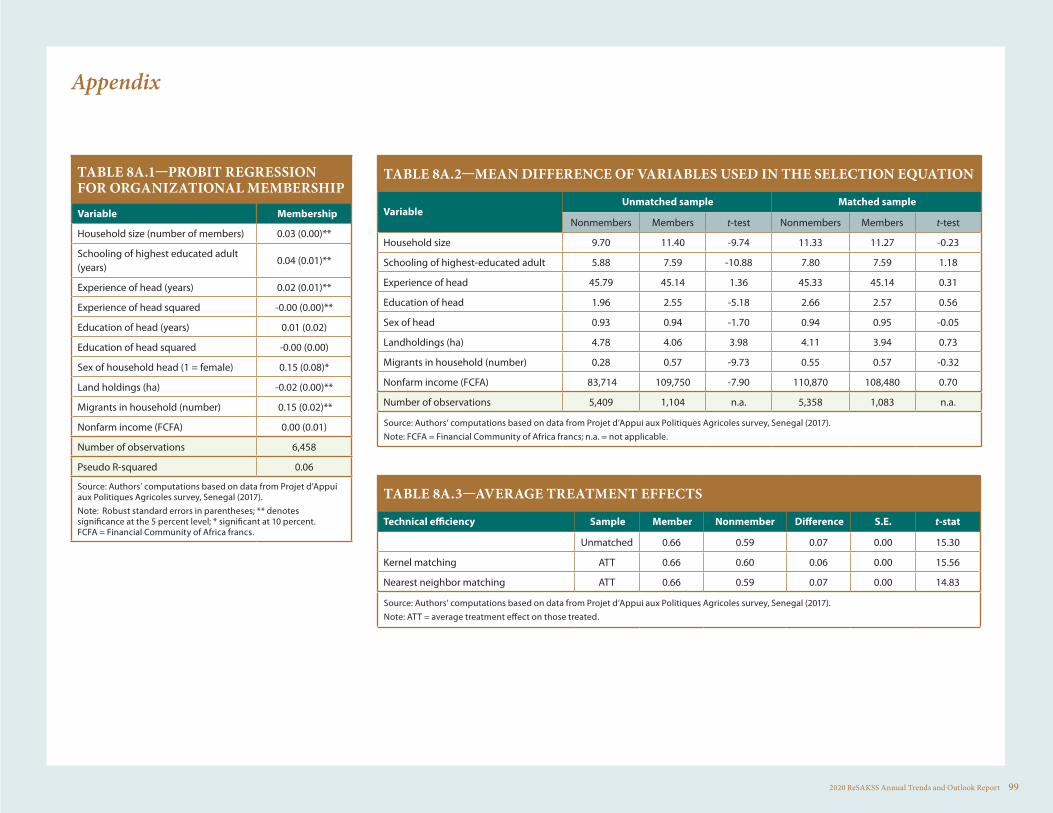
2020 ReSAKSS Annual Trends and Outlook Report 99
Appendix
TABLE 8A.1—PROBIT REGRESSION FOR ORGANIZATIONAL MEMBERSHIP
Variable Membership
Household size (number of members) 0.03 (0.00)**
Schooling of highest educated adult (years)
0.04 (0.01)**
Experience of head (years) 0.02 (0.01)**
Experience of head squared -0.00 (0.00)**
Education of head (years) 0.01 (0.02)
Education of head squared -0.00 (0.00)
Sex of household head (1 = female) 0.15 (0.08)*
Land holdings (ha) -0.02 (0.00)**
Migrants in household (number) 0.15 (0.02)**
Nonfarm income (FCFA) 0.00 (0.01)
Number of observations 6,458
Pseudo R-squared 0.06
Source: Authors’ computations based on data from Projet d’Appui aux Politiques Agricoles survey, Senegal (2017). Note: Robust standard errors in parentheses; ** denotes significance at the 5 percent level; * significant at 10 percent. FCFA = Financial Community of Africa francs.
TABLE 8A.2—MEAN DIFFERENCE OF VARIABLES USED IN THE SELECTION EQUATION
VariableUnmatched sample Matched sample
Nonmembers Members t-test Nonmembers Members t-test
Household size 9.70 11.40 -9.74 11.33 11.27 -0.23
Schooling of highest-educated adult 5.88 7.59 -10.88 7.80 7.59 1.18
Experience of head 45.79 45.14 1.36 45.33 45.14 0.31
Education of head 1.96 2.55 -5.18 2.66 2.57 0.56
Sex of head 0.93 0.94 -1.70 0.94 0.95 -0.05
Landholdings (ha) 4.78 4.06 3.98 4.11 3.94 0.73
Migrants in household (number) 0.28 0.57 -9.73 0.55 0.57 -0.32
Nonfarm income (FCFA) 83,714 109,750 -7.90 110,870 108,480 0.70
Number of observations 5,409 1,104 n.a. 5,358 1,083 n.a.
Source: Authors’ computations based on data from Projet d’Appui aux Politiques Agricoles survey, Senegal (2017). Note: FCFA = Financial Community of Africa francs; n.a. = not applicable.
TABLE 8A.3—AVERAGE TREATMENT EFFECTS
Technical efficiency Sample Member Nonmember Difference S.E. t-stat
Unmatched 0.66 0.59 0.07 0.00 15.30
Kernel matching ATT 0.66 0.60 0.06 0.00 15.56
Nearest neighbor matching ATT 0.66 0.59 0.07 0.00 14.83
Source: Authors’ computations based on data from Projet d’Appui aux Politiques Agricoles survey, Senegal (2017). Note: ATT = average treatment effect on those treated.

100 resakss.org
Appendix continued
TABLE 8A.5—SUMMARY STATISTICS OF VARIABLES USED IN THE PRODUCTION FRONTIER AND TECHNICAL EFFICIENCY ESTIMATESVariable Mean Std. dev. Min Max
Value of output (FCFA) 1,189,091 3,318,789 0 112,000,000
Land (ha) 4.46 5.15 0.002 62
Household workers (number) 3.09 2.27 1 22
Fertilizer (kg) 657.18 2,987.26 0 74,400
Cost of hired labor (FCFA) 27,536 102,864 0 1,000,000
Other costs (FCFA) 21,806 156,745 0 10,100,000
Value of equipment (FCFA) 173,914 364,639 0 7,619,100
Rice producer (1 = yes) 0.10 0.31 0 1
Cereal producer (1 = yes) 0.69 0.46 0 1
2016 rainfall deviation from 4-year average (mm)
-27.99 73.44 -296.80 188.08
Number of crops cultivated 2.17 1.03 1 9
Land rights through inheritance (1 = yes)
0.69 0.47 0 1
Number of observations 6,513 n.a. n.a. n.a.
Source: Authors’ computations based on data from Projet d’Appui aux Politiques Agricoles survey, Senegal (2017). Note: FCFA = Financial Community of Africa francs; n.a. = not applicable.
TABLE 8A.4—ROBUSTNESS CHECK USING ROSENBAUM TEST
Rosenbaum bounds for delta (N = 1,083 matched pairs)
Gamma sig+ sig- t-hat+ t-hat- CI+ CI-
1.0 0 0 0.073956 0.073956 0.067049 0.080766
1.2 0 0 0.064763 0.082946 0.057424 0.089626
1.4 0 0 0.056659 0.090316 0.049009 0.096820
1.6 0 0 0.049439 0.096474 0.041538 0.102928
1.8 0 0 0.042977 0.101740 0.034911 0.108160
2.0 7.50E-15 0 0.037199 0.106371 0.028866 0.112752
2.2 3.10E-11 0 0.031906 0.110448 0.023286 0.116905
2.4 1.90E-08 0 0.027039 0.114169 0.018133 0.120576
2.6 2.60E-06 0 0.022459 0.117484 0.013424 0.123879
2.8 0.000114 0 0.018254 0.120505 0.009017 0.126872
3.0 0.001971 0 0.014320 0.123233 0.004841 0.129604
3.2 0.016421 0 0.010629 0.125768 0.000909 0.132118
3.4 0.075974 0 0.007193 0.128093 -0.002790 0.134465
3.6 0.219854 0 0.003870 0.130228 -0.006220 0.136687
3.8 0.440789 0 0.000735 0.132220 -0.009610 0.138748
4.0 0.670987 0 -0.002290 0.134111 -0.012740 0.140728
Source: Authors’ computations based on data from Projet d’Appui aux Politiques Agricoles survey, Senegal (2017).

2020 ReSAKSS Annual Trends and Outlook Report 101
Appendix continued
TABLE 8A.6— ESTIMATION RESULTS OF PRODUCTION FRONTIER AND TECHNICAL EFFICIENCY FOR MATCHED SAMPLE
Variable Value of output (FCFA)
Ln Land (ha) 0.66 (0.02)**
Ln Household workers (number) 0.10 (0.02)**
Ln Fertilizer (kg) 0.11 (0.01)**
Ln Cost of hired labor (FCFA) 0.02 (0.00)**
Ln Other costs (FCFA) 0.02 (0.00)**
Ln Value of equipment (FCFA) 0.03 (0.02)
Rice producer (1 = yes) 1.63 (0.07)**
Cereal producer (1 = yes) 0.42 (0.06)**
2016 rainfall deviation from 4-year average (mm/100) -0.15 (0.02)**
Variable Technical inefficiency
Membership in a producer organization -0.59 (0.12)**
Household size -0.02 (0.01)**
Schooling of highest-educated adult -0.00 (0.01)
Experience of head 0.01 (0.00)**
Education of head 0.01 (0.01)
Sex of head -0.68 (0.15)**
Number of crops grown -0.02 (0.04)
Land rights through inheritance 0.28 (0.12)**
Source: Authors’ computations based on data from Projet d’Appui aux Politiques Agricoles survey, Senegal (2017). Note: Robust standard errors in parentheses; ** denotes significance at the 5 percent level; * significant at 10 percent. FCFA = Financial Community of Africa francs.
TABLE 8A.7— SUMMARY STATISTICS OF VARIABLES USED TO EXPLAIN COMMERCIAL PERFORMANCE
Variable Mean Std. dev. Min Max
Produce sold (kg/member) 124.64 439.94 0 6,000
Value of produce sold (FCFA/member) 21,628 67,996 0 486,000
Established by members (1 = yes) 0.58 0.49 0 1
Existence of a board (1 = yes) 0.64 0.48 0 1
Decisions made by general assembly (1 = yes) 0.38 0.49 0 1
Number of activities 4.09 1.65 0 8
Number of collective activities 3.02 2.10 0 7
Membership fee (1 = yes) 0.63 0.48 0 1
Regular contributions (1 = yes) 0.76 0.43 0 1
Meeting attendance (1 = yes) 0.59 0.49 0 1
Must honor commitments (1 = yes) 0.59 0.49 0 1
Profit sharing (1 = yes) 0.35 0.48 0 1
System of accountability (1 = yes) 0.61 0.49 0 1
Collective investment per member (FCFA/10,000) 3.31 21.56 0 300
Land held by PO per member (ha) 0.41 4.09 0 55.56
Collective output (kg) 7,131 35,258 0 600,000
Age of PO head (years) 50.18 10.49 23 80
Sex of PO head (1 = male) 0.23 0.42 0 1
Number of observations 395 n.a. n.a. n.a.
Source: Authors’ computations based on data from Projet d’Appui aux Politiques Agricoles survey, Senegal (2017). Note: FCFA = Financial Community of Africa francs; n.a. = not applicable; PO = producer organization.

CHAPTER 9
Skills Development for Value Chain Actors in African Agriculture
Oliver Kirui

2020 ReSAKSS Annual Trends and Outlook Report 103
This chapter highlights policies and interventions related to skills development and training for agricultural and food value chain development in Africa. The opening section provides the background
and context for the study. The section that follows is dedicated to describing skills gaps and the training needs of various agrifood value chain actors in Africa. The next section describes skills development and training provision for agrifood value chain actors. It provides an overview of continental policies and interventions that characterize skills development for agricultural value chain actors, discusses some examples of significant agricultural technical and vocational education and training (ATVET) initiatives in selected countries in Africa, mulls participation of the private sector in skills development and training, and discusses the prospects of a “dual system” of skills development in African agriculture. The final section concludes the chapter with a summary of main findings and some policy implications.
Background and ContextFormal vocational training is needed to transform farmers and other actors in the agriculture and food system into skilled entrepreneurs who run their farms or businesses as productive and sustainable economic enterprises (Kahan 2012; Kahan and Worth 2015; Carson 2018; Reardon et al. 2019). Training is essential for farms and companies in the agro-processing sector to sustainably increase their level of productivity and income as well as their competitiveness in domestic and international markets. Though the agricultural sector employs a vast proportion of the labor force in many African countries, it is not yet sufficiently professionalized to realize its potential for poverty alleviation, food security, and economic growth (GIZ 2017).
Recent estimates from the International Labour Organization (ILO) show that about 44 percent and 16 percent of the youth (ages 15–24) in northern Africa and Africa south of the Sahara, respectively, are not in employment, education, or training (NEET)—that is, are classified as “idle” youth (ILO 2020). Idle young people are unable to develop skills needed in the labor market, which reduces their future employment possibilities and limits their countries from achieving sustained economic growth (O’Higgins 2017; World Economic Forum 2017; ILO 2019). Further, statistics show that an overwhelming majority of the youth in employment (95 percent in Africa south of Sahara and 88 percent in northern
Africa) in 2016 were in the informal sector because of lack of opportunities in the formal economy (ILO 2020). Informal jobs (such as own-account work and contributing to family work) are associated with vulnerability characterized by income instability and limited social security coverage (Elder and Kring 2016). To keep pace with the growing working-age population, Africa requires some 18–22 million new jobs annually (IMF 2016; ILO 2019; Coulibaly 2019).
Unfortunately, there are still far too few training opportunities for young people. Moreover, the available training often does not match the needs of the private sector (Kirui and Kozicka 2018; Ragasa et al. 2019; Kosec and Ragasa 2019). The low social status of crafts and trades poses another challenge in promoting technical and vocational education and training, or TVET (Ute 2014; Chong 2014). Furthermore, vocational training institutes in many African coun-tries have suffered from many years of neglect, having been poorly equipped with physical, human, and financial resources (Eicker, Haseloff, and Lennartz 2017). The curriculum in many these of institutions is also outdated (Janoski, Luke, and Oliver 2014; Eicker, Haseloff, and Lennartz 2017). There is, therefore, an urgent need to expand technical and vocational training opportunities and revamp the existing training institutions in Africa. ATVET should also be made readily avail-able to farming communities in order to improve their productivity and make the agricultural sector more attractive. For far too long, African smallholder agriculture has been characterized by lack of modern production methods and low productivity, making it an unattractive sector to work in. There is also the need to train people in new and innovative ways and strategies for developing accompanying small and medium enterprises (Davis and Babu 2020).
One of the focuses of the erstwhile United Nations Millennium Development Goals (MDGs) was on basic education, and especially on universal primary education, leaving out post-basic education and training, including ATVET (Fluitman 2005). This structure was in large part because vocational education and training was absent in most government and donor poverty-reduction strategies in most developing countries (King and Palmer 2006, 2007; Kirui and Kozicka 2018; Ziderman 2018). Indeed, vocational education and training has been receiving even less political attention (Oketch 2007, 2014), due, in part, to a lack of donor investment and lack of action by many governments, despite ATVET’s place among the key pillars of training for sustainable development (Pavlova 2014). The Sustainable Development Goals (SDGs), however, have
104 resakss.org
specifically placed importance on ATVET. Goal 8 of the SDGs (to promote sustained, inclusive, and sustainable economic growth; full and productive employment; and decent work for all) seeks to substantially reduce the propor-tion of NEET youth by 2020 (UN General Assembly 2015).
The linkages between poverty reduction, training and skills acquisition, increased growth and productivity, and innovation are particularly strong in the informal sector (Fluitman 2002; Fu, Mohnen, and Zanello 2018; Acemoglu et al. 2018; Bardak and Rosso 2019; Chavas and Nauges 2020; Gutowski et al. 2020). For instance, ATVET plays a vital role in developing the skills needed to improve output, quality, variety, and occupational safety, all of which in turn increase the incomes and livelihoods of the poor. ATVET can also strengthen trainees’ knowl-edge about the informal sector, rural organizations, and good governance. Access to training and relevant skills in the agrifood value chain may also link the poor rural population to profitable income-generating activities. Effective ATVET systems that build linkages between education, technical training, labor market entry, and lifelong learning are also necessary for generating better-paying jobs in rural areas and beyond (White 2012; Poole et al. 2013; Walker and Hofstetter 2016; Som et al. 2018; Yami et al. 2019; Christiaensen 2020).
The African Union has identified agriculture and rural development as key priority areas in which technical and vocational training and skills develop-ment are crucial for economic and social development to be realized (African Union 2007; ILO and UNESCO 2019; McGrath et al. 2019). Without these new skills, the indigenous (cottage) industries and the traditional and informal skills acquisition systems would not adequately spur development. The African Union, therefore, recommended that the ‘‘member States develop and implement policies and strategies that would provide (re)training opportunities so as to ensure that half of Africa’s workforce will obtain new or improved skills” (AUC 2014, 6). ATVET is increasingly being supported through vocational colleges and university-based certification programs, and through private sector institutions and job-based training programs (Jacobs and Hawley 2008; Rivera and Alex 2008; Jones 2013; Adendorff and Van Wyk 2016; Mwaura 2017; Somers et al. 2019; Bankole, Nouatin, and Gandonou 2019; Ramboarison-Lalao and Rabeson 2020).
Skills Gaps and Training Needs of Agrifood Value Chain ActorsIn general, the actors involved in the ATVET system can be grouped into four categories:
1. Training providers, such as public and private institutions, teachers/trainers, nongovernmental organizations (NGOs)
2. Training recipients, such as students/apprentices, farmers (commercial and smallholders), entrepreneurs along the value chains (aggregators, processors, retailers, wholesalers, transporters, agrifood sector companies), producer organizations and cooperatives
3. Regulators: the state, line ministries, policymakers
4. Other interested parties, such as sponsors, universities, agricultural exten-sion agents, NGOs
Overall, the public sector does not provide adequate ATVET or TVET across Africa. The TVET sector is grossly inadequate, and ATVET is even worse in countries where it is most needed (Eicker, Haseloff, and Lennartz 2017). In countries where some training is available, it lacks practical relevance to labor market needs (Eicker, Haseloff, and Lennartz 2017). Furthermore, the infrastruc-ture and equipment are extremely insufficient (Li et al. 2016). The low quality of teaching in these institutions is also of major concern—most of the teaching and instructing staff do not have the requisite combination of academic competencies alongside technical qualifications and industry experience (Eicker, Haseloff, and Lennartz 2017; Ismail et al. 2018; Koobonye 2020). In the absence of ATVET, agricultural extension service providers have been filling the void, albeit with disappointing results.
In many countries, the provision of TVET by NGOs is on the increase, in terms of both the number of institutions and the number of students, albeit still negligible on both accounts. This trend is partially explained by the fact that the private sector provides training for the informal sector (which is an expanding job market all over Africa), whereas public institutions mainly provide training for the relatively stagnant agricultural and industrial sectors. Private providers

2020 ReSAKSS Annual Trends and Outlook Report 105
also target “soft” business and service-sector skills that do not require huge capital outlays to deliver, such as secretarial practice, cookery, and garment making. A limited amount of in-company or enterprise-based training also takes place in some countries, but this type of training aims to hone some specific skills of company employees (African Union 2007; Onderi, Ajowi, and Malala 2014; Akoojee 2016; Malambe 2016; Adejuwon 2016; Walker and Hofstetter 2016; Egeru et al. 2016; Melaku 2017; Mungai et al. 2018; McGrath et al. 2019).
Figure 9.1 classifies the actors involved in TVET into formal, nonformal, and informal training categories and by level of education, and distin-guishes between private and public agents. TVET providers generally fall into one of the following categories: public school–based vocational education and training programs, vocational training centers, private for-profit institutions, or NGOs.
The anticipated recipients of ATVET are a wide-ranging group, including students/apprentices, farmers (smallholders and commercial), entrepre-neurs within the agrifood value chain (aggregators, processors, and agribusiness managers). The human capacity needs of these recipients are diverse and encompass both “hard” and “soft” skills—technical, managerial, business, and entrepreneurial (Davis et al. 2007; Timmer 2011). ATVET and skills development systems should transform training into an entrepreneurial and professional system that will improve the skills of value chain actors and attract more youth into agrifood value chains. It should provide adequate skills to various value chain actors. This system is needed to transform the traditional agricultural sector and to effectively build the necessary capaci-ties that correspond to the needs of the agrifood sector (Timmer 2011; Babu, Manvatkar, and Kolavalli 2016).
At the production level of the value chain, technical skills such as land prepa-ration methods, proper use of inputs (seeds, fertilizers) and machinery, crop
management, and postharvest handling and storage are essential for all producers (Mabaya and Cramer 2014). Management skills help value chain actors to efficiently manage their physical, financial, and human capital resources. With proper management skills, the value chain actors have the capacity to identify and exploit opportunities, improve their operations, and respond quickly to market shifts (Babu 2015). However, most farmers and other value chain actors across Africa exhibit extensive capacity gaps because they are poorly educated and ill-trained, lacking the individual capacity to expand their small-scale opera-tions (Babu 2015). Entrepreneurial and business skills are needed to increase the profitability of enterprises (Yumkella et al. 2011). These skills are often important for input and output market participation, and for engaging with other value chain actors (for example, through contract farming) (Rao and Sudarshan 2012).
Source: Kirui and Kozicka (2018).Note: NGO = nongovernmental organization; TVET = technical and vocational education and training.
FIGURE 9.1—ACTORS IN TECHNICAL AND VOCATIONAL EDUCATION AND TRAINING IN AFRICA
Shor
t-Te
rm T
rain
ing
Formal Nonformal Informal
Tertiary
Secondary/ Postsecondary
Private(technical)
Universities
College
Farmer Organizations
Inpu
t-Su
pply
ing
Com
pani
es
Priv
ate
Exte
nsio
n Se
rvic
es
Publ
ic E
xten
sion
Ser
vice
s
NG
Os
Farms as Employers
Input-Supplying Companies
Farmer to Farmer
Public Private
Media
Public(technical)
Universities
PublicUniversitiesof AppliedSciences
PrivateUniversitiesof AppliedSciences
PrivateCollege
TVETSchools
PrivateTraining
Providers
Companies(formal
apprenticeship)

106 resakss.org
The expansion of a smallholder production system into an agro-enterprise hinges on increasing both technical and entrepreneurial capacity (Babu, Manvatkar, and Kolavalli 2016). Consequently, successful agribusiness requires improved mana-gerial skills and agribusiness practices (Babu, Manvatkar, and Kolavalli 2016).
Whereas most ATVET systems focus primarily on the farm level and basic processing, this chapter proposes that a much broader set of skills is required to transform the agriculture sector in Africa. The relevant professions can be grouped into three categories:
1. Core professions include those directly related to the agricultural value chain. These may vary in degree of specialization because innovations and the introduction of new tech-nologies may require highly specialized and skilled labor beyond the production level—for example, production of inputs (seeds, finger-lings, fertilizer mixing), processing and storage technology, logistics, retailing.
2. Support professions are required to ensure the functioning of the core professions at different stages of the agricultural value chain—for example, machine technicians for repair and servicing of farm machines at the production, processing, and storage stages of the value chain, and electri-cians to ensure proper processing, storage, and logistics.
3. Cross-sectoral professions are not directly related to the agricultural sector but are required to ensure the functioning of the value chain as a whole—for example, finance, accounting, insurance, and communication specialists.
Some examples of professions along the value chain are shown in Figure 9.2.
The approach to providing ATVET pursued by countries in Africa may be considered inadequate in the context of increasingly technical 21st-century agricultural systems (Johanson 2007; Brooks et al. 2013). In the majority of the countries, vocational training has not been considered a means for long-term capacity development in agriculture (African Union 2007; Walker and Hofstetter 2016; Mulugeta and Mekonen 2016; ILO and UNESCO 2019). In its place, short-term and topic-specific training was the main instrument to improve farmers’ knowledge and agricultural practices, and young farmers learned farming techniques from their parents (Šūmane et al. 2018; Afere et al. 2019; ILO and UNESCO 2019). However, evidence shows that short-term training (lasting a few days or weeks) alone does not sufficiently qualify young farmers and other professionals in the agrifood sector, nor in the rural sector as a whole (Haggblade et al. 2015; Minde et al. 2015; Eissler and Brennan 2015; Brewer and Comyn 2015; O’Donoghue and Heanue 2018; Jjuuko, Tukundane, and Zeelen
Source: Kirui and Kozicka (2018).
FIGURE 9.2—TECHNICAL AND VOCATIONAL EDUCATION AND TRAINING PROFESSIONS ALONG THE AGRICULTURAL VALUE CHAIN
Input supply
Production
Processing &storage
Retailing & logistics
Industrial service specialistElectronics technician
Food technology specialistDairy technology specialist
Distillery specialist
Logistics specialistRetailing specialist
Packaging technologist Marketing specialist
Examples of core professions
Insurance and �nance specialist Accountant
O�ce communication specialist
O�ce management specialist
Cleaning service
Examples of support professions
Animal breeding specialist Crop technology specialist
Home economics specialistSpecialist for agri. services
Mechantronics technichian for farm machines
Farmer Fish farm specialist
Production technology specialist
Air conditioning technicianWaste management specialist
Laboratory assistantElectronics technician
Laboratory assistantChemical technician
Examples of overarching professions
2020 ReSAKSS Annual Trends and Outlook Report 107
2019; Simões and do Rio 2020). There is a need to combine all the different capacity-building approaches (such as training and learning visits, formal educa-tion, capacity-building projects, and training workshops and networking) into a flexible, overarching concept of capacity development and to embed this system into the agricultural and food sector. Such a system would include colleges and universities, as well as the interaction between dual and tertiary educational systems. Capacity building is a lengthy process, especially where initial capacity is very weak (Pamuk et al. 2018; Kalimba and Culas 2020).
ATVET increases the employability and entrepreneurship potential of youth (FAO and IFAD 2014). ATVET that focuses on various segments of the value chain is essential in preparing youth for entrepreneurship opportunities. Furthermore, measures should also be put in place to ensure enrollment and retention of female youth in ATVET (for example, providing scholarships for female applicants). This is important because presently women constitute about 50 percent of all workers in the agrifood sector in Africa south of Sahara (Palacios-Lopez, Christiaensen, and Kilic 2017; Christiaensen and Demery 2018). The revitalization of TVET, and ATVET in particular, would require bold initiatives, such as improving the quality of TVET instruction by growing the capabilities of staff (for example, through capacity building or creating new appointments); modernizing infrastructure, equipment, and technologies; improving the relevance of TVET programs by strengthening links with the private sector and conducting regular curriculum review; and improving the curricula and training materials (for example, by developing competency-based modules or demand-based skills training) in consultation with the private sector (potential employers) (BMZ 2017; FAO and IFAD 2014; Nájera 2017; Li et al. 2016).
The new systems could adapt or use appropriate elements of other models, such as the German dual system (Aenis and Lixia 2016; BLE 2016; BMEL 2015; Kirui and Kozicka 2018). The success of the German dual system is attributed to its broad qualification structure, which offers high-quality education and viable employment prospects, coupled with a high degree of engagement of all stake-holders, a well-financed and balanced structure via the private and public sectors, and well-developed and institutionalized capacities (Bauer and Gessler 2017; Wolf 2017; Grollmann 2018; Oviawe 2018; Kirui and Kozicka 2018; Pilz and Fürstenau 2019; Bonoli and Wilson 2019; Young 2019; Gessler and Peters 2020).
Skills Development and Training for Agrifood Value Chain Actors This section presents the current state of skills development and TVET provi-sion at the postsecondary (tertiary) level in selected countries in Africa for agrifood value chain actors. The analysis highlights the commonalities and differences in provision of ATVET across some African countries, and points out the challenges that need to be addressed for a more effective ATVET system in Africa. Emphasis is placed on two areas: (1) the Africa-wide ATVET as envisioned in the Comprehensive Africa Agricultural Development Program (CAADP)—which was piloted in six countries (Benin, Burkina Faso, Ghana, Kenya, Malawi, and Togo) (NEPAD 2013), and (2) two other significant skills development systems—one public (Alage ATVET College in Ethiopia) and one private (Songhaï Training Center in Benin). These two cases were selected because they present the most interesting (that is, successful) cases and have received considerable investments and publicity, as described below.
Africa-wide CAADP ATVETThe NEPAD (New Partnership for Africa’s Development) Planning and Coordination Agency (NPCA)—the technical arm of the African Union coor-dinating the implementation of the CAADP—has stressed the importance of ATVET (NEPAD 2013; GIZ 2015). With the support of the German Agency for International Cooperation (GIZ), on behalf of the German Federal Ministry for Economic Cooperation and Development (BMZ), a project called Promotion of Technical Vocational Education and Training for the Agricultural Sector in Africa, better known as CAADP ATVET, was launched by NPCA and the CAADP secretariat in 2012. The aim of CAADP ATVET is to develop and implement market-oriented qualification measures as well as coherent plans to incorporate agricultural technical vocational training components into national education systems. Ultimately, CAADP ATVET seeks to offer a solution to Africa’s lack of trained and qualified smallholder farmers.
The first phase of CAADP ATVET (2012–2016) involved six partner coun-tries, each with two or three value chains of priority focus (GIZ 2015; Walker and Hofstetter 2016):
1. Benin: rice and meat
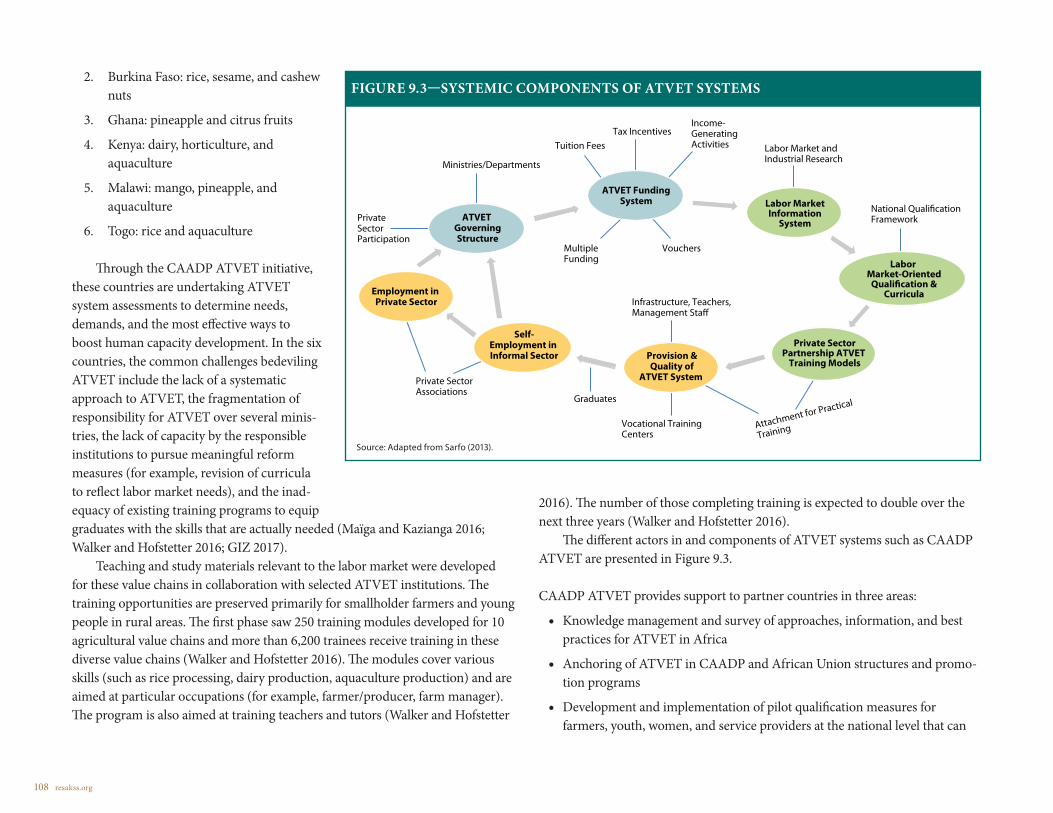
108 resakss.org
2. Burkina Faso: rice, sesame, and cashew nuts
3. Ghana: pineapple and citrus fruits
4. Kenya: dairy, horticulture, and aquaculture
5. Malawi: mango, pineapple, and aquaculture
6. Togo: rice and aquaculture
Through the CAADP ATVET initiative, these countries are undertaking ATVET system assessments to determine needs, demands, and the most effective ways to boost human capacity development. In the six countries, the common challenges bedeviling ATVET include the lack of a systematic approach to ATVET, the fragmentation of responsibility for ATVET over several minis-tries, the lack of capacity by the responsible institutions to pursue meaningful reform measures (for example, revision of curricula to reflect labor market needs), and the inad-equacy of existing training programs to equip graduates with the skills that are actually needed (Maïga and Kazianga 2016; Walker and Hofstetter 2016; GIZ 2017).
Teaching and study materials relevant to the labor market were developed for these value chains in collaboration with selected ATVET institutions. The training opportunities are preserved primarily for smallholder farmers and young people in rural areas. The first phase saw 250 training modules developed for 10 agricultural value chains and more than 6,200 trainees receive training in these diverse value chains (Walker and Hofstetter 2016). The modules cover various skills (such as rice processing, dairy production, aquaculture production) and are aimed at particular occupations (for example, farmer/producer, farm manager). The program is also aimed at training teachers and tutors (Walker and Hofstetter
2016). The number of those completing training is expected to double over the next three years (Walker and Hofstetter 2016).
The different actors in and components of ATVET systems such as CAADP ATVET are presented in Figure 9.3.
CAADP ATVET provides support to partner countries in three areas:
• Knowledge management and survey of approaches, information, and best practices for ATVET in Africa
• Anchoring of ATVET in CAADP and African Union structures and promo-tion programs
• Development and implementation of pilot qualification measures for farmers, youth, women, and service providers at the national level that can
Source: Adapted from Sarfo (2013).
FIGURE 9.3—SYSTEMIC COMPONENTS OF ATVET SYSTEMS
Self-Employment in Informal Sector Provision &
Quality ofATVET System
Ministries/Departments
PrivateSectorParticipation
Tuition FeesTax Incentives
Income-GeneratingActivities Labor Market and
Industrial Research
National Quali�cationFramework
Vocational TrainingCenters
Graduates
Private Sector Associations
Attachment for Practical
Training
Multiple Funding
Vouchers
Infrastructure, Teachers,Management Sta�
Private SectorPartnership ATVET
Training Models
Labor Market-Oriented
Quali�cation &Curricula
Labor MarketInformation
SystemATVET GoverningStructure
ATVET FundingSystem
Employment in Private Sector
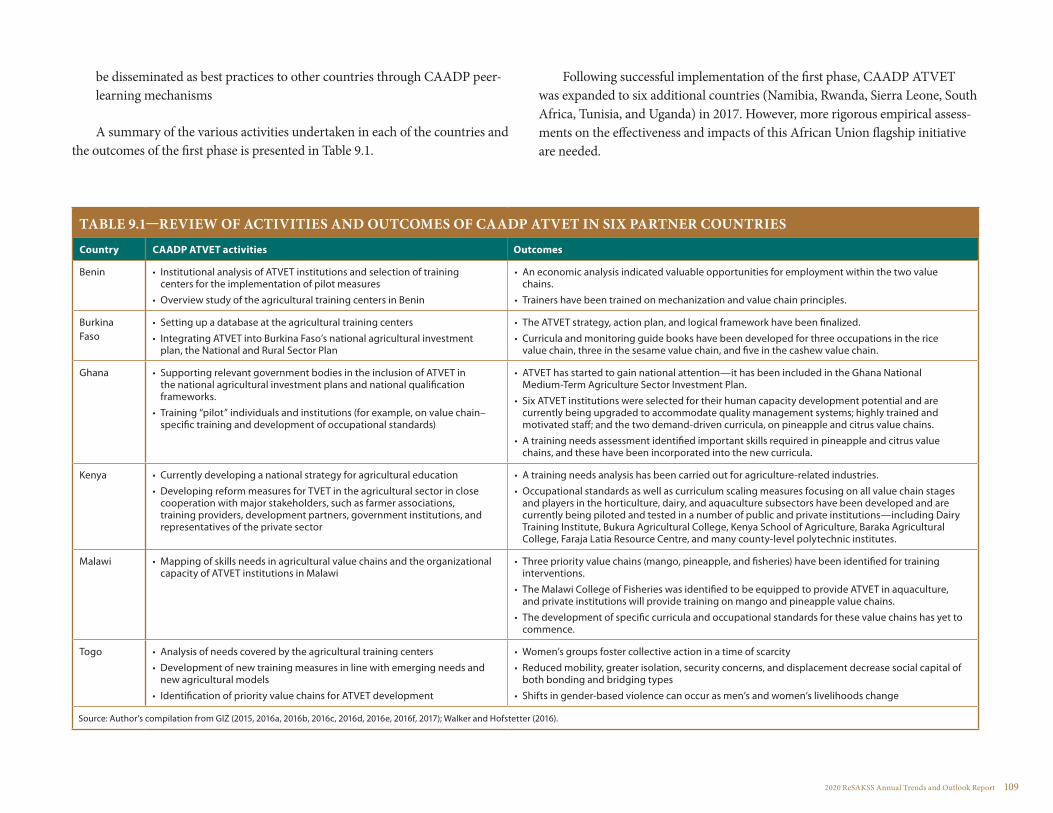
2020 ReSAKSS Annual Trends and Outlook Report 109
be disseminated as best practices to other countries through CAADP peer-learning mechanisms
A summary of the various activities undertaken in each of the countries and the outcomes of the first phase is presented in Table 9.1.
Following successful implementation of the first phase, CAADP ATVET was expanded to six additional countries (Namibia, Rwanda, Sierra Leone, South Africa, Tunisia, and Uganda) in 2017. However, more rigorous empirical assess-ments on the effectiveness and impacts of this African Union flagship initiative are needed.
TABLE 9.1—REVIEW OF ACTIVITIES AND OUTCOMES OF CAADP ATVET IN SIX PARTNER COUNTRIES
Country CAADP ATVET activities Outcomes
Benin • Institutional analysis of ATVET institutions and selection of training centers for the implementation of pilot measures
• Overview study of the agricultural training centers in Benin
• An economic analysis indicated valuable opportunities for employment within the two value chains.
• Trainers have been trained on mechanization and value chain principles.
Burkina Faso
• Setting up a database at the agricultural training centers
• Integrating ATVET into Burkina Faso’s national agricultural investment plan, the National and Rural Sector Plan
• The ATVET strategy, action plan, and logical framework have been finalized.
• Curricula and monitoring guide books have been developed for three occupations in the rice value chain, three in the sesame value chain, and five in the cashew value chain.
Ghana • Supporting relevant government bodies in the inclusion of ATVET in the national agricultural investment plans and national qualification frameworks.
• Training “pilot” individuals and institutions (for example, on value chain–specific training and development of occupational standards)
• ATVET has started to gain national attention—it has been included in the Ghana National Medium-Term Agriculture Sector Investment Plan.
• Six ATVET institutions were selected for their human capacity development potential and are currently being upgraded to accommodate quality management systems; highly trained and motivated staff; and the two demand-driven curricula, on pineapple and citrus value chains.
• A training needs assessment identified important skills required in pineapple and citrus value chains, and these have been incorporated into the new curricula.
Kenya • Currently developing a national strategy for agricultural education
• Developing reform measures for TVET in the agricultural sector in close cooperation with major stakeholders, such as farmer associations, training providers, development partners, government institutions, and representatives of the private sector
• A training needs analysis has been carried out for agriculture-related industries.
• Occupational standards as well as curriculum scaling measures focusing on all value chain stages and players in the horticulture, dairy, and aquaculture subsectors have been developed and are currently being piloted and tested in a number of public and private institutions—including Dairy Training Institute, Bukura Agricultural College, Kenya School of Agriculture, Baraka Agricultural College, Faraja Latia Resource Centre, and many county-level polytechnic institutes.
Malawi • Mapping of skills needs in agricultural value chains and the organizational capacity of ATVET institutions in Malawi
• Three priority value chains (mango, pineapple, and fisheries) have been identified for training interventions.
• The Malawi College of Fisheries was identified to be equipped to provide ATVET in aquaculture, and private institutions will provide training on mango and pineapple value chains.
• The development of specific curricula and occupational standards for these value chains has yet to commence.
Togo • Analysis of needs covered by the agricultural training centers
• Development of new training measures in line with emerging needs and new agricultural models
• Identification of priority value chains for ATVET development
• Women’s groups foster collective action in a time of scarcity
• Reduced mobility, greater isolation, security concerns, and displacement decrease social capital of both bonding and bridging types
• Shifts in gender-based violence can occur as men’s and women’s livelihoods change
Source: Author’s compilation from GIZ (2015, 2016a, 2016b, 2016c, 2016d, 2016e, 2016f, 2017); Walker and Hofstetter (2016).
110 resakss.org
Country-Level ATVET InitiativesAlage ATVET College in Ethiopia1
Ethiopia’s ATVET sector is rather advanced compared with those of other developing countries. Ethiopia developed an ambitious plan, the Agricultural Sector Policy and Investment Framework 2010–2020, led by the Ministry of Agriculture and Rural Development, and invested considerable resources to build up an ATVET system, which is primarily a public agricultural extension system (FAO 2014). A successful example of the ATVET college in Africa is the Ethiopian Alage ATVET College. Alage College was established in 2002 following the government’s decision to promote national TVET. The knowledge and skills attained by the trainees, specifically in agricultural disciplines, are intended fit into the country’s transformation strategy. Alage ATVET College comprises 4,200 ha of land and possesses the infrastructure and facilities necessary for practical agricultural training. The college has four departments: plant science, animal science, natural resources, and animal health. The objectives of the institution are threefold: to train development (extension) agents (DAs) in the fields of animal science, animal health, plant science, and natural resources; to organize practical and demonstration sites; and to increase the income of the college. The college is considered a success because it has managed to train more than 60,000 local teachers, agricultural technicians (DAs), and students, unlike any other ATVET institution in the region. The college offers a number of short-term trainings—such as improved animal feed and fodder production, cooperative development and accounting, alternative energy sources and small-scale irrigation, meat hygiene and control, basic computer applications—to DAs, who in turn train farmers. It also offers several outreach programs.
Songhaï Training Center in Benin2 Songhaï Training Center is the most renowned private ATVET institution in Benin. It was founded in 1985 to provide training to farmers, skilled farm workers, and rural development practitioners. It has a dense collaboration with more than 40 public and private organizations and universities. Songhaï trains young entrepreneurs who can then contribute to the sustainable development of their communities by creating jobs and thus preventing rural exodus; by ensuring
1 Adapted from Kirui and Kozicka (2018).2 Adapted from Kirui and Kozicka (2018).
food self-sufficiency for the region and contributing to the well-being of the people, who will become more aware of the components of the products they consume; by training other young people willing to work in the field, who will thus contribute to the education of the youth of their villages; and by providing services such as electricity and gas for all. The training is open to anyone who wishes to receive or deepen knowledge in the field of agricultural entrepreneur-ship. The duration and the cost vary depending on the program. A framework has also been created to monitor and support some trainees after program completion, particularly young women, who can benefit from microcredit to culture and set up their farms.
Songhaï Center not only has expanded its activities in Benin but has been replicated in 14 other African countries. It encompasses practical and entre-preneurial curricula. A success factor is the cascading information transfer and teaching system that creates a large number of farmer resource persons; each trained graduate is encouraged to train another five farmers (Vodouhe and Zoundji 2015).
Conclusions and Recommendations ATVET in Africa is increasingly becoming relevant and important as a means to address present and future challenges for human capacity development. ATVET should be tailored to meet the needs and demands in the agrifood sector and to contribute to growth and sustainable development. Although the analysis of the current state of ATVET in Africa shows that pan-African initiative through the CAADP, and regional strategies and plans, are already established, ATVET in Africa is limited by the marginal attention given to it, making for weak integration into the general TVET system; the lack of a strong network involving all stakeholders; the lack of resources dedicated to ATVET; and the negative perception of ATVET professions and employment prospects upon completion of training. ATVET curricula and skills development should be not only linked to key priority areas and aimed at providing gainful employment to both youth and adults, but also committed to developing rural areas in ways such as diversifying agricultural production or markets, increasing manufacturing or services sectors, and promoting private sector development. This calls for expanded focus on

2020 ReSAKSS Annual Trends and Outlook Report 111
technical training and skill development in both agricultural and nonagricultural sectors in rural areas so as to benefit both women and men.
The priority should be to identify significant value chains (that employ many people and generate incomes) and to develop curricula for the various actors in these chains. This should also be done based on present and future national labor market priorities and in partnership with the multiple stakeholders. The CAADP ATVET made these activities a priority in all six pilot countries. The curriculum not only should target the core professions at different stages of the value chain (such as farmers, fishers, agro-processors) but should also include support and overarching professions (such as electricians, and warehouse and storage managers). The latter would particularly benefit young people from rural areas because these professions are relevant not only for agriculture but for rural development as a whole.
There exists an opportunity to develop an ATVET system that considers the present and future demands of society; that merges education, training, knowledge acquisition, and skill/technique development; and that takes into consideration the input of both public and private players. Such a system must leverage new and innovative techniques to bolster agriculture in the TVET systems or create completely new ones. These innovative techniques involve systematic transformation of ATVET toward new practices and solutions relevant to local social and economic problems. As an example, the Songhaï Training Center’s more practical and entrepreneurial curriculum and its cascading infor-mation transfer and teaching approach creates a large number of farmer resource persons—each trained graduate is encouraged to train another five farmers.
The system should also provide incentives to encourage private sector participation in ATVET skills development, and it must also adapt to emerging innovative training delivery (such as the use of information and communications technologies, implementation of entrepreneurial education, or administering more practical and outdoor learning that links theory and everyday examples—approaches that have been used in the Alage and Songhaï ATVET centers). The ATVET system should transform training into an entrepreneurial and profes-sional system that will improve the skills of farmers and attract more youth into agriculture. More important, the new systems should borrow from and adapt
models that have proved to be successful in other regions or countries. One such model is the German dual system. The success of the German dual system shows how a broad qualification structure that offers high-quality education and viable employment prospects for youth, coupled with a high degree of engagement of all stakeholders, a well-financed and balanced structure via the private and public sectors, and well-developed and institutionalized capacities, can contribute to a strengthened and effective ATVET system. Hence, policy reforms and national strategies that aim to incorporate these aspects in national ATVET systems can prove beneficial for African nations.

CHAPTER 10
Why Food Safety Matters to Africa: Making the Case for Policy Action
Steven Jaffee, Spencer Henson, Delia Grace, Mateo Ambrosio, and Franck Berthe1
1 The overall approach and findings in this chapter are based heavily on Jaffee et al. (2019).

2020 ReSAKSS Annual Trends and Outlook Report 113
Food safety is vital for achieving food and nutritional security in Africa. Unsafe food contains microbiological, chemical, or physical hazards that can make people sick, causing acute or chronic illness that,
in extreme cases, can lead to death or permanent disability.2 The presence of foodborne hazards can also reduce the bioavailability of nutrients in food, putting already food-insecure populations at greater risk of malnutrition. Food safety is closely linked to other food-related public health issues. For example, the inappropriate use of antimicrobials in livestock and aquaculture production is contributing to the emergence of antimicrobial-resistant pathogens.
The safety of food impacts not only public health in African countries but also the growth and modernization of these countries’ domestic food markets. Food consumption and expenditure patterns are changing throughout the continent, driven by income growth, urbanization, and other factors. Overall, consumption is declining for starchy staples and increasing for animal products, fruits and vegetables, and processed foods. Out-of-home eating is also on the rise. But for farmers and food business operators to profitably and sustainably service this demand for higher-value foods, they must manage the food safety risks asso-ciated with such foods and maintain consumer trust (Ortega and Tschirley 2017). These developments may profoundly impact income and employment opportu-nities in the African food packing, manufacturing, and food service industries, as well as affecting the growth (or otherwise) of domestic and international tourism.
Unsafe food and its antidote, investments in food safety capacity, can have profound effects on the success of efforts to alleviate poverty and reduce inequalities in Africa. Because people with low incomes are both consumers of food and agents in agrifood value chains, food safety intersects with poverty in two critical ways. A growing body of literature identifies the extent of food safety hazards in informal food markets, which are the predominant source of food for poor people, especially in Africa’s urban areas (Roesel and Grace 2014; Skinner 2016; Fellows and Hilmi 2011). Furthermore, food safety can affect the livelihoods of poor people within agrifood value chains, whether as small-scale
2 Hazards that have been addressed by public policies include microbial pathogens (such as Salmonella species), zoonotic disease agents (such as highly pathogenic avian influenza), parasites (such as intestinal worms), adulterants (such as melamine), naturally occurring toxins (such as aflatoxin), antibiotic drug residues, pesticide residues, and heavy metals (such as cadmium).
3 The full set of SDGs (and their indicators) can be found at https://unstats.un.org/sdgs/indicators/indicators-list/. See Grace (2017a) for an elaboration on the links between food safety and the SDGs.
producers; marketplace, street, or cross-border food vendors; or operators (or employees) of micro and small food enterprises.
Food safety is an important contributor to the trade performance of some African countries. This is especially true for those countries that compete in markets for high-value foods, including fresh fruit and vegetables, fish and fishery products, meat, spices, and nuts. Countries, and sectors and firms therein, with limited food safety capacity tend to find themselves at a competitive disadvantage when trying to serve potentially lucrative export markets if they face periodic yet costly rejections of product consignments and uncertainty about sustained market access. For Africa, special attention has been given to addressing the potential constraints faced by organized smallholder farmers in meeting the evolving regulatory and private food safety and other standards in high-value external markets (Jaffee, Henson, and Diaz Rios 2012). Concerns about food safety have also strongly impacted intraregional trade, both of staple commodi-ties and of higher-value foods.
For all of these reasons, food safety is a vital issue for achieving many of the Sustainable Development Goals (SDGs). Food safety is integral to achieving SDG 1 (end poverty), SDG 2 (end hunger), and SDG 3 (good health and well-being), and can also contribute to or detract from achieving SDG 5 (gender equality), SDG 8 (decent work and economic growth), and SDG 11 (sustainable cities and communities).3
In 2015, the African Union Commission (AUC) launched the Comprehensive Africa Agriculture Development Programme (CAADP) Biennial Review (BR) to monitor progress in agricultural development on the continent. The CAADP BR initially encompassed 43 indicators, with AU member states committing to mutual accountability for results and actions related to the core themes. Seven of the key indicators related to nutrition, but none tracked food safety, despite its relationship to many of the CAADP’s technical and socioeco-nomic goals. Yet during the past few years there has been growing awareness of the importance of food safety. As a result, three new new indicators on food safety (the food safety systems index, food safety health index, and food safety trade index) were added to the 2019 CAADP BR.

114 resakss.org
Another sign that food safety has been moving up the development agenda in Africa was the convening of the first International Conference on Food Safety, sponsored by the Food and Agriculture Organization of the United Nations, the World Health Organization (WHO), and the AU in Addis Ababa in February 2019. This event generated a large number of back-ground documents4 and resulted in a high-level political statement advocating for increased and better-coordinated collaboration and support to improve food safety in the region and around the globe.5
Positioning Africa in the Food Safety Life Cycle of CountriesThe burden of unsafe food generally evolves in a systematic manner, in line with processes of economic development; this can be thought of as the food safety life cycle of a country (Figure 10.1). The economic costs of unsafe food, in both absolute and relative terms, vary across countries according to their level of economic development. This variation is linked to the complex interplay of a wide range of economic, demographic, dietary, and environmental health factors. These factors affect the incidence of and potential exposure of popula-tions to food safety hazards, the strength of incentives for actors in agrifood value chains to prevent or manage these hazards, and the costs of food safety missteps. Although all African and other low- and middle-income countries are
4 Available at http://www.fao.org/about/meetings/future-food-safety/international-food-safety-conference/en/.5 The years 2019 and 2020 have seen major new dedicated food safety initiatives in Africa. These included four projects jointly funded by the Bill & Melinda Gates Foundation and the UK Department
for International Development in their first-ever round of funding for food safety; a new Feed the Future Innovation Lab on Food Safety; a US Agency for International Development Broad Agency Announcement on food safety; and the launch of the One Health Research, Education and Outreach Centre in Nairobi, with food safety as one of its three thematic areas.
experiencing changes in diet and agrifood value chains, their position in this process of food system transformation varies considerably. The food safety life cycle across countries and over time reflects evolving food safety challenges, as well as the degree of mismatch of food safety management capacity in and between the public and private sectors.
Source: Jaffee et al. (2019).
FIGURE 10.1—THE FOOD SAFETY LIFE CYCLE
Traditional Transitioning Modernizing Post-Modern
Level of Economic Development
Food
Safe
ty Ec
onom
ic Bu
rden
• Mature demand• Risks well-managed• Periodic failures lead to rapid
response
• Formal sector responds to consumer demands
• Growing public capacity• Stronger incentives
• Rapid dietary diversity• Changing risks• Lagging capacity and incentives
• Low diet diversity• Weak incentives• Weak capacity

2020 ReSAKSS Annual Trends and Outlook Report 115
Low-income African countries face a very significant burden of food-related illness, with the supply of and demand for safe food remaining underdeveloped, as is typical of the traditional stage. Here, diets tend to be dominated by starchy staples (maize, cassava, and rice), and policy attention is focused on the availability and affordability of these foods and on other public health issues (for example, malaria and maternal and child mortality). Much food is produced close to the point of consumption and undergoes limited transformation. Traditional ways of processing food dominate and are often fairly effective at reducing risk. The predominant foodborne diseases (FBDs) come from microbiological pathogens and parasites linked to poor hygiene, close contact with animals, and low access to clean water and improved sanitation. Domestic market drivers or incentives for safer food are often weak. Food safety capacity tends to be rudimentary, with more-developed systems predominantly geographically concentrated and focused, for example, in capital cities for higher-income consumers and in niche high-value exports to high-income countries.
African countries reaching lower-middle-income status—the transi-tioning stage in Figure 10.1—face a broader range of food safety hazards, straining if not overwhelming food safety systems. These countries are experiencing rapid shifts in diet and agricultural production practices, as well as swift urbanization, all of which affect the exposure of consumers to food safety hazards. In these countries, most of the distribution of potentially hazardous fresh food products continues to occur through informal channels with multiple points of intermediation. For farms, intensification of production often involves greater use of agrochemicals and veterinary drugs. Animal-sourced foods are an important cause of FBD, and as animal production intensifies, epidemiological changes occur that can lead to the emergence of new diseases. More opportuni-ties and incentives for food fraud also arise. Food imports, including perishable foods, often increase. As a result, domestic consumers are exposed to new foodborne hazards. A common situation is one in which the prevailing official regulatory apparatus is overwhelmed by the breadth and depth of emerging issues, while emerging private sector food safety governance measures still reach only a modest share of the overall food market, and are not exposed to many checks. At this stage, consumer food safety concerns are rising faster than the use of available tools to fix food safety problems. Empirical evidence points to the underdevelopment of regulatory oversight capabilities in lower-middle-income countries, especially for relatively high-risk animal products. Commonly,
national and subnational governments are playing catch-up and are sometimes being overwhelmed by the emerging challenges. Yet the politics of unsafe food presses governments to act, in real or symbolic ways.
For upper-middle-income countries in the modernizing stage, the gap between need and capacity begins to close. This results in a reduction in the absolute and relative public health and economic burdens of unsafe food. The modernizing stage is characterized by profound and often rapid restructuring of agrifood value chains. Formal sector enterprises come to dominate in both urban and rural areas, and the modern retail sector expands and extends into smaller urban centers and rural areas. As businesses become better organized, both as individual enterprises and collectively across sectors, they are able to exert greater pressure on government to enhance public food safety management systems. Because of administrative change and public investment, regulatory systems become more effective at establishing and enforcing minimum food safety standards, and at promoting and facilitating food safety management system upgrades in the private sector. More effective surveillance systems also highlight the burden of FBD, such that the problem gains recognition and the benefits of upgrading food safety management systems become more apparent. Simultaneously, public administration of food safety becomes more efficient, in turn enhancing authorities’ ability to respond to the needs and demands of stakeholders. All of these changes foster greater trust within the population in the ability of the agrifood system to deliver safe food.
The burden of FBD eventually declines to much lower and relatively stable levels in the post-modern stage, at which point any further improve-ments in food safety happen in smaller increments. Although FBDs are generally at much lower levels in high-income countries, some FBDs persist and have proven difficult to eradicate. A new equilibrium reflects the facts that both market-based and political incentives for improved food safety management capacity remain high, but agrifood value chains are complex, with few easy wins in terms of improved capacity. Paradoxically, concern over FBD and novel food technologies is highest at this stage, reflecting the level of media attention and the nature of demand for food among consumers with a higher degree of discre-tionary food expenditure. For some consumers, there is a blurring of borders between food safety and other issues—for example, organic food, animal welfare, biotechnology, and industrial production systems.

116 resakss.org
The vast majority of African countries are presently situated in either the traditional or the transitioning stage of the food safety life cycle, meaning that their capacities to manage food safety risks, in both government and the private sector, lag considerably behind the need for such capacity. Furthermore, the gap between capacity and need is widening with the rapid urbanization and dietary changes that are occurring in an increasing number of African countries. Although time series data are not available, it is likely that African countries at these stages are experiencing rising public health burdens and rising economic costs from unsafe food. Very few African countries are at the modernizing stage of the food safety life cycle, at which capacity is quickly catching up with need, and there is a downward slope in the economic costs of unsafe food relative to the value of the domestic food market. The only African countries that are likely to have progressed into the modernizing stage are Algeria, Egypt, Mauritius, Morocco, Seychelles, South Africa, and Tunisia. These countries collectively account for only 21 percent of Africa’s population.
For African countries, neither the widening gap between food safety capacity and need, nor the escalation of public health and economic costs due to FBDs is inevitable. Prevailing food safety capacity and the evolution of agrifood systems are not acts of nature outside of human influence, but largely the results of actions taken by governments, the private sector, and consumers. In referring to “actions” here, the focus is not on “firefighting” efforts, such as stepping up product testing or restricting certain types of commerce in the aftermath of FBD outbreaks or high-profile food-related scandals. Rather, the emphasis is on the incremental yet systematic building up of food safety manage-ment capacities and the mainstreaming of preventive practices in the food system “from farm to fork.”
The Public Health and Economic Costs of Unsafe Food in AfricaResearch is shedding new light on the global burden of FBD. Until recently, data on the incidence of FBD and its associated costs were limited to high-income countries. To address this gap, the WHO’s Foodborne Disease Burden Epidemiology Reference Group (FERG) spent nearly a decade gathering data
6 One DALY can be thought of as one lost year of a “healthy” life. The sum of DALYs across a population is a measure of the burden of disease and can be thought of as a measurement of the gap between current health status and an ideal health situation, wherein the entire population lives to an advanced age, free of disease and disability.
and employing statistical models to estimate the burden of some 31 important foodborne hazards in 14 regions of the world (WHO-FERG 2015). The estimates were expressed in terms of lost disability-adjusted life years (DALYs) associated with ill health and premature death.6 For 2010, the base year, the global burden of FBD was estimated at 600 million illnesses and 420,000 premature deaths. This aggregates to the equivalent of 33 million DALYs (Havelaar et al. 2015). For com-parison, the estimated 2015 global burden of tuberculosis and that of malaria in 2010 were 40 million and 66 million DALYs, respectively. The same WHO study more recently presented estimates of the 2015 burden of FBD associated with four heavy metals, suggesting a global burden of some 1 million illnesses, 56,000 deaths, and 9 million DALYs (Gibb et al. 2019).
The global burden of FBD is unequally distributed, with Africa and emerging Asia having the highest incidence of (and death rates from) FBD. The Africa region (including both northern Africa and the part of the continent south of the Sahara) accounted for more than 90 million foodborne illnesses and around 137,000 deaths in 2010, according to FERG estimates (WHO-FERG 2015). These represented around 15 percent and 33 percent of the global totals, respectively. Extrapolating to Africa’s population in 2018 and including the more recent analysis related to heavy metals, we estimate that Africa’s foodborne illnesses and FBD deaths currently number around 135 million and 180,000, respectively, per year. These estimates translate into a loss of some 15 million DALYS annually due to FBD.
Epidemiological studies show that the most vulnerable people to FBD are the young, old, malnourished, poor, pregnant, and immunocompromised (Grace 2015). A disproportionate share of the burden falls on children under the age of five. Children are more exposed to foodborne hazards because of their lack of control over food preparation and a propensity to behaviors that increase the risk of FBD. Furthermore, children are more vulnerable to the consequences of infection because of their developing immune systems, small body size, and lower levels of stomach acid, among other factors. Globally, children account for 9 percent of the total population, yet 38 percent of all cases of foodborne illness occur in children. The FERG study estimated that some 56.6 million African

2020 ReSAKSS Annual Trends and Outlook Report 117
children fell ill from FBDs in 2010, of whom nearly 48,000 eventually died (WHO-FERG 2015).
Much of Africa south of the Sahara (SSA) has the highest proportional FBD burden in the world, based on FERG estimates of DALYs per 100,000 people. Although these estimates tend to be many times greater than official national estimates, reflecting the weaknesses of surveillance systems in many countries, they are generally considered to be conservative.7 A deeper review of the data further-more highlights patterns that have potentially important implications. Due to data limitation and other concerns, the results of the WHO-FERG study were reported by geographic subregions, rather than for individual countries. Yet it is at the country level where especially interesting comparisons can be made. Without specifying individual country names, we can still provide some comparative data for several countries of SSA and of East and Southeast Asia (ESE). According to FERG, emerging Asia accounts for about half of the world’s foodborne illnesses and deaths. Table 10.1 allows a comparison between the public health burden of the “big three” diseases (tuberculosis, HIV/AIDS, and malaria) and that of foodborne illness by and between subregions. It also allows for a comparison of the estimated rates of foodborne illness and FBD-attributed death among groups of countries.
Whereas the global burden of FBD is now on par with one or more of the “big three” public health concerns at a global level, this is not yet the case in most countries of SSA, including those shown in Table 10.1. Nevertheless, the burden of FBD is quite high in these countries. For comparison, there are relatively few countries outside of SSA with an estimated FBD burden exceeding 650 DALYs per 100,000, a burden about twice that of the listed ESE countries. Yet
7 Foodborne illness reporting itself tells us little because the majority of people falling ill do not seek medical attention and the symptoms are not always attributed to food sources.
the burden from FBD in the African countries remains quite a bit lower than for one or more of the “big three.” This prevailing situation influences the political economy for food safety because public health resources and policy attention continue to remain focused squarely on tackling the current burden of the “big three.” This is one reason why domestic food safety fails to get onto the policy radar in much of SSA, except in the event of large-scale outbreaks of disease that garner media attention. It is also why food safety is largely seen as a trade issue. In parts of Asia, the situation is quite different. Given large gains in relation to legacy public health concerns, especially the “big three,” food safety is now recognized to be among the leading health concerns. Furthermore, there is political pressure for action, reflecting high and persistent pressure by consumers. This has translated into comparatively stronger policy and budgetary attention to domestic food safety in many parts of Asia.
Whereas the incidence of foodborne illness in SSA countries is generally very high, this is also commonly the case in much of emerging Asia. The exception-ally high loss of DALYs per 100,000 population in SSA seems to be significantly linked to a much higher estimated death rate from FBD in these countries.
TABLE 10.1—COMPARATIVE PUBLIC HEALTH BURDEN: DISABILITY-ADJUSTED LIFE YEARS LOST PER 100,000 POPULATION; FOODBORNE ILLNESSES AND DEATHS PER 100,000 POPULATION
Disease ESE1 ESE2 SSA1 SSA2 SSA3 SSA4
Tuberculosis (2016) 148 414 1,326 2,769 1,694 1,150
HIV/AIDS (2016) 67 440 3,138 5,131 11,928 1,171
Malaria (2016) 1 1 3,496 4,964 12 357
FBD (2010) 272 390 1,235 1,322 797 967
FBD Illness Rate 6,873 9,270 9,370 11,047 8,061 10,767
FBD Death Rate 2.8 3.9 15.9 17.8 10.8 12.6
Source: WHO-FERG unpublished statistics and WHO Global Health Observatory data (https://apps.who.int/gho/data/view.main).Note: ESE = East and Southeast Asia; FBD = foodborne disease; SSA = Africa south of the Sahara. ESE1, ESE2, SSA1, SSA2, SSA3, and SSA4 signify individual countries whose burden of disease patterns are representative of those in these regions.

118 resakss.org
Compare, for example, the situation of the ESE2 and SSA1 countries. They have a very similar estimated incidence of foodborne illness, yet the estimated death rate from such illness is nearly four times higher in the SSA countries. Likely contributing factors are higher rates of FBD among young children and serious health consequences when FBD is paired with preexisting ailments. Other impor-tant contributing factors are likely to include less timely diagnosis of FBD and problems accessing timely and effective treatment, especially among the poor and among children more generally. Thus, large numbers of Africans are dying from cases of FBD that would be effectively treated in parts of Asia and elsewhere. The implication is that a major part of the strategy for reducing the burden of FBD in Africa must involve improvements in access to effective health services.
African populations are exposed to a broad range of food safety hazards. The analysis of FERG suggests that some 82 percent of the burden of FBD in Africa is associated with microbial pathogens, in particular Salmonella species, toxigenic E. coli, Norovirus, and Campylobacter species (WHO-FERG 2015). Next in importance are heavy metals, especially lead, accounting for 8 percent of the burden. Though estimated to account for a very small proportion of foodborne illnesses or deaths in Africa, aflatoxins are the food safety hazard that has attracted the most public attention, policy focus, and development assistance in recent times. Aflatoxins, naturally occurring toxins produced by fungus, can contaminate a wide variety of food crops including maize, sorghum, cassava, groundnuts, sesame, chili, and others. Furthermore, aflatoxin-contaminated feed can result in the contamination of the resultant animal products, such as milk. Children can also be affected through breast milk or from direct consumption of weaning foods. Acute exposure to aflatoxin has proven lethal in several instances in Africa, although chronic exposure is more pervasive. A large body of research in Africa and elsewhere has found causative links between aflatoxin levels in the diet and cancer. Aflatoxin has also been found to be a growth retardant in animals and is suspected of being a contributing factor to child stunting.
For risk management purposes, it is important to have detailed information on which foods are most involved in the transmission of FBD. Unfortunately, very little information on the prevalence of foodborne hazards
across foods is available for most countries in Africa. A FERG expert elicita-tion process reviewed the most likely source for 11 of the 31 hazards that were assessed (Hoffmann et al. 2017). It found fresh produce, in the form of fruits and vegetables, and multiple animal products to be the primary source of these hazards. Current estimates attribute very little of the global burden of FBD to cereals, although the newer research related to chemical and heavy metal hazards is beginning to change this picture somewhat. Despite the consider-able attention given to aflatoxin in cereals, the bulk of FBD in Africa is likely attributable to animal products, especially meat, fish, and milk, and secondarily to fruits and vegetables. The results of a recent analysis of FBD attributable to animal-sourced foods (Li et al. 2019), when assessed against the earlier FERG analysis, suggests that, for most African countries, animal-sourced foods account for between 30 and 50 percent of the FBD burden. As discussed below, this has important implications given that most African countries are ill-prepared to manage food safety hazards related to animal products.
The economic costs of unsafe food take multiple forms and have both short- and long-term dimensions, although valuing these costs is challenging because of data and methodological limitations. The economic costs associated with FBD include the resources expended on public health and loss of produc-tivity when disease occurs, disruptions to food markets when outbreaks of illness take place as consumers avoid implicated foods or shift to alternatives that are perceived to be safer, impediments to agrifood exports due to real or expected food safety problems, and the costs of complying with food safety regulations and standards in foreign markets. More indirect and harder to measure are costs including those of FBD prevention and those associated with wary consumers shifting their food consumption patterns, for example from nutrient-dense fresh produce to processed foods, as a result of concerns about food safety. For most African countries, reliable estimates of these costs and how they are distributed within society are lacking. This makes coherent policy planning and implementation difficult, especially in the face of acute resource limitations.
There have been very few studies of the burden of FBD in low- and middle-income countries. However, a recent World Bank global study estimated the

2020 ReSAKSS Annual Trends and Outlook Report 119
productivity losses that can be attrib-uted to unsafe food within Africa at around US$20 billion8 in 2016 alone (Jaffee et al. 2019).9 To these losses of productivity can be added the annual costs of treating foodborne illnesses, which are estimated at $3.5 billion in 2016. Thus, even ignoring the costs of market disruptions, product recalls, and consumer product avoidance, which are difficult to estimate given available information, it is reasonable to expect that the annual costs of unsafe food in the domestic markets of Africa exceed $24 billion. Of course, the costs of FBD vary significantly across the African continent based on country size, level of economic devel-opment, food consumption patterns, and so on. However, estimates from the aforementioned World Bank study (Jaffee et al. 2019) indicate that very significant productivity losses from FBD are currently being experienced by at least two dozen African coun-tries. That being said, the majority of the aggregate loss due to unsafe food on the African continent is accounted for by a small number of countries based on their (large) population size, (higher) per capita income, or both,
8 All dollar amounts are US dollars.9 As estimated by national FBD DALYS multiplied by gross national income per capita. Jaffee and others (2019) reported the total for SSA to be $16.7 billion, whereas that for North Africa totaled $2.3 billion.
The Africa total constitutes 21 percent of the global total for low- and middle- income countries. Given its much larger population and higher per capita income, emerging Asia accounts for a little less than two-thirds of the global total.
Source: Jaffee et al. (2019), based on data from WHO-FERG (2015) and World Bank (2019).Note: The estimated loss for the indicated countries totals US$19.5 billion. The estimated loss for all other African countries totals US$0.5 billion.
FIGURE 10.2—ESTIMATED “PRODUCTIVITY LOSS” DUE TO FOODBORNE DISEASE, AFRICA, 2016 (US$ BILLIONS)
Nig
eria
Sout
h A
fric
a
Egyp
t
Ang
ola2.0
3.0
4.0
5.0
6.0
Bilii
on
Alg
eria
Keny
a
Ethi
opia
Tanz
ania
Suda
n
Côte
d’Iv
oire
Gha
na
Cam
eroo
n
Cong
o, D
em. R
ep.
Mor
occo
Uga
nda
Zam
bia
Moz
ambi
que
Liby
a
Bots
wan
a
Mal
i
Burk
ina
Faso
Zim
babw
e
Chad
Sene
gal
Tuni
sia
Mad
agas
car
Beni
n
Cong
o, R
ep.
0.0
0.1
0.2
0.3
0.4
0.5
0.6
0.7
0.8
0.9
1.0
Low income Lower-middle income Upper-middle income

120 resakss.org
together with a very significant FBD incidence (Figure 10.2).
It is important to understand not only the absolute but also the relative magnitude of the costs associated with FBD. This is illustrated in Figure 10.3, in which the estimated productivity loss from FBD as a share of total national food expenditure in 2010 is reported for low- and middle-income countries in various regions.10 Whereas there is considerable diversity in the relative cost among African countries, the relative economic burden is generally higher for African countries than for countries in Asia, Latin America, and the eastern Europe–central Asia region that are at a similar level of economic development. This is espe-cially the case for countries clustered at lower income levels. In contrast, the pattern is more ambiguous at the lower-middle-income level, where there has likely been a surge in the burden of FBD in rapidly urbanizing Asia. Unfortunately, more recent data on total food expenditures are not available for many African countries, making it difficult to discern whether the relative economic burden of FBD is rising for African countries that have transitioned into middle-income status as they too have experienced rapid urban growth and dietary change. The evidence that is available, however, is consistent with the food safety life cycle described above. Thus, among the five African countries for which 2016 food expenditure data are
10 This is illustrated for 2010 because reliable data on total food expenditures are not available for more recent years for some of the comparator (and especially low-income) countries in other regions. 11 Tunisia was the lone exception, and its ratio was minimally lower (from 2.28 to 2.19 percent). For most emerging Asian countries with available data on food expenditures, this ratio also increased between
2010 and 2016.
available (namely, Algeria, Egypt, Morocco, South Africa, and Tunisia), the ratio between the productivity loss from FBD and food expenditure is generally higher in 2016 than in 2010.11
Beyond the domestic burden of FBD, food safety also impacts the agrifood trade performance of African countries, with potentially important consequences for the performance of formal-sector businesses, employment, and incomes. Effectively competing in international agrifood trade may entail
Source: Jaffee et al. (2019).Note: GNI = gross national income.
FIGURE 10.3—THE RELATIVE ECONOMIC COST OF UNSAFE FOOD: FOODBORNE DISEASE–RELATED “PRODUCTIVITY LOSSES”/TOTAL FOOD EXPENDITURES (%), 2010
0 500 1,000 1,500 2,000 2,500 3,000 3,500 4,000 4,500 5,000 5,500 6,000 6,500 7,000 7,500 8,000 8,500 9,000 9,500 10,000
GNI per Capita (2010)
0
0.5
1.0
1.5
2.0
2.5
3.0
3.5
4.0
4.5
5.0
5.5
Prod
ucti
vity
Los
s as
Per
cent
age
of F
ood
Expe
ndit
ure
(201
0)
Ukraine Serbia BulgariaBosnia-Herzegovina
Belarus
Ecuador
Costa Rica
Uzbekistan
Nepal
India
China
Bangladesh
TurkeyRussiaRomaniaMacedonia
Jordan
Iran
Georgia
Peru
MexicoJamaica
Honduras
GuatemalaEl Salvador
Colombia Brazil
Bolivia
Argentina
Vietnam
Turkmenistan
Thailand
Sri Lanka
Philippines
Pakistan
Malaysia
Kazakhstan
Indonesia
Cambodia
Azerbaijan
TunisiaSudan
Nigeria
Niger
Mauritania
Malawi
Lesotho
Kenya
Ghana
Congo, Rep.
Congo, DRC
South Africa
Senegal
MoroccoEthiopiaEgypt
Cote d' Ivoire
Chad
Burundi Algeria
Africa Asia Latin America and the Caribbean Middle East and Eastern Europe

2020 ReSAKSS Annual Trends and Outlook Report 121
considerable costs for the public and private sectors to comply with food safety regulations or standards in a given export market. The magnitude of these costs is a critical issue for export competitiveness, especially with respect to Africa’s external trade in fish, fruit, and vegetables.12 International experience suggests that a multitude of factors influence compliance costs, including firm and industry size, the gap between prevailing food safety management capacity and that required for export markets, and levels of collective action between exporting firms. In many cases, the challenges faced in complying with food safety regulations and stan-dards tend to reinforce or accentuate the broader set of competitive strengths and weaknesses of industries and firms (World Bank 2005; Beghin and Orden 2012). In some cases, “trade losses” attributed to (noncompliance with) more stringent standards are more accurately attributable to more entrenched and longer-term competitiveness issues within businesses or sectors. And although more stringent food safety regulations and standards can certainly act as non-tariff barriers to trade, they may also act as powerful catalysts for investments in improved food safety management systems, especially when the incentives for such investments are lacking in domestic markets.
For Africa, food safety has been on the development agenda predomi-nantly as a trade and market access issue. Many of the pertinent challenges, whether related to intraregional or extraregional food trade, have drawn considerable attention and resources from African governments, researchers, trade partners, and many development support agencies. Indeed, a recent survey pointed to literally hundreds of small and larger projects supported by trade partners or development agencies during the past decade and a half that have sought to address trade-related food safety problems or capacity constraints in Africa (GFSP 2018). In contrast, initiatives focused on domestic food safety matters have been comparatively few and poorly funded, until quite recently.
12 This has been much less of an issue in relation to Africa’s large trade in beverage crops (cocoa, coffee, and tea). Although much has been claimed about the adverse impact of food safety standards on Africa’s trade in groundnuts and groundnut products, many additional factors have also undermined the region’s export competitiveness in those markets.
13 Rejection rates do vary by country. The region’s four largest fish exporters—Mauritius, Morocco, Namibia, and South Africa—and its leading fruit exporters—Cameroon, Côte d’Ivoire, and South Africa—all have relatively low rejection rates compared with major developing-country suppliers elsewhere. Some smaller exporters, of both product groups, have higher rejection rates and have had to make considerable upgrades to remain competitive.
14 For SSA in 2016, Jaffee and colleagues (2019) estimated the productivity loss due to unsafe food to be $16.7 billion and the costs for FBD treatment to be $2.5 billion. This conservatively estimated domestic cost of $19.2 billion does not take into account commercial losses incurred by domestic firms due to market disruptions or product recalls, nor does it count the costs incurred in making investments in facilities or food safety management systems. Regarding trade, the estimated value of rejected trade consignments is $78 million per year. Some companies are simply deterred from engaging in trade due to the complexities of complying with strict food safety requirements. We assume the impact of this to be significant, perhaps leading to a “loss” of potential trade worth three times that of the rejected products (that is, $234 million). We further add an estimate of the annualized capital investments needed by African exporters to ensure compliance with food safety standards—amounting to $155 million. This puts the trade-related costs of food safety for SSA at $467 million annually.
Though ongoing challenges remain, very notable progress has been made in addressing important trade-related food safety hazards and capacity limitations. This has contributed to gains in the region’s trade, especially its trade in higher-value, food safety–sensitive foods such as fish, fresh fruit and vegetables, nuts, and spices. Between 2001 and 2017, the region’s exports of these products increased more than fourfold, from $3.8 billion to $16.1 billion. By way of comparison, over that same period, the region’s exports of its traditional core commodities—cotton, cocoa, coffee, and tea—rose from the same base of $3.8 billion to reach only $11.9 billion. Another illustration of the region’s progress on trade-related matters has been its generally good and improving pattern of low rates of rejection by the European Union and other major trading partners on its export consignments of fish, fruit, and vegetables due to food safety problems.13
The available evidence suggests that, for Africa, the trade-related costs associated with food safety pale in magnitude compared with the public health and commercial costs, and the productivity losses experienced due to unsafe food domestically. For SSA, the ratio between domestic and trade-related costs is likely to be on the order of 40 to 1 today, and this would likely widen substantially in the future in a business-as-usual scenario, as suggested by the food safety life cycle.14 This gap suggests that the predominant attention of multilateral agencies and bilateral donors, in addition to national governments, on the trade impacts of food safety has been misguided. Largely, the reality reflects the greater visibility of the export losses associated with noncompliance with food safety requirements, and the pressure applied on governments and donors by well-organized export-oriented businesses and farmer groups. In contrast, the costs associated with domestic FBD are not only largely hidden, given that they are rarely monitored and measured, but predominantly imposed on segments of society that have

122 resakss.org
little or no influence over the policies and priorities of national governments and donors, most notably the poor, children, and micro- and small enterprises.
The Status of Food Safety Capacity in AfricaThe safety of food is the result of the actions and inactions of many stake-holders, operating under diverse environmental, infrastructural, and socio-political conditions. These stakeholders include farmers, food handlers and distributors, food manufacturers, food service operators, consumers, regulators, scientists, educators, and the media. The behavior of these stakeholders can be shaped by their awareness of food safety hazards; their technical, financial, and other capabilities to apply effective mitigating practices; and prevailing rules, commercial incentives, and other motivators.
Food safety management capacity comes in many forms. First, it is a critical element of human capital across all those who are involved in the handling or oversight of food. It may involve very basic knowledge, more special-ized technical expertise, or “soft” management, leadership, and communication skills. Second, capacity is embedded in the physical infrastructure that provides clean water and other basic services; supports food production, storage, and distribution functions; and allows for quality assurance services. A third type of capacity is embedded in management systems within enterprises, regulatory agencies, laboratories, and consuming households. Finally, food safety capacity relates to institutional norms, including social cues, brand reputation, profes-sional ethics, and the depth and breadth of food safety culture. Motivations to invest in or otherwise strengthen food safety management capacities and put them to use can be influenced by laws, social pressure, market signals, or other factors. The mix and strength of these motivators tend to vary by a country’s stage of economic development and agrifood system transformation.
Systematic assessments of food safety management capacity have been completed for relatively few low- and middle-income countries. Where detailed assessments have been undertaken, the findings have often not been quantified, making comparisons across countries difficult. Furthermore, many of the pertinent capacity assessments are not in the public domain because of the sensitivity surrounding public food control systems and because of concerns
15 One promising step is the development of an African Food Safety Index to track the status of pertinent indicators across the region. In the near term, many of the indicators will likely relate to conditions that may impact food safety outcomes—for example, access to clean water and sanitation—rather than food safety outcomes themselves (such as the incidence of foodborne illness) or specific food safety management capacities (such as the quality of laboratory testing systems). Over time, however, the index can be refined as additional data are generated.
about how the media or public might react to documented shortcomings in these systems. To get around these limitations, here we make use of a variety of data and other information sources.15
Source: WHO, accessed June 2020, https://www.who.int/ihr/procedures/mission-reports-africa/en/. Note: IHR = International Health Regulations.
FIGURE 10.4—CAPACITY RATING OF AFRICAN COUNTRIES ACCORDING TO THE WORLD HEALTH ORGANIZATION JOINT EXTERNAL EVALUATION INDICATORS FOR FOOD SAFETY
IHR rank 1IHR rank 2IHR rank 3IHR rank 4IHR rank 5Missing data
Nigeria
NigerChad
Algeria Libya Egypt
SudanMali
United Rep. of
Tanzania
SouthAfrica
Lesotho
Swaziland
Mauritius
Seychelles
Comoros
Cabo Verde
Sierra LeoneLiberia
GuineaGuinea-Bissau
GambiaSenegal
Mauritania
Western Sahara
Morocco
Côte d’Ivoire
BurkinaFaso
Gha
na
Togo
Beni
n
Equatorial Guinea
GabonDem. Rep. of the
Congo
Angola
Namibia
Zambia
Botswana
Zimbabwe
BurundiRwanda
Uganda Kenya
Rep.
of t
he C
ongo
MozambiqueMalawi
Cameroon
Central African Republic
SouthSudan
Somali
a
Mad
agas
car
Tuni
sia
Eritrea
Djibouti
EthiopiaSomaliland

2020 ReSAKSS Annual Trends and Outlook Report 123
One source of information is the assessments undertaken by the WHO to evaluate the compliance of individual countries with the International Health Regulations.16 These regulations obligate signatory countries to develop capacities to prevent, detect, and rapidly respond to potential public health risks. Joint external evaluations (JEEs) have been completed for nearly all African countries during the past 3 years and cover 19 technical areas of public health capacity, with ratings of each capacity on a 5-point scale ranging from “no capacity” (1) to “sustainable capacity” (5). For food safety, the capacities that have been assessed relate only to FBD surveillance (indicator 5.1) and rapid response to food safety emergencies and FBD outbreaks (indicator 5.2). Although these are useful indicators, they provide an incomplete picture of the prevailing status of food safety management capacity. Figure 10.4 maps out the JEE food safety ratings for African countries. Of the 47 African countries assessed, only 1 country (Seychelles) received a 5 rating for food safety, and only 2 others (Mauritius and Morocco) received a rating of 4, defined as “demonstrated capacity.” A quarter of the assessed African countries received a rating of 1 and the vast majority were rated at 2, defined as “limited capacity.”
A second useful tool for gauging the capacity of national food safety management is the results of the assessments by the World Organisation for Animal Health (OIE) of the performance of veterinary services (PVS) in various countries. The fundamental components of the OIE’s PVS assessment pertain to (1) human, physical, and financial resources; (2) technical authority and capability; (3) interaction with interested parties; and (4) measures to ensure
16 See https://www.who.int/ihr/procedures/mission-reports-africa/en/.
market access. The most recent version of the PVS assessment tool covers 38 critical competencies, with experts rating each capacity on a 5-point scale from “little or no capacity” (1) to “a high level of competence or application of best international practice” (5). A subset of these criteria is either directly associated with the safety of animal-based products or is likely to strongly influence how well food safety oversight is performed. Specifically, ratings for 18 such criteria can be used to gauge and compare the status of official control systems for animal-sourced food safety, including 2 associated with funding adequacy, 12 associated with technical capacities and regulatory functions, and 4 related to international market access. Jaffee and colleagues (2019) combined the technical capacities and market access measures from the PVS to construct an index
Source: Authors’ construction based on data from unpublished assessments of countries’ performance of veterinary services by the World Organisation for Animal Health (OIE), various years..Note: * “Adequate” includes ratings of 3, 4, and 5.
FIGURE 10.5—PROPORTION OF AFRICAN COUNTRIES WITH ADEQUATE* CAPACITY FOR ANIMAL-SOURCED FOOD SAFETY
0
5
10
15
20
25
30
35
40
Prod
uctio
n In
spec
tion
Abb
atto
ir In
spec
tion
Dis
trib
utio
n In
spec
tion
Vete
rinar
y D
rug
Regu
latio
n
Resi
due
Test
ing
Ani
mal
Iden
ti�ca
tion
Labo
rato
ry In
fras
truc
ture
Lab
Qua
lity
Ass
uran
ce
Qua
rant
ine
and
Bord
erCo
ntro
ls
Emer
genc
y Re
spon
se
Cert
i�ca
tion:
Ani
mal
s/Pr
oduc
ts

124 resakss.org
of animal-sourced food safety capacity.
The PVS assessments suggest that the vast majority of African countries have underinvested in their animal-sourced food safety systems and therefore have low capacities. Still, there are important variations in the status of these systems across the continent. Among the 39 African countries recently assessed for PVS, more than 30 percent were judged to have “adequate” capacity (ratings of 3, 4, or 5) with respect to emergency response and the certi-fication of animals and products for export (Figure 10.5). In contrast, only 4 of the 39 countries were rated as having adequate capacities in relation to primary production inspection, animal identification, and animal product distribution inspection. Better ratings of capacity were generally found in North Africa and among the SSA countries that have been regular exporters of animals or meat. The African region as a whole is lagging behind other developing regions by a considerable margin.17
Such varying capacities to manage the food safety risks associated with animal products in Africa should be gauged in relation to current needs. Countries demonstrate considerable differences in terms of the prominence of animal products in the local diet and in trade, as well as in terms of the importance of livestock in their agricultural gross domestic product. These
17 Among lower-middle-income countries globally, some 30 percent are rated as having adequate laboratory infrastructure and 40 percent as having adequate capacities for quarantine and for emergency response. Among upper-middle-income countries, 60 percent or more have adequate capacities in these three dimensions.
and other factors were considered in constructing a “capacity need index” in relation to the safety of animal-sourced foods. Figure 10.6 maps animal-sourced food safety capacity and current capacity need, both for African countries and for other low- and middle-income countries (which are not labeled). In the bottom left quadrant are multiple western and central African countries whose capacities are low, but so too are their prevailing needs. We would expect the need for animal-sourced food safety capacity in these countries to increase over time as urbanization and income growth result in higher consumption of
Source: Authors’ construction based on data from unpublished assessments of countries’ performance of veterinary services by the World Organisation for Animal Health (OIE), various years, and Jaffee et al (2019).
FIGURE 10.6—CAPACITY AND NEED FOR CAPACITY FOR FOOD SAFETY SYSTEMS FOR ANIMAL-SOURCED FOOD, AFRICA
15 20 25 30 35 40 45 50 55 60 65 70 75 80 85 90 95
Food Safety Management Capacity Need Index
15
20
25
30
35
40
45
50
55
60
65
70
75
80
85
Gabon
Algeria
Sao Tome Principe
Morocco
MauritaniaLesotho
Kenya
Angola
Zimbabwe
Togo
Tanzania
NigerMadagascar
Liberia
Guinea
Central African RepublicBurundi
Benin
Libya
Botswana
TunisiaSwaziland
Sudan
Nigeria
Egypt
South Africa
Cabo Verde
Cameroon
Sierra Leone
Senegal
Guinea-Bissau
EthiopiaCongo, Democratic Republic of
Chad
Côte d'Ivoire
Low income Lower-middle income Upper-middle income
Ani
mal
Pro
duct
s-Re
late
d Fo
od S
afet
y Ca
paci
ty In
dex
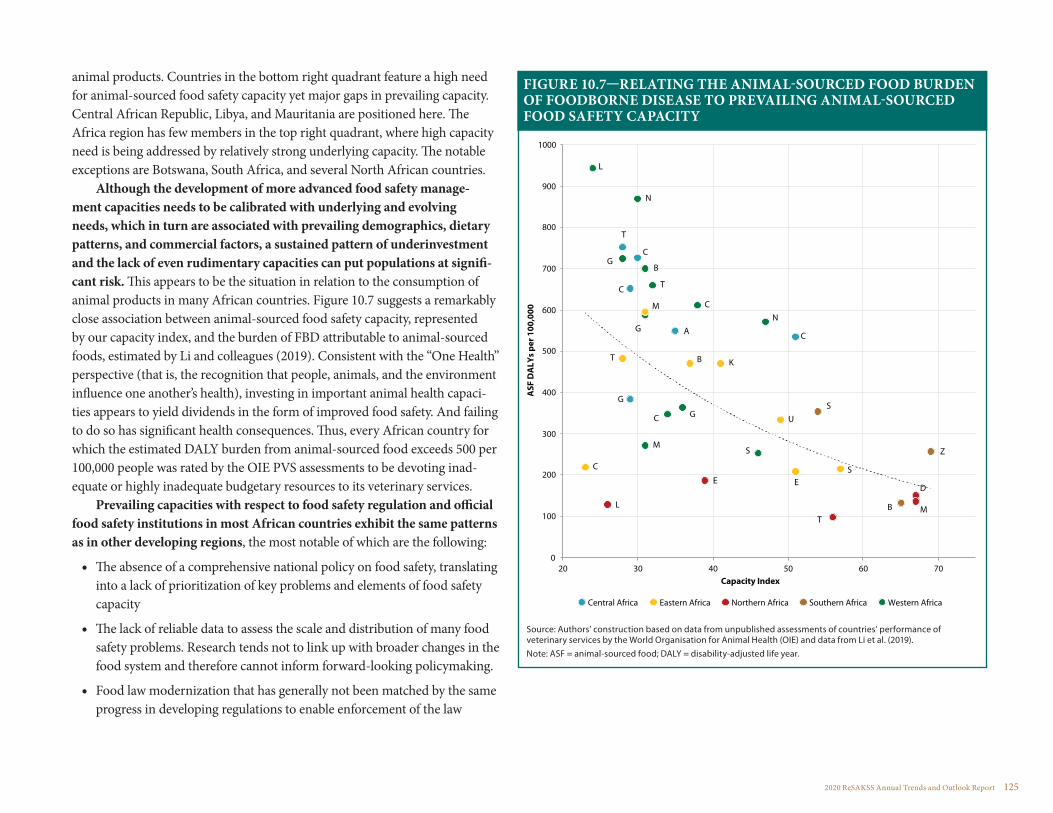
2020 ReSAKSS Annual Trends and Outlook Report 125
animal products. Countries in the bottom right quadrant feature a high need for animal-sourced food safety capacity yet major gaps in prevailing capacity. Central African Republic, Libya, and Mauritania are positioned here. The Africa region has few members in the top right quadrant, where high capacity need is being addressed by relatively strong underlying capacity. The notable exceptions are Botswana, South Africa, and several North African countries.
Although the development of more advanced food safety manage-ment capacities needs to be calibrated with underlying and evolving needs, which in turn are associated with prevailing demographics, dietary patterns, and commercial factors, a sustained pattern of underinvestment and the lack of even rudimentary capacities can put populations at signifi-cant risk. This appears to be the situation in relation to the consumption of animal products in many African countries. Figure 10.7 suggests a remarkably close association between animal-sourced food safety capacity, represented by our capacity index, and the burden of FBD attributable to animal-sourced foods, estimated by Li and colleagues (2019). Consistent with the “One Health” perspective (that is, the recognition that people, animals, and the environment influence one another’s health), investing in important animal health capaci-ties appears to yield dividends in the form of improved food safety. And failing to do so has significant health consequences. Thus, every African country for which the estimated DALY burden from animal-sourced food exceeds 500 per 100,000 people was rated by the OIE PVS assessments to be devoting inad-equate or highly inadequate budgetary resources to its veterinary services.
Prevailing capacities with respect to food safety regulation and official food safety institutions in most African countries exhibit the same patterns as in other developing regions, the most notable of which are the following:
• The absence of a comprehensive national policy on food safety, translating into a lack of prioritization of key problems and elements of food safety capacity
• The lack of reliable data to assess the scale and distribution of many food safety problems. Research tends not to link up with broader changes in the food system and therefore cannot inform forward-looking policymaking.
• Food law modernization that has generally not been matched by the same progress in developing regulations to enable enforcement of the law
Source: Authors’ construction based on data from unpublished assessments of countries’ performance of veterinary services by the World Organisation for Animal Health (OIE) and data from Li et al. (2019).Note: ASF = animal-sourced food; DALY = disability-adjusted life year.
FIGURE 10.7—RELATING THE ANIMAL-SOURCED FOOD BURDEN OF FOODBORNE DISEASE TO PREVAILING ANIMAL-SOURCED FOOD SAFETY CAPACITY
D
A
B
B
T
C
C
C
T
C
C
E E
G
G
G
G
C
K
L
L
M
M
M
N
N
S Z
S
S
B
T
T
U
0
100
200
300
400
500
600
700
800
900
1000
20 30 40 50 60 70
ASF
DA
LYs
per 1
00,0
00
Capacity Index
Central Africa Eastern Africa Northern Africa Southern Africa Western Africa

126 resakss.org
• The absence of effective mechanisms for the accreditation and certification of businesses
• The fragmentation of institutional responsibilities among lead agencies and ministries, and between central and decentralized units, with often weak coordination due to overlapping mandates or gaps. There is, therefore, a lack of coordination in monitoring hazards, risks, and human health outcomes, and in interpreting laboratory test results.
• Capacities for food safety regulatory oversight that tend to be stronger for exports than for the domestic market. This stems from a variety of factors, including the clarity of requirements for “competent authorities” coming from external (and especially Organisation for Economic Co-operation and Development country) trade partners, a more narrow or concentrated industry structure over which regulatory checks can be more readily made, the presence of better-organized industry associations in some export industries, and a legacy of earlier investments made to improve the competitiveness of export industries and resolve specific food safety–related problems.
Because public food safety management capacity is inadequate in much of Africa, there is growing interest in alternative approaches to regulation, envisaging a new relationship between the private sector as the “regulated” and the government as “regulator.” Thus, co-regulatory approaches and other forms of public–private partnerships are seen to provide opportunities to achieve greater efficiency in the management of food safety through the adoption of approaches that are practicable and more amenable to available resources, prevailing capacities, and prevailing incentives within agrifood value chains. For alternatives to direct regulation, the government can support the development and application of voluntary codes of practice or private standards, provide information to businesses and consumers about risk management, and facilitate market-based incentives for better risk management.18 Regulatory approaches can be made more flexible to allow businesses to comply in ways that are more
18 Use of market-based incentives for compliance with voluntary food safety standards has the greatest utility in circumstances where there is a strong consumer demand for certified foods. Though there are certainly examples of such demand in middle-income African countries, it tends to occur in niche markets, and the majority of consumers are either unable or unwilling to pay for certified foods, with the latter often due to a lack of understanding of what certification represents or a lack of confidence in the credibility of the certifications.
efficient and effective. Initiatives for such flexibility include industry inputs into the design of regulatory standards, flexibility in applying and enforcing process standards, and industry collaboration on enforcement.
With available data, it is not possible to make any strong generalizations or comparisons in terms of private sector food safety management capacity in Africa. Food industry structure varies enormously within the region, in terms of the size distribution and concentration levels in different segments of food manufacturing and the patterns of food distribution. Importantly, this variation includes the relative significance of different forms of “modern retail” (supermar-kets, convenience stores, e-commerce operations, and so on) versus traditional community food markets. Levels of and formats for out-of-home eating, each with its own challenges for managing food safety risks, also vary significantly among the countries of Africa. Citing data or circumstances for one or even several African countries, therefore, does not provide a representative picture.
In the absence of reliable data, proxy indicators of private sector food safety management capacity can be employed, although these relate primarily to companies or value chains with a predominant export market orientation. For example, across the African continent, 387,204 hectares of the area under fruit and vegetable production was certified by GlobalGAP (a trademarked international farm assurance program) in 2017, a significant increase over the total of 99,337 hectares in 2010. In 2017, Africa accounted for 7.3 percent of the global total certified area and 21 percent of the total in low- and middle-income countries. Although 17 African countries had some GlobalGAP-certified area in 2017, 3 countries (namely Egypt, Morocco, and South Africa) accounted for 82 percent of the total for Africa. With respect to organic certification, 131,457 hectares of fruit and vegetable production was certified on the African continent in 2017, representing 15.6 percent of the total area in low- and middle-income countries certified for organic fruit and vegetable production. Egypt, Kenya, and Madagascar had the largest areas and collectively accounted for two-thirds of the African total. With respect to agrifood processing, one indicator of prevailing food safety management capacity is the number of businesses that are registered
2020 ReSAKSS Annual Trends and Outlook Report 127
to export to high-income countries. Outside of fish and fishery products, very few businesses are registered to export to the United States. The lone excep-tion is South Africa, which ranked among the top 15 low- and middle-income countries in terms of the number of food manufacturing enterprises registered with the US Food and Drug Administration (FDA) in 2018. African countries as a whole accounted for only 7.2 percent of the total food processing enterprises in low- and middle-income countries registered with the FDA in that year, with 5 countries accounting for two-thirds of all African registrations.
Comparable data on the food safety capacities or regulatory compliance of small and medium-size enterprises are not available. Depending upon the objectives and perceived impacts of data disclosure, regulatory agencies seem to waiver between statistics pointing to (implausibly) high rates of compliance and those communicating information about the (significant) number of companies that have been fined or closed down during regular or seasonal regulatory inspec-tion campaigns. It is clear, however, that large numbers of small and medium-size enterprises, and also microenterprises, that cater to the poor in Africa will need to upgrade their facilities and their food safety and supply chain management capacities to meet rising consumer demands and regulatory requirements in the coming years.
Very significant challenges remain in improving hygienic conditions and vendor practices in community markets and in relation to street foods. Survey and other evidence from many African cities points to low levels of food safety awareness and high-risk behaviors among food handlers in the informal sector, which services a large proportion of urban populations and the majority of the urban poor. Furthermore, evidence from small-scale studies of street food and other informal vendors suggests worryingly high contamination levels. Among the common risk factors are these:
• Inappropriate and unhygienic locations and surroundings, as vendors target high-human-traffic areas that may be exposed to airborne chemicals in dust and vehicle exhaust fumes
• Poor personal hygiene practices, either due to a lack of knowledge or poor environmental conditions and poor access to potable water, waste disposal, or both
• Unsuitable methods of transportation of food and ingredients, especially with respect to within-city movements of meat and animal carcasses by carts and motorbikes, and on bus rooftops
• Unclean places of preparation, including surfaces, equipment, and utensils, whether at the vending site or in the home, where condiments may be prepared ahead of time
• Use of contaminated water and ice when potable sources are not available; also, use of nondisposable plates, cups, and cutlery
Intervening in informal food channels is especially challenging given the large numbers of vendors involved, their frequent mobility and periodicity of business, their low levels of literacy and numeracy, and the hesitancy of regula-tors to unduly disrupt the livelihoods of relatively poor market actors. Yet these distribution channels often service a significant proportion of rural and urban consumers across the African continent. Even with the emergence of “modern retail” outlets, the small shops, community markets, and street vendors will remain major players in African food markets for the foreseeable future. This is especially the case with respect to the distribution of fresh foods that are critical to efforts to enhance the nutrient intake of the poor. It is important, therefore, to experiment with different types of intervention that are aimed at inducing behavioral changes on the part of traditional market and street food vendors and among their clientele. Some African experiences with such interventions are summarized in Roesel and Grace (2014) and in Jaffee and others (2019), and the sources cited therein.
The Way ForwardA significant share of Africa’s food safety problems and associated costs are avoidable if a concerted set of preventive measures are put in place. Some countries have invested little in food safety in the public or private sector. Foundational investments will be needed in people, infrastructure, and institu-tions, together with interventions in priority agrifood value chains. Importantly, the priority here must be value chains directed at domestic markets, and especially those that serve the poor, and not to exports. For other countries, the
128 resakss.org
challenges are to improve the functionality of public regulatory delivery and technical services while mainstreaming safer food practices among farmers and food business operators of various sizes.
There are no simple solutions or quick fixes to the myriad of food safety challenges faced in Africa. On the contrary, a comprehensive approach is required that simultaneously focuses on improving food safety awareness, practices, and governance. It should include (1) addressing fragmented and often weakly coordinated institutional responsibilities; (2) building up capacities for risk analysis and risk communications; (3) enhancing systems for surveillance and food product traceability and recall; (4) moving from an end product testing focus to one that emphasizes supporting GAP among farmers and upgrading private sector management systems; (5) increasing consumer awareness of the safety of food; and (6) improving consumer food storage, handling, and prepara-tion practices.
Food safety should be seen as a shared responsibility between food business operators, consumers, and government. However, the effective opera-tionalization of this concept, which has been actively promoted by the WHO, is a significant challenge in many African countries. Governments need to play effec-tive vision-setting and convening roles, provide reliable information to the entire spectrum of stakeholders, and employ a diverse set of policy instruments that involve, incentivize, and leverage the actions of key value chain actors. Whereas practitioners once emphasized effective “official food control” systems, the most critical roles for government are now recognized to be facilitative ones that induce investments and behavior change by actors who share with government the goal and responsibility for safer food.19
This inclusive concept of food safety management will require a paradigm shift in how African countries approach food safety regulation. The traditional regulatory model centers on enforcement through the inspection of food facilities and product testing, accompanied by systems of legal and financial penalties for infractions. Though this strict authoritative model is seemingly appealing to the public and media, and therefore to political decisionmakers, in many contexts its efficacy is questionable. This is especially the case where smallholder farmers, micro- and small enterprises, and informal food channels predominate, and both
19 The private sector, both as individual companies and through industry associations, can play a major role in advancing food safety science, applying emerging technologies, developing food safety human capital, providing quality assurance services, and promoting safer practices in primary production and food value chains.
surveillance and inspection capacities are limited. A shared responsibility model instead implies a move from a regulator–regulated relationship toward efforts by government to better incentivize and facilitate the delivery of safe produc-tion, processing, and distribution of food. In this context the role of regulation becomes one in which the absolute minimum food safety standard is legally defined but food business operators are given a degree of flexibility in how they attain this standard. And governments can offer information and other resources and support to motivate and assist compliance.
Governments in Africa need not only to invest more in food safety but also to invest more smartly. This means (1) investing with clear purpose and tracking the impacts of interventions; (2) investing in the foundational knowl-edge, human resources, and infrastructure for food safety systems; (3) balancing attention to “hardware” (laboratories, physical market infrastructure, processing facilities, and so on) and “software” (management systems, human capital, aware-ness raising for behavioral change, and so on); (4) realizing synergies among investments and in the pursuit of goals, for example initiatives addressing both animal and human health, or both food safety and environmental health; and (5) ensuring the sustainability of investments and wider outcomes.
Not all investments that can reduce the burden of FBD are typically regarded as falling within the scope of “food safety” interventions. Thus, critical investments may address environmental health issues, such as those that increase access to potable water and improve sanitation, or those that lessen environmental contaminants in soil, water, and air. Measures such as these reduce the propensity for cross-contamination in food supply chains. Also important are investments in public health systems, including those that improve the quality of and access to medical treatment, which can reduce significantly both the morbidity and mortality outcomes of FBD.
In advancing the food safety agenda in Africa, making informed planning and other decisions will require fundamental improvements in the scientific and statistical dimensions of food safety, but also the active involvement of finance and other central economic ministries. It is recommended that such entities (1) calibrate public expenditure for food safety to the economic costs of unsafe food and the benefits of investing in its prevention and management; (2)

2020 ReSAKSS Annual Trends and Outlook Report 129
emphasize forward-looking preventive measures to minimize future costs (in the form of avoidable losses) for, among other things, public health and market development; (3) balance public expenditure and investment between “hardware” and “software”; and (4) ensure that proposals for significant public investments or programs are justified through cost-benefit or cost-effectiveness analysis, and that alternative approaches, including regulatory measures and facilitating private investment, have been considered.
Lead food safety agencies and pertinent technical ministries (that is, agri-culture, health, trade, and environment) should develop a unified food safety strategy that defines priorities and responsibilities, guides the coordination of measures by government and private entities, and establishes funding needs. These lead agencies and ministries are also advised to (1) adjust key performance indicators to be less about noncompliant outcomes (for example, number of legal infringements, value of fines collected, number of businesses closed, and so on) and more about food safety outcomes (for example, magnitude of food safety risks, incidence of FBD, levels of border rejections in focal export markets, and the like); (2) take measures that aim to minimize the entry of food safety hazards into the food supply from farms, especially approaches that offer co-benefits for public health and environmental protection; (3) direct attention to small and informal actors in the food system with an emphasis on raising awareness, promoting safer food handling practices, and improving physical operating conditions (for example, access to clean water and waste management facilities); (4) remove policy, regulatory, and other barriers to private investments in and services for food safety; (5) apply risk-based approaches to govern food trade, together with improved trade facilitation capabilities; (6) provide consumers with the tools to become partners in food safety through their own actions and through incentivizing and motivating food suppliers; and (7) incorporate the science of behavior change by redesigning training programs, information campaigns, and other interventions.
Clearly, however, the countries within Africa face distinct circumstances in relation to the current mix of food safety challenges, the structure of their food markets, and their prevailing strengths and weaknesses in food safety management capacity. Thus, specific priorities and the appropriate sequencing
of investments and initiatives need to be determined at the individual country level, and in the case of very large countries, at the subnational level. Guidance to countries at different positions in the food safety life cycle regarding ways to effectively position food safety in the national development dialogue as well as likely priorities in relation to food safety risk assessment, risk management, and risk communications is provided in the executive summary of The Safe Food Imperative (Jaffee et al. 2019). Most African countries have food systems that fall into either the “traditional” or “transitioning” stages, although the region’s upper-middle-income countries will likely find the strategic guidelines for “modernizing” food systems more appropriate.
Importantly, individual African countries need not, and should not, act on their own to develop a full range of food safety management capacities and understand the efficacy of different types of interventions. There is enormous scope for collaboration at the subregional and regional levels. For example, at either of those levels there is scope, among other things, to (1) develop a food science agency to provide independent scientific opinions and advice based upon risk assessment work on emerging topics; (2) develop centers of excellence to provide training in food safety regulatory delivery and to document good practice; (3) develop centers of excellence to support food safety education programs, consumer communications, and wider engagement programs; and (4) develop and apply capacities that combine networks of national laboratories and regional reference laboratories to support laboratory leadership, proficiency testing, and multicountry surveillance and testing programs.
Finally, building food safety capacity in Africa needs to be seen as a continuous process of development, upgrading, learning, adjustment, and refinement. It needs to be linked to the broader processes and evolving goals of economic development, and to be addressed in tandem with broader interven-tions and investments including measures to improve access to quality public health services, clean water and sanitation, and improved agricultural produc-tivity and sustainability. Whereas a subset of investments and institutions will need to be dedicated to food safety, the complex challenges of food safety cannot be addressed through professional silos.
130 resakss.org
CHAPTER 11
The Competitiveness of African Agriculture: Revisiting Trade Policy Reform in Africa
Antoine Bouët and Sunday Odjo

2020 ReSAKSS Annual Trends and Outlook Report 131
International trade is conventionally considered to be an engine of economic growth and economic and social development. While this view is at the heart of the policy recommendations of most international institutions
focusing on African agriculture today, it remains controversial for some governments on the African continent and is still debated among some development experts.
Trade policy can be instrumental in enhancing the competitiveness of an economy or a sector. Protectionist trade policies have often been used to support the competitiveness of local farmers in local markets vis-à-vis foreign farmers. However, a more comprehensive accounting of all potential consequences of policy reform reveals that the competitiveness of an economy’s agricultural sector is positively affected by policies aimed at the reduction of trading costs, both on the export side and on the import side. Other factors that might influence competitiveness include investment policies, property rights, and the degree of participation in regional trade agreements (RTAs).
Competitiveness is a key notion that is difficult to define. From a microeco-nomic point of view, it may be understood as the comparison of the prices of the same commodity produced in two different places. From a macroeconomic one, a nation’s competitiveness can be viewed as its capacity to augment the national share in world exports of goods and services. European treaties go even further and define the concept as the “capacity of a country to sustainably improve the standard of living of its inhabitants and to provide them with a high level of employment and social cohesion” (Debonneuil and Fontagné 2003, 8).
Competitiveness can be studied through its microeconomic drivers (labor costs, input costs, productivity, etc.) and macroeconomic drivers (trade costs, exchange rates, institutions, etc.). It can also be evaluated through its impact on economic variables such as the level of a country’s exports of a product relative to other countries. While the notion of competitiveness is often related to that of productivity, it should be noted that the latter concept refers to an absolute metric (for example, production per capita) while the former refers to a relative metric (for example, comparison of the prices of the same commodity produced in two different countries).
1 The controversy between pro–import substitution strategy and pro–outward oriented strategy economists was renewed at the end of 1990s with the release of a discussion paper by Rodriguez and Rodrik (1999). The paper was strongly criticized by Srinivasan and Bhagwati (1999).
The competitiveness of African economies is generally considered to be low. For Schwab and Sala-i-Martín (2017), who rank 137 countries in terms of competitiveness, all African countries are ranked 67 or below, except Mauritius, which is 47th. The Malabo Declaration states that the African heads of state are concerned “that there is limited progress made in agro-industries and agribusi-ness development, which hampers value addition and competitiveness of our [African] products in trade both local, regional, and international” (African Union Commission 2014, 2). The declaration aims to address these limitations and restore the competitiveness of African nations in the agricultural and agrifood sectors.
Though many African governments long opted for protectionist policies, especially in the agricultural sector, they have progressively, but not uniformly, adopted more liberal policies since the 1980s. Some governments are now attempting to increase the participation of their agricultural sectors in global or regional value chains. But at the same time, some countries continue to adopt openly protectionist strategies.
Indeed, it is interesting to recall rapidly how African trade policy has evolved since 1950. Figure 11.1 summarizes this evolution.
Starting with the African independence period (which for most African countries took place between 1950 and 1975), most African governments adopted protectionist policies. A primary reason was the need for public revenues. Another reason for the widespread adoption of import substitution policies was the belief that limiting or even forbidding foreign competition in the local market could create incentives for domestic investment opportunities.
Import substitution policies were a failure, as evidenced by a series of case studies of policies implemented by developing countries (Bhagwati 1978; Krueger 1978). Those studies concluded that an outward-oriented strategy is better for economic development.1
In 1968, at the strong urging of Raul Prebisch, then secretary-general of the United Nations Conference on Trade and Development (UNCTAD), rich countries began to grant trade preferences to developing countries in general and African economies in particular.
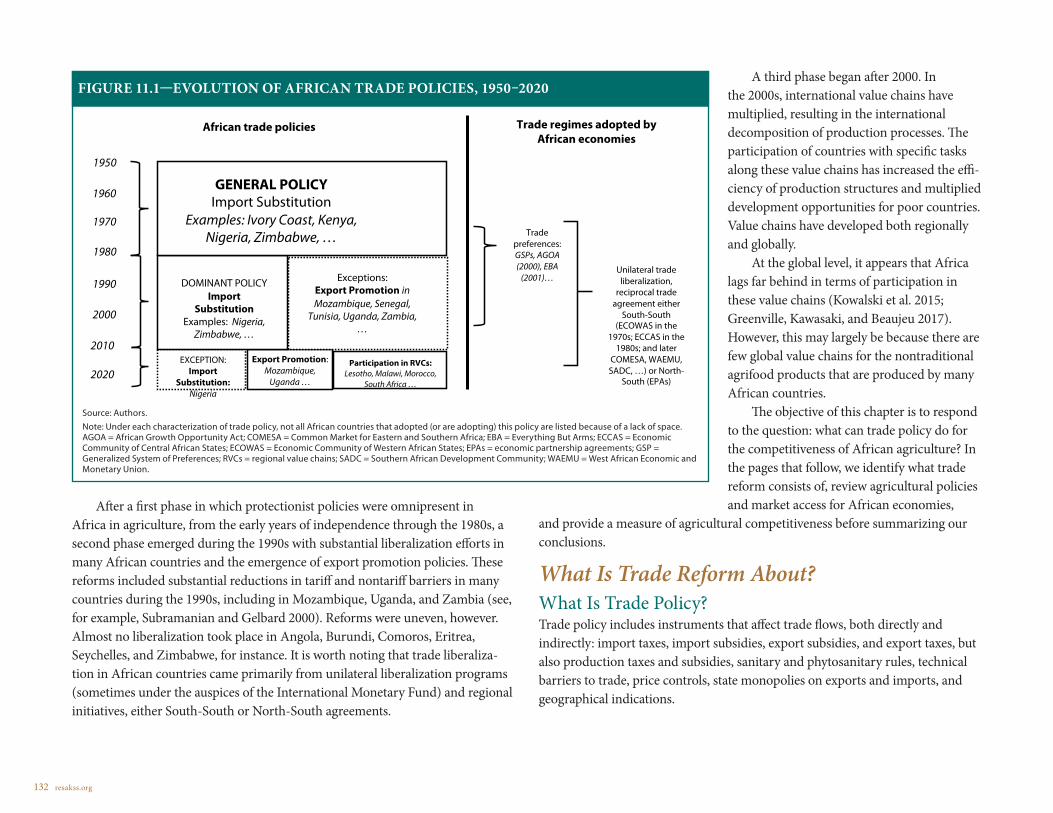
132 resakss.org
After a first phase in which protectionist policies were omnipresent in Africa in agriculture, from the early years of independence through the 1980s, a second phase emerged during the 1990s with substantial liberalization efforts in many African countries and the emergence of export promotion policies. These reforms included substantial reductions in tariff and nontariff barriers in many countries during the 1990s, including in Mozambique, Uganda, and Zambia (see, for example, Subramanian and Gelbard 2000). Reforms were uneven, however. Almost no liberalization took place in Angola, Burundi, Comoros, Eritrea, Seychelles, and Zimbabwe, for instance. It is worth noting that trade liberaliza-tion in African countries came primarily from unilateral liberalization programs (sometimes under the auspices of the International Monetary Fund) and regional initiatives, either South-South or North-South agreements.
A third phase began after 2000. In the 2000s, international value chains have multiplied, resulting in the international decomposition of production processes. The participation of countries with specific tasks along these value chains has increased the effi-ciency of production structures and multiplied development opportunities for poor countries. Value chains have developed both regionally and globally.
At the global level, it appears that Africa lags far behind in terms of participation in these value chains (Kowalski et al. 2015; Greenville, Kawasaki, and Beaujeu 2017). However, this may largely be because there are few global value chains for the nontraditional agrifood products that are produced by many African countries.
The objective of this chapter is to respond to the question: what can trade policy do for the competitiveness of African agriculture? In the pages that follow, we identify what trade reform consists of, review agricultural policies and market access for African economies,
and provide a measure of agricultural competitiveness before summarizing our conclusions.
What Is Trade Reform About?What Is Trade Policy? Trade policy includes instruments that affect trade flows, both directly and indirectly: import taxes, import subsidies, export subsidies, and export taxes, but also production taxes and subsidies, sanitary and phytosanitary rules, technical barriers to trade, price controls, state monopolies on exports and imports, and geographical indications.
Source: Authors.Note: Under each characterization of trade policy, not all African countries that adopted (or are adopting) this policy are listed because of a lack of space. AGOA = African Growth Opportunity Act; COMESA = Common Market for Eastern and Southern Africa; EBA = Everything But Arms; ECCAS = Economic Community of Central African States; ECOWAS = Economic Community of Western African States; EPAs = economic partnership agreements; GSP = Generalized System of Preferences; RVCs = regional value chains; SADC = Southern African Development Community; WAEMU = West African Economic and Monetary Union.
FIGURE 11.1—EVOLUTION OF AFRICAN TRADE POLICIES, 1950–2020
African trade policies Trade regimes adopted by African economies
1950
1960
1970
1980
1990
2000
2010
2020
GENERAL POLICYImport Substitution
Examples: Ivory Coast, Kenya, Nigeria, Zimbabwe, …
DOMINANT POLICYImport
SubstitutionExamples: Nigeria,
Zimbabwe, …
Exceptions:Export Promotion inMozambique, Senegal,
Tunisia, Uganda, Zambia, …
EXCEPTION:Import
Substitution: Nigeria
Export Promotion: Mozambique,
Uganda …
Participation in RVCs: Lesotho, Malawi, Morocco,
South Africa …
Trade preferences: GSPs, AGOA (2000), EBA
(2001)…Unilateral trade liberalization,
reciprocal trade agreement either
South-South (ECOWAS in the
1970s; ECCAS in the 1980s; and later
COMESA, WAEMU, SADC, …) or North-
South (EPAs)

2020 ReSAKSS Annual Trends and Outlook Report 133
The international trade landscape has been drastically modified during the last two decades, with the rapid growth of global value chains (GVCs), which can be defined as “activities spread over several countries that take place in transforming raw materials into the product delivered at its end use” (OECD 2020). What makes these value chains global is that activity is spread over many countries. What is relatively new is that developing countries are now actively participating in these GVCs.
The multiplication of GVCs and their increasingly prominent role in interna-tional trade has transformed the role of trade policy and the impact it has on an economy’s competitiveness. Trade policy is now increasingly being designed as a tool for improving an economy’s competitiveness.
Agrifood trade is becoming more and more connected to GVCs (OECD 2020). This significantly affects the impact of trade and agricultural policies. In terms of competitiveness, the key issue for many developing countries’ govern-ments now is securing access to cheap intermediate products. Another feature of GVCs is that they include the cross-border movement of know-how and human capital. These characteristics explain why the reduction of trade costs and the protection of assets are so important to participation in GVCs. It may also explain why Africa is lagging behind in terms of participation in GVCs.
Governments are showing increasing interest in their countries’ participation in GVCs. To boost their participation, they must engage not only in tariff liberal-ization (reduction of local duties applied on imports, as well as reduction of foreign tariffs faced by exports), but also in deep integration: increasing openness to foreign direct investment, improving efficiencies in services, and embracing other factors that help lower the costs of doing business. The objective is to augment a country’s participation in GVCs, either under backward participation (the “extent to which domestic firms use foreign intermediate value added for exporting activi-ties in a given country” [Kowalski et al. 2015, 14]), or under forward participation (“the extent to which a given country’s exports are used by firms in partner coun-tries as inputs into their own exports” [Kowalski et al. 2015, 14]).
2 It is worth noting that Melitz (2003) suggests that the increase in productivity is not obtained through these channels, but through a process of selection of firms: low-productivity firms disappear, and high-productivity firms expand their production. Stated differently, each firm’s productivity remains the same but the average productivity in the economy increases with trade liberalization.
The Impact of Trade Policies on Trade and CompetitivenessIn the early 1990s, most studies on barriers to international trade concluded that the successful tariff liberalization that had taken place from 1945 to 1990 had resolved the issue of customs duties, which are relatively low now, and that policymakers’ attention should be turned toward nontariff barriers. With the development of GVCs, this viewpoint deserves to be reconsidered. About 70 percent of international trade today involves GVCs (Miroudot, Rouzet, and Spinelli 2013). A tariff, even if small, has an amplified negative impact on trade. This is indeed intuitive, as the same value added may cross the same border several times with GVCs (Ferrantino 2012).
The effect of GVCs on trade may even be nonlinear. A small decrease in tariffs can decrease trading costs to a tipping point at which vertical specialization kicks in. With tariffs moving under this threshold, a large and nonlinear increase in international trade occurs (Yi 2003).
Diakantoni and Escaith (2014, 30) conclude their study with the following words: “Are tariffs an issue of the past, thanks to the progress in multilateral or regional trade liberalization? Definitely no!”
The recent economic literature on international trade emphasizes the positive impact of trade liberalization on productivity (Melitz 2003). Does trade liberalization automatically lead to productivity improvement and hence competitiveness? There are two relevant issues to be addressed here: (1) whether trade reforms help domestic producers adopt new technologies in order to be competitive, or simply result in a substitution of imports for local production, and (2) whether increases in imports with modern technology embodied in the imported products help improve productivity and competition, and whether there is any evidence of such an effect.2
In the manufacturing sector there is significant evidence of this positive impact (see, for example, Nazli, Siddiqui, and Hanif [2018] on the Pakistani manufacturing sector or Hayakawa and Matsuura [2017] on the Indonesian manufacturing sector). This evidence also exists in the agricultural sector, even if it is less abundant: Staboulis, Natos, and Mattas (2019) use a new measure of
134 resakss.org
trade costs to test the link between trade costs and productivity in the agricultural sector across the 34 Organization for Economic Co-operation and Development (OECD) member countries for the period 1995–2014. They conclude that when the agricultural sector faces lower trade costs, it becomes more productive and experiences higher productivity growth.
The impact of trade liberalization on productivity in African agriculture is a highly controversial issue, as there have been examples of an inverse relationship: trade liberalization can lead to a decline in productivity. For example, Morrissey and Leyaro (2009) conclude that the liberalization of the Tanzanian agricultural sector in the 1990s has led to a general decline in yields due to a large increase in fertilizer prices, which discouraged its use. Comparing cotton yields, Poulton, Labaste, and Boughton (2009) show that productivity is higher in the more concentrated systems (Zambia and Zimbabwe) than in the more competitive models (Tanzania and Uganda). In the latter, it is very difficult to provide the services that farmers need to raise their yields.
But although many African countries have experienced a decline in productivity following liberalization of the sector, this decline is not inevitable. The negative relation can be explained by market failures, particularly markets for credit and insurance, or dysfunctional input markets. A positive relationship between trade liberalization and productivity is therefore conditional on the proper functioning of these markets.
What Could Be the Objectives of Trade Policies? Many objectives have been cited as justification for trade policies, such as protecting local farmers from foreign competition, raising public revenues, and improving food security. However, these policies may be misguided or costly or both. We focus here on the role that trade policy can play in enhancing agricul-tural competitiveness in the current context of regional or global agrifood value chains.
Of course, a tax on imported goods can reduce the competitiveness of foreign farmers and improve the competitiveness of local ones. But this concerns only domestic markets, as an import tax does not improve local farmers’ competitiveness on international markets. And in cases in which an imported intermediate good is taxed, local farmers will face a loss of competitiveness on both domestic and international markets.
However, trade policy can be used to improve competitiveness on inter-national markets. A differential export taxes scheme is a trade policy aimed at increasing the competitiveness of the manufacturing stages of a value chain: high export taxes on primary products, low or zero export taxes on manufactured products. The idea behind this scheme is to decrease the domestic price of primary products, which gives an edge to local processors. But this benefit comes at the expense of local producers of raw materials, and the policy is highly distor-tionary (Bouët, Estrades, and Laborde 2014).
Examples of this type of trade policy include the policies implemented by the Democratic Republic of the Congo in the wood value chain and by Tanzania in cashew nuts and wet blue leather exports.
• In the Democratic Republic of the Congo, exports of raw timber are taxed at a rate in the range of 8.5 to 10 percent of the free on board (FOB) value, while exports of processed timber are taxed at 0 to 5 percent of the FOB value (WTO Trade Policy Review Body 2016).
• In Tanzania, raw cashew nuts are subject to an export tax at a rate of 15 percent of the FOB value of the exports or US$160 per metric ton, whichever is higher (Tanzania Revenue Authority 2020). Exports of shelled cashews are not taxed.
• Tanzania is an exporter of wet blue leather, made from the hides and skins of sheep, lambs, goats, bovines, buffalo, or horses. The Tanzanian govern-ment officially supports exports in this value chain. Skins and hides are also exported, but the scheme implemented by the government aims to give more support to exports of wet blue leather. Raw hides and skins are subject to an export tax at a rate of 80 percent of the FOB value of the exports or US$0.52 per kilogram, whichever is greater, while export taxes on wet blue leather are levied at a rate of 10 percent of FOB value (Tanzania Revenue Authority 2020).
Differential export taxes policies tax producers, especially of raw materials, and may reward inefficient processors. It is difficult to recommend these policies.
An economy’s competitiveness today is often estimated in terms of its participation in GVCs. Unfortunately, data on GVCs do not cover all countries and sectors. However, recent studies point out a few converging observations (Kowalski et al. 2015; Greenville, Kawasaki, and Beaujeu 2017):

2020 ReSAKSS Annual Trends and Outlook Report 135
• Structural factors such as size of the domestic market, location, level of development, and industrial structure are key determinants of countries’ participation in GVCs.
• Policy factors are also important determinants of participation in GVCs: tariffs charged on imports and faced on exports, technical barriers to trade placed on imports and faced on exports, import and export shares covered by RTAs, revealed openness to foreign direct investment flows, logistics performance, intellectual property rights, and quality of infrastructure and institutions.
• With regard to participation in GVCs, Africa is lagging behind. For Kowalski et al., “there is as yet little sign of a factory Africa emerging along the lines of factory Asia” (2015, 8).
• In agriculture, participation in GVCs is generally lower than in industrial sectors. A key explanation is that there are more distortions in the agrifood sector. Tariffs, which are an important determinant of participation in GVCs, are significantly higher in this sector.
Several conclusions emerge here. First, as underlined above, tariff barriers are still important, and this renewed importance is related to the emergence of GVCs. Second, the competitiveness of an economy is increasingly measured by its participation in GVCs, and trade policy can play a key role in this regard. Third, concerning the participation of African firms in the agrifood sector, there is significant room for policy reform.
Review of Agricultural Trade Policies and Market AccessDomestic market and trade liberalization policies have had a considerable impact on food security across African countries. Economic theory and empirical evidence across the continent suggest that the current challenges relating to food security in Africa can be better addressed by revisiting policies that govern domestic food markets as well as intraregional and extraregional trade.
To gain insight into the effects of trade and market access policies, we review the experiences of individual African countries in reforming their domestic markets as part of structural adjustment programs and their trade policy instru-ments as part of their alignment with regional integration schemes. We draw on
the estimations of average ad valorem equivalents of export and import restric-tions by Bouët, Cosnard, and Laborde (2017) to illustrate the level of protection of the agricultural sector in Africa compared to other regions of the developing world. The experiences outlined here reveal that market and trade policy reforms can still play a crucial role in sustaining food security by improving access not only to global agricultural markets but also to African markets for both African and non-African exporters.
Domestic Market Liberalization PoliciesBetween the 1960s and the mid-1980s, commodity price controls, input subsi-dies, state marketing boards, and export restrictions and taxation were common in the newly independent African countries. Most governments were convinced that their interventions were necessary (1) in the food sector to guarantee domestic food prices that would be both profitable to producers and affordable to consumers, and (2) in the export sector to obtain the resources needed for devel-opment expenditures through explicit or implicit taxation. Policymakers justified government interventions with the arguments put forward by development economists who saw price controls as the appropriate response to market failures (Myrdal 1956) or who viewed the taxation of agricultural exports in developing countries as a convenient and practical way to achieve industrial development (Lewis 1954; Hirschman 1958; Bhagwati 1958).
State interference in the operation of agricultural markets achieved the stated objectives to varying degrees. Jayne and Jones (1997) observed a “smallholder green revolution” in eastern and southern Africa as producers responded to the incentives provided by marketing boards and prices through massive adoption of new technology. However, the state intervention approach became fiscally unsus-tainable, and several African governments were urged to undertake a range of domestic market reforms during the late 1980s and the 1990s as part of structural adjustment programs.
This reform agenda aimed to open domestic markets to more competition and increase agricultural productivity and export competitiveness. It included the elimination of barriers to private sector involvement in agricultural production and marketing; the removal of price controls, export taxes, and input subsidies; the privatization of state-backed processing and marketing enterprises; the dismantling of state monopolies and barriers to competition; and, in some cases, the correction of overvalued exchange rates.

136 resakss.org
The implementation of this reform agenda varied across countries and commodities. For example, the governments of Mozambique and Uganda are recognized for the successful reforms of their fertilizer and maize markets, as are Ghana and Mali for their cereal market reforms. In contrast, the government still plays an important role in cotton marketing in Benin, in maize marketing in Malawi, and in input distribution in both countries. Zimbabwe reverted back to maize price controls a couple of years after eliminating them. In addition, the government has continued controlling fertilizer markets in Zambia and Ethiopia and the coffee market in Malawi (Kherallah et al. 2001; FAO 2003).
Thus, the implementation of reforms has been selective, depending on the political sensitivity regarding food security or foreign exchange earnings and tax revenues. Prior to market reforms, the food sector appeared to be more politically sensitive than the export sector. Food markets were protected through price controls for the benefit of rural producers and at the expense of urban consumers, while export commodities were taxed to obtain government revenue and foreign exchange earnings. However, export restrictions aided urban consumers but penalized producers. In contrast, during the reforms the food sector became less sensitive than the export sector. Many governments were generally more inclined to implement food market reforms while being reluctant to reform export markets.
Some smallholder farmers have responded to the increased political sensi-tivity of the export sector by either moving away from cereals production or integrating cereals and export commodities. This unanticipated effect appeared as a threat to food self-sufficiency and encouraged a return to government controls over food markets in some countries. Hence, state marketing boards survived the reform process in countries such as Ethiopia, Kenya, Malawi, and Zimbabwe. Competing with the nascent private sector, they played a significant role as buyer of last resort and managed price stabilization reserves. In other countries, such as Benin, Tanzania, and Zambia, the role of postreform marketing boards was restricted to maintaining a limited grain stock for use in emergency situations (Akiyama et al. 2001).
Generally, some sectors that are critical for agricultural marketing, such as rural transportation and finance, or some segments of distribution output or input chains, were excluded from the grain market liberalization process. This incomplete liberalization process may be exemplified by the case of Benin, where, despite the reforms, fertilizer importation, distribution, and pricing continued
to be regulated (Badiane et al. 1997). Because of their significant contributions to gross domestic product (GDP), foreign exchange earnings, tax revenues, rural employment, and poverty reduction, export crops such as cocoa, coffee, cotton, and sugar were not completely reformed in many countries.
Market liberalization is a gradual process; the sequence and pace of remaining reforms across all commodities will depend not only on the political and economic conditions within individual countries but also on access to regional and global markets. For example, domestic interventions in developed countries in the form of subsidies and tariff protection are often raised as the reason for delaying domestic market reforms in developing countries.
Trade Liberalization Policies and Global Market AccessIn addition to domestic market reforms, African countries have engaged in trade liberalization efforts not only as part of structural adjustment programs but also through RTAs.
Over the past four decades, RTAs have proliferated with the objective of expanding trade among their member countries and further connecting them to global markets. The establishment of RTAs entails significant changes in national trade policies, including the removal of impediments to cross-border trade such as import licenses and other procedural barriers, tariff and nontariff barriers, import and export prohibitions, import levies and export taxes, and the adher-ence to common external tariffs (CETs) if the RTA is a customs union. Not all member countries of an RTA adhere to the trade facilitation agreements of the RTA, and not all RTAs have put their trade facilitation agreements in force.
The Southern African Customs Union (SACU), the East African Community (EAC), the Central African Economic and Monetary Community (CEMAC), and the Economic Community of West African States (ECOWAS) have their CETs in force. CETs serve as most favored nation (MFN) applied tariffs applicable to all imports originating from extraregional partners. The entry into force of the ECOWAS CET in January 2015 abolished the CET of the West African Economic and Monetary Union (WAEMU). Earlier, the ECOWAS Trade Liberalization Scheme (ETLS) was adopted in 1979 and revised in 1990 to promote a free trade area in the region. However, complex rules of origin and cumbersome procedures led to persistent noncompliance with the ETLS. Although Cabo Verde is an ECOWAS member and enjoys full access to the free trade area, the country has
2020 ReSAKSS Annual Trends and Outlook Report 137
not yet adhered to the West African CET and continues to trade with extrare-gional partners under MFN applied tariffs.
Although CETs are not yet in place in the Common Market for Eastern and Southern Africa (COMESA) or the Southern African Development Community (SADC), free trade agreements (FTAs) are set up and consist of preferential tariffs granted on intraregional imports, while MFN applied tariffs are due on imports originating from extraregional partners that are World Trade Organization (WTO) members. However, five COMESA member countries are not part of the region’s FTA: the Democratic Republic of the Congo, Eritrea, Ethiopia, Somalia, and Tunisia trade with their COMESA partners under MFN applied tariffs as they do with their extra-COMESA partners. Similarly, three SADC members, Angola, Comoros, and the Democratic Republic of the Congo, have not adhered to the preferential tariff treatment on intra-SADC imports. As with their extra-SADC partners, their trade with other SADC members is subject to MFN applied tariffs.
The Arab Maghreb Union (AMU), the Economic Community of Central African States (ECCAS), and the Inter-Governmental Authority on Development (IGAD) also have FTAs. However, these FTAs are not yet in force; intraregional trade is still subject to MFN applied tariffs, as is extraregional trade with third parties that are WTO members.
Across all RTAs, trade with extraregional partners that are not WTO members is under general applied tariffs. Despite these RTAs, Africa remains highly protected with respect to extraregional import tariff rates across the continent. According to Bouët, Cosnard, and Laborde (2017), in 2010 the average import duty in the agricultural sector was 19.6 percent in Africa, compared to 19 percent in Asia and 14.4 percent in Latin America and the Caribbean. AMU, CEMAC, COMESA, EAC, and IGAD have the most protected agriculture, with the average import duty close to or more than 20 percent in 2010. Though CEMAC and EAC are customs unions, their extraregional tariffs are among the most prohibitive, averaging 19.5 and 24.2 percent, respectively, in 2010. In contrast, SACU, SADC, and ECOWAS have the least protected agriculture, with average 2010 import duty rates at 12.8, 13.6, and 14.0 percent, respectively. More specifically, Egypt and Tunisia, two AMU members, are the most protectionist African countries as regards agriculture, with average 2010 import duty rates at 46.7 and 45.3 percent, respectively. Seychelles and Morocco follow with 36 percent and 33.8 percent, respectively, while all other countries had average
2010 import duty rates around or much below 25 percent. The most open agri-cultural sectors in Africa are found in Libya (AMU), and Mauritius and Comoros (COMESA members), with average 2010 import duty rates of less than 5 percent. Countries with average 2010 import duty rates on agriculture of between 5 and 10 percent include Botswana, Eswatini, Lesotho, and Namibia (within SACU); Angola, Djibouti, and Eritrea (within COMESA); Mauritania (AMU); and Cabo Verde (ECOWAS).
Though RTAs have succeeded in reducing intraregional import duties in many cases, there is room for improvement in many other cases. The most recent available data indicate that the average tariff rate on intracontinental imports of agricultural products was 15.2 percent in Africa as of 2007, compared to 15.4 percent in Latin America and the Caribbean, 19.9 percent in Asia, and 22.2 percent in Europe (Bouët, Cosnard, and Laborde 2017). Agriculture protec-tion against cross-border trade is the highest within SADC, where the average duty on intraregional imports of agricultural products was 12.5 percent in 2007. The protection of agriculture is less trade prohibitive within IGAD, AMU, and COMESA, where average 2007 import duty rates were 7.6 percent, 5.1 percent, and 4.9 percent, respectively. Within the three customs unions that existed in 2007 (CEMAC, EAC, and SACU) and within ECOWAS since 2015, all import duties have been eliminated.
African exporters face fewer restrictions in global markets than in intrac-ontinental markets. In addition to lower trading costs outside Africa, exporters from least developed countries can seize the opportunities of preferential trade regimes such as the Everything But Arms initiative introduced by the European Union, and the African Growth and Opportunity Act implemented by the United States. According to estimations by Bouët, Cosnard, and Laborde (2017), African exporters have easier access to global agricultural markets than their competitors from other continents do. The average ad valorem equivalent of import duties faced by African exporters of agricultural products when entering foreign coun-tries is estimated at 9.9 percent in 2010, while corresponding estimations range between 14 and 20.4 percent for other exporter groups, including 14 percent for North American exporters and 16.4 percent for European exporters. With respect to regional disparities, CEMAC and ECOWAS are the most favored exporters to global agricultural markets, with import duties faced by their members’ agricultural exports averaging 2.6 percent and 5.4 percent, respectively. In contrast, SACU is the least favored exporter to global agricultural markets; it

138 resakss.org
faces an estimated average import duty on its members’ agricultural exports of 13.9 percent. More specifically, global agricultural markets are the most accessible for Cameroon, Equatorial Guinea, Sao Tome and Principe, and Sierra Leone, which face an average import duty on agricultural exports of 2 percent or less, and the least accessible for Algeria, Egypt, Gabon, Kenya, Malawi, and Niger, which face an average duty of not less than 15 percent.
In sum, despite the domestic market and trade liberalization efforts completed as part of structural adjustment programs and regional integration schemes, African agricultural markets remain less accessible than global agri-cultural markets. However, they benefit from relatively good access to foreign markets, even if this situation varies significantly from one African country to the next. It is often claimed that African countries’ access to global markets is limited by domestic support in rich and emerging countries, nontariff barriers related to compliance with sanitary and phytosanitary issues, and too-strict rules of origin. There is a fear that emerging protectionism and tariff escalation in rich countries will exacerbate these barriers to African competitiveness. However, while these arguments deserve consideration, impediments to Africa’s export performance on global markets also have much to do with high import tariffs, lengthy customs procedures, poor logistics performance, and nontariff barriers imposed by African countries both against each other within RTAs and against their non-African competitors.
The Participation of African Agricultural Sectors in Global Agrifood Value ChainsA well-known feature of Africa’s participation in world trade is the excessive specialization of its economies in traditional primary products such as tea, coffee, cocoa, and cotton. As we shall see in the next section, this structure of African exports prevails in its extracontinental relations in particular.
The emergence and multiplication of value chains can be a great opportu-nity for Africa to specialize in labor- and land-intensive segments of GVCs in order to attract international investment, which generally generates transfers of know-how and technology. Moreover, alliances with large companies from rich countries generally facilitate the adaptation of African agricultural products to the technical, sanitary, and phytosanitary standards of large countries.
An example of this type of alliance is informative. Madagascar has been very successful with its agricultural exports, thanks not only to vanilla but also to
exports of fruits and vegetables (for example, French beans, asparagus, gherkins, and snow peas). The country benefits from preferential access for its exports to the European Union and the United States. Furthermore, the government has introduced an export processing zone scheme. An export processing zone is an area with a special customs regime: the import of plants, machinery, equipment, and material for the local manufacture of export goods is free of any duty. In Madagascar, Lecofruit, the company that carries out most exports of fruits and vegetables, has contracted 9,000 small local farmers to produce French beans, which are highly appreciated in Europe because they are handpicked. At the same time, Lecofruit has contracted with large European supermarkets for the marketing and distribution of these products in Europe. Minten, Randrianarison, and Swinnen (2009) show that farmers associated with Lecofruit enjoy higher welfare and more stable incomes.
Until recently, at the global level, Africa was considered as lagging behind in terms of participation in global agrifood value chains (Kowalski et al. 2015; Greenville, Kawasaki, and Beaujeu 2017). It should be noted, however, that a few recent studies (Del Prete et al. 2016; Foster-McGregor, Kaulich, and Stehrer 2015) conclude that the participation of African economies in GVCs in agribusiness is significant. In particular, Uganda is an important supplier of unprocessed products in the sector’s international value chains. It is true that African involve-ment generally remains confined to supplying unprocessed products to these value chains, especially in their relations with other continents. However, a few exceptions show that it is possible to position these countries in the processing stages: a relatively large share of the gross agricultural exports of Ethiopia, Rwanda, and Tanzania is composed of foreign value added.
Measuring the Competitiveness of African AgricultureIn examining the links between trade policy reforms and competitiveness gains, we seek to determine the extent to which global trade policies explain the dif-ferential competitiveness of raw versus semiprocessed agricultural goods. We begin by reviewing a compilation of trade statistics and analyses to assess the competitiveness of African agricultural value chains. Then we examine how global trade policies have contributed to the differential competitiveness of raw versus semiprocessed agricultural goods in Africa.

2020 ReSAKSS Annual Trends and Outlook Report 139
Revealed Comparative Advantage We start with a study of Africa’s comparative advantages in agriculture. The com-parative advantage of a country in a product is often assessed in terms of revealed comparative advantage (RCA). This indicator is based on recorded levels of trade flows and measures whether a specific product is a strength or a weakness in the structure of a specific country’s exports. The RCA is calculated by dividing the share of a product’s exports in a country’s total exports by the share of exports of the same product in world exports. If the RCA is greater than (or less than) 1, it is concluded that this country has a comparative advantage (or disadvantage) in this product.
Importantly, an RCA reflects trade flows in the current policy environment. A country may be very competitive in, for example, rice cultivation, but if its government bans the export of this product, a comparative advantage in rice will not be revealed. By contrast, large exports of a product by a country may come about only because exports are highly subsidized. In a nutshell, an RCA reveals a comparative advantage or disadvantage from observed trade flows, but it does not explain why exports of this product by this country are so high or so low.
This statistic can be calculated for the African continent and for the entire agricultural sector: it reveals a comparative advantage of Africa in agriculture (see Dedehouanou, Dimaranan, and Laborde 2019).
RCAs can also be calculated at the product level (using the six-digit Harmonized System codes) and for each African country. Doing so, on average for 2015–2017, the three top-ranking agricultural products for each country can be identified.3
This gives a list of 153 products, 78 percent of which can be grouped into eight categories of agricultural products: horticultural products (28, of which 15 are fruits, 9 are vegetables, and 4 belong to the floriculture sector), fish and related products (28), livestock products (18), cocoa and its derivatives (15), cotton and related products (8), sesame (8), tobacco (7), and legumes (7). All 55 African countries have a RCAs in the eight main categories identified. The commodities most frequently identified are cocoa, cotton, fish and fish products, fruits, legumes, and tea.
3 The complete list can be requested from the authors.
Market Share Growth Analysis A market share decomposition analysis, comparing the period 2005–2007 to the period 2015–2017, can help us evaluate Africa’s competitiveness.
The competitiveness of a country in a sector such as agriculture is often evaluated in terms of the country’s world agricultural market share. However, this is misleading because a gain in market share can be attributed to the specializa-tion of this country in a product that is relatively more in demand as compared to other products, or to a geographic concentration of its exports toward a country whose demand for imports is increasing more than the world average. To determine whether a gain in market share can be attributed to an increase in competitiveness, the global market shares of a country can be decomposed to analyze what is driving the performance: good geographical or sectoral special-ization (that is, benefiting from a growth trend due to sectoral or geographical specialization), or individual performance.
This approach assesses whether a country has overperformed or underper-formed and identifies the domestic performance as the portion of the market share growth that is not attributable to increases in sectoral or geographic demand. A gain (or loss) in competitiveness is concluded if this residual is positive (or negative) (see Cheptea, Fontagné, and Zignago 2014).
More precisely, under this analysis a change in market share is attributed to one or more of the following factors:
1. The initial geographical pattern of exports. If a country is initially special-ized in exports toward markets with strong growth (Cambodia, China, Malaysia, Myanmar, Nepal, the Philippines, Thailand, and Viet Nam), this could explain an increase in global market share without an actual gain in competitiveness.
2. The initial sectoral pattern of exports. If a country is initially specialized in products experiencing strong growth in world demand (avocados; nuts such as pine nuts or pecans; and spices such as ginger, turmeric, cloves, cardamom, and vanilla), this could explain an increase in global market share without an actual gain in competitiveness.

140 resakss.org
3. The changes in geographical export patterns over the period. This compo-nent examines whether exporters have shifted from traditional markets to growing ones, for example, by increasing China’s share in their exports.
4. The changes in product specialization over the period.
5. Domestic performance, that is, competitiveness. The residual of an exporter’s performance not attributable to the above four factors is attrib-uted to competitiveness.
Between 2005–2007 and 2015–2017, Africa slightly improved its global market share in agriculture, from 4 percent to 4.3 percent. Overall, 31 African countries increased their global market shares, with the largest absolute gains for Algeria, Benin, Côte d’Ivoire, Egypt, Ethiopia, Ghana, Guinea-Bissau, Madagascar, Morocco, Mozambique, Nigeria, Rwanda, Senegal, Somalia, Tanzania, and Uganda. In relative terms, the worst performers were Botswana, Cabo Verde, Central African Republic, Chad, Congo, Djibouti, Equatorial Guinea, Gabon, and Namibia.
Results of the market share decomposition analysis for all African countries are presented in Figure 11.2. The horizontal axis measures the percentage change in world market share between 2005–2007 and 2015–2017, and each bar shows the decomposition along our five drivers: initial geographical and sectoral specialization (dark blue and dark green), changes in geographical and sectoral specialization (light blue and light green), and the competitiveness factor (ochre). Black dots indicate the net effect.
Most of the 48 African countries benefited from initial pro-export-growth geographical specialization, especially Benin, Burkina Faso, Chad, and Guinea-Bissau. Their initial exports were relatively concentrated toward the Netherlands (global re-export platforms), China, India, and Malaysia (relatively high growth in demand). Four African countries (Angola, Gabon, Niger, and Somalia) had a disadvantageous initial geographical specialization. Geographical reallocation has been beneficial for 27 countries, including Niger, which increased its export shares to China, Malaysia, and Thailand; Angola, which augmented its exports to Chile, China, and Peru; Somalia, which increased its export shares to Gulf countries, especially Oman and Saudi Arabia, and to China; Liberia (toward Malaysia and the Netherlands); Gabon (toward Canada and Switzerland); and Zimbabwe (toward China).
Regarding sectoral specialization, 33 African economies benefited from an initial specialization in products in high demand throughout this period, including Tunisia (olive oil and dates), the Comoros (spices and essential oils), Botswana (bovine meat), Burundi (coffee, tea, and beer), Rwanda (coffee and tea), and Guinea (cocoa and coffee).
Forty-four African economies increased their export shares in pro-growth products. Examples include Madagascar, which increased its specialization in spices and vanilla; the Comoros (also spices and vanilla); Gabon, which reduced its concentration on exports of tobacco-related products and increased exports of “niche” products such as communion wafers; Niger, which increased exports of sesame seeds; Central African Republic (fresh fruits); Cabo Verde (rum); and Senegal (fresh or chilled vegetables and groundnuts).
The residual competitiveness factor is positive for 10 countries: Algeria, Benin, Gambia, Guinea-Bissau, Madagascar, Rwanda, Senegal, Sierra Leone, Somalia, and Tanzania. None are poor performers in absolute terms. However, this analysis concludes that they have operated below their export potential: given their export specialization, in terms of products and destinations, and the changes in this specialization over the period, they should have expanded their world market share by more than they actually did.
Price CompetitivenessLet us now examine the price competitiveness of African countries with regard to several value chains. Dedehouanou, Dimaranan, and Laborde (2019) base their analysis on comparisons of unit values obtained through a trade flows database. At the aggregate level of agriculture, Africa appears to be competitive in terms of its prices of agricultural goods compared to the rest of the world: the gap in average prices varies between 10 and 25 percent over the period between 2005–2007 and 2015–2017. Africa appears to be very competitive in terms of price in the value chains of cotton, tea, sugar, sesame seed, and cocoa.
Price differences for the same good between two countries must be carefully interpreted. These differences may reflect either the price competitiveness of one economy in relation to another or differences in quality. However, in the context of agricultural goods, the issue of quality differentiation is less influential. This is especially true when we compare average unit values for specific value chains such as tomatoes, cotton, and cashews.
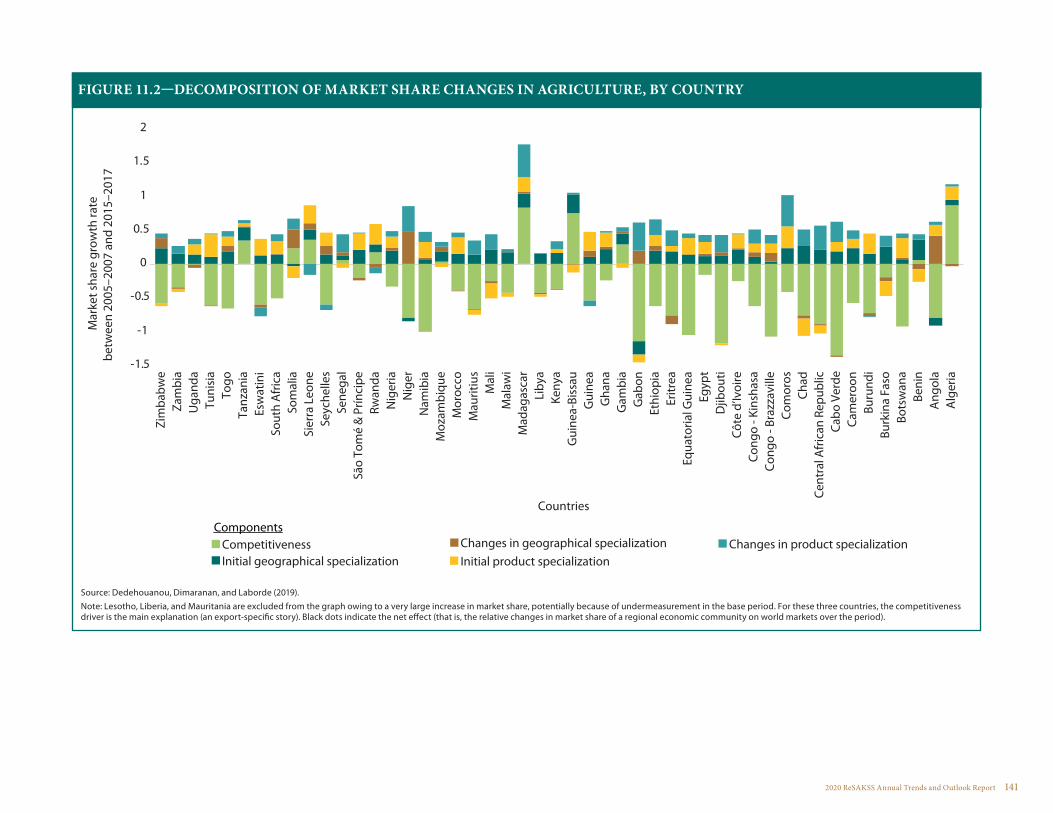
2020 ReSAKSS Annual Trends and Outlook Report 141
Source: Dedehouanou, Dimaranan, and Laborde (2019).Note: Lesotho, Liberia, and Mauritania are excluded from the graph owing to a very large increase in market share, potentially because of undermeasurement in the base period. For these three countries, the competitiveness driver is the main explanation (an export-specific story). Black dots indicate the net effect (that is, the relative changes in market share of a regional economic community on world markets over the period).
FIGURE 11.2—DECOMPOSITION OF MARKET SHARE CHANGES IN AGRICULTURE, BY COUNTRY
CompetitivenessInitial geographical specialization
Changes in geographical specializationInitial product specialization
Changes in product specializationComponents
-1.5
-1
-0.5
0
0.5
1
1.5
2
Zim
babw
eZa
mbi
aU
gand
aTu
nisi
aTo
goTa
nzan
iaEs
wat
ini
Sout
h A
fric
aSo
mal
iaSi
erra
Leo
neSe
yche
lles
Sene
gal
São
Tom
é &
Prín
cipe
Rwan
daN
iger
iaN
iger
Nam
ibia
Moz
ambi
que
Mor
occo
Mau
ritiu
sM
ali
Mal
awi
Mad
agas
car
Liby
aKe
nya
Gui
nea-
Biss
auG
uine
aG
hana
Gam
bia
Gab
onEt
hiop
iaEr
itrea
Equa
toria
l Gui
nea
Egyp
tD
jibou
tiCô
te d
’Ivoi
reCo
ngo
- Kin
shas
aCo
ngo
- Bra
zzav
ille
Com
oros
Chad
Cent
ral A
fric
an R
epub
licCa
bo V
erde
Cam
eroo
nBu
rund
iBu
rkin
a Fa
soBo
tsw
ana
Beni
nA
ngol
aA
lger
ia
Countries
Mar
ket s
hare
gro
wth
rate
betw
een
2005
–200
7 an
d 20
15–2
017

142 resakss.org
The Contribution of Global Trade Policies to Differential Competitiveness of Raw versus Semiprocessed Agricultural GoodsObserving the structure of African countries’ agricultural exports by degree of product processing illustrates a remarkable inadequacy in the participation of these countries in world trade: these productive systems remain too confined to the production and export of raw or semiprocessed products. This limitation is shown in Figure 11.3, which represents African agricultural exports by destina-tion (either intra-Africa or extra-Africa) and by degree of processing, from 2005 to 2017.
The figure shows that intra-African agricultural exports are relatively small,
and they are equally divided between raw and semiprocessed products on the one hand and processed products on the other. In contrast, extra-African
agricultural exports are largely dominated by raw and semiprocessed products.
There are economic explanations for the weakness of intra-African agricultural exports. Of course, the geographical distance is small between African economies, and these countries share common borders—which should strengthen trade. However, GDPs are lower in Africa, which has a negative impact on both export supply and import demand, and trade barriers are also relatively high within the continent (see previous section). Moreover, unrecorded trade is relatively important in intra-African trade (Bouët, Pace, and Glauber 2018). There are also historical and cultural explana-tions for the trade structure of these economies: a dummy variable tracing a colonial link is generally significant in econometric work regressing bilateral trade flows through a gravity equation. This partly explains why African trade with European countries is relatively strong and why intra-African trade is relatively low.
Our second observation allows us to confirm an essential conclusion already mentioned: African
agriculture is insufficiently involved in the processing stages of international value chains. It remains too concentrated on the production and export of raw products.
In order for African agriculture to move up the production stages of international value chains, both developed and developing countries would need to change their trade policies. The former should reduce tariff escalation in their trade policies, that is, the introduction of low tariffs on raw or semi-processed products and higher tariffs on processed products. This protective structure favors the location of processing activities in rich countries (see Boumellassa, Laborde, and Mitaritonna [2009] for a systematic measure and Aziz, Denkyirah, and Denkyirah [2017] for a case study on cocoa and Ghana).
The role of standards and other technical barriers to trade is difficult to assess. On paper, these policies may either stimulate or hinder trade (Maskus,
Source: Dedehouanou, Dimaranan, and Laborde (2019).
FIGURE 11.3—AFRICAN AGRICULTURAL EXPORTS BY DESTINATION MARKET AND STAGE OF PROCESSING
0
20000
40000
60000
80000
2005 2007 2009 2011 2013 2015 2017
Afr
ican
exp
orts
, m
illio
n U
SD
Year
Extra-Africa—Processed
Extra-Africa—Unprocessed & semi-processed
Intra-Africa—Processed
Intra-Africa—Unprocessed & semi-processed

2020 ReSAKSS Annual Trends and Outlook Report 143
Otsuki, and Wilson 2005; Moenius 2006). From an empirical point of view, a few studies show that some nontariff measures enhance trade (Disdier and Marette 2010). However, there is a relatively large literature that identifies a negative impact of sanitary and phytosanitary regulations adopted by developed countries on exports by developing countries (Otsuki, Wilson, and Sewadeh 2001; Wilson and Otsuki 2002; Disdier, Fontagné, and Mimouni 2008).
It remains true that stronger participation of African economies in GVCs, especially in high value-added stages of production, also depends on African trade policies. As shown in the previous section, there are still important barriers to trade in Africa, especially on intra-African trade, such as import duties, low-quality transportation and telecommunications infrastructure, and lengthy customs procedures. These policies obviously penalize the development of regional value chains.
Conclusions As demonstrated by recent statistics, the African agricultural sector has recorded substantial progress. Bouët, Cosnard, and Fall (2019), for example, show that between 2005 and 2017, Africa’s share in world agricultural GDP increased from 10 to 12 percent. This chapter aimed to identify the possible policy alignments or gaps that need to be addressed to sustain and accelerate this recent economic growth.
Trading costs remain too high in Africa, especially in the agricultural sector. The removal of customs duties on intra-African trade of agricultural commodities is expected with the implementation of the African Continental Free Trade Area. This is a necessary reform, but it is not sufficient to sustain and accelerate the recent success of African agriculture. Policymakers must also prioritize the streamlining of customs procedures, the improvement of trans-portation and communications infrastructure, the adoption of international sanitary and phytosanitary standards, the reduction of uncertainty about trade through a general consolidation of import duties in Africa, and the commit-ment by all governments to stop using export restrictions and prohibitions.
This will be a high price to pay. For example, the consolidation of all import duties and ending the use of export taxes are reforms that appear very costly to policymakers. They may reduce public revenues and make the need for general fiscal reform even more urgent. The reforms will also be costly in terms of political economy, as protectionist policies are a simple and easy way
to address the concerns of domestic lobbies and pressure groups. But this is the price to pay for a development strategy for the African agricultural sector that will be successful over the long term.

CHAPTER 12
Aligning Macroeconomic Policies for Agricultural Transformation in Africa
Adamon N. Mukasa, Njuguna Ndung’u, and Abebe Shimeles

2020 ReSAKSS Annual Trends and Outlook Report 145
Agriculture, even subsistence agriculture, does not operate in a closed environment and has important downstream and upstream sectoral linkages. Most empirical studies have found that growth in agriculture
is more effective in reducing poverty than growth in nonagricultural sectors (Irz et al. 2001; Christiaensen and Demery 2007; de Janvry and Sadoulet 2010). In fact, Shimeles (2015) has shown that the majority of individuals living in poverty in Africa, close to 54 percent, are active in the agricultural sector, followed by services, at around 32 percent, which is dominated by informal work arrangements, an offshoot of suppressed agricultural development. This means that agricultural development and transformation cannot be dissociated from the economic environment of a country or a region and that a conducive policy regime is therefore crucial to leverage the full potential of the agricultural sector (Díaz-Bonilla 2015).
Generally, the macroeconomic instruments governments deploy are diverse and seek to address short- and/or long-term concerns such as reducing uncertainty and overall risk in the national economic environment, promoting growth, and improving welfare and equity in income distribution. Although the underlying concerns in Africa regarding macroeconomic stability are never linked to the agricultural sector directly, the reliance on rainfed agriculture and the devastating consequences of periodic droughts and subsequent food supply constraints feed directly into a supply-side effect on domestic prices—inflation—and disturb the trajectory of monetary policy programs. Durevall and Ndung’u (2001) show that the Kenyan government’s control of maize prices, including the interdistrict maize movements from the 1970s to the 1990s, served as an instru-ment to contain inflation from the supply side.
This chapter discusses how accounting for macroeconomic perspectives when establishing agricultural policies can help African governments ensure that their agricultural sectors become productive, competitive, and lucrative across agricultural value chains. It presents the two-way linkages between agriculture-led growth strategies and macroeconomic policies by focusing on price, fiscal, monetary, exchange rate, and trade policies. It also discusses the main constraints to effective agricultural policy and the options for integrating agricultural perspectives when developing macroeconomic policies.
Urban and Anti-agricultural Bias of Macroeconomic Policies in AfricaIn many agriculture-dependent African countries, the performance of the agri-cultural sector determines the prevailing macroeconomic conditions, including economic growth, unemployment, balance-of-payments conditions, and fiscal balances (Díaz-Bonilla 2015). However, in many countries, farm earnings have often been depressed by macroeconomic policies with pro-urban and anti-agricultural and anti-trade biases. Despite significant strides in reducing those policy biases in recent decades, distortions to agricultural incentives remain widespread in most African countries.
In the 1960s and 1970s, many African countries implemented pro-urban, anti-agricultural, and anti-trade macroeconomic policies at the expense of farm households (Krueger, Schiff, and Valdés 1988, 1991; Thiele 2004; Anderson and Masters 2009). This urban bias was created by direct interventions in agricultural markets via a heavy tax burden on agriculture and by indirect interventions through overvalued exchange rates and import substitution policies (Krueger, Schiff, and Valdés 1992; Wiebelt et al. 1992).
A large portion of postindependence African governments’ expenditures has been focused on developing urban economies and infrastructure. For instance, Botswana, a country that has experienced sustained positive rates of economic growth over the greater part of its postindependence period, has been commit-ting nearly 85 percent of its development funds toward the development of urban social and physical infrastructure. This is despite economists’ pre-independence recommendations to prioritize agriculture-based development growth. Even when later development plans involving agriculture were initiated, they tended to have an urban-elite bias favoring large commercial farms rather than smallholder farmers.
Further compounding the problem of macroeconomic policies character-ized by urban bias is the discrimination in pricing policies of most African countries. Food prices have frequently been subjected to distortions through direct and indirect price interventions to address urban food needs and keep urban-economy wages low. One possible measure of the impact of price interven-tions in agricultural output markets is the nominal rate of assistance (NRA), defined as “the percentage by which government policies have raised gross returns to farmers above what they would have been without the government’s

146 resakss.org
intervention” (Anderson and Masters 2009, 11). Negative values indicate greater taxation on the agricultural sector, while positive values reflect supports to the sector. In Africa, the NRA has been negative since the waves of independence in the 1960s. In the 1960s, Africa’s NRA values were among the highest in the world, with a tax equivalent of about 10.3 percent of the value of total agricultural production. Only Asia (excluding Japan) surpassed the continent, with an estimated NRA of -25.6 percent. However, while the other regions managed to gradually shift from heavily taxing the agricultural sector to supporting the sector beginning in the 1990s, Africa has remained the only region that continues to tax agriculture—though it does so at continuously lower rates, moving from about -6.2 percent over the period 1990–1999 to -4.3 percent in the 2000s (Anderson and Masters 2013). Since the 2010s, likely due to country commitments under the Comprehensive Africa Agriculture Development Programme (CAADP) and the Malabo Declaration of 2014, NRAs for agricultural products have become positive, reaching on average 19.2 percent (MAFAP 2018a).
Evidence of anti-agricultural policies in Africa also comes out clearly when the NRA values of agricultural products are compared with those of nonagricultural products. The underlying indicator called the relative rate of assistance (RRA) therefore indicates the extent to which African countries have supported their agricultural sector relative to nonagricultural sectors. A negative RRA signals an anti-agricultural bias, while a positive value suggests pro-agricultural bias. If both agricultural and nonagricultural sectors are equally assisted by a country’s macroeconomic policies, then the RRA is zero. Between 1960 and 2010, macroeconomic policies in African countries favored nonagricultural sectors more than the agricultural sector, with the NRA almost always negative and lower than the NRA for tradable nonagricultural sectors. And despite the CAADP commitments and national agricultural development strategies, policy supports to the agricultural sector have remained insufficient to completely suppress the observed anti-agricultural bias in Africa.
The above regional averages, however, hide important heterogeneity across countries and agricultural products. A visual inspection of NRAs across 19 African countries with available data is provided in Figure 12.1. It shows a significant reduction in
taxation of farmers in countries such as Côte d’Ivoire, Ethiopia, Senegal, and Tanzania from 1960 to 1999 (pre-2000 period) and 2000 to 2017 (post-2000 period). It also identifies countries transitioning from taxing to supporting agriculture, such as Mozambique and Uganda, as well as countries transitioning from support to taxation of agriculture, such as Kenya, Nigeria, and South Africa. In countries such as Burkina Faso, Kenya, Malawi, and Mali, agricultural NRAs have been on average positive since the 2000s. Overall, empirical evidence suggests that agricultural NRAs and RRAs tend to be positively and significantly correlated with per capita gross domestic product (GDP) in Africa (Figure 12.2). Variations in NRA levels among agricultural products are shown in Figure 12.3 and suggest that commodities such as rice, cotton, and maize receive the highest level of agricultural assistance and support from African governments, whereas cash crops such as tea, cashew, and sugar (since 2010) are heavily taxed.
Source: Authors’ calculations based on Anderson and Masters (2009), Anderson and Nelgen (2013), and MAFAP (2018a).
FIGURE 12.1—TRENDS IN THE NOMINAL RATE OF ASSISTANCE TO AGRICULTURE IN SELECTED AFRICAN COUNTRIES
-80
-60
-40
-20
0
20
40
60
80
Zim
babw
e
Zam
bia
Côte
d'Iv
oire
Suda
n
Ethi
opia
Mad
agas
car
Moz
ambi
que
Gha
na
Egyp
t
Tanz
ania
Cam
eroo
n
Nig
eria
Uga
nda
Sout
h A
fric
a
Sene
gal
Mal
i
Mal
awi
Burk
ina
Faso
Keny
a
Perc
ent
Pre-2000 Post-2000

2020 ReSAKSS Annual Trends and Outlook Report 147
The above analysis suggests that in many African countries, macroeconomic and agricultural policies are disconnected, a stark contrast with the experiences of countries that have managed to achieve both agricultural and industrial development. African countries’ macroeconomic policies have not only been disconnected from agricultural needs and agrarian development; they have actively punished the underdeveloped agricultural sector through various forms
of taxation and indirect transfers to the urban economy. Fuel subsidies and subsidies on increas-ingly popular consumer goods such as packaged staples of maize, rice, and wheat work in the interests of urban residents but are meaningless for the economic welfare of smallholder farmers in rural areas. In addition, monetary and financial policies promoting lending to micro- and small businesses and low-income groups have mostly tended to exclude rural smallholder farmers. However, with renewed interest in the need to promote agriculture in various African countries, financial policies providing for credit guarantees to smallholder farmers have emerged in countries such as Kenya and Rwanda.
State of Macroeconomic Policy Targeting the Agricultural Sector in AfricaAnti-agriculture-industry bias can be traced back to the postcolonial socioeconomic and political context within which macroeconomic policies promoting the urgently needed economic growth were embedded. Schiff and Valdés (1992) provide details of the socioeconomic and political context, in which former colonies wanted to free themselves from their past role as economically dependent and peripheral raw commodities suppliers to former colonizers and from the international economic order in which the real exchange rate was seen to favor imported
industrial products over agricultural exports. Many African country leaders also had the general feeling that they needed to transform their economies from raw material outposts to economies that could manufacture products that were at that time predominantly imported. Agriculture was viewed as backward, traditional, less responsive to market signals, and having limited links to other sectors of
Source: Authors’ calculations based on Anderson and Nelgen (2013) and World Bank (2020).Note: NRA = nominal rate of assistance; RRA = relative rate of assistance.
FIGURE 12.2—RELATIONSHIP BETWEEN AGRICULTURAL NOMINAL RATES OF ASSISTANCE AND RELATIVE RATES OF ASSISTANCE AND REAL GDP PER CAPITA BETWEEN 1960 AND 2010
−1
−.5
0.5
NRA
6 7 8 9 10Log real GDP per capita
NRA values Fitted values
Slope = 0.02, Std. error = 0.00, F−stat = 2.39
−1
−.5
0.5
1RR
A
6 7 8 9 10Log real GDP per capita
RRA values Fitted values
Slope = 0.08, Std. error = 0.00, F−stat = 20.47

148 resakss.org
the economy. The main issue of allocation of limited investment resources was therefore settled decidedly in favor of industry over agriculture, thus ushering in import substitution policies. The boom-and-bust cycles that agricultural commodities undergo in international markets also provided a reason for macroeconomic planners to shun externally oriented sources of revenue. Agricultural-sector-specific policies such as tariffs, price controls, input and credit subsidies, quantitative restrictions, government expenditures, and taxes distorted the agricultural incentives for many farmers.
Fiscal PolicyHigh taxation rates have characterized African agricultural exports for decades—continuing even to current times, though there has been a marked reduction in the rate of taxation. Export crops such as cocoa, tea, and coffee are taxed as a major source of foreign exchange and revenue, which is a requisite for dealing with fiscal deficits. Essentially, the agricultural sector has been used as a revenue
source by the various African governments to subsidize the protected industrial sector. At the same time, the domestic producers of import-competing staples such as maize and rice are heavily subsidized, with producer prices well above global prices, though this has not resulted in enough increased productivity to meet food self-sufficiency goals in many African countries. Nontradable agricultural products such as plantains, sweet potatoes, and cassava are hardly supported by governments.
Trade PolicyTrade policies directly impact agricultural productivity and growth. Trade liberalization policies can increase agricultural productivity by creating competitive export and import opportunities, which are generally efficiency enhancing. Usually, African governments use trade policies to meet one or more specific economic and social priori-ties such as food security, price stability, lower prices and increased availability of staple food items, foreign exchange to enable fiscal equi-librium, and economic sectoral development. Trade policies, though heavily influenced by the national economic context, sectoral composi-tion of growth, food security concerns, fiscal equilibrium concerns, and employment creation, can have both short- and long-term price effects and implications for access, availability, stability, and utilization aspects of food security (FAO 2016). Trade policy in Africa is becoming more
regionalized while progressing toward a more liberalized regime, though pro-tectionism still persists due to tariff and nontariff measures such as subsidies on cereals and grains during cyclical food crises. African governments’ intervention-ist policies in agricultural trade have their root in past institutional arrangements in which government marketing boards controlled the marketing of agricultural products and inputs. Swinnen, Vandeplas, and Maertens (2010) and Kherallah et al. (2002) have noted that in countries in the East African and southern African regions these institutions were more engaged in the production and marketing of staples, while their West African counterparts focused interventions on the supply chains of export crops.
One way to capture the nature of trade policy toward the agricultural sector is by looking at the trade bias index (TBI) using NRAs for exportable agricultural products and import-competing products (Anderson and Masters 2009). The
Source: Authors’ calculations based on MAFAP (2018a).
FIGURE 12.3—TRENDS IN THE NOMINAL RATE OF ASSISTANCE TO AGRICULTURE IN SELECTED AFRICAN COUNTRIES
2005-17 2005-09
-100 -50 0 50 100 150
OnionsBeefTeaCashewCo�eeSugarGroundnutTobaccoMaizeCottonRice
Percent
2020 ReSAKSS Annual Trends and Outlook Report 149
TBI1 evaluates the extent to which a country’s policy regime creates an anti-trade bias within its agricultural sector. The more negative the index, the larger the agricultural anti-trade bias and the larger the gap between support to import-competing agricultural subsectors and assistance to exportable agricultural sub-industries. Available data suggest that agricultural anti-trade bias has been persistent in Africa, worsening between 1960 and the late 1980s before improving since the 1990s.
The proliferation of tariff and nontariff barriers to agricultural trade deserves attention when considering agricultural trade policy in the region. These tariffs change the relative prices of commodities (outputs, inputs, machinery, or equip-ment). Nontariff barriers translate into lost agricultural earnings due to missed trade opportunities, in addition to the loss to producers who cannot capture market prices in informal trade taking place across borders as a way to circum-vent complex and numerous customs rules. Informal market exchanges tend to be more costly to producers, and in this instance smallholder farmers are often at the mercy of middlemen who are the key movers in such informal markets. Kalaba (2012) noted, for instance, that the number of nontariff measures between Malawi, Mozambique, and Zambia rose from 400 to 1,400 between 2000 and 2010, implying an average increase of 100 nontariff measures on agricultural products per year. In the case of the East African region, Karugia et al. (2011) found that nontariff barriers account for as much as 35 percent of the cost of maize transfers, thus eliminating a large share of value that could have been captured by the producers. Nevertheless, trade in staple food items is becoming increasingly important for many African countries, considering the lack of domestic capacity to meet growing demand under compelling domestic pressures for food security and self-sufficiency. The largest increase in African food imports is occurring in the grain and meat categories, a clear indication that African countries’ agricultural trade is defined primarily by deficits in the domestic supply of staple items such as maize, rice, and wheat.
The nominal rate of protection (NRP) can be used to compute the impact of tariffs on agricultural prices. The NRP measures the extent to which a set of agri-cultural trade policies affects the market price of a commodity. It is calculated as the percentage price difference between the farmgate price received by producers and an undistorted reference price at the farmgate level. A negative NRP suggests
1 The trade bias index is computed as TBI=[(1+ NRAagX/100)/(1+NRAagM/100)-1], where NRAagX andNRAagM are NRA values for exportable and import-competing agricultural subsectors.
that tariff barriers distort the domestic farmgate prices received by producers. The graphs in Figure 12.4 show the trends in NRPs for four key commodities (maize, rice, cassava, and sorghum) in a sample of African countries using available data over the subperiods 2005–2009 and 2010–2017. For maize, NRPs are positive in countries such as Burkina Faso, Burundi, Kenya, Mozambique, and Uganda throughout the surveyed period. In Kenya, for instance, the increasing trend in NRPs—from 27.3 percent in 2005–2009 to 52.7 percent in 2010–2017—could be explained by adverse weather conditions that negatively impacted maize produc-tion and led the National Cereals and Produce Board to intervene by increasing domestic prices (Apell, Nelgen, and Anderson 2019). With Kenya being the main export market for Ugandan maize, price distortions in the former country influ-ence maize NRPs in the latter. Maize NRPs in Tanzania have benefited from a more liberalized market environment as the country has lifted maize export bans imposed in the past (MAFAP 2018b).
In almost all the countries under analysis, rice NRPs are positive over the period covered. Because rice is a strategic crop for food security in Africa, many countries have implemented policies aimed at supporting rice production and consumption. They have also put in place national rice development strategies as an import substitution policy to ensure self-sufficiency in rice production and support rice farmers. Interventions have included increased direct budget alloca-tions to the rice sector and the imposition of high tariff rates for imported rice.
The same pattern of NRPs can be observed for cassava, especially since 2010, as African countries have implemented national cassava sector strategies to boost the contribution of the sector to economic development, improved food security, and poverty reduction. For sorghum, however, NRPs are globally negative, implying distortionary effects of agricultural tariffs on domestic farmgate prices. This could reflect an antiproducer bias of policy support to the sector, which is likely considered less strategic than crops such as maize, rice, cassava, or wheat.
Monetary Policy Monetary policy directly influences inflation, employment, exchange rates, and interest rates in an economy. Monetary and fiscal policies are used together as twin policy tools to bring about the desired macroeconomic impact. For instance, an increase in the supply of money that exceeds the actual growth in aggregate

150 resakss.org
FIGURE 12.4—NOMINAL RATE OF PROTECTION IN SELECTED AFRICAN COUNTRIES AND SELECTED PRODUCTS, AVERAGE 2005–2009 AND 2010–2017
Source: Authors’ calculations based on MAFAP (2018a).
2005-09 2010-17
-150
-100
-50
0
50
100
150
Ethi
opia
Gha
na
Nig
eria
Mal
i
Mal
awi
Tanz
ania
Beni
n
Moz
ambi
que
Uga
nda
Keny
a
Buru
ndi
Burk
ina
Faso
Perc
ent
Maize
-100
-50
0
50
100
150
200
250
300
Gha
na
Moz
ambi
que
Tanz
ania
Sene
gal
Beni
n
Nig
eria
Mal
i
Uga
nda
Buru
ndi
Burk
ina
Faso
Keny
a
Rwan
da
Perc
ent
Perc
ent
Perc
ent
Rice
-20
0
20
40
60
80
100
120
140
Moz
ambi
que
Uga
nda
Keny
a
Gha
na
Buru
ndi
Cassava
-80
-60
-40
-20
0
20
40
60
80
Nig
eria
Mal
i
Ethi
opia
Keny
a
Burk
ina
Faso
Sorghum
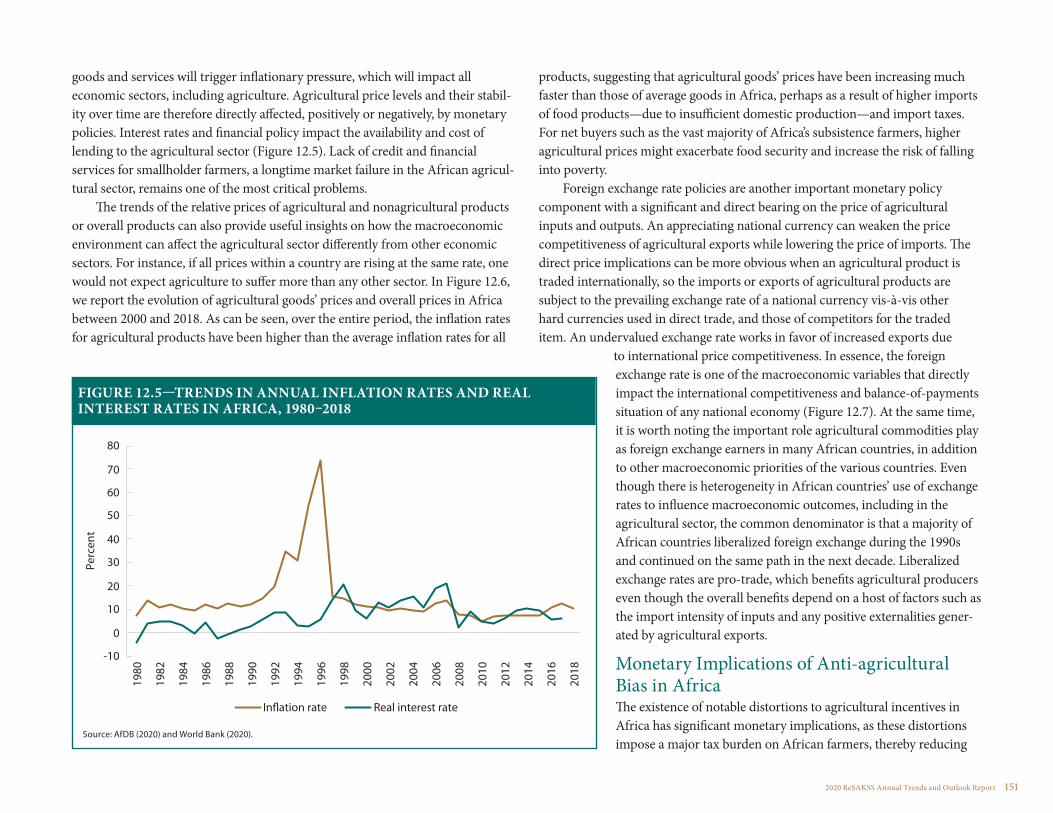
2020 ReSAKSS Annual Trends and Outlook Report 151
goods and services will trigger inflationary pressure, which will impact all economic sectors, including agriculture. Agricultural price levels and their stabil-ity over time are therefore directly affected, positively or negatively, by monetary policies. Interest rates and financial policy impact the availability and cost of lending to the agricultural sector (Figure 12.5). Lack of credit and financial services for smallholder farmers, a longtime market failure in the African agricul-tural sector, remains one of the most critical problems.
The trends of the relative prices of agricultural and nonagricultural products or overall products can also provide useful insights on how the macroeconomic environment can affect the agricultural sector differently from other economic sectors. For instance, if all prices within a country are rising at the same rate, one would not expect agriculture to suffer more than any other sector. In Figure 12.6, we report the evolution of agricultural goods’ prices and overall prices in Africa between 2000 and 2018. As can be seen, over the entire period, the inflation rates for agricultural products have been higher than the average inflation rates for all
products, suggesting that agricultural goods’ prices have been increasing much faster than those of average goods in Africa, perhaps as a result of higher imports of food products—due to insufficient domestic production—and import taxes. For net buyers such as the vast majority of Africa’s subsistence farmers, higher agricultural prices might exacerbate food security and increase the risk of falling into poverty.
Foreign exchange rate policies are another important monetary policy component with a significant and direct bearing on the price of agricultural inputs and outputs. An appreciating national currency can weaken the price competitiveness of agricultural exports while lowering the price of imports. The direct price implications can be more obvious when an agricultural product is traded internationally, so the imports or exports of agricultural products are subject to the prevailing exchange rate of a national currency vis-à-vis other hard currencies used in direct trade, and those of competitors for the traded item. An undervalued exchange rate works in favor of increased exports due
to international price competitiveness. In essence, the foreign exchange rate is one of the macroeconomic variables that directly impact the international competitiveness and balance-of-payments situation of any national economy (Figure 12.7). At the same time, it is worth noting the important role agricultural commodities play as foreign exchange earners in many African countries, in addition to other macroeconomic priorities of the various countries. Even though there is heterogeneity in African countries’ use of exchange rates to influence macroeconomic outcomes, including in the agricultural sector, the common denominator is that a majority of African countries liberalized foreign exchange during the 1990s and continued on the same path in the next decade. Liberalized exchange rates are pro-trade, which benefits agricultural producers even though the overall benefits depend on a host of factors such as the import intensity of inputs and any positive externalities gener-ated by agricultural exports.
Monetary Implications of Anti-agricultural Bias in AfricaThe existence of notable distortions to agricultural incentives in Africa has significant monetary implications, as these distortions impose a major tax burden on African farmers, thereby reducing
Source: AfDB (2020) and World Bank (2020).
FIGURE 12.5—TRENDS IN ANNUAL INFLATION RATES AND REAL INTEREST RATES IN AFRICA, 1980–2018
-10
0
10
20
30
40
50
60
70
80
1980
1982
1984
1986
1988
1990
1992
1994
1996
1998
2000
2002
2004
2006
2008
2010
2012
2014
2016
2018
Perc
ent
In�ation rate Real interest rate

152 resakss.org
the attractiveness of agriculture and undermining its transformation into a lucra-tive sector. While other regions of the world have continuously supported their farmers with substantial agricultural subsidies, African farmers are still heavily taxed as a result of an anti-agricultural bias. Available data show that the total value of annual transfers from farmers (or tax imposed on farmers) has increased from an average of US$3.9 billion in constant 2000 US dollars in the 1960s to a peak of US$10.9 billion in the 1970s, before gradually declining afterward. Evaluated in terms of workers engaged in agriculture, the burden of agricultural taxation is such that, in Africa as a whole, each farmer paid a gross annual tax amounting on average to US$66.50 in constant 2000 US dollars between 1960 and 2010. In 2010, the most recent year with available data, the burden of taxation on Africa’s agricultural sector averaged US$31.8 billion, or US$238.70
per farmer (Anderson and Nelgen 2013). However, compared to the peak in the 1970s, African farmers are currently taxed less, due in part to the reductions in taxation of farmers that occurred in many African countries in an effort to stimulate the performance of the sector and attract private sector actors and foreign investors.
At the country level, the burden of agricultural taxation is the largest for farmers in Côte d’Ivoire, Sudan, and Zimbabwe, while agricultural transfers to farmers (subsidies) are important in South Africa, Egypt, and Nigeria, Africa’s three largest economies. In Côte d’Ivoire, for instance, each person engaged in agriculture was taxed on average US$818.90 per year between 2000 and 2009 due to high taxation on the country’s major export cash crops (cocoa, coffee, and cotton). Agricultural taxation has since decreased in the country as Ivorian authorities have established agricultural sector policies aimed at supporting major cash crops and increasing the competitiveness of domestic markets. Hence, taxes on exports of cocoa butter have been reduced from 14.6 percent to 11 percent, while taxes on cocoa mass have dropped to 13.2 percent from 14.6 percent. South Africa, in contrast, has supported its agricultural sector through a series of policy instruments targeted at farmers, including not only direct subsidies but also many regulatory instruments aimed
at increasing health, safety, and the protection of natural agricultural resources (Kristen, Edwards, and Vink 2009).
Constraints to Effective Macroeconomic Policy Impact on Africa’s Agriculture Supply-Side Constraints Supply-side constraints to macroeconomic policies and efforts aimed at making agriculture a lucrative business are diverse. There is a good deal of heterogeneity among African countries with regard to the level of severity of the supply-side constraints. The most salient constraints are lack of credit, with an average of only
Source: Authors’ calculations using FAO (2020).
FIGURE 12.6—TRENDS IN ANNUAL INFLATION RATES OF AGRICULTURAL VERSUS ALL PRODUCTS IN AFRICA, 2000–2018
-20
0
20
40
60
80
100
12020
00
2001
2002
2003
2004
2005
2006
2007
2008
2009
2010
2011
2012
2013
2014
2015
2016
2017
In�a
tion
rate
s (%
)
Agricultural products All products
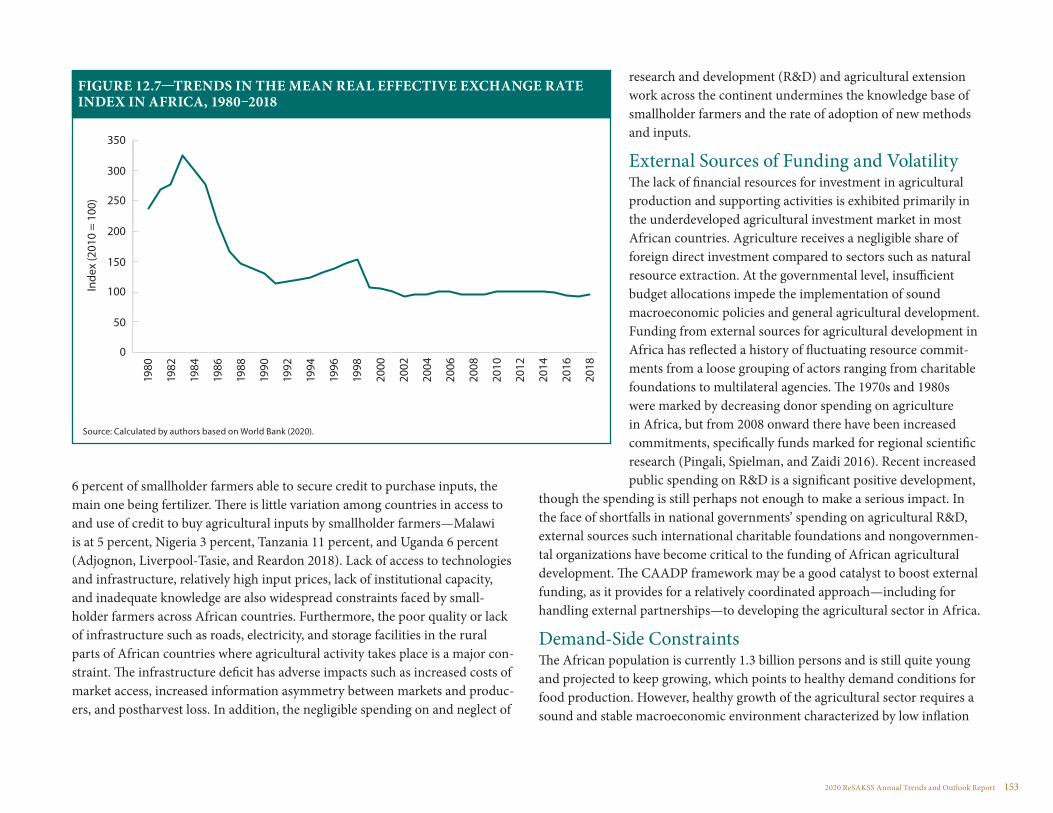
2020 ReSAKSS Annual Trends and Outlook Report 153
6 percent of smallholder farmers able to secure credit to purchase inputs, the main one being fertilizer. There is little variation among countries in access to and use of credit to buy agricultural inputs by smallholder farmers—Malawi is at 5 percent, Nigeria 3 percent, Tanzania 11 percent, and Uganda 6 percent (Adjognon, Liverpool-Tasie, and Reardon 2018). Lack of access to technologies and infrastructure, relatively high input prices, lack of institutional capacity, and inadequate knowledge are also widespread constraints faced by small-holder farmers across African countries. Furthermore, the poor quality or lack of infrastructure such as roads, electricity, and storage facilities in the rural parts of African countries where agricultural activity takes place is a major con-straint. The infrastructure deficit has adverse impacts such as increased costs of market access, increased information asymmetry between markets and produc-ers, and postharvest loss. In addition, the negligible spending on and neglect of
research and development (R&D) and agricultural extension work across the continent undermines the knowledge base of smallholder farmers and the rate of adoption of new methods and inputs.
External Sources of Funding and VolatilityThe lack of financial resources for investment in agricultural production and supporting activities is exhibited primarily in the underdeveloped agricultural investment market in most African countries. Agriculture receives a negligible share of foreign direct investment compared to sectors such as natural resource extraction. At the governmental level, insufficient budget allocations impede the implementation of sound macroeconomic policies and general agricultural development. Funding from external sources for agricultural development in Africa has reflected a history of fluctuating resource commit-ments from a loose grouping of actors ranging from charitable foundations to multilateral agencies. The 1970s and 1980s were marked by decreasing donor spending on agriculture in Africa, but from 2008 onward there have been increased commitments, specifically funds marked for regional scientific research (Pingali, Spielman, and Zaidi 2016). Recent increased public spending on R&D is a significant positive development,
though the spending is still perhaps not enough to make a serious impact. In the face of shortfalls in national governments’ spending on agricultural R&D, external sources such international charitable foundations and nongovernmen-tal organizations have become critical to the funding of African agricultural development. The CAADP framework may be a good catalyst to boost external funding, as it provides for a relatively coordinated approach—including for handling external partnerships—to developing the agricultural sector in Africa.
Demand-Side Constraints The African population is currently 1.3 billion persons and is still quite young and projected to keep growing, which points to healthy demand conditions for food production. However, healthy growth of the agricultural sector requires a sound and stable macroeconomic environment characterized by low inflation
Source: Calculated by authors based on World Bank (2020).
FIGURE 12.7—TRENDS IN THE MEAN REAL EFFECTIVE EXCHANGE RATE INDEX IN AFRICA, 1980–2018
0
50
100
150
200
250
300
35019
80
1982
1984
1986
1988
1990
1992
1994
1996
1998
2000
2002
2004
2006
2008
2010
2012
2014
2016
2018
Inde
x (2
010
= 10
0)

154 resakss.org
and rising incomes for agricultural producers and consumers. Low incomes and price inflation negatively impact demand conditions. It is notable that a rise in agricultural prices needs to be matched by rising domestic incomes to keep demand conditions stable. However, as incomes increase and the middle-income demographic expands, tastes also change, particularly among urban populations. Changes in tastes can be a challenge to local staple food produc-tion and relative output prices.
Overall, African demand for food remains very high, as can be understood from the rising imports. Increases in agricultural production within African countries could in the long run partially displace these imports, though international competition remains an external threat factor. However, the development of new infrastructure and improve-ment of existing infrastructure linking rural agricultural production zones to markets could help to eliminate high marketing costs as a demand-side constraint. In addition, nontariff measures that limit intra-African trade are a constraint on the demand side, and when the rules push trade into informal market channels, smallholder farmers face higher costs and fewer benefits.
Looming External Debt One of the consequences of macroeconomic imbalances in many African countries is the accumulation of debt, particularly external debt, which, if unchecked, could lead to reduced investment in agriculture. In the last four decades, external debt typically followed a pattern of escalation due either to procycli-cal behavior of government spending or to exogenous shocks, such as the deterioration of terms of trade, to which most African economies exhibit frequent vulnerabilities.
As Figure 12.8 depicts, Africa’s external debt as a share of GDP accelerated after the 1970s in the wake of the oil price crisis that sent shockwaves across the globe. As most African economies shrank, deficits mounted, and debt arrears accu-mulated, most countries faced debt crises and debt overhang, eventually leading to a massive debt-relief effort under the Heavily Indebted Poor Countries Initiative with a condition of
implementing what were popularly known as structural adjustment programs. As a result, external debt began to decline significantly in the late 1990s. During that period, African economies also enjoyed significant economic revival, buoyed by improvements in the terms of trade, particularly an unprecedented rise in the prices of export commodities that lasted for more than a decade. Economies were significantly bolstered by increases in foreign direct invest-ment and remittances, accelerating the pace of urbanization and the emergence of a middle class with increasing purchasing power—which also accelerated the importation of processed high-value agricultural products. However, external debt rose again after 2010 as capital markets began opening up for African
Source: Authors’ computations based on World Bank (2020).
FIGURE 12.8—TRENDS IN EXTERNAL DEBT AS A SHARE OF GDP IN AFRICA (UNWEIGHTED MEAN)
120
20
40
60
80
1970 1980 1990 2000 2010 2020
Exte
rnal
deb
t as
a pe
rcen
t of G
DP
100
Year

2020 ReSAKSS Annual Trends and Outlook Report 155
dollar- or euro-denominated sovereign bonds in the wake of the 2008/2009 global financial crisis, offering many governments access to borrowing opportunities without conditionalities, albeit at a higher rate of interest. The end of the commodity price super cycle hit the budgets of many African governments as debt service increased. According to the International Monetary Fund (IMF 2020), as many as 8 African countries were in debt distress and about 16 at high risk of debt distress, indicating that the trend, if continued, could lead to a significant macroeconomic setback for many African countries.
As shown in Figure 12.9, the ratio of debt service to exports, a key indicator of debt burden and potential for debt sustain-ability, began rising in Africa in 2010, following the trend in the debt-to-GDP ratio. The increase sped up after the collapse of commodity prices in 2013, reaching an average of nearly 10 percent of export earnings used to service debt. However, the average hides significant variation across countries. The situation is dire in Mauritius (56 percent), Angola (26 percent), Mozambique (26 percent), and Ethiopia (22 percent), as well as Egypt, Côte d’Ivoire, and other countries that have exceeded 15 percent, which is often considered the maximum share of its export earnings that a country should be devoting to service debt. The question is, what are the potential implications of rising debt for the agricultural sector?
One potential problem rising external debt may cause is the diminishing fiscal space to support agriculture. As noted by many observers, the share of government expenditure devoted to agriculture is generally low in Africa (Benin and Yu 2013; IFPRI 2015; AGRA 2016; Goyal and Nash 2016; Mukasa 2018). Typically, the higher the deficit in the government budget, the lower the share of government expendi-ture devoted to the development of agriculture (see Figure 12.10). Hence, rising debt and increased debt service generally lead to limited fiscal space for many governments, often forcing them to reduce spending on agriculture-related programs.
Most importantly, there is a significant and negative correlation between external debt and agricultural productivity in Africa (see Figure 12.11). This correlation may suggest various relationships between debt and the performance of the agricultural sector. One possibility is that in countries where agriculture is growing slowly or productivity is low, there is more opportunity to resort to borrowing for consumption smoothing at the national level, prompting higher debt. Thus, weak or low growth in the agricultural sector could be a source of increased borrowing. The other possibility is that
Source: Authors’ computations based on World Bank (2020).
FIGURE 12.9—DEBT SERVICE AS A RATIO OF EXPORTS IN AFRICA (%, UNWEIGHTED MEAN)
40
0
10
20
30
1970 1980 1990 2000 2010 2020D
ebt s
ervi
ce a
s a
ratio
of e
xpor
ts (%
)
Year
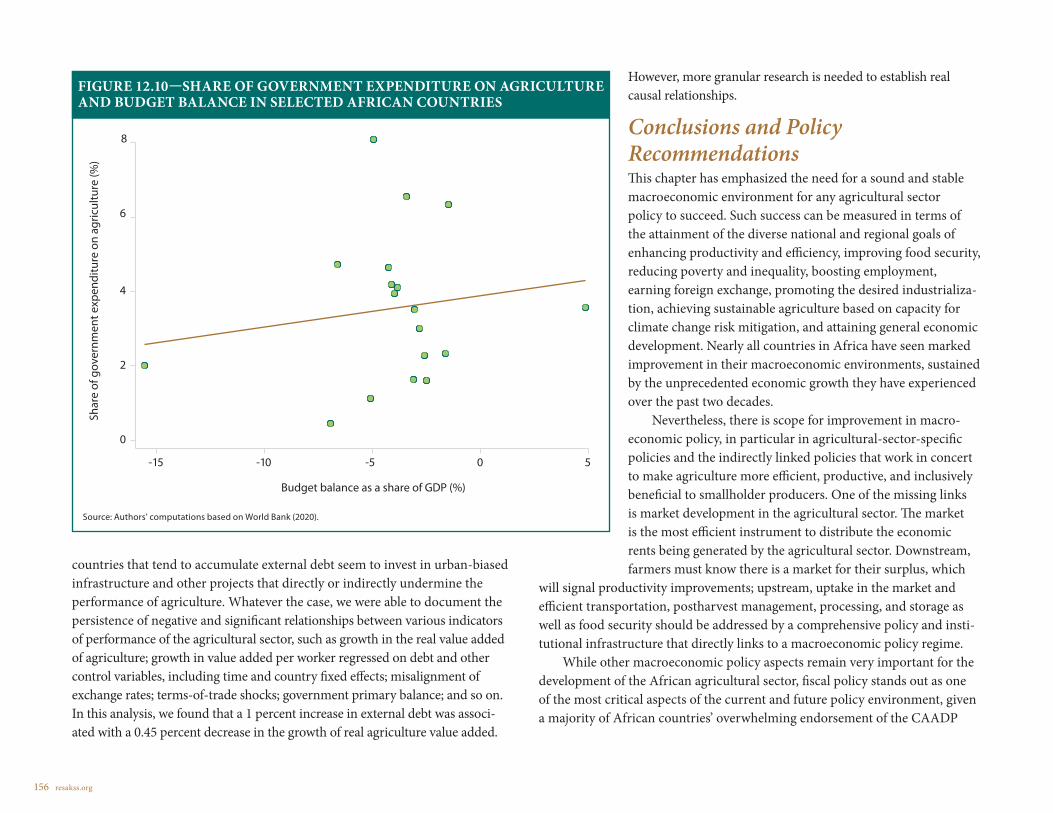
156 resakss.org
countries that tend to accumulate external debt seem to invest in urban-biased infrastructure and other projects that directly or indirectly undermine the performance of agriculture. Whatever the case, we were able to document the persistence of negative and significant relationships between various indicators of performance of the agricultural sector, such as growth in the real value added of agriculture; growth in value added per worker regressed on debt and other control variables, including time and country fixed effects; misalignment of exchange rates; terms-of-trade shocks; government primary balance; and so on. In this analysis, we found that a 1 percent increase in external debt was associ-ated with a 0.45 percent decrease in the growth of real agriculture value added.
However, more granular research is needed to establish real causal relationships.
Conclusions and Policy Recommendations This chapter has emphasized the need for a sound and stable macroeconomic environment for any agricultural sector policy to succeed. Such success can be measured in terms of the attainment of the diverse national and regional goals of enhancing productivity and efficiency, improving food security, reducing poverty and inequality, boosting employment, earning foreign exchange, promoting the desired industrializa-tion, achieving sustainable agriculture based on capacity for climate change risk mitigation, and attaining general economic development. Nearly all countries in Africa have seen marked improvement in their macroeconomic environments, sustained by the unprecedented economic growth they have experienced over the past two decades.
Nevertheless, there is scope for improvement in macro-economic policy, in particular in agricultural-sector-specific policies and the indirectly linked policies that work in concert to make agriculture more efficient, productive, and inclusively beneficial to smallholder producers. One of the missing links is market development in the agricultural sector. The market is the most efficient instrument to distribute the economic rents being generated by the agricultural sector. Downstream, farmers must know there is a market for their surplus, which
will signal productivity improvements; upstream, uptake in the market and efficient transportation, postharvest management, processing, and storage as well as food security should be addressed by a comprehensive policy and insti-tutional infrastructure that directly links to a macroeconomic policy regime.
While other macroeconomic policy aspects remain very important for the development of the African agricultural sector, fiscal policy stands out as one of the most critical aspects of the current and future policy environment, given a majority of African countries’ overwhelming endorsement of the CAADP
Source: Authors’ computations based on World Bank (2020).
FIGURE 12.10—SHARE OF GOVERNMENT EXPENDITURE ON AGRICULTURE AND BUDGET BALANCE IN SELECTED AFRICAN COUNTRIES
8
0
2
4
6
Shar
e of
gov
ernm
ent e
xpen
ditu
re o
n ag
ricul
ture
(%)
Budget balance as a share of GDP (%)
-15 -10 -5 0 5

2020 ReSAKSS Annual Trends and Outlook Report 157
framework targeting expenditure of at least 10 percent of annual public budgets on agriculture. The important question of optimal allocation of resources in the agricultural sector remains. Evidence from the experience of other agricultur-ally successful countries points to the need for sustained spending to improve and maintain infrastructure such as roads, agricultural facilities, rural markets, and irrigation systems to help the continent bridge its infrastructure gap, but above all a system for buying surplus from smallholder farmers that also includes processing and storage.
Equally, sustained investment in agricultural R&D and extension work is positively correlated with increases in productivity, innovation, and the use of new technologies, as demonstrated by the case of Brazil and other agriculturally successful countries (Evenson and Golli 2003). Research shows that agricultural R&D posts far higher returns on investment than investment in fertilizers, machinery, human resource training, and land quality (Evenson and Golli 2003; Thirtle, Lin, and Piesse 2003). However, efforts and investments in R&D require long time horizons to yield results, so sustained investment from the public sector is required. Over the past decades, growth in spending on agricultural R&D has been slower than growth in spending on other forms of investment in agriculture. This is due to low government funding and ad hoc funding by external sources, mainly donor funds. Volatility in R&D spending is counterproductive and wasteful because the interruptions and inconsistencies in spending act to cancel out any poten-tial long-term yields. Therefore, a well-informed agricultural R&D policy commitment is needed. On the brighter side, there has been a small increase in agricultural R&D spending since African countries committed themselves to the CAADP framework.
Public policy attention must also be directed at formu-lating the fine details of pragmatic pro-export / open trade policies targeted at removing the constraints to intra-African trade in agricultural commodities, including tariff and nontariff barriers due to highly regionalized trade policies,
and poor transportation networks that impede and raise the cost of access to markets. Because of the dependence on natural agroecological factors and rainfed agriculture, there is enormous but latent potential for differentiation in agricultural production beyond what is dictated by the current factors within the continent. Therefore, raising productivity is in itself a requisite condition for successful intra-African trade in agricultural commodities.
Needless to say, public programs to help the small-scale farmers who make up the majority of African farmers are critical to improving productivity and
FIGURE 12.11—EXTERNAL DEBT AND AGRICULTURAL VALUE ADDED PER WORKER IN AFRICA
5
6
7
8
9
10
Log
agric
ultu
ral v
alue
add
ed p
er w
orke
r
1 2 3 4 5 6Log external debt as share of GDP (%)
Source: Authors’ computations based on World Development Indicators data.

158 resakss.org
steering African agriculture from traditional to business-oriented farming. Therefore, public policy must address the use of subsidies and other support systems using public money. Whereas subsidies on fertilizers could be used to increase the use of fertilizers to improve productivity, this is not viable in the long term. Prolonged use of subsidies will only undermine the prospects of developing functional input markets. Likewise, output price support systems need to be market friendly, as even small-scale farmers are quite responsive to market-oriented incentives. Extension work and training programs for farmers are perhaps one of the most viable and sustainable means of helping small-scale farmers learn about better inputs and how to interact with agricultural markets. In this regard, incentives such as relief from taxes on product sales to encourage smallholder farmers to join farmers’ organizations can help in dealing with a number of demand- and supply-side constraints, as in the case of Malawi’s exemption of smallholder tobacco farmers affiliated with the National Smallholder Farmers’ Association of Malawi (Chirwa 2009). It is notable that the positive externalities generated from farmers’ membership in smallholder farmers’ organizations may well outstrip any benefits of tax revenues to govern-ment coffers.
Attention must also be directed to proper agricultural policy sequencing—for instance, providing irrigation facilities may be a catalyst for the adoption of new farming methods and the use of inputs that drive up productivity. Therefore, the first emphasis and priority in spending should be on irrigation infrastructure, complemented by other facilities, rural markets, roads, and extension work. Likewise, sustained high levels of investment in R&D must come first, as the outcomes lead to or act as a catalyst for the other goals requiring public attention in the agricultural sector. A significant portion of the funding for these first-stage policy priorities may need to come from national public coffers to avoid the volatility associated with external sources of financial resources.
Although the macroeconomic policy environment and specific policies for the agricultural sector have improved in African countries, much room remains for further policy improvement. The focus of such improvement should be on more pragmatic, market-oriented, and sustainable policies that can be effective in meeting the countries’ efficiency, equity, and food security goals. Public support systems for small commercial farmers need not crowd out private
sector initiatives and input market development. Emphasis must be placed on fiscal policy, with the key concern being efficacy of spending in the agricultural sector. In that regard, policy should focus on increasing spending on R&D, agricultural extension work, and providing irrigation systems and other agricultural infrastructure. These efforts must involve sustained investment to avoid the current volatility in the funding of R&D in African agriculture.
2020 ReSAKSS Annual Trends and Outlook Report 159159 resakss.org
CHAPTER 13
The Enabling Environments for the Digitalization of African Agriculture
Heike Baumüller and Benjamin K. Addom

160 resakss.org
The slow pace of modernization in Africa’s agricultural sector contributes to persistent poverty and deteriorating food security on the continent. To prevent Africa’s food import bill from surging to a predicted US$110
billion by 2025, Africa’s agricultural sector must transform (AGRA 2017). Numerous challenges remain to be addressed. An Intergovernmental Panel on Climate Change report from 2014 identifies Africa as a region that is and will increasingly be profoundly affected by climate change (Niang et al. 2014). This is partly due to African agriculture’s heavy reliance on rainfed systems, which account for approximately 90 percent of crop production across the continent on existing low-producing arable land. In the past five years alone, African countries have faced extreme droughts and floods, prolonged by rising temperatures (WMO 2020), all of which have brought yield losses and hard times for rural families. This already vulnerable food system now faces even greater risk due to the COVID-19 pandemic currently gripping the world, threatening to bring a global food shortage and new hunger crises (Hernandez et al. 2020). In a typical year, postharvest losses are as high as 27 percent, resulting in decreasing productivity within the agricultural system, and access to intraregional and global markets by farmers and traders is often poor (Christiaensen and Demery 2018). These conditions affect Africa’s economic potential to absorb its un- and underemployed population, some 60 percent of whom are youth (Ighobor 2013), and better integrate women into higher levels of the value chain.
At the same time, however, digitalization is effecting change and driving development across all sectors, including agriculture. Digitalization is reducing barriers, facilitating collaboration, and generating opportunities for inclusion, thereby contributing to the achievement of the United Nations Sustainable Development Goals. Within the agricultural sector, digitalization is viewed as a game changer in building climate resilience for farmers because it has the potential to boost productivity and profitability along the value chain, improve access to financing, and address social inclusion gaps for youth and women. To fulfil the potential of digitalization, an enabling environment is required that allows suitable digital solutions to emerge and to be adopted effectively as part of a broader toolbox of measures that can transform African agrifood systems. This chapter explains the four pillars of digitalization for agriculture (D4Ag) and takes a closer look at two of those pillars that are required to build a strong enabling environment.
What Is Digitalization for Agriculture?D4Ag holds great promise for the transformation of African agriculture, but only if it is carried out holistically—that is, if it is well defined and appropriately deployed as part of broader agricultural and rural development strategies. In other words, digitalization must be understood as an agricultural development tool rather than a technological tool so that its application is problem- rather than technology-driven.
Tsan et al. (2019) define D4Ag as the use of digital technologies, inno-vations, and data to transform business models and practices across the agricultural value chain and address bottlenecks in, among other things, productivity, postharvest handling, market access, finance, and supply chain management so as to achieve greater income for smallholder farmers, improve food and nutrition security, build climate resilience, and expand inclusion of youth and women. The concept of D4Ag can be illustrated through four pillars: (1) digital agricultural innovations, (2) big data and analytics, (3) business development services, and (4) the enabling environment (Figure 13.1). These four pillars can be applied to any agricultural transformation issue or challenge, including climate variability, low productivity and profitability, inaccessibility of financing, and exclusion of social groups, among others. While the chapter focuses on the third and fourth pillars, that is, enabling environments for D4Ag business development and the adoption of D4Ag solutions in Africa, it will also briefly outline the other components to provide context for the chapter.
Pillar 1: Digital agricultural innovations. According to the Global Innovation Index 2017, digital innovation in agriculture has been relatively slow, and leading global digital technology companies have made few inroads into agriculture. These innovations are being championed by “Big Ag” companies, small start-ups, smaller agricultural technology (agtech) companies, govern-ments, mobile network operators, and top agricultural universities. They can be divided into “digital technologies” and “digital solutions and services.” Digital technologies may include infrastructure (cables, masts, wireless routers, etc.) and hardware (mobile phones, sensors, blockchain, drones, etc.) required to operate, offer, and access digital services and solutions (Trendov, Varas, and Zeng 2019). Digital agricultural solutions and services, in contrast, encompass services and products offered to end users with the support of digital technologies (Malabo Montpellier Panel 2019). Tsan et al. (2019) provide a comprehensive analysis of

2020 ReSAKSS Annual Trends and Outlook Report 161
the current state of D4Ag in Africa. They find that the availability of D4Ag solu-tions and services across the continent has skyrocketed, increasing from about 42 solutions in 2012 to more than 390 active solutions as of early 2019. However, overall, the market remains largely untapped, as many services are still small in scale, scattered, and not financially viable. These solutions and services need an enabling environment that will allow agricultural stakeholders to improve
productivity, income, access to financing, supply chain management, and policy- and decision-making.
Pillar 2: Big data and analytics. Big data has been defined as large datasets that can be analyzed computationally to reveal patterns, trends, insights, and associations, especially in relation to human behavior and interactions (McAfee and Brynjolfsson 2012). For smallholder digital agriculture, varied sources of data covering two main areas—quality content and user identity—are key for change. Providing reliable and authentic agricultural content is one of the challenges affecting the perfor-mance of digital agricultural solutions (CTA 2018). The quality of agricultural data is currently being driven by remote sensing tools such as satellites, drones, sensors, the Internet of Things, and other sources of data. However, data on the users of digital agri-cultural solutions—actors along the value chain—has been missing (USAID 2018). Creating digital identities or farm registries for these actors can help solution providers identify their interests, behavior, and history and develop tailored and customized services for them. When varied data sources covering these two components—content and user data—are brought together and
analyzed, the resulting insights can be used to improve the quality of solutions and advice to users. To support smallholder agriculture transformation across the continent, big data and analytics must be increasingly enabled through access to relevant and diverse sources of data that can be used for computational analysis and the development of customized advice to users.
FIGURE 13.1—FRAMEWORK FOR DIGITALIZATION IN AGRICULTURE
Source: Compiled by Benjamin K. Addom.
4. Promote Enabling Environment 1. Digital strategies / infrastructure2. Nondigital—transport, energy, etc.3. Knowledge exchange and networking
D4Ag
3. Facilitate Business Development Services 1. Digital entrepreneurship—incubation, coaching, etc.2. Digital literacy and skills for agriculture3. Business linkages and networks
1. Support Digital Agricultural Innovations 1. Digital agricultural technologies2. Digital agricultural solutions and services3. Identi�cation, development, and promotion of access
2. Enable Big Data and Analytics 1. Reliable content for digital solutions2. Digital identities / farmer registries3. Remote sensing satellites, drones, etc.

162 resakss.org
Big data and analytics are increasingly becoming an alternative approach to ensuring the sustainability of business models for digital solutions and services (Addom 2018). A functional data infrastructure is needed that combines user and content data to provide value for agribusinesses such as input manufac-turers, aggregators, financial institutions, and so on, while allowing them to deliver free or subsidized digital solutions to farmers. For example, financial service providers need to know farmers and the locations of their fields for loan or credit services (Rabobank Foundation 2018). These user databases, when built accurately, can be accessed through digital platforms delivering agricultural advisory services and solutions. Also, index-based insurance services are being provided to farmers based on the historical data of their fields obtained via remote sensing technologies.
Pillar 3: Business development services. For digital solutions to be sustainable, there must be continuous investment either through payments by users or some other form of external funding to support service provision (Lohento and Tossou 2018; GSMA 2019). The limited adoption, use, and scale of digital solutions for agriculture has been reported in Tsan et al. (2019). These solutions have been developed through donor funding, development projects, self-funding, or large or small private sector investors. Entrepreneurs involved in the provision of the services must be prepared to manage service growth and development in a way that ensures sustainability. Since smallholder farmers are generally not willing or able to pay for information services driven by digital innovations, efforts must be made to explore models that encourage other stake-holders such as cooperatives, input dealers, financial institutions, governments, nongovernmental organizations, retail organizations, and commercial farmers to pay for these services. This shift will take place when the value being obtained from these services is enhanced such that third parties other than smallholders will be willing to contribute financially. In addition, there is a need to build the business capacity of service providers, particularly start-ups, through incuba-tion, coaching, business linkages, and networking to prepare them to face future business challenges.
Pillar 4: Enabling environments for digitalization to thrive. The enabling environment includes policies, institutions, infrastructure, support services, and other conditions that create a business setting in which enterprises and business activities can start, develop, and scale (Christy et al. 2009). This environment includes the “rules of the game” that are established to achieve a sustainable
balance between social, economic, and environmental needs. The enabling environment within the context of digital agriculture should therefore embody a set of interrelated conditions that together facilitate the smooth and continuous inclusion of actors within the agricultural ecosystem through strategies, policies, and other enablers of sustainable agricultural development. Ohiomoba (2013) argues that an enabling environment for information and communications technologies (ICTs) in agriculture in African, Caribbean, and Pacific countries is one in which policies and practices as well as infrastructure and general invest-ments are favorable for ICTs to thrive and positively contribute to agricultural improvements.
In the absence of an enabling environment, developing and scaling suitable digital technologies and services for agricultural stakeholders will not be possible; using modern tools to capture and offer quality data and content for the digital solutions will be inadequate; and engaging and deploying innova-tive and viable business models will not suffice to transform agriculture. The enabling environment includes both digital and nondigital factors that support digitalization. The following section describes some of the critical factors that will determine whether and how an enabling environment for digitalization in agriculture will emerge across the continent.
Factors Determining the Enabling Environment for D4Ag Businesses and Adoption Strategies and PoliciesDigital innovations continue to multiply despite the absence of sound sector policies and strategies to guide their development and deployment. While the lack of sector policies may not necessarily be an impediment to the current growth of D4Ag, investment readiness, long-term sustainability, and large-scale adoption of viable solutions may still be an issue. Well-developed national and/or regional digital agricultural policies and strategies may outline procedures for the development of digital platforms, D4Ag infrastructure, implementation of D4Ag projects, the operations of private sector service providers, enforceable or advisory guidelines by governments for users and implementers, and a code of conduct for all actors.
Driven in part by the United Nations Economic Commission for Africa (UNECA) through the National Information and Communication
2020 ReSAKSS Annual Trends and Outlook Report 163
Infrastructure (NICI) framework developed in 2000, African countries across the continent have made significant progress in developing and implementing national ICT policies and strategies (UNECA 2007). While UNECA focused on national ICT policies and plans, national governments identified key priority areas, usually referred to as pillars, including ICTs for agriculture. The World Summits on the Information Society in 2003 and 2005 called for the develop-ment of ICT strategies for all sectors, referred to as e-strategies. Accordingly, several countries have moved from policy formulation to implementation in sectors such as government services, education, health, and agriculture.
Within the agricultural sector, e-strategies are still lacking or not as compre-hensive as they should be. The Technical Centre for Agricultural and Rural Cooperation has been one of the champions of e-agriculture strategies, offering technical support to African, Caribbean, and Pacific countries to develop and implement their sector strategies. The Food and Agriculture Organization of the United Nations and the International Telecommunications Union jointly developed a National e-Agriculture Strategy Guide in 2016 (FAO and ITU 2016). The guide identified three key components in the development of a national e-agriculture strategy: (1) the vision development process, (2) action plan development, and (3) a monitoring and evaluation component. The guide concluded that the development of a national e-agriculture strategy is only the first step toward realizing the transformative potential of ICTs in agriculture. It maintains that the strategy must be implemented to realize the transformative power of the technologies, and, most importantly, the strategy must be reviewed periodically to ensure that it keeps up with changing demands, emerging goals, and new technologies.
These early sector strategies and policies make little or no mention of emerging digital technologies such as big data and analytics, blockchain, the Internet of Things, robotics, machine learning, artificial intelligence, drones, satellite data, and their implications for agricultural development. In light of the fast-changing landscape of digital technologies and services, these sector strate-gies, most of which were developed in the mid- to late 2000s, need continuous updating to meet the demands of the sector. An example of such an update can be seen in Rwanda, where NICI I, developed in 2000, was updated to NICI II in 2006 and NICI III in 2010 to keep pace with the developments within the sector.
1 The data are available at https://researchictafrica.net/data/after-access-surveys/.
At the same time, the country’s ICT Sector Strategic Plan (2013–2018) has been expanded into the National ICT4RAg Strategy (2016–2020). This strategy is intended to serve as guide to ensure appropriate use of digital solutions, data, and business development services to benefit Rwanda’s citizens.
Policy recommendation: Strong foundations have been laid by regional and national bodies. To keep up with changing demands, emerging goals, and new technologies, individual countries must endeavor to continuously review their strategies to address current issues and innovations within the sector. The example of Rwanda should be emulated. In addition to the currently widespread mobile-phone-enabled solutions, focus must also be placed on policies to monitor and regulate the deployment of emerging digital technologies that, in the longer term, have the potential to transform smallholder agriculture across the continent.
Literacy and SkillsDigital literacy and skills are needed for the development, adoption, use, and scaling up of digital solutions in agriculture (Trendov, Varas, and Zeng 2019). The ability of agricultural stakeholders to access, manage, understand, inte-grate, communicate, evaluate, and create information safely and appropriately through digital technologies is paramount. Conversely, the absence of digital literacy and skills stands in the way of effective implementation of these new technologies. Limited knowledge and skills in using ICTs by farmers contribute to the challenges in adoption (Abdullah 2015; Mulauzi and Albright 2008). In the short term, the skills to use mobile phones in particular will need to be strengthened, since the Internet and digital agricultural services are primarily accessed through these devices (Gillwald and Mothobi 2018; Tsan et al. 2019). In the medium to long term, skills to take advantage of more advanced emerging digital technologies will also be needed.
Information about the digital literacy of D4Ag target users in Africa is limited. Data from the Research ICT Africa (RIA) Beyond Access survey in 2017/20181 show that a lack of conventional literacy, that is, whether someone is able to read or write, is not necessarily an obstacle to mobile phone owner-ship. Survey data from a number of African countries show that illiterate users make up a sizable share of mobile phone owners, including both those who

164 resakss.org
obtain income from agricultural activities and those who do not (Figure 13.2). The data also show, however, that levels of illiteracy are clearly higher among those who do not own mobile phones, although the direction of causality is difficult to establish. Only about a third of the small number of smartphone users responding to the survey in Ghana and Nigeria had ever installed an application on their phone, compared to 44 percent in Senegal, 51 percent in Kenya, and just 12 percent in Rwanda. These shares gener-ally decrease with an increasing reliance on agriculture as an income source.
Feder, Richard, and Zilberman (1985) found that educated farmers tend to be early adopters of technology and apply the associated inputs more effectively. For digital technology users such as smallholder farmers, researchers, traders, extension agents, policymakers, and so on, information and data literacy are key. A systemic literature review carried out by Heideveld (2019) on digitalization and agriculture found that use of ICTs is dependent on the literacy of the people. Skills for managing data—browsing, searching, filtering, assessing, and evaluating data, information, and digital content—are paramount. Additionally, skills in digital communication and collaboration, such as interacting with others, sharing content, and managing digital identity, are critical. Going beyond the basics, users must be able to use digital technologies and tools to solve social,
FIGURE 13.2—LITERACY LEVELS AMONG MOBILE PHONE OWNERS AND NON-OWNERS, BY DEPENDENCE ON AGRICULTURE
Data source: RIA Beyond Access survey 2017/2018.Note: The graph shows mobile phone owners or non-owners who cannot read a letter or newspaper as a share of all respondents and by the share of agriculture as an income source.
0% 10% 20% 30% 40% 50% 60% 70% 80% 90% 100%
phone
no phone
phone
no phone
phone
no phone
phone
no phone
phone
no phone
phone
no phone
phone
no phone
phone
no phone
Gha
naKe
nya
Moz
ambi
que
Nig
eria
Rwan
daSe
nega
lTa
nzan
iaU
gand
a
Illiterate - no agr. income Illiterate - agr. income Literate - no agr. income Literate - agr. income

2020 ReSAKSS Annual Trends and Outlook Report 165
developmental, and technical problems. Taken together, all these are skills that allow users to creatively solve issues. Also critical are knowledge and skills to ensure digital safety, such as by protecting devices, personal data and privacy, and health and well-being.
For smallholder farmers and traders specifically, there is a need to identify regular operations that require digital literacy and skills to perform, including simple tasks such as turning a device on and off and charging it; sending and receiving text messages; setting or changing an app language; sharing location data or images of field situations; creating a public profile; searching for, choosing, downloading, and approving the privacy policy of an app; performing intra-app financial transactions; searching for goods and services and comparing price information; interacting with buyers and sellers; and topping up accounts through agents, among many others. In addition, reaching small-holder farmers may require engaging intermediaries such as extension agents, agrodealers, or community leaders to assist them in using digital solutions. Young people can also play an important role as intermediaries by assisting their family and other community members in accessing digital agricultural services.
For digital agricultural solution and platform developers, literacy in the areas of technical programming, content creation and integration, copyright and licenses, and so on, is key. The success of a given platform also depends on the business skills of the team. Hence, platform developers must have team members who are able to develop a business model or case around the products for deployment. Building these skills will require reform of many African countries’ formal education and training systems by introducing digital skills from primary through tertiary education. Outside formal educational systems, on-the-job digital training can help “digital migrants” cope with the changing professional system.
Policy recommendation: Digital inclusion depends on digital literacy and skills, and literacy is an important consideration in a broader definition of access. African countries need to integrate digital education into the curricula of schools, universities, and vocational training institutes and improve regular on-the-job training of users to support rapid adoption and effective use of digital technologies and solutions. Care must be taken to ensure that the resulting digital skills are in line with the demand of the labor market and can help entre-preneurs grow their businesses.
Knowledge Exchange and NetworkingKnowledge exchange and networking are critical factors in providing an enabling environment for D4Ag to thrive, as they form the basis for exchange of information on the other three pillars of D4Ag. Agricultural stakeholders, including those in the D4Ag domain, need to be kept up to date on changes within the sector. This can only be done through knowledge exchange and networking. The current state of D4Ag in Africa is marked by weak mechanisms for managing digital innovations, unreliable data and knowledge products, lack of business linkages and knowledge flows, and limited sectoral coordination, resulting in missed opportunities for collaboration and leading to duplication of effort (Tsan et al. 2019).
The D4Ag sector needs robust knowledge products and services that inform the various actors within the ecosystem, such as a “knowledge and innovation hub” that liaises between all players. The hub should act as an honest knowledge broker to facilitate knowledge sharing and networking among stakeholders. This can be achieved through consistent data gathering, curation, validation, and sharing. A comprehensive database that pulls datasets from varied partners and sources, such as donors, implementers, enterprises, researchers, farmers, etc., and can analyze them computationally to derive added value for all the contributing partners. The outcome will be regular access to quality processed knowledge products such as reports, discussion papers, technical briefs, and policy pointers that provide the sector with trends, insights, and challenges for relevant actors to act on. Knowledge exchange must be based on data—data management systems that provide evidence, market intelligence, and impact for better decision-making.
Networking is key to partnership building, which facilitates access to data, funding, and other opportunities across the entire value chain of stakeholders. Lack of linkages and knowledge flows limits sector coordination, resulting in duplication of effort. Strong and functional global, regional, and national communities of practice form a solid foundation for networking among agri-cultural stakeholders. Face-to-face conferences, expert workshops, webinars, and other in-person or digital meetups provide a good platform for networking. Networking and cross-country learning through South-South and North-South collaboration provide solid ground for expansion of D4Ag. Thematic e-discussions, funding news, global alerts, and referral programs help bring together fragmented initiatives.

166 resakss.org
Networking platforms—whether virtual or face-to-face—can provide coor-dination mechanisms for stakeholders in the ecosystem to ensure efficient use of scarce resources. These platforms connect entrepreneurs to investors, users to developers, smallholder farmers to commercial farmers, small enterprises to big technology companies, and researchers to policymakers, among other linkages. They ensure experience sharing among actors. Through networking, cutting-edge innovations from developed countries can be shared and adapted for use by smallholder farmers and other stakeholders. Focused networks can be built to identify, test, and monitor emerging technologies in partnership with technical experts from across the globe.
Policy recommendation: The digital agricultural knowledge space is characterized by duplication of scattered knowledge products and resources. This situation does not support quality knowledge sharing among agricultural stake-holders. Thus, the sector should explore and embrace a centralized “knowledge and innovation hub” that liaises between all players. The hub should act as an honest knowledge broker to facilitate knowledge sharing and networking among stakeholders. The hub can also support data gathering, curation, validation, and sharing through a comprehensive database that pulls and analyzes datasets from varied partners and sources.
Infrastructure Provision and Access Infrastructure investments are a prerequisite for both the provision of and access to D4Ag services. The presence of mobile network coverage is not sufficient in this regard, however. Equally important are quality and affordability as well as equitable access. While progress has been made with regard to network coverage and physical infrastructure, shortcomings related to the other aspects are still hindering effective use of digital infrastructure and consequently the ability to offer digital services to agriculture actors—smallholders in particular.
The cable infrastructure in Africa has improved in recent years. International connectivity through undersea cables has expanded significantly.2 The area and population connected by fiber-optic cables is also growing.3 By 2019, 584 million people (or 55 percent of the population of Africa south of the Sahara) lived within a 25-kilometer range of an operational fiber-optic network node, compared to 259 million in 2010 (Hamilton Research 2019). However, major gaps in the
2 See www.submarinecablemap.com. 3 See https://afterfibre.nsrc.org.
terrestrial infrastructure remain. As a result, international connectivity is not necessarily used at full capacity. In Nigeria, for instance, it is estimated that less than 10 percent of sea cable capacity is actually used (Eleanya 2019).
One of the main challenges today is covering the “last mile” to allow end users to cost-effectively access mobile networks and the Internet. Addressing this gap is partly a question of infrastructure, including innovative solutions such as wireless networks or WiBACK. In addition, even where there is broadband coverage, people do not necessarily use the Internet because they do not know what the Internet is or how to use it, or do not have access to the necessary devices (Gillwald and Mothobi 2018). While 60 percent of the population south of the Sahara is covered by broadband, and therefore could use it in theory, only around one-third of people are actually using the Internet (GSMA 2018).
Beyond the extent of mobile networks, other important factors that deter-mine the utility of mobile infrastructure are the speed of the connection, the cost of using mobile services, and social norms that affect access to mobile handsets or the Internet. In terms of speed, Africa has the worst fixed broadband perfor-mance in the world, though its mobile broadband performance is comparable to that of South America and Asia (McKetta 2019).
The cost of handsets has dropped significantly in recent years as compa-nies increasingly develop cheaper phones targeted at lower-income users. Government policies have also contributed to this cost reduction in some coun-tries. In Kenya, for instance, the government lowered taxes on handsets to reduce costs (Schumann and Kende 2013). The cost of mobile use has also dropped, including mobile cellular and mobile broadband (Table 13.1), although costs differ widely among countries. Despite the decrease, a survey in seven African countries showed that among Internet users, 36 percent cited high costs as the main barrier to using the Internet (Gillwald and Mothobi 2018). Interestingly, only 15 percent of Internet users cited speed as a main barrier, though this could be because almost two-thirds of Internet users are located in urban areas.
Importantly for the provision of D4Ag services, rural-urban divides persist across Africa. Fiber-optic cables are usually better developed in urban areas because urban markets are more lucrative for mobile network operators. The quality of mobile networks is comparably worse in rural areas, which suffer from slower speeds and weaker connections. People often have several SIM cards
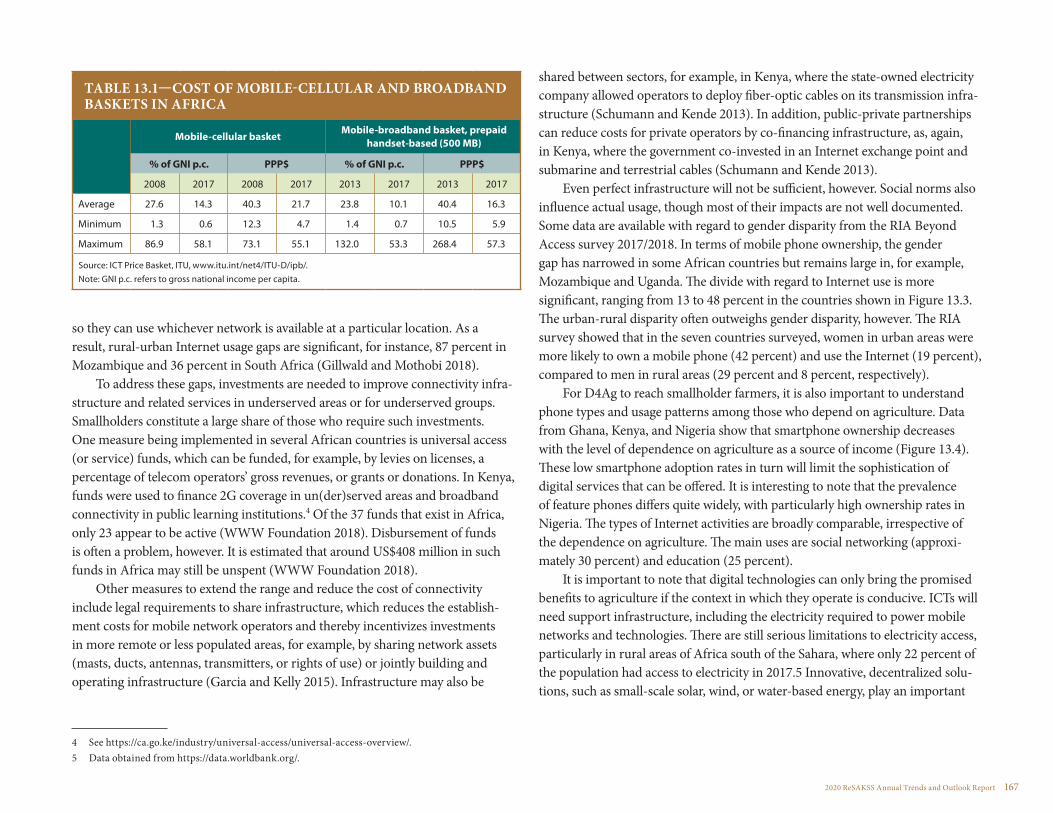
2020 ReSAKSS Annual Trends and Outlook Report 167
so they can use whichever network is available at a particular location. As a result, rural-urban Internet usage gaps are significant, for instance, 87 percent in Mozambique and 36 percent in South Africa (Gillwald and Mothobi 2018).
To address these gaps, investments are needed to improve connectivity infra-structure and related services in underserved areas or for underserved groups. Smallholders constitute a large share of those who require such investments. One measure being implemented in several African countries is universal access (or service) funds, which can be funded, for example, by levies on licenses, a percentage of telecom operators’ gross revenues, or grants or donations. In Kenya, funds were used to finance 2G coverage in un(der)served areas and broadband connectivity in public learning institutions.4 Of the 37 funds that exist in Africa, only 23 appear to be active (WWW Foundation 2018). Disbursement of funds is often a problem, however. It is estimated that around US$408 million in such funds in Africa may still be unspent (WWW Foundation 2018).
Other measures to extend the range and reduce the cost of connectivity include legal requirements to share infrastructure, which reduces the establish-ment costs for mobile network operators and thereby incentivizes investments in more remote or less populated areas, for example, by sharing network assets (masts, ducts, antennas, transmitters, or rights of use) or jointly building and operating infrastructure (Garcia and Kelly 2015). Infrastructure may also be
4 See https://ca.go.ke/industry/universal-access/universal-access-overview/.5 Data obtained from https://data.worldbank.org/.
shared between sectors, for example, in Kenya, where the state-owned electricity company allowed operators to deploy fiber-optic cables on its transmission infra-structure (Schumann and Kende 2013). In addition, public-private partnerships can reduce costs for private operators by co-financing infrastructure, as, again, in Kenya, where the government co-invested in an Internet exchange point and submarine and terrestrial cables (Schumann and Kende 2013).
Even perfect infrastructure will not be sufficient, however. Social norms also influence actual usage, though most of their impacts are not well documented. Some data are available with regard to gender disparity from the RIA Beyond Access survey 2017/2018. In terms of mobile phone ownership, the gender gap has narrowed in some African countries but remains large in, for example, Mozambique and Uganda. The divide with regard to Internet use is more significant, ranging from 13 to 48 percent in the countries shown in Figure 13.3. The urban-rural disparity often outweighs gender disparity, however. The RIA survey showed that in the seven countries surveyed, women in urban areas were more likely to own a mobile phone (42 percent) and use the Internet (19 percent), compared to men in rural areas (29 percent and 8 percent, respectively).
For D4Ag to reach smallholder farmers, it is also important to understand phone types and usage patterns among those who depend on agriculture. Data from Ghana, Kenya, and Nigeria show that smartphone ownership decreases with the level of dependence on agriculture as a source of income (Figure 13.4). These low smartphone adoption rates in turn will limit the sophistication of digital services that can be offered. It is interesting to note that the prevalence of feature phones differs quite widely, with particularly high ownership rates in Nigeria. The types of Internet activities are broadly comparable, irrespective of the dependence on agriculture. The main uses are social networking (approxi-mately 30 percent) and education (25 percent).
It is important to note that digital technologies can only bring the promised benefits to agriculture if the context in which they operate is conducive. ICTs will need support infrastructure, including the electricity required to power mobile networks and technologies. There are still serious limitations to electricity access, particularly in rural areas of Africa south of the Sahara, where only 22 percent of the population had access to electricity in 2017.5 Innovative, decentralized solu-tions, such as small-scale solar, wind, or water-based energy, play an important
TABLE 13.1—COST OF MOBILE-CELLULAR AND BROADBAND BASKETS IN AFRICA
Mobile-cellular basketMobile-broadband basket, prepaid
handset-based (500 MB)
% of GNI p.c. PPP$ % of GNI p.c. PPP$
2008 2017 2008 2017 2013 2017 2013 2017
Average 27.6 14.3 40.3 21.7 23.8 10.1 40.4 16.3
Minimum 1.3 0.6 12.3 4.7 1.4 0.7 10.5 5.9
Maximum 86.9 58.1 73.1 55.1 132.0 53.3 268.4 57.3
Source: ICT Price Basket, ITU, www.itu.int/net4/ITU-D/ipb/. Note: GNI p.c. refers to gross national income per capita.
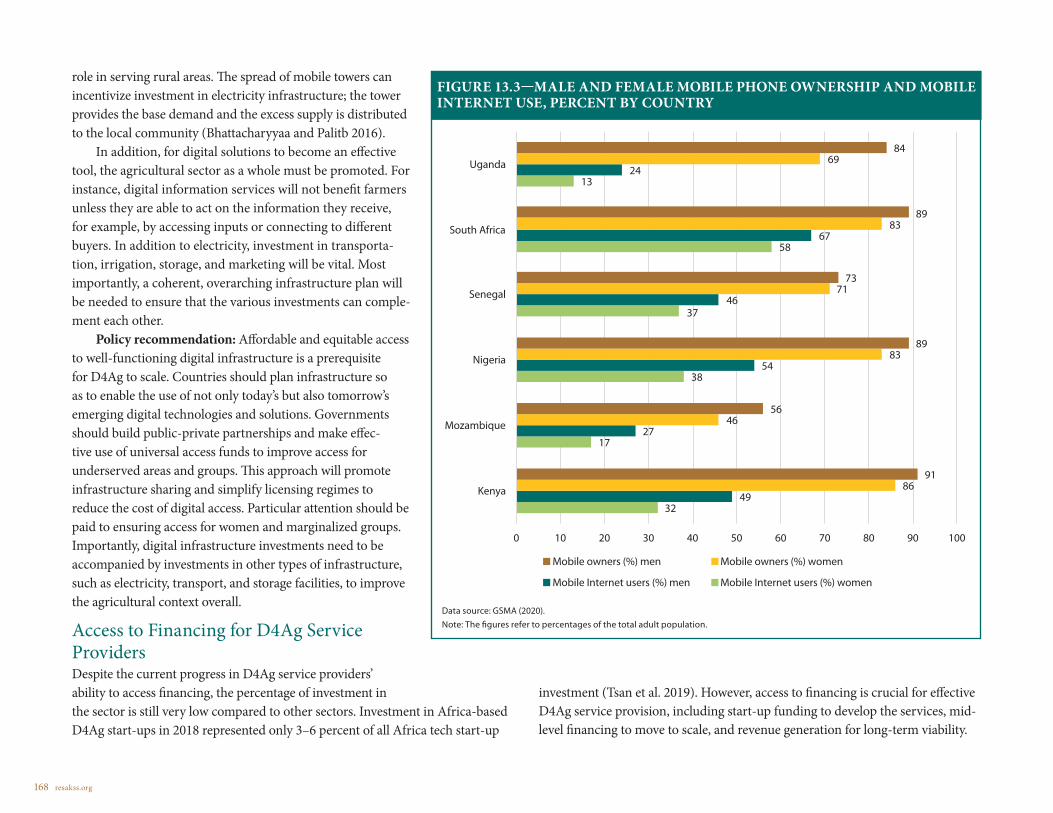
168 resakss.org
role in serving rural areas. The spread of mobile towers can incentivize investment in electricity infrastructure; the tower provides the base demand and the excess supply is distributed to the local community (Bhattacharyyaa and Palitb 2016).
In addition, for digital solutions to become an effective tool, the agricultural sector as a whole must be promoted. For instance, digital information services will not benefit farmers unless they are able to act on the information they receive, for example, by accessing inputs or connecting to different buyers. In addition to electricity, investment in transporta-tion, irrigation, storage, and marketing will be vital. Most importantly, a coherent, overarching infrastructure plan will be needed to ensure that the various investments can comple-ment each other.
Policy recommendation: Affordable and equitable access to well-functioning digital infrastructure is a prerequisite for D4Ag to scale. Countries should plan infrastructure so as to enable the use of not only today’s but also tomorrow’s emerging digital technologies and solutions. Governments should build public-private partnerships and make effec-tive use of universal access funds to improve access for underserved areas and groups. This approach will promote infrastructure sharing and simplify licensing regimes to reduce the cost of digital access. Particular attention should be paid to ensuring access for women and marginalized groups. Importantly, digital infrastructure investments need to be accompanied by investments in other types of infrastructure, such as electricity, transport, and storage facilities, to improve the agricultural context overall.
Access to Financing for D4Ag Service ProvidersDespite the current progress in D4Ag service providers’ ability to access financing, the percentage of investment in the sector is still very low compared to other sectors. Investment in Africa-based D4Ag start-ups in 2018 represented only 3–6 percent of all Africa tech start-up
investment (Tsan et al. 2019). However, access to financing is crucial for effective D4Ag service provision, including start-up funding to develop the services, mid-level financing to move to scale, and revenue generation for long-term viability.
Data source: GSMA (2020). Note: The figures refer to percentages of the total adult population.
FIGURE 13.3—MALE AND FEMALE MOBILE PHONE OWNERSHIP AND MOBILE INTERNET USE, PERCENT BY COUNTRY
32
17
38
37
58
13
49
27
54
46
67
24
86
46
83
71
83
69
91
56
89
73
89
84
0 10 20 30 40 50 60 70 80 90 100
Kenya
Mozambique
Nigeria
Senegal
South Africa
Uganda
Mobile owners (%) men Mobile owners (%) women
Mobile Internet users (%) men Mobile Internet users (%) women

2020 ReSAKSS Annual Trends and Outlook Report 169
Opportunities to access financing exist in Africa for local start-ups, such as through angel investors who invest comparatively small sums and are willing to take risk. Additional financing can be obtained through competitions such as Pivot East, the largest event in East Africa for start-ups to pitch ideas for digital services and win seed funding.6 At the other end of the scale, larger-scale invest-ments are being made through corporations. For example, the German software company SAP is investing in the development of supply chain management
6 See https://pivoteast.co.ke/.7 See https://hellofuture.orange.com/en/innovative-services-that-are-supporting-agriculture-in-africa/.8 See www.safaricom.co.ke/business/digifarm/what-is-digifarm/digifarm.
software to coordinate sourcing from small-holders, and the mobile network operators Orange7 and Safaricom8 are setting up platforms that offer multiple services for different actors in the agricultural sector. However, what is often lacking is mid-level financing to help start-ups scale and develop into fully fledged businesses that can compete with the large players.
In the longer term, start-ups need business models that make them financially sustainable. Tsan et al. (2019) estimate that 70 percent of the 390 active D4Ag service providers in Africa generate some revenue, and 80 percent of those revenue-generating enterprises maintain several revenue streams. Financial viability is still rare, but it is improving. Among 175 surveyed enterprises, just 26 percent report that they are breaking even. The annual revenue generated per farmer amounted on average to €5 for advisory services, €25 for market linkages, and €4 for digital financial service intermediaries and supply chain management solutions. Some companies are able to achieve 30–40 percent gross margins. The availability of digital payment systems has also helped greatly in generating financial returns from digital services, for example, through online
banking or mobile payments. This is also one of the reasons why such services have expanded rapidly in Kenya. The mobile money transfer service M-Pesa is widespread even in rural areas and allows service providers to include financial transactions in their services.
A focus on farmers as the target beneficiaries will make it difficult to generate significant revenue unless they can be reached at a very large scale. Alternative
FIGURE 13.4—TYPE OF MOBILE PHONE OWNED, BY DEPENDENCE ON AGRICULTURE
Data source: RIA Beyond Access survey 2017/2018.
0% 10% 20% 30% 40% 50% 60% 70% 80% 90% 100%
No agric. income
Agr. income <25%
Agr. income >25%
No agric. income
Agr. income <25%
Agr. income >25%
No agric. income
Agr. income <25%
Agr. income >25%
Keny
aG
hana
Nig
eria
Basic Feature Smartphone

170 resakss.org
models include cross-subsidizing lower-income customers with premium services sold to higher-income customers or targeting wealthier actors higher up in the value chain with spillover effects to benefit farmers. In addition, where digital services are part of larger operations, the main economic rationale may no longer be income generation from the service, but rather other gains, for instance, the introduction of digital supply chain management tools to reduce transaction costs, increase efficiency of business operations, and ensure the reli-ability of high-quality supply.
Policy recommendation: Considering the enormous potential of digita-lization for the agricultural sector, a coordinated approach to financing and investment is recommended. National governments need to coordinate with donors, foundations, and private sector investors on phased investment in the sector. Donors and foundations should absorb the risks associated with the development and pilot testing of the technologies and services, while national governments provide the necessary investment incentives. The private sector will then build upon the tested innovations to scale them for commercial purposes, with the possibility of subsidizing the services for underserved communities.
Business Ecosystem for D4Ag Service ProvidersCreating an enabling business climate for entrepreneurs is a key condition for success. Skills for digital service providers and users; access to financing; and well-functioning, affordable infrastructure were already discussed above. Other elements of the ecosystem include innovation hubs, networks, and a conducive business environment. These elements are not unique to agriculture but are required for any business sector to emerge and grow. However, an “agriculture lens” is needed when designing related business support policies to ensure that rural areas are not neglected and that the differing financial, educational, and technological capacities of smallholder are taken into account.
Innovation hubs. Innovation hubs can provide a space for networking and mentoring, an entry point for investors, and deployment of publicly accessible small-scale workshops offering digital fabrication. The Kenyan iHub was among the main drivers of the establishment of such hubs across Africa. In 2019 there were 618 active tech hubs, with Nigeria and South Africa having particularly high
9 A regularly updated map of innovation hubs is available here: https://africahubs.crowdmap.com/.
concentrations (Giuliani and Ajadi 2019).9 Lagos, Nigeria; Cape Town, South Africa; and Nairobi, Kenya, are among the cities that host the most hubs. More than 50 percent of all hubs involve public or corporate partnerships, including with mobile network operators such as MTN, Orange, or Vodafone, as well as IT companies such as Nokia or Microsoft (Giuliani and Ajadi 2019). This applies to simple hubs as well as accelerators that actively assist promising start-ups.
Networks. Interconnection of the main actors in start-up ecosystems plays an important role in the development of local ecosystems that can support start-ups as they grow. This interconnection should also extend beyond African borders. Reinforcing cooperation between Africa and industrialized countries on mutually beneficial terms can help build bridges between start-ups in different parts of the world and therefore boost the emergence of joint projects; facilitate access to venture capital; and increase talent recruitment, creativity, and financing opportunities.
A conducive business environment. A conducive business environment includes legal predictability, positive fiscal policies providing incentives, and low levels of corruption. Figure 13.5 shows how selected countries are performing in terms of their ICT-related enabling environment for rural agriculture in relation to mobile connectivity. While it is not possible to establish causality between the two indicators, they show a positive and significant correlation (r = 0.7), high-lighting the importance of a strong regulatory regime for technology adoption (Kayumova 2017).
Policy recommendation: A strong enabling environment, created through conducive regulations and investments, is critical to every business. Any measures to strengthen the private sector should pay particular attention to young start-ups, to enable them to scale proof-of-concept D4Ag solutions by providing them with a business environment that safeguards their investments. In addition, any enabling measures must be assessed—and, when necessary, amended—with a D4Ag lens to ensure that rural areas are well served through infrastructure and services, that innovation hubs offer mentoring and support for agriculture-related digital solutions, and that developers have access to innova-tive financial mechanisms in order to reach low-income customers, including smallholders.

2020 ReSAKSS Annual Trends and Outlook Report 171
Data, Content, and Access RightsAt the continental level, efforts have been underway to harmonize and unify the system of data protection legislation. In 2014, the African Union (AU) adopted the African Union Convention on Cyber Security and Personal Data Protection,10 which addresses the need for data harmonization among member countries of the AU, and mechanisms for each country to handle violations of data privacy (Box 13.1). As of July 2020, only 8 out of the required 15 countries had ratified the convention (Angola, Ghana, Guinea, Mozambique, Mauritius, Namibia, Rwanda, and Senegal). According to Articles 11 and 12 of the convention, enforcement of legislation in indi-vidual countries would be undertaken through a national personal data protection authority (DPA), which would be responsible for informing the country’s citizens of their rights and obligations with respect to data protection. The DPA would also ensure that the processing of personal data is consistent with the provisions of the convention.
A review of data protection legislation in 54 African countries by Chichaibelu, Matschuk, and Baumüller (forthcoming) found that among the 48 countries for which information was available, 27 have adopted data privacy legislation, 10 have included related revisions in other types of legisla-tion, and 6 have drafts of legislation. Among the 27 countries with legislation, all except Nigeria, which has sector-specific agencies that manage data protection regulations, mention the establishment of a DPA under their data protection legislation. Of these 27 countries, 18 have the DPAs already established and operational, and 4 do not (for the remaining 5 the status is unknown). Among the countries in
10 Available at https://au.int/en/treaties/african-union-convention-cyber-security-and-personal-data-protection.
which DPAs have been set up, Mauritius and Morocco are reported to have well-established DPA programs (Rich 2017). Evidence of enforcement is also seen in Benin, Ghana, Mali, Senegal, and Tunisia (Rich 2017).
Part of the reason for the AU’s push for harmonization between data protection policies in Africa is to ensure ease in data transfer between African
FIGURE 13.5—CLUSTERING OF COUNTRIES ACCORDING TO THEIR EBA ICT AND MCI INDEX SCORES
Source: Malabo Montpellier Panel (2019). Note: The Enabling the Business of Agriculture (EBA) ICT Index measures to what extent laws, regulations, and policies relating to information and communications technology (ICT) promote an enabling environment for agriculture. The GSMA Mobile Connectivity Index (MCI) measures the key enablers of mobile Internet adoption, including infrastructure, affordability, consumer readiness, and content and services.
MaliBurundi
EthiopiaSudan
Niger
Burkina FasoMalawi
Egypt
Rwanda
CameroonZimbabwe
UgandaSenegal
Mozambique
TanzaniaBenin
Liberia Zambia
Morocco
Ghana
Côte d'IvoireNigeria
Kenya
0
10
20
30
40
50
60
70
0 1 2 3 4 5 6 7 8
MCI
inde
x sc
ore
Stre
ngth
of m
obile
inte
rnet
EBA index score / Regulatory framework
Low EBA & low MCI Low EBA & high MCI High EBA & low MCI High EBA & high MCI
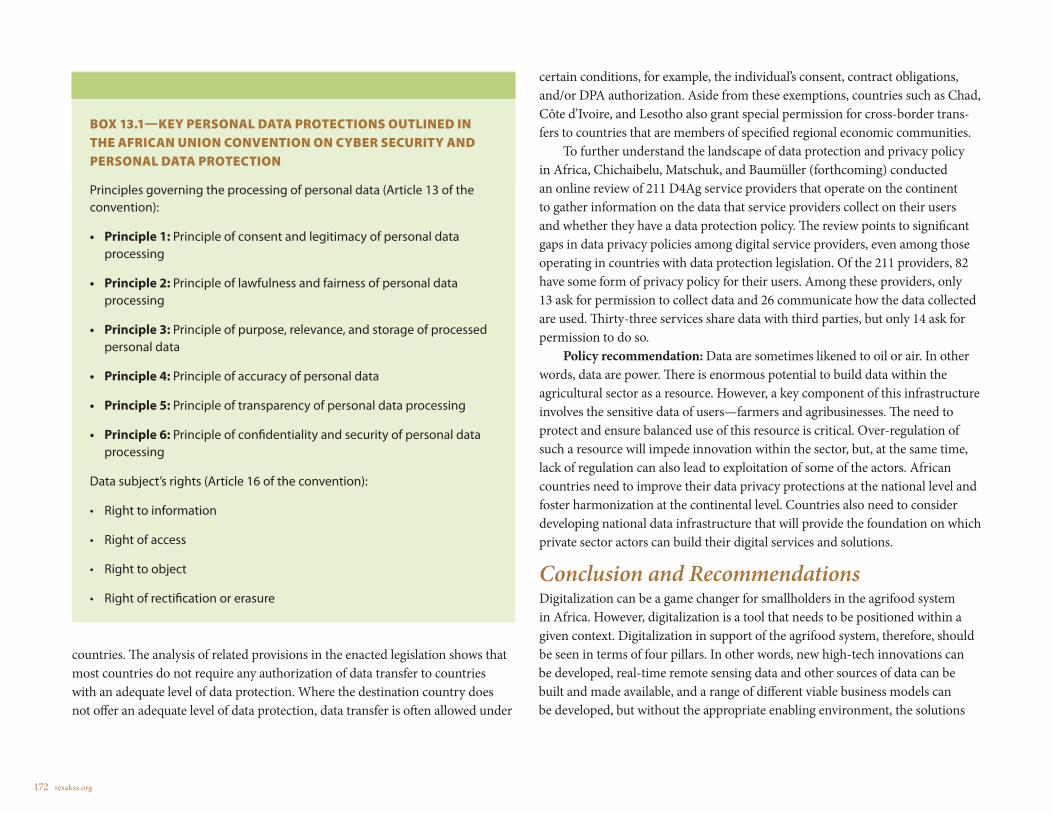
172 resakss.org
countries. The analysis of related provisions in the enacted legislation shows that most countries do not require any authorization of data transfer to countries with an adequate level of data protection. Where the destination country does not offer an adequate level of data protection, data transfer is often allowed under
certain conditions, for example, the individual’s consent, contract obligations, and/or DPA authorization. Aside from these exemptions, countries such as Chad, Côte d’Ivoire, and Lesotho also grant special permission for cross-border trans-fers to countries that are members of specified regional economic communities.
To further understand the landscape of data protection and privacy policy in Africa, Chichaibelu, Matschuk, and Baumüller (forthcoming) conducted an online review of 211 D4Ag service providers that operate on the continent to gather information on the data that service providers collect on their users and whether they have a data protection policy. The review points to significant gaps in data privacy policies among digital service providers, even among those operating in countries with data protection legislation. Of the 211 providers, 82 have some form of privacy policy for their users. Among these providers, only 13 ask for permission to collect data and 26 communicate how the data collected are used. Thirty-three services share data with third parties, but only 14 ask for permission to do so.
Policy recommendation: Data are sometimes likened to oil or air. In other words, data are power. There is enormous potential to build data within the agricultural sector as a resource. However, a key component of this infrastructure involves the sensitive data of users—farmers and agribusinesses. The need to protect and ensure balanced use of this resource is critical. Over-regulation of such a resource will impede innovation within the sector, but, at the same time, lack of regulation can also lead to exploitation of some of the actors. African countries need to improve their data privacy protections at the national level and foster harmonization at the continental level. Countries also need to consider developing national data infrastructure that will provide the foundation on which private sector actors can build their digital services and solutions.
Conclusion and Recommendations Digitalization can be a game changer for smallholders in the agrifood system in Africa. However, digitalization is a tool that needs to be positioned within a given context. Digitalization in support of the agrifood system, therefore, should be seen in terms of four pillars. In other words, new high-tech innovations can be developed, real-time remote sensing data and other sources of data can be built and made available, and a range of different viable business models can be developed, but without the appropriate enabling environment, the solutions
BOX 13.1 —KEY PERSONAL DATA PROTECTIONS OUTLINED IN THE AFRICAN UNION CONVENTION ON CYBER SECURITY AND PERSONAL DATA PROTECTION
Principles governing the processing of personal data (Article 13 of the convention):
• Principle 1: Principle of consent and legitimacy of personal data processing
• Principle 2: Principle of lawfulness and fairness of personal data processing
• Principle 3: Principle of purpose, relevance, and storage of processed personal data
• Principle 4: Principle of accuracy of personal data
• Principle 5: Principle of transparency of personal data processing
• Principle 6: Principle of confidentiality and security of personal data processing
Data subject’s rights (Article 16 of the convention):
• Right to information
• Right of access
• Right to object
• Right of rectification or erasure
2020 ReSAKSS Annual Trends and Outlook Report 173
and services will be short-lived. To be able to realize the transformational power of digitalization in African agriculture, all these interrelated conditions for an enabling environment must be fully embraced. However, the interplay between these conditions may differ from one geographic context to another at the national level, depending on the existing investments that have been made in these factors over the years.
Bearing in mind these national specificities, a number of priority steps need to be taken. First, at the continental level, decision-makers must reassess existing ICTs and agricultural policies and strategies and make efforts to continuously upgrade the digital space by considering new developments such as data to meet the demands of the agricultural sector. This should be done alongside the private sector, multinational development banks, and foundations and donors to upgrade the current infrastructure—both digital (connectivity, broadband, etc.) and nondigital (transport, energy, storage, etc.)—with the goal to provide easy and affordable services to rural communities. Second, with policies and infrastructure in place, the AU should embrace and promote phased financing of digitalization to ensure that innovations are de-risked through donor investments to support the long-term involvement of the private sector for sustainability. Third, a conducive business ecosystem, including a single continental market for goods and services, with free movement of persons and investments, must be ensured. Finally, continuous investment in capacity building, for digital literacy and skills as well as coordinated knowledge generation and exchange, will help support the sharing of best practices and the development of platforms for monitoring and ensuring the accountability of these investments, especially to the ultimate beneficiaries.
With visionary leadership at the continental level, transparent partnerships with multilateral institutions, and strong commitment at the national level, the collective impact of digitalization on African agriculture should not be a mirage but reality.
174 resakss.org
CHAPTER 14
The Political Economy of Agricultural Policy in Africa: Implications for Agrifood System Transformation
Danielle Resnick1
1 This chapter was written with support from the CGIAR Research Program on Policies, Institutions, and Markets (PIM), led by the International Food Policy Research Institute (IFPRI).

2020 ReSAKSS Annual Trends and Outlook Report 175
Inclusive and sustainable agrifood system transformation refers to shifting from subsistence agriculture to higher-value-added food production that generates larger incomes and decent jobs while also contributing to
healthier diets within planetary boundaries. This goal is increasingly the focus of many international initiatives and global reports (HLPE 2019; Searchinger et al. 2018; EAT-Lancet Commission 2019). Yet the political economy of facilitating such an ambitious transformation is rarely examined, even though it is often fundamental to determining when and why the policies needed for such a transformation are possible. Convincing governments to prioritize sustainable food systems over other pressing needs requires grappling with three fundamental issues central to political economy: reconciling competing interests and incentives, overcoming ideational biases, and identifying how institutions can reinforce commitments or stymie change.
Interests, ideas, and institutions are building blocks of political economy. In the interest-based approach, actors derive their preferences based on maximizing their utility, for either profits, income, votes, job security, prestige, or other private objectives. The ideational view emphasizes that preferences often rely on intersubjective understandings about how the world works that derive from historical experience, cultural norms, societal expectations, and even familial upbringing. Concepts such as food self-sufficiency or resistance to genetically modified organisms can be molded by the ideological lens through which one views the world and trusts science. Institutions mediate and structure how these interest-based or ideational preferences affect policy outcomes. Among others, such institutions can encompass formal organizations (such as the World Trade Organization, marketing boards, and food reserve agencies), regulations, laws, and conventions (such as the Cartagena Protocol on Biosafety, Codex Alimentarius, and Trade-Related Aspects of Intellectual Property Rights agree-ment), exchange rate regimes (such as the CFA franc in West Africa), land tenure systems, political institutions (legislative and electoral systems), and many others.
The intent of this chapter is, first, to review how these components of polit-ical economy analysis have affected past agricultural policy decisions and, then, to highlight key points for building a broader empirical research agenda around agrifood system transformation. The first three sections of the chapter focus on how a political economy lens previously has been used to understand trade and price distortions, public investment patterns, and agro-industrial policies. Subsequently, the chapter emphasizes that the growing focus on agrifood system transformation implies an expanded array of needed interventions by the public
sector that extend beyond the traditional mandates of agricultural ministries. Moreover, as the food system spans rural areas, small towns, and large cities, all of which are governed by different types of local authorities, public sector support for transformation is no longer under the domain of national governments alone. Consequently, the chapter argues that horizontal and vertical coordination—meaning cooperation across sectors and levels of government—will need to be addressed to manage the transformation process. Some examples of public sector restructuring initiatives are therefore discussed before the chapter concludes.
Trade and Price Distortions in the Agricultural Sector The first generation of political economy scholarship, focusing on policies from the 1970s and 1980s, examined the causes of distortionary policies against agricultural producers. Analyzing 18 developing countries, Krueger, Schiff, and Valdés (1988) argued that those governments were supporting industrial growth through import substitution policies and overvalued exchange rates that made imports cheaper at the expense of exports, including those in the agricultural sector. At the same time, procurement policies (such as those involving market-ing boards) and export taxation further suppressed agricultural producer prices. Ideology was one potential explanation for this approach because financing rapid industrialization by taxing agriculture was popular across very different countries in Africa, Asia, and Latin America at that time (Krueger 1992).
In Africa, the seminal work of Bates (1981) explained this pattern by offering a politically rational argument based on the preferences and strength of interest groups. He argued that the governments of one-party states were concerned about the possibility of economically disgruntled urbanites lobbying for greater democratization. With food prices kept low through distortionary policies, urban consumers might prove less restive. McMillan (2001), however, suggested that because taxation rates varied across countries and crops, these distortions were explained more by time inconsistency problems. Leaders with longer time horizons did not want to reduce long-term export revenues through overtaxa-tion, but governments also did not want to tax crops with lower sunk costs (cotton and groundnuts, for example, as opposed to coffee and cocoa) out of fear that farmers could rebel and not plant across seasons.
Looking at policy three decades later, Bates and Block (2013) found that those African countries that had moved toward competitive-party political

176 resakss.org
systems tended to be associated with relative rates of assistance that favored agri-culture over nonagriculture and led to greater agricultural productivity growth.2 They noted that although authoritarian regimes had relied on a small coterie of urban supporters, democratization required them to court support from rural voters who, in much of the region, were still numerically superior. This need, in turn, led to more rural-focused policies. Electoral malapportionment in some countries, such as Ghana, Kenya, Malawi, and Zambia (Boone and Wahman 2015), has been exacerbated by the tendency of many governments to create increasingly more subnational units (provinces, regions, districts) in rural areas. The latter usually results in new parliamentary constituencies that give rural voters more weight in the policy process (Boone and Wahman 2015; Grossman and Lewis 2014; Resnick 2017a).
Responses to the 2007–2008 food price crisis, which caused urban riots in a number of African countries (Berazneva and Lee 2013), raise questions about these dynamics. On the one hand, the growth of input subsidy programs that emerged at that time, especially in democracies, suggested more pro-rural responses in such regimes (Jayne and Rashid 2013). On the other hand, a number of African countries responded with price controls and export bans that seemed to suggest a continued urban bias in agricultural policy (Pinstrup-Andersen 2015).
These responses seem contradictory only when interests are examined through the lens of a simplistic dichotomy divided between rural producers and urban consumers, and between democracies and autocracies. As observed by van de Walle (2001), interests do not automatically translate into policy outcomes without considering who has power, how well regimes are insulated from popular pressures, and the extent to which effective mediating institutions—such as unions, cooperatives, and consumer associations—exist. For instance, during the 2007–2008 global food price crisis, consumer groups in Senegal strongly influenced that country’s response to the crisis (Resnick 2015), and a few large-scale millers had an impact on Zambia’s response (Chapoto 2015). Admassie (2015) has suggested that despite urban riots in Ethiopia as a result of the food price crisis, the executive was insulated enough from societal pressures to avoid responding with policies that solely favored urban demands.
2 A similar pattern with respect to relative rates of assistance has been found for a larger cross-country sample that extends beyond Africa (Olper and Raimondi 2010).
Public Investments in AgricultureA second theme of political economy research has centered on how public investment decisions for African agriculture have been made and to whom the benefits of such investments have been targeted. Specifically, a well-observed pattern is that African governments generally exhibit lower investments in agricultural research and development (R&D) than those in other regions of the world (Beintema and Stads 2017). Although the Maputo Declaration of 2003 was intended to reverse this trend by committing heads of state to spending 10 percent of their national budgets on agriculture, some governments met this target by allocating such expenditures disproportionately to input subsidy programs. One estimate suggested that the 10 countries in Africa with input subsidy programs collectively devoted upwards of US$1 billion to such programs on an annual basis, ranging from 14 to 26 percent of their public expenditures on agriculture (Jayne et al. 2018).
From an interest-based standpoint, the choice of subsidizing inputs over making broader investments in higher-return agriculture has been partially explained as based on politicians’ preference to prioritize high-visibility goods and services (Mogues 2015; Mogues and do Rosario 2016). The assumption is that voters can better attribute accountability for visible goods and services, such as subsidized inputs and roads, than they can for services like extension, which involves transfer of a nontangible item, knowledge, whose value it is difficult to discern in the short term because the benefits of extension advice manifest over a growing season. Moreover, attribution is difficult because extension agent advice can be undermined by bad weather, economic shocks, and improper implementation (see Anderson 2008). In turn, one theory is that democracies are more likely to be vulnerable to disproportionate spending on subsidies because politicians in those regimes need to respond to citizen preferences in order to be elected. Ironically, then, one comparative study across six countries—Burkina Faso, Ethiopia, Kenya, Malawi, Rwanda, and Tanzania—found that greater accountability alone did not necessarily lead to citizen pressures to pursue pro-poor agricultural spending (Poulton 2014). In contrast, more autocratic regimes that are dependent on agricultural development for their survival may be more likely to pursue investments with greater pro-poor returns.

2020 ReSAKSS Annual Trends and Outlook Report 177
Beyond analysis of why governments allocate public investments to some subsectors over others, another line of analysis has focused on the political economy of subsidy distribution. Following an interest-based approach that assumes governments distribute visible goods in order to win votes, some studies suggest that governments target opposition supporters with subsidies (Banful 2011), others claim that they target their core constituents (Mason, Jayne, and van de Walle 2017; Mason and Ricker-Gilbert 2013), and still others find no partisan targeting at all (Brazys, Heaney, and Walsh 2015; Dionne and Horowitz 2016). In addition, although some suggest that input subsidy programs result in more votes for incumbent governments (Brazys, Heaney, and Walsh 2015; Dionne and Horowitz 2016), others demonstrate they do not (Mason, Jayne, and van de Walle 2017). A challenge in making generalizable conclusions about the political economy of subsidies is that the findings are based on different types of subsidy programs, with very different design and implementation features. If these features have differential impacts on agricultural productivity, poverty reduction, and elite capture, as many economists have shown (Chirwa and Dorward 2013; Jayne and Rashid 2013; Pan and Christiaensen 2011; Takeshima and Liverpool-Tasie 2015), then they should also have differential political impacts. At the same time, their impacts should be considered in interaction with the electoral institutions that are in place and bolstered by greater research on citizens’ actual, rather than assumed, policy preferences.
More broadly, institutional factors should be considered in more detail when considering public investment prioritization and targeting decisions. For instance, drawing on the concept of “veto players,” which identifies who has the power to make key decisions in a given policy system (see Tsebelis 2002), it would be extremely useful to determine the institutional factors that shape who has authority in the budgeting process, as a way of uncovering which interests gain the most currency. Country case studies on Mozambique (Mogues and do Rosario 2016) and Nigeria (Mogues and Olofinbiyi 2020) have begun to do so by mapping the institutional budget landscape within the agricultural sector.
Such mappings should increasingly consider whether or not agricultural responsibilities have been decentralized to lower-level government entities. Although recentralization has occurred in some countries, such as Uganda (Lewis 2014; Rwamgisa et al. 2018), several other African countries have moved in recent years toward the more comprehensive form of decentralization: devolution. This entails giving elected local governments greater fiscal and
administrative authority (Riedl and Dickovick 2014). After adopting a new constitution in 2010, Kenya implemented a devolved governance structure in 2013 whereby the new 47 counties became responsible for a range of services, including agriculture. In 2014, Zambia’s cabinet issued Circular Number 10, which initiated the first of a three-phase devolution exercise that formally began in early 2015. As a result, extension services were to be devolved away from the Ministry of Agriculture and Livestock and to the approximately 118 districts. Ghana likewise shifted to a devolved structure with the passage of the Local Government Instrument in 2009; agriculture was among the first functions devolved to the district assemblies in 2012 (Resnick 2018).
Public investments in agriculture in such settings are likely to require grap-pling with a broader array of interest group preferences, including those of local politicians and traditional authorities. Moreover, although devolution allows local governments to embark on agricultural strategies that reflect local citizens’ priorities, it can be difficult to aggregate these to the national level or to ensure that national agricultural strategies do not contradict local ones. For example, in Kenya, the counties’ integrated development plans need to align with the country’s Big Four Agenda (food security, affordable housing, manufacturing, and affordable healthcare for all). As a result, a large number of commodity value chains need to be incorporated so that the needs of each county are taken into account (see Kenya, MoALF 2019); however, this approach can also undermine efforts at genuine prioritization at the national level.
Agro-industrial Policy A third aspect of political economy that has become more salient in the last decade focuses on agro-industrial policy. Instead of revisiting a period when dis-tortions in the agriculture sector were used to bolster industry, more recent policy thrusts center on using industry to provide added value to agriculture along the value chain and thereby improve the incomes of farmers as well as generate more off-farm employment downstream. The intention of industrial policy generally is to rectify coordination failures, address externalities, and facilitate learning and knowledge spillovers for infant industries (Noman and Stiglitz 2015). Some of the key levers of industrial policy include spatial clusters (for example, export processing zones, industrial parks), tax incentives to investors, loans to specific sectors, and access to services and infrastructure at subsidized rates (Newman and Page 2017; Rodrik 2007).
178 resakss.org
One key political economy aspect of agro-industrial policy is why some sectors are targeted but others are not. Some have used a political settlements perspective, which integrates interest-based and institutional approaches, to address this question. A political settlement is considered the balance of power among elites and between the elites and different social groups, which shapes policy selection and performance (Khan 1995). There are two dimensions to a political settlement. One dimension is the social foundations of the settlement, which refers to different coalitions that may form around particular fault lines relevant to the society. These coalitions can include, inter alia, trade unions, commercial farmers, the military, donors, ethnic groups, business groups, party members, and politicians who collectively bring resources together to shape societal norms, deploy economic resources, encourage protest, or mobilize other forms of action. The second dimension is the degree of power concentra-tion among elites. Concentrated power occurs when the top leadership can gain consent among groups that are part of the settlement’s social foundation, and no other groups are strong enough to deflect the leadership’s ambitions. In dispersed power settings, the leadership can achieve its goals only after exten-sive negotiation and deal making, which might dilute original policy objectives (Kelsall 2018).
A conclusion from the application of the political settlements perspective is that productive agro-industrial activities are more likely to be favored when the relationship between political elites and industry actors is central to the ruling party coalition. For example, Whitfield and colleagues (2015) looked at why efforts to rehabilitate the sugar industry in Mozambique during the 2000s succeeded, whereas equivalent initiatives for fish processing did not. They suggested that sugar rehabilitation through the attraction of Mauritian and South African investors presented an opportunity for the ruling party to gain votes in rural, opposition areas through the creation of factories and jobs. In contrast, kick-starting fish processing required a reallocation of quotas and licenses to foreign firms and away from veterans of the liberation war and top bureaucrats. Similarly, in Uganda, the dairy industry has developed considerably, with
3 This is not to negate the important role played by smallholders, commercial actors, and others in the process of agro-industrialization. Instead, the focus here is on the state because its actions mold the environment in which many of these other stakeholders must operate and the degree of power they are able to exert.
improved quality of milk production; in contrast, despite a promising growth of fish factories, fish processing has been undermined by a lack of regulation of fish stocks in Lake Victoria. Ugandan elites’ links to the dairy industry have been identified as a reason why there is an effective regulatory agency to ensure milk quality, whereas fisheries regulation countered the interests of powerful factions (Kjær 2015). Ideational goals still underlie some agro-industry initiatives, such as Ghana’s One District, One Factory program, under which the govern-ment has aspired to create a factory in every one of its now 260 metropolitan, municipal, and ordinary districts. Although this plan contradicts traditional agglomeration theory about concentrating industries to benefit from economies of scale, Frimpong and Sumberg (2019) have argued that it reflects a long-standing commitment by successive governments, beginning with that of Kwame Nkrumah in the 1960s, to spatial equity in agro-industrial development.
Because the state is a central actor in most economic theories of industrial policy, the shift toward agro-industrial policy offers a lens through which to examine the importance of building state capabilities.3 The state must be able to exert enough control over factional demands in the ruling coalition to shift budget resources and overcome resistance, and the relevant bureaucrats must be able to manage the policy details (Whitfield et al. 2015). Whereas the former requires high levels of political will and leadership, the latter involves strengthening the autonomy and accountability of bureaucrats to perform the difficult task of policy implementation. Bureaucratic capabilities are found to be higher when agents can operate in an environment of experimentation, novelty, and feedback loops (Andrews, Pritchett, and Woolcock 2013; Pires 2011). In contrast, bureaucrats can be demoralized in organizational settings that stymie flexibility or devalue hard work (Grindle 1997; Tummers and Bekkers 2014). Ministries of agriculture remain largely a black box, but a few case studies of agricultural bureaucracies in Africa suggest that they often experience high levels of political interference, including interference in agriculture statistics, diversion of resources, and having their long-term work plans subverted to support short-term presidential initiatives (Johnson 2015; Joughin and Adupa 2017).
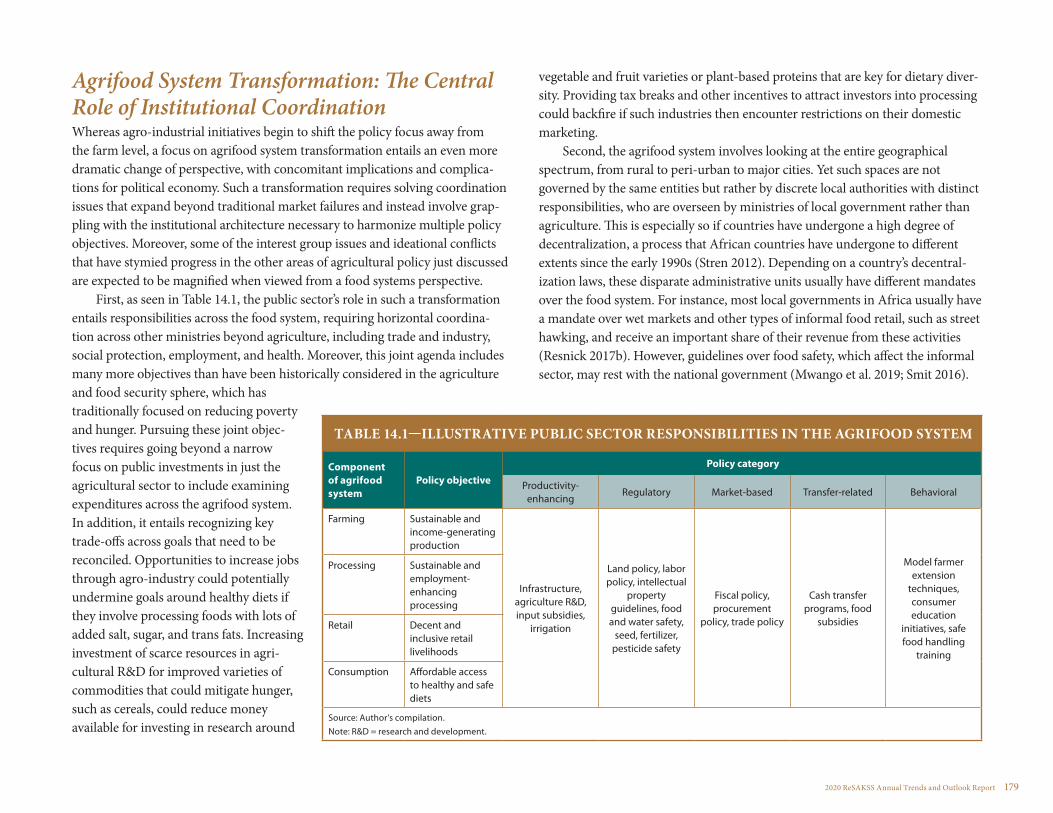
2020 ReSAKSS Annual Trends and Outlook Report 179
Agrifood System Transformation: The Central Role of Institutional Coordination Whereas agro-industrial initiatives begin to shift the policy focus away from the farm level, a focus on agrifood system transformation entails an even more dramatic change of perspective, with concomitant implications and complica-tions for political economy. Such a transformation requires solving coordination issues that expand beyond traditional market failures and instead involve grap-pling with the institutional architecture necessary to harmonize multiple policy objectives. Moreover, some of the interest group issues and ideational conflicts that have stymied progress in the other areas of agricultural policy just discussed are expected to be magnified when viewed from a food systems perspective.
First, as seen in Table 14.1, the public sector’s role in such a transformation entails responsibilities across the food system, requiring horizontal coordina-tion across other ministries beyond agriculture, including trade and industry, social protection, employment, and health. Moreover, this joint agenda includes many more objectives than have been historically considered in the agriculture and food security sphere, which has traditionally focused on reducing poverty and hunger. Pursuing these joint objec-tives requires going beyond a narrow focus on public investments in just the agricultural sector to include examining expenditures across the agrifood system. In addition, it entails recognizing key trade-offs across goals that need to be reconciled. Opportunities to increase jobs through agro-industry could potentially undermine goals around healthy diets if they involve processing foods with lots of added salt, sugar, and trans fats. Increasing investment of scarce resources in agri-cultural R&D for improved varieties of commodities that could mitigate hunger, such as cereals, could reduce money available for investing in research around
vegetable and fruit varieties or plant-based proteins that are key for dietary diver-sity. Providing tax breaks and other incentives to attract investors into processing could backfire if such industries then encounter restrictions on their domestic marketing.
Second, the agrifood system involves looking at the entire geographical spectrum, from rural to peri-urban to major cities. Yet such spaces are not governed by the same entities but rather by discrete local authorities with distinct responsibilities, who are overseen by ministries of local government rather than agriculture. This is especially so if countries have undergone a high degree of decentralization, a process that African countries have undergone to different extents since the early 1990s (Stren 2012). Depending on a country’s decentral-ization laws, these disparate administrative units usually have different mandates over the food system. For instance, most local governments in Africa usually have a mandate over wet markets and other types of informal food retail, such as street hawking, and receive an important share of their revenue from these activities (Resnick 2017b). However, guidelines over food safety, which affect the informal sector, may rest with the national government (Mwango et al. 2019; Smit 2016).
TABLE 14.1—ILLUSTRATIVE PUBLIC SECTOR RESPONSIBILITIES IN THE AGRIFOOD SYSTEM
Component of agrifood system
Policy objective
Policy category
Productivity-enhancing
Regulatory Market-based Transfer-related Behavioral
Farming Sustainable and income-generating production
Infrastructure, agriculture R&D, input subsidies,
irrigation
Land policy, labor policy, intellectual
property guidelines, food and water safety,
seed, fertilizer, pesticide safety
Fiscal policy, procurement
policy, trade policy
Cash transfer programs, food
subsidies
Model farmer extension
techniques, consumer education
initiatives, safe food handling
training
Processing Sustainable and employment-enhancing processing
Retail Decent and inclusive retail livelihoods
Consumption Affordable access to healthy and safe diets
Source: Author’s compilation. Note: R&D = research and development.

180 resakss.org
Likewise, agricultural extension may be overseen by local governments, but agricultural R&D is the preserve of national research institutes. Moreover, export processing zones may span numerous administrative boundaries, and infrastruc-ture investments can straddle multiple municipalities that are nonetheless part of the same metropolitan governance structure. Capital cities and other major urban agglomerations are much likelier to have higher fiscal autonomy to pursue agrifood system policies than their rural counterparts, and many city mayors are participating in global initiatives focused on enhancing access to healthy, sustain-ably produced food, such as the Milan Urban Food Policy Pact and C40 Cities (UCLG 2019). However, it is not always clear that commitments to these global initiatives align with national governments’ strategies on agriculture and food. To complicate matters, Africa’s urban areas disproportionately support opposition parties (Harding 2020), and cities are more likely than rural areas to be governed by opposition parties (Resnick 2019). In other settings, this vertically divided authority has undermined incentives for national and local authorities to work together (Estache, Garsous, and Seroa da Motta 2016).
These dynamics about horizontal (cross-sectoral) and vertical (across levels of government) coordination prompt key questions. For instance, how do we encourage all relevant ministries and policy actors at the national and subnational levels to pursue a joint agenda without duplicating efforts? This is not a straight-forward question because ministries often do not like having to forfeit power and budgets to a coordinating entity. Yet even if this is achieved, how do we still ensure accountability for delivering on such agendas when so many government actors—not to mention private sector and donor stakeholders—are involved, each with its distinct interests and agenda?
Recent public sector reform experiments in Africa provide some informa-tion about possible mechanisms. One is the creation of multisectoral agencies. Known as “agentification,” this approach theoretically offers greater internal efficiency within governments by streamlining particular responsibilities for service delivery and separating policy formation from policy implementation. In addition, agencies can gain greater autonomy for technocratic policymaking by being removed from the political interference that typically affects line ministries (Pollitt et al. 2005). Accordingly, they have often been promoted by donors as a way to bypass inefficiencies embedded in traditional public administration (Robinson 2007). The example of this model that has received the most attention in recent years is Ethiopia’s Agricultural Transformation Agency, which was
established in 2010 and is modeled on South Korea’s Economic Planning Board, Taiwan’s Joint Commission on Rural Reconstruction, and Malaysia’s Economic Planning Unit. However, some studies focused on Africa have observed that, at best, if such agencies lack high-level political backing, they can become just as ineffective as their parent ministry (Caulfield 2006; Sulle 2010). At worst, they could create a precedent of establishing parallel structures that further erode the rest of the bureaucracy. Such erosion occurs when recruitment into agencies involves attracting public sector employees, who are incentivized by higher salaries, away from government ministries (Ngowi 2008).
The trend toward results-based management (RBM) aims to improve mutual accountability by adopting a “life-cycle” approach that relies on defining desired results, monitoring progress toward those results, and reporting on performance. It often ties financing for agreed-upon goals to outcome targets (Beschel et al. 2018). One modality of RBM is performance contracts or performance plans, which technically are agreements between individual employees and their supe-riors that specify the performance targets by which employees will be assessed (Phillips et al. 2014). Long used in Africa’s utility sector, such agreements are increasingly popular within the public sector to enable presidents and prime ministers to monitor ministries’ or local governments’ delivery of agreed-upon goals critical to national development strategies. One prime example of the performance contract approach is Rwanda’s imihigo system, which began in 2006 and is based on performance contracts between the president and government ministries, including those in agriculture, as well as with local governments. The targets are decided through consultation with local government but also need to be reflective of national development priorities (Beschel et al. 2018).
Besides performance contracts, another modality has been delivery units. Such units rely on a mandate from the chief executive to focus on a limited number of priority areas, address obstacles that block progress, and build learning. Concretely, delivery units consist of small teams of experts whose offices are usually located within the office of the chief executive (president, prime minister, governor) or the ministry of finance. This placement ensures high-level political commitment to the delivery unit’s work and provides it with access to decision-makers at the ministerial level to identify bottlenecks and facilitate information flows (Barber, Kihn, and Moffit 2010; Lindquist 2007). A few examples attempted in the African context have included Big Results Now!, which was adopted by the previous administration in Tanzania in order to

2020 ReSAKSS Annual Trends and Outlook Report 181
achieve the targets outlined in Tanzania’s Development Vision 2025, inspired by Malaysia’s Performance Management and Delivery Unit (PEMANDU). Likewise, South Africa Operation Phakisa, or “Big Fast Results,” was motivated by a state visit to Malaysia and inspired by the PEMANDU approach. Other countries, including Benin, Ghana, Kenya, Nigeria, Senegal, and Togo, have also adopted the model. In fact, the African Development Bank recently established an African Delivery Units Network in order to facilitate peer learning and best-practice experiences with this model (AfDB 2019).
Much more research is needed on all of these modalities to affirm their effectiveness at addressing horizontal and vertical coordination problems relevant to agrifood systems. Moreover, because such initiatives often have been effective due to their embeddedness within a high-level political office, it is not obvious whether these are sustainable after political administrations change. Yet due to the centrality of coordination, it is clear that building state capabilities will remain one of the fundamental prerequisites for achieving transformation.
Conclusions This chapter has focused on discussing how political economy approaches that have been used to explain diverse policy choices related to price and trade distor-tions, public investment decisions, and agro-industrial policy. The demands on agriculture are even greater under the agrifood system agenda, with the sector viewed as the linchpin for generating jobs and economic growth, providing healthier food choices in a climate-smart way, promoting women’s empower-ment, and meeting the aspirations of youth, among others. The burden on the public sector is also high, with expectations that the government, both national and subnational, will not only provide an enabling environment but also take a proactive role in attracting investment and coordinating policy interventions that ensure synergies rather than trade-offs across many different development objectives. Therefore, instead of relegating politics to a position as a residual factor to explain why sound policies never materialize as expected, examining the confluence of interests, ideas, and institutions can help uncover different actors’ motivations, identify champions for change, and highlight needed public sector reforms to sustain African agrifood system transformation.

182 resakss.org
CHAPTER 15
Mutual Accountability in African Agricultural Transformation
John M. Ulimwengu, Greenwell Matchaya, Tsitsi Makombe, and James Oehmke1
1 The views presented in this chapter are those of the authors and do not necessarily reflect the views of the US Agency for International Development.

2020 ReSAKSS Annual Trends and Outlook Report 183
Mutual accountability is rooted in the observation that development is a multistakeholder phenomenon and that stakeholders must therefore hold themselves and others accountable for their
commitments to the development process for that process to succeed. Jointly, stakeholders must be accountable for ensuring that the set of commitments suffices to achieve common development goals. The potential of mutual accountability to align multistakeholder commitments around common development goals and ensure efficient execution of these commitments makes it one of the most exciting development innovations of the decade. In African countries plagued with inefficient markets and weak contracting mechanisms, mutual accountability provides an additional tool to align resources in multistakeholder situations, with considerable potential to mobilize those resources and improve the efficiency of their use—perhaps the most critical concerns for sustainable development. However, a lack of mutual trust among business, civil society, and government; data and evidence constraints; and limited capacity for multistakeholder dialogue may make it exceedingly difficult for mutual accountability to live up to its full potential.
Simply put, mutual accountability is a process by which two or more partners agree to be held responsible for commitments that they have voluntarily made to each other (OECD 2009). The “mutual” refers to that which is common and shared among the partners, which includes having a shared agenda and vision for achieving desired development outcomes and having jointly agreed performance indicators based on agreed performance criteria. A shared agenda is central to establishing and sustaining buy-in, unity, and commitment among stakeholders or participating members. It is essential for shared goals and commitments to be SMART—specific, measurable, achievable, relevant, and time-bound. Effective mutual accountability requires common performance indicators based on mutually agreed performance criteria that can be used to monitor and adjust progress on the commitments and goals. The “accountability” part of mutual accountability consists of two important dimensions—answerability and enforce-ability (SADEV 2012; Vance, Lowry, and Eggett 2013). Answerability implies that one must justify to others one’s actions or decisions; it is “a responsibility to answer for particular performance expectations to specific stakeholders” (Brown and Jagadananda 2007, 9). And enforceability involves ensuring that an actor sticks to his or her commitments; this part of accountability renders judgment
or imposes sanctions on the actions (or lack thereof) of participating persons (Brown and Jagadananda 2007).
Mutual accountability is furthermore rooted in the concept of managing for development results (MfDR), a management approach that uses performance information at all stages of the development process to make better and more effective decisions and to steer development efforts toward clearly defined goals. The MfDR approach covers five areas: (1) setting desired results and agreeing on targets and strategies, (2) allocating available resources to activities that will contribute to the achievement of results, (3) monitoring and evaluating progress to assess whether results are being achieved, (4) reporting on performance, and (5) learning from the experience and providing feedback to improve decision making (OECD 2005). Mutual accountability provides a platform or a mechanism to operationalize the five core areas of MfDR and to ensure effective delivery and tracking of shared commitments as well as increased accountability and performance, and ultimately the achievement of desired results in the improvement of livelihoods.
Mutual accountability has been a core principle of the New Partnership for Africa’s Development (NEPAD) since its adoption by the African Union (AU) in 2002, and of the Comprehensive Africa Agriculture Development Programme (CAADP) since its launch in 2003. In line with NEPAD principles of African collective ownership and leadership around a shared vision and of good governance and accountability, CAADP has emphasized the need for improved agriculture sector governance through promoting benchmarking, dialogue, review, and mutual learning and accountability in the agriculture sector (NEPAD Secretariat 2005). Since 2014, the African Union Commission (AUC) and the African Union Development Agency–NEPAD (AUDA-NEPAD) have led efforts to establish and strengthen agriculture joint sector reviews (JSRs)—a key instrument for operationalizing mutual accountability by mutually assessing performance and progress in the agriculture sector and allowing state actors and nonstate actors (NSAs) to hold each other accountable on their commitments and outcomes. In 2014, African heads of state and government reaffirmed their commitment to mutual accountability and the entire CAADP agenda by adopting the Malabo Declaration on Accelerated Agricultural Growth and Transformation for Shared Prosperity and Improved Livelihoods (AU 2014). In a strong show of their commitment, African leaders pledged to hold a continental

184 resakss.org
agricultural biennial review (BR) to assess progress on all seven Malabo commit-ment areas.
This chapter aims to deepen our understanding of both the conceptual framework of mutual accountability and its best practices in the context of agri-cultural transformation in Africa. We do so in three ways: documenting the need for and growth of mutual accountability mechanisms over time, discussing how mutual accountability processes contribute to agricultural transformation, and examining the effectiveness of the mutual accountability processes of choice—JSRs and the African agricultural BR. In the next section, we provide a brief review of the origins and theory of mutual accountability as well as its application in African agriculture. Following that, we discuss how mutual accountability is being operationalized through JSRs and the Malabo BR, and the effectiveness of the two processes. The section after empirically assesses the contribution of mutual accountability to agricultural transformation in Africa. The final section provides concluding remarks for driving agricultural transformation through mutual accountability processes.
Mutual Accountability and Agricultural TransformationThe Evolution and Theory of Mutual Accountability The concept of mutual accountability originated in the business management literature. Katzenbach and Smith (1993) argued that mutual accountability arises naturally in well-functioning corporate teams: “teams enjoying a strong common purpose and approach inevitably hold themselves responsible, both as individuals and as a team, for the team’s performance” (116). Buchanan-Smith and Collinson (2002) used the concept to describe joint commitments by donors and multilat-eral agencies with respect to humanitarian crises but did not articulate mutual accountability as a paradigm for improved aid effectiveness.
In 2005, the Paris Declaration on Aid Effectiveness articulated the concept of donors and national governments as partners, including the concept and applica-tion of mutual accountability, which was reaffirmed in the 2008 Accra Agenda for Action and the 2011 Busan Partnership Agreement. The immediate need for mutual accountability came from divergent priorities among government and donors. Despite agreement on the overarching framework of the Millennium Development Goals (MDGs), donor funding often came with a narrower set of
objectives that did not fully match developing-country priorities. Developing countries wanted donors to provide direct government-to-government (G2G) financial support. Donors perceived public financial accounting as not trans-parent and voiced concerns over possible corruption and diversion of public resources. In the Paris Declaration, African governments committed to more transparent financial accounting processes and donors committed to considering G2G support or at least harmonizing off-budget support with country priorities.
The key mutual accountability characteristics of responsibility and voluntary commitment remain important today, often implemented through inclusive, evidence-based dialogue processes leading to commitments based on shared objectives (Oehmke 2017; Benin et al. 2018). A limiting feature of the Paris Declaration was that only donor and partner countries made commitments—that is, the declaration contains only government commitments. Even the recognition of the need for broad dialogue among development stakeholders was phrased in terms of government commitment to support better dialogue—there were no civil society or private sector commitments to go beyond dialogue and become part of the solution, or even to participate in dialogue at all. The Paris Declaration led to selection of the JSR as the implementing tool of choice for mutual account-ability. Although the JSR began as a review of financial commitments between donors and a national government, countries have quickly learned the potential of the JSR to serve as an inclusive, evidence-based policy dialogue process, particularly in agriculture.
As stated earlier, mutual accountability has been a core principle of CAADP since its launch in 2003 but has grown in importance as the demand for evidence on progress to achieve agreed-on commitments has increased. In the 2003 Maputo Declaration, which launched CAADP, African leaders called for the active participation of civil society organizations (CSOs), smallholder farmers, the private sector, and women and youth associations in all aspects of agricultural and food production (AU 2003). An early and visible initiative is NEPAD’s African Peer Review Mechanism, established in 2003, whereby AU member states voluntarily accede to a peer review process that assesses their adoption of political, economic, and corporate governance policies and practices in pursuit of political stability, economic growth, and sustainable development (APRM 2020). Both NEPAD and CAADP have promoted key principles of good governance and accountability, inclusive participation, dialogue, benchmarking, peer review, and mutual learning (NEPAD 2010). CAADP has also promoted partnerships
2020 ReSAKSS Annual Trends and Outlook Report 185
and alliances that facilitate the alignment of development efforts by governments and development partners, improve incentives for long-term investments by the private sector, and increase inclusive and active participation of NSAs such as farmers’ organizations in agricultural policymaking (NEPAD Secretariat 2005; NEPAD 2010).
In 2011, through a consultative process, AUC and AUDA-NEPAD developed the CAADP Mutual Accountability Framework to incentivize CAADP partners to effectively deliver on their commitments by tracking the commitments, increasing accountability, and rewarding performance (AUC and NPCA 2011). The framework document noted the existence of review mechanisms such as agriculture JSRs in a few countries and called for their strengthening as well as the establishment of accountability platforms where they do not exist. Thus, since 2014, AUC and AUDA-NEPAD, and their technical partners such as the Regional Strategic Analysis and Knowledge Support System (ReSAKSS), have led efforts to establish and strengthen JSRs. An overarching commitment of the 2014 Malabo Declaration is the pledge by African heads of state and government to hold themselves accountable over actions and results associated with provisions of the declaration by conducting a continent-level BR to monitor and report on progress. Essentially, the BR elevates attention to country JSR or equivalent processes with comparable data and evidence across countries and regions. To date, two BRs have taken place, in January 2018 and February 2020, during the AU summits of heads of state and government.
In both the 2003 Maputo Declaration and the 2014 Malabo Declaration, African leaders committed to increase financial support for agriculture and make spending more effective through CAADP. Donors and governments quickly realized that they did not have the ability to fully fund agricultural development either individually or jointly: smallholders invest three to seven times more than donors, governments, and the for-profit private sector combined (Lowder, Skoet, and Raney 2016; FAO 2012). Thus, the mutual accountability process that has emerged under the CAADP agenda goes beyond the focus on donors and country governments, and in line with the CAADP principle of inclusiveness, opens up the process and dialogue space to all stakeholder groups including NSAs such as farmers’ organizations, the private sector, CSOs, youth associa-tions, and nongovernmental organizations (NGOs). Moreover, it represents a move from vertical accountability mechanisms—which characterized past aid modality relationships between donors and country governments—to horizontal
accountability—which tries to deal with inherent power imbalances between donors and governments by emphasizing mutual respect, trust, reciprocal commitments, and mutual responsibility (Brown and Jagadananda 2007).
Although mutual accountability processes can operate at levels from grass-roots to continental (Oehmke 2017; Oehmke et al. 2018; Oehmke, Kagniniwa, and Franklin 2018; Franklin and Oehmke 2019), the emphasis in this chapter is on agricultural JSRs and the BR. Overall, successful agricultural mutual account-ability processes have the following four distinct characteristics (Oehmke 2017):
1. A common vision of development that includes overlapping stakeholder interests and is publicly articulated, for instance in a National Agriculture Investment Plan (NAIP) or on a smaller scale in a local resilience plan
2. Voluntary and transparent commitment to actions in support of the common vision
3. A means for individuals to hold themselves and others accountable for responsible execution of these commitments
4. Joint accountability to ensure that the portfolio of commitments is suffi-cient to progress toward development goals
Other key characteristics or principles that have emerged under the CAADP agenda as critical for the success of mutual accountability processes include (1) country ownership and leadership to ensure the success and sustainability of the processes; (2) inclusive participation that ensures all stakeholders actively and fully participate in the process and have access to timely, transparent, and relevant information; and (3) evidence-based decision making, whereby reliable data, performance monitoring information, and evidence-based analysis are made accessible to all stakeholders and used to guide policy decisions (Benin et al. 2018). The use of credible data and analysis helps to build trust among stakeholders that contribute to the process. The novelty and potential of mutual accountability arise from the nature of commitment and enforcement in mutual accountability processes and the ability to strengthen social institutions for accountability. For example, the MDGs exemplify both a common vision and voluntary commitment—but the MDGs were not achieved, in large part because of nonspecific commitments and ineffective enforcement processes.
186 resakss.org
Enforcement in mutual accountability is accomplished primarily through social institutions that offer “answerability,” although some legal changes are often required as well. Mutual accountability is in part a collaborative accountability or social accountability (Fox 2015) based on shared interests and commitments to achieve common goals, with limited specific political, legal, or economic sanctions in place. Therefore its enforceability relies primarily on “soft” sanctions: social or reputational forces such as peer pressure or peer review (Brown and Jagadananda 2007; Droop, Isenman, and Mlalazi 2008). In circumstances where legal or economic penalties are effective, it is likely that market mechanisms, contracting, grades and standards, or other traditional resource commitment and allocation mechanisms may be relatively efficient and are the mechanisms of choice. On the other hand, in circumstances where these traditional sanctions are difficult or impossible to enforce impartially, a mutual accountability process that relies on social, relational, and reputational forces is likely to be a useful tool in advancing multistakeholder development goals.
Mutual accountability under the CAADP agenda is a voluntary cooperative action based on shared interests and commitments to achieve common goals. Its enforceability relies both on social or reputational forces such as peer pressure or peer review, and on the ambition of reaching the shared vision that provides benefit to stakeholders. The BR process is already showing that reputational risks can be effective in getting AU member states to participate in reporting progress toward Malabo Declaration commitments. A total of 49 out of 55 AU member states participated in the 2019 BR, compared with 47 out of 55 in 2017 (AUC 2020), and the best-performing countries are honored among their peers, a practice that can help incentivize other countries to take measures to improve their own agricultural transformation outcomes.
Mutual Accountability and Agricultural Transformation Through the 2014 Malabo Declaration, African leaders pledged, between 2015 and 2025, to accelerate agricultural transformation, a process that involves the modernization of the agriculture sector from subsistence farming to a modern commercialized agriculture that has strong linkages to other sectors of the economy. In essence, agricultural transformation is characterized by (1) a relative decline of basic subsistence agriculture, (2) a rising importance of agribusiness and increased value added for agro-industries and agricultural trade and services,
and (3) an increasing share of high-value agricultural products in international trade (Divanbeigi, Paustian, and Loayza 2016; Barrett et al. 2017).
Agricultural transformation is very complementary to the broader process of structural transformation, which involves the reallocation of economic activity across the agriculture, manufacturing, and services sectors. Structural transfor-mation is often characterized by a falling share of agriculture in economic output and employment, a rising share of urban economic activity in industry and services, migration of rural workers to urban areas, and a demographic transition from high rates of births and deaths to low rates of births and deaths (Timmer and Akkus 2008; Breisinger and Diao 2008). The agriculture sector plays a key role in structural transformation, especially as a source of labor for the modern industrial sector and of food supplies for the laborers (Lewis 1954; Johnston and Mellor 1961), and as a source of fiscal revenue for financing infrastructure, health, and education (Badiane and McMillian 2015). Furthermore, evidence from Asia has shown that poverty reduction is fastest when agricultural transfor-mation complements the structural transformation process (Timmer and Akkus 2008; World Bank 2007).
The development hypothesis undergirding the recommitment to CAADP is that application of the CAADP principles and values, including good gover-nance, good policies, and effective mutual accountability processes, will lead to better development outcomes (Figure 15.1) (Benin, Ulimwengu, and Tefera 2018). Adherence to CAADP principles and values, including effective mutual accountability processes, is expected to improve the policymaking process and to safeguard the design and implementation of good policies, effects that in turn are expected to lead to desirable policy outcomes. Expected outcomes include increases in the amount and quality of public and private investments, improved access to technologies and markets, reductions in postharvest losses, greater employment for women and youth, and stronger systemic capacity for policy formulation and implementation. Ultimately, countries and the continent are expected to realize accelerated, inclusive agricultural transformation and the associated Malabo goals: increased trade; reduced poverty, hunger, and under-nutrition; enhanced food security; and better resilience. Thus, effective mutual accountability processes contribute to agricultural transformation through improvements in agriculture sector governance: policy efficiency, improved strategies, and policy and institutional reforms.

2020 ReSAKSS Annual Trends and Outlook Report 187
Although the various theoretical and empirical studies that have looked into the determinants of agricultural transformation or structural transformation have not directly considered mutual accountability and its potential role in supporting agricultural transformation, these studies have emphasized the important role played by good agriculture sector governance, and institutional and policy reforms. For example, Jayne, Chamberlin, and Benfica (2018) highlighted good governance and the policy reforms of the 1980s and 1990s as key drivers of Africa’s transformation. Dabla-Norris and others (2013) found that policy and institutional variables such as product market reforms, openness to trade, and human and physical capital are important determinants of structural transforma-tion. McMillan and Rodrik (2011) showed that structural change in Asia has been growth-enhancing due to policy and institutional factors such as having flexible labor markets and competitive real exchange rates to promote trade. Mensah and colleagues (2016) used a cross-country study of African countries to highlight the strong role played by policy and institutional reforms (for example, education, trade openness, and financial reforms), as well as governance and
fiscal reforms, in driving structural trans-formation. Anderson, Rausser, and Swinnen (2013) documented the political economy difficulties in advancing policy change, which suggest that adopting systemic approaches such as mutual accountability may be more effective than taking on policy changes piecemeal.
Operationalizing Mutual Accountability This section discusses the processes that are used to operationalize the concept of mutual accountability in the agriculture sector, as introduced in the foregoing section. Our focus is on the agriculture JSR and the CAADP BR, processes that, as described later, are closely related to one another and implemented for the same purposes.
Agriculture Joint Sector Reviews The basis of an agriculture JSR as a tool for operationalizing mutual accountabil-ity in the agriculture sector is the country’s NAIP, which sets out jointly agreed objectives and goals for the agriculture sector as well as details about monitor-ing progress in the pursuit of the objectives. NAIP reviews, such as mid-term program reviews, JSRs, and sector performance assessments, are important for successful NAIP implementation (AUC and NPCA 2016). Participants in agricul-ture sector reviews include the ministry of agriculture, other line ministries that perform functions with a bearing on agriculture (such as finance, trade, public works, and health), development partners, civil society, the private sector, and farmer organizations.
The Process and Conduct of a Typical Joint Sector ReviewJSRs provide a platform to assess the performance and results of the agriculture sector, and in turn, assist governments in setting sector policy and priorities. Specifically, they aim to assess how well state and nonstate stakeholders have
FIGURE 15.1—MALABO DECLARATION IMPACT PATHWAY
Source: Benin, Ulimwengu, and Tefera (2018).
Policy outcomesImprovement in• Public/private �nancing
and investments• Access to technologies,
inputs, markets• Reduced postharvest
losses• Value chains• Jobs for women/youth• Systemic capacity
CAADP principles and values
• Agriculture-led development strategy
• Policy e�ciency, dialogue, review, and mutual accountability
• Partnerships and alliances for inclusiveness
Evidence-based policies and plans
• Change in existing policies and strategies
• New policies, strategies, and plans
• Reforms
Development outcomes
Improvement in• Productivity• Growth• Trade• Poverty• Hunger• Food/nutrition• Resilience
Mutual accountability, monitoring and evaluation, joint sector reviews, cross-country learning
188 resakss.org
implemented pledges and commitments stipulated in the CAADP compacts, NAIPs, and related cooperation agreements in the sector (ReSAKSS 2013). By allowing a broad spectrum of stakeholders to get insights into and influence overall policies and priorities of the sector, JSRs serve as a management and policy support tool for inclusive stakeholder planning, programming, budget preparation and execution, monitoring and evaluation (M&E), and overall development of the sector (ReSAKSS 2013; CAADP MA-M&E JAG 2012). The JSRs also facilitate information sharing and consensus building among different stakeholders, and encourage evidence-based decision making (Benin et al. 2018). For a JSR to be successful and robust, it needs to conform to certain procedural and substantive elements. The JSR process involves setting up a JSR steering committee chaired by the ministry of agriculture, followed by establishing a JSR secretariat, developing JSR terms of reference, mobilizing resources for the review, and constituting the review team. These activities are followed by conducting the review studies in line with the focus of the JSR that year, and compiling reports based on the studies. After a given report is cleared by senior managers, it is shared with all key sector players for review in preparation for validation (Benin et al. 2018). During the stakeholder dialogue, implementation and follow-up plans for the recommendations from the JSR are also drawn up (see Bahiigwa, Matchaya, and Benin 2013). The JSR report validation is the culmination of stakeholder participation and transparency in the process of the review. At this meeting, the report is presented, discussed, and critiqued, with the view of improving it and ensuring it is viewed as credible by all key sectoral players. The results from the validation are used to improve the report before it is finally shared with a wider variety of stakeholders, including the AUC (see Benin et al. 2018). The sector then drafts sectoral action plans.
The substance of the JSR derives from the mutually agreed milestones and targets laid out in the NAIP (ReSAKSS 2013). The substance is usually organized around five main areas: (1) development results, such as income growth, poverty and hunger reduction, food and nutrition security, and so on; (2) an overall agri-culture sector growth target, with specific subsector and commodity targets; (3) required financial and nonfinancial resources; (4) policies, programs, institutions,
2 This section is based on the experience of ReSAKSS in supporting JSR processes at the country and regional levels. 3 The countries are Angola, Benin, Burkina Faso, Côte d’Ivoire, Democratic Republic of the Congo, Eswatini, Ethiopia, Ghana, Kenya, Malawi, Mali, Mauritius, Mozambique, Niger, Senegal, Seychelles,
Tanzania, Togo, Uganda, Zambia, and Zimbabwe. RECs are the East African Community and the Economic Community of West African States.
and implementation processes; and (5) linkages (including pathways to achieve the development results), enabling environment, and assumptions (ReSAKSS 2013; CAADP MA-M&E JAG 2012; Benin et al. 2018). In some cases, deeper analysis may be conducted on a special or time-sensitive topic. A typical JSR can hence have its substance or topic focus on any one or various combinations of these five areas. For the chosen focus area, the JSR process will then identify (1) the main questions to be answered, (2) the methodologies and data needed for answering these questions, and (3) the outputs or reports to be generated (ReSAKSS 2013). Once the review terms are agreed upon and elaborated, the review of the sector then involves collecting, analyzing, and organizing relevant data from the sector in order to answer the key questions. This stage constitutes looking back to reexamine the actions taken by the stakeholders in the sector and evaluating them against the previously set joint targets in order to gauge the level of progress, or lack thereof, made.
Effectiveness of the Joint Sector Review as a Mutual Accountability Tool2
Since 2014, ReSAKSS, in partnership with the AUC and AUDA-NEPAD, has launched assessments of JSR efforts in 21 countries and two regional economic communities (RECs).3 The assessments evaluate the institutional and policy landscape as well as the quality of current agricultural review processes, and then develop action plans for improving or establishing best-practice JSRs that are regular, comprehensive, and inclusive.
These assessments have shown that many sectoral review processes had both similarities with and differences from the ideal JSR. Beyond the JSR assess-ments conducted by the AUC and ReSAKSS in 21 countries, some countries were shown to have only “JSR-like” processes that do not exhibit all the elements of a best-practice JSR but generally take place annually and are used to review agriculture sector performance (Nhemachena, Matchaya, and Nhlengethwa 2017). Out of 32 countries that conducted an agriculture JSR or JSR-like review in the past five years, 11 were in western Africa, 11 were in southern Africa, and 10 were in eastern Africa. The majority of the countries that have not conducted JSR or JSR-like processes are in central and northern Africa. At the regional level,
2020 ReSAKSS Annual Trends and Outlook Report 189
the Economic Community of West African States has to date held one regional JSR and is gearing up for a second one in 2020. The East African Community is expected to conduct its first regional JSR in 2020 following its JSR assessment in 2019.
JSR assessments or JSR-like processes have not been reported to have been conducted in a total of 23 African countries.4 Future assessments in these countries could help establish whether or not the countries have JSR or JSR-like reviews in place, and could develop action plans for establishing or strengthening such reviews.
Findings of the assessments also show that existing sectoral review practices are narrow in scope, not fully inclusive, not predicated on consensus, and not wholly country-owned (Nhemachena, Matchaya, and Nhlengethwa 2017). Further, the findings from the initial JSR assessments, when compared with the expectations set out in the JSR guidelines (ReSAKSS 2013), showed that the review processes did not include a review of agricultural policies and were not followed up with policy actions as recommended by the JSR review guidelines (Nhemachena, Matchaya, and Nhlengethwa 2017). For example, both the Ghana (Ghana, MoFA 2014) and Malawi (Malawi, MoAFS 2014) JSR assessments in 2014 showed that private sector involvement was lacking and action recommen-dations from reviews were often never followed up, even though this is a cardinal recommendation of the JSR guidelines (ReSAKSS 2013). In all the JSR assessment countries, there was a willingness by country stakeholders to improve the process following the assessments.
Outcomes of the assessments have been used to strengthen agriculture JSR processes where they existed prior to the assessments (for example, in Eswatini, Ghana, Malawi, Mozambique, and Zambia) and establish new JSRs where they did not (for example, in Burkina Faso and Senegal); further, countries have expanded the scope of their JSRs, compared with past reviews.5 Country stakeholders expressed their willingness to draw up action plans based on the assessments in order to improve agriculture sector performance (Nhemachena, Matchaya, and Nhlengethwa 2017). In addition, JSRs have raised accountability
4 The countries are Algeria, Cameroon, Cabo Verde, Chad, Comoros, Djibouti, Egypt, Equatorial Guinea, Eritrea, Gabon, Gambia, Guinea, Guinea-Bissau, Libya, Madagascar, Mauritania, Morocco, Sahrawi Arab Democratic Republic, Sao Tome and Principe, Somalia, South Africa, South Sudan, and Tunisia.
5 See JSR country assessment reports for Burkina Faso (Burkina Faso, MASA 2014), Ghana (Ghana, MoFA 2014), Malawi (Malawi, MoAFS 2014), Mozambique (Mozambique, MINAG 2014), Senegal (Senegal, MoARE 2014), and Uganda (Uganda, MAAIF 2012).
6 The eBR is a web-based tool for easing BR data entry, access, and management, developed by ReSAKSS at the request of the AUC.
standards, enhanced stakeholder engagement, and increased active participa-tion by NSAs in JSR meetings in Eswatini, Malawi, Zambia, and Mozambique (Benin et al. 2018). JSR assessments have led to discussions about targeting public projects away from areas with a huge presence of NGOs performing similar tasks, implying that wasteful duplication of effort may be on the decline (Benin et al. 2018). JSR assessments in the countries have led to an express inclusion of NSAs in JSR meetings, although their participation still requires strengthening (Benin et al. 2018).
The CAADP/Malabo Biennial ReviewThe CAADP BRs are much like continental JSRs, but they differ primarily in that the Malabo Declaration (1) elevates attention to a broad set of goals, including multisectoral goals heavily influenced by agriculture and food systems, such as nutritional outcomes, trade, and employment, among others; and (2) intention-ally strives for cross-country comparability in indicators, measurement, and milestones. The BR process contributes to the overarching principle of mutual accountability enshrined in the CAADP process, alongside JSRs, midterm reviews, and other NAIP assessments. The immediate products of the BR are the continental BR report and the African Agriculture Transformation Scorecard (AATS), which present the overall summary of a country’s performance against the milestones required to be on track to achieve the Malabo targets by 2025. Thus far, BRs have taken place in 2017 and 2019, with the presentation of BR reports and AATSs during AU summits held in January 2018 and February 2020.
Typically, the BR process begins with (1) definition and refinement of BR indicators, templates, guidelines, and methodologies; (2) training of AU member states on the BR refinements; and (3) BR data collection, analysis, reporting, and validation at the country level. The process at the country level is expected to involve all key stakeholders and utilize any existing JSR or JSR-like process, from its launch to the holding of a multistakeholder workshop to review and validate the data before they are submitted to the respective RECs and the AUC using the eBR.6 RECs provide quality control by reviewing data and providing feedback to

190 resakss.org
countries before generating regional summaries and handing over the data to the AUC. In turn, the AUC and its technical partners generate country agricultural transformation scores and draft the continental BR report and AATSs. The BR report and AATSs are reviewed and endorsed by the AU’s Specialized Technical Committee on Agriculture, Rural Development, Water and Environment before they are submitted to AU heads of state and government for presentation and review at the AU summit.
Is the BR Effective as a Process?The BR can be considered to be effective as a process if it elevates attention to and suitably prioritizes those areas that countries need to focus on to achieve the Malabo targets, and if countries respond positively to this prioritization. Following are six examples of positive country responses.
Malawi makes data and policy improvements. The 2017 BR pointed out the need for improved data coverage and quality in several countries including Malawi. Malawi’s Ministry of Agriculture and Food Security led the develop-ment of data clusters around the seven Malabo commitments. The clusters brought together leading country experts on the different commitment areas to spearhead the data collection and reporting effort. As a result, Malawi completed more data indicators, parameters, and sources in the second BR than in the first (Benin et al. 2020). At the policy level, the BR process has led to increased policy dialogue between the public and private sectors, which has in turn generated a government review of the country’s fertilizer policy, fertilizer bill, seed bill, and agricultural extension and advisory strategy in order to improve access to agricultural inputs and advisory services, and ultimately increase agricultural productivity (Malawi, MoAFS 2019, 6).
Lesotho pledges to increase budget allocation for agriculture. In response to the slow increase in budget allocation to its agriculture sector, underscored by the 2019 BR, the Lesotho government pledged to increase the operational budget to the Ministry of Agriculture and Food Security by 34 percent for fiscal year 2020/2021.7
Mozambique government recommits to allocating 10 percent of budget to agriculture and institutes policy changes. In Mozambique, the BR process
7 Information collected by ReSAKSS from Ministry of Agriculture and Food Security in Lesotho in February 2020.8 Information collected by ReSAKSS from Ministry of Agriculture in Mozambique in February 2020.
has helped to sensitize civil society and other stakeholders to the low levels of public agricultural spending—averaging 4.8 percent of total public spending since 2011 (Mozambique, MINAG 2020). As a result of stakeholder engage-ment in dialogue, the government has recommitted to allocating 10 percent of total spending to the agriculture sector annually over the next five years8 (Mozambique, MINAG 2019).
In the policy arena, the Ministry of Agriculture and Rural Development has responded to BR results by establishing a climate change unit to advise the ministry on building resilience and mobilizing resources for resilience. In response to the call to improve BR data, the ministry has incorporated BR indica-tors related to finance, climate change, and postharvest losses into its agriculture survey, and has secured funds to set up a sectorwide M&E system in March 2020 (Mozambique, MINAG 2019, 59).
Côte d’Ivoire makes programmatic changes to increase agricultural productivity. In Cote d’Ivoire, the first BR results led to inclusion of the Ministry of Environment in NAIP processes to ensure that resilience and climate vari-ability are discussed with a broad group of experts (Côte d’Ivoire, Ministry of Agriculture 2019). The BR also led to the adoption of an investment code in 2018 that provides tax incentives for all private investments in the agriculture sector. The BR has resulted in the launch of new projects aimed at promoting farmers’ access to credit services and the creation of a rural land agency to facilitate access to land by smallholder farmers. In addition, the Millennium Challenge Corporation has provided funding to track the BR indicator on access to land (Côte d’Ivoire, Ministry of Agriculture 2019).
Niger promotes private agricultural investment. Because BR results have shown Niger to be short of the target in its investment finance in agriculture, the country (1) adopted a decree in September 2018 that created the Nigerian Agency for the Promotion of Private Investments and Strategic Projects, and (2) passed an inclusive public-private partnership law in June 2018 to govern the formation and operation of public-private partnerships (Niger, Ministry of Agriculture 2019).

2020 ReSAKSS Annual Trends and Outlook Report 191
Togo makes policy and data improvements. The BR motivated the Ministry of Agriculture to introduce several new projects9 aimed at improving nutri-tion and promoting organic farming across the country (Togo, Ministry of Agriculture 2019). In addition, BR results led the ministry to review its national data collection surveys and protocols, resulting in the incorporation of several BR indicators into national surveys to ensure that they are regularly tracked (Togo, Ministry of Agriculture 2019).
Mutual Accountability: Empirical Evidence This section explores whether mutual accountability processes are associated with expected Malabo outcomes such as increased agricultural productivity, and whether there is evidence that mutual accountability processes accelerate agricul-tural transformation. To do so, we estimate a simple model of the following form:
Yij = αj+βjAgExpi+θjLandi+εij (15.1)
Xij = δj + πj Yij + ρj Zij + єij (15.2)
AgExpi = γ0 + γ1 CAADPi + γ2 MAi + μi, (15.3)
where Yij represents the level of outcome j (j= land productivity, labor produc-tivity) for country i, AgExpi is the level of public agricultural expenditures, Xij is the share of agricultural employment in total employment, Zij is a set of control variables (population growth and life expectancy), and CAADPi and MAi capture country i’s commitment to CAADP and mutual accountability processes, respectively. The variables εij, єij and μi are error terms. This empiri-cal specification explicitly recognizes that the level of agricultural expenditures is endogenous, and it includes the CAADP and MA variables in the dual roles of explanatory variables and instruments for the level of public agricultural expen-ditures. The use of these variables as instruments is consistent with the hypothesis that involvement in CAADP or mutual accountability processes does not directly affect expected Malabo outcomes, but does enable processes such as allocation of agricultural expenditure to be more targeted and effective. The overall system of
9 The Food Security Project (called ProSécAl, its French abbreviation), the Green Innovation Centers Program (ProCIV), the Agriculture Sector Support Project (PASA), and the Shared-Risk Agricultural Financing Incentive Mechanism Support Project (ProMIFA).
equations is estimated using three-stage least squares (3SLS). Table 15.1 presents the variables included in the estimation.
For Yij we use land productivity and labor productivity; these are level 2 Malabo outcomes. This treatment is consistent with the Malabo results framework, which states that level 2 outcomes are realized only once the actions specified as level 1 outcomes are completed; the level 1 outcomes include the accomplishment of those actions specified in the CAADP and mutual account-ability processes (AUC and NPCA 2011). To fully capture the effect of mutual
TABLE 15.1—VARIABLES INCLUDED IN THE ESTIMATIONa Variable name Variable description Source Period
MA (mutual accountability)
Conducted a JSR/JSR-A/JSR-L in past five years (Yes = 1; No=0)
ReSAKSS (2020) 2008–2018
Population growth rate
Population growth (annual %)Word Development
Indicators (World Bank 2020)
2008–2018
Life expectancyLife expectancy at birth, total (years)
Word Development Indicators (World
Bank 2020)2008–2018
Land Agricultural land (sq. km)Word Development
Indicators (World Bank 2020)
2008–2018
Agriculture value added per worker
Agriculture, forestry, and fishing, value added per worker (constant 2010 USD)
Word Development Indicators (World
Bank 2020)2008–2018
Agriculture value added per hectare
Agriculture, forestry, and fishing, value added per hectare (constant 2010 USD)
Word Development Indicators (World
Bank 2020)2008–2018
CAADP 1 if participant, 0 otherwise ReSAKSS (2020) 2008–2018
Agriculture expenditure
Government agriculture expenditure (constant 2010 USD, million)
ReSAKSS (2020) 2008–2018
Source: Authors, based on data from ReSAKSS (2020) and World Bank (2020).Notes: JSR = joint sector review; JSR-A = JSR assessment; JSR-L = JSR-like process; USD = US dollars.a Estimation includes 52 African countries. Sahrawi Arab Democratic Republic, Somalia, and South Sudan were excluded because of a sizable number of missing observations.
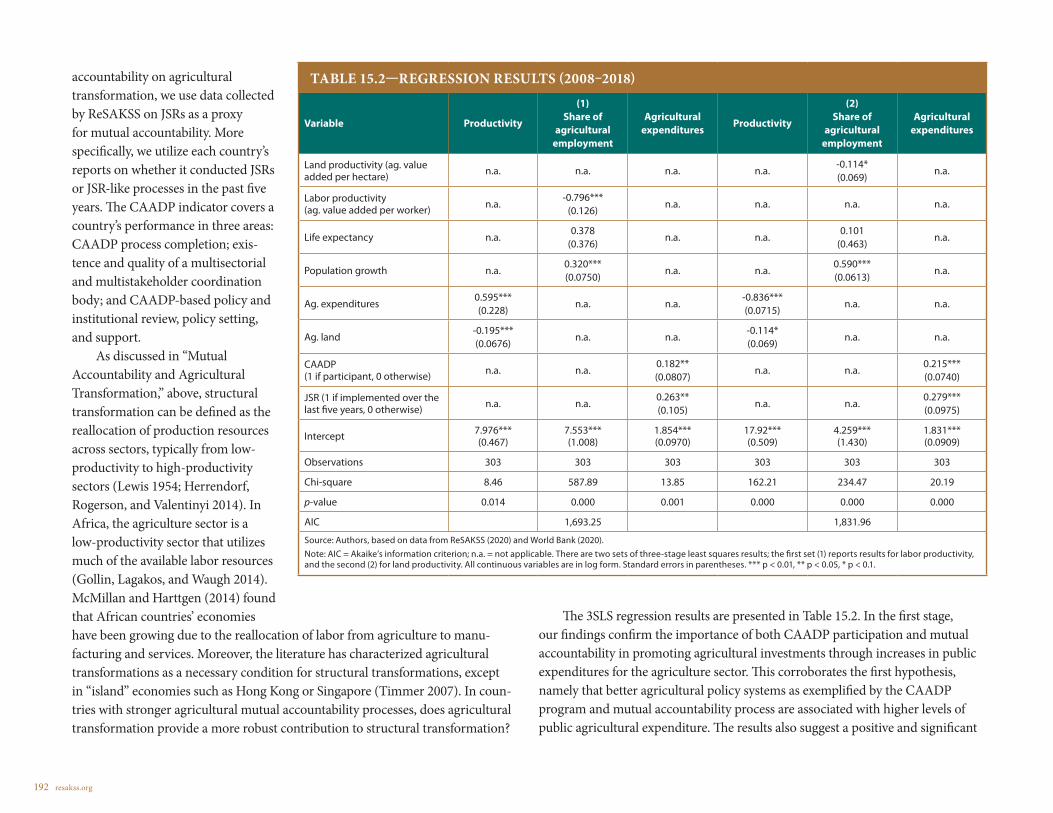
192 resakss.org
accountability on agricultural transformation, we use data collected by ReSAKSS on JSRs as a proxy for mutual accountability. More specifically, we utilize each country’s reports on whether it conducted JSRs or JSR-like processes in the past five years. The CAADP indicator covers a country’s performance in three areas: CAADP process completion; exis-tence and quality of a multisectorial and multistakeholder coordination body; and CAADP-based policy and institutional review, policy setting, and support.
As discussed in “Mutual Accountability and Agricultural Transformation,” above, structural transformation can be defined as the reallocation of production resources across sectors, typically from low-productivity to high-productivity sectors (Lewis 1954; Herrendorf, Rogerson, and Valentinyi 2014). In Africa, the agriculture sector is a low-productivity sector that utilizes much of the available labor resources (Gollin, Lagakos, and Waugh 2014). McMillan and Harttgen (2014) found that African countries’ economies have been growing due to the reallocation of labor from agriculture to manu-facturing and services. Moreover, the literature has characterized agricultural transformations as a necessary condition for structural transformations, except in “island” economies such as Hong Kong or Singapore (Timmer 2007). In coun-tries with stronger agricultural mutual accountability processes, does agricultural transformation provide a more robust contribution to structural transformation?
The 3SLS regression results are presented in Table 15.2. In the first stage, our findings confirm the importance of both CAADP participation and mutual accountability in promoting agricultural investments through increases in public expenditures for the agriculture sector. This corroborates the first hypothesis, namely that better agricultural policy systems as exemplified by the CAADP program and mutual accountability process are associated with higher levels of public agricultural expenditure. The results also suggest a positive and significant
TABLE 15.2—REGRESSION RESULTS (2008–2018)
Variable Productivity
(1)Share of
agricultural employment
Agricultural expenditures
Productivity
(2)Share of
agricultural employment
Agricultural expenditures
Land productivity (ag. value added per hectare) n.a. n.a. n.a. n.a.
-0.114* (0.069)
n.a.
Labor productivity (ag. value added per worker) n.a.
-0.796***(0.126)
n.a. n.a. n.a. n.a.
Life expectancy n.a.0.378
(0.376)n.a. n.a.
0.101 (0.463)
n.a.
Population growth n.a.0.320*** (0.0750)
n.a. n.a. 0.590***(0.0613)
n.a.
Ag. expenditures0.595***(0.228)
n.a. n.a. -0.836*** (0.0715)
n.a. n.a.
Ag. land-0.195*** (0.0676)
n.a. n.a. -0.114* (0.069)
n.a. n.a.
CAADP (1 if participant, 0 otherwise) n.a. n.a.
0.182** (0.0807)
n.a. n.a. 0.215*** (0.0740)
JSR (1 if implemented over the last five years, 0 otherwise) n.a. n.a.
0.263** (0.105)
n.a. n.a. 0.279*** (0.0975)
Intercept 7.976***(0.467)
7.553***(1.008)
1.854***(0.0970)
17.92***(0.509)
4.259***(1.430)
1.831***(0.0909)
Observations 303 303 303 303 303 303
Chi-square 8.46 587.89 13.85 162.21 234.47 20.19
p-value 0.014 0.000 0.001 0.000 0.000 0.000
AIC 1,693.25 1,831.96
Source: Authors, based on data from ReSAKSS (2020) and World Bank (2020).Note: AIC = Akaike’s information criterion; n.a. = not applicable. There are two sets of three-stage least squares results; the first set (1) reports results for labor productivity, and the second (2) for land productivity. All continuous variables are in log form. Standard errors in parentheses. *** p < 0.01, ** p < 0.05, * p < 0.1.
2020 ReSAKSS Annual Trends and Outlook Report 193
effect of public agricultural expenditures on both labor and land productivity. These results confirm the hypothesis that increased investment in agriculture would spur agricultural growth through productivity gains.
Overall, these results suggest that mutual accountability and the CAADP process are associated with increased agricultural spending. As pointed out by Benin (2018), agricultural expenditures may increase with participation in CAADP because, in general, the CAADP process strengthens the much-needed political will to invest; creates peer pressure within the sector and among countries, which then leads to investment; and more important, by responding to citizens’ demands for inclusiveness as well as accountability, also encourages investments.
Our findings also confirm the existence of agricultural and structural trans-formation because an increase in agricultural productivity (of both labor and land) leads to a decline in the share of agricultural employment in total employ-ment. The elasticities of agricultural employment with respect to productivity are negative and significant. The overall implication is that mutual accountability creates an incentive to increase investment in agriculture, which is likely to increase land and labor productivity. If sustained, the increase in agricultural productivity will trigger an exit of labor from the agriculture sector, leading to a significant reduction in the share of agriculture in overall employment. Ultimately, countries engaged in mutual accountability processes are likely to experience faster agricultural transformation.
Concluding Remarks As a multistakeholder mechanism, mutual accountability creates a platform whereby commitments around common development goals can be efficiently executed and monitored. In the context of inefficient markets and weak contract-ing mechanisms, such as those pervasive in Africa, mutual accountability offers credible incentives through reputational forces and peer pressure to ensure fulfillment of commitments to achieve a common vision and effect behavioral change. This chapter has presented both the theoretical underpinnings of mutual accountability and its application in the context of agricultural transformation in Africa. It has also conducted a comprehensive analysis of JSRs and the BR, including a quantitative assessment of mutual accountability’s contribution to agricultural transformation in Africa.
Under the CAADP/Malabo agenda, mutual accountability is based on shared interests and values, as well as commitments to achieve common goals, without any specific political, legal, or economic sanctions. Its enforceability relies on social or reputational forces such as peer pressure or peer review. Indeed, the BR process is already showing that reputational forces can be effective in getting AU member states to voluntarily participate in reporting progress toward the common CAADP/Malabo agenda. A total of 49 out of 55 AU member states submitted reports for the 2019 BR, compared with 47 out of 55 in 2017, and the best-performing countries were honored among their peers, a practice that can help incentivize other countries to take measures to improve their own agricul-tural transformation outcomes.
A growing body of evidence shows that mutual accountability contributes to agricultural transformation through improvements in agriculture sector gover-nance, policy efficiency, improved strategies, and policy and institutional reforms. Information collected from ministries of agriculture in a handful of countries suggests that the 2017 and 2019 BRs have led to policy changes and adjustments that are likely to boost agricultural transformation processes in the countries. Regression analysis shows that mutual accountability is associated with greater public agricultural expenditures, which in turn increase agricultural productivity. Our findings also confirm the existence of structural change in the agriculture sector, with an increase in labor productivity (measured as agricultural value added per worker) leading to a decline in the share of agricultural employment in total employment. The findings further suggest that countries implementing the CAADP’s mutual accountability processes are experiencing a faster track toward structural change.
To accelerate the pace of agricultural transformation in Africa, it is essential that African countries maintain their commitment to the CAADP/Malabo agenda as well as its related mutual accountability processes. Doing so will require governments to demonstrate leadership of an inclusive process, from developing a shared agenda to monitoring and reviewing commitments to having inclusive dialogue around the commitments. Moreover, soft incentives associ-ated with reputational, relational, and peer pressure are important for ensuring accountability and the enforceability of commitments. There is also a need to build the capacities of governments and NSAs to generate shared agendas, monitor and review progress, and engage in dialogue and debate. Finally, JSRs and the BRs have highlighted the urgent need to improve data quality and
194 resakss.org
strengthen country capacities for data collection, M&E, and analysis—all central to ensuring credible data and information to accurately track progress toward Africa’s agricultural transformation.
Amid the COVID-19 pandemic, we have witnessed mutual accountability operating at regional and global scales. Recognizing the negative secondary impacts of border closures, AU and the Food and Agriculture Organization of the United Nations issued a joint declaration and commitment on “…supporting access to food and nutrition for Africa’s most vulnerable; providing Africans with social protection; minimizing disruptions to the safe movement and transport of essential people, and to the transport and marketing of goods and services; and keeping borders open on the continent for the food and agriculture trade” (FAO 2020, 4–6).
Mutual accountability provides a framework for coordinated multistake-holder responses to global issues such as COVID-19 and their country effects. The COVID-19 pandemic has increasingly made it clear how important strong accountability systems are for mitigating the immediate impacts to public health as well as the secondary impacts to food and water systems, local resilience, and the economy. Coordinated policy systems, responses, and accountability across countries, governments, the private sector, and civil society within countries are essential to minimize the impacts of COVID-19.

2020 ReSAKSS Annual Trends and Outlook Report 195195 resakss.org
CHAPTER 16
Tracking Key CAADP Indicators and Implementation Processes
Tsitsi Makombe, Wondwosen Tefera, and John M. Ulimwengu

196 resakss.org
In 2003, African Union (AU) leaders adopted the Comprehensive Africa Agriculture Development Programme (CAADP) as part of the Maputo Declaration on Agriculture and Food Security. In the declaration, the leaders
committed to reducing poverty, food insecurity, and hunger; revitalizing the agriculture sector; and allocating at least 10 percent of national budgets to the agriculture sector (AU 2003). As part of the CAADP agenda, leaders also pledged to achieve a 6 percent agricultural growth rate at the national level. The need for a common framework to demonstrate CAADP implementation progress and performance led to the development of a CAADP monitoring and evaluation (M&E) system starting in 2007. At the behest of the African Union Commission (AUC), the Regional Strategic Analysis and Knowledge Support System (ReSAKSS) led the development of the CAADP M&E framework, which identified key indicators for tracking progress in allocating resources and achieving targets; outlined the required data, sources, and methods for estimating the indicators; and laid out a plan for successfully implementing the framework (see Benin, Johnson, and Omilola 2010). ReSAKSS was established in 2006 to provide data and knowledge products to facilitate CAADP benchmarking, review, dialogue, and mutual learning processes.
Following a decade of implementation, African leaders reaffirmed their commitment to CAADP in the 2014 Malabo Declaration on Accelerated Agricultural Growth and Transformation for Shared Prosperity and Improved Livelihoods. In the Malabo Declaration, they made seven wide-ranging commit-ments, including upholding the CAADP principles and values, enhancing investment in agriculture, ending hunger and halving poverty by 2025, boosting intra-African agricultural trade, enhancing resilience to climate variability, and strengthening mutual accountability for actions and results by conducting a continental Biennial Review (BR) of progress made in achieving the commitments (AUC 2014). In 2015, the AUC and the African Union Development Agency–New Partnership for Africa’s Development (AUDA-NEPAD) developed the CAADP Results Framework (RF) for 2015–2025, which is aligned with the seven Malabo commitments and organized by three levels of inputs, outputs, and outcomes (AUC and NPCA 2015). ReSAKSS tracks progress on CAADP indicators in the CAADP RF for 2015–2025 through its flagship Annual Trends and Outlook Report (ATOR) and website (www.resakss.org).
Level 1 of the CAADP RF includes broader development outcomes and impacts to which agriculture contributes, including wealth creation; food and
nutrition security; enhanced economic opportunities, poverty alleviation, and shared prosperity; and resilience and sustainability. Level 2 includes the outputs from interventions intended to transform the agriculture sector and achieve inclusive growth: improved agricultural production and productivity; increased intra-African trade and functional markets; expanded local agro-industry and value chain development, inclusive of women and youth; increased resilience of livelihoods and improved management of risks in agriculture; and improved management of natural resources for sustainable agriculture. Level 3 includes inputs and processes required to strengthen systemic capacity to deliver CAADP results and create an enabling environment in which agricultural transformation can take place: effective and inclusive policy processes; effective and accountable institutions that regularly assess the quality of implementation of policies and commitments; strengthened capacity for evidence-based planning, implementa-tion, and review; improved multisectoral coordination, partnerships, and mutual accountability in sectors related to agriculture; increased public and private
TABLE 16.1—NUMBER OF INDICATORS IN THE CAADP RESULTS FRAMEWORK AND BIENNIAL REVIEW
CAADP Results Framework Number of indicators
Level 1: Agriculture’s contribution to growth and development 14
Level 2: Agricultural transformation and inclusive growth 12
Level 3: Systemic capacity to deliver results 12
Total number of indicators 38
CAADP Biennial Review and Africa Agriculture Transformation Scorecard Number of indicators
Theme 1: CAADP processes and values 3
Theme 2: Investment finance in agriculture 6
Theme 3: Ending hunger by 2025 21
Theme 4: Halving poverty by 2025 8
Theme 5: Boosting intra-African trade in agricultural commodities and services 3
Theme 6: Enhancing resilience to climate variability 3
Theme 7: Mutual accountability for results and actions 3
Total number of indicators 47
Source: Authors based on AUC and NPCA 2015 and AUC 2014.

2020 ReSAKSS Annual Trends and Outlook Report 197
investments in agriculture; and increased capacity to generate, analyze, and use data, information, knowledge, and innovations. There are 38 indicators in the CAADP RF: 14 for level 1, 12 for level 2, and 12 for level 3 (Table 16.1).
Although the CAADP RF is intended to help track progress in implementing the Malabo Declaration, the CAADP BR process initiated in 2015 introduced indicators aimed at monitoring the specific commitments in the declaration using the Africa Agriculture Transformation Scorecard (AATS) (Table 16.1). Although there is considerable overlap between CAADP RF and CAADP BR indicators, some of the indicators in both the CAADP RF and the CAADP BR are not yet included in the ReSAKSS database because data are not yet consistently available at all or not available across all countries to allow for cross-country aggregation. These include several indicators on access to finance, private sector investment, postharvest loss, women’s empowerment, food safety, and resilience.
Objectives of the ChapterThis chapter discusses progress on 25 of the 38 CAADP RF indicators for which cross-country data are available (Table 16.2)—details of the indicators and aggregate statistics are available in the data tables in Annexes 1–3 of this report. Progress is discussed across different geographic and economic groupings on the continent, comparing trends in the RF indicators since the adoption of CAADP in 2003 (that is, from 2003 to 2019) with the pre-CAADP subperiod (1995 to 2003). In keeping with the policy theme of the 2020 ATOR, this chapter also discusses recent policy adjustments due to the COVID-19 pandemic in selected African countries. Starting with the next section, the chapter also discusses the CAADP implementation process itself in terms of country and regional progress in developing evidence-based, Malabo-compliant national agriculture investment plans (NAIPs) and operationalizing CAADP mutual accountability processes to support agriculture sector review and dialogue.
Progress in CAADP Implementation ProcessesOperationalizing the Malabo Declaration and the CAADP RF requires countries and regional economic communities (RECs) to develop national or regional agriculture investment plans that align with the goals and targets of the declara-tion. The NAIP development or updating process at the country level starts with a Malabo NAIP domestication event, led by AUC, AUDA-NEPAD, and RECs, that convenes national CAADP constituencies to discuss and agree on a country
TABLE 16.2—CAADP RESULTS FRAMEWORK INDICATORS DISCUSSED
No. Level 1: Agriculture’s contribution to economic growth and inclusive development
1 L1.1.1 GDP per capita (constant 2010 US$)
2 L1.1.2 Household final consumption expenditure per capita (constant 2010 US$)
3 L1.2.1 Prevalence of undernourishment (% of population)
4 L1.2.2a Prevalence of underweight, weight for age (% of children under 5)
5 L1.2.2b Prevalence of stunting, height for age (% of children under 5)
6 L1.2.2c Prevalence of wasting, weight for height (% of children under 5)
7 L1.2.3 Cereal import dependency index
8 L1.3.1 Employment rate
9 L1.3.3 Poverty gap at $1.90 a day (2011 PPP)
10 L1.3.4 Extreme poverty headcount ratio at $1.90 a day (2011 PPP), % of population
No. Level 2: Agricultural transformation and sustained inclusive agricultural growth
11 L2.1.1 Agriculture value added (million, constant 2010 US$)
12 L2.1.2 Agriculture Production Index (2004–2006 = 100)
13 L2.1.3 Agriculture value added per agricultural worker (constant 2010 US$)
14 L2.1.4 Agriculture value added per hectare of agricultural land (constant 2010 US$)
15 L2.2.1 Value of intra-African agricultural trade (constant 2010 US$, million)
16 L2.4.2 Existence of food reserves, local purchases for relief programs, early warning systems, and school feeding programs
No. Level 3: Strengthening systemic capacity to deliver results
17 L3.1.1 Existence of a new NAIP/NAFSIP developed through an inclusive and participatory process
18 L3.2.1 Existence of inclusive institutionalized mechanisms for mutual accountability and peer review
19 L3.3.1 Existence of and quality in the implementation of evidence-informed policies and corresponding human resources
20 L3.4.1 Existence of a functional multisectoral and multistakeholder coordination body
21 L3.4.2 Cumulative number of agriculture-related public-private partnerships (PPPs) that are successfully undertaken
22 L3.5.1 Government agriculture expenditure (billion, constant 2010 US $)
23 L3.5.2 Government agriculture expenditure (% of total government expenditure)
24 L3.5.3 Government agriculture expenditure (% of agriculture value added)
25 L3.6.2 Existence of an operational country SAKSS
Source: AUC and NPCA (2015).Note: GDP = gross domestic product; NAFSIP = national agriculture and food security investment plan; NAIP = national agriculture investment plan; PPP = purchasing power parity; SAKSS = Strategic Analysis and Knowledge Support System.

198 resakss.org
roadmap to review and revise the NAIP. The roadmap specifies roles, timelines, and coordination modalities needed to generate a NAIP that receives broad support from national stakeholders. To date, domestication events have been held in 25 countries (Table L3(a) in Annex 3d).
ReSAKSS, in partnership with local experts, provides analysis to inform the design of country NAIPs in the form of three main deliverables: the Malabo Status Assessment and Profile (SAP), the Malabo Goals and Milestones Report (MGM), and the Policy and Program Opportunities Report (PPO). By the end of September 2020, ReSAKSS had completed SAP reports for 31 countries and MGM reports for 25 countries (Table L3(a)). In addition, a total of 9 thematic PPO reports had been completed, as well as PPO reports for 8 countries in Central and Southern Africa: Angola, Botswana, Eswatini, Gabon, Lesotho, Namibia, Zambia, and Zimbabwe. The 9 thematic PPO reports covered the following areas: regional trade, value chain development, food security and nutri-tion, gender, climate-smart agriculture, social protection, agricultural technical vocational education and training (ATVET), and mutual accountability. All of the reports (SAP, MGM, and PPO) were shared with country NAIP teams to inform their NAIP formulation processes. Furthermore, a total of 21 African countries had drafted, reviewed, and/or validated a Malabo-compliant NAIP by the end of September 2020 (Table L3(a)).
Mutual accountability is a core principle of CAADP; it is a process by which two or more partners agree to be held responsible for commitments that they have voluntarily made to each other (OECD 2009). Agriculture joint sector reviews (JSRs) are one way of operationalizing mutual accountability at the country and regional levels. JSRs provide an inclusive, evidence-based platform for multiple stakeholders to jointly review progress; hold each other accountable for actions, results, and commitments; and based on gaps identified, agree on future implementation actions. At the request of AUC and AUDA-NEPAD, ReSAKSS has been strengthening agriculture JSRs since 2014. ReSAKSS has, to date, initiated agriculture JSR assessments in 26 countries and completed them in 21 countries (Table L3(a)). At the regional level, ReSAKSS also conducted JSR assessments for the Economic Community of West African States (ECOWAS) in 2015 and for the East African Community (EAC) in 2019. The assessments
1 The eBR is a web-based data entry and management tool for the BR process.
evaluate the institutional and policy landscape as well as the quality of current agricultural review processes, identifying areas that need strengthening in order to help countries and RECs develop JSR processes that are regular, comprehen-sive, and inclusive. Outcomes of the assessments have been used to strengthen agriculture JSR processes where they exist and establish new JSRs where none exist. According to a study by Nhemachena, Matchaya, and Nhlengethwa (2017), improvements made following the assessments have resulted in expanding the scope of what is reviewed in JSRs, raising accountability standards, enhancing stakeholder engagement, and increasing active participation by nonstate actors.
The CAADP BR is another way of operationalizing mutual accountability by monitoring continental progress toward meeting Malabo Declaration commit-ments by 2025. To date, Africa has held two BRs, the first in 2017 and the second in 2019. The launch of each continental BR report and AATS marked important milestones in promoting mutual accountability on the African continent. For the second BR, 49 out of 55 AU member states submitted country BR reports, compared with 47 during the inaugural BR (Table L3(a)). With a higher bench-mark score to assess progress in the 2019 BR, only 4 out of 49 countries are on track to achieve the Malabo commitments by 2025, compared with 20 during the 2017 BR (AUC 2020). Nonetheless, the 2019 BR report shows that 36 out of 49 reporting AU member states improved their overall agricultural transformation scores, compared with 2017 (AUC 2020).
Following the launch of the second BR report and AATS during the 33rd AU Summit, February 9–10, 2020, ReSAKSS conducted analysis of the lessons and implications of the second BR results and prepared country and regional briefs that distill findings of the second BR for country and regional learning events. Preparations for the 2021 BR began during the second half of 2020, and ReSAKSS will provide technical support to improve BR indicators, guidelines, the eBR,1 and other tools; train AU member states on the BR improvements; and support countries as they compile, analyze, validate, and report on their data. ReSAKSS will also support RECs with reviewing country data and producing regional summaries, and support AUC with the production of the third continental BR report and AATS.

2020 ReSAKSS Annual Trends and Outlook Report 199
Progress in CAADP IndicatorsThis section discusses Africa’s performance on 25 of the 38 CAADP RF indicators for which data are available—19 quantitative and all 6 qualitative indicators, orga-nized by the three RF levels.2 Data on the 25 indicators are presented in Annexes 1–3. Unlike the qualitative indicators, which are presented primarily at the country level, progress on the quantitative indicators is presented at the aggregate level in seven different breakdowns: (1) for Africa as a whole; (2) by the AU’s five geographic regions (Central, Eastern, Northern, Southern, and Western); (3) by five economic categories (countries with less favorable agricultural conditions, countries with more favorable agricultural conditions, mineral-rich countries, lower-middle-income countries, and upper-middle-income countries); (4) by the eight RECs (CEN-SAD, COMESA, EAC, ECCAS, ECOWAS, IGAD, SADC, and UMA);3 (5) by the period during which countries signed the CAADP compact (CC0, CC1, CC2, and CC3);4 (6) by the level or stage of CAADP implementation reached by the end of 2015 (CL0, CL1, CL2, CL3, and CL4);5 and (7) by the dis-tribution of countries in formulating first- and second-generation NAIPs (N00, N10, and N11).6 Annex 4 lists countries in the various geographic, economic, and REC categories; Annex 5 lists the countries in the different groupings for CAADP compact signing or level of implementation reached; and Annex 6 lists countries by NAIP formulation category. Progress is also reported over differ-ent subperiods, with achievement in post-CAADP subperiods—that is, annual average levels over the periods 2003 to 2008, 2008 to 2014, and 2014 to 2019—compared with achievement in the pre-CAADP subperiod of 1995 to 2003.7
2 Several of these indicators are also part of the CAADP BR and AATS.3 CEN-SAD = Community of Sahel-Saharan States; COMESA = Common Market for Eastern and Southern Africa; EAC = East African Community; ECCAS = Economic Community of Central African
States; ECOWAS = Economic Community of West African States; IGAD = Intergovernmental Authority on Development; SADC = Southern African Development Community; UMA = Arab Maghreb Union.
4 CC1 = group of countries that signed the compact in 2007–2009; CC2 = group of countries that signed the compact in 2010–2012; CC3 = group of countries that signed the compact in 2013–2015; CC0 = group of countries that have not yet signed a CAADP compact.
5 CL0 = group of countries that have not started the CAADP process or have not yet signed a compact; CL1 = group of countries that have signed a CAADP compact; CL2 = group of countries that have signed a compact and formulated an NAIP; CL3 = group of countries that have signed a compact, formulated an NAIP, and secured one external funding source; CL4 = group of countries that have signed a compact, formulated an NAIP, and secured more than one external funding source.
6 N00 = group of countries that have neither a first-generation NAIP (NAIP1.0) nor a second-generation NAIP (NAIP2.0); N10 = group of countries that have NAIP1.0 but do not have NAIP2.0; N11 = group of countries that have both NAIP1.0 and NAIP2.0.
7 Considering that CAADP was launched in 2003, renewed in 2008, and renewed again 2014 with the Malabo Declaration, the years 2003, 2008, and 2014 represent important milestones. Therefore, the post-CAADP subperiods for reporting on progress use overlapping years to mark these milestones that usually occurred during the middle of the year in June, that is, 2003–2008, 2008–2014, and 2014–2019.
The discussion of trends and changes in CAADP indicators pertains to country categories or groupings as a whole and not individual countries within the categories; for example, it relates to Africa as a whole, Central Africa as a group, ECOWAS members as a group, and groups of countries categorized by their stage of CAADP implementation and NAIP formulation experience. Presenting the trends by different groups helps to determine how the implications for strength-ening or maintaining desirable outcomes or for reversing undesirable outcomes may differ across the continent, without inference of causality. Unless otherwise stated, all monetary values have been converted into constant 2010 US dollar prices for intertemporal and cross-country or cross-category comparisons.
CAADP Results Framework Level 1 Indicators: Agriculture’s Contribution to Economic Growth and Inclusive DevelopmentWealth CreationAcross all country groupings, real gross domestic product (GDP) growth, measured by GDP per capita, has continued to decelerate since 2008 compared with the growth achieved between 2003 and 2008. For Africa as whole, although annual GDP per capita grew by an annual average rate of 3.3 percent in 2003–2008, it slowed to 1.2 percent in 2008–2014 and further decelerated to 0.2 percent in 2014–2019 (Figure 16.1; Table L1.1.1). The decline is linked to the recent global economic slowdown and lower commodity prices, particularly in 2016. Although several country groupings witnessed negative GDP per capita growth

200 resakss.org
during the most recent subperiod, 2014–2019, the highest growth, of at least 2.4 percent, occurred in Eastern Africa, countries with more favorable agricultural conditions (Figure 16.1), EAC countries, Intergovernmental Authority on Development (IGAD) countries, and countries that have been implementing CAADP longer (CC2). In terms of levels, GDP per capita grew consistently over the review period for Africa as a whole and most of the country groupings. In particular, Africa’s GDP per capita rose from an annual average level of $1,494 in 1995–2003 to $1,735 in 2003–2008 and reached $2,005 in 2014–2019. Upper-middle-income countries, the Arab Maghreb Union (UMA), and countries that have not yet joined the CAADP process (CC0 and CL0) registered the highest levels of annual average GDP per capita, of more than $4,000, in 2014–2019. Over the same period, countries with less and more favorable agri-cultural conditions and mineral-rich countries recorded the lowest levels of GDP per capita, of less than $700 per year (Table L1.1.1).
Another measure of household living stan-dards is household consumption expenditure per capita, an essential indicator of household demand for goods and services. Similar to the pattern observed with GDP per capita, growth in household consumption expenditure per capita has also decelerated since 2008 for Africa as a whole and for most of the country groupings. For Africa as a whole, household consumption expenditure per capita grew by 2.2 percent in 2003–2008 and by 0.7 percent in 2008–2014; it contracted by 1.4 percent in 2014–2019 (Table L1.1.2). Northern Africa, Western Africa, and UMA saw consistent increases in the growth rate from the pre-CAADP subperiod (1995–2003) to the post-CAADP subperiod (2003–2019). In level terms, similar to GDP per capita, household consumption expenditure per capita has steadily increased over time across most country
groupings, with the exception of the Common Market for Eastern and Southern Africa (COMESA) and IGAD. For example, for Africa as a whole, it grew margin-ally, from an annual average level of $1,117 in the early CAADP era of 2003–2008, to $1,223 and $1,297 in 2008–2014 and 2014–2019, respectively.
Food and Nutrition SecurityThe prevalence of undernourishment measures the percentage of the population whose dietary energy intake is lower than the minimum energy requirement. Although the prevalence of undernourishment was declining for many years, it has increased across many country groupings in more recent years, especially
FIGURE 16.1—GROSS DOMESTIC PRODUCT PER CAPITA (CONSTANT 2010 US DOLLARS), ANNUAL AVERAGE PERCENTAGE CHANGE, 2003–2019
-3
-1
1
3
5
7
A
fric
a
C
entr
al A
fric
a
E
aste
rn A
fric
a
N
orth
ern
Afr
ica
S
outh
ern
Afr
ica
W
este
rn A
fric
a
Ann
ual a
vera
ge c
hang
e (%
)
Annual avg. change (2003-2008) Annual avg. change (2008-2014) Annual avg. change (2014-2019)
L
ess
favo
rab
le
agric
ultu
re c
ondi
tions
M
ore
favo
rab
le
M
iner
al-r
ich
coun
trie
s
L
ower
mid
dle-
inco
me
cou
ntrie
s
U
pp
er m
iddl
e-in
com
e co
untr
ies
agric
ultu
re c
ondi
tions
Source: ReSAKSS based on World Bank (2020) and ILO (2020).

2020 ReSAKSS Annual Trends and Outlook Report 201
starting in 2015 (Figure 16.2). For Africa as a whole, the proportion of the population suffering from undernourishment declined from an average of 20.6 percent over 2003–2008 to 18.1 percent during 2008–2014, and it increased slightly, to 18.6, in 2017, the latest year for which data are available (Table L1.2.1; Figure 16.2). The proportion also increased, by more than 2.5 percent, across several other country groupings during 2014–2017, including in Central Africa, Western Africa, countries with less favorable agricultural conditions, mineral-rich countries, lower-middle-income countries, countries in the Community of Sahel-Saharan States (CEN-SAD), EAC and ECOWAS countries, countries that have been implementing CAADP longer (CC1 and CC2), countries that have not advanced in implementing CAADP (CL2), countries that are further along in CAADP implementation (CL3 and CL4), and countries that have
formulated both a first-generation NAIP1 and a second-generation NAIP2 (N11). The increas-ing trend in the proportion of people suffering from undernourishment threatens Africa’s ability to meet the Malabo Declaration goal of ending hunger by 2025 (FAO and UNECA 2018). The only region that continued to experi-ence a consistent decline in the prevalence of undernourishment, albeit slow, was Northern Africa, where the prevalence fell from a low 4.9 percent in 2008–2014 to 4.2 percent in 2017 (Figure 16.2).
The prevalence of malnutrition among children younger than five years—that is, stunting (low height for age), underweight (low weight for age), and wasting (low weight for height)—has been on a declining trend over the last two decades. Stunting is the most common indicator of chronic malnutrition. For Africa as a whole and for the various country groupings, although it remains high (more than 30 percent) according to World Health Organization (2020) prevalence ranges, the prevalence of stunting
consistently declined throughout the review period. However, it is worth noting that no country grouping experienced very high prevalence rates, more than 40 percent, during the most recent period, 2014–2019. For Africa as a whole, the prevalence slowly declined from an annual average level of 39.9 percent in 1995–2003 to 34.4 percent in 2008–2014 and to 31.8 percent in 2014–2019 (Table L1.2.2B; Figure 16.3). During the latest period, 2014–2019, the highest prevalence rates, greater than 37 percent, were observed in Central Africa, in countries with less favorable agriculture conditions, in mineral-rich countries, in Economic Community of Central African States (ECCAS) countries, in countries that have not advanced in CAADP implementation (CL2), and in countries that have formulated only a first-generation NAIP1 (N10). The only country groupings with low prevalence of stunting—that is, less than 20 percent—are Northern Africa
FIGURE 16.2—PREVALENCE OF UNDERNOURISHMENT IN AFRICA (PERCENTAGE OF POPULATION), 2000–2017
0
5
10
15
20
25
30
35
40
4520
00
2001
2002
2003
2004
2005
2006
2007
2008
2009
2010
2011
2012
2013
2014
2015
2016
2017
Africa Central Africa Eastern Africa Northern Africa Southern Africa Western Africa
Source: ReSAKSS based on World Bank (2020) and ILO (2020).

202 resakss.org
and UMA member countries, at 18.0 percent and 15.8 percent in 2014–2019, respectively. Between 2003–2008 and 2014–2019, the largest reduc-tions in child stunting, of more than 17 percent, occurred in Eastern and Northern Africa; coun-tries with more favorable agricultural conditions; EAC, IGAD, and UMA; countries that are further along in implementing CAADP (CL4); and countries that have formulated both NAIP1 and NAIP2 (N11). Meanwhile, the smallest reduc-tion, of less than 10 percent, occurred in Central Africa, countries with less favorable agricultural conditions, upper-middle-income countries, and countries that are not advanced in CAADP implementation (CL2).
For Africa as a whole, the prevalence of under-weight children declined from an annual average level of 22.2 percent in 1995–2003 to 20.1 percent in 2003–2008, and further down to 16.4 percent in 2014–2019 (Table L1.2.2A; Figure 16.3). This decline represents a moderate improvement in the prevalence of underweight for Africa, moving from high prevalence in the pre-CAADP period to medium prevalence in the post-CAADP period. Despite consistent declines over time, however, the prevalence of underweight remains high, at more than 20 percent, in several country groupings, including Central and Eastern Africa, countries with less favorable agricultural conditions, mineral-rich countries, IGAD members, countries that joined CAADP early by signing a CAADP compact in 2007–2009 (CC1), countries that have not progressed much in the CAADP implementation process (CL1), and countries that have formulated only NAIP1 (N10). Between 2003–2008 and 2014–2019, relatively higher reductions in underweight prevalence, of more than 25 percent, were witnessed in Northern and Southern Africa, countries with more favorable agricultural conditions, upper-middle-income countries, EAC countries, UMA countries, and countries that are furthest along in CAADP implementation (CL4);
the lowest reduction in prevalence, of less than 10 percent, occurred in countries that have not advanced in CAADP implementation (CL1).
A measure of acute malnutrition, the prevalence of wasting in children younger than five, declined from 9.8 percent in 1995–2003 to 7.3 percent in 2014–2019 for Africa as a whole (Table L1.2.2C).The declining trend is observed across all country groupings, with Southern and Western Africa, mineral-rich countries, ECOWAS and Southern African Development Community (SADC) countries, and countries that are the furthest along in the CAADP implementation process (CL4) experiencing the largest declines in wasting, of at least 27 percent, between 2003–2008 and 2014–2019. The group of countries in COMESA, countries that have not formulated both NAIP1 and NAIP2 (N00), and countries that have not advanced in implementing CAADP (CL1) saw the lowest reductions in the preva-lence of wasting over the same period. However, Northern Africa experienced
FIGURE 16.3—PREVALENCE OF UNDERWEIGHT, STUNTING, AND WASTING IN AFRICA (PERCENTAGE OF CHILDREN YOUNGER THAN FIVE), 2014–2019
0
5
10
15
20
25
30
35
40
45
A
fric
a
C
entr
al A
fric
a
E
aste
rn A
fric
a
N
orth
ern
Afr
ica
S
outh
ern
Afr
ica
W
este
rn A
fric
a
Ann
ual a
vera
ge le
vel (
%)
Stunting Underweight Wasting
L
ess
favo
rab
le
agric
ultu
re c
ondi
tions
M
ore
favo
rab
le
M
iner
al-r
ich
coun
trie
s
L
ower
mid
dle-
inco
me
cou
ntrie
s
U
pp
er m
iddl
e-in
com
e co
untr
ies
agric
ultu
re c
ondi
tions
Source: ReSAKSS based on World Bank (2020) and ILO (2020).
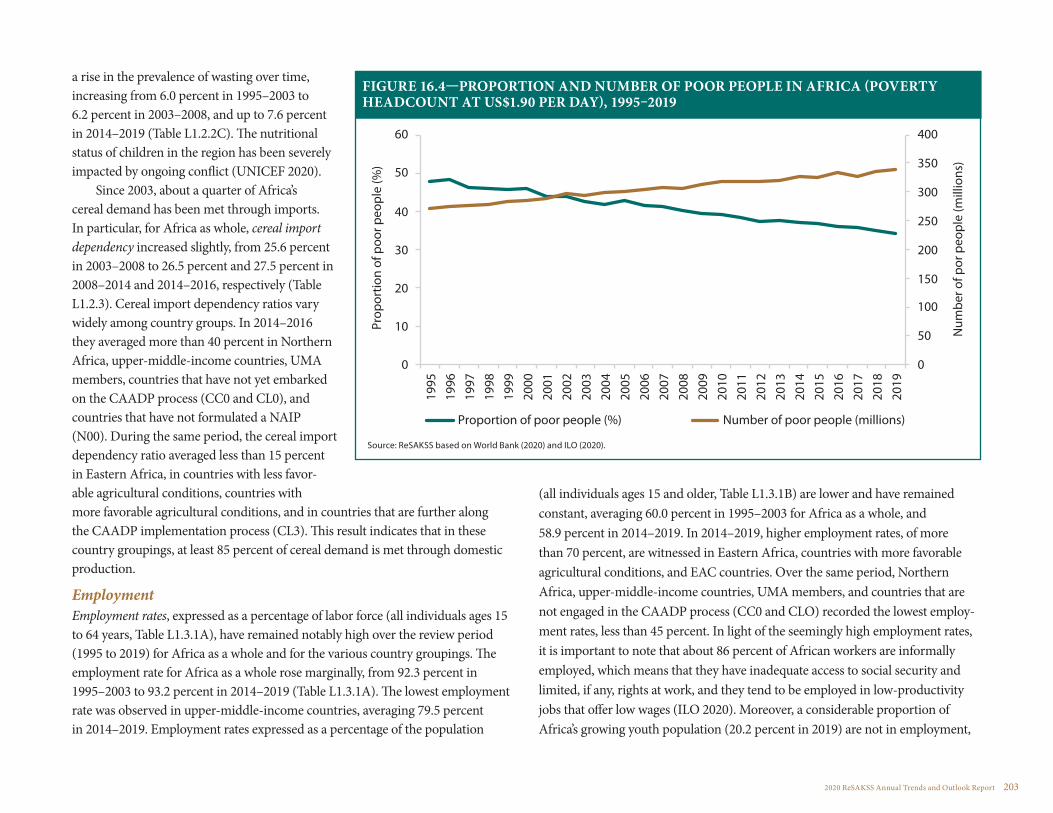
2020 ReSAKSS Annual Trends and Outlook Report 203
a rise in the prevalence of wasting over time, increasing from 6.0 percent in 1995–2003 to 6.2 percent in 2003–2008, and up to 7.6 percent in 2014–2019 (Table L1.2.2C). The nutritional status of children in the region has been severely impacted by ongoing conflict (UNICEF 2020).
Since 2003, about a quarter of Africa’s cereal demand has been met through imports. In particular, for Africa as whole, cereal import dependency increased slightly, from 25.6 percent in 2003–2008 to 26.5 percent and 27.5 percent in 2008–2014 and 2014–2016, respectively (Table L1.2.3). Cereal import dependency ratios vary widely among country groups. In 2014–2016 they averaged more than 40 percent in Northern Africa, upper-middle-income countries, UMA members, countries that have not yet embarked on the CAADP process (CC0 and CL0), and countries that have not formulated a NAIP (N00). During the same period, the cereal import dependency ratio averaged less than 15 percent in Eastern Africa, in countries with less favor-able agricultural conditions, countries with more favorable agricultural conditions, and in countries that are further along the CAADP implementation process (CL3). This result indicates that in these country groupings, at least 85 percent of cereal demand is met through domestic production.
EmploymentEmployment rates, expressed as a percentage of labor force (all individuals ages 15 to 64 years, Table L1.3.1A), have remained notably high over the review period (1995 to 2019) for Africa as a whole and for the various country groupings. The employment rate for Africa as a whole rose marginally, from 92.3 percent in 1995–2003 to 93.2 percent in 2014–2019 (Table L1.3.1A). The lowest employment rate was observed in upper-middle-income countries, averaging 79.5 percent in 2014–2019. Employment rates expressed as a percentage of the population
(all individuals ages 15 and older, Table L1.3.1B) are lower and have remained constant, averaging 60.0 percent in 1995–2003 for Africa as a whole, and 58.9 percent in 2014–2019. In 2014–2019, higher employment rates, of more than 70 percent, are witnessed in Eastern Africa, countries with more favorable agricultural conditions, and EAC countries. Over the same period, Northern Africa, upper-middle-income countries, UMA members, and countries that are not engaged in the CAADP process (CC0 and CLO) recorded the lowest employ-ment rates, less than 45 percent. In light of the seemingly high employment rates, it is important to note that about 86 percent of African workers are informally employed, which means that they have inadequate access to social security and limited, if any, rights at work, and they tend to be employed in low-productivity jobs that offer low wages (ILO 2020). Moreover, a considerable proportion of Africa’s growing youth population (20.2 percent in 2019) are not in employment,
FIGURE 16.4—PROPORTION AND NUMBER OF POOR PEOPLE IN AFRICA (POVERTY HEADCOUNT AT US$1.90 PER DAY), 1995–2019
0
50
100
150
200
250
300
350
400
0
10
20
30
40
50
60
1995
1996
1997
1998
1999
2000
2001
2002
2003
2004
2005
2006
2007
2008
2009
2010
2011
2012
2013
2014
2015
2016
2017
2018
2019
Num
ber o
f por
peo
ple
(mill
ions
)
Prop
ortio
n of
poo
r peo
ple
(%)
Proportion of poor people (%) Number of poor people (millions)
Source: ReSAKSS based on World Bank (2020) and ILO (2020).
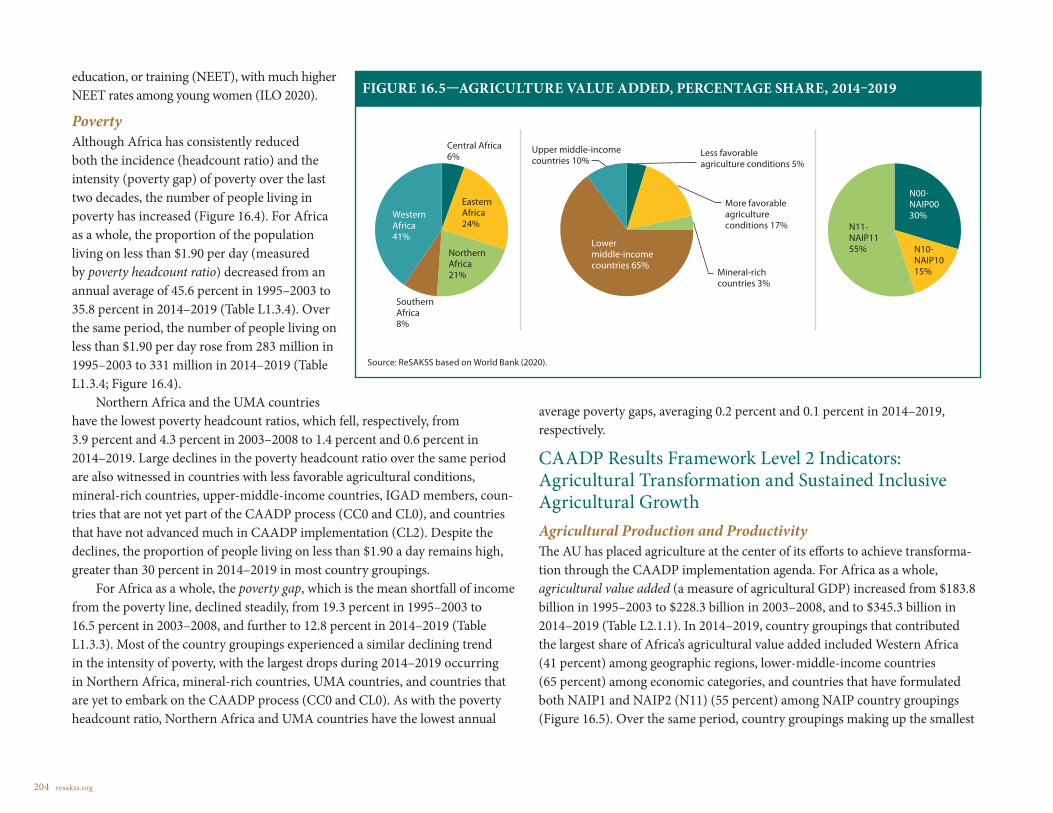
204 resakss.org
education, or training (NEET), with much higher NEET rates among young women (ILO 2020).
PovertyAlthough Africa has consistently reduced both the incidence (headcount ratio) and the intensity (poverty gap) of poverty over the last two decades, the number of people living in poverty has increased (Figure 16.4). For Africa as a whole, the proportion of the population living on less than $1.90 per day (measured by poverty headcount ratio) decreased from an annual average of 45.6 percent in 1995–2003 to 35.8 percent in 2014–2019 (Table L1.3.4). Over the same period, the number of people living on less than $1.90 per day rose from 283 million in 1995–2003 to 331 million in 2014–2019 (Table L1.3.4; Figure 16.4).
Northern Africa and the UMA countries have the lowest poverty headcount ratios, which fell, respectively, from 3.9 percent and 4.3 percent in 2003–2008 to 1.4 percent and 0.6 percent in 2014–2019. Large declines in the poverty headcount ratio over the same period are also witnessed in countries with less favorable agricultural conditions, mineral-rich countries, upper-middle-income countries, IGAD members, coun-tries that are not yet part of the CAADP process (CC0 and CL0), and countries that have not advanced much in CAADP implementation (CL2). Despite the declines, the proportion of people living on less than $1.90 a day remains high, greater than 30 percent in 2014–2019 in most country groupings.
For Africa as a whole, the poverty gap, which is the mean shortfall of income from the poverty line, declined steadily, from 19.3 percent in 1995–2003 to 16.5 percent in 2003–2008, and further to 12.8 percent in 2014–2019 (Table L1.3.3). Most of the country groupings experienced a similar declining trend in the intensity of poverty, with the largest drops during 2014–2019 occurring in Northern Africa, mineral-rich countries, UMA countries, and countries that are yet to embark on the CAADP process (CC0 and CL0). As with the poverty headcount ratio, Northern Africa and UMA countries have the lowest annual
average poverty gaps, averaging 0.2 percent and 0.1 percent in 2014–2019, respectively.
CAADP Results Framework Level 2 Indicators: Agricultural Transformation and Sustained Inclusive Agricultural GrowthAgricultural Production and ProductivityThe AU has placed agriculture at the center of its efforts to achieve transforma-tion through the CAADP implementation agenda. For Africa as a whole, agricultural value added (a measure of agricultural GDP) increased from $183.8 billion in 1995–2003 to $228.3 billion in 2003–2008, and to $345.3 billion in 2014–2019 (Table L2.1.1). In 2014–2019, country groupings that contributed the largest share of Africa’s agricultural value added included Western Africa (41 percent) among geographic regions, lower-middle-income countries (65 percent) among economic categories, and countries that have formulated both NAIP1 and NAIP2 (N11) (55 percent) among NAIP country groupings (Figure 16.5). Over the same period, country groupings making up the smallest
FIGURE 16.5—AGRICULTURE VALUE ADDED, PERCENTAGE SHARE, 2014–2019
Central Africa6%
Eastern Africa24%
NorthernAfrica21%
SouthernAfrica8%
WesternAfrica41%
More favorableagriculture conditions 17%
Mineral-richcountries 3%
Lower middle-incomecountries 65%
Upper middle-incomecountries 10%
N11-NAIP1155%
N00-NAIP0030%
N10-NAIP1015%
Less favorableagriculture conditions 5%
Source: ReSAKSS based on World Bank (2020).

2020 ReSAKSS Annual Trends and Outlook Report 205
shares of Africa’s agricultural value added included Central Africa (6 percent), countries with less favorable agricultural conditions (5 percent), mineral-rich countries (3 percent), and those that have designed only a first-generation NAIP1 (N10) (15 percent).
In terms of growth, agricultural value added for Africa as a whole remained at less than the 6 percent CAADP target throughout the review period (1995 to 2019). Specifically, it grew at an annual average rate of 4.6 percent in 1995–2003 and fell to 3.2 percent growth in 2014–2019 (Table L2.1.1). Although a handful of country groupings achieved growth rates of at least 6 percent
during the pre-CAADP era (1995–2003), only the group of countries that have not advanced in CAADP implementation (CL2) met the 6 percent target more recently, in 2014–2019, and EAC countries came close, at 5.8 percent. In addition, a total of 10 countries either met or surpassed the 6 percent target in 2014–2019, with Gabon, Guinea, and Kenya achieving growth rates of more than 10 percent (Figure 16.6).
The agricultural production index (API) shows total agricultural production for each year relative to the base period of 2004–2006. For Africa as a whole and all of the country groupings, API exhibited an increasing trend. For Africa as a
FIGURE 16.6—AGRICULTURAL VALUE-ADDED ANNUAL AVERAGE GROWTH (PERCENTAGE), 2008–2019
-20
-15
-10
-5
0
5
10
15
Gui
nea
Gab
onKe
nya
Gui
nea-
Biss
auN
iger
Zim
bab
we
Sene
gal
Rwan
da
Beni
nC
ongo
, Dem
. Rep
.Et
hiop
iaM
ali
Cam
eroo
nM
ozam
biq
ueA
lger
iaLe
soth
oTu
nisi
aEg
ypt
Tanz
ania
Equa
toria
l Gui
nea
Seyc
helle
sC
ent.
Af.
Rep
.U
gand
aTo
goM
aurit
ania
Con
go, R
ep.
Burk
ina
Faso
S. T
ome
& P
rinci
pe
Com
oros
Nig
eria
Mor
occo
Côt
e d
'Ivoi
reSi
erra
Leo
neG
hana
Lib
eria
Mad
agas
car
Mal
awi
Bots
wan
aC
had
Mau
ritiu
sEs
wat
ini
Nam
ibia
Sout
h A
fric
aG
amb
iaSu
dan
Buru
ndi
Ang
ola
Cab
o Ve
rde
Zam
bia
Ann
ual a
vera
ge c
hang
e (%
)
Annual avg. change (2008-2014) Annual avg. change (2014-2019) CAADP 6% target
Source: ReSAKSS based on World Bank (2020) and ILO (2020).

206 resakss.org
whole, API grew by 2.8 percent in 1995–2003 and by 3.6 percent in 2008–2014 (Table L2.1.2). In several country groupings, growth in API was highest in 2008–2014, increasing by more than 5 percent in Eastern Africa, countries with more favorable agricultural conditions, countries that have not advanced in CAADP implementation (CL1), and countries that have formulated only a first-generation NAIP (N10).
Labor and land productivity are essential for driving Africa’s agricultural growth and transformation. For Africa as a whole, both labor and land produc-tivity have consistently increased since 2008 compared with the earlier period of 2003–2008 (Figure 16.7). Agricultural labor productivity, measured by agricul-tural value added per agricultural worker, increased by 2.1 percent in 2008–2014 and by 1.4 percent in 2014–2019 (Table L2.1.3; Figure 16.7). Similarly, for most of the country groupings, the rate of growth in labor productivity was highest
during 2008–2014 when compared with the other periods. For the most recent period, 2014–2019, the annual average growth in labor productivity was highest (at least 4 percent) in Northern Africa, UMA countries, and non-CAADP countries (CC0 and CL0). These three country groupings also had the highest labor productivity levels, of more than $5,900 per agri-cultural worker, in 2014–2019, partially due to their higher levels of mechanization. Over the same period, decreases in labor productivity growth were recorded in Southern Africa, ECCAS and SADC members, the group of countries that signed a CAADP compact in 2013–2015 (CC3), those that are not advanced in CAADP implementation (CL1), and countries that have formulated only a first-generation NAIP (N10). The lowest labor productivity, of less than $700 per agricultural worker, was in Central Africa, countries with more favorable agricultural conditions, mineral-rich countries, and countries that are not advanced in CAADP implementation (CL2).
For Africa as whole, land productivity, measured by agricultural value added per hectare of arable land, grew more rapidly in 2014–2019 than in earlier subpe-
riods from 1995 to 2014 (Figure 16.7). Specifically, Africa’s land productivity grew at 4.9 percent in 2014–2019, compared with 1.6 percent in 2003–2008 and 3.2 percent in 1995–2003 (Table L2.1.4). Country groupings with the highest annual average growth in land productivity, of more than 6 percent, during the most recent period, 2014–2019, are Eastern Africa; lower-middle-income coun-tries; CEN-SAD, COMESA, and IGAD member countries; countries that signed a CAADP compact later (CC3); those that are not advanced in CAADP imple-mentation (CL1); and those that have formulated only a first-generation NAIP (N10). The highest annual average levels of land productivity in 2014–2019, more than $600 per hectare of arable land, are witnessed in IGAD countries, countries that joined CAADP early (CC1), and countries that are further along in the CAADP implementation process (CL4) (Table L2.1.4). Over the same subperiod, the lowest annual average level of land productivity (of less than $100
FIGURE 16.7—LABOR AND LAND PRODUCTIVITY IN AFRICA, ANNUAL AVERAGE GROWTH (PERCENTAGE)
-2
-1
0
1
2
3
4
5
6
1995-2003 2003-2008 2008-2014 2014-2019
Ann
ual a
vera
ge g
row
th (%
)
Labor productivity Land productivity
Source: ReSAKSS based on World Bank (2020) and FAO (2020).

2020 ReSAKSS Annual Trends and Outlook Report 207
per hectare of arable land) is observed in Southern Africa, a region that also experienced negative growth in land productivity.
Intra-African Agricultural Trade Tripling intra-African agricultural trade between 2015 and 2025, a key Malabo Declaration com-mitment, is critical for driving economic growth, generating jobs, and improving food and nutrition security, as well as advancing the objectives of the African Continental Free Trade Area agreement. Africa has witnessed remarkable annual average growth in intra-African agricultural exports and imports alike during the post-CAADP period (2003 to 2018) (Tables L2.2.1A and L2.2.1B). For Africa as a whole, intra-African agricultural exports nearly tripled between 1995–2003 and 2014–2018, rising from an annual average of $5.2 billion to $15.3 billion (Table L2.2.1A). Africa as a whole and several country groupings experienced stronger annual average growth in intra-African agricultural exports in 2008–2014 than in the most recent subperiod, 2014–2018. For example, intra-African agricultural exports, for Africa as a whole, grew at annual average rates of 9.2 percent and 3.0 percent in 2008–2014 and 2014–2018, respectively. However, a few country groupings were exceptions—Eastern Africa, IGAD members, countries that joined CAADP later (CC3), and countries that are not advanced in CAADP implementation (CL1)—with stronger annual average growth, of 14.5 percent or more, in 2014–2018.
Southern Africa has consistently made up about half of all intra-African agricultural exports, averaging 52 percent in 2014–2018, whereas Central Africa accounted for the smallest share, about 1 percent, over the same period (Figure 16.8). In terms of economic categories, lower-middle-income and
8 The value of intra-African agricultural exports and imports for Africa as a whole is expected to be equal. However, Tables TL2.2.1A and TL.2.2.1B show exports to be greater than imports, likely due to (1) differences in the ways in which the origins of initial exports versus re-exports are reflected in the imports; (2) differences in the valuation of exports versus imports in terms of using cost, insurance, and freight or free on board values; and (3) conversion of values measured in current US dollars to constant 2010 US dollars.
upper-middle-income countries make up the largest shares of intra-African agricultural exports, with about 40 percent each. Countries with less favorable agricultural conditions and mineral-rich countries contribute the smallest shares of intra-African agricultural exports. In addition, for the NAIP country groupings, countries that have not engaged in NAIP formulation (N00) made up the biggest share of intra-African agricultural exports, whereas those that have formulated only NAIP1 (N10) had the smallest share (Figure 16.8).
Intra-African agricultural imports for Africa as a whole more than doubled between 1995–2003 and 2014–2018, increasing from $6 billion to $14.2 billion (Table L2.2.1B).8 Similar to exports, intra-African agricultural imports also witnessed stronger annual average growth in Africa as a whole and several country groups in 2008–2014, compared with the most recent subperiod, 2014–2018. For example, Africa’s intra-African agricultural imports grew
FIGURE 16.8—INTRA-AFRICAN AGRICULTURAL EXPORTS, PERCENTAGE SHARE
Central Africa1%
Eastern Africa20%
NorthernAfrica14%
SouthernAfrica52%
WesternAfrica13%
More favorableagriculture conditions 17%
Mineral-richcountries 1%
Less favorableagriculture conditions 2%
Lower middle-incomecountries 40%
Upper middle-incomecountries 40% N11-
NAIP1127%
N00-NAIP0056%N10-
NAIP1017%
Source: ReSAKSS based on UNCTAD (2020) and World Bank (2020).
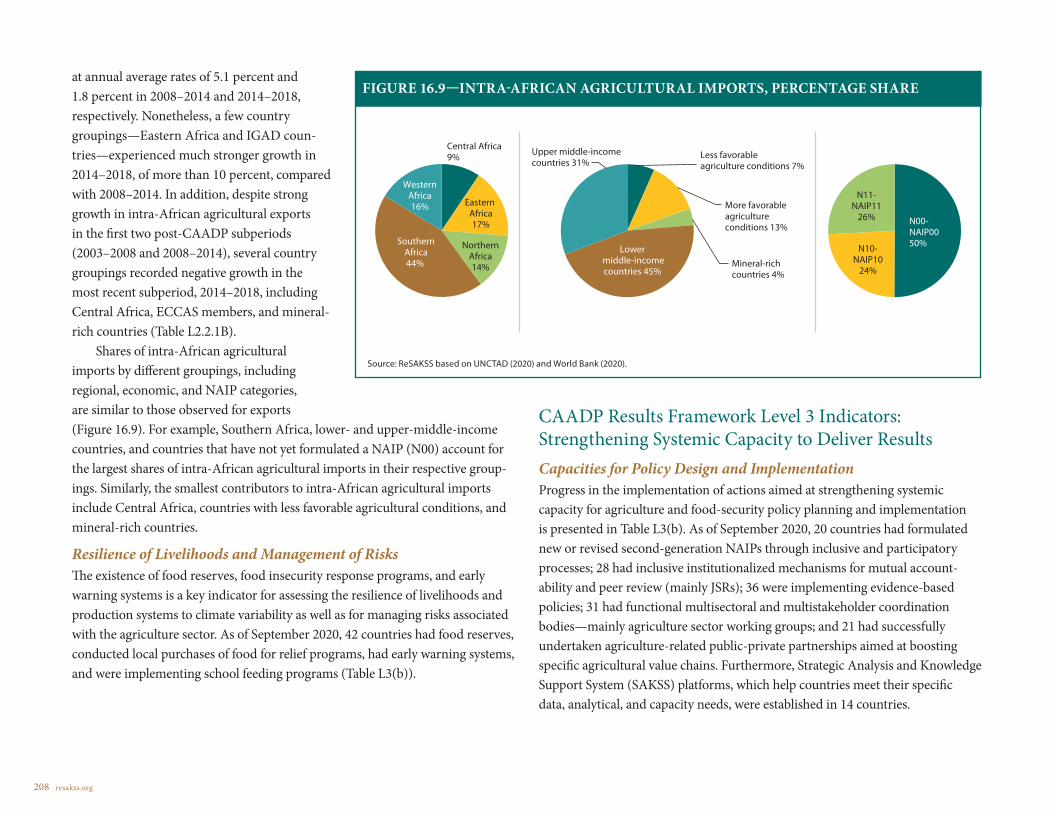
208 resakss.org
at annual average rates of 5.1 percent and 1.8 percent in 2008–2014 and 2014–2018, respectively. Nonetheless, a few country groupings—Eastern Africa and IGAD coun-tries—experienced much stronger growth in 2014–2018, of more than 10 percent, compared with 2008–2014. In addition, despite strong growth in intra-African agricultural exports in the first two post-CAADP subperiods (2003–2008 and 2008–2014), several country groupings recorded negative growth in the most recent subperiod, 2014–2018, including Central Africa, ECCAS members, and mineral-rich countries (Table L2.2.1B).
Shares of intra-African agricultural imports by different groupings, including regional, economic, and NAIP categories, are similar to those observed for exports (Figure 16.9). For example, Southern Africa, lower- and upper-middle-income countries, and countries that have not yet formulated a NAIP (N00) account for the largest shares of intra-African agricultural imports in their respective group-ings. Similarly, the smallest contributors to intra-African agricultural imports include Central Africa, countries with less favorable agricultural conditions, and mineral-rich countries.
Resilience of Livelihoods and Management of RisksThe existence of food reserves, food insecurity response programs, and early warning systems is a key indicator for assessing the resilience of livelihoods and production systems to climate variability as well as for managing risks associated with the agriculture sector. As of September 2020, 42 countries had food reserves, conducted local purchases of food for relief programs, had early warning systems, and were implementing school feeding programs (Table L3(b)).
CAADP Results Framework Level 3 Indicators: Strengthening Systemic Capacity to Deliver ResultsCapacities for Policy Design and ImplementationProgress in the implementation of actions aimed at strengthening systemic capacity for agriculture and food-security policy planning and implementation is presented in Table L3(b). As of September 2020, 20 countries had formulated new or revised second-generation NAIPs through inclusive and participatory processes; 28 had inclusive institutionalized mechanisms for mutual account-ability and peer review (mainly JSRs); 36 were implementing evidence-based policies; 31 had functional multisectoral and multistakeholder coordination bodies—mainly agriculture sector working groups; and 21 had successfully undertaken agriculture-related public-private partnerships aimed at boosting specific agricultural value chains. Furthermore, Strategic Analysis and Knowledge Support System (SAKSS) platforms, which help countries meet their specific data, analytical, and capacity needs, were established in 14 countries.
FIGURE 16.9—INTRA-AFRICAN AGRICULTURAL IMPORTS, PERCENTAGE SHARE
Central Africa9%
Eastern Africa17%
NorthernAfrica14%
SouthernAfrica44%
WesternAfrica16% More favorable
agriculture conditions 13%
Mineral-richcountries 4%
Lower middle-incomecountries 45%
Upper middle-incomecountries 31%
N11-NAIP11
26% N00-NAIP0050%N10-
NAIP1024%
Less favorableagriculture conditions 7%
Source: ReSAKSS based on UNCTAD (2020) and World Bank (2020).

2020 ReSAKSS Annual Trends and Outlook Report 209
Government Agriculture ExpenditureFor Africa as a whole, government agriculture expenditure (GAE) increased in real terms throughout the review period, more than doubling between 1995–2003 and 2014–2019. Specifically, Africa allocated an annual average of $9.6 billion to agriculture in 1995–2003, which rose to $13.1 billion in 2003–2008, and further to $19.6 billion in 2014–2019 (Table L3.5.1). However, in more recent years, the growth in Africa’s GAE has declined, increasing at annual average rate of 3.0 percent in 2014–2019, compared with 6.3 percent in 2003–2008 and 4.4 percent in 1995–2003. A similar growth trend in GAE is observed in the majority of the other country groupings, but a number of country groupings experienced negative growth in GAE in 2014–2019—Southern Africa, ECCAS and SADC countries, countries that joined CAADP late (CC3), countries have formulated only NAIP1 (N10), and the groups of countries that either are not advanced (CL1 and CL2) or are advanced (CL3) in CAADP implementation (Table L3.5.1).
In terms of geographic region, Northern Africa contributed the largest proportion of GAE (45 percent) in 2014–2019, whereas Central
Africa contributed the least (4 percent) (Figure 16.10). Within economic categories, lower-middle-income countries, followed by upper-middle-income countries, made up the highest shares of GAE in 2014–2019, of 45 percent and 32 percent, respectively, and mineral-rich countries made up the lowest share, of about 1 percent. Countries that have yet to formulate either a first-generation NAIP1 or a second-generation NAIP2 (N00) contributed the lion’s share of GAE, more than 50 percent, in 2014–2019, and the smallest contribution, of about 12 percent, came from countries that have formulated only a first-generation NAIP1 (N10).
For Africa as a whole and most of the country groupings, the share of agriculture expenditure in total government expenditure has consistently remained less than the CAADP
target of 10 percent of national budgets allocated to agriculture. For example, for Africa as whole, the share has remained fairly constant, declining slightly from 3.6 percent in 2003–2008 to 3.2 percent in 2008–2014 before rising marginally to 3.3 percent in 2014–2019 (Table L3.5.2). Only a handful of country groupings achieved agriculture expenditure shares of at least 7 percent in 2014–2019—countries with less or more favorable agricultural conditions, and those that are advanced in implementing CAADP (CL3). In addition, during the same period, Southern Africa, countries that joined CAADP later (CC3), and those that are not advanced in implementing CAADP (CL1) allocated the smallest shares of their budgets to agriculture, less than 2 percent. Notably, country groupings that are fairly advanced in CAADP implementation (such as CL3 countries) have allocated a larger proportion of their national budgets to agriculture, unlike those that joined the process later and have not progressed much in implementing the program (CC3 and CL1). Although no country grouping met the 10 percent budget target, a total of seven individual countries met or surpassed the target in 2014–2019—Burkina Faso, Ethiopia, Liberia, Malawi, Mali, Senegal, and Sierra Leone (Figure 16.11). Two countries came close to meeting the target—Benin
FIGURE 16.10—GOVERNMENT AGRICULTURE EXPENDITURE, PERCENTAGE SHARE
Central Africa4%
Eastern Africa15%
NorthernAfrica45%
SouthernAfrica19%
WesternAfrica17% More favorable
agriculture conditions 18%
Mineral-richcountries 1%
Lower middle-incomecountries 45%
Upper middle-incomecountries 32%
N11-NAIP11
31% N00-NAIP0057%
N10-NAIP10
12%
Less favorableagriculture conditions 4%
Source: ReSAKSS based on IFPRI (2020), World Bank (2020), and national sources.

210 resakss.org
(9.4 percent) and Nigeria (9.5 percent).
The share of GAE in agricultural GDP provides insights into how Africa is spending on agriculture relative to the size of its agricultural sector. For Africa as a whole, the share of GAE in agricultural GDP decreased marginally, from 5.9 percent in 2003–2008 to 5.7 percent in 2014–2019 (Table L3.5.3). Northern and Southern Africa, upper-middle-income countries, UMA members, and countries that have yet to embark on the CAADP process (CC0 and CL0) or have not yet formulated a NAIP1 (N00) consistently recorded the highest shares, of more than 10 percent, throughout the review period (1995–2019), reflecting the larger agriculture expenditures in these countries relative to the size of their agricultural sector.
Policy Responses to COVID-19 in Selected Countries To address the impact of the COVID-19 pandemic on agrifood systems, African countries have used a combination of fiscal, trade, social, and market policies. As expected, social protection initiatives are a significant part of COVID-19 response packages in most countries. Here we outline policy responses of selected
countries from when the pandemic broke out, in February 2020, up to the end of August 2020.
Nigeria: In April, the Nigerian federal government reduced the price of fertilizer from 5,500 Nigerian naira (N) to N 5,000 per 50-kilogram bag while offering farmers price subsidies for seeds to ensure the continuity of agricultural activities during the lockdown period (Nigerian Tribune 2020). Moreover, the government managed to secure €995 million worth of agricultural equipment, including tractors, to lease out to farmers (Chiejina 2020). It approved N 13 billion to control transboundary pests and minimize the impacts of COVID-19. The Central Bank of Nigeria is set to disburse no-interest loans to farmers through the Anchor Borrowers’ Programme and Targeted Credit Facility to
FIGURE 16.11—SHARE OF GOVERNMENT AGRICULTURE EXPENDITURE IN TOTAL PUBLIC EXPENDITURE (PERCENTAGE), 2008–2014 AND 2014–2019
0
5
10
15
20
25
Ethi
opia
Mal
awi
Sier
ra L
eone
Sene
gal
Mal
iLi
beria
Burk
ina
Faso
Nig
erBe
nin
Zam
bia
Leso
tho
Tuni
sia
Moz
ambi
que
Rwan
daCa
mer
oon
Cabo
Ver
deTo
goM
oroc
coZi
mba
bwe
Gam
bia
S. T
ome
& P
rinci
peM
adag
asca
rTa
nzan
iaCe
nt. A
f. Re
p.N
amib
iaEs
wat
ini
Uga
nda
Côte
d'Iv
oire
Gui
nea
Nig
eria
Keny
aM
aurit
ius
Gui
nea-
Biss
auCh
adSe
yche
lles
Egyp
tBu
rund
iBo
tsw
ana
Cong
o, R
ep.
Gab
onSo
uth
Afr
ica
Mau
ritan
iaSu
dan
Gha
naA
ngol
aSo
uth
Suda
nCo
mor
osEq
uato
rial G
uine
a
Annual avg. level (2014-2019) Annual avg. level (2008-2014) CAADP 10% target
Ann
ual a
vera
ge le
vel (
%)
Source: ReSAKSS based on IFPRI (2020), World Bank (2020), and national sources.
2020 ReSAKSS Annual Trends and Outlook Report 211
support households and small and medium enterprises affected by COVID-19. It also announced support for local maize farmers, who are expected to produce 12.5 million tons of maize over the 18 months starting in May 2020. The federal government has delivered 5,318 metric tons of assorted foodstuffs to the govern-ment of Kano state for distribution to the less privileged, the vulnerable, and people living with disabilities as palliatives against the effect of the COVID-19 pandemic (Abdullateef 2020).
Egypt: At the start of the wheat harvest season in April 2020, the government fixed the price at 700 Egyptian pounds per ardeb (150 kilograms) to support farmers and boost wheat reserves in the country over seven months (El Wardany 2020). The minister of agriculture, with the approval of the governor of the Central Bank of Egypt, has postponed debt payments by farmers for six months, until October 1, 2020. The government extended a moratorium on agricultural land taxes for a period of two years. At the same time, Egypt banned the export of pulses for three months, except for peanuts, green peas, and green beans (Egypt Today 2020). In April 2020, the country also changed its import tender policies by requiring suppliers to replace any wheat shipments impacted by COVID-19 transport restrictions with wheat from elsewhere and to bear the cost of doing so. The Ministry of Social Solidarity added 100,000 families to the country’s monetary subsidy program as Egypt expanded its social safety net program amid COVID-19. The families will receive a monthly social allowance (Bhatia 2020).
Ethiopia: Amid the COVID-19 pandemic, in April, the government of Ethiopia distributed agricultural inputs such as fertilizer, insecticide, and equipment to farmers across the country (Ethiopian News Agency 2020). The government requested international companies to supply the country with 18.1 million quintals of wheat, 1.73 million quintals of rice, 3.2 million quintals of sugar, and 104.3 million liters of edible oil, free of tax, in order to reduce any food shortages due to the pandemic. Only selected companies are expected to import wheat, but they will subcontract with local distributors to distribute the wheat to consumer cooperatives. The Ethiopian prime minister launched the “Each One Feed One” National Challenge, a nationwide effort to mobilize Ethiopians to provide a meal to the most vulnerable. The Ministry of Revenues and the Customs Commission jointly donated food and clothing worth over 1.4 billion Ethiopian birr to nine regional states, two city administrations, and 26 charities to address the impacts of COVID-19. The government also declared a state of emergency, which forbids landlords from increasing housing rents
and evicting tenants unless the tenants want to leave. The Federal Housing Corporation announced a 50 percent rent reduction starting in April. The state of emergency law also forbids companies from laying off workers and terminating employment during the period of emergency. The Commercial Bank of Ethiopia announced a three-month suspension of mortgage payments for condominium homes. It also announced a suspension of debt collection activity during the same period. On April 17, the Steering Committee for Ethiopia’s federal Urban Development Safety Net Program announced that (1) beneficiaries of the Urban Productive Safety Net Program would receive three monthly safety net payments in advance and (2) Ethiopians residing in 16 cities identified to be at high risk of COVID-19 exposure and who need assistance would also receive three months of safety net payments in advance. In May 2020, the Addis Ababa city administra-tion launched a food rationing program, funded by the Bill & Melinda Gates Foundation, to distribute food to more than 1,000 vulnerable people in the Lideta and Addis Ketema sub cities over a period of three months (Fana Broadcasting 2020). The city has also prepared more than 421 hectares of land for urban agri-culture to mitigate the impact of COVID-19 on food shortages.
Ghana: Under the country’s Coronavirus Alleviation Program, the presi-dent of Ghana announced that the government would allocate (1) 280 million Ghanaian cedis (GH¢) for food security among the most vulnerable and to pay the water bills of all Ghanaians from April to June; (2) GH¢323 million to support the healthcare sector; and (3) GH¢600 million for micro, small, and medium-scale businesses (CNBC Africa 2020). All water tankers, publicly and privately owned, have been mobilized to ensure a supply of water to all vulner-able communities. Beginning April 1, the government suspended rent charges for cargo during a partial three-week lockdown (Larnyoh 2020). Since March, the Ministry of Gender, Children and Social Protection, the Ministry of Local Government and Rural Development, and the National Disaster Management Organization, working with faith-based organizations, have provided food for up to 400,000 individuals and households in the areas affected by COVID-19-related restrictions. The Ghanaian government agreed to fully absorb the electricity bills of the poorest of the poor from April to June to provide free electricity for persons who consume up to 50 kilowatt hours a month. For all other residential consumers, the government agreed to cover 50 percent of their electricity bills for the period April to June.
212 resakss.org
Rwanda: On March 17, 2020, the Rwandan government set fixed prices for staple foods, and distributed food, under the supervision of local leaders, to the urban poor who cannot work and have no gardens (Rwanda, Ministry of Trade and Industry 2020). Also in March, the National Bank of Rwanda offered to buy back bonds at the prevailing market rate and reduce the waiting period for indi-viduals who fail to sell their bonds on the secondary market from 30 to 15 days. Since the beginning of the pandemic, the Rwanda Red Cross has supplied food items, face masks, and handwashing facilities to 13,000 families whose livelihoods were disrupted by the lockdown (African Business 2020).
The above discussion shows that countries have stepped up and enacted measures to mitigate the effects of COVID-19 on their respective agrifood systems. Although commendable, given the systemic nature of COVID-19, these individual country efforts are not enough to fully address the fallout from the pandemic. Coordination is needed to avoid conflicting initiatives with negative spillover effects. For example, some countries have imposed export bans on some products, which are likely to hurt their trading partners.
Therefore, countries need to sustain their COVID-19 responses aimed at improving food security by collectively implementing the short- and medium-term measures adopted by AU ministers of agriculture, trade, and finance on July 27, 2020, to ensure food and nutrition security in the midst of COVID-19. The measures include (1) recognizing food and agricultural input markets and supply chains as essential services and ensuring they remain open; (2) providing small-holder farmers with access to quality agricultural inputs and equipment to boost agricultural productivity; (3) ensuring the private sector has access to affordable finance to support local businesses and quality jobs; (4) applying digital technolo-gies to support agrifood systems and services; (5) reducing customs duties on food products to promote food security; (6) ensuring that borders remain open to facilitate regional trade in food and agricultural inputs; and (7) adjusting existing social safety net programs to address vulnerabilities due to COVID-19 (AU 2020).
Conclusions and ImplicationsThis chapter shows that Africa continues to steadily advance the CAADP implementation agenda. The launch of the second BR report and AATS at the AU summit in February 2020 marked an important milestone in promoting mutual accountability on the continent. The trends in CAADP indicators presented in this chapter show both progress being made and areas requiring urgent attention.
Owing to the recent global economic slowdown and lower commodity prices, Africa’s GDP per capita growth has continued to slow, reaching an annual average rate of 0.2 percent in 2014–2019. And in light of the COVID-19 pandemic and its damaging effects, Africa’s economic growth will likely contract further in 2020. Although Africa’s prevalence of undernourishment was declining for many years, more recently it rose from 18.1 percent in 2008–2014 to 18.6 percent in 2017. The increase was even higher in the Central and Western Africa regions. Moreover, despite declines over time in the prevalence rates for stunting, underweight, and wasting in children under five years old, they remain rather high for Africa and for many country groupings. Africa’s prevalence of stunting is considered high by WHO guidelines, at 31.8 percent in 2014–2019. Meanwhile, although Africa has consistently managed to reduce both the incidence and the intensity of poverty over time, the number of people living in poverty has been on the rise. In particular, whereas the proportion of Africa’s population living on less than $1.90 per day fell from 45.6 percent in 1995–2003 to 35.8 percent in 2014–2019, the number of people living on less than $1.90 per day rose from 283 million to 331 million over the same period. The chapter also shows that only a handful of countries have met or surpassed the CAADP targets of achieving 6 percent agricultural growth and allocating 10 percent of the national budget to agriculture.
These trends highlight the need for countries to consolidate the progress made while urgently tackling high levels of child malnutrition, rising undernour-ishment, and growing numbers of poor people. This will require policy actions to increase both agricultural investments and productivity, and to improve market access and trade infrastructure. Although the policy measures adopted to combat COVID-19 in the selected African countries reviewed in the chapter are commendable, coordination is needed across countries to avoid conflicting initiatives and negative spillovers. Thus, African governments need to collectively institute policies that keep borders open and promote cross-border trade in food and agricultural inputs. Investments to improve health and food security outcomes and support social protection and resilience-building initiatives for the most vulnerable groups are of the essence. Moreover, African leaders need to hasten their efforts to formulate and implement policies and evidence-based NAIPs that put countries on a trajectory to achieve the Malabo commitments by 2025.
2020 ReSAKSS Annual Trends and Outlook Report 213213 resakss.org
CHAPTER 17
Concluding Remarks
Danielle Resnick, Xinshen Diao, and Getaw Tadesse
214 resakss.org
The objectives of the 2020 Annual Trends and Outlook Report (ATOR) are twofold. First, the report tracks past and current African agricultural policies, and evaluates their limitations and achievements. Second, it
identifies further policy interventions to improve agricultural outcomes and stimulate broader transformation throughout the agrifood system so as to contribute to healthy and nutritious diets, environmental sustainability, and job creation. Collectively, the chapters converge on a number of key lessons: consolidate recent successes without repeating past mistakes, ensure that policies are both holistic and nuanced, and strengthen the broader policy and institutional setting in which sector-specific policy decisions are embedded. This chapter summarizes these findings and concludes that even though COVID-19 has been a significant global shock, it does not need to derail the region’s agrifood system transformation aspirations.
Consolidate Successes but Learn from the Past As a result of the 2014 Malabo Declaration by the African Union (AU), African countries have made many commitments, including to sustaining annual agricul-tural gross domestic product (GDP) growth of at least 6 percent, creating jobs for at least 30 percent of the youth in agricultural value chains, strengthening public-private partnerships, tripling intra-African trade, and improving the climate resilience of agricultural communities (AUC 2014). In many respects, there has been important progress toward meeting these commitments. For example, land and labor productivity growth improved significantly during the 2010–2018 period, compared with previous decades (chapter 2). Moreover, between 2004 and 2017, Africa’s share in world agricultural GDP increased from 10 percent to 12 percent (chapter 11). The nominal rate of assistance—the share by which gov-ernment policies have raised returns to farmers above what they would have been without such government intervention—shifted from being persistently negative since the 1960s to becoming positive since the 2010s, averaging 19 percent across the region (chapter 12). Nevertheless, only a handful of countries have met or surpassed the Comprehensive Africa Agriculture Development Programme (CAADP) targets of achieving 6 percent agricultural growth and allocating 10 percent of the national budget to agriculture. Furthermore, the number of people living on US$1.90 or less per day has increased on the continent during
the 2014–2019 period, while the prevalence of stunting in the region remains stubbornly high (chapter 16).
There is a concern about the risk of policy reversal and, particularly, a return to policies that failed or were less productive in the past (chapter 2). This is especially true for policies directly related to agricultural production, such as those covering seeds, fertilizers, extension services, mechanization, and trade. Indeed, some policies that were prominent in the 1970s or 1980s are now reap-pearing, albeit with notable modifications. Despite much evidence on the fiscal strain, negative impacts on the private sector, and environmental implications of subsidized agricultural inputs, they continue to dominate the agricultural policy portfolios of some African countries (chapters 3, 4, and 5). In addition, publicly subsidized or state-owned agricultural mechanization service enterprises are also reemerging in several countries, including Ghana, Nigeria, and Mozambique (chapter 5). Their resurgence reveals that the long-standing tension about the appropriate role of the state vis-à-vis the private sector remains unresolved. To date, most innovations in these areas have revolved around introducing new targeting mechanisms or interventions designed more appropriately by farm size and soil type, rather than on rigorous monitoring and evaluation systems to further improve government decision-making about program efficacy.
Likewise, in the domain of trade, there have been some troubling trends. Export bans have reemerged (chapter 2), and African countries still confront more restrictions with respect to intracontinental markets than they do on the global stage (chapter 11). Long-standing issues like poor customs procedures, insufficient transport and communications logistics, and noncompliance with sanitary and phytosanitary standards are compounded by policy narratives about national self-sufficiency and food sovereignty (Mockshell and Birner 2020). The need to ensure sufficient domestic resources for agro-industrial initiatives is another challenge. The region’s inconsistent approach toward trade is clearly illus-trated with respect to the African Continental Free Trade Area, whereby regional commitments have been undermined by divergent national interests, especially by Nigeria’s continued blocking of imports from neighboring countries in order to stimulate domestic agri-business (Bouët et al. 2019).
It is important to identify when and why policymakers revert to options that evidence shows may not be appropriate. Chapter 14 discussed the political economy of distortionary policies. Such policies could equally be the result

2020 ReSAKSS Annual Trends and Outlook Report 215
of a perceived lack of information about their impacts, insufficient awareness about existing evidence, or doubts about the credibility and applicability of such evidence to local conditions. Therefore, a better understanding of how national and regional policy processes operate and intersect with each other will be key for ensuring that policymakers do not divert from their national development goals or AU commitments.
Ensure That Policies Are Both Holistic and Nuanced This ATOR’s contributors have also emphasized the need for comprehensive and differentiated policy interventions. This need exists both across the agrifood system and along agricultural value chains, with the need for interventions that span training, regulations, infrastructure, and institutional reforms. One challenge of an agrifood system transformation agenda is that policies must be holistic within the system and cannot be disproportionately focused in just one area of the agrifood system or one modality of intervention. Nonetheless, budgets allocated to agriculture have gone disproportionately to subsidy programs (Goyal and Nash 2017) while agricultural research and development, irrigation, and agricultural digitalization have received fewer public resources (chapters 3, 6, 12, and 13). Likewise, regulatory policies that are needed to safeguard the health of African consumers and improve the region’s international market access remain relatively weak. As discussed in chapter 10, low-income African countries face a significant burden of food-related illness, but food safety regulations—especially in domestic markets—tend to be very limited, making the control of regional and global epidemics extremely difficult. Some policies, such as creating an environment that fosters associational activity, offer high returns at lower cost. As shown in chapter 8, encouraging the formation of producer organizations alone, especially those with particular governance features, can be a way of improving agricultural productivity.
More generally, many policy domains require a break from the traditional way of doing business. Agricultural technical and vocational education and training (ATVET) programs are a good example. To transform agriculture into a business profession, such training needs to go beyond a narrow focus on just agricultural practices and provide a range of other skills to both farmers and those along the value chain, inclusive of commercial, financial, and technological
skills (chapter 9). Similarly, the potential of information and communications technology (ICT) and digitalization depends on a whole host of concurrent investments, ranging from expanded Internet connectivity, digital literacy training, and digital privacy regulations to network platforms and innovation hubs (chapter 13). Likewise, efforts to support agro-processors need to consider their varying size, commodity focus, and target markets, as well as their collective training and technology needs, and the disparate regulatory and institutional environments they encounter (chapter 7).
Overall, agrifood system transformation is a complex agenda, and there are more trade-offs to consider across different desired outcomes (such as dietary diversity, gender equity, food security, job creation, environmental sustain-ability, and economic growth). In turn, the need for better policy coordination is paramount, and this requires breaking out of traditional policymaking silos oriented around sector-specific portfolios (chapter 14). At the same time, it may require a stocktaking of the range of AU commitments and frameworks already set up—many of which are detailed in this report’s individual chapters—to ensure that they do indeed complement each other.
Strengthen Policy Systems Individual policies are only as effective as the larger organizational and institu-tional settings in which they are embedded. A focus on the policy environment was one of the groundbreaking recognitions of CAADP when it was first introduced in 2003 (chapter 2). As elaborated in chapter 15, CAADP integrated the principle of mutual accountability to ensure that government and donor commitments are tracked and scrutinized by the public. Joint sector reviews and the biennial review have provided the opportunity for operationalizing mutual accountability. As discussed in chapter 15, these mechanisms have brought about notable improvements in data collection, budget allocations, and monitoring and evaluation systems relevant to countries’ agricultural systems. In addition, countries that have conducted a joint sector review within the last five years are found to have higher levels of public agricultural expenditures. In turn, these expenditures have led to increased labor and land productivity, both of which are critical for agricultural transformation. This result more broadly suggests the value of policy systems that are open and inclusive and that allow for critical feedback, introspection, and course corrections.

216 resakss.org
Other aspects of the policy system are equally important, including fiscal policies that can promote sustainable domestic revenue mobilization to continue to meet the CAADP goal of allocating at least 10 percent of annual public budgets to agriculture. Similarly, a stable macroeconomic policy environment is essential for attracting investment and enabling farmers and businesses to plan their operations. In this regard, the high debt-to-GDP and debt-to-export ratios prevailing in more than a dozen African countries will remain a concern for meeting further AU commitments on agriculture and agrifood system transfor-mation (chapter 12).
Moreover, more focus is needed on learning from the reasons for past failed implementation of public policy commitments, as well as anticipating future implementation challenges. Public sector capacity is surely one challenge in this regard; from seed quality (chapter 3) to food safety (chapter 10), the capacity of regulators to provide needed oversight to protect farmers and consumers remains a major issue. Another potential issue is whether and how governments should be restructured to address the many complex agrifood system issues that span the traditional boundaries of ministerial mandates. Chapter 14 provided some suggestions about different public sector models in this regard. Relatedly, as some countries further devolve agricultural functions to subnational governments, strengthened forms of vertical coordination are needed. Implementation weak-nesses also need to be assessed and addressed for a wide variety of functions often devolved to the local government level, including agricultural extension, ATVET, food safety oversight, and fertilizer and seed input distribution.
ConclusionThe recommendations outlined in this ATOR for generating agrifood system transformation can appear daunting. Much needs to be done across value chains and geographies, and no one policy lever will be sufficient. The COVID-19 pandemic, along with other recent shocks such as the locust plague and fall armyworm infestations, certainly complicates matters by redirecting attention and resources to other pressing needs. African governments, like their coun-terparts elsewhere, undoubtedly will need to prioritize how to allocate scarce financial and human resources to ensure that the transformation agenda under CAADP remains on track. At the same time, it is critical to recognize that many of the same innovations and interventions discussed in this ATOR have proved important for grappling with the pandemic, including making investments in ICT and digitalization that allow customers continued access to basic goods, engaging with producer organizations and cooperatives about effective social dis-tancing behaviors, and keeping borders open for trade. In this way, the pandemic should not be a diversion from the efforts of African governments to strengthen their agrifood systems; instead, it underscores that such transformation is needed precisely to create healthy citizens and resilient societies that can withstand this and other similar shocks.

2020 ReSAKSS Annual Trends and Outlook Report 217
ANNEXES
Core CAADP Monitoring & Evaluation and Supplementary Indicators

218 resakss.org
Annexes: Core CAADP Monitoring & Evaluation and Supplementary IndicatorsThis section presents data and trends across three levels of the CAADP Results Framework as well as supplementary data and trends.1
The data are presented at the aggregate level for the entire continent (Africa); the five geographic regions of the African Union (central, eastern, northern, southern, and western); eight Regional Economic Communities (CEN-SAD, COMESA, EAC, ECCAS, ECOWAS, IGAD, SADC, and UMA);2 five economic categories defined by agricultural production potential, nonagricultural sources of growth, and income level; nine CAADP groups representing either the period during which countries signed a CAADP compact or the level of CAADP implementation reached by countries by the end of 2015; and three levels of progress for countries in formulating national agriculture investment plans (NAIPs). Data for individual countries and regional groupings are available at www.resakss.org.
Technical Notes to Annex Tables
1. To control for year-to-year fluctuations, moving averages are used. Therefore, the values under the column “2003” are averages over the years 2002 to 2004 and the values under the column “2019” are averages over the years 2018 to 2019.
2. Annual average level and annual average change for 2014–2019 include data from 2014 up to the most recent year that is measured and available.
3. Annual average level is the simple average over the years shown, inclusive of the years shown.
4. Annual average change for all indicators is annual average percent change, from the beginning to the end years, shown by fitting an exponential growth function to the data points (that is, “LOGEST” function in Excel).
5. For indicators for which there are only a few measured data points over the years specified in the range (such as poverty, which is measured once every three to five years or so), a straight-line method was used to obtain missing values for the individual years between any two measured data points. Otherwise, estimated annual average change based on the measured values is used to obtain missing values either preceding or following the measured data point. In cases where the missing values could not be interpolated, the data are reported as missing and excluded from the calculations for that time period. Any weights used for these indicators are adjusted to account for the missing data in the series.
1 Future Annual Trends and Outlook Reports (ATORs) will report on more of the CAADP Results Framework indicators as more data become available.2 CEN-SAD is the Community of Sahel-Saharan States; COMESA is the Common Market for Eastern and Southern Africa; EAC is the East African Community; ECCAS is the Economic Community of
Central African States; ECOWAS is the Economic Community of West African States; IGAD is the Intergovernmental Authority on Development; SADC is the Southern African Development Community; and UMA is the Union du Maghreb Arabe.

2020 ReSAKSS Annual Trends and Outlook Report 219
6. Values for Africa, the regional aggregations (central, eastern, northern, southern, and western), economic aggregations (less favorable agriculture conditions, more favorable agriculture conditions, mineral-rich countries, lower middle-income countries, and upper middle-income countries), Regional Economic Communities (CEN-SAD, COMESA, EAC, ECCAS, ECOWAS, IGAD, SADC, and UMA), CAADP groups (Compact 2007–2009, Compact 2010–2012, Compact 2013–2015, Compact not yet, Level 0, Level 1, Level 2, Level 3, and Level 4), and NAIP groups (NAIP00, NAIP10, and NAIP11) are calculated by weighted summation. The weights vary by indicator and are based on each country’s proportion in the total value of the indicator used for the weighting measured at the respective aggregate level. Each country i’s weight in region j (wij) is then multiplied by the country’s data point (xi) and then summed for the relevant countries in the region to obtain the regional value (yj) according to: yj = Σi wijxi.
The trend data are organized as follows:Annex 1Level 1—Agriculture’s Contribution to Economic Growth and Inclusive Development
Annex 2Level 2—Agricultural Transformation and Sustained Inclusive Agricultural Growth
Annex 3Level 3— Strengthening Systemic Capacity to Deliver Results
Annex 4Distribution of Countries by Geographic Regions, Economic Classification, and Regional Economic Communities
Annex 5Distribution of Countries by Year of Signing CAADP Compact and Level of CAADP Implementation Reached by End of 2015
Annex 6Distribution of Countries in Formulating First-Generation Investment Plans (NAIP1.0) and Second-Generation Investment Plans (NAIP2.0) Reached by September of 2020
Annex 7Supplementary Data Tables

220 resakss.org
ANNEX 1a: Level 1—Agriculture’s Contribution to Economic Growth and Inclusive Development, Indicator 1.1.1
TABLE L1.1.1—GDP PER CAPITA (constant 2010 US$)
Region
Annual avg. level
(1995–2003)
Annual avg. change (1995–2003) 2003
Annual avg. level
(2003–2008)
Annual avg. change (2003–2008)
Annual avg. level
(2008–2014)
Annual avg. change (2008–2014)
Annual avg. level
(2014-2019)
Annual avg. change (2014-2019) 2019
Africa 1,494 1.4 1,602 1,735 3.3 1,930 1.2 2,005 0.2 2,013
Central 749 0.0 782 846 2.8 925 1.4 937 -1.5 912
Eastern 579 1.6 619 690 5.0 826 1.5 931 2.4 971
Northern 2,560 2.5 2,821 3,091 3.6 3,393 0.1 3,519 1.7 3,649
Southern 3,011 1.0 3,164 3,436 3.7 3,761 0.9 3,735 -1.5 3,624
Western 1,138 1.8 1,277 1,388 3.2 1,663 3.2 1,800 -0.4 1,795
Less favorable agriculture conditions 451 1.5 494 537 2.7 598 2.0 644 0.5 654
More favorable agriculture conditions 392 1.8 423 466 4.3 571 3.5 683 3.1 725
Mineral-rich countries 371 -2.7 347 379 5.8 485 -0.6 476 -0.1 481
Lower middle-income countries 1,505 2.1 1,659 1,818 4.0 2,154 2.3 2,307 0.2 2,317
Upper middle-income countries 5,230 1.7 5,686 6,237 3.5 6,613 0.0 6,557 -0.2 6,544
CEN-SAD 1,422 1.9 1,559 1,702 3.6 1,936 1.2 2,046 0.9 2,089
COMESA 980 1.1 1,017 1,103 3.7 1,223 0.3 1,286 2.1 1,343
EAC 587 1.1 622 686 4.6 825 1.4 922 2.8 973
ECCAS 940 0.9 1,012 1,151 5.4 1,336 1.6 1,333 -2.4 1,271
ECOWAS 1,138 1.8 1,277 1,388 3.2 1,663 3.2 1,800 -0.4 1,795
IGAD 572 1.5 611 687 5.7 837 1.3 938 2.4 976
SADC 1,871 0.6 1,937 2,083 3.3 2,252 0.8 2,245 -1.2 2,190
UMA 3,161 2.4 3,515 3,876 3.3 4,131 -0.2 4,208 1.2 4,324
CAADP Compact 2007-09 (CC1) 894 2.0 1,020 1,124 3.9 1,389 3.6 1,518 -0.3 1,513
CAADP Compact 2010-12 (CC2) 628 0.1 638 681 2.7 776 2.6 892 2.4 934
CAADP Compact 2013-15 (CC3) 1,425 1.8 1,536 1,717 5.0 1,979 1.3 1,985 -1.9 1,900
CAADP Compact not yet (CC0) 3,349 2.0 3,641 3,956 3.2 4,208 0.2 4,392 1.5 4,516
CAADP Level 0 (CL0) 3,349 2.0 3,641 3,956 3.2 4,208 0.2 4,392 1.5 4,516
CAADP Level 1 (CL1) 1,503 1.8 1,620 1,826 5.4 2,125 1.3 2,107 -2.3 2,002
CAADP Level 2 (CL2) 571 -1.1 563 590 1.9 637 1.8 710 1.6 732
CAADP Level 3 (CL3) 554 1.6 594 634 3.0 747 2.5 812 1.0 831
CAADP Level 4 (CL4) 867 1.7 967 1,060 3.7 1,291 3.5 1,441 0.5 1,459
NAIP00 (N00) 2,944 1.8 3,178 3,473 3.7 3,801 0.5 3,844 0.1 3,856
NAIP10 (N10) 689 1.2 734 805 4.1 925 0.8 984 0.7 993
NAIP11 (N11) 868 1.5 959 1,046 3.5 1,263 3.3 1,400 0.4 1,416
Source: ReSAKSS based on World Bank (2020) and ILO (2020).Note: Aggregate value for a group is the sum of real GDP for countries in a group divided by total population of countries in the group.

2020 ReSAKSS Annual Trends and Outlook Report 221
ANNEX 1b: Level 1—Agriculture’s Contribution to Economic Growth and Inclusive Development, Indicator 1.1.2
TABLE L1.1.2—HOUSEHOLD CONSUMPTION EXPENDITURE PER CAPITA (constant 2010 US$)
Region
Annual avg. level
(1995–2003)
Annual avg. change (1995–2003) 2003
Annual avg. level
(2003–2008)
Annual avg. change (2003–2008)
Annual avg. level
(2008–2014)
Annual avg. change (2008–2014)
Annual avg. level
(2014-2019)
Annual avg. change (2014-2019) 2019
Africa 1,023 0.8 1,073 1,117 2.2 1,223 0.7 1,297 -1.4 1,243
Central 460 -1.0 457 473 1.7 515 1.6 586 -0.3 567
Eastern 581 0.2 568 609 3.0 712 2.1 765 1.5 782
Northern 1,562 0.6 1,583 1,611 1.9 1,884 2.7 2,182 3.5 2,302
Southern 1,991 0.4 2,041 2,158 2.3 2,300 1.3 2,402 -0.2 2,386
Western 715 3.0 838 892 3.2 1,142 4.0 1,386 4.0 1,474
Less favorable agriculture conditions 367 0.8 394 400 1.9 442 2.1 489 1.3 502
More favorable agriculture conditions 386 1.5 409 429 2.0 445 -1.2 467 2.2 487
Mineral-rich countries 308 -1.6 298 332 4.4 372 0.9 377 -1.4 370
Lower middle-income countries 994 2.0 1,096 1,166 3.3 1,447 3.3 1,633 -2.5 1,520
Upper middle-income countries 2,960 -0.2 2,981 3,069 1.7 3,294 1.4 3,512 0.6 3,537
CEN-SAD 942 1.8 1,029 1,084 3.0 1,303 3.1 1,446 -2.7 1,344
COMESA 853 0.1 845 874 2.5 904 -1.5 870 -6.3 756
EAC 458 0.7 467 494 2.9 585 2.7 648 2.2 680
ECCAS 540 -1.1 538 548 1.5 647 2.9 792 0.2 779
ECOWAS 715 3.1 857 913 3.3 1,157 3.9 1,376 0.3 1,365
IGAD 675 0.5 678 728 3.0 708 -4.7 685 1.9 707
SADC 1,216 -0.1 1,222 1,281 2.0 1,338 0.7 1,365 -0.7 1,344
UMA 1,690 -0.7 1,675 1,627 0.0 1,754 2.1 2,045 2.4 2,122
CAADP Compact 2007-09 (CC1) 693 3.5 858 917 3.4 1,060 -0.3 1,162 0.3 1,155
CAADP Compact 2010-12 (CC2) 468 0.2 468 492 2.3 552 2.2 616 1.9 639
CAADP Compact 2013-15 (CC3) 876 -0.4 871 898 2.1 1,067 2.7 1,248 0.0 1,220
CAADP Compact not yet (CC0) 2,053 0.7 2,115 2,207 2.1 2,426 1.9 2,508 -4.1 2,281
CAADP Level 0 (CL0) 2,053 0.7 2,115 2,207 2.1 2,426 1.9 2,508 -4.1 2,281
CAADP Level 1 (CL1) 915 -0.8 894 923 2.4 1,116 2.9 1,306 -0.4 1,267
CAADP Level 2 (CL2) 430 -0.5 424 446 2.1 468 0.6 511 0.9 520
CAADP Level 3 (CL3) 384 1.2 412 444 3.1 525 3.0 557 -0.2 557
CAADP Level 4 (CL4) 661 2.8 776 823 3.1 958 0.8 1,079 1.0 1,089
NAIP00 (N00) 1,795 0.4 1,830 1,896 2.1 2,126 2.0 2,245 -3.4 2,065
NAIP10 (N10) 500 -0.4 496 526 2.5 606 1.7 643 -0.7 628
NAIP11 (N11) 660 2.7 771 822 3.2 949 0.7 1,063 0.9 1,071
Source: ReSAKSS based on World Bank (2020) and ILO (2020).Note: Aggregate value for a group is sum of household consumption expenditure for countries in group divided by total population for countries in group.
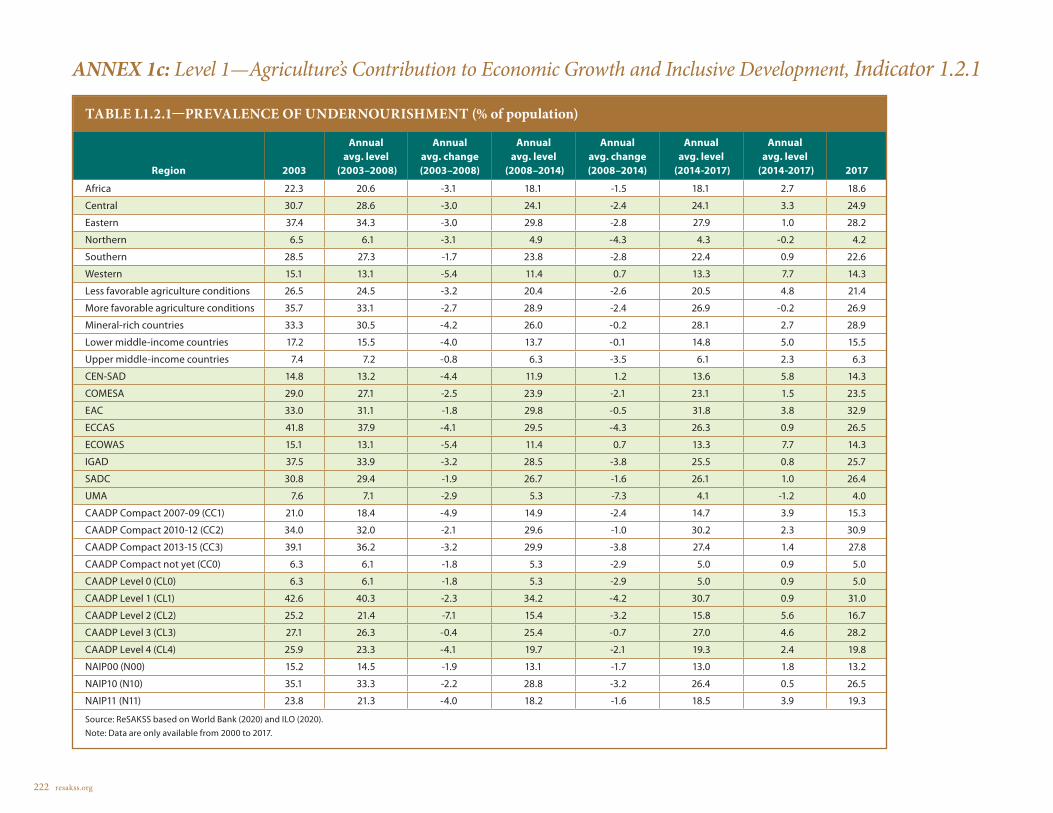
222 resakss.org
ANNEX 1c: Level 1—Agriculture’s Contribution to Economic Growth and Inclusive Development, Indicator 1.2.1
TABLE L1.2.1—PREVALENCE OF UNDERNOURISHMENT (% of population)
Region 2003
Annual avg. level
(2003–2008)
Annual avg. change (2003–2008)
Annual avg. level
(2008–2014)
Annual avg. change (2008–2014)
Annual avg. level
(2014-2017)
Annual avg. level
(2014-2017) 2017
Africa 22.3 20.6 -3.1 18.1 -1.5 18.1 2.7 18.6
Central 30.7 28.6 -3.0 24.1 -2.4 24.1 3.3 24.9
Eastern 37.4 34.3 -3.0 29.8 -2.8 27.9 1.0 28.2
Northern 6.5 6.1 -3.1 4.9 -4.3 4.3 -0.2 4.2
Southern 28.5 27.3 -1.7 23.8 -2.8 22.4 0.9 22.6
Western 15.1 13.1 -5.4 11.4 0.7 13.3 7.7 14.3
Less favorable agriculture conditions 26.5 24.5 -3.2 20.4 -2.6 20.5 4.8 21.4
More favorable agriculture conditions 35.7 33.1 -2.7 28.9 -2.4 26.9 -0.2 26.9
Mineral-rich countries 33.3 30.5 -4.2 26.0 -0.2 28.1 2.7 28.9
Lower middle-income countries 17.2 15.5 -4.0 13.7 -0.1 14.8 5.0 15.5
Upper middle-income countries 7.4 7.2 -0.8 6.3 -3.5 6.1 2.3 6.3
CEN-SAD 14.8 13.2 -4.4 11.9 1.2 13.6 5.8 14.3
COMESA 29.0 27.1 -2.5 23.9 -2.1 23.1 1.5 23.5
EAC 33.0 31.1 -1.8 29.8 -0.5 31.8 3.8 32.9
ECCAS 41.8 37.9 -4.1 29.5 -4.3 26.3 0.9 26.5
ECOWAS 15.1 13.1 -5.4 11.4 0.7 13.3 7.7 14.3
IGAD 37.5 33.9 -3.2 28.5 -3.8 25.5 0.8 25.7
SADC 30.8 29.4 -1.9 26.7 -1.6 26.1 1.0 26.4
UMA 7.6 7.1 -2.9 5.3 -7.3 4.1 -1.2 4.0
CAADP Compact 2007-09 (CC1) 21.0 18.4 -4.9 14.9 -2.4 14.7 3.9 15.3
CAADP Compact 2010-12 (CC2) 34.0 32.0 -2.1 29.6 -1.0 30.2 2.3 30.9
CAADP Compact 2013-15 (CC3) 39.1 36.2 -3.2 29.9 -3.8 27.4 1.4 27.8
CAADP Compact not yet (CC0) 6.3 6.1 -1.8 5.3 -2.9 5.0 0.9 5.0
CAADP Level 0 (CL0) 6.3 6.1 -1.8 5.3 -2.9 5.0 0.9 5.0
CAADP Level 1 (CL1) 42.6 40.3 -2.3 34.2 -4.2 30.7 0.9 31.0
CAADP Level 2 (CL2) 25.2 21.4 -7.1 15.4 -3.2 15.8 5.6 16.7
CAADP Level 3 (CL3) 27.1 26.3 -0.4 25.4 -0.7 27.0 4.6 28.2
CAADP Level 4 (CL4) 25.9 23.3 -4.1 19.7 -2.1 19.3 2.4 19.8
NAIP00 (N00) 15.2 14.5 -1.9 13.1 -1.7 13.0 1.8 13.2
NAIP10 (N10) 35.1 33.3 -2.2 28.8 -3.2 26.4 0.5 26.5
NAIP11 (N11) 23.8 21.3 -4.0 18.2 -1.6 18.5 3.9 19.3
Source: ReSAKSS based on World Bank (2020) and ILO (2020).Note: Data are only available from 2000 to 2017.
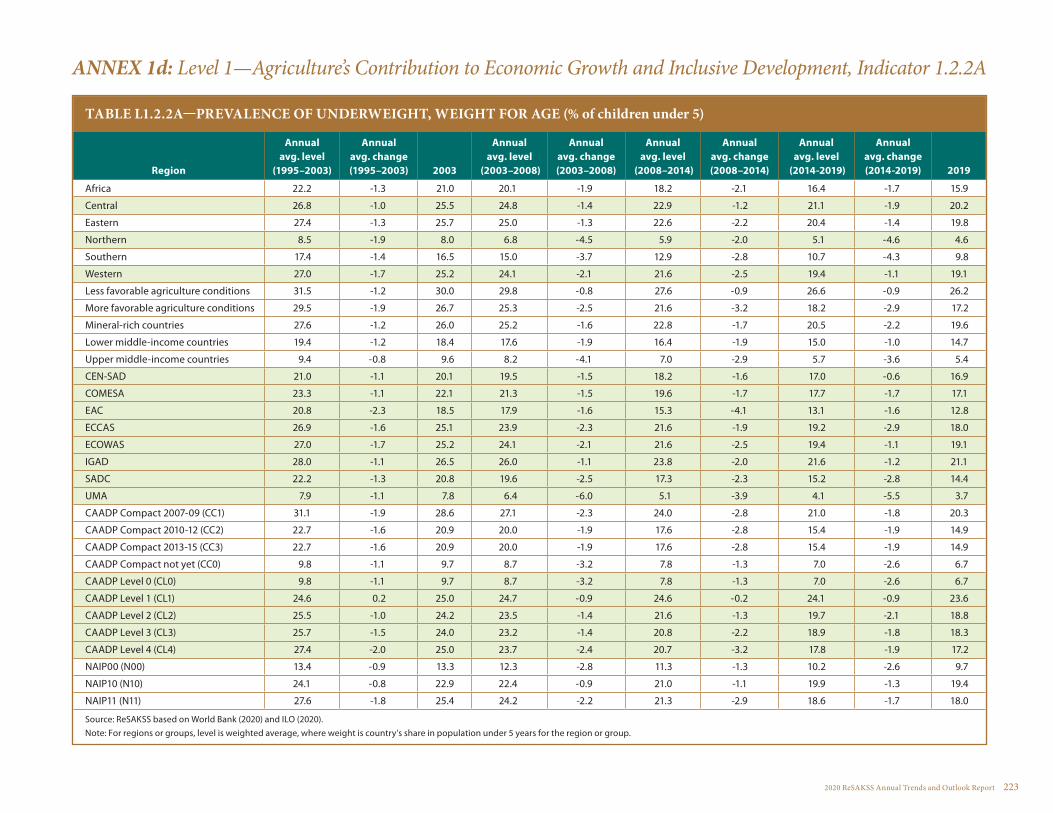
2020 ReSAKSS Annual Trends and Outlook Report 223
ANNEX 1d: Level 1—Agriculture’s Contribution to Economic Growth and Inclusive Development, Indicator 1.2.2A
TABLE L1.2.2A—PREVALENCE OF UNDERWEIGHT, WEIGHT FOR AGE (% of children under 5)
Region
Annual avg. level
(1995–2003)
Annual avg. change (1995–2003) 2003
Annual avg. level
(2003–2008)
Annual avg. change (2003–2008)
Annual avg. level
(2008–2014)
Annual avg. change (2008–2014)
Annual avg. level
(2014-2019)
Annual avg. change (2014-2019) 2019
Africa 22.2 -1.3 21.0 20.1 -1.9 18.2 -2.1 16.4 -1.7 15.9
Central 26.8 -1.0 25.5 24.8 -1.4 22.9 -1.2 21.1 -1.9 20.2
Eastern 27.4 -1.3 25.7 25.0 -1.3 22.6 -2.2 20.4 -1.4 19.8
Northern 8.5 -1.9 8.0 6.8 -4.5 5.9 -2.0 5.1 -4.6 4.6
Southern 17.4 -1.4 16.5 15.0 -3.7 12.9 -2.8 10.7 -4.3 9.8
Western 27.0 -1.7 25.2 24.1 -2.1 21.6 -2.5 19.4 -1.1 19.1
Less favorable agriculture conditions 31.5 -1.2 30.0 29.8 -0.8 27.6 -0.9 26.6 -0.9 26.2
More favorable agriculture conditions 29.5 -1.9 26.7 25.3 -2.5 21.6 -3.2 18.2 -2.9 17.2
Mineral-rich countries 27.6 -1.2 26.0 25.2 -1.6 22.8 -1.7 20.5 -2.2 19.6
Lower middle-income countries 19.4 -1.2 18.4 17.6 -1.9 16.4 -1.9 15.0 -1.0 14.7
Upper middle-income countries 9.4 -0.8 9.6 8.2 -4.1 7.0 -2.9 5.7 -3.6 5.4
CEN-SAD 21.0 -1.1 20.1 19.5 -1.5 18.2 -1.6 17.0 -0.6 16.9
COMESA 23.3 -1.1 22.1 21.3 -1.5 19.6 -1.7 17.7 -1.7 17.1
EAC 20.8 -2.3 18.5 17.9 -1.6 15.3 -4.1 13.1 -1.6 12.8
ECCAS 26.9 -1.6 25.1 23.9 -2.3 21.6 -1.9 19.2 -2.9 18.0
ECOWAS 27.0 -1.7 25.2 24.1 -2.1 21.6 -2.5 19.4 -1.1 19.1
IGAD 28.0 -1.1 26.5 26.0 -1.1 23.8 -2.0 21.6 -1.2 21.1
SADC 22.2 -1.3 20.8 19.6 -2.5 17.3 -2.3 15.2 -2.8 14.4
UMA 7.9 -1.1 7.8 6.4 -6.0 5.1 -3.9 4.1 -5.5 3.7
CAADP Compact 2007-09 (CC1) 31.1 -1.9 28.6 27.1 -2.3 24.0 -2.8 21.0 -1.8 20.3
CAADP Compact 2010-12 (CC2) 22.7 -1.6 20.9 20.0 -1.9 17.6 -2.8 15.4 -1.9 14.9
CAADP Compact 2013-15 (CC3) 22.7 -1.6 20.9 20.0 -1.9 17.6 -2.8 15.4 -1.9 14.9
CAADP Compact not yet (CC0) 9.8 -1.1 9.7 8.7 -3.2 7.8 -1.3 7.0 -2.6 6.7
CAADP Level 0 (CL0) 9.8 -1.1 9.7 8.7 -3.2 7.8 -1.3 7.0 -2.6 6.7
CAADP Level 1 (CL1) 24.6 0.2 25.0 24.7 -0.9 24.6 -0.2 24.1 -0.9 23.6
CAADP Level 2 (CL2) 25.5 -1.0 24.2 23.5 -1.4 21.6 -1.3 19.7 -2.1 18.8
CAADP Level 3 (CL3) 25.7 -1.5 24.0 23.2 -1.4 20.8 -2.2 18.9 -1.8 18.3
CAADP Level 4 (CL4) 27.4 -2.0 25.0 23.7 -2.4 20.7 -3.2 17.8 -1.9 17.2
NAIP00 (N00) 13.4 -0.9 13.3 12.3 -2.8 11.3 -1.3 10.2 -2.6 9.7
NAIP10 (N10) 24.1 -0.8 22.9 22.4 -0.9 21.0 -1.1 19.9 -1.3 19.4
NAIP11 (N11) 27.6 -1.8 25.4 24.2 -2.2 21.3 -2.9 18.6 -1.7 18.0
Source: ReSAKSS based on World Bank (2020) and ILO (2020).Note: For regions or groups, level is weighted average, where weight is country’s share in population under 5 years for the region or group.
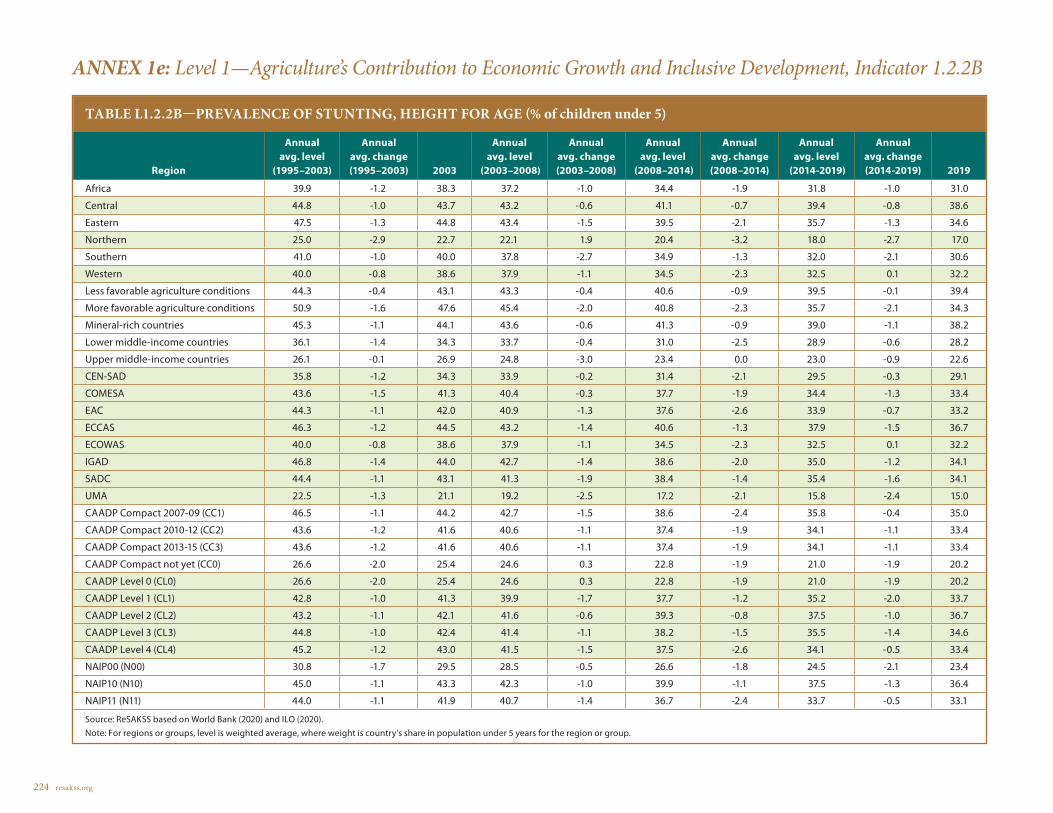
224 resakss.org
ANNEX 1e: Level 1—Agriculture’s Contribution to Economic Growth and Inclusive Development, Indicator 1.2.2B
TABLE L1.2.2B—PREVALENCE OF STUNTING, HEIGHT FOR AGE (% of children under 5)
Region
Annual avg. level
(1995–2003)
Annual avg. change (1995–2003) 2003
Annual avg. level
(2003–2008)
Annual avg. change (2003–2008)
Annual avg. level
(2008–2014)
Annual avg. change (2008–2014)
Annual avg. level
(2014-2019)
Annual avg. change (2014-2019) 2019
Africa 39.9 -1.2 38.3 37.2 -1.0 34.4 -1.9 31.8 -1.0 31.0
Central 44.8 -1.0 43.7 43.2 -0.6 41.1 -0.7 39.4 -0.8 38.6
Eastern 47.5 -1.3 44.8 43.4 -1.5 39.5 -2.1 35.7 -1.3 34.6
Northern 25.0 -2.9 22.7 22.1 1.9 20.4 -3.2 18.0 -2.7 17.0
Southern 41.0 -1.0 40.0 37.8 -2.7 34.9 -1.3 32.0 -2.1 30.6
Western 40.0 -0.8 38.6 37.9 -1.1 34.5 -2.3 32.5 0.1 32.2
Less favorable agriculture conditions 44.3 -0.4 43.1 43.3 -0.4 40.6 -0.9 39.5 -0.1 39.4
More favorable agriculture conditions 50.9 -1.6 47.6 45.4 -2.0 40.8 -2.3 35.7 -2.1 34.3
Mineral-rich countries 45.3 -1.1 44.1 43.6 -0.6 41.3 -0.9 39.0 -1.1 38.2
Lower middle-income countries 36.1 -1.4 34.3 33.7 -0.4 31.0 -2.5 28.9 -0.6 28.2
Upper middle-income countries 26.1 -0.1 26.9 24.8 -3.0 23.4 0.0 23.0 -0.9 22.6
CEN-SAD 35.8 -1.2 34.3 33.9 -0.2 31.4 -2.1 29.5 -0.3 29.1
COMESA 43.6 -1.5 41.3 40.4 -0.3 37.7 -1.9 34.4 -1.3 33.4
EAC 44.3 -1.1 42.0 40.9 -1.3 37.6 -2.6 33.9 -0.7 33.2
ECCAS 46.3 -1.2 44.5 43.2 -1.4 40.6 -1.3 37.9 -1.5 36.7
ECOWAS 40.0 -0.8 38.6 37.9 -1.1 34.5 -2.3 32.5 0.1 32.2
IGAD 46.8 -1.4 44.0 42.7 -1.4 38.6 -2.0 35.0 -1.2 34.1
SADC 44.4 -1.1 43.1 41.3 -1.9 38.4 -1.4 35.4 -1.6 34.1
UMA 22.5 -1.3 21.1 19.2 -2.5 17.2 -2.1 15.8 -2.4 15.0
CAADP Compact 2007-09 (CC1) 46.5 -1.1 44.2 42.7 -1.5 38.6 -2.4 35.8 -0.4 35.0
CAADP Compact 2010-12 (CC2) 43.6 -1.2 41.6 40.6 -1.1 37.4 -1.9 34.1 -1.1 33.4
CAADP Compact 2013-15 (CC3) 43.6 -1.2 41.6 40.6 -1.1 37.4 -1.9 34.1 -1.1 33.4
CAADP Compact not yet (CC0) 26.6 -2.0 25.4 24.6 0.3 22.8 -1.9 21.0 -1.9 20.2
CAADP Level 0 (CL0) 26.6 -2.0 25.4 24.6 0.3 22.8 -1.9 21.0 -1.9 20.2
CAADP Level 1 (CL1) 42.8 -1.0 41.3 39.9 -1.7 37.7 -1.2 35.2 -2.0 33.7
CAADP Level 2 (CL2) 43.2 -1.1 42.1 41.6 -0.6 39.3 -0.8 37.5 -1.0 36.7
CAADP Level 3 (CL3) 44.8 -1.0 42.4 41.4 -1.1 38.2 -1.5 35.5 -1.4 34.6
CAADP Level 4 (CL4) 45.2 -1.2 43.0 41.5 -1.5 37.5 -2.6 34.1 -0.5 33.4
NAIP00 (N00) 30.8 -1.7 29.5 28.5 -0.5 26.6 -1.8 24.5 -2.1 23.4
NAIP10 (N10) 45.0 -1.1 43.3 42.3 -1.0 39.9 -1.1 37.5 -1.3 36.4
NAIP11 (N11) 44.0 -1.1 41.9 40.7 -1.4 36.7 -2.4 33.7 -0.5 33.1
Source: ReSAKSS based on World Bank (2020) and ILO (2020).Note: For regions or groups, level is weighted average, where weight is country’s share in population under 5 years for the region or group.

2020 ReSAKSS Annual Trends and Outlook Report 225
ANNEX 1f: Level 1—Agriculture’s Contribution to Economic Growth and Inclusive Development, Indicator 1.2.2C
TABLE L1.2.2C—PREVALENCE OF WASTING, WEIGHT FOR HEIGHT (% of children under 5)
Region
Annual avg. level
(1995–2003)
Annual avg. change (1995–2003) 2003
Annual avg. level
(2003–2008)
Annual avg. change (2003–2008)
Annual avg. level
(2008–2014)
Annual avg. change (2008–2014)
Annual avg. level
(2014-2019)
Annual avg. change (2014-2019) 2019
Africa 9.8 -1.1 9.3 9.1 -0.9 8.1 -2.3 7.3 -1.5 7.0
Central 11.1 -0.1 10.4 10.0 -1.9 8.7 -2.2 7.7 -2.5 7.3
Eastern 9.4 -0.9 9.0 8.9 -1.1 8.2 -2.1 7.6 -1.4 7.3
Northern 6.0 0.7 6.5 6.2 1.2 6.9 1.7 7.6 0.7 7.7
Southern 6.6 -1.6 6.3 5.9 -3.3 4.9 -1.7 4.0 -3.9 3.7
Western 12.7 -2.3 11.6 11.4 -0.5 9.6 -3.6 8.2 -1.6 7.6
Less favorable agriculture conditions 14.7 -2.6 13.5 12.8 -2.2 11.3 -2.3 10.0 -2.4 9.6
More favorable agriculture conditions 9.2 -1.6 8.6 8.3 -2.8 7.0 -2.9 6.1 -3.3 5.6
Mineral-rich countries 12.1 -0.5 10.9 10.4 -2.3 8.7 -2.8 7.5 -3.5 7.0
Lower middle-income countries 9.5 -1.0 9.1 9.2 0.9 8.5 -2.0 7.9 -0.1 7.6
Upper middle-income countries 6.0 -0.3 6.6 5.6 -3.6 5.1 -1.2 4.5 -1.4 4.5
CEN-SAD 11.1 -1.2 10.6 10.5 0.0 9.5 -2.3 8.7 -0.5 8.5
COMESA 9.0 -0.2 8.7 8.7 -0.4 8.2 -1.1 7.9 -1.0 7.7
EAC 6.2 -2.2 5.5 5.5 0.2 4.9 -3.9 4.3 -0.2 4.2
ECCAS 10.4 -0.6 9.6 9.3 -1.8 8.0 -2.4 7.0 -2.5 6.6
ECOWAS 12.7 -2.3 11.6 11.4 -0.5 9.6 -3.6 8.2 -1.6 7.6
IGAD 10.1 -0.5 9.7 9.8 -0.6 9.2 -1.7 8.7 -0.7 8.5
SADC 8.4 -1.0 7.8 7.3 -2.8 6.2 -2.5 5.2 -3.7 4.8
UMA 6.0 1.6 6.8 5.8 -5.8 5.2 -0.9 5.1 -1.3 5.1
CAADP Compact 2007-09 (CC1) 12.2 -2.2 11.1 11.0 -0.5 9.4 -3.4 8.1 -2.2 7.5
CAADP Compact 2010-12 (CC2) 8.9 -1.3 8.1 7.9 -1.5 6.7 -2.9 5.9 -2.1 5.6
CAADP Compact 2013-15 (CC3) 8.9 -1.3 8.1 7.9 -1.5 6.7 -2.9 5.9 -2.1 5.6
CAADP Compact not yet (CC0) 6.9 0.4 7.3 6.9 -0.9 6.9 0.2 6.9 -0.2 7.0
CAADP Level 0 (CL0) 6.9 0.4 7.3 6.9 -0.9 6.9 0.2 6.9 -0.2 7.0
CAADP Level 1 (CL1) 10.3 0.5 10.7 10.6 -0.9 10.1 -0.4 9.9 0.0 9.9
CAADP Level 2 (CL2) 11.2 -0.3 10.3 9.9 -2.2 8.4 -2.5 7.4 -3.0 6.9
CAADP Level 3 (CL3) 9.3 -1.9 8.7 8.7 -0.9 7.8 -1.2 7.1 -1.5 7.0
CAADP Level 4 (CL4) 10.7 -2.1 9.6 9.5 -0.6 8.1 -3.8 6.9 -2.1 6.3
NAIP00 (N00) 7.6 0.3 8.0 7.6 -1.4 7.3 -0.4 7.0 -0.5 7.0
NAIP10 (N10) 9.6 -0.6 8.9 8.7 -1.1 8.0 -1.5 7.3 -2.3 6.9
NAIP11 (N11) 11.1 -2.0 10.2 10.1 -0.6 8.6 -3.4 7.5 -1.6 7.0
Source: ReSAKSS based on World Bank (2020) and ILO (2020).Note: For regions or groups, level is weighted average, where weight is country’s share in population under 5 years for the region or group.
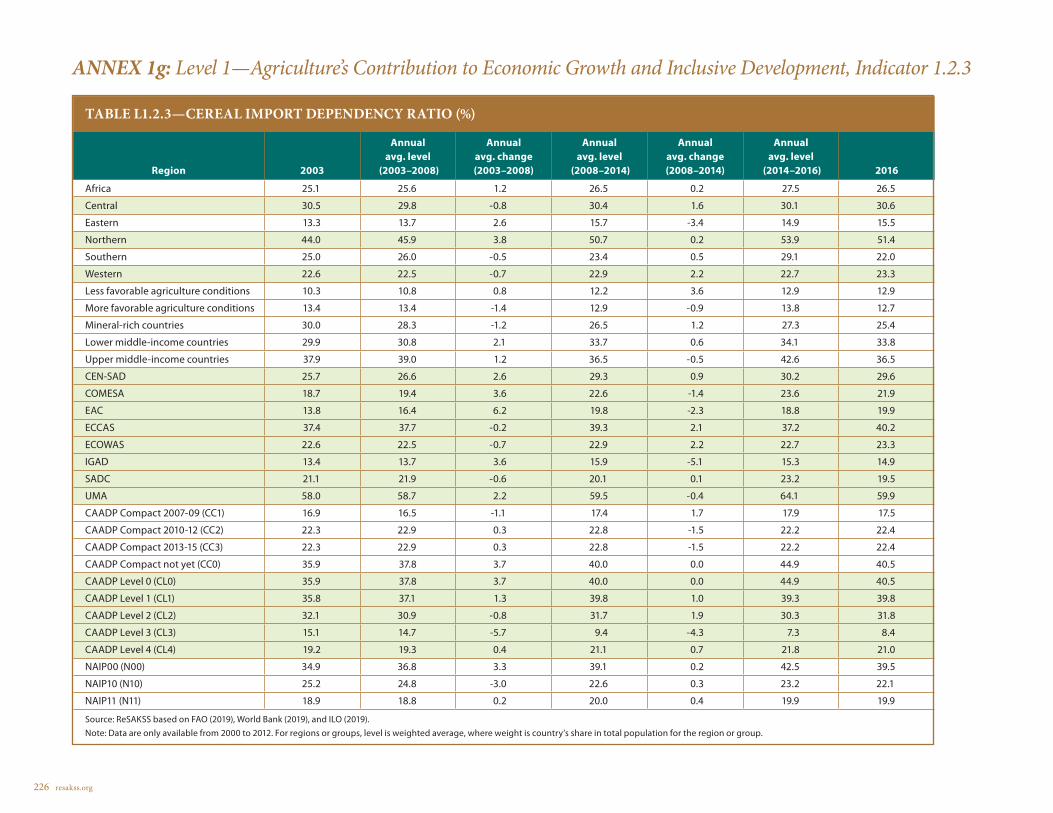
226 resakss.org
ANNEX 1g: Level 1—Agriculture’s Contribution to Economic Growth and Inclusive Development, Indicator 1.2.3
TABLE L1.2.3—CEREAL IMPORT DEPENDENCY RATIO (%)
Region 2003
Annual avg. level
(2003–2008)
Annual avg. change (2003–2008)
Annual avg. level
(2008–2014)
Annual avg. change (2008–2014)
Annual avg. level
(2014–2016) 2016
Africa 25.1 25.6 1.2 26.5 0.2 27.5 26.5
Central 30.5 29.8 -0.8 30.4 1.6 30.1 30.6
Eastern 13.3 13.7 2.6 15.7 -3.4 14.9 15.5
Northern 44.0 45.9 3.8 50.7 0.2 53.9 51.4
Southern 25.0 26.0 -0.5 23.4 0.5 29.1 22.0
Western 22.6 22.5 -0.7 22.9 2.2 22.7 23.3
Less favorable agriculture conditions 10.3 10.8 0.8 12.2 3.6 12.9 12.9
More favorable agriculture conditions 13.4 13.4 -1.4 12.9 -0.9 13.8 12.7
Mineral-rich countries 30.0 28.3 -1.2 26.5 1.2 27.3 25.4
Lower middle-income countries 29.9 30.8 2.1 33.7 0.6 34.1 33.8
Upper middle-income countries 37.9 39.0 1.2 36.5 -0.5 42.6 36.5
CEN-SAD 25.7 26.6 2.6 29.3 0.9 30.2 29.6
COMESA 18.7 19.4 3.6 22.6 -1.4 23.6 21.9
EAC 13.8 16.4 6.2 19.8 -2.3 18.8 19.9
ECCAS 37.4 37.7 -0.2 39.3 2.1 37.2 40.2
ECOWAS 22.6 22.5 -0.7 22.9 2.2 22.7 23.3
IGAD 13.4 13.7 3.6 15.9 -5.1 15.3 14.9
SADC 21.1 21.9 -0.6 20.1 0.1 23.2 19.5
UMA 58.0 58.7 2.2 59.5 -0.4 64.1 59.9
CAADP Compact 2007-09 (CC1) 16.9 16.5 -1.1 17.4 1.7 17.9 17.5
CAADP Compact 2010-12 (CC2) 22.3 22.9 0.3 22.8 -1.5 22.2 22.4
CAADP Compact 2013-15 (CC3) 22.3 22.9 0.3 22.8 -1.5 22.2 22.4
CAADP Compact not yet (CC0) 35.9 37.8 3.7 40.0 0.0 44.9 40.5
CAADP Level 0 (CL0) 35.9 37.8 3.7 40.0 0.0 44.9 40.5
CAADP Level 1 (CL1) 35.8 37.1 1.3 39.8 1.0 39.3 39.8
CAADP Level 2 (CL2) 32.1 30.9 -0.8 31.7 1.9 30.3 31.8
CAADP Level 3 (CL3) 15.1 14.7 -5.7 9.4 -4.3 7.3 8.4
CAADP Level 4 (CL4) 19.2 19.3 0.4 21.1 0.7 21.8 21.0
NAIP00 (N00) 34.9 36.8 3.3 39.1 0.2 42.5 39.5
NAIP10 (N10) 25.2 24.8 -3.0 22.6 0.3 23.2 22.1
NAIP11 (N11) 18.9 18.8 0.2 20.0 0.4 19.9 19.9
Source: ReSAKSS based on FAO (2019), World Bank (2019), and ILO (2019).Note: Data are only available from 2000 to 2012. For regions or groups, level is weighted average, where weight is country’s share in total population for the region or group.
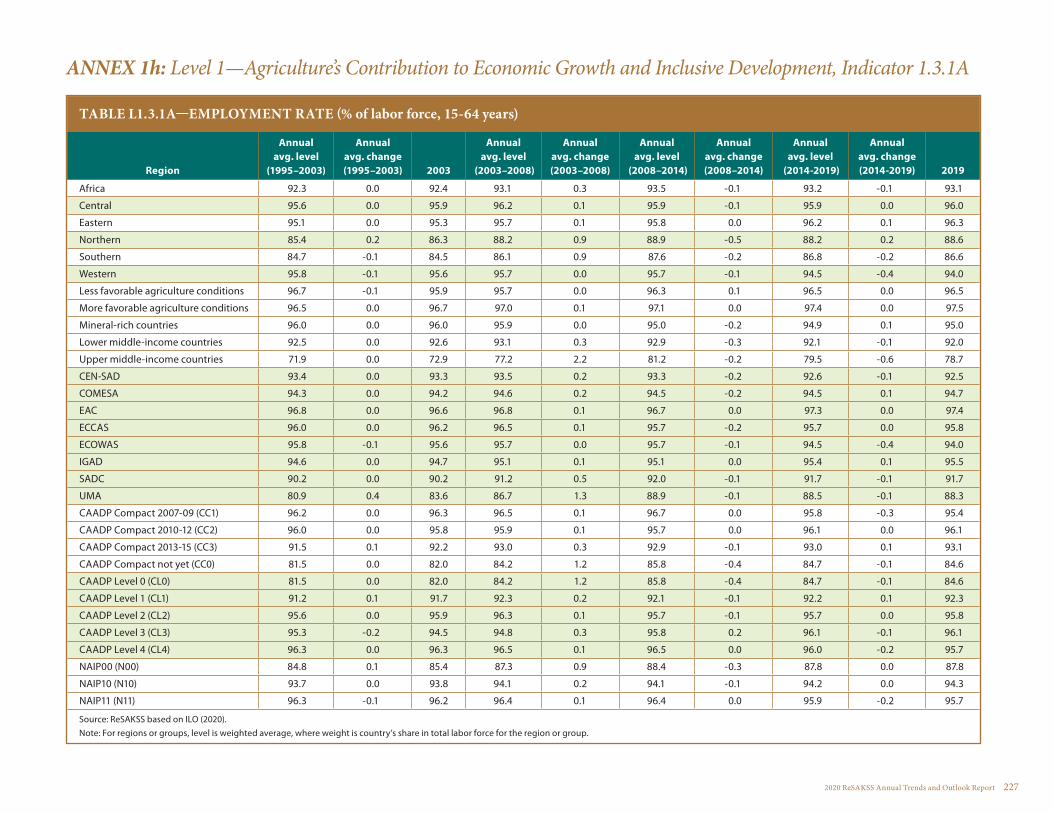
2020 ReSAKSS Annual Trends and Outlook Report 227
ANNEX 1h: Level 1—Agriculture’s Contribution to Economic Growth and Inclusive Development, Indicator 1.3.1A
TABLE L1.3.1A—EMPLOYMENT RATE (% of labor force, 15-64 years)
Region
Annual avg. level
(1995–2003)
Annual avg. change (1995–2003) 2003
Annual avg. level
(2003–2008)
Annual avg. change (2003–2008)
Annual avg. level
(2008–2014)
Annual avg. change (2008–2014)
Annual avg. level
(2014-2019)
Annual avg. change (2014-2019) 2019
Africa 92.3 0.0 92.4 93.1 0.3 93.5 -0.1 93.2 -0.1 93.1
Central 95.6 0.0 95.9 96.2 0.1 95.9 -0.1 95.9 0.0 96.0
Eastern 95.1 0.0 95.3 95.7 0.1 95.8 0.0 96.2 0.1 96.3
Northern 85.4 0.2 86.3 88.2 0.9 88.9 -0.5 88.2 0.2 88.6
Southern 84.7 -0.1 84.5 86.1 0.9 87.6 -0.2 86.8 -0.2 86.6
Western 95.8 -0.1 95.6 95.7 0.0 95.7 -0.1 94.5 -0.4 94.0
Less favorable agriculture conditions 96.7 -0.1 95.9 95.7 0.0 96.3 0.1 96.5 0.0 96.5
More favorable agriculture conditions 96.5 0.0 96.7 97.0 0.1 97.1 0.0 97.4 0.0 97.5
Mineral-rich countries 96.0 0.0 96.0 95.9 0.0 95.0 -0.2 94.9 0.1 95.0
Lower middle-income countries 92.5 0.0 92.6 93.1 0.3 92.9 -0.3 92.1 -0.1 92.0
Upper middle-income countries 71.9 0.0 72.9 77.2 2.2 81.2 -0.2 79.5 -0.6 78.7
CEN-SAD 93.4 0.0 93.3 93.5 0.2 93.3 -0.2 92.6 -0.1 92.5
COMESA 94.3 0.0 94.2 94.6 0.2 94.5 -0.2 94.5 0.1 94.7
EAC 96.8 0.0 96.6 96.8 0.1 96.7 0.0 97.3 0.0 97.4
ECCAS 96.0 0.0 96.2 96.5 0.1 95.7 -0.2 95.7 0.0 95.8
ECOWAS 95.8 -0.1 95.6 95.7 0.0 95.7 -0.1 94.5 -0.4 94.0
IGAD 94.6 0.0 94.7 95.1 0.1 95.1 0.0 95.4 0.1 95.5
SADC 90.2 0.0 90.2 91.2 0.5 92.0 -0.1 91.7 -0.1 91.7
UMA 80.9 0.4 83.6 86.7 1.3 88.9 -0.1 88.5 -0.1 88.3
CAADP Compact 2007-09 (CC1) 96.2 0.0 96.3 96.5 0.1 96.7 0.0 95.8 -0.3 95.4
CAADP Compact 2010-12 (CC2) 96.0 0.0 95.8 95.9 0.1 95.7 0.0 96.1 0.0 96.1
CAADP Compact 2013-15 (CC3) 91.5 0.1 92.2 93.0 0.3 92.9 -0.1 93.0 0.1 93.1
CAADP Compact not yet (CC0) 81.5 0.0 82.0 84.2 1.2 85.8 -0.4 84.7 -0.1 84.6
CAADP Level 0 (CL0) 81.5 0.0 82.0 84.2 1.2 85.8 -0.4 84.7 -0.1 84.6
CAADP Level 1 (CL1) 91.2 0.1 91.7 92.3 0.2 92.1 -0.1 92.2 0.1 92.3
CAADP Level 2 (CL2) 95.6 0.0 95.9 96.3 0.1 95.7 -0.1 95.7 0.0 95.8
CAADP Level 3 (CL3) 95.3 -0.2 94.5 94.8 0.3 95.8 0.2 96.1 -0.1 96.1
CAADP Level 4 (CL4) 96.3 0.0 96.3 96.5 0.1 96.5 0.0 96.0 -0.2 95.7
NAIP00 (N00) 84.8 0.1 85.4 87.3 0.9 88.4 -0.3 87.8 0.0 87.8
NAIP10 (N10) 93.7 0.0 93.8 94.1 0.2 94.1 -0.1 94.2 0.0 94.3
NAIP11 (N11) 96.3 -0.1 96.2 96.4 0.1 96.4 0.0 95.9 -0.2 95.7
Source: ReSAKSS based on ILO (2020).Note: For regions or groups, level is weighted average, where weight is country’s share in total labor force for the region or group.

228 resakss.org
ANNEX 1i: Level 1—Agriculture’s Contribution to Economic Growth and Inclusive Development, Indicator 1.3.1B
TABLE L1.3.1B—EMPLOYMENT RATE (% of population, 15+ years)
Region
Annual avg. level
(1995–2003)
Annual avg. change (1995–2003) 2003
Annual avg. level
(2003–2008)
Annual avg. change (2003–2008)
Annual avg. level
(2008–2014)
Annual avg. change (2008–2014)
Annual avg. level
(2014-2019)
Annual avg. change (2014-2019) 2019
Africa 60.0 -0.1 59.9 60.4 0.4 60.1 -0.5 58.9 -0.2 58.7
Central 70.7 0.0 70.6 70.2 -0.5 66.5 -0.9 65.3 0.0 65.2
Eastern 70.7 0.0 70.7 71.0 0.2 71.3 0.0 71.1 -0.1 71.1
Northern 39.6 -0.1 39.7 41.1 1.4 42.2 -0.3 40.5 -0.7 40.0
Southern 58.4 -0.1 58.2 59.3 0.9 59.5 -0.3 59.6 0.0 59.6
Western 62.1 -0.3 61.5 61.2 -0.1 59.6 -1.2 55.8 -0.7 55.2
Less favorable agriculture conditions 70.7 -0.3 69.7 69.3 -0.1 69.3 -0.3 68.2 0.0 68.1
More favorable agriculture conditions 77.7 0.1 78.3 78.6 0.1 77.5 -0.4 76.3 -0.2 76.1
Mineral-rich countries 67.8 0.0 67.8 67.1 -0.7 63.1 -1.1 61.6 -0.1 61.4
Lower middle-income countries 55.3 -0.2 54.8 55.1 0.4 54.7 -0.7 52.6 -0.5 52.2
Upper middle-income countries 36.5 -0.3 36.7 38.8 2.2 40.3 -0.2 40.1 -0.3 39.9
CEN-SAD 55.2 -0.2 54.6 54.8 0.3 54.6 -0.7 52.4 -0.4 52.1
COMESA 63.0 0.0 62.8 63.3 0.3 63.5 -0.1 63.2 -0.1 63.1
EAC 75.5 -0.3 74.3 74.2 0.1 74.7 0.1 75.1 0.0 75.1
ECCAS 72.3 0.0 72.2 71.8 -0.4 68.5 -0.8 67.6 0.0 67.5
ECOWAS 62.1 -0.3 61.5 61.2 -0.1 59.6 -1.2 55.8 -0.7 55.2
IGAD 66.3 0.0 66.2 66.5 0.2 67.1 0.1 67.3 0.0 67.3
SADC 66.2 0.0 66.3 66.9 0.4 65.9 -0.5 65.3 0.0 65.3
UMA 37.9 0.1 38.7 40.0 1.0 40.9 -0.2 39.4 -0.6 38.9
CAADP Compact 2007-09 (CC1) 66.7 0.0 66.9 67.1 0.1 66.1 -0.9 63.0 -0.5 62.5
CAADP Compact 2010-12 (CC2) 70.9 -0.2 70.1 69.6 -0.2 67.9 -0.5 67.2 -0.1 67.1
CAADP Compact 2013-15 (CC3) 65.4 0.0 65.7 66.2 0.3 65.5 -0.3 65.1 0.0 65.1
CAADP Compact not yet (CC0) 40.4 -0.2 40.4 41.9 1.5 43.0 -0.3 41.9 -0.5 41.5
CAADP Level 0 (CL0) 40.4 -0.2 40.4 41.9 1.5 43.0 -0.3 41.9 -0.5 41.5
CAADP Level 1 (CL1) 63.2 0.0 63.5 63.9 0.2 63.8 -0.2 63.4 0.0 63.4
CAADP Level 2 (CL2) 68.9 0.0 69.0 68.5 -0.6 64.3 -1.0 62.9 -0.1 62.8
CAADP Level 3 (CL3) 70.7 -0.2 70.1 70.2 0.2 70.1 -0.2 69.1 -0.2 68.9
CAADP Level 4 (CL4) 68.6 -0.1 68.3 68.3 0.0 67.3 -0.7 64.9 -0.4 64.5
NAIP00 (N00) 46.4 -0.1 46.5 47.8 1.2 49.0 -0.1 48.4 -0.2 48.2
NAIP10 (N10) 69.3 0.0 69.3 69.2 -0.2 66.5 -0.8 65.2 -0.1 65.1
NAIP11 (N11) 66.5 -0.1 66.1 66.1 0.0 65.5 -0.6 63.4 -0.4 63.0
Source: ReSAKSS based on ILO (2020).Note: For regions or groups, level is weighted average, where weight is country’s share in total population for the region or group.
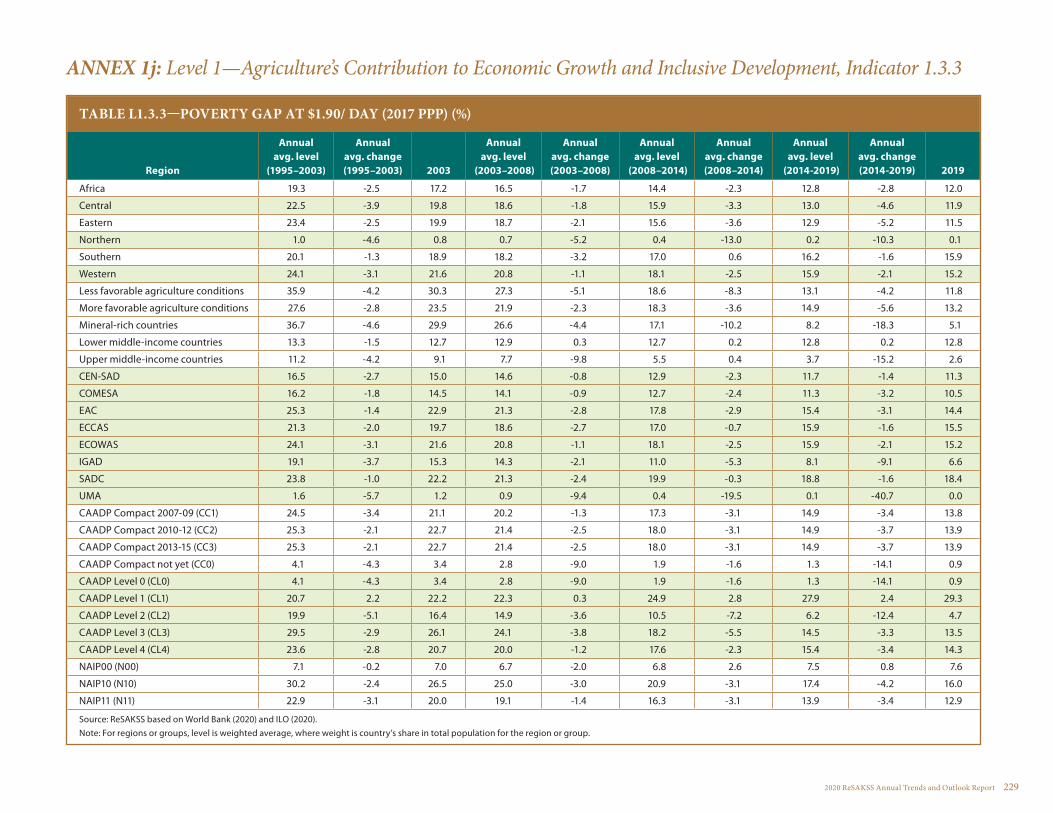
2020 ReSAKSS Annual Trends and Outlook Report 229
ANNEX 1j: Level 1—Agriculture’s Contribution to Economic Growth and Inclusive Development, Indicator 1.3.3
TABLE L1.3.3—POVERTY GAP AT $1.90/ DAY (2017 PPP) (%)
Region
Annual avg. level
(1995–2003)
Annual avg. change (1995–2003) 2003
Annual avg. level
(2003–2008)
Annual avg. change (2003–2008)
Annual avg. level
(2008–2014)
Annual avg. change (2008–2014)
Annual avg. level
(2014-2019)
Annual avg. change (2014-2019) 2019
Africa 19.3 -2.5 17.2 16.5 -1.7 14.4 -2.3 12.8 -2.8 12.0
Central 22.5 -3.9 19.8 18.6 -1.8 15.9 -3.3 13.0 -4.6 11.9
Eastern 23.4 -2.5 19.9 18.7 -2.1 15.6 -3.6 12.9 -5.2 11.5
Northern 1.0 -4.6 0.8 0.7 -5.2 0.4 -13.0 0.2 -10.3 0.1
Southern 20.1 -1.3 18.9 18.2 -3.2 17.0 0.6 16.2 -1.6 15.9
Western 24.1 -3.1 21.6 20.8 -1.1 18.1 -2.5 15.9 -2.1 15.2
Less favorable agriculture conditions 35.9 -4.2 30.3 27.3 -5.1 18.6 -8.3 13.1 -4.2 11.8
More favorable agriculture conditions 27.6 -2.8 23.5 21.9 -2.3 18.3 -3.6 14.9 -5.6 13.2
Mineral-rich countries 36.7 -4.6 29.9 26.6 -4.4 17.1 -10.2 8.2 -18.3 5.1
Lower middle-income countries 13.3 -1.5 12.7 12.9 0.3 12.7 0.2 12.8 0.2 12.8
Upper middle-income countries 11.2 -4.2 9.1 7.7 -9.8 5.5 0.4 3.7 -15.2 2.6
CEN-SAD 16.5 -2.7 15.0 14.6 -0.8 12.9 -2.3 11.7 -1.4 11.3
COMESA 16.2 -1.8 14.5 14.1 -0.9 12.7 -2.4 11.3 -3.2 10.5
EAC 25.3 -1.4 22.9 21.3 -2.8 17.8 -2.9 15.4 -3.1 14.4
ECCAS 21.3 -2.0 19.7 18.6 -2.7 17.0 -0.7 15.9 -1.6 15.5
ECOWAS 24.1 -3.1 21.6 20.8 -1.1 18.1 -2.5 15.9 -2.1 15.2
IGAD 19.1 -3.7 15.3 14.3 -2.1 11.0 -5.3 8.1 -9.1 6.6
SADC 23.8 -1.0 22.2 21.3 -2.4 19.9 -0.3 18.8 -1.6 18.4
UMA 1.6 -5.7 1.2 0.9 -9.4 0.4 -19.5 0.1 -40.7 0.0
CAADP Compact 2007-09 (CC1) 24.5 -3.4 21.1 20.2 -1.3 17.3 -3.1 14.9 -3.4 13.8
CAADP Compact 2010-12 (CC2) 25.3 -2.1 22.7 21.4 -2.5 18.0 -3.1 14.9 -3.7 13.9
CAADP Compact 2013-15 (CC3) 25.3 -2.1 22.7 21.4 -2.5 18.0 -3.1 14.9 -3.7 13.9
CAADP Compact not yet (CC0) 4.1 -4.3 3.4 2.8 -9.0 1.9 -1.6 1.3 -14.1 0.9
CAADP Level 0 (CL0) 4.1 -4.3 3.4 2.8 -9.0 1.9 -1.6 1.3 -14.1 0.9
CAADP Level 1 (CL1) 20.7 2.2 22.2 22.3 0.3 24.9 2.8 27.9 2.4 29.3
CAADP Level 2 (CL2) 19.9 -5.1 16.4 14.9 -3.6 10.5 -7.2 6.2 -12.4 4.7
CAADP Level 3 (CL3) 29.5 -2.9 26.1 24.1 -3.8 18.2 -5.5 14.5 -3.3 13.5
CAADP Level 4 (CL4) 23.6 -2.8 20.7 20.0 -1.2 17.6 -2.3 15.4 -3.4 14.3
NAIP00 (N00) 7.1 -0.2 7.0 6.7 -2.0 6.8 2.6 7.5 0.8 7.6
NAIP10 (N10) 30.2 -2.4 26.5 25.0 -3.0 20.9 -3.1 17.4 -4.2 16.0
NAIP11 (N11) 22.9 -3.1 20.0 19.1 -1.4 16.3 -3.1 13.9 -3.4 12.9
Source: ReSAKSS based on World Bank (2020) and ILO (2020).Note: For regions or groups, level is weighted average, where weight is country’s share in total population for the region or group.
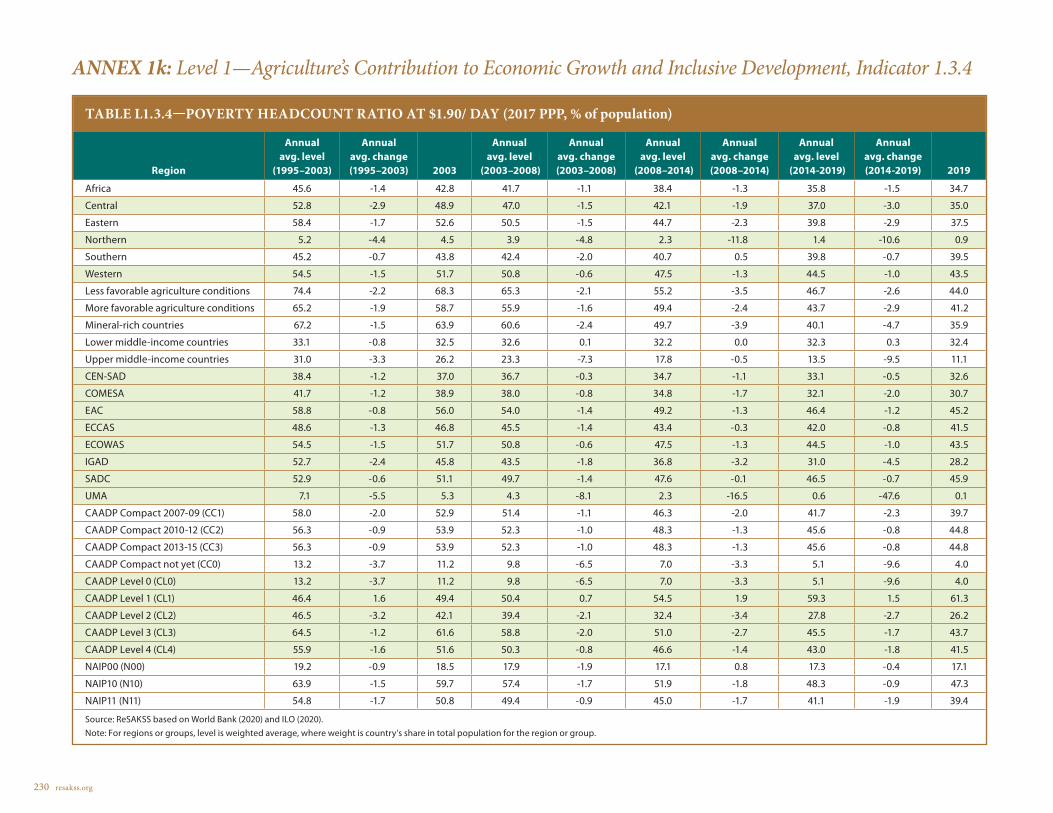
230 resakss.org
ANNEX 1k: Level 1—Agriculture’s Contribution to Economic Growth and Inclusive Development, Indicator 1.3.4
TABLE L1.3.4—POVERTY HEADCOUNT RATIO AT $1.90/ DAY (2017 PPP, % of population)
Region
Annual avg. level
(1995–2003)
Annual avg. change (1995–2003) 2003
Annual avg. level
(2003–2008)
Annual avg. change (2003–2008)
Annual avg. level
(2008–2014)
Annual avg. change (2008–2014)
Annual avg. level
(2014-2019)
Annual avg. change (2014-2019) 2019
Africa 45.6 -1.4 42.8 41.7 -1.1 38.4 -1.3 35.8 -1.5 34.7
Central 52.8 -2.9 48.9 47.0 -1.5 42.1 -1.9 37.0 -3.0 35.0
Eastern 58.4 -1.7 52.6 50.5 -1.5 44.7 -2.3 39.8 -2.9 37.5
Northern 5.2 -4.4 4.5 3.9 -4.8 2.3 -11.8 1.4 -10.6 0.9
Southern 45.2 -0.7 43.8 42.4 -2.0 40.7 0.5 39.8 -0.7 39.5
Western 54.5 -1.5 51.7 50.8 -0.6 47.5 -1.3 44.5 -1.0 43.5
Less favorable agriculture conditions 74.4 -2.2 68.3 65.3 -2.1 55.2 -3.5 46.7 -2.6 44.0
More favorable agriculture conditions 65.2 -1.9 58.7 55.9 -1.6 49.4 -2.4 43.7 -2.9 41.2
Mineral-rich countries 67.2 -1.5 63.9 60.6 -2.4 49.7 -3.9 40.1 -4.7 35.9
Lower middle-income countries 33.1 -0.8 32.5 32.6 0.1 32.2 0.0 32.3 0.3 32.4
Upper middle-income countries 31.0 -3.3 26.2 23.3 -7.3 17.8 -0.5 13.5 -9.5 11.1
CEN-SAD 38.4 -1.2 37.0 36.7 -0.3 34.7 -1.1 33.1 -0.5 32.6
COMESA 41.7 -1.2 38.9 38.0 -0.8 34.8 -1.7 32.1 -2.0 30.7
EAC 58.8 -0.8 56.0 54.0 -1.4 49.2 -1.3 46.4 -1.2 45.2
ECCAS 48.6 -1.3 46.8 45.5 -1.4 43.4 -0.3 42.0 -0.8 41.5
ECOWAS 54.5 -1.5 51.7 50.8 -0.6 47.5 -1.3 44.5 -1.0 43.5
IGAD 52.7 -2.4 45.8 43.5 -1.8 36.8 -3.2 31.0 -4.5 28.2
SADC 52.9 -0.6 51.1 49.7 -1.4 47.6 -0.1 46.5 -0.7 45.9
UMA 7.1 -5.5 5.3 4.3 -8.1 2.3 -16.5 0.6 -47.6 0.1
CAADP Compact 2007-09 (CC1) 58.0 -2.0 52.9 51.4 -1.1 46.3 -2.0 41.7 -2.3 39.7
CAADP Compact 2010-12 (CC2) 56.3 -0.9 53.9 52.3 -1.0 48.3 -1.3 45.6 -0.8 44.8
CAADP Compact 2013-15 (CC3) 56.3 -0.9 53.9 52.3 -1.0 48.3 -1.3 45.6 -0.8 44.8
CAADP Compact not yet (CC0) 13.2 -3.7 11.2 9.8 -6.5 7.0 -3.3 5.1 -9.6 4.0
CAADP Level 0 (CL0) 13.2 -3.7 11.2 9.8 -6.5 7.0 -3.3 5.1 -9.6 4.0
CAADP Level 1 (CL1) 46.4 1.6 49.4 50.4 0.7 54.5 1.9 59.3 1.5 61.3
CAADP Level 2 (CL2) 46.5 -3.2 42.1 39.4 -2.1 32.4 -3.4 27.8 -2.7 26.2
CAADP Level 3 (CL3) 64.5 -1.2 61.6 58.8 -2.0 51.0 -2.7 45.5 -1.7 43.7
CAADP Level 4 (CL4) 55.9 -1.6 51.6 50.3 -0.8 46.6 -1.4 43.0 -1.8 41.5
NAIP00 (N00) 19.2 -0.9 18.5 17.9 -1.9 17.1 0.8 17.3 -0.4 17.1
NAIP10 (N10) 63.9 -1.5 59.7 57.4 -1.7 51.9 -1.8 48.3 -0.9 47.3
NAIP11 (N11) 54.8 -1.7 50.8 49.4 -0.9 45.0 -1.7 41.1 -1.9 39.4
Source: ReSAKSS based on World Bank (2020) and ILO (2020).Note: For regions or groups, level is weighted average, where weight is country’s share in total population for the region or group.

2020 ReSAKSS Annual Trends and Outlook Report 231
ANNEX 2a: Level 2—Agricultural Transformation and Sustained Inclusive Agricultural Growth, Indicator 2.1.1
TABLE L2.1.1—AGRICULTURE VALUE ADDED (billion, constant 2010 US$)
Region
Annual avg. level
(1995–2003)
Annual avg. change (1995–2003) 2003
Annual avg. level
(2003–2008)
Annual avg. change (2003–2008)
Annual avg. level
(2008–2014)
Annual avg. change (2008–2014)
Annual avg. level
(2014-2019)
Annual avg. change (2014-2019) 2019
Africa 183.8 4.6 222.6 228.3 2.0 286.7 3.2 345.3 3.2 364.3
Central 12.6 -4.1 10.8 11.1 1.4 14.6 5.1 19.2 4.2 20.6
Eastern 39.6 1.2 41.0 45.1 4.4 66.0 6.1 83.5 3.8 89.0
Northern 38.6 8.7 49.7 50.3 0.3 59.3 3.0 73.8 3.9 78.6
Southern 19.6 1.3 20.4 21.3 3.7 25.1 1.9 28.9 -0.8 27.5
Western 73.5 6.7 100.7 100.5 1.5 121.7 1.8 139.9 3.1 148.7
Less favorable agriculture conditions 7.4 4.5 8.7 9.6 3.5 12.3 5.5 16.6 4.9 18.1
More favorable agriculture conditions 24.9 -0.8 25.4 30.5 7.8 46.1 5.5 58.0 4.0 61.7
Mineral-rich countries 8.2 -3.8 6.9 7.1 3.9 10.0 3.7 12.0 4.2 13.1
Lower middle-income countries 125.6 5.1 156.1 156.8 1.2 191.7 2.4 223.9 2.8 235.3
Upper middle-income countries 17.8 13.9 25.5 24.2 -1.1 26.6 3.1 34.9 3.0 36.1
CEN-SAD 127.8 5.5 162.1 163.4 1.4 200.2 2.4 233.3 3.2 248.1
COMESA 67.3 1.9 70.6 74.6 2.8 95.5 3.6 114.3 4.0 123.2
EAC 18.0 -0.7 18.1 20.0 3.7 30.5 6.9 42.5 5.8 46.2
ECCAS 16.3 -2.6 14.9 15.7 2.2 21.8 6.4 30.3 2.1 30.5
ECOWAS 73.5 6.7 100.7 100.5 1.5 121.7 1.8 139.9 3.1 148.7
IGAD 30.4 2.0 31.3 34.3 4.7 51.9 6.3 65.1 4.0 70.4
SADC 33.4 -1.6 32.2 34.2 3.7 42.2 2.9 50.8 1.1 50.1
UMA 18.7 13.9 27.3 26.9 -1.6 32.0 5.5 43.3 3.7 45.8
CAADP Compact 2007-09 (CC1) 70.8 6.5 97.7 99.8 2.6 125.7 2.4 146.4 3.3 156.0
CAADP Compact 2010-12 (CC2) 37.8 -0.9 37.0 39.3 2.6 54.1 5.1 71.2 5.2 77.2
CAADP Compact 2013-15 (CC3) 27.3 2.8 28.8 29.2 1.0 37.1 5.1 44.3 -0.1 43.6
CAADP Compact not yet (CC0) 47.8 7.1 59.1 59.9 1.0 69.8 2.1 83.4 3.1 87.5
CAADP Level 0 (CL0) 47.8 7.1 59.1 59.9 1.0 69.8 2.1 83.4 3.1 87.5
CAADP Level 1 (CL1) 24.8 2.8 26.0 26.5 1.2 33.8 5.0 39.5 -0.8 38.3
CAADP Level 2 (CL2) 11.4 -4.3 9.6 9.6 0.8 12.1 4.2 16.1 6.0 18.0
CAADP Level 3 (CL3) 12.6 3.4 13.9 15.5 4.7 21.4 3.7 24.3 3.3 26.0
CAADP Level 4 (CL4) 87.3 5.1 114.0 116.7 2.4 149.6 3.1 182.0 3.8 194.6
NAIP00 (N00) 58.4 5.8 69.7 71.2 1.2 83.4 2.7 102.4 2.7 105.9
NAIP10 (N10) 32.8 0.1 33.0 34.1 2.1 45.7 4.6 52.5 0.9 53.0
NAIP11 (N11) 92.6 5.4 119.9 123.0 2.4 157.6 3.0 190.4 4.1 205.4
Source: ReSAKSS based on World Bank (2020) and FAO (2020).Note: Aggregate value for a group is sum of agriculture value added for countries in a group.
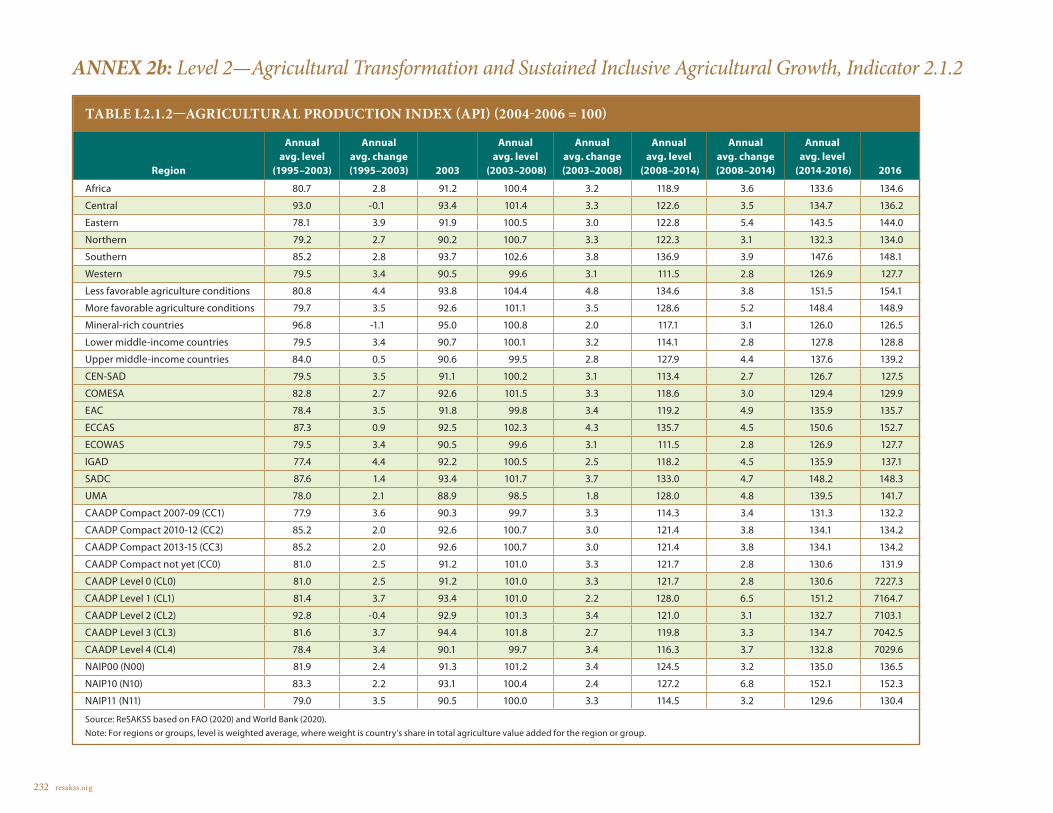
232 resakss.org
ANNEX 2b: Level 2—Agricultural Transformation and Sustained Inclusive Agricultural Growth, Indicator 2.1.2
TABLE L2.1.2—AGRICULTURAL PRODUCTION INDEX (API) (2004-2006 = 100)
Region
Annual avg. level
(1995–2003)
Annual avg. change (1995–2003) 2003
Annual avg. level
(2003–2008)
Annual avg. change (2003–2008)
Annual avg. level
(2008–2014)
Annual avg. change (2008–2014)
Annual avg. level
(2014-2016) 2016
Africa 80.7 2.8 91.2 100.4 3.2 118.9 3.6 133.6 134.6
Central 93.0 -0.1 93.4 101.4 3.3 122.6 3.5 134.7 136.2
Eastern 78.1 3.9 91.9 100.5 3.0 122.8 5.4 143.5 144.0
Northern 79.2 2.7 90.2 100.7 3.3 122.3 3.1 132.3 134.0
Southern 85.2 2.8 93.7 102.6 3.8 136.9 3.9 147.6 148.1
Western 79.5 3.4 90.5 99.6 3.1 111.5 2.8 126.9 127.7
Less favorable agriculture conditions 80.8 4.4 93.8 104.4 4.8 134.6 3.8 151.5 154.1
More favorable agriculture conditions 79.7 3.5 92.6 101.1 3.5 128.6 5.2 148.4 148.9
Mineral-rich countries 96.8 -1.1 95.0 100.8 2.0 117.1 3.1 126.0 126.5
Lower middle-income countries 79.5 3.4 90.7 100.1 3.2 114.1 2.8 127.8 128.8
Upper middle-income countries 84.0 0.5 90.6 99.5 2.8 127.9 4.4 137.6 139.2
CEN-SAD 79.5 3.5 91.1 100.2 3.1 113.4 2.7 126.7 127.5
COMESA 82.8 2.7 92.6 101.5 3.3 118.6 3.0 129.4 129.9
EAC 78.4 3.5 91.8 99.8 3.4 119.2 4.9 135.9 135.7
ECCAS 87.3 0.9 92.5 102.3 4.3 135.7 4.5 150.6 152.7
ECOWAS 79.5 3.4 90.5 99.6 3.1 111.5 2.8 126.9 127.7
IGAD 77.4 4.4 92.2 100.5 2.5 118.2 4.5 135.9 137.1
SADC 87.6 1.4 93.4 101.7 3.7 133.0 4.7 148.2 148.3
UMA 78.0 2.1 88.9 98.5 1.8 128.0 4.8 139.5 141.7
CAADP Compact 2007-09 (CC1) 77.9 3.6 90.3 99.7 3.3 114.3 3.4 131.3 132.2
CAADP Compact 2010-12 (CC2) 85.2 2.0 92.6 100.7 3.0 121.4 3.8 134.1 134.2
CAADP Compact 2013-15 (CC3) 85.2 2.0 92.6 100.7 3.0 121.4 3.8 134.1 134.2
CAADP Compact not yet (CC0) 81.0 2.5 91.2 101.0 3.3 121.7 2.8 130.6 131.9
CAADP Level 0 (CL0) 81.0 2.5 91.2 101.0 3.3 121.7 2.8 130.6 7227.3
CAADP Level 1 (CL1) 81.4 3.7 93.4 101.0 2.2 128.0 6.5 151.2 7164.7
CAADP Level 2 (CL2) 92.8 -0.4 92.9 101.3 3.4 121.0 3.1 132.7 7103.1
CAADP Level 3 (CL3) 81.6 3.7 94.4 101.8 2.7 119.8 3.3 134.7 7042.5
CAADP Level 4 (CL4) 78.4 3.4 90.1 99.7 3.4 116.3 3.7 132.8 7029.6
NAIP00 (N00) 81.9 2.4 91.3 101.2 3.4 124.5 3.2 135.0 136.5
NAIP10 (N10) 83.3 2.2 93.1 100.4 2.4 127.2 6.8 152.1 152.3
NAIP11 (N11) 79.0 3.5 90.5 100.0 3.3 114.5 3.2 129.6 130.4
Source: ReSAKSS based on FAO (2020) and World Bank (2020).Note: For regions or groups, level is weighted average, where weight is country’s share in total agriculture value added for the region or group.

2020 ReSAKSS Annual Trends and Outlook Report 233
ANNEX 2c: Level 2—Agricultural Transformation and Sustained Inclusive Agricultural Growth, Indicator 2.1.3
TABLE L2.1.3—LABOR PRODUCTIVITY (agriculture value-added per agricultural worker, constant 2010 US$)
Region
Annual avg. level
(1995–2003)
Annual avg. change (1995–2003) 2003
Annual avg. level
(2003–2008)
Annual avg. change (2003–2008)
Annual avg. level
(2008–2014)
Annual avg. change (2008–2014)
Annual avg. level
(2014-2019)
Annual avg. change (2014-2019) 2019
Africa 1,311.3 1.5 1,413.2 1,337.9 -1.5 1,488.6 2.1 1,672.7 1.4 1,704.3
Central 639.5 -6.4 494.2 459.3 -3.4 495.6 3.3 585.3 1.6 597.5
Eastern 702.1 -2.0 639.2 652.7 1.8 849.6 3.9 950.0 1.4 966.7
Northern 3,514.1 4.6 3,852.2 3,637.0 -1.8 4,383.3 4.5 5,910.7 5.3 6,419.7
Southern 1,193.3 -2.0 1,051.9 1,027.1 0.7 1,076.6 0.2 1,122.8 -2.9 1,023.1
Western 2,038.5 4.4 2,622.7 2,375.1 -3.6 2,500.0 2.4 2,950.2 2.5 3,089.4
Less favorable agriculture conditions 606.2 1.8 655.8 631.9 -3.9 625.4 3.7 755.9 2.0 779.4
More favorable agriculture conditions 424.2 -3.4 386.7 437.8 5.8 604.6 3.7 681.4 1.7 693.7
Mineral-rich countries 522.3 -6.8 382.3 376.9 2.3 469.0 2.0 507.2 1.7 529.8
Lower middle-income countries 2,493.8 2.5 2,776.1 2,493.5 -3.9 2,629.9 2.4 3,055.9 2.2 3,167.5
Upper middle-income countries 7,434.5 0.8 7,849.2 7,669.2 0.5 10,325.5 5.7 13,679.3 2.2 14,029.0
CEN-SAD 2,310.2 3.0 2,667.3 2,413.8 -3.9 2,506.6 2.3 2,896.4 2.5 3,027.1
COMESA 925.9 -1.5 835.0 819.5 0.2 962.3 2.0 1,034.8 1.8 1,069.4
EAC 615.8 -3.5 550.9 570.6 1.2 752.4 4.1 900.8 2.9 932.7
ECCAS 705.0 -6.1 541.4 515.4 -2.6 577.8 4.3 718.1 -0.4 689.3
ECOWAS 2,038.5 4.4 2,622.7 2,375.1 -3.6 2,500.0 2.4 2,950.2 2.5 3,089.4
IGAD 861.2 -1.5 767.2 770.0 1.5 1,011.6 3.6 1,098.1 1.4 1,129.7
SADC 715.4 -4.3 606.6 610.0 1.6 687.4 1.5 749.5 -1.2 705.9
UMA 3,257.1 6.0 3,806.0 3,750.0 -1.0 5,014.4 7.8 7,404.2 4.5 7,928.5
CAADP Compact 2007-09 (CC1) 1,280.9 3.5 1,599.2 1,487.6 -1.4 1,661.6 1.6 1,856.8 1.8 1,919.0
CAADP Compact 2010-12 (CC2) 686.3 -3.4 605.9 610.2 0.2 733.2 3.4 863.6 2.8 896.6
CAADP Compact 2013-15 (CC3) 1,608.9 -1.0 1,400.9 1,252.7 -5.1 1,284.1 3.3 1,390.1 -2.2 1,306.5
CAADP Compact not yet (CC0) 3,981.2 3.6 4,306.6 4,082.4 -1.0 4,905.5 3.5 6,293.2 4.4 6,742.4
CAADP Level 0 (CL0) 3,981.2 3.6 4,306.6 4,082.4 -1.0 4,905.5 3.5 6,293.2 4.4 6,742.4
CAADP Level 1 (CL1) 1,931.2 -1.4 1,622.5 1,429.4 -6.0 1,389.4 2.7 1,450.3 -3.1 1,336.6
CAADP Level 2 (CL2) 593.8 -7.0 445.1 426.9 -0.7 490.5 2.9 593.7 3.7 634.7
CAADP Level 3 (CL3) 650.1 0.4 644.4 664.2 1.6 793.6 1.1 771.6 0.1 774.8
CAADP Level 4 (CL4) 1,146.9 2.4 1,365.2 1,291.3 -1.2 1,463.1 2.4 1,696.5 2.4 1,763.5
NAIP00 (N00) 2,759.9 1.4 2,677.7 2,426.1 -4.3 2,437.0 1.8 2,844.7 1.6 2,876.8
NAIP10 (N10) 724.0 -2.2 667.4 661.6 0.6 820.2 3.5 864.9 -1.3 831.8
NAIP11 (N11) 1,264.6 2.4 1,476.0 1,382.2 -1.6 1,535.9 1.9 1,736.2 2.4 1,813.2
Source: ReSAKSS based on World Bank (2020).
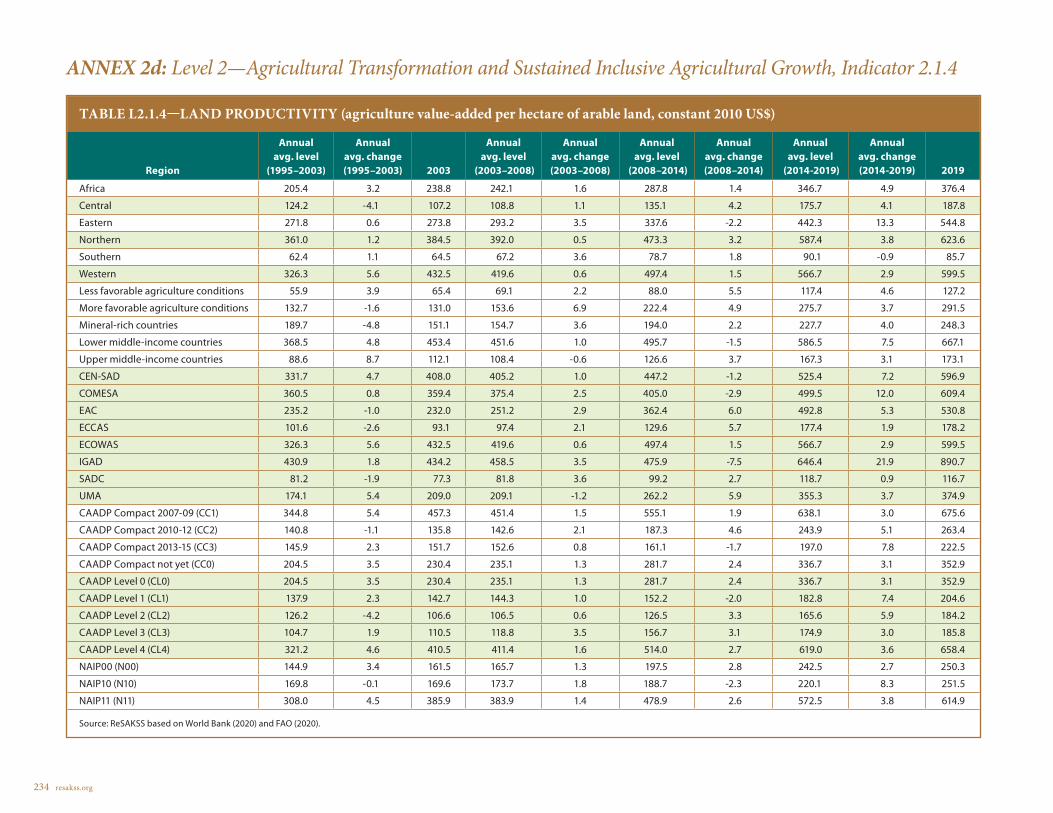
234 resakss.org
ANNEX 2d: Level 2—Agricultural Transformation and Sustained Inclusive Agricultural Growth, Indicator 2.1.4
TABLE L2.1.4—LAND PRODUCTIVITY (agriculture value-added per hectare of arable land, constant 2010 US$)
Region
Annual avg. level
(1995–2003)
Annual avg. change (1995–2003) 2003
Annual avg. level
(2003–2008)
Annual avg. change (2003–2008)
Annual avg. level
(2008–2014)
Annual avg. change (2008–2014)
Annual avg. level
(2014-2019)
Annual avg. change (2014-2019) 2019
Africa 205.4 3.2 238.8 242.1 1.6 287.8 1.4 346.7 4.9 376.4
Central 124.2 -4.1 107.2 108.8 1.1 135.1 4.2 175.7 4.1 187.8
Eastern 271.8 0.6 273.8 293.2 3.5 337.6 -2.2 442.3 13.3 544.8
Northern 361.0 1.2 384.5 392.0 0.5 473.3 3.2 587.4 3.8 623.6
Southern 62.4 1.1 64.5 67.2 3.6 78.7 1.8 90.1 -0.9 85.7
Western 326.3 5.6 432.5 419.6 0.6 497.4 1.5 566.7 2.9 599.5
Less favorable agriculture conditions 55.9 3.9 65.4 69.1 2.2 88.0 5.5 117.4 4.6 127.2
More favorable agriculture conditions 132.7 -1.6 131.0 153.6 6.9 222.4 4.9 275.7 3.7 291.5
Mineral-rich countries 189.7 -4.8 151.1 154.7 3.6 194.0 2.2 227.7 4.0 248.3
Lower middle-income countries 368.5 4.8 453.4 451.6 1.0 495.7 -1.5 586.5 7.5 667.1
Upper middle-income countries 88.6 8.7 112.1 108.4 -0.6 126.6 3.7 167.3 3.1 173.1
CEN-SAD 331.7 4.7 408.0 405.2 1.0 447.2 -1.2 525.4 7.2 596.9
COMESA 360.5 0.8 359.4 375.4 2.5 405.0 -2.9 499.5 12.0 609.4
EAC 235.2 -1.0 232.0 251.2 2.9 362.4 6.0 492.8 5.3 530.8
ECCAS 101.6 -2.6 93.1 97.4 2.1 129.6 5.7 177.4 1.9 178.2
ECOWAS 326.3 5.6 432.5 419.6 0.6 497.4 1.5 566.7 2.9 599.5
IGAD 430.9 1.8 434.2 458.5 3.5 475.9 -7.5 646.4 21.9 890.7
SADC 81.2 -1.9 77.3 81.8 3.6 99.2 2.7 118.7 0.9 116.7
UMA 174.1 5.4 209.0 209.1 -1.2 262.2 5.9 355.3 3.7 374.9
CAADP Compact 2007-09 (CC1) 344.8 5.4 457.3 451.4 1.5 555.1 1.9 638.1 3.0 675.6
CAADP Compact 2010-12 (CC2) 140.8 -1.1 135.8 142.6 2.1 187.3 4.6 243.9 5.1 263.4
CAADP Compact 2013-15 (CC3) 145.9 2.3 151.7 152.6 0.8 161.1 -1.7 197.0 7.8 222.5
CAADP Compact not yet (CC0) 204.5 3.5 230.4 235.1 1.3 281.7 2.4 336.7 3.1 352.9
CAADP Level 0 (CL0) 204.5 3.5 230.4 235.1 1.3 281.7 2.4 336.7 3.1 352.9
CAADP Level 1 (CL1) 137.9 2.3 142.7 144.3 1.0 152.2 -2.0 182.8 7.4 204.6
CAADP Level 2 (CL2) 126.2 -4.2 106.6 106.5 0.6 126.5 3.3 165.6 5.9 184.2
CAADP Level 3 (CL3) 104.7 1.9 110.5 118.8 3.5 156.7 3.1 174.9 3.0 185.8
CAADP Level 4 (CL4) 321.2 4.6 410.5 411.4 1.6 514.0 2.7 619.0 3.6 658.4
NAIP00 (N00) 144.9 3.4 161.5 165.7 1.3 197.5 2.8 242.5 2.7 250.3
NAIP10 (N10) 169.8 -0.1 169.6 173.7 1.8 188.7 -2.3 220.1 8.3 251.5
NAIP11 (N11) 308.0 4.5 385.9 383.9 1.4 478.9 2.6 572.5 3.8 614.9
Source: ReSAKSS based on World Bank (2020) and FAO (2020).

2020 ReSAKSS Annual Trends and Outlook Report 235
ANNEX 2e: Level 2—Agricultural Transformation and Sustained Inclusive Agricultural Growth, Indicator 2.1.5A
TABLE L2.1.5A—YIELD, CASSAVA (metric tons per hectare)
Region
Annual avg. level
(1995–2003)
Annual avg. change (1995–2003) 2003
Annual avg. level
(2003–2008)
Annual avg. change (2003–2008)
Annual avg. level
(2008–2014)
Annual avg. change (2008–2014)
Annual avg. level
(2014-2018)
Annual avg. change (2014-2018) 2018
Africa 8.6 1.0 8.9 9.3 1.8 9.2 -2.2 9.0 0.6 9.1
Central 7.8 -0.2 7.6 7.8 1.3 8.1 0.4 8.3 0.2 8.3
Eastern 8.0 0.1 7.7 7.5 1.0 6.1 -3.3 6.0 4.3 6.4
Northern
Southern 6.4 8.3 8.1 8.5 2.8 10.4 2.6 10.3 -0.6 10.3
Western 10.1 -0.4 10.3 10.8 1.5 10.4 -4.6 9.9 0.0 9.7
Less favorable agriculture conditions 7.1 7.1 8.3 7.4 -6.0 7.0 5.5 9.3 2.1 8.8
More favorable agriculture conditions 7.5 3.0 7.7 7.6 0.6 7.5 0.7 7.8 1.6 8.1
Mineral-rich countries 7.6 -0.2 7.5 7.4 -0.1 7.8 1.3 7.9 -0.5 7.8
Lower middle-income countries 9.8 0.1 10.2 11.0 2.7 10.9 -4.9 10.1 0.1 10.0
Upper middle-income countries 4.2 0.5 4.3 4.3 0.9 4.5 0.9 4.6 0.3 4.7
CEN-SAD 9.8 -0.3 10.0 10.5 1.4 10.1 -4.2 9.7 0.0 9.6
COMESA 8.1 2.4 8.6 8.7 -0.4 8.0 -0.9 8.2 1.9 8.4
EAC 8.4 0.2 8.1 7.7 -0.5 5.8 -3.2 6.1 4.7 6.4
ECCAS 7.6 1.9 8.3 8.7 2.4 9.2 -1.7 8.7 0.7 8.7
ECOWAS 10.1 -0.4 10.3 10.8 1.5 10.4 -4.6 9.9 0.0 9.7
IGAD 10.2 9.1 12.6 11.9 -7.3 5.7 -12.1 5.3 14.4 6.3
SADC 7.3 1.3 7.5 7.8 2.7 8.6 0.8 8.4 0.0 8.5
UMA
CAADP Compact 2007-09 (CC1) 10.3 -0.7 10.4 10.9 1.5 10.5 -4.5 10.2 0.2 10.1
CAADP Compact 2010-12 (CC2) 7.4 1.4 7.5 7.4 0.0 7.4 1.1 7.6 0.5 7.7
CAADP Compact 2013-15 (CC3) 7.3 4.3 8.5 9.7 6.5 11.2 -2.3 10.4 1.8 10.6
CAADP Compact not yet (CC0) 7.1 0.7 7.3 7.3 -0.1 7.4 0.3 7.4 0.2 7.4
CAADP Level 0 (CL0) 7.1 0.7 7.3 7.3 -0.1 7.4 0.3 7.4 0.2 7.4
CAADP Level 1 (CL1) 6.9 6.5 8.8 9.6 4.7 10.7 -3.3 9.4 2.4 9.6
CAADP Level 2 (CL2) 7.8 -0.5 7.6 7.9 1.7 8.2 0.1 8.3 0.0 8.3
CAADP Level 3 (CL3) 8.2 5.3 9.1 8.6 -4.7 6.2 -3.8 5.9 2.4 6.0
CAADP Level 4 (CL4) 9.2 0.1 9.4 9.8 2.1 9.9 -2.2 9.8 -0.5 9.7
NAIP00 (N00) 6.8 7.0 8.8 9.6 4.9 10.7 -3.7 9.2 2.5 9.5
NAIP10 (N10) 7.2 -0.9 6.8 6.8 1.5 7.4 3.0 7.9 -0.6 7.9
NAIP11 (N11) 10.0 0.8 10.5 10.9 0.9 10.2 -4.6 9.8 1.0 9.8
Source: ReSAKSS based on FAO (2020).Note: Cassava production data are not available in Northern Africa and UMA.
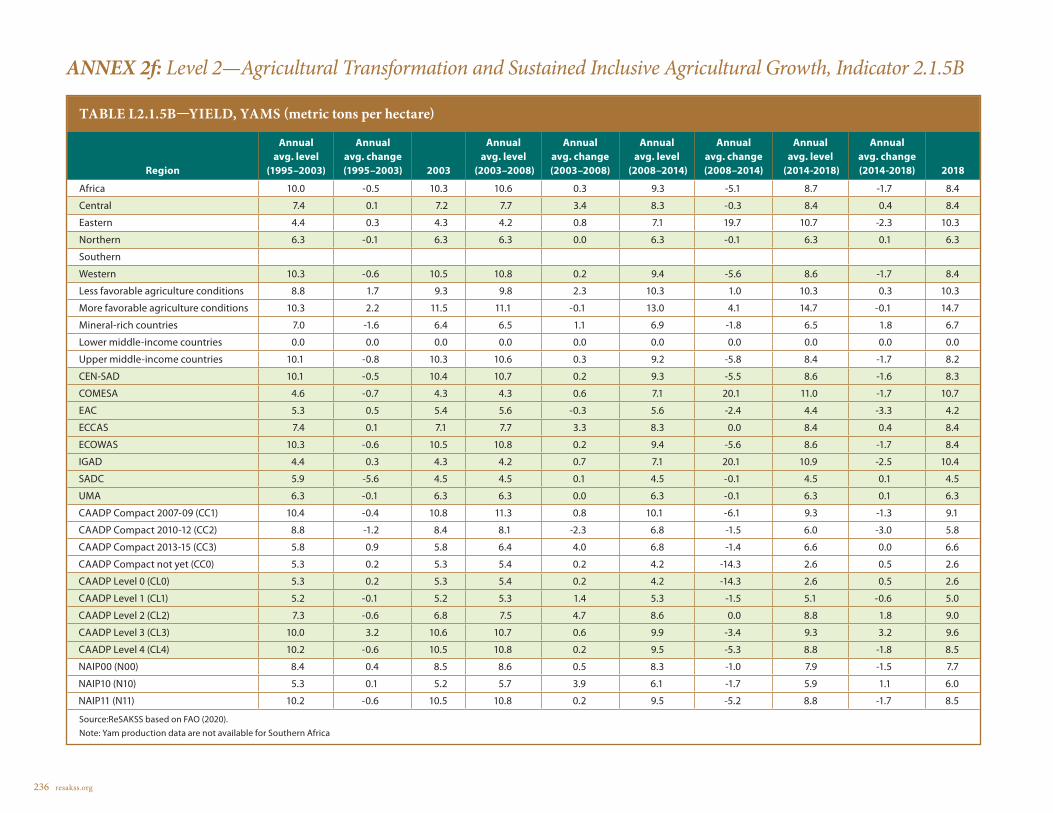
236 resakss.org
ANNEX 2f: Level 2—Agricultural Transformation and Sustained Inclusive Agricultural Growth, Indicator 2.1.5B
TABLE L2.1.5B—YIELD, YAMS (metric tons per hectare)
Region
Annual avg. level
(1995–2003)
Annual avg. change (1995–2003) 2003
Annual avg. level
(2003–2008)
Annual avg. change (2003–2008)
Annual avg. level
(2008–2014)
Annual avg. change (2008–2014)
Annual avg. level
(2014-2018)
Annual avg. change (2014-2018) 2018
Africa 10.0 -0.5 10.3 10.6 0.3 9.3 -5.1 8.7 -1.7 8.4
Central 7.4 0.1 7.2 7.7 3.4 8.3 -0.3 8.4 0.4 8.4
Eastern 4.4 0.3 4.3 4.2 0.8 7.1 19.7 10.7 -2.3 10.3
Northern 6.3 -0.1 6.3 6.3 0.0 6.3 -0.1 6.3 0.1 6.3
Southern
Western 10.3 -0.6 10.5 10.8 0.2 9.4 -5.6 8.6 -1.7 8.4
Less favorable agriculture conditions 8.8 1.7 9.3 9.8 2.3 10.3 1.0 10.3 0.3 10.3
More favorable agriculture conditions 10.3 2.2 11.5 11.1 -0.1 13.0 4.1 14.7 -0.1 14.7
Mineral-rich countries 7.0 -1.6 6.4 6.5 1.1 6.9 -1.8 6.5 1.8 6.7
Lower middle-income countries 0.0 0.0 0.0 0.0 0.0 0.0 0.0 0.0 0.0 0.0
Upper middle-income countries 10.1 -0.8 10.3 10.6 0.3 9.2 -5.8 8.4 -1.7 8.2
CEN-SAD 10.1 -0.5 10.4 10.7 0.2 9.3 -5.5 8.6 -1.6 8.3
COMESA 4.6 -0.7 4.3 4.3 0.6 7.1 20.1 11.0 -1.7 10.7
EAC 5.3 0.5 5.4 5.6 -0.3 5.6 -2.4 4.4 -3.3 4.2
ECCAS 7.4 0.1 7.1 7.7 3.3 8.3 0.0 8.4 0.4 8.4
ECOWAS 10.3 -0.6 10.5 10.8 0.2 9.4 -5.6 8.6 -1.7 8.4
IGAD 4.4 0.3 4.3 4.2 0.7 7.1 20.1 10.9 -2.5 10.4
SADC 5.9 -5.6 4.5 4.5 0.1 4.5 -0.1 4.5 0.1 4.5
UMA 6.3 -0.1 6.3 6.3 0.0 6.3 -0.1 6.3 0.1 6.3
CAADP Compact 2007-09 (CC1) 10.4 -0.4 10.8 11.3 0.8 10.1 -6.1 9.3 -1.3 9.1
CAADP Compact 2010-12 (CC2) 8.8 -1.2 8.4 8.1 -2.3 6.8 -1.5 6.0 -3.0 5.8
CAADP Compact 2013-15 (CC3) 5.8 0.9 5.8 6.4 4.0 6.8 -1.4 6.6 0.0 6.6
CAADP Compact not yet (CC0) 5.3 0.2 5.3 5.4 0.2 4.2 -14.3 2.6 0.5 2.6
CAADP Level 0 (CL0) 5.3 0.2 5.3 5.4 0.2 4.2 -14.3 2.6 0.5 2.6
CAADP Level 1 (CL1) 5.2 -0.1 5.2 5.3 1.4 5.3 -1.5 5.1 -0.6 5.0
CAADP Level 2 (CL2) 7.3 -0.6 6.8 7.5 4.7 8.6 0.0 8.8 1.8 9.0
CAADP Level 3 (CL3) 10.0 3.2 10.6 10.7 0.6 9.9 -3.4 9.3 3.2 9.6
CAADP Level 4 (CL4) 10.2 -0.6 10.5 10.8 0.2 9.5 -5.3 8.8 -1.8 8.5
NAIP00 (N00) 8.4 0.4 8.5 8.6 0.5 8.3 -1.0 7.9 -1.5 7.7
NAIP10 (N10) 5.3 0.1 5.2 5.7 3.9 6.1 -1.7 5.9 1.1 6.0
NAIP11 (N11) 10.2 -0.6 10.5 10.8 0.2 9.5 -5.2 8.8 -1.7 8.5
Source:ReSAKSS based on FAO (2020).Note: Yam production data are not available for Southern Africa
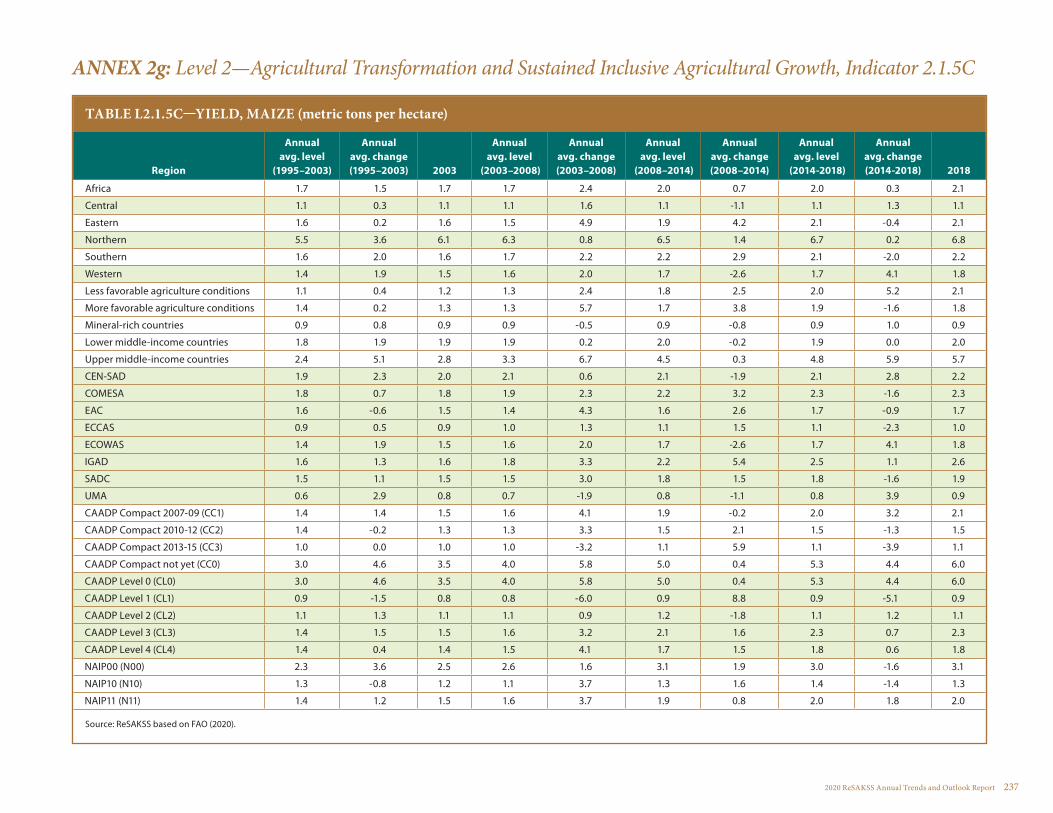
2020 ReSAKSS Annual Trends and Outlook Report 237
ANNEX 2g: Level 2—Agricultural Transformation and Sustained Inclusive Agricultural Growth, Indicator 2.1.5C
TABLE L2.1.5C—YIELD, MAIZE (metric tons per hectare)
Region
Annual avg. level
(1995–2003)
Annual avg. change (1995–2003) 2003
Annual avg. level
(2003–2008)
Annual avg. change (2003–2008)
Annual avg. level
(2008–2014)
Annual avg. change (2008–2014)
Annual avg. level
(2014-2018)
Annual avg. change (2014-2018) 2018
Africa 1.7 1.5 1.7 1.7 2.4 2.0 0.7 2.0 0.3 2.1
Central 1.1 0.3 1.1 1.1 1.6 1.1 -1.1 1.1 1.3 1.1
Eastern 1.6 0.2 1.6 1.5 4.9 1.9 4.2 2.1 -0.4 2.1
Northern 5.5 3.6 6.1 6.3 0.8 6.5 1.4 6.7 0.2 6.8
Southern 1.6 2.0 1.6 1.7 2.2 2.2 2.9 2.1 -2.0 2.2
Western 1.4 1.9 1.5 1.6 2.0 1.7 -2.6 1.7 4.1 1.8
Less favorable agriculture conditions 1.1 0.4 1.2 1.3 2.4 1.8 2.5 2.0 5.2 2.1
More favorable agriculture conditions 1.4 0.2 1.3 1.3 5.7 1.7 3.8 1.9 -1.6 1.8
Mineral-rich countries 0.9 0.8 0.9 0.9 -0.5 0.9 -0.8 0.9 1.0 0.9
Lower middle-income countries 1.8 1.9 1.9 1.9 0.2 2.0 -0.2 1.9 0.0 2.0
Upper middle-income countries 2.4 5.1 2.8 3.3 6.7 4.5 0.3 4.8 5.9 5.7
CEN-SAD 1.9 2.3 2.0 2.1 0.6 2.1 -1.9 2.1 2.8 2.2
COMESA 1.8 0.7 1.8 1.9 2.3 2.2 3.2 2.3 -1.6 2.3
EAC 1.6 -0.6 1.5 1.4 4.3 1.6 2.6 1.7 -0.9 1.7
ECCAS 0.9 0.5 0.9 1.0 1.3 1.1 1.5 1.1 -2.3 1.0
ECOWAS 1.4 1.9 1.5 1.6 2.0 1.7 -2.6 1.7 4.1 1.8
IGAD 1.6 1.3 1.6 1.8 3.3 2.2 5.4 2.5 1.1 2.6
SADC 1.5 1.1 1.5 1.5 3.0 1.8 1.5 1.8 -1.6 1.9
UMA 0.6 2.9 0.8 0.7 -1.9 0.8 -1.1 0.8 3.9 0.9
CAADP Compact 2007-09 (CC1) 1.4 1.4 1.5 1.6 4.1 1.9 -0.2 2.0 3.2 2.1
CAADP Compact 2010-12 (CC2) 1.4 -0.2 1.3 1.3 3.3 1.5 2.1 1.5 -1.3 1.5
CAADP Compact 2013-15 (CC3) 1.0 0.0 1.0 1.0 -3.2 1.1 5.9 1.1 -3.9 1.1
CAADP Compact not yet (CC0) 3.0 4.6 3.5 4.0 5.8 5.0 0.4 5.3 4.4 6.0
CAADP Level 0 (CL0) 3.0 4.6 3.5 4.0 5.8 5.0 0.4 5.3 4.4 6.0
CAADP Level 1 (CL1) 0.9 -1.5 0.8 0.8 -6.0 0.9 8.8 0.9 -5.1 0.9
CAADP Level 2 (CL2) 1.1 1.3 1.1 1.1 0.9 1.2 -1.8 1.1 1.2 1.1
CAADP Level 3 (CL3) 1.4 1.5 1.5 1.6 3.2 2.1 1.6 2.3 0.7 2.3
CAADP Level 4 (CL4) 1.4 0.4 1.4 1.5 4.1 1.7 1.5 1.8 0.6 1.8
NAIP00 (N00) 2.3 3.6 2.5 2.6 1.6 3.1 1.9 3.0 -1.6 3.1
NAIP10 (N10) 1.3 -0.8 1.2 1.1 3.7 1.3 1.6 1.4 -1.4 1.3
NAIP11 (N11) 1.4 1.2 1.5 1.6 3.7 1.9 0.8 2.0 1.8 2.0
Source: ReSAKSS based on FAO (2020).

238 resakss.org
ANNEX 2h: Level 2—Agricultural Transformation and Sustained Inclusive Agricultural Growth, Indicator 2.1.5D
TABLE L2.1.5D—YIELD, MEAT (indigenous cattle, kilograms per head)
Region
Annual avg. level
(1995–2003)
Annual avg. change (1995–2003) 2003
Annual avg. level
(2003–2008)
Annual avg. change (2003–2008)
Annual avg. level
(2008–2014)
Annual avg. change (2008–2014)
Annual avg. level
(2008–2014)
Annual avg. change (2008–2014) 2018
Africa 145.6 0.7 152.7 156.6 0.8 156.6 -0.6 154.1 -0.4 152.8
Central 134.4 -0.2 133.0 132.4 0.0 127.8 -0.9 124.9 -0.4 124.2
Eastern 116.6 1.0 125.6 129.8 1.0 128.3 -1.0 128.5 1.2 131.3
Northern 191.7 3.0 223.6 228.6 1.7 237.2 -0.1 233.8 -1.7 224.8
Southern 222.3 -0.4 217.3 228.6 1.1 235.3 0.2 236.6 -0.5 232.6
Western 128.6 0.4 130.3 130.2 0.0 127.7 -0.5 123.6 -1.1 121.5
Less favorable agriculture conditions 124.6 1.2 129.3 129.0 -0.3 125.9 -0.3 124.5 -0.1 124.3
More favorable agriculture conditions 115.5 -0.5 112.4 113.7 0.5 114.0 -0.4 110.3 0.1 110.6
Mineral-rich countries 131.2 -0.4 128.5 125.7 -0.3 135.1 3.2 143.8 -0.6 143.3
Lower middle-income countries 146.5 2.0 164.7 170.6 1.4 168.9 -1.5 165.1 -0.5 163.3
Upper middle-income countries 234.2 -0.2 232.8 248.4 1.5 268.9 1.1 275.6 0.4 275.9
CEN-SAD 136.3 1.7 150.9 154.9 1.2 154.1 -1.2 149.7 -0.5 148.4
COMESA 136.2 1.7 152.4 157.3 1.1 157.4 -1.2 153.5 -0.2 152.3
EAC 122.3 1.8 142.2 152.4 2.1 147.0 -2.1 145.9 1.9 151.0
ECCAS 139.9 0.2 138.3 135.7 -0.4 130.2 -0.8 126.9 -0.6 125.8
ECOWAS 128.6 0.4 130.3 130.2 0.0 127.7 -0.5 123.6 -1.1 121.5
IGAD 118.2 1.7 132.4 138.2 1.2 137.6 -1.1 139.0 1.5 142.4
SADC 175.7 -0.1 174.5 181.1 0.9 182.8 -0.1 180.6 -0.4 178.5
UMA 180.5 1.1 184.4 185.6 0.8 189.7 1.0 204.0 2.2 212.3
CAADP Compact 2007-09 (CC1) 123.7 0.3 124.9 125.3 0.0 121.5 -0.8 120.1 -0.5 119.1
CAADP Compact 2010-12 (CC2) 125.4 0.8 135.8 141.9 1.5 141.7 -1.0 140.0 1.1 143.0
CAADP Compact 2013-15 (CC3) 131.7 1.0 135.1 134.1 -0.2 129.8 -1.3 124.8 -0.3 124.2
CAADP Compact not yet (CC0) 206.6 1.2 222.2 232.9 1.7 242.6 -0.6 236.5 -0.9 231.2
CAADP Level 0 (CL0) 206.6 1.2 222.2 232.9 1.7 242.6 -0.6 236.5 -0.9 231.2
CAADP Level 1 (CL1) 131.1 1.2 135.0 133.9 -0.3 131.2 -0.9 127.0 -0.2 126.6
CAADP Level 2 (CL2) 136.6 -0.7 133.0 131.3 -0.1 128.5 -0.3 125.3 -1.6 122.3
CAADP Level 3 (CL3) 146.6 2.5 157.6 156.8 -0.3 153.0 -0.4 150.9 0.0 151.0
CAADP Level 4 (CL4) 119.3 0.4 125.5 129.9 1.2 127.0 -1.5 125.5 1.0 127.6
NAIP00 (N00) 184.3 1.0 194.3 199.1 0.8 204.8 0.2 202.8 -1.2 197.5
NAIP10 (N10) 120.8 0.3 121.2 121.6 0.3 121.5 -0.3 120.1 0.1 120.9
NAIP11 (N11) 125.2 0.9 134.6 138.9 0.9 136.7 -1.0 135.9 0.5 137.3
Source: ReSAKSS based on FAO (2020).

2020 ReSAKSS Annual Trends and Outlook Report 239
ANNEX 2i: Level 2—Agricultural Transformation and Sustained Inclusive Agricultural Growth, Indicator 2.1.5E
TABLE L2.1.5E—YIELD, MILK (whole fresh cow, kilograms per head)
Region
Annual avg. level
(1995–2003)
Annual avg. change (1995–2003) 2003
Annual avg. level
(2003–2008)
Annual avg. change (2003–2008)
Annual avg. level
(2008–2014)
Annual avg. change (2008–2014)
Annual avg. level
(2014-2018)
Annual avg. change (2014-2018) 2018
Africa 528.2 1.5 563.4 553.6 -0.7 539.3 0.3 518.2 -1.0 512.9
Central 310.8 -0.9 299.1 300.6 0.6 312.8 2.0 260.5 -3.7 259.7
Eastern 377.8 2.8 435.1 407.4 -2.5 377.0 -0.5 354.1 -0.8 349.5
Northern 1179.7 4.6 1375.7 1580.7 5.0 1896.5 2.6 1810.2 -3.7 1732.8
Southern 1326.8 -1.1 1337.5 1403.8 0.9 1421.1 1.3 1494.5 1.1 1525.3
Western 256.3 -0.8 248.0 254.0 1.6 263.4 -0.2 272.8 1.6 285.4
Less favorable agriculture conditions 285.2 -1.6 265.4 275.1 1.6 282.4 0.1 280.3 1.7 300.1
More favorable agriculture conditions 313.3 4.6 409.5 388.7 -2.7 335.6 -0.6 309.7 -1.5 305.0
Mineral-rich countries 317.4 -3.8 282.8 303.1 2.8 357.8 1.6 358.6 -0.3 358.0
Lower middle-income countries 560.3 1.2 579.8 567.9 0.0 626.0 2.8 642.3 -1.2 631.1
Upper middle-income countries 1986.8 0.4 2100.8 2373.7 3.5 2587.2 2.9 2697.4 0.2 2730.1
CEN-SAD 497.3 1.2 512.6 503.3 0.0 520.1 0.1 501.6 -0.9 497.6
COMESA 467.0 2.6 535.9 513.3 -1.7 477.8 -0.4 446.4 0.1 448.3
EAC 386.6 3.1 429.4 416.9 -1.7 417.3 -0.1 396.6 -1.7 384.0
ECCAS 374.8 -0.4 364.8 366.6 0.4 383.9 2.3 322.9 -2.5 324.5
ECOWAS 256.3 -0.8 248.0 254.0 1.6 263.4 -0.2 272.8 1.6 285.4
IGAD 415.8 2.7 480.9 446.2 -2.7 402.5 -1.2 375.6 0.3 376.5
SADC 667.8 -0.7 641.2 630.4 -1.3 620.2 1.6 640.9 -0.6 638.7
UMA 1175.6 4.9 1350.1 1521.8 5.2 1908.8 4.3 1914.0 -4.6 1780.4
CAADP Compact 2007-09 (CC1) 289.9 6.0 422.7 401.5 -2.8 322.4 -2.4 292.5 0.2 296.9
CAADP Compact 2010-12 (CC2) 425.9 1.9 452.8 435.2 -1.8 440.7 0.9 431.1 -1.3 422.2
CAADP Compact 2013-15 (CC3) 423.6 -0.4 411.4 379.1 -1.9 372.8 0.5 351.6 0.0 356.3
CAADP Compact not yet (CC0) 1209.8 2.0 1300.1 1461.9 3.7 1377.2 -7.6 1045.6 -1.6 1026.4
CAADP Level 0 (CL0) 1209.8 2.0 1300.1 1461.9 3.7 1377.2 -7.6 1045.6 -1.6 1026.4
CAADP Level 1 (CL1) 418.5 -0.3 407.3 375.0 -1.9 367.6 0.4 345.5 0.0 350.3
CAADP Level 2 (CL2) 663.4 -0.7 645.5 624.0 -1.4 622.4 0.4 617.8 -1.1 611.3
CAADP Level 3 (CL3) 444.2 -1.2 419.9 415.6 0.1 409.1 -0.1 429.8 1.2 444.1
CAADP Level 4 (CL4) 334.6 5.1 435.0 414.1 -2.9 367.8 -0.8 337.1 -1.2 330.4
NAIP00 (N00) 910.6 2.2 999.9 1102.4 3.0 1232.2 2.1 1169.0 -2.0 1151.5
NAIP10 (N10) 443.3 -0.7 421.6 388.2 -2.2 380.0 0.7 377.5 -0.6 376.4
NAIP11 (N11) 352.3 4.4 448.7 430.4 -2.3 381.7 -1.4 356.3 0.3 358.0
Source: ReSAKSS based on FAO (2020).
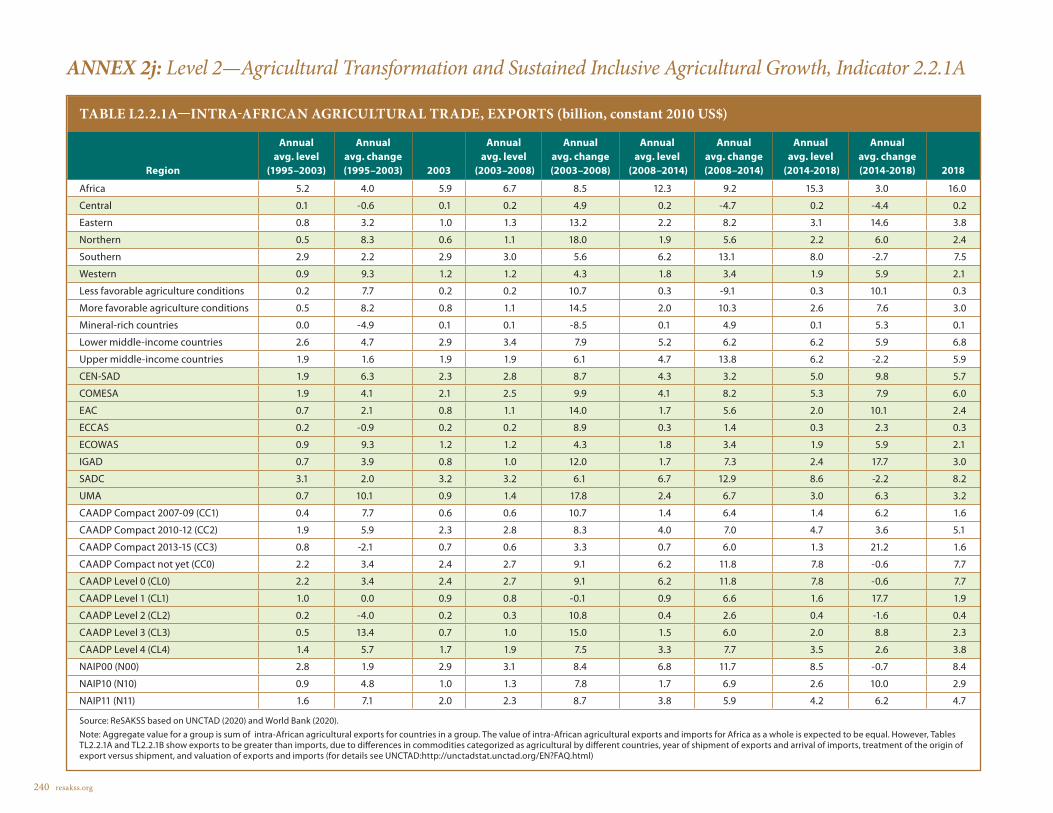
240 resakss.org
ANNEX 2j: Level 2—Agricultural Transformation and Sustained Inclusive Agricultural Growth, Indicator 2.2.1A
TABLE L2.2.1A—INTRA-AFRICAN AGRICULTURAL TRADE, EXPORTS (billion, constant 2010 US$)
Region
Annual avg. level
(1995–2003)
Annual avg. change (1995–2003) 2003
Annual avg. level
(2003–2008)
Annual avg. change (2003–2008)
Annual avg. level
(2008–2014)
Annual avg. change (2008–2014)
Annual avg. level
(2014-2018)
Annual avg. change (2014-2018) 2018
Africa 5.2 4.0 5.9 6.7 8.5 12.3 9.2 15.3 3.0 16.0
Central 0.1 -0.6 0.1 0.2 4.9 0.2 -4.7 0.2 -4.4 0.2
Eastern 0.8 3.2 1.0 1.3 13.2 2.2 8.2 3.1 14.6 3.8
Northern 0.5 8.3 0.6 1.1 18.0 1.9 5.6 2.2 6.0 2.4
Southern 2.9 2.2 2.9 3.0 5.6 6.2 13.1 8.0 -2.7 7.5
Western 0.9 9.3 1.2 1.2 4.3 1.8 3.4 1.9 5.9 2.1
Less favorable agriculture conditions 0.2 7.7 0.2 0.2 10.7 0.3 -9.1 0.3 10.1 0.3
More favorable agriculture conditions 0.5 8.2 0.8 1.1 14.5 2.0 10.3 2.6 7.6 3.0
Mineral-rich countries 0.0 -4.9 0.1 0.1 -8.5 0.1 4.9 0.1 5.3 0.1
Lower middle-income countries 2.6 4.7 2.9 3.4 7.9 5.2 6.2 6.2 5.9 6.8
Upper middle-income countries 1.9 1.6 1.9 1.9 6.1 4.7 13.8 6.2 -2.2 5.9
CEN-SAD 1.9 6.3 2.3 2.8 8.7 4.3 3.2 5.0 9.8 5.7
COMESA 1.9 4.1 2.1 2.5 9.9 4.1 8.2 5.3 7.9 6.0
EAC 0.7 2.1 0.8 1.1 14.0 1.7 5.6 2.0 10.1 2.4
ECCAS 0.2 -0.9 0.2 0.2 8.9 0.3 1.4 0.3 2.3 0.3
ECOWAS 0.9 9.3 1.2 1.2 4.3 1.8 3.4 1.9 5.9 2.1
IGAD 0.7 3.9 0.8 1.0 12.0 1.7 7.3 2.4 17.7 3.0
SADC 3.1 2.0 3.2 3.2 6.1 6.7 12.9 8.6 -2.2 8.2
UMA 0.7 10.1 0.9 1.4 17.8 2.4 6.7 3.0 6.3 3.2
CAADP Compact 2007-09 (CC1) 0.4 7.7 0.6 0.6 10.7 1.4 6.4 1.4 6.2 1.6
CAADP Compact 2010-12 (CC2) 1.9 5.9 2.3 2.8 8.3 4.0 7.0 4.7 3.6 5.1
CAADP Compact 2013-15 (CC3) 0.8 -2.1 0.7 0.6 3.3 0.7 6.0 1.3 21.2 1.6
CAADP Compact not yet (CC0) 2.2 3.4 2.4 2.7 9.1 6.2 11.8 7.8 -0.6 7.7
CAADP Level 0 (CL0) 2.2 3.4 2.4 2.7 9.1 6.2 11.8 7.8 -0.6 7.7
CAADP Level 1 (CL1) 1.0 0.0 0.9 0.8 -0.1 0.9 6.6 1.6 17.7 1.9
CAADP Level 2 (CL2) 0.2 -4.0 0.2 0.3 10.8 0.4 2.6 0.4 -1.6 0.4
CAADP Level 3 (CL3) 0.5 13.4 0.7 1.0 15.0 1.5 6.0 2.0 8.8 2.3
CAADP Level 4 (CL4) 1.4 5.7 1.7 1.9 7.5 3.3 7.7 3.5 2.6 3.8
NAIP00 (N00) 2.8 1.9 2.9 3.1 8.4 6.8 11.7 8.5 -0.7 8.4
NAIP10 (N10) 0.9 4.8 1.0 1.3 7.8 1.7 6.9 2.6 10.0 2.9
NAIP11 (N11) 1.6 7.1 2.0 2.3 8.7 3.8 5.9 4.2 6.2 4.7
Source: ReSAKSS based on UNCTAD (2020) and World Bank (2020).Note: Aggregate value for a group is sum of intra-African agricultural exports for countries in a group. The value of intra-African agricultural exports and imports for Africa as a whole is expected to be equal. However, Tables TL2.2.1A and TL2.2.1B show exports to be greater than imports, due to differences in commodities categorized as agricultural by different countries, year of shipment of exports and arrival of imports, treatment of the origin of export versus shipment, and valuation of exports and imports (for details see UNCTAD:http://unctadstat.unctad.org/EN?FAQ.html)

2020 ReSAKSS Annual Trends and Outlook Report 241
ANNEX 2k: Level 2—Agricultural Transformation and Sustained Inclusive Agricultural Growth, Indicator 2.2.1B
TABLE L2.2.1B—INTRA-AFRICAN AGRICULTURAL TRADE, IMPORTS (billion, constant 2010 US$)
Region
Annual avg. level
(1995–2003)
Annual avg. change (1995–2003) 2003
Annual avg. level
(2003–2008)
Annual avg. change (2003–2008)
Annual avg. level
(2008–2014)
Annual avg. change (2008–2014)
Annual avg. level
(2014-2018)
Annual avg. change (2014-2018) 2018
Africa 6.0 6.8 7.6 8.1 4.5 12.1 5.1 14.2 1.8 14.5
Central 0.6 0.0 0.6 0.8 8.8 1.1 6.2 1.3 -9.3 1.1
Eastern 0.7 10.7 1.1 1.3 6.9 1.9 4.5 2.4 13.4 2.9
Northern 0.7 11.7 1.0 1.0 5.1 1.6 5.8 1.9 2.8 2.1
Southern 3.1 5.0 3.7 3.7 3.4 5.5 4.2 6.2 -1.0 5.9
Western 1.0 11.0 1.2 1.3 2.2 2.0 7.2 2.3 4.0 2.5
Less favorable agriculture conditions 0.3 11.0 0.4 0.5 6.5 0.8 7.8 0.9 0.5 0.9
More favorable agriculture conditions 0.7 2.1 0.9 1.1 4.5 1.4 7.9 1.8 5.6 2.0
Mineral-rich countries 0.3 -3.2 0.3 0.4 12.7 0.6 4.3 0.6 -6.0 0.6
Lower middle-income countries 3.3 8.0 4.0 4.1 3.6 5.9 1.6 6.4 3.2 6.8
Upper middle-income countries 1.5 8.3 1.9 2.0 4.1 3.5 10.2 4.4 -0.3 4.3
CEN-SAD 1.8 12.9 2.6 2.8 3.1 4.4 6.3 5.3 6.5 5.9
COMESA 2.3 7.4 3.2 3.7 7.6 5.0 1.7 5.4 3.7 5.8
EAC 0.4 5.4 0.6 0.8 10.4 1.1 4.2 1.2 6.3 1.4
ECCAS 1.2 5.7 1.3 1.3 0.1 1.7 5.1 2.0 -6.8 1.8
ECOWAS 1.0 11.0 1.2 1.3 2.2 2.0 7.2 2.3 4.0 2.5
IGAD 0.5 13.2 0.7 0.9 7.4 1.2 1.9 1.6 17.6 2.0
SADC 3.5 4.5 4.3 4.4 4.1 6.5 4.2 7.2 -0.8 7.0
UMA 1.0 19.2 1.4 1.4 3.4 2.4 9.4 3.0 -1.0 2.9
CAADP Compact 2007-09 (CC1) 0.8 10.1 1.0 1.0 1.6 1.6 8.1 1.8 2.6 1.9
CAADP Compact 2010-12 (CC2) 1.8 4.8 2.3 2.6 5.3 3.4 4.5 4.1 2.9 4.3
CAADP Compact 2013-15 (CC3) 1.8 7.0 2.2 2.2 3.3 3.1 0.9 3.4 0.9 3.4
CAADP Compact not yet (CC0) 1.7 7.4 2.2 2.3 5.9 4.0 8.2 4.9 1.2 5.0
CAADP Level 0 (CL0) 1.7 7.4 2.2 2.3 5.9 4.0 8.2 4.9 1.2 5.0
CAADP Level 1 (CL1) 2.1 6.8 2.5 2.4 2.6 3.3 0.6 3.6 0.8 3.6
CAADP Level 2 (CL2) 0.3 -1.7 0.4 0.6 14.8 0.8 2.9 0.8 -1.7 0.8
CAADP Level 3 (CL3) 0.6 8.2 0.8 0.9 3.4 1.0 4.9 1.4 3.7 1.4
CAADP Level 4 (CL4) 1.3 8.1 1.7 1.9 3.1 2.9 7.3 3.5 3.9 3.7
NAIP00 (N00) 3.2 7.3 4.0 4.1 4.6 6.4 4.4 7.1 -0.8 6.9
NAIP10 (N10) 1.4 3.6 1.7 1.8 3.7 2.6 6.2 3.4 4.1 3.6
NAIP11 (N11) 1.5 9.0 1.9 2.2 4.9 3.1 5.8 3.7 4.7 4.0
Source: ReSAKSS based on UNCTAD (2020) and World Bank (2020).Note: Aggregate value for a group is sum of intra-African agricultural imports for countries in a group. The value of intra-African agricultural exports and imports for Africa as a whole is expected to be equal. However, Tables TL2.2.1A and TL2.2.1B show exports to be greater than imports, due to differences in commodities categorized as agricultural by different countries, year of shipment of exports and arrival of imports, treatment of the origin of export versus shipment, and valuation of exports and imports (for details see UNCTAD:http://unctadstat.unctad.org/EN?FAQ.html)

242 resakss.org
ANNEX 3a: Level 3—Strengthening Systemic Capacity to Deliver Results, Indicator 3.5.1
TABLE L3.5.1—GOVERNMENT AGRICULTURE EXPENDITURE (billion, constant 2010 US$)
Region
Annual avg. level
(1995–2003)
Annual avg. change (1995–2003) 2003
Annual avg. level
(2003–2008)
Annual avg. change (2003–2008)
Annual avg. level
(2008–2014)
Annual avg. change (2008–2014)
Annual avg. level
(2014-2019)
Annual avg. change (2014-2019) 2019
Africa 9.6 4.4 11.3 13.1 6.3 16.2 3.3 19.6 3.0 20.9
Central 0.4 -16.8 0.2 0.3 11.8 0.6 8.5 0.7 0.7 0.7
Eastern 1.3 2.7 1.7 2.4 11.8 2.7 -1.4 3.0 6.2 3.3
Northern 4.8 4.6 5.3 5.0 -2.8 5.9 7.0 8.8 8.4 10.3
Southern 1.5 11.4 2.1 3.0 14.6 3.8 0.5 3.7 -9.4 3.0
Western 1.7 4.2 2.0 2.5 11.0 3.3 3.3 3.4 0.2 3.5
Less favorable agriculture conditions 0.4 1.4 0.4 0.5 1.3 0.6 10.4 0.8 0.7 0.8
More favorable agriculture conditions 1.0 2.1 1.2 1.8 16.3 2.7 4.0 3.6 2.6 3.6
Mineral-rich countries 0.4 -21.5 0.1 0.1 4.2 0.2 6.3 0.3 4.8 0.3
Lower middle-income countries 5.9 3.3 6.4 6.8 4.0 7.6 1.7 8.8 4.7 9.9
Upper middle-income countries 2.0 14.5 3.2 4.0 6.9 5.2 4.4 6.2 0.9 6.2
CEN-SAD 6.2 2.3 6.5 6.7 1.6 7.2 2.8 8.7 5.9 10.0
COMESA 3.6 1.3 3.7 4.1 4.9 4.2 -0.1 5.6 7.6 6.4
EAC 0.5 4.3 0.7 0.7 5.9 1.1 0.8 1.3 10.3 1.5
ECCAS 0.6 -11.2 0.4 0.7 25.2 1.1 1.6 1.1 -3.0 1.0
ECOWAS 1.7 4.2 2.0 2.5 11.0 3.3 3.3 3.4 0.2 3.5
IGAD 1.0 3.4 1.4 2.0 13.5 2.0 -0.5 2.3 6.0 2.6
SADC 2.0 4.4 2.4 3.4 13.4 4.3 -0.7 4.3 -7.4 3.6
UMA 5.6 4.7 6.8 6.9 1.1 9.6 8.4 13.9 6.1 15.6
CAADP Compact 2007-09 (CC1) 1.4 11.8 2.0 2.8 13.9 3.6 2.6 3.9 0.9 4.0
CAADP Compact 2010-12 (CC2) 2.4 -4.4 2.1 2.4 6.8 3.1 3.1 3.9 1.9 4.1
CAADP Compact 2013-15 (CC3) 0.8 -1.8 0.9 1.5 18.6 1.5 -6.4 1.2 -0.7 1.2
CAADP Compact not yet (CC0) 5.1 7.9 6.3 6.5 1.1 8.0 5.7 10.6 4.6 11.6
CAADP Level 0 (CL0) 5.1 7.9 6.3 6.5 1.1 8.0 5.7 10.6 4.6 11.6
CAADP Level 1 (CL1) 0.7 -2.7 0.8 1.3 17.9 1.2 -10.9 0.8 -0.5 0.8
CAADP Level 2 (CL2) 1.3 -7.6 1.0 0.9 -1.5 0.8 -0.6 0.8 -0.1 0.8
CAADP Level 3 (CL3) 0.5 9.1 0.6 0.9 12.1 1.1 5.4 1.7 -1.7 1.7
CAADP Level 4 (CL4) 2.0 5.5 2.6 3.5 14.0 5.1 3.5 5.6 2.2 6.0
NAIP00 (N00) 5.5 7.1 6.6 7.1 3.0 8.8 4.2 11.2 4.4 12.2
NAIP10 (N10) 1.8 -4.0 1.8 2.1 6.3 2.0 -0.9 2.3 -2.1 2.2
NAIP11 (N11) 2.4 4.8 2.9 3.9 13.3 5.4 3.5 6.2 2.4 6.5
Source: ReSAKSS based on IFPRI (2015), World Bank (2020), and national sources.Note: Aggregate value for a group is sum of government agriculture expenditure for countries in a group.

2020 ReSAKSS Annual Trends and Outlook Report 243
ANNEX 3b: Level 3—Strengthening Systemic Capacity to Deliver Results, Indicator 3.5.2
TABLE L3.5.2— SHARE OF AGRICULTURE EXPENDITURE IN TOTAL GOVERNMENT EXPENDITURE (%)
Region
Annual avg. level
(1995–2003)
Annual avg. change (1995–2003) 2003
Annual avg. level
(2003–2008)
Annual avg. change (2003–2008)
Annual avg. level
(2008–2014)
Annual avg. change (2008–2014)
Annual avg. level
(2014-2019)
Annual avg. change (2014-2019) 2019
Africa 3.5 4.3 3.7 3.6 -2.0 3.2 -0.7 3.3 2.9 3.6
Central 2.9 11.0 2.7 3.0 -2.6 2.6 -1.2 2.9 9.1 3.3
Eastern 5.2 0.8 5.5 6.1 4.5 6.1 -4.4 5.2 1.5 5.3
Northern 5.3 -1.0 4.5 3.7 -9.9 3.1 3.3 3.9 7.1 4.5
Southern 1.6 10.1 2.2 2.5 3.6 2.2 -4.2 1.9 -7.2 1.6
Western 4.0 -4.0 3.8 4.2 5.1 4.2 1.5 4.2 -1.9 4.1
Less favorable agriculture conditions 10.6 -4.6 9.2 8.9 -2.9 6.3 3.5 7.2 -0.3 7.0
More favorable agriculture conditions 7.1 -3.7 6.9 8.7 8.9 9.7 -2.1 8.7 -5.9 7.6
Mineral-rich countries 5.3 18.3 3.8 3.0 -6.7 2.8 0.9 3.4 8.8 4.2
Lower middle-income countries 4.5 -2.3 4.0 3.5 -3.9 2.8 -2.5 3.0 5.9 3.5
Upper middle-income countries 1.9 12.5 2.8 2.9 -2.0 2.6 1.3 2.7 0.6 2.7
CEN-SAD 5.4 -3.1 4.6 3.9 -5.6 3.2 -0.1 3.4 4.5 3.9
COMESA 5.1 9.2 5.1 4.5 -4.2 3.5 -3.9 3.5 4.7 4.0
EAC 4.9 -1.8 4.1 3.7 1.0 4.3 -6.0 3.5 5.2 3.9
ECCAS 1.9 4.2 1.6 2.2 8.7 2.0 -7.9 2.0 11.6 2.4
ECOWAS 4.0 -4.0 3.8 4.2 5.1 4.2 1.5 4.2 -1.9 4.1
IGAD 5.0 1.9 5.6 6.6 6.0 6.5 -2.8 5.6 2.3 5.7
SADC 1.9 11.5 2.4 2.6 2.6 2.3 -5.4 2.0 -5.6 1.7
UMA 4.9 -2.2 4.3 3.9 -4.6 3.9 5.1 5.1 5.1 5.6
CAADP Compact 2007-09 (CC1) 3.6 0.4 4.1 5.2 7.9 4.9 0.7 5.2 -0.7 5.1
CAADP Compact 2010-12 (CC2) 6.7 6.6 5.1 4.9 1.8 4.9 -3.2 4.4 -2.9 4.1
CAADP Compact 2013-15 (CC3) 2.6 -3.3 2.8 3.4 4.2 2.3 -12.4 1.9 11.4 2.5
CAADP Compact not yet (CC0) 3.2 5.2 3.5 3.0 -7.3 2.6 2.4 3.0 3.9 3.3
CAADP Level 0 (CL0) 3.2 5.2 3.5 3.0 -7.3 2.6 2.4 3.0 3.9 3.3
CAADP Level 1 (CL1) 2.6 -3.5 2.8 3.3 2.9 1.9 -16.5 1.4 14.0 1.9
CAADP Level 2 (CL2) 11.6 13.4 5.7 4.9 -4.5 3.6 -6.9 2.7 -0.4 2.6
CAADP Level 3 (CL3) 5.8 0.3 6.1 7.4 7.7 7.3 -1.3 7.8 -6.8 6.6
CAADP Level 4 (CL4) 4.0 -2.4 4.0 4.7 7.6 5.0 0.2 4.8 -1.8 4.7
NAIP00 (N00) 3.1 4.1 3.3 2.9 -6.2 2.4 0.2 2.8 5.6 3.1
NAIP10 (N10) 5.9 10.1 5.3 5.3 -0.9 4.1 -5.3 3.5 -3.4 3.3
NAIP11 (N11) 4.4 -3.3 4.2 4.9 7.7 5.2 0.1 5.1 -1.0 5.0
Source: ReSAKSS based on IFPRI (2015), World Bank (2020), and national sources.

244 resakss.org
ANNEX 3c: Level 3—Strengthening Systemic Capacity to Deliver Results, Indicator 3.5.3
TABLE L3.5.3—GOVERNMENT AGRICULTURE EXPENDITURE AS SHARE OF AGRICULTURE GDP (%)
Region
Annual avg. level
(1995–2003)
Annual avg. change (1995–2003) 2003
Annual avg. level
(2003–2008)
Annual avg. change (2003–2008)
Annual avg. level
(2008–2014)
Annual avg. change (2008–2014)
Annual avg. level
(2014-2019)
Annual avg. change (2014-2019) 2019
Africa 5.4 -0.3 5.2 5.9 4.1 5.8 0.0 5.7 -0.2 5.8
Central 3.1 -13.2 2.2 2.9 8.7 4.0 3.9 3.9 -3.1 3.7
Eastern 3.4 1.4 4.2 5.3 7.3 4.4 -7.2 3.6 2.1 3.8
Northern 12.7 -3.2 11.2 10.2 -3.4 10.0 3.5 11.8 4.4 13.2
Southern 8.7 9.2 11.5 15.6 10.1 15.9 -1.6 13.6 -8.1 11.6
Western 2.4 -2.3 2.0 2.5 9.4 2.7 1.5 2.5 -2.8 2.4
Less favorable agriculture conditions 5.1 -3.2 5.0 5.3 -1.9 4.6 4.2 4.9 -4.0 4.5
More favorable agriculture conditions 3.9 2.9 4.6 5.7 7.8 5.8 -1.4 6.2 -1.4 5.9
Mineral-rich countries 4.8 -18.4 2.0 1.9 -0.2 2.1 3.5 2.3 -1.0 2.4
Lower middle-income countries 4.9 -1.8 4.1 4.4 2.8 4.0 -0.8 4.0 1.8 4.2
Upper middle-income countries 12.3 0.7 14.3 18.1 7.3 20.2 0.6 18.3 -1.9 17.8
CEN-SAD 5.0 -2.9 4.1 4.1 0.0 3.7 0.3 3.7 2.5 4.1
COMESA 5.7 -0.4 5.5 5.9 1.7 4.7 -3.9 4.9 3.5 5.3
EAC 3.0 5.0 3.6 3.6 2.5 3.7 -5.9 3.0 3.8 3.3
ECCAS 3.5 -8.9 2.6 4.7 21.2 5.4 -4.2 3.8 -4.8 3.6
ECOWAS 2.4 -2.3 2.0 2.5 9.4 2.7 1.5 2.5 -2.8 2.4
IGAD 3.4 1.3 4.4 5.7 8.7 4.3 -6.6 3.5 1.7 3.6
SADC 6.6 6.0 8.1 10.6 9.0 10.7 -3.7 8.7 -8.1 7.4
UMA 16.5 -7.1 13.6 13.7 2.3 15.0 2.2 16.0 2.3 17.0
CAADP Compact 2007-09 (CC1) 2.0 4.9 2.1 2.8 11.0 2.8 0.2 2.7 -2.3 2.5
CAADP Compact 2010-12 (CC2) 6.2 -3.6 5.7 6.0 3.8 5.8 -1.7 5.5 -3.2 5.3
CAADP Compact 2013-15 (CC3) 3.3 -5.3 3.5 5.5 17.1 5.0 -11.2 3.0 0.0 3.1
CAADP Compact not yet (CC0) 10.9 1.2 11.2 11.3 0.0 11.6 3.2 12.8 1.3 13.3
CAADP Level 0 (CL0) 10.9 1.2 11.2 11.3 0.0 11.6 3.2 12.8 1.3 13.3
CAADP Level 1 (CL1) 3.6 -6.3 3.6 5.6 16.1 4.3 -15.5 2.1 1.0 2.3
CAADP Level 2 (CL2) 11.2 -3.5 10.1 9.5 -3.4 6.8 -3.8 5.3 -5.8 4.7
CAADP Level 3 (CL3) 3.7 5.6 4.6 5.5 7.0 5.3 1.6 7.2 -4.9 6.4
CAADP Level 4 (CL4) 2.4 0.3 2.3 3.0 11.3 3.4 0.4 3.1 -1.5 3.1
NAIP00 (N00) 10.1 1.0 10.3 10.7 1.4 10.8 1.1 11.2 1.8 11.9
NAIP10 (N10) 5.4 -4.1 5.5 6.3 4.0 5.0 -5.0 4.5 -3.3 4.2
NAIP11 (N11) 2.6 -0.6 2.4 3.1 10.7 3.4 0.5 3.2 -1.6 3.1
Source: ReSAKSS based on IFPRI (2015), World Bank (2020), and national sources.
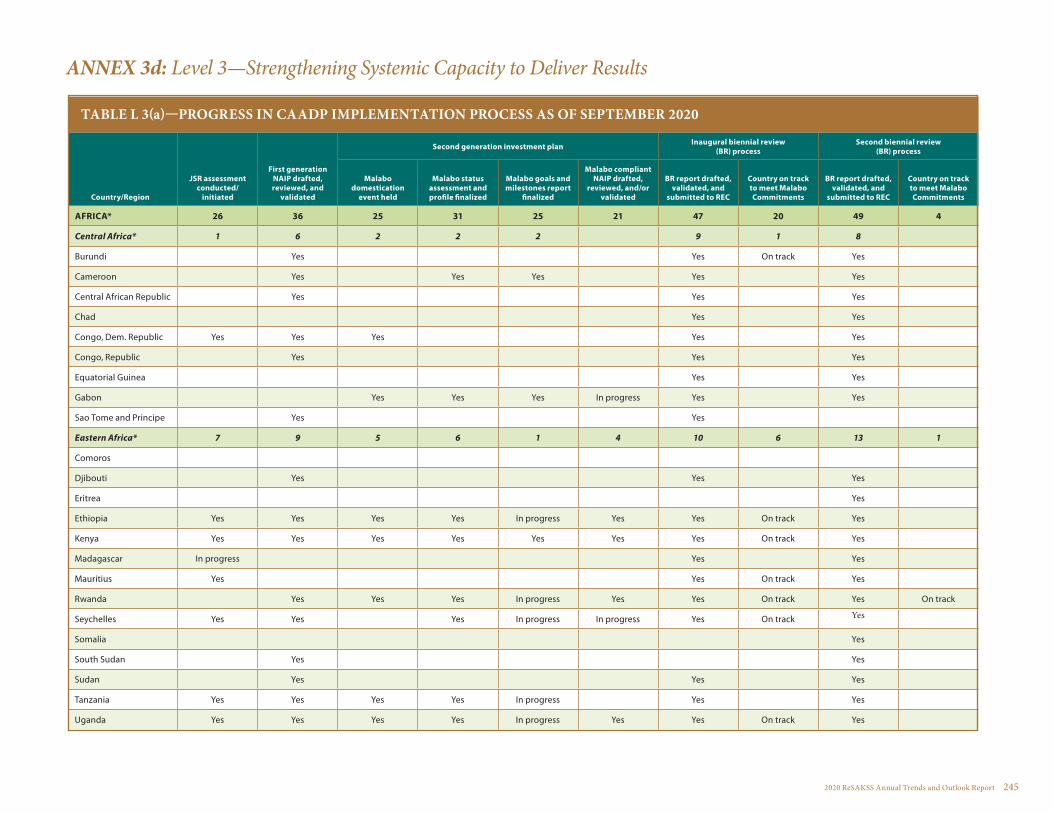
2020 ReSAKSS Annual Trends and Outlook Report 245
TABLE L 3(a)—PROGRESS IN CAADP IMPLEMENTATION PROCESS AS OF SEPTEMBER 2020
Country/Region
JSR assessment conducted/
initiated
First generation NAIP drafted, reviewed, and
validated
Second generation investment plan Inaugural biennial review (BR) process
Second biennial review (BR) process
Malabo domestication
event held
Malabo status assessment and profile finalized
Malabo goals and milestones report
finalized
Malabo compliant NAIP drafted,
reviewed, and/or validated
BR report drafted, validated, and
submitted to REC
Country on track to meet Malabo Commitments
BR report drafted, validated, and
submitted to REC
Country on track to meet Malabo Commitments
AFRICA* 26 36 25 31 25 21 47 20 49 4
Central Africa* 1 6 2 2 2 9 1 8
Burundi Yes Yes On track Yes
Cameroon Yes Yes Yes Yes Yes
Central African Republic Yes Yes Yes
Chad Yes Yes
Congo, Dem. Republic Yes Yes Yes Yes Yes
Congo, Republic Yes Yes Yes
Equatorial Guinea Yes Yes
Gabon Yes Yes Yes In progress Yes Yes
Sao Tome and Principe Yes Yes
Eastern Africa* 7 9 5 6 1 4 10 6 13 1
Comoros
Djibouti Yes Yes Yes
Eritrea Yes
Ethiopia Yes Yes Yes Yes In progress Yes Yes On track Yes
Kenya Yes Yes Yes Yes Yes Yes Yes On track Yes
Madagascar In progress Yes Yes
Mauritius Yes Yes On track Yes
Rwanda Yes Yes Yes In progress Yes Yes On track Yes On track
Seychelles Yes Yes Yes In progress In progress Yes On track Yes
Somalia Yes
South Sudan Yes Yes
Sudan Yes Yes Yes
Tanzania Yes Yes Yes Yes In progress Yes Yes
Uganda Yes Yes Yes Yes In progress Yes Yes On track Yes
ANNEX 3d: Level 3—Strengthening Systemic Capacity to Deliver Results

246 resakss.org
ANNEX 3d: Level 3—Strengthening Systemic Capacity to Deliver Results, continued
TABLE L 3(a)—PROGRESS IN CAADP IMPLEMENTATION PROCESS AS OF SEPTEMBER 2020 continued
Country/Region
JSR assessment conducted/
initiated
First generation NAIP drafted, reviewed, and
validated
Second generation investment plan Inaugural biennial review (BR) process
Second biennial review (BR) process
Malabo domestication
event held
Malabo status assessment and profile finalized
Malabo goals and milestones report
finalized
Malabo compliant NAIP drafted,
reviewed, and/or validated
BR report drafted, validated, and
submitted to REC
Country on track to meet Malabo Commitments
BR report drafted, validated, and
submitted to REC
Country on track to meet Malabo Commitments
Northern Africa* 1 4 2 3 1
Algeria
Egypt Yes
Libya
Mauritania Yes Yes On track Yes
Morocco Yes On track Yes On track
Tunisia Yes Yes
Saharawi Arab Dem. Republic
Southern Africa* 8 5 9 8 7 2 10 6 10
Angola Yes Yes Yes Yes In progress Yes Yes
Botswana Yes Yes Yes Yes Yes On track Yes
Eswatini Yes Yes Yes Yes Yes In progress Yes On track Yes
Lesotho In progress Yes Yes Yes In progress Yes Yes
Malawi Yes Yes Yes Yes Yes Yes On track Yes
Mozambique Yes Yes Yes In progress In progress Yes On track Yes
Namibia In progress Yes Yes Yes In progress Yes On track Yes
South Africa Yes On track Yes
Zambia Yes Yes Yes Yes Yes In progress Yes Yes
Zimbabwe Yes Yes Yes Yes Yes In progress Yes Yes
Western Africa* 10 15 9 15 15 15 14 5 15 2
Benin Yes Yes Yes Yes Yes Yes Yes On track Yes
Burkina Faso Yes Yes Yes Yes Yes Yes Yes On track Yes
Cabo Verde In progress Yes Yes Yes Yes Yes On track Yes
Côte d'Ivoire Yes Yes Yes Yes Yes Yes Yes Yes
Gambia Yes Yes Yes Yes Yes Yes
Ghana Yes Yes Yes Yes Yes Yes Yes Yes On track
Guinea In progress Yes Yes Yes Yes Yes Yes
Guinea Bissau Yes Yes Yes Yes Yes
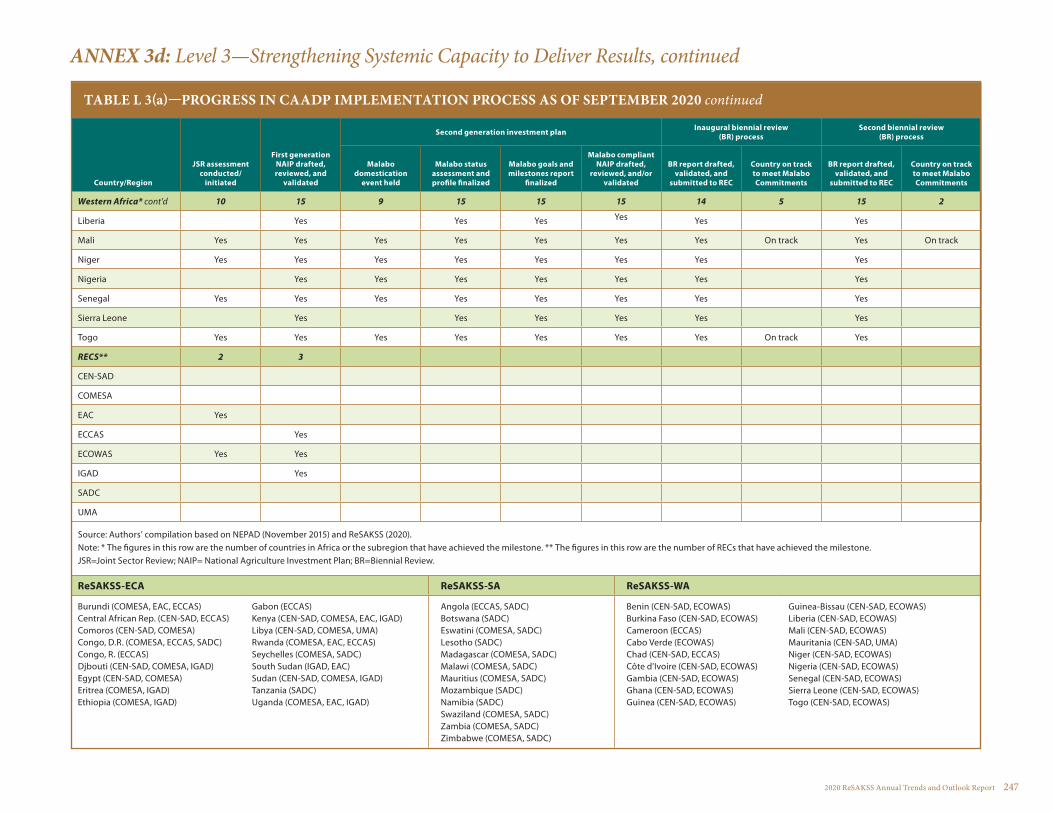
2020 ReSAKSS Annual Trends and Outlook Report 247
TABLE L 3(a)—PROGRESS IN CAADP IMPLEMENTATION PROCESS AS OF SEPTEMBER 2020 continued
Country/Region
JSR assessment conducted/
initiated
First generation NAIP drafted, reviewed, and
validated
Second generation investment plan Inaugural biennial review (BR) process
Second biennial review (BR) process
Malabo domestication
event held
Malabo status assessment and profile finalized
Malabo goals and milestones report
finalized
Malabo compliant NAIP drafted,
reviewed, and/or validated
BR report drafted, validated, and
submitted to REC
Country on track to meet Malabo Commitments
BR report drafted, validated, and
submitted to REC
Country on track to meet Malabo Commitments
Western Africa* cont'd 10 15 9 15 15 15 14 5 15 2
Liberia Yes Yes Yes Yes Yes Yes
Mali Yes Yes Yes Yes Yes Yes Yes On track Yes On track
Niger Yes Yes Yes Yes Yes Yes Yes Yes
Nigeria Yes Yes Yes Yes Yes Yes Yes
Senegal Yes Yes Yes Yes Yes Yes Yes Yes
Sierra Leone Yes Yes Yes Yes Yes Yes
Togo Yes Yes Yes Yes Yes Yes Yes On track Yes
RECS** 2 3
CEN-SAD
COMESA
EAC Yes
ECCAS Yes
ECOWAS Yes Yes
IGAD Yes
SADC
UMA
Source: Authors’ compilation based on NEPAD (November 2015) and ReSAKSS (2020). Note: * The figures in this row are the number of countries in Africa or the subregion that have achieved the milestone. ** The figures in this row are the number of RECs that have achieved the milestone. JSR=Joint Sector Review; NAIP= National Agriculture Investment Plan; BR=Biennial Review.
ReSAKSS-ECA ReSAKSS-SA ReSAKSS-WA
Burundi (COMESA, EAC, ECCAS)Central African Rep. (CEN-SAD, ECCAS)Comoros (CEN-SAD, COMESA)Congo, D.R. (COMESA, ECCAS, SADC)Congo, R. (ECCAS)Djbouti (CEN-SAD, COMESA, IGAD)Egypt (CEN-SAD, COMESA)Eritrea (COMESA, IGAD)Ethiopia (COMESA, IGAD)
Gabon (ECCAS)Kenya (CEN-SAD, COMESA, EAC, IGAD)Libya (CEN-SAD, COMESA, UMA)Rwanda (COMESA, EAC, ECCAS)Seychelles (COMESA, SADC)South Sudan (IGAD, EAC)Sudan (CEN-SAD, COMESA, IGAD)Tanzania (SADC)Uganda (COMESA, EAC, IGAD)
Angola (ECCAS, SADC)Botswana (SADC)Eswatini (COMESA, SADC)Lesotho (SADC)Madagascar (COMESA, SADC)Malawi (COMESA, SADC)Mauritius (COMESA, SADC)Mozambique (SADC)Namibia (SADC)Swaziland (COMESA, SADC)Zambia (COMESA, SADC)Zimbabwe (COMESA, SADC)
Benin (CEN-SAD, ECOWAS)Burkina Faso (CEN-SAD, ECOWAS)Cameroon (ECCAS)Cabo Verde (ECOWAS)Chad (CEN-SAD, ECCAS)Côte d'Ivoire (CEN-SAD, ECOWAS)Gambia (CEN-SAD, ECOWAS)Ghana (CEN-SAD, ECOWAS)Guinea (CEN-SAD, ECOWAS)
Guinea-Bissau (CEN-SAD, ECOWAS)Liberia (CEN-SAD, ECOWAS)Mali (CEN-SAD, ECOWAS)Mauritania (CEN-SAD, UMA)Niger (CEN-SAD, ECOWAS)Nigeria (CEN-SAD, ECOWAS)Senegal (CEN-SAD, ECOWAS)Sierra Leone (CEN-SAD, ECOWAS)Togo (CEN-SAD, ECOWAS)
ANNEX 3d: Level 3—Strengthening Systemic Capacity to Deliver Results, continued

248 resakss.org
ANNEX 3d: Level 3—Strengthening Systemic Capacity to Deliver Results
TABLE L 3(b)—PROGRESS IN STRENGTHENING SYSTEMIC CAPACITY continued
Country/region
L2.4.2-Existence of food reserves, local purchases for relief
programs, early warning systems
and school feeding programs**
L3.1.1-Existence of a new NAIP/NAFSIP
developed through an inclusive
and participatory process
L3.2.1-Existence of inclusive
institutionalized mechanisms for mutual accountability and peer
review
L3.3.1-Existence of and quality in the
implementation of evidence-informed
policies and corresponding human
resources
L3.4.1-Existence of a functional
multisectoral and multistakeholder
coordination body
L3.4.2-Cumulative number of
agriculture-related public-private
partnerships (PPPs) that are successfully
undertaken
L3.4.3-Cumulative value of
investments in the PPPs
L3.4.6-Existence of an operational
country SAKSS
AFRICA* 42 21 28 36 31 21 21 14
Central Africa* 4 2 3 1 2 2 1
Burundi Yes Yes Yes Yes Several PPPs € 18 million
Cameroon
Central African Republic Yes
Chad
Congo, Dem. Rep. Yes Yes Yes Several PPPs Not stated Yes
Congo, Rep. Yes Yes
Equatorial Guinea
Gabon In progress
Sao Tome and Principe
Eastern Africa* 4 4 12 8 8 8 4 4
Comoros Yes
Djibouti Yes Several PPPs Not stated
Eritrea
Ethiopia Yes Yes Yes Yes Several PPPs Over US$ 10 million Yes
Kenya Yes Yes Yes Yes Several PPPs Over US$ 200 million Yes Yes
Madagascar Yes Yes Four Not stated
Mauritius Yes Yes One Not stated
Rwanda Yes Yes Yes Yes Several PPPs Over US$ 20 million Yes Yes
Seychelles In progress Yes Yes
Somalia
South Sudan Yes
Sudan Yes

2020 ReSAKSS Annual Trends and Outlook Report 249
ANNEX 3d: Level 3—Strengthening Systemic Capacity to Deliver Results, continued
TABLE L 3(b)—PROGRESS IN STRENGTHENING SYSTEMIC CAPACITY continued
Country/region
L2.4.2-Existence of food reserves, local purchases for relief
programs, early warning systems
and school feeding programs**
L3.1.1-Existence of a new NAIP/NAFSIP
developed through an inclusive
and participatory process
L3.2.1-Existence of inclusive
institutionalized mechanisms for mutual accountability and peer
review
L3.3.1-Existence of and quality in the
implementation of evidence-informed
policies and corresponding human
resources
L3.4.1-Existence of a functional
multisectoral and multistakeholder
coordination body
L3.4.2-Cumulative number of
agriculture-related public-private
partnerships (PPPs) that are successfully
undertaken
L3.4.3-Cumulative value of
investments in the PPPs
L3.4.6-Existence of an operational
country SAKSS
Eastern Africa* cont'd 14 4 6 12 7 8 8 4
Tanzania Yes Yes
Several PPPs across the country and many of them in
SAGCOT with several projects
US$ 3.2 billion by 2030 Yes
Uganda Yes Yes Yes Yes Several PPPs Over US$ 218 million Yes Yes
Northern Africa* 2 2 1 1 1
Algeria
Egypt Yes Yes Yes Several PPPs Over US$ 30 million
Libya Yes Yes
Mauritania
Morocco
Tunisia
Saharawi Arab Dem. Republic
Southern Africa* 10 2 10 10 9 7 7 2
Angola Yes In progress Yes Yes Yes Five Not stated
Botswana Yes Yes Yes Yes Yes Three Not stated
Eswatini Yes In progress Yes Yes Yes Four Not stated
Lesotho Yes In progress Yes Yes Four Not stated
Malawi Yes Yes Yes Yes Yes Four Not stated
Mozambique Yes In progress Yes Yes Yes Four Not stated Yes
Namibia Yes In progress Yes Yes Yes One Not stated
South Africa Yes Yes Yes Yes
Zambia Yes In progress Yes Yes Yes
Zimbabwe Yes In progress Yes Yes Yes Yes

250 resakss.org
TABLE L 3(b)—PROGRESS IN STRENGTHENING SYSTEMIC CAPACITY continued
Country/region
L2.4.2-Existence of food reserves, local purchases for relief
programs, early warning systems
and school feeding programs**
L3.1.1-Existence of a new NAIP/NAFSIP
developed through an inclusive
and participatory process
L3.2.1-Existence of inclusive
institutionalized mechanisms for mutual accountability and peer
review
L3.3.1-Existence of and quality in the
implementation of evidence-informed
policies and corresponding human
resources
L3.4.1-Existence of a functional
multisectoral and multistakeholder
coordination body
L3.4.2-Cumulative number of
agriculture-related public-private
partnerships (PPPs) that are successfully
undertaken
L3.4.3-Cumulative value of
investments in the PPPs
L3.4.6-Existence of an operational
country SAKSS
Western Africa* 12 15 10 9 12 3 3 7
Benin Yes Yes Yes Yes Yes
Burkina Faso Yes Yes Yes Yes Yes
Cabo Verde Yes
Côte d'Ivoire Yes Yes Yes two Not stated
Gambia Yes Yes Yes Yes Yes
Ghana Yes Yes Yes Yes Yes Yes
Guinea Yes Yes Yes Yes
Guinea-Bissau Yes
Liberia Yes Yes Yes
Mali Yes Yes Yes Yes Yes Three More than 50 billion FCFA Yes
Niger Yes Yes Yes Yes Yes Yes
Nigeria Yes Yes Yes Yes
Senegal Yes Yes Yes Yes Yes Yes
Sierra Leone Yes Yes Yes Yes
Togo Yes Yes Yes Yes Yes Four Not stated Yes
Note: * The figures in this row are the number of countries in Africa or the sub region corresponding to each indicator. ** This indicator is from level 2 of the CAADP Results FrameworkSAKSS = Strategic Analysis and Knowledge Support SystemNAIP = National Agricultural Investment PlanNAFSIP = National Agriculture and Food Security Investment Plans
ANNEX 3d: Level 3—Strengthening Systemic Capacity to Deliver Results, continued
continued
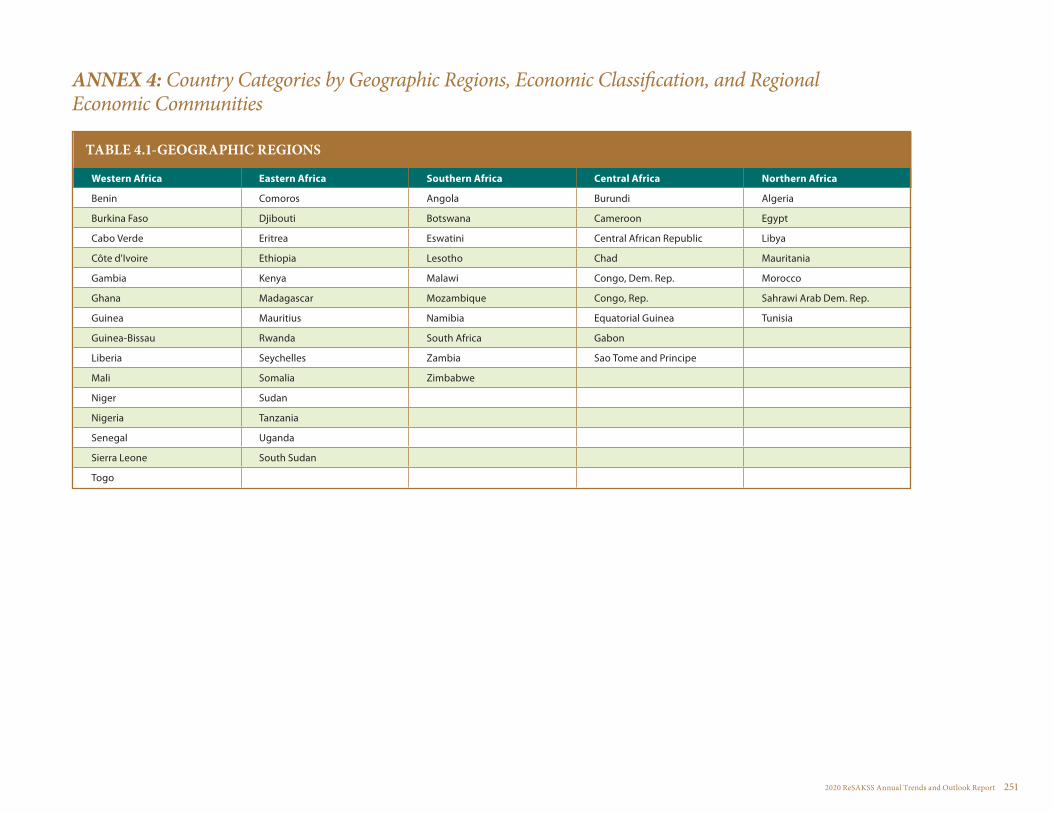
2020 ReSAKSS Annual Trends and Outlook Report 251
ANNEX 4: Country Categories by Geographic Regions, Economic Classification, and Regional Economic Communities
TABLE 4.1-GEOGRAPHIC REGIONS
Western Africa Eastern Africa Southern Africa Central Africa Northern Africa
Benin Comoros Angola Burundi Algeria
Burkina Faso Djibouti Botswana Cameroon Egypt
Cabo Verde Eritrea Eswatini Central African Republic Libya
Côte d'Ivoire Ethiopia Lesotho Chad Mauritania
Gambia Kenya Malawi Congo, Dem. Rep. Morocco
Ghana Madagascar Mozambique Congo, Rep. Sahrawi Arab Dem. Rep.
Guinea Mauritius Namibia Equatorial Guinea Tunisia
Guinea-Bissau Rwanda South Africa Gabon
Liberia Seychelles Zambia Sao Tome and Principe
Mali Somalia Zimbabwe
Niger Sudan
Nigeria Tanzania
Senegal Uganda
Sierra Leone South Sudan
Togo
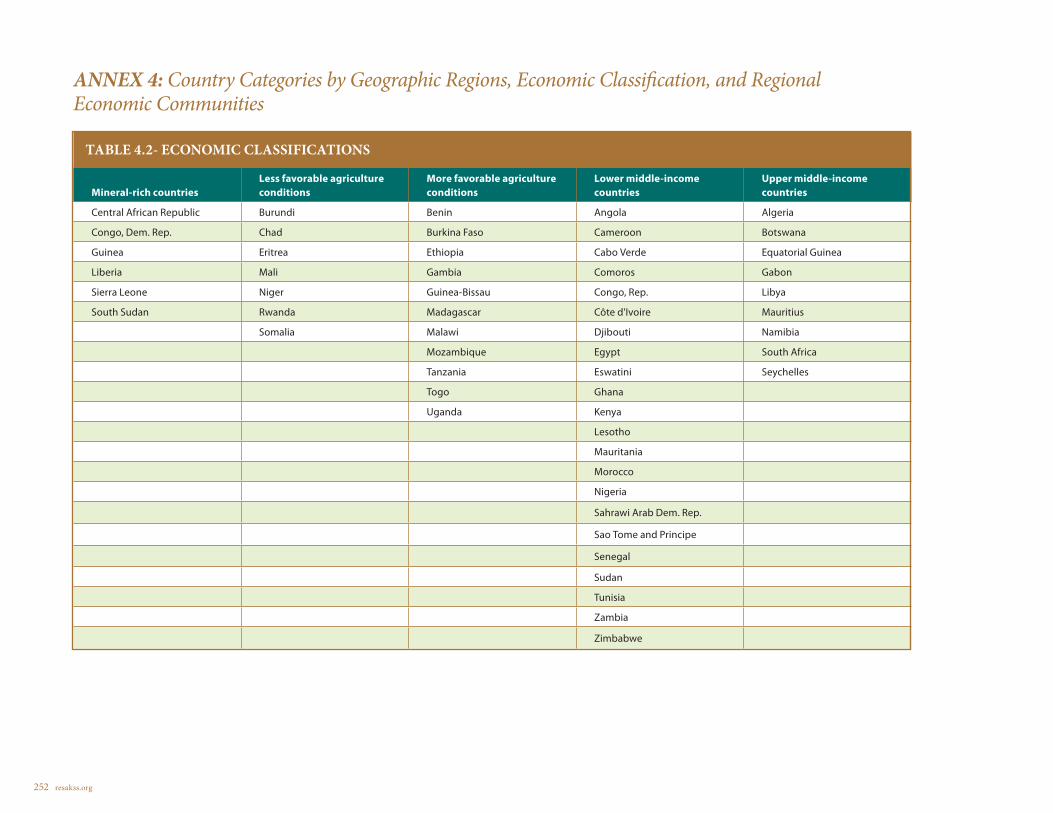
252 resakss.org
ANNEX 4: Country Categories by Geographic Regions, Economic Classification, and Regional Economic Communities
TABLE 4.2- ECONOMIC CLASSIFICATIONS
Mineral-rich countries Less favorable agriculture conditions
More favorable agriculture conditions
Lower middle-income countries
Upper middle-income countries
Central African Republic Burundi Benin Angola Algeria
Congo, Dem. Rep. Chad Burkina Faso Cameroon Botswana
Guinea Eritrea Ethiopia Cabo Verde Equatorial Guinea
Liberia Mali Gambia Comoros Gabon
Sierra Leone Niger Guinea-Bissau Congo, Rep. Libya
South Sudan Rwanda Madagascar Côte d'Ivoire Mauritius
Somalia Malawi Djibouti Namibia
Mozambique Egypt South Africa
Tanzania Eswatini Seychelles
Togo Ghana
Uganda Kenya
Lesotho
Mauritania
Morocco
Nigeria
Sahrawi Arab Dem. Rep.
Sao Tome and Principe
Senegal Sudan
Tunisia
Zambia
Zimbabwe
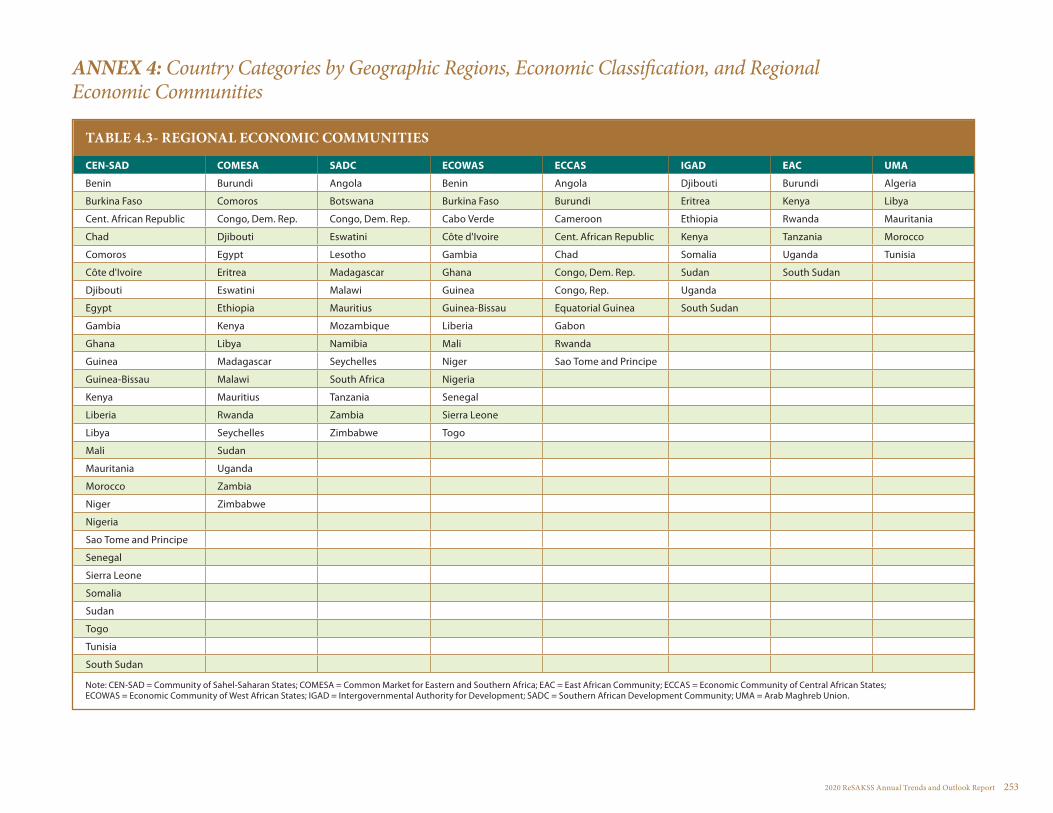
2020 ReSAKSS Annual Trends and Outlook Report 253
ANNEX 4: Country Categories by Geographic Regions, Economic Classification, and Regional Economic Communities
TABLE 4.3- REGIONAL ECONOMIC COMMUNITIES
CEN-SAD COMESA SADC ECOWAS ECCAS IGAD EAC UMA
Benin Burundi Angola Benin Angola Djibouti Burundi Algeria
Burkina Faso Comoros Botswana Burkina Faso Burundi Eritrea Kenya Libya
Cent. African Republic Congo, Dem. Rep. Congo, Dem. Rep. Cabo Verde Cameroon Ethiopia Rwanda Mauritania
Chad Djibouti Eswatini Côte d'Ivoire Cent. African Republic Kenya Tanzania Morocco
Comoros Egypt Lesotho Gambia Chad Somalia Uganda Tunisia
Côte d'Ivoire Eritrea Madagascar Ghana Congo, Dem. Rep. Sudan South Sudan
Djibouti Eswatini Malawi Guinea Congo, Rep. Uganda
Egypt Ethiopia Mauritius Guinea-Bissau Equatorial Guinea South Sudan
Gambia Kenya Mozambique Liberia Gabon
Ghana Libya Namibia Mali Rwanda
Guinea Madagascar Seychelles Niger Sao Tome and Principe
Guinea-Bissau Malawi South Africa Nigeria
Kenya Mauritius Tanzania Senegal
Liberia Rwanda Zambia Sierra Leone
Libya Seychelles Zimbabwe Togo
Mali Sudan
Mauritania Uganda
Morocco Zambia
Niger Zimbabwe
Nigeria
Sao Tome and Principe
Senegal
Sierra Leone
Somalia
Sudan
Togo
Tunisia
South Sudan
Note: CEN-SAD = Community of Sahel-Saharan States; COMESA = Common Market for Eastern and Southern Africa; EAC = East African Community; ECCAS = Economic Community of Central African States; ECOWAS = Economic Community of West African States; IGAD = Intergovernmental Authority for Development; SADC = Southern African Development Community; UMA = Arab Maghreb Union.
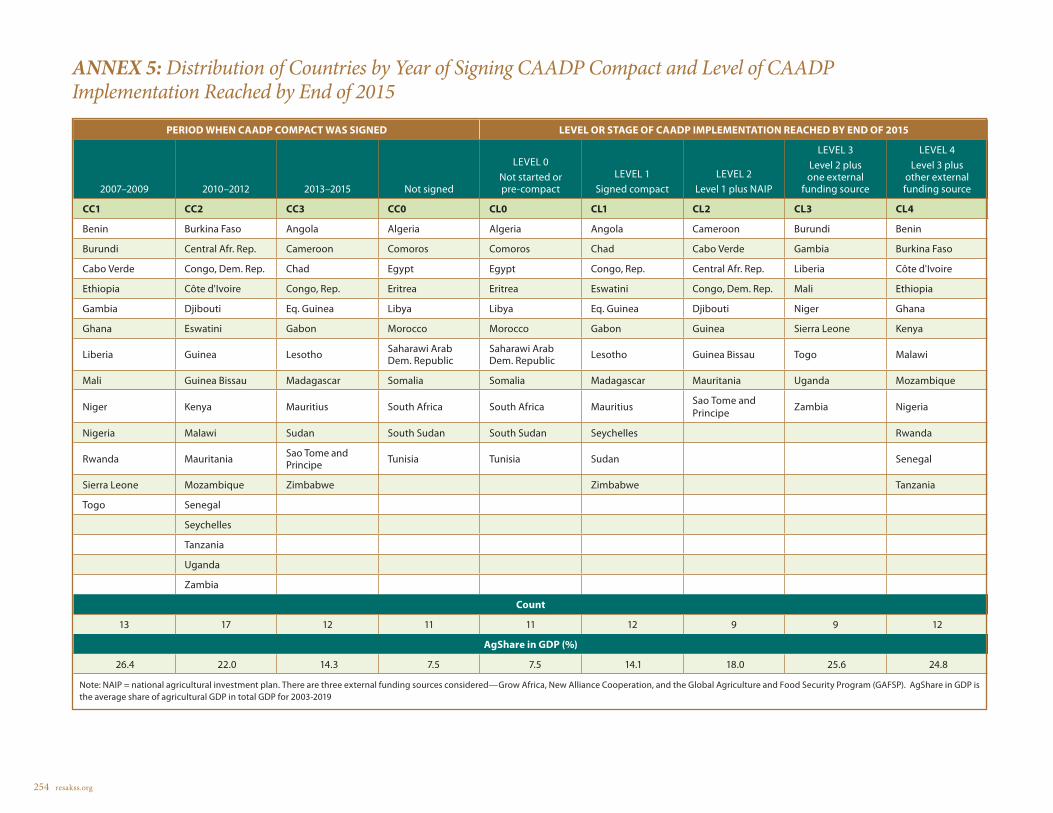
254 resakss.org
PERIOD WHEN CAADP COMPACT WAS SIGNED LEVEL OR STAGE OF CAADP IMPLEMENTATION REACHED BY END OF 2015
2007–2009 2010–2012 2013–2015 Not signed
LEVEL 0 Not started or pre-compact
LEVEL 1Signed compact
LEVEL 2Level 1 plus NAIP
LEVEL 3Level 2 plus one external
funding source
LEVEL 4Level 3 plus
other external funding source
CC1 CC2 CC3 CC0 CL0 CL1 CL2 CL3 CL4
Benin Burkina Faso Angola Algeria Algeria Angola Cameroon Burundi Benin
Burundi Central Afr. Rep. Cameroon Comoros Comoros Chad Cabo Verde Gambia Burkina Faso
Cabo Verde Congo, Dem. Rep. Chad Egypt Egypt Congo, Rep. Central Afr. Rep. Liberia Côte d'Ivoire
Ethiopia Côte d'Ivoire Congo, Rep. Eritrea Eritrea Eswatini Congo, Dem. Rep. Mali Ethiopia
Gambia Djibouti Eq. Guinea Libya Libya Eq. Guinea Djibouti Niger Ghana
Ghana Eswatini Gabon Morocco Morocco Gabon Guinea Sierra Leone Kenya
Liberia Guinea Lesotho Saharawi Arab Dem. Republic
Saharawi Arab Dem. Republic Lesotho Guinea Bissau Togo Malawi
Mali Guinea Bissau Madagascar Somalia Somalia Madagascar Mauritania Uganda Mozambique
Niger Kenya Mauritius South Africa South Africa Mauritius Sao Tome and Principe Zambia Nigeria
Nigeria Malawi Sudan South Sudan South Sudan Seychelles Rwanda
Rwanda Mauritania Sao Tome and Principe Tunisia Tunisia Sudan Senegal
Sierra Leone Mozambique Zimbabwe Zimbabwe Tanzania
Togo Senegal
Seychelles
Tanzania
Uganda
Zambia
Count
13 17 12 11 11 12 9 9 12
AgShare in GDP (%)
26.4 22.0 14.3 7.5 7.5 14.1 18.0 25.6 24.8
Note: NAIP = national agricultural investment plan. There are three external funding sources considered—Grow Africa, New Alliance Cooperation, and the Global Agriculture and Food Security Program (GAFSP). AgShare in GDP is the average share of agricultural GDP in total GDP for 2003-2019
ANNEX 5: Distribution of Countries by Year of Signing CAADP Compact and Level of CAADP Implementation Reached by End of 2015
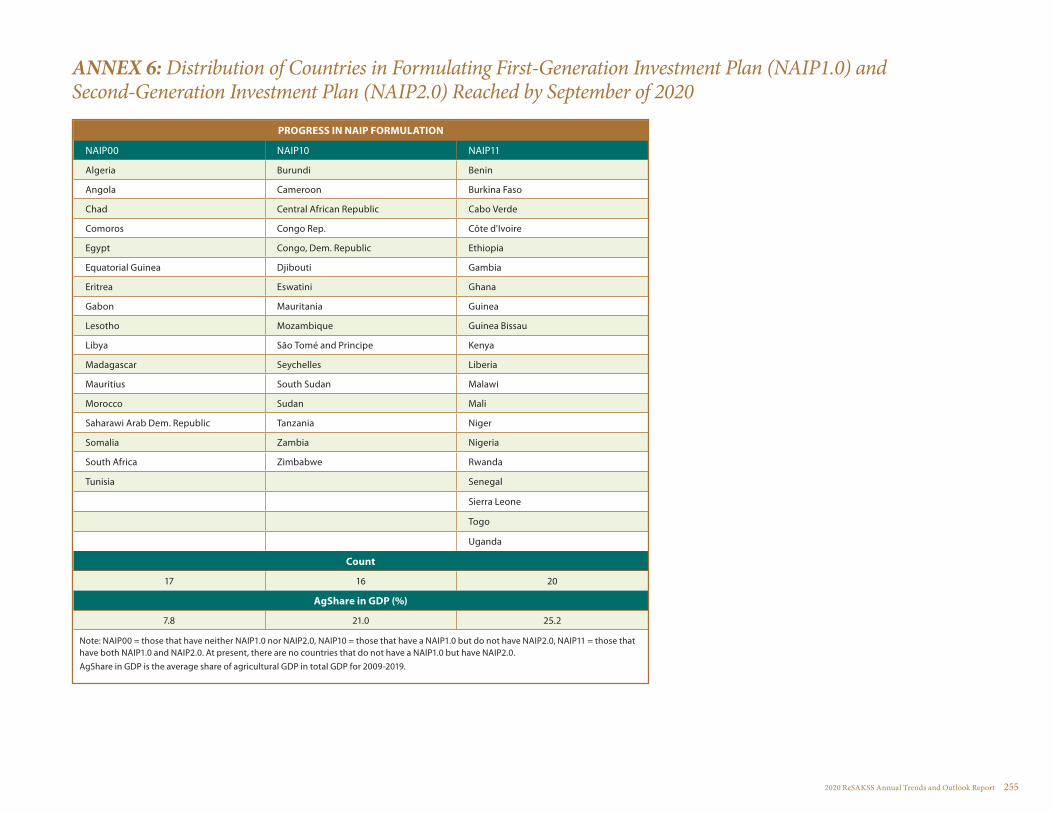
2020 ReSAKSS Annual Trends and Outlook Report 255
ANNEX 6: Distribution of Countries in Formulating First-Generation Investment Plan (NAIP1.0) and Second-Generation Investment Plan (NAIP2.0) Reached by September of 2020
PROGRESS IN NAIP FORMULATION
NAIP00 NAIP10 NAIP11
Algeria Burundi Benin
Angola Cameroon Burkina Faso
Chad Central African Republic Cabo Verde
Comoros Congo Rep. Côte d'Ivoire
Egypt Congo, Dem. Republic Ethiopia
Equatorial Guinea Djibouti Gambia
Eritrea Eswatini Ghana
Gabon Mauritania Guinea
Lesotho Mozambique Guinea Bissau
Libya São Tomé and Principe Kenya
Madagascar Seychelles Liberia
Mauritius South Sudan Malawi
Morocco Sudan Mali
Saharawi Arab Dem. Republic Tanzania Niger
Somalia Zambia Nigeria
South Africa Zimbabwe Rwanda
Tunisia Senegal
Sierra Leone
Togo
Uganda
Count
17 16 20
AgShare in GDP (%)
7.8 21.0 25.2
Note: NAIP00 = those that have neither NAIP1.0 nor NAIP2.0, NAIP10 = those that have a NAIP1.0 but do not have NAIP2.0, NAIP11 = those that have both NAIP1.0 and NAIP2.0. At present, there are no countries that do not have a NAIP1.0 but have NAIP2.0.AgShare in GDP is the average share of agricultural GDP in total GDP for 2009-2019.
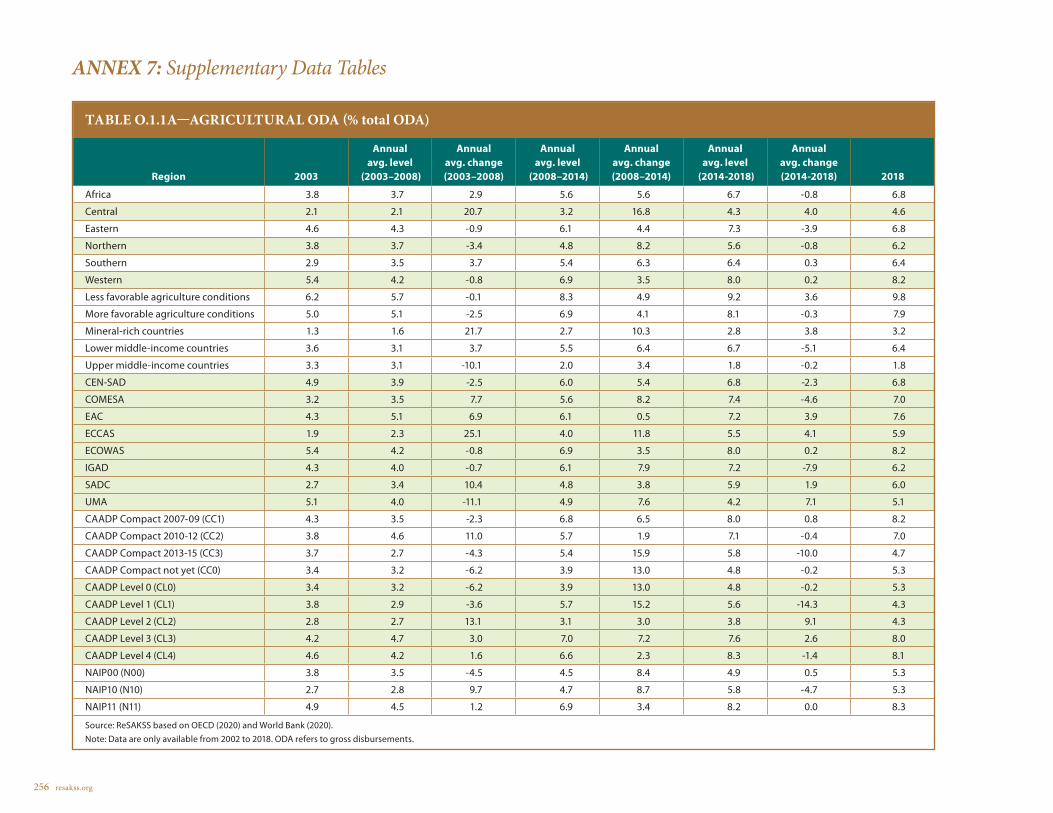
256 resakss.org
ANNEX 7: Supplementary Data Tables
TABLE O.1.1A—AGRICULTURAL ODA (% total ODA)
Region 2003
Annual avg. level
(2003–2008)
Annual avg. change (2003–2008)
Annual avg. level
(2008–2014)
Annual avg. change (2008–2014)
Annual avg. level
(2014-2018)
Annual avg. change (2014-2018) 2018
Africa 3.8 3.7 2.9 5.6 5.6 6.7 -0.8 6.8
Central 2.1 2.1 20.7 3.2 16.8 4.3 4.0 4.6
Eastern 4.6 4.3 -0.9 6.1 4.4 7.3 -3.9 6.8
Northern 3.8 3.7 -3.4 4.8 8.2 5.6 -0.8 6.2
Southern 2.9 3.5 3.7 5.4 6.3 6.4 0.3 6.4
Western 5.4 4.2 -0.8 6.9 3.5 8.0 0.2 8.2
Less favorable agriculture conditions 6.2 5.7 -0.1 8.3 4.9 9.2 3.6 9.8
More favorable agriculture conditions 5.0 5.1 -2.5 6.9 4.1 8.1 -0.3 7.9
Mineral-rich countries 1.3 1.6 21.7 2.7 10.3 2.8 3.8 3.2
Lower middle-income countries 3.6 3.1 3.7 5.5 6.4 6.7 -5.1 6.4
Upper middle-income countries 3.3 3.1 -10.1 2.0 3.4 1.8 -0.2 1.8
CEN-SAD 4.9 3.9 -2.5 6.0 5.4 6.8 -2.3 6.8
COMESA 3.2 3.5 7.7 5.6 8.2 7.4 -4.6 7.0
EAC 4.3 5.1 6.9 6.1 0.5 7.2 3.9 7.6
ECCAS 1.9 2.3 25.1 4.0 11.8 5.5 4.1 5.9
ECOWAS 5.4 4.2 -0.8 6.9 3.5 8.0 0.2 8.2
IGAD 4.3 4.0 -0.7 6.1 7.9 7.2 -7.9 6.2
SADC 2.7 3.4 10.4 4.8 3.8 5.9 1.9 6.0
UMA 5.1 4.0 -11.1 4.9 7.6 4.2 7.1 5.1
CAADP Compact 2007-09 (CC1) 4.3 3.5 -2.3 6.8 6.5 8.0 0.8 8.2
CAADP Compact 2010-12 (CC2) 3.8 4.6 11.0 5.7 1.9 7.1 -0.4 7.0
CAADP Compact 2013-15 (CC3) 3.7 2.7 -4.3 5.4 15.9 5.8 -10.0 4.7
CAADP Compact not yet (CC0) 3.4 3.2 -6.2 3.9 13.0 4.8 -0.2 5.3
CAADP Level 0 (CL0) 3.4 3.2 -6.2 3.9 13.0 4.8 -0.2 5.3
CAADP Level 1 (CL1) 3.8 2.9 -3.6 5.7 15.2 5.6 -14.3 4.3
CAADP Level 2 (CL2) 2.8 2.7 13.1 3.1 3.0 3.8 9.1 4.3
CAADP Level 3 (CL3) 4.2 4.7 3.0 7.0 7.2 7.6 2.6 8.0
CAADP Level 4 (CL4) 4.6 4.2 1.6 6.6 2.3 8.3 -1.4 8.1
NAIP00 (N00) 3.8 3.5 -4.5 4.5 8.4 4.9 0.5 5.3
NAIP10 (N10) 2.7 2.8 9.7 4.7 8.7 5.8 -4.7 5.3
NAIP11 (N11) 4.9 4.5 1.2 6.9 3.4 8.2 0.0 8.3
Source: ReSAKSS based on OECD (2020) and World Bank (2020).Note: Data are only available from 2002 to 2018. ODA refers to gross disbursements.

2020 ReSAKSS Annual Trends and Outlook Report 257
ANNEX 7: Supplementary Data Tables
TABLE O.1.1B—AGRICULTURAL ODA DISBURSEMENTS (as % of agricultural ODA commitments)
Region 2003
Annual avg. level
(2003–2008)
Annual avg. change (2003–2008)
Annual avg. level
(2008–2014)
Annual avg. change (2008–2014)
Annual avg. level
(2014-2018)
Annual avg. change (2014-2018) 2018
Africa 81.0 77.3 -5.2 73.4 3.0 71.8 -6.3 66.3
Central 72.4 79.4 12.6 69.6 1.6 71.6 -0.8 68.7
Eastern 71.9 81.1 -1.6 78.3 3.0 65.0 -10.9 57.6
Northern 115.7 70.2 -19.5 69.2 21.1 131.9 26.4 209.9
Southern 85.1 89.2 -1.7 83.2 0.2 88.6 -15.0 59.7
Western 86.7 77.2 -7.7 73.2 -1.7 70.6 -3.4 68.0
Less favorable agriculture conditions 92.9 88.8 -8.2 76.5 3.2 64.8 -2.8 70.5
More favorable agriculture conditions 82.2 89.3 -1.6 82.7 -1.4 69.2 -8.0 57.6
Mineral-rich countries 69.2 82.1 10.9 91.4 -3.2 75.8 -20.3 57.5
Lower middle-income countries 81.1 65.1 -9.0 67.1 6.5 81.3 -3.3 78.5
Upper middle-income countries 80.9 115.2 9.8 97.2 10.1 115.2 -21.2 78.8
CEN-SAD 87.6 68.2 -9.2 69.8 5.9 73.5 -2.4 74.4
COMESA 74.9 81.0 -3.7 72.3 2.5 68.4 -7.4 62.6
EAC 59.3 87.0 15.0 85.3 -0.6 63.2 -11.0 59.1
ECCAS 75.0 78.7 6.4 72.7 1.2 70.0 -6.4 64.2
ECOWAS 86.7 77.2 -7.7 73.2 -1.7 70.6 -3.4 68.0
IGAD 65.1 78.8 -3.8 77.1 6.0 63.1 -14.5 52.8
SADC 81.5 88.3 2.2 86.1 -1.4 81.8 -9.0 66.9
UMA 98.9 76.8 -22.3 106.3 48.3 123.7 -10.9 112.8
CAADP Compact 2007-09 (CC1) 82.7 77.0 -11.4 74.9 -1.1 67.3 -1.5 66.8
CAADP Compact 2010-12 (CC2) 73.4 85.9 7.2 79.7 -0.8 75.1 -12.0 62.1
CAADP Compact 2013-15 (CC3) 92.9 80.3 -8.3 72.7 8.9 66.2 -12.4 52.2
CAADP Compact not yet (CC0) 121.1 86.6 -25.1 69.4 24.7 139.6 24.0 216.8
CAADP Level 0 (CL0) 121.1 86.6 -25.1 69.4 24.7 139.6 24.0 216.8
CAADP Level 1 (CL1) 82.2 75.6 -9.3 80.4 14.5 66.6 -20.0 45.6
CAADP Level 2 (CL2) 82.4 88.2 7.1 77.3 -8.6 71.2 -0.9 69.4
CAADP Level 3 (CL3) 79.8 103.5 -0.3 79.0 -0.2 58.7 -12.4 57.4
CAADP Level 4 (CL4) 78.1 72.0 -2.4 76.9 -1.6 80.5 -1.6 74.9
NAIP00 (N00) 109.2 85.3 -16.8 72.4 15.4 85.8 5.2 100.1
NAIP10 (N10) 74.7 77.0 2.1 78.6 4.7 79.9 -10.1 70.7
NAIP11 (N11) 76.5 79.7 -3.7 75.0 -1.3 68.2 -6.6 61.6
Source: ReSAKSS based on OECD (2020) and World Bank (2020).Note: Data are from 2002 to 2018.

258 resakss.org
ANNEX 7: Supplementary Data Tables
TABLE O.1.1C—EMERGENCY FOOD AID (% of total ODA)
Region 2003
Annual avg. level
(2003–2008)
Annual avg. change (2003–2008)
Annual avg. level
(2008–2014)
Annual avg. change (2008–2014)
Annual avg. level
(2014-2018)
Annual avg. change (2014–2018) 2018
Africa 4.4 4.9 -0.5 4.4 -10.3 4.1 12.8 4.6
Central 1.7 3.0 27.5 5.1 0.3 5.7 7.6 6.3
Eastern 10.0 10.7 -8.7 8.2 -12.8 5.7 1.3 5.4
Northern 1.2 1.6 8.5 1.5 -15.3 1.1 17.4 1.3
Southern 4.3 3.7 3.0 2.6 -17.3 2.3 -5.9 1.3
Western 0.9 0.8 -6.0 1.6 24.3 3.8 38.3 5.9
Less favorable agriculture conditions 3.9 4.8 -11.2 6.7 8.6 5.7 -0.4 5.6
More favorable agriculture conditions 5.8 6.1 -7.4 4.5 -16.6 3.7 6.6 3.4
Mineral-rich countries 2.3 3.2 14.2 3.1 0.0 4.0 8.4 4.6
Lower middle-income countries 4.8 5.3 4.6 4.9 -13.2 4.2 20.0 5.4
Upper middle-income countries 0.6 0.6 7.3 0.8 -5.1 3.0 94.2 4.2
CEN-SAD 3.7 5.1 8.6 5.3 -9.0 4.7 16.8 5.8
COMESA 7.1 9.1 4.4 8.0 -12.3 6.0 -1.3 5.4
EAC 3.6 4.0 -3.9 3.3 -8.2 2.6 8.8 3.1
ECCAS 3.9 3.3 1.9 4.3 0.0 4.7 8.1 5.2
ECOWAS 0.9 0.8 -6.0 1.6 24.3 3.8 38.3 5.9
IGAD 14.5 15.6 -9.0 11.5 -12.9 8.0 -1.6 7.2
SADC 2.7 2.6 11.5 2.5 -12.5 2.4 6.4 2.1
UMA 1.2 1.6 8.5 1.5 -15.3 1.1 17.4 1.3
CAADP Compact 2007-09 (CC1) 5.6 4.8 -13.9 4.4 -6.2 5.6 22.3 7.2
CAADP Compact 2010-12 (CC2) 1.7 2.4 8.6 2.6 -2.4 2.8 2.9 2.7
CAADP Compact 2013-15 (CC3) 11.9 12.4 5.4 13.5 -10.8 8.3 -1.7 7.3
CAADP Compact not yet (CC0) 4.4 3.4 -43.8 0.5 -16.0 0.4 40.9 0.7
CAADP Level 0 (CL0) 4.4 3.4 -43.8 0.5 -16.0 0.4 40.9 0.7
CAADP Level 1 (CL1) 15.3 15.4 5.7 15.2 -10.3 9.4 -1.5 8.2
CAADP Level 2 (CL2) 1.3 2.2 20.7 3.3 1.0 4.3 3.8 4.6
CAADP Level 3 (CL3) 3.2 3.1 -8.2 3.1 10.5 4.2 3.0 4.3
CAADP Level 4 (CL4) 3.8 3.7 -9.8 3.4 -10.6 3.8 20.3 4.5
NAIP00 (N00) 7.6 6.2 -1.8 4.5 -25.5 2.4 26.2 3.0
NAIP10 (N10) 3.8 5.7 12.2 5.3 -6.7 4.6 1.8 4.5
NAIP11 (N11) 4.3 4.1 -9.7 3.9 -6.4 4.5 15.4 5.2
Source: ReSAKSS based on OECD (2020) and World Bank (2020).Note: Data are from 2002 to 2018. ODA and food aid refer to gross disbursements.

2020 ReSAKSS Annual Trends and Outlook Report 259
ANNEX 7: Supplementary Data Tables
TABLE O.1.2A—GENERAL GOVERNMENT GROSS DEBT (% of GDP)
Region
Annual avg. level
(1995–2003)
Annual avg. change (1995–2003) 2003
Annual avg. level
(2003–2008)
Annual avg. change (2003–2008)
Annual avg. level
(2008–2014)
Annual avg. change (2008–2014)
Annual avg. level
(2014-2019)
Annual avg. change (2014-2019) 2019
Africa 48.6 -2.5 41.1 28.8 -14.3 21.7 3.0 32.4 8.9 37.0
Central 87.0 -0.3 78.2 51.0 -18.5 20.7 -7.2 29.1 7.2 30.6
Eastern 60.5 -6.0 50.0 33.0 -21.8 28.4 9.7 39.6 3.3 41.8
Northern 47.1 -6.2 37.7 26.5 -15.7 16.8 0.4 24.0 13.0 29.5
Southern 40.6 -3.0 33.0 26.6 -4.3 31.2 6.3 48.2 7.2 53.2
Western 48.8 3.6 44.3 28.1 -20.8 14.8 0.2 23.6 13.0 28.8
Less favorable agriculture conditions 77.5 -2.1 63.3 39.6 -21.2 26.5 3.2 35.2 6.0 38.0
More favorable agriculture conditions 69.3 -4.6 61.3 46.1 -16.0 30.7 1.8 41.9 4.6 44.3
Mineral-rich countries 92.7 15.9 126.3 99.4 -12.8 34.1 -20.0 24.1 5.9 25.8
Lower middle-income countries 53.4 -2.8 44.4 29.6 -17.9 18.5 1.6 30.8 13.1 37.5
Upper middle-income countries 34.7 -4.0 27.0 20.2 -6.1 23.9 7.5 33.0 4.2 34.7
CEN-SAD 45.9 -0.1 42.2 29.8 -15.9 18.8 0.7 28.3 12.4 34.5
COMESA 51.1 -2.5 49.8 36.4 -15.8 22.3 -0.7 33.4 12.1 40.5
EAC 55.6 -5.7 46.5 32.8 -17.0 26.2 5.4 38.1 6.1 41.9
ECCAS 91.4 -5.0 67.7 41.8 -21.0 20.3 -2.6 33.9 11.7 39.5
ECOWAS 48.8 3.6 44.3 28.1 -20.8 14.8 0.2 23.6 13.0 28.8
IGAD 52.1 -4.1 48.3 31.9 -22.0 24.3 8.1 35.9 5.5 39.3
SADC 44.3 -2.5 37.1 29.3 -6.4 31.6 5.3 46.8 6.3 51.0
UMA 55.2 -6.3 40.1 25.3 -18.4 17.8 3.3 23.0 5.3 24.9
CAADP Compact 2007-09 (CC1) 39.4 6.6 39.6 23.5 -25.7 12.3 6.1 23.1 13.3 28.2
CAADP Compact 2010-12 (CC2) 98.2 -1.4 86.1 60.4 -15.8 35.3 -4.0 46.4 7.5 51.2
CAADP Compact 2013-15 (CC3) 82.5 -7.8 55.8 34.9 -19.8 24.7 3.7 40.3 8.5 45.5
CAADP Compact not yet (CC0) 36.2 -3.9 30.6 24.2 -7.1 23.2 4.6 32.6 7.7 36.8
CAADP Level 0 (CL0) 36.2 -3.9 30.6 24.2 -7.1 23.2 4.6 32.6 7.7 36.8
CAADP Level 1 (CL1) 85.0 -7.7 57.8 36.6 -18.8 26.7 3.4 42.7 8.1 48.0
CAADP Level 2 (CL2) 86.6 3.1 87.6 62.2 -16.1 28.3 -9.8 30.7 6.6 33.3
CAADP Level 3 (CL3) 121.2 1.0 109.8 63.5 -25.4 25.8 -1.9 49.2 12.1 56.2
CAADP Level 4 (CL4) 49.5 0.3 43.3 27.6 -21.3 16.6 3.5 28.0 11.7 33.4
NAIP00 (N00) 41.0 -5.0 32.7 25.0 -8.9 23.7 4.7 33.9 7.8 38.3
NAIP10 (N10) 109.8 -1.7 96.2 61.8 -20.2 29.8 -3.0 49.1 9.0 53.6
NAIP11 (N11) 49.9 2.3 45.6 28.9 -21.4 16.1 1.9 25.7 11.7 30.8
Source: ReSAKSS based on AfDB (2020) and World Bank (2020).
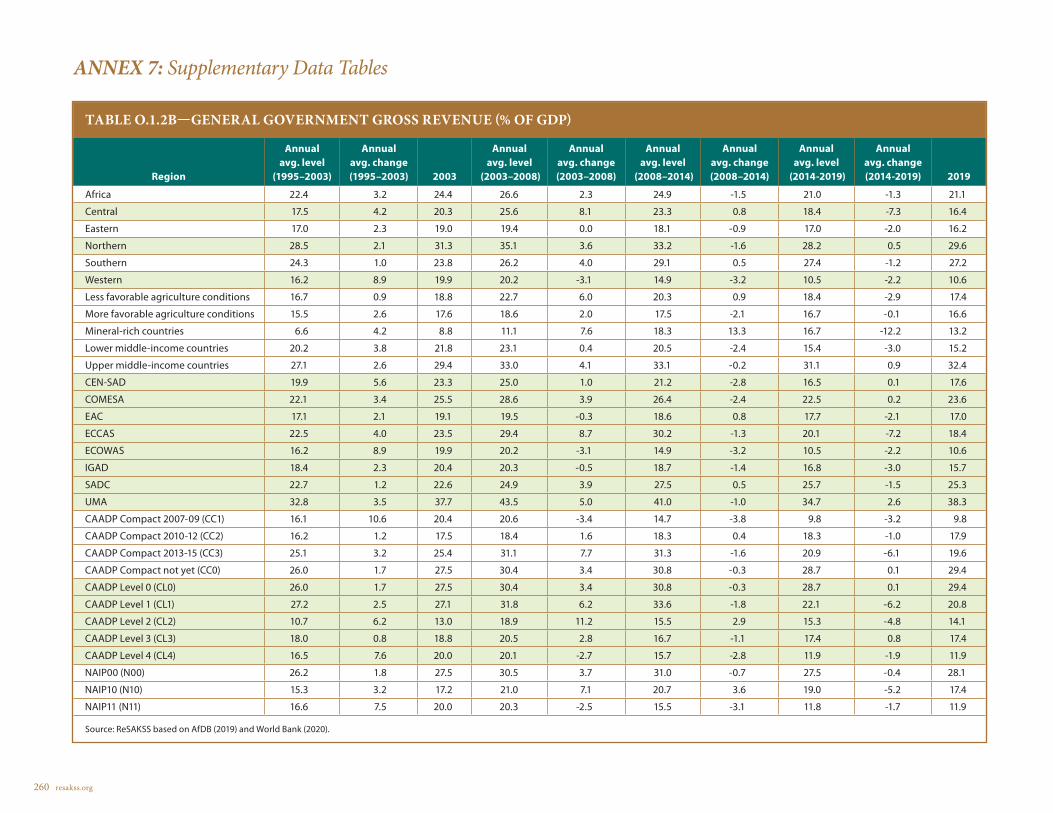
260 resakss.org
ANNEX 7: Supplementary Data Tables
TABLE O.1.2B—GENERAL GOVERNMENT GROSS REVENUE (% OF GDP)
Region
Annual avg. level
(1995–2003)
Annual avg. change (1995–2003) 2003
Annual avg. level
(2003–2008)
Annual avg. change (2003–2008)
Annual avg. level
(2008–2014)
Annual avg. change (2008–2014)
Annual avg. level
(2014-2019)
Annual avg. change (2014-2019) 2019
Africa 22.4 3.2 24.4 26.6 2.3 24.9 -1.5 21.0 -1.3 21.1
Central 17.5 4.2 20.3 25.6 8.1 23.3 0.8 18.4 -7.3 16.4
Eastern 17.0 2.3 19.0 19.4 0.0 18.1 -0.9 17.0 -2.0 16.2
Northern 28.5 2.1 31.3 35.1 3.6 33.2 -1.6 28.2 0.5 29.6
Southern 24.3 1.0 23.8 26.2 4.0 29.1 0.5 27.4 -1.2 27.2
Western 16.2 8.9 19.9 20.2 -3.1 14.9 -3.2 10.5 -2.2 10.6
Less favorable agriculture conditions 16.7 0.9 18.8 22.7 6.0 20.3 0.9 18.4 -2.9 17.4
More favorable agriculture conditions 15.5 2.6 17.6 18.6 2.0 17.5 -2.1 16.7 -0.1 16.6
Mineral-rich countries 6.6 4.2 8.8 11.1 7.6 18.3 13.3 16.7 -12.2 13.2
Lower middle-income countries 20.2 3.8 21.8 23.1 0.4 20.5 -2.4 15.4 -3.0 15.2
Upper middle-income countries 27.1 2.6 29.4 33.0 4.1 33.1 -0.2 31.1 0.9 32.4
CEN-SAD 19.9 5.6 23.3 25.0 1.0 21.2 -2.8 16.5 0.1 17.6
COMESA 22.1 3.4 25.5 28.6 3.9 26.4 -2.4 22.5 0.2 23.6
EAC 17.1 2.1 19.1 19.5 -0.3 18.6 0.8 17.7 -2.1 17.0
ECCAS 22.5 4.0 23.5 29.4 8.7 30.2 -1.3 20.1 -7.2 18.4
ECOWAS 16.2 8.9 19.9 20.2 -3.1 14.9 -3.2 10.5 -2.2 10.6
IGAD 18.4 2.3 20.4 20.3 -0.5 18.7 -1.4 16.8 -3.0 15.7
SADC 22.7 1.2 22.6 24.9 3.9 27.5 0.5 25.7 -1.5 25.3
UMA 32.8 3.5 37.7 43.5 5.0 41.0 -1.0 34.7 2.6 38.3
CAADP Compact 2007-09 (CC1) 16.1 10.6 20.4 20.6 -3.4 14.7 -3.8 9.8 -3.2 9.8
CAADP Compact 2010-12 (CC2) 16.2 1.2 17.5 18.4 1.6 18.3 0.4 18.3 -1.0 17.9
CAADP Compact 2013-15 (CC3) 25.1 3.2 25.4 31.1 7.7 31.3 -1.6 20.9 -6.1 19.6
CAADP Compact not yet (CC0) 26.0 1.7 27.5 30.4 3.4 30.8 -0.3 28.7 0.1 29.4
CAADP Level 0 (CL0) 26.0 1.7 27.5 30.4 3.4 30.8 -0.3 28.7 0.1 29.4
CAADP Level 1 (CL1) 27.2 2.5 27.1 31.8 6.2 33.6 -1.8 22.1 -6.2 20.8
CAADP Level 2 (CL2) 10.7 6.2 13.0 18.9 11.2 15.5 2.9 15.3 -4.8 14.1
CAADP Level 3 (CL3) 18.0 0.8 18.8 20.5 2.8 16.7 -1.1 17.4 0.8 17.4
CAADP Level 4 (CL4) 16.5 7.6 20.0 20.1 -2.7 15.7 -2.8 11.9 -1.9 11.9
NAIP00 (N00) 26.2 1.8 27.5 30.5 3.7 31.0 -0.7 27.5 -0.4 28.1
NAIP10 (N10) 15.3 3.2 17.2 21.0 7.1 20.7 3.6 19.0 -5.2 17.4
NAIP11 (N11) 16.6 7.5 20.0 20.3 -2.5 15.5 -3.1 11.8 -1.7 11.9
Source: ReSAKSS based on AfDB (2019) and World Bank (2020).

2020 ReSAKSS Annual Trends and Outlook Report 261
ANNEX 7: Supplementary Data Tables
TABLE O.1.3—ANNUAL INFLATION, GDP DEFLATOR (%)
Region
Annual avg. level
(1995–2003)
Annual avg. change (1995–2003) 2003
Annual avg. level
(2003–2008)
Annual avg. change (2003–2008)
Annual avg. level
(2008–2014)
Annual avg. change (2008–2014)
Annual avg. level
(2014-2019)
Annual avg. change (2014-2019) 2019
Africa 10.6 -2.7 9.1 10.5 0.8 9.8 -1.8 5.9 1.2 7.5
Central 4.9 -0.6 3.0 9.4 3.0 3.7 -2.2 0.1 0.0 3.6
Eastern 10.3 -1.4 6.5 9.0 1.4 8.3 -1.1 6.0 -0.2 5.0
Northern 6.5 -1.3 6.1 8.6 1.0 8.7 -0.9 6.9 0.2 9.0
Southern 8.4 -1.1 8.9 6.2 0.0 13.9 -3.8 2.8 3.5 4.3
Western 17.5 -5.8 15.0 14.3 0.0 8.4 -0.6 7.5 0.5 8.4
Less favorable agriculture conditions 5.9 -1.7 3.2 7.6 1.7 4.3 -1.2 1.6 0.0 1.9
More favorable agriculture conditions 9.8 -1.8 8.3 8.4 1.3 8.9 -1.2 6.3 0.1 6.8
Mineral-rich countries 4.0 0.8 8.4 22.9 0.4 7.6 -1.6 5.2 0.3 6.0
Lower middle-income countries 11.2 -3.1 10.2 10.6 0.5 9.0 -0.5 7.9 0.3 8.8
Upper middle-income countries 10.0 -2.0 6.6 11.2 1.6 12.2 -4.4 0.9 2.6 3.2
CEN-SAD 11.3 -3.2 10.2 10.8 0.5 8.8 -0.5 7.9 0.3 8.8
COMESA 7.8 -0.9 7.9 9.4 0.9 11.2 -0.5 10.0 0.0 11.2
EAC 11.6 -1.2 6.9 9.7 1.2 6.9 -1.2 5.3 -0.3 3.3
ECCAS 5.1 -0.7 3.4 9.7 2.8 3.9 -2.1 0.3 0.0 3.2
ECOWAS 17.5 -5.8 15.0 14.3 0.0 8.4 -0.6 7.5 0.5 8.4
IGAD 11.4 -0.9 7.5 10.1 1.2 10.0 -1.0 7.3 -0.4 6.1
SADC 8.0 -1.6 6.8 5.9 0.8 12.9 -3.6 2.2 3.2 3.6
UMA 7.3 -1.7 5.4 8.0 0.9 6.3 -1.5 1.5 -0.1 2.5
CAADP Compact 2007-09 (CC1) 19.0 -6.5 15.9 15.2 -0.1 9.2 -0.6 8.1 0.6 9.6
CAADP Compact 2010-12 (CC2) 9.6 -1.1 7.6 8.6 1.3 7.9 -1.3 5.0 -0.2 2.9
CAADP Compact 2013-15 (CC3) 9.6 -1.1 7.6 8.6 1.3 7.9 -1.3 5.0 -0.2 2.9
CAADP Compact not yet (CC0) 6.6 -1.2 6.1 8.5 1.0 11.4 -2.7 5.7 2.2 8.7
CAADP Level 0 (CL0) 6.6 -1.2 6.1 8.5 1.0 11.4 -2.7 5.7 2.2 8.7
CAADP Level 1 (CL1) 7.6 -1.1 5.8 8.8 1.8 6.5 -1.4 2.9 -0.3 4.7
CAADP Level 2 (CL2) 4.0 -0.3 3.4 8.1 1.1 4.3 -1.2 2.3 0.4 3.0
CAADP Level 3 (CL3) 9.8 -0.8 9.6 8.6 0.0 9.6 -0.8 4.2 -0.3 3.5
CAADP Level 4 (CL4) 16.7 -5.2 13.9 13.5 0.4 8.8 -0.8 7.6 0.4 7.9
NAIP00 (N00) 6.3 6.0 8.7 6.7 11.0 -2.6 5.3 2.0 8.4
NAIP10 (N10) 7.5 -10.7 4.6 5.6 14.0 6.3 -1.1 2.8 -0.2 2.4
NAIP11 (N11) 16.8 -9.5 14.2 14.1 -2.9 9.0 -0.7 7.7 0.3 8.1
Source: ReSAKSS based on World Bank (2020).

262 resakss.org
ANNEX 7: Supplementary Data Tables
TABLE O.2.1A—AGRICULTURAL EXPORTS (% of total merchandise exports)
Region
Annual avg. level
(1995–2003)
Annual avg. change (1995–2003) 2003
Annual avg. level
(2003–2008)
Annual avg. change (2003–2008)
Annual avg. level
(2008–2014)
Annual avg. change (2008–2014)
Annual avg. level
(2014-2019)
Annual avg. change (2014-2019) 2019
Africa 12.1 -4.4 10.1 8.0 -7.0 8.6 2.9 12.0 3.2 11.3
Central 5.1 -9.0 3.3 2.8 -5.2 2.9 -4.6 3.6 -0.3 3.1
Eastern 47.2 -6.3 35.0 29.7 -5.6 31.3 7.5 42.0 2.6 41.4
Northern 6.8 -10.2 4.7 4.5 -0.3 6.1 5.3 9.5 3.9 9.3
Southern 11.2 -1.7 10.2 7.9 -9.1 8.1 4.1 10.3 0.4 9.6
Western 14.4 0.4 14.3 10.6 -8.6 9.8 -2.4 13.7 3.4 11.8
Less favorable agriculture conditions 13.8 -4.9 9.6 6.6 -0.1 7.7 -7.0 10.7 16.4 11.0
More favorable agriculture conditions 49.1 -2.4 41.5 37.7 -2.6 36.6 -0.4 36.8 -1.9 33.7
Mineral-rich countries 6.0 -11.4 5.1 4.7 -14.9 3.0 -5.6 3.7 10.1 3.0
Lower middle-income countries 13.6 -1.7 12.8 9.9 -8.4 9.5 0.8 13.5 4.0 12.6
Upper middle-income countries 6.5 -6.2 4.9 3.8 -5.9 5.1 7.2 7.4 1.8 7.1
CEN-SAD 15.7 -4.8 12.5 9.6 -7.5 9.9 1.7 14.8 4.2 13.9
COMESA 26.6 -10.7 14.9 11.5 -7.3 13.7 8.0 20.4 0.0 18.5
EAC 57.5 -3.7 45.8 44.1 -0.6 42.2 0.1 44.8 0.0 44.5
ECCAS 3.0 -9.3 2.0 1.6 -8.5 1.5 -0.8 2.3 1.6 1.9
ECOWAS 14.4 0.4 14.3 10.6 -8.6 9.8 -2.4 13.7 3.4 11.8
IGAD 51.0 -7.7 34.1 27.6 -7.3 30.8 11.1 45.4 3.2 45.4
SADC 12.4 -2.1 11.4 9.0 -8.7 9.0 3.7 11.3 0.2 10.4
UMA 6.5 -12.2 3.9 3.6 -0.9 4.6 7.2 7.9 4.8 7.7
CAADP Compact 2007-09 (CC1) 8.2 1.6 9.1 7.2 -8.1 7.2 -2.3 9.7 5.5 8.4
CAADP Compact 2010-12 (CC2) 42.2 -1.2 37.2 32.7 -3.8 29.2 -1.8 30.2 -2.5 27.6
CAADP Compact 2013-15 (CC3) 9.9 -5.5 7.5 4.6 -16.5 3.7 5.7 7.9 16.1 8.5
CAADP Compact not yet (CC0) 8.2 -5.5 6.7 5.7 -3.7 7.3 4.6 10.0 2.5 9.8
CAADP Level 0 (CL0) 8.2 -5.5 6.7 5.7 -3.7 7.3 4.6 10.0 2.5 9.8
CAADP Level 1 (CL1) 10.3 -5.0 7.8 4.8 -16.6 3.7 7.0 7.8 16.2 8.5
CAADP Level 2 (CL2) 17.0 -2.4 15.8 14.3 -5.8 13.2 -4.5 14.6 -1.3 12.8
CAADP Level 3 (CL3) 23.0 -1.1 23.0 22.7 -0.4 18.9 -5.6 19.2 3.6 18.3
CAADP Level 4 (CL4) 51.1 -1.8 47.5 43.0 -3.0 38.4 -3.8 37.2 -1.8 34.7
NAIP00 (N00) 8.3 -5.6 6.6 5.3 -6.3 6.3 5.3 9.1 3.1 8.8
NAIP10 (N10) 19.8 -4.7 15.5 12.9 -5.4 11.7 1.7 16.7 4.6 16.4
NAIP11 (N11) 19.1 -0.9 17.7 14.4 -5.4 13.8 -1.4 18.4 2.2 16.0
ReSAKSS based on UNCTAD (2020) and World Bank (2020).

2020 ReSAKSS Annual Trends and Outlook Report 263
ANNEX 7: Supplementary Data Tables
TABLE O.2.1B—AGRICULTURAL IMPORTS (% of total merchandise imports)
Region
Annual avg. level
(1995–2003)
Annual avg. change (1995–2003) 2003
Annual avg. level
(2003–2008)
Annual avg. change (2003–2008)
Annual avg. level
(2008–2014)
Annual avg. change (2008–2014)
Annual avg. level
(2014-2019)
Annual avg. change (2014-2019) 2019
Africa 15.1 -0.4 14.7 13.3 -3.3 13.9 1.2 14.3 1.7 14.2
Central 17.1 -1.4 16.8 17.1 -1.0 15.7 1.1 18.0 4.5 19.6
Eastern 14.7 0.1 14.4 12.8 -3.8 14.0 0.2 15.2 7.2 16.6
Northern 20.1 -3.0 17.7 15.6 -2.3 16.1 1.9 16.3 -1.7 15.2
Southern 9.4 1.1 9.6 8.5 -3.8 9.5 -0.4 9.8 3.4 9.8
Western 17.5 2.5 18.5 16.8 -4.7 16.8 2.0 16.6 0.6 16.0
Less favorable agriculture conditions 20.3 -1.4 18.4 18.8 -3.0 17.7 -0.2 17.8 2.4 17.9
More favorable agriculture conditions 14.3 -0.1 15.9 15.1 -2.8 13.8 -2.3 14.1 4.9 14.7
Mineral-rich countries 22.3 -1.3 21.9 20.0 -2.4 18.7 -2.2 18.1 4.0 19.0
Lower middle-income countries 17.0 0.4 16.6 14.7 -3.6 15.6 1.5 15.3 0.1 14.9
Upper middle-income countries 12.2 -1.6 11.7 10.3 -3.6 11.2 2.5 12.7 2.4 12.5
CEN-SAD 16.7 -0.2 16.1 14.7 -3.0 15.8 2.1 16.0 0.1 15.3
COMESA 17.1 0.0 17.1 15.4 -2.6 16.7 1.2 16.8 0.6 16.3
EAC 13.4 -3.0 12.1 11.6 -2.3 11.6 -0.2 12.2 4.3 12.0
ECCAS 20.3 -0.6 19.4 17.5 -3.9 16.2 1.6 18.4 6.3 20.4
ECOWAS 17.5 2.5 18.5 16.8 -4.7 16.8 2.0 16.6 0.6 16.0
IGAD 14.1 0.7 13.6 12.0 -4.3 13.8 -0.5 15.1 8.8 17.1
SADC 10.2 0.6 10.5 9.4 -3.5 10.2 -0.3 10.5 3.4 10.5
UMA 19.6 -3.9 16.5 14.8 -1.4 14.7 1.6 15.6 -0.9 14.9
CAADP Compact 2007-09 (CC1) 16.1 2.8 16.9 15.3 -5.6 15.3 2.4 14.6 0.5 14.2
CAADP Compact 2010-12 (CC2) 17.8 -0.4 17.5 15.9 -2.9 14.7 -2.8 14.6 2.7 14.5
CAADP Compact 2013-15 (CC3) 17.2 0.7 17.5 15.7 -2.7 17.5 2.4 20.1 6.1 21.9
CAADP Compact not yet (CC0) 13.5 -1.8 12.7 11.5 -2.4 12.6 1.6 13.0 0.7 12.5
CAADP Level 0 (CL0) 13.5 -1.8 12.7 11.5 -2.4 12.6 1.6 13.0 0.7 12.5
CAADP Level 1 (CL1) 17.4 0.8 17.7 15.7 -3.0 17.5 2.7 20.2 5.7 21.8
CAADP Level 2 (CL2) 22.0 -0.3 21.8 21.4 0.2 20.7 -2.7 20.3 2.7 21.2
CAADP Level 3 (CL3) 15.9 -2.4 15.4 13.6 -4.6 11.7 -2.3 11.9 3.5 12.0
CAADP Level 4 (CL4) 16.2 2.2 16.8 15.1 -4.9 14.9 0.7 14.5 1.5 14.2
NAIP00 (N00) 14.2 -1.3 13.6 12.2 -2.7 13.2 1.5 13.7 1.0 13.3
NAIP10 (N10) 17.6 -0.3 16.8 14.9 -3.4 15.2 -0.6 16.3 4.9 17.8
NAIP11 (N11) 16.5 1.8 17.1 15.5 -4.6 15.4 0.9 15.1 1.5 14.8
Source: ReSAKSS based on UNCTAD (2020) and World Bank (2020).

264 resakss.org
ANNEX 7: Supplementary Data Tables
TABLE O.2.2—RATIO OF AGRICULTURAL EXPORTS TO AGRICULTURAL IMPORTS
Region
Annual avg. level
(1995–2003)
Annual avg. change (1995–2003) 2003
Annual avg. level
(2003–2008)
Annual avg. change (2003–2008)
Annual avg. level
(2008–2014)
Annual avg. change (2008–2014)
Annual avg. level
(2014-2019)
Annual avg. change (2014-2019) 2019
Africa 0.8 -1.8 0.8 0.7 -4.9 0.6 -1.2 0.7 1.2 0.7
Central 0.5 -6.7 0.4 0.3 -4.1 0.3 -10.6 0.2 1.7 0.2
Eastern 1.7 -4.6 1.4 1.2 -4.6 1.0 0.1 1.1 -1.4 1.0
Northern 0.3 0.0 0.3 0.4 1.0 0.3 -3.1 0.4 5.6 0.4
Southern 1.3 -2.9 1.1 1.0 -4.0 0.9 3.9 1.0 -2.8 0.9
Western 1.1 -1.2 1.2 0.9 -8.3 0.8 -4.2 0.8 1.8 0.8
Less favorable agriculture conditions 0.3 -4.8 0.3 0.3 5.3 0.3 -6.6 0.3 9.9 0.4
More favorable agriculture conditions 2.0 -2.9 1.5 1.2 -3.8 1.2 2.3 1.3 -3.1 1.2
Mineral-rich countries 0.3 -16.1 0.2 0.2 -13.0 0.1 -2.5 0.2 16.8 0.2
Lower middle-income countries 0.8 -1.2 0.9 0.7 -7.0 0.6 -2.6 0.7 3.3 0.7
Upper middle-income countries 0.6 -0.5 0.6 0.5 -2.2 0.5 0.4 0.5 -1.5 0.5
CEN-SAD 0.9 -1.7 0.9 0.7 -7.5 0.6 -4.0 0.7 3.9 0.7
COMESA 1.0 -3.5 0.8 0.7 -5.5 0.6 -1.0 0.7 1.9 0.7
EAC 2.3 -1.6 2.1 1.8 -6.2 1.4 -3.0 1.5 -0.3 1.5
ECCAS 0.3 -9.4 0.2 0.2 1.0 0.2 -6.4 0.2 4.7 0.2
ECOWAS 1.1 -1.2 1.2 0.9 -8.3 0.8 -4.2 0.8 1.8 0.8
IGAD 1.8 -6.0 1.4 1.2 -3.4 1.0 0.3 1.1 -0.6 1.0
SADC 1.3 -2.9 1.1 1.0 -4.5 0.9 3.5 1.0 -2.6 0.9
UMA 0.4 -2.6 0.3 0.4 2.1 0.3 -2.4 0.4 6.6 0.4
CAADP Compact 2007-09 (CC1) 0.7 -0.8 0.8 0.7 -7.2 0.6 -4.5 0.6 4.8 0.6
CAADP Compact 2010-12 (CC2) 2.0 -2.6 1.7 1.5 -4.3 1.4 -0.6 1.4 -2.7 1.3
CAADP Compact 2013-15 (CC3) 0.8 -4.6 0.6 0.5 -9.7 0.3 -0.7 0.5 11.6 0.5
CAADP Compact not yet (CC0) 0.6 0.5 0.5 0.5 -2.7 0.5 -0.4 0.6 0.6 0.5
CAADP Level 0 (CL0) 0.6 0.5 0.5 0.5 -2.7 0.5 -0.4 0.6 0.6 0.5
CAADP Level 1 (CL1) 0.8 -3.7 0.7 0.5 -9.2 0.3 0.7 0.5 12.1 0.5
CAADP Level 2 (CL2) 0.9 -7.3 0.6 0.6 -5.2 0.5 -3.4 0.6 0.9 0.5
CAADP Level 3 (CL3) 0.9 -1.4 0.9 1.0 6.0 1.1 -0.7 1.0 0.6 1.0
CAADP Level 4 (CL4) 1.4 -2.9 1.4 1.1 -6.2 1.0 -2.8 1.0 -0.1 1.0
NAIP00 (N00) 0.6 -1.0 0.5 0.5 -3.8 0.5 0.5 0.5 1.2 0.5
NAIP10 (N10) 1.1 -3.4 0.9 0.8 -1.7 0.7 -3.7 0.7 3.5 0.7
NAIP11 (N11) 1.3 -2.6 1.3 1.1 -5.9 1.0 -2.8 1.0 0.6 1.0
Source: ReSAKSS based on UNCTAD (2020) and World Bank (2020).
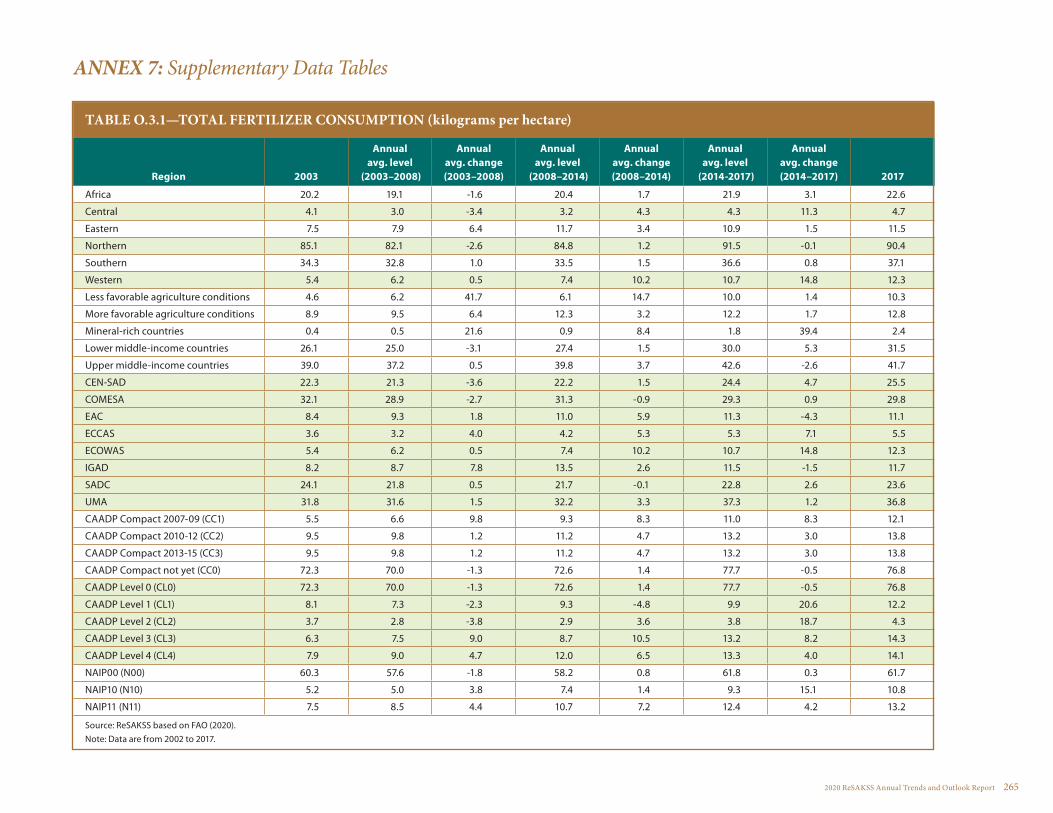
2020 ReSAKSS Annual Trends and Outlook Report 265
ANNEX 7: Supplementary Data Tables
TABLE O.3.1—TOTAL FERTILIZER CONSUMPTION (kilograms per hectare)
Region 2003
Annual avg. level
(2003–2008)
Annual avg. change (2003–2008)
Annual avg. level
(2008–2014)
Annual avg. change (2008–2014)
Annual avg. level
(2014-2017)
Annual avg. change (2014–2017) 2017
Africa 20.2 19.1 -1.6 20.4 1.7 21.9 3.1 22.6
Central 4.1 3.0 -3.4 3.2 4.3 4.3 11.3 4.7
Eastern 7.5 7.9 6.4 11.7 3.4 10.9 1.5 11.5
Northern 85.1 82.1 -2.6 84.8 1.2 91.5 -0.1 90.4
Southern 34.3 32.8 1.0 33.5 1.5 36.6 0.8 37.1
Western 5.4 6.2 0.5 7.4 10.2 10.7 14.8 12.3
Less favorable agriculture conditions 4.6 6.2 41.7 6.1 14.7 10.0 1.4 10.3
More favorable agriculture conditions 8.9 9.5 6.4 12.3 3.2 12.2 1.7 12.8
Mineral-rich countries 0.4 0.5 21.6 0.9 8.4 1.8 39.4 2.4
Lower middle-income countries 26.1 25.0 -3.1 27.4 1.5 30.0 5.3 31.5
Upper middle-income countries 39.0 37.2 0.5 39.8 3.7 42.6 -2.6 41.7
CEN-SAD 22.3 21.3 -3.6 22.2 1.5 24.4 4.7 25.5
COMESA 32.1 28.9 -2.7 31.3 -0.9 29.3 0.9 29.8
EAC 8.4 9.3 1.8 11.0 5.9 11.3 -4.3 11.1
ECCAS 3.6 3.2 4.0 4.2 5.3 5.3 7.1 5.5
ECOWAS 5.4 6.2 0.5 7.4 10.2 10.7 14.8 12.3
IGAD 8.2 8.7 7.8 13.5 2.6 11.5 -1.5 11.7
SADC 24.1 21.8 0.5 21.7 -0.1 22.8 2.6 23.6
UMA 31.8 31.6 1.5 32.2 3.3 37.3 1.2 36.8
CAADP Compact 2007-09 (CC1) 5.5 6.6 9.8 9.3 8.3 11.0 8.3 12.1
CAADP Compact 2010-12 (CC2) 9.5 9.8 1.2 11.2 4.7 13.2 3.0 13.8
CAADP Compact 2013-15 (CC3) 9.5 9.8 1.2 11.2 4.7 13.2 3.0 13.8
CAADP Compact not yet (CC0) 72.3 70.0 -1.3 72.6 1.4 77.7 -0.5 76.8
CAADP Level 0 (CL0) 72.3 70.0 -1.3 72.6 1.4 77.7 -0.5 76.8
CAADP Level 1 (CL1) 8.1 7.3 -2.3 9.3 -4.8 9.9 20.6 12.2
CAADP Level 2 (CL2) 3.7 2.8 -3.8 2.9 3.6 3.8 18.7 4.3
CAADP Level 3 (CL3) 6.3 7.5 9.0 8.7 10.5 13.2 8.2 14.3
CAADP Level 4 (CL4) 7.9 9.0 4.7 12.0 6.5 13.3 4.0 14.1
NAIP00 (N00) 60.3 57.6 -1.8 58.2 0.8 61.8 0.3 61.7
NAIP10 (N10) 5.2 5.0 3.8 7.4 1.4 9.3 15.1 10.8
NAIP11 (N11) 7.5 8.5 4.4 10.7 7.2 12.4 4.2 13.2
Source: ReSAKSS based on FAO (2020).Note: Data are from 2002 to 2017.

266 resakss.org
ANNEX 7: Supplementary Data Tables
TABLE O.3.2—AGRICULTURAL VALUE ADDED (% GDP)
Region
Annual avg. level
(1995–2003)
Annual avg. change (1995–2003) 2003
Annual avg. level
(2003–2008)
Annual avg. change (2003–2008)
Annual avg. level
(2008–2014)
Annual avg. change (2008–2014)
Annual avg. level
(2014-2019)
Annual avg. change (2014-2019) 2019
Africa 17.3 -1.1 16.9 15.1 -3.8 14.6 -1.0 14.6 0.7 14.7
Central 21.7 -5.3 17.0 14.3 -7.6 13.1 0.2 14.4 2.7 14.9
Eastern 34.0 -3.1 29.3 27.0 -3.1 28.2 1.0 27.1 -1.2 26.3
Northern 14.0 -3.3 12.5 11.4 -4.1 11.0 0.2 11.6 0.6 11.6
Southern 5.6 -1.7 5.1 4.7 -2.1 4.5 -1.4 4.5 -1.6 4.3
Western 28.3 1.9 31.5 27.1 -4.3 23.6 -4.0 21.4 0.7 21.7
Less favorable agriculture conditions 38.1 -0.6 36.1 33.5 -2.7 31.7 0.1 33.1 1.0 33.4
More favorable agriculture conditions 30.6 -4.5 26.6 27.6 1.3 28.6 -1.5 25.8 -1.5 24.7
Mineral-rich countries 37.5 -4.3 29.3 26.6 -2.4 24.8 -2.8 23.1 1.2 23.6
Lower middle-income countries 21.4 0.7 22.3 19.2 -5.0 17.4 -2.1 16.6 0.2 16.6
Upper middle-income countries 4.7 3.9 5.1 4.3 -5.5 4.2 1.1 5.0 1.9 5.1
CEN-SAD 23.7 0.7 24.8 21.7 -4.3 19.9 -2.1 18.8 0.3 18.9
COMESA 24.2 -2.2 21.5 20.0 -3.0 19.4 -0.6 18.4 -0.6 18.1
EAC 30.8 -4.5 25.9 24.4 -3.1 26.2 1.1 27.4 0.5 26.9
ECCAS 17.1 -5.5 13.3 11.2 -7.8 10.5 1.4 12.4 1.4 12.3
ECOWAS 28.3 1.9 31.5 27.1 -4.3 23.6 -4.0 21.4 0.7 21.7
IGAD 36.7 -2.3 31.6 28.9 -3.4 30.5 1.2 29.1 -0.8 28.8
SADC 8.5 -4.4 7.2 6.7 -2.0 6.6 -0.6 6.8 -0.4 6.6
UMA 12.8 -5.2 10.8 9.8 -5.1 10.1 2.8 11.7 1.4 11.9
CAADP Compact 2007-09 (CC1) 30.4 1.5 33.4 28.9 -3.9 25.3 -3.9 23.1 0.9 23.4
CAADP Compact 2010-12 (CC2) 27.3 -3.6 23.5 21.8 -2.9 22.2 -0.5 21.6 -0.2 21.2
CAADP Compact 2013-15 (CC3) 19.4 -1.0 17.7 14.9 -7.5 13.5 1.0 14.0 -0.7 13.6
CAADP Compact not yet (CC0) 8.6 -0.5 8.3 7.5 -3.6 7.3 -0.4 7.6 1.0 7.7
CAADP Level 0 (CL0) 8.6 -0.5 8.3 7.5 -3.6 7.3 -0.4 7.6 1.0 7.7
CAADP Level 1 (CL1) 19.4 -0.9 17.7 14.8 -7.8 13.4 0.9 13.7 -1.0 13.3
CAADP Level 2 (CL2) 26.9 -5.6 20.6 18.4 -4.0 17.7 -1.0 17.7 1.3 18.1
CAADP Level 3 (CL3) 31.1 -1.8 28.0 27.0 -1.5 26.5 -2.0 23.2 -1.0 22.7
CAADP Level 4 (CL4) 28.9 0.6 30.8 26.9 -3.8 24.4 -3.1 22.8 0.7 22.9
NAIP00 (N00) 9.1 -1.1 8.6 7.8 -4.1 7.5 -0.2 8.0 0.8 8.0
NAIP10 (N10) 29.2 -3.5 24.7 21.8 -4.5 21.3 0.0 19.6 -2.2 18.6
NAIP11 (N11) 29.3 0.9 31.1 27.3 -3.7 24.9 -3.0 23.2 0.9 23.5
Source: ReSAKSS based on World Bank (2020).

2020 ReSAKSS Annual Trends and Outlook Report 267
ANNEX 7: Supplementary Data Tables
TABLE O.4.1—GROSS DOMESTIC PRODUCT (constant 2010 US$, trillion)
Region
Annual avg. level
(1995–2003)
Annual avg. change (1995–2003) 2003
Annual avg. level
(2003–2008)
Annual avg. change (2003–2008)
Annual avg. level
(2008–2014)
Annual avg. change (2008–2014)
Annual avg. level
(2014-2019)
Annual avg. change (2014-2019) 2019
Africa 1.1 4.6 1.4 1.6 6.0 2.0 3.8 2.4 2.5 2.5
Central 0.1 2.7 0.1 0.1 6.1 0.1 4.6 0.1 1.5 0.1
Eastern 0.1 4.5 0.1 0.2 8.5 0.2 4.2 0.3 4.5 0.3
Northern 0.4 6.6 0.4 0.5 5.2 0.6 2.0 0.7 3.6 0.7
Southern 0.4 3.0 0.4 0.5 5.8 0.6 3.3 0.6 0.8 0.6
Western 0.3 4.7 0.3 0.4 6.1 0.5 6.0 0.7 2.4 0.7
Less favorable agriculture conditions 0.0 4.9 0.0 0.0 6.1 0.0 4.4 0.0 3.8 0.1
More favorable agriculture conditions 0.1 4.7 0.1 0.1 7.3 0.2 6.5 0.2 6.1 0.2
Mineral-rich countries 0.0 0.6 0.0 0.0 10.6 0.0 2.4 0.1 0.6 0.1
Lower middle-income countries 0.6 4.4 0.7 0.8 6.4 1.1 4.8 1.4 2.6 1.4
Upper middle-income countries 0.4 5.1 0.5 0.6 5.0 0.7 1.7 0.7 1.5 0.8
CEN-SAD 0.6 5.9 0.7 0.8 6.3 1.1 3.8 1.3 3.0 1.4
COMESA 0.3 6.4 0.4 0.4 6.3 0.5 2.9 0.7 4.8 0.7
EAC 0.1 4.0 0.1 0.1 8.6 0.1 4.5 0.2 4.3 0.2
ECCAS 0.1 3.9 0.1 0.2 8.8 0.2 4.8 0.2 0.7 0.2
ECOWAS 0.3 4.7 0.3 0.4 6.1 0.5 6.0 0.7 2.4 0.7
IGAD 0.1 4.4 0.1 0.1 9.3 0.2 3.9 0.2 4.1 0.2
SADC 0.4 2.9 0.5 0.5 5.9 0.6 3.6 0.7 1.4 0.8
UMA 0.4 7.5 0.6 0.6 4.7 0.7 1.4 0.8 2.9 0.9
CAADP Compact 2007-09 (CC1) 0.2 5.0 0.3 0.3 6.8 0.5 6.5 0.6 2.4 0.7
CAADP Compact 2010-12 (CC2) 0.1 2.8 0.2 0.2 5.7 0.2 5.6 0.3 5.4 0.4
CAADP Compact 2013-15 (CC3) 0.1 4.4 0.2 0.2 7.7 0.3 4.1 0.3 0.7 0.3
CAADP Compact not yet (CC0) 0.6 4.9 0.7 0.8 5.3 1.0 2.0 1.1 2.3 1.2
CAADP Level 0 (CL0) 0.6 4.9 0.7 0.8 5.3 1.0 2.0 1.1 2.3 1.2
CAADP Level 1 (CL1) 0.1 4.4 0.2 0.2 8.1 0.3 4.0 0.3 0.3 0.3
CAADP Level 2 (CL2) 0.0 1.5 0.0 0.1 4.9 0.1 4.8 0.1 4.6 0.1
CAADP Level 3 (CL3) 0.0 5.2 0.0 0.1 6.3 0.1 5.8 0.1 4.3 0.1
CAADP Level 4 (CL4) 0.3 4.5 0.4 0.4 6.5 0.6 6.3 0.8 3.2 0.8
NAIP00 (N00) 0.7 4.8 0.8 1.0 5.5 1.2 2.5 1.3 2.1 1.4
NAIP10 (N10) 0.1 3.8 0.1 0.2 7.7 0.2 3.7 0.3 2.7 0.3
NAIP11 (N11) 0.3 4.5 0.4 0.5 6.4 0.6 6.2 0.8 3.2 0.9
Source: ReSAKSS based on World Bank (2020).Note: Aggregate value for a group is sum of gross domestic product for countries in a group.

268 resakss.org
ANNEX 7: Supplementary Data Tables
TABLE O.5.1—GLOBAL HUNGER INDEX (GHI)
Region
Annual avg. level
(1995–2003)
Annual avg. change (1995–2003) 2003
Annual avg. level
(2003–2008)
Annual avg. change (2003–2008)
Annual avg. level
(2008–2014)
Annual avg. change (2008–2014)
Annual avg. level
(2014-2019)
Annual avg. change (2014-2019) 2019
Africa 36.3 -1.5 34.0 32.5 -1.7 29.0 -1.8 26.1 -1.7 25.2
Central 43.2 -1.3 40.9 39.5 -1.5 35.8 -1.5 32.8 -1.6 31.8
Eastern 45.9 -1.9 42.1 39.8 -2.2 34.7 -2.3 30.3 -2.3 28.9
Northern 15.9 -1.1 15.1 14.7 -1.1 13.7 -1.1 12.9 -1.0 12.6
Southern 38.5 -1.6 35.9 34.4 -2.0 30.2 -2.1 26.5 -2.3 25.3
Western 39.4 -1.5 36.7 35.1 -1.7 31.3 -1.7 28.4 -1.4 27.7
Less favorable agriculture conditions 49.9 -1.8 46.0 43.6 -2.1 38.1 -2.1 33.7 -2.0 32.4
More favorable agriculture conditions 46.6 -1.8 42.9 40.7 -2.1 35.5 -2.3 31.1 -2.3 29.7
Mineral-rich countries 47.3 -1.3 44.6 43.0 -1.5 38.6 -1.4 35.5 -1.3 34.7
Lower middle-income countries 32.3 -1.3 30.3 29.1 -1.5 26.3 -1.6 24.0 -1.4 23.4
Upper middle-income countries 19.3 -1.7 18.1 17.6 -2.1 15.3 -1.9 13.7 -2.3 13.0
CEN-SAD 32.9 -1.3 31.1 29.9 -1.4 27.2 -1.4 25.0 -1.3 24.4
COMESA 38.0 -1.5 35.4 33.7 -1.8 30.1 -2.0 26.8 -2.0 25.8
EAC 35.3 -1.3 33.0 31.5 -1.7 28.2 -1.7 25.5 -1.5 24.9
ECCAS 50.8 -2.0 46.4 43.6 -2.4 37.3 -2.6 32.0 -2.6 30.3
ECOWAS 39.4 -1.5 36.7 35.1 -1.7 31.3 -1.7 28.4 -1.4 27.7
IGAD 47.1 -2.1 42.9 40.2 -2.4 34.4 -2.7 29.4 -2.7 27.9
SADC 39.4 -1.5 36.9 35.5 -1.7 31.7 -1.8 28.4 -1.9 27.4
UMA 15.8 -1.9 14.6 14.0 -2.4 11.9 -1.9 10.6 -1.9 10.2
CAADP Compact 2007-09 (CC1) 32.9 -1.6 30.6 29.1 -1.9 26.9 -2.3 23.5 -2.1 22.0
CAADP Compact 2010-12 (CC2) 33.7 -1.5 31.5 30.2 -1.8 28.0 -2.1 24.7 -2.1 23.2
CAADP Compact 2013-15 (CC3) 15.3 -1.4 14.5 14.0 -1.7 13.1 -1.7 11.9 -1.5 11.4
CAADP Compact not yet (CC0) 45.9 -2.2 41.5 38.7 -2.7 34.6 -3.3 28.2 -3.3 25.5
CAADP Level 0 (CL0) 15.3 -1.4 14.5 14.0 -1.7 12.7 -1.4 12.3 1.2 12.6
CAADP Level 1 (CL1) 32.6 -1.4 30.8 29.7 -1.5 26.8 -1.6 29.6 7.9 33.9
CAADP Level 2 (CL2) 16.4 -1.8 15.1 14.2 -2.5 12.0 -2.6 18.7 26.2 26.7
CAADP Level 3 (CL3) 40.4 -1.4 37.8 36.0 -1.8 32.1 -1.8 30.3 0.7 30.8
CAADP Level 4 (CL4) 42.6 -1.8 39.2 37.1 -2.0 32.5 -2.1 28.7 -2.0 27.6
NAIP00 (N00) 19.7 -1.9 18.2 17.2 -2.0 15.9 -2.4 13.7 -2.4 12.8
NAIP10 (N10) 22.0 -1.6 20.5 19.4 -2.0 18.0 -2.3 15.7 -2.0 14.8
NAIP11 (N11) 49.1 -1.7 45.3 43.0 -2.0 39.5 -2.5 30.2 -11.5 15.9
Source: ReSAKSS based on Welthungerhilfe (WHH) and Concern Worldwide (2019), World Bank (2020), and ILO (2020).

2020 ReSAKSS Annual Trends and Outlook Report 269
ReferencesARRANGED BY CHAPTER

270 resakss.org
Chapter 1AGRA (Alliance for a Green Revolution in Africa).
2019. The Hidden Middle: A Quiet Revolution in the Private Sector Driving Agricultural Transformation. Africa Agriculture Status Report Issue 7. Nairobi: AGRA.
Byerlee, D., A. Garcia, A. Giertz, and V. Palmade. 2013. Growing Africa: Unlocking the Potential of Agribusiness. Washington, DC: World Bank.
Demmler, K. M. 2020. “The Role of Small and Medium-Sized Enterprises in Nutritious Food Supply Chains in Africa.” GAIN Working Paper Series Number 2, Global Alliance for Improved Nutrition, Geneva.
Diao, X., P. Hazell, and J. Thurlow. 2010. “The Role of Agriculture in African Development.” World Development 38 (10): 1375–1383.
Diao, X., and M. McMillan. 2018. “Toward an Understanding of Economic Growth in Africa: A Reinterpretation of the Lewis Model.” World Development 109: 511–522.
FAO (Food and Agriculture Organization of the United Nations). 2020. Food Outlook: Biannual Report on Global Food Markets—June 2020. Rome.
Gálvez Nogales, E., and M. Webber, eds. 2017. Territorial Tools for Agro-industry Development: A Sourcebook. Rome: FAO.
Geopoll. 2020. “Report: Coronavirus in Sub-Saharan Africa.” March 17. https://www.geopoll.com/blog/coronavirus-africa/.
IFAD (International Fund for Agricultural Development). 2016. Rural Development Report 2016: Fostering Inclusive Rural Transformation. Rome.
Kosec, K., H. Ghebru, B. Holtemeyer, V. Mueller, and E. Schmidt. 2018. “The Effect of Land Access on Youth Employment and Migration Decisions: Evidence from Rural Ethiopia.” American Journal of Agricultural Economics 100 (3): 931–954.
Morgan, S. N., N. M. Mason, N. K. Levine, and O. Zulu-Mbata. 2019. “Dis-incentivizing Sustainable Intensification? The Case of Zambia’s Maize-Fertilizer Subsidy Program.” World Development 122: 54–69.
Mueller, V., and J. Thurlow, eds. 2019. Youth and Jobs in Rural Africa: Beyond Stylized Facts. Washington, DC: IFPRI.
Picard, F., M. Coulibaly, and C. Smaller. 2017. The Rise of Agricultural Growth Poles in Africa. Investment in Agriculture Policy Brief No. 6. Winnipeg, Canada: International Institute for Sustainable Development.
Pingali, P. 2015. “Agricultural Policy and Nutrition Outcomes—Getting Beyond the Preoccupation with Staple Grains.” Food Security 7 (3): 583–591.
Porteous, O. 2017. “Empirical Effects of Short-Term Export Bans: The Case of African Maize.” Food Policy 71: 17–26.
Quisumbing, A., R. Meinzen-Dick, and J. Njuki. 2019. Gender Equality in Rural Africa: From Commitments to Outcomes. Annual Trends and Outlook Report 2019. Washington, DC: IFPRI.
Schulz, N. 2020. “The Politics of Export Restrictions: A Panel Data Analysis of African Commodity Processing Industries.” World Development 130: 104904.
Technoserve. 2020. Food Processing in a Pandemic: Challenges and Responses for Africa’s Food
Processors Facing COVID-19. Updated April 15. Arlington, VA. https://www.technoserve.org/resources/challenges-and-responses-for-africas-food-processors-facing-covid-19/.
Resnick, D., S. Haggblade, T. Benson, and E. Crawford. 2019. Synthesis Report I: Advancing Research, Policy, and Capacity for Food System Transformation—Synthesis of Achievements from the Feed the Future Innovation Lab for Food Security Policy. East Lansing, MI, and Washington, DC: Michigan State University and IFPRI.
Chapter 2Abramovitz, M. 1986. “Catching Up, Forging Ahead,
and Falling Behind.” Journal of Economic History 46 (2): 385–406.
AfricaFertilizer.org. 2019. “Burundi.” Accessed March 30, 2020. https://africafertilizer.org/burundi/#tab-id-4.
Alfa Shaban, A. R. 2019. “Cashew Pileup Burdens Tanzania Govt after Unilateral Purchase.” Africa News, February 22.
Anderson, K. 2010. “Krueger, Schiff, and Valdés Revisited: Agricultural Price and Trade Policy Reform in Developing Countries since 1960.” Applied Economic Perspectives and Policy 32 (2): 195–231.
Anderson, K., M. Kurzweil, W. Martin, D. Sandri, and E. Valenzuela. 2008. “Measuring Distortions to Agricultural Incentives, Revisited.” World Trade Review 7:675–704.
Anderson, K., and A. Valdés, eds. 2008. Distortions to Agricultural Incentives in Latin America. Washington, DC: World Bank.
2020 ReSAKSS Annual Trends and Outlook Report 271
Artadi, E. V., and X. Sala-i-Martin. 2003. “The Economic Tragedy of the XXth Century: Growth in Africa.” NBER Working Paper 9865, National Bureau of Economic Research, Cambridge, MA.
Awoyinfa, S., I. Chiedozie, and A. Okon. 2019. “NECA, LCCI Fault Buhari’s Directive on Food Importation.” Punch. August 15.
Badiane, O. 2000. “The Effects of Liberalization on Food Markets in Africa.” In Agricultural Markets Beyond Liberalization, edited by A. van Tilburg, H. A. J. Moll, and A. Kuyvenhoven, 135–158. Boston: Springer.
Badiane, O., S. Benin, and T. Makombe. 2016. “Strengthening the Continental Agricultural Agenda and Accountability Framework: The Road from Maputo to Malabo.” In Africa Agriculture Status Report 2016: Progress Towards Agricultural Transformation in Africa, 24–47. Nairobi: Alliance for a Green Revolution in Africa.
Badiane, O., and J. Collins. 2020. “Strengthening National Institutions for Tangible and Sustainable Impacts at Scale.” In Inclusive Growth: Making Value Chains Work for Smallholder Farmers, edited by Islamic Development Bank Group. Jeddah: Islamic Development Bank, forthcoming.
Badiane, O., J. Collins, X. Diao, and J. Ulimwengu. 2015. “Economic Recovery in Africa and Its Determinants.” In Beyond a Middle Income Africa: Transforming African Economies for Sustained Growth with Rising Employment and Incomes. 2014 ReSAKSS Annual Trends and Outlook Report, edited by O. Badiane and T. Makombe, 75–106. Washington, DC: IFPRI.
Badiane, O., and M. Gaye. 1999. “Liberalization of Groundnut Markets in Senegal: Impact
on the Marketing and Processing Sectors.” Unpublished, IFPRI, Washington, DC.
Badiane, O., F. Goletti, M. Kherallah, P. Berry, K. Govindan, P. Gruhn, and M. Mendoza. 1997. Agricultural Input and Output: Marketing Reforms in African Countries. Washington, DC: IFPRI.
Badiane, O., and S. Kinteh. 1994. Trade Pessimism and Regionalism in African Countries: The Case of Groundnut Exporters. IFPRI Research Report 97. Washington, DC: IFPRI.
Badiane, O., and T. Makombe. 2015. “Agriculture, Growth, and Development in Africa: Theory and Practice.” In The Oxford Handbook of Africa and Economics. Vol. 2, edited by C. Monga and J. Y. Lin, 307–324. Oxford, UK: Oxford University Press.
Badiane, O., and M. McMillan. 2015. “Economic Transformation in Africa: Patterns, Drivers, and Implications for Future Growth Strategies.” In Beyond a Middle Income Africa: Transforming African Economies for Sustained Growth with Rising Employment and Incomes. 2014 ReSAKSS Annual Trends and Outlook Report, edited by O. Badiane and T. Makombe, 107–132. Washington, DC: IFPRI.
Baliño, S., D. Laborde, S. Murphy, M. Parent, C. Smaller, and F. Traoré. 2019. Agricultural Bias in Focus. Winnipeg, Canada: International Institute for Sustainable Development.
Barro, R. J., and X. Sala-i-Martin. 1990. “Economic Growth and Convergence across the United States.” NBER Working Paper 3419, National Bureau of Economic Research, Cambridge, MA.
Baumol, W. J. 1986. “Productivity Growth, Convergence, and Welfare: What the Long-Run
Data Show.” American Economic Review 76 (5): 1072–1085.
Bautista, R. 1990. “Price and Trade Policies for Agricultural Development.” The World Economy (13) 1: 89–109.
Benin, S. 2018. “From Maputo to Malabo: How Has CAADP Fared?” ReSAKSS Working Paper 40, IFPRI, Washington, DC, and Dakar.
Benin, S., A. Nin Pratt, S. Wood, and Z. Guo. 2011. Trends and Spatial Patterns in Agricultural Productivity in Africa, 1961–2010. ReSAKSS Annual Trends and Outlook Report 2011. Washington, DC: IFPRI.
Berhane, G., and K. Hirvonen. 2018. “Designing Social Protection Programs.” In Boosting Growth to End Hunger by 2025: The Role of Social Protection. 2017–2018 ReSAKSS Annual Trends and Outlook Report, edited by F. Wouterse and A. S. Taffesse, 154–160. Washington, DC: IFPRI.
Block, S. 2010. “The Decline and Rise of Agricultural Productivity in Sub-Saharan Africa since 1961.” NBER Working Paper 16481, National Bureau of Economic Research, Cambridge, MA.
Bouët, A., and D. Laborde. 2020. “COVID-19 Border Policies Create Problems for African Trade and Economic Pain for Communities.” IFPRI Blog, May 12.
Busse, M., C. Erdogan, and H. Mühlen. 2016. “China’s Impact on Africa—the Role of Trade, FDI and Aid.” KYKLOS 69 (2): 228–262.
Chisanga, B., M. Subakanya, and M. Makungwe. 2018. “Getting It Right: How to Make Grain Trade Work for Zambia.” IAPRI Working Paper 144, Indaba Agricultural Policy Research Institute, Lusaka, Zambia.

272 resakss.org
Christopher, K. M. T. 2019. “Declaration of Vanilla Harvesting Dates.” Uganda Media Centre, May 21.
Clemens, M. A., S. Radelet, R. R. Bhavnani, and S. Bazzi. 2012. “Counting Chickens When They Hatch: Timing and the Effects of Aid on Growth.” Economic Journal 122 (561): 590–617.
Conway, G., O. Badiane, and K. Glatzel. 2019. Food for All in Africa: Sustainable Intensification for African Farmers. Ithaca, NY, and London: Cornell University Press.
De Pinto, A., and J. M. Ulimwengu, eds. 2017. A Thriving Agricultural Sector in a Changing Climate: Meeting Malabo Declaration Goals through Climate-Smart Agriculture. ReSAKSS Annual Trends and Outlook Report 2016. Washington, DC: IFPRI.
Deason, L., D. Laborde, N. Minot, S. Rashid, and M. Torero. 2014. “Food Price Volatility: Effects and Response Mechanisms in Africa.” In Promoting Agricultural Trade to Enhance Resilience in Africa. 2013 ReSAKSS Annual Trends and Outlook Report, edited by O. Badiane, T. Makombe, and G. Bahiigwa, 18–37. Washington, DC: IFPRI.
Dembélé, N. N., and J. M. Staatz. 1999. “The Impact of Market Reform on Agricultural Transformation in Mali.” MSU Agricultural Economics Staff Paper 99-29, Michigan State University, East Lansing, MI.
Devarajan, S., and S. Shetty. 2010. Africa: Leveraging the Crisis into a Development Takeoff. Economic Premise 30. Washington, DC: World Bank.
Drummond, P., and E. X. Liu. 2015. “Africa’s Rising Exposure to China: How Large Are Spillovers through Trade?” International Advances in Economic Research 21 (3): 317–334.
Easterly, W. 2003. “IMF and World Bank Structural Adjustment Programs and Poverty.” In Managing Currency Crises in Emerging Markets, edited by M. P. Dooley and J. A. Frankel, 361–392. Chicago: University of Chicago Press.
Easterly, W., and R. Levine. 1997. “Africa’s Growth Tragedy: Policies and Ethnic Divisions.” Quarterly Journal of Economics 112: 1203–1250.
Edwards, L., and R. Jenkins. 2014. “The Margins of Export Competition: A New Approach to Evaluating the Impact of China on South African Exports to Sub-Saharan Africa.” Journal of Policy Modeling 36 (1): S132–S150.
Food Business Africa.com. 2019. “Kenyan Lobbies Oppose Draft Rules on Food and Horticulture Crops.” July 25.
Fuglie, K., and N. Rada. 2013. Resources, Policies, and Agricultural Productivity in Sub-Saharan Africa. Economic Research Report 145. Washington, DC: Economic Research Service, US Department of Agriculture.
Hollinger, F., and J. Staatz. 2015. Agricultural Growth in West Africa: Market and Policy Drivers. Rome: Food and Agriculture Organization of the United Nations, African Development Bank, and Economic Community of West African States.
Horwitz, F. 2005. “HR CAN Competitiveness Advance.” Executive Business Brief 10: 50–52.
Jayne, T. S., J. Govereh, A. Mwanaumo, J. K. Nyoro, and A. Chapoto. 2002. “False Promise or False Premise? The Experience of Food and Input Market Reform in Eastern and Southern Africa.” World Development 30 (11): 1967–1985.
Jayne, T. S., and S. Jones. 1997. “Food Marketing and Pricing Policy in Eastern and Southern Africa: A
Survey.” World Development 25 (9): 1505–1527.
Jones, W. O. 1987. “Food-Crop Marketing Boards in Tropical Africa.” The Journal of Modern African Studies 25 (3): 375–402.
Kaufmann, D., A. Kraay, and M. Mastruzzi. 2010. “The Worldwide Governance Indicators: Methodology and Analytical Issues.” Policy Research Working Paper 5430, World Bank, Washington, DC.
Kherallah, M., C. Delgado, E. Gabre-Madhin, N. Minot, and M. Johnson. 2002. Reforming Agricultural Markets in Africa. Baltimore: Johns Hopkins University Press.
Khodeir, A.-N. 2016. “The Impact of Chinese Direct Investments on Employment in Africa.” Journal of Chinese Economic and Foreign Trade Studies 9 (2): 86–101.
Krueger, A. O., M. Schiff, and A. Valdés. 1988. “Agricultural Incentives in Developing Countries: Measuring the Effect of Sectoral and Economywide Policies.” The World Bank Economic Review 2 (3): 255–271.
Leszczensky, L., and T. Wolbring. 2019. “How to Deal with Reverse Causality Using Panel Data? Recommendations for Researchers Based on a Simulation Study.” Sociological Methods & Research 2019: 1–29.
Lucas, R. E. 1988. “On the Mechanics of Economic Development.” Journal of Monetary Economics 22: 3–42.
Lusaka Times. 2018. “Zambia Puts Restriction on Maize Exports.” October 17.
Makombe, T., and J. Collins. 2018. “Malawi’s Agriculture Joint Sector Review: Fostering Mutual Accountability and Guiding Policy Reform.” Agrilinks blog, June 25.
Chapter 2 References continued

2020 ReSAKSS Annual Trends and Outlook Report 273
Makombe, T., and J. Kurtz. 2020. “Second Biennial Review Report Highlights Urgent Need to Accelerate Progress toward Achieving Malabo Declaration Goals by 2025.” IFPRI blog, February 17.
Makombe, T., W. Tefera, and S. Benin. 2018. “Tracking Key CAADP Indicators and Implementation Processes.” In Boosting Growth to End Hunger by 2025: The Role of Social Protection. ReSAKSS Annual Trends and Outlook Report 2017–2018, edited by F. Wouterse and A. S. Taffesse, 161–177. Washington, DC: IFPRI.
Makombe, T., W. Tefera, and J. Ulimwengu. 2019. “Tracking Key CAADP Indicators and Implementation Processes.” In Gender Equality in Rural Africa: From Commitments to Outcomes. ReSAKSS Annual Trends and Outlook Report 2019, edited by A. Quisumbing, R. Meinzen-Dick, and J. Njuki, 190–206. Washington, DC: IFPRI.
Malabo Montpellier Panel. 2017. Nourished: How Africa Can Build a Future Free from Hunger and Malnutrition. Dakar: IFPRI.
Malabo Montpellier Panel. 2019. Energized: Policy Innovations to Power the Transformation of Africa’s Agriculture and Food System. Dakar: IFPRI.
Mankiw, N. G., D. Romer, and D. N. Weil. 1992. “Contribution to the Empirics of Economic Growth.” The Quarterly Journal of Economics 107 (2): 407–437.
Montiel, P., and L. Servén. 2006. “Macroeconomic Stability in Developing Countries: How Much Is Enough?” The World Bank Research Observer 21 (2): 151–178.
Nnanna, J. 2015. "Is China's Investment in Africa Good
for the Nigerian Economy?" Journal of Chinese Economic and Foreign Trade Studies 8 (1): 40–48.
OAU (Organisation of African Unity). 1980. Lagos Plan of Action for the Economic Development of Africa 1980–2000. Addis Ababa.
Oyejide, T. A. 1986. The Effects of Trade and Exchange Rate Policies on Agriculture in Nigeria. IFPRI Research Report 55. Washington, DC: IFPRI.
Prebisch, R. 1950. The Economic Development of Latin America and Its Principal Problems. Lake Success, NY: United Nations Department of Social Affairs.
Przeworski, A., and J. R. Vreeland. 2000. “The Effect of IMF Programs on Economic Growth.” Journal of Development Economics 62: 385–421.
Reardon, T. 2015. “The Hidden Middle: The Quiet Revolution in the Midstream of Agrifood Value Chains in Developing Countries.” Oxford Review of Economic Policy 31 (1): 45–63.
Republic of Benin. 2019. Décret N. 2019 – 075 du 06 Mars 2019. Cotonou, Benin.
ReSAKSS (Regional Strategic Analysis and Knowledge Support System). 2020. ReSAKSS database. Accessed in March. https://www.resakss.org/node/3.
Resnick, D. 2020. “Covid-19 Lockdowns Threaten Africa’s Vital Informal Urban Food Trade.” IFPRI blog, March 31.
Romer, P. 1990. “Human Capital and Growth: Theory and Evidence.” Carnegie Rochester Conference Series on Public Policy 32: 251–286.
Roseboom, J., and K. Flaherty. 2016. “The Evolution of Agricultural Research in Africa: Key Trends and Institutional Developments.” In Agricultural
Research in Africa: Investing in Future Harvests, edited by J. Lynam, N. Beintema, J. Roseboom, and O. Badiane, 31–58. Washington, DC: IFPRI.
Sachs, J., and A. Warner. 1995. “Economic Convergence and Economic Policies.” NBER Working Paper 5039, National Bureau of Economic Research, Cambridge, MA .
Sahara Reporters New York. 2019. “Nigeria Places Full Ban on Importation of Goods through Land Borders.” October 14.
Siggel, E. 2000. “Uganda’s Policy Reforms, Competitiveness and Regional Integration Industry: A Comparison with Kenya.” African Economic Policy Discussion Paper 24, Bureau for Africa, United States Agency for International Development, Washington, DC.
———. 2001. “India’s Trade Policy Reforms and Competitiveness Industry in the 1980s.” World Economy 24 (2): 159–183.
Singer, H. W. 1950. “The Distribution of Gains between Investing and Borrowing Countries.” American Economic Review 40 (2): 473–485.
Sonobe, T., and K. Otsuka. 2011. Cluster-Based Industrial Development: A Comparative Study of Asia and Africa. New York: Palgrave Macmillan.
Tanzi, V. 1989. “Fiscal Policy, Growth, and the Design of Stabilization Programs.” In Fiscal Policy, Stabilization, and Growth in Developing Countries, edited by M. I. Blejer and K. Chu, 13–32. Washington, DC: International Monetary Fund.
The Citizen. 2018. “Tanzanian Cashew Nut Dealers Suffer as Magufuli Deploys Army.” Business Daily, November 14.

274 resakss.org
Tsakok, I. 2011. Success in Agricultural Transformation: What It Means and What Makes It Happen. Cambridge, UK: Cambridge University Press.
Tshibaka, T. 1986. The Effects of Trade and Exchange Rate Policies on Agriculture in Zaire. IFPRI Research Report 55. Washington, DC: IFPRI.
UNECA (United Nations Economic Commission for Africa). 1991. Appraisal and Review of the Impact of the Lagos Plan of Action on the Development and Expansion of Intra-African Trade. Addis Ababa.
UNDP (United Nations Development Programme). 2020. Human Development Data (1990–2018) database. Accessed in March. http://hdr.undp.org/en/data.
World Bank. 2006. Global Monitoring Report 2006: Millennium Development Goals—Strengthening Mutual Accountability, Aid, Trade, and Governance. Washington, DC: World Bank.
World Bank. 2020a. PovcalNet database. Accessed in March. http://iresearch.worldbank.org/PovcalNet/povOnDemand.aspx.
World Bank. 2020b. World Development Indicators database. Accessed in March. https://databank.worldbank.org/source/world-development-indicators#.
Yu, B., and A. Nin-Pratt. 2011. “Agricultural Productivity and Policies in Sub-Saharan Africa.” IFPRI Discussion Paper 1150, IFPRI, Washington, DC.
Zhang, J., I. Alon, and Y. Chen. 2014. “Does Chinese Investment Affect Sub-Saharan African Growth?” International Journal of Emerging Markets 9 (2): 257–275.
Chapter 3Abate, T., M. Fisher, T. Abdoulaye, G. T. Kassie, R.
Lunduka, P. Marenya, and W. Asnake. 2017. “Characteristics of Maize Cultivars in Africa: How Modern Are They and How Many Do Smallholder Farmers Grow?” Agriculture and Food Security 6: 1–17.
Alemu, D. 2011. “The Political Economy of Ethiopian Cereal Seed Systems: State Control, Market Liberalisation and Decentralisation.” IDS Bulletin 42 (4): 69–77.
Amanor, K. S. 2011. “From Farmer Participation to Pro-poor Seed Markets: The Political Economy of Commercial Cereal Seed Networks in Ghana.” IDS Bulletin 42 (4): 48–58.
Atlin, G. N., J. E. Cairns, and B. Das. 2017. “Rapid Breeding and Varietal Replacement Are Critical to Adaptation of Cropping Systems in the Developing World to Climate Change.” Global Food Security 12: 31–37.
Barriga, A., and N. Fiala. 2020. “The Supply Chain for Seed in Uganda: Where Does It Go Wrong?” World Development 130: 104928.
Beintema, N., and G. J. Stads. 2017. A Comprehensive Overview of Investments and Human Resource Capacity in African Agricultural Research. ASTI Synthesis Report. Washington, DC: IFPRI.
Bold, T., K. C. Kaizzi, J. Svensson, and D. Yanagizawa-Drott. 2017. “Lemon Technologies and Adoption: Measurement, Theory, and Evidence from Agricultural Markets in Uganda.” Quarterly Journal of Economics 132: 1055–1100.
Buruchara, R., R. Chirwa, L. Sperling, C. Mukankusi, J. C. Rubyogo, R. Muthoni, and M. M. Abang. 2011. “Development and Delivery of Bean Varieties in Africa: The Pan-Africa Bean
Research Alliance (PABRA) Model.” African Crop Science Journal 19 (4): 227–245.
Chirwa, E., and A. Dorward. 2013. Agricultural Input Subsidies: Recent Malawi Experience. Oxford: Oxford University Press.
De Jonge, B., and P. Munyi. 2017. “Creating Space for ‘Informal’ Seed Systems in a Plant Variety Protection System That Is Based on UPOV 1991.” KIT Working Paper 2017-7, KIT Royal Tropical Institute, Amsterdam.
FAO (Food and Agriculture Organization of the United Nations). 2006. Quality Declared Seed System. FAO Plant Production and Protection Paper 185. Rome.
Gildemacher, P. R., E. Schulte-Geldermann, D. Borus, P. Demo, P. Kinyae, P. Mundia, and P. C. Struik. 2011. “Seed Potato Quality Improvement through Positive Selection by Smallholder Farmers in Kenya.” Potato Research 54: 253–266.
Glennerster, R., and T. Suri. 2015. What Is the Impact of NERICA Rice on Yields and Nutrition in Sierra Leone? Evidence from a Randomized Control Trial. Rome: CGIAR Standing Panel on Impact Assessment.
Hassena, M., O. Hospes, and B. De Jonge. 2016. “Reconstructing Policy Decision-Making in the Ethiopian Seed Sector: Actors and Arenas Influencing Policymaking Process.” Public Policy and Administration Research 6 (2): 84–95.
Herpers, S., R. Vodouhe, M. Halewood, and B. De Jonge. 2017. “The Support for Farmer-led Seed Systems in African Seed Laws.” KIT Working Paper 2017-9, KIT Royal Tropical Institute, Amsterdam.
Holden, S., and M. Fisher. 2015. “Subsidies Promote Use of Drought Tolerant Maize Varieties Despite
Chapter 2 References continued

2020 ReSAKSS Annual Trends and Outlook Report 275
Variable Yield Performance under Smallholder Environments in Malawi.” Food Security 7: 1225–1238.
ISAAA (International Service for the Acquisition of Agri-Biotech Applications). 2018. Global Status of Commercialized Biotech/GM Crops in 2018: Biotech Crops Continue to Help Meet the Challenges of Increased Population and Climate Change. ISAAA Brief No. 54. Ithaca, NY.
ISSD (Integrated Seed Systems Development) Uganda. 2019. Integrated Seed Systems Development Uganda Programme. Accessed January 15, 2020. https://issduganda.org/.
Jinnah, S., and S. Jungcurt. 2009. “Could Access Requirements Stifle Your Research?” Science 323 (5913): 464–465.
Joughin, J. 2014. “The Political Economy of Seed Reform in Uganda: Promoting a Regional Seed Trade Market.” Africa Trade Practice Working Paper Series 3, World Bank, Washington, DC.
Kassie, G. T., O. Erenstein, W. Mwangi, J. MacRobert, P. Setimela, and B. Shiferaw. 2013. “Political and Economic Features of the Maize Seed Industry in Southern Africa.” Agrekon 52 (2): 104–127.
Keyser, J. C., M. Eilittä, G. Dimithe, G. Ayoola, and L. Sène. 2015. Towards an Integrated Market for Seeds and Fertilizers in West Africa. Washington, DC: World Bank.
Maredia, M. K., B. A. Reyes, J. A. Manu-Aduening, A. A. Dankyi, P. Hamazakaza, K. Muimui, I. Rabbi, et al. 2016. “Testing Alternative Methods of Varietal Identification Using DNA Fingerprinting: Results of Pilot Studies in Ghana and Zambia.” International Development Working Papers 246950, Michigan State University, East Lansing, MI.
Mason, N. M., and J. Ricker-Gilbert. 2013. “Disrupting Demand for Commercial Seed: Input Subsidies in Malawi and Zambia.” World Development 45: 75–91.
Mason, N. M., and M. Smale. 2013. “Impacts of Subsidized Hybrid Seed on Indicators of Economic Well-Being among Smallholder Maize Growers in Zambia.” Agricultural Economics 44 (6): 659–670.
Muthoni, J. J., H. Shimelis, and R. Melis. 2013. “Potato Production in Kenya: Farming Systems and Production Constraints.” Journal of Agricultural Science 5 (5): 182.
Naseem, A., D. J. Spielman, and S. W. Omamo. 2010. “Private-Sector Investment in R&D: A Review of Policy Options to Promote Its Growth in Developing-Country Agriculture.” Agribusiness 2 (1): 143–173.
Odame, H., and E. Muange. 2011. “Can Agro-dealers Deliver the Green Revolution in Kenya?” IDS Bulletin 42 (4): 78–89.
Okello, J. J., Y. Zhou, N. Kwikiriza, S. Ogutu, I. Barker, E. Schulte-Geldermann, E. Atieno, and J. T. Ahmed. 2017. “Productivity and Food Security Effects of Using of Certified Seed Potato: The Case of Kenya’s Potato Farmers.” Agriculture and Food Security 6 (1): 25.
Rutsaert, P., and J. Donovan. 2020. “Sticking with the Old Seed: Input Value Chains and the Challenges to Deliver Genetic Gains to Smallholder Maize Farmers.” Outlook on Agriculture 49 (1): 39–49.
Schulte-Geldermann, E., P. R. Gildemacher, and P. C. Struik. 2012. “Improving Seed Health and Seed Performance by Positive Selection in Three Kenyan Potato Varieties.” American Journal of
Potato Research 89 (6): 429–437.
Scoones, I., and J. Thompson. 2011. “The Politics of Seed in Africa’s Green Revolution: Alternative Narratives and Competing Pathways.” IDS Bulletin 42 (4): 1–23.
Sheahan, M., and C. B. Barrett. 2017. “Ten Striking Facts about Agricultural Input Use in Sub-Saharan Africa.” Food Policy 67: 12–25.
Spielman, D. J., and A. Kennedy. 2016. “Towards Better Metrics and Policymaking for Seed System Development: Insights from Asia’s Seed Industry.” Agricultural Systems 147: 111–122.
Spielman, D. J., and X. Ma. 2016. “Private Sector Incentives and the Diffusion of Agricultural Technology: Evidence from Developing Countries.” Journal of Development Studies 52 (5): 696–717.
Spielman, D. J., and M. Smale. 2017. “Policy Options to Accelerate Varietal Change among Smallholder Farmers in South Asia and Africa South of the Sahara.” IFPRI Discussion Paper 01666, International Food Policy Research Institute, Washington, DC.
Uganda, Ministry of Agriculture, Animal Husbandry and Fisheries. 2018. National Seed Policy. Kampala.
Walker, T. S., and J. Alwang, eds. 2015. Crop Improvement, Adoption, and Impact of Improved Varieties in Food Crops in Sub-Saharan Africa. Wallingford, UK: CABI.
Welch, E. W., E. Shin, and J. Long. 2013. “Potential Effects of the Nagoya Protocol on the Exchange of Non-plant Genetic Resources for Scientific Research: Actors, Paths, and Consequences.” Ecological Economics 86: 136–147.

276 resakss.org
Wineman, A., T. Njagi, C. L. Anderson, T. W. Reynolds, D. Y. Alia, P. Wainaina, E. Njue, P. Biscaye, and M. W. Ayieko. 2020. “A Case of Mistaken Identity? Measuring Rates of Improved Seed Adoption in Tanzania Using DNA Fingerprinting.” Journal of Agricultural Economics. DOI: 10.1111/1477-9552.12368.
Wossen, T., T. Abdoulaye, A. Alene, P. Nguimkeu, S. Feleke, I. Y. Rabbi, M. G. Haile, and V. Manyong. 2019. “Estimating the Productivity Impacts of Technology Adoption in the Presence of Misclassification.” American Journal of Agricultural Economics 101 (1): 1–16.
Yirga, C., K. Negisho, L. Oruko, D. Alemu, and G. Taxler. 2016. Tracking the Diffusion of Crop Varieties Using DNA Fingerprinting. EIAR Research Report 112. Addis Ababa: Ethiopian Institute of Agricultural Research.
Chapter 4Abay, K. A., G. Berhane, A. S. Taffesse, K. Abay,
and B. Koru. 2018. “Estimating Input Complementarities with Unobserved Heterogeneity: Evidence from Ethiopia.” Journal of Agricultural Economics 69 (2): 495–517.
Abay, K. A., G. Blalock, and G. Berhane. 2017. “Locus of Control and Technology Adoption in Developing Country Agriculture: Evidence from Ethiopia.” Journal of Economic Behavior and Organization 143: 98–115.
AGRA (Alliance for a Green Revolution in Africa). 2019. Feeding Africa’s Soils: Fertilizers to Support Africa’s Agricultural Transformation. Nairobi, Kenya.
ASTI. 2020. Statistical database. Accessed April 2020.
https://www.asti.cgiar.org/data.
AUC (African Union Commission). 2006. African Fertilizer Summit Proceedings. Muscle Shoals, AL: International Fertilizer Development Center.
———. 2014. Malabo Declaration on Accelerated Agricultural Growth and Transformation for Shared Prosperity and Improved Livelihoods. Malabo, Equatorial Guinea.
Ayalew, H., J. Chamberlin, and C. Newman. 2020. “Site-Specific Agronomic Information and Technology Adoption: A Field Experiment from Ethiopia.” TEP Working Paper 0620, Trinity College Dublin, University of Dublin, Ireland.
Banful, A. 2011. “Old Problems in the New Solutions? Politically Motivated Allocation of Program Benefits and the ‘New’ Fertilizer Subsidies.” World Development 39 (7): 1166–1176.
Berazneva, J., L. McBride, M. Sheahan, and D. Güereña. 2018. “Empirical Assessment of Subjective and Objective Soil Fertility Metrics in East Africa: Implications for Researchers and Policy Makers.” World Development 105: 367–382.
Berhane, G., C. Ragasa, G. T. Abate, and T. W. Assefa, 2018. “The State of Agricultural Extension Services in Ethiopia and Their Contribution to Agricultural Productivity.” ESSP Working Paper, IFPRI, Washington, DC.
Binswanger-Mkhize, H. P., and S. Savastano. 2017. “Agricultural Intensification: The Status in Six African Countries.” Food Policy 67: 26–40.
Bold, T., K. C. Kaizzi, J. Svensson, and D. Yanagizawa-Drott. 2017. “Lemon Technologies and Adoption: Measurement, Theory and Evidence from Agricultural Markets in Uganda.” Quarterly Journal of Economics 132 (3): 1055–1100.
Burke, W. J., S. J. Thom, and J. R. Black. 2017. “Factors Explaining the Low and Variable Profitability of Fertilizer Application to Maize in Zambia.” Journal of Agricultural Economics 48: 115–126.
Byerlee, D., and C. K. Eicher, eds. 1997. Africa’s Emerging Maize Revolution. Boulder, CO: Lynne Rienner .
Chibwana, C., G. Shively, M. Fisher, C. Jumbe, and W. Masters. 2014. “Measuring the Impacts of Malawi’s Farm Input Subsidy Programme.” African Journal of Agricultural and Resource Economics 9 (2): 132–147.
Conley, T. G., and C. R. Udry. 2010. “Learning about a New Technology: Pineapple in Ghana.” American Economic Review 100 (1): 35–69.
Crawford, E., V. Kelly, T. S. Jayne, and J. Howard. 2003. “Input Use and Market Development in Sub-Saharan Africa: An Overview.” Food Policy 28 (4): 277–292.
Croppenstedt, A., M. Demeke, and M. M. Meschi. 2003. “Technology Adoption in the Presence of Constraints: The Case of Fertilizer Demand in Ethiopia.” Review of Development Economics 7 (1): 58–70.
Davis, K., B. Swanson, D. Amudavi, D. A. Mekonnen, A. Flohrs, J. Riese, C. Lamb, and E. Zerfu. 2010. “In-Depth Assessment of the Public Agricultural Extension System of Ethiopia and Recommendations for Improvement.” IFPRI Discussion Paper 1041, IFPRI, Washington, DC.
Denning, G., P. Kabambe, P. Sanchez, A. Malik, R. Flor, R. Harawa, P. Nkhoma, C. Zamba, C. Banda, C. Magombo, M. Keating, J. Wangila, and J. Sachs. 2009. “Input Subsidies to Improve Smallholder Maize Productivity in Malawi: Toward an African Green Revolution.” PLoS Biology 7 (1):
Chapter 3 References continued

2020 ReSAKSS Annual Trends and Outlook Report 277
e1000023.
Dercon, S., and L. Christiaensen. 2011. “Consumption Risk, Technology Adoption and Poverty Traps: Evidence from Ethiopia.” Journal of Development Economics 96 (2): 159–173.
Dorward, A., and E. Chirwa, E. 2011. “The Malawi Agricultural Input Subsidy Programme: 2005/06 to 2008/09.” International Journal of Agricultural Sustainability 9 (1): 232–247.
Druilhe, Z., and J. Barreiro-Hurlé. 2012. “Fertilizer Subsidies in Sub-Saharan Africa.” ESA Working Paper 12-04, Food and Agriculture Organization of the United Nations, Rome.
Duflo, E., M. Kremer, and J. Robinson. 2008. “How High Are Rates of Return to Fertilizer? Evidence from Field Experiments in Kenya.” American Economic Review 98: 482–488.
———. 2011. “Nudging Farmers to Use Fertilizer: Theory and Experimental Evidence from Kenya.” American Economic Review 101 (6): 2350–2390.
Dugger, C. W. 2007. “Ending Famine, Simply by Ignoring the Experts.” New York Times, December 2.
Eicher, C. K. 1995. “Zimbabwe’s Maize-Based Green Revolution: Preconditions for Replication.” World Development 23 (5): 805–818.
Evenson, R. E. 2001. “Economic Impacts of Agricultural Research and Extension.” In Handbook of Agricultural Economics. Vol. 1, edited by B. L. Gardner and G. C. Rausser, 573–628. Amsterdam: Elsevier.
Evenson, R. E., and D. Gollin. 2003. “Assessing the Impact of the Green Revolution, 1960 to 2000.” Science 300 (5620): 758–762.
Fairbairn, A. M. 2017. “Are They Lemons? Unobservable Quality, Information, and Mineral Fertilizer Demand.” Master’s thesis, University of Illinois at Urbana-Champaign.
Fan, S., P. B. Hazell, and S. Thorat. 1999. Linkages between Government Spending, Growth, and Poverty in Rural India. Research Report 110. Washington, DC: IFPRI.
FAO (Food and Agriculture Organization of the United Nations). 2020. FAOSTAT database. Accessed April 2020. www.fao.org/faostat/en/#data.
Foster, A. D., and M. R. Rosenzweig. 2010. “Microeconomics of Technology Adoption.” Annual Review of Economics 2 (1): 395–424.
Giné, X., and D. Yang. 2009. “Insurance, Credit, and Technology Adoption: Field Experimental Evidence from Malawi.” Journal of Development Economics 89 (1): 1–11.
Gourlay, S., E. Aynekulu, K. Shepherd, and C. Carletto. 2017. “Collecting the Dirt on Soils: Advancements in Plot-Level Soil Testing and Implications for Agricultural Statistics.” Policy Research Working Paper 8057, World Bank, Washington, DC.
Harou, A. P., M. Madajewicz, C. Magomba, H. Michelson, K. Tschirhart, N. Amuri, and C. Palme. 2018. “Can Information Improve Investment? Effects of Site-Specific Soil Recommendations on Fertilizer Demand.” Working paper, McGill University, Montreal.
Henao, J., and C. Baanante. 2006. Agricultural Production and Soil Nutrient Mining in Africa: Implications for Resource Conservation and Policy Development. Muscle Shoals, AL: International Fertilizer Development Center.
Holden, S. T. 2019. “Fertilizer and Sustainable Intensification in Africa.” CLTS Working Papers 1/18, Centre for Land Tenure Studies, Norwegian University of Life Sciences, Ås, Norway.
Holden, S., and R. Lunduka. 2012. “Do Fertilizer Subsidies Crowd Out Organic Manures? The Case of Malawi.” Agricultural Economics 43 (3): 303–314.
IFDC (International Fertilizer Development Center). 2015. Developing Competitive Fertilizer Markets in Africa: Policy Lessons from FTF Country Assessments. Background paper. Muscle Shoals, AL.
Jayne, T. S., J. Govereh, A. Mwanaumo, J. K. Nyoro, and A. Chapoto. 2002. “False Promise or False Premise? The Experience of Food and Input Market Reform in Eastern and Southern Africa.” World Development 30 (11): 1967–1985.
Jayne, T. S., J. Govereh, M. Wanzala, and M. Demeke. 2003. “Fertilizer Market Development: A Comparative Analysis of Ethiopia, Kenya, and Zambia.” Food Policy 28 (4): 293–316.
Jayne, T. S., and S. Jones. 1997. “Food Marketing and Pricing Policy in Eastern and Southern Africa: A Survey.” World Development 25 (9): 1505–1527.
Jayne, T. S., N. M. Mason, W. J. Burke, and J. Ariga. 2018. “Review: Taking Stock of Africa’s Second-Generation Agricultural Input Subsidy Programs.” Food Policy 75: 1–14.
Jayne, T. S., D. Mather, N. Mason, and J. Ricker-Gilbert. 2013. “How Do Fertilizer Subsidy Programs Affect Total Fertilizer Use in Sub-Saharan Africa? Crowding Out, Diversion, and Benefit/Cost Assessments.” Agricultural Economics 44 (6): 687–703.

278 resakss.org
Jayne, T. S., and S. Rashid. 2013. “Input Subsidy Programs in Sub-Saharan Africa: A Synthesis of Recent Evidence.” Agricultural Economics 44 (6): 547–562.
Johnson, D. G. 2000. “Population, Food, and Knowl-edge.” American Economic Review 90 (1): 1–14.
Karlan, D., R. Osei, I. Osei-Akoto, and C. Udry. 2014. “Agricultural Decisions after Relaxing Credit and Risk Constraints.” Quarterly Journal of Economics 129 (2): 597–652.
Kassie, M., J. Pender, M. Yesuf, G. Kohlin, R. Bluffstone, and E. Mulugeta. 2008. “Estimating Returns to Soil Conservation Adoption in the Northern Ethiopian Highlands.” Agricultural Economics 38: 213–232.
Kelly, V., and E. Crawford, E. 2007. Policies and Actions to Stimulate Private Sector Fertilizer Marketing in Sub-Saharan Africa. Rome: FAO.
Kihara, J., G. Nziguheba, S. Zingore, A. Coulibaly, A. Esilaba, V. Kabambe, S. Njoroge, C. Palm, and J. Huising. 2016. “Understanding Variability in Crop Response to Fertilizer and Amendments in Sub-Saharan Africa.” Agriculture, Ecosystems and Environment 229: 1–12.
Krishnan, P., and M. Patnam. 2014. “Neighbors and Extension Agents in Ethiopia: Who Matters More for Technology Adoption?” American Journal of Agricultural Economics 96 (1): 308–327.
Kurdi, S., M. Mai, K. Abay, and C. Breisinger. 2020. “Too Much of a Good Thing? Evidence that Fertilizer Subsidies Lead to Overapplication in Egypt.” IFPRI MENA RP Working Paper 27, IFPRI, Washington, DC.
Levy, S., ed. 2005. Starter Packs: A Strategy to Fight Hunger in Developing Countries? Lessons from the Malawi Experience 1998–2003. Wallingford,
UK: CAB International.
Liverpool-Tasie, L. S. 2017. “Is Fertilizer Use Inconsistent with Expected Profit Maximization in Sub-Saharan Africa? Evidence from Nigeria.” Journal of Agricultural Economics 68 (1): 22–44.
Lunduka, R., J. Ricker-Gilbert, and M. Fisher. 2013. “What Are the Farm-Level Impacts of Malawi’s Farm Input Subsidy Program? A Critical Review.” Agricultural Economics 44 (6): 563–579.
Marenya, P. P., and C. B. Barrett. 2009. “State-Conditional Fertilizer Yield Response on Western Kenyan Farms.” American Journal of Agricultural Economics 91 (4): 991–1006.
Mason, N. M., and T. S. Jayne. 2013. “Fertiliser Subsidies and Smallholder Commercial Fertiliser Purchases: Crowding Out, Leakage and Policy Implications for Zambia.” Journal of Agricultural Economics 64 (3): 558–582
Mason, N. M., T. S. Jayne, and N. Van De Walle. 2017. “The Political Economy of Fertilizer Subsidy Programs in Africa: Evidence from Zambia.” American Journal of Agricultural Economics 99 (3): 705–731.
Mather, D., I. Minde, B. Waized, D. Ndyetabula, and A. Temu. 2016. The Profitability of Inorganic Fertilizer Use in Smallholder Maize Production in Tanzania: Implications for Alternative Strategies to Improve Smallholder Maize Productivity. Food Security Collaborative Policy Briefs 260437, Department of Agricultural, Food, and Resource Economics, Michigan State University, East Lansing.
Mellor, J. W. 2000. “Faster More Equitable Growth: The Relation Between Growth in Agriculture and Poverty Reduction.” Harvard Institute for
International Development, Cambridge, MA.
Minot, N., and T. Benson. 2009. Fertilizer Subsidies in Africa: Are Vouchers the Answer? IFPRI Issue Brief 60. Washington, DC: IFPRI.
Minten, B., B. Koru, and D. Stifel. 2013. “The Last Mile(s) in Modern Input Distribution: Pricing, Profitability, and Adoption.” Agricultural Economics 44 (6): 629–646.
Morgan, S. N., N. M. Mason, N. K. Levine, and O. Zulu-Mbata. 2019. “Dis-incentivizing Sustainable Intensification? The Case of Zambia’s Maize-Fertilizer Subsidy Program.” World Development 122: 54–69.
Morris, M., V. A. Kelly, R. J. Kopicki, and D. Byerlee. 2007. Fertilizer Use in African Agriculture: Lessons Learned and Good Practice Guidelines. Washington, DC: World Bank.
Moser, C. M., and C. B. Barrett. 2006. “The Complex Dynamics of Smallholder Technology Adoption: The Case of SRI in Madagascar.” Agricultural Economics 35 (3): 373–388.
Murphy, D. M., D. Roobroeck, D. R. Lee, and J. Thies. 2019. “Underground Knowledge: Estimating the Impacts of Soil Information Transfers through Experimental Auctions.” American Journal of Agricultural Economics, forthcoming.
Niyuhire, M. C., P. Pypers, B. Vanlauwe, G. Nziguheba, D. Roobroeck, and R. Merckx. 2017. “Profitability of Diammonium Phosphate Use in Bush and Climbing Bean-Maize Rotations in Smallholder Farms of Central Burundi.” Field Crops Research 212: 52–60.
Pan, L., and L. Christiaensen. 2012. “Who Is Vouching for the Input Voucher? Decentralized Targeting and Elite Capture in Tanzania.” World
Chapter 4 References continued

2020 ReSAKSS Annual Trends and Outlook Report 279
Development 40 (8): 1619–1633.
Ragasa, C., and A. Chapoto. 2017. “Moving in the Right Direction? The Role of Price Subsidies in Fertilizer Use and Maize Productivity in Ghana.” Food Security 9 (2): 329–353.
Ragasa, C., and J. Mazunda. 2018. “The Impact of Agricultural Extension Services in the Context of a Heavily Subsidized Input System: The Case of Malawi.” World Development 105: 25–47.
Rashid, S., P. A. Dorosh, M. Malek, and S. Lemma. 2013. “Modern Input Promotion in Sub‐Saharan Africa: Insights from Asian Green Revolution.” Agricultural Economics 44 (6): 705–721.
Resnick, D., and D. Mather. 2016. “Agricultural Inputs Policy under Macroeconomic Uncertainty: Applying the Kaleidoscope Model to Ghana’s Fertilizer Subsidy Programme (2008–2015).” IFPRI Discussion Paper 1551, IFPRI, Washington, DC.
Ricker-Gilbert, J., and T. S. Jayne. 2017. “Estimating the Enduring Effects of Fertiliser Subsidies on Commercial Fertiliser Demand and Maize Production: Panel Data Evidence from Malawi.” Journal of Agricultural Economics 68 (1): 70–97.
Ricker-Gilbert, J., T. S. Jayne, and E. Chirwa. 2011. “Subsidies and Crowding Out: A Double-Hurdle Model of Fertilizer Demand in Malawi.” American Journal of Agricultural Economics 93 (1): 26–42.
Ricker-Gilbert, J., N. M. Mason, F. A. Darko, and S. T. Tembo. 2013. “What Are the Effects of Input Subsidy Programs on Maize Prices? Evidence from Malawi and Zambia.” Agricultural Economics 44 (6): 671–686.
Rosegrant, M. W., and R. E. Evenson. 1992. “Agricultural Productivity and Sources of Growth in South Asia.” American Journal of Agricultural Economics 74 (3): 757–761.
Ruttan, V. W. 2002. “Productivity Growth in World Agriculture: Sources and Constraints.” Journal of Economic Perspectives 16 (4): 161–184.
Sachs, J. 2012. “How Malawi Fed Its Own People.” New York Times, April 19, 2012.
Sheahan, M., and C. B. Barrett. 2017. “Ten Striking Facts about Agricultural Input Use in Sub-Saharan Africa.” Food Policy 67: 12–25.
Spielman, D. J., D. Kelemwork, and D. Alemu. 2012. “Seed, Fertilizer, and Agricultural Extension in Ethiopia.” In Food and Agriculture in Ethiopia: Progress and Policy Challenges, edited by P. A. Dorosh and S. Rashid, 84–122. Washington, DC: IFPRI.
Suri, T. 2011. “Selection and Comparative Advantage in Technology Adoption.” Econometrica 79 (1): 159–209.
Sutton, M. A., O. Oenema, J. W. Erisman, A. Leip, H. van Grinsven, and W. Winiwarter. 2011. “Too Much of a Good Thing.” Nature 472: 159–161.
Taffesse, A. S., and F. Tadesse. 2017. “Pathways Less Explored: Locus of Control and Technology Adoption.” Journal of African Economies 26 (suppl 1): i36–i72.
Takeshima, H., and E. Nkonya. 2014. “Government Fertilizer Subsidy and Commercial Sector Fertilizer Demand: Evidence from the Federal Market Stabilization Program (FMSP) in Nigeria.” Food Policy 47: 1–12.
Theriault, V., M. Smale, and H. Haider. 2018. “Economic Incentives to Use Fertilizer on Maize
under Differing Agro-ecological Conditions in Burkina Faso.” Food Security 10 (5): 1263–1277.
Timmer, C. P. 1997. How Well Do the Poor Connect to the Growth Process? Cambridge, MA: Harvard Institute for International Development.
Tittonell, P., and K. E. Giller. 2013. “When Yield Gaps Are Poverty Traps: The Paradigm of Ecological Intensification in African Smallholder Agriculture.” Field Crops Research 143: 76–90.
Tittonell, P., B. Vanlauwe, M. Corbeels, and K. E. Giller. 2008. “Yield Gaps, Nutrient Use Efficiencies and Response to Fertilisers by Maize across Heterogeneous Smallholder Farms of Western Kenya.” Plant and Soil 313: 19–37.
Tjernstrom, E. 2017. “Learning from Others in Heterogeneous Environments.” Working paper, University of Wisconsin–Madison.
Tovihoudji, G. P. 2018. “Improving Maize Productivity in Northern Benin through Localized Placement of Amendments and Fertilizers.” PhD dissertation, Université Catholique de Louvain, Belgium.
Van Grinsven, H. J., M. Holland, B. H. Jacobsen, Z. Klimont, M. A. Sutton, and W. Jaap Willems. 2013. “Costs and Benefits of Nitrogen for Europe and Implications for Mitigation.” Environmental Science and Technology 47 (8): 3571–3579.
Wossen, T., T. Abdoulaye, A. Alene, S. Feleke, J. Ricker-Gilbert, V. Manyong, and B. A. Awotide. 2017. “Productivity and Welfare Effects of Nigeria’s e-Voucher-Based Input Subsidy Program.” World Development 97: 251–265.
Yadav, S. N., W. Peterson, and K. W. Easter. 1997. “Do Farmers Overuse Nitrogen Fertilizer to the Detriment of the Environment?” Environmental and Resource Economics 9 (3): 323–340.

280 resakss.org
Yamano, T., and A. Arai. 2010. “Fertilizer Policies, Price and Application in East Africa.” GRIPS Discussion Paper 10-24, National Graduate Institute for Policy Studies, Tokyo.
Zhang, W. F., Z. X. Dou, P. He, X. T. Ju, D. Powlson, D. Chadwick, D. Norse, Y.-L. Lu, Y. Zhang, L. Wu, X.-P. Chen, K. G. Cassman, and F.-S. Zhang. 2013. “New Technologies Reduce Greenhouse Gas Emissions from Nitrogenous Fertilizer in China.” Proceedings of the National Academy of Sciences of the United States of America 110 (21): 8375–8380.
Chapter 5Baudron, F., M. Misiko, B. Getnet, R. Nazare, J.
Sariah, and P. Kaumbutho. 2019. “A Farm-Level Assessment of Labor and Mechanization in Eastern and Southern Africa.” Agronomy for Sustainable Development 39 (2): 17.
Benin, S. 2015. “Impact of Ghana’s Agricultural Mechanization Services Center Program.” Agricultural Economics 46 (s1): 103–117.
Benin, S., M. Johnson, K. Jimah, J. Taabazuing, A. Tenga, E. Abokyi, G. Nasser, G. Ahorbo, and V. Owuusu. 2012. “Evaluation of Four Special Initiatives of the Ministry of Food and Agriculture.” Draft Report, IFPRI, Washington, DC.
Berhane, G., M. Dereje, B. Minten, and S. Tamru. 2017. “The Rapid—but from a Low Base—Uptake of Agricultural Mechanization in Ethiopia: Patterns, Implications and Challenges.” ESSP Working Paper 105, IFPRI, Washington, DC.
Binswanger, H., and G. Donovan. 1987. Agricultural Mechanization: Issues and Options. Washington,
DC: World Bank.
Birner, R., and T. Daum. 2017. Governance and Economics of Mechanizing Africa’s Smallholder Agriculture. Stuttgart, Germany: University of Hohenheim.
Cabral, L. 2019. “Zinc Roof or Mango Tree? Tractors, Modernisation and Agrarian Transformation in Mozambique.” Agricultural Policy Research in Agriculture Working Paper 19, Future Agricultures Consortium Secretariat at the Institute of Development Studies at the University of Sussex, Brighton, UK.
Daum, T., and R. Birner. 2017. “The Neglected Governance Challenges of Agricultural Mechanisation in Africa: Insights from Ghana.” Food Security 9 (5): 959–979.
———. 2019. “African Agricultural Mechanization: Myths, Realities and an Emerging Research Agenda.” ZEF Working Paper Series 189, University of Hohenheim, Stuttgart, Germany.
Diao, X., J. Agandin, P. Fang, S. E. Justice, D. Kufoalor, and H. Takeshima. 2018. “Agricultural Mechanization in Ghana: Insights from a Recent Field Study.” IFPRI Discussion Paper 01729, IFPRI, Washington, DC.
Diao, X., F. Cossar, N. Houssou, and S. Kolavalli. 2014. “Mechanization in Ghana: Emerging Demand, and the Search for Alternative Supply Models.” Food Policy 48: 168–181.
Diao, X., P. Hazell, S. Kolavalli, and D. Resnick. 2019. Ghana’s Economic and Agricultural Transformation: Past Performance and Future Prospects. Oxford: Oxford University Press.
Diao, X., J. Kweka, and M. McMillan. 2019. “Economic Transformation in Africa from the Bottom
Up.” In The Oxford Handbook of Structural Transformation, edited by C. Monga and J. Y. Lin. Oxford: Oxford University Press.
Diao, X., J. Silver, and H. Takeshima. 2016. Agricultural Mechanization and Agricultural Transformation. Background Paper for African Economic Transformation Report, submitted to the African Center of Economic Transformation.
———. 2017. Agricultural Mechanization in Africa: Insights from Ghana’s Experience. IFPRI Issue Brief. Washington, DC: IFPRI.
Diao, X., H. Takeshima, and X. Zhang. 2020. A New Paradigm of Agricultural Mechanization Development: How Much Can Africa Learn from Asia? Washington, DC: IFPRI, forthcoming.
FAO (Food and Agriculture Organization of the United Nations). 1981. Agricultural Mechanization in Development: Guidelines for Strategy Formulation FAO Agricultural Services Bulletin 45. Rome.
———. (2008). Agricultural Mechanization in Sub Saharan Africa: Time for a New Look. AGSF Occasional Paper 22: Rural Infrastructure and Agro-Industries Division. Rome.
———. 2019. FAOSTAT. Rome.
FAO and AUC (African Union Commission). 2018. Sustainable Agricultural Mechanization: A Framework for Africa. Rome and Addis Ababa.
Fonteh, F. M. 2010. Agricultural Mechanization in Mali and Ghana: Strategies, Experiences and Lessons for Sustained Impacts. Rome: FAO.
Giller, K. E., E. Witter, M. Corbeels, and P. Tittonell. 2009. “Conservation Agriculture and Smallholder Farming in Africa: The Heretics’ View.” Field Crops Research 114 (1): 23–34.
Chapter 4 References continued

2020 ReSAKSS Annual Trends and Outlook Report 281
Gray, L., and B. Dowd-Uribe. 2013. “A Political Ecology of Socio-economic Differentiation: Debt, Inputs and Liberalization Reforms in Southwestern Burkina Faso.” Journal of Peasant Studies 40 (4): 683–702.
Gyimah-Brempong K., M. Johnson, and H. Takeshima. 2016. The Nigerian Rice Economy: Policy Options for Transforming Production, Marketing, and Trade. Philadelphia: University of Pennsylvania Press.
Hatzenbuehler, P., H. Takeshima, H. Edeh, and A. Lawal. 2018. “Cost and Policy Determinants of Features of Tractor Markets in Nigeria.” IFPRI NSSP Working Paper 55, IFPRI, Washington, DC.
Houssou, N., X. Diao, F. Cossar, S. Kolavalli, K. Jimah, and P. Aboagye. 2013. “Agricultural Mechanization in Ghana: Is Specialization in Agricultural Mechanization a Viable Business Model?” IFPRI Discussion Paper 1255, IFPRI, Washington, DC.
Jayne, T. S., M. Muyanga, A. Wineman, H. Ghebru, C. Stevens, M. Stickler, A. Chapoto, W. Anseeuw, D. van der Westhuizen, and D. Nyange. 2019. “Are Medium-Scale Farms Driving Agricultural Transformation in Sub-Saharan Africa?” Agricultural Economics 50: 75–95.
Kragelund, P. 2008. “The Return of Non-DAC Donors to Africa: New Prospects for African Development?” Development Policy Review 26 (5): 555–584.
Malabo Montpellier Panel. 2018. Mechanized: Transforming Africa’s Agriculture Value Chains. Malabo Montpellier Panel Report. Dakar
Mrema, G. C., D. G. Kahan, and A. Agyei-Holmes. 2020. “Smallholder Agricultural Mechanization and the Role of Service Hiring Market in Developing Countries: A Case Study of
Tanzania.” In A New Paradigm of Agricultural Mechanization Development: How Much Can Africa Learn from Asia? edited by X. Diao, H. Takeshima, and X. Zhang. Washington, DC: IFPRI, forthcoming.
Mueller, V., and J. Thurlow. 2019. Youth and Jobs in Rural Africa: Beyond Stylized Facts. Washington, DC: IFPRI.
Pingali, P., Y. Bigot, and H. Binswanger. 1987. Agricultural Mechanization and the Evolution of Farming Systems in Sub-Saharan Africa. Baltimore: Johns Hopkins University Press.
Ruthenberg, H. 1980. Farming Systems in the Tropics. New York: Oxford University Press.
Sheahan, M., and C. B. Barrett. 2014. “Understanding the Agricultural Input Landscape in Sub-Saharan Africa: Recent Plot, Household, and Community-Level Evidence.” Policy Research Working Paper 7014, World Bank, Washington, DC.
Sithole, N. J., L. S. Magwaza, and P. L. Mafongoya. 2016. “Conservation Agriculture and Its Impact on Soil Quality and Maize Yield: A South African Perspective.” Soil and Tillage Research 162: 55–67.
Sneyd, A. 2014. “Cameroon: Perspectives on Food Security and the Emerging Power Footprint.” Sustainability 6 (4): 1868–1895.
Takeshima, H., E. Edeh, A. Lawal, and M. Isiaka. 2015. “Characteristics of Private-Sector Tractor Service Provisions: Insights from Nigeria.” Developing Economies 53 (3): 188–217.
Takeshima, H., and A. Lawal. 2018. “Overview of the Evolution of Agricultural Mechanization in Nigeria.” IFPRI Discussion Paper 01750, IFPRI, Washington, DC.
Twum, A., and O. K. Gyarteng. 1991. “Agricultural Mechanization in Ghana: An Overview.” In Agricultural Mechanization Policies and Strategies in Africa: Case Studies from Commonwealth African Countries, edited by G. C. Mrema. London: Commonwealth Secretariat.
Veiga, P. D. M., and S. P. Rios. 2017. Brazilian and Moroccan Policies for Sub-Saharan Africa: Description and Elements for Assessment. OCP Policy Center Policy Paper 17/05. Rabat, Morocco: Policy Center for the New South.
World Bank. 2012. Agribusiness Indicators: Ethiopia. Washington DC: World Bank.
Chapter 6Altchenko, Y. and K. G. Villholth. 2015. “Mapping
Irrigation Potential from Renewable Groundwater in Africa: A Quantitative Hydrological Approach.” Hydrology and Earth System Sciences 15: 1055-1067.
Amarnath, G., G. W. H. Simons, N. Alahacoon, V. Smakhtin, B. Sharma, Y. Gismalla, Y. Mohammed, and M. C. M. Andriessen. 2018. “Using Smart ICT to Provide Weather and Water Information to Smallholders in Africa: The Case of the Gash River Basin, Sudan.” Climate Risk Management 22: 52–66.
AU (African Union). 2020. Framework for Irrigation Development and Agricultural Water Management in Africa. Addis Ababa, Ethiopia. https://archives.au.int/handle/123456789/8139.
AUC (African Union Commission). 2014. “Malabo Declaration on Accelerated Agricultural Growth and Transformation for Shared Prosperity and

282 resakss.org
Improved Livelihoods.” Addis Ababa.
Baye, K., J. Choufani, D. K. Mekonnen, E. Bryan, C. Ringler, J. K. Griffiths, and E. Davies. 2019. “Irrigation and Women’s Diet in Ethiopia: A Longitudinal Study.” IFPRI Discussion Paper 1864, IFPRI, Washington, DC.
Bjornlund, H., A. van Rooyen, and R. Stirzaker. 2017. “Profitability and Productivity Barriers and Opportunities in Small-Scale Irrigation Schemes.” International Journal of Water Resources Development 33 (5): 690–704.
Borgstein, E., D. K. Mekonnen, and K. Wade. 2020. Capturing the Productive Use Dividend: Valuing the Synergies between Rural Electrification and Smallholder Agriculture in Ethiopia. Insight Brief April 2020. Basalt, CO: Rocky Mountain Institute.
Bryan, E., C. Chase, and M. Schulte. 2019. “Nutrition-Sensitive Irrigation and Water Management.” Water Global Practice Guidance Note. Washington, DC: World Bank.
de Bont, C.; Komakech, H. C. and Veldwisch, G. J. 2018. “Neither Modern nor Traditional: Farmer-led Irrigation Development in Kilimanjaro Region, Tanzania.” World Development 116: 15-27.
Domènech, L. 2015. “Improving Irrigation Access to Combat Food Insecurity and Undernutrition: A Review.” Global Food Security 6: 24–33.
FAO (Food and Agriculture Organization of the United Nations). 2005. Irrigation in Africa in Figures. AQUASTAT Survey – 2005. FAO Water Reports 29. Rome.
———. 2016. AQUASTAT Main Database. Accessed January 3, 2020. http://www.fao.org/aquastat/en/databases/.
Frenken, K., and V. Gillet. 2012. Irrigation Water Requirement and Water Withdrawal by Country. AQUASTAT Report. Rome: FAO.
Getnet, K., A. Haileslasseie, Y. Dessalegne, F. Hagos, G. Gebrehaweria, and B. Gebremedhin. 2016. “On the Profitability of Irrigated Fodder Production: Comparative Evidence from Smallholders in Koga Irrigation Scheme, Ethiopia.” Animal Production Sciences 57 (9): 1962–1974.
Grafton, R. Q., L. Doyen, C. Béné, E. Borgomeo, K. Brooks, C. Ringler, et al. 2019. “Realizing Resilience for Decision-Making.” Nature Sustainability 2 (October): 907–913.
IEA (International Energy Agency). 2019. World Energy Outlook 2019. Paris.
IFPRI (International Food Policy Research Institute). 2019. ASTI: 2019 Global Food Policy Report Annex Table 1, https://doi.org/10.7910/DVN/9OXBIB, Harvard Dataverse, V1.
Nigussie, L., J. Barron, A. T. Haile, N. Lefore, and J. Gowing. 2018. “Gender Dimensions of Community-based Groundwater Governance in Ethiopia: Using Citizen Science as an Entry Point.” IWMI Working Paper 184, International Water Management Institute, Colombo.
Lecoutere, E., B. D’Exelle, and B. Van Campenhout. 2015. “Sharing Common Resources in Patriarchal and Status-Based Societies: Evidence from Tanzania.” Feminist Economics 12 (3): 142–167.
Lefore, N., M. Giordano, C. Ringler, and J. Barron. 2019. “Sustainable and Equitable Growth in Farmer-Led Irrigation in Sub-Saharan Africa: What Will It Take?” Water Alternatives 12 (1): 156–168.
Malabo Montpellier Panel. 2018. Water-Wise: Smart
Irrigation Strategies for Africa. Dakar.
Meier, J., F. Zabel, and W. Mauser. 2018. “A Global Approach to Estimate Irrigated Areas: A Comparison between Different Data and Statistics.” Hydrology and Earth System Sciences 22: 1119–1133.
Meinzen-Dick, R. S., M. A. Janssen, S. Kandikuppa, R. Chaturvedi, K. Rao, and S. Theis. 2018. “Playing Games to Save Water: Collective Action Games for Groundwater Management in Andhra Pradesh, India.” World Development 107 (July): 40–53.
Mekonnen, D. K., J. Choufani, E. Bryan, A.-R. Abizari, C. Ringler, and J. Amikuzuno. 2019. “Irrigation-Nutrition Linkages: Evidence from Northern Ghana.” IFPRI Discussion Paper 1887, IFPRI, Washington, DC.
Nakawuka, P., S. Langan, P. Schmitter, and J. Barron. 2018. “A Review of Trends, Constraints and Opportunities for Smallholder Irrigation in East Africa.” Global Food Security 17: 196–212.
Passarelli, S., D. Mekonnen, E. Bryan, and C. Ringler. 2018. “Evaluating the Pathways from Small-Scale Irrigation to Dietary Diversity: Evidence from Ethiopia and Tanzania.” Food Security 10: 981–997.
Pretty, J. 2018. “Intensification for Redesigned and Sustainable Agricultural Systems.” Science 362 (6417): eaav0294.
Ringler, C. 2017. Investment in Irrigation for Global Food Security. IFPRI Policy Note. Washington DC: IFPRI.
Rosegrant, M. W., C. Ringler, and I. De Jong. 2009. “Irrigation: Tapping Potential.” In Africa Infrastructure: A Time for Transformation,
Chapter 6 References continued
2020 ReSAKSS Annual Trends and Outlook Report 283
edited by V. Foster and C. Briceño-Garmendia, 287–297. Paris and Washington, DC: Agence Française de Développement and World Bank.
Rosegrant, M. W., C. Ringler, and T. Zhu. 2009. “Water for Agriculture: Maintaining Food Security under Growing Scarcity.” Annual Review of Environment and Resources 34: 205–223.
Schmitter, P., K. S. Kibret, N. Lefore, and J. Barron. 2018. “Suitability Mapping Framework for Solar Photovoltaic Pumps for Smallholder Farmers in Sub-Saharan Africa.” Applied Geography 94: 41–57.
Schreiner, B., and B. van Koppen. 2020. “Hybrid Water Rights Systems for Pro-poor Water Governance in Africa.” Water 12: 155.
Stein, C., H. Ernstson, and J. Barron. 2011. “A Social Network Approach to Analyzing Water Governance: The Case of the Mkindo Catchment, Tanzania.” Physics and Chemistry of the Earth 36 (14–15): 1085–1092.
Svendsen, M., M. Ewing, and S. Msangi. 2009. “Measuring Irrigation Performance in Africa.” IFPRI Discussion Paper 894, IFPRI, Washington DC.
Theis, S., N. Lefore, R. Meinzen-Dick, and E. Bryan. 2018. “What Happens after Technology Adoption? Gendered Aspects of Small-Scale Irrigation Technologies in Ethiopia, Ghana and Tanzania.” Agriculture and Human Values 35: 671–684.
Teklu, B. M., A. Hailu, D. A. Wiegant, B. S. Scholten, and P. J. Van den Bring. 2018. “Impacts of Nutrients and Pesticides from Small- and Large-Scale Agriculture on the Water Quality of Lake Ziway, Ethiopia.” Environmental Science and Pollution Research International 25 (14): 13207–13216.
Van Koppen, B. 2003. “Water Reform in Sub-Saharan Africa: What Is the Difference?” Physics and Chemistry of the Earth, Parts A/B/C 28 (20–77): 1047–1053.
World Bank. 2007. “Emerging Public-Private Partnerships in Irrigation Development and Management.” Water Sector Board Discussion Paper 10, World Bank, Washington, DC.
WWAP (United Nations World Water Assessment Programme). 2019. The United Nations World Water Development Report 2019: Leaving No One Behind. Paris: UNESCO.
Xie, H., N. Perez, C. Ringler, W. Anderson, and L. You. 2018. “Can Sub-Saharan Africa Feed Itself? The Role of Irrigation Development in the Region’s Drylands for Food Security.” Water International 43 (6): 796–814.
Xie, H., and C. Ringler. 2017. “Agricultural Nutrient Loadings to the Freshwater Environment: The Role of Climate Change and Socioeconomic Change.” Environmental Research Letters 12 (10): 104008.
Xie, H., C. Ringler, and M. A. H. Mondal. Under review. “Solar or Diesel: A Comparison of Costs for Groundwater-Fed Irrigation in Sub-Saharan Africa under Two Energy Solutions.” Submitted to Earth’s Future.
Xie, H., L. You, B. Wielgosz, and C. Ringler. 2014. “Estimating the Potential for Expanding Smallholder Irrigation in Sub-Saharan Africa.” Agricultural Water Management 131 (1): 183–193.
Yami, M. 2013. “Sustaining Participation in Irrigation Systems of Ethiopia: What Have We Learned about Water User Associations?” Water Policy 15: 961–984.
You, L., C. Ringler, U. Wood-Sichra, R. Robertson,
S. Wood, T. Zhu, G. Nelson, Z. Guo, and Y. Sun. 2011. “What Is the Irrigation Potential for Africa? A Combined Biophysical and Socioeconomic Approach.” Food Policy 36 (6): 770–782.
Chapter 7AGRA (Alliance for a Green Revolution in Africa).
2019. Africa Agriculture Status Report: The Hidden Middle: A Quiet Revolution in the Private Sector Driving Agricultural Transformation (Issue 7). Nairobi, Kenya.
Al-Awlaqi, M. A., A. M. Aamer, and N. Habtoor. 2018. “The Effect of Entrepreneurship Training on Entrepreneurial Orientation: Evidence from a Regression Discontinuity Design on Micro-Sized Businesses.” International Journal of Management Education 100267.
Altenburg, T. 2007. Donor Approaches to Supporting Pro-poor Value Chains: Report Prepared for the Donor Committee for Enterprise Development, Working Group on Linkages and Value Chains. Cambridge, UK: Donor Committee for Enterprise Development
AUC (African Union Commission). 2014. Malabo Declaration on Accelerated Agricultural Growth and Transformation for Shared Prosperity and Improved Livelihoods. Addis Ababa, Ethiopia.
Badiane, O., J. Collins, J. Ulimwengu, and X. Diao. 2015. “Economic Recovery in Africa and Its Determinants.” In Beyond a Middle-Income Africa: Transforming African Economies for Sustained Growth with Rising Employment and Incomes, ReSAKSS Annual Trends and Outlook Report 2014, edited by O. Badiane and T. Makombe. Washington, DC: IFPRI.

284 resakss.org
Badiane, O., and T. Makombe. 2015. “Agriculture, Growth, and Development in Africa: Theory and Practice.” In Oxford Handbook of Africa and Economics. Vol. 2, edited by C. Monga and J. Lin. Oxford, UK: Oxford University Press.
Badiane, O., and J. Ulimwengu. 2017. “Business Pathways to the Future of Smallholder Farming in the Context of Transforming Value Chains.” In Africa Agriculture Status Report: The Business of Smallholder Agriculture in Africa, 24–44. Nairobi, Kenya: Alliance for a Green Revolution in Africa.
Blattman, C., S. Dercon, and S. Franklin. 2019. “Impacts of Industrial and Entrepreneurial Jobs on Youth: 5-Year Experimental Evidence on Factory Job Offers and Cash Grants in Ethiopia.” NBER Working Paper 25788, National Bureau of Economic Research, Cambridge, MA.
Blattman, C., N. Fiala, and S. Martinez. 2018. “The Long-Term Impacts of Grants on Poverty: 9-Year Evidence from Uganda’s Youth Opportunities Program.” NBER Working Paper 24999, National Bureau of Economic Research, Cambridge, MA.
Boamah, E. F., and J. Sumberg. 2019. “The Long Overhang of Bad Decisions in Agro-industrial Development: Sugar and Tomato Paste in Ghana.” Food Policy 89: 101786.
Conway, G., O. Badiane, and K. Glatzel. 2019. Food for All. Ithaca, NY: Cornell University Press.
De Mel, S., D. McKenzie, and C. Woodruff. 2012. “Business Training and Female Enterprise Start-up, Growth, and Dynamics: Experimental Evidence from Sri Lanka.” Policy Research Working Paper 6145, World Bank, Washington, DC.
Dodgson, M. 2000. “Policies for Science, Technology and Innovation in Asian Newly Industrializing
Economies.” In Technology Learning and Innovation: The Experience of Newly Industrializing Economies, edited by L. Kim and R. Nelson, 226–268. Cambridge: Cambridge University Press.
Donovan, J., S. Franzel, M. Cunha, A. Gyau, and D. Mithöfer. 2015. “Guides for Value Chain Development: A Comparative Review.” Journal of Agribusiness in Developing and Emerging Economies 5 (1): 2–23.
Duteurtre, G., M. D. Faye, and P. N. Dièye. 2010. L’Agriculture Sénégalaise à l’Epreuve du Marché. Dakar, Senegal: Institut Sénégalais de Recherches Agricoles. Paris: Karthala.
Fall, A. A., and P. N. Dièye. 2008. “Impact des Cours Mondiaux du Riz sur la Sécurité Alimentaire au Sénégal.” Réflexions e Perspectives 6 (6). Dakar: Institut Sénégalais de Recherches Agricoles.
Faye, M. D., and A. Gueye. 2010. Mils et Sorgho: L’Émergence d’un Artisanat Agroalimentaire, 83–97. Dakar, Senegal: Institut Sénégalais de Recherches Agricoles, Bureau d’Analyses Macro-Économiques. Paris: L’Harmattan.
Gielnik, M. M., M. A. Uy, R. Funken, and K. M. Bischoff. 2017. “Boosting and Sustaining Passion: A Long-Term Perspective on the Effects of Entrepreneurship Training.” Journal of Business Venturing 32 (3): 334–353.
Girvan, N. P. 1987. “Transnational Corporations and Non-fuel Primary Commodities in Developing Countries.” World Development 15 (5): 713–740.
Haggblade, S. 2011. “Modernizing African Agribusiness: Reflections for the Future.” Journal of Agribusiness in Developing and Emerging Economies 1 (1): 10–30.
Horton, D., J. Donovan, A. Devaux, and M. Torero.
2016. “Innovation for Inclusive Value-Chain Development: Highlights.” In Innovation for Inclusive Value-Chain Development: Successes and Challenges, edited by A. Devaux, M. Torero, J. Donovan, and D. Horton, Part 1, 3–36. Washington, DC: IFPRI.
Krause, B. L., A. S. McCarthy, and D. Chapman. 2016. “Fueling Financial Literacy: Estimating the Impact of Youth Entrepreneurship Training in Tanzania.” Journal of Development Effectiveness 8 (2): 234–256.
Ladzani, W. M., and J. J. Van Vuuren. 2002. “Entrepreneurship Training for Emerging SMEs in South Africa.” Journal of Small Business Management 40 (2): 154–161.
MAER (Ministere de l’Agriculture et de l’Equipement Rural). 2018. Lettre de Politique Sectorielle de Développement de l'Agriculture (LPSDA) 2019–2023. Dakar.
Michael, S. C., and J. A. Pearce. 2009. “The Need for In-novation as a Rationale for Government Involve-ment in Entrepreneurship.” Entrepreneurship and Regional Development 21 (3): 285–302.
Monga, C., A. Shimeles, and A. Woldemichael. 2019. Creating Decent Jobs: Strategies, Policies, and Instruments. Abidjan: African Development Bank.
Porter, M. E. 1985. Competitive Advantage: Creating and Sustaining Superior Performance. New York: The Free Press.
———. 2001. “The Value Chain and Competitive Advantage.” In Understanding Business Processes, 50–66. New York: Routledge.
Reardon, T., D. Tschirley, B. Minten, S. Haggblade, S. Liverpool-Tasie, M. Dolislager, J. Snyder, and C. Ijumba. 2015. “Transformation of African Agrifood Systems in the New Era of
Chapter 7 References continued

2020 ReSAKSS Annual Trends and Outlook Report 285
Rapid Urbanization and the Emergence of a Middle Class.” In Beyond a Middle-Income Africa: Transforming African Economies for Sustained Growth with Rising Employment and Incomes, edited by O. Badiane and T. Makombe. ReSAKSS Annual Trends and Outlook Report 2014. Washington, DC: IFPRI.
ReSAKSS (Regional Strategic Analysis and Knowledge Support System), MSU (Michigan State University), and Syngenta. 2011. Etude sur la Consommation Alimentaire en Afrique de l’Ouest: Rapport de Synthèse. Addis Ababa, Ethiopia; East Lansing, MI; Basel, Switzerland.
Sitko, N. J., and T. S. Jayne. 2012. “Why Are African Commodity Exchanges Languishing? A Case Study of the Zambian Agricultural Commodity Exchange.” Food Policy 37 (3): 275–282.
Sonobe, T., and K. Otsuka. 2011. Cluster-Based Industrial Development: A Comparative Study of Asia and Africa. New York: Palgrave Macmillan.
Stamm, A. 2004. Value Chains for Development Policy: Challenges for Trade Policy and the Promotion of Economic Development. Concept Study. Eschborn, Germany: Gesellschaft für Technische Zusammenarbeit.
Stampini, M., R. Leung, S. M. Diarra, and L. Pla. 2013. “How Large Is the Private Sector in Africa? Evidence from National Accounts and Labour Markets.” South African Journal of Economics 81 (1): 140–165.
Tadesse, G. 2018. “Determinants of African Agricultural Exports.” In Africa Agriculture Trade Monitor Report 2018, edited by O. Badiane, S. Odjo, and J. Collins, 85–109. Washington, DC: IFPRI.
Tadesse, G., and G. Bahiigwa. 2015. “Mobile Phones and Farmers’ Marketing Decisions in Ethiopia.”
World Development 68: 296–307.
Tadesse, G., and T. Zewdie. 2019. “Grants versus Credits for Improving the Livelihoods of Ultra-poor: Evidence from Ethiopia.” World Development 113: 320–329.
Traore, F., and D. Sakyi. 2018. “Africa’s Global Trade Patterns.” In Africa Agriculture Trade Monitor Report 2018, edited by O. Badiane, S. Odjo, and J. Collins, 3–23. Washington, DC: IFPRI.
Tschirley, D., M. Dolislager, T. Reardon, and J. Snyder. 2015. “The Rise of a Middle Class in East and Southern Africa: Implications for Food System Transformation.” Journal of International Development 27 (5): 628–646.
Ulimwengu, J., and C. Jenane. 2019. “Private Sector and Clusters Development for Agricultural Transformation in Africa.” In Africa Agriculture Status Report: The Hidden Middle: A Quiet Revolution in the Private Sector Driving Agricultural Transformation (Issue 7), 74–86. Nairobi, Kenya: Alliance for a Green Revolution in Africa.
Ulimwengu, J. U., W. Marivoet, A. Gueye, K. Savadogo, K. Dia, and L. M. Sall. 2020. “Understanding Urban and Rural Food Consumption in Senegal.” In Transformation Structurelle du Système Agricole et Alimentaire du Sénégal: Consommation et Systèmes d’Approvisionnement, edited by O. Badiane, M. D. Faye, and K. Savadogo, forthcoming.
UN (United Nations). 2001. Transforming Our World: The 2030 Agenda for Sustainable Development. UN Resolution A/RES/70/1. New York.
Chapter 8
Abate, G. T., G. N. Francesconi, and K. Getnet. 2014. “Impact of Agricultural Cooperatives on Smallholders’ Technical Efficiency: Evidence from Ethiopia.” Annals of Public and Cooperative Economics 85 (2): 257–286.
Abdul-Rahaman, A., and A. Abdulai. 2018. “Do Farmer Groups Impact on Farm Yield and Efficiency of Smallholder Farmers? Evidence from Rice Farmers in Northern Ghana.” Food Policy 81: 95–105.
Abebaw, D., and M. G. Haile. 2013. “The Impact of Cooperatives on Agricultural Technology Adoption: Empirical Evidence from Ethiopia.” Food Policy 38: 82–91.
Aigner, D. J., C. A. Lovell, and P. Schmidt. 1977. “Formulation and Estimation of Stochastic Frontier Production Function Models.” Journal of Econometrics 6: 21–37.
ANSD (Agence Nationale de la Statistique et de la Démographie). 2014. Rapport Definitif RGPHAE 2013. Dakar: République du Sénégal Ministère de l’Economie, des Finances et du Plan.
Ba, C. O., J. Bourgoin, and D. Diop. 2017. “Senegal: The Fluidity of Internal Migration as an Answer to Local Constraints.” In Rural Africa in Motion. Dynamics and Drivers of Migration South of the Sahara, edited by S. Mercandallie and B. Losch, 32–33. Rome: FAO-CIRAD.
Ben-Ner, A., and M. Ellman. 2013. “The Contributions of Behavioral Economics to Understanding and Advancing the Sustainability of Worker Cooperatives.” Journal of Entrepreneurial and Organizational Diversity 2 (1): 75–100.
Bernard, T., M. H. Collion, A. de Janvry, P. Rondot, and E. Sadoulet. 2008. “Do Village Organizations Make a Difference in African Rural Development? A Study for Senegal and Burkina
286 resakss.org
Faso.” World Development 36 (11): 2188–2204.
Bernard, T., L. Sene, A. Viceisza, and F. Wouterse. 2014. “Leaders Needed: Experimental Evidence from Rural Producer Organizations in Senegal.” Unpublished, IFPRI, Washington, DC.
Bernard, T., A. S. Taffesse, and E. Gabre-Madhin. 2008. “Impact of Cooperatives on Smallholders’ Commercialization Behavior: Evidence from Ethiopia.” Agricultural Economics 39 (2): 147–161.
Bernard, T. and A. Tafesse. 2012. “Returns to Scope? Smallholders’ Commercialisation through Multipurpose Cooperatives in Ethiopia.” Journal of African Economies 21: 440– 464.
Buell, R. 1928. The Native Problem in Africa. London: Frank Cass.
Cook, M. L., and M. Chambers. 2007. “The Role of Agricultural Cooperatives in Global Netchains.” Paper presented at workshop on small farmer organizations and markets in developing countries, organized by INRA-MOISA and Wageningen University, Montpellier, France, July.
Deininger, K. 1995. “Collective Agricultural Production: A Solution for Transition Economies?” World Development 23 (8): 1317–1334.
de Janvry, A., and E. Sadoulet. 2004. Organisations pay-sannes et développement rural au Sénégal, Berke-ley, University of California for the World Bank.
Fall, A. A. 2015. “Synthèse des études sur l’état des lieux chaine de valeur riz au senegal.” Cadre Régional de Concertation des Organisations des Producteurs de Riz de l’Afrique de l’ouest.
Francesconi, G. N., and H. M. Ayerakwa. 2011. West African Grain Banks in a New Era of Food Crisis: A Policy Report. Dakar: IFPRI, German
Federal Ministry for Economic Cooperation and Development (BMZ), and World Food Programme.
Francesconi, G. N., and N. Heerink. 2011. “Ethiopian Agricultural Cooperatives in an Era of Global Commodity Exchange: Does Organizational Form Matter?” Journal of African Economies 20 (1): 153–177.
Francesconi, G. N., and F. Wouterse. 2015a. “The Health of Farmer-Based Organizations in Ghana: Organizational Diagnostics and Governance Implications.” The Journal of Development Studies 51 (3): 262–273.
———. 2015b. “Promoting the Role of Farmer-Based Organizations for Value Chain Integration: The Tension between a Program’s Targeting and an Organization’s Investment Strategy.” Agricultural Economics 46 (4): 527–536.
Hoken, H., and Q. Su. 2018. “Measuring the Effect of Agricultural Cooperatives on Household Income: Case Study of a Rice-Producing Cooperative in China.” Agribusiness 34 (4): 831–846.
Ma, W., A. Abdulai, and R. Goetz. 2018. “Agricultural Cooperatives and Investment in Organic Soil Amendments and Chemical Fertilizer in China.” American Journal of Agricultural Economics 100 (2): 502–520.
McKeon, N. 2002. Organisations Paysannes et Développement National: l’Expérience du Conseil National de Concertation et de Coopération des Ruraux au Sénégal (CNCR). Rome: FAO.
Ostrom, E. 1990. Governing the Commons: The Evolution of Institutions for Collective Action. Cambridge: Cambridge University Press.
ReSAKSS (Regional Strategic Analysis and Knowledge Support System). 2020. Monitoring Progress database. Accessed July 1, 2020. https://www.resakss.org/node/36.
Salifu, A., G. N. Francesconi, and S. Kolavalli. 2010. “A Review of Collective Action in Rural Ghana.” IFPRI Discussion Paper 00998, IFPRI, Washington, DC.
Staatz, J. M. 1987. “Farmers’ Incentives to Take Collective Action via Cooperatives: A Transaction Costs Approach.” In Cooperative Theory: New Approaches, Agricultural Cooperative Service Report 18, edited by J. Royer, 87–107. Washington, DC: US Department of Agriculture.
Strickland, C. F. 1933. Co-operation for Africa. London: Oxford University Press.
Tadesse, G., G. T. Abate, and K. Ergano. 2019. “The Boundary of Smallholder Producers’ Cooperatives: A Conceptual and Empirical Analysis.” Journal of Agricultural Economics 70 (2): 529–549.
Verhofstadt, E., and M. Maertens. 2014. “Smallholder Cooperatives and Agricultural Performance in Rwanda: Do Organizational Differences Matter?” Agricultural Economics 45 (S1): 39–52.
Williamson, O. E. 1981. “The Modern Corporation: Origins, Evolution, Attributes.” Journal of Economic Literature 19 (4): 1537–1568.
World Bank. 2007. World Development Report 2008: Agriculture for Development. New York: Oxford University Press.
Wollni, M., and M. Zellner. 2007. “Do Farmers Benefit from Participating in Specialty Markets and Cooperatives? The Case of Coffee Marketing in
Chapter 8 References continued

2020 ReSAKSS Annual Trends and Outlook Report 287
Costa Rica.” Agricultural Economics 37 (2–3): 243–248.
Wouterse, F., and G. N. Francesconi. 2016. “Organizational Health and Performance: An Empirical Assessment of Smallholder Producer Organizations in Africa.” Journal on Chain and Network Science 16 (1): 29–40
Chapter 9Acemoglu, D., U. Akcigit, H. Alp, N. Bloom, and W.
Kerr. 2018. “Innovation, Reallocation, and Growth.” American Economic Review 108 (11): 3450–3491.
Adejuwon, O. O. 2016. “Building Innovation Systems for Small-Scale Agricultural Activities in Sub-Saharan Africa: Key Success Factors.” In Handbook of Research on Driving Competitive Advantage through Sustainable, Lean, and Disruptive Innovation, edited by L. Al-Hakim, X. Wu, A. Koronios, Y. Shou, 276–304. Hershey, PA: IGI Global.
Adendorff, M., and C. Van Wyk. 2016. “Offering TVET College Lecturers Increased Access to Professional Qualification Programmes through a National Open Learning System in South Africa.” Paper presented at eighth Pan-Commonwealth Forum on Open Learning, Kuala Lumpur, November 27–30.
Aenis, A. T., and T. Lixia. 2016. “Vocational Education and Training in the Agricultural Sector of Germany and China.” Report for German-Sino Agricultural Center. Bonn and Beijing: German Agency for International Cooperation.
Afere, L., O. Adedeji, V. Baker, C. Barbou des Courières, L. Mabonga, M. Ocansey, and P. J. Neate.
2019. Making Agriculture Attractive to Young People. CTA Technical Brief 19. Wageningen, Netherlands: Technical Centre for Agricultural and Rural Cooperation.
African Union. 2007. “Strategy to Revitalize Technical and Vocational Education and Training (TVET) in Africa.” Paper presented at meeting of the Bureau of the Conference of Ministers of Education of the African Union (COMEDAF II), Addis Ababa, Ethiopia, May 29–31. https://www.voced.edu.au/content/ngv%3A58399.
Akoojee, S. 2016. “Private TVET in Africa: Understanding the Context and Managing Alternative Forms Creatively.” Journal of Technical Education and Training 8 (2).
AUC (African Union Commission). 2014. Science, Technology, and Innovation Strategy for Africa (STISA-2024). Addis Ababa.
Babu, S. C. 2015. “Institutional Innovations for Agricultural Transformation: Issues, Challenges, and Policy Options.” Paper prepared for the African Economic Research Consortium (AERC) Senior Policy Seminar XVII, March 26–27, 2015, Maputo, Mozambique.
Babu, S. C., R. Manvatkar, and S. Kolavalli. 2016. “Strengthening Capacity for Agribusiness Development and Management in Sub-Saharan Africa.” Africa Journal of Management 2 (1): 1–30.
Bankole, R., G. Nouatin, and E. Gandonou. 2019. “Benin Dual Apprenticeship: Strategic Actors and Roles.” Policy Brief to Working Paper 18, ETH Zurich.
Bardak, U., and F. Rosso. 2019. “Skills Development in the Informal Sector.” In Assessing Informal Employment and Skills Needs, edited by C. Larsen, S. Rand, A. Schmid, V. Bobkov, and V.
Lokosov, 41–86. Munich: Rainer Hampp Verlag.
Bauer, W., and M. Gessler. 2017. “Dual Vocational Education and Training Systems in Europe: Lessons Learned from Austria, Germany and Switzerland.” In Vocational Education and Training in Sub-Saharan Africa, edited by F. Eicker, G. Haseloff, and B. Lennartz, 48–66. Bielefeld, Germany: Bertelsmann Verlag.
BLE (German Federal Office for Agriculture and Food). 2016. “Bildungsserver Agrar.” https://www.bildungsserveragrar.de/.
BMEL (German Federal Ministry of Agriculture and Food). 2015. “BMEL-Statistik—Landwirtschaft—Ausbildung.” http://www.bmel-statistik.de/landwirtschaft/ausbildung/.
BMZ (German Federal Ministry for Economic Cooperation and Development). 2017. Supporting TVET—Shaping the Future: Technical and Vocational Education and Training (TVET) in Development Cooperation. Bonn and Berlin.
Bonoli, G., and A. Wilson. 2019. “Bringing Firms on Board: Inclusiveness of the Dual Apprenticeship Systems in Germany, Switzerland and Denmark.” International Journal of Social Welfare 28 (4): 369–379.
Brewer, L., and P. Comyn. 2015. Integrating Core Work Skills into TVET Systems: Six Country Case Studies. Geneva: International Labour Organization.
Brooks, K., S. Zorya, A. Gautam, and A. Goyal. 2013. “Agriculture as a Sector of Opportunity for Young People in Africa.” Policy Research Working Paper No. 6473, World Bank, Washington, DC.
Carson, K. I., 2018. “Agricultural Training and the Labour Productivity Challenge.” International

288 resakss.org
Journal of Agricultural Management 6 (3–4): 131–133.
Chavas, J. P., and C. Nauges. 2020. “Uncertainty, Learning, and Technology Adoption in Agriculture.” Applied Economic Perspectives and Policy 42 (1): 42–53.
Chong, T. 2014. “Vocational Education in Singapore: Meritocracy and Hidden Narratives.” Discourse: Studies in the Cultural Politics of Education 35 (5): 637–648.
Christiaensen, L. 2020. Agriculture, Jobs, and Value Chains in Africa. Washington, DC: World Bank.
Christiaensen, L., and L. Demery, eds. 2018. Agriculture in Africa: Telling Myths from Facts. Washington, DC: World Bank.
Coulibaly, B. S. 2019. Foresight Africa: Top Priorities for the Continent in 2019. Washington, DC: Africa Growth Initiative at Brookings.
Davis, K., and S. Babu. 2020 (forthcoming). “Empirical Lessons and Cross-Country Best Practices on Agricultural Technical Vocational Education and Training.” In Policy and Program Opportunities for National Agricultural Investment Plans in Africa: Program Options and Best Practices for NAIP Implementation, edited by G. Tadesse, I. Fofana, J. Collins, and O. Badiane. Regional Strategic Analysis and Knowledge Support System. Dakar.
Davis, K., J. Ekboir, W. Mekasha, C.M.O. Ochieng, D.J. Spielman, and E. Zerfu. 2007. “Strengthening Agricultural Education and Training in sub-Saharan Africa from an Innovation Systems Perspective: Case Studies of Ethiopia and Mozambique.” IFPRI Discussion Paper 00736. IFPRI, Washington, DC.
Egeru, A., P. Nampala, H. Makuma-Massa, M.
Osiru, and A. Ekwamu. 2016. “Innovating for Skills Enhancement: The Centrality of Field Attachment Programs in Agricultural Sciences in Africa.” Gateways: International Journal of Community Research and Engagement 9 (1): 159–171.
Eicker, F., G. Haseloff, and R. Lennartz, eds. 2017. Vocational Education and Training in Sub-Saharan Africa: Current Situation and Development. Bielefeld, Germany: Bertelsmann Verlag.
Eissler, S., and M. Brennan. 2015. Review of Research and Practice for Youth Engagement in Agricultural Education and Training Systems. Nairobi: Paulines Publications Africa.
Elder, S., and S. Kring. 2016. Young and Female—A Double Strike? Gender Analysis of School-to-Work Transition Surveys in 32 Developing Countries. Work4Youth Publication Series No. 32, International Labour Organization, Geneva.
FAO (Food and Agriculture Organization of the United Nations). 2014. Food and Agriculture Policy Decision Analysis database. http://www.fao.org/in-action/fapda/fapda-home/en/.
FAO and IFAD (International Fund for Agricultural Development). 2014. Youth and Agriculture: Key Challenges and Concrete Solutions. Rome: FAO, Technical Centre for Agricultural and Rural Cooperation, and IFAD.
Fluitman, F. 2002. Unpublished plenary discussion on draft of World Bank’s Vocational Skills Development in Sub-Saharan Africa: Synthesis of a Regional Review, University of Edinburgh, UK.
Fluitman, F. 2005. “Poverty Reduction, Decent Work, and the Skills It Takes, or: Towards Correcting a Partial View of Training Needs in African Development.” Paper presented at Conference
on Reintegrating Education, Skills and Work in Africa, Edinburgh, UK, April 27–28. Reprinted in Reintegrating Education, Skills and Work in Africa, edited by M. Beveridge, K. King, R. Palmer, and R. Wedgwood, 27-28. Centre of African Studies, University of Edinburgh.
Fu, X., P. Mohnen, and G. Zanello. 2018. “Innovation and Productivity in Formal and Informal Firms in Ghana.” Technological Forecasting and Social Change 131: 315–325.
Gessler, M., and S. Peters. 2020. “Competency-Based Education and Training in Namibia: Educational Transfer as Imitation.” In Comparative Vocational Education Research, edited by M. Pilz and J. Li, 113–130. Wiesbaden, Germany: Springer.
GIZ (German Agency for International Cooperation). 2015. “NEPAD/CAADP: Supporting Vocational Training in Agriculture.” https://www.giz.de/en/worldwide/15974.html.
———. 2016a. “Promotion of Agricultural Technical Vocational Education and Training (ATVET) with the Support of the Comprehensive Africa Agriculture Development Programme (CAADP) in Benin.” Support to Pan-African Reform Processes in Agriculture Development (NEPAD/CAADP) fact sheet.
———. 2016b. “Promotion of Agricultural Technical Vocational Education and Training (ATVET) with the Support of the Comprehensive Africa Agriculture Development Programme (CAADP) in Burkina Faso.” Support to Pan-African Reform Processes in Agriculture Development (NEPAD/CAADP) fact sheet.
———. 2016c. Promotion of Agricultural Technical Vocational Education and Training (ATVET) with the Support of the Comprehensive Africa
Chapter 9 References continued
2020 ReSAKSS Annual Trends and Outlook Report 289
Agriculture Development Programme (CAADP) in Ghana. Support to Pan-African Reform Processes in Agriculture Development (NEPAD/CAADP) fact sheet.
———. 2016d. Promotion of Agricultural Technical Vocational Education and Training (ATVET) with the Support of the Comprehensive Africa Agriculture Development Programme (CAADP) in Kenya. Support to Pan-African Reform Processes in Agriculture Development (NEPAD/CAADP) fact sheet.
———. 2016e. Promotion of Agricultural Technical Vocational Education and Training (ATVET) with the Support of the Comprehensive Africa Agriculture Development Programme (CAADP) in Malawi. Support to Pan-African Reform Processes in Agriculture Development (NEPAD/CAADP) fact sheet.
———. 2016f. Promotion of Agricultural Technical Vocational Education and Training (ATVET) with the Support of the Comprehensive Africa Agriculture Development Programme (CAADP) in Togo. Support to Pan-African Reform Processes in Agriculture Development (NEPAD/CAADP) fact sheet.
———. 2017. “African Union: Transforming Agriculture through Skills Development.” CAADP fact sheet.
Grollmann, P. 2018. “Varieties of ‘Duality’: Work-Based Learning and Vocational Education in International Comparative Research.” In Integration of Vocational Education and Training Experiences, edited by S. Choy, G.-B. Wärvik, and V. Lindberg, 63–82. Singapore: Springer.
Gutowski, A., N. M. Hassan, T. Knedlik, C. M. N. Tong, and K. Wohlmuth, eds. 2020. Science, Technology and Innovation Policies for Inclusive
Growth in Africa: Human Skills Development and Country Cases. African Development Perspectives Yearbook, vol. 21. Münster: LIT Verlag.
Haggblade, S., A. Chapoto, A. Drame-Yayé, S. L. Hendriks, S. Kabwe, I. Minde, J. Mugisha, and S. Terblanche. 2015. “Motivating and Preparing African Youth for Successful Careers in Agribusiness.” Journal of Agribusiness in Developing and Emerging Economies 5 (2): 170–189.
ILO (International Labour Organization). 2019. Work for a Brighter Future—Global Commission on the Future of Work. Geneva.
———. 2020. Global Employment Trends for Youth 2020: Technology and the Future of Jobs. Geneva.
ILO and UNESCO. 2019. “A Global Overview of TVET Teaching and Training: Current Issues, Trends and Recommendations.” Background document for 13th session of Joint ILO–UNESCO Committee of Experts, Geneva.
IMF (International Monetary Fund). 2016. “DataMapper,” accessed on July 2, 2020. http://www.imf.org/external/datamapper/datasets
Ismail, A., R. Hassan, A. A. Bakar, H. Hussin, M. A. M. Hanafiah, and L. H. Asary. 2018. “The Development of TVET Educator Competencies for Quality Educator.” Journal of Technical Education and Training 10 (2).
Jacobs, R., and J. Hawley. 2008. “Emergence of Workforce Development: Definition, Conceptual Boundaries, and Implications.” In International Handbook of Technical and Vocational Education and Training, edited by R. MacLean and D. Wilson, 2537-2552. Amsterdam: Kluwer.
Janoski, T., D. Luke, and C. Oliver. 2014. The Causes of Structural Unemployment: Four Factors That Keep People from the Jobs They Deserve. Hoboken, NJ: John Wiley & Sons.
Jjuuko, R., C. Tukundane, and J. Zeelen. 2019. “Exploring Agricultural Vocational Pedagogy in Uganda: Students’ Experiences.” International Journal of Training Research 17 (3): 238–251.
Johanson, R. A. 2007. Cultivating Knowledge and Skills to Grow African Agriculture: A Synthesis of an Institutional, Regional, and International Review. Washington, DC: World Bank.
Jones, K. 2013. The Role of Agricultural Technical and Vocational Education and Training in Developing Countries: A Review of Literature, Issues and Recommendations for Action. Washington, DC: U.S. Agency for International Development.
Kahan, D. 2012. Entrepreneurship in Farming. Farm Management Extension Guide 5. Rome: FAO.
Kahan, D., and S. Worth. 2015. Introducing the Farm Business School: A Training Package. Rome: FAO.
Kalimba, U. B., and R. J. Culas. 2020. “Climate Change and Farmers’ Adaptation: Extension and Capacity Building of Smallholder Farmers in Sub-Saharan Africa.” In Global Climate Change and Environmental Policy, edited by R. Venkat, S. Shah, and R. Prasad, 379–410. Singapore: Springer.
King, K., and R. Palmer. 2006. “Skills Development and Poverty Reduction: The State of the Art.” Post-basic Education and Training Working Paper Series No. 9, Centre of African Studies, University of Edinburgh, UK.
———. 2007. Skills Development and Poverty Reduction: A State of the Art Review. Turin, Italy: European Training Foundation.

290 resakss.org
Kirui, O., and M. Kozicka. 2018. “Vocational Education and Training for Farmers and Other Actors in the Agri-food Value Chain in Africa.” ZEF Working Paper No. 164, Center for Development Research, Bonn, Germany.
Koobonye, S. 2020. TVET in Botswana: A Case Study on Its Ability to Develop Demand-Driven and Competence-Based Skills for the Labour Market. Bonn, Germany: Federal Institute for Vocational Education and Training.
Kosec, K., and C. Ragasa. 2019. How to Improve Rural Service Delivery in Developing Countries: Complementarities, Information, and Incentives. IFPRI Policy Brief. Washington, DC: IFPRI.
Li, W., M. Ahmed, Q. Khan, and M. Hongwei. 2016. Education and Training for Rural Transformation: Skills, Jobs, Food and Green Future to Combat Poverty. New Delhi: SAGE Publications India.
Mabaya, E., and L. Cramer. 2014. “Growth in a Global-ized Industry: The Case of Hillside Green Grow-ers and Exporters Ltd.” International Food and Agribusiness management Review 7 (B): 199–205.
Maïga, E. W., and H. Kazianga. 2016. “The Role of Agricultural Skills Development in Transforming African Agriculture.” Background paper, African Center for Economic Transformation, Accra, Ghana.
Malambe, L. 2016. “Exploring Skills Development within the Interface of Public and Private Sectors.” Unpublished doctoral dissertation, University of Cape Town, South Africa.
McGrath, S., P. Ramsarup, J. Zeelen, V. Wedekind, S. Allais, H. Lotz-Sisitka, D. Monk, G. Openjuru, and J. A. Russon. 2019. “Vocational Education and Training for African Development: A
Literature Review.” Journal of Vocational Education & Training. Published online ahead of print November 5. https://doi.org/10.1080/13636820.2019.1679969.
Melaku, M. 2017. “The Role of Technical and Vocational Education and Training in Preparing Its Graduates for Green Jobs in Entoto Technical and Vocational Education and Misrak Poly-technique Colleges.” Unpublished doctoral dissertation, Addis Ababa University, Ethiopia.
Minde, I., S. Terblanche, B. Bashaasha, I. C. Madakadze, J. Snyder, and A. Mugisha. 2015. “Challenges for Agricultural Education and Training (AET) Institutions in Preparing Growing Student Populations for Productive Careers in the Agri-food System.” Journal of Agribusiness in Developing and Emerging Economies 5 (2): 137–169.
Mulugeta, M., and T. Mekonen. 2016. “Implementation of Technical and Vocational Training Strategy in Agricultural Sector in Ethiopia: Practices, Challenges and the Way Forward.” Ethiopian Journal of the Social Sciences and Humanities 12 (2): 57–80.
Mungai, C., T. Muchaba, L. Szilagyi, M. A. Radeny, V. Atakos, and D. Ntiokam. 2018. Youth Engagement in Climate-Smart Agriculture in Africa: Opportunities and Challenges. Wageningen, Netherlands: CGIAR Research Program on Climate Change, Agriculture and Food Security.
Mwaura, G. M. 2017. “Just Farming? Neoliberal Subjectivities and Agricultural Livelihoods among Educated Youth in Kenya.” Development and Change 48 (6): 1310–1335.
Nájera, J. 2017. “Integration of Small Farmers into Global Value Chains: Challenges and
Opportunities Inside the Current Global Demand.” TEC Empresarial 11 (2): 7–16.
NEPAD (New Partnership for Africa’s Development). 2013. Review of Agricultural Technical Vocational Education and Training (ATVET) in Africa: Best Practices from Benin, Ethiopia, Namibia and Sierra Leone. Midrand, South Africa: NEPAD Planning and Coordinating Agency CAADP Unit.
O’Donoghue, C., and K. Heanue. 2018. “The Impact of Formal Agricultural Education on Farm Level Innovation and Management Practices.” Journal of Technology Transfer 43 (4): 844–863.
O’Higgins, N. 2017. Rising to the Youth Employment Challenge: New Evidence on Key Policy Issues. Geneva: International Labour Organization.
Oketch, M. O. 2007. “To Vocationalise or Not to Vocationalise? Perspectives on Current Trends and Issues in Technical and Vocational Education and Training (TVET) in Africa.” International Journal of Educational Development 27 (2): 220–234.
Oketch, M. 2014. “Education Policy, Vocational Training, and the Youth in Sub-Saharan Africa.” WIDER Working Paper No. 2014/069, UNU-WIDER Institute for Development Economics Research, New York.
Onderi, H., J. Ajowi, and G. Malala. 2014. “Restructuring Technical and Vocational Education and Training for Sustainable Development in Sub-Saharan Africa.” International Journal of Interdisciplinary Research and Innovations 2 (1): 40–45.
Oviawe, J. I. 2018. “Revamping Technical Vocational Education and Training through Public-Private Partnerships for Skill Development.” Makerere Journal of Higher Education 10 (1): 73–91.
Chapter 9 References continued

2020 ReSAKSS Annual Trends and Outlook Report 291
Palacios-Lopez, A., L. Christiaensen, and T. Kilic. 2017. “How Much of the Labor in African Agriculture Is Provided by Women?” Food Policy 67: 52–63.
Pamuk, H., M. V. Asseldonk, K. Deering, E. Girvetz, J. Hella, S. Karanja, T. Masoud, J. Osiemo, and R. Ruben. 2018. “Testing a New Model Combining Micro-finance and Farmer Training to Upscale the Adoption of Climate-Smart Agriculture Practices by Small-Scale Farmers in Developing Countries.” Info Note, CGIAR Research Program on Climate Change, Agriculture and Food Security, Wageningen, Netherlands.
Pavlova, M. 2014. “TVET as an Important Factor in Country’s Economic Development.” SpringerPlus 3 (Suppl 1): K3.
Pilz, M., and B. Fürstenau. 2019. “Duality and Learning Fields in Vocational Education and Training: Pedagogy, Curriculum, and Assessment.” In The Wiley Handbook of Vocational Education and Training, edited by D. Guile and L. Unwin, 311–328. Hoboken, NJ: Wiley.
Poole, N., F. Álvarez, N. Penagos, and R. Vázquez. 2013. “Education for All and for What? Life-Skills and Livelihoods in Rural Communities.” Journal of Agribusiness in Developing and Emerging Economies 3 (1): 64–78.
Ragasa, C., C. Mthinda, C. Chowa, D. Mzungu, K. Kalagho, and C. Kazembe. 2019. “Assessing and Strengthening Malawi’s Pluralistic Agricultural Extension System: Evidence and Lessons from a 3-Year Research Study.” Project Note, IFPRI, Washington, DC.
Ramboarison-Lalao, L., and L. Rabeson. 2020. “Apprenticeship Management in Africa: The Case of Madagascar.” The Success of Apprenticeships: Views of Stakeholders on Training and
Learning vol. 3, edited by J.-L. Cerdin and J.-M. Peretti, 167–173. Hoboken, NJ: Wiley.
Rao, B., and S. Sudarshan. 2012. “Human Capital Development for the Management of Food and Agribusiness in India.” International Food and Agribusiness Management Review 2(A): 47–50.
Reardon, T., R. Echeverria, J. Berdegué, B. Minten, S. Liverpool-Tasie, D. Tschirley, and D. Zilberman. 2019. “Rapid Transformation of Food Systems in Developing Regions: Highlighting the Role of Agricultural Research and Innovations.” Agricultural Systems 172: 47–59.
Rivera, W., and G. E. Alex. 2008. “Human Resource Development for Modernizing the Agricultural Workforce.” Human Resource Development Review 7 (4): 374–386.
Sarfo, A. 2013. “Initiative on Technical, Vocational Education and Training (TVET) in Support CAADP Implementation.” PowerPoint presentation, Accra, Ghana, July 16. http://de.slideshare.net/FARA-AFRICA/atvet-fara-science-week-accra-16072013.
Simões, F., and N. B. do Rio. 2020. “How to Increase Rural NEETs Professional Involvement in Agriculture? The Roles of Youth Representations and Vocational Training Packages Improvement.” Journal of Rural Studies 75: 9–19.
Som, S., R. R. Burman, J. P. Sharma, R. N. Padaria, S. Paul, and A. K. Singh. 2018. “Attracting and Retaining Youth in Agriculture: Challenges and Prospects.” Journal of Community Mobilization and Sustainable Development 13 (3): 385–395.
Somers, M. A., S. J. Cabus, W. Groot, and H. M. van den Brink. 2019. “Horizontal Mismatch between Employment and Field of Education: Evidence
from a Systematic Literature Review.” Journal of Economic Surveys 33 (2): 567–603.
Šūmane, S., I. Kunda, K. Knickel, A. Strauss, T. Tisenkopfs, I. des Ios Rios, M. Rivera, T. Chebach, and A. Ashkenazy. 2018. “Local and Farmers’ Knowledge Matters! How Integrating Informal and Formal Knowledge Enhances Sustainable and Resilient Agriculture.” Journal of Rural Studies 59: 232–241.
Timmer, P. 2011. “Managing Food Price Volatility: Approaches at the Global, National and Household Levels.” Stanford, CA: Freeman Spogli Institute for International Studies.
UN General Assembly. 2015. Transforming Our World: The 2030 Agenda for Sustainable Development. Resolution A/RES/70/1. New York.
Ute, C. 2014. “Improving the Image of Technical and Vocational Education and Training.” Deutsche Gesellschaft für Internationale Zusammenarbeit (GIZ) GmbH.
Walker, K., and S. Hofstetter. 2016. “Study on Agricultural Technical and Vocational Education and Training (ATVET) in Developing Countries.” Bern: Swiss Agency for Development and Cooperation.
White, B. 2012. “Agriculture and the Generation Problem: Rural Youth, Employment and the Future of Farming.” IDS Bulletin 43 (6): 9–19.
Wolf, S. 2017. “Past Meets Present: The History of the German Vocational Education and Training Model as a Reflection Frame to the Prospect of the Egyptian Model.” In Social Dimension and Participation in Vocational Education and Training: Proceedings of the 2nd Conference “Crossing Boundaries in VET,” edited by F. Kaiser

292 resakss.org
and S. Krugmann, 89–109. Rostocker Papers of Vocational Education No. 1, Institute for Vocational Education, University of Rostock, Germany.
World Economic Forum. 2017. The Africa Competitiveness Report 2017: Addressing Africa’s Demographic Dividend. Geneva.
Yami, M., S. Feleke, T. Abdoulaye, A. D. Alene, A. Bamba, and V. Manyong. 2019. “African Rural Youth Engagement in Agribusiness: Achievements, Limitations, and Lessons.” Sustainability 11 (1): 185.
Young, I. 2019. “Apprenticeship: Lessons from the German Dual Studies Model of Vocational Education and Training.” Unpublished doctoral dissertation, Simon Fraser University, Burnaby, British Columbia, Canada.
Yumkella, K. K., P.M. Kormawa, T.M. Roepstorff, and A.M Hawkins. (Eds). 2011. Agribusiness for Africa’s Prosperity. Vienna: United Nations Industrial Development Organization.
Ziderman, A. 2018. “Funding Mechanisms for Financing Vocational Training: An Analytical Framework.” In Education Finance, Equality, and Equity, edited by I. BenDavid-Hadar, 135–164. Cham, Switzerland: Springer.
Chapter 10Beghin, J., and D. Orden, eds. 2012. “NTMs, Agricultural
and Food Trade, and Competitiveness.” Special Issue, World Economy 35 (8).
Fellows, P., and M. Hilmi. 2011. Selling Street and Snack Foods. Rome: FAO.
Gibb, H., A. Barchowsky, C. Bellinger, M. Bolger, C. Carringon, A. Havelaar, S. Oberoi, Y. Zang, K. O’Leary, and B. Devleesschauwer. 2019. “Estimates of the 2015 Global and Regional Disease Burden from Four Foodborne Metals—Arsenic, Cadmium, Lead and Methylmercury.” Environmental Research 174: 188–194.
GFSP (Global Food Safety Partnership). 2018. Food Safety in Africa: Past Endeavors and Future Directions. Washington, DC.
Grace, D. 2015. Food Safety in Developing Countries: An Overview. London: Evidence on Demand; Nairobi: International Livestock Research Institute.
Havelaar, A., M. D. Kirk, P. R. Torgerson, H. J. Gibb, T. Hald, R. J. Lake, N. Praet, D. C. Bellinger, N. R. de Silva, N. Gargouri, N. Speybroeck, A. Cawthorne, C. Mathers, C. Stein, F. J. Angulo, and B. Devleesschauwer. 2015. “World Health Organization Global Estimates and Regional Comparisons of the Burden of Foodborne Disease in 2010.” PLOS Medicine 12 (2): e1001923.
Hoffmann, S., B. Devleesschauwer, W. Aspinall, R. Cooke, T. Corrigan, A. Havelaar, F. Angulo, H. Gibb, M. Kirk, R. Lake, N. Speybroeck, P. Torgerson, and T. Hald. 2017. “Attribution of Global Foodborne Disease to Specific Foods: Findings from a World Health Organization Structured Expert Elicitation.” PLoS ONE 12 (9): e0183641.
Jaffee, S., S. Henson, and L. Diaz Rios. 2012. Making the Grade: Smallholder Farmers, Emerging Standards and Development Assistance Programs in Africa. Washington, DC: World Bank.
Jaffee, S., S. Henson, L. Unnevehr, D. Grace, and E. Cassou. 2019. The Safe Food Imperative: Accelerating Progress in Low- and Middle-Income Countries. Washington, DC: World Bank.
Li, M., A. Havelaar, S. Hoffmann, T. Hald, M. Kirk, P. Torgerson, and B. Devleesschauwer. 2019. “Global Disease Burden of Pathogens in Animal Source Foods, 2010.” PLoS ONE 14 (6): e0216545.
Ortega, D., and D. Tschirley. 2017. “Demand for Food Safety in Emerging and Developing Countries: A Research Agenda for Asia and Sub-Saharan Africa.” Journal of Agribusiness in Developing and Emerging Economies 7 (1): 21–34.
Roesel, K., and D. Grace, eds, D. 2014. Food Safety and Informal Markets: Animal Products in sub-Saharan Africa. London, UK: Routledge.
Sezgin, A., C., and N. Şanlier. 2016. “Street Food Consumption in Terms of the Food Safety and Health.” Journal of Human Sciences 13 (3): 4072–4083.
Skinner, C. 2016. “Informal Food Retail in Africa: A Review of Evidence.” Consuming Urban Poverty Working Paper No. 2, University of Cape Town, Rondebosch, South Africa.
WHO-FERG (World Health Organization Foodborne Disease Burden Epidemiology Reference Group). 2015. WHO Estimates of the Global Burden of Foodborne Diseases. Geneva.
World Bank. 2005. Food Safety and Agricultural Health Standards: Challenges and Opportunities for Developing Country Exports. Washington, DC.
———. 2018. World Development Indicators database. Accessed April 2018, https://data.worldbank.org
Chapter 9 References continued

2020 ReSAKSS Annual Trends and Outlook Report 293
Chapter 11African Union Commission. 2014. Malabo Declaration
on Accelerated Agricultural Growth and Transformation for Shared Prosperity and Improved Livelihoods. Addis-Ababa.
Akiyama, T., J. Baffes, D. Larson, and P. Varangis. 2001. Commodity Market Reforms: Lessons of Two Decades. Washington, DC: World Bank.
Aziz, A. A., E. K. Denkyirah, and E. K. Denkyirah. 2017. “Effect of Tariff Escalation on Ghanaian Cocoa Exports: An Empirical Perspective.” International Journal of Food and Agricultural Economics 5 (1128): 45–65.
Bhagwati, J. 1958. “Immiserizing Growth: A Geometrical Note.” Review of Economic Studies 25: 201–205.
———. 1978. Foreign Trade Regimes and Economic Development: Anatomy and Consequences of Exchange Control Regimes. Cambridge, MA: Ballinger Publishing Company for National Bureau of Economic Research.
Bouët, A., L. Cosnard, and C. S. Fall. 2019. “Africa in Global Agricultural Trade.” In Africa Agriculture Trade Monitor 2019, edited by A. Bouët and S. Odjo. Washington, DC: IFPRI.
Bouët, A., L. Cosnard, and D. Laborde. 2017. “Measuring Trade Integration in Africa.” Journal of Economic Integration 32 (4): 937–977.
Bouët, A., C. Estrades, and D. Laborde. 2014. “Differential Export Taxes along the Oilseeds Value Chain: A Partial Equilibrium Analysis.” American Journal of Agricultural Economics 96 (3): 924–938.
Bouët, A., K. Pace, and J. Glauber. 2018. “Informal Cross-Border Trade in Africa: How Much? Why? And What Impact?” IFPRI Discussion Paper 1783, IFPRI, Washington, DC.
Boumellassa, H., D. Laborde, and C. Mitaritonna. 2009. “A Picture of Tariff Protection across the World in 2004: MAcMap-HS6, Version 2.” IFPRI Discussion Paper 903, IFPRI, Washington, DC.
Cheptea, A., L. Fontagné, and S. Zignago. 2014. “European Export Performance.” World Economics 150 (1): 25–58.
Debonneuil, M., and L. Fontagné. 2003. Compétitivité. Rapport du CAE. Paris: La Documentation Française for Conseil d’Analyse Economique.
Dedehouanou, F., B. Dimaranan, and D. Laborde. 2019. “Competitiveness of African Agricultural Value Chains.” In Africa Agriculture Trade Monitor 2019, edited by A. Bouët and S. Odjo. Washington, DC: IFPRI.
Del Prete, D., E. Magrini, P. Montalbano, and S. Nenci. 2016. “Global Agro-food Value Chains: New Evidence from SSA.” Mimeo, FAO, Rome.
Diakantoni, A., and H. Escaith. 2014. “Trade in Tasks, Tariff Policy and Effective Protection Rates.” Working paper, World Bank, Washington, DC.
Disdier, A.-C., L. Fontagné, and M. Mimouni. 2008. “The Impact of Regulations on Agricultural Trade: Evidence from the SPS and TBT Agreements.” American Journal of Agricultural Economics 90 (2): 336–350.
Disdier, A.-C., and S. Marette. 2010. “The Combination of Gravity and Welfare Approaches for Evaluating Nontariff Measures.” American Journal of Agricultural Economics 92 (3): 713–726.
FAO (Food and Agriculture Organization of the United Nations). 2003. Trade Reforms and Food Security: Conceptualizing the Linkages. Rome.
Ferrantino, M. 2012. “Using Supply Chain Analysis to Examine the Costs of Non-Tariff Measures (NTMs) and the Benefits of Trade Facilitation.” WTO Staff Working Paper ERSD-2012-02, World Trade Organization, Geneva.
Foster-McGregor, N., F. Kaulich, and R. Stehrer. 2015. “Global Value Chains in Africa.” UNU Working Papers Series 2015-024, United Nations University, Tokyo.
Greenville, J., K. Kawasaki, and R. Beaujeu. 2017. How Policies Shape Global Food and Agriculture Value Chains. OECD Food, Agriculture and Fisheries Papers 100. Paris: OECD Publishing.
Hayakawa, K., and T. Matsuura. 2017. “Trade Liberalization, Market Share Reallocation, and Aggregate Productivity: The Case of the Indonesian Manufacturing Industry.” Developing Economies 55 (3): 230–249.
Hirschman, A. O. 1958. The Strategy of Economic Development. New Haven, CT: Yale University Press.
Jayne, T. S., and S. Jones. 1997. “Food Marketing and Pricing Policy in Eastern and Southern Africa: A Survey.” World Development 25 (9): 1505–1527.
Kherallah, M., N. Minot, R. Kachule, B. G. Soule, and P. Berry. 2001. Impact of Agricultural Market Reforms on Smallholder Farmers in Benin and Malawi. IFPRI Collaborative Research Project Report, vol. 1. Washington, DC: IFPRI.
Kowalski, P., J. L. Gonzalez, A. Ragoussis, and C. Ugarte. 2015. Participation of Developing Countries in Global Value Chains: Implications for Trade and Trade-Related Policies. OECD

294 resakss.org
Trade Policy Papers 179. Paris: OECD Publishing.
Krueger, A. O. 1978. “Alternative Trade Strategies and Employment in LDCs.” American Economic Review 68 (2): 270–274.
Krugman, P. 1991. “The Move toward Free Trade Zones.” Economic Review (Federal Reserve Bank of Kansas City) 76 (6): 5–25.
Lewis, W. A. 1954. “Economic Development with Unlimited Supply of Labor.” Manchester School of Economic and Social Studies 22 (2): 139–191.
Maskus, K. E., T. Otsuki, and J. S. Wilson. 2005. The Cost of Compliance with Product Standards for Firms in Developing Countries: An Econometric Study. Washington, DC: World Bank.
Melitz, M. J. 2003. “The Impact of Trade on Intra-industry Reallocations and Aggregate Industry Productivity.” Econometrica 71 (6): 1695–1725.
Minten, B., L. Randrianarison, and J. F. M. Swinnen. 2009. “Global Retail Chains and Poor Farmers: Evidence from Madagascar.” World Development 37 (11): 1728–1741.
Miroudot, S., D. Rouzet, and F. Spinelli. 2013. Trade Policy Implications of Global Value Chains. Paris: OECD.
Moenius, J. 2006. “The Good, the Bad and the Ambiguous: Standards and Trade in Agricultural Products.” IATRC Summer Symposium 5: 28–30.
Morrissey, O., and V. Leyaro. 2009. “Tanzania.” In Distortions to Agricultural Incentives in Africa, edited by W. Masters and K. Anderson. Washington, DC: World Bank .
Myrdal, G. 1956. An International Economy: Problems and Prospects. New York: Harper.
Nazli, A., R. Siddiqui, and I. Hanif. 2018. “Trade Reforms and Productivity Growth in Manufacturing Industries of Pakistan.” Review of Economics and Development Studies 4 (2): 199–207.
OECD. 2020.”Global Value Chains in Agriculture.” Agriculture Policy Brief, February, Paris.
Otsuki, T., J. S. Wilson, and M. Sewadeh. 2001. “Saving Two in a Billion: Quantifying the Trade Effect of European Food Safety Standards on African Exports.” Food Policy 26 (5): 495–514.
Poulton, C., P. Labaste, and D. Boughton. 2009. “Yields and Returns to Farmers.” In Organization and Performance of Cotton Subsectors in Africa: Learning from Reform Experience, edited by D. Tschirley, C. Poulton, and P. Labaste. Washington, DC: World Bank.
Rodriguez, F., and D. Rodrik. 1999. “Trade Policy and Economic Growth: A Skeptic’s Guide to Cross-National Evidence.” NBER Working Paper W7081, National Bureau of Economic Research, Cambridge, MA.
Schwab, K., and X. Sala-i-Martín. 2017. The Global Competitiveness Report 2017–2018. Geneva: World Economic Forum.
Srinivasan, T. N., and J. Bhagwati. 1999. “Outward-Orientation and Development: Are Revisionists Right?” Center Discussion Paper 806, Economic Growth Center, Yale University, New Haven, CT.
Staboulis, C., D. Natos, and K. Mattas. 2019. “Estimating the Impact of Trade Costs on Agricultural Productivity.” International Journal on Food System Dynamics 10 (3): 278–286.
Subramanian, A., and E. Gelbard. 2000. Trade and Trade Policies in Eastern and Southern Africa. Occasional Paper 196. Washington, DC: International Monetary Fund.
Tanzania Revenue Authority. 2020. “Export Procedures.” Accessed January 23, 2020. www.tra.go.tz/index.php/export-procedures.
UNCTAD (United Nations Conference on Trade and Development). 2002. The Least Developed Countries Report 2002: Escaping the Poverty Trap. Geneva.
Wilson, J., and T. Otsuki. 2002. To Spray or Not to Spray? Pesticides, Banana Exports, and Food Safety. Washington, DC: World Bank.
WTO (World Trade Organization) Trade Policy Review Body. 2016. Trade Policy Review: Report by the Secretariat: Democratic Republic of the Congo. WT/TPR/S/339. Geneva.
Yi, K.-M. 2003. “Can Vertical Specialization Explain the Growth in World Trade?” Journal of Political Economy 111 (1): 52–102.
Chapter 12Adjognon, G. S., L. S. O. Liverpool-Tasie, and T.
Reardon. 2018. “Financing Agricultural Inputs in Africa: Own Cash or Credit?” In Agriculture in Africa: Telling Myths from Facts, edited by L. Christiaensen and L. Demery, 29–37. Directions in Development. Washington, DC: World Bank.
AfDB (African Development Bank). 2020. AfDB Socio-Economic Database 1960-2020. Abidjan.
AGRA (Alliance for a Green Revolution in Africa). 2016. Africa Agriculture Status Report 2016: Progress Toward Agricultural Transformation in Africa. Nairobi.
Anderson, K., and W. A. Masters. 2009. Distortions to Agricultural Incentives in Africa. Washington, DC: World Bank.
Chapter 11 References continued

2020 ReSAKSS Annual Trends and Outlook Report 295
Anderson, K., and S. Nelgen. 2013. Updated National and Global Estimates of Distortions to Agricultural Incentives, 1955 to 2011, Regional Aggregates. Washington, DC: World Bank.
Apell, D., S. Nelgen, and K. Anderson. 2019. “Incentives in Support of the Agricultural Sector in the East African Community.” IGC blog, November 18. International Growth Centre.
Benin, S., and B. Yu. 2013. Complying with the Maputo Declaration Target: Trends in Public Agricultural Expenditures and Implications for Pursuit of Optimal Allocation of Public Agricultural Spending. ReSAKSS Annual Trends and Outlook Report 2012. Washington, DC: IFPRI.
Chirwa, E. W. 2009. “Farmer Organisations and Profitability in Smallholder Tobacco in Malawi.” Working Paper No. 2009/04, University of Malawi Chancellor College, Zomba, Malawi.
Christiaensen, L., and L. Demery. 2007. Down to Earth: Agriculture and Poverty Reduction in Africa. Directions in Development. Washington, DC: World Bank.
de Janvry, A., and E. Sadoulet. 2010. “Agriculture for Development in Sub-Saharan Africa: An Update.” African Journal of Agriculture and Resource Economics 5 (1): 194–204.
Díaz-Bonilla, E. 2015. Macroeconomics, Agriculture and Food Security: A Guide to Policy Analysis in Developing Countries. Washington, DC: IFPRI .
Durevall, D., and N. S. Ndung’u. 2001. “A Dynamic Model of Inflation for Kenya 1974–1996.” Journal of African Economies 10 (1): 91–124.
Evenson, R., and D. Gollin, eds. 2003. Crop Variety Improvement and Its Effect on Productivity: The Impact of International Agricultural Research. Wallingford, UK: CABI Publishing.
FAO (Food and Agriculture Organization of the United Nations). 2016. Africa Regional Overview of Food Security and Nutrition: The Challenge of Building Resilience to Shocks and Stresses. Rome.
———. 2020. FAOSTAT Statistical Database. Accessed January 15, 2020. http://www.fao.org/faostat/en/#home.
Goyal, A., and J. Nash. 2016. Reaping Richer Returns: Public Spending Priorities for Transforming African Agriculture. Washington, DC: World Bank Group.
IFPRI (International Food Policy Research Institute). 2015. Statistics on Public Expenditures for Economic Development (SPEED) database. Accessed on January 15, 2020. http://dx.doi.org/10.7910/DVN/INZ3QK.
IMF (International Monetary Fund). 2020. The Evolution of Public Debt Vulnerabilities in Lower Income Countries. Policy Paper 20/003. Washington, DC.
Irz, X., L. Lin, C. Thirtle, and S. Wiggins. 2001. “Agricultural Productivity Growth and Poverty Alleviation.” Development Policy Review 19 (4): 449–466.
Kalaba, M. 2012. “Non Tariff Measures along the Beira Corridor: Impact on Cross-Border Trade.” Barriers to Agriculture and Trade 2 (5). Johannesburg: NEPAD Business Foundation.
Karugia, J., J. Wanjiku, J. Nzuma, S. Gbegbelegbe, E. Macharia, S. Massawe, A. Freeman, M. Waithaka, and S. Kaitibie. 2011. “The Impact of Non-tariff Barriers on Maize and Beef Trade in East Africa,” ReSAKSS Working Paper 29, IFPRI, Washington, DC.
Kherallah, M., C. L. Delgado, E. Z. Gabre-Madhin, N. Minot, and M. Johnson. 2002. The Road Half
Travelled: Agricultural Market Reform in Sub-Saharan Africa. Washington, DC: IFPRI .
Kristen, J., L. Edwards, and N. Vink. 2009. “South Africa.” In Distortions to Agricultural Incentives in Africa, edited by K. Anderson and W. Masters, 147–174. Washington, DC: World Bank.
Krueger, A. O., M. Schiff, and A. Valdés. 1988. “Agricultural Incentives in Developing Countries: Measuring the Effect of Sectoral and Economy-wide Policies.” World Bank Economic Review 2 (3): 255–272.
———. 1991. Africa and the Mediterranean. The Political Economy of Agricultural Pricing Policy, vol. 3. Baltimore: Johns Hopkins University Press for World Bank.
———. 1992. The Political Economy of Agricultural Pricing Policies: A World Bank Comparative Study. Baltimore: Johns Hopkins University Press for World Bank.
MAFAP (Monitoring and Analysing Food and Agricultural Policies). 2018a. MAFAP database. Accessed on June 10, 2020. www.fao.org/in-action/mafap/data/en/.
———. 2018b. Agricultural Policy Incentives in the Last Decade (2005–2016). Rome: FAO.
Mukasa, A. N. 2018. “Technology Adoption and Risk Exposure among Smallholder Farmers: Panel Data Evidence from Tanzania and Uganda.” World Development 105: 299–309.
Pingali, P., D. Spielman, and F. Zaidi. 2016. “Changing Donor Trends in Assistance to Agricultural Research and Development in Africa South of Sahara.” In Agricultural Research in Africa: Investing in Future Harvests, edited by J. Lynam, N. Beintema, J. Roseboom, and O. Badiane, 139–170. Washington, DC: IFPRI.
296 resakss.org
Schiff, M., and A. Valdés. 1992. A Synthesis of the Economics in Developing Countries. Vol. 4, The Political Economy of Agricultural Pricing Policy, edited by A. Krueger, M. Schiff, and A. Valdés. Baltimore: John Hopkins University Press for World Bank.
Shimeles, A. 2015. “Poverty: Shifting Fortunes and New Perspectives.” In Oxford Handbook of Africa and Economics, edited by J. Li and C. Monga. Oxford: Oxford University Press.
Swinnen, J. F. M., A. Vandeplas, and M. Maertens. 2010. “Governance and Surplus Distribution in Community Value Chains in Africa.” In Food Security in Africa: Market and Trade Policy for Staple Foods in Eastern and Southern Africa, edited by A. Sarris and J. Morrison, 77–98. Cheltenham, UK: Elgar; Rome: FAO.
Thiele, R. 2004. “The Bias against Agriculture in Sub-Saharan Africa: Has It Survived 20 Years of Structural Adjustment Programs?” Quarterly Journal of International Agriculture 42 (1): 5–20.
Thirtle, C., L. Lin, and J. Piesse. 2003. “The Impact of Research-Led Agricultural Productivity Growth on Poverty Reduction in Africa, Asia, and Latin America.” World Development 31 (12): 1959–1975.
Wiebelt, M., R. Herrmann, P. Schenck, and R. Thiele. 1992. “Discrimination against Agriculture in De-veloping Countries?” Kiel Studies 243, Kiel Insti-tute for World Economics, Tübingen, Germany.
World Bank. 2020. World Development Indicators. Washington, DC: World Bank.
Chapter 13Abdullah, A. 2015. “Digital Divide and Caste in Rural
Pakistan.” Information Society 31 (4): 346–356.
———. 2018. “ACP Agribusiness Digitalisation: Big Data Analytics a Pathway towards Sustainability.” CTA Blog, December 11.
AGRA (Alliance for a Green Revolution in Africa). 2017. Africa Agriculture Status Report: The Business of Smallholder Agriculture in Sub-Saharan Africa (Issue 5). Nairobi.
Bhattacharyyaa, S. C., and D. Palitb. 2016. “Mini-Grid Based Off-Grid Electrification to Enhance Electricity Access in Developing Countries: What Policies May Be Required?” Energy Policy 94: 166–178.
Chichaibelu, B., M.-A. Matschuk, and H. Baumüller. Forthcoming. “Data Protection in Africa: A Review of National Legislation and Data Privacy Provisions in Digital Agricultural Services.” ZEF Working Paper, Center for Development Research, University of Bonn, Germany.
Christiaensen, L., and L. Demery. 2018. Agriculture in Africa: Telling Myths from Facts. Directions in Development—Agriculture and Rural Development. Washington, DC: World Bank.
Christy, R., E. Mabaya, N. Wilson, E. Mutambatsere, and N. Mhlanga. 2009. “Enabling Environments for Competitive Agro-industries.” In Agro-industries for Development, edited by C. Da Silva, D. Baker, A. W. Shepherd, C. Jenane, and S. Miranda da Cruz, 136–185. Wallingford, UK: CAB International, with FAO and United Nations Industrial Development Organization.
CTA (Technical Centre for Agricultural and Rural Cooperation). 2018. Big Data for Smallholder Farmers: The Case of MUIIS Uganda. Wageningen, Netherlands.
Eleanya, F. 2019. “Nigeria Uses Less Than 10% of Its Five Submarine Cables’ Capacity—ASCON.” Business Daily, January 3.
FAO (Food and Agriculture Organization of the United Nations) and ITU (International Telecommunications Union). 2016. E-agriculture Strategy Guide. Rome and Geneva.
Feder, G., E. Richard, and D. Zilberman. 1985. “Adoption of Agricultural Innovations in Developing Countries: A Survey.” Economic Development and Change 33 (2): 255–298.
Garcia, J., and T. Kelly. 2015. The Economics and Policy Implications of Infrastructure Sharing and Mutualisation in Africa. Background paper to the World Development Report 2016. Washington, DC: World Bank.
Gillwald, A., and O. Mothobi. 2018. After Access 2018: A Demand-Side View of Mobile Internet from 10 African Countries. Cape Town: Research ICT Africa.
Giuliani, D., and S. Ajadi. 2019. “618 Active Tech Hubs: The Backbone of Africa’s Tech Ecosystem.” GSMA Mobile for Development Blog, July 10.
GSMA (GSM Association). 2018. State of Mobile Internet Connectivity 2018. London.
———. 2019. E-commerce in Agriculture: New Business Models for Smallholders’ Inclusion into the Formal Economy. Report by the GSMA AgriTech Programme. London.
———. 2020. The Mobile Gender Gap Report 2020. London.
Hamilton Research. 2019. “Africa: Africa’s Operational Fibre Optic Network Reaches 1 Million Route Kilometres.” Africa Bandwidth Maps, November 19.
Heideveld, L. 2019. Digitalization in the Agri-food Industry: A Systematic Literature Review. Wageningen University. Wageningen, Netherlands.
Chapter 12 References continued

2020 ReSAKSS Annual Trends and Outlook Report 297
Hernandez, M., S. Kim, B. Rice, and R. Vos. 2020. “IFPRI’s New COVID-19 Food Price Monitor Tracks Warning Signs of Stress in Local Markets.” IFPRI Blog, May 5.
Ighobor, K. 2013. “Africa’s Youth: A ‘Ticking Time Bomb’ or an Opportunity?” Africa Renewal, May.
Kayumova, M. 2017. The Role of ICT Regulations in Agribusiness and Rural Development. Washington, DC: World Bank.
Lohento, K., and H. Tossou. 2018. “Six Business Model Recommendations for ACP Digital Agribusiness Entrepreneurs.” CTA Blog, November 23.
Malabo Montpellier Panel. 2019. Byte by Byte: Policy Innovation for Transforming Africa’s Food System with Digital Technologies. Dakar.
McAfee, A., and E. Brynjolfsson. 2012. “Big Data: The Management Revolution.” Harvard Business Review 90: 60–68.
McKetta, I. 2019. “In-Depth Analysis of Changes in World Internet Performance Using the Speedtest Global Index.” Speedtest Blog, September 4.
Mulauzi, F., and K. S. Albright. 2008. “Information and Communication Technologies (ICTs) and Development Information for Professional Women in Zambia.” International Journal of Technology Management 45 (1/2): 177.
Niang, I., O. C. Ruppel, M. A. Abdrabo, A. Essel, C. Lennard, J. Padgham, and P. Urquhart. 2014. “Africa.” In Climate Change 2014: Impacts, Adaptation, and Vulnerability. Part B: Regional Aspects, 1199–1265. Contribution of Working Group II to the Fifth Assessment Report of the Intergovernmental Panel on Climate Change. Cambridge: Cambridge University Press.
Ohiomoba, I. 2013. “Creating an Enabling
Environment.” ICT Update, October. Wageningen, Netherlands: Technical Centre for Agricultural and Rural Cooperation.
Rabobank Foundation. 2018. “Geodata Puts Precision Agriculture into Farmers’ Orbits: Satellites Support Smallholders.” Rabobank Blog, October 19.
Rich, C. 2017. A Look at New Trends in 2017: Privacy Laws in Africa and the Near East. Arlington, VA: Bureau of National Affairs.
Schumann, R., and M. Kende. 2013. Lifting Barriers to Internet Development in Africa: Suggestions for Improving Connectivity. London: Analysys Mason Limited.
RIA Beyond Access survey 2017/2018, https://researchictafrica.net/2017/06/26/beyond-access-data-research-ict-africa-ria-ict-household-surveys-in-2017/
Trendov, N. M., S. Varas, and M. Zeng. 2019. Digital Technologies in Agriculture and Rural Areas: Status Report. Rome.
Tsan, M., S. Totapally, M. Hailu, and B. K. Addom. 2019. The Digitalisation of African Agriculture Report 2018–2019. Wageningen, Netherlands: Technical Centre for Agricultural and Rural Cooperation and Dalberg Advisers.
UNECA (United Nations Economic Commission for Africa). 2007. National Information and Communication Infrastructure (NICI) e-Strategies: Best Practices and Lessons Learnt. Addis Ababa.
USAID (United States Agency for International Development). 2018. Digital Farmer Profiles: Reimagining Smallholder Agriculture. Feed the Future Program. Washington, DC.
WMO (World Meteorological Organization). 2020. WMO Statement on the State of the Global Climate in 2019. Geneva.
WWW (World Wide Web) Foundation. 2018. Universal Service and Access Funds: An Untapped Resource to Close the Gender Digital Divide. Washington, DC.
Chapter 14Admassie, A. 2015. “The Political Economy of Food
Price Policy in Ethiopia.” In Food Price Policy in an Era of Market Instability: A Political Economy Analysis, edited by P. Pinstrup-Andersen, 133–152. Oxford: Oxford University Press.
AfDB (African Development Bank). 2019. “New African Delivery Units Network Launched.” AfDB News and Events, January 23.
Anderson, J. R. 2008. “Agricultural Advisory Services.” Background Paper for World Development Report 2008, World Bank, Washington, DC.
Andrews, M., L. Pritchett, and M. Woolcock. 2013. “Escaping Capability Traps through Problem Driven Iterative Adaptation (PDIA).” World Development 51: 234–244.
Banful, A. B. 2011. “Old Problems in the New Solutions? Politically Motivated Allocation of Program Benefits and the ‘New’ Fertilizer Subsidies.” World Development 39 (7): 1166–1176.
Barber, M., P. Kihn, and A. Moffit. 2010. Deliverology 101: A Field Guide for Educational Leaders. Thousand Oaks, CA: Corwin Press.
Bates, R. 1981. Markets and States in Tropical Africa: The Political Basis of Agricultural Policies. Berkeley: University of California Press.

298 resakss.org
Bates, R. H., and S. A. Block. 2013. “Revisiting African Agriculture: Institutional Change and Productivity Growth.” Journal of Politics 75 (2): 372–384.
Beintema, N., and G. Stads. 2017. A Comprehensive Overview of Investments and Human Resource Capacity in African Agricultural Research. ASTI Synthesis Report. Washington, DC: IFPRI.
Berazneva, J., and D. R. Lee. 2013. “Explaining the African Food Riots of 2007–2008: An Empirical Analysis.” Food Policy 39: 28–39.
Beschel, R., B. Cameron, J. Kunicova, and B. Myers. 2018. Improving Public Sector Performance through Innovation and Inter-agency Coordination. Kuala Lumpur: World Bank Group Global Knowledge and Research Hub in Malaysia.
Boone, C., and M. Wahman. 2015. “Rural Bias in African Electoral Systems: Legacies of Unequal Representation in African Democracies.” Electoral Studies 40: 335–346.
Brazys, S., P. Heaney, and P. P. Walsh. 2015. “Fertilizer and Votes: Does Strategic Economic Policy Explain the 2009 Malawi Election?” Electoral Studies 39: 39–55.
Caulfield, J. L. 2006. “The Politics of Bureaucratic Reform in Sub-Saharan Africa.” Public Administration and Development 26 (1): 15–26.
Chapoto, A. 2015. “The Political Economy of Food Price Policy in Zambia.” In Food Price Policy in an Era of Market Instability: A Political Economy Analysis, edited by P. Pinstrup-Andersen, 174–194. Oxford: Oxford University Press.
Chirwa, E., and A. Dorward. 2013. Agricultural Input Subsidies: The Recent Malawi Experience. Oxford: Oxford University Press.
Dionne, K. Y., and J. Horowitz. 2016. “The Political Effects of Agricultural Subsidies in Africa: Evidence from Malawi.” World Development 87: 215–226.
EAT-Lancet Commission. 2019. “Food in the Anthropocene: The EAT–Lancet Commission on Healthy Diets from Sustainable Food Systems.” Lancet 393 (10170): 447–492.
Estache, A., G. Garsous, and R. Seroa da Motta. 2016. “Shared Mandates, Moral Hazard, and Political (Mis)alignment in a Decentralized Economy.” World Development 83: 98–110.
Frimpong, E., and J. Sumberg. 2019. “The Long Overhang of Bad Decisions in Agro-industrial Development: Sugar and Tomato Paste in Ghana.” Food Policy 89: Article 101786.
Grindle, M. 1997. “Divergent Cultures? When Public Organizations Perform Well in Developing Countries.” World Development 25 (4): 481–495.
Grossman, G., and J. Lewis. 2014. “Administrative Unit Proliferation.” American Political Science Review 108 (1): 196–217.
Harding, R. 2020. Rural Democracy: Elections and Development in Africa. Oxford: Oxford University Press.
HLPE (High Level Panel of Experts on Food Security and Nutrition). 2019. Agroecological and Other Innovative Approaches for Sustainable Agriculture and Food Systems That Enhance Food Security and Nutrition. HLPE Report 14. Rome: FAO.
Jayne, T., N. Mason, W. Burke, and J. Ariga. 2018. “Review: Taking Stock of Africa’s Second-Generation Agricultural Input Subsidy Programs.” Food Policy 75: 1–14.
Jayne, T. S., and S. Rashid. 2013. “Input Subsidy
Programs in Sub-Saharan Africa: A Synthesis of Recent Evidence.” Agricultural Economics (United Kingdom) 44(6): 547–562.
Johnson, M. C. 2015. “Donor Requirements and Pockets of Effectiveness in Senegal’s Bureaucracy.” Development Policy Review 33(6): 783–804.
Joughin, J., and L. Adupa. 2017. “Agricultural Transformation in Uganda: Governance and Institutional Aspects.” Unpublished, World Bank, Washington, DC.
Kelsall, T. 2018. “Thinking and Working with Political Settlements.” Working paper 541, Overseas Development Institute, London.
Kenya, MoALF (Ministry of Agriculture, Livestock and Fisheries). 2019. Agricultural Sector Transformation and Growth Strategy. Nairobi.
Khan, M. 1995. “State Failure in Weak States: A Critique of New Institutional Economics.” In The New Institutional Economics and Third World Development, edited by J. Harris, J. Hunter, and C. M. Lewis, 71 –86. London: Routledge.
Kjær, A. M. 2015. “Political Settlements and Productive Sector Policies: Understanding Sector Differences in Uganda.” World Development 68: 230–241.
Krueger, A. O. 1992. The Political Economy of Agricultural Pricing Policy: A Synthesis of the Political Economy in Developing Countries. Baltimore: Johns Hopkins University Press.
Krueger, A. O., M. Schiff, and A. Valdés. 1988. “Agricultural Incentives in Developing Countries: Measuring the Effect of Sectoral and Economywide Policies.” World Bank Economic Review 2 (3): 255–271.
Chapter 14 References continued

2020 ReSAKSS Annual Trends and Outlook Report 299
Lewis, J. 2014. “When Decentralization Leads to Recentralization: Subnational State Transformation in Uganda.” Regional & Federal Studies 24 (5): 571–588.
Lindquist, E. 2007. “Organising for Policy Implementation: The Emergence and Role of Implementation Units in Policy.” In Improving Implementation: Organisational Change and Project Management, edited by J. Wanna, 229–256. Canberra: ANU Press.
Mason, N. M., T. S. Jayne, and N. van de Walle. 2017. “The Political Economy of Fertilizer Subsidy Programs in Africa: Evidence from Zambia.” American Journal of Agricultural Economics 99 (3): 705–731.
Mason, N. M., and J. Ricker-Gilbert. 2013. “Disrupting Demand for Commercial Seed: Input Subsidies in Malawi and Zambia.” World Development 45: 75–91.
McMillan, M. 2001. “Why Kill the Golden Goose ? A Political-Economy Model of Export Taxation.” Review of Economics and Statistics 83 (1): 170–184.
Mogues, T. 2015. “Political Economy Determinants of Public Spending Allocations: A Review of Theories, and Implications for Agricultural Public Investment.” European Journal of Development Research 27 (3): 452–473.
Mogues, T., and D. do Rosario. 2016. “The Political Economy of Public Expenditures in Agriculture: Applications of Concepts to Mozambique.” South African Journal of Economics 84 (1): 20–39.
Mogues, T., and T. Olofinbiyi. 2020. “Budgetary Influence under Information Asymmetries: Evidence from Nigeria’s Subnational Agricultural Investments.” World Development 129: 104902.
Mwango, M., M. Kaliba, M. Chirwa, and A. Guarin. 2019. “Informal Food Markets in Zambia: Perspectives from Vendors, Consumers and Policymakers in Lusaka and Kitwe.” Discussion paper, Hivos Foundation, The Hague; International Institute for Environment and Development, London.
Newman, C., and J. M. Page. 2017. “Industrial Clusters: The Case for Special Economic Zones in Africa.” WIDER Working Paper 2017/15, UNU-WIDER Institute for Development Economics Research, Helsinki.
Ngowi, H. P. 2008. “Privatization and ‘Agentification’ of Public Services Delivery in Africa: Extent and Managerial Leadership Implications in Tanzania.” Africa Development 33 (4): 97–116.
Noman, A., and J. Stiglitz. 2015. “Introduction and Overview: Economic Transformation and Learning, Industrial, and Technology Policies in Africa.” In Industrial Policy and Economic Transformation in Africa, edited by A. Noman and J. Stiglitz, 1–29. New York: Columbia University Press.
Olper, A., and V. Raimondi. 2010. “Constitutional Rules and Agricultural Policy Outcomes.” In The Political Economy of Agricultural Price Distortions, edited by K. Anderson, 358–392. New York: Cambridge University Press.
Pan, L., and L. Christiaensen. 2011. “Who Is Vouching for the Input Voucher? Decentralized Targeting and Elite Capture in Tanzania.” World Development 40 (8): 1619–1633.
Phillips, S., I. Goldman, N. Gasa, I. Akhalwaya, and B. Leon. 2014. “A Focus on M&E of Results: An Example from the Presidency, South Africa.” Journal of Development Effectiveness 6 (4): 392–406.
Pinstrup-Andersen, P. 2015. “The Political Economy of Food Price Policy: An Overview.” In Food Price Policy in an Era of Market Instability: A Political Economy Analysis, edited by P. Pinstrup-Andersen, 3–20. Oxford: Oxford University Press.
Pires, R. R. C. 2011. “Beyond the Fear of Discretion: Flexibility, Performance, and Accountability in the Management of Regulatory Bureaucracies.” Regulation & Governance 5 (1): 43–69.
Pollitt, C., C. Talbot, J. Caulfield, and A. Smullen. 2005. Agencies: How Governments Do Things through Semi-autonomous Organizations. London: Palgrave MacMillan.
Poulton, C. 2014. “Democratisation and the Political Incentives for Agricultural Policy in Africa.” Development Policy Review 32 (S2): S101–S122.
Resnick, D. 2015. “The Political Economy of Food Price Policy in Senegal.” In Food Price Policy in an Era of Market Instability: A Political Economy Analysis, edited by P. Pinstrup-Andersen, 296–316. Oxford: Oxford University Press.
Resnick, D. 2017a. “Democracy, Decentralization, and District Proliferation: The Case of Ghana.” Political Geography 59:47–60.
Resnick, D. 2017b. “Governance: Informal Food Markets in Africa’s Cities.” In 2017 Global Food Policy Report, 50–57. Washington, DC: IFPRI.
Resnick, D. 2018. “The Devolution Revolution: Implications for Agricultural Service Delivery in Ghana.” IFPRI Discussion Paper No. 1714, IFPRI, Washington, DC.
Resnick, D. 2019. “Urban Politics in Africa.” In The Routledge Handbook of Democratization in Africa, edited by G. Lynch and P. VonDoepp. London: Routledge.

300 resakss.org
Riedl, R. B., and J. T. Dickovick. 2014. “Party Systems and Decentralization in Africa.” Studies in Comparative International Development 49 (3): 321–342.
Robinson, M. 2007. “The Political Economy of Governance Reforms in Uganda.” Commonwealth & Comparative Politics 45 (4): 452–474.
Rodrik, D. 2007. One Economics, Many Recipes. Princeton: Princeton University Press.
Rwamgisa, P., R. Birner, M. Mangheni, and A. Semana. 2018. “How to Promote Institutional Reforms in the Agricultural Sector? A Case Study of Uganda’s National Agricultural Advisory Services (NAADS).” Development Policy Review 36: 607–627.
Searchinger, T., R. Waite, T. Beringer, A. Forslund, H. Guyomard, C. Le Mouël, S. Manceron, and E. Marajo-Petitzon. 2018. Creating a Sustainable Food Future. Washington, DC: World Resources Institute.
Smit, W. 2016. “Urban Governance and Urban Food Systems in Africa: Examining the Linkages.” Cities 58: 80–86.
Stren, R. 2012. “Cities and Politics in the Developing World: Why Decentralization Matters.” In The Oxford Handbook of Urban Politics, edited by P. John, K. Mossberger, and S. Clarke, 567–588. Oxford: Oxford University Press.
Sulle, A. 2010. “The Application of New Public Management Doctrines in the Developing World: An Exploratory Study of the Autonomy and Control of Executive Agencies in Tanzania.” Public Administration and Development 30 (5): 345–354.
Takeshima, H., and S. Liverpool-Tasie. 2015. “Fertilizer Subsidies, Political Influence and Local Food Prices in Sub-Saharan Africa: Evidence from Nigeria.” Food Policy 54: 11–24.
Tsebelis, G. 2002. Veto Players: How Political Institutions Work. Princeton: Princeton University Press.
Tummers, L., and V. Bekkers. 2014. “Policy Implementation, Street-Level Bureaucracy, and the Importance of Discretion.” Public Management Review 16 (4): 527–547.
UCLG (United Cities and Local Governments). 2019. The Localization of the Global Agendas: How Local Action Is Transforming Territories and Communities. Barcelona.
van de Walle, N. 2001. African Economics and the Politics of Permanent Crisis, 1979–2001. Cambridge: Cambridge University Press.
Whitfield, L., O. Therkildsen, L. Buur, and A. M. Kjær. 2015. The Politics of African Industrial Policy: A Comparative Perspective. Cambridge: Cambridge University Press.
Chapter 15Anderson, K., G. Rausser, and J. Swinnen. 2013.
“Political Economy of Public Policies: Insights from Distortions to Agricultural and Food Markets.” Journal of Economic Literature 51 (2): 423–477.
APRM (African Peer Review Mechanism). 2020. Accessed May 29. https://www.aprm-au.org/.
AU (African Union). 2003. Maputo Declaration on Agriculture and Food Security in Africa.
Assembly/AU/Decl. 7(II). Addis Ababa: African Union Commission.
———. 2014. The Malabo Declaration on Accelerated Agricultural Growth and Transformation for Shared Prosperity and Improved Livelihoods. Addis Ababa: African Union Commission.
AUC (African Union Commission). 2020. The Second Biennial Review Report of the African Union Commission on the Implementation of the Malabo Declaration on Accelerated Agricultural Growth and Transformation for Shared Prosperity and Improved Livelihoods: The 2019 Progress Report to the Assembly. Addis Ababa.
AUC and NPCA (NEPAD Planning and Coordinating Agency). 2011. Mutual Accountability Framework (MAF) for the Comprehensive Africa Agriculture Development Programme. Johannesburg: New Partnership for Africa’s Development (NEPAD).
———. 2016. Guidelines: CAADP Country Implementation under the Malabo Declaration. Johannesburg: New Partnership for Africa’s Development.
Badiane, O., and M. McMillan. 2015. “Economic Transformation in Africa: Patterns, Drivers, and Implications for Future Growth Strategies.” In Beyond a Middle Income Africa: Transforming African Economies for Sustained Growth with Rising Employment and Incomes. ReSAKSS Annual Trends and Outlook Report 2014, edited by O. Badiane and T. Makombe, 107–132. Washington, DC: IFPRI.
Bahiigwa, G., G. Matchaya, and S. Benin. 2013. “Mutual Accountability and Joint Sector Reviews in the Implementation of CAADP.” PowerPoint presentation at Agricultural Sector Meeting,
Chapter 14 References continued

2020 ReSAKSS Annual Trends and Outlook Report 301
Maputo, April 10. http://www.acismoz.com/wp-content/uploads/2017/06/nutual%20accountability%20africa%20agriculture.pdf.
Barrett, C. B., L. Christiansen, M. Sheahan, and A. Shimeles. 2017. “On the Structural Transformation of Rural Africa.” Journal of African Economies 26 (suppl. 1): i11–i35.
Benin, S. 2018. “From Maputo to Malabo: How Has CAADP Fared?” ReSAKSS Working Paper 40, IFPRI, Washington, DC, and Dakar.
Benin, S., J. Karugia, G. Matchaya, and M. Yade. 2020. “Improving Data Quality for the CAADP Biennial Review: A Partnership Initiative Piloted in Five Countries.” IFPRI Discussion Paper 01925, IFPRI, Washington, DC.
Benin, S., J. Ulimwengu, G. Matchaya, T. Makombe, M. Lorka, A. Vodounhessi, and W. Tefera. 2018. “Mutual Accountability in CAADP and Agricultural Transformation.” In Africa Agriculture Status Report: Catalyzing Government Capacity to Drive Agricultural Transformation. Issue 6, 150–184. Nairobi: Alliance for a Green Revolution in Africa.
Benin, S., J. M. Ulimwengu, and W. Tefera. 2018. “The CAADP Inaugural Biennial Review and Africa Agricultural Transformation Scorecard: Results and Areas for Improvement.” IFPRI Discussion Paper 01754, IFPRI, Washington, DC.
Breisinger, C., and X. Diao. 2008. “Economic Transformation in Theory and Practice: What Are the Messages for Africa?” IFPRI Discussion Paper 797, IFPRI, Washington, DC.
Brown, D. L., and Jagadananda. 2007. “Civil Society Legitimacy and Accountability: Issues and Challenges.” Working Paper No. 32, Hauser Center for Nonprofit Organizations and John
F. Kennedy School of Government, Harvard University, Cambridge, MA.
Buchanan-Smith, M., and S. Collinson. 2002. International Humanitarian Action and the Accountability of Official Donors. London: Overseas Development Institute.
Burkina Faso, MASA (Ministry of Agriculture and Food Security). 2014. Burkina Faso: Evaluation des Processus de Revue Conjointe du Secteur Agricule. Ouagadougou.
CAADP MA-M&E JAG (Joint Action Group on Mutual Accountability and Monitoring and Evaluation). 2012. Guidelines to Undertaking Agriculture Joint Sector Reviews. Midrand, South Africa: NEPAD Planning and Coordinating Agency.
Côte d’Ivoire, Ministry of Agriculture. 2019. Biennial Review Country Performance Reporting Template. Abidjan.
Dabla-Norris, E., A. H. Thomas, R. Garcia-Verdu, and Y. Chen. 2013. Benchmarking Structural Transformation across the World. Washington, DC: International Monetary Fund.
Divanbeigi, R., N. Paustian, and N. Loayza. 2016. Structural Transformation of the Agricultural Sector: A Primer. Research & Policy Brief No 2. Kuala Lumpur: World Bank Group Global Knowledge and Research Hub in Malaysia.
Droop, J., P. Isenman, and B. Mlalazi. 2008. Paris Declaration on Aid Effectiveness: Study of Existing Mechanisms to Promote Mutual Accountability between Donors and Partner Countries at the International Level. London: Oxford Policy Management.
FAO (Food and Agriculture Organization of the United Nations). 2012. The State of Food and
Agriculture: Investing in Agriculture for a Better Future. Rome.
———. 2020. Meeting of African Ministers for Agriculture: Declaration on Food Security and Nutrition During the COVID-19 Pandemic. Rome. http://www.fao.org/3/ca8655en/ca8655en.pdf.
Fox, J. A. 2015. “Social Accountability: What Does the Evidence Really Say?” World Development 72:346–361.
Franklin, K., and J. Oehmke. 2019. “Building African Agribusiness through Trust and Accountability.” Journal of Agribusiness in Developing and Emerging Economies 9 (1): 22–43.
Ghana, MoFA (Ministry of Food and Agriculture). 2014. Ghana: Joint Sector Review Assessment: Advancing Mutual Accountability through Comprehensive, Inclusive, and Technically Robust Review and Dialogue. Accra.
Gollin, D., D. Lagakos, and M. E. Waugh. 2014. “The Agricultural Productivity Gap.” Quarterly Journal of Economics 129 (2): 939–993.
Herrendorf, B., R. Rogerson, and A. Valentinyi. 2014. “Growth and Structural Transformation.” In Handbook of Economic Growth. Vol. 2, edited by P. Aghion and S. N. Durlauf, 855–941. Oxford: Elsevier.
Jayne, T. S., J. Chamberlin, and R. Benfica. 2018. “Africa’s Unfolding Economic Transformation.” Journal of Development Studies 54 (5): 777–787.
Johnston, D. G., and J. W. Mellor. 1961. “The Role of Agriculture in Economic Development.” American Economic Review 51 (4): 566–593.
Katzenbach, J. R., and D. K. Smith. 1993. “The Discipline of Teams.” Harvard Business Review 71 (2): 111–120.
302 resakss.org
Lewis, W. A. 1954. “Economic Development with Unlimited Supplies of Labor.” The Manchester School 22 (2): 139–191.
Lowder, S. K., J. Skoet, and T. Raney. 2016. “The Number, Size, and Distribution of Farms, Smallholder Farms, and Family Farms Worldwide.” World Development 87: 16–29.
Malawi, MoAFS (Ministry of Agriculture and Food Security). 2014. Malawi: Joint Sector Review Assessment: Advancing Mutual Accountability through Comprehensive, Inclusive, and Technically Robust Review and Dialogue. Lilongwe.
———. 2019. Biennial Review Country Performance Reporting Template. Lilongwe.
McMillan, M., and D. Rodrik. 2011. “Globalization, Structural Change and Productivity Growth.” In Making Globalization Socially Sustainable, edited by M. Bacchetta and M. Jansen, 49–84. Geneva: International Labour Organization and World Trade Organization.
McMillan, M. S., and K. Harttgen. 2014. “What Is Driving the ‘African Growth Miracle’?” NBER Working Paper No. 20077, National Bureau of Economic Research, Cambridge, MA.
Mensah, J. T., G. Adu, A. Amoah, K. K. Abrokwa, and J. Adu. 2016. “What Drives Structural Transformation in Sub-Saharan Africa?” African Development Review 28 (2): 157–169.
Mozambique, MINAG (Ministry of Agriculture). 2014. Mozambique: Joint Sector Review Assessment: Advancing Mutual Accountability through Comprehensive, Inclusive, and Technically Robust Review and Dialogue. Maputo.
———. 2019. Biennial Review Country Performance Reporting Template. Maputo.
———. 2020. Mozambique Country SAKSS. Maputo.
NEPAD (New Partnership for Africa’s Development). 2010. Accelerating CAADP Country Implementation: A Guide for Implementors. Midrand, South Africa.
NEPAD Secretariat. 2005. “Comprehensive Africa Agricultural Development Programme: Country-Level Implementation Process.” Concept note based on NEPAD Implementation Retreat, Pretoria, South Africa, October 24–25.
Nhemachena, C., G. Matchaya, and S. Nhlengethwa. 2017. “Strengthening Mutual Accountability and Performance in Agriculture in Southern Africa.” South African Journal of Science 113 (5/6): 50–56.
Niger, Ministry of Agriculture. 2019. Biennial Review Country Performance Reporting Template. Niamey.
OECD (Organisation for Economic Co-operation and Development). 2005. Paris Declaration on Aid Effectiveness. Paris.
———. 2009. Mutual Accountability: Emerging Good Practice. Paris.
Oehmke, J. 2017. “Mutual Accountability Opens Private-Sector Opportunities in African Agriculture.” Choices 31 (4).
Oehmke, J. F., B. Kagniniwa, and K. Franklin. 2018. “A Behavioral Model of Trust-Based Cooperation and Accountability.” Paper presented at International Conference of Agricultural Economists, Vancouver, Canada, July 27–Aug 2.
Oehmke, J. F., S. L. Young, G. Bahiigwa, B. B. Keizire, and L. A. Post. 2018. “The Behavioral-Economics Basis of Mutual Accountability to Achieve Food Security.” Politics and Policy 46: 32–57.
ReSAKSS (Regional Strategic Analysis and Knowledge
Support System). 2013. “Implementing the CAADP Joint Sector Review Guidelines: What Should Be Reviewed?” ReSAKSS Concept Note, ReSAKSS and IFPRI, Washington, DC.
———. 2020. ReSAKSS database. Accessed March 1, 2020. https://www.resakss.org.
SADEV (Swedish Agency for Development Evaluation). 2012. Mutual Accountability in Practice: The Case of Mozambique. Karlstad.
Senegal, MoARE (Ministry of Agriculture and Rural Equipment). 2014. Senegal: Evaluation des Processus de Revue Conjointe du Secteur Agricule. Dakar.
Timmer, P. 2007. “The Structural Transformation and the Changing Role of Agriculture in Economic Development: Empirics and Implications.” Henry Wendt Lecture, American Enterprise Institute, Washington, DC, October 30.
Timmer, P., and S. Akkus. 2008. “The Structural Transformation as a Pathway out of Poverty: Analytics, Empirics and Politics.” Working Paper Number 150, Center for Global Development, Washington, DC.
Togo, Ministry of Agriculture. 2019. Biennial Review Country Performance Reporting Template. Lome.
Uganda, MAAIF (Ministry of Agriculture, Animal Industry and Fisheries). 2012. Uganda JSR Report. Kampala.
Vance, A., P. B. Lowry, and D. L. Eggett. 2013. “Using Accountability to Reduce Access Policy Violations in Information Systems.” Journal of Management Information Systems 29 (4):
263–289.
World Bank. 2007. World Development Report 2008: Agriculture for Development. Washington, DC.
Chapter 15 References continued
2020 ReSAKSS Annual Trends and Outlook Report 303
———. 2020. World Development Indicators database. Accessed March 1, 2020. https://databank.worldbank.org/source/world-development-indicators .
Chapter 16Abdullateef, I. 2020. “COVID-19: FG Gives Kano 5,318
Metric Tons of Foodstuff.” Federal Ministry of Information and Culture, Nigeria. May 18.
AfDB (African Development Bank). 2020. AfDB Socio Economic Database, 1960–2020. Accessed July 18. http://dataportal.opendataforafrica.org/nbyenxf/afdb-socio-economic-database-1960-2019.
AfDB, OECD (Organisation for Economic Co-operation and Development ), and UNDP (United Nations Development Programme). 2017. African Economic Outlook 2017: Entrepreneurship and Industrialisation. Paris: OECD Publishing.
African Business. 2020. “Rwanda Unveils Social Protection for the Vulnerable During COVID-19.” April 9.
AU (African Union). 2003. The Maputo Declaration on Agriculture and Food Security in Africa. Addis Ababa: African Union Commission.
———. 2020. “Joint Ministerial Declaration and Action Agenda.” Joint Virtual Meeting of the African Ministers Responsible for Agriculture, Trade and Finance on the Impact of COVID-19 on Food and Nutrition Security in Africa, Addis Ababa, July 27.
AUC (African Union Commission). 2014. Malabo Declaration on Accelerated Agricultural Growth and Transformation for Shared Prosperity and
Improved Livelihoods. Addis Ababa.
———. 2020. The Second Biennial Review Report of the African Union Commission on the Implementation of the Malabo Declaration on Accelerated Agricultural Growth and Transformation for Shared Prosperity and Improved Livelihoods: The 2019 Progress Report to the Assembly. Addis Ababa.
AUC and NPCA (NEPAD Planning and Coordinating Agency). 2015. The CAADP Results Framework 2015–2025. Midrand, South Africa: NPCA.
Benin, S., M. Johnson, and B. Omilola. 2010. “Monitoring and Evaluation (M&E) System for the Comprehensive Africa Agriculture Development Programme (CAADP).” ReSAKSS Working Paper 6. Regional Strategic Analysis and Knowledge Support System, Washington, DC.
Bhatia, N. 2020. “Covid-19 Cases in MENA Near 134,000 Mark.” MEED Media. April 23. https://www.meed.com/covid-19-cases-in-mena-near-134000-mark.
Chiejina, N. “Federal Government to Secure €995mn Agricultural Equipment for Farmers.” 2020. The Nation (Nigeria). May 17.
CNBC Africa. 2020. “Ghana Lifts Lockdown on Key Regions as COVID-19 Cases Reach 1,042.” April 20.
Egypt Today. 2020. “Egypt Records 168 New Coronavirus Cases, 13 Deaths.” April 16.
El Wardany, S. 2020. “Wheat’s Biggest Buyer Builds Stockpile to Battle Virus.” Bloomberg Quint. May 12.
Ethiopian News Agency. 2020. “Gov’t Strives to Curtail Possible Incidence of Food Insecurity.” April 7.
Fana Broadcasting. 2020. “Addis Ababa Launches Food Rationing for Vulnerable Societies.” May 30.
FAO (Food and Agriculture Organization of the United Nations). 2020. FAOSTAT database. Accessed August 8. http://www.fao.org/faostat/en/#data.
FAO and UNECA (United Nations Economic Commission for Africa). 2018. Regional Overview of Food Security and Nutrition: Addressing the Threat from Climate Variability and Extremes for Food Security and Nutrition. Accra: FAO.
IFPRI (International Food Policy Research Institute). 2015, 2020. Statistics on Public Expenditures for Economic Development (SPEED). Accessed July 18. http://dx.doi.org/10.7910/DVN/INZ3QK.
ILO (International Labour Organization). 2020. Statistics and databases. Accessed July 9. http://www.ilo.org/ilostat.
Larnyoh, M. T. 2020. “Ghanaian Government Orders Suspension of Demurrage, Storage Rent Charges on All Cargoes.” Pulse. April 20.
NEPAD (New Partnership for Africa’s Development). 2013. African Agriculture: Transformation and Outlook. Johannesburg.
———. 2015. “Countries with Compacts/Investment Plans—Nov 2015.” http://www.nepad.org/resource/countries-compacts-investmentplans-%E2%80%93-nov-2015.
Nhemachena, C., G. Matchaya, and S. Nhlengethwa. 2017. “Strengthening Mutual Accountability and Performance in Agriculture in Southern Africa.” South African Journal of Science 113 (5/6): 50–56.
Nigerian Tribune. 2020. “Buhari Orders Distribution of 150 Truckloads of Rice Seized by Customs to Nigerians.” April 6.

304 resakss.org
OECD (Organisation for Economic Co-operation and Development). 2009. Mutual Accountability: Emerging Good Practice. Paris.
———. 2020. Creditor Reporting System database. Accessed July 9. https://stats.oecd.org/Index.aspx?DataSetCode=crs1.
Rwanda, Ministry of Trade and Industry. 2020. Official press release. Accessed September 22. http://www.minicom.gov.rw/fileadmin/minicom_publications/Press_Release/Itangazo_ryo_kumenyesha.pdf.
UNCTAD (United Nations Conference on Trade and Development). 2020. UNCTADSTAT database. Accessed July 21. http://unctadstat.unctad.org/wds/ReportFolders/reportFolders.aspx?sCS_ChosenLang=en.
UNICEF. 2020. “Nutrition.” Accessed September 22. https://www.unicef.org/mena/nutrition.
Welthungerhilfe and Concern Worldwide. 2019. 2019 Global Hunger Index. Bonn and Dublin.
World Bank. 2020. World Development Indicators database. Accessed July 28. https://databank.worldbank.org/source/world-developmentindicators#.
WHO (World Health Organization). 2020. Global Database on Child Growth and Malnutrition. Accessed September 22. https://www.who.int/nutgrowthdb/about/introduction/en/index5.html.
Chapter 17AUC (African Union Commission). 2014. Decisions,
Declarations, and Resolution: Assembly of the Union, Twenty-Third Ordinary Session. Addis Ababa.
Bouët, A., D. Laborde, F. Traoré, and S. Malhotra. 2019. “Walk the Talk: Nigeria’s Import Prohibitions, Smuggling, and the African Continental Free Trade Agreement.” IFPRI blog, December 20.
Goyal, A., and J. Nash. 2017. Reaping Richer Returns: Public Spending Priorities for African Agriculture Productivity Growth. Washington, DC: World Bank.
Mockshell, J., and R. Birner. 2020. “Who Has the Better Story? On the Narrative Foundations of Agricultural Development Dichotomies.” World Development 135: 105043.
Chapter 16 References continued


Kicukiro/Niboye KK 341 St 22 P.O. Box 1855Kigali, RwandaTel.: +221-77-761-73-02Email: [email protected]
Regional Strategic Analysis and Knowledge Support System
AKADEMIYA2063Kicukiro/Niboye KK 341 St 22 P.O. Box 1855Kigali, RwandaTel.: +221-77-761-73-02Email: [email protected] | www.akademiya2063.org
International Food Policy Research Institute1201 Eye Street NWWashington, DC 20005 USATel.: + 1 202.862.5600Fax: +1 202.862.5606www.ifpri.org
ISBN: 978-0-89629-394-6
Related Documents


![[Day 2] Center Presentation: ReSAKSS](https://static.cupdf.com/doc/110x72/5552cfd6b4c905920f8b53a8/day-2-center-presentation-resakss.jpg)