Computational Materials Science A Combined Neuro Fuzzy-Cellular Automata Based Material Model for Finite Element Simulation of Plane Strain Compression S. Das* 2 , M.F. Abbod ♠ , Q. Zhu* 1 , E.J. Palmiere ♦ , I.C. Howard* and D.A. Linkens ♠ IMMPETUS Institute for Microstructural and Mechanical Process Engineering, The University of Sheffield ♣ School of Engineering and Design, Brunel University, Uxbridge UB8 3PH ♠ Department of Automatic Control and Systems Engineering, ♦ Department of Engineering Materials *Department of Mechanical Engineering University of Sheffield, Sheffield S1 3JD, UK Corresponding Author: Dr M.F. Abbod Howell Building, School of Engineering and Design, Brunel University, Uxbridge UB8 3PH, United Kingdom Tel: +44-(0)1895267061 email: [email protected] 1 Current address: Holset Engineering Co. Ltd., St Andrew’s Road, Huddersfield HD1 6RA, UK. 2 Current address: Technologist, Automation Division, Tata Steel, Jamshedpur – 831001 India.

Welcome message from author
This document is posted to help you gain knowledge. Please leave a comment to let me know what you think about it! Share it to your friends and learn new things together.
Transcript
Computational Materials Science
A Combined Neuro Fuzzy-Cellular Automata Based Material Model
for Finite Element Simulation of Plane Strain Compression
S. Das*2, M.F. Abbod♠, Q. Zhu*
1, E.J. Palmiere♦, I.C. Howard* and D.A. Linkens♠
IMMPETUS
Institute for Microstructural and Mechanical Process Engineering, The University of Sheffield
♣♣♣♣School of Engineering and Design, Brunel University, Uxbridge UB8 3PH
♠Department of Automatic Control and Systems Engineering,
♦♦♦♦Department of Engineering Materials
*Department of Mechanical Engineering
University of Sheffield, Sheffield S1 3JD, UK
Corresponding Author:
Dr M.F. Abbod
Howell Building,
School of Engineering and Design,
Brunel University, Uxbridge UB8 3PH,
United Kingdom
Tel: +44-(0)1895267061
email: [email protected]
1 Current address: Holset Engineering Co. Ltd., St Andrew’s Road, Huddersfield HD1 6RA, UK.
2 Current address: Technologist, Automation Division, Tata Steel, Jamshedpur – 831001 India.
Abstract:
This paper presents a modelling strategy that combines Neuro-Fuzzy methods to
define the material model with Cellular Automata representations of the
microstructure, all embedded within a Finite Element solver that can deal with the
large deformations of metal processing technology. We use the acronym nf-CAFE as
a label for the method. The need for such an approach arises from the twin demands
of computational speed for quick solutions for efficient material characterisation by
incorporating metallurgical knowledge for material design models and subsequent
process control. In this strategy, the cellular automata hold the microstructural
features in terms of sub-grain size and dislocation density which are modelled by a
neuro-fuzzy system that predicts the flow stress. The proposed methodology is
validated on a two dimensional (2D) plane strain compression finite element
simulation with Al-1% Mg alloy. Results from the simulations show the potential of
the model for incorporating the effects of the underlying microstructure on the
evolving flow stress fields. In doing this, the paper highlights the importance of
understanding the local transition rules that affect the global behaviour during
deformation.
Keywords: Cellular Automata, Neuro-Fuzzy, Finite Element, Microstructure Modelling,
1. Introduction
Thermo-mechanical simulations of metal-forming operations typically use the finite
element (FE) method to study the evolution of deformation variables e.g. stress, strain
and temperature. The relationship between the externally applied deformation and the
internally evolving variables can be captured by a material model that is expressed by
physically based equations. Such physically-based relations [1][2] use the
fundamental variables of dislocation density (ρ), sub-grain size (δ) and misorientation
angle (θ) to capture the local hardening and softening phenomena based on the
externally applied deformation. The local effects are summed at the global structural
level to arrive at the structural stress patterns.
Recently, physically-based formulations have utilised the merits of Artificial
Intelligence (AI) tools, particularly the concept of Neuro-Fuzzy (NF) architectures, to
define the material model [3][4]. NF models work well in situations where the
experimental data on the evolution rates of ρ, δ and θ are sparse or difficult to obtain
for the entire workable range of deformation conditions. To carry out simulation
studies at the structural level, the physically-based formulations need to be coded in-
situ within the finite element solver using user-subroutines.
A particular area of interest is the effect of the initial microstructure on the evolution
rates of ρ, δ and θ. Experimental evidence shows that the initial distribution of grain
size, particularly the grain boundaries, play an important role in defining the evolution
rules. An efficient method of capturing the initial and evolving microstructural
information is to use a combination of cellular automata (CA) and finite element (FE)
techniques, a result often termed CAFE [5][6][7]. It uses the scale-invariant spatial
characteristic of CA to define the micro-feature and it links the CA cells to the
integration point of a finite element.
The concept of Cellular Automata was introduced by von Neumann [13]in the early
1940’s for the simulation of self-reproducing automata and population evolution.
Early developments in application were to the fields of fluid dynamics and biological
processes, and recently it has been applied to the simulation of material
microstructure [14][15][16].
In the CAFE framework, the material model is defined by the rate of evolution of ρ, δ
and θ at each time increment. The rate constants used in the evolution equations of ρ,
δ and θ are based on a neuro-fuzzy model which has been developed using the
experimental work reported by Sellars and Zang [10].
This paper reports the concept and development of this new combined neuro-fuzzy
and cellular automata based material model. A schematic illustration of this approach
is shown in Figure 2 for a single element highlighted in this concept. The material
model has been encoded in the user subroutine USDFLD within the finite element
software ABAQUSTM
which was used to study the evolution of the stress patterns at
specific spatial locations in a model of 2D plane strain compression of a Al-1%Mg
alloy. At each time increment of the solver, the FE integration point provides the
strain, strain-rate and temperature to the user-subroutine. These variables are
distributed using simple rules to accommodate the variances of the underlying micro-
features. For the case illustrated in Figure 2, the strains at the grain boundaries and
interiors are designated as εgb and εin. The strains, their rates and temperature
variables are passed to the NF material model to calculate the current value of the
flow stress for each individual CA cell, then the summation of all the stresses from
each CA cell is obtained to present the final stress of the FE cell. The paper shows
that subtle changes in the initial distribution of microstructural features affect the
evolution of the stress patterns and this also varies from point to point within the
deforming model.
2. Experimental Observations
During thermomechanical processing of materials such as aluminium alloys, local
regions deform under conditions that involve continuous change in strain-rate and
temperature. Decreasing strain-rate and changing straining direction have a significant
effect on the evolution of deformation microstructure, texture and any subsequent
recrystallisation behaviour [1][8]. Microbands, as a dislocation substructure, form
during deformation both at room and high temperature in aluminium. The structure is
created by geometrically-necessary dislocations that form walls leading to in-grain
lattice curvatures. The microbands are initially evolved at low strains when a single or
a few slip systems are active, and then become cell blocks or equiaxed subgrains. The
geometrically-necessary boundaries have higher misorientation angles across them
than other dislocation sub-boundaries, and have a significant effect on subsequent
recrystallisation behaviour. During rolling or plane strain compression (PSC)
deformation, the microbands form parallel plates oriented at an average 35° to the
surface or the effective rolling direction.
Zhu et al [1] and Sellars and Zhu [9] state that the mechanism of the effect arises from
the different evolution of the geometrically-necessary dislocation during monotonic
and reversed deformation, or during changes in strain-rate. The dislocation density
within sub-boundaries ρb increases with strain during monotonic deformation as the
spacing between the sub-boundaries δ decreases and misorientation θ across the sub-
boundaries increases according to the relationship δθρ bC /b = , where C (≈1-2
depending on the type of the sub-boundaries) is a geometrical parameter. On the other
hand, the dislocation density decreases with strain after a change in the straining
direction or a decrease in the strain-rate.
The dislocation density initially increases with plastic deformation until the stage
where the increase in dislocation density arising from strain hardening and the
decrease arising from dynamic recovery become dynamically balanced. Then the
dislocation density remains constant with further deformation. When dynamic
recovery becomes significant, substructures such as dislocation cells/sub-grains or
micro-bands form. Experimental observations show that the sub-grain size decreases
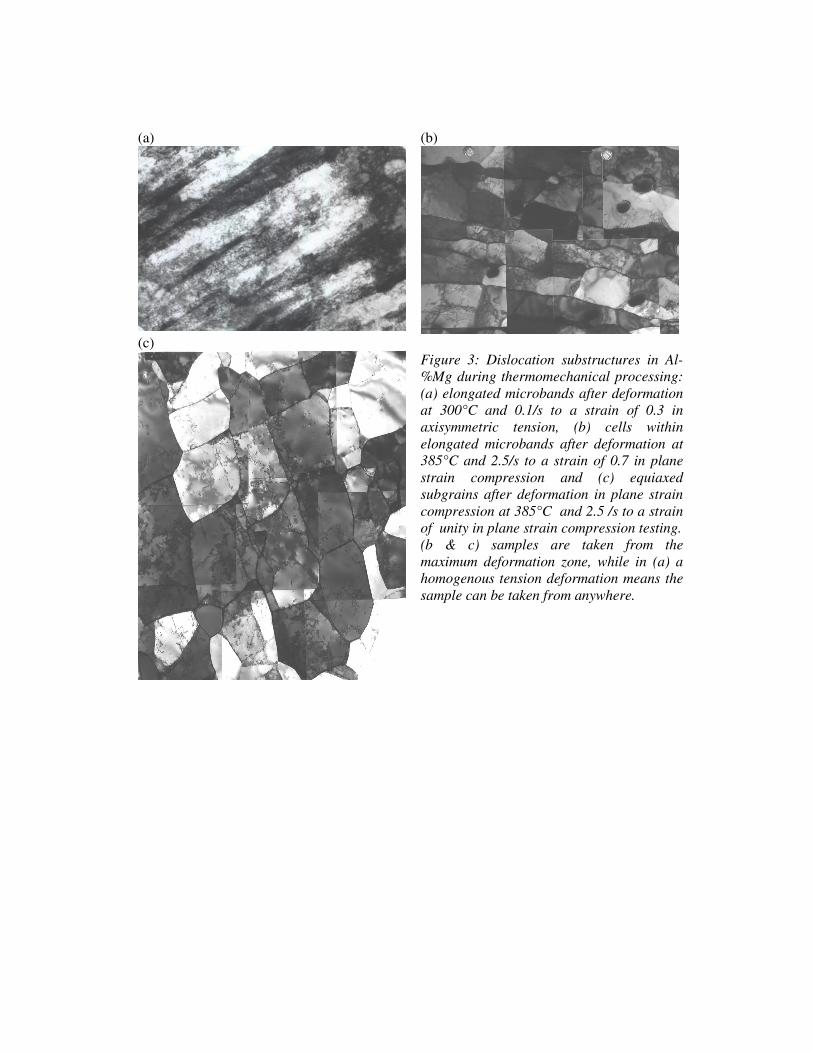
but the misorientation between sub-grains increases with plastic deformation. Figure
3 shows three typical dislocation substructures (Types 1, 2 and 3) that occur during
thermomechanical processing. Hansen and Huang [10] determined that the three
different dislocation substructures have coherent relationships with the orientation of
the grains, as shown in Figure 4. The dislocation substructures represented by Type 1
have grains with orientations to the stress axis concentrated in the region of the lower
half, close to [100], with Taylor factor less than 3.0; Type 2 have grains with
orientations concentrated in the region close to [100] with the Taylor factor less than
2.5; and Type 3 have grains distributed over the remaining area of the triangle (Figure
4a).
3. Material Characteristics Model
The neuro-fuzzy model was developed to predict the parameters of the material
microstructure (ρ, δ and θ) that are used to calculate the stress. The relations are as
follows.
2/1
1 ii MGbρασ ρ = ……………..(1)
δασ δ MGb2= ……………..(2)
m
f
Z
bD
MB
ρσ ⋅=
2
0
……………...(3)
pfii σσσσ δρ ++= ……………...(4)
where the constants α1 = 0.38 and α2 = 0.79 for aluminium alloys, the Taylor factor
for polycrystals is M = 3 , D0 = 1 is the diffusion frequency, G = (29484-13.6T) MPa
where T is the temperature is the shear modulus, b = 0.286×10⁻⁹
m is the Burgers
vector, ρm is the mobile dislocation density, (which is the same order of magnitude as
the internal dislocation density ρi for hot deformation at constant strain rate) and B is
a material constant reflecting solution hardening.
In the NF model, the inputs are the deformation conditions of strain rate, temperature
and deformation level (i.e. strain for a given material) [11][12].
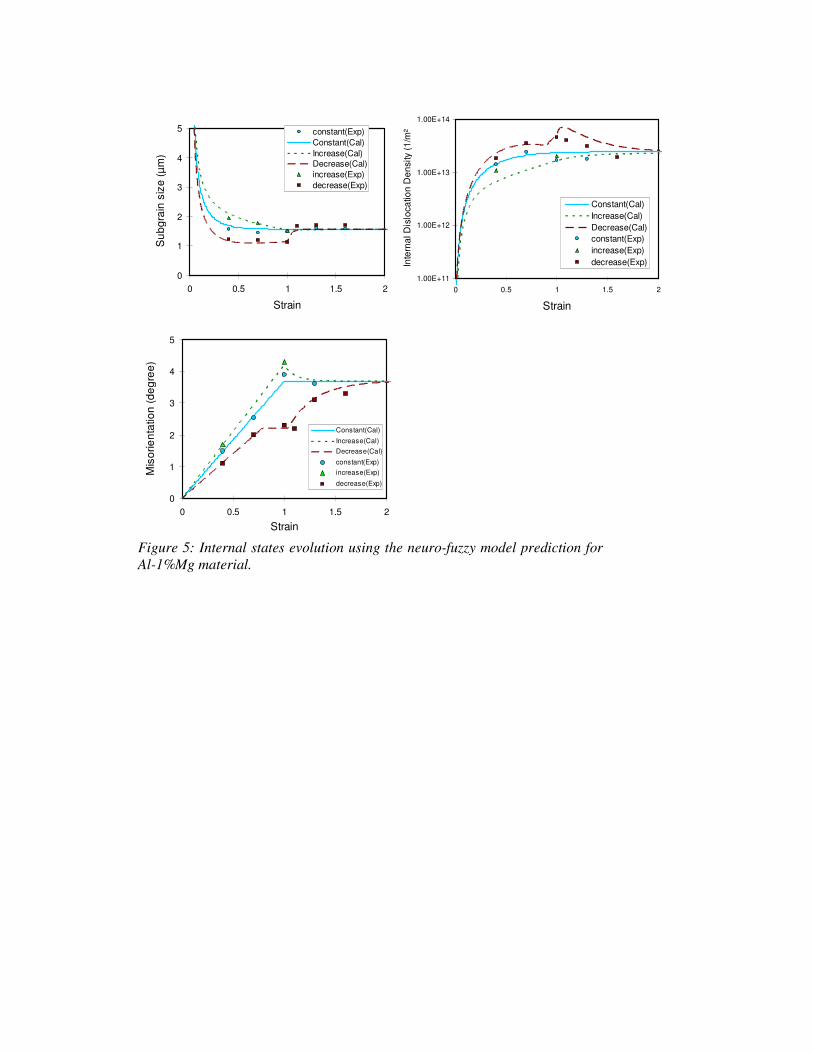
Sample results for modelling the internal dislocation density, sub-grain size and mis-
orientation for a constant strain rate (2.5/s) and changing strain rates are shown in
Figure 5. The solid line is the modelled output, while the dotted points are the
experimental data.
There is no explicit inclusion of the initial spatial grain structure in the approach
outlined above. The representation is in terms of a mean grain size that is used to
evaluate the internal state variables in the NF program. This does not deal particularly
well with important features in material processing, where the evolution of
microstructural features can be very inhomogeneous. What is more, such
microstructural variance can affect the local resistance to further deformation. We
need, therefore, a way of coupling these effects.
4. The Cellular Automata / Finite Element (CAFE) Framework
The CAFE framework uses cellular automata cells to capture the important
microstructural details. It embeds this information within the integration point of an
overlying finite element. The microstructural details are those characterised by the
material region surrounding the CA cell and are defined in terms of logical states e.g.
grain interiors and grain boundaries or lumped quantities of average dislocation
densities. The integration is brought about with the help of user subroutines within
ABAQUS. A more detailed account of the technique can be found in reference [17].
The CAFE framework for a plane strain compression model is formulated below. The
workpiece geometry in plane strain compression is discretised using finite elements of
the order of millimetres (~0.5-1mm). Figure 6a illustrates one such discretisation
where the domain is divided into 10 finite elements.
Each finite element is populated with CA cells, the size of which are suitably adjusted
to the feature of interest. The CA cell associates with itself a material region around
itself. All properties (intrinsic or extrinsic) are homogenous over this material region.
The simulation of a representative microstructure starts by populating these cells with
pre-specified numbers of nuclei. Each nucleus is assigned a tag that defines its spatial
position and its orientation with respect to a fixed global Cartesian coordinate system
(Figure 6b). The orientation is illustrated in Figure 6c for nuclei N1 and N2 with
orientation angles t1 and t2 with respect to the X Cartesian axis. All other cells have
null orientation. The orientation variable varies between zero and 360o.
A suitable neighbourhood is then selected that defines the probable direction of the
moving fronts emerging from the nuclei. The neighbourhood of a cell is usually taken
to be the cell itself and the cells sharing an edge or a corner of the centre cell. If the
cell currently being computed is represented as A (Figure 6d), then using Moore’s
definition of a CA neighbourhood, the cells represented by tpA, btA, leA, rtA
influence the moving front. The state of cell A is modified based on the states of the
surrounding cells. The velocity of the moving front of each nucleus is converted into
the spatial dimension (dX or dY) moved per unit time. At each step, the nuclei will
spread over cells that have a null orientation. This is true for both directions. Growth
is interrupted when the moving fronts of two nuclei meet. This interface forms the
grain boundary having a misorientation defined by the difference of orientations
across the boundaries. This is the form of Figure 6e and is the microstructure linked to
the integration point of an overlying finite element.
Once the grain interiors and grain boundary representation is complete, each CA cell
is associated with an initial dislocation density that varies between pre-specified upper
and lower bounds. Theoretically, the lower bound is equal to zero i.e. the material
region is free from dislocations. Experimentally, however, dislocation densities are of
the order of 1012
/m2 (=10
6 /mm
2) even in well-annealed materials.
Figure 7a shows the simplest construction of a microstructure consisting of nine
grains having four different orientations corresponding to (110), (111), (100) and
(112). At this stage of 2D model formulation, these are numbers that reduce to angles
of 0, 30, 45 and 90 degrees with the principal straining direction. The constructed
microstructure is designed to have similar orientations to the experimentally observed
Al-1%Mg microstructure (Figure 7b) where the different grey levels highlight
different orientations.
This concept was extended to form coarse (Figure 8a) and fine (Figure 8b)
microstructures containing approximately 100 and 300 grains respectively. For these
grains, the orientation distributions are shown in Figure 9a. For the simulations that
follow, these orientation distributions can be classified into biased and non-biased
regions (shaded portions in Figure 9b). The intention was to demonstrate the potential
of the modelling strategy to account for differences in internal response to the applied
strain direction. The biased regions offer a greater resistance to applied strain and
therefore harden faster than the non-biased regions.
A similar approach was used for the CA cells that form part of the grain boundary and
those that form part of the grain interior. Those CA cells forming part of the grain
boundary were allocated a higher strain (as is consistent with the assumption that
grain boundaries act as dislocation sinks) and those within the grain boundary were
ascribed the same values as the macroscopic strain at the integration point of the
element. The NF program was then called to evaluate the stress in terms of the
internal variables of strain, strain-rate and temperature at each CA cell.
5. Model Assembly
Figure 10 shows the PSC finite element model where both the specimen and tool are
modelled using 4-noded quadrilateral elements. All the stock elements were initialised
with a starting temperature of 400oC and the tool elements at 390
oC. Friction at the
tool-stock interface was modelled using the Amonton-Coulomb law with a constant
coefficient of friction of 0.1. The heat transfer coefficient at the interface was 80
kW/m2K. The instantaneous tool velocity changes with the instantaneous specimen
height and was controlled to achieve a constant nominal strain-rate of 3 /s. The stock
thickness was reduced by 50% during the deformation.
The simulation began with the introduction of a representative microstructure into
each finite element. The first simulation set is one in which each finite element
constituting the element set A is populated with the simplified microstructure of
Figure 7a in which only 4 orientations are permitted.
The second simulation set is one in which each element constituting the element set A
is populated with the representative microstructure of Figure 8.
6. Results and Discussions
6.1. Qualitative Shape Changes
Figure 11a shows the deformation pattern of the nine grains constituting the
simplified microstructure of Figure 7. The grains are elongated along the compression
direction. The reasonableness of the combined modelling approach is evident from a
qualitative comparison between the simulated deformed microstructure of Figure 11a
and the experimentally observed microstructure of Al-1%Mg alloy of Figure 11b.
Figure 12 shows the grain structure in element number 3 located at the bottom-left
hand corner of the specimen (third from bottom of element set A (shaded)). The
element was 100 mm by 100 mm in size before deformation, and it changed to 200
mm by 56 mm. The grain structure at the end of the test as simulated using the nf-
CAFE model is shown by the grey dots. Comparing the grain structures before and
after deformation shows a qualitatively reasonable change in grain shape. This change
in grain shape is associated with evolution of dislocation structures and increase in
volume fraction of grain boundary surface.
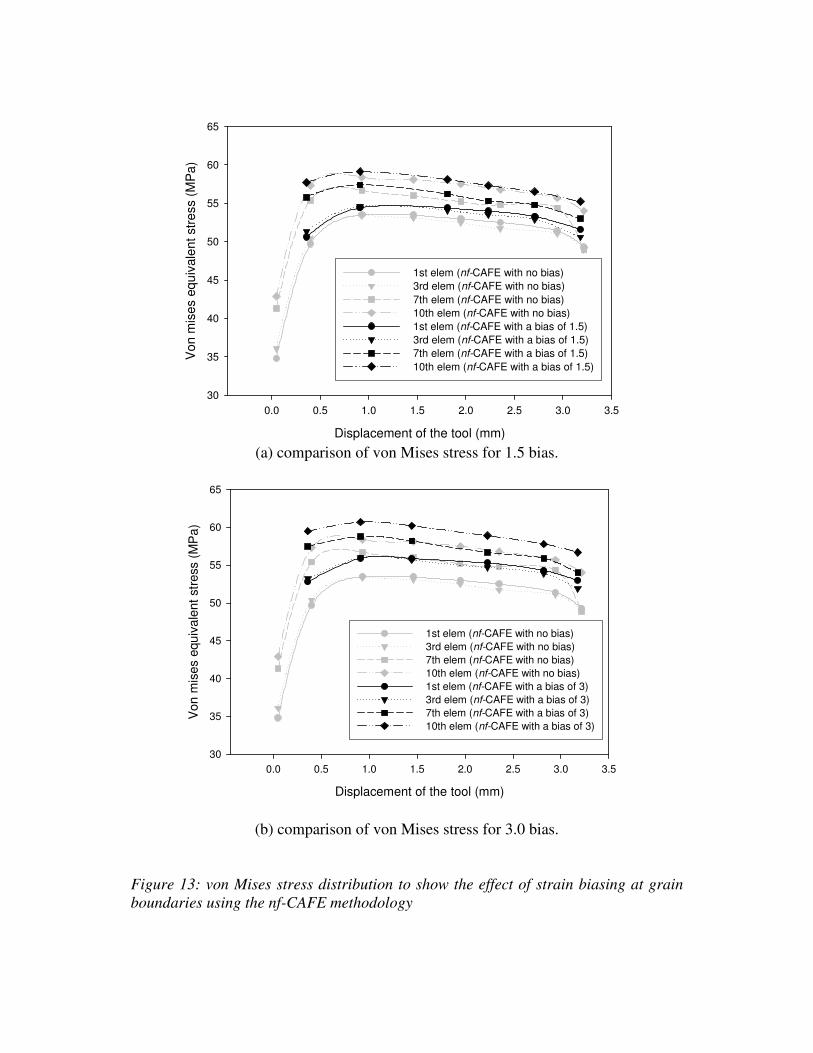
6.2. Effect of biasing grain boundaries
In the above simulation, the nf-CAFE formulation was called at each CA cell and
assumed the same integration point strain at both grain interiors and grain boundaries.
Changing this distribution affects the predictions. Figure 13 displays the effect of
biasing the strain distribution towards the grain boundaries, using bias features of 1.5
and 3.0. With a 1.5 bias, the difference is less than 1MPa. This rises to around 3~4
MPa with a bias of 3.0. This is because the underlying microstructural feature at each
CA cell forms the basis to initialise and evolve its local dislocation density. In other
words, if a CA cell belongs to a grain boundary, a biasing factor increases its
dislocation storage in terms of CA strain. Results show that a variance of around 50%
does not affect the global stress patterns. It is only after a biasing of more than 150%
that a noticeable change is observed.
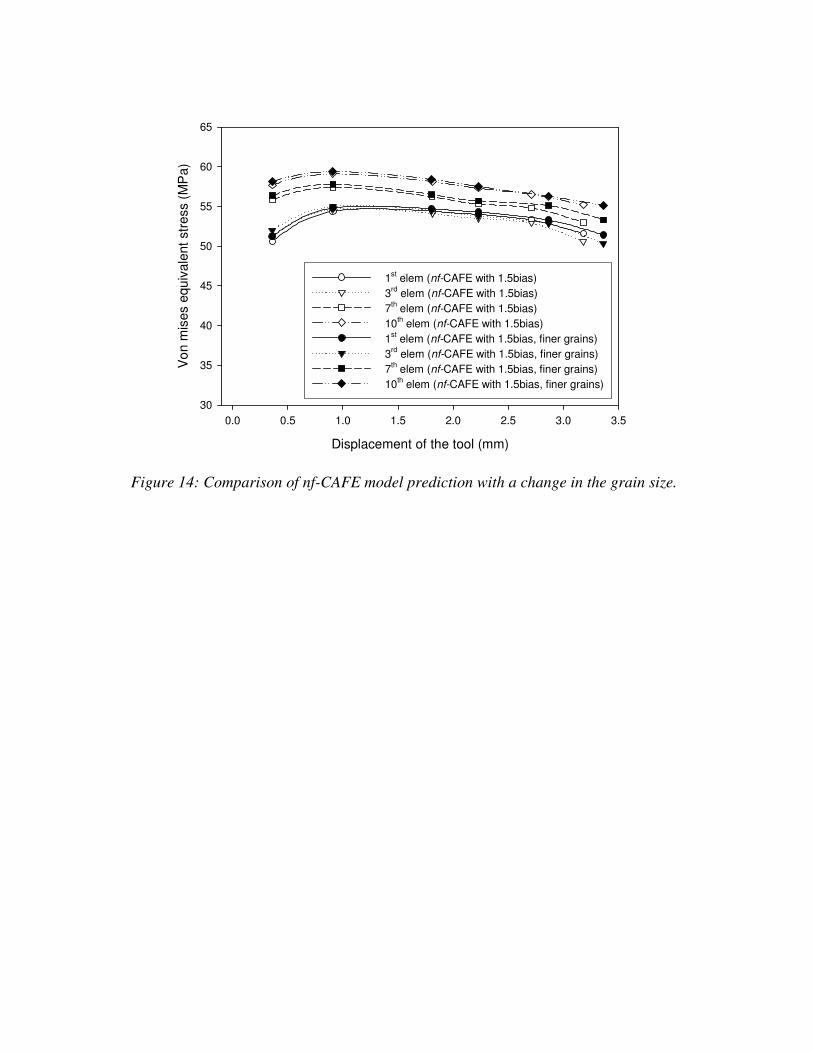
6.3. Effect of grain sizes
Figure 14 displays the stress predictions for a change in the initial grain sizes, one
with large grains and the other with small grains. There is an insignificant difference
of about 0.5 MPa. The distributions are for the two initial microstructures of Figure 8a
and 8b.
6.4. Effect of Orientation Biasing
The effect of orientation biasing on the evolving von Mises stress fields is shown in
Figure 15. In Figure 15a, no biasing is allowed. In Figure 15b, all regions falling
outside the shaded area of Figure 9b are biased with a factor of 20%. This means that
these regions with these orientations should harden faster and this is evident in the
higher stress levels of Figure 15b.
Additionally, there are two regions that are of interest. The letters A and B denote
regions compressed by the centre of the tool and by the edge, respectively. A
superscript star (*) denotes the model with biasing, whilst an absence indicates none.
In region A, near the centreline, the stress changes by about 4 MPa with biasing. It
has a value of 54 MPa in Region A*, but only in 50 MPa in Region A. In the edge-
region, B, biasing affects not only the value of the stress, but also its distribution, as
should be clear from Figure 15.
7. Conclusions
The paper has presented a generic method for representing the microstructure of
deformed metals within the continuum formulation of finite element structural
modelling. The nf-CAFE framework was applied to model the behaviour of the
materials during hot deformation using a hybrid modelling technique. Sensitivity
studies of the initial grain size of the material were conducted. The nf-CAFE model is
based on the internal states and predicts the deformed material properties. The results
of the nf-CAFE numerical models generally compare well with those of models
generated using empirical equations, and their predictions are more accurate in
characterising deformation at the initial and final stages of the deformation.
The material behaviour using the nf-CAFE approach was based on the physically-
based relations that relate the stress evolution to the total dislocation density and the
sub-grain size. A major benefit of this modelling technique is the modelling of the
dynamic evolution of the internal states, while still providing accurate final material
properties in terms of stress/strain relationships. A second advantage is the ability of
the model to predict the material properties at a micro-scale without the need for the
high computational burden that would be imposed by reducing the mesh size of a
straightforward macro-micro finite element model.
The CA technique can analyse the FE cell further into finer cellular structures without
changing the meshing scale. Furthermore, one of the advantages of the neuro-fuzzy
model as used here is the ability to predict the recrystallisation behaviour based on the
material microstructure (ρ and δ) at a CA level. This latter feature is currently under
development.
Acknowledgment
The authors gratefully acknowledge the Engineering and Physical Sciences Research
Council, UK for their financial support under grant no. GR/L50198.
References
[1] Q. Zhu, C.M. Sellars, Effect of Deformation Paths on Static Recrystallisation
Behaviour of an Al-2Mg, Recrystallisation and Related Topics REX’96, eds. T.R.
McNelley et.al, Monterey, California, USA, October (1996) 195-202.
[2] K. Marthinsen, E. Nes, A General Model For Metal Plasticity, Materials
Science and Engineering, A234-236 (1997) 1095-1098.
[3] M.F. Abbod, D.A. Linkens, Q. Zhu, Semi-Physical Modelling of Internal States
for Aluminium Alloys, Materials Science & Engineering A, A333 (2002), 397-
408.
[4] M.F. Abbod, J. Talamantes-Silva, Q. Zhu, D.A. Linkens, Modelling of
Aluminium Rolling Using Finite Elements and Grey-Box Modelling Technique,
Proceedings of the 2002 IEEE International Symposium on Intelligent Control
(ISIC2002), Vancouver, British Columbia, Canada, 27-30 October, eds. C.W.
de Silva and F. Karray, The publisher: IEEE Control Systems Society (2002)
321-326.
[5] S. Das, E.J. Palmiere, I.C. Howard, CAFE: A New Approach to the Modelling
of Multipass Hot Rolling, Symposium on Metal Rolling Processes, IOM,
London, (2001).
[6] S. Das, E.J. Palmiere, I.C. Howard, CAFE: A Tool For Modelling
Thermomechanical Processes, Proceedings of an International Conference on
Thermomechanical Processing: Mechanics, Microstructure, Control. ed.
Palmiere, Mahfouf and Pinna. The University of Sheffield, UK (2003) 296-301.
[7] S. Das, E.J. Palmiere, I.C. Howard, Modelling Recrystallisation During
Thermomechanical Processing Using CAFE, Materials Science Forum, 467-470
(2004) 623-628.
[8] Q. Zhu, M.F. Abbod, C.M. Sellars, D.A. Linkens, Physically-based and Neuro-
Fuzzy Hybrid Modelling of Aluminium Alloys During Thermomechanical
Processing , Conference of Metallurgists CIM (COM 2002), August 11-14,
2002, Montreal, Canada.
[9] C.M. Sellars, Q. Zhu, Microstructural Modelling of Aluminium Alloys during
Thermomechanical Processing, Materials Science and Engineering, A280
(2000) 1-7.
[10] N. Hansen, X. Huang, Microstructure and Flow Stress of Polycrystals and
Single Crystals, Acta Mat., 46, 5 (1998) 1827-1836.
[11] Q. Zhu, M.F. Abbod, J. Talamantes-Silva, C.M. Sellars, D.A. Linkens, J.H.
Beynon, Hybrid Modelling of Aluminium-Magnesium Alloys During
Thermomechanical Processing in terms of Physically-Based, Neuro-Fuzzy and
Finite Element Models, Acta Mat , 51 (2003) 5051-5062.
[12] C.M. Sellars, M.F. Abbod, Q. Zhu, D.A. Linkens, Hybrid Modelling
Methodology Applied To Microstructural Evolution During Hot Deformation
Of Aluminium Alloys,, Int. Conf. on Processing and Manufacturing of
Advanced Materials (THERMEC’2003), Madrid, Spain, 7-11 July, (2003) 27-
34.
[13] J. von Neumann, The general and logical theory of automata, in W. Aspray and
A. Burks, editors, papers of the John von Neumann on Computing and
Computers Theory, vol 12 in the Charles Babbage Institution Reprint Series for
the History of Computing, 1987, MIT Press (1963).
[14] D. Raabe, Computational Materials Science, Wiely-VCH, Weinheim (1998).
[15] D. Raabe, Cellular Automata for materials science with particular reference to
recrystallisation simulation, Annual Review of Materials Research, 32 (2002),
53-76.
[16] D. Raabe, R.C. Becker, Coupling of plasticity finite-elements model with a
probabilistic cellular automation for simulating primary static recrystallisation
in aluminium. Modelling and Simulation in Materials Science Engineering, 8
(2000), 445-462.
[17] S. Das, A. Shterenlikht, I. C. Howard and E. J. Palmiere, A general method for
coupling microstructural response with structural performance, Proceedings of
the Royal Society of London, A, (2006), 462, 2085 – 2096.
List of Figures
Figure 1: Schematic diagram of the nf-CAFE model.
Figure 2: The physically-based model formulation and its linkage to each integration
point of a finite element. However, the linkage is made at each CA cell and its state,
i.e. whether it is a grain boundary or a grain interior.
Figure 3: Dislocation substructures in Al-%Mg during thermomechanical processing:
(a) elongated microbands after deformation at 300°C and 0.1/s to a strain of 0.3 in
axisymmetric tension, (b) cells within elongated microbands after deformation at
385°C and 2.5/s to a strain of 0.7 in plane strain compression and (c) equiaxed sub-
grains after deformation in plane strain compression at 385°C and 2.5 /s to a strain of
unity in plane strain compression testing. (b & c) samples are taken from the
maximum deformation zone, while in (a) a homogenous tension deformation means
the sample can be taken from anywhere.
Figure 4: Dislocation substructures of pure aluminium after room temperature tension
at a strain rate of 8.3X10⁻⁴
/s: (a) Inverse pole figure showing the tensile axis
orientation of 89 grains embedded in polycrystalline specimens strained in the range
0.05-0.34. (b) Type 1 represents the grains with crystallographic dislocation
boundaries, (c) type 2 the grains containing equiaxed dislocation cell/sub-grains and
(d) type 3 the grains with non-crystallographic dislocation boundaries.
Figure 5: Internal states evolution using the neuro-fuzzy model prediction for Al-
1%Mg material.
Figure 6: The three domains of the present CAFE model. (a) The structure domain
divided into a number of finite elements; one element is shown with its expected array
of cells. (b) A population of nuclei in a CA array from which the grain will grow. (c)
Definition of orientations with respect to the loading direction. (d) Moore’s definition
of a CA neighbourhood. (e) A grain structure that emerges from the nuclei of (b).
Figure 7: Simple microstructure with 4 orientations.
Figure 8: Representative microstructures with (a) 100 grains forming a coarse
microstructure. (b) 300 grains forming a fine microstructure.
Figure 9: (a) Orientation distributions for each nucleus used to generate the
microstructure of Figure 7. (b) Highlighted region shows biasing of specific
orientations with respect to a particular loading direction.
Figure 10: Finite element model assembly for the PSC tests.
Figure 11: The simple microstructure of figure 3 after deformation.
Figure 12: Change in microstructure shape for element no. 3, before and after
deformation.

Figure 13: von Mises stress distribution to show the effect of strain biasing at grain
boundaries using the nf-CAFE methodology
Figure 14: Comparison of nf-CAFE model prediction with a change in the grain size.
Figure 15: Comparison of nf-CAFE model prediction with introduction of orientation
biasing. (a) No Biasing. (b) With a biasing of 20%.
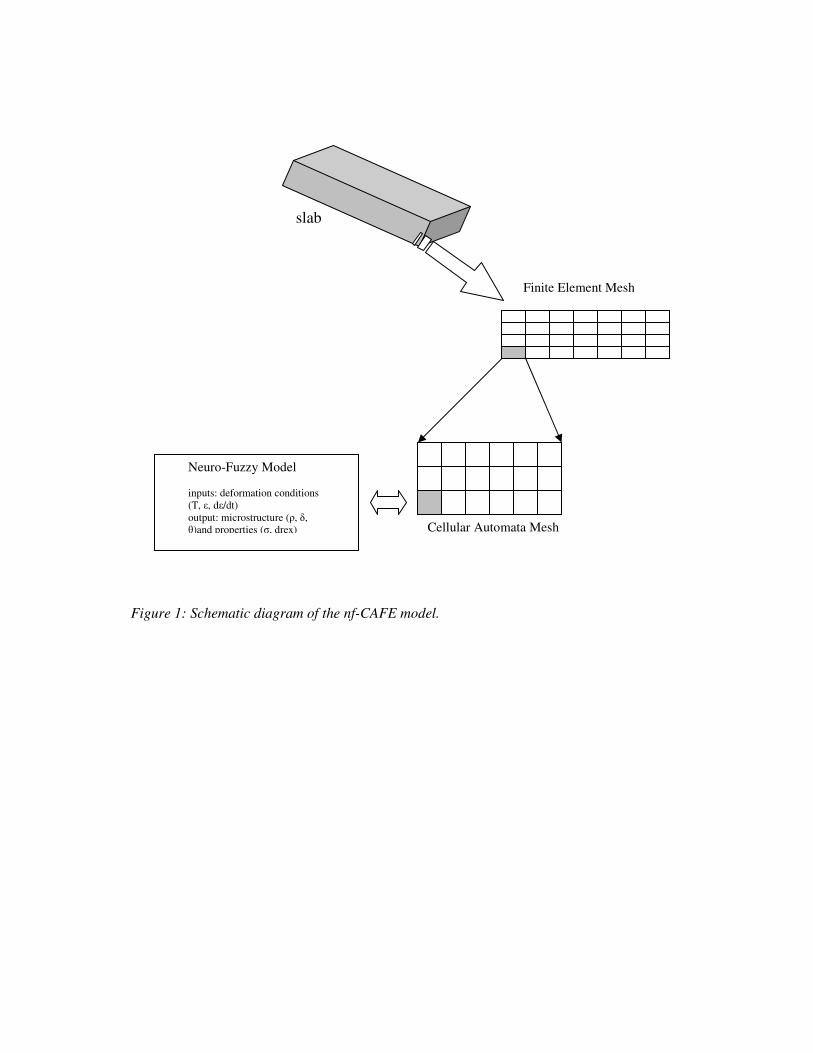
Figure 1: Schematic diagram of the nf-CAFE model.
Finite Element Mesh
Cellular Automata Mesh
Neuro-Fuzzy Model
inputs: deformation conditions
(T, ε, dε/dt)
output: microstructure (ρ, δ,
θ)and properties (σ, drex)
slab
Figure 2: The physically-based model formulation and its linkage to each integration point of
a finite element. However, the linkage is made at each CA cell and its state, i.e. whether it is a
grain boundary or a grain interior.
εin, εgb
Τ, ε, ε’
Neuro-Fuzzy
Model
Σ σ
ρ
Evaluate
σ θ
δ
ε’in, ε’gb
Τ
σ
CA cell
FE
grain
boundary
subgrain
boundary
(a)
(b)
(c)
Figure 3: Dislocation substructures in Al-
%Mg during thermomechanical processing:
(a) elongated microbands after deformation
at 300°C and 0.1/s to a strain of 0.3 in
axisymmetric tension, (b) cells within
elongated microbands after deformation at
385°C and 2.5/s to a strain of 0.7 in plane
strain compression and (c) equiaxed
subgrains after deformation in plane strain
compression at 385°C and 2.5 /s to a strain
of unity in plane strain compression testing.
(b & c) samples are taken from the
maximum deformation zone, while in (a) a
homogenous tension deformation means the
sample can be taken from anywhere.
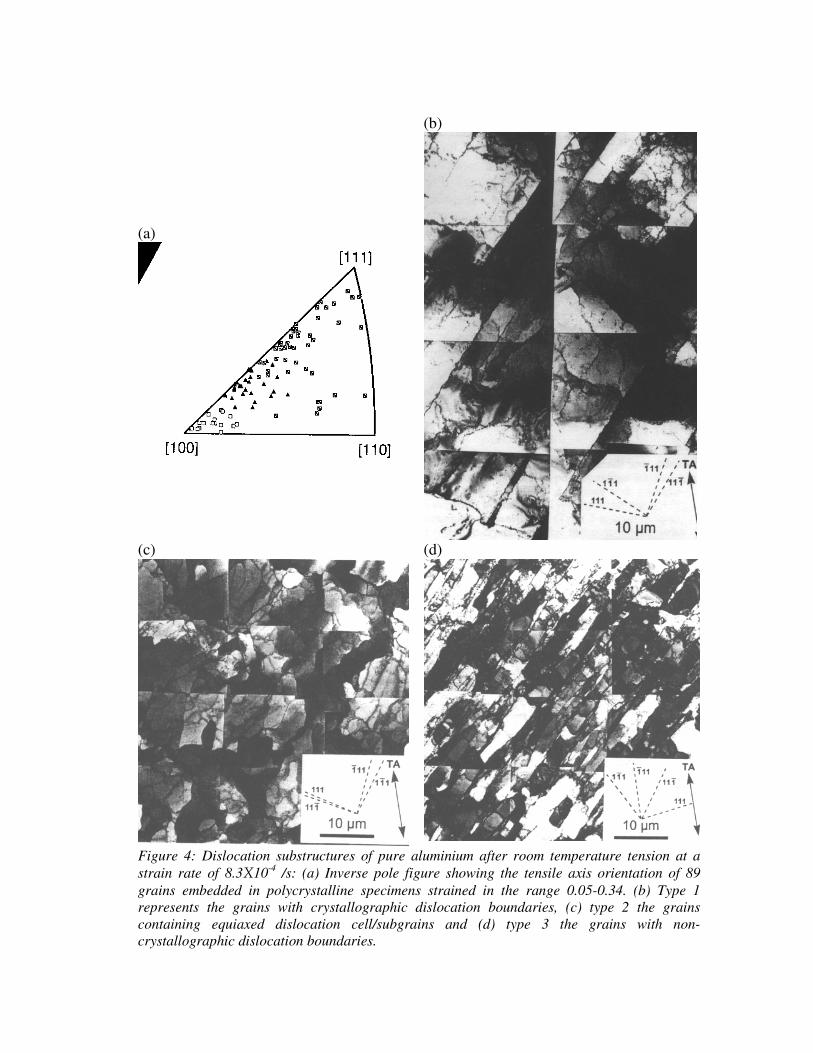
(a)
(b)
(c)
(d)
Figure 4: Dislocation substructures of pure aluminium after room temperature tension at a
strain rate of 8.3X10⁻⁴
/s: (a) Inverse pole figure showing the tensile axis orientation of 89
grains embedded in polycrystalline specimens strained in the range 0.05-0.34. (b) Type 1
represents the grains with crystallographic dislocation boundaries, (c) type 2 the grains
containing equiaxed dislocation cell/subgrains and (d) type 3 the grains with non-
crystallographic dislocation boundaries.
0
1
2
3
4
5
0 0.5 1 1.5 2
Strain
Su
bg
rain
siz
e (
µm
)
constant(Exp)
Constant(Cal)
Increase(Cal)
Decrease(Cal)
increase(Exp)
decrease(Exp)
1.00E+11
1.00E+12
1.00E+13
1.00E+14
0 0.5 1 1.5 2
Strain
Inte
rna
l D
islo
ca
tio
n D
en
sity (
1/m
²)
Constant(Cal)
Increase(Cal)
Decrease(Cal)
constant(Exp)
increase(Exp)
decrease(Exp)
0
1
2
3
4
5
0 0.5 1 1.5 2
Strain
Mis
orie
nta
tio
n (
de
gre
e)
Constant(Cal)
Increase(Cal)
Decrease(Cal)
constant(Exp)
increase(Exp)
decrease(Exp)
Figure 5: Internal states evolution using the neuro-fuzzy model prediction for
Al-1%Mg material.
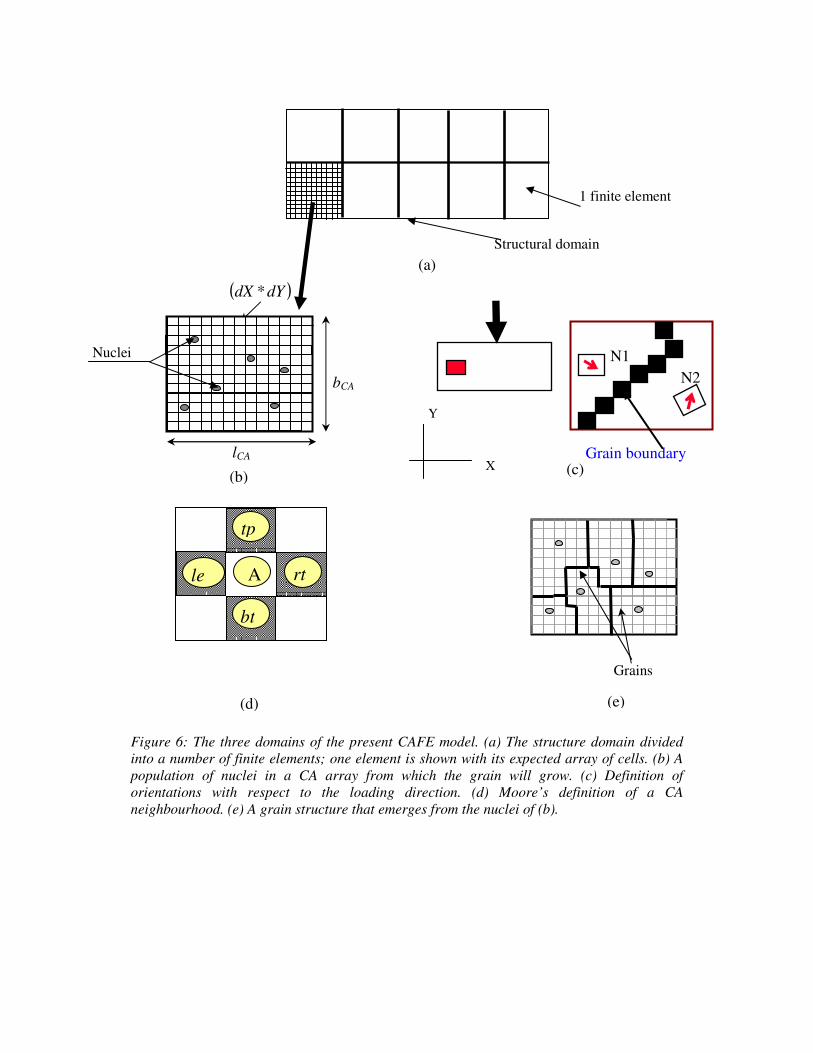
Figure 6: The three domains of the present CAFE model. (a) The structure domain divided
into a number of finite elements; one element is shown with its expected array of cells. (b) A
population of nuclei in a CA array from which the grain will grow. (c) Definition of
orientations with respect to the loading direction. (d) Moore’s definition of a CA
neighbourhood. (e) A grain structure that emerges from the nuclei of (b).
A le rt
tp
bt
(d)
lCA
bCA
( )dYdX *
Nuclei
(b)
Grains
(e)
1 finite element
Structural domain
(a)
X
Y
Grain boundary
N1
N2
(c)
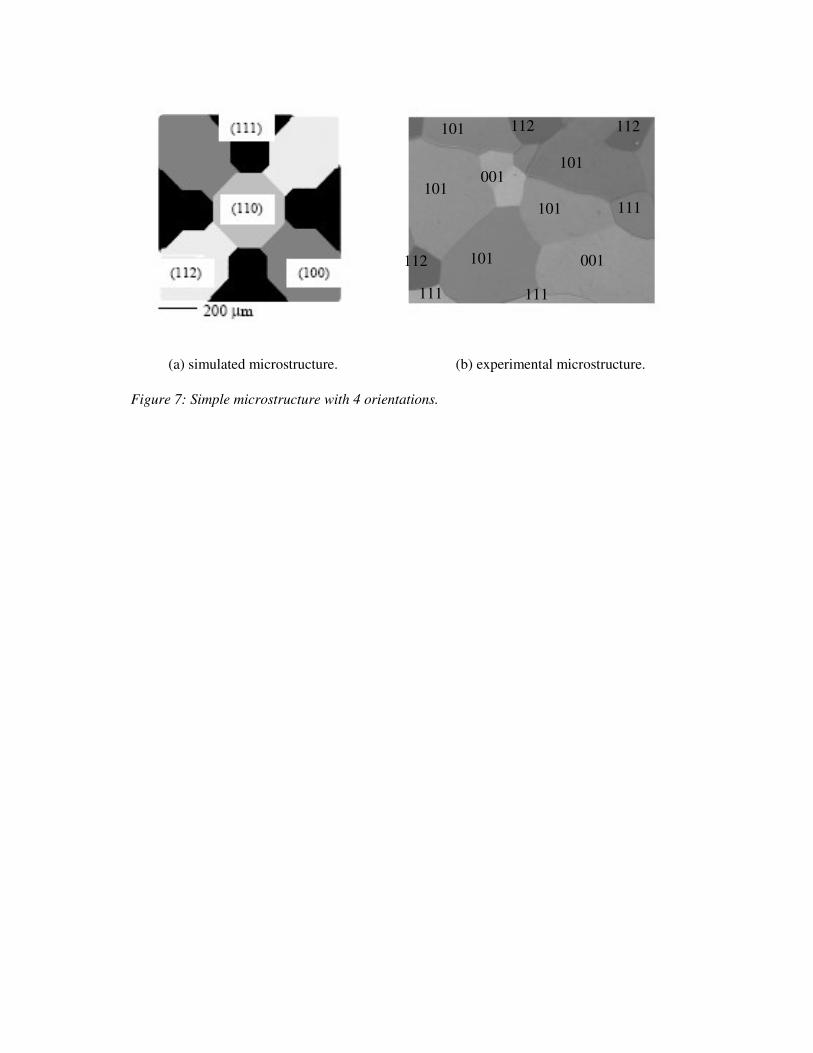
(a) simulated microstructure. (b) experimental microstructure.
Figure 7: Simple microstructure with 4 orientations.
111
001
112
101
112
112
111 111
001
101
101
101
101
Figure 8: Representative microstructures with (a) 100 grains forming a coarse
microstructure. (b) 300 grains forming a fine microstructure.
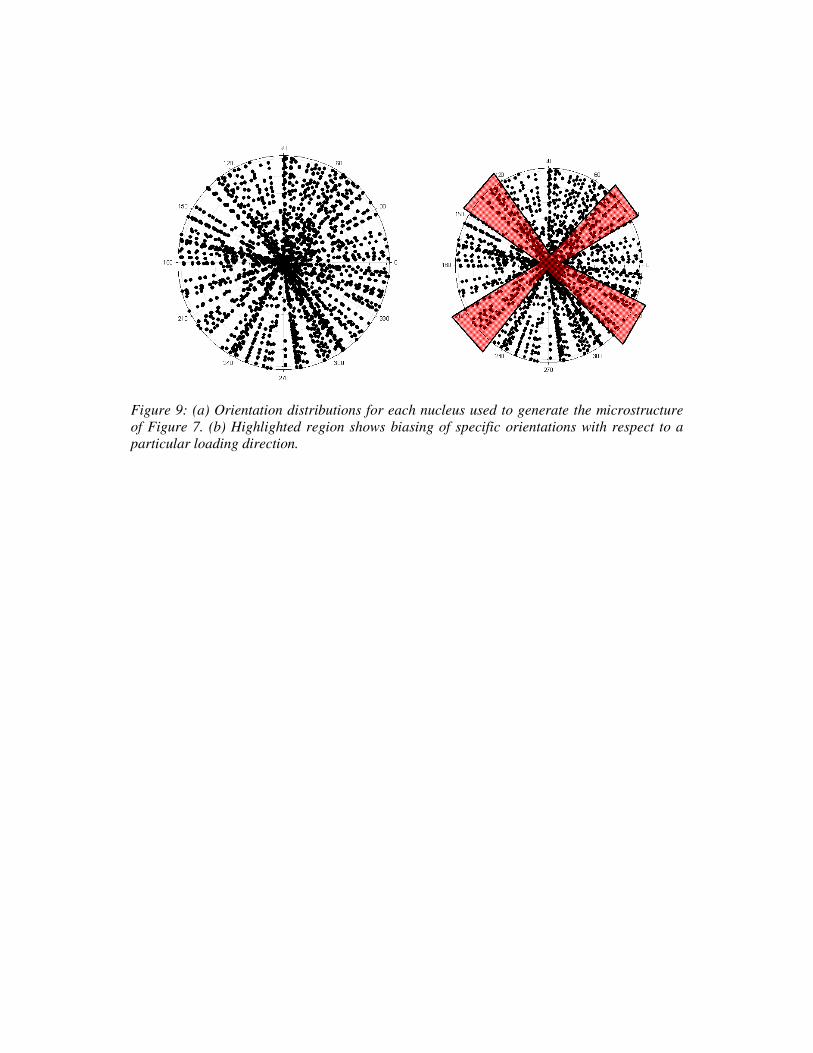
Figure 9: (a) Orientation distributions for each nucleus used to generate the microstructure
of Figure 7. (b) Highlighted region shows biasing of specific orientations with respect to a
particular loading direction.
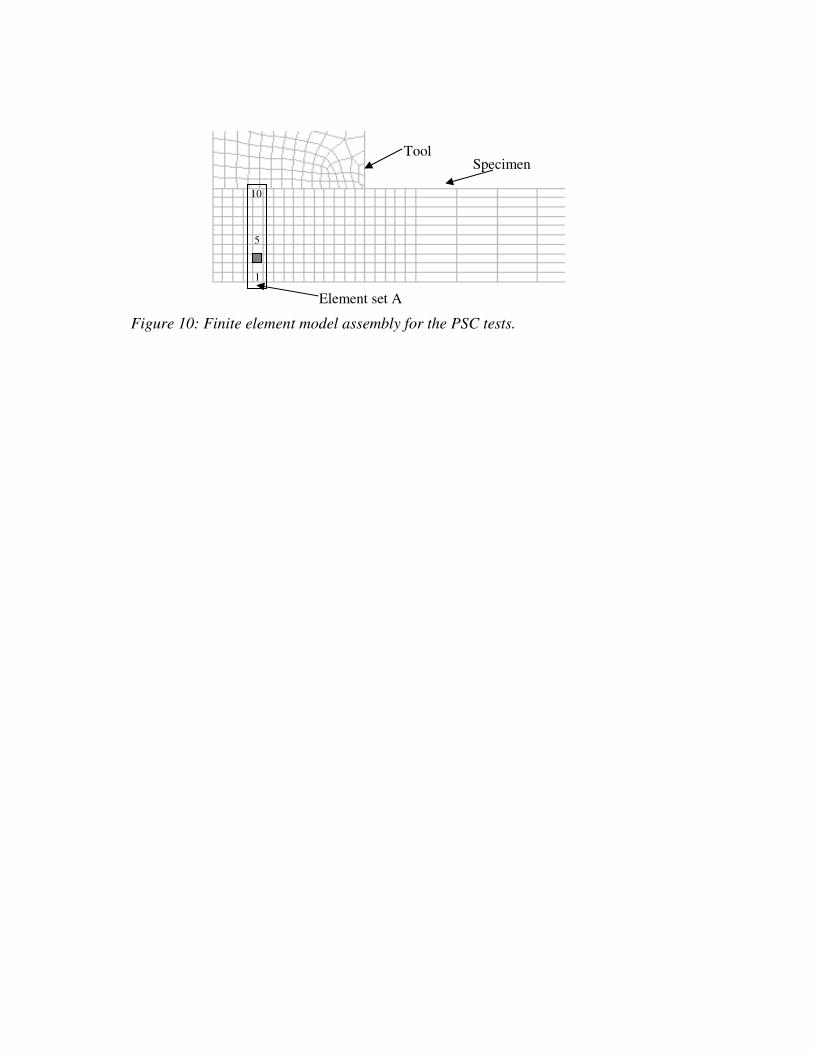
Figure 10: Finite element model assembly for the PSC tests.
Specimen Tool
Element set A
1
5
10
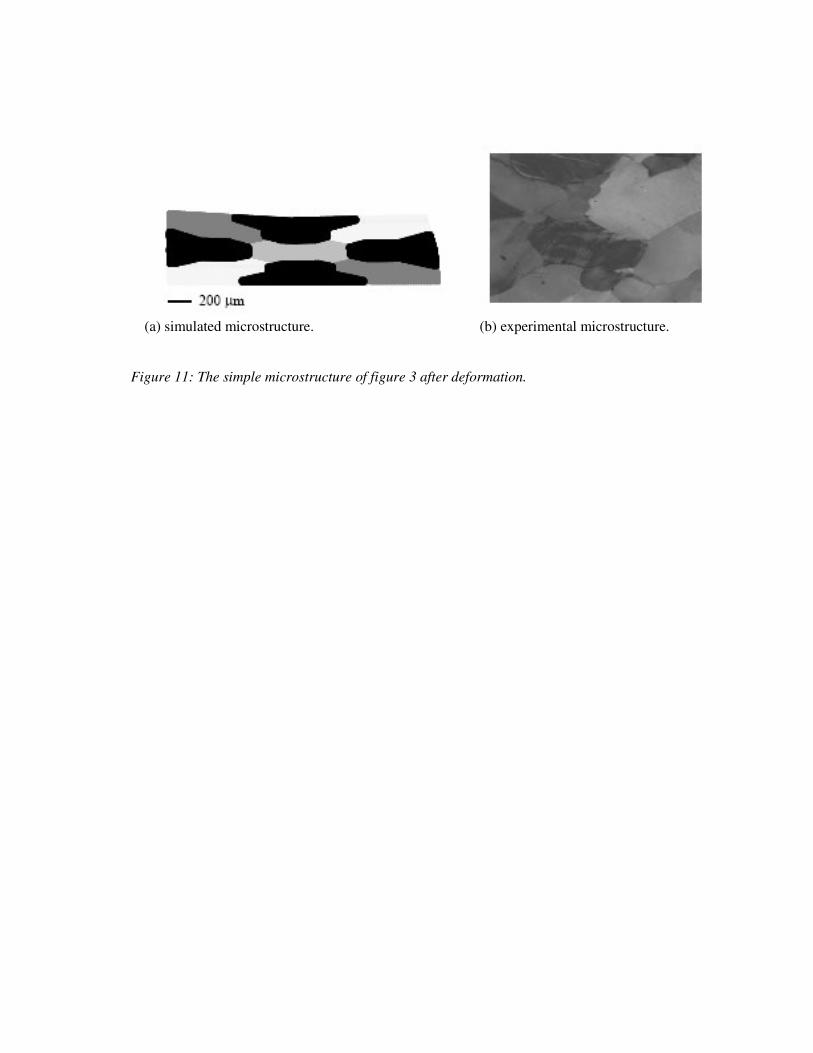
(a) simulated microstructure. (b) experimental microstructure.
Figure 11: The simple microstructure of figure 3 after deformation.
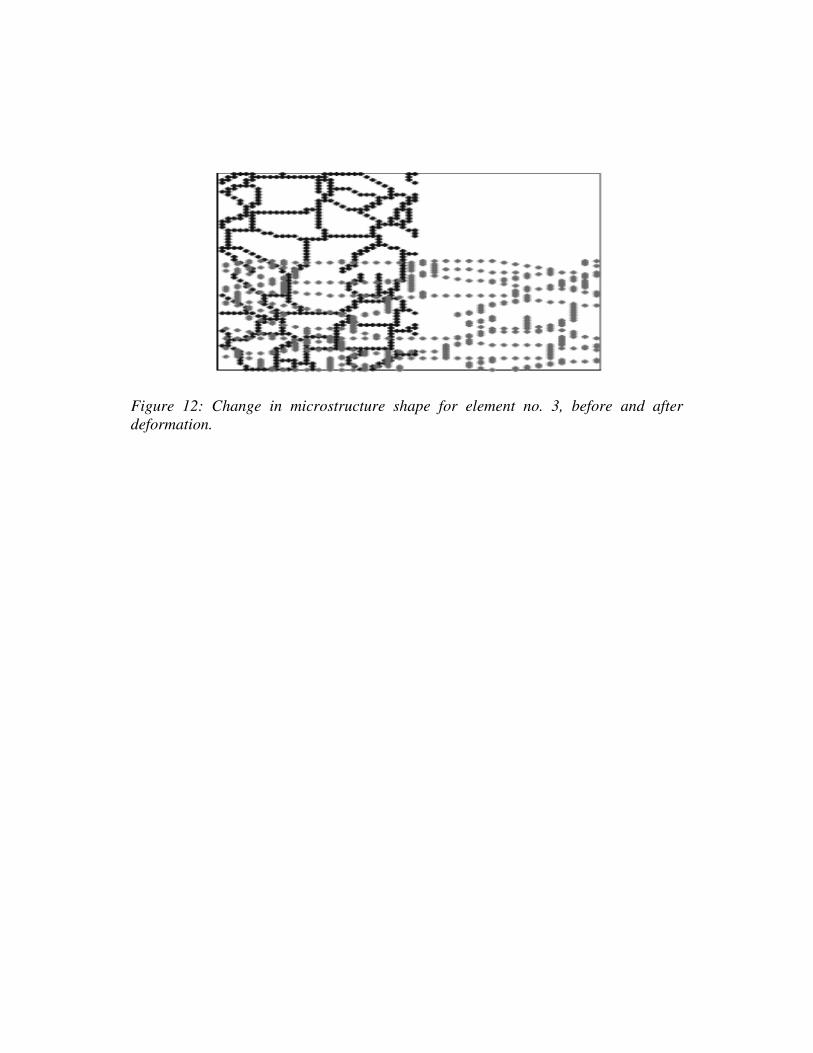
Figure 12: Change in microstructure shape for element no. 3, before and after
deformation.
Displacement of the tool (mm)
0.0 0.5 1.0 1.5 2.0 2.5 3.0 3.5
Vo
n m
ise
s e
qu
ivale
nt str
ess (
MP
a)
30
35
40
45
50
55
60
65
1st elem (nf-CAFE with no bias)
3rd elem (nf-CAFE with no bias)
7th elem (nf-CAFE with no bias)
10th elem (nf-CAFE with no bias)
1st elem (nf-CAFE with a bias of 1.5)
3rd elem (nf-CAFE with a bias of 1.5)
7th elem (nf-CAFE with a bias of 1.5)
10th elem (nf-CAFE with a bias of 1.5)
(a) comparison of von Mises stress for 1.5 bias.
Displacement of the tool (mm)
0.0 0.5 1.0 1.5 2.0 2.5 3.0 3.5
Vo
n m
ise
s e
qu
iva
len
t str
ess (
MP
a)
30
35
40
45
50
55
60
65
1st elem (nf-CAFE with no bias)
3rd elem (nf-CAFE with no bias)
7th elem (nf-CAFE with no bias)
10th elem (nf-CAFE with no bias)
1st elem (nf-CAFE with a bias of 3)
3rd elem (nf-CAFE with a bias of 3)
7th elem (nf-CAFE with a bias of 3)
10th elem (nf-CAFE with a bias of 3)
(b) comparison of von Mises stress for 3.0 bias.
Figure 13: von Mises stress distribution to show the effect of strain biasing at grain
boundaries using the nf-CAFE methodology
Displacement of the tool (mm)
0.0 0.5 1.0 1.5 2.0 2.5 3.0 3.5
Vo
n m
ises e
quiv
ale
nt
str
ess (
MP
a)
30
35
40
45
50
55
60
65
1st elem (nf-CAFE with 1.5bias)
3rd
elem (nf-CAFE with 1.5bias)
7th elem (nf-CAFE with 1.5bias)
10th elem (nf-CAFE with 1.5bias)
1st elem (nf-CAFE with 1.5bias, finer grains)
3rd
elem (nf-CAFE with 1.5bias, finer grains)
7th elem (nf-CAFE with 1.5bias, finer grains)
10th elem (nf-CAFE with 1.5bias, finer grains)
Figure 14: Comparison of nf-CAFE model prediction with a change in the grain size.
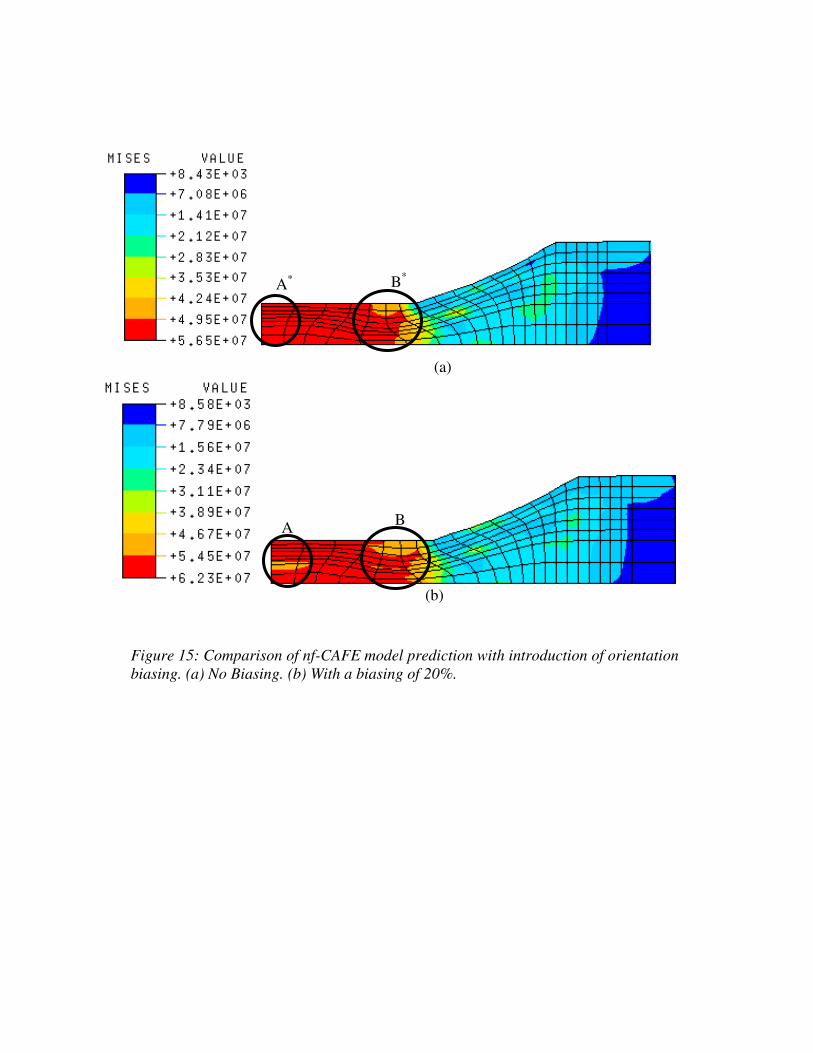
Figure 15: Comparison of nf-CAFE model prediction with introduction of orientation
biasing. (a) No Biasing. (b) With a biasing of 20%.
A B
A* B
*
(a)
(b)
Related Documents