Connor Keef GEOG 3023 Dr. Scott Greene 4 May 2014 A Case Study on the Great Mississippi and Missouri Rivers Flood of 1993 Abstract. There have been many catastrophic floods along the Mississippi River, but one of the most devastating of these floods was the “Great Flood of 1993.” The flood lasted six months, from April through October, and caused more than $15 billion in damage (Larson). To date, it still ranks as the most devastating and costly flooding disaster in United States history. The purpose of this project is to investigate the amount and rate of precipitation that fell over the region to cause the rapid water rise and to investigate the streamflow and hydrology of the Mississippi and Missouri river basins. We will also study changes that have been made since the event to determine the effectiveness of new engineering in minimizing the hazards of river floods today.

Welcome message from author
This document is posted to help you gain knowledge. Please leave a comment to let me know what you think about it! Share it to your friends and learn new things together.
Transcript
Connor Keef
GEOG 3023
Dr. Scott Greene
4 May 2014
A Case Study on the Great Mississippi and Missouri Rivers Flood
of 1993
Abstract. There have been many catastrophic floods along the
Mississippi River, but one of the most devastating of these
floods was the “Great Flood of 1993.” The flood lasted six
months, from April through October, and caused more than $15
billion in damage (Larson). To date, it still ranks as the most
devastating and costly flooding disaster in United States
history.
The purpose of this project is to investigate the amount and rate
of precipitation that fell over the region to cause the rapid
water rise and to investigate the streamflow and hydrology of the
Mississippi and Missouri river basins. We will also study
changes that have been made since the event to determine the
effectiveness of new engineering in minimizing the hazards of
river floods today.

Introduction. The Great Flood of 1993 is one of the most
catastrophic and devastating floods to hit the United States of
America. Mark Twain said in his book Eruption “The Mississippi
River will always have its own way; no engineering skill can
persuade it to do otherwise…” (Johnson et. al. 1). What Twain
has said was shown to be true during the flood. Many levees had
been built along the banks of the Mississippi River and its
tributaries to regulate water levels. Hundreds of these failed
or were overtopped, causing as much as $20 billion in damages
(Johnson et. al. 2). Tens of thousands of people were forced to
evacuate their homes. Whole towns and cities were completely
underwater and millions of acres of farmland was rendered
unusable for years (Larson). So what caused this flood to be so
much more devastating than previous floods? In the following
paper, we will research the ingredients that came together to
produce a flood event of this magnitude.
Literature Review. There had been many floods of the Mississippi
River in the past, including the previous “Great Flood” in 1927.
However, they all paled in comparison to the 1993 Flood. To aid
in our analysis of the Great Flood of 1993, our group selected

several journal and government publications that investigated the
roots of the flood. Many of our sources focused on the
meteorological or climatological viewpoint, with a few others
concentrating on the hydrological aspect of the flood.
Bell and Janowiak (1994) explored the link between the El
Nino/Southern Oscillation and other atmospheric circulations and
the corresponding increased precipitation across the midwestern
United States, especially the Greater Mississippi River basin.
In the journal article “Atmospheric Circulation Associated with
the Midwest Floods of 1993,” the authors say “[the] region was
poised for potentially severe hydrologic problems prior to the
onset of excessive and focused rainfall events in June” (Bell and
Janowiak 682). An anomalously strong trough was centered over
the central North Pacific Ocean while a stronger than normal
upper level ridge was located across the western continental
United States. This, along with a dramatic intensification of
the Pacific jet stream, amplified storm tracks over the central
latitudes of the North Pacific Ocean (Bell 681). The North
Pacific Oscillation was especially strong as well (Bell 684).
They go on to say “the ‘cause’ of many of these events is simply
the temporary displacement of the atmospheric circulation from
its normal state rather than a direct response to external
forcing” (Bell 693). Multiple circulation features came together
to cause the quasi-cataclysmic flood event of 1993 (Bell 694).
Junker, Schneider, and Fauver (1999) investigated the causes
of mesoscale convective complexes and systems (MCSs and MCCs)
which resulted in the Great Flood of 1993. Over the summer of
1993, numerous sites achieved record monthly maximum
precipitation, with the estimated return period for the values at
this magnitude to be more than 100 years (Junker et. al. 701).
During that time, at least 43 different MCSs produced 24-hour
rain totals in excess of five inches (Moore et. al. 862), while
24 events had observed 24-hour rain totals at or exceeding six
inches (Junker et. al. 703). Much of their study concentrated on
analysis of upper air data in determining similarities between
the atmospheric conditions and the surface precipitation
accumulation.
While Junker et. al. investigate the causes of MCSs and MCCs
in the Great Flood of 1993, Kunkel, Changnon, and Angel (1994)
and Moore, Glass, Graves, Rochette, and Singer (2003) studied the
effects of the MCSs and MCCs on the Mississippi River basin and
why the flood was so severe. According to Moore et. al., MCSs
already account for between thirty and seventy percent of
precipitation during the warm season (April through September)
(Moore et. al. 861). Prior to the persistent rainfalls of the
warm season, the Mississippi River basin was plagued with above
normal rainfall, beginning in July, 1992 (Kunkel et. al. 813).
While a rainfall surplus is normally a good thing, it set the
stage for a historical flood which lasted as long as six months.
Rainfall totals between June 1, 1993 and August 31, 1993 were
unprecedented, with most areas in the Mississippi River basin
receiving 400 millimeters (15.75 inches) of rainfall, with many
areas collecting 600 millimeters (23.6 inches). Some areas even
received rainfall in excess of 900 millimeters (35.4 inches)
(Kunkel et. al. 813). From a historical standpoint, the
precipitation that fell has not been seen before since
observations began (Kunkel et. al. 814). For example, the June
through August rainfall amounts for Iowa were estimated as a
1000-year event using the maximum likelihood method and the
generalized extreme value distribution (Kunkel 814). From St.
Louis north to Hannibal, MO, the flood was estimated to be a 500-
year event (Kunkel 815). In St. Louis, MO, the Mississippi River
crested at 15.11 meters (49.5 feet), more than 1.8 m above the
previous record, which occurred in 1973 (Kunkel et. al. 811).
Kunkel’s research brought him to conclude that there were seven
conditions which led to the significance of the flood: record-
breaking rainfall totals, high incidence of moderate to heavy
rain events, persistence of saturated or near-saturated soils,
large-sized rain areas, the orientation of rain areas, a large
number of localized extreme rains capable of producing flash
floods, and below normal seasonal evapotranspiration (Kunkel et.
al. 818-821).
Historically and climatologically, the flood was
devastating. June experienced the greatest departure from the
average precipitation amounts (Guttman et. al. 1786). In July,
several stations recorded precipitation amounts at or above
twelve inches above average, while most sites experienced at
least six inches above average precipitation (Guttman et. al.
1786). Out of a total of 273 sites, forty-three experienced a
new maxima for three month precipitation amounts for May through
July 1993. The experienced precipitation amounts were estimated
to happen once every one-thousand years at several sites.
Precipitation amounts were approximately 200-350 percent above
average (Johnson et. al. 2).
Lins and Slack discuss the long-term trends of streamflow in
the United States by observing data from 395 stations located
around the conterminous United States (Lins and Slack 227). They
found that nationally there is an upward trend in “increasing
annual minimum streamflow” and that the upward trends actually
exceed the downtrends 4 to 1 (Lins and Slack 227). At the high
flows, however, the upward and downward trends are “roughly
equal” (Lins and Slack 228). They found that, hydrologically, the
nation as a whole is becoming wetter but not more extreme in its
events (Lins and Slack 228).
Pitlick points to this revelation, saying that “peak
discharges on the Mississippi and Missouri Rivers were
unprecedented” but the extremity of the event could be skewed
based on differing techniques (Pitlick 142). He goes on to say
that while floods were very common in the area in 1993, that most
rivers “experienced floods less than two times Qm and has return

periods of less than twenty years, and many rivers did not flood
at all” (Pitlick 143). This points toward some discrepancy, in
terms of flood frequency, in exactly how extreme this particular
event was in the Midwest.
The Mississippi River drains nearly 40 percent of the
contiguous United States as well as portions of Canada. This
drainage area is about 1.25 million square miles (Johnson et. al.
1). It should be no surprise that the river is susceptible to
fluctuations due to heavy rainfall in some areas of the basin.
But when the whole upper Mississippi River valley is inundated
with heavy rainfall for several months, the worst case scenario
can happen. And it did in 1993. At the same time, nearly 500
forecast gauges were at or above flood state (Johnson et. al. 1).
Lee Larson, the Chief at the Hydrologic Research Laboratory,
reported that 600 gauges were above flood stage at the same time.
More than one-hundred major rivers and tributaries flooded. The
flooded rivers and failed levies led to sediment being deposited
across a large portion of the Mississippi River Basin.
Data/Methods. To aid in our investigation of the Great Flood of
1993, we collected and analyzed several variables relating to
climatology and hydrology in the St. Louis metropolitan area. A
great majority of our data came from the National Oceanic and
Atmospheric Administration and the United States Geological
Survey.
Climatologically, we collected several pieces of data.
One of which was the monthly summaries for six St. Louis metro
stations: Valley Park, MO, St. Louis Science Center, MO, 7 SSW
St. Charles, MO, St. Charles, MO, Caholia, IL, and St. Louis –
Lambert International Airport, MO. This data was obtained from
the National Climatic Data Center (NCDC). Our data set was from
April 1, 1990, through October 1, 1994, which spans from three
years before the Great Flood of 1993 to one year after the event.
The data set contained total monthly precipitation and the
extreme maximum daily precipitation for that month, in tenths of
millimeters, as well as other variables such as snowfall and
temperature. We also viewed and collected information from the
NCDC on the Palmer Modified Drought Index. We also acquired data
from the United States Historical Climatology Network (USHCN) at
the Carbon Dioxide Information Analysis Center (CDIAC) website.
From a hydrological standpoint, we collected data on streamflow
and discharge from the USGS National Water Information System.
With our raw data, we created several visual aids, most
of which were in the form of graphs. First, we used the monthly
summary data to create a graph showing monthly precipitation for
all six stations. Using this data, we were able to see how much
more rain fell over the region than had the few years previous.
With the Palmer Modified Drought Index images, we created a graph
that showed what the drought situation for the area was. Knowing
this information also helped us determine how abnormal the
monthly precipitation measurements were. Using the data acquired
from the USHCN, we created a time-series graph showing
precipitation from 1878 through 2012. We also created two water
budgets: one showing the calculated average values for the 134
year period and one for 1993, the year of the event. This,
again, showed the abnormality of the event compared to normal.
Using the data from the USGS, we calculated the flood frequency
at St. Louis, and were able to determine what the frequency of
the 1993 flood event would be.

One thing that we observed is that some of the data was
missing for some of the monthly summaries. Also, the units on
the data were extremely confusing. For example, precipitation
used tenths of millimeters while snowfall measurements used
millimeters. Also, we used cubic meters per second for our
discharge data, but the data also had cubic feet per second. So,
while there were not any obvious problems or difficulties with
the data acquisition and analysis, it was important to keep a
watchful eye on our work to make sure we were using the correct
units.
Data Analysis. One of the first things that our group produced were
two water budgets. The first is a running average from 1878-
2012. This is seen in Figure 1. The average wet season begins
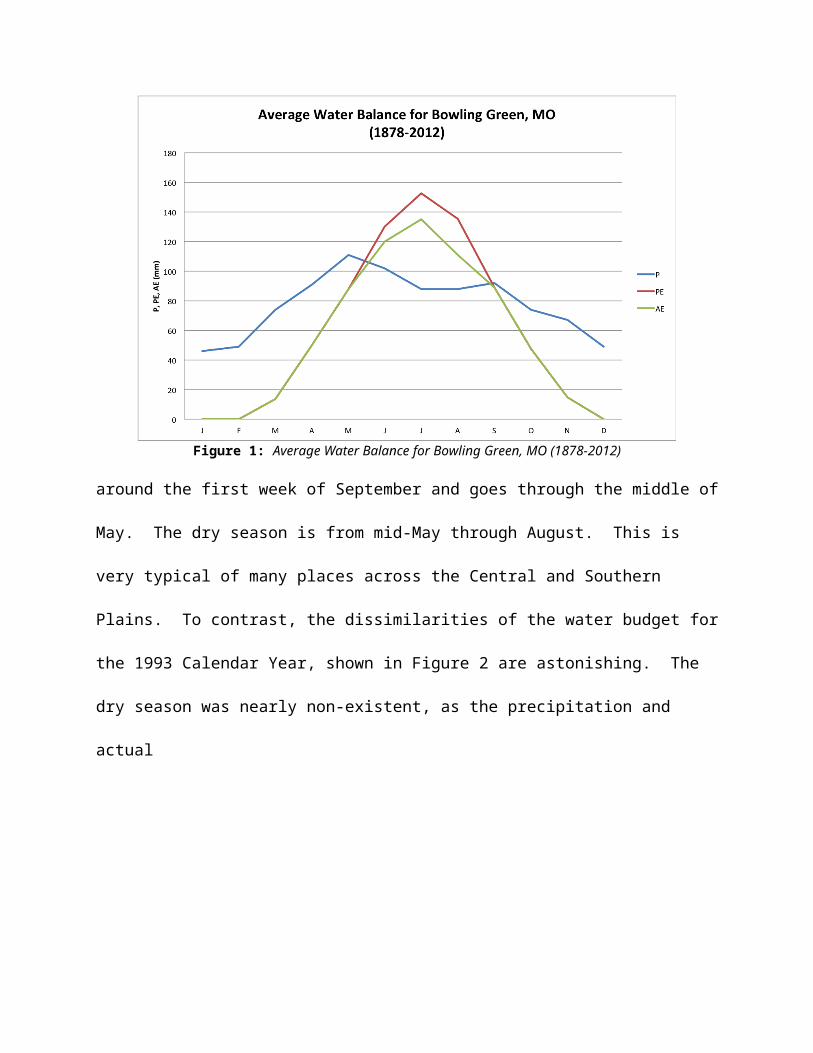
Figure 1: Average Water Balance for Bowling Green, MO (1878-2012)
around the first week of September and goes through the middle of
May. The dry season is from mid-May through August. This is
very typical of many places across the Central and Southern
Plains. To contrast, the dissimilarities of the water budget for
the 1993 Calendar Year, shown in Figure 2 are astonishing. The
dry season was nearly non-existent, as the precipitation and
actual
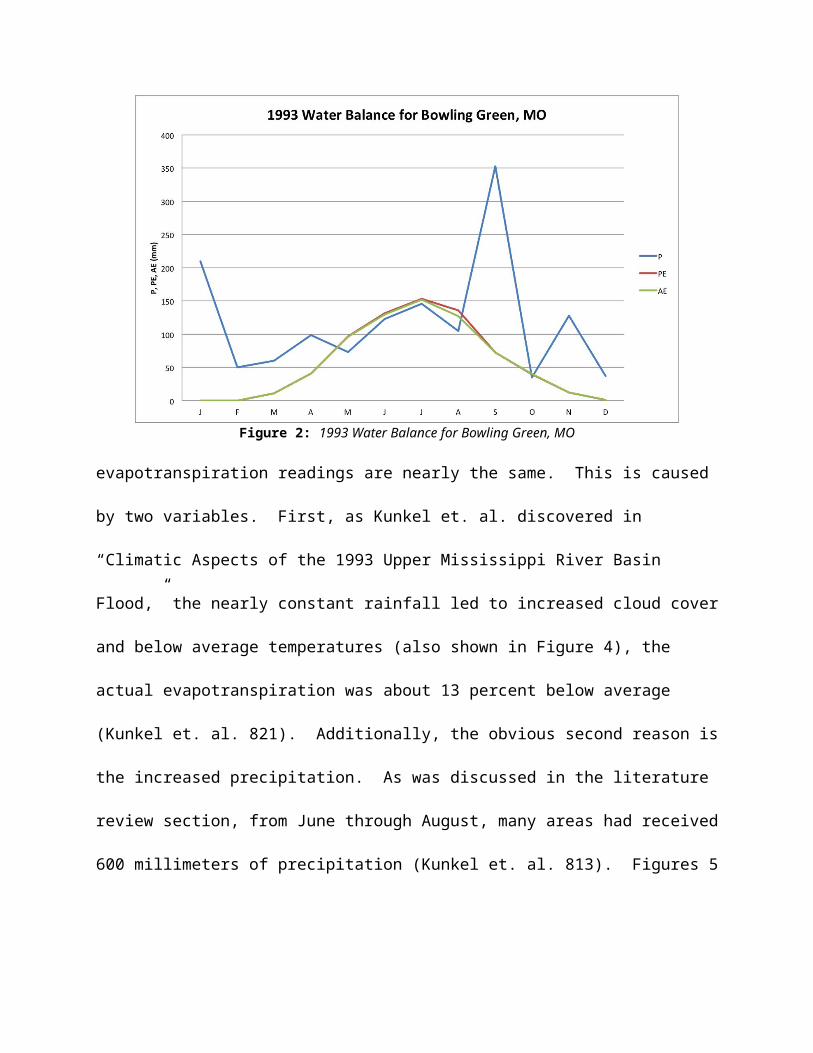
Figure 2: 1993 Water Balance for Bowling Green, MO
evapotranspiration readings are nearly the same. This is caused
by two variables. First, as Kunkel et. al. discovered in
“Climatic Aspects of the 1993 Upper Mississippi River Basin
Flood,” the nearly constant rainfall led to increased cloud cover
and below average temperatures (also shown in Figure 4), the
actual evapotranspiration was about 13 percent below average
(Kunkel et. al. 821). Additionally, the obvious second reason is
the increased precipitation. As was discussed in the literature
review section, from June through August, many areas had received
600 millimeters of precipitation (Kunkel et. al. 813). Figures 5
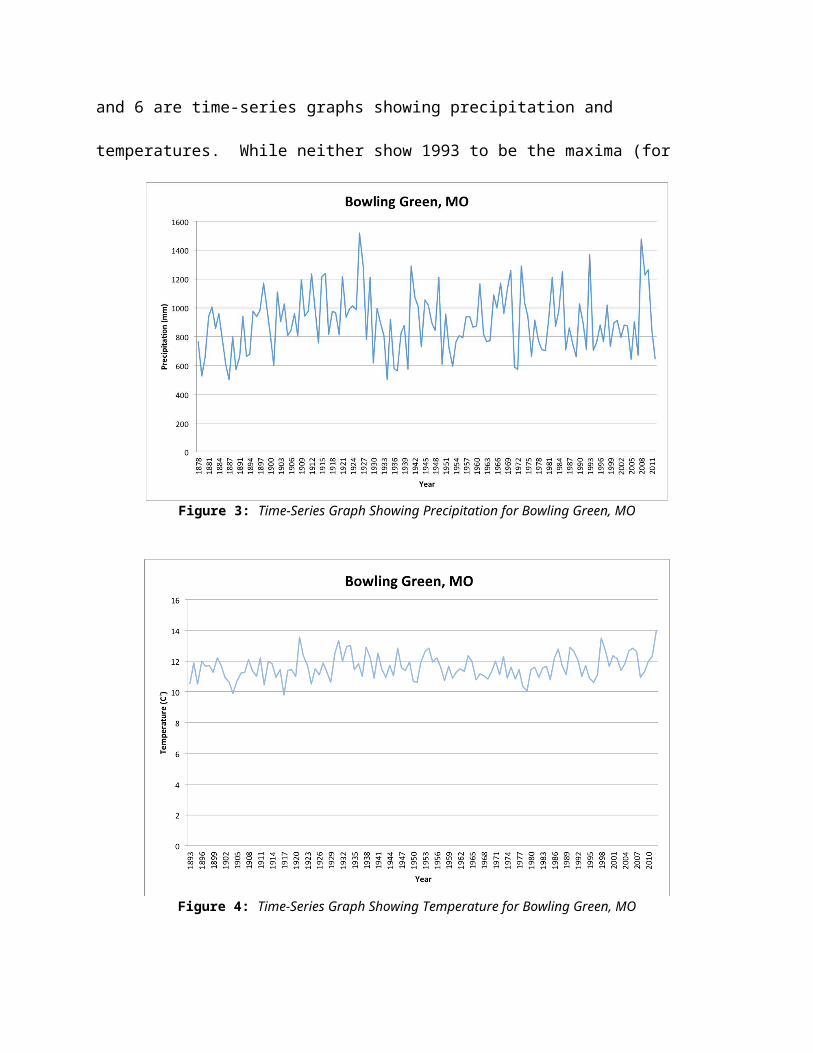
and 6 are time-series graphs showing precipitation and
temperatures. While neither show 1993 to be the maxima (for
Figure 3: Time-Series Graph Showing Precipitation for Bowling Green, MO
Figure 4: Time-Series Graph Showing Temperature for Bowling Green, MO
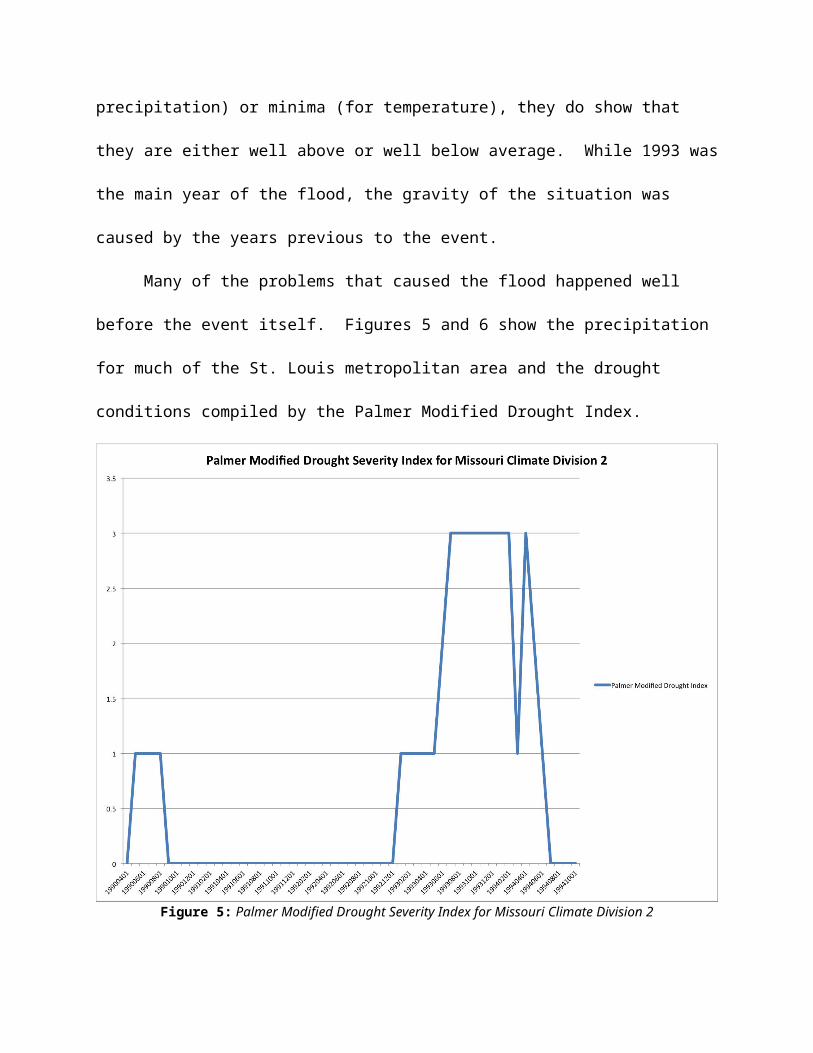
precipitation) or minima (for temperature), they do show that
they are either well above or well below average. While 1993 was
the main year of the flood, the gravity of the situation was
caused by the years previous to the event.
Many of the problems that caused the flood happened well
before the event itself. Figures 5 and 6 show the precipitation
for much of the St. Louis metropolitan area and the drought
conditions compiled by the Palmer Modified Drought Index.
Figure 5: Palmer Modified Drought Severity Index for Missouri Climate Division 2
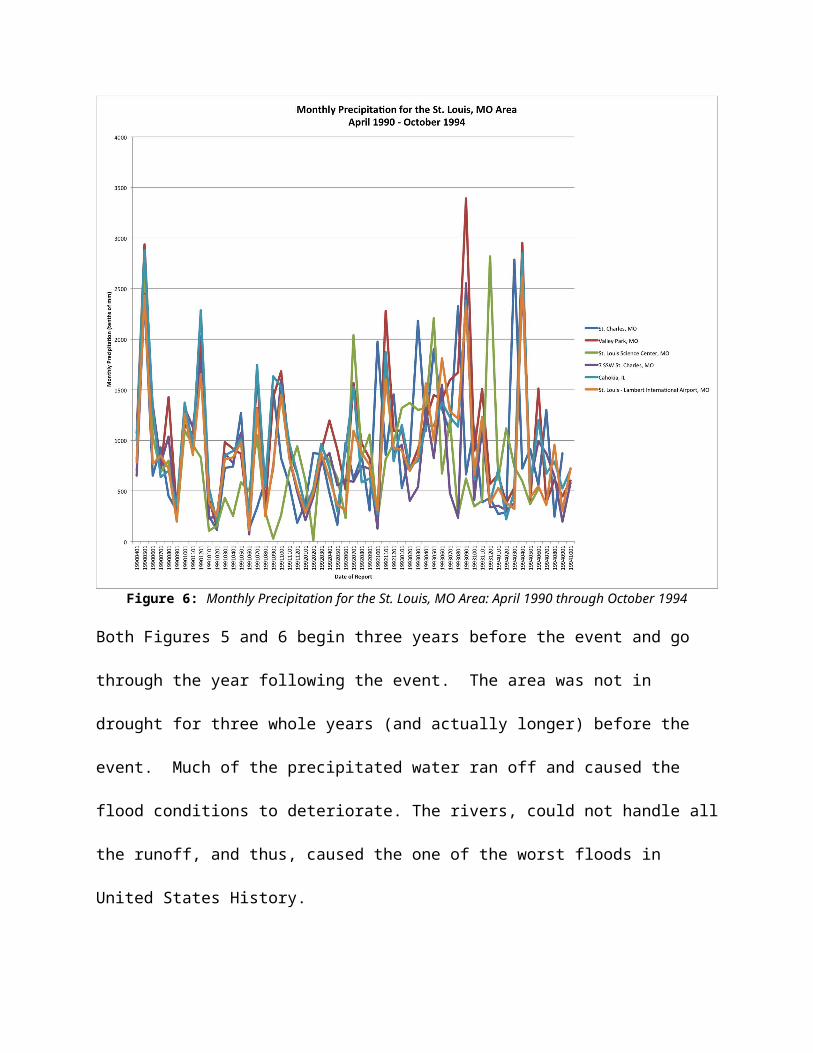
Figure 6: Monthly Precipitation for the St. Louis, MO Area: April 1990 through October 1994
Both Figures 5 and 6 begin three years before the event and go
through the year following the event. The area was not in
drought for three whole years (and actually longer) before the
event. Much of the precipitated water ran off and caused the
flood conditions to deteriorate. The rivers, could not handle all
the runoff, and thus, caused the one of the worst floods in
United States History.
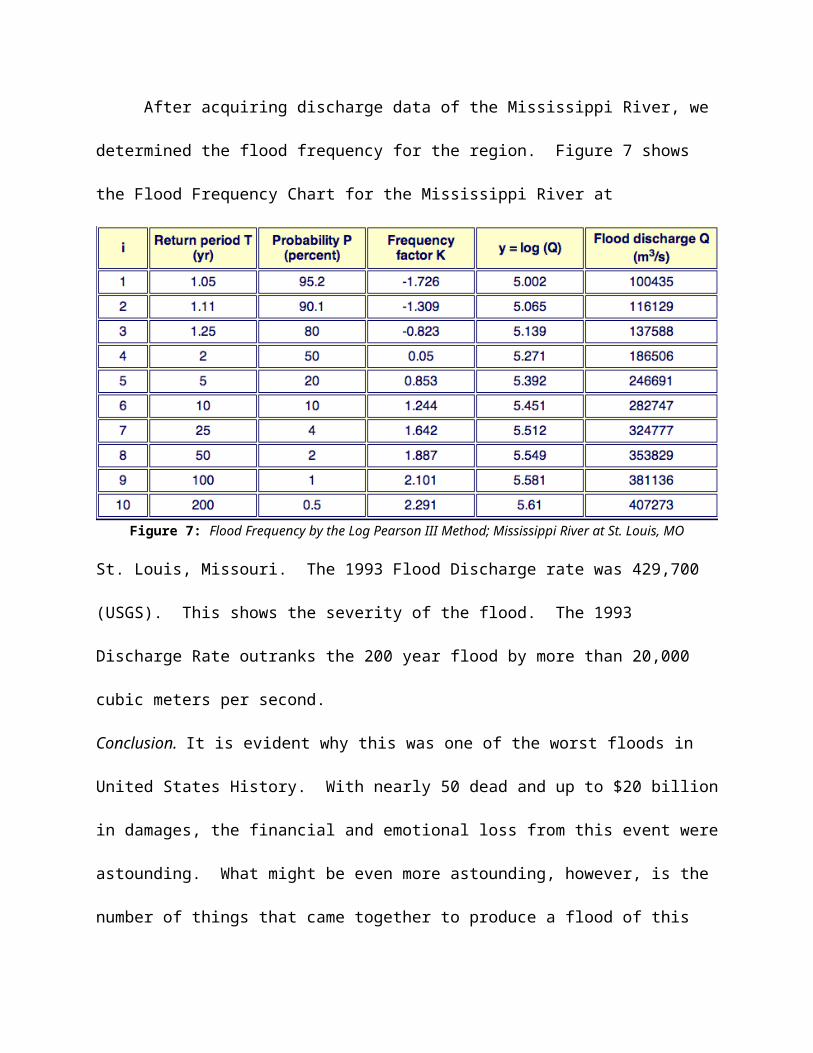
After acquiring discharge data of the Mississippi River, we
determined the flood frequency for the region. Figure 7 shows
the Flood Frequency Chart for the Mississippi River at
Figure 7: Flood Frequency by the Log Pearson III Method; Mississippi River at St. Louis, MO
St. Louis, Missouri. The 1993 Flood Discharge rate was 429,700
(USGS). This shows the severity of the flood. The 1993
Discharge Rate outranks the 200 year flood by more than 20,000
cubic meters per second.
Conclusion. It is evident why this was one of the worst floods in
United States History. With nearly 50 dead and up to $20 billion
in damages, the financial and emotional loss from this event were
astounding. What might be even more astounding, however, is the
number of things that came together to produce a flood of this
magnitude. Whether it be the water surplus in the previous years
which led to most water running off of the land, or the decreased
evapotranspiration due to cloud cover, or the repeated mesoscale
convective systems that affected the area, without these
ingredients, the flood would not have been nearly as bad. In the
wake of the flood, the federal government began to data
collection, flood control efforts, and evacuation practices for
floods nationwide. Had it not been for the occurrence of the
Great Flood of 1993, flood control and safety may not be
comparable as it is today.

Works Consulted
Bell, Gerald D., and John E. Janowiak. "Atmospheric Circulation
Associated with the Midwest Floods of 1993." Bulletin of the
American Meteorological Society 76.5 (1995): 681-95. Print.
"Great Flood of 1993." Wikipedia. Wikimedia Foundation, 05 Mar.
2014. Web. 02 May 2014.
<http://en.wikipedia.org/wiki/Great_Flood_of_1993>.
Guttman, Nathaniel B., J. R. M. Hosking, and James R. Wallis.
"The 1993 Midwest Extreme Precipitation in Historical and
Probabilistic Perspective." Bulletin of the American Meteorological
Society 75.10 (1994): 1785-792. Print.
"Historical Palmer Drought Indices." National Climatic Data Center
(NCDC). N.p., n.d. Web. 02 May 2014.
<http://www.ncdc.noaa.gov/temp-and-precip/drought/historical
-palmers.php>.
Junker, Norman W., Russell S. Schneider, and Stephanie L. Fauver.
"A Study of Heavy Rainfall Events during the Great Midwest
Flood of 1993."Weather and Forecasting 14.5 (1999): 701-12.
Print.
Johnson, Gary P., Robert R. Holmes, Jr., and Loyd A. Waite. "The
Great Flood of 1993 on the Upper Mississippi River—10 Years
Later." United States Geological Survey, May 2004. Web. 30
Apr. 2014.
<http://il.water.usgs.gov/hot/Great_Flood_of_1993.pdf>.
Kunkel, Kenneth E., Stanley A. Changnon, and James R. Angel.
"Climatic Aspects of the 1993 Upper Mississippi River Basin
Flood." Bulletin of the American Meteorological Society 75.5 (1994):
811-22. Print.
Larson, Lee W. "The Great USA Flood of 1993." The Great USA Flood of
1993. N.p., n.d. Web. 01 Feb. 2014.
<http://www.nwrfc.noaa.gov/floods/papers/oh_2/great.htm>.
Lins, Harry F., and James R. Slack. "Streamflow Trends in the
United States."Geophysical Research Letters 26.2 (1999): 227-30.
Print.
"Monthly Summaries." National Climatic Data Center (NCDC). N.p., n.d.
Web. 02 May 2014.
<http://www.ncdc.noaa.gov/cdo-web/results>.
Moore, James T., Fred H. Glass, Charles E. Graves, Scott M.
Rochette, and Marc J. Singer. "The Environment of Warm-
Season Elevated Thunderstorms Associated with Heavy Rainfall
over the Central United States." Weather and Forecasting 18.5
(2003): 861-78. Print.
"National Weather Service Weather Forecast Office." The Great Flood
of 1993. N.p., n.d. Web. 01 May 2014.
<http://www.crh.noaa.gov/lsx/?n=1993_flood>.
Pitlick, John. "A Regional Perspective of the Hydrology of the
1993 Mississippi River Basin Floods." Annals of the Association of
American Geographers 87.1 (1997): 135-51. Print.
Ponce, Victor Miguel. San Diego State University. Calculation of Flood
Frequency by the Log Pearson III Method. Web. 02 May 2014.
<http://ponce.sdsu.edu/onlinepearson.php>.
"United States Historical Climatology Network." Carbon Dioxide
Information Analysis Center. 02 May 2014
<http://cdiac.ornl.gov/epubs/ndp/ushcn/ushcn_map_interface.h
tml>.
USGS. Surface-Water Data for the Nation. Web. 02 May 2014.
<http://waterdata.usgs.gov/nwis/sw>.
Related Documents