Hydrographic Surveys of Rivers and Lakes Using a Multibeam Echosounder Mapping System Using Sound Waves to Map River and Lake Bottoms A multibeam echosounder (MBES) is a type of sound navigation and ranging device that uses sound waves to “see” through even murky waters (fig. 1: Note that all figures used in this report are for an illustrative rather than an interpretive purpose, not all geographic locations will be shown). Unlike a single beam echosounder (also known as a depth sounder or fathometer) that releases a single sound pulse in a single, narrow beam and “listens” for the return echo, a multibeam system emits a multidirectional radial beam to obtain informa- tion within a fan-shaped swath (figs. 1, 2). The timing and direction of the returning sound waves provide detailed informa- tion on the depth of water and the shape of the river channel, lake bottom, or any underwater features of interest. This infor- mation has been used by the U.S. Geological Survey (USGS) to efficiently generate high- resolution maps of river and lake bottoms. The Multibeam Echosounder Mapping System A multibeam echosounder mapping system (MBMS) is an integration of several individual components: the MBES, an inertial navigation system (INS), and a data-collection and data-processing computer. The MBES that was used for numer- ous surveys completed by the USGS in Missouri is the Teledyne RESON SeaBat® 7125–SV2 (fig. 3), which is operated at a frequency of 200 or 400 kilohertz. Multibeam echosounder Survey boat with an Inertial Navigation System (INS) Fan-shaped radial swath EXPLANATION Shallow Water depth Deep Surveyed channel bed Figure 1. Schematic of a survey with a multibeam echosounder mapping system on the Mississippi River near the Jefferson Barracks Bridge on Interstate 255 near St. Louis, Mo. Photograph by Richard Huizinga, U.S. Geological Survey. U.S. Department of the Interior U.S. Geological Survey Fact Sheet 2018–3021 June 2018

Welcome message from author
This document is posted to help you gain knowledge. Please leave a comment to let me know what you think about it! Share it to your friends and learn new things together.
Transcript

Hydrographic Surveys of Rivers and Lakes Using a Multibeam Echosounder Mapping SystemUsing Sound Waves to Map River and Lake Bottoms
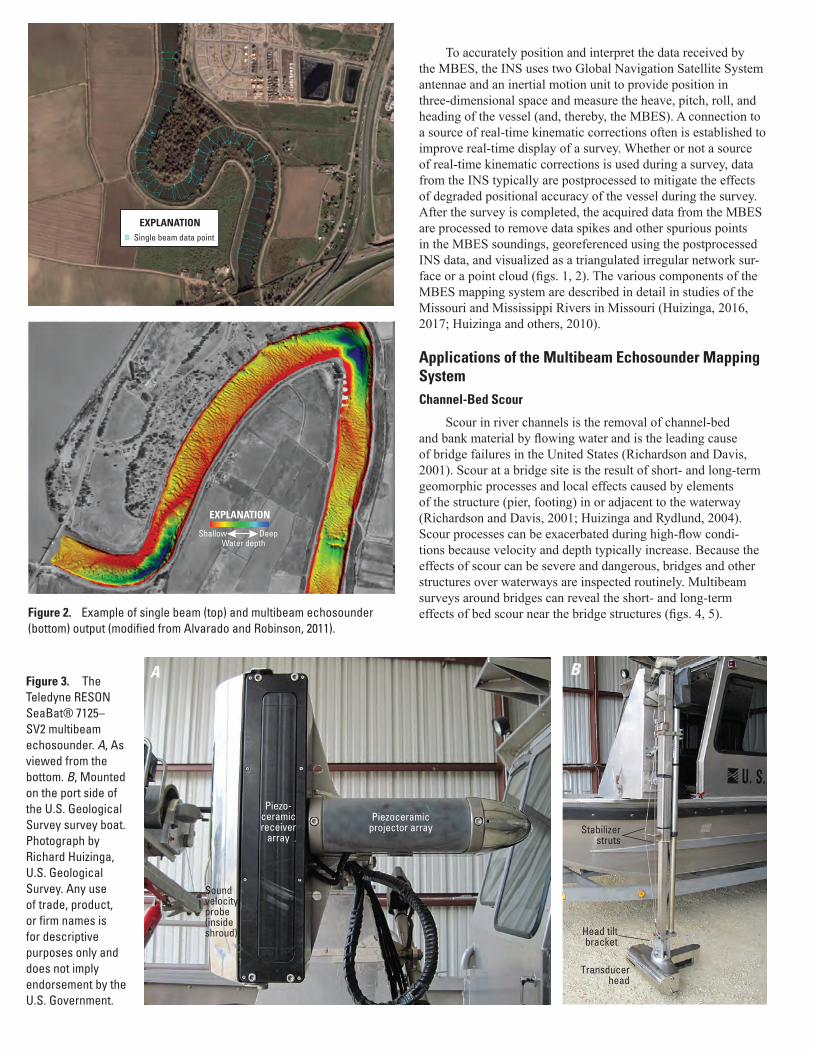
A multibeam echosounder (MBES) is a type of sound navigation and ranging device that uses sound waves to “see” through even murky waters (fig. 1: Note that all figures used in this report are for an illustrative rather than an interpretive purpose, not all geographic locations will be shown). Unlike a single beam echosounder (also known as a depth sounder or fathometer) that releases a single sound pulse in a single, narrow beam and “listens” for the return echo, a multibeam system emits a multidirectional radial beam to obtain informa-tion within a fan-shaped swath (figs. 1, 2). The timing and direction of the returning sound waves provide detailed informa-tion on the depth of water and the shape of the river channel, lake bottom, or any underwater features of interest. This infor-mation has been used by the U.S. Geological Survey (USGS) to efficiently generate high-resolution maps of river and lake bottoms.
The Multibeam Echosounder Mapping SystemA multibeam echosounder mapping system (MBMS) is
an integration of several individual components: the MBES, an inertial navigation system (INS), and a data-collection and data-processing computer. The MBES that was used for numer-ous surveys completed by the USGS in Missouri is the Teledyne RESON SeaBat® 7125–SV2 (fig. 3), which is operated at a frequency of 200 or 400 kilohertz.
Multibeamechosounder
Survey boat with an Inertial Navigation
System (INS)Fan-shapedradial swathEXPLANATION
ShallowWater depth
Deep
Surveyed channel bed
Figure 1. Schematic of a survey with a multibeam echosounder mapping system on the Mississippi River near the Jefferson Barracks Bridge on Interstate 255 near St. Louis, Mo. Photograph by Richard Huizinga, U.S. Geological Survey.
U.S. Department of the InteriorU.S. Geological Survey
Fact Sheet 2018–3021June 2018
Single beam data point
EXPLANATION
EXPLANATION
ShallowWater depth
Deep
Figure 2. Example of single beam (top) and multibeam echosounder (bottom) output (modified from Alvarado and Robinson, 2011).
BA
Piezoceramicprojector array
Piezo-ceramicreceiver
array
Soundvelocityprobe(insideshroud) Head tilt
bracket
Transducerhead
Stabilizerstruts
Figure 3. The Teledyne RESON SeaBat® 7125–SV2 multibeam echosounder. A, As viewed from the bottom. B, Mounted on the port side of the U.S. Geological Survey survey boat. Photograph by Richard Huizinga, U.S. Geological Survey. Any use of trade, product, or firm names is for descriptive purposes only and does not imply endorsement by the U.S. Government.
To accurately position and interpret the data received by the MBES, the INS uses two Global Navigation Satellite System antennae and an inertial motion unit to provide position in three-dimensional space and measure the heave, pitch, roll, and heading of the vessel (and, thereby, the MBES). A connection to a source of real-time kinematic corrections often is established to improve real-time display of a survey. Whether or not a source of real-time kinematic corrections is used during a survey, data from the INS typically are postprocessed to mitigate the effects of degraded positional accuracy of the vessel during the survey. After the survey is completed, the acquired data from the MBES are processed to remove data spikes and other spurious points in the MBES soundings, georeferenced using the postprocessed INS data, and visualized as a triangulated irregular network sur-face or a point cloud (figs. 1, 2). The various components of the MBES mapping system are described in detail in studies of the Missouri and Mississippi Rivers in Missouri (Huizinga, 2016, 2017; Huizinga and others, 2010).
Applications of the Multibeam Echosounder Mapping SystemChannel-Bed Scour
Scour in river channels is the removal of channel-bed and bank material by flowing water and is the leading cause of bridge failures in the United States (Richardson and Davis, 2001). Scour at a bridge site is the result of short- and long-term geomorphic processes and local effects caused by elements of the structure (pier, footing) in or adjacent to the waterway (Richardson and Davis, 2001; Huizinga and Rydlund, 2004). Scour processes can be exacerbated during high-flow condi-tions because velocity and depth typically increase. Because the effects of scour can be severe and dangerous, bridges and other structures over waterways are inspected routinely. Multibeam surveys around bridges can reveal the short- and long-term effects of bed scour near the bridge structures (figs. 4, 5).

682688
676694
700706
712718
724
Elevation of point, in feet above the North American Vertical Datum of 1988
EXPLANATION
Flow
Underminedseal course
Drilled shaft
Echo from sides ofdrilled shafts
Flow
715710705700695690685680675
Elevation of point, in feet above the North American Vertical Datum of 1988
EXPLANATION
Figure 4. Examples of three-dimensional representations of scour around a bridge pier obtained using a multibeam mapping system. The top image is the Interstate 635 Bridge on the Missouri River at Riverside, Mo., and the bottom image is the Interstate 435 Bridge on the Missouri River at Randolph, Mo. (Huizinga 2016).
Channel-Bottom Characteristics
In rivers, the channel-bed features reflect dynamic interactions between flowing water and the mobile sedi-ment available on the bed. These interactions generate a wide range in channel-bed characteristics depending on the hydrologic and geologic context and provide a vari-ety of aquatic habitat conditions for fish and inverte-brates. Knowing when and where selected channel-bed conditions are found, how these features are used by aquatic species of interest, and how these features may change with time are all valuable pieces of informa-tion for fisheries managers. For example, channel-bed features acquired using the MBMS, in conjunction with velocity distribution data provided by an acoustic Dop-pler current profiler (Mueller and others, 2013), were used to assess pallid sturgeon habitat in the Missssippi River near a proposed bridge construction site (fig. 6; Huizinga and others, 2010).
Multibeam echosounder surveys have been com-pleted by the USGS at numerous bridge locations along the Missouri and Mississippi Rivers to determine chan-nel-bed characteristics. At all the surveyed locations, a variety of fluvial features were detected in the channel, ranging from a planar or nearly planar bed—indicat-ing minimal bedload transport in these areas—to large dunes that indicate substantial transport of bedload.
Rock outcrops also were detected at sev-eral sites where the alluvial material of the channel bed had been washed away. Repeated surveys at these locations have allowed for the quantification of bed changes (deposition and scour) with time and provide some indication of the bed volume change and the relation between streamflow changes and the associated channel-bed responses (fig. 7).

94°38'50"
94°38'55"
94°39'00"
94°39'05"
94°39'10"
39°9'20"
39°9'15"
39°9'10"
94°39'15"
FLOW
0 50 100 150 200 250 FEET
0 25 50 75 METERS
Channel-bed elevation, in feet above North American Vertical Datum of 1988
EXPLANATION
735
730
725
720
715
710
705
700
695
690
685
Pier 3
Pier 2
Rock outcrop
Stone revetment
Figure 5. Planar view of mapped Missouri River channel reach indicating substantial scour around a bridge pier and other channel substrate features (Interstate 635 Bridge over the Missouri River at Riverside, Mo.; Huizinga, 2016).
Estimation of Bedload Transport
Bedload, defined as “the sediment that slides, rolls, or skips along in almost continuous contact with the streambed” (Hub-bell, 1964, p. 2), currently (2018) is not measured consistently in most rivers. Direct measurement of bedload in large sand-bed rivers is highly inaccurate (Hubbell, 1964; Edwards and Glys-son, 1999), and unconfirmed theoretical estimates commonly are used (Gomez, 2006). Techniques using time-lagged MBMS surveys (as demonstrated in figure 7), such as about an hour, have been developed to estimate bedload transport based on dune movement and the associated change in areas of scour and fill (Abraham and others, 2011).
Lake Surveys and Volume Calculations
Sedimentation in lakes and reservoirs can result in reduced capacity for flood storage and water supply and a loss of usable aquatic habitat over time. A detailed bathymetric survey allows for an accurate determination of available lake capacity for various uses. The MBMS has been used to map and determine accurate volume estimates for lakes in Missouri (fig. 8) and surrounding States. Such information can be used to determine water-supply availability, reservoir sedimentation rates and pro-jected lifespans, and the spatial distribution of selected aquatic habitat.
References CitedAbraham, D.D., Kuhnle, R.A., and Odgaard, A.J., 2011, Validation of
bed-load transport measurements with time-sequenced bathymetric data: Journal of Hydraulic Engineering, v. 137, no. 7, p. 723–728.
Alvarado, A., and Robinson, D., 2011, Hydro survey—Multi-beam vs. single beam (part 1): Ayres Associates web page, accessed January, 2018, at http://ayresriverblog.com/2011/08/02/hydro-survey-multi-beam-vs-single-beam-part-1/.
Edwards, T.K., and Glysson, G.D., 1999, Field methods for measure-ment of fluvial sediment: U.S. Geological Survey Techniques of Water-Resources Investigations, book 3, chap. C2, 89 p.
Gomez, B., 2006, The potential rate of bed-load transport: Proceed-ings of the National Academy of Sciences of the United States of America, v. 103, no. 46, p. 17170–17173. [Also available at https://doi.org/10.1073%2Fpnas.0608487103.]
Hubbell, D.W., 1964, Apparatus and techniques for measuring bedload: U.S. Geological Survey Water-Supply Paper 1748, 74 p., accessed April 15, 2015, at https://pubs.er.usgs.gov/publication/wsp1748.
Huizinga, R.J., 2012, Bathymetric and velocimetric surveys at highway bridges crossing the Missouri River in and into Missouri during sum-mer flooding, July–August 2011: U.S. Geological Survey Scientific Investigations Report 2012–5204, 166 p.
Huizinga, R.J., 2014, Bathymetric surveys and area/capacity tables of water-supply reservoirs for the city of Cameron, Missouri, July 2013: U.S. Geological Survey Open-File Report 2014–1005, 15 p., https://doi.org/10.3133/ofr20141005.
Huizinga, R.J., 2016, Bathymetric and velocimetric surveys at highway bridges crossing the Missouri River near Kansas City, Missouri, June 2–4, 2015: U.S. Geological Survey Scientific Investigations Report 2016–5061, 93 p. [Also available at https://doi.org/10.3133/sir20165061.]
Huizinga, R.J., 2017, Bathymetry and velocity data from surveys at highway bridges crossing the Missouri and Mississippi Rivers near St. Louis, Missouri, October 2008 through May 2016: U.S. Geo-logical Survey data release, accessed January 2018 at https://doi.org/10.5066/F71C1VCC.
Huizinga, R.J., Elliott, C.M., and Jacobson, R.B., 2010, Bathymetric and velocimetric survey and assessment of habitat for pallid sturgeon on the Mississippi River in the vicinity of the proposed Interstate 70 Bridge at St. Louis, Missouri: U.S. Geological Survey Scientific Investigations Report 2010–5017, 28 p. [Also available at https://pubs.usgs.gov/sir/2010/5017/.]

0 100 200 300 400 500 600 FEET
0 50 100 150 METERS
Flow
392390388386384382380378376374372370368366364362360358356354352350348346
Channel-bed elevation, in feet above North American Vertical
Datum of 1988
6.5 to 7.06.0 to 6.55.5 to 6.05.0 to 5.54.5 to 5.04.0 to 4.53.5 to 4.03.0 to 3.52.5 to 3.02.0 to 2.51.5 to 2.01.0 to 1.50.5 to 1.00.3 to 0.5
Vertically averaged velocity,in feet per second
Centerline of proposed
Interstate 70 Bridge
Proposed location of main channel piers
EXPLANATION
90°10'30"90°10'35"90°10'40"90°10'45"90°10'50"90°10'55"
38°39'
38°38'55"
38°38'50"
38°38'45"
38°38'40"
38°38'35"
38°38'30"
38°38'25"
St. Louis City, Missouri St. Clair County, Illinois
Figure 6. Planar view of mapped Missssippi River channel reach indicating bed features and corresponding velocity distribution (Huizinga and others, 2010).

39°9'20"
39°9'15"
94°39'15"
39°9'10"
94°38'50"
94°38'55"
94°39'00"
94°39'05"
94°39'10"
FLOW
0 50 100 150 200 250 FEET
0 25 50 75 METERSEXPLANATION
Change in channel-bed elevation, in feet
-1-3-5-7-10-15-20-30-45 2015107531 30DEPOSITIONSCOUR
Pier 3
Pier 2 Stone revetmentRock outcrop
Figure 7. Planar view of mapped Missouri River channel reach at Kansas City, Mo., indicating the change in bed conditions between surveys in 2015 and 2011 (Interstate 635 Bridge over the Missouri River at Riverside, Mo.; Huizinga, 2016).
EXPLANATION
ShallowWater depth
Deep
Figure 8. Planar view of mapped bottom of Reservoir 3 near Cameron, Mo., from a multibeam echosounder survey in July 2013 (Huizinga, 2014).
Huizinga, R.J., and Rydlund, P.H., Jr., 2004, Potential-scour assess-ments and estimates of scour depth using different techniques at selected bridge sites in Missouri: U.S. Geological Survey Scientific Investigations Report 2004–5213, 42 p. [Also available at https://pubs.usgs.gov/sir/2004/5213/.]
Mueller, D.S., Wagner, C.R., Rehmel, M.S., Oberg, K.A., and Rain-ville, F., 2013, Measuring discharge with acoustic Doppler current profilers from a moving boat (ver. 2.0, December 2013): U.S Geolog-ical Survey Techniques and Methods, book 3, chap. A22, 95 p. [Also available at https://doi.org/10.3133/tm3A22.]
Richardson, E.V., and Davis, S.R., 2001, Evaluating scour at bridges (4th ed.): U.S. Federal Highway Administration Publication FHWA NHI 01–001, Hydraulic Engineering Circular no. 18, 378 p.
By Richard J. Huizinga and David C. Heimann
For further information, please contact Director, Central Midwest Water Science CenterU.S. Geological Survey1400 Independence RoadRolla, MO 65401(573) 308-3667https://mo.water.usgs.gov/
ISSN 2327-6916 (print)ISSN 2327-6932 (online) https://doi.org/10.3133/fs20183021
Related Documents