See discussions, stats, and author profiles for this publication at: https://www.researchgate.net/publication/341188515 A case study on commercial silkworm rearing of Daba (Bi-Voltine) tasar ecorace (Antheraea mylitta Drury) in Kurjuli Forest area of Bandgaon Block, West Singhbhum district, Jharkhan... Article in JOURNAL OF ENTOMOLOGY AND ZOOLOGY STUDIES · April 2020 CITATIONS 0 READ 1 4 authors, including: Some of the authors of this publication are also working on these related projects: https://www.akinik.com/products/437/current-research-in-soil-fertility?UPC=1573026794 View project Diagnosis of nutrient constraints and its management in mulberry field at farm and farmers’ level in Kalimpong hills View project Dr. Ram Lakhan Ram Central Silk Board 27 PUBLICATIONS 42 CITATIONS SEE PROFILE All content following this page was uploaded by Dr. Ram Lakhan Ram on 06 May 2020. The user has requested enhancement of the downloaded file.

Welcome message from author
This document is posted to help you gain knowledge. Please leave a comment to let me know what you think about it! Share it to your friends and learn new things together.
Transcript
See discussions, stats, and author profiles for this publication at: https://www.researchgate.net/publication/341188515
A case study on commercial silkworm rearing of Daba (Bi-Voltine) tasar
ecorace (Antheraea mylitta Drury) in Kurjuli Forest area of Bandgaon Block,
West Singhbhum district, Jharkhan...
Article in JOURNAL OF ENTOMOLOGY AND ZOOLOGY STUDIES · April 2020
CITATIONS
0READ
1
4 authors, including:
Some of the authors of this publication are also working on these related projects:
https://www.akinik.com/products/437/current-research-in-soil-fertility?UPC=1573026794 View project
Diagnosis of nutrient constraints and its management in mulberry field at farm and farmers’ level in Kalimpong hills View project
Dr. Ram Lakhan Ram
Central Silk Board
27 PUBLICATIONS 42 CITATIONS
SEE PROFILE
All content following this page was uploaded by Dr. Ram Lakhan Ram on 06 May 2020.
The user has requested enhancement of the downloaded file.
~ 223 ~
Journal of Entomology and Zoology Studies 2020; 8(3): 223-232
E-ISSN: 2320-7078
P-ISSN: 2349-6800
www.entomoljournal.com
JEZS 2020; 8(3): 223-232
© 2020 JEZS
Received: 05-03-2020
Accepted: 06-04-2020
RL Ram
Scientist-C, P4, Tasar Breeding
Station, Central Silk Board,
Chakradharpur, District-West
Singhbhum, Jharkhand, India
N Kumar
Scientist-D, Central Tasar
Research and Training Institute,
Central Silk Board, Ranchi,
Jharkhand, India
S Rai
Scientist-D, Research Extension
Centre, Kapistha, West Bengal,
India
TK Ghosh
Technical Assistant, P4, Tasar
Breeding Station, Central Silk
Board, Chakradharpur, West
Singhbhum, Jharkhand, India
Corresponding Author:
RL Ram
Scientist-C, P4, Tasar Breeding
Station, Central Silk Board,
Chakradharpur, District-West
Singhbhum, Jharkhand, India
A case study on commercial silkworm rearing of
Daba (Bi-Voltine) tasar ecorace (Antheraea mylitta
Drury) in Kurjuli Forest area of Bandgaon Block,
West Singhbhum district, Jharkhand, India
RL Ram, N Kumar, S Rai and TK Ghosh
Abstract A case study was conducted on commercial silkworm rearing of Daba (Bi-Voltine) tasar ecorace
(Antheraea mylitta Drury) to study the effect of age, education, experience and socio-economic
conditions of the farmers on cocoon yield. Based on the rearing performance of 21361 dfls of Daba (Bi-
Voltine) tasar ecorace distributed among 136 farmers, it was found that, 12 farmers produced more than
80 cocoons dfls-1, which was the great achievement Indian tasar farming. Besides, 37 farmers have
produced between 60-80 cocoons dfls-1, 50 farmers produced 40-60 cocoons dfls-1, 27 farmers produced
20-40 cocoons dfls-1 and only 10 farmers have produced lass than 20 cocoons dfls-1 respectively. The
rearing performance of 72.79 per cent farmers was better than the benchmark of 40-60 cocoons yield dfl-1
adopted by the Indian tasar sericulturist. Based on the rearing performance of the farmers of different age
group, it was found that, the maximum cocoons were produced by the farmers’ age group of 30-40 and
40-50 years whereas the lowest cocoon production were recorded at the farmers below 30 years of age
group. The highest cocoons yield dfl-1 was recorded at the farmers below 30 years of age followed by
lowest cocoons yield dfl-1 at farmers above 60 years of age. While considering the education level, it was
found that, the maximum cocoons were produced by the farmers having non-matric or 10+2 and above
level of educational qualification followed by the illiterate farmers. The highest cocoon yield 70.77
cocoons dfl-1 was produced by the educated farmers, who had matric or 10+2 level of educational
qualification. The farmers experience has also shown the positive impact on cocoon yield.
Keywords: Sericulture, tasar, silkworm, daba (Bi-Voltine) tasar ecorace
Introduction Sericulture is one of the oldest agro based cottage industry in India and probably dates back to the beginning of the Christian era. Scientifically, sericulture can be defined as “art and science of silkworm rearing” for the production of raw silk. The end product of sericulture is silk, which is well known as “Queen of fabrics” for its natural colour, purity and unusual lustre. Being an agro based cottage industry and intensive engagement of labour, sericulture is one of the major sectors for generation of rural and semi-urban employment. It is also an alternative source of income to enhance the livelihoods of small-scale farmers and tribal communities. Geographically, Asia is the main producer and manufacturer of raw silk over worldwide. After China, India is the 2nd largest producer of raw silk with 0.354 Lakh MT annual productions against the total 1.596 Lakh MT world raw silk production in year 2018-19 (Anonymous, 2019; https://www.inserco.org/en/ statistics.) [1-2]. Brazil, Japan, Korea, Thailand, Uzbekistan and Vietnam etc. are also leading countries of raw silk production. On the global platform, sericulture industry has been divided into mulberry (Bombyx mori L.) and wild or Vanya silk. India is the only country which produces all the varieties of silk namely mulberry, eri, tropical tasar, oak tasar and muga etc. Out of these four varieties of silk in India, annual production of tasar raw silk (both tropical and oak tasar) was 2981 MT with 8.40 per cent share of total Indian raw silk production in 2018-19 (Anonymous, 2019 [1]. Tropical tasar (Antheraea mylitta D.) is one of the strong pillars of sericulture industry and it plays a key role for empowerment of rural and tribal livelihood, regeneration of forest and best utility of low to marginal fertile land. Besides, this industry also generates the huge employment to the stake holders engaged in post cocoon. It is an eco-friendly forest-based cottage industry that requires a very low investment, but is highly remunerative and suits the tribal way of life with a positive impact on forest health and conservation of its biodiversity.
Journal of Entomology and Zoology Studies http://www.entomoljournal.com
~ 224 ~
Tropical tasar silkworm (Antheraea mylitta Drury) is
popularly known as wild or Vanya silkworm. These
silkworms are polyphagous in nature and primarily fed on
most popular trees Arjun (Terminalia arjuna), Asan
(Terminalia tomentosa) and Sal (Shorea robusta) etc. (Gupta
and Sinha, 2013) [3]. Besides, many other plants can also be
feed as secondary food materials. Initially, the silkworm
Antheraea mylitta D. was bred in the Europe during the
beginning of 19th century and well distributed in the Asiatic
continent (Srivastava et al., 2003) [4]. In India, total 44
ecoraces of tropical tasar were identified and extensively
reared in the tribal forest range of Orissa, Jharkhand, West
Bengal, Madhya Pradesh, Chhattisgarh, Uttar Pradesh,
Maharashtra, Telangana and Karnataka. (Alam et al., 2018,
Sharma et al., 2015) [5-6]. Some of the most popular ecoraces
of Indian terrain are Daba, Sukinda, Raily, Modal, Laria,
Sarihan, Modia, Andhra Local etc.
Like mulberry silkworm, the life cycle of A. mylitta L. is also
passes through four stages – egg, larva, pupa and adult. The
larvae are voracious feeders while, adult are non-feeders.
These ecoraces are morphogenetic variable in colour, shape
and size etc. The eggs of tasar ecoraces are creamy, white,
brownish or bluish in colour with 08-12 mm weight whereas
the larval body of these ecoraces are either green, yellow, blue
or almond in colour. The body weight of tasar silkworm
larvae is highly variable and fully dependent on quality
feeding and its genotypic characters. The body weight of 5th
instar larvae is ranged from 18 to 52 g. The fifth instar larvae
spin the cocoon and pupate inside. The cocoon of A. mylitta is
tough with different shape and colour. The filament length of
these silkworms ranged from 600 to1500 m depending upon
nature and varieties of ecoraces. The cocoon has a large
peduncle, which terminates in a ring and fits into the branch
of host plant. The races are univoltine, bivoltine and trivoltine
in nature. Being a native of West Singhbhum district,
Jharkhand, Daba Bv Tasar Ecorace (A. mylitta D.) was chosen
for this study. Total 21361 disease free laying (DFLs) were
distributed among the different age, education and experience
groups of farmers for successful commercial crop rearing.
Materials and Methods
Location of the study area and Socio-economic condition
of villagers
Location
The area selected for the case study on commercial silkworm
rearing of Daba (Bi-Voltine) Tasar Ecorace (Antheraea
mylitta Drury) falls under Kaumail, Mundasai, Janko, Talasai,
Dongosai, Puniburi, Tenda, Paprida, Indruwa, and Banragara
tola of Bandgaon block, West Singhbhum, Jharkhand, India.
These tolas are the small groups of the main villages namely;
Kurjuli, Janko, Indruwa and Tendana. These main four
villages lies between 22o39’33” N to 22o41’06” N latitude and
85o27’53” E to 85o29’51” E longitude with 300 to 500
altitude above MSL. The study area was situated in the dense
forest of Kurjuli forest range, which is the part of Saranda
dense forest of west singhbhum. Apart from shrubs and other
tall trees, Kurjuli forest is mostly dominated by Terminalia
tomentosa (Asan) and Sorea robusta (Sal) plants, which are
the primary food materials of A. mylitta D.
According to Census, 2011 [7]; total 516 families were
residing in these villages in a very small tolas scattered in
Kurjuli forest area. These families were having total 2418
members including children with an average 4.68 members in
a family. Out of total population, 1184 were male and 1234
female with average sex ratio 1042. In 2011, the literacy rate
of male was 65.0 per cent and female was only 34.2 per cent
with cumulative literacy rate 49.6 per cent. The literacy rate
of the above villages was lower than the literacy rate of
Jharkhand state which stands at 62.84 per cent. As per Census
2011, total 77.3 per cents workers from all four villages have
less than 6 months employment as their main work and only
28.9 per cent have more than 6 months employment as their
main work.
Selection of tasar farmers
Distribution of tasar farmers by Tola
Selection of tasar farmers was done based on their age,
education, experience and socio-economic conditions. Total
136 farmers from Kaumail, Mundasai, Janko, Talasai,
Dongosai, Puniburi, Tenda, Paprida, Indruwa, and Banragara
tola/ village of Bandgaon block, West Singhbhum, Jharkhand
were selected under adopted seed rearers (ASR) programme
for commercial or 2nd seed crop rearing for the financial year
2019-20. These tolas are the small busty of Kurjuli, Janko,
Indruwa and Tendana village of same block and district. All
the farmers selected under this programme were mostly
landless or marginal farmers of scheduled tribe category.
They are mostly very poor and living their life under below
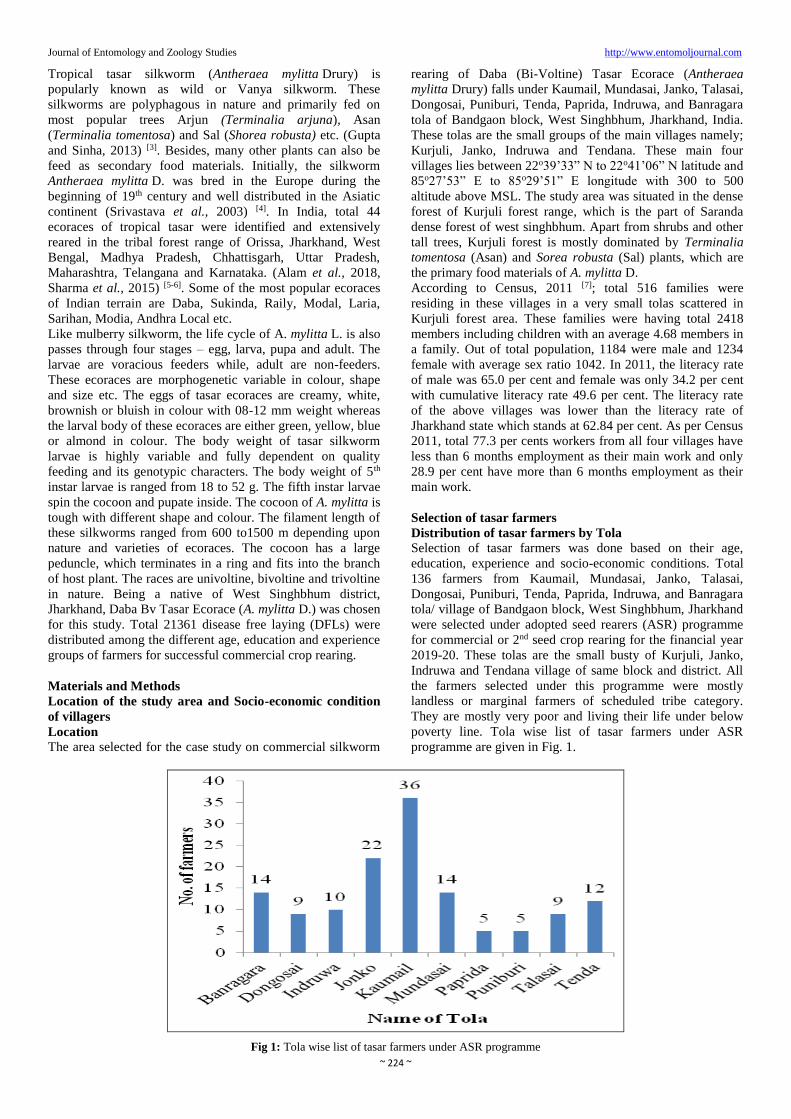
poverty line. Tola wise list of tasar farmers under ASR
programme are given in Fig. 1.
Fig 1: Tola wise list of tasar farmers under ASR programme
Journal of Entomology and Zoology Studies http://www.entomoljournal.com
~ 225 ~
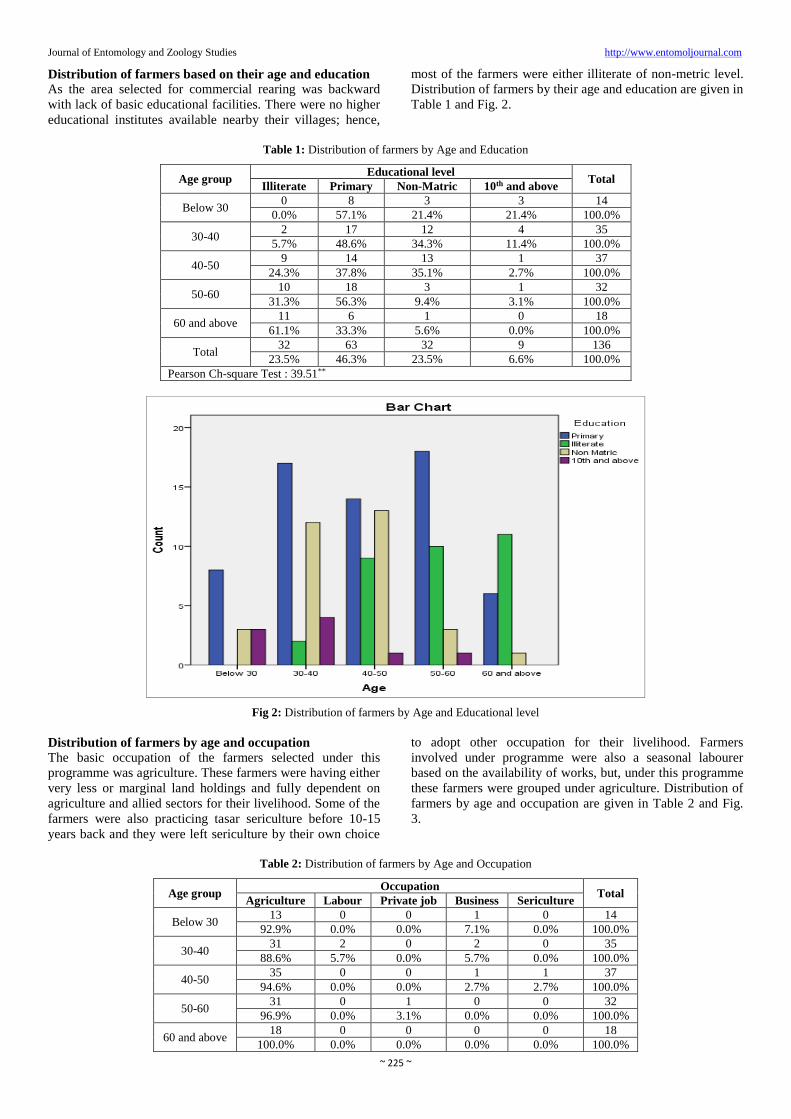
Distribution of farmers based on their age and education
As the area selected for commercial rearing was backward
with lack of basic educational facilities. There were no higher
educational institutes available nearby their villages; hence,
most of the farmers were either illiterate of non-metric level.
Distribution of farmers by their age and education are given in
Table 1 and Fig. 2.
Table 1: Distribution of farmers by Age and Education
Age group Educational level
Total Illiterate Primary Non-Matric 10th and above
Below 30 0 8 3 3 14
0.0% 57.1% 21.4% 21.4% 100.0%
30-40 2 17 12 4 35
5.7% 48.6% 34.3% 11.4% 100.0%
40-50 9 14 13 1 37
24.3% 37.8% 35.1% 2.7% 100.0%
50-60 10 18 3 1 32
31.3% 56.3% 9.4% 3.1% 100.0%
60 and above 11 6 1 0 18
61.1% 33.3% 5.6% 0.0% 100.0%
Total 32 63 32 9 136
23.5% 46.3% 23.5% 6.6% 100.0%
Pearson Ch-square Test : 39.51**
Fig 2: Distribution of farmers by Age and Educational level
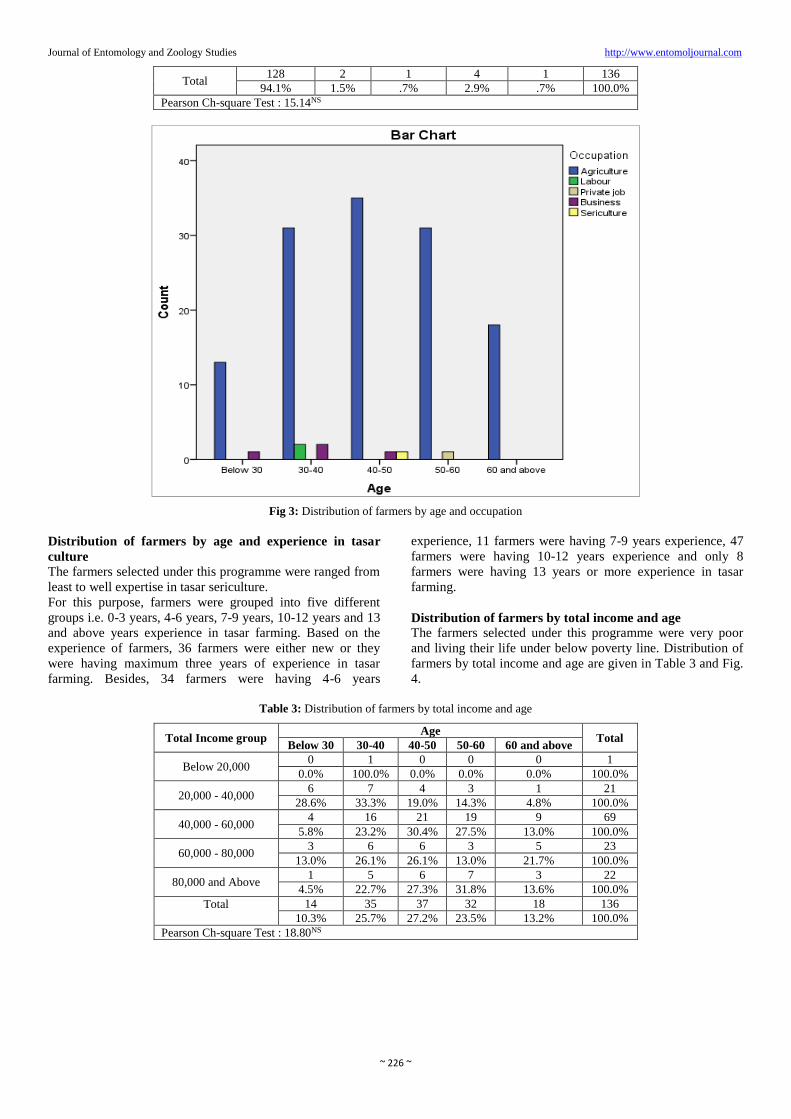
Distribution of farmers by age and occupation
The basic occupation of the farmers selected under this
programme was agriculture. These farmers were having either
very less or marginal land holdings and fully dependent on
agriculture and allied sectors for their livelihood. Some of the
farmers were also practicing tasar sericulture before 10-15
years back and they were left sericulture by their own choice
to adopt other occupation for their livelihood. Farmers
involved under programme were also a seasonal labourer
based on the availability of works, but, under this programme
these farmers were grouped under agriculture. Distribution of
farmers by age and occupation are given in Table 2 and Fig.
3.
Table 2: Distribution of farmers by Age and Occupation
Age group Occupation
Total Agriculture Labour Private job Business Sericulture
Below 30 13 0 0 1 0 14
92.9% 0.0% 0.0% 7.1% 0.0% 100.0%
30-40 31 2 0 2 0 35
88.6% 5.7% 0.0% 5.7% 0.0% 100.0%
40-50 35 0 0 1 1 37
94.6% 0.0% 0.0% 2.7% 2.7% 100.0%
50-60 31 0 1 0 0 32
96.9% 0.0% 3.1% 0.0% 0.0% 100.0%
60 and above 18 0 0 0 0 18
100.0% 0.0% 0.0% 0.0% 0.0% 100.0%
Journal of Entomology and Zoology Studies http://www.entomoljournal.com
~ 226 ~
Total 128 2 1 4 1 136
94.1% 1.5% .7% 2.9% .7% 100.0%
Pearson Ch-square Test : 15.14NS
Fig 3: Distribution of farmers by age and occupation
Distribution of farmers by age and experience in tasar
culture
The farmers selected under this programme were ranged from
least to well expertise in tasar sericulture.
For this purpose, farmers were grouped into five different
groups i.e. 0-3 years, 4-6 years, 7-9 years, 10-12 years and 13
and above years experience in tasar farming. Based on the
experience of farmers, 36 farmers were either new or they
were having maximum three years of experience in tasar
farming. Besides, 34 farmers were having 4-6 years
experience, 11 farmers were having 7-9 years experience, 47
farmers were having 10-12 years experience and only 8
farmers were having 13 years or more experience in tasar
farming.
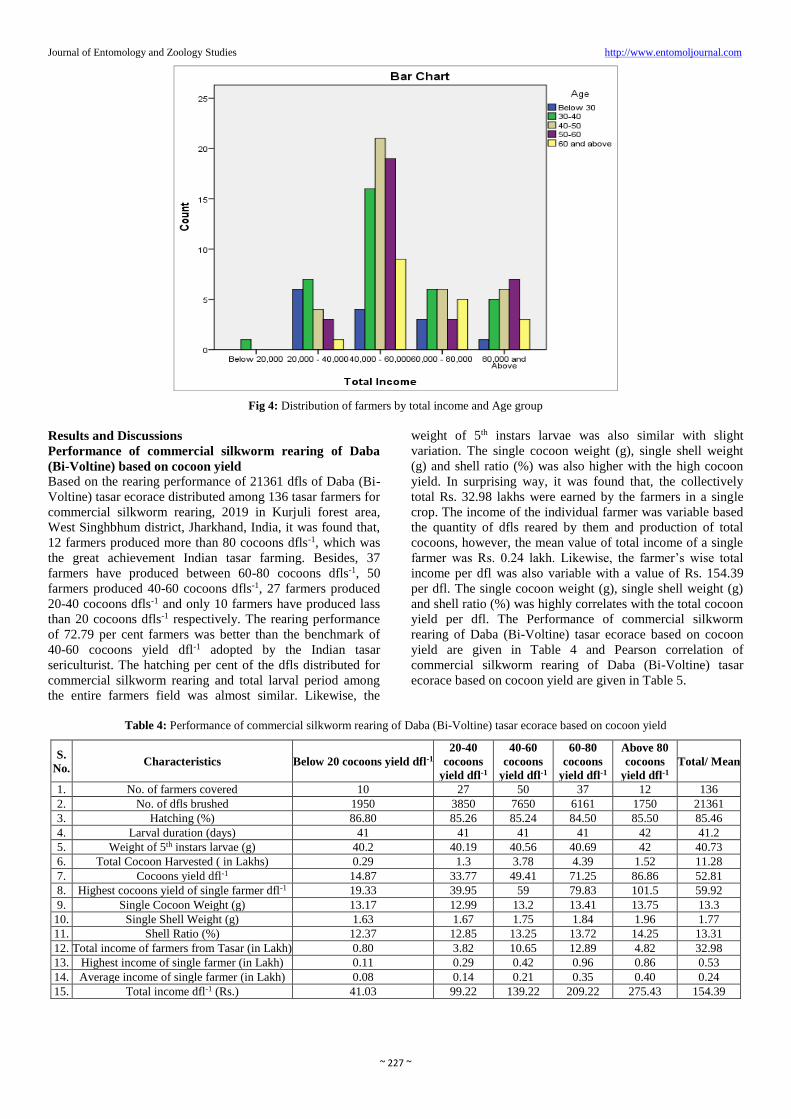
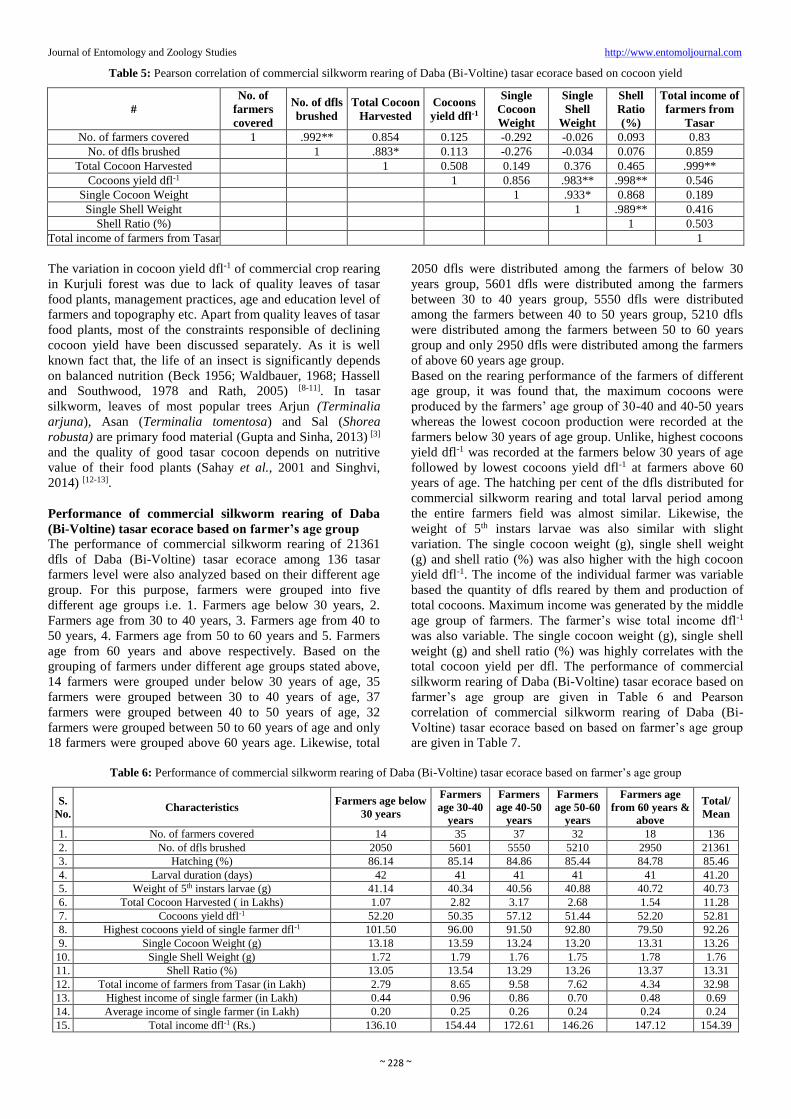
Distribution of farmers by total income and age
The farmers selected under this programme were very poor
and living their life under below poverty line. Distribution of
farmers by total income and age are given in Table 3 and Fig.
4.
Table 3: Distribution of farmers by total income and age
Total Income group Age
Total Below 30 30-40 40-50 50-60 60 and above
Below 20,000 0 1 0 0 0 1
0.0% 100.0% 0.0% 0.0% 0.0% 100.0%
20,000 - 40,000 6 7 4 3 1 21
28.6% 33.3% 19.0% 14.3% 4.8% 100.0%
40,000 - 60,000 4 16 21 19 9 69
5.8% 23.2% 30.4% 27.5% 13.0% 100.0%
60,000 - 80,000 3 6 6 3 5 23
13.0% 26.1% 26.1% 13.0% 21.7% 100.0%
80,000 and Above 1 5 6 7 3 22
4.5% 22.7% 27.3% 31.8% 13.6% 100.0%
Total
14 35 37 32 18 136
10.3% 25.7% 27.2% 23.5% 13.2% 100.0%
Pearson Ch-square Test : 18.80NS
Journal of Entomology and Zoology Studies http://www.entomoljournal.com
~ 227 ~
Fig 4: Distribution of farmers by total income and Age group
Results and Discussions
Performance of commercial silkworm rearing of Daba
(Bi-Voltine) based on cocoon yield
Based on the rearing performance of 21361 dfls of Daba (Bi-
Voltine) tasar ecorace distributed among 136 tasar farmers for
commercial silkworm rearing, 2019 in Kurjuli forest area,
West Singhbhum district, Jharkhand, India, it was found that,
12 farmers produced more than 80 cocoons dfls-1, which was
the great achievement Indian tasar farming. Besides, 37
farmers have produced between 60-80 cocoons dfls-1, 50
farmers produced 40-60 cocoons dfls-1, 27 farmers produced
20-40 cocoons dfls-1 and only 10 farmers have produced lass
than 20 cocoons dfls-1 respectively. The rearing performance
of 72.79 per cent farmers was better than the benchmark of
40-60 cocoons yield dfl-1 adopted by the Indian tasar
sericulturist. The hatching per cent of the dfls distributed for
commercial silkworm rearing and total larval period among
the entire farmers field was almost similar. Likewise, the
weight of 5th instars larvae was also similar with slight
variation. The single cocoon weight (g), single shell weight
(g) and shell ratio (%) was also higher with the high cocoon
yield. In surprising way, it was found that, the collectively
total Rs. 32.98 lakhs were earned by the farmers in a single
crop. The income of the individual farmer was variable based
the quantity of dfls reared by them and production of total
cocoons, however, the mean value of total income of a single
farmer was Rs. 0.24 lakh. Likewise, the farmer’s wise total
income per dfl was also variable with a value of Rs. 154.39
per dfl. The single cocoon weight (g), single shell weight (g)
and shell ratio (%) was highly correlates with the total cocoon
yield per dfl. The Performance of commercial silkworm
rearing of Daba (Bi-Voltine) tasar ecorace based on cocoon
yield are given in Table 4 and Pearson correlation of
commercial silkworm rearing of Daba (Bi-Voltine) tasar
ecorace based on cocoon yield are given in Table 5.
Table 4: Performance of commercial silkworm rearing of Daba (Bi-Voltine) tasar ecorace based on cocoon yield
S.
No. Characteristics Below 20 cocoons yield dfl-1
20-40
cocoons
yield dfl-1
40-60
cocoons
yield dfl-1
60-80
cocoons
yield dfl-1
Above 80
cocoons
yield dfl-1
Total/ Mean
1. No. of farmers covered 10 27 50 37 12 136
2. No. of dfls brushed 1950 3850 7650 6161 1750 21361
3. Hatching (%) 86.80 85.26 85.24 84.50 85.50 85.46
4. Larval duration (days) 41 41 41 41 42 41.2
5. Weight of 5th instars larvae (g) 40.2 40.19 40.56 40.69 42 40.73
6. Total Cocoon Harvested ( in Lakhs) 0.29 1.3 3.78 4.39 1.52 11.28
7. Cocoons yield dfl-1 14.87 33.77 49.41 71.25 86.86 52.81
8. Highest cocoons yield of single farmer dfl-1 19.33 39.95 59 79.83 101.5 59.92
9. Single Cocoon Weight (g) 13.17 12.99 13.2 13.41 13.75 13.3
10. Single Shell Weight (g) 1.63 1.67 1.75 1.84 1.96 1.77
11. Shell Ratio (%) 12.37 12.85 13.25 13.72 14.25 13.31
12. Total income of farmers from Tasar (in Lakh) 0.80 3.82 10.65 12.89 4.82 32.98
13. Highest income of single farmer (in Lakh) 0.11 0.29 0.42 0.96 0.86 0.53
14. Average income of single farmer (in Lakh) 0.08 0.14 0.21 0.35 0.40 0.24
15. Total income dfl-1 (Rs.) 41.03 99.22 139.22 209.22 275.43 154.39
Journal of Entomology and Zoology Studies http://www.entomoljournal.com
~ 228 ~
Table 5: Pearson correlation of commercial silkworm rearing of Daba (Bi-Voltine) tasar ecorace based on cocoon yield
#
No. of
farmers
covered
No. of dfls
brushed
Total Cocoon
Harvested
Cocoons
yield dfl-1
Single
Cocoon
Weight
Single
Shell
Weight
Shell
Ratio
(%)
Total income of
farmers from
Tasar
No. of farmers covered 1 .992** 0.854 0.125 -0.292 -0.026 0.093 0.83
No. of dfls brushed
1 .883* 0.113 -0.276 -0.034 0.076 0.859
Total Cocoon Harvested
1 0.508 0.149 0.376 0.465 .999**
Cocoons yield dfl-1
1 0.856 .983** .998** 0.546
Single Cocoon Weight
1 .933* 0.868 0.189
Single Shell Weight
1 .989** 0.416
Shell Ratio (%)
1 0.503
Total income of farmers from Tasar
1
The variation in cocoon yield dfl-1 of commercial crop rearing
in Kurjuli forest was due to lack of quality leaves of tasar
food plants, management practices, age and education level of
farmers and topography etc. Apart from quality leaves of tasar
food plants, most of the constraints responsible of declining
cocoon yield have been discussed separately. As it is well
known fact that, the life of an insect is significantly depends
on balanced nutrition (Beck 1956; Waldbauer, 1968; Hassell
and Southwood, 1978 and Rath, 2005) [8-11]. In tasar
silkworm, leaves of most popular trees Arjun (Terminalia
arjuna), Asan (Terminalia tomentosa) and Sal (Shorea
robusta) are primary food material (Gupta and Sinha, 2013) [3]
and the quality of good tasar cocoon depends on nutritive
value of their food plants (Sahay et al., 2001 and Singhvi,
2014) [12-13].
Performance of commercial silkworm rearing of Daba
(Bi-Voltine) tasar ecorace based on farmer’s age group
The performance of commercial silkworm rearing of 21361
dfls of Daba (Bi-Voltine) tasar ecorace among 136 tasar
farmers level were also analyzed based on their different age
group. For this purpose, farmers were grouped into five
different age groups i.e. 1. Farmers age below 30 years, 2.
Farmers age from 30 to 40 years, 3. Farmers age from 40 to
50 years, 4. Farmers age from 50 to 60 years and 5. Farmers
age from 60 years and above respectively. Based on the
grouping of farmers under different age groups stated above,
14 farmers were grouped under below 30 years of age, 35
farmers were grouped between 30 to 40 years of age, 37
farmers were grouped between 40 to 50 years of age, 32
farmers were grouped between 50 to 60 years of age and only
18 farmers were grouped above 60 years age. Likewise, total
2050 dfls were distributed among the farmers of below 30
years group, 5601 dfls were distributed among the farmers
between 30 to 40 years group, 5550 dfls were distributed
among the farmers between 40 to 50 years group, 5210 dfls
were distributed among the farmers between 50 to 60 years
group and only 2950 dfls were distributed among the farmers
of above 60 years age group.
Based on the rearing performance of the farmers of different
age group, it was found that, the maximum cocoons were
produced by the farmers’ age group of 30-40 and 40-50 years
whereas the lowest cocoon production were recorded at the
farmers below 30 years of age group. Unlike, highest cocoons
yield dfl-1 was recorded at the farmers below 30 years of age
followed by lowest cocoons yield dfl-1 at farmers above 60
years of age. The hatching per cent of the dfls distributed for
commercial silkworm rearing and total larval period among
the entire farmers field was almost similar. Likewise, the
weight of 5th instars larvae was also similar with slight
variation. The single cocoon weight (g), single shell weight
(g) and shell ratio (%) was also higher with the high cocoon
yield dfl-1. The income of the individual farmer was variable
based the quantity of dfls reared by them and production of
total cocoons. Maximum income was generated by the middle
age group of farmers. The farmer’s wise total income dfl-1
was also variable. The single cocoon weight (g), single shell
weight (g) and shell ratio (%) was highly correlates with the
total cocoon yield per dfl. The performance of commercial
silkworm rearing of Daba (Bi-Voltine) tasar ecorace based on
farmer’s age group are given in Table 6 and Pearson
correlation of commercial silkworm rearing of Daba (Bi-
Voltine) tasar ecorace based on based on farmer’s age group
are given in Table 7.
Table 6: Performance of commercial silkworm rearing of Daba (Bi-Voltine) tasar ecorace based on farmer’s age group
S.
No. Characteristics
Farmers age below
30 years
Farmers
age 30-40
years
Farmers
age 40-50
years
Farmers
age 50-60
years
Farmers age
from 60 years &
above
Total/
Mean
1. No. of farmers covered 14 35 37 32 18 136
2. No. of dfls brushed 2050 5601 5550 5210 2950 21361
3. Hatching (%) 86.14 85.14 84.86 85.44 84.78 85.46
4. Larval duration (days) 42 41 41 41 41 41.20
5. Weight of 5th instars larvae (g) 41.14 40.34 40.56 40.88 40.72 40.73
6. Total Cocoon Harvested ( in Lakhs) 1.07 2.82 3.17 2.68 1.54 11.28
7. Cocoons yield dfl-1 52.20 50.35 57.12 51.44 52.20 52.81
8. Highest cocoons yield of single farmer dfl-1 101.50 96.00 91.50 92.80 79.50 92.26
9. Single Cocoon Weight (g) 13.18 13.59 13.24 13.20 13.31 13.26
10. Single Shell Weight (g) 1.72 1.79 1.76 1.75 1.78 1.76
11. Shell Ratio (%) 13.05 13.54 13.29 13.26 13.37 13.31
12. Total income of farmers from Tasar (in Lakh) 2.79 8.65 9.58 7.62 4.34 32.98
13. Highest income of single farmer (in Lakh) 0.44 0.96 0.86 0.70 0.48 0.69
14. Average income of single farmer (in Lakh) 0.20 0.25 0.26 0.24 0.24 0.24
15. Total income dfl-1 (Rs.) 136.10 154.44 172.61 146.26 147.12 154.39
Journal of Entomology and Zoology Studies http://www.entomoljournal.com
~ 229 ~
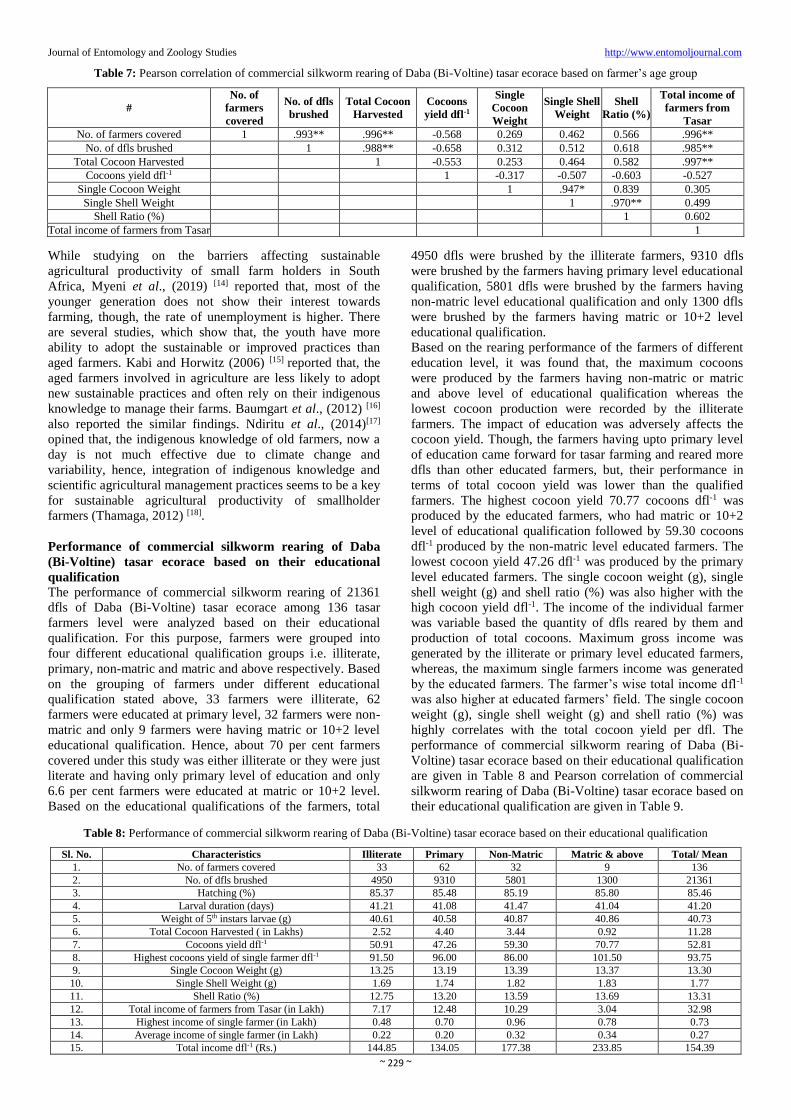
Table 7: Pearson correlation of commercial silkworm rearing of Daba (Bi-Voltine) tasar ecorace based on farmer’s age group
#
No. of
farmers
covered
No. of dfls
brushed
Total Cocoon
Harvested
Cocoons
yield dfl-1
Single
Cocoon
Weight
Single Shell
Weight
Shell
Ratio (%)
Total income of
farmers from
Tasar
No. of farmers covered 1 .993** .996** -0.568 0.269 0.462 0.566 .996**
No. of dfls brushed
1 .988** -0.658 0.312 0.512 0.618 .985**
Total Cocoon Harvested
1 -0.553 0.253 0.464 0.582 .997**
Cocoons yield dfl-1
1 -0.317 -0.507 -0.603 -0.527
Single Cocoon Weight
1 .947* 0.839 0.305
Single Shell Weight
1 .970** 0.499
Shell Ratio (%)
1 0.602
Total income of farmers from Tasar
1
While studying on the barriers affecting sustainable
agricultural productivity of small farm holders in South
Africa, Myeni et al., (2019) [14] reported that, most of the
younger generation does not show their interest towards
farming, though, the rate of unemployment is higher. There
are several studies, which show that, the youth have more
ability to adopt the sustainable or improved practices than
aged farmers. Kabi and Horwitz (2006) [15] reported that, the
aged farmers involved in agriculture are less likely to adopt
new sustainable practices and often rely on their indigenous
knowledge to manage their farms. Baumgart et al., (2012) [16]
also reported the similar findings. Ndiritu et al., (2014)[17]
opined that, the indigenous knowledge of old farmers, now a
day is not much effective due to climate change and
variability, hence, integration of indigenous knowledge and
scientific agricultural management practices seems to be a key
for sustainable agricultural productivity of smallholder
farmers (Thamaga, 2012) [18].
Performance of commercial silkworm rearing of Daba
(Bi-Voltine) tasar ecorace based on their educational
qualification
The performance of commercial silkworm rearing of 21361
dfls of Daba (Bi-Voltine) tasar ecorace among 136 tasar
farmers level were analyzed based on their educational
qualification. For this purpose, farmers were grouped into
four different educational qualification groups i.e. illiterate,
primary, non-matric and matric and above respectively. Based
on the grouping of farmers under different educational
qualification stated above, 33 farmers were illiterate, 62
farmers were educated at primary level, 32 farmers were non-
matric and only 9 farmers were having matric or 10+2 level
educational qualification. Hence, about 70 per cent farmers
covered under this study was either illiterate or they were just
literate and having only primary level of education and only
6.6 per cent farmers were educated at matric or 10+2 level.
Based on the educational qualifications of the farmers, total
4950 dfls were brushed by the illiterate farmers, 9310 dfls
were brushed by the farmers having primary level educational
qualification, 5801 dfls were brushed by the farmers having
non-matric level educational qualification and only 1300 dfls
were brushed by the farmers having matric or 10+2 level
educational qualification.
Based on the rearing performance of the farmers of different
education level, it was found that, the maximum cocoons
were produced by the farmers having non-matric or matric
and above level of educational qualification whereas the
lowest cocoon production were recorded by the illiterate
farmers. The impact of education was adversely affects the
cocoon yield. Though, the farmers having upto primary level
of education came forward for tasar farming and reared more
dfls than other educated farmers, but, their performance in
terms of total cocoon yield was lower than the qualified
farmers. The highest cocoon yield 70.77 cocoons dfl-1 was
produced by the educated farmers, who had matric or 10+2
level of educational qualification followed by 59.30 cocoons
dfl-1 produced by the non-matric level educated farmers. The
lowest cocoon yield 47.26 dfl-1 was produced by the primary
level educated farmers. The single cocoon weight (g), single
shell weight (g) and shell ratio (%) was also higher with the
high cocoon yield dfl-1. The income of the individual farmer
was variable based the quantity of dfls reared by them and
production of total cocoons. Maximum gross income was
generated by the illiterate or primary level educated farmers,
whereas, the maximum single farmers income was generated
by the educated farmers. The farmer’s wise total income dfl-1
was also higher at educated farmers’ field. The single cocoon
weight (g), single shell weight (g) and shell ratio (%) was
highly correlates with the total cocoon yield per dfl. The
performance of commercial silkworm rearing of Daba (Bi-
Voltine) tasar ecorace based on their educational qualification
are given in Table 8 and Pearson correlation of commercial
silkworm rearing of Daba (Bi-Voltine) tasar ecorace based on
their educational qualification are given in Table 9.
Table 8: Performance of commercial silkworm rearing of Daba (Bi-Voltine) tasar ecorace based on their educational qualification
Sl. No. Characteristics Illiterate Primary Non-Matric Matric & above Total/ Mean
1. No. of farmers covered 33 62 32 9 136
2. No. of dfls brushed 4950 9310 5801 1300 21361
3. Hatching (%) 85.37 85.48 85.19 85.80 85.46
4. Larval duration (days) 41.21 41.08 41.47 41.04 41.20
5. Weight of 5th instars larvae (g) 40.61 40.58 40.87 40.86 40.73
6. Total Cocoon Harvested ( in Lakhs) 2.52 4.40 3.44 0.92 11.28
7. Cocoons yield dfl-1 50.91 47.26 59.30 70.77 52.81
8. Highest cocoons yield of single farmer dfl-1 91.50 96.00 86.00 101.50 93.75
9. Single Cocoon Weight (g) 13.25 13.19 13.39 13.37 13.30
10. Single Shell Weight (g) 1.69 1.74 1.82 1.83 1.77
11. Shell Ratio (%) 12.75 13.20 13.59 13.69 13.31
12. Total income of farmers from Tasar (in Lakh) 7.17 12.48 10.29 3.04 32.98
13. Highest income of single farmer (in Lakh) 0.48 0.70 0.96 0.78 0.73
14. Average income of single farmer (in Lakh) 0.22 0.20 0.32 0.34 0.27
15. Total income dfl-1 (Rs.) 144.85 134.05 177.38 233.85 154.39
Journal of Entomology and Zoology Studies http://www.entomoljournal.com
~ 230 ~
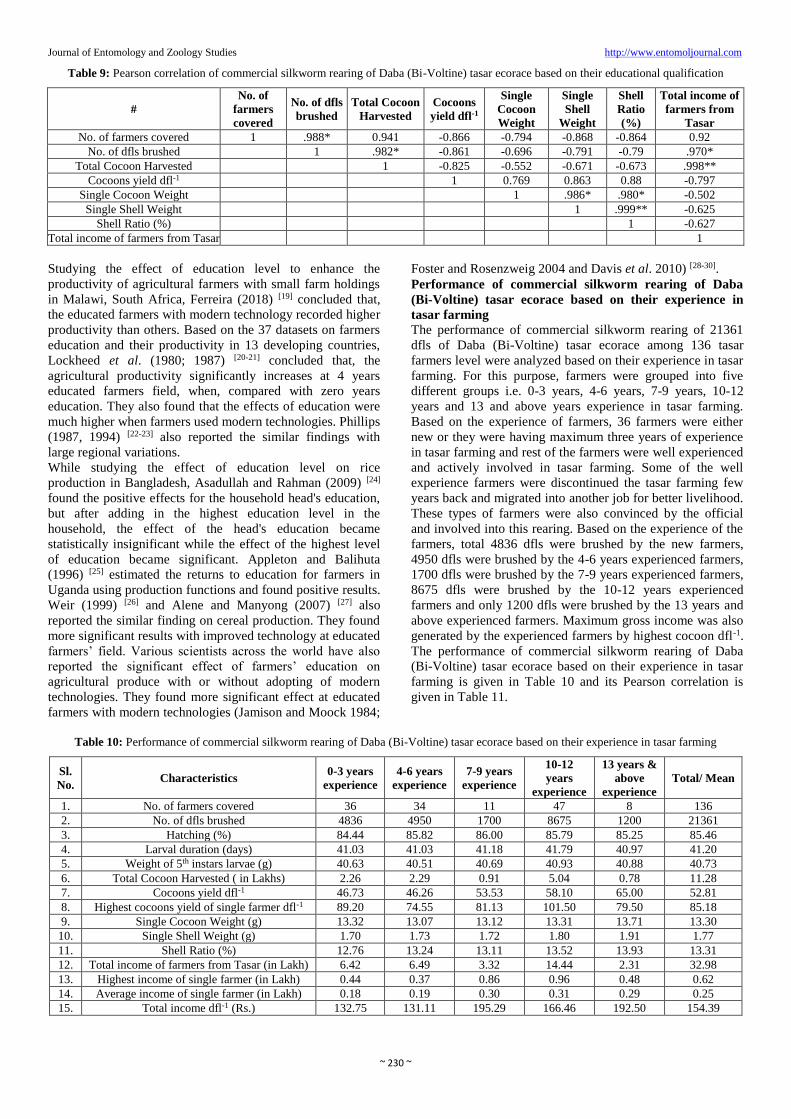
Table 9: Pearson correlation of commercial silkworm rearing of Daba (Bi-Voltine) tasar ecorace based on their educational qualification
#
No. of
farmers
covered
No. of dfls
brushed
Total Cocoon
Harvested
Cocoons
yield dfl-1
Single
Cocoon
Weight
Single
Shell
Weight
Shell
Ratio
(%)
Total income of
farmers from
Tasar
No. of farmers covered 1 .988* 0.941 -0.866 -0.794 -0.868 -0.864 0.92
No. of dfls brushed
1 .982* -0.861 -0.696 -0.791 -0.79 .970*
Total Cocoon Harvested
1 -0.825 -0.552 -0.671 -0.673 .998**
Cocoons yield dfl-1
1 0.769 0.863 0.88 -0.797
Single Cocoon Weight
1 .986* .980* -0.502
Single Shell Weight
1 .999** -0.625
Shell Ratio (%)
1 -0.627
Total income of farmers from Tasar
1
Studying the effect of education level to enhance the
productivity of agricultural farmers with small farm holdings
in Malawi, South Africa, Ferreira (2018) [19] concluded that,
the educated farmers with modern technology recorded higher
productivity than others. Based on the 37 datasets on farmers
education and their productivity in 13 developing countries,
Lockheed et al. (1980; 1987) [20-21] concluded that, the
agricultural productivity significantly increases at 4 years
educated farmers field, when, compared with zero years
education. They also found that the effects of education were
much higher when farmers used modern technologies. Phillips
(1987, 1994) [22-23] also reported the similar findings with
large regional variations.
While studying the effect of education level on rice
production in Bangladesh, Asadullah and Rahman (2009) [24]
found the positive effects for the household head's education,
but after adding in the highest education level in the
household, the effect of the head's education became
statistically insignificant while the effect of the highest level
of education became significant. Appleton and Balihuta
(1996) [25] estimated the returns to education for farmers in
Uganda using production functions and found positive results.
Weir (1999) [26] and Alene and Manyong (2007) [27] also
reported the similar finding on cereal production. They found
more significant results with improved technology at educated
farmers’ field. Various scientists across the world have also
reported the significant effect of farmers’ education on
agricultural produce with or without adopting of modern
technologies. They found more significant effect at educated
farmers with modern technologies (Jamison and Moock 1984;
Foster and Rosenzweig 2004 and Davis et al. 2010) [28-30].
Performance of commercial silkworm rearing of Daba
(Bi-Voltine) tasar ecorace based on their experience in
tasar farming
The performance of commercial silkworm rearing of 21361
dfls of Daba (Bi-Voltine) tasar ecorace among 136 tasar
farmers level were analyzed based on their experience in tasar
farming. For this purpose, farmers were grouped into five
different groups i.e. 0-3 years, 4-6 years, 7-9 years, 10-12
years and 13 and above years experience in tasar farming.
Based on the experience of farmers, 36 farmers were either
new or they were having maximum three years of experience
in tasar farming and rest of the farmers were well experienced
and actively involved in tasar farming. Some of the well
experience farmers were discontinued the tasar farming few
years back and migrated into another job for better livelihood.
These types of farmers were also convinced by the official
and involved into this rearing. Based on the experience of the
farmers, total 4836 dfls were brushed by the new farmers,
4950 dfls were brushed by the 4-6 years experienced farmers,
1700 dfls were brushed by the 7-9 years experienced farmers,
8675 dfls were brushed by the 10-12 years experienced
farmers and only 1200 dfls were brushed by the 13 years and
above experienced farmers. Maximum gross income was also
generated by the experienced farmers by highest cocoon dfl-1.
The performance of commercial silkworm rearing of Daba
(Bi-Voltine) tasar ecorace based on their experience in tasar
farming is given in Table 10 and its Pearson correlation is
given in Table 11.
Table 10: Performance of commercial silkworm rearing of Daba (Bi-Voltine) tasar ecorace based on their experience in tasar farming
Sl.
No. Characteristics
0-3 years
experience
4-6 years
experience
7-9 years
experience
10-12
years
experience
13 years &
above
experience
Total/ Mean
1. No. of farmers covered 36 34 11 47 8 136
2. No. of dfls brushed 4836 4950 1700 8675 1200 21361
3. Hatching (%) 84.44 85.82 86.00 85.79 85.25 85.46
4. Larval duration (days) 41.03 41.03 41.18 41.79 40.97 41.20
5. Weight of 5th instars larvae (g) 40.63 40.51 40.69 40.93 40.88 40.73
6. Total Cocoon Harvested ( in Lakhs) 2.26 2.29 0.91 5.04 0.78 11.28
7. Cocoons yield dfl-1 46.73 46.26 53.53 58.10 65.00 52.81
8. Highest cocoons yield of single farmer dfl-1 89.20 74.55 81.13 101.50 79.50 85.18
9. Single Cocoon Weight (g) 13.32 13.07 13.12 13.31 13.71 13.30
10. Single Shell Weight (g) 1.70 1.73 1.72 1.80 1.91 1.77
11. Shell Ratio (%) 12.76 13.24 13.11 13.52 13.93 13.31
12. Total income of farmers from Tasar (in Lakh) 6.42 6.49 3.32 14.44 2.31 32.98
13. Highest income of single farmer (in Lakh) 0.44 0.37 0.86 0.96 0.48 0.62
14. Average income of single farmer (in Lakh) 0.18 0.19 0.30 0.31 0.29 0.25
15. Total income dfl-1 (Rs.) 132.75 131.11 195.29 166.46 192.50 154.39
Journal of Entomology and Zoology Studies http://www.entomoljournal.com
~ 231 ~
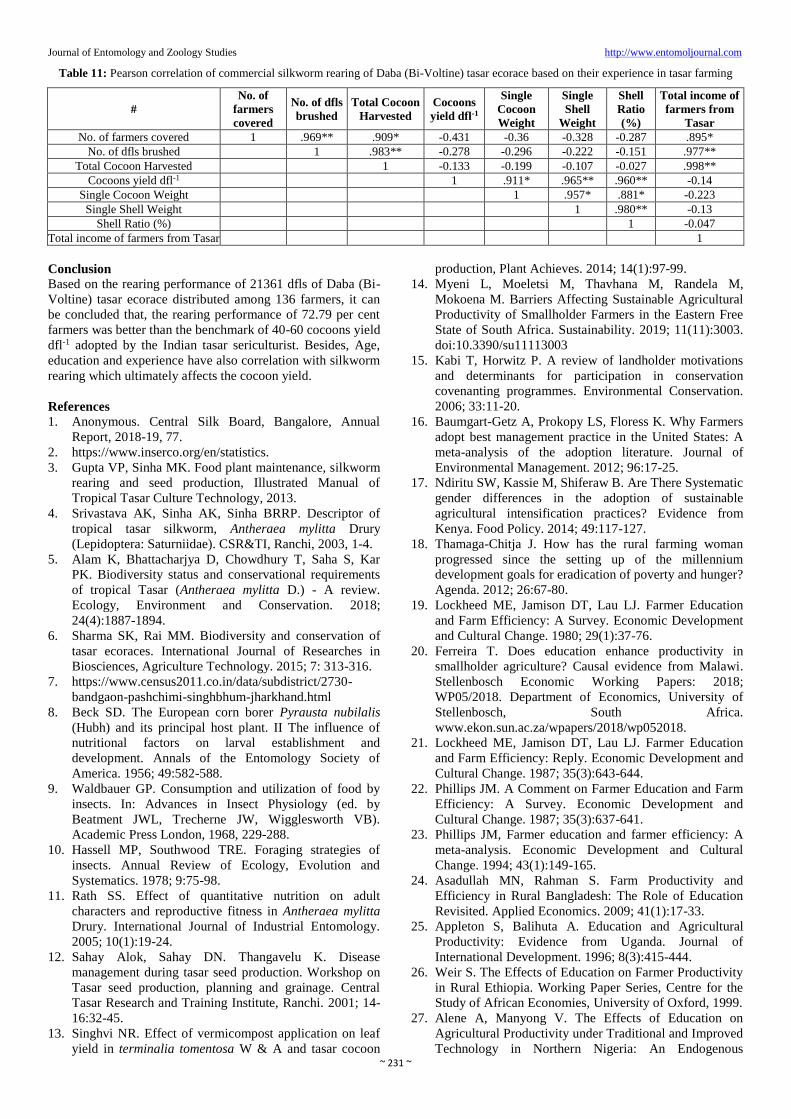
Table 11: Pearson correlation of commercial silkworm rearing of Daba (Bi-Voltine) tasar ecorace based on their experience in tasar farming
#
No. of
farmers
covered
No. of dfls
brushed
Total Cocoon
Harvested
Cocoons
yield dfl-1
Single
Cocoon
Weight
Single
Shell
Weight
Shell
Ratio
(%)
Total income of
farmers from
Tasar
No. of farmers covered 1 .969** .909* -0.431 -0.36 -0.328 -0.287 .895*
No. of dfls brushed
1 .983** -0.278 -0.296 -0.222 -0.151 .977**
Total Cocoon Harvested
1 -0.133 -0.199 -0.107 -0.027 .998**
Cocoons yield dfl-1
1 .911* .965** .960** -0.14
Single Cocoon Weight
1 .957* .881* -0.223
Single Shell Weight
1 .980** -0.13
Shell Ratio (%)
1 -0.047
Total income of farmers from Tasar
1
Conclusion
Based on the rearing performance of 21361 dfls of Daba (Bi-
Voltine) tasar ecorace distributed among 136 farmers, it can
be concluded that, the rearing performance of 72.79 per cent
farmers was better than the benchmark of 40-60 cocoons yield
dfl-1 adopted by the Indian tasar sericulturist. Besides, Age,
education and experience have also correlation with silkworm
rearing which ultimately affects the cocoon yield.
References
1. Anonymous. Central Silk Board, Bangalore, Annual
Report, 2018-19, 77.
2. https://www.inserco.org/en/statistics.
3. Gupta VP, Sinha MK. Food plant maintenance, silkworm
rearing and seed production, Illustrated Manual of
Tropical Tasar Culture Technology, 2013.
4. Srivastava AK, Sinha AK, Sinha BRRP. Descriptor of
tropical tasar silkworm, Antheraea mylitta Drury
(Lepidoptera: Saturniidae). CSR&TI, Ranchi, 2003, 1-4.
5. Alam K, Bhattacharjya D, Chowdhury T, Saha S, Kar
PK. Biodiversity status and conservational requirements
of tropical Tasar (Antheraea mylitta D.) - A review.
Ecology, Environment and Conservation. 2018;
24(4):1887-1894.
6. Sharma SK, Rai MM. Biodiversity and conservation of
tasar ecoraces. International Journal of Researches in
Biosciences, Agriculture Technology. 2015; 7: 313-316.
7. https://www.census2011.co.in/data/subdistrict/2730-
bandgaon-pashchimi-singhbhum-jharkhand.html
8. Beck SD. The European corn borer Pyrausta nubilalis
(Hubh) and its principal host plant. II The influence of
nutritional factors on larval establishment and
development. Annals of the Entomology Society of
America. 1956; 49:582-588.
9. Waldbauer GP. Consumption and utilization of food by
insects. In: Advances in Insect Physiology (ed. by
Beatment JWL, Trecherne JW, Wigglesworth VB).
Academic Press London, 1968, 229-288.
10. Hassell MP, Southwood TRE. Foraging strategies of
insects. Annual Review of Ecology, Evolution and
Systematics. 1978; 9:75-98.
11. Rath SS. Effect of quantitative nutrition on adult
characters and reproductive fitness in Antheraea mylitta
Drury. International Journal of Industrial Entomology.
2005; 10(1):19-24.
12. Sahay Alok, Sahay DN. Thangavelu K. Disease
management during tasar seed production. Workshop on
Tasar seed production, planning and grainage. Central
Tasar Research and Training Institute, Ranchi. 2001; 14-
16:32-45.
13. Singhvi NR. Effect of vermicompost application on leaf
yield in terminalia tomentosa W & A and tasar cocoon
production, Plant Achieves. 2014; 14(1):97-99.
14. Myeni L, Moeletsi M, Thavhana M, Randela M,
Mokoena M. Barriers Affecting Sustainable Agricultural
Productivity of Smallholder Farmers in the Eastern Free
State of South Africa. Sustainability. 2019; 11(11):3003.
doi:10.3390/su11113003
15. Kabi T, Horwitz P. A review of landholder motivations
and determinants for participation in conservation
covenanting programmes. Environmental Conservation.
2006; 33:11-20.
16. Baumgart-Getz A, Prokopy LS, Floress K. Why Farmers
adopt best management practice in the United States: A
meta-analysis of the adoption literature. Journal of
Environmental Management. 2012; 96:17-25.
17. Ndiritu SW, Kassie M, Shiferaw B. Are There Systematic
gender differences in the adoption of sustainable
agricultural intensification practices? Evidence from
Kenya. Food Policy. 2014; 49:117-127.
18. Thamaga-Chitja J. How has the rural farming woman
progressed since the setting up of the millennium
development goals for eradication of poverty and hunger?
Agenda. 2012; 26:67-80.
19. Lockheed ME, Jamison DT, Lau LJ. Farmer Education
and Farm Efficiency: A Survey. Economic Development
and Cultural Change. 1980; 29(1):37-76.
20. Ferreira T. Does education enhance productivity in
smallholder agriculture? Causal evidence from Malawi.
Stellenbosch Economic Working Papers: 2018;
WP05/2018. Department of Economics, University of
Stellenbosch, South Africa.
www.ekon.sun.ac.za/wpapers/2018/wp052018.
21. Lockheed ME, Jamison DT, Lau LJ. Farmer Education
and Farm Efficiency: Reply. Economic Development and
Cultural Change. 1987; 35(3):643-644.
22. Phillips JM. A Comment on Farmer Education and Farm
Efficiency: A Survey. Economic Development and
Cultural Change. 1987; 35(3):637-641.
23. Phillips JM, Farmer education and farmer efficiency: A
meta-analysis. Economic Development and Cultural
Change. 1994; 43(1):149-165.
24. Asadullah MN, Rahman S. Farm Productivity and
Efficiency in Rural Bangladesh: The Role of Education
Revisited. Applied Economics. 2009; 41(1):17-33.
25. Appleton S, Balihuta A. Education and Agricultural
Productivity: Evidence from Uganda. Journal of
International Development. 1996; 8(3):415-444.
26. Weir S. The Effects of Education on Farmer Productivity
in Rural Ethiopia. Working Paper Series, Centre for the
Study of African Economies, University of Oxford, 1999.
27. Alene A, Manyong V. The Effects of Education on
Agricultural Productivity under Traditional and Improved
Technology in Northern Nigeria: An Endogenous
Journal of Entomology and Zoology Studies http://www.entomoljournal.com
~ 232 ~
Switching Regression Analysis. Empirical Economics.
2007; 32(1):141-159.
28. Jamison DT, Moock PR. Farmer education and farm
efficiency in Nepal: The role of schooling, extension
services, and cognitive skills. World Development. 1984;
12(1):67-86. URL
http://www.sciencedirect.com/science/article/pii/0305750
X84900366.
29. Foster AD, Rosenzweig MR. Technological Change and
the Distribution of Schooling: Evidence from Green-
Revolution India: New Research on Education in
Developing Economies. Journal of Development
Economics. 2004; 74(1):87-111.
30. Davis K, Nkonya E, Kato E, Mekonnen DA, Odendo M,
Miiro R et al. Impact of Farmer Field Schools on
Agricultural Productivity and Poverty in East Africa.
IFPRI Discussion 00992; International Food Policy
Research Institute, 2010.
View publication statsView publication stats
Related Documents