Restorative Neurology and Neuroscience 32 (2014) 767–787 DOI 10.3233/RNN-140426 IOS Press 767 A case of post-traumatic minimally conscious state reversed by midazolam: Clinical aspects and neurophysiological correlates Maria Chiara Carboncini a,∗ , Andrea Piarulli b , Alessandra Virgillito a , Pieranna Arrighi a , Paolo Andre d , Francesco Tomaiuolo c , Antonio Frisoli b , Massimo Bergamasco b , Bruno Rossi a and Luca Bonfiglio a a Department of Neuroscience, University of Pisa, Pisa, Italy b PERCRO (Perceptual Robotics) Laboratory, Scuola Superiore Sant’Anna, Pisa, Italy c Auxilium Vitae, Volterra, Pisa, Italy d Department of Medical and Surgical Sciences and Neuroscience, University of Siena, Siena, Italy Abstract. Purpose: We describe the case of a subject in a post-traumatic Minimally Conscious State (MCS) who retrieved full interaction with the environment after midazolam infusion. We studied EEG correlates of the “awakening reaction” in the different domains of frequency, time and cortical topography, along with the intrinsic connectivity within both the task-positive and the linguistic network. Methods: EEG recorded before and after midazolam administration has been submitted to spectral power analysis, sLORETA analysis and intrinsic connectivity analysis within both functional networks. Results: A critical change in the power spectrum profile was observed after midazolam: a) the power between 1 and 12 Hz decreased, reaching its maximum difference with respect to pre-infusion at about 7 Hz and b) the power between 12 and 30 Hz increased, with a maximum difference at about 15 Hz. At the same time, midazolam induced significant connectivity changes, especially for these two frequency bands, within both functional networks. Conclusions: We advance some hypotheses about certain aspects of the recovery from the MCS both in terms of anatomo- functional correlations and functional brain systems and we make inferences about the role that some kind of ‘catatonic’ symptoms might play in determining and/or maintaining this peculiar clinical state. Keywords: Connectivity, catatonia, disorders of consciousness, EEG, GABAergic drugs, minimally conscious state, non- convulsive status epilepticus, theta rhythm 1. Introduction To our knowledge, no reporting has been made regarding the “awakening” effect of midazolam. Herein we describe the case of a subject in appar- ent minimally conscious state, who retrieves the full interaction with the environment after midazolam administration. ∗ Corresponding author: Dr. Maria Chiara Carboncini, Depart- ment of Neuroscience, University of Pisa, via Paradisa 2, 56126 Pisa, Italy. Tel.: +39 50995581; Fax: +39 50995723; E-mail: [email protected]. As a result of a car accident SV, a 43-years-old male, had a craniofacial trauma. He was admitted to the hos- pital scoring 4 to the Glasgow Coma Scale (GCS); the CT scan at the admittance indicated the presence of little contusive hemorrhagic lesions into the right temporo-insular region and in the left white matter around the posterior horn of the lateral ventricles. SV had been in coma for 40 days and subsequently in vegetative state for four weeks. He further evolved after 180 days turning in Severe Disability status according to Giacino classification criteria (Giacino et al., 2002). He was dismissed after ten months. At discharge he 0922-6028/14/$27.50 © 2014 – IOS Press and the authors. All rights reserved This article is published online with Open Access and distributed under the terms of the Creative Commons Attribution Non-Commercial License.

Welcome message from author
This document is posted to help you gain knowledge. Please leave a comment to let me know what you think about it! Share it to your friends and learn new things together.
Transcript

Restorative Neurology and Neuroscience 32 (2014) 767–787DOI 10.3233/RNN-140426IOS Press
767
A case of post-traumatic minimally consciousstate reversed by midazolam: Clinical aspectsand neurophysiological correlates
Maria Chiara Carboncinia,∗, Andrea Piarullib, Alessandra Virgillitoa, Pieranna Arrighia, Paolo Andred,Francesco Tomaiuoloc, Antonio Frisolib, Massimo Bergamascob, Bruno Rossia and Luca Bonfiglioa
aDepartment of Neuroscience, University of Pisa, Pisa, ItalybPERCRO (Perceptual Robotics) Laboratory, Scuola Superiore Sant’Anna, Pisa, ItalycAuxilium Vitae, Volterra, Pisa, ItalydDepartment of Medical and Surgical Sciences and Neuroscience, University of Siena, Siena, Italy
Abstract.Purpose: We describe the case of a subject in a post-traumatic Minimally Conscious State (MCS) who retrieved full interactionwith the environment after midazolam infusion. We studied EEG correlates of the “awakening reaction” in the different domainsof frequency, time and cortical topography, along with the intrinsic connectivity within both the task-positive and the linguisticnetwork.Methods: EEG recorded before and after midazolam administration has been submitted to spectral power analysis, sLORETAanalysis and intrinsic connectivity analysis within both functional networks.Results: A critical change in the power spectrum profile was observed after midazolam: a) the power between 1 and 12 Hzdecreased, reaching its maximum difference with respect to pre-infusion at about 7 Hz and b) the power between 12 and 30 Hzincreased, with a maximum difference at about 15 Hz. At the same time, midazolam induced significant connectivity changes,especially for these two frequency bands, within both functional networks.Conclusions: We advance some hypotheses about certain aspects of the recovery from the MCS both in terms of anatomo-functional correlations and functional brain systems and we make inferences about the role that some kind of ‘catatonic’symptoms might play in determining and/or maintaining this peculiar clinical state.
Keywords: Connectivity, catatonia, disorders of consciousness, EEG, GABAergic drugs, minimally conscious state, non-convulsive status epilepticus, theta rhythm
1. Introduction
To our knowledge, no reporting has been maderegarding the “awakening” effect of midazolam.
Herein we describe the case of a subject in appar-ent minimally conscious state, who retrieves the fullinteraction with the environment after midazolamadministration.
∗Corresponding author: Dr. Maria Chiara Carboncini, Depart-ment of Neuroscience, University of Pisa, via Paradisa 2, 56126Pisa, Italy. Tel.: +39 50995581; Fax: +39 50995723; E-mail:[email protected].
As a result of a car accident SV, a 43-years-old male,had a craniofacial trauma. He was admitted to the hos-pital scoring 4 to the Glasgow Coma Scale (GCS);the CT scan at the admittance indicated the presenceof little contusive hemorrhagic lesions into the righttemporo-insular region and in the left white matteraround the posterior horn of the lateral ventricles. SVhad been in coma for 40 days and subsequently invegetative state for four weeks. He further evolved after180 days turning in Severe Disability status accordingto Giacino classification criteria (Giacino et al., 2002).He was dismissed after ten months. At discharge he
0922-6028/14/$27.50 © 2014 – IOS Press and the authors. All rights reserved
This article is published online with Open Access and distributed under the terms of the Creative Commons Attribution Non-Commercial License.
768 M.C. Carboncini et al. / A case of post-traumatic minimally conscious state reversed by midazolam
had psicomotor slowness, lack of verbal initiative anddependence in all life activity. Behind insistence hewas able to read aloud single words and numbers.
After about 1 year from trauma, because of diurnalsleepiness onset, hydrocephalus was suspected, thus heunderwent a further CT scan. Since a dilatation of ven-tricular volume was detected, a ventriculo-peritonealshunt was positioned. Soon after the shunt, SV wentback to the previous status (i.e. psychomotor slownessand lack of verbal initiative). A progressive cognitiveability decline occurred, as verified during the medi-cal examination for the annual shunt control two yearsafter trauma: SV did not produce any single word,he did not answer even to very simple requests (e.g.close your eyes) and did not communicate in any way.The general physical examination let on psychomotorbradykinesia, amimica facies, reduction of the blinkrate, increased muscle tone plastic type and no limbsweakness. He had enlargement of the support base,
overall body rigidity and bradykinetic gait. He pro-duced aimless repetitive behaviours (e.g., clapping)and resistance to passive motion proportional to thestrength of the stimulus.
He underwent EEG, P300, PET and CT. The EEGpattern revealed a widespread theta rhythm and anamplitude reduction of P300 response was observedwhen registering acoustic evoked potentials. A F18-FDG PET revealed a reduction of the metabolic activityin the overall cingulate, frontal and in the temporalcortex bilaterally, larger into the right hemisphere. Dur-ing this period we attempted different drug therapiestesting individually their effect. We tested amantadine,L-dopa and zolpidem. None of the tested drugs resultedin SV clinical status modification, thus we decided tosuspend any kind of drug administration.
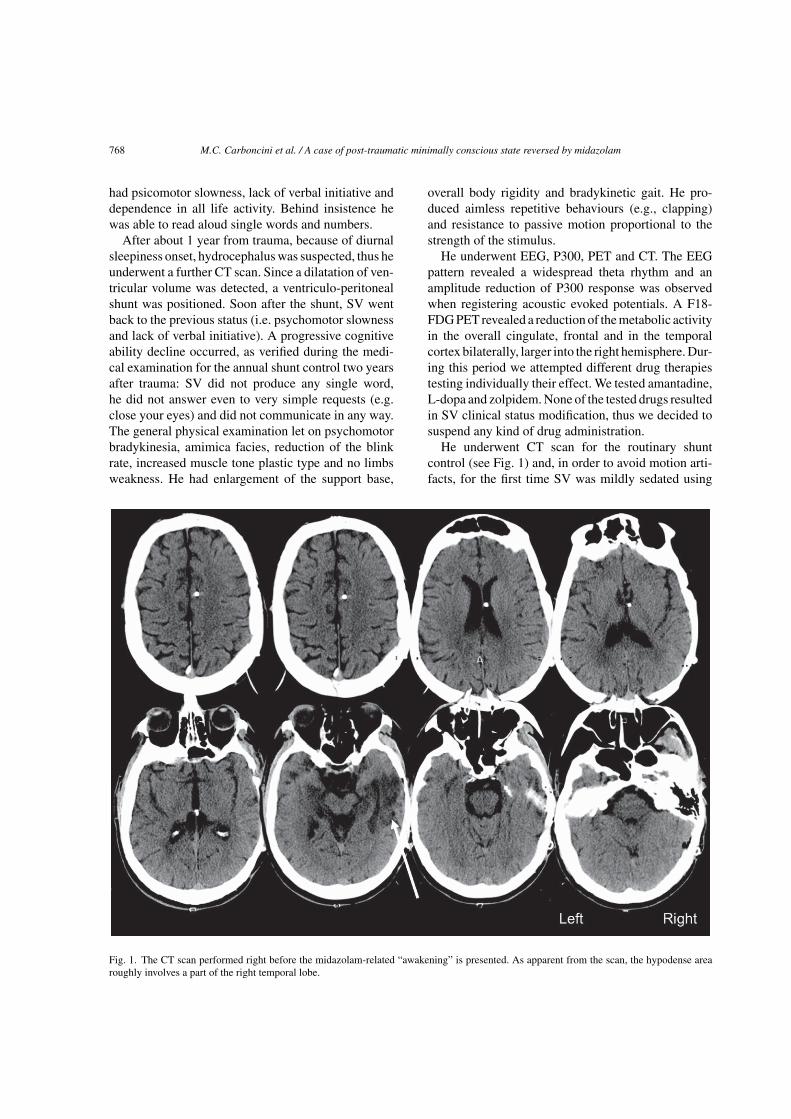
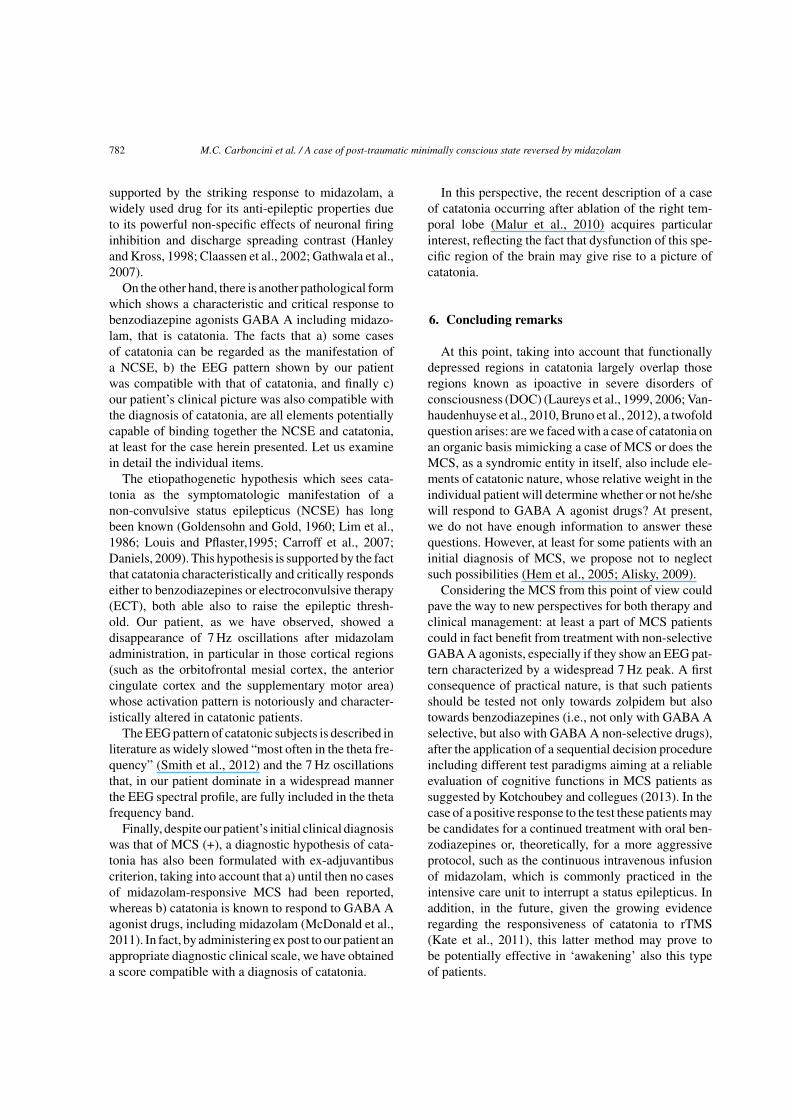
He underwent CT scan for the routinary shuntcontrol (see Fig. 1) and, in order to avoid motion arti-facts, for the first time SV was mildly sedated using
Fig. 1. The CT scan performed right before the midazolam-related “awakening” is presented. As apparent from the scan, the hypodense arearoughly involves a part of the right temporal lobe.

M.C. Carboncini et al. / A case of post-traumatic minimally conscious state reversed by midazolam 769
midazolam instead of the usual propofol. SurprisinglySV began to interact with the anesthetist and soon afterwith his parents. He talked by cellphone with his auntand congratulated his brother when he was informedof his graduation; he recognized the road leading tohis home. When he was asked about his car accidenthe did not remember anything and apparently he wasnot aware of his status. This clinical status lasted abouttwo hours after drugs administration and disappearedquickly after, taking the patient back to the previousclinical status (psicomotor slowness and lack of verbalinitiative).
His relatives reported that SV did not show eitherword production or responsive behaviour during thetime window following the CT scan.
SV behavioural examination was repeated one weekand four weeks later. During both examinations wewere able to observe only a single episode in whichSV reacted to a simple command with a longer latency(i.e. “switch off the light” while he was walking out ofthe room). No further verbal commands were executedduring these examinations.
To verify if SV clinical status modification had beeninduced by midazolam, we repeated the administra-tion of midazolam (5 mg in 100 cc of saline solutionin eight min), under both behavioural and EEG mon-itoring. The study was approved by the Pisa Hospitalethical committee and informed consent was obtainedfrom the legal surrogates of SV.
Few minutes after midazolam administration, thepatient began to interact with his brother and withthe staff, answering appropriately to the questions thatwere asked. For this striking response to benzodi-azepine administration we suspect, in our patient, thecoexistence of catatonia.
Behavioural reactions preceding and followingmidazolam administration have been described andvideotaped (watch movies: http://youtu.be/XIsTC4lbHo and http://youtu.be/-rWzNv3q8Xc). EEG recor-ded before and after midazolam administration hasbeen submitted to spectral power analysis, sLORETAanalysis and intrinsic connectivity analysis within boththe task-positive network and the linguistic network.Our attention has focused on these two particularnetworks because we believe that their functionalimprovement has substantially contributed to deter-mine the awakening reaction presented by our patient.The task-positive network, in fact, has to deal withthe ability to cope with and solve cognitive tasksthat require explicit behavioural responses, while the
linguistic one deals with language comprehension andproduction. All of these functions have been provento recover following midazolam administration: ourpatient, in fact, was able to understand verbal com-mands and to perform any type of response wasrequired, either behavioural or verbal.
2. Background
The incidence of traumatic brain injury is high bothin industrialized and non-industrialized countries and itis estimated to be between 150–250 cases per 100.000population per year (Thurman and Guerrero, 1999;Tagliaferri et al., 2006), about 10% of these can beclassified at the admittance as severe TBI, based on theGlasgow Coma Score (GCS, <8). In the case of sur-vival, after the phase of coma, the patient evolves eithertowards vegetative state, minimally conscious state, orsevere disability, that result in catastrophic changes forhis/her family and in a significant amount of human andfinancial resources from the national health and socialsystems.
In order to try to achieve the recovery of conscious-ness, either stimulant or depressant pharmacologicagents have been used in small-scale pharmacologicaltrials.
As regard stimulant pharmacologic agents, stud-ies using amantadine, a mixed of NMDA antagonistand dopaminergic agonist, showed a better outcomein post-traumatic disorders of consciousness (Whyteet al., 2005; Sawyer et al., 2008). Also the administra-tion of other dopaminergic agents, such as levodopaand bromocriptine, appears to promote a favourablefunctional outcome (Passler and Riggs 2001; Matsudaet al., 2005).
Several reports concern the arousing effect ofdepressant pharmacological agents. Zolpidem, a selec-tive non-benzodiazepinic GABAA alfa 1 agonist, hasbeen extensively studied both clinically (Clauss et al.,2000, 2001; Shames and Ring, 2008; Nyakale et al.,2010), and with functional neuroimaging (Clauss andNel, 2004; Brefel-Courbon et al., 2007; Victor et al.,2011).
Regarding other GABAergic drugs, just few casereports of patients with severe brain injury who havea significant clinical improvement after diazepam(GABAA agonist) (Caradoc-Davis, 1996) or baclofen(GABAB agonist) (Taira and Hori, 2007) administra-tion are documented in literature.
770 M.C. Carboncini et al. / A case of post-traumatic minimally conscious state reversed by midazolam
3. Materials and methods
3.1. Behavioural evaluation
A procedure similar to that used for Wada Testwas executed (Jones Gotman, 1987). Speech test-ing includes: naming the subject own name, namingof objects, reading of single words. Language com-prehension was estimate using a yes-no response torecognition of subject name choosing among 4 verballypresented alternatives, a modified version of token test,while he had to choose among 4 objects, the one writ-ten on the sketchpad that was positioned in front ofhim. Finally a readapted version of Mini Mental StateExamination (Folstein et al., 1975) was administeredwhile the patient was lying in bed both before and afterdrug administration.
3.2. EEG recording and pre-processing
EEG activity was monitored from ten minutesbefore midazolam administration to twenty minutesafter the administration. EEG signals were acquiredusing a BQ132S EEG amplifier (BrainQuick Sys-tem, Micromed, Treviso, Italy) and an electrode cap(Electro-Cap International, Inc., Eaton, Ohio 45320USA) at 19 positions following the 10–20 InternationalSystem. EEG signals were collected with a samplingrate of 256 Hz and band-pass filtered between 0.03and 45 Hz, keeping electrodes impedance below 5 k�.Independent component analysis (ICA) was employedto detect and remove EEG artifacts (Makeig et al.,1996). EEG signals were then visually inspected andresidual artifacted epochs were removed. In line with aprevious paper from our group (Bonfiglio et al., 2013),surface potentials were referenced off-line (after ICApruning), to an estimated infinity reference usingthe REST software (Qin et al., 2010). The infin-ity reference was chosen as this technique has beendemonstrated to perform better than other commonlyused referencing schemes when analyzing power spec-tra (Yao et al., 2005), ERP topographies (Yao et al.,2007), and connectivity (i.e. coherence measures) (Qinet al., 2010).
At the end of the artifacted epochs removal proce-dure, about 5 minutes of recording before midazolamadministration, 10 minutes encompassing the infusionperiod and 18 after were retained. All three periods(pre-infusion, infusion and post-infusion) were dividedin 8 seconds epochs.
3.3. EEG spectral analysis
For each EEG channel and each epoch, the powerspectrum was estimated using the wavelet trans-form (Torrence and Compo, 1998) with a Morletbasis. The Morlet is a complex function definedas: ψ0 (η) = π−1/4eiω0ηe−η2/2(1), where η = t/s is anon-dimensional time parameter (t being the time-parameter expressed in time samples and s the scale),and ω0 is a non-dimensional frequency that identifiesthe number of wavelet cycles (a value of 6 was cho-sen for the non-dimensional frequency to satisfy theadmissibility condition, see for example Farge, 1992).The non-dimensional frequency was kept constant atdifferent scales.
In the continuous limit the Fourier Transform (FT)of the function ψ0 (t/s) is given by �0 (sω) (here andin the following upper-case letters indicate the FT ofa function). The FT of the Morlet function is thusdefined as: �0 (sω) = π−1/4H (ω) e−(sω−ω0)2/2 (2),where H (ω) is the Heaviside step function (H (ω) =1 if ω > 0, H (ω) = 0 if ω < 0). As the Morlet isa non-orthogonal wavelet basis, the wavelet func-tion at each scale has to be normalized to have unitenergy (so that transforms of different time-seriesand at different scales can be compared): � (sωk) =(2πδt/s)1/2�0 (sωk) (3), where k is the angular fre-quency index.
Let then xn be the time series related to one epochwhere n = 0, 2, . . . N − 1, N being the number of sam-ples in the time series (2048, that is 8*f s where f sis the EEG sampling rate) and δt = 1/fs be the timespacing between consecutive samples.
The Wavelet Transform (WT) of thexn time-series ata scale s and time-point n is defined as the convolutionof xn with a scaled and translated version of the motherwavelet ψ:
Wn (s) =N−1∑µ=0
xµψ ∗[
(µ− n) δt
s
](4)
(ψ ∗ indicates the complex coniugate of ψ)
While the wavelet transform can be estimated usingEquation (4), a faster approach to the transform isto conduct the calculation in Fourier space. It isworth underlining that the approximation of the WTis obtained applying the above-defined convolution Ntimes for each scale. All the N convolutions at a givenscale can be conducted simultaneously in Fourier spaceusing the Discrete Fourier Transform (DFT).

M.C. Carboncini et al. / A case of post-traumatic minimally conscious state reversed by midazolam 771
Let Xk = 1N
∑N−1n=0 xne
−2πikn/N (5) be the DFT ofxn where k is the frequency index. The application ofthe convolution theorem leads to the following formu-lation: Wn (s) = ∑N−1
k=0 Xk� ∗ (sωk) eiωknδt (7) wherethe angular frequency is ωk = 2πk
Nδtfor k < N/2 and
ωk = − 2πkNδt
for k ≥ N/2.Finally the wavelet power spectrum expressed in
dB is defined as: PdB (s) = 10 log10
(|Wn (s)|2) (8) foreach scale s, where |Wn (s)|2 is expressed in µV 2.
For a wavelet analysis based on a non-orthogonalbasis, an arbitrary set of scales can be used. The scaleswere expressed as fractional powers of two: sj = s02jδj
(see Torrence and Compo, 1998) where the j were cho-sen in order to cover the scales (and correspondingfrequencies) of interest; we set s0 = 2δt (i.e. 0.0078)in order to satisfy the condition on the equivalentFourier period T (which should be at least equal to2δt, as for the Morlet function the following equationholds: T = 4πs
ω0+√
2+ω20
∼= 1.03s (9) with the choice of
ω0 = 6. Regarding δj, a value of about 0.5 is the largestone that gives adequate sampling in scale (Torrenceand Compo, 1998); to obtain a finer scale resolutionδj was set equal to 0.1. The frequencies of interestranging from 1 Hz to 35 Hz were thus covered by 51scales. Frequencies were obtained from scales apply-ing the following fj = 1
1.03sjwhich directly derives
from (9). Equation (8) can be rewritten as a function
of frequency as: PdB(fj
) = 10 log10
(∣∣Wn
(fj
)∣∣2)
.
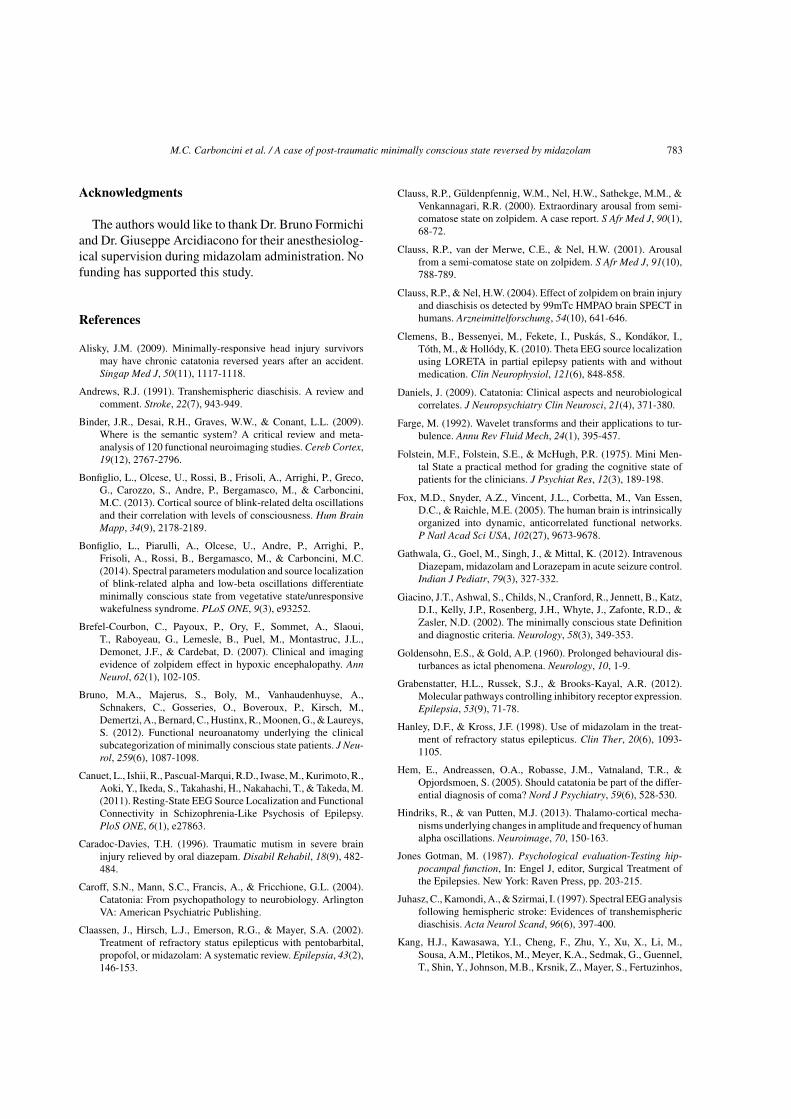
The mean power spectra of each epoch was then esti-mated for each channel. Power spectra (as a functionof frequency) were obtained for each channel averag-ing among mean spectra of epochs pertaining to eachperiod (be it pre- or post-infusion). The mean scalppower spectra as a function of frequency (see Fig. 2central graph) was then obtained averaging amongelectrodes.
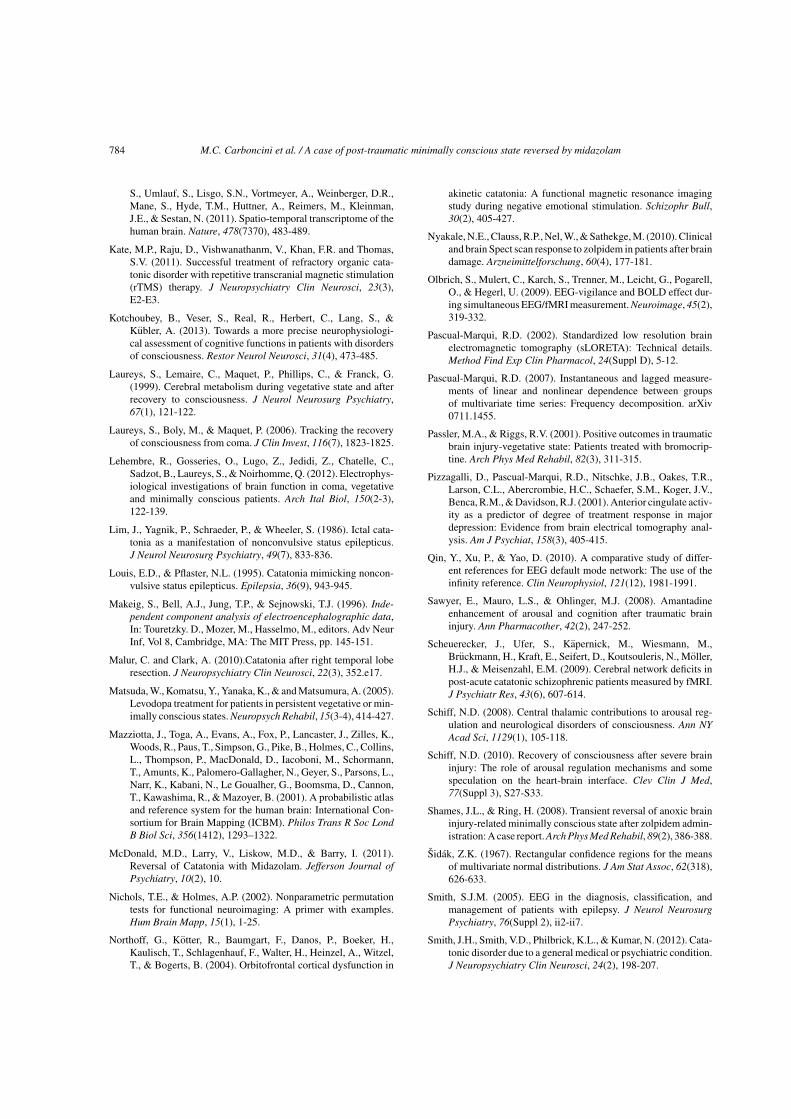
The time-course (from pre-infusion to post-infusionand including also the intra-infusion epochs) ofmean scalp power was then estimated for sevenEEG bands: delta (1–4 Hz), theta1 (4–6 Hz), theta2(6–8 Hz), alpha1 (8–10 Hz), alpha2 (10–12 Hz), beta1(12–18 Hz), beta2(18–35 Hz), see Fig. 3:
– For each channel and each 8 seconds epochthe power of each selected band was estimatedas the summation of power values related tothe center frequencies included in the band: a)delta (1.04–3.87 Hz); b) theta1 (4.15–5.87 Hz); c)
theta2 (6.29–7.74 Hz); d) alpha1 (8.30–9.53 Hz);e) alpha2 (10.22–11.74 Hz); f) beta1 (12.58–17.79 Hz); g) beta2 (19.07–33.20 Hz).
– As a second step, the mean scalp power for each8 seconds epoch and each band of interest wasestimated averaging between electrodes.
– Finally, for each band and epoch, the power Z-score was estimated referred to the pre-infusionperiod: Zij = Pij−〈Pik〉
std(Pik) where i is the band (delta,theta1, theta2, alpha1, alpha2, beta1, beta2), j isthe 8 seconds epoch (ranging from the begin-ning of pre-infusion to the end of post-infusion),k are the 8 seconds epochs included in the pre-infusion period, 〈Pik〉 identifies the mean powerrelated to the i-th band in the pre-infusion period(obtained averaging among epochs pertaining tothe pre-infusion) and std (Pik) identifies the stan-dard deviation of power related to the i-th bandduring the pre-infusion period (estimated over the8 seconds epochs of the pre-infusion).
3.4. EEG-current source localization analysis
Intracortical distributions of electrical activity ineach band were estimated both for the pre-infusionand post-infusion epochs using standardized LowResolution Tomography, sLORETA (Pascual-Marqui,2002). sLORETA has been extensively used to local-ize sources of current with set-ups of as few as 19electrodes (Clemens et al., 2010; Canuet et al., 2011).
Montreal Neurologic Institute average MRI brain(MNI152) (Mazziotta et al., 2001) was used as arealistic head model (6239 cortical gray matter vox-els at 5 mm resolution) for which the lead field wascomputed. Electrode positions were registered to thespherical model on the basis of Towle et al. (1993). Itis fair to underline that the use of standardized corticalstructures instead of the real ones of the subjects (asobtained by MRI) inevitably leads to inaccuracies ofsource localizations. Valdes-Hernandez et al. (2009),examined the performances of various standardizedhead models finding mean localization errors varyingbetween 6 and 8 mm depending on the chosen headmodel.
On the other side, sLORETA has been proven able toreliably identify activations even in deep cortical struc-tures such as the cingulate cortices confirming findingsobtained with other brain imaging techniques such asPET (Pizzagalli et al., 2001) or fMRI (Olbrich et al.,2009).

772 M.C. Carboncini et al. / A case of post-traumatic minimally conscious state reversed by midazolam
Fig. 2. Power spectra of pre-infusion (black lines) and post-infusion (grey lines) for ten selected electrodes are presented. For each electrodeand condition (pre- or post-infusion) the mean power spectrum was obtained mediating between the power spectra of the 8 seconds epochspertaining to the condition. The mean power spectra (averaged over all electrodes) of pre-infusion (black line) and post-infusion (grey line) aredepicted in the graph at the center of the scalp. Power spectra are expressed in dB. For visualization purposes, as the frequencies are discrete,the continuous line depicting the power spectra as a function of frequency was obtained interpolating among the available frequencies. Note thepresence of a peak at 7 Hz for the pre-infusion. Post-infusion is characterized by an enhancement of higher frequency activity (>12 Hz) and aparallel decrease of lower frequencies (<12 Hz).

M.C. Carboncini et al. / A case of post-traumatic minimally conscious state reversed by midazolam 773
Fig. 3. Z-scores of the time courses of seven frequency bands are presented. The time course of each band was obtained averaging between thetime courses of single electrodes. The Z-score of each 8 seconds epoch was estimated related to the 8 seconds epochs included in the pre-infusionperiod. For each band, the time-course is represented by a gray dotted-line for epochs whose Z-scores are lower than the significance threshold(Z = 2.58 in absolute value, corresponding to p < 0.01). The time-course is represented by a solid black line for epochs whose Z-score is lowerthan −2.58 and by a solid red line for epochs whose Z-score is higher than 2.58. Two-three minutes after the beginning of midazolam infusion abroadband increase of power is observed. After the end of midazolam administration a significant decrease of theta1, theta2, alpha1 and alpha2takes place, whereas beta1 and particularly beta2 still yield values significantly higher than those of the pre-infusion. In each subplot the periodduring which the patient regained full consciousness is shaded in grey.
Significant differences in sources distributionsbetween pre and post-infusion epochs were assessedfor each band on the basis of t-tests with a StatisticalNon-Parametrical Mapping (SNPM, Nichols andHolmes, 2002) approach for multiple testing. In orderto take into account the simultaneous testing on mul-tiple voxels, a single threshold test approach (i.e. a
single critical t-value derived from 10000 permutationperformed for each voxel in each band was estimated)was used.
SNPM works as follows: let us consider the nullhypothesis of no significant difference between epochspertaining to each condition (be it pre- or post-infusion): under the null-hypothesis, the labeling of

774 M.C. Carboncini et al. / A case of post-traumatic minimally conscious state reversed by midazolam
epochs for each period could be changed randomly(i.e. the value related to an epoch of the pre-infusioncould be assigned to post-infusion and vice-versa).Based on this assumption, 10000 random relabelingwere made and for each of them, the t-value relatedto each voxel was estimated. For each relabeling, onlythe maximum t-value (in absolute value) among vox-els was retained, obtaining thus the maximum statisticsdistribution under the null-hypothesis. For each band,the significance of the t-value related to each voxel wasestimated as the ratio between the number of t-valuesof the distribution obtained under the null-hypothesisexceeding the original t-value (in absolute value) andthe number of relabeling. The t-value threshold (inabsolute value) corresponding to p < 0.0014 (whichleads to an overall p < 0.01, applying Bonferroni cor-rection, as the tests were conducted on multiple bands),was estimated for each band, and the maximum t-valuethreshold among the bands was taken. As already men-tioned above, the issue of multiple testing on differentEEG bands was dealt with applying Bonferroni correc-tion for multiple comparisons. The overall significancethreshold was set at p < 0.01, which corresponds to athreshold of p < 0.0014 for each band.
3.5. Phase synchronization analysis in the taskpositive network and in the semantic network
Connectivity between regions of interest were esti-mated for each 8 seconds epoch both during thepre-infusion and the post-infusion on the basis of phasesynchronization.
Let x(t) and y(t) be two time-series, the squaredphase synchronization is defined as:
ϕ2X,Y (ω) =
∣∣∣∣∣∣1
Nr
Nr∑j=1
Xjω
Y∗jω
∣∣∣∣∣∣2
where
Xjω and
Yjω indicate the normalized DiscreteFourier Transform of respectively x(t) and y(t); Nr isthe number of segments on which the Fourier Trans-form is being applied. Normalization is obtained asfollows:
Xjω =(X∗jωXjω
)− 12
Xjω
(see Pascual−Marqui, 2007).
Phase synchronization was evaluated in each epochfor each frequency band considering two cortical net-works: the Task Positive Network (TPN) and theSemantic Network (SN). Regions included in the TPNwere chosen in line with (Fox et al., 2005), whereasSemantic Network regions were taken from Binder etal. (2009) (see Table 1 for details). For the analysisof connectivity a single voxel at the centroid of eachregion was used. This procedure is justified becausesLORETA has a relatively low spatial resolution whichmakes it unable to separate two closely spaced sources,and additionally, the centroid voxel is an excellent rep-resentative of the corresponding region (Canuet et al.,2011). For each network, phase synchronization wasestimated between all couples of regions, both for thepre-infusion and the post-infusion periods.
Table 1
For each of the two considered network, regions and region centroids in MNI coordinates are presented
Network Cortical structure Hemisphere Centroid (MNI coordinates,x,y,z in mm)
TPN Frontal Eye Field, FEF Left (–25, –15,55)Right (25, –15,55)
Intraparietal Sulcus, IPS Left (–25, –60,45)Right (25, –60, 45)
Middle Temporal Region, MT Left (–45, –70, –5)Right (45, –70, –5)
SEMANTIC NETWORK Inferior Frontal Gyrus, IFG Left (–40, 22, 0)Right (41, 22, 1)
Medial Prefrontal Cortex, MPFC (0, 50, 0)Middle Temporal Gyrus, MT Left (–54, –37, –6)
Right (55, –33, –8)Parahippocampal and Fusiform Left (–32, –41, –19)Gyri, PHF Right (33, –41, –18)Posterior Cingulate, PC (0, –57, 13)Posterior Inferior Parietal Left (–49, –44, 42)Lobe, IPL Right (49, –45, 43)

M.C. Carboncini et al. / A case of post-traumatic minimally conscious state reversed by midazolam 775
Significant differences in connectivity between postand pre-infusion were assessed separately for the twonetworks on the basis of t-tests with the same SNPMapproach used for sLORETA. Also in this case, as thestatistical tests were conducted on multiple couplesof regions, for each band of interest a single thresh-old approach was used, with the aim of controllingfor type I errors (Nichols and Holmes, 2002). Correc-tion for multiple bands testing was conducted applyingBonferroni method. The overall significance thresholdwas set at p < 0.01 (corresponding to a threshold ofp < 0.0014 for each single band).
As the choice of the epoch length (8 seconds) isarbitrary, both the analyses on current sources distri-butions and on phase synchronizations, were repeatedusing epoch lengths varying between 4 seconds and12 seconds with 1 second steps, in order to excludepossible dependencies of our findings on the specificepoching applied (i.e. the same analyses were repeatedconsidering epochs of 4, 5, 6 up to 12 seconds). Bothfor sLORETA and phase synchronization only results(i.e. voxels for sLORETA, connectivity levels betweencouples of regions for phase synchronization) that weresignificant for all the epoch lengths (ranging from 4to 12 seconds) were considered significant (see Sup-plementary Material for results regarding 4, and 12seconds epoching, results with other epoch lengths arenot shown).
4. Results
4.1. Midazolam-induced behavioural changes
After midazolam infusion, SV became more coop-erative and appeared as “just awakened”. The speechproduction, although not perfectly articulated, wasunderstandable. He was able to answer with simplesentences to specific questions. He could pronouncehis own name and the name of simple objects broughtto his sight. He could also read simple object nouns.He understood simple sentences such as “touch a yel-low square”. He was also able to read and understandthe sentence “close your eyes”. SV was not orientedeither in time or in space except for the place where hewas. SV was able to compute simple subtractions (i.e.100–7, 93–7, etc.). He did recognize his relatives andhe did recall the names of two of his grandchildren.He was even able to recognize the way to his home (asreported by his parents). He failed to remember objects
presented before midazolam administration when theywere presented again after the infusion.
4.2. Midazolam-induced EEG power spectrumchanges
As it can be seen from Fig. 2 (black line), the EEGpower spectrum at baseline (pre-infusion) is character-ized by a) high power at low frequency (1–12 Hz), witha characteristic power peak in the theta2 band, (at about7 Hz), which is detectable across different regions ofthe scalp and b) relatively low power in the frequencyrange between 12 and 30 Hz.
After midazolam infusion (post-infusion period),a change in the power spectrum profile is observed(Fig. 2, grey line): a) the power between 1 and 12 Hzis reduced, the highest decrease (with respect to thepre-infusion) at about 7 Hz (theta2 band) and b) thepower between 12 and 30 Hz is increased, with a max-imum difference when compared to pre-infusion atabout 15 Hz (beta1 band). The end result is a more bal-anced distribution of the signal power across low andhigh frequencies, which results in an overall tendencytowards a profile/spectral pattern normalization.
4.3. Time-course of the EEG power changes foreach frequency band as a function ofmidazolam infusion and clinicalmodifications
During midazolam infusion, the most striking phe-nomenon was the power increase in the delta, theta1,alpha2, beta1, and beta2 bands (a consistent increase ofboth low and high frequencies), which started withinthe first 5 minutes after the infusion beginning to reacha plateau between the 5th and 10th minute (Fig. 3).
The power increase of alpha2, beta1, and beta2bands, however, was more stable and lasted longer thanthat of delta and theta1 (Fig. 3). Within the first 5 min-utes from the infusion end, in fact, high frequencies(beta1 and beta2) still remained at significantly higherlevels with respect to the baseline, whilst low frequen-cies had already fallen to levels similar to the baseline(Fig. 3). Although in this period the low and highfrequencies behaviour was already different, no clini-cal response was still observed. Clinical effects wereobserved more than 5 minutes after the beginning of thepost-infusion period, when the low and high frequen-cies behaviour became totally dissociated, since lowerfrequencies (from delta to alpha1 bands) were reduced
776 M.C. Carboncini et al. / A case of post-traumatic minimally conscious state reversed by midazolam
to significantly lower levels with respect to the base-line while high frequencies (beta1 and beta2 bands)still remained at significantly higher levels (Fig. 3). It’sworth noting the intermediate behaviour of the alpha2band, which increased along with high frequencies inthe first 5 minutes after the infusion, but decreasedtogether with low frequencies in the next few minutes(Fig. 3).
4.4. Cortical source localization of themidazolam-induced changes for eachfrequency band
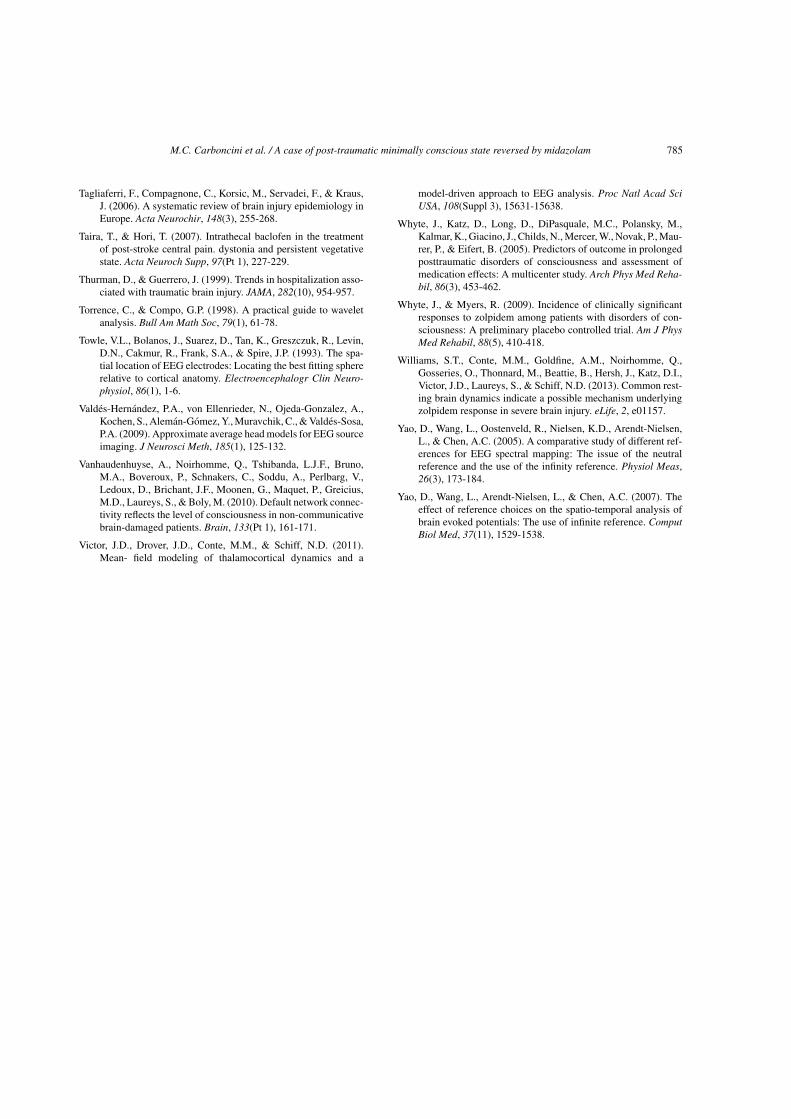
By inspecting Fig. 4, consider that the pre-infusionperiod was taken as a reference and, as such, treated asa baseline. Consequently, cold colors (blue tones) rep-resent cortical areas in negative variation, that is wherethe current density levels decreases significantly aftermidazolam infusion, and warm colors (yellow, orange)those in positive change, that is where the current den-sity increases significantly after the infusion. Keepingin mind this reading key, it becomes clear that mida-zolam significantly reduces lower frequencies (delta,theta1, theta2, alpha1, and alpha2 bands) activity onanterior cortical regions and, at the same time, boostshigher frequencies (beta1 and beta2 bands) activity onposterior cortical regions.
Let us now consider in detail each frequency band.The delta band regression is topographically limited tothe lesion area and neighboring areas (the right fronto-temporo-insular and temporo-polar regions) (Figs. 2and 4).
The theta band regression concerns, however, notonly the lesion area, but also broad regions outsidethe lesion area, both in the ipsilateral (especially thedorso-lateral, latero-ventral and supraorbital prefrontalregions) and contralateral hemisphere (centro-parietal,frontal and prefrontal regions) (Fig. 4). This is partic-ularly true for the theta2 band (peak at 7 Hz), whichshows an even more marked regression on the con-tralateral than on the ipsilateral hemisphere (Fig. 4). Amassive regression of both theta1 and theta2 bands alsooccurs on bilateral mesial prefrontal regions (mesialorbitofrontal and anterior cingulate) (Fig. 4).
The alpha band has lower activations (in thepost-infusion) in juxta-lesional areas of the frontal, pre-frontal and centro-parietal regions (Fig. 4). Comparedto alpha2, the alpha1 band regression is more pro-nounced on the hemisphere contralateral to the lesion(pre-frontal and temporo-polar regions) (Fig. 4).
The beta band, finally, is the only one with anenhanced activity after the infusion. It increases, partic-ularly, on the posterior regions, both mesial (precuneus,posterior cingulate, cuneus, and inferior temporo-occipital) and dorso-lateral (parieto-occipital) (Fig. 4).Compared to beta2, the beta1 band is characterizedby the expansion on the left temporo-parietal junc-tion (angular and supramarginal gyri), bilateral mesialpre-frontal cortex (anterior cingulate) and fronto-temporo-insular lesion area (Fig. 4).
4.5. Midazolam-induced changes within thetask-positive network and the linguisticnetwork cortical connectivities for eachfrequency band
We tested the task-positive network and the linguis-tic network because we believe such systems representthe functional basis of the individual interactivity withthe outside world and people.
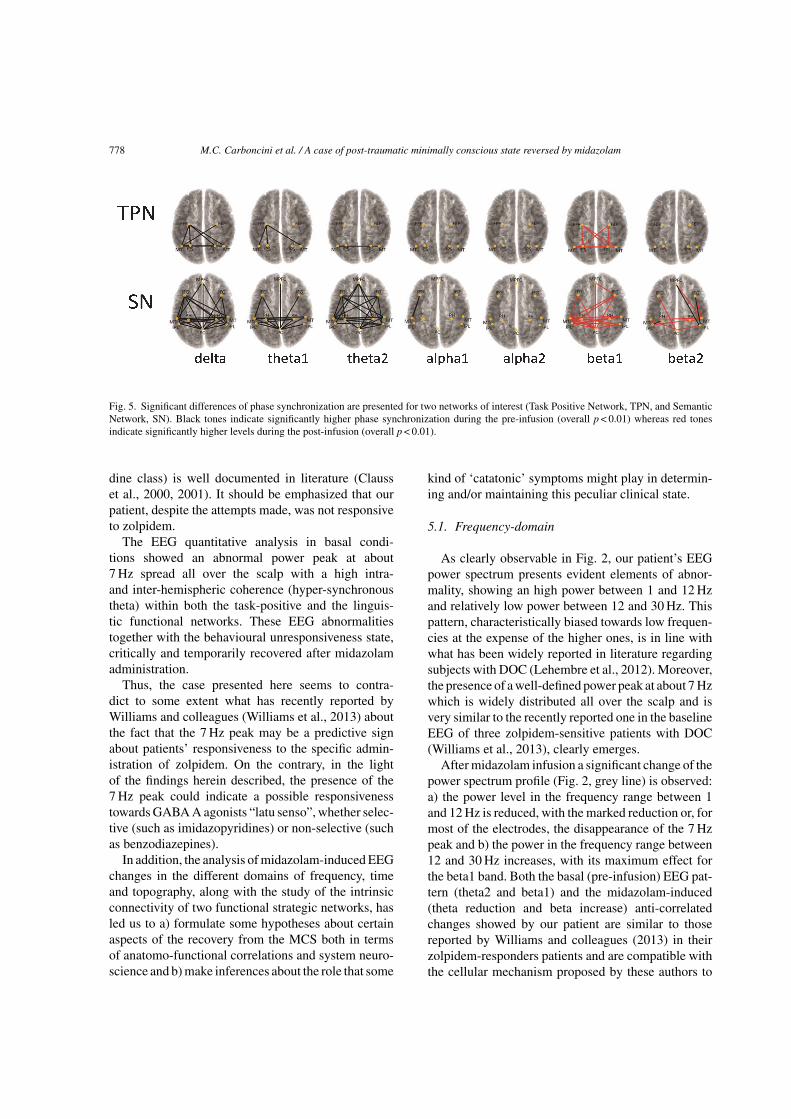
The baseline condition is characterized by a higherintrinsic connectivity of these systems in the low fre-quencies (Fig. 5), which, probably, corresponds to thepre-infusion prevalence of such frequencies both interms of power spectrum and current densities distribu-tion (cortical sources). This occurs for both networks,but for the linguistic one to a greater extent. Amongall the bands, the one that seems to affect the intrin-sic connectivity of this circuit to a greater extent is thetheta2 (peak at 7 Hz). It is as if the intrinsic connectivityin both systems was saturated by oscillations at about7 Hz and thus not accessible to other frequencies.
Conversely, the midazolam infusion appears toremove the low frequency intrinsic connectivity (inparticular in the theta2 band) and to foster it in the highfrequencies (in particular beta1 band) in both networks,both at the intra-hemispheric or inter-hemispheric level(Fig. 5).
5. Discussion
To our best knowledge, this is the first case describedin literature in which a patient with a clinical diagnosisof MCS has shown a paradoxical behavioural facilita-tion in response to the administration of midazolam(a non-selective GABA A agonist of the benzodi-azepine class). On the other side, although relativelyrare (1 out of 15 consecutive cases, according toWhyte and Myers, 2009), the response to zolpidem (analpha1-selective GABA A agonist of the imidazopyri-

M.C. Carboncini et al. / A case of post-traumatic minimally conscious state reversed by midazolam 777
Fig. 4. Voxels with significantly different levels of activation between post and pre-infusion, (|t| >tcrit , overall p < 0.01, tcrit = 5.25) are presentedfor each of the 7 bands. Panels refer to delta, theta1, theta, alpha1, alpha2, beta1 and beta2 respectively. Yellow to red tones correspond toprogressively higher (i.e. with higher t-values) activations in the post-infusion whereas light to dark blue tones indicate a progressively higheractivation in the pre-infusion. First column of each panel represents a left view of the left hemisphere, second column a right view of the lefthemisphere, third column a right view of the right hemisphere, fourth column a left view of the right hemisphere and fifth column a view frombelow of the whole cortex.
778 M.C. Carboncini et al. / A case of post-traumatic minimally conscious state reversed by midazolam
Fig. 5. Significant differences of phase synchronization are presented for two networks of interest (Task Positive Network, TPN, and SemanticNetwork, SN). Black tones indicate significantly higher phase synchronization during the pre-infusion (overall p < 0.01) whereas red tonesindicate significantly higher levels during the post-infusion (overall p < 0.01).
dine class) is well documented in literature (Clausset al., 2000, 2001). It should be emphasized that ourpatient, despite the attempts made, was not responsiveto zolpidem.
The EEG quantitative analysis in basal condi-tions showed an abnormal power peak at about7 Hz spread all over the scalp with a high intra-and inter-hemispheric coherence (hyper-synchronoustheta) within both the task-positive and the linguis-tic functional networks. These EEG abnormalitiestogether with the behavioural unresponsiveness state,critically and temporarily recovered after midazolamadministration.
Thus, the case presented here seems to contra-dict to some extent what has recently reported byWilliams and colleagues (Williams et al., 2013) aboutthe fact that the 7 Hz peak may be a predictive signabout patients’ responsiveness to the specific admin-istration of zolpidem. On the contrary, in the lightof the findings herein described, the presence of the7 Hz peak could indicate a possible responsivenesstowards GABA A agonists “latu senso”, whether selec-tive (such as imidazopyridines) or non-selective (suchas benzodiazepines).
In addition, the analysis of midazolam-induced EEGchanges in the different domains of frequency, timeand topography, along with the study of the intrinsicconnectivity of two functional strategic networks, hasled us to a) formulate some hypotheses about certainaspects of the recovery from the MCS both in termsof anatomo-functional correlations and system neuro-science and b) make inferences about the role that some
kind of ‘catatonic’ symptoms might play in determin-ing and/or maintaining this peculiar clinical state.
5.1. Frequency-domain
As clearly observable in Fig. 2, our patient’s EEGpower spectrum presents evident elements of abnor-mality, showing an high power between 1 and 12 Hzand relatively low power between 12 and 30 Hz. Thispattern, characteristically biased towards low frequen-cies at the expense of the higher ones, is in line withwhat has been widely reported in literature regardingsubjects with DOC (Lehembre et al., 2012). Moreover,the presence of a well-defined power peak at about 7 Hzwhich is widely distributed all over the scalp and isvery similar to the recently reported one in the baselineEEG of three zolpidem-sensitive patients with DOC(Williams et al., 2013), clearly emerges.
After midazolam infusion a significant change of thepower spectrum profile (Fig. 2, grey line) is observed:a) the power level in the frequency range between 1and 12 Hz is reduced, with the marked reduction or, formost of the electrodes, the disappearance of the 7 Hzpeak and b) the power in the frequency range between12 and 30 Hz increases, with its maximum effect forthe beta1 band. Both the basal (pre-infusion) EEG pat-tern (theta2 and beta1) and the midazolam-induced(theta reduction and beta increase) anti-correlatedchanges showed by our patient are similar to thosereported by Williams and colleagues (2013) in theirzolpidem-responders patients and are compatible withthe cellular mechanism proposed by these authors to

M.C. Carboncini et al. / A case of post-traumatic minimally conscious state reversed by midazolam 779
motivate the origin of the 7 Hz peak and its high andwidespread coherence. The 7 Hz rhythm would be infact the product of “self-sustained intrinsic membranesoscillations arising from Layer V pyramidal neurons”under the influence of a global thalamic suppressionand/or disfacilitation due, in turn, to a deafferentationproduced by a severe and widespread cortical damage.
In contrast, our patient had a right focal fronto-temporo-opercular cortical lesion (Fig. 1, CT-scan).Given this assumption, according to the model pro-posed by Williams and colleagues (2013), we wouldhave to expect rather the typical EEG pattern of athalamo-cortical dysrhythmia, i.e. a focal and congru-ent increase of both theta and beta oscillations underbasal conditions and an equally congruent reduction inresponse to pharmacotherapy. None of this, however,was observed in our case.
5.2. Time-domain
During the midazolam infusion, the most strik-ing phenomenon consisted in an initial congru-ent/consistent increase of both low and highfrequencies (delta, theta1, alpha2, beta1, beta2 bands)power which reached a plateau shortly before the infu-sion end (Fig. 3). In the first 5 minutes after the end ofthe infusion, low frequencies did already fall to levelssimilar to the baseline, while the higher ones (beta1and 2) remained at significantly higher levels (Fig. 3).Although in this period the behaviour of low and highfrequencies was already different from baseline, noclinical response was observed. A clinically significantresponse was apparent more than 5 minutes after theinfusion, when the behaviour of lower and higher fre-quencies became openly anti-correlated, as the lowerfrequencies (delta to alpha1) were reduced to signifi-cantly lower levels with respect to the baseline, whilethe high ones (beta1 and beta2) still held at significantlyhigher levels (Fig. 3).
The ability to increase the high frequencies intensityis a known property of the GABA A agonists (so-calledparadoxical effect), either of those belonging to thebenzodiazepine class or to the imidazopyridine class.However, taking into account only the time-domain,the decisive event for the clinical improvement appearsto be the abatement of low frequencies below basallevels, although a possible permissive role of the highfrequencies increase cannot be ruled out.
A tentative hypothesis could be that, since theclinical improvement coincides with the temporal
coexistence of both variations, it occurs at the attain-ment of a certain critical value (threshold value) of thepower ratio between these two frequency bands.
5.3. Space-domain
An overview of the Fig. 4, allows one to immediatelyrealize that midazolam administration significantlyreduces low frequencies (delta, theta1 and 2, alpha 1and 2 bands) current densities on the anterior regionsand that, at the same time, it boosts the higher ones(beta1 and beta2 bands) on the posterior regions. Themost striking aspects, however, specifically concernbeta and theta bands.
On the basis of the observations made in the powerspectrum paragraph, we can argue that the regionswhere low frequencies are decreased after the infu-sion correspond to areas where these frequencies wereabnormally increased before the infusion itself, as wellas those where high frequencies are increased afterinfusion correspond to areas where they were previ-ously poorly represented. In other words, we can saythat the blue of the Fig. 4 represents the areas where lowfrequencies ‘give ground’ after the infusion, and the redthose areas where the higher ones ‘gain ground’. Onecan, therefore, consider the ‘territorial dominance’ oflow frequencies at the expense of the high ones typicalof the baseline, as the sign of the dysfunctional phe-nomenon responsible for the clinical syndrome. On thecontrary, the post-midazolam clinical improvement,together with the related recovery of the bioelectricactivity resides both in a ‘retreat’ of low frequenciesand in an ‘advancement’ of the higher ones, which areoften co-localized.
The theta band regression, in particular, involvesnot only the lesional area, but also wide extra-lesionalregions, both of the ipsilateral hemisphere (especiallydorsolateral prefrontal, ventral and lateral supraorbitalregions) and of the contralateral one (central-parietal,frontal and prefrontal regions) (Fig. 4). This is par-ticularly evident for theta2, which shows a moremarked regression on the contralateral than on theipsilateral hemisphere (Fig. 4). This probably resultsfrom an abnormal representation of theta oscillationson large bi-hemispheric cortical regions (suppressedareas) prior to the infusion, as a sign of eitherdiaschisis (Andrews, 1991; Juhasz, 1997) or inhibi-tion/disfacilitation phenomena of subcortical nature(e.g., thalamic) with a diffuse cortical expression (Hin-driks and van Putten, 2013). A massive regression

780 M.C. Carboncini et al. / A case of post-traumatic minimally conscious state reversed by midazolam
of both theta1 and theta 2 bands also occurs uponbilateral mesial prefrontal regions (mesial orbitofrontaland anterior cingulate regions) (Fig. 4).
Finally, the beta band is the only one with highercurrent densities after the infusion. It increases,in particular, upon the posterior regions, both onthe mesial (precuneus, posterior cingulate, cuneus,inferior temporo-occipital) and dorso-lateral (parieto-occipital) areas (Fig. 4). Compared to beta2, beta1 ischaracterized by its expansion on: left temporo-parietaljunction (angular and supramarginal gyri), bilateralmesial prefrontal cortex (anterior cingulate cortex) andright temporo-insular lesional area. This, among otherthings, enables the increase of the inter-hemisphericcoherence between homologous crucial nodes withinthe language network, as will be seen in the next para-graph (Fig. 4).
Taking into account only the topographic-domain,regardless of the diachronic time factor, critical ele-ments associated with the functional recovery wouldseem to be both a widespread reduction of the 7 Hz peakupon wide anterior regions, and a reconquest of strate-gically important ‘bridgeheads’ by beta1 oscillations.
In particular, the functional recovery of both a) pre-cuneus/posterior cingulate, whose progressive reacti-vation has long been recognized as characteristic ofthe recovery path from Vegetative State/UnresponsiveWakefulness Syndrome (VS/UWS) to normal (Lau-reys et al., 1999, 2006; Vanhaudenhuyse et al., 2010;Bonfiglio et al., 2013), and b) left temporo-parietaljunction, recently referred to as the prerogative of thoseMCS patients who begin to follow commands (i.e.,those who evolve from condition MCS− to MCS+)(Bruno et al., 2012; Bonfiglio et al., 2014), appearrelevant. Moreover, in view of a possible diagnosisof catatonia (as will be discussed below), the bilat-eral reactivation of the mesial prefrontal region (mesialorbitofrontal and anterior cingulate cortices) and of thesupplementary motor area assumes a special impor-tance. Recent studies have in fact shown that motor,behavioural and affective symptoms in catatonia areconnected to an altered pattern of activation in thosespecific regions (Northoff et al., 2004; Scheuereckeret al., 2009).
5.4. Linguistic and task-positive networksintrinsic connectivity
As stated above, we tested the task-positive andlinguistic networks because we believe that they
are representative of many interaction interfaces ofthe individual with the outside world and people,respectively.
The baseline condition (pre-infusion) is character-ized by a greater intrinsic connectivity of these systemsin the delta, theta1 and theta2 bands (Fig. 5), as a plau-sible sign of their functional deficit. This is particularlyevident for the semantic network, whose intrinsic con-nectivity is blocked by 7 Hz oscillations.
Conversely, the midazolam infusion removes theintrinsic connectivity at low frequencies and fostersit at higher ones in both networks (Fig. 5), mostlikely promoting both the functional recovery andthe resumption of the interactive and communicativecapabilities of our patient towards the external envi-ronment and people. This seems to be favoured by thewidespread reduction of the 7 Hz peak upon extendedanterior regions and by the reconquest by beta1 ofsome strategic areas, such as the homologous middletemporal gyrus (MT) and inferior parietal lobule (IPL)nodes (i.e., the angular and supramarginal gyri of bothhemispheres) within the linguistic network.
5.5. Mesocortical circuit and severe disorders ofconsciousness
A deficit of the frontal/prefrontal cortico-striatopallidal thalamocortical loop system (mesocorti-cal circuit, see Fig. 6) has been recently proposed
Fig. 6. This figure (modified from Schiff, N.D. (2010). Recovery ofconsciousness after severe brain injury: The role of arousal regula-tion mechanisms and some speculation on the heart-brain interface.Clev Clin J Med, 77(Suppl 3), S27-S33) represents the pathophysi-ological model (so-called “mesocircuit” model) proposed by Schiffto explain behavioural fluctuations following large-scale corticaldysfunction following multifocal brain injuries.

M.C. Carboncini et al. / A case of post-traumatic minimally conscious state reversed by midazolam 781
(Schiff, 2008, 2010; Williams et al., 2013) as theanatomical and patho-physiological basis of the severedisorders of consciousness resulting from diffuseaxonal injury, anoxia and hypoxia-ischemia. A diffusecortical damage resulting from these pathologieswould lead to a neuronal cell loss and a widespreaddeafferentation of the central thalamus, either directly(cortico-thalamic subsystem) or indirectly (cortico-striato-pallidal subsystem). This would contribute tokeep suppressed both wide bilateral regions of thefrontal/prefrontal cortex (thalamo-cortical subsystem)and the striatum (thalamo-striatal subsystem). Boththe striatum and the globus pallidus interna (GPi)would play a central role in this circuital mechanism.The former, under normal conditions, would exert itsinhibitory activity towards the GPi, that is maintainedby adequate cortical and thalamic inputs which ensurean adequate background activity of medium spinyneurons (MSNs) of the striatum. Lacking such anintense background activity, the GPi would be freeto inhibit the central thalamus contributing to keepsuppressed its activity. According to Schiff (2010),zolpidem’s effectiveness in awakening patients withsevere disorders of consciousness resides in the abilityof this drug, highly selective for GABA A alpha 1receptor, to maintain the inhibition of the GPi (whichis characterized, in fact, by the highest expressionof alpha 1 receptors), thereby releasing the pallidalinhibition of the central thalamus and restoring thefunctionality of the entire circuit.
The failure to respond to zolpidem observed in ourpatient, may be due to the great expression variabilityof GABA receptor subtypes detectable in the humanpopulation (currently at least 50 different phenotypes,according to Kang et al. (2011). So, in the specific case,the mesocortical mechanism could be simply mediatedby different receptor subtypes. A patient with a recep-tor set-up characterized by a low expression of alpha1 on sites with usually specific mediation (GPi andcortical inhibitory interneuronal networks), could seehis/her mesocortical mechanism predominantly medi-ated by other receptors and as a consequence, to beless or not at all responsive to zolpidem but con-versely, more or only responsive to midazolam. It isvery interesting to underline that repetitive seizuresand/or a status epilepticus are able to change the phe-notypic representation of GABA A receptor subtypes,in particular by significantly reducing the expression ofalpha1, as it has been recently demonstrated(Grabenstatter et al., 2012).
Alternatively, the response to midazolam observedin our patient, could be mediated through GABA Anon-specific sites, which are present within the sameloop, but in different locations than the GPi (for exam-ple, MSNs and pyramidal cell axons), obtaining in thisway “the release of tonic inhibition of neurons fromthe globus pallidus interna” with an indirect rather thandirect mechanism.
What still does not agree with the model proposedby Williams and colleagues (2013), is that, in our case,we do not have to deal with a diffuse neuronal damage,but with a focal damage.
5.6. Critical focal dysfunction, non-convulsivestatus epilepticus and catatonia
We propose here a hypothesis able to resolve theapparent discrepancy between the lesion focality andthe widespread electrical abnormalities observed in ourpatient and, at the same time, to reconcile them withthe positive response to midazolam and the lack ofresponse to zolpidem.
Considering, in fact, the typical 7 Hz oscillations asthe electrical manifestation of a non-convulsive statusepilepticus (NCSE) would allow us to explain theirwidespread representation on the entire scalp eitherthrough their ‘vertical’ propagation via (cortico-)thalamo-cortical circuits/loops or their ‘horizontal’propagation via intra- (e.g., superior longitudinal fas-ciculus) and inter-hemispheric (e.g., corpus callosum)cortico-cortical connections. The analysis of our datadoes not allow us to favor one of the two hypotheses,but rather it seems in agreement with them both.Indeed, the fact, that the 7 Hz peak shows a reducedamplitude on the right hemisphere, in correspondenceof the lesional area (Fig. 4), could suggest a thalamo-cortical mechanism with a widespread projectionmode, with a lower expression of the thalamic-drivenoscillations on that area as a result of its neuronaldamage; conversely, the graphical representation ofthe theta oscillations intrinsic connectivity withinthe examined networks (Fig. 5) would seem to carrysome elements in favor of a propagation occurringespecially through transcallosal, cortico-corticalconnection systems.
Moreover, the EEG pattern of non-convulsive statusepilepticus is not necessarily characterized by specificgraphoelements (such as spike-and-wave patterns),but can be simply represented by slow oscillations(Smith, 2005). This hypothesis, finally, would seem
782 M.C. Carboncini et al. / A case of post-traumatic minimally conscious state reversed by midazolam
supported by the striking response to midazolam, awidely used drug for its anti-epileptic properties dueto its powerful non-specific effects of neuronal firinginhibition and discharge spreading contrast (Hanleyand Kross, 1998; Claassen et al., 2002; Gathwala et al.,2007).
On the other hand, there is another pathological formwhich shows a characteristic and critical response tobenzodiazepine agonists GABA A including midazo-lam, that is catatonia. The facts that a) some casesof catatonia can be regarded as the manifestation ofa NCSE, b) the EEG pattern shown by our patientwas compatible with that of catatonia, and finally c)our patient’s clinical picture was also compatible withthe diagnosis of catatonia, are all elements potentiallycapable of binding together the NCSE and catatonia,at least for the case herein presented. Let us examinein detail the individual items.
The etiopathogenetic hypothesis which sees cata-tonia as the symptomatologic manifestation of anon-convulsive status epilepticus (NCSE) has longbeen known (Goldensohn and Gold, 1960; Lim et al.,1986; Louis and Pflaster,1995; Carroff et al., 2007;Daniels, 2009). This hypothesis is supported by the factthat catatonia characteristically and critically respondseither to benzodiazepines or electroconvulsive therapy(ECT), both able also to raise the epileptic thresh-old. Our patient, as we have observed, showed adisappearance of 7 Hz oscillations after midazolamadministration, in particular in those cortical regions(such as the orbitofrontal mesial cortex, the anteriorcingulate cortex and the supplementary motor area)whose activation pattern is notoriously and character-istically altered in catatonic patients.
The EEG pattern of catatonic subjects is described inliterature as widely slowed “most often in the theta fre-quency” (Smith et al., 2012) and the 7 Hz oscillationsthat, in our patient dominate in a widespread mannerthe EEG spectral profile, are fully included in the thetafrequency band.
Finally, despite our patient’s initial clinical diagnosiswas that of MCS (+), a diagnostic hypothesis of cata-tonia has also been formulated with ex-adjuvantibuscriterion, taking into account that a) until then no casesof midazolam-responsive MCS had been reported,whereas b) catatonia is known to respond to GABA Aagonist drugs, including midazolam (McDonald et al.,2011). In fact, by administering ex post to our patient anappropriate diagnostic clinical scale, we have obtaineda score compatible with a diagnosis of catatonia.
In this perspective, the recent description of a caseof catatonia occurring after ablation of the right tem-poral lobe (Malur et al., 2010) acquires particularinterest, reflecting the fact that dysfunction of this spe-cific region of the brain may give rise to a picture ofcatatonia.
6. Concluding remarks
At this point, taking into account that functionallydepressed regions in catatonia largely overlap thoseregions known as ipoactive in severe disorders ofconsciousness (DOC) (Laureys et al., 1999, 2006; Van-haudenhuyse et al., 2010, Bruno et al., 2012), a twofoldquestion arises: are we faced with a case of catatonia onan organic basis mimicking a case of MCS or does theMCS, as a syndromic entity in itself, also include ele-ments of catatonic nature, whose relative weight in theindividual patient will determine whether or not he/shewill respond to GABA A agonist drugs? At present,we do not have enough information to answer thesequestions. However, at least for some patients with aninitial diagnosis of MCS, we propose not to neglectsuch possibilities (Hem et al., 2005; Alisky, 2009).
Considering the MCS from this point of view couldpave the way to new perspectives for both therapy andclinical management: at least a part of MCS patientscould in fact benefit from treatment with non-selectiveGABA A agonists, especially if they show an EEG pat-tern characterized by a widespread 7 Hz peak. A firstconsequence of practical nature, is that such patientsshould be tested not only towards zolpidem but alsotowards benzodiazepines (i.e., not only with GABA Aselective, but also with GABA A non-selective drugs),after the application of a sequential decision procedureincluding different test paradigms aiming at a reliableevaluation of cognitive functions in MCS patients assuggested by Kotchoubey and collegues (2013). In thecase of a positive response to the test these patients maybe candidates for a continued treatment with oral ben-zodiazepines or, theoretically, for a more aggressiveprotocol, such as the continuous intravenous infusionof midazolam, which is commonly practiced in theintensive care unit to interrupt a status epilepticus. Inaddition, in the future, given the growing evidenceregarding the responsiveness of catatonia to rTMS(Kate et al., 2011), this latter method may prove tobe potentially effective in ‘awakening’ also this typeof patients.
M.C. Carboncini et al. / A case of post-traumatic minimally conscious state reversed by midazolam 783
Acknowledgments
The authors would like to thank Dr. Bruno Formichiand Dr. Giuseppe Arcidiacono for their anesthesiolog-ical supervision during midazolam administration. Nofunding has supported this study.
References
Alisky, J.M. (2009). Minimally-responsive head injury survivorsmay have chronic catatonia reversed years after an accident.Singap Med J, 50(11), 1117-1118.
Andrews, R.J. (1991). Transhemispheric diaschisis. A review andcomment. Stroke, 22(7), 943-949.
Binder, J.R., Desai, R.H., Graves, W.W., & Conant, L.L. (2009).Where is the semantic system? A critical review and meta-analysis of 120 functional neuroimaging studies. Cereb Cortex,19(12), 2767-2796.
Bonfiglio, L., Olcese, U., Rossi, B., Frisoli, A., Arrighi, P., Greco,G., Carozzo, S., Andre, P., Bergamasco, M., & Carboncini,M.C. (2013). Cortical source of blink-related delta oscillationsand their correlation with levels of consciousness. Hum BrainMapp, 34(9), 2178-2189.
Bonfiglio, L., Piarulli, A., Olcese, U., Andre, P., Arrighi, P.,Frisoli, A., Rossi, B., Bergamasco, M., & Carboncini, M.C.(2014). Spectral parameters modulation and source localizationof blink-related alpha and low-beta oscillations differentiateminimally conscious state from vegetative state/unresponsivewakefulness syndrome. PLoS ONE, 9(3), e93252.
Brefel-Courbon, C., Payoux, P., Ory, F., Sommet, A., Slaoui,T., Raboyeau, G., Lemesle, B., Puel, M., Montastruc, J.L.,Demonet, J.F., & Cardebat, D. (2007). Clinical and imagingevidence of zolpidem effect in hypoxic encephalopathy. AnnNeurol, 62(1), 102-105.
Bruno, M.A., Majerus, S., Boly, M., Vanhaudenhuyse, A.,Schnakers, C., Gosseries, O., Boveroux, P., Kirsch, M.,Demertzi, A., Bernard, C., Hustinx, R., Moonen, G., & Laureys,S. (2012). Functional neuroanatomy underlying the clinicalsubcategorization of minimally conscious state patients. J Neu-rol, 259(6), 1087-1098.
Canuet, L., Ishii, R., Pascual-Marqui, R.D., Iwase, M., Kurimoto, R.,Aoki, Y., Ikeda, S., Takahashi, H., Nakahachi, T., & Takeda, M.(2011). Resting-State EEG Source Localization and FunctionalConnectivity in Schizophrenia-Like Psychosis of Epilepsy.PloS ONE, 6(1), e27863.
Caradoc-Davies, T.H. (1996). Traumatic mutism in severe braininjury relieved by oral diazepam. Disabil Rehabil, 18(9), 482-484.
Caroff, S.N., Mann, S.C., Francis, A., & Fricchione, G.L. (2004).Catatonia: From psychopathology to neurobiology. ArlingtonVA: American Psychiatric Publishing.
Claassen, J., Hirsch, L.J., Emerson, R.G., & Mayer, S.A. (2002).Treatment of refractory status epilepticus with pentobarbital,propofol, or midazolam: A systematic review. Epilepsia, 43(2),146-153.
Clauss, R.P., Guldenpfennig, W.M., Nel, H.W., Sathekge, M.M., &Venkannagari, R.R. (2000). Extraordinary arousal from semi-comatose state on zolpidem. A case report. S Afr Med J, 90(1),68-72.
Clauss, R.P., van der Merwe, C.E., & Nel, H.W. (2001). Arousalfrom a semi-comatose state on zolpidem. S Afr Med J, 91(10),788-789.
Clauss, R.P., & Nel, H.W. (2004). Effect of zolpidem on brain injuryand diaschisis os detected by 99mTc HMPAO brain SPECT inhumans. Arzneimittelforschung, 54(10), 641-646.
Clemens, B., Bessenyei, M., Fekete, I., Puskas, S., Kondakor, I.,Toth, M., & Hollody, K. (2010). Theta EEG source localizationusing LORETA in partial epilepsy patients with and withoutmedication. Clin Neurophysiol, 121(6), 848-858.
Daniels, J. (2009). Catatonia: Clinical aspects and neurobiologicalcorrelates. J Neuropsychiatry Clin Neurosci, 21(4), 371-380.
Farge, M. (1992). Wavelet transforms and their applications to tur-bulence. Annu Rev Fluid Mech, 24(1), 395-457.
Folstein, M.F., Folstein, S.E., & McHugh, P.R. (1975). Mini Men-tal State a practical method for grading the cognitive state ofpatients for the clinicians. J Psychiat Res, 12(3), 189-198.
Fox, M.D., Snyder, A.Z., Vincent, J.L., Corbetta, M., Van Essen,D.C., & Raichle, M.E. (2005). The human brain is intrinsicallyorganized into dynamic, anticorrelated functional networks.P Natl Acad Sci USA, 102(27), 9673-9678.
Gathwala, G., Goel, M., Singh, J., & Mittal, K. (2012). IntravenousDiazepam, midazolam and Lorazepam in acute seizure control.Indian J Pediatr, 79(3), 327-332.
Giacino, J.T., Ashwal, S., Childs, N., Cranford, R., Jennett, B., Katz,D.I., Kelly, J.P., Rosenberg, J.H., Whyte, J., Zafonte, R.D., &Zasler, N.D. (2002). The minimally conscious state Definitionand diagnostic criteria. Neurology, 58(3), 349-353.
Goldensohn, E.S., & Gold, A.P. (1960). Prolonged behavioural dis-turbances as ictal phenomena. Neurology, 10, 1-9.
Grabenstatter, H.L., Russek, S.J., & Brooks-Kayal, A.R. (2012).Molecular pathways controlling inhibitory receptor expression.Epilepsia, 53(9), 71-78.
Hanley, D.F., & Kross, J.F. (1998). Use of midazolam in the treat-ment of refractory status epilepticus. Clin Ther, 20(6), 1093-1105.
Hem, E., Andreassen, O.A., Robasse, J.M., Vatnaland, T.R., &Opjordsmoen, S. (2005). Should catatonia be part of the differ-ential diagnosis of coma? Nord J Psychiatry, 59(6), 528-530.
Hindriks, R., & van Putten, M.J. (2013). Thalamo-cortical mecha-nisms underlying changes in amplitude and frequency of humanalpha oscillations. Neuroimage, 70, 150-163.
Jones Gotman, M. (1987). Psychological evaluation-Testing hip-pocampal function, In: Engel J, editor, Surgical Treatment ofthe Epilepsies. New York: Raven Press, pp. 203-215.
Juhasz, C., Kamondi, A., & Szirmai, I. (1997). Spectral EEG analysisfollowing hemispheric stroke: Evidences of transhemisphericdiaschisis. Acta Neurol Scand, 96(6), 397-400.
Kang, H.J., Kawasawa, Y.I., Cheng, F., Zhu, Y., Xu, X., Li, M.,Sousa, A.M., Pletikos, M., Meyer, K.A., Sedmak, G., Guennel,T., Shin, Y., Johnson, M.B., Krsnik, Z., Mayer, S., Fertuzinhos,
784 M.C. Carboncini et al. / A case of post-traumatic minimally conscious state reversed by midazolam
S., Umlauf, S., Lisgo, S.N., Vortmeyer, A., Weinberger, D.R.,Mane, S., Hyde, T.M., Huttner, A., Reimers, M., Kleinman,J.E., & Sestan, N. (2011). Spatio-temporal transcriptome of thehuman brain. Nature, 478(7370), 483-489.
Kate, M.P., Raju, D., Vishwanathanm, V., Khan, F.R. and Thomas,S.V. (2011). Successful treatment of refractory organic cata-tonic disorder with repetitive transcranial magnetic stimulation(rTMS) therapy. J Neuropsychiatry Clin Neurosci, 23(3),E2-E3.
Kotchoubey, B., Veser, S., Real, R., Herbert, C., Lang, S., &Kubler, A. (2013). Towards a more precise neurophysiologi-cal assessment of cognitive functions in patients with disordersof consciousness. Restor Neurol Neurosci, 31(4), 473-485.
Laureys, S., Lemaire, C., Maquet, P., Phillips, C., & Franck, G.(1999). Cerebral metabolism during vegetative state and afterrecovery to consciousness. J Neurol Neurosurg Psychiatry,67(1), 121-122.
Laureys, S., Boly, M., & Maquet, P. (2006). Tracking the recoveryof consciousness from coma. J Clin Invest, 116(7), 1823-1825.
Lehembre, R., Gosseries, O., Lugo, Z., Jedidi, Z., Chatelle, C.,Sadzot, B., Laureys, S., & Noirhomme, Q. (2012). Electrophys-iological investigations of brain function in coma, vegetativeand minimally conscious patients. Arch Ital Biol, 150(2-3),122-139.
Lim, J., Yagnik, P., Schraeder, P., & Wheeler, S. (1986). Ictal cata-tonia as a manifestation of nonconvulsive status epilepticus.J Neurol Neurosurg Psychiatry, 49(7), 833-836.
Louis, E.D., & Pflaster, N.L. (1995). Catatonia mimicking noncon-vulsive status epilepticus. Epilepsia, 36(9), 943-945.
Makeig, S., Bell, A.J., Jung, T.P., & Sejnowski, T.J. (1996). Inde-pendent component analysis of electroencephalographic data,In: Touretzky. D., Mozer, M., Hasselmo, M., editors. Adv NeurInf, Vol 8, Cambridge, MA: The MIT Press, pp. 145-151.
Malur, C. and Clark, A. (2010).Catatonia after right temporal loberesection. J Neuropsychiatry Clin Neurosci, 22(3), 352.e17.
Matsuda, W., Komatsu, Y., Yanaka, K., & and Matsumura, A. (2005).Levodopa treatment for patients in persistent vegetative or min-imally conscious states. Neuropsych Rehabil, 15(3-4), 414-427.
Mazziotta, J., Toga, A., Evans, A., Fox, P., Lancaster, J., Zilles, K.,Woods, R., Paus, T., Simpson, G., Pike, B., Holmes, C., Collins,L., Thompson, P., MacDonald, D., Iacoboni, M., Schormann,T., Amunts, K., Palomero-Gallagher, N., Geyer, S., Parsons, L.,Narr, K., Kabani, N., Le Goualher, G., Boomsma, D., Cannon,T., Kawashima, R., & Mazoyer, B. (2001). A probabilistic atlasand reference system for the human brain: International Con-sortium for Brain Mapping (ICBM). Philos Trans R Soc LondB Biol Sci, 356(1412), 1293–1322.
McDonald, M.D., Larry, V., Liskow, M.D., & Barry, I. (2011).Reversal of Catatonia with Midazolam. Jefferson Journal ofPsychiatry, 10(2), 10.
Nichols, T.E., & Holmes, A.P. (2002). Nonparametric permutationtests for functional neuroimaging: A primer with examples.Hum Brain Mapp, 15(1), 1-25.
Northoff, G., Kotter, R., Baumgart, F., Danos, P., Boeker, H.,Kaulisch, T., Schlagenhauf, F., Walter, H., Heinzel, A., Witzel,T., & Bogerts, B. (2004). Orbitofrontal cortical dysfunction in
akinetic catatonia: A functional magnetic resonance imagingstudy during negative emotional stimulation. Schizophr Bull,30(2), 405-427.
Nyakale, N.E., Clauss, R.P., Nel, W., & Sathekge, M. (2010). Clinicaland brain Spect scan response to zolpidem in patients after braindamage. Arzneimittelforschung, 60(4), 177-181.
Olbrich, S., Mulert, C., Karch, S., Trenner, M., Leicht, G., Pogarell,O., & Hegerl, U. (2009). EEG-vigilance and BOLD effect dur-ing simultaneous EEG/fMRI measurement. Neuroimage, 45(2),319-332.
Pascual-Marqui, R.D. (2002). Standardized low resolution brainelectromagnetic tomography (sLORETA): Technical details.Method Find Exp Clin Pharmacol, 24(Suppl D), 5-12.
Pascual-Marqui, R.D. (2007). Instantaneous and lagged measure-ments of linear and nonlinear dependence between groupsof multivariate time series: Frequency decomposition. arXiv0711.1455.
Passler, M.A., & Riggs, R.V. (2001). Positive outcomes in traumaticbrain injury-vegetative state: Patients treated with bromocrip-tine. Arch Phys Med Rehabil, 82(3), 311-315.
Pizzagalli, D., Pascual-Marqui, R.D., Nitschke, J.B., Oakes, T.R.,Larson, C.L., Abercrombie, H.C., Schaefer, S.M., Koger, J.V.,Benca, R.M., & Davidson, R.J. (2001). Anterior cingulate activ-ity as a predictor of degree of treatment response in majordepression: Evidence from brain electrical tomography anal-ysis. Am J Psychiat, 158(3), 405-415.
Qin, Y., Xu, P., & Yao, D. (2010). A comparative study of differ-ent references for EEG default mode network: The use of theinfinity reference. Clin Neurophysiol, 121(12), 1981-1991.
Sawyer, E., Mauro, L.S., & Ohlinger, M.J. (2008). Amantadineenhancement of arousal and cognition after traumatic braininjury. Ann Pharmacother, 42(2), 247-252.
Scheuerecker, J., Ufer, S., Kapernick, M., Wiesmann, M.,Bruckmann, H., Kraft, E., Seifert, D., Koutsouleris, N., Moller,H.J., & Meisenzahl, E.M. (2009). Cerebral network deficits inpost-acute catatonic schizophrenic patients measured by fMRI.J Psychiatr Res, 43(6), 607-614.
Schiff, N.D. (2008). Central thalamic contributions to arousal reg-ulation and neurological disorders of consciousness. Ann NYAcad Sci, 1129(1), 105-118.
Schiff, N.D. (2010). Recovery of consciousness after severe braininjury: The role of arousal regulation mechanisms and somespeculation on the heart-brain interface. Clev Clin J Med,77(Suppl 3), S27-S33.
Shames, J.L., & Ring, H. (2008). Transient reversal of anoxic braininjury-related minimally conscious state after zolpidem admin-istration: A case report. Arch Phys Med Rehabil, 89(2), 386-388.
Sidak, Z.K. (1967). Rectangular confidence regions for the meansof multivariate normal distributions. J Am Stat Assoc, 62(318),626-633.
Smith, S.J.M. (2005). EEG in the diagnosis, classification, andmanagement of patients with epilepsy. J Neurol NeurosurgPsychiatry, 76(Suppl 2), ii2-ii7.
Smith, J.H., Smith, V.D., Philbrick, K.L., & Kumar, N. (2012). Cata-tonic disorder due to a general medical or psychiatric condition.J Neuropsychiatry Clin Neurosci, 24(2), 198-207.
M.C. Carboncini et al. / A case of post-traumatic minimally conscious state reversed by midazolam 785
Tagliaferri, F., Compagnone, C., Korsic, M., Servadei, F., & Kraus,J. (2006). A systematic review of brain injury epidemiology inEurope. Acta Neurochir, 148(3), 255-268.
Taira, T., & Hori, T. (2007). Intrathecal baclofen in the treatmentof post-stroke central pain. dystonia and persistent vegetativestate. Acta Neuroch Supp, 97(Pt 1), 227-229.
Thurman, D., & Guerrero, J. (1999). Trends in hospitalization asso-ciated with traumatic brain injury. JAMA, 282(10), 954-957.
Torrence, C., & Compo, G.P. (1998). A practical guide to waveletanalysis. Bull Am Math Soc, 79(1), 61-78.
Towle, V.L., Bolanos, J., Suarez, D., Tan, K., Greszczuk, R., Levin,D.N., Cakmur, R., Frank, S.A., & Spire, J.P. (1993). The spa-tial location of EEG electrodes: Locating the best fitting sphererelative to cortical anatomy. Electroencephalogr Clin Neuro-physiol, 86(1), 1-6.
Valdes-Hernandez, P.A., von Ellenrieder, N., Ojeda-Gonzalez, A.,Kochen, S., Aleman-Gomez, Y., Muravchik, C., & Valdes-Sosa,P.A. (2009). Approximate average head models for EEG sourceimaging. J Neurosci Meth, 185(1), 125-132.
Vanhaudenhuyse, A., Noirhomme, Q., Tshibanda, L.J.F., Bruno,M.A., Boveroux, P., Schnakers, C., Soddu, A., Perlbarg, V.,Ledoux, D., Brichant, J.F., Moonen, G., Maquet, P., Greicius,M.D., Laureys, S., & Boly, M. (2010). Default network connec-tivity reflects the level of consciousness in non-communicativebrain-damaged patients. Brain, 133(Pt 1), 161-171.
Victor, J.D., Drover, J.D., Conte, M.M., & Schiff, N.D. (2011).Mean- field modeling of thalamocortical dynamics and a
model-driven approach to EEG analysis. Proc Natl Acad SciUSA, 108(Suppl 3), 15631-15638.
Whyte, J., Katz, D., Long, D., DiPasquale, M.C., Polansky, M.,Kalmar, K., Giacino, J., Childs, N., Mercer, W., Novak, P., Mau-rer, P., & Eifert, B. (2005). Predictors of outcome in prolongedposttraumatic disorders of consciousness and assessment ofmedication effects: A multicenter study. Arch Phys Med Reha-bil, 86(3), 453-462.
Whyte, J., & Myers, R. (2009). Incidence of clinically significantresponses to zolpidem among patients with disorders of con-sciousness: A preliminary placebo controlled trial. Am J PhysMed Rehabil, 88(5), 410-418.
Williams, S.T., Conte, M.M., Goldfine, A.M., Noirhomme, Q.,Gosseries, O., Thonnard, M., Beattie, B., Hersh, J., Katz, D.I.,Victor, J.D., Laureys, S., & Schiff, N.D. (2013). Common rest-ing brain dynamics indicate a possible mechanism underlyingzolpidem response in severe brain injury. eLife, 2, e01157.
Yao, D., Wang, L., Oostenveld, R., Nielsen, K.D., Arendt-Nielsen,L., & Chen, A.C. (2005). A comparative study of different ref-erences for EEG spectral mapping: The issue of the neutralreference and the use of the infinity reference. Physiol Meas,26(3), 173-184.
Yao, D., Wang, L., Arendt-Nielsen, L., & Chen, A.C. (2007). Theeffect of reference choices on the spatio-temporal analysis ofbrain evoked potentials: The use of infinite reference. ComputBiol Med, 37(11), 1529-1538.

786 M.C. Carboncini et al. / A case of post-traumatic minimally conscious state reversed by midazolam
Supplementary Material
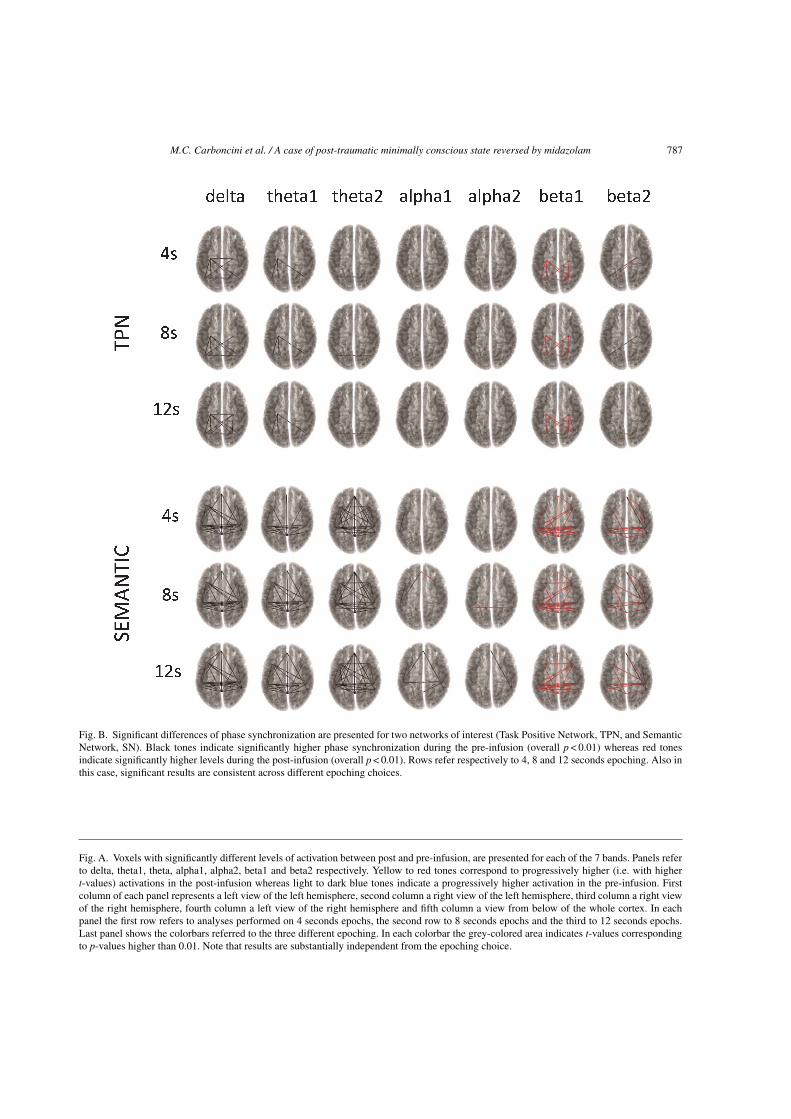
M.C. Carboncini et al. / A case of post-traumatic minimally conscious state reversed by midazolam 787
Fig. B. Significant differences of phase synchronization are presented for two networks of interest (Task Positive Network, TPN, and SemanticNetwork, SN). Black tones indicate significantly higher phase synchronization during the pre-infusion (overall p < 0.01) whereas red tonesindicate significantly higher levels during the post-infusion (overall p < 0.01). Rows refer respectively to 4, 8 and 12 seconds epoching. Also inthis case, significant results are consistent across different epoching choices.
Fig. A. Voxels with significantly different levels of activation between post and pre-infusion, are presented for each of the 7 bands. Panels referto delta, theta1, theta, alpha1, alpha2, beta1 and beta2 respectively. Yellow to red tones correspond to progressively higher (i.e. with highert-values) activations in the post-infusion whereas light to dark blue tones indicate a progressively higher activation in the pre-infusion. Firstcolumn of each panel represents a left view of the left hemisphere, second column a right view of the left hemisphere, third column a right viewof the right hemisphere, fourth column a left view of the right hemisphere and fifth column a view from below of the whole cortex. In eachpanel the first row refers to analyses performed on 4 seconds epochs, the second row to 8 seconds epochs and the third to 12 seconds epochs.Last panel shows the colorbars referred to the three different epoching. In each colorbar the grey-colored area indicates t-values correspondingto p-values higher than 0.01. Note that results are substantially independent from the epoching choice.
Related Documents