1 9th Annual Itaú BBA LatAm CEO Conference in New York May, 2014

Welcome message from author
This document is posted to help you gain knowledge. Please leave a comment to let me know what you think about it! Share it to your friends and learn new things together.
Transcript
1
9th Annual Itaú BBA LatAm CEO Conference in New York May, 2014

History and Business Model

3
More Than 30 Years of History
47%
Filadélphia
Participações S.A.1 Others
53%
155,298,749 ordinary shares
1. Holding owned by Ricardo Valadares Gontijo and family
2. Data: 06/30/2013
Industrial projects acting
as contractor to third
parties
Important geographic
expansion: Brasília, Rio de
Janeiro and Campinas
Development of projects
focused on the low-income
segment
Beginning of large scale
projects for the low-income
segment
Consolidation of a leading
position in Manaus and
Brasilia
Operations expansion to
PA, RO and ES
IPO 36% annual growth
in PSV launched
(CAGR)
69% annual growth
in net revenue
(CAGR)
Follow-on
MCMV 2
Establishment of
own sales team
1981 - 2005 2006-2007 2008 2009 2010-2011 2012
Record net
revenue of R$ 1.4
Billion, a 28% YoY
growth
More than R$
1 billion on
projects delivered
during 2012
Increasing stock
liquidity
The most relevant
player in the MCMV
2nd phase Level 1
Focus on Cash
Generation and
Construction
Service business
2013
Latin American
Asia 13.8%
North American
4.1%
Europe
15.8%
Brazil
17.2%
49.1%
Free Floating ( others 53%)2

Unique Footprint Strong footprint in markets with high growth potential, low
competition and high barriers to entry Low competition in
profitable markets
Track Record in
Operating in the low-
Income segment
Over 30 years of experience
Solid track record in MCMV Level 1 projects
Low equity commitment,
solid margins and high
ROIC
Focus on Large
Scale Projects
Verticalized
Business Model
Strong expertise in large scale ventures
Own work force
Performance-based compensation
Standardized and industrialized production on-site
Large scale operations in
the low-income segments,
with strict cost control and
high margins
4
Direcional: A Unique Business Model
The most profitable
and efficient player in
the low-income sector
‘’’’
High efficiency and profitability
ROE¹ among the highest in the sector LTM ROE¹: 15%
1. LTM ROE: Net Income in the Last Twelve Months / Average Shareholders’ Equity in the Last Twelve Months (net of non-controlling interest in silent partnerships and SPEs)
The best low-income player in Brazil
Industrialization Aluminum panels and concrete walls technology
45 days to develop a five floors building
1
2
3
5
4
Focus on the Low-Income Segment

6
Launched - Construction Service
(PSV R$ million)
CAGR -5%
1Q14 2013
523
2012
698
2011
924
2010
686
2009
634
Launched - Development
(PSV R$ million)
CAGR +92%
1Q14
772
2013
2,041
2012
1,647
2011
522
2010
380
2009
149
Construction Service Development
MCMV Level 1
+ Little or no cash burn
+ Higher ROE
+ Lower risk
+ Non-cyclical market
- Lower Margin
Development
- Higher cash burn
- Lower ROE
- Higher risk
- Cyclical market
+ Higher Margin
Total Launched – Track Record
(PSV R$ million)
772
100%
80%70%
36%36%
19%
2013 1Q14
698
2,565
523
2,041
2012
2,345
1,647
2011
1,447
924
522
2010
1,067
686
380
2009
783
634 149
% Construction Service
Development
Construction Service
The Growth Coming From The Construction Service (MCMV Level 1)
Total Hired % Balance Concluded % %(A) (B) (C) (C/A) (C/B)
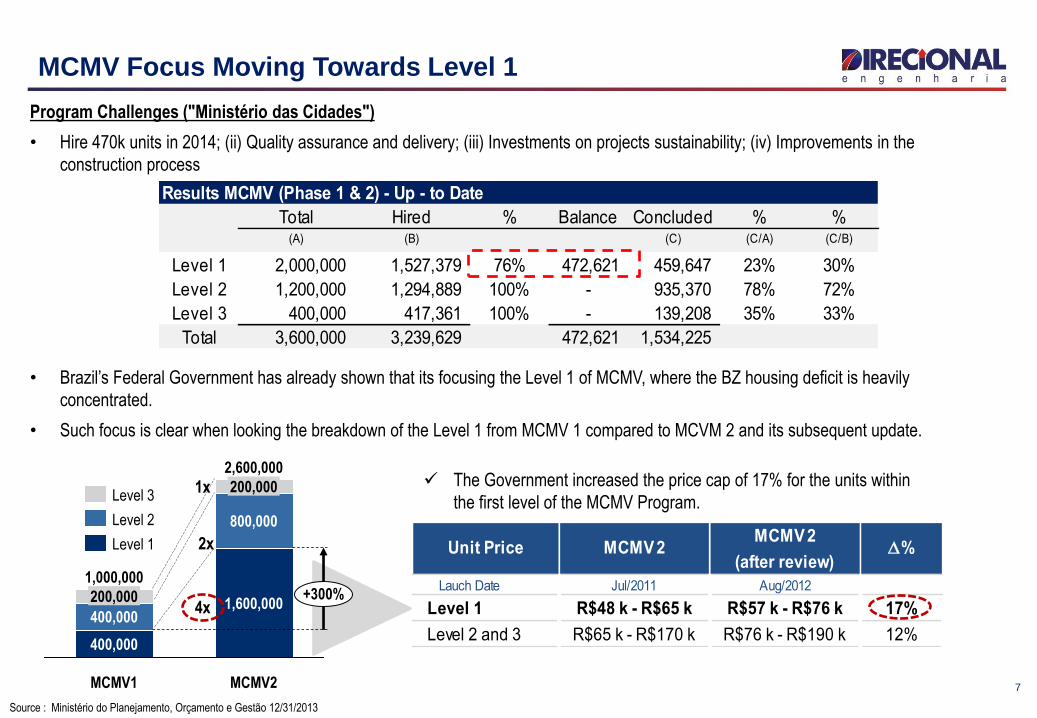
Level 1 2,000,000 1,527,379 76% 472,621 459,647 23% 30%
Level 2 1,200,000 1,294,889 100% - 935,370 78% 72%
Level 3 400,000 417,361 100% - 139,208 35% 33%
Total 3,600,000 3,239,629 472,621 1,534,225
Results MCMV (Phase 1 & 2) - Up - to Date
7
MCMV Focus Moving Towards Level 1
Program Challenges ("Ministério das Cidades")
• Hire 470k units in 2014; (ii) Quality assurance and delivery; (iii) Investments on projects sustainability; (iv) Improvements in the
construction process
Source : Ministério do Planejamento, Orçamento e Gestão 12/31/2013
Lauch Date Jul/2011 Aug/2012
Level 1 R$48 k - R$65 k R$57 k - R$76 k 17%
Level 2 and 3 R$65 k - R$170 k R$76 k - R$190 k 12%
MCMV 2MCMV 2
(after review)Unit Price D%
2,600,000
+300%
MCMV2
1,600,000
800,000
200,000
MCMV1
1,000,000
400,000
400,000
200,000
Level 1
Level 2
Level 3 The Government increased the price cap of 17% for the units within
the first level of the MCMV Program.
4x
2x
1x
• Brazil’s Federal Government has already shown that its focusing the Level 1 of MCMV, where the BZ housing deficit is heavily
concentrated.
• Such focus is clear when looking the breakdown of the Level 1 from MCMV 1 compared to MCVM 2 and its subsequent update.

8
MCMV Level 1 vs Development: Net FCF with no Sales Cancellations
Cash flow (traditional project vs MCMV Level 1 project)
-20%
-10%
0%
10%
20%
0Q -1Q 10Q 9Q 8Q 7Q 6Q 5Q 4Q 3Q 2Q 1Q -2Q -3Q -4Q
Traditional Development
MCMV Level 1 MCMV Level 1 Project Construction
• 100% of units sold to the Federal Government: No delinquency and sales cancelations from this segment, benefiting consolidated figures
• The Fist range of MCMV implies almost no working capital needs.
Land
acquisition Comercial
launch End of
construction
Hired to
Traditional Project Construction
Cash Exposure
MCMV Level 1
Development

Level 1 Contracted Units Direcional Share %
MCMV 1 & 2 1,527,379 73,869 5%
MCMV 1 482,741 7,391 2%
MCMV 2 1,044,638 66,478 6%
9
MCMV: Risk of Discontinuation?
Even considering a potential reduction in the MCMV Level 1 program with a change in political parties, there should be little effect on Direcional.
There are few companies that can deliver high volumes of construction in MCMV Level 1:
MCMV 1: 23% of units launched in MCMV Level 1 were delivered
100% 76%
23%
78%
35% 100%
100%
100%
100%
Delivered Contracted Program
Level 1
Level 2
Level 3
MCMV Program Phase 1 & 2: Status
(% of Units)
Low Share: Direcional represents 5% of MCMV Level 1 as a whole
Opportunity to increase its share
+400 bps
Source : Ministério do Planejamento, Orçamento e Gestão 07/15/2013
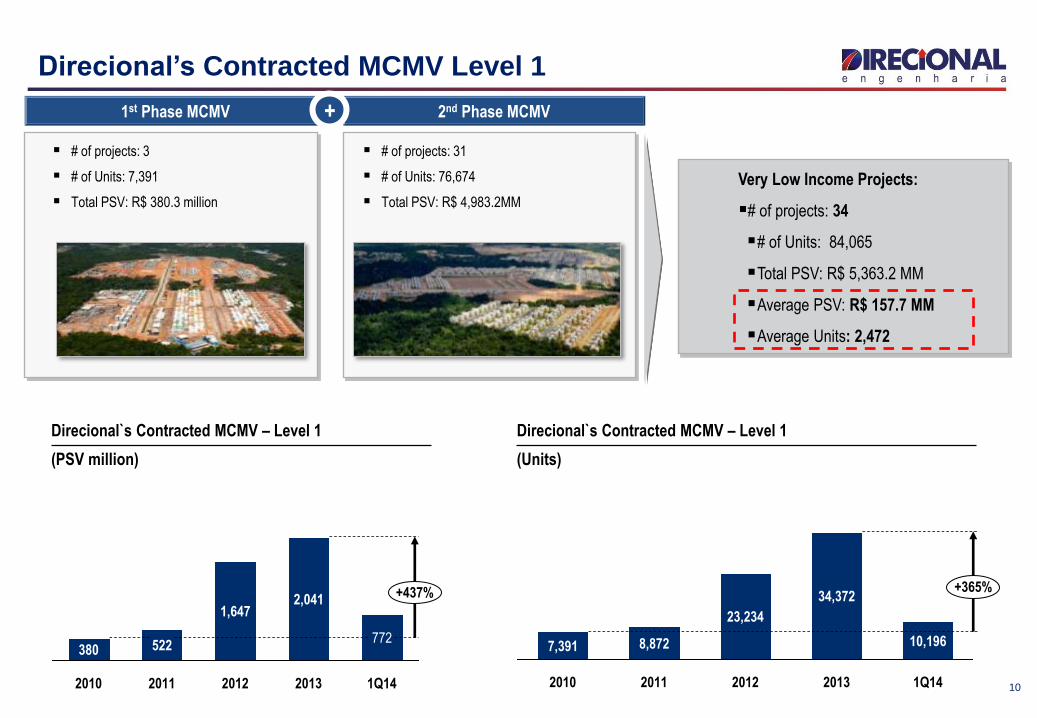
Very Low Income Projects:
# of projects: 34
# of Units: 84,065
Total PSV: R$ 5,363.2 MM
Average PSV: R$ 157.7 MM
Average Units: 2,472
10
Direcional’s Contracted MCMV Level 1
1st Phase MCMV 2nd Phase MCMV
# of projects: 3
# of Units: 7,391
Total PSV: R$ 380.3 million
# of projects: 31
# of Units: 76,674
Total PSV: R$ 4,983.2MM
+
Direcional`s Contracted MCMV – Level 1
(PSV million)
Direcional`s Contracted MCMV – Level 1
(Units)
+437%
1Q14
772
2013
2,041
2012
1,647
2011
522
2010
380
+365%
1Q14
10,196
2013
34,372
2012
23,234
2011
8,872
2010
7,391

Focus on Industrialization
11

12
Focus on Performance
6% 5%5%
4Q13
45%
49%
7%
1Q14
4% 8%
88% 85%
10%
3Q13
84%
11%
2Q13
78%
16%
1Q13
75%
18% 7%
4Q12
70%
23%
7%
3Q12
60%
31%
9%
2Q12
56%
36%
9%
1Q12
50%
41%
8%
4Q11
49%
43%
7%
3Q11
Units Under Construction by Construction Method
(% of Units)
1 Aluminum mold and concrete walls method
Industrial Construction¹ Concrete Blocks Conventional Structure (Concrete Pillars)
1Q14 1Q13 D %
Units Under Construction 77.291 55.583 39%
% of Industrialization (# of units) 88% 75% 13 p.p.
Construction Sites 56 50 12%
Average # of Units by Construction Sites 1.380 1.112 24%
# of Cities 18 13 38%

Construction Technology
45 days to develop 2 buildings with 5 floors and 4 apartments per floor
Video: http://www.direcional.com.br/ri
Aluminum Panels and Concrete Walls
13

14
Construction Inflation (INCC) Track Record
Brazilian construction cost index, base 100 = Jan/2003
100
110
120
130
140
150
160
170
180
190
200
210
220
230
240
250
260
jan/03 jan/04 jan/05 jan/06 jan/07 jan/08 jan/09 jan/10 jan/11 jan/12 jan/13
Labor
INCC
(Aggregated Index)
Materials
Source: BACEN and IBGE

Operating and Financial Highlights
15

16
Launches
20% 14%
2012
60%
20%
2013
82%
4%
Launches by Region - Development
(% PSV)
16%43%
27%
2013
24%
30%
3%
2012
33%
24%
Launches by Region - MCMV Level 1
(% PSV)
2013:
MCMV Level 1 represented 80% of the PSV launched;
82% of the launches in the development segment were in the
southeast region.
+9%
2,565
+24%
2013
2,041
523
2012
2,346
1,647
698
Launched PSV
(R$ million)
MCMV Level 1
Development
Southeast North Northeast Midwest
Launches 1Q14
MG
RS
681,595PSV (R$'000)
Units
Granja Werneck
8,896
89,909PSV (R$'000)
Units
Irmãos Maristas
1,300

17
Net Sales and Inventory
Inventory by Region – 1Q14
(% PSV)
Inventory
(PSV - R$ million)
882
+66%
1Q14
772
110
1Q13
530
405
125
Contracted Net Sales
(PSV - R$ million)
MCMV Level 1
Development
1Q14
55.3%
14.0%
4Q13
55.1%
21.1%
3Q13
46.9%
15.4%
2Q13
49.6%
21.2%
1Q13
40.7%
15.2%
With MCMV Level 1 project
Without MCMV Level 1 project
Sales-over-supply ratio (VSO)¹
(% Total PSV)
1 - VSO ratio = Sales for the period / (Opening Inventory + Launches in the Period)
43%
20%
North
37% Southeast
Midweast
-9%
1Q14
631
452
179
2013
725
571
154
2012
800
670
130
-13.0%
Under Construction
Finished Units
18
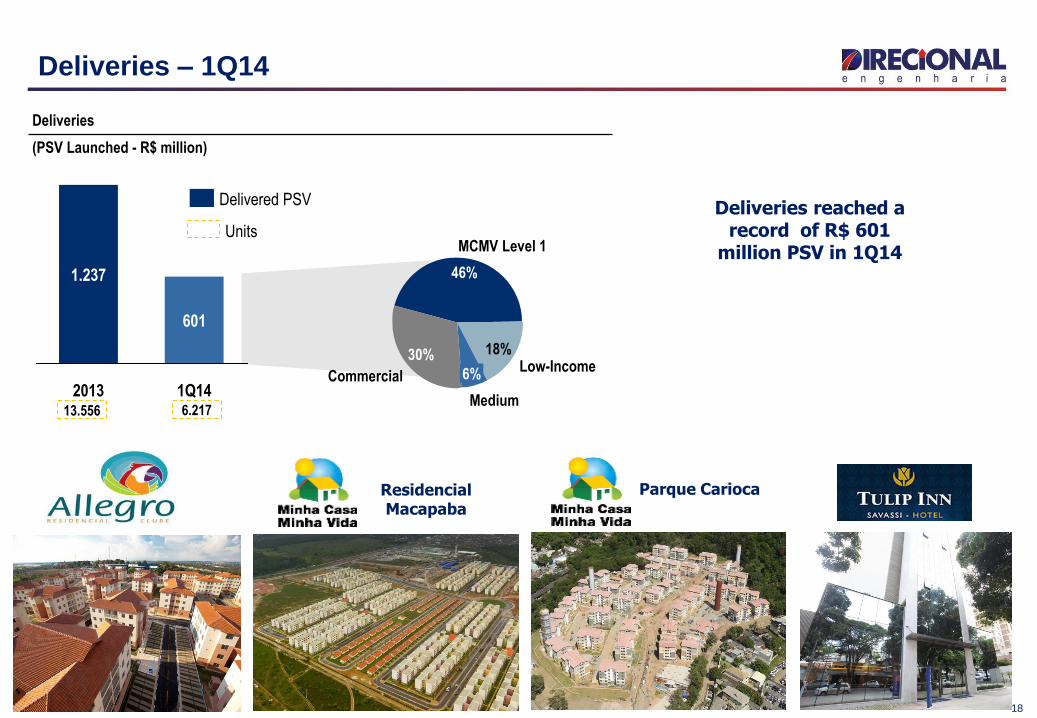
Deliveries – 1Q14
Deliveries
(PSV Launched - R$ million)
Units
6.217 13.556
1Q14
601
2013
1.237
Delivered PSV
30%
Commercial
18%
MCMV Level 1
46%
Medium
6% Low-Income
Residencial Macapaba
Parque Carioca
Deliveries reached a record of R$ 601
million PSV in 1Q14

19
Land Bank
73% are large scale projects (over 1,000 units)
58% are eligible for the MCMV Program
82% were acquired by physical or financial Swap
Average acquisition price of 12% over PSV
R$ 7.8 Billion
52.115 units
Land Bank by Segment
(% PSV)
Land Bank Track Record in 2013
(R$ million in PSV) 194
1Q14
7,820
Review of
Assumptions
/ Traded and
Cancellation
Acquired
Land Bank
632
4Q13
7,382
Land Bank by Region
(% PSV)
Type of Payment
(1Q14 – % PSV)
Swap 81.8% Cash 18.2%
9%
Upper-Middle
2%
RET
31% Low-Income
Medium
53%
Commercial
5%
ES1%
AM10%
MG40%
RO1%
SP6%
PA7%
DF18%
GO2%
RJ15%

250
60%47%
31%24%
14%
1Q14 2013
836
2012
457
2011
269
2010
117
% of Gross Revenue
Revenue from Services
(R$ million)
Cash Generation with Growth
1 - Cash Burn: measured by the change in net debt adjusted for dividend payments and shares buyback
2 – Numbers prior to 2012 are not adjusted in accordance with the new consolidation accounting practices (IFRS 11).
1Q14
82
2013
76
2012
-183
2011
-176
2010
-283
2009
-95
Cash Burn¹,²
(R$ million)
Net Revenues - Track Record²
(R$ million)
397
2012
1,744
2012
1,449
2011
1,072
2010
782
2009
378
CAGR +66%
1Q14
Financing Pass-through (“Repasses”)
(R$ million)
633
+39%
2013
273
360
2012
455
233
222
"Associativo"
SFH Service
87%
Development 13%
Revenue to be Recognized
(% Total)
Services
R$ 4,2 Billion
Development

21
Financial Results
1. Adjusted for (non-cash) expenses with the stock option program
Adjusted¹ G&A
(R$ million)
2013
101
5.8%
2012
96
6.6%
1Q14
30
7.5%
4Q13
26
5.9%
+5%
+15%
1Q13
26
6.6%
Adjusted¹ G&A
% Net revenue
Selling Expenses
(R$ million)
+2%
-27%
2013
41
2.4%
2012
40
2.8%
1Q14
11
2.7%
4Q13
14
3.3%
1Q13
6
1.6%
Selling Expenses % Net revenue
585
4,214
+61%
1Q14
3,660
555
1Q13
2,620
2,035
MCMV Level 1
Development
Revenues to be Recognized
(R$ million)
Gross Revenue
(R$ million)
1,024
457
1Q14
414
164
250
4Q13
452
214
238
1Q13
396
+21%
-8%
2013
1,792
956
836
2012
1,482
246
150
Development
MCMV Level 1

22
Capital Structure
(R$ million)
Loans and Financing – 1Q14
(% of Debt)
1Q14
603
869
4Q13
543
890
1Q13
434
807
Cash
Gross Debt 374
Net Debt
25% 22% 16%
Net Debt / Shareholder's Equity
22
348 266
Capital Structure
Debt
(R$ million)
CRI
4%
Working Capital
2%
SFH
66%
FINAME and Leasing 5%
Debentures
23%
Net Debt
Without SFH
-310
Net Debt
266
Cash and
Cash
Equivalent
603
Debt
869
SFH
576
293

23
Improvement on DIRR3 Float
-13%
Apr.14
1.370
847
523
Mar.14
1.571
675
896
Pessoas Jurídicas
Pessoas Físicas
Number of Investors
(#)
6.043
11.789
-49%
1Q14 1Q13
Average Trading Volume
(R$ 000)
Average Trading Volume
(# of Transactions)
1.359
+52%
1Q14
2.072
1Q13
2.069
3

24
Benchmarking 2013 – Outstanding Results
Direcional: Adjusted for non-cash expenses (Stock-Options Program)
BISA3; -10%
CYRE3; 13%
EVEN3; 15%
EZTC3; 30%
GFSA3; 1%
HBOR3; 26%
MRVE3; 11%
PDGR3; -6%
DIRR3 16%
RDNI3; 12%
RSID3; 2%
TCSA3; 16%
VIVR3; -63%
SETOR; 7%
TRIS3; 6%
22%
27%
32%
37%
42%
47%
52%
-55% -35% -15% 5% 25% 45%
Net
Rev
enu
e LT
M/T
ota
l Ass
ets
Net Margin¹
Slow turnover and margin above averageSlow turnover and margin below average
Fast turnover and margin below average Fast turnover and margin above average
Company; ROE LTMSize: Leverage (Assets/Equity)
Color: Average Prince - Launched Units Last 24 months
Low - up to R$ 200k per unit
Medium - between R$ 200k and R$ 400k per unit
High - above R$ 400k per unit
Setor
18%

25
Contacts
Carlos Wollenweber CFO | IR Officer
Paulo Sousa IR Coordenador
Luiz Felipe Almeida IR Analyst
www.direcional.com.br
(55 31) 3214-6200
(55 31) 3214-6450
Related Documents