9 - 1 Copyright © 2014 Pearson Education, Inc. publishing as Prentice Hall 9 - 1

9 - 1 Copyright © 2014 Pearson Education, Inc. publishing as Prentice Hall 9 - 1.
Dec 21, 2015
Welcome message from author
This document is posted to help you gain knowledge. Please leave a comment to let me know what you think about it! Share it to your friends and learn new things together.
Transcript

9 - 1Copyright © 2014 Pearson Education, Inc. publishing as Prentice Hall
9 - 1

9 - 2Copyright © 2014 Pearson Education, Inc. publishing as Prentice Hall
9 - 2
Chapter 9
Management Control Systemsand Responsibility Accounting

9 - 3Copyright © 2014 Pearson Education, Inc. publishing as Prentice Hall
9 - 3
Chapter 9 Learning Objectives
1. Describe the relationship of management control systems to organizational goals.
2. Explain the importance of evaluating performance and describe how it impacts motivation, goal congruence, and employee effort.
3. Develop performance measures and use them to monitor the achievements of an organization.
4. Use responsibility accounting to define an organizational subunit as a cost center, a profit center, or an investment center.

9 - 4Copyright © 2014 Pearson Education, Inc. publishing as Prentice Hall
9 - 4
5. Prepare segment income statements for evaluating profit and investment centers using the contribution margin and controllable-cost concepts.
6. Measure performance against nonfinancial performance measures such as quality, cycle time, and productivity.
7. Use a balanced scorecard to integrate financial and nonfinancial measures of performance.
8. Describe the difficulties of management control in service and nonprofit organizations.
Chapter 9 Learning Objectives

9 - 5Copyright © 2014 Pearson Education, Inc. publishing as Prentice Hall
9 - 5
Management Control Systems
This is a logical integration of techniquesfor gathering and using information.
Planningand control
Motivating
Evaluating
Learning Objective 1
ForecastingBudgeting
9 - 6Copyright © 2014 Pearson Education, Inc. publishing as Prentice Hall
9 - 6
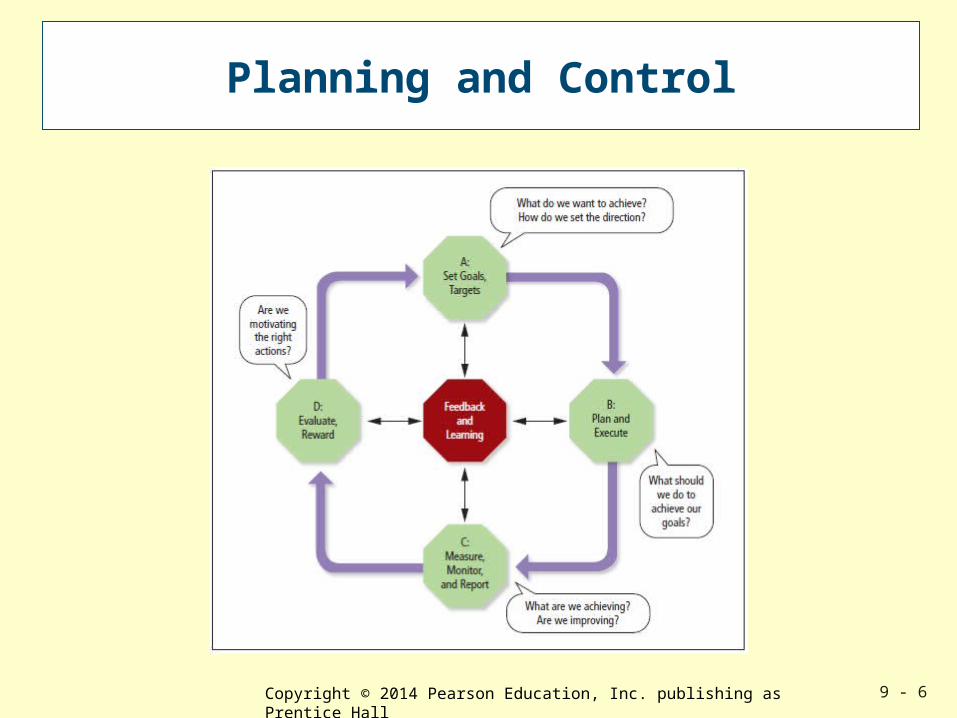
Planning and Control
9 - 7Copyright © 2014 Pearson Education, Inc. publishing as Prentice Hall
9 - 7
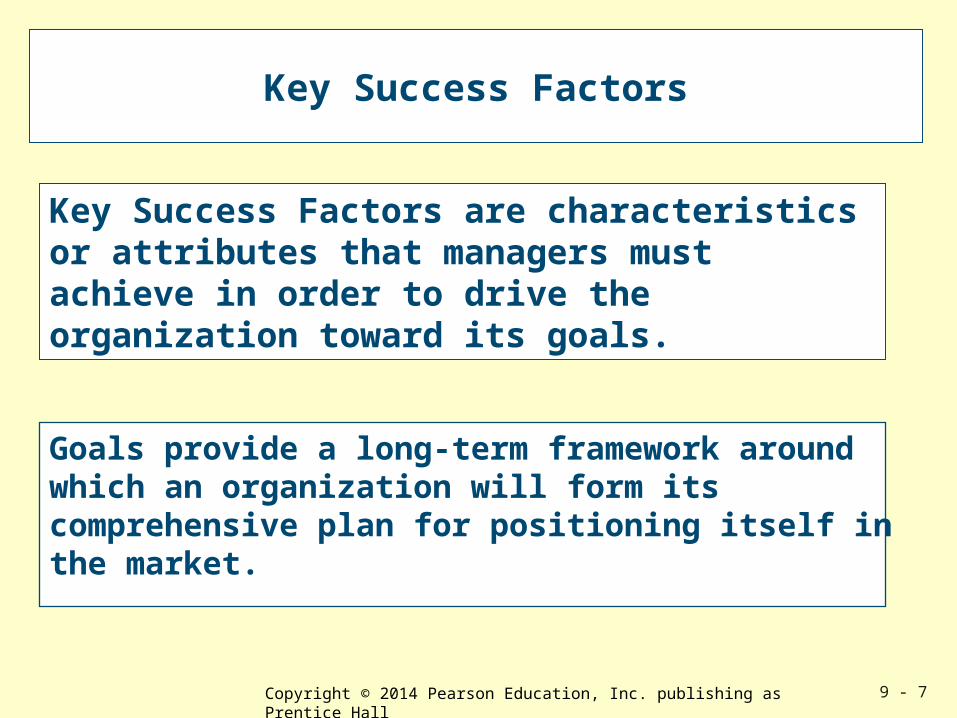
Key Success Factors
Key Success Factors are characteristics or attributes that managers must achieve in order to drive the organization toward its goals.
Goals provide a long-term framework around which an organization will form its comprehensive plan for positioning itself in the market.

9 - 8Copyright © 2014 Pearson Education, Inc. publishing as Prentice Hall
9 - 8
Translating Goals and Objectives into Performance Measures
9 - 9Copyright © 2014 Pearson Education, Inc. publishing as Prentice Hall
9 - 9
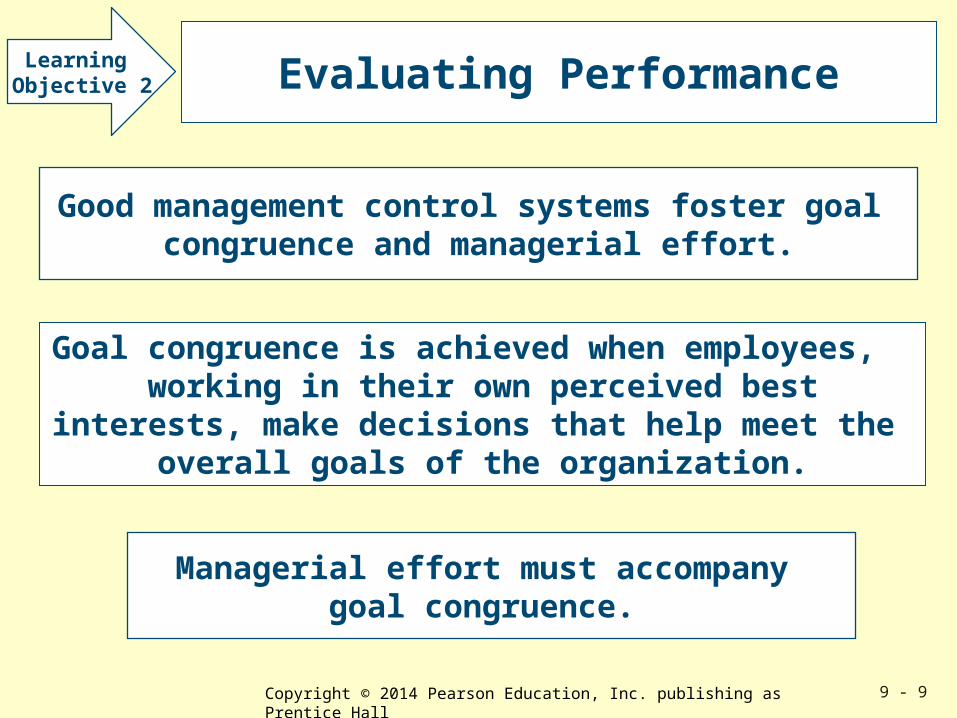
Evaluating Performance
Managerial effort must accompany goal congruence.
Good management control systems foster goal congruence and managerial effort.
Learning Objective 2
Goal congruence is achieved when employees, working in their own perceived best interests,
make decisions that help meet the overall goals of the organization.

9 - 10Copyright © 2014 Pearson Education, Inc. publishing as Prentice Hall
9 - 10
Managerial Effort
Managerial effort is exertiontoward a goal or objective.
Supervising
Planning
Thinking
Effort means working harder, faster, and better.

9 - 11Copyright © 2014 Pearson Education, Inc. publishing as Prentice Hall
9 - 11
Motivation
Motivation is a drive toward some selected goal.
It createseffort.
It createsaction toward
that goal.

9 - 12Copyright © 2014 Pearson Education, Inc. publishing as Prentice Hall
9 - 12
Developing Performance Measures
Effective performance measures will:1. Reflect key actions and activities that relate to the
organization’s goals 2. Be affected by actions of managers and employees3. Be readily understood by employees4. Be reasonably objective and easily measured5. Be used consistently and regularly to evaluate and reward6. Balance long-term and short-term concerns
LearningObjective 3
Effective performance measurement requires multiple performance measures, both financial and nonfinancial.
9 - 13Copyright © 2014 Pearson Education, Inc. publishing as Prentice Hall
9 - 13
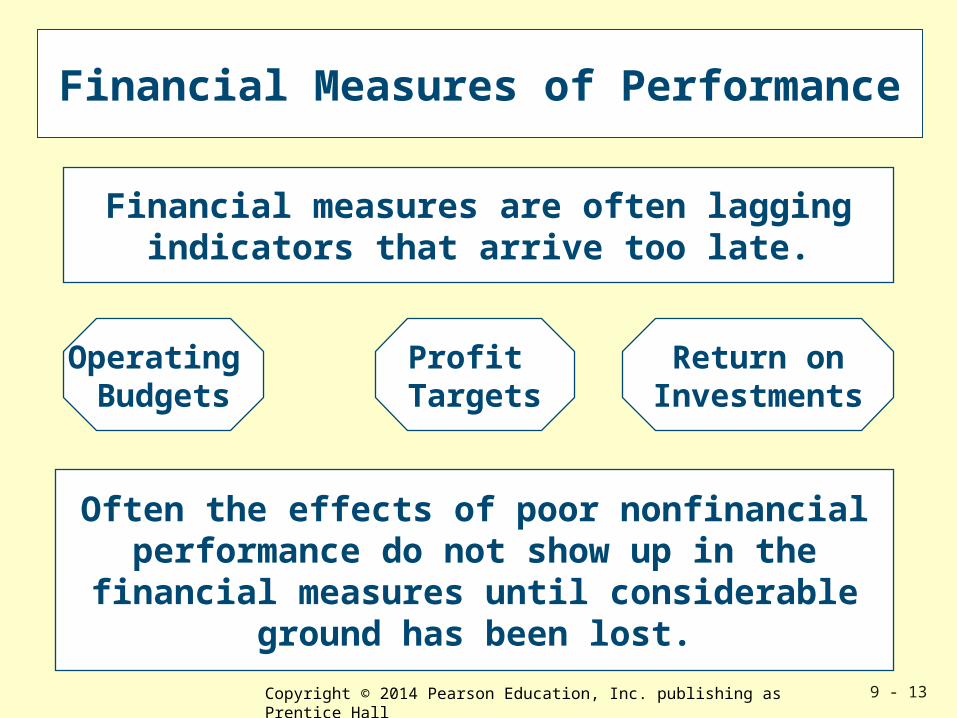
Financial Measures of Performance
Financial measures are often laggingindicators that arrive too late.
Often the effects of poor nonfinancialperformance do not show up in the
financial measures until considerableground has been lost.
Operating Budgets
Profit Targets
Return onInvestments

9 - 14Copyright © 2014 Pearson Education, Inc. publishing as Prentice Hall
9 - 14
Nonfinancial Measures of Performance
These measures include average speed of answer, abandon rate,and application processing time.
AT&T Universal Card Services uses 18 Performance measures for its customer
inquiries process.
Nonfinancial measures often motivate employees toward achieving important
performance goals.
9 - 15Copyright © 2014 Pearson Education, Inc. publishing as Prentice Hall
9 - 15
Monitoring and Reporting Results
At all points in the planning and control process,it is vital that effective communication exists
among all levels of management and employees.
Feedback and learning are at the centerof the management control system.

9 - 16Copyright © 2014 Pearson Education, Inc. publishing as Prentice Hall
9 - 16
A Successful Organization and Measures of Achievement
9 - 17Copyright © 2014 Pearson Education, Inc. publishing as Prentice Hall
9 - 17
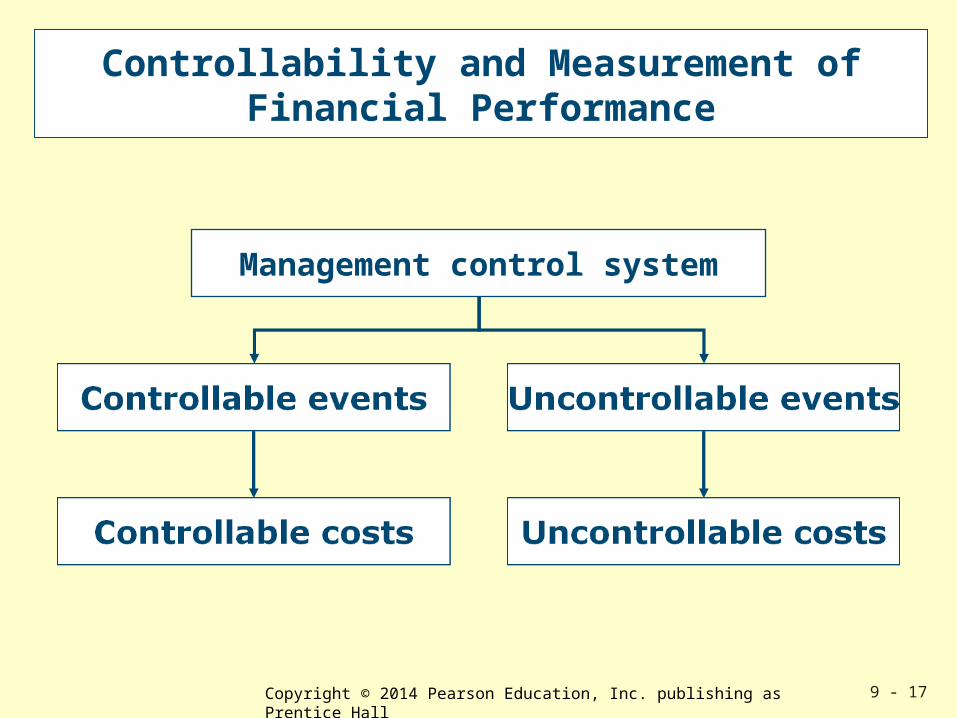
Controllability and Measurement of Financial Performance
Management control system

9 - 18Copyright © 2014 Pearson Education, Inc. publishing as Prentice Hall
9 - 18
Controllability and Measurement of Financial Performance
Controllable costs include all costs that amanager’s decisions and actions can influence.
An uncontrollable cost is any cost thatcannot be affected by the management of
a responsibility center within a given time span.

9 - 19Copyright © 2014 Pearson Education, Inc. publishing as Prentice Hall
9 - 19
Responsibility Centers
System designers apply responsibilityaccounting to identify what part ofthe organization has responsibility
for each action.
A responsibility center is a set of activitiesassigned to a manager, a group of
managers, or other employees.
Learning Objective 4
9 - 20Copyright © 2014 Pearson Education, Inc. publishing as Prentice Hall
9 - 20
Identifying Responsibility Centers
Cost centers
Profit centers
Investment centers

9 - 21Copyright © 2014 Pearson Education, Inc. publishing as Prentice Hall
9 - 21
Identifying Responsibility Centers
Cost centers
In a cost center, managers are responsible for costs only. A cost center may encompass an entire department, or a department may contain several cost centers.
The determination of the number of cost centers depends on cost-benefit considerations—do the benefits exceed the higher costs of reporting?
9 - 22Copyright © 2014 Pearson Education, Inc. publishing as Prentice Hall
9 - 22
Identifying Responsibility Centers
Profit centers
Profit-center managers are responsible for controlling revenues as well as costs—that is, profitability.
Profit centers exist in nonprofit organizations, despite the name, (though it might not be referred to as such) when a responsibility center receives revenues for its services.

9 - 23Copyright © 2014 Pearson Education, Inc. publishing as Prentice Hall
9 - 23
Identifying Responsibility Centers
Investment centers
An investment center adds responsibility for investment to profit-center responsibilities. Investment-center success depends on both income and invested capital, measured by relating income generated to the value of the capital employed.

9 - 24Copyright © 2014 Pearson Education, Inc. publishing as Prentice Hall
9 - 24
Contribution Margin
Managers may quickly calculate any expectedchanges in income by multiplying increases indollar sales by the contribution margin ratio.
The contribution margin is especially helpfulfor predicting the impact on income ofshort-run changes in activity volume.

9 - 25Copyright © 2014 Pearson Education, Inc. publishing as Prentice Hall
9 - 25
Contribution Controllable by Segment Managers
Controllable costs are usually discretionary fixed costs such as local advertising and some salaries, but not the manager’s salary.
Managers help explain the total segment contribution, but they are responsible only for the controllable contribution.
Controllable fixed costs are deducted from the contribution margin to obtain the contribution controllable by segment managers.
9 - 26Copyright © 2014 Pearson Education, Inc. publishing as Prentice Hall
9 - 26
Performance Measures
Many organizations, in recent years, have developed an awareness of the importance of controlling aspects of nonfinancial performance measures.
LearningObjective 6
Quality Control Cycle Time
Productivity
9 - 27Copyright © 2014 Pearson Education, Inc. publishing as Prentice Hall
9 - 27
Quality Control
Quality control is the effort to ensure that products and services perform
to customer requirements.
The traditional approach to controlling quality in the U. S. was to inspect products after completing them and reject or rework
those that failed the inspections.
Because testing is expensive, companies often inspected only a sample of products.
9 - 28Copyright © 2014 Pearson Education, Inc. publishing as Prentice Hall
9 - 28
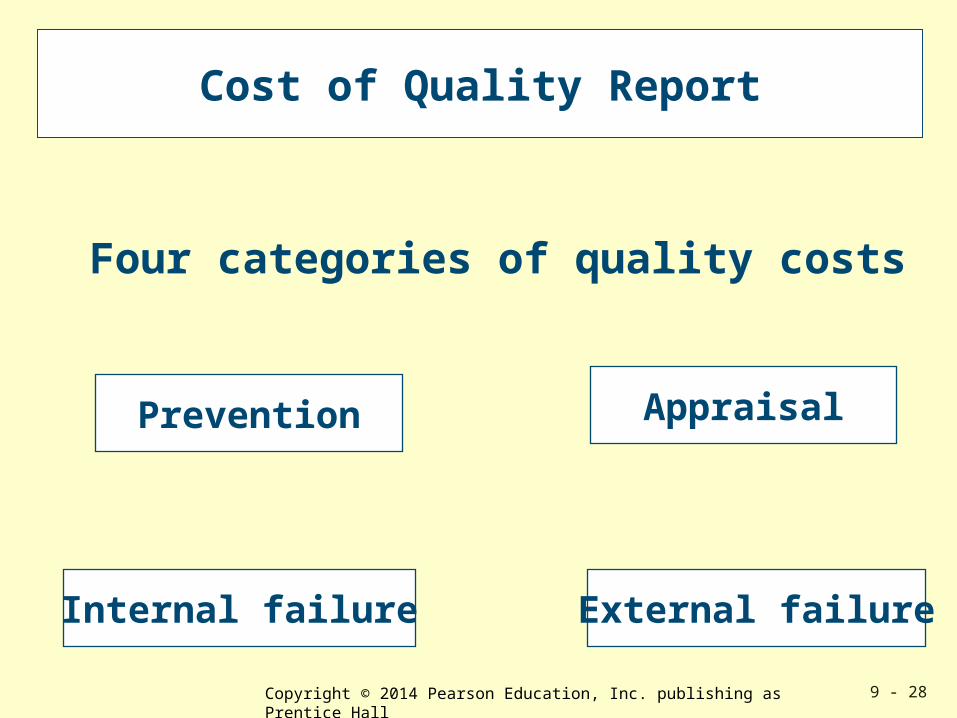
Cost of Quality Report
Prevention
Internal failure
Appraisal
External failure
Four categories of quality costs

9 - 29Copyright © 2014 Pearson Education, Inc. publishing as Prentice Hall
9 - 29
Cost of Quality Report
Prevention costs are the costs incurred toprevent the production of defective
products or delivery of substandard services.
Appraisal costs are the costs incurred toidentify defective products or services.

9 - 30Copyright © 2014 Pearson Education, Inc. publishing as Prentice Hall
9 - 30
Cost of Quality Report
Internal failure costs are the costs of defectivecomponents and final products or services
that are scrapped or reworked.
External failure costs are the costs caused bydelivery of defective products or services
to customers, such as field repairs,returns, and warranty expenses.
9 - 31Copyright © 2014 Pearson Education, Inc. publishing as Prentice Hall
9 - 31
TQM
Total quality management (TQM) focuses on prevention of defects and on achievement of customer satisfaction.
The TQM approach assumes an organization minimizes the cost of quality when it achieves high quality levels.
TQM is the application of quality principles to all the organization’s efforts to satisfy customers.

9 - 32Copyright © 2014 Pearson Education, Inc. publishing as Prentice Hall
9 - 32
Quality-Control Chart
The quality-control chart is a statisticalplot of measures of various product
dimensions or attributes.
This plot helps detect process deviationsbefore the process generates defects.

9 - 33Copyright © 2014 Pearson Education, Inc. publishing as Prentice Hall
9 - 33
Quality-Control Chart
00
11
22
33
3/123/123/19 3/19 3/263/26 4/24/2 4/9 4/9 4/164/164/23 4/23 4/304/30 5/75/7 5/14 5/14
Week of Week of
Perc
en
tag
e o
f D
efe
cts
Perc
en
tag
e o
f D
efe
cts
Goal = 0.6%Goal = 0.6%
ActualActual
9 - 34Copyright © 2014 Pearson Education, Inc. publishing as Prentice Hall
9 - 34
Six Sigma
Six Sigma is a continuous process- improvement effort designed to reduce
costs by improving quality.
It has broadened into a general process todefine and measure a process, analyze it,
and improve it to minimize errors.
9 - 35Copyright © 2014 Pearson Education, Inc. publishing as Prentice Hall
9 - 35
Control of Cycle Time
Cycle time, or throughput time, is the time taken to complete a product or service, or any of the components
of a product or service.
The longer a product or service is inprocess, the more costs it consumes.

9 - 36Copyright © 2014 Pearson Education, Inc. publishing as Prentice Hall
9 - 36
Control of Productivity
Productivity is a measure ofoutputs divided by inputs.
Productivity measures vary widelyaccording to the type of resource
with which management is concerned.
Outputs InputsProductivity =

9 - 37Copyright © 2014 Pearson Education, Inc. publishing as Prentice Hall
9 - 37
Control of Productivity
How should outputs andinputs be measured?
Labor-intensive organizations areconcerned with increasing theproductivity of labor, so labor-
based measures are appropriate.

9 - 38Copyright © 2014 Pearson Education, Inc. publishing as Prentice Hall
9 - 38
Measures of Productivity
9 - 39Copyright © 2014 Pearson Education, Inc. publishing as Prentice Hall
9 - 39
Balance Scorecard
A balanced scorecard is a performancemeasurement and reporting system
that strikes a balance betweenfinancial and operating measures.
It links performance to rewards.
It gives explicit recognition to thediversity of organizational goals.
Learning Objective 7
9 - 40Copyright © 2014 Pearson Education, Inc. publishing as Prentice Hall
9 - 40
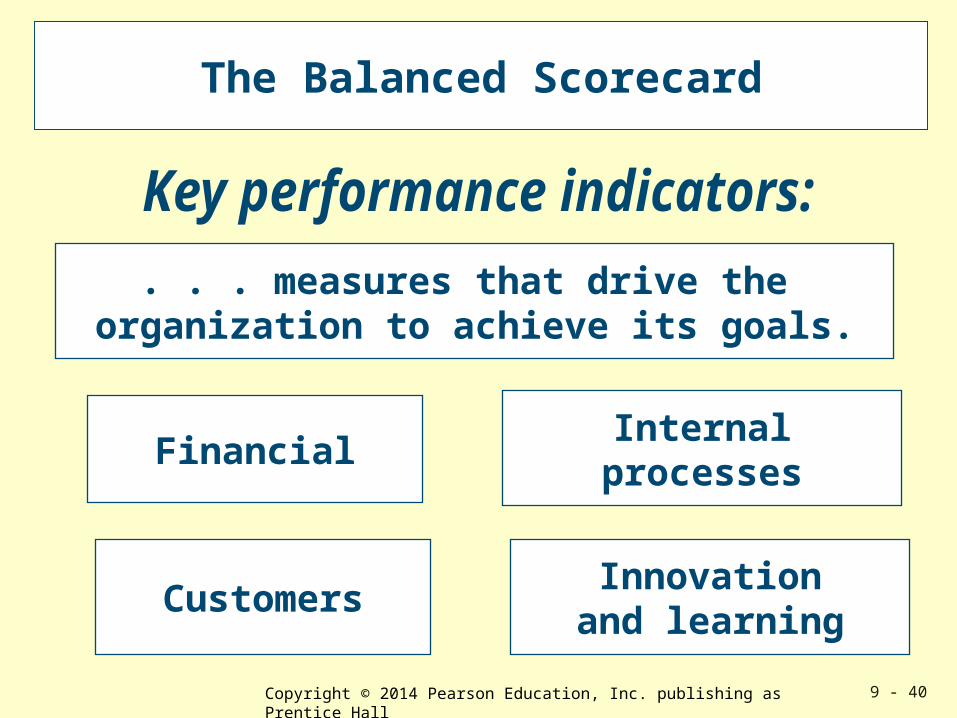
The Balanced Scorecard
. . . measures that drive the organization to achieve its goals.
FinancialInternal
processes
CustomersInnovation
and learning

9 - 41Copyright © 2014 Pearson Education, Inc. publishing as Prentice Hall
9 - 41
Service, Government, and Nonprofit Organizations
Most service, government, and nonprofitorganizations have more difficulty
implementing managementcontrol systems.
Learning Objective 8
Outputs of service and nonprofitorganizations are more difficultto measure than are the cars or
computers that are producedby manufacturers.
9 - 42Copyright © 2014 Pearson Education, Inc. publishing as Prentice Hall
9 - 42
Service, Government, and Nonprofit Organizations
These organizations have problems in designing and implementing an objective similar to the financial
“bottom line” - the unifying goal in private industry.
In nonprofit organizations, many people seekprimarily nonmonetary rewards.

9 - 43Copyright © 2014 Pearson Education, Inc. publishing as Prentice Hall
9 - 43
Service, Government, and Nonprofit Organizations
Management control systems in nonprofit organizations are not as highly developed as those in profit-seeking firms because:Organizational goals and objectives are less clear.
Professionals dominate these organizations.
Measurements are more difficult – no profit measure and heavy fixed costs.
Less competitive pressure to improve management control systems.
The role of budgeting is more a matter of playing bargaining games.
Motivations and incentives differ from for-profit organizations.

9 - 44Copyright © 2014 Pearson Education, Inc. publishing as Prentice Hall
9 - 44
Future of Management Control Systems
A changing environment often means that organizations must adjust their
goals or key success factors.
As organizations mature and environments change, managers expand and refine their
management control tools.
9 - 45Copyright © 2014 Pearson Education, Inc. publishing as Prentice Hall
9 - 45
All rights reserved. No part of this publication may be reproduced, stored in a retrieval system, or transmitted, in any form or by any means, electronic, mechanical, photocopying, recording, or otherwise, without the prior written permission of the publisher. Printed in the United States of America.
Related Documents