November 2, 2008 US Technology Strategy Independent Insight: IT Spending Survey 2009 under the knife – expect -1% global decline Expect global slowing in IT spending Balancing developed market declines of -5% for 2009 against emerging market growth of 7% we triangulate to a -1% decline globally. This compares to 6% estimated global growth in 2008 and 9% in 2007. CIO feedback underscores spending contraction Our reading on total IT spending is the lowest in the history of the survey (since 2002). Our total IT spending index came in at 38.8, down from 51.0 in our prior survey, implying meaningful contraction. 4Q budget flush severely capped Fifty-two percent of respondents have seen budgets decrease for 2008 in the past three months, likely pressuring any sort of 4Q budget flush. Forty-one percent of our survey believes spending will be less in 4Q versus recent years. Services pressured; caution on Indian IT Services ticks up Results for services mark a new low point. Appetite for offshore services remains well below trend, and we remain cautious on the space, with both TCS (TCS.BO) and Wipro (WIT, WIPR.BO) rated Sell. Software weakens; Microsoft the exception Software spending intentions dropped to just in line with overall budget commentary, having been flagged as more resilient prior. Applications are most at risk, SAP (SAP) drops out of the top group, and we remain sellers of salesforce.com (CRM) and NetSuite (N). Microsoft (MSFT) enterprise products driving relatively better expectations of spending; in mobile arena, catching up to RIM (RIMM). Networking softer; Cisco positive, best-of-breeds pressured Networking spending intentions softened in line with the overall reining-in of spending intentions. We remain on the sidelines for most stocks in this area. The notable exception is Cisco (CSCO), where share gains partially mute the impact of weaker spending. THIS IS THE 43 RD ISSUE IN OUR IT SPENDING SURVEY SERIES. OUR SURVEY PANEL IS MADE UP OF 100 MANAGERS WITH STRATEGIC DECISION-MAKING AUTHORITY AT MULTINATIONAL FORTUNE 1000 COMPANIES. Sarah Friar (415) 249-7436 | [email protected] Goldman, Sachs & Co. James Covello (212) 902-1918 | [email protected] Goldman, Sachs & Co. Derek R. Bingham (415) 249-7435 | [email protected] Goldman, Sachs & Co. The Goldman Sachs Group, Inc. does and seeks to do business with companies covered in its research reports. As a result, investors should be aware that the firm may have a conflict of interest that could affect the objectivity of this report. Investors should consider this report as only a single factor in making their investment decision. For Reg AC certification, see the end of the text. Other important disclosures follow the Reg AC certification, or go to www.gs.com/research/hedge.html. Analysts employed by non-US affiliates are not registered/qualified as research analysts with FINRA in the U.S. The Goldman Sachs Group, Inc. Global Investment Research

7737986 goldman-sachs-it-spending-survey
Jun 19, 2015
Welcome message from author
This document is posted to help you gain knowledge. Please leave a comment to let me know what you think about it! Share it to your friends and learn new things together.
Transcript

November 2, 2008
Goldman Sachs Global Investment Research 1
November 2, 2008
US Technology Strategy
Independent Insight: IT Spending Survey
2009 under the knife – expect -1% global decline
Expect global slowing in IT spending
Balancing developed market declines of -5% for 2009 against emerging
market growth of 7% we triangulate to a -1% decline globally. This
compares to 6% estimated global growth in 2008 and 9% in 2007.
CIO feedback underscores spending contraction
Our reading on total IT spending is the lowest in the history of the
survey (since 2002). Our total IT spending index came in at 38.8, down
from 51.0 in our prior survey, implying meaningful contraction.
4Q budget flush severely capped
Fifty-two percent of respondents have seen budgets decrease for 2008
in the past three months, likely pressuring any sort of 4Q budget flush.
Forty-one percent of our survey believes spending will be less in 4Q
versus recent years.
Services pressured; caution on Indian IT Services ticks up
Results for services mark a new low point. Appetite for offshore
services remains well below trend, and we remain cautious on the
space, with both TCS (TCS.BO) and Wipro (WIT, WIPR.BO) rated Sell.
Software weakens; Microsoft the exception
Software spending intentions dropped to just in line with overall
budget commentary, having been flagged as more resilient prior.
Applications are most at risk, SAP (SAP) drops out of the top group,
and we remain sellers of salesforce.com (CRM) and NetSuite (N).
Microsoft (MSFT) enterprise products driving relatively better
expectations of spending; in mobile arena, catching up to RIM (RIMM).
Networking softer; Cisco positive, best-of-breeds pressured
Networking spending intentions softened in line with the overall
reining-in of spending intentions. We remain on the sidelines for most
stocks in this area. The notable exception is Cisco (CSCO), where share
gains partially mute the impact of weaker spending.
THIS IS THE 43RD ISSUE IN OUR IT SPENDING SURVEY
SERIES. OUR SURVEY PANEL IS MADE UP OF 100
MANAGERS WITH STRATEGIC DECISION-MAKING
AUTHORITY AT MULTINATIONAL FORTUNE 1000
COMPANIES.
Sarah Friar
(415) 249-7436 | [email protected] Goldman, Sachs & Co.
James Covello
(212) 902-1918 | [email protected] Goldman, Sachs & Co.
Derek R. Bingham
(415) 249-7435 | [email protected] Goldman, Sachs & Co.
The Goldman Sachs Group, Inc. does and seeks to do business with companies covered in its research reports. As a result, investors should be aware that the firm may have a conflict of interest that could affect the objectivity of this report. Investors should consider this report as only a single factor in making their investment decision. For Reg AC certification, see the end of the text. Other important disclosures follow the Reg AC certification, or go to www.gs.com/research/hedge.html. Analysts employed by non-US affiliates are not registered/qualified as research analysts with FINRA in the U.S.
The Goldman Sachs Group, Inc. Global Investment Research

November 2, 2008
Goldman Sachs Global Investment Research 2
Table of contents
2009 IT spending forecast down 1% globally: Negative in developed economies; growth still evident in emerging markets 2
End-market demand: Almost every vertical likely to soften in 2009 given broad-based nature of macroeconomic declines 7
Latest IT Spending Survey results: Indices continue sharp retreat, now indicating contraction 8
Segment focus: Professional services and hardware tend to be a top focus for spending cuts 12
Vendor focus: Who is gaining share of the shrinking budget? 13
Sub-sector focus: Hardware 17
Sub-sector focus: Software 21
Sub-sector focus: Services 23
Sub-sector focus: Networking 27
Respondent overview 32
Disclosures 34
2009 IT spending forecast down 1% globally: Negative in developed economies; growth still evident in emerging markets
• We estimate IT spending in developed economies will contract 5% in 2009. We
triangulate on the outlook for economic growth, capital spending, and corporate
profits – as well as our latest IT Spending Survey results – to conclude that tech
spending in the developed economies (the United States, Western Europe, and Japan)
is likely to decline by about 5% in 2009. This compares to 4% expected growth in 2008
and 7% growth in 2007.
• We expect 2009 emerging economy IT spending growth of 7%. The Goldman Sachs
Economic Research outlook for capital spending in emerging economies for 2009 is
growth of about 7%. We assume IT spending should trend about in line with this
estimate. The 2009 outlook for emerging markets compares to 10% expected growth in
2008 and 12% growth in 2007.
• Developed market declines offset by emerging market growth leads us to our
forecast of -1% global IT spending growth for 2009. We estimate that developed
economies account for about 65% of total IT spending, with emerging economies
making up the balance. The weighted global spending forecast thus comes to
contraction of about 1% in 2009, compared to our estimate of 6% global spending
growth in 2008 and 9% growth in 2007.
Aligning bottom-up with top-down analysis
Aligning with this IT spending forecast, each coverage group within Goldman Sachs US
Technology Research is forecasting a significant deceleration in growth in CY2009 from
the growth rates seen in CY2008 (see Exhibit 1). We note it is difficult to triangulate exactly
from a global IT spending forecast to our individual sector and company coverage growth
rates. However, directionally we are in synch, having the same delta between our forecast
and overall IT spending expectations in both CY2008 and CY2009. The delta is likely driven
by some bias on the size and quality of companies under coverage, some M&A that does
not get removed in our bottom-up builds, and finally the overall capital spending data we
use does not cover some of the more ratable and recurring revenue streams such as
software maintenance, for example.

November 2, 2008
Goldman Sachs Global Investment Research 3
Exhibit 1: Goldman Sachs US Tech Research bottom-up revenue growth projections vs. IT
spending forecasts
GS Sector Coverage Group GS Revenue Growth EstimatesCY2008 CY2009
Indian IT Services 29% 12%Software 13% 5%Hardware 9% 4%US IT Services 13% 4%CommTech 5% 1%Semis -3% -5%GS Average 11% 4%Global IT Spending forecast 6% -1%∆ 5% 5%
Source: Goldman Sachs Research.
We see developed economy IT spending down 5% in 2009, using
the United States as a proxy
Given the increasing correlation between developed economies and the availability of
more robust historical data on US tech spending, we use our US estimate as a proxy for
the major emerged economies, including Western Europe, Canada, and Japan. We
estimate that, together, the developed economies account for approximately 65% of
overall IT spending (see Exhibit 6).
• US GDP growth is expected to slow further. Goldman Sachs Economics Research
currently expects nominal US GDP to slow to 1.9% in 2009, down from 3.8% in 2008
(real GDP is expected to dip to slight contraction of 0.2% in 2009). GDP growth has
historically been a coincident indicator for US IT spending, though tech spending has
tended to contract more sharply than GDP in downturns (see Exhibit 2).
• US business capital spending is expected to contract sharply in 2009. Goldman
Sachs Economics Research expects nominal US business fixed investment (BFI) to
decline 8% in 2009. The sharpness of the decline is due in large part to rapid growth in
structures (offices, industrial buildings, hospitals, shopping centers, etc.), which
outpaced IT investment growth significantly in the middle part of the decade. Thus, a
contraction in tech spending should be less severe than the overall contraction in US
capex, which is consistent with prior cycles (see Exhibit 3).
• Declines in US corporate profits deepened in 2008, which should lead to spending
reductions in 2009. Corporate profits have tended to be more of a leading indicator of
US tech spending, by about a year. Although S&P operating profits began to decline in
2007 (due largely to financial write-downs) and accelerated downward this year, tech
spending continued to grow at a healthy rate. However, 2009 should be the year in
which the impact is most felt in tech as spending is curtailed, though IT spending has
historically held up quite a bit better relative to declines in corporate profits (see
Exhibit 4).
• Latest CIO feedback indicates spending contraction. Consistent with our ongoing
CIO conversations suggesting cautious budgeting for 2009, our latest IT spending
survey shows clear expectations of spending contraction for next year (see Exhibit 8).
We note that of total enterprise IT budgets, about 75% typically consists of operating
budgets, with the remaining 25% being capital budgets. Operating budgets, which
comprise staffing and recurring elements such as maintenance, typically have more
resilience associated with them, even in downturns. This has something of a

November 2, 2008
Goldman Sachs Global Investment Research 4
smoothing effect on the overall volatility of IT capital budgets and should be kept in
mind when we translate the budget outlook into revenue growth rates for vendors.
Contraction in 2009 US IT spending not likely to be overly sharp
We currently expect declines in US IT investment of about 5%. Historically, tech spending
has tended not to swing as sharply as capital spending or corporate profits. The 2002 tech
downturn was exceptionally sharp by historical measures (down 7% in 2001 followed by
down 9% in 2002 in the United States). However, this came in the wake of significant IT
overbuilding, which we have not seen post-bubble. In the recession prior to that (1990-91),
US tech spending continued to grow at a low-to-mid single digit nominal pace through the
downturn. Because IT spending has been outpacing GDP only modestly over the past few
years, and has been lagging overall US capital spending growth, it would be surprising for
IT spending to swing to sharp or sustained declines, in our view.
Exhibit 2: GDP has tended to be a coincident indicator of US tech spending, with tech
investment slowing more deeply vs. GDP in the last 2 recessions.
US GDP vs. tech capital investment (nominal), 1970-2009E
-15%
-10%
-5%
0%
5%
10%
15%
20%
25%
30%
1970
1971
1972
1973
1974
1975
1976
1977
1978
1979
1980
1981
1982
1983
1984
1985
1986
1987
1988
1989
1990
1991
1992
1993
1994
1995
1996
1997
1998
1999
2000
2001
2002
2003
2004
2005
2006
2007
2008
E20
09E
year
-ove
r-ye
ar g
row
th %
US GDP, nom US Tech Capital Investment, nom
Note: Grey shading denotes recession.
Source: Goldman Sachs Research, US Department of Commerce.

November 2, 2008
Goldman Sachs Global Investment Research 5
Exhibit 3: Business fixed investment (BFI) has also been a coincident indicator of US tech
spending, though tech spending has tended to hold up better in downturns
US BFI vs. tech capital investment (nominal), 1970-2009E
-15%
-10%
-5%
0%
5%
10%
15%
20%
25%
30%
1970
1971
1972
1973
1974
1975
1976
1977
1978
1979
1980
1981
1982
1983
1984
1985
1986
1987
1988
1989
1990
1991
1992
1993
1994
1995
1996
1997
1998
1999
2000
2001
2002
2003
2004
2005
2006
2007
2008
E20
09E
year
-ove
r-ye
ar g
row
th %
US Business Fixed Investment, nom US Tech Capital Investment, nom
Source: Goldman Sachs Research, US Department of Commerce.
Exhibit 4: Corporate profits have been more of a leading indicator of US tech spending,
with swings in corporate profits tending to be more sharp than IT investment
S&P 500 operating profits vs. tech investment, 1970-2009E
-20%
-10%
0%
10%
20%
30%
40%
1970
1971
1972
1973
1974
1975
1976
1977
1978
1979
1980
1981
1982
1983
1984
1985
1986
1987
1988
1989
1990
1991
1992
1993
1994
1995
1996
1997
1998
1999
2000
2001
2002
2003
2004
2005
2006
2007
2008
E20
09E
year
-ove
r-ye
ar g
row
th %
S&P 500 Operating Earnings US Tech Capital Investment, nom
Source: Goldman Sachs Strategy Research, US Department of Commerce.

November 2, 2008
Goldman Sachs Global Investment Research 6
Emerging market spending slowing to 7% but still at relatively
stronger levels
We currently expect emerging market growth to remain relatively stronger, although down
from the levels seen in the prior six years. The Goldman Sachs Economics Research
outlook for capital spending in emerging economies for 2009 is growth of about 7%. We
assume IT spending should trend about in-line with this estimate. This compares to 10%
growth in 2008 and 12% in 2007 (see Exhibit 5).
Exhibit 5: Emerging markets fixed investment is likely to decelerate, but still well outpace
that of G7 economies
Emerging markets vs. G7 fixed investment, 2000-2009E
-6
-4
-2
0
2
4
6
8
10
12
14
2000 2001 2002 2003 2004 2005 2006 2007 2008 2009
year
-ove
r-ye
ar g
row
th %
Emerging Markets Fixed Investment G7 Fixed Investment
Source: Goldman Sachs Economics Research.
Exhibit 6: We estimate developed economies make up about 65% of IT spending
Estimated share of worldwide IT spending by geography, 2009E
North America30%
Western Europe27%
Japan8%
Asia/Pacific16%
Latin America7%
Middle East and Africa7%
Central & Eastern Europe5%
Source: Goldman Sachs Research, Gartner.

November 2, 2008
Goldman Sachs Global Investment Research 7
End-market demand: Almost every vertical likely to soften in 2009 given broad-based nature of macroeconomic declines
Exhibit 7: Normalized vertical end demand: Financials, communications, manufacturing,
and government are the “Big 4,” making up almost two-thirds of IT spending
Financials and manufacturing likely to see the sharpest contraction in 2009 based on feedback
from CIO conversations
Financial services, 21%
Communications, 16%
Manufacturing, 14%Government, 11%
Business services, 8%
Technology, 6%
Retail, 5%
Healthcare, 5%
Transportation, 3%
Energy & utilities, 3%
Education, 2%Other, 6%
Source: Goldman Sachs Research estimates.
Our conversations with CIOs across many verticals, as well as with management teams in
our coverage, have emphasized the broad-based nature of the current downturn, both by
vertical and by geography. Healthcare is perhaps the only vertical that still appears to be
spending at a more normalized clip, but given its small overall size within IT spending this
is unlikely to be a “needle-mover,” except at the micro level for companies particularly
exposed in that arena.
• Financials: We expect significant spending pressure. As is already well known, we
have seen tightening spending in 2008 by US and European financials companies. In
the US, most financials CIOs with whom we have spoken are planning on IT spending
being down in the range of 10-20% for 2009, with some even suggesting more than
this. We do not expect a rebound from the sector until companies can assess how the
credit and broader macro outlooks are unfolding.
• Communications: Having been one of the healthiest, comms are likely to curtail
spending in 2009. We expect the communications vertical to see about a 7% decline
in capital spending in 2009 globally given macro headwinds and following a few big
years of investment. Comms capital spending growth in 2008 was about 5% in the
United States with about 22% growth in the rest of the world (17% growth in total).
Wireline build-outs to facilitate triple-play broadband and rich audio/visual delivery in
both the home and enterprise will continue to be a focus but will slow for now.

November 2, 2008
Goldman Sachs Global Investment Research 8
• Manufacturing: Capital spending plans remain highly in flux in this vertical. However,
Goldman Sachs analysts’ best estimate is for overall capital spending to be flat to
down 10% from low to mid-single-digit growth in 2008. We expect companies to
remain conservative about the emerged economies in setting 2009 spending targets,
but would expect relatively stronger investment in international markets.
• Government: Spending is likely to soften quite a bit as well. On the local level, we
expect a more pronounced slowdown after stronger spending growth over the past
few years. Tax receipts are set to fall as housing and income impacts feed through the
local economies. At the Federal civilian level, the continuing resolution provides
authorization in civilian agencies to continue spending at 2008 levels. However, this
does impede new program starts. On the Federal DoD side, spending remains intact
and is fully funded. With an administration change, regardless of party, we would not
expect any material change in the near term as the DoD budget has already been put
into law, and the continuing resolution on the Federal Civilian is in effect through
March 2009.
• Technology and Retail: Expect spending to drop as the impact from reduced
consumer spending flows through business models. Currently, Goldman Sachs
analysts expect negative capital expenditure growth from both verticals.
Latest IT Spending Survey results: Indices continue sharp retreat, now indicating contraction
Our IT spending indices, which measure indications of spending growth versus
spending contraction, have reached multi-year lows, now implying year-over-year
spending contraction. Our total IT spending index (which includes salaries, services,
depreciation, occupancy, etc.) came in at 38.8, down from 51.0 in our prior survey in
August, implying meaningful contraction. This reading on total IT spending is the lowest in
the history of our survey (since 2002). Our tech capital spending index (representing
spending only on new equipment and software) dropped to 45.9, versus 53.5 in our prior
survey, also dipping into contraction territory (see Exhibit 8). We note that our respondents
continue to indicate that capital spending is holding up somewhat better than overall
spending, consistent with anecdotal feedback putting contingent labor, professional and
data services at the top of the list of cut-backs. However, this likely reverses next year as
capital budgets are targeted for the next round of cost reductions. Interviews for our latest
survey were conducted in mid-October.

November 2, 2008
Goldman Sachs Global Investment Research 9
Exhibit 8: Both our IT spending indices are now in contraction territory
Goldman Sachs IT Spending Indices
35.0
40.0
45.0
50.0
55.0
60.0
65.0
70.0
75.0
80.0
85.0
90.0
Feb-
02
Apr
-02
Jun-
02
Aug
-02
Oct
-02
Dec
-02
Feb-
03
Apr
-03
Jun-
03
Aug
-03
Oct
-03
Dec
-03
Feb-
04
Apr
-04
Jun-
04
Aug
-04
Oct
-04
Dec
-04
Feb-
05
Apr
-05
Jun-
05
Aug
-05
Oct
-05
Dec
-05
Feb-
06
Apr
-06
Jun-
06
Aug
-06
Oct
-06
Dec
-06
Feb-
07
Apr
-07
Jun-
07
Aug
-07
Oct
-07
Dec
-07
Feb-
08
Apr
-08
Jun-
08
Aug
-08
Oct
-08
Spen
ding
Indi
ces
index >50 = expansion
index <50 = contraction
Total IT spending
index
Tech capital
spending index
1 year ago (Oct-07)2 years ago (Oct-06)
Source: Goldman Sachs IT Spending Survey.
Note on our index methodology: Our IT spending indices (shown in Exhibit 8) summarize
our detailed survey data on forward spending expectations (shown in Exhibit 9) simply in
terms of directional changes and in a way that allows a contiguous data series across
years. The indices are determined by a methodology similar to that used by the ISM
manufacturing indices, although our index is more forward-looking in that it gauges
forward-year spending expectations, as opposed to the ISM indices that gauge current
spending levels. Responses indicating spending growth in the coming year receive a
weighting of 1.0, responses of “no change” receive a weighting of 0.5, and responses
indicating declining spending receive a weighting of zero. Thus, an index value above 0.50
indicates expected spending growth, while a value below 0.50 indicates expected
contraction.
Early 2009 reading a similar portrait of contraction; capital budgets
remain more pressured
Although the October reading is still somewhat preliminary as most budgets are not
finalized until closer to year-end or even into the following year, our survey respondents’
early reading on 2009 spending shows an expectation of ongoing contraction in the year
ahead, with an outlook not much different than currently depressed views of spending
contraction to close 2008 (see Exhibit 9). Weighted-average 2009 total IT spending growth
expectations are also in negative territory, but about 100 basis points less severe than our
2008 readings, while weighted-average 2009 capital spending growth expectations are
about 40 bp lower than our 2008 reading. This could suggest that operational and service
cuts may moderate in 2009, while capital spending cuts are more likely to accelerate as
2009 budgets are put in place.

November 2, 2008
Goldman Sachs Global Investment Research 10
Exhibit 9: Early indications from our Survey panel on 2009 spending suggest ongoing contraction of a similar
magnitude to current activity Underlying detail on our spending indices
Total IT Spending
21%
12%
15%
24%
15%
6% 5%
12%14%
10%
35%
21%
7%
0%0%
5%
10%
15%
20%
25%
30%
35%
40%
More than10% lower
5-10% lower Down lessthan 5%
About thesame
Up less than5%
5-10%higher
More than10% higher
% o
f Res
pond
ents
2008 2009
IT Capital Spending
20%
11%
6%
34%
13%
8% 7%
17%
13% 13%
39%
13%
3% 4%
0%
5%
10%
15%
20%
25%
30%
35%
40%
45%
More than10% lower
5-10% lower Down lessthan 5%
About thesame
Up less than5%
5-10%higher
More than10% higher
% o
f Res
pond
ents
2008 2009
Source: Goldman Sachs IT Spending Survey.
Exhibit 10: What is your current expectation of US economic conditions in 2009 relative to
2008?
Oct-08 Oct-07 Oct-06Stronger 11% 18% 25%Weaker 56% 38% 29%About the same 33% 43% 46%
Source: Goldman Sachs IT Spending Survey.
Clearly, CIO views on the economy are driving their views on budget decisions.

November 2, 2008
Goldman Sachs Global Investment Research 11
Fourth quarter budget flush likely capped, as even 2008 budgets
come under the knife
Exhibit 11: How have your IT budget expectations for 2008 changed in the past three
months?
18%
10%
24%
39%
6%
2%
0% 5% 10% 15% 20% 25% 30% 35% 40% 45%
Down greater than 10%
Down 5-10%
Down 0-5%
Unchanged
Up 0-5%
Up 5-10%
% of respondents
Source: Goldman Sachs IT Spending Survey.
Exhibit 12: Which of the following best characterizes your spending intentions through
the end of the current calendar year?
Oct-08 Oct-07 Oct-06 Oct-05Our end-of-year IT spending activity will be similar to recent years 42% 57% 67% 55%Our end-of-year IT spending activity will be greater than recent years 17% 28% 24% 24%Our end-of-year IT spending activity will be less than recent years 41% 15% 9% 21%
Source: Goldman Sachs IT Spending Survey.
Volatile pricing index recovers somewhat but remains at depressed
levels
Our panel suggests pricing discounts remain fairly aggressive. Vendors seem to be
remaining flexible with respect to pricing in an effort to buoy demand in the current
environment (see Exhibit 13). In general, we believe that this favors larger solution
providers who can offer attractive pricing and payment terms on bundles of products
relative to smaller “best-of-breed” vendors who may lack similar flexibility. From an
investment perspective, we believe that this benefits companies such as Cisco, IBM,
and Oracle. Pricing is more likely to be an issue for more focused “best-of-breeds”
such as Aruba Networks, Lexmark, NetSuite, Network Appliance, Riverbed,
salesforce.com, and TIBCO.
52% of respondents have seen budgets decrease for 2008 in the past three months, likely dampening any sort of 4Q budget flush.
In addition, responses paint a tempered view directly on 4Q budget activity.

November 2, 2008
Goldman Sachs Global Investment Research 12
Exhibit 13: Our pricing index is based on respondents’ indications of increasing or
decreasing discounting by vendors to close business
-0.30
-0.25
-0.20
-0.15
-0.10
-0.05
0.00
0.05
0.10
Apr-04
Jun-04
Aug-04
Oct-04
Dec-04
Feb-05
Apr-05
Jun-05
Aug-05
Oct-05
Dec-05
Feb-06
Apr-06
Jun-06
Aug-06
Oct-06
Dec-06
Feb-07
Apr-07
Jun-07
Aug-07
Oct-07
Dec-07
Feb-08
Apr-08
Jun-08
Aug-08
Oct-08
Pric
ing
Inde
x
IT Pricing Index
Higher index value = firmer pricing, benefiting vendors
Lower index value = softer pricing / more discounting
Source: Goldman Sachs IT Spending Survey.
Segment focus: Professional services and hardware tend to be a top focus for spending cuts
We alternate how often we ask questions and hence the segment focus was not updated in
this current round of questions. However, to put the next section on vendor focus in
perspective we are reprising the data from our August survey on how each segment tends
to be viewed by our CIO population as they look for cost reduction (see Exhibit 14).
Exhibit 14: In terms of where your organization sees the greatest potential for cost
reduction in your IT organization, please specify the areas in which you expect to see the
greatest proportion of cost reduction over the next 12 months. Answer all that apply.
Aug-08 Jun-08 Apr-08 Feb-08
Third-party professional services 50% 42% 43% 48%
Computer hardware (PCs, servers, storage, etc.) 35% 47% 48% 53%
Software licensing 23% 21% 23% 22%
Communications and networking equipment 21% 24% 21% 18%
Internal staffing 15% 9% 12% 9%
Software maintenance 8% 10% 10% 0%
Source: Goldman Sachs IT Spending Survey.
• According to our survey, third-party professional services is the top area for
potential cost reduction looking forward. Fifty percent of our respondents indicated
third-party professional services as a top area for potential spending reduction,
Sitting at the lower end of recent years, our pricing index continues to indicate pricing pressure on vendors.

November 2, 2008
Goldman Sachs Global Investment Research 13
placing the category above the next most frequently indicated area – hardware. Our
anecdotal checks with CIOs also point to a slowing in new project deployments and a
strong preference for using internal staff where possible, rather than utilizing external
consultants. The IT Services portion of this survey digs into this in more depth.
• Computer hardware equipment remains close to the top of the list for cost
reduction, but pressure appears to be ameliorating. The proportion of respondents
indicating computer hardware as a focus area for near-term spending cuts declined
significantly from near 50% in prior readings to 35% in August. This could suggest that
much of the “fat” has already been cut over the past year or so, as virtualization
projects for example have lead to substantial increases in utilization rates for
hardware. Thus future spending reductions in hardware may be getting harder to
come by.
• Panel views on cutting potential for software licensing, networking equipment,
and software maintenance remain consistent with prior readings. Software
maintenance, in particular, remains relatively sheltered for now, although even here
we increasingly hear from CIOs trying to squeeze some savings from their vendors,
and in some cases consolidating spending to the bigger few in order to finally get off
maintenance contracts with smaller vendors that are less strategic.
Vendor focus: Who is gaining share of the shrinking budget?
Note: Our surveys of share changes for individual vendors have been somewhat
volatile in the past. These results are best read in the context of several surveys and
in conjunction with fundamental research.
Enterprise servers/systems: Dell and HP keep the top spots in
servers due to their PC server strength
Exhibit 15: Which enterprise servers/systems providers are gaining or losing share of your
IT spending dollars?
Gaining Losing 1. Dell 1. Sun Microsystems 2. Hewlett-Packard 2. IBM
Source: Goldman Sachs IT Spending Survey.
Dell and HP remain the top two share gainers in servers again this survey, with Dell taking
the #1 spot from HP this time around, receiving positive responses from 38% of the survey
respondents versus 33% for HP (see Exhibit 15). Our checks and the company’s recent
results suggest that Dell’s strength in this space is coming from more aggressive pricing
(Dell’s units were up 19% in its July quarter versus revenue growth of only 5%) and its re-
entrance into the blade server market. HP’s second-place ranking highlights its ongoing
strength in blades, where it holds a market share lead, and higher-end PC servers.
However, HP’s strength in PC servers is somewhat offset by its declining UNIX presence.
IBM moved from a share gainer in the last survey to a share loser this time around as the
company’s relative strength in its System z (mainframe) and converged System p/i (Unix)
platforms, both of which are in the middle of new product cycles, is being overshadowed
by weakness in its System x (PC) servers, which were down 18% yoy in the recently-

November 2, 2008
Goldman Sachs Global Investment Research 14
reported September quarter. Consistent with Sun’s June and September quarter results,
when it saw yoy revenue declines in systems, Sun continues to see the most share erosion,
with only 12% of the responses in the survey coming in positive versus 36% negative –
slightly worse than the split in our prior survey.
PCs: HP’s share gain in the corporate PC market continues
Exhibit 16: Which PC providers are gaining or losing share of your IT spending dollars?
Gaining Losing 1. Apple 1. Gateway 2. Hewlett-Packard 3. Lenovo
Source: Goldman Sachs IT Spending Survey.
Our latest survey indicates that Hewlett-Packard continues to gain share in the enterprise
PC segment, benefiting from its focus on notebooks and ongoing sales force expansion.
According to IDC, HP has been gradually expanding its presence in the enterprise PC
segment, with its share growing from 24% in the beginning of 2007 to 25.3% last quarter,
and the survey results suggest that HP’s strength in this segment will likely continue.
Apple emerges as a share gainer for the sixth time in a row in this survey, as the company
continues to gain traction outside of its core customers (consumer, design and music
professionals). Although its presence in the enterprise PC segment remains relatively
small compared to other segments for Apple (about 0.4% market share and about 1% of
total Mac units shipped, per IDC), the survey results reflect the positive momentum behind
Mac adoption, even in the enterprise segment. Gateway continues to show up as a share
loser, as the value of its brand continues to deteriorate and uncertainty around its
competitiveness vs. HP and Dell persists even after being acquired by Acer.
Storage: Independents – EMC and NetApp – continue to take share in
the storage market
Exhibit 17: Which storage providers are gaining or losing share of your IT spending
dollars?
Gaining Losing 1. EMC 1. IBM 2. NetApp 2. Sun Microsystems 3. Hewlett-Packard
Source: Goldman Sachs IT Spending Survey.
In our latest survey, EMC is once again the strongest share gainer in the storage space.
We think EMC will retain its leading position and continue to gain share at least over the
intermediate term as the breadth of its hardware, software, and service offerings,
augmented by a recently-launched midrange Clariion product cycle, should enable the
company to deepen its relationships with existing customers and expand into new markets.
At the same time, we expect EMC to work more closely with VMware (its server
virtualization subsidiary), providing more opportunities to deploy its storage solutions in
virtualized environments. NetApp also gained share in this survey, highlighting the strong

November 2, 2008
Goldman Sachs Global Investment Research 15
market position of storage specialists vis-à-vis the broadline hardware vendors.
Specifically, IBM led on the downside among the respondents of this survey, which is
consistent with the company’s September quarter results when storage revenue declined -
3% yoy. Moreover, Sun, which saw overall storage revenue mostly flat in the September
quarter, also lost share in this round. HP, yet another integrated hardware vendor, rounds
out the vendors that lost share in the quarter.
Software and security: VMware once again in “pole position”;
Microsoft shifts into top 3
Exhibit 18: Which software providers are gaining or losing share of your IT spending
dollars?
Gaining Losing 1. VMware 1. Novell 2. Red Hat 2. Informatica 3. Microsoft 3. TIBCO 4. Citrix 4. CA 5. Cisco Software/Security 5. IBM Software 6. EMC Software (ex-VMware) 7. CommVault 8. Adobe 9. Oracle
Source: Goldman Sachs IT Spending Survey.
Consistent share gainers from prior surveys in software and security include VMware,
Cisco, Citrix, CommVault, EMC, Red Hat, and Oracle; falling out of the top group were
both SAP and HP. Microsoft showed the greatest increase, moving into the top group in a
number three position, and Adobe is also a new showing.
VMware’s incumbent position at the top of the rankings demonstrates that server
virtualization momentum remains alive and well with a strong ROI case for a declining
budget environment. Red Hat continues near the top of the group, underscoring a still-
strong interest in Linux adoption; our latest checks have also indicated mounting traction
for JBoss offerings in the middleware space, particularly in a environment were a lower
priced offering may be even more attractive.
Microsoft’s shift into the top group is likely to be a result of a number of its enterprise
product upgrades, such as SQL Server (Microsoft’s enterprise database) and the ongoing
traction of SharePoint Server (see Exhibit 26 for additional color). In addition, the Office
suite was stronger than expected in the September quarter; however, we remain mindful
of the exposure to the small-to-mid sized enterprise and remain muted in our expectations
for this area of Microsoft’s business.
Oracle’s positioning is representative of a consolidator that remains a clear aggressor in
cross selling to its customer base, while SAP’s slip from the top is consistent with its
disappointing 3Q results and the ongoing pressures on a vendor clearly oriented to new
application deployments, nad hence are more at risk as spending slows. We see Citrix’s
ongoing strong results as also validating the virtualization theme where Citrix is viewed as
a leader, and also a good sign for the core XenApp franchise, where our checks suggest
demand remains healthy owing to the good ROI case for remote access, centralized
management, and lowered security issues.

November 2, 2008
Goldman Sachs Global Investment Research 16
Informatica remained in the negative column after first appearing there two surveys back.
This is likely a testament to a tougher IT spending environment, with customers preferring
solutions offered from their current (mostly larger) vendors and/or simply “making do”
with solutions they have already, and in this case, primarily internally developed. In
addition, weakness in the applications area will have a second derivative impact on
Informatica if it persists. For CA, our checks suggest improving operations and execution,
although changes to customer sentiment may be longer in coming, hence the low survey
ranking. Our latest market readings suggest a solid mainframe ecosystem that should
continue to benefit mainframe management vendors near term.
IBM Software shifted into the losing group for the first time in our survey’s history.
Results and anecdotal feedback suggest that product sets have lagged and this is now
beginning to show in customer purchasing decisions. TIBCO re-appeared in the negative
column. Although TIBCO remains a good franchise with strong technology, we believe that
slow environments are particularly challenging for best-of-breeds.
Communications equipment: Continued evidence of consolidation
in spending around the largest vendors such as Cisco and Juniper
during the downturn
Exhibit 19: Which communications equipment providers are gaining or losing share of
your IT spending dollars?
Gaining Losing 1. Cisco 1. Netgear 2. Juniper
Source: Goldman Sachs IT Spending Survey.
We asked respondents to mark which networking equipment vendors are gaining, seeing
no change, or losing share of their IT spending dollars among a long list that included
Cisco, Juniper, HP, Nortel, 3Com, Foundry, Extreme, Force10, F5 Networks, Riverbed,
Aruba, and Netgear. The vast majority of respondents (over 70%) marked N/A for most of
the smaller vendors, including Nortel, 3Com, Foundry, Extreme, Force10, Riverbed, and
Aruba, suggesting that these smaller vendors are seeing very limited traction or still have
low penetration of the customer base. This is not surprising, given Cisco’s solid lead in the
enterprise networking market, with over 80% share of enterprise routers and over 70%
share of switches.
The only vendors that received a meaningful number of responses (30% or higher)
included Cisco, Juniper, HP, F5 Networks, and Netgear. Of those, Cisco was by far the
strongest share gainer, with a plurality of respondents noting that Cisco is gaining share of
their IT dollars, a smaller number indicating no change, and a minority showing share loss.
These results show that Cisco continues to gain market share from its smaller competitors,
as CIOs consolidate their spending around the large incumbent vendors during the
downturn. Juniper also had more respondents indicating share gains than share losses,
though the majority of respondents indicated no change. The results were more balanced
for HP and F5 Networks among the gainers and losers, with a large majority indicating no
change. Finally, Netgear was the only company in our survey with a meaningful number of
respondents where those indicating loss of share exceeded those indicating gains. We
believe this could be due to share loss in the mid-range SMB switch segment (perhaps to
HP) as Netgear has recently been more focused on the low-end switch market which may
not be captured by this survey.

November 2, 2008
Goldman Sachs Global Investment Research 17
Sub-sector focus: Hardware
iPhone continues to see solid support in the enterprise space
Exhibit 20: Do you expect to roll out Apple's iPhone as a supported platform over the next
12 months?
Oct-08 Aug-08 Jun-08
Yes / Currently use 20% 23% 17%
No 78% 76% 83%
Maybe 2% 1% 0%
Source: Goldman Sachs IT Spending Survey.
The percentage of our survey respondents who expect to support the iPhone 3G within the
next year remains at 20% in our latest survey, although this level ticked down slightly from
the August results. With our survey panel coming from a controlled group of 100 IT
executives from Fortune 1000 companies across tech’s various key verticals, including
financial services, manufacturing, technology, and retail, we view 20% as a strong result
for the iPhone 3G. Our main thesis on iPhone is that Apple's software (operating system
and software developer platform) is the biggest advantage for iPhone versus other
smartphone competitors and, as Apple’s iPhone Software 2.0 (which includes Microsoft
Exchange ActiveSync support, additional security features, and push e-mail, calendar, and
contacts) becomes more mature, we would expect more commercial customers to
consider the iPhone. We recently raised our 2009 iPhone unit forecast to 22.5 million, and
with incremental demand from enterprise customers, we think the bias remains to the
upside. Although Apple continues to score well in our survey as a PC share gainer, the
20% of the companies represented in our survey that expect to deploy the iPhone 3G is
significantly higher than Apple’s Mac position in the enterprise, which has remained below
1% over the past few years despite Apple’s increased acceptance among SMBs and
consumers.
Analysis by Goldman Sachs’ Hardware Research Team, led by David Bailey, Min Park, and Hongyu Cai.

November 2, 2008
Goldman Sachs Global Investment Research 18
Tighter budgets are likely to accelerate the adoption of server
virtualization
Exhibit 21: What percentage of your PC servers use server virtualization software today?
What percentage of your PC servers will use server virtualization software 12 months
from now?
61%
31%
6%
1% 1%
29%
19% 17% 16%19%
0%
10%
20%
30%
40%
50%
60%
70%
Less than 15% 15-30% 31-45% 46-60% 61-75%
% o
f res
pond
ents
Today In 12 months
Weighted average:Current: 15.2%In 12 months: 34.3%
Source: Goldman Sachs IT Spending Survey.
In a relatively short 12-month period, our survey respondents expect to dramatically
increase the percentage of their PC servers that are virtualized. On a weighted average
basis, 34% of PC servers should be virtualized a year from now, more than double the 15%
that are virtualized today. More striking, 45% of our respondents expect to virtualize over
30% of their servers, up from just 7% today, suggesting a much more aggressive
penetration of virtualization compared to what we have seen to date. Our sense is that
total cost of ownership (TCO) reductions will be a key driver of the acceleration in server
virtualization deployments as CIOs are forced to cut capital spending and reign in
management, administrative, and power/cooling costs. In our VMware initiation (“Still the
aggressor, but slowing growth & valuation a drag”; published August 11, 2008), our base-
case analysis showed a 30% reduction in TCO, while a higher compression ratio of
physical to virtual servers would allow the savings to increase to 45%-50%. Avoidance of
PC server purchases is the largest source of savings, followed by reduced management
and support costs which more than offset the incremental investment in the server
virtualization software/support itself and storage.

November 2, 2008
Goldman Sachs Global Investment Research 19
Despite the emergence of new competition, VMware should
maintain a large lead over the next two years
Exhibit 22: Who do you currently view as your primary server virtualization providers /
enablers? What do you expect 2 years from now?
82
13
50 1 1 3
79
16 15
2 1 1 3
0
10
20
30
40
50
60
70
80
90
VMware Citrix(XenSource)
Microsoft Oracle Sun Red Hat Incumbentsystems
managementprovider
# of
resp
onde
nts
Current In 2 years
Source: Goldman Sachs IT Spending Survey.
VMware should continue to dominate the market for server virtualization software over the
next two years, with 79 of our respondents selecting the company as their primary
provider in this high-priority segment, roughly the same number as today. Our checks
continue to be overwhelmingly positive for VMware from both a product and support point
of view. While Microsoft and Citrix have become more competitive in the hypervisor
space, VMware’s suite of advanced management tools and its large number of third-party
software partners set it apart from the competition. At the same time, it appears that
customers will begin to add additional server virtualization solutions into their
environments, with both Citrix and, more dramatically, Microsoft gaining share. In the
next two years, just over 30% of our survey respondents expect to deploy server
virtualization from Citrix and Microsoft, up from 18% today.

November 2, 2008
Goldman Sachs Global Investment Research 20
EMC and IBM remain best positioned among storage vendors to
benefit from server virtualization
Exhibit 23: What is your storage vendor of choice in virtualized server environments?
Oct-08 Aug-08 Jun-08
EMC 36% 42% 40%
IBM 16% 22% 25%
Dell 16% 7% 9%
Hitachi 9% 9% 8%
NetApp 9% 6% 8%
Hewlett-Packard 8% 13% 7%
EqualLogic/Dell 5% 2% 4%
Sun Microsystems 2% 1% 3%
Compellent 1% -- 1%
Source: Goldman Sachs IT Spending Survey.
Our survey results indicate that EMC is still the dominant storage vendor in virtualized
environments although Dell, NetApp, and EqualLogic all saw better results from our panel
in this survey by comparison with previous surveys. Similar to our prior results and
consistent with our checks with storage end users, 36% of the respondents chose EMC as
the preferred storage vendor in virtualized server environments (down slightly from our
August survey), while IBM remained a solid second at 16%. Dell and EqualLogic both
moved up nicely in the latest survey, with Dell moving to 16% from 7% and EqualLogic
moving to 5% from 2% in the latest survey. At the same time, Sun continues to lag behind
other vendors as its storage offerings remain well behind the leaders.

November 2, 2008
Goldman Sachs Global Investment Research 21
Sub-sector focus: Software
Software spending weakened; now in-line with overall budget
expectations
Exhibit 24: In terms of your overall software spending, what do you expect to be the most
likely scenario over the next 12 months?
5%
23%
34%
16%
22%
14%
26%
33%
12%
15%
0% 5% 10% 15% 20% 25% 30% 35% 40%
Up more than 10%
Up 1 to 10%
Same / flat
Down 1 to 10%
Down more than 10%
% of respondents
Oct-08 Aug-08
Source: Goldman Sachs IT Spending Survey.
We are beginning a bi-monthly tracker for software spending. In this second installment,
28% of our respondents are expecting increased software spending over the next year,
well down from the 40% reading in the last survey. This compares to 38% expecting a
decrease, up from 27% in our last survey. Clearly shifting lower, software now ranks about
in line with the overall expectations for IT spending in 2009. However, the change in
sentiment from the last survey is worrying, and suggests that even with the stickiness of
elements such as maintenance and support requirements, software will be cut as budgets
are cut.
Analysis by Goldman Sachs’ Software Research Team, led by Sarah Friar, Sasa Zorovic, and Derek Bingham.

November 2, 2008
Goldman Sachs Global Investment Research 22
Microsoft stronger than overall expectations; new product cycles
likely helping
Exhibit 25: In terms of your level of spending with Microsoft, what do you expect to be
the most likely scenario over the next 12 months?
Up 21 to 50% 3%
Up 11 to 20% 5%
Up 1 to 10% 33%
Same / flat 37%
Down 1 to 10% 5%
Down 11 to 20% 13%
Down 21 to 50% 5%
Source: Goldman Sachs IT Spending Survey.
Among applicable respondents, 41% indicate an expectation of spending growth with
Microsoft over the coming year vs. 23% indicating contraction, a somewhat stronger ratio
of increases to decreases than for software spending as a whole (in the prior exhibit). This
is consistent Microsoft’s lift in the overall software share gainers and laggards. Overall,
we would expect Microsoft to continue to consolidate share, and upgrade cycles such as
Windows Server 2008, SQL Server, and traction with SharePoint Server should continue to
provide momentum to the company’s Server and Tools division – the key area we think
CIOs are responding to in the survey. See Exhibit 26.
Exhibit 26: In the next twelve months, please indicate how you expect your spending will
change for the following Microsoft products, if applicable.
0% 10% 20% 30% 40% 50% 60% 70% 80% 90% 100%
Forefront Security Offerings
System Center (managementofferings)
Search
Exchange Server
Dynamics Apps (including CRM)
Office
Vista
Communications Server
SharePoint Server
Windows Server (including Hyper-V)
SQL Server
Increase No Change Reduce
Source: Goldman Sachs IT Spending Survey.

November 2, 2008
Goldman Sachs Global Investment Research 23
Sub-sector focus: Services
Demand for discretionary IT projects deteriorates to worst levels
tracked
Exhibit 27: In the next six months, how do you think your budgets for discretionary IT
projects that require services from systems integrators, application developers, or other IT
consulting companies, including offshore service providers, will trend?
Not applicable
Up
Down
No change
0%
5%
10%
15%
20%
25%
30%
35%
40%
45%
50%D
ec-0
6
Jan-
07
Feb-
07
Mar
-07
Apr
-07
May
-07
Jun-
07
Jul-0
7
Aug
-07
Sep-
07
Oct
-07
Nov
-07
Dec
-07
Jan-
08
Feb-
08
Mar
-08
Apr
-08
May
-08
Jun-
08
Jul-0
8
Aug
-08
Sep-
08
Oct
-08
Up Down No change Not applicable
Source: Goldman Sachs IT Spending Survey.
Consistent with other leading indicators and macro data points, the survey results
reinforce our guarded stance on discretionary IT spending and budget trends into
2009. Specifically, we believe that a protracted decline in discretionary IT projects
remains a risk for systems integrators, applications developers, and other IT
consulting companies, including offshore service providers on the non-maintenance
components of their revenue streams.
Demand for discretionary services marks a new low point. Since the end of December
2007, we have noted a steady decline in the responses for discretionary IT budgets. This
month’s survey results mark a continuation of this trend to new trough levels, indicating
that demand for discretionary services deteriorated further since the previous survey.
Specifically, the percentage of respondents indicating that budgets will trend up over the
next six months declined sharply to 12% vs. 23% from last survey’s results; this marks the
lowest level recorded in the history of our survey results. On the other hand, the
percentage of respondents indicating that budgets will trend down finished at 49%, which
marks the highest level recorded. More over, on a combined basis the total number of
respondents indicating no change or a down trend on budgets also fell sharply from 53%
Analysis by Goldman Sachs’ IT Services Research Team, led by Julio Quinteros.

November 2, 2008
Goldman Sachs Global Investment Research 24
in the previous survey to 35%, a level that is almost 50% less than the average results of
67% noted in the previous 8 surveys.
Although the survey data collected this time around look rather stark relative to historical
levels, we also acknowledge that they have been inconsistent with the sustained bookings
momentum and revenue growth reported through the September quarter as these results
have finished relatively in line with expectations. We attribute this to the fact that IT
services companies are a lagging indicator and therefore the weakness being captured in
our survey results has yet to get reflected in reported results. In addition, relative to the
last downturn, we believe that the resiliency in reported results so far is in part due to
increased revenue diversification from the perspective of services, vertical and geographic
mix. In addition, many of our companies appear much more in tune and capable of
delivering cost relief, lower cost labor, and other costs rationalization services.
From a sector perspective, in addition to our survey data, we continue to monitor various
leading indicators that we believe are relevant in identifying the pace of the expected
downturn. In particular, we believe that lower headcount growth, reduced hiring targets,
and reduced pricing leverage continue to warrant attention and some caution. In addition,
we believe that any further deterioration in enterprise software spending could further
come home to roost on the growth prospects of the sector.
Near-term risk increases for on-site third-party providers, offshore
remains relatively more insulated but not immune
Exhibit 28: Assuming a cost-constrained or tightening IT budget scenario, in which area of
IT service delivery resources would you look to cut first for application-related
development or maintenance work?
Oct-08 Aug-08 Jun-08 Apr-08 Feb-08
Augmented IT staff providers (e.g., short-
term staffing) 38% 52% 48% 31% 39%
On-site third-party service providers (e.g.,
Accenture, BearingPoint, IBM Services,
etc.) 40% 25% 30% 35% 41%
Offshore third-party service providers (e.g.,
Cognizant) 14% 14% 12% 19% 13%
In-house IT programming staff (e.g.,
internal employees, etc.) 8% 8% 11% 15% 8%
Source: Goldman Sachs IT Spending Survey.
Our data continue to suggest that offshore third-party service providers are relatively
more insulated versus their on-site peers in a cutting scenario. Results from this survey
continue to suggest that, in a cost-constrained IT budget scenario, CIOs will most likely
look to cut their resources first from on-site third-party service providers, followed by
augmented IT staff providers for application-related development or maintenance work.
On a relative basis, offshore and in-house remain more insulated.
At 40%, the risk for on-site third-party service providers providing application-related
development or maintenance work appears to have increased and now represents the first
in-line of service providers expected to be cut. At 14%, we view the relative insulation of
the offshore companies as a direct reflection of the lower cost basis provided and
recurring nature of the application maintenance/outsourcing work provided. However, we
November 2, 2008
Goldman Sachs Global Investment Research 25
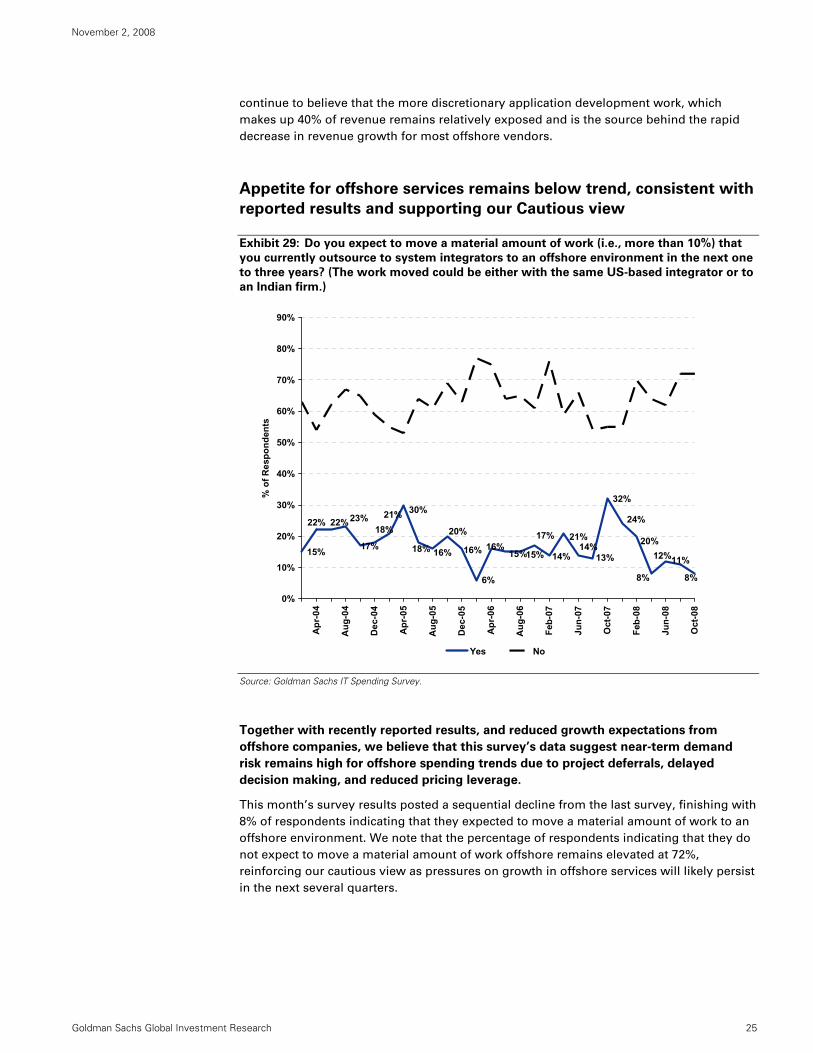
continue to believe that the more discretionary application development work, which
makes up 40% of revenue remains relatively exposed and is the source behind the rapid
decrease in revenue growth for most offshore vendors.
Appetite for offshore services remains below trend, consistent with
reported results and supporting our Cautious view
Exhibit 29: Do you expect to move a material amount of work (i.e., more than 10%) that
you currently outsource to system integrators to an offshore environment in the next one
to three years? (The work moved could be either with the same US-based integrator or to
an Indian firm.)
32%
6%
15% 15%15%
20%
16%
21%23%22%22%
20%
8%
16% 16%21%
24%
18%
30%
18%
17%12%
8%
11%13%14%
17%
14%
0%
10%
20%
30%
40%
50%
60%
70%
80%
90%
Oct
-08
Jun-
08
Feb-
08
Oct
-07
Jun-
07
Feb-
07
Aug
-06
Apr
-06
Dec
-05
Aug
-05
Apr
-05
Dec
-04
Aug
-04
Apr
-04
% o
f Res
pond
ents
Yes No
Source: Goldman Sachs IT Spending Survey.
Together with recently reported results, and reduced growth expectations from
offshore companies, we believe that this survey’s data suggest near-term demand
risk remains high for offshore spending trends due to project deferrals, delayed
decision making, and reduced pricing leverage.
This month’s survey results posted a sequential decline from the last survey, finishing with
8% of respondents indicating that they expected to move a material amount of work to an
offshore environment. We note that the percentage of respondents indicating that they do
not expect to move a material amount of work offshore remains elevated at 72%,
reinforcing our cautious view as pressures on growth in offshore services will likely persist
in the next several quarters.

November 2, 2008
Goldman Sachs Global Investment Research 26
Appetite for new offshore services posts a modest decline, an
indication of waning penetration opportunity for offshore services
Exhibit 30: Recently, offshore companies have become more aggressive in marketing
their capabilities in new areas such as infrastructure management, software R&D,
business process outsourcing, and consulting. In the next 12 months, are you likely to
consider offshore delivery for IT services outside of traditional application maintenance
and development?
15%
24%26%
20%21%
33%
17%22%
24%22%
25%30%
27%24%
38%
28%24%
26%
0%
10%
20%
30%
40%
50%
60%
70%
80%
90%
Oct
-08
Aug
-08
Jun-
08
Apr
-08
Feb-
08
Dec
-07
Oct
-07
Aug
-07
Jun-
07
Apr
-07
Feb-
07
Dec
-06
Aug
-06
Jun-
06
Apr
-06
Feb-
06
Dec
-05
Oct
-05
% o
f Res
pond
ents
Will consider
Will not consider
Source: Goldman Sachs IT Spending Survey.
Consistent with our previous commentary, the adoption of newer services remains key to
the long-term growth profile of offshore services, as over time the continued penetration
of these services and the relatively faster growth rates should help offset the more mature
and now slower-growing areas in application maintenance and outsourcing. In most cases,
these services are still growing more than the traditional application maintenance and
development work and collectively remain an important source of long-term growth
opportunity.
The percentage of respondents indicating that they would consider offshore delivery
for IT services outside of traditional application maintenance and development
finished at 22%, down modestly from 24% in the previous survey, but above the
trough levels noted in April and June. The percentage of respondents indicating that
they will not consider new offshore services finished at 53%, about flat from 54% noted in
the previous survey. Finally, the percentage of Unsure/Not applicable responses increased
from the previous survey and remains elevated at 25% (versus an average of about 15% in
our previous surveys), suggesting heightened uncertainty and stagnation of near-term
spending plans.

November 2, 2008
Goldman Sachs Global Investment Research 27
Sub-sector focus: Networking
Network equipment spending resumed its downward trend in
October following the rebound in August
Exhibit 31: In terms of your overall network equipment spending, what do you expect to
be the most likely scenario over the next 12 months?
0%
10%
20%
30%
40%
50%
60%
70%
80%
Dec-03
Feb-04
Apr-04
Jun-04
Aug-04
Oct-04
Dec-04
Feb-05
Apr-05
Jun-05
Aug-05
Oct-05
Dec-05
Feb-06
Apr-06
Jun-06
Aug-06
Jan-07
Feb-07
Apr-07
June-0
7
Aug-07
Oct-07
Dec-07
Feb-08
Apr-08
Jun-08
Aug-08
Oct-08
% o
f Res
pond
ents
Down
Up
Flat
Unsure
Source: Goldman Sachs IT Spending Survey.
As in past surveys, we asked our respondents about their plans for overall network
equipment spending over the next 12 months. The responses reflect a deteriorating
environment, with a meaningful drop in the percentage of respondents who expect their
spending to increase from 53% in August to 48% in October. In addition, the percentage of
respondents who expect their spending to decline increased from 13% to 19%. The
findings from the survey are consistent with our belief that given the increased probability
that we are now in a recession, overall network spending will likely decline in the United
States over the next several quarters. The findings are consistent with our below-
consensus estimates for companies in our coverage with significant enterprise networking
exposure, such as Cisco, Juniper, Riverbed, and Aruba Networks. We recommend that
investors remain on the sidelines for all these stocks except for Cisco, where we believe
the impact to estimates will be partially muted by the company’s continued share gains, as
CIOs continue to consolidate their spending around their largest, and most strategic
vendors.
Analysis by Goldman Sachs’ Networking Research Team, led by Simona Jankowski and Thomas Lee.

November 2, 2008
Goldman Sachs Global Investment Research 28
Spending on Cisco products also impacted, but shows some
resilience
Exhibit 32: In terms of your level of spending on Cisco products, what do you expect to be
the most likely scenario over the next 12 months?
0%
10%
20%
30%
40%
50%
60%
70%
80%
Dec-03
Feb-04
Apr-04
Jun-04
Aug-04
Oct-04
Dec-04
Feb-05
Apr-05
Jun-05
Aug-05
Oct-05
Dec-05
Feb-06
Apr-06
Jun-06
Aug-06
Jan-07
Feb-07
Apr-07
June-0
7
Aug-07
Oct-07
Dec-07
Feb-08
Apr-08
Jun-08
Aug-08
Oct-08
% o
f Res
pond
ents
Down
Up
Flat
Unsure
Source: Goldman Sachs IT Spending Survey.
Similar to the overall network equipment spending trends, our respondents’ outlook for
spending on Cisco products also deteriorated. In the October reading, 48% of respondents
expect to increase spending on Cisco products in the next 12 months, down from 53% in
August. Moreover, the number of respondents who expect to reduce their spending on
Cisco grew from 11% to 20%, the highest reading in over four years. On balance, the
results show some level of resilience, as the number of respondents who expect to
increase their spending remains fairly close to the 50-70% range that we consider healthy,
and within the range of the prior readings in 2008.
Historically, our survey results have been relatively well correlated to Cisco’s out-quarter
guidance and qualitative comments on the call. Therefore, we view the results as
consistent with our below-consensus estimates for Cisco, and expect them to be reflected
in lower guidance for the January quarter. In particular, we expect Cisco to guide for
2QFY09 (January) yoy sales growth in the 3% range, well below the consensus estimate of
7% and Cisco’s guidance of 8.5%. We also remain comfortable with our full year FY2009
(July) sales growth estimate of 3%, well below consensus of 8%.
That said, we maintain our CL-Buy rating on Cisco, as we see compelling value in the stock
at 13.7X our below-consensus CY2009 GAAP EPS estimate. We believe Cisco will remain
one of the strongest franchises in the Technology sector long term given its solid
execution in a number of markets that benefit from favorable secular tailwinds. Moreover,
while we expect estimates to continue to come down, we believe the company has more
of a cushion than most of its peers, given Cisco’s conservative guidance and market share
gains through the downturn.

November 2, 2008
Goldman Sachs Global Investment Research 29
Incrementally negative for RIM: Interest in Microsoft-based devices
accelerating with iPhone steadily improving
We asked our respondents about their plans to deploy wireless email devices over the next
12 months. The October results were incrementally negative for RIM on three fronts.
• Interest in BlackBerry only deployments decreased significantly since August. The
percentage of respondents expecting to offer only BlackBerry devices to their
employee base declined significantly to 32% from 44% in August.
• Interest in Microsoft-enabled devices increased significantly since August. The
percentage of respondents who are currently using BlackBerry devices but will also
enable Microsoft-based devices increased considerably to 26% from 16% in August.
These results are consistent with our checks that an increasing number of enterprises
are looking at Microsoft as a potential second source of their wireless email
deployment, due to their desire to diversify their wireless e-mail supplier base.
Additionally, with a number of key smartphone vendors adopting Microsoft as their
business OS (HTC, Motorola, Palm), we believe lower smartphone ASPs (driven by a
wider availability of devices) could be another reason why enterprises are taking a
greater interest in Microsoft-enabled devices.
• iPhone adoption continues to gain traction. Interest in the Apple iPhone continued
to increase as 10% of our respondents said they will enable iPhone devices alongside
BlackBerry compared to 8% in August and 4% in June. This is also consistent with our
anecdotal checks which reveal that some enterprises may be looking to enable the
iPhone as part of their wireless device fleets.
Lastly, unlike the last few surveys, we saw a much greater number of respondents that
were NA/Unsure (10% vs 0% in August/June) about their plans for email device
deployment over the next 12 months. We believe this is likely attributed to the level of
uncertainty that CIOs have about their current IT budgets given the present macro
environment. CIOs may look curtail spending on new wireless email devices by either
lengthening the replacement cycle and/or delaying purchases for new wireless email
devices.
While the IT survey results have negative implications for RIM’s enterprise business, we
continue to believe that RIM will still maintain a strong position in this segment though it
may cede some of its dominant share in North America to Microsoft-based devices and the
iPhone over the next few years. We believe the decrease in share will more than likely be
offset by an overall increase in penetration of wireless e-mail in enterprises, which
currently stands at only 5% of a base of 600 million enterprise e-mail accounts. As the
overall market penetration expands, in particular outside North America, we expect RIM
will continue to benefit from strong growth in that segment despite having to share some
of the incremental market growth with Microsoft/Apple.

November 2, 2008
Goldman Sachs Global Investment Research 30
Exhibit 33: What wireless email devices do you plan to deploy over the next 12 months?
0%
4%
8%
3%
6%
6%
4%
23%
46%
0%
5%
10%
5%
6%
6%
8%
16%
44%
10%
2%
6%
2%
5%
7%
10%
26%
32%
0% 5% 10% 15% 20% 25% 30% 35% 40% 45% 50%
NA/Unsure
We do not plan to deploy anywireless email devices over the next
12 months
We currently use a combination ofdevices
We currently use Microsoft-baseddevices but will also enable iPhone
We currently use Microsoft-baseddevices but will also enable
BlackBerry
Microsoft-based devices only
We currently use BlackBerry but willalso enable iPhone
We currently use BlackBerry but willalso enable Microsoft-based devices
BlackBerry only
% of total responses
June August October
Source: Goldman Sachs IT Spending Survey.
Enterprise outlook for RIM remains weak
We asked our respondents about their plans to increase their BlackBerry subscriber base
over the next six months. The survey results suggest a negative outlook, as 16% of our
respondents (versus 25% in the August survey) expect their subscriber base to grow
double digits over the next six months. The distribution of responses within that
percentage continues to be unfavorable, with 0% of subscribers (down from 1% in August
and 6% in June) expecting to increase their subscriber base by over 26%. We believe our
November quarter estimates are inline with the survey results as we are forecasting RIM’s
enterprise subscribers to grow only 1% qoq, compared to 8% in the August quarter.
Similar to the above question, we believe the current macro headwinds are causing
increased uncertainty with CIOs, as 3% of respondents were unsure about their 6-month
outlook, compared to 0% in the prior three readings.

November 2, 2008
Goldman Sachs Global Investment Research 31
Exhibit 34: If applicable, by what percentage will you increase your Blackberry subscriber
base in the next 6 months?
0%
25%
0%
0%
0%
0%
16%
59%
0%
18%
3%
0%
3%
3%
20%
53%
0%
22%
0%
1%
0%
0%
24%
53%
3%
26%
1%
0%
0%
0%
16%
54%
0% 10% 20% 30% 40% 50% 60% 70%
NA/Unsure
0% - Do not use BlackBerry
Decrease
Greater than 75%
51% to 75%
26% to 50%
11% to 25%
1% to 10%
% of total responses
April June August October
Only 16% of respondents expect double digit growth
(25% in August)
Source: Goldman Sachs IT Spending Survey.
We also asked our respondents about their plans to upgrade devices for their current
BlackBerry subscriber base over the next six months. The survey results for replacement
sales were not quite as negative as the new subscriber results. While only 44% of
respondents (versus 51% in August) plan to upgrade BlackBerry devices of just 1-10% of
their users, 33% of respondents (versus 30% in August) expect to upgrade a double-digit
percentage of their users.
In our own estimates, we have assumed a slightly higher replacement rate as a percentage
of total subscribers in the November quarter relative to May, which is driven mostly by an
increase in consumer upgrades as early Pearl users begin to roll off their two-year
contracts. In our view, the uncertain macro environment will likely reduce enterprise
spending on device upgrades, lengthening the replacement cycle. Therefore, we believe
replacement demand will likely be driven more by consumer subscribers, as RIM expands
its consumer offering with devices such as the BlackBerry Pearl Flip and Storm (its new
touch screen smartphone).
The bottom line is that our latest survey’s results reinforce our confidence in our below-
consensus estimates for RIM. Our FY2010 (February) EPS estimate of $3.62 is 23% below
consensus of $4.73, on lower revenues driven by fewer new subscribers and a longer
replacement cycle, as well as over 200 bp in margin compression. However, we believe
RIM’s valuation more than reflects the risk to Street estimates, at 13X our own below-
consensus EPS and 11X the consensus estimate. We view these multiples as greatly
undervaluing RIM’s earnings potential, as we estimate a long-term annual EPS growth rate
in the high teens, driven by continued share gains in the fast-growing smartphone market,
partly offset by margin compression. Therefore, we maintain our Buy rating on the stock.

November 2, 2008
Goldman Sachs Global Investment Research 32
Exhibit 35: If applicable, what percentage of your Blackberry installed base will get a
device upgrade in the next 6 months?
23%
0%
0%
0%
6%
25%
46%
19%
2%
3%
5%
9%
19%
43%
19%
0%
0%
2%
6%
22%
51%
23%
0%
0%
3%
9%
21%
44%
0% 10% 20% 30% 40% 50% 60%
0% - Do not use BlackBerry
Only Pay For Service, NotDevices
Greater than 75%
51% to 75%
26% to 50%
11% to 25%
1% to 10%
% of total responses
April June August October
Source: Goldman Sachs IT Spending Survey.
Respondent overview
This is the 43rd issue of our IT Spending Survey series, conducted in mid-October 2008.
Our survey panel comprises a controlled group of 100 IT executives from Fortune 1000
companies. The current survey results reflect the following:
Exhibit 36: Respondent demographics
By title: By company revenues: By number of employees worldwide:CIO 56% Over $10 billion 20% Over 100,000 10%Director of MIS/IT 20% $1-$10 billion 31% 50,000 to 100,000 15%Vice President of IT/IS 18% $500 million-$1 billion 32% 10,000 to 50,000 23%IT Manager 2% $0-$500 million 16% 5,000 to 10,000 36%CTO 2% Less than 5,000 15%Other 2%
Source: Goldman Sachs IT Spending Survey.
In terms of industry breakdown for the surveyed companies, our goal is to roughly
mirror our estimate of vertical end-market demand for information technology.

November 2, 2008
Goldman Sachs Global Investment Research 33
Exhibit 37: Respondents by vertical industry vs. our estimates of end-demand share
Survey breakdown
Normalized end-market demand
Financial services 18% 21%Communications 4% 16%Manufacturing 18% 14%Government 4% 11%Business services 13% 8%Technology 13% 6%Retail 7% 5%Healthcare 8% 5%Transportation 2% 3%Energy & utilities 2% 3%Education 3% 2%Other 8% 6%Total 100% 100%
Source: Goldman Sachs IT Spending Survey, Goldman Sachs Research estimates.
Our survey captures the most significant IT spending verticals.

November 2, 2008
Goldman Sachs Global Investment Research 34
Reg AC
We, Sarah Friar, James Covello and Derek R. Bingham, hereby certify that all of the views expressed in this report accurately reflect our personal
views about the subject company or companies and its or their securities. We also certify that no part of our compensation was, is or will be, directly
or indirectly, related to the specific recommendations or views expressed in this report.
Investment profile
The Goldman Sachs Investment Profile provides investment context for a security by comparing key attributes of that security to its peer group and
market. The four key attributes depicted are: growth, returns, multiple and volatility. Growth, returns and multiple are indexed based on composites
of several methodologies to determine the stocks percentile ranking within the region's coverage universe.
The precise calculation of each metric may vary depending on the fiscal year, industry and region but the standard approach is as follows:
Growth is a composite of next year's estimate over current year's estimate, e.g. EPS, EBITDA, Revenue. Return is a year one prospective aggregate
of various return on capital measures, e.g. CROCI, ROACE, and ROE. Multiple is a composite of one-year forward valuation ratios, e.g. P/E, dividend
yield, EV/FCF, EV/EBITDA, EV/DACF, Price/Book. Volatility is measured as trailing twelve-month volatility adjusted for dividends.
Quantum
Quantum is Goldman Sachs' proprietary database providing access to detailed financial statement histories, forecasts and ratios. It can be used for
in-depth analysis of a single company, or to make comparisons between companies in different sectors and markets.
Disclosures
Coverage group(s) of stocks by primary analyst(s)
Compendium report: please see disclosures at http://www.gs.com/research/hedge.html. Disclosures applicable to the companies included in this
compendium can be found in the latest relevant published research.
Company-specific regulatory disclosures
Compendium report: please see disclosures at http://www.gs.com/research/hedge.html. Disclosures applicable to the companies included in this
compendium can be found in the latest relevant published research.
Distribution of ratings/investment banking relationships
Goldman Sachs Investment Research global coverage universe
Rating Distribution Investment Banking Relationships
Buy Hold Sell Buy Hold Sell
Global 26% 57% 17% 52% 47% 37%
As of October 1, 2008, Goldman Sachs Global Investment Research had investment ratings on 3,165 equity securities. Goldman Sachs assigns
stocks as Buys and Sells on various regional Investment Lists; stocks not so assigned are deemed Neutral. Such assignments equate to Buy, Hold
and Sell for the purposes of the above disclosure required by NASD/NYSE rules. See 'Ratings, Coverage groups and views and related definitions'
below.
Price target and rating history chart(s)
Compendium report: please see disclosures at http://www.gs.com/research/hedge.html. Disclosures applicable to the companies included in this
compendium can be found in the latest relevant published research.
Regulatory disclosures
Disclosures required by United States laws and regulations
See company-specific regulatory disclosures above for any of the following disclosures required as to companies referred to in this report: manager
or co-manager in a pending transaction; 1% or other ownership; compensation for certain services; types of client relationships; managed/co-
managed public offerings in prior periods; directorships; market making and/or specialist role.
The following are additional required disclosures: Ownership and material conflicts of interest: Goldman Sachs policy prohibits its analysts,
professionals reporting to analysts and members of their households from owning securities of any company in the analyst's area of coverage.

November 2, 2008
Goldman Sachs Global Investment Research 35
Analyst compensation: Analysts are paid in part based on the profitability of Goldman Sachs, which includes investment banking revenues. Analyst as officer or director: Goldman Sachs policy prohibits its analysts, persons reporting to analysts or members of their households from serving as
an officer, director, advisory board member or employee of any company in the analyst's area of coverage. Non-U.S. Analysts: Non-U.S. analysts
may not be associated persons of Goldman, Sachs & Co. and therefore may not be subject to NASD Rule 2711/NYSE Rules 472 restrictions on
communications with subject company, public appearances and trading securities held by the analysts. Distribution of ratings: See the distribution
of ratings disclosure above. Price chart: See the price chart, with changes of ratings and price targets in prior periods, above, or, if electronic format
or if with respect to multiple companies which are the subject of this report, on the Goldman Sachs website at
http://www.gs.com/research/hedge.html. Goldman, Sachs & Co. is a member of SIPC(http://www.sipc.org).
Additional disclosures required under the laws and regulations of jurisdictions other than the United States
The following disclosures are those required by the jurisdiction indicated, except to the extent already made above pursuant to United States laws
and regulations. Australia: This research, and any access to it, is intended only for "wholesale clients" within the meaning of the Australian
Corporations Act. Canada: Goldman Sachs Canada Inc. has approved of, and agreed to take responsibility for, this research in Canada if and to the
extent it relates to equity securities of Canadian issuers. Analysts may conduct site visits but are prohibited from accepting payment or
reimbursement by the company of travel expenses for such visits. Hong Kong: Further information on the securities of covered companies referred
to in this research may be obtained on request from Goldman Sachs (Asia) L.L.C. India: Further information on the subject company or companies
referred to in this research may be obtained from Goldman Sachs (India) Securities Private Limited; Japan: See below. Korea: Further information
on the subject company or companies referred to in this research may be obtained from Goldman Sachs (Asia) L.L.C., Seoul Branch. Russia: Research reports distributed in the Russian Federation are not advertising as defined in Russian law, but are information and analysis not having
product promotion as their main purpose and do not provide appraisal within the meaning of the Russian Law on Appraisal. Singapore: Further
information on the covered companies referred to in this research may be obtained from Goldman Sachs (Singapore) Pte. (Company Number:
198602165W). Taiwan: This material is for reference only and must not be reprinted without permission. Investors should carefully consider their
own investment risk. Investment results are the responsibility of the individual investor. United Kingdom: Persons who would be categorized as
retail clients in the United Kingdom, as such term is defined in the rules of the Financial Services Authority, should read this research in conjunction
with prior Goldman Sachs research on the covered companies referred to herein and should refer to the risk warnings that have been sent to them
by Goldman Sachs International. A copy of these risks warnings, and a glossary of certain financial terms used in this report, are available from
Goldman Sachs International on request.
European Union: Disclosure information in relation to Article 4 (1) (d) and Article 6 (2) of the European Commission Directive 2003/126/EC is
available at http://www.gs.com/client_services/global_investment_research/europeanpolicy.html
Japan: Goldman Sachs Japan Co., Ltd. Is a Financial Instrument Dealer under the Financial Instrument and Exchange Law, registered with the Kanto Financial Bureau (Registration No. 69), and is a member of Japan Securities Dealers Association (JSDA) and Financial Futures Association of Japan (FFJAJ). Sales and purchase of equities are subject to commission pre-determined with clients plus consumption tax. See company-specific disclosures as to any applicable disclosures required by Japanese stock exchanges, the
Japanese Securities Dealers Association or the Japanese Securities Finance Company.
Ratings, coverage groups and views and related definitions
Buy (B), Neutral (N), Sell (S) -Analysts recommend stocks as Buys or Sells for inclusion on various regional Investment Lists. Being assigned a Buy
or Sell on an Investment List is determined by a stock's return potential relative to its coverage group as described below. Any stock not assigned as
a Buy or a Sell on an Investment List is deemed Neutral. Each regional Investment Review Committee manages various regional Investment Lists to
a global guideline of 25%-35% of stocks as Buy and 10%-15% of stocks as Sell; however, the distribution of Buys and Sells in any particular coverage
group may vary as determined by the regional Investment Review Committee. Regional Conviction Buy and Sell lists represent investment
recommendations focused on either the size of the potential return or the likelihood of the realization of the return.
Return potential represents the price differential between the current share price and the price target expected during the time horizon associated
with the price target. Price targets are required for all covered stocks. The return potential, price target and associated time horizon are stated in
each report adding or reiterating an Investment List membership.
Coverage groups and views: A list of all stocks in each coverage group is available by primary analyst, stock and coverage group at
http://www.gs.com/research/hedge.html. The analyst assigns one of the following coverage views which represents the analyst's investment outlook
on the coverage group relative to the group's historical fundamentals and/or valuation. Attractive (A). The investment outlook over the following 12
months is favorable relative to the coverage group's historical fundamentals and/or valuation. Neutral (N). The investment outlook over the
following 12 months is neutral relative to the coverage group's historical fundamentals and/or valuation. Cautious (C). The investment outlook over
the following 12 months is unfavorable relative to the coverage group's historical fundamentals and/or valuation.
Not Rated (NR). The investment rating and target price, if any, have been removed pursuant to Goldman Sachs policy when Goldman Sachs is
acting in an advisory capacity in a merger or strategic transaction involving this company and in certain other circumstances. Rating Suspended (RS). Goldman Sachs Research has suspended the investment rating and price target, if any, for this stock, because there is not a sufficient
fundamental basis for determining an investment rating or target. The previous investment rating and price target, if any, are no longer in effect for
this stock and should not be relied upon. Coverage Suspended (CS). Goldman Sachs has suspended coverage of this company. Not Covered (NC). Goldman Sachs does not cover this company. Not Available or Not Applicable (NA). The information is not available for display or is not applicable.
Not Meaningful (NM). The information is not meaningful and is therefore excluded.
Ratings, coverage views and related definitions prior to June 26, 2006
Our rating system requires that analysts rank order the stocks in their coverage groups and assign one of three investment ratings (see definitions
below) within a ratings distribution guideline of no more than 25% of the stocks should be rated Outperform and no fewer than 10% rated
Underperform. The analyst assigns one of three coverage views (see definitions below), which represents the analyst's investment outlook on the
coverage group relative to the group's historical fundamentals and valuation. Each coverage group, listing all stocks covered in that group, is
available by primary analyst, stock and coverage group at http://www.gs.com/research/hedge.html.
Definitions

November 2, 2008
Goldman Sachs Global Investment Research 36
Outperform (OP). We expect this stock to outperform the median total return for the analyst's coverage universe over the next 12 months. In-Line (IL). We expect this stock to perform in line with the median total return for the analyst's coverage universe over the next 12 months. Underperform (U). We expect this stock to underperform the median total return for the analyst's coverage universe over the next 12 months.
Coverage views: Attractive (A). The investment outlook over the following 12 months is favorable relative to the coverage group's historical
fundamentals and/or valuation. Neutral (N). The investment outlook over the following 12 months is neutral relative to the coverage group's
historical fundamentals and/or valuation. Cautious (C). The investment outlook over the following 12 months is unfavorable relative to the coverage
group's historical fundamentals and/or valuation.
Current Investment List (CIL). We expect stocks on this list to provide an absolute total return of approximately 15%-20% over the next 12 months.
We only assign this designation to stocks rated Outperform. We require a 12-month price target for stocks with this designation. Each stock on the
CIL will automatically come off the list after 90 days unless renewed by the covering analyst and the relevant Regional Investment Review
Committee.
Global product; distributing entities
The Global Investment Research Division of Goldman Sachs produces and distributes research products for clients of Goldman Sachs, and pursuant
to certain contractual arrangements, on a global basis. Analysts based in Goldman Sachs offices around the world produce equity research on
industries and companies, and research on macroeconomics, currencies, commodities and portfolio strategy.
This research is disseminated in Australia by Goldman Sachs JBWere Pty Ltd (ABN 21 006 797 897) on behalf of Goldman Sachs; in Canada by
Goldman Sachs Canada Inc. regarding Canadian equities and by Goldman Sachs & Co. (all other research); in Germany by Goldman Sachs & Co.
oHG; in Hong Kong by Goldman Sachs (Asia) L.L.C.; in India by Goldman Sachs (India) Securities Private Ltd.; in Japan by Goldman Sachs Japan Co.,
Ltd.; in the Republic of Korea by Goldman Sachs (Asia) L.L.C., Seoul Branch; in New Zealand by Goldman Sachs JBWere (NZ) Limited on behalf of
Goldman Sachs; in Singapore by Goldman Sachs (Singapore) Pte. (Company Number: 198602165W); and in the United States of America by
Goldman, Sachs & Co. Goldman Sachs International has approved this research in connection with its distribution in the United Kingdom and
European Union.
European Union: Goldman Sachs International, authorised and regulated by the Financial Services Authority, has approved this research in
connection with its distribution in the European Union and United Kingdom; Goldman, Sachs & Co. oHG, regulated by the Bundesanstalt für
Finanzdienstleistungsaufsicht, may also be distributing research in Germany.
General disclosures in addition to specific disclosures required by certain jurisdictions
This research is for our clients only. Other than disclosures relating to Goldman Sachs, this research is based on current public information that we
consider reliable, but we do not represent it is accurate or complete, and it should not be relied on as such. We seek to update our research as
appropriate, but various regulations may prevent us from doing so. Other than certain industry reports published on a periodic basis, the large
majority of reports are published at irregular intervals as appropriate in the analyst's judgment.
Goldman Sachs conducts a global full-service, integrated investment banking, investment management, and brokerage business. We have
investment banking and other business relationships with a substantial percentage of the companies covered by our Global Investment Research
Division.
Our salespeople, traders, and other professionals may provide oral or written market commentary or trading strategies to our clients and our
proprietary trading desks that reflect opinions that are contrary to the opinions expressed in this research. Our asset management area, our
proprietary trading desks and investing businesses may make investment decisions that are inconsistent with the recommendations or views
expressed in this research.
We and our affiliates, officers, directors, and employees, excluding equity analysts, will from time to time have long or short positions in, act as
principal in, and buy or sell, the securities or derivatives (including options and warrants) thereof of covered companies referred to in this research.
This research is not an offer to sell or the solicitation of an offer to buy any security in any jurisdiction where such an offer or solicitation would be
illegal. It does not constitute a personal recommendation or take into account the particular investment objectives, financial situations, or needs of
individual clients. Clients should consider whether any advice or recommendation in this research is suitable for their particular circumstances and,
if appropriate, seek professional advice, including tax advice. The price and value of the investments referred to in this research and the income from
them may fluctuate. Past performance is not a guide to future performance, future returns are not guaranteed, and a loss of original capital may
occur. Fluctuations in exchange rates could have adverse effects on the value or price of, or income derived from, certain investments.
Certain transactions, including those involving futures, options, and other derivatives, give rise to substantial risk and are not suitable for all
investors. Investors should review current options disclosure documents which are available from Goldman Sachs sales representatives or at
http://www.theocc.com/publications/risks/riskchap1.jsp. Transactions cost may be significant in option strategies calling for multiple purchase and
sales of options such as spreads. Supporting documentation will be supplied upon request.
Our research is disseminated primarily electronically, and, in some cases, in printed form. Electronic research is simultaneously available to all
clients.
Disclosure information is also available at http://www.gs.com/research/hedge.html or from Research Compliance, One New York Plaza, New York,
NY 10004.
Copyright 2008 The Goldman Sachs Group, Inc.
No part of this material may be (i) copied, photocopied or duplicated in any form by any means or (ii) redistributed without the prior written consent of The Goldman Sachs Group, Inc.

November 2, 2008
Goldman Sachs Global Investment Research 37
US Technology Strategy
Sarah Friar Sarah Friar, managing director, joined Goldman Sachs in July 2000. She is the Business Unit Leader of the Technology Research Group, as well as the lead analyst for the Software sector. Sarah became a managing director in 2006. Prior to joining Goldman Sachs, she worked at McKinsey & Co. in both London and South Africa. Sarah has a Master’s of Engineering from Oxford University and an M.B.A. from Stanford Graduate School of Business, where she graduated as an Arjay Miller scholar.
James Covello Jim Covello, managing director, joined Goldman Sachs in July 2000. He is the Business Unit Leader of the Technology, Media and Telecom Team, as well as the lead analyst for the Semiconductor Devices and Semiconductor Capital Equipment sectors. Jim became a managing director in 2004. He has been recognized by both Institutional Investor magazine and the Greenwich Survey as one of the leading analysts covering the sector. Prior to joining the firm, Jim worked in the Investment Banking divisions of SG Cowen and Smith Barney. He earned an M.B.A. from The Tuck School at Dartmouth College, where he was awarded distinction as a Tuck Scholar. Jim earned his B.A. Phi Beta Kappa, Magna Cum Laude in American Government from Georgetown University, where he graduated with distinction as a Baker Scholar.
Derek Bingham Derek Bingham, vice president, joined Goldman Sachs in 1999. He works in the Technology Research Group covering Infrastructure Software and Technology Strategy. Prior to joining the Investment Research division in 2001, he spent two years in Goldman Sachs’ Technology Investment Banking Group. Derek holds an M.B.A. from Stanford University and a B.A. in economics from Princeton University.
Related Documents