Tamil Nadu State Action Plan for Climate Change 75 6 WATER RESOURCES 6.1 OVERVIEW, CHARACTERISTICS AND STATUS Tamil Nadu constitutes 4 percent of India‟s land area and is inhabited by 6 percent of India‟s population, but has only 2.5 percent of India‟s water resources. More than 95 percent of the surface water and 80 percent of the ground water have already been put into use. Major uses of water include human/animal consumption, irrigation and industrial use. The demand for water in Tamil Nadu is increasing at a fast rate both due to increasing population and also due to larger per capita needs triggered by economic growth. The per capita availability of water resources however, is just 900 cubic meters when compared to the national average of 2,200 cubic meters. Agriculture is the largest consumer of water in the State using 75 per cent of the State‟s water resources. Demands from other sectors such as domestic and industries have been growing significantly. The State is heavily dependent on monsoon rains. The annual average rainfall is around 930 mm (47 percent during the north east monsoon, 35 percent during the south west monsoon, 14 percent in the summer and 4 percent in the winter). Actual rainfall for the year 2010-11 is 1165.10 mm, out of which 48 percent is through the north east monsoon, 32 percent is through the south west monsoon and the remaining 20 percent is through summer and winter rainfall. Since the State is entirely dependent on rains for recharging its water resources, monsoon failures lead to acute water scarcity and severe droughts. Surface Water Resources River basins of Tamil Nadu and Water Potential There are 17 river basins in Tamil Nadu (Figure 6.1). Cauvery is the only major basin. Of the others, 13 basins are medium and 3 are minor river basins. At 75 percent dependability, the annual surface water generated in the State is 692.78 TMC (19,619 MCM). Table 6.1 detailing the surface water potential in the different districts of Tamil Nadu. The State depends on neighbouring States for considerable quantum of flows, which is about 261.70 TMC (7411 MCM) annually.Table 6.2 indicates the water received from the States of Andhra Pradesh, Karnataka, Kerala and Maharashtra. Thus, the total surface water potential of the State at 75 percent dependability is 954.58 TMC (27,030 MCM). Table 6.1: Basin wise surface water potential at 75 percent dependability S.No. Basin / Basin Group Surface Water Potential at 75 percent dependability S.No. Basin / Basin Group Surface Water Potential at 75 percent dependability in MCM in TMC in MCM in TMC 1 Chennai 1645 58.09 8 Agniyar 1136 40.12 2 Palar 1264 44.64 9 Pambar & Kottakaraiyar 648 22.88 3 Varahanadhi 429 15.15 10 Vaigai 1372 48.42

Welcome message from author
This document is posted to help you gain knowledge. Please leave a comment to let me know what you think about it! Share it to your friends and learn new things together.
Transcript

Tamil Nadu State Action Plan for Climate Change
75
6 WATER RESOURCES 6.1 OVERVIEW, CHARACTERISTICS AND STATUS
Tamil Nadu constitutes 4 percent of India‟s land area and is inhabited by 6 percent of India‟s population, but has only 2.5 percent of India‟s water resources. More than 95 percent of the surface water and 80 percent of the ground water have already been put into use. Major uses of water include human/animal consumption, irrigation and industrial use. The demand for water in Tamil Nadu is increasing at a fast rate both due to increasing population and also due to larger per capita needs triggered by economic growth. The per capita availability of water resources however, is just 900 cubic meters when compared to the national average of 2,200 cubic meters. Agriculture is the largest consumer of water in the State using 75 per cent of the State‟s water resources. Demands from other sectors such as domestic and industries have been growing significantly.
The State is heavily dependent on monsoon rains. The annual average rainfall is around 930 mm (47 percent during the north east monsoon, 35 percent during the south west monsoon, 14 percent in the summer and 4 percent in the winter). Actual rainfall for the year 2010-11 is 1165.10 mm, out of which 48 percent is through the north east monsoon, 32 percent is through the south west monsoon and the remaining 20 percent is through summer and winter rainfall. Since the State is entirely dependent on rains for recharging its water resources, monsoon failures lead to acute water scarcity and severe droughts.
Surface Water Resources
River basins of Tamil Nadu and Water Potential
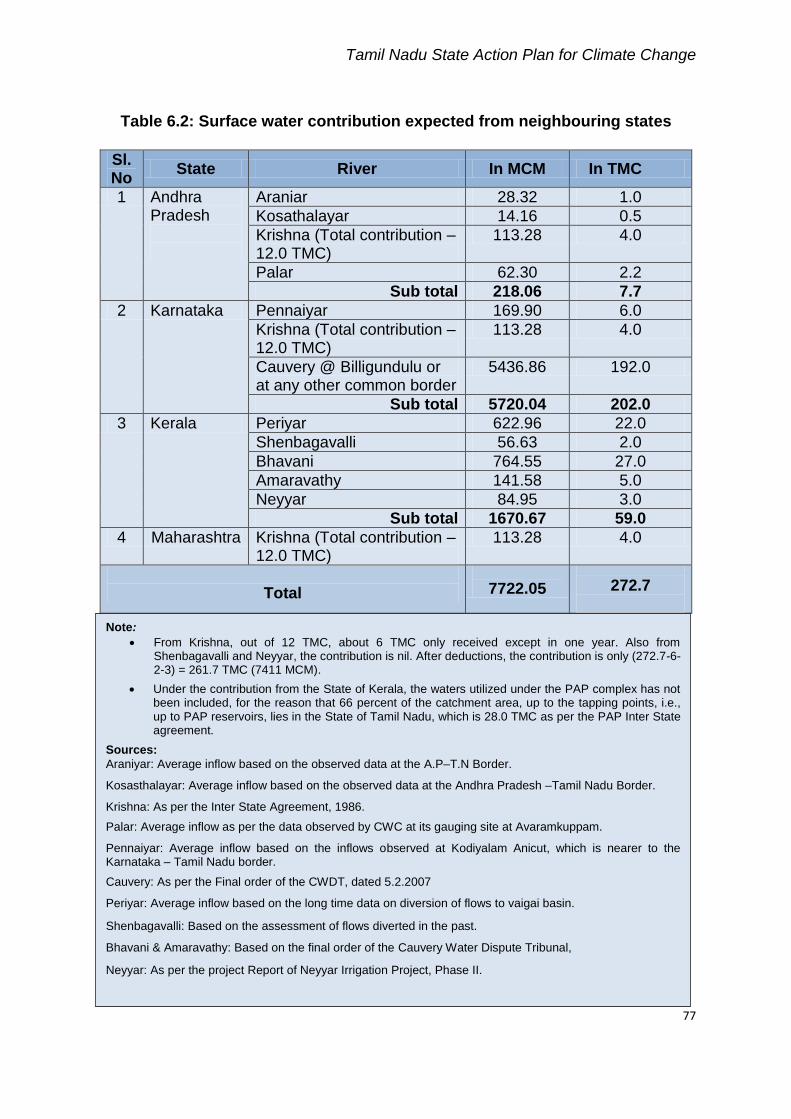
There are 17 river basins in Tamil Nadu (Figure 6.1). Cauvery is the only major basin. Of the others, 13 basins are medium and 3 are minor river basins. At 75 percent dependability, the annual surface water generated in the State is 692.78 TMC (19,619 MCM). Table 6.1 detailing the surface water potential in the different districts of Tamil Nadu. The State depends on neighbouring States for considerable quantum of flows, which is about 261.70 TMC (7411 MCM) annually.Table 6.2 indicates the water received from the States of Andhra Pradesh, Karnataka, Kerala and Maharashtra. Thus, the total surface water potential of the State at 75 percent dependability is 954.58 TMC (27,030 MCM).
Table 6.1: Basin wise surface water potential at 75 percent dependability
S.No. Basin / Basin Group
Surface Water Potential at 75
percent dependability
S.No. Basin / Basin Group
Surface Water Potential at 75
percent dependability
in MCM
in TMC
in MCM
in TMC
1 Chennai 1645 58.09 8 Agniyar 1136 40.12
2 Palar 1264 44.64 9 Pambar & Kottakaraiyar
648 22.88
3 Varahanadhi 429 15.15 10 Vaigai 1372 48.42

Tamil Nadu State Action Plan for Climate Change
76
S.No. Basin / Basin Group
Surface Water Potential at 75
percent dependability
S.No. Basin / Basin Group
Surface Water Potential at 75
percent dependability
in MCM
in TMC
in MCM
in TMC
4 Pennaiyar 1396 49.30 11 Gundar 549 19.39
5 Paravanar 379 13.38 12 Vaippar 715 25.25
6 Vellar 985 34.79 13 Kallar 128 4.52
7 Cauvery 5805 205.00 14 Tamiraparani 1374 48.49
15 Nambiyar 203 7.17 16 Kodaiyar 916 32.35
17 PAP 675 23.84 Total 19619 692.78
Sources: S.No. 1,3 to 6 & 8 to 16:Micro level study reports prepared by IWS, WRD, 2010 S.No. 2: Joint Hydrological Study of Palar Basin, CWC Report, Nov 2010 S. No. 7: Cauvery, as per the Report of the Cauvery Fact Finding Committee,1971 S. No.17 : as per the inter State PAP agreement, Tamil Nadu has to get 30.5 TMC. But as per the Actual flows realized since inception of the Project it is only 23.84 TMC, at 75 percent dependability.
Figure 6.1: River Basins of Tamil Nadu
Tamil Nadu State Action Plan for Climate Change
77
Table 6.2: Surface water contribution expected from neighbouring states
Sl.No
State River In MCM In TMC
1 Andhra Pradesh
Araniar 28.32 1.0
Kosathalayar 14.16 0.5
Krishna (Total contribution – 12.0 TMC)
113.28 4.0
Palar 62.30 2.2
Sub total 218.06 7.7
2 Karnataka Pennaiyar 169.90 6.0
Krishna (Total contribution – 12.0 TMC)
113.28 4.0
Cauvery @ Billigundulu or at any other common border
5436.86 192.0
Sub total 5720.04 202.0
3 Kerala Periyar 622.96 22.0
Shenbagavalli 56.63 2.0
Bhavani 764.55 27.0
Amaravathy 141.58 5.0
Neyyar 84.95 3.0
Sub total 1670.67 59.0
4 Maharashtra Krishna (Total contribution – 12.0 TMC)
113.28 4.0
Total
7722.05
272.7
Note:
From Krishna, out of 12 TMC, about 6 TMC only received except in one year. Also from Shenbagavalli and Neyyar, the contribution is nil. After deductions, the contribution is only (272.7-6-2-3) = 261.7 TMC (7411 MCM).
Under the contribution from the State of Kerala, the waters utilized under the PAP complex has not been included, for the reason that 66 percent of the catchment area, up to the tapping points, i.e., up to PAP reservoirs, lies in the State of Tamil Nadu, which is 28.0 TMC as per the PAP Inter State agreement.
Sources:
Araniyar: Average inflow based on the observed data at the A.P–T.N Border.
Kosasthalayar: Average inflow based on the observed data at the Andhra Pradesh –Tamil Nadu Border.
Krishna: As per the Inter State Agreement, 1986.
Palar: Average inflow as per the data observed by CWC at its gauging site at Avaramkuppam.
Pennaiyar: Average inflow based on the inflows observed at Kodiyalam Anicut, which is nearer to the Karnataka – Tamil Nadu border.
Cauvery: As per the Final order of the CWDT, dated 5.2.2007
Periyar: Average inflow based on the long time data on diversion of flows to vaigai basin.
Shenbagavalli: Based on the assessment of flows diverted in the past.
Bhavani & Amaravathy: Based on the final order of the Cauvery Water Dispute Tribunal,
Neyyar: As per the project Report of Neyyar Irrigation Project, Phase II.

Tamil Nadu State Action Plan for Climate Change
78
Ground water
The annual ground water potential of the State is 22,943 MCM and the net annual ground water availability is 20,649 MCM, as assessed during 2009. Out of this, up to 80 percent is being used. However this utilization is not uniform. As per the recent classification, out of 385+1 blocks, 138+1 (Chennai district) are over exploited, 33 are critical, 67 are semi-critical and in 11 blocks the quality is bad. Only 136 blocks are classified as safe (Figure 6.2).Further Keelaiyur, Kilvelur, Nagapattinam, Thalainaiyar, Thirumarugal and Vedaranyam blocks in Nagapattinam district, Thiruthuraipoondi and Muthupet blocks in Thiruvarur district are classified as saline blocks. Kadaladi, Thiruvadanai and Thirubhuvanam blocks in Ramanathapuram district are classified as poor quality blocks.
Figure 6.2: Block wise categorisation of Ground water
Source: Ground water Board, GoTN
Tamil Nadu State Action Plan for Climate Change
79
Storage Structures
Prior to independence only three reservoirs, viz., Periyar, Pechiparai and Mettur reservoir were constructed. Presently, there are about 85 reservoirs- major, medium and small put together with a total storage capacity of about 6,500 MCM. There are about 39000 tanks and their total capacity is assessed as 6000 MCM. The total capacity of storage created is about 12,500 MCM. The existing status of the storage structures created cannot be said as good or normal due to the various developments over the years. Water Resource Department is making efforts to revive them through various modernization programmes.
Per capita storage capacity in Tamil Nadu is just 175 cum where as all India average is 262 cum. This shows that we have to augment the storage capacity of the existing structures and create additional storage to manage the growing demand and also given the uncertainty in monsoon and surface water availability due to climate change. The research reports on climate change State that even though there is no apparent trend in the annual rainfall, there may be changes in the intensity of seasonal rainfall, and reduction in number of rainy days resulting in flash floods and consequent effects of it. In future, to capture and store such sudden large run-off lasting for a shorter duration, more storage structures need to be constructed.
6.2 INSTITUTIONS INVOLVED IN WATER SECTOR SERVICE DELIVERY IN TAMIL NADU
Water Resources Department (WRD)
The Water Resources Department is responsible for planning, evolving, executing and maintaining the irrigation facilities and infrastructure of the State. Sustainable development of the available water resources in a judicious and equitable manner is scientifically ensured by this department. Regulation of water from dams, flood control and mitigation, coastal protection, ground water recharge, rainwater harvesting and inter-linking of rivers to divert surplus flood flows to drought prone areas are the main activities of this department.
Water Resources Department is executing and maintaining all Irrigation
Projects such as dams, canals, tanks, water harvesting structures, implementation and maintenance of water supply in rural areas. The ground water wing of this department is maintaining all weather stations owned by the department and is monitoring the ground water level and quality of water in the State. This Department owns 85 dams and reservoirs. These dams and reservoirs have got their own system canals and tanks. This State has got about 39,000 tanks out of which 13,699 tanks are owned by Water Resources Department. Out of 13,699 tanks, about 7,198 tanks are system tanks. The rest 6,501 tanks are rain fed tanks. The total length of main channels in the State is about 9700 km. These assets are the source for irrigating a total extent of about 69,00,000 acres.
TWAD (Tamil Nadu Water Supply and Drainage Board) The Tamil Nadu Water Supply and Drainage Board (TWAD Board) was formed
during 1971 as an autonomous organization for providing water supply and drainage

Tamil Nadu State Action Plan for Climate Change
80
facilities to Rural and Urban areas of Tamil Nadu excluding the Chennai Metropolitan Area. The functions of the TWAD Board are as follows:
Planning investigation, Design, Implementation and commissioning of water supply and sewerage schemes in rural and urban areas.
Operation and maintenance of combined water supply schemes.
Water quality monitoring and surveillance programme.
Activities on sustainability of drinking water sources.
Chennai Metropolitan Water Supply and Sewerage Board ,,In 1978, the Chennai Metropolitan Water Supply and Sewerage Board (CMWSSB) was formed to take on the responsibility of augmenting water supply in the city. The main functions of the Board are:
Promoting and securing the planned development of water supply and sewerage services;
Efficient operation, maintenance and regulation of the water supply and sewerage systems in Chennai Metropolitan Area;
Preparing immediate and long-term measures to meet future demands for water supply and sewerage services in the Chennai Metropolitan Area. At present the Board serves a population of about 7 million most of who live in the Chennai city area. To carry out all these functions, the 1978 Act gives power to the Board.
To take over all existing responsibilities, powers, controls, facilities, services and administration relating to water supply and sewage in or for the Chennai Metropolitan Area;
To prepare schemes for water supply and sewerage (including abstraction of water from any natural source and disposal of waste and polluted water) in or for the Chennai Metropolitan Area
To control extraction, conservation and use of ground water in Chennai Metropolitan Area
To prevent pollution of any water including any water sources, water course or channel utilized for the purpose of Chennai Metropolitan Area and few more.
,
<
Rural Development and Panchayat Raj Department The Department of Rural Development and Panchayat Raj is responsible for
the implementation of various rural welfare schemes and also assists Panchayat Raj Institutions to discharge their duties and functions as effective Local Self Government entities. This Government is committed to provide all the basic amenities in the rural areas at the level of habitation, promote sanitation, reduce poverty, conserve the natural resources and reduce the urban-rural divide and ensure a prosperous rural Tamil Nadu. Minor Irrigation tanks in the State are being maintained by this department.
Tamil Nadu Pollution Control Board (TNPCB) The objective of TNPCB is to control, prevent and abate pollution of streams,
wells, land and atmosphere in the State and to protect the environment from any degradation by effective monitoring and implementation of pollution control
Tamil Nadu State Action Plan for Climate Change
81
legislations. TNPCB has delegated the power to the field officers for close monitoring. The Joint Chief Environmental Engineer/ District Environmental Engineers/ Assistant Environmental Engineers are empowered to issue/renew consent to orange and green category industries and to renew for red small category industries. They are also empowered to issue show cause notices to all the industries. TNPCB is taking effective steps for safe disposal of hazardous wastes. TNPCB creates environmental awareness in the State through the Environmental Training Institute, Environmental Awareness Cell, Environmental Awareness Programme, Environmental Pavilion constructed at the Periyar Science and Technology Centre (Chennai), NGO Cell, Publishing of Newsletters/Pamphlets on environmental issues, etc.
Educational Institutions ,,
The Educational Institutions such as Indian Institute of Technology Madras, Chennai, Anna University, Chennai and Tamil Nadu Agricultural University, Coimbatore are involved in various research Activities in Hydrology and Water Resources Management in the river basins of Tamil Nadu. They are also being referred to, then and there for finding solution to specific issues.
6.3 EXISTING WATER RELATED CONCERNS IN TAMIL NADU
Demand- Supply Gap
The total water potential of the State including cross border contribution from Andhra Pradesh, Karnataka and Kerala is 1775.60 TMC (47,680 MCM). This also includes ground water potential of about 20,649 MCM. The sectoral demand for water in 2011 was 49,773 MCM, which is about 2000 MCM more than the potential availability. The demand is projected to increase to 48,766 MCM and 55,919 MCM in 2020 and 2045 respectively (Table 6.3).The gap between supply and demand by 2020 is expected to be 5,211 MCM (11 percent) and it is likely to go up to 17 percent by 2050, if there is no intervention. Therefore all possible measures have to be taken to reduce the gap.
Table 6.3: Total sectoral demand (MCM)
Sl. No
Sector / Year 2011 2020 2045
1 Domestic 2248 2608 3908
2 Irrigation 38032 38032 38302
3 Livestock 965 965 965
4 Industrial & Power 3884 5318 10774
5 Eco & Env Recreation & Minimum flow needs
519 1843 1970
Sub Total 45,648 48,766 55,919
6 Add for existing 45 percent overall irrigation efficiency instead of 60 percent adopted in calculating irrigation for Cauvery basin
4125 4125 -
Grand Total 49,773 52,891 55,919

Tamil Nadu State Action Plan for Climate Change
82
Over-exploitation of Ground Water
As per the available data, up to 80 percent of the total ground water available is being used. This has led to the decline in ground water table in most of the blocks. According to the estimates for 2009, out of 385+1 blocks, 138+1 (Chennai District) are over exploited, 33 are critical, 67 are semi-critical and in 11 blocks the quality is bad.
Table 6.4: Over-exploitation of groundwater in Tamil Nadu
Source: State Ground & Surface Water Resources Data Centre, Chennai
Decreasing southwest monsoon and increasing northeast monsoon
The north east monsoon rainfall has increased from 34 percent to 63 percent and the south west rainfall has decreased from 48 percent to 24 percent, in a span of 10 years between 1995-96 to 2005-2006 respectively. (Figure 6.3)
Figure 6.3: Shifting rainfall pattern
Source: Indian Meteorology Department
S.
No
Year of Assessment
Total Number of
Blocks
Categorization of Blocks
Dark Grey White
1 January1980 377 80
(21 percent)
113
(30 percent)
184
(49 percent)
2 January1992 384 89
(23 percent)
86
(22 percent)
209
(55 percent)
3 January1997 384 97
(25 percent)
88
(23 percent)
199
(52 percent)
4 January2009 385+1 183
(48 percent)
67
(17 percent)
136
(35 percent)
Tamil Nadu State Action Plan for Climate Change
83
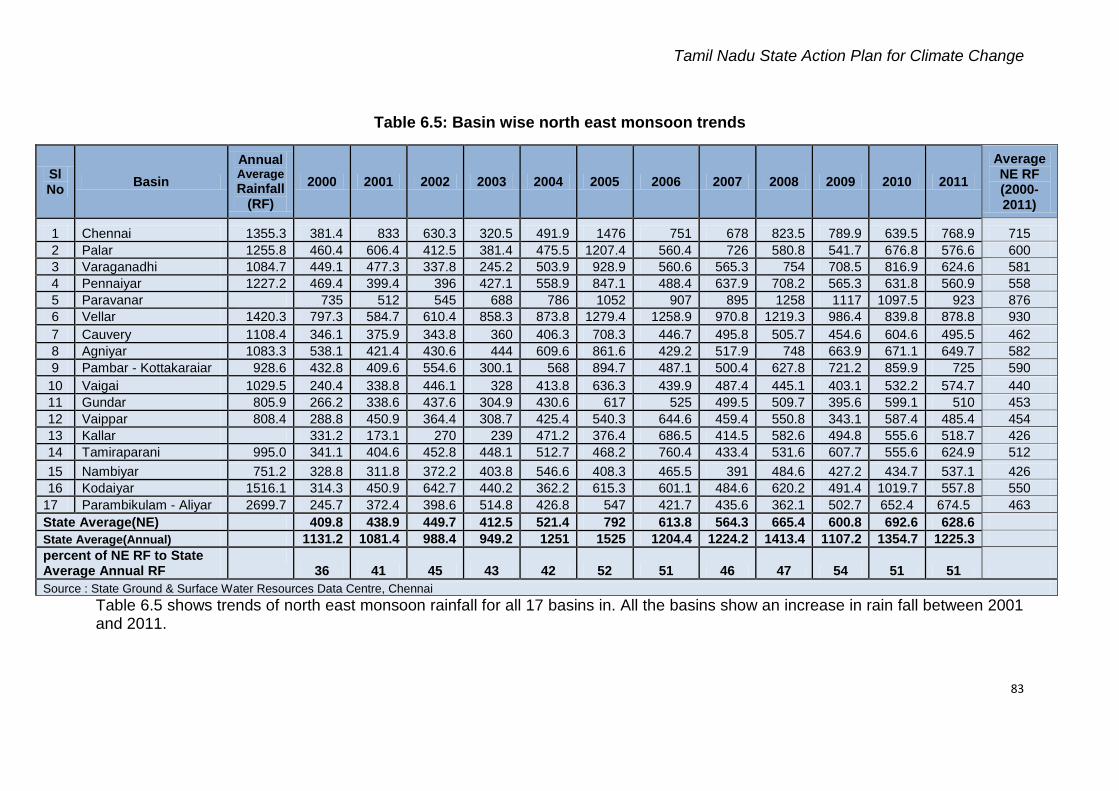
Table 6.5: Basin wise north east monsoon trends
Sl No
Basin
Annual Average Rainfall
(RF)
2000 2001 2002 2003 2004 2005 2006 2007 2008 2009 2010 2011
Average NE RF (2000-2011)
1 Chennai 1355.3 381.4 833 630.3 320.5 491.9 1476 751 678 823.5 789.9 639.5 768.9 715
2 Palar 1255.8 460.4 606.4 412.5 381.4 475.5 1207.4 560.4 726 580.8 541.7 676.8 576.6 600
3 Varaganadhi 1084.7 449.1 477.3 337.8 245.2 503.9 928.9 560.6 565.3 754 708.5 816.9 624.6 581
4 Pennaiyar 1227.2 469.4 399.4 396 427.1 558.9 847.1 488.4 637.9 708.2 565.3 631.8 560.9 558
5 Paravanar 735 512 545 688 786 1052 907 895 1258 1117 1097.5 923 876
6 Vellar 1420.3 797.3 584.7 610.4 858.3 873.8 1279.4 1258.9 970.8 1219.3 986.4 839.8 878.8 930
7 Cauvery 1108.4 346.1 375.9 343.8 360 406.3 708.3 446.7 495.8 505.7 454.6 604.6 495.5 462
8 Agniyar 1083.3 538.1 421.4 430.6 444 609.6 861.6 429.2 517.9 748 663.9 671.1 649.7 582
9 Pambar - Kottakaraiar 928.6 432.8 409.6 554.6 300.1 568 894.7 487.1 500.4 627.8 721.2 859.9 725 590
10 Vaigai 1029.5 240.4 338.8 446.1 328 413.8 636.3 439.9 487.4 445.1 403.1 532.2 574.7 440
11 Gundar 805.9 266.2 338.6 437.6 304.9 430.6 617 525 499.5 509.7 395.6 599.1 510 453
12 Vaippar 808.4 288.8 450.9 364.4 308.7 425.4 540.3 644.6 459.4 550.8 343.1 587.4 485.4 454
13 Kallar 331.2 173.1 270 239 471.2 376.4 686.5 414.5 582.6 494.8 555.6 518.7 426
14 Tamiraparani 995.0 341.1 404.6 452.8 448.1 512.7 468.2 760.4 433.4 531.6 607.7 555.6 624.9 512
15 Nambiyar 751.2 328.8 311.8 372.2 403.8 546.6 408.3 465.5 391 484.6 427.2 434.7 537.1 426
16 Kodaiyar 1516.1 314.3 450.9 642.7 440.2 362.2 615.3 601.1 484.6 620.2 491.4 1019.7 557.8 550
17 Parambikulam - Aliyar 2699.7 245.7 372.4 398.6 514.8 426.8 547 421.7 435.6 362.1 502.7 652.4 674.5 463
State Average(NE) 409.8 438.9 449.7 412.5 521.4 792 613.8 564.3 665.4 600.8 692.6 628.6
State Average(Annual) 1131.2 1081.4 988.4 949.2 1251 1525 1204.4 1224.2 1413.4 1107.2 1354.7 1225.3
percent of NE RF to State Average Annual RF
36 41 45 43 42 52 51 46 47 54 51 51
Source : State Ground & Surface Water Resources Data Centre, Chennai
Table 6.5 shows trends of north east monsoon rainfall for all 17 basins in. All the basins show an increase in rain fall between 2001 and 2011.
Tamil Nadu State Action Plan for Climate Change
84
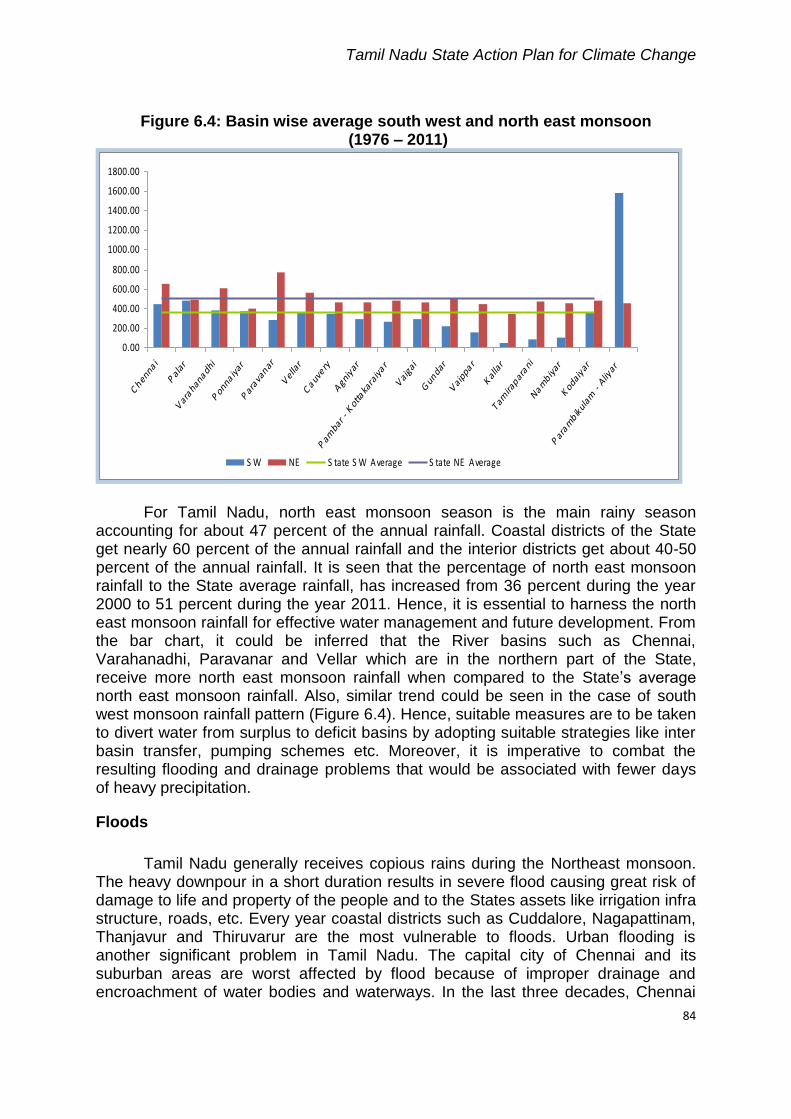
Figure 6.4: Basin wise average south west and north east monsoon (1976 – 2011)
0.00
200.00
400.00
600.00
800.00
1000.00
1200.00
1400.00
1600.00
1800.00
Chen
nai
Pal
ar
Var
ahana
dhi
Pon
naiyar
Par
avanar
Vel
lar
Cauv
ery
Agn
iyar
Pam
bar -
Kot
taka
raiya r
Vai
gai
Gun
dar
Vai
ppa r
Kal
lar
Tamira
parani
Nam
biyar
Kod
aiya
r
Par
ambik
ulam
- Aliy
ar
S W NE S tate S W Average S tate NE Average
For Tamil Nadu, north east monsoon season is the main rainy season accounting for about 47 percent of the annual rainfall. Coastal districts of the State get nearly 60 percent of the annual rainfall and the interior districts get about 40-50 percent of the annual rainfall. It is seen that the percentage of north east monsoon rainfall to the State average rainfall, has increased from 36 percent during the year 2000 to 51 percent during the year 2011. Hence, it is essential to harness the north east monsoon rainfall for effective water management and future development. From the bar chart, it could be inferred that the River basins such as Chennai, Varahanadhi, Paravanar and Vellar which are in the northern part of the State, receive more north east monsoon rainfall when compared to the State‟s average north east monsoon rainfall. Also, similar trend could be seen in the case of south west monsoon rainfall pattern (Figure 6.4). Hence, suitable measures are to be taken to divert water from surplus to deficit basins by adopting suitable strategies like inter basin transfer, pumping schemes etc. Moreover, it is imperative to combat the resulting flooding and drainage problems that would be associated with fewer days of heavy precipitation.
Floods
Tamil Nadu generally receives copious rains during the Northeast monsoon. The heavy downpour in a short duration results in severe flood causing great risk of damage to life and property of the people and to the States assets like irrigation infra structure, roads, etc. Every year coastal districts such as Cuddalore, Nagapattinam, Thanjavur and Thiruvarur are the most vulnerable to floods. Urban flooding is another significant problem in Tamil Nadu. The capital city of Chennai and its suburban areas are worst affected by flood because of improper drainage and encroachment of water bodies and waterways. In the last three decades, Chennai

Tamil Nadu State Action Plan for Climate Change
85
metropolitan area has experienced heavy floods during the years 1976, 1985, 1996, 1998, 2005, 2007 and 2008.The 2005 flooding was caused by torrential rain over four weeks in October and early November which was compounded by more monsoon storms that hit the region in late November.
Cyclones
Floods are also caused by severe cyclonic storms. Often, the area of low pressure formed as depression zone and subsequently developed as cyclone resulted in heavy rain. In Tamil Nadu, severe cyclonic storm occurred during north east monsoon period. In the last decade the cyclones such as “Nisha (2008)”, “Jal” (2010) and “Thane” (2011) caused heavy damages to the lives and properties of the people. Normally these cyclonic storms leads to heavy rains e.g. Orathanadu, Thanjavur district recorded 660 mm of rainfall within a period of 24 hours during cyclone Nisha (2008). It is important to have provisions to channelize and store this water to be used in the lean period.
Migration
Due to erratic rainfall and inflation of agricultural inputs many agricultural lands were kept fallow or converted for other uses and agricultural labourers migrated to urban areas in search of jobs to sustain their life. The stream of people moving to large urban centres with hope of better fortune increases each year and this trend has led to large number of people, especially the poor, settling and living in floodplains in and around urban areas. These areas lie outside the formal city limits (peri-urban areas) so they are unplanned and unregulated. They are ignored in urban planning systems so they continually lack adequate drainage systems, water supply and sanitation facilities. This causes stress to water sources and increases the pollution. The capital city Chennai and other city corporations in the State are experiencing such stress. The competition between rural and urban demands for scarce water resources sometimes exacerbates the water shortage. To manage the urban water demand, it needs to transfer the ground water from peri-urban and rural areas and thus the water table level decline affecting sustainability of the source. For example, Chennai in Tamil Nadu, India, is one such example (Box. 6.1)
Box 6.1 Case study of water market: Affecting sustainability of per-urban sources.
Chennai is a fast growing city in Tamil Nadu with almost 4.6 million people in 2011. The ever increasing urbanization since 2000 in Chennai has lead to decline in agriculture in South Chennai and also has increased the water demand in the city thereby leading extraction and marketing of ground water from agricultural wells in peri-urban villages. It is estimated that the deficit in supplying of water to Chennai city varies between 897-1043 MLD during the period of 2005-2008. In order to fill the demand supply gap, the private tankers move from peri-urban to urban city, transporting the ground water from the agricultural wells of the southern peri-urban areas, with a capacity of 12,000 litre to 24,000 litre. It is estimated that a quantity of about 17.1 MLD of water is being transported from the southern peri-urban villages alone. Apart from this, there are packaged water companies in and around the villages, which are extracting a huge amount of ground water. A semi-structured interview with selected owners of the packaged water industries reveal that approximately 4000-4500 water cans of the capacity of 20 litre are transported to customers everyday from the existing packaged water companies accounting to about 19.2 MLD of ground water extraction in the southern peri-urban villages of Chennai. Hence this water marketing is major negative face of the urbanization affecting the water and food security of rural areas.
Source : Centre for water Resources, Anna University, Chennai

Tamil Nadu State Action Plan for Climate Change
86
Droughts
Tamil Nadu, a coastal State in south India, is also prone to droughts. The climate of the State ranges from dry sub humid to semiarid. An assessment of droughts in Tamil Nadu from 1977 to 1991 reveals recurrent drinking water shortages in major parts of the State and the Chennai city in particular. The worst drought years in the past 32 years were identified as 1980, 1982, 1983, 1987, 1989, 2002, 2003, 2004, 2006 and 2009. The drought of 1980 destroyed the groundnut crop in over 1,00,000 hectares in the districts of Chengalpattu and Vellore.
According to a study of rain pattern in peninsular India by the Indian Council of Agricultural Research (ICAR), the frequency of deficit rainfall and resultant drought is once in every 2.5 years in Rayalaseema and Telangana, three years in entire Tamil Nadu, four years in Vidarbha and north interior Karnataka, and once in five years in coastal Andhra Pradesh, south interior Karnataka and central part of Maharashtra.
Low Water Use Efficiency
The overall efficiency in surface irrigation like canals and tanks is only 40 percent (when compared to 75 percent in Israel) whereas in well irrigation it is 70 percent. Researchers opine that this level of overall efficiency can be increased to 50 to 60 percent in surface irrigation and to 85 percent in well irrigation. If the overall efficiency were increased in phases from 40 percent to 50 percent and 60 percent, this would annually save about 3,000 MCM for every 10 percent increase in efficiency.
6.4 CURRENT POLICIES, PROGRAMMES AND PROJECTS
Policies and legislations related to water ,
Policies and legislations related to the conservation, development and management of water resources have been evolved at both State and National level.
The Tamil Nadu Additional Assessment and Additional Water Cess Act 1963:
This Act provides for the collection of levy of land and water-cess on different lands with respect to source of irrigation and type of crop in Tamil Nadu. The Revenue Department was authorized to assess and collect the levy and water cess. Later, the Act was amended four times mainly with changes in tariff.
The Water (Prevention and Control of Pollution) Act, 1974:
The Water Act was enacted by Parliament Act, 1974 with a purpose for prevention of control of water pollution and the maintaining or restoring of wholesomeness of water. Till date, it is applicable in all the States of India. The CPCB and SPCB were formulated under Section 4 of this Act. The Act deals with a particular type of pollution and presents an integrated approach to tackle the

Tamil Nadu State Action Plan for Climate Change
87
problem. It is an important legislative measure that has been enacted to implement the decision taken in the United Nation‟s Conference on Human Environment held in June 1972 at Stockholm.
The Water (Prevention and Control of Pollution) Cess Act, 1977:
This Act provides for the levy and collection of a cess on water consumed by persons for their industries and by local authorities, with a view to augment the resources of the Central Board and the State Boards, for the prevention and control of water pollution constituted under the Water (Prevention and Control of Pollution) Act, 1974.
<The Environment (Protection) Act 1986:
This Act provides for the Protection and Improvement of Environment and it deals with all other environmental issues. This Act empowers the Government of India to take all measures that are necessary to protect and improve the quality of environment and to prevent, control and abate environmental pollution. This Act includes laying down standards for the quality of environment and for discharge of environmental pollutants from various sources.
Chennai Metropolitan Area Ground Water (Regulation) Act, 1987:
The aim of this Act was to facilitate the functioning of the Water Board and to regulate and control the extraction, use or transport of ground water and to conserve ground water in Chennai Metropolitan Area and in the surrounding notified areas. The Act envisages control, regulation, abstractions and transportation of ground water in the notified area through (i) Registration of existing wells, (ii) Regulation of sinking of new wells (iii) Issue of licenses to extract water for non domestic uses and (iv) Issue of license for transportation through goods vehicles. The Act exempts from its purview, wells used for agricultural and domestic purposes. The Competent Authority for the purpose of the Act. In the city of Chennai, the Metro Water Board and pertaining to the villages specified in the schedule, the respective Sub-Collectors / Revenue Divisional Officers of the Taluks in which the villages fall.
State Water Policy, 1994:
Taking into account the National Water Policy 2002, the State Water Policy 1994 was redrafted emphasising the need for utmost efficiency in water utilisation and public awareness of the importance of water conservation. This water policy applies to all the water resources in the State.

Tamil Nadu State Action Plan for Climate Change
88
The Tamil Nadu Panchayat Act, 1994:
This Act vested powers with the Village Panchayats for sinking wells and let them for open use and enjoyment of all individuals, irrespective of their caste or creed under section 110(g). Under Section 236 of this Act the repair and maintenance of these wells need to be done by the Village Panchayats. This also deals with the artificial recharge of ground water through the rainwater harvesting schemes under Section 257 making it mandatory in every building and if this is not executed, the water supply connection provided to those buildings will be disconnected till rainwater-harvesting structures are provided after the Second amendment in 2003.
The Tamil Nadu Farmers Management of Irrigation Systems Act, 2000:
This Act provides for Farmer's participation in the Management of Irrigation Systems. The Act facilitates optimal water utilization by farmers for improved agricultural production through formation of Water Users Association. This Act details the procedure for formation of Water Users Association and the election of office bearers because it is considered that the scientific and systematic development and maintenance of irrigation infrastructure is best possible through Water Users Association.
National Water Policy, 2002:
The National Water Policy 2002 lays emphasis on integrated water resources development and management for optimal and sustainable utilization of the available surface and ground water. The involvement of beneficiaries and stakeholders in project Planning and participatory approach in water resources management has been focused in the policy. At present, the Draft National Water Policy 2012 has been and adopted by the National Water Resources Council on August 9, 2012 and is under deliberation by the National Water Board. In this draft, the title, “Adaptation to Climate Change” has been included with the following points:
Importance should be given towards mitigation at micro level by enhancing the capabilities of community to adopt climate resilient technological options.
The adaptation strategies include increasing water storage in its various forms, such as soil moisture, ponds, ground water, small and large reservoirs, and their combination, which provides a mechanism for dealing with increased variability because of climate change.
Stakeholder participation in land-soil-water management with scientific inputs from local research and academic institutions for evolving different agricultural strategies, reducing soil erosion and improving soil fertility should be promoted.
In view of the likely impact of climate change, there is a need to adopt compatible agricultural strategies, and cropping patterns. This may be achieved by involving the water users, sensitizing them appropriately and enhancing their capacities.

Tamil Nadu State Action Plan for Climate Change
89
Planning and management of water resources structures, such as, dams, flood embankments, tidal embankments, etc., should incorporate coping strategies for possible climate changes. ,
Tamil Nadu State Groundwater Development and Management Act, 2003:
The Government of Tamil Nadu has formulated and passed the Tamil Nadu
Ground water (Development and Management) Act 2003 to protect ground water resources and to safeguard against hazards of it‟s over exploitation and to ensure its planned development and proper management in the State. The 2003 Act gives direct establishment of “The Tamil Nadu Ground Water Authority”. This Authority has the power to direct and regulate the development and management of ground water resources in Tamil Nadu with the aim of ensuring its optimal and efficient utilisation.
The National Environment Policy, 2006:
The National Environment Policy, 2006 formulated by the Ministry of Environment and Forests, deals with direct causes of groundwater depletion, pollution and the efficient means for utilizing and conserving the groundwater.
The Tamil Nadu Protection of Tanks and Eviction of Encroachment Act, 2007:
This Act facilitates the checking, protection and eviction of encroachment in the tanks that are under the control and management of the Water Resources Department.
On-going Programmes and Projects
National Action Plan on Climate Change for Cauvery delta:
Under Asian Development Bank assistance, the National Action Plan on Climate Change programme will be implemented at a cost of Rs.1560 crore in the Cauvery delta area and this is an eight-year Programme (2012-2020). The Major components of this Programme are (i) Integrated flood and salinity management, (ii) Sustainable agriculture system, (iii) Shore line protection and management and (iv) Institutional development, training and awareness. This plan is designed to meet the key objectives of development needs, sustainability and adaptation to climate change. The Cauvery delta with an area of 5,60,000 ha is irrigated and drained by the following four main canal systems-Lower Coleroon Anicut (49,000 ha); Cauvery (2,00,000 ha); Vennar (1,90,000 ha); Grand Anicut (1,21,000 ha). The proposed program under the National Action Plan for Climate Change will modernize the surface water, ground water and coastal drainage system in the Cauvery delta.

Tamil Nadu State Action Plan for Climate Change
90
Tamil Nadu Irrigated Agriculture Modernisation and Water Bodies Restoration and Management Project (TN IAMWARM):
The TN IAMWARM Project is being implemented with the assistance of the World Bank at an outlay of 2547 crore since 2007 to benefit 6.69 lakh ha for a period of 6 years. The Water Resources Department and seven other line departments of the Government are the implementing departments of the project. 4922 tanks, 669 anicuts and 8071 km length of supply channels are proposed for rehabilitation under the TN IAMWARM Project. The TN IAMWARN Project aims to improve the service delivery of the irrigation system and to increase the productivity of irrigated agriculture with effective integrated water resources management in a sub basin framework.
,Master plan for artificial recharge:
A Master plan for artificial recharge scheme at an estimated cost of Rs.550 crore is being implemented by the Water Resources Department, TWAD Board, Agricultural Engineering Department and Forest Department. Under this scheme, construction of Check dam, percolation ponds and recharge shaft are being implemented.
Coastal Protection Works:
The 13th Finance Commission constituted by the Government of India has recommended a grant of Rs.200 crore for Coastal Protection Works over a period of 4 years from 2011-12 under the State specific needs grant to protect the coastline from sea erosion. On priority basis, vulnerable reaches have been identified and the State Government have accorded administrative sanction for 50 coastal protection works in 7 coastal districts, at an estimate of Rs. 199.93 crore and the works are in progress.
,Restoration:
Restoration of the 674 traditional water bodies over a period of 4 years from 2011 -2012 have been taken and the works are under progress.
Flood Management Programme in Tamil Nadu:
The Government of Tamil Nadu has taken measures to tackle the recurrent heavy floods experienced during the Northeast monsoons. Under the National Perspective plan, the Flood Management Programme with a Centre - State share of 75:25, is under implementation in Tamil Nadu. The Schemes involved are flood protection works to the Araniar, Kosasthalaiyar, Vellar, Pennaiyar, Gadilam, Malattar, Uppanar, Paravanar and Kollidam rivers to safeguard Thiruvallur, Villupuram, Cuddalore, Thanjavur and Nagapattinam districts for a total value on Rs.635.54 crore. The above work is being executed by State Water Resources Department since 2010 and is under progress.
Tamil Nadu State Action Plan for Climate Change
91
,Dam Rehabilitation and Improvement Project (DRIP):
In order to ensure the strength and improve the safety and operational performance of the existing dams in a sustainable manner, the dam rehabilitation and improvement project with the World Bank assistance is proposed to be taken up over a period of 6 years from 2012-2013 in 4 phases. The project aims to restore the capacity of the dams, achieve effective utilization of stored water and manage the long-term performance of the dams.Three organizations, viz Water Resources Department, Tamil Nadu Generation and Distribution Corporation Limited / Tamil Nadu Electricity Board and Agricultural Engineering Department are participating in this project. The project covers 66 WRD Dams and 38 TANGEDCO dams at a cost of Rs. 745.49 crore.
Linking of Rivers within the State:
The following two Interlinking works in the State are under implementation to primarily serve as flood carriers and to divert the flood flows to reach the drought prone areas.
Interlinking of Cauvery, Manimuthar, Vaigai and Gundar Rivers.
Formation of a flood carrier canal from the Kannadian Channel to drought prone areas of Sathankulam and Thisaiyanvilai by interlinking Tamiraparani, Karumeniyar and Nambiyar rivers in Tirunelveli and Thoothukudi districts.
,
6.5 LIKELY IMPLICATIONS OF CLIMATE CHANGE ON WATER RESOURCES
Evaluating the potential impacts of climate change on water resources (precipitation) requires the application of hydrological simulation modelling techniques, driven by scenarios of changes in temperature, precipitation and potential evapotranspiration derived from global and regional climate modeling studies. Precipitation is one of the least well-represented processes in climate models at present, and the uncertainty in projections of climate change impacts on water resources is therefore high. The following section summarises a review of various studies carried out to understand the likely availability of water in the future in a changing climate scenario.
Rainfall and water balance projections in Mid Century
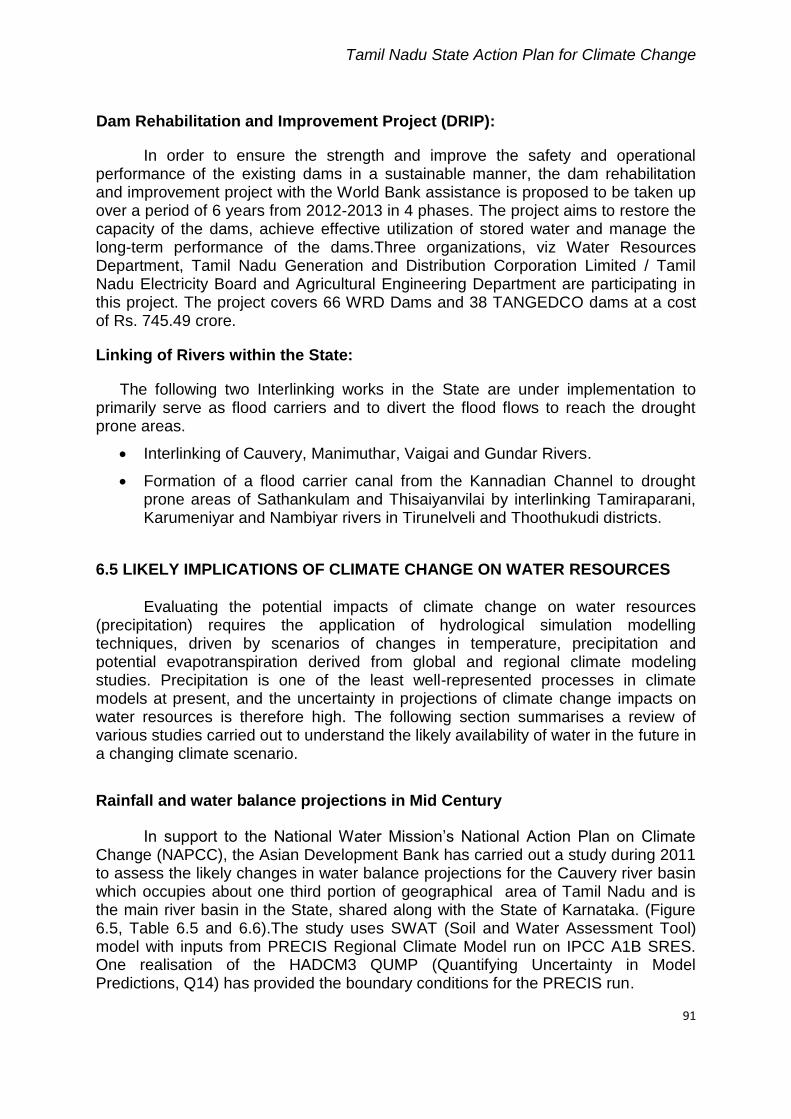
In support to the National Water Mission‟s National Action Plan on Climate Change (NAPCC), the Asian Development Bank has carried out a study during 2011 to assess the likely changes in water balance projections for the Cauvery river basin which occupies about one third portion of geographical area of Tamil Nadu and is the main river basin in the State, shared along with the State of Karnataka. (Figure 6.5, Table 6.5 and 6.6).The study uses SWAT (Soil and Water Assessment Tool) model with inputs from PRECIS Regional Climate Model run on IPCC A1B SRES. One realisation of the HADCM3 QUMP (Quantifying Uncertainty in Model Predictions, Q14) has provided the boundary conditions for the PRECIS run.
Tamil Nadu State Action Plan for Climate Change
92
Figure 6.5 Boundary of the Cauvery River Basin
Spatial changes in water balance parameters across the Cauvery basin for south west monsoon and north east monsoon in mid century (2021-2050) with respect to base line (1961-1990) is shown in Figure 6.6a and b respectively.

Tamil Nadu State Action Plan for Climate Change
93
Figure 6.6: Change in the Water Balance to Mid Century – (a) South West monsoon and (b) North East monsoon
(a)
(b)

Tamil Nadu State Action Plan for Climate Change
94
The projections under the A1B scenario indicate the following:
Average Annual changes
Annual Rainfall – There is no significant change of annual rainfall in mid century A1B scenario. Annual precipitation is highest in the Cauvery delta and in the northwest of the basin where over 1000 mm occurs.
Changes in annual average evapotranspiration – These values are projected to increase during mid century.
Projections for south west monsoon:
Southwest monsoon rainfall - For the southwest monsoon, the indications of the PRECIS A1B results are that there will be a reduction in precipitation by up to 10 percent by mid-century. The implications of this projection are increased demand for irrigation water in the upper basin, coupled with a reduction in surface water availability for the delta part. The surface water resource available to the Cauvery delta is likely to decrease during the southwest monsoon under this scenario.
Ground water demand – Ground water demand will probably increase to compensate for the estimated weakening of the south west monsoon.
Changes in evapotranspiration – Marginal increase have been predicted leading to increase in water demand for crops during south west monsoon season.
Surface runoff – Run-off is projected to decrease during south west monsoon season.
Projections for north east monsoon:
For the northeast monsoon the PRECIS A1B scenario indicates a 10 percent to 20 percent increase in precipitation in the Cauvery delta. Drainage is already a problem in the lower parts of the delta, and increased north east monsoon precipitation coupled with higher sea levels will exacerbate the problems.
Changes in ground water recharge - The ground water estimation predicts an increase in salinity issues.
Flood risk - Increased rainfall, rainfall intensities and sea-level rise will increase flood risk during the north east monsoon. Flooding is already a problem and will likely become more significant in the future.
Rainfall Projections by End of the Century
IIT Madras in collaboration with Tamil Nadu Agricultural University carried out a study to assess the likely rainfall scenario in the mid century. This study was part of the CLIMARICE project, was supported by the Norwegian Government. The climate change data used for this study was simulated by the GCM run by the International Pacific Research Centre (IPRC) Hawaii. Climate change simulations were made using GFDL doubling of CO2 concentration in the end-century (A1B scenario) and the GCM results were downscaled to 25km resolution using IPRC-Reg

Tamil Nadu State Action Plan for Climate Change
95
SIM model. The results are shown in Figures 6.7 to 6.12
Figure 6.7: Annual rainfall - base line and projections
Figure 6.8: Annual rainfall days in base line and end century scenario
Tamil Nadu State Action Plan for Climate Change
96
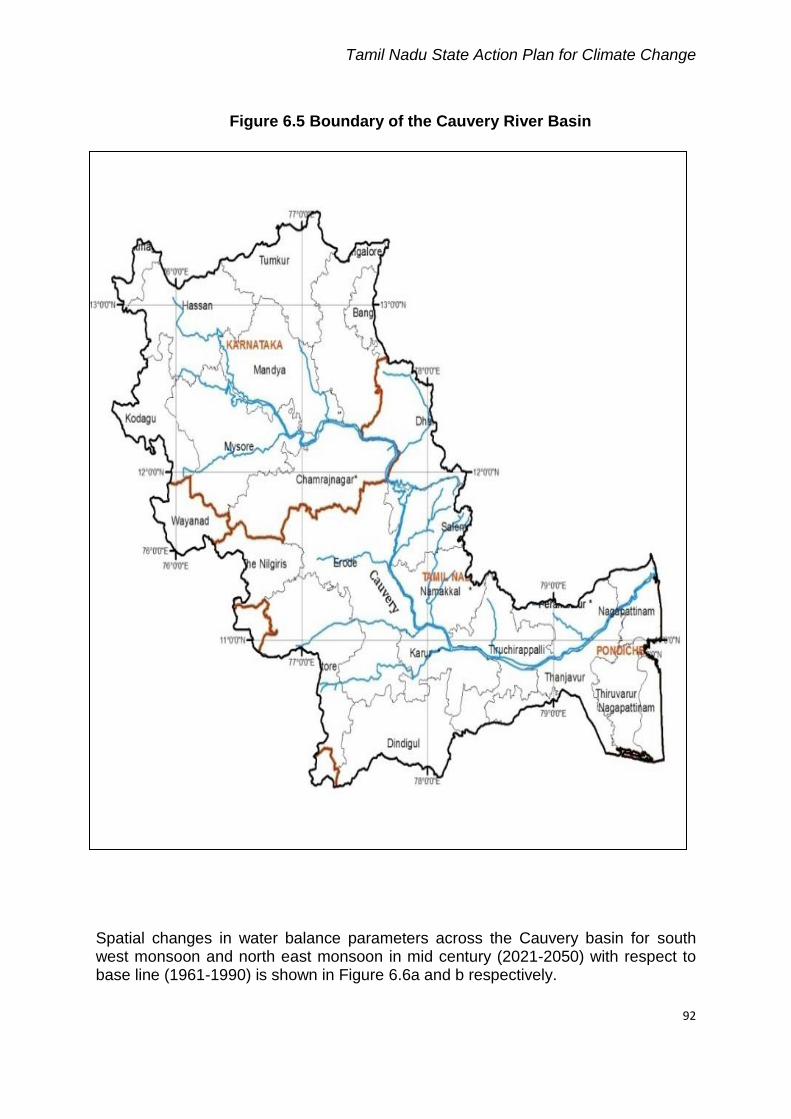
Figure 6.9: Average rainfall intensity
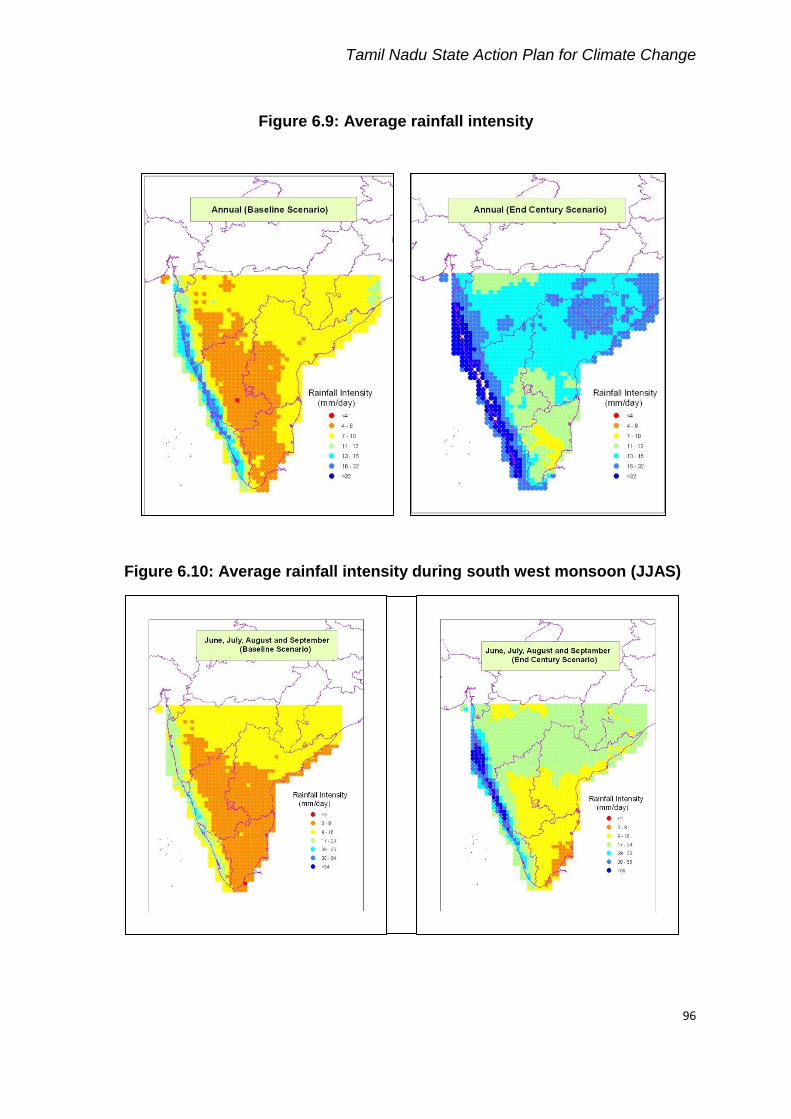
Figure 6.10: Average rainfall intensity during south west monsoon (JJAS)

Tamil Nadu State Action Plan for Climate Change
97
Figure 6.11: Average rainfall intensity during north east monsoon (ONDJ)
Figure 6.12: Average rainfall intensity during the dry season (FMAM)

Tamil Nadu State Action Plan for Climate Change
98
Table 6.6: Changes in precipitation in mid-century (2021-2050) in the Cauvery basin with respect to Base line (1961-1990)
Source: ADB Final Report, September 2011
From these figures, it is clear that, the
Annual rainfall is predicted to increase considerably towards the end of century (2081-2100) in Tamil Nadu. The results is agreed with the basin level study carried out by ADB (2012) and the study done by Gosain et al. (2011) and several other studies that project an increase in rainfall for most parts of Tamil Nadu.
Though there is likely to be increase in rain fall annually, but the number of rainy days is likely to decrease by half in the end century scenario with reference to the base line
Annual rainfall intensities are likely to increase by 7-12 mm/day
Rainfall intensities during South West monsoon is likely to remain at 3-6 mm/day in the coastal areas but in the rest of State it is likely to increase to increase to 9-16 mm/day
Rainfall intensity during the North East monsoon is likely to increase by 9-22 mm/day by the end of the century across the State, with heavier precipitation towards the coast
Annual rain fall intensity is again likely to increase by 8-14 mm/day all across the State by the end of the century.
Ground Water Projections
Climate Change is projected to have an adverse impact on the ground water resources of the State. The coastal districts and islands are more sensitive to Climate Change than the inlands. The factors that are likely to create impact on ground water resources due to climate change are as follows:
Rise in sea level due to increase in global temperature will result in shifting of shorelines towards inland, thus affecting the freshwater interface in the
Scenario / Season Precipitation
in mm
Average annual rainfall (A1B baseline) 822
Average annual rainfall (A1B mid century) 810
Net change in mm 12
percent change 1.5 percent
Average southwest monsoon rainfall (A1B baseline) 479
Average southwest monsoon rainfall (A1B mid century) 455
Net change in mm 24
percent change 5 percent
Average northeast monsoon rainfall (A1B Base line) 165
Average northeast monsoon rainfall (A1B mid century) 169
Net change in mm 4
percent change 2 percent
Tamil Nadu State Action Plan for Climate Change
99
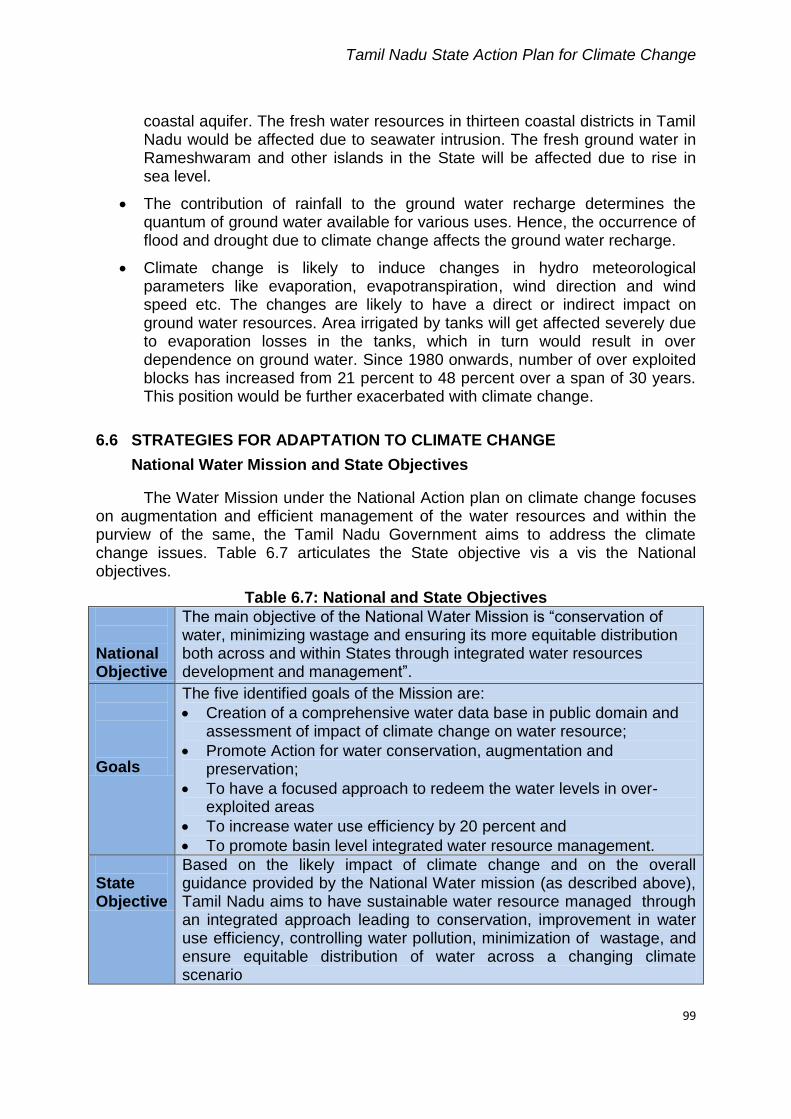
coastal aquifer. The fresh water resources in thirteen coastal districts in Tamil Nadu would be affected due to seawater intrusion. The fresh ground water in Rameshwaram and other islands in the State will be affected due to rise in sea level.
The contribution of rainfall to the ground water recharge determines the quantum of ground water available for various uses. Hence, the occurrence of flood and drought due to climate change affects the ground water recharge.
Climate change is likely to induce changes in hydro meteorological parameters like evaporation, evapotranspiration, wind direction and wind speed etc. The changes are likely to have a direct or indirect impact on ground water resources. Area irrigated by tanks will get affected severely due to evaporation losses in the tanks, which in turn would result in over dependence on ground water. Since 1980 onwards, number of over exploited blocks has increased from 21 percent to 48 percent over a span of 30 years. This position would be further exacerbated with climate change.
6.6 STRATEGIES FOR ADAPTATION TO CLIMATE CHANGE
National Water Mission and State Objectives
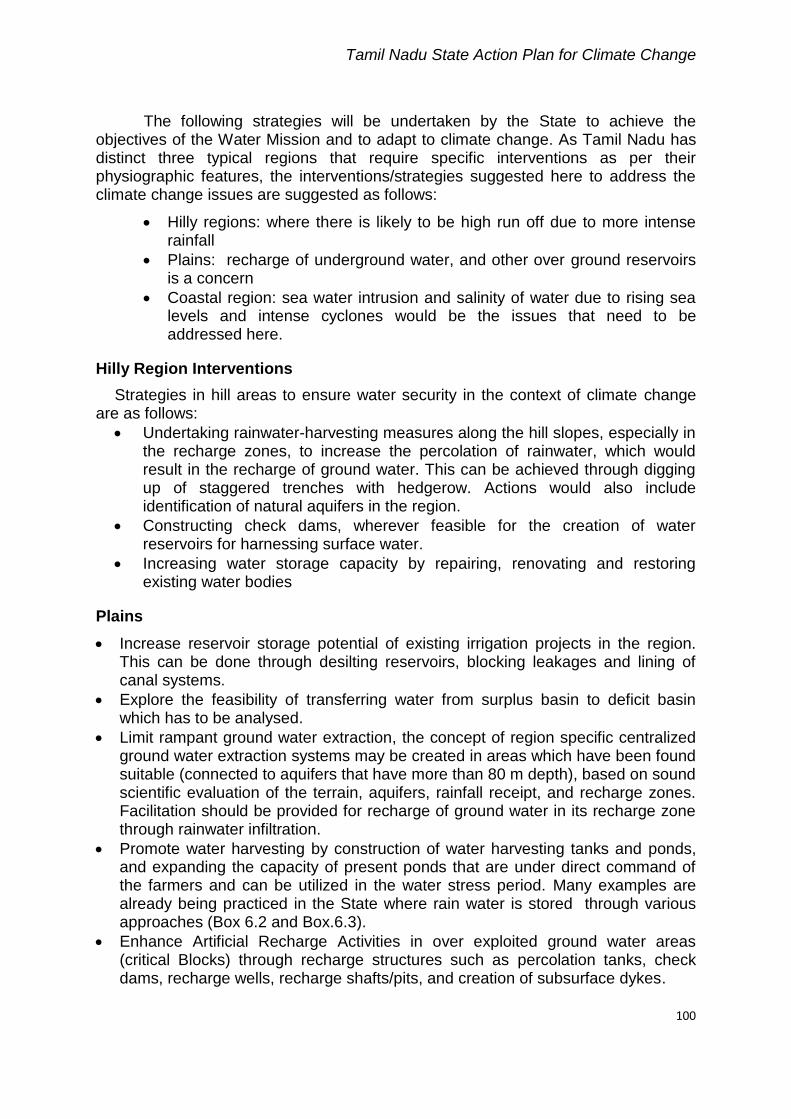
The Water Mission under the National Action plan on climate change focuses on augmentation and efficient management of the water resources and within the purview of the same, the Tamil Nadu Government aims to address the climate change issues. Table 6.7 articulates the State objective vis a vis the National objectives.
Table 6.7: National and State Objectives
National Objective
The main objective of the National Water Mission is “conservation of water, minimizing wastage and ensuring its more equitable distribution both across and within States through integrated water resources development and management”.
Goals
The five identified goals of the Mission are:
Creation of a comprehensive water data base in public domain and assessment of impact of climate change on water resource;
Promote Action for water conservation, augmentation and preservation;
To have a focused approach to redeem the water levels in over-exploited areas
To increase water use efficiency by 20 percent and
To promote basin level integrated water resource management.
State Objective
Based on the likely impact of climate change and on the overall guidance provided by the National Water mission (as described above), Tamil Nadu aims to have sustainable water resource managed through an integrated approach leading to conservation, improvement in water use efficiency, controlling water pollution, minimization of wastage, and ensure equitable distribution of water across a changing climate scenario
Tamil Nadu State Action Plan for Climate Change
100
The following strategies will be undertaken by the State to achieve the objectives of the Water Mission and to adapt to climate change. As Tamil Nadu has distinct three typical regions that require specific interventions as per their physiographic features, the interventions/strategies suggested here to address the climate change issues are suggested as follows:
Hilly regions: where there is likely to be high run off due to more intense rainfall
Plains: recharge of underground water, and other over ground reservoirs is a concern
Coastal region: sea water intrusion and salinity of water due to rising sea levels and intense cyclones would be the issues that need to be addressed here.
Hilly Region Interventions
Strategies in hill areas to ensure water security in the context of climate change are as follows:
Undertaking rainwater-harvesting measures along the hill slopes, especially in the recharge zones, to increase the percolation of rainwater, which would result in the recharge of ground water. This can be achieved through digging up of staggered trenches with hedgerow. Actions would also include identification of natural aquifers in the region.
Constructing check dams, wherever feasible for the creation of water reservoirs for harnessing surface water.
Increasing water storage capacity by repairing, renovating and restoring existing water bodies
Plains
Increase reservoir storage potential of existing irrigation projects in the region. This can be done through desilting reservoirs, blocking leakages and lining of canal systems.
Explore the feasibility of transferring water from surplus basin to deficit basin which has to be analysed.
Limit rampant ground water extraction, the concept of region specific centralized ground water extraction systems may be created in areas which have been found suitable (connected to aquifers that have more than 80 m depth), based on sound scientific evaluation of the terrain, aquifers, rainfall receipt, and recharge zones. Facilitation should be provided for recharge of ground water in its recharge zone through rainwater infiltration.
Promote water harvesting by construction of water harvesting tanks and ponds, and expanding the capacity of present ponds that are under direct command of the farmers and can be utilized in the water stress period. Many examples are already being practiced in the State where rain water is stored through various approaches (Box 6.2 and Box.6.3).
Enhance Artificial Recharge Activities in over exploited ground water areas (critical Blocks) through recharge structures such as percolation tanks, check dams, recharge wells, recharge shafts/pits, and creation of subsurface dykes.

Tamil Nadu State Action Plan for Climate Change
101
Enhance Water use efficiency through renovating the existing systems and by educating farmers to adopt modern irrigation methods and latest technologies. Participatory approach i.e., stakeholders‟ involvement is to be encouraged in Planning, development, utilization and management of water resources.
Abate floods in the State, Flood control measures needs to be integrated with drainage and irrigation systems. By combining the functions of flood diversion with some form of retention in tanks, the parallel benefits of irrigation use and groundwater recharge could be achieved. Strengthening of banks of rivers and providing protective works are necessary.
Create small reservoir schemes such as check dams.
Coastal Region Interventions
With climate change, the sea level is likely to rise further, causing larger area of inland to be inundated. Also the intensity of the cyclones is likely to increase giving rise to stronger storm surges. In view of the above, the main strategies that need to be put in place to ensure water security of this region may be as follows:
Construct and rehabilitate tail end regulators to prevent the intrusion of saline water in channels
Desalination plants in coastal areas are to be established to ensure availability of fresh water.
Control volume of groundwater abstraction by strictly enforcing the ground water regulation Acts to prevent seawater intrusion.
Box 6.2 : Case Study: Farm Pond– An Alternate Source
Paraman is a shepherd-farmer at Sengapadai village, in Madurai district. For many years he cultivated pulses and millets in his six acres rainfed land. Usually, once in every four years, when the rainfall was good he could harvest one or two bags of grain for his family. He was rearing goats for other families in the village using the traditional method of „varam‟ in which Paraman would share the profits with the owners of the goats at the end of the year. The DHAN Foundation promoted a Farmer‟s group in the village in 2004 as part of its intervention in rain-fed farming. Paraman joined in the Farmer‟s group and availed assistance to dig farm pond. His pond was filled soon after the first rains. He decided to cultivate paddy on part of his land using the water from the pond. He was able to harvest 840 kg of paddy that year.(Source : DHAN Foundation)

Tamil Nadu State Action Plan for Climate Change
102
Research & Capacity Building: Scientific Assessments for Better Understanding of Impacts of Climate Change
As there is no flood forecasting station in the State, new stations are to be established at suitable locations. Dissemination systems are essential to make all farmers and the entire population aware of the impending event.
Assess water demand by sector by factoring in climate change for short, medium and long term time lines
Monitor quality of water to understand the impact of warming of the atmosphere and for providing remedies
Identify vulnerable areas of ground water contamination by point sources of industrial, municipal solid waste landfills and agricultural pollutants and R&D on contamination mitigation
Undertake mapping of water availability, Minor surface water bodies, Aquifers in time and space, and Water use in conjunction with land use and land classification.
Introducing climate change into the curriculum at all school levels.
Policy Related Interventions
Modernize the Irrigation system using Drip, Sprinklers systems.
Box 6.3: Case Study -- A Sustainable approach in water management
The Community Collaborative Water Management (CCWM) is a unique process based on Integrated Water Resources Management (IWRM) principle with a focus on shared vision planning and trade-offs with a aim of providing equitable sharing of the scarce water resources by all stake holders. In contrary to the conventional method of management, the existing water management practices has lack of ownership by the community and there is an absence of grass root level institutions. In order to overcome these drawbacks, a new approach, Community Collaborative Water Management has been evolved focusing mainly on the demand side management. The CCWM will create awareness among the rural population about the water resources and enable them realise the status of water as a finite and scarce resource through various participatory exercises. The Centre of Excellence for Change (CEC) under the IAMWARM project is implementing this CCWM in model villages in Tamil Nadu. One such village is Tiruvampattu village in Villupuram district with a population of 5,100. The village has 8 tanks with a total capacity of 0.935 Million cubic metre. The crops cultivated are Paddy, Ground nut, Pulses, Sugarcane and Mango. The Water Budgeting exercise was carried out with the involvement of the Community. This exercise was done after sensiting the community about water, conducting water walk (Transect Walk) along with the cross-section of all the stakeholders and developing a „Vision Building‟ for the village through Participatory Rural Appraisal (PRA) exercise. The water deficit in the village was worked out as 11,700 lakh litres. The people realized the need for a long term Action plan for water management in their village. The people resolved to adopt water saving technologies. The women group also resolved to ensure no wastage while collecting water from the drinking water taps in the village. The village people are now able to prepare the water budgeting exercise on their own before the commencement every season and plan their cultivation Activities based on the water availability at that time and after taking all other sectoral uses into consideration. (Source : Centre of Excellence for Change,PWD,GoTN)
Tamil Nadu State Action Plan for Climate Change
103
Pricing and Regulation: Lack of metering is an issue. Piped water usage for domestic and drinking water can be subjected to metering and thereby restricting unnecessary wastage of water can be avoided
Undertake periodical census of minor irrigation projects to check sustainability and also to detect dis-functionalities and to implement remedial measures
Variable Irrigation Water Tax on surface water use and ground water use might be levied, depending on the land holding size, to minimise use of ground water for irrigation and also to reduce wastage of the water obtained through surface resources. This may also encourage small and medium farmers to have their own water storage structure to irrigate their fields.
Extend compulsory rain water harvesting regulation in individual houses in all towns
Establishment and capacity strengthening of Institutions, Water Users Associations (WUAs) and Systems to achieve sub basin level Integrated Water Resources Management (including planning, monitoring and decision support systems to address the impact of climate change).
The contribution of NGO‟s in climate change adaptation programme is to support the government in formulating adaptation strategies and setting priorities. In setting priorities, it will be important for the NGO‟s to target the most vulnerable regions, vulnerable groups and sectors most affected by climate change.The NGO‟s play a vital role in creating awareness among the public at the local level through village knowledge centres and participatory action studies.
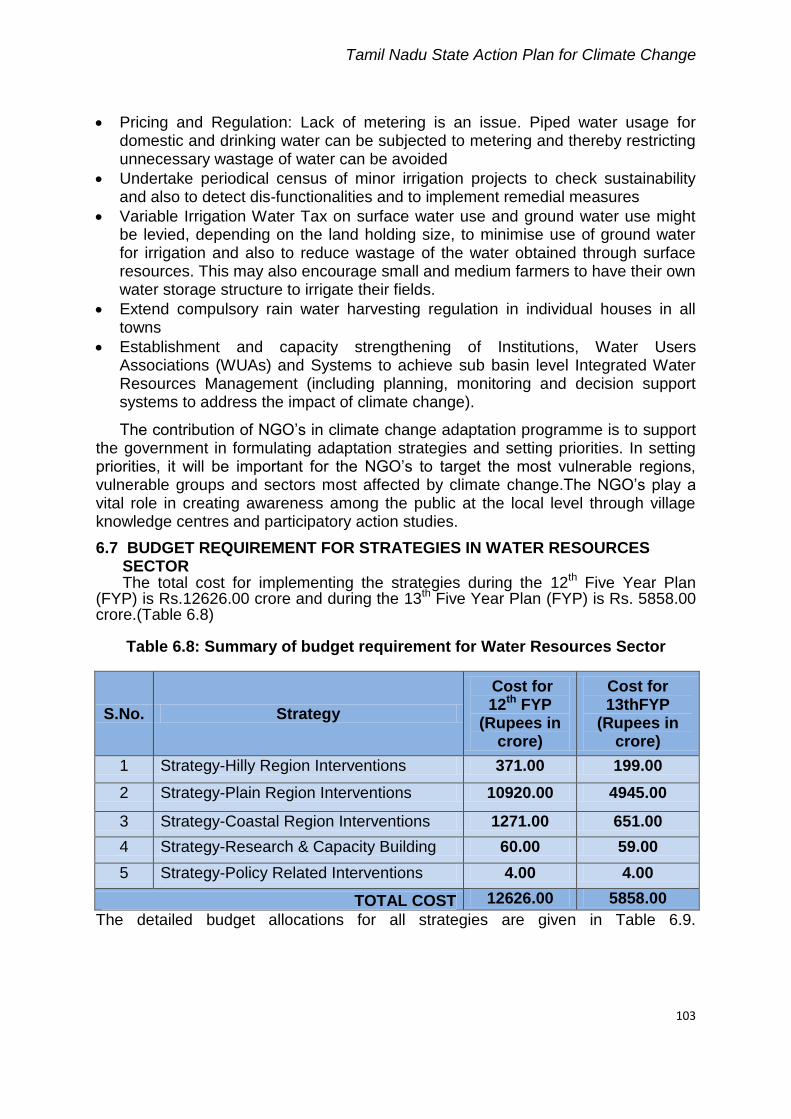
6.7 BUDGET REQUIREMENT FOR STRATEGIES IN WATER RESOURCES SECTOR The total cost for implementing the strategies during the 12th Five Year Plan (FYP) is Rs.12626.00 crore and during the 13th Five Year Plan (FYP) is Rs. 5858.00 crore.(Table 6.8)
Table 6.8: Summary of budget requirement for Water Resources Sector
S.No. Strategy
Cost for 12th FYP
(Rupees in crore)
Cost for 13thFYP
(Rupees in crore)
1 Strategy-Hilly Region Interventions 371.00 199.00
2 Strategy-Plain Region Interventions 10920.00 4945.00
3 Strategy-Coastal Region Interventions 1271.00 651.00
4 Strategy-Research & Capacity Building 60.00 59.00
5 Strategy-Policy Related Interventions 4.00 4.00
TOTAL COST 12626.00 5858.00
The detailed budget allocations for all strategies are given in Table 6.9.

Tamil Nadu State Action Plan for Climate Change
104
Table 6.9: Detailed Budget for strategies in Water Resources Sector
S. No
Strategy Agency
Cost for
12th FYP (Rupees in
crore)
Cost for
13th FYP (Rupees in
crore)
Strategy 1: Hilly Region Interventions
1.1 Undertaking rain water harvesting measures along the hill slopes PR,RD, DoF & WRD 1 1
1.2 Construction of Water harvesting structures such as check dams, recharge shafts, farm ponds, etc.
PR, RD, WRD, TWAD & DoF
200 100
1.3 Repairing, renovating and restoring tanks and traditional water bodies PR, RD & WRD 15 10
1.4 Interlinking of Rivers, and Construction of Mini Reservoirs WRD 50 35
1.5 Desilting & Widening of Channels and Drains, strengthening of embankments & removing water weeds from channels
WRD 100 50
1.6 Strengthening infrastructure to manage disaster Concerned Line Depts, 5 3
Sub Total 371 199
Strategy 2: Plain Region Interventions
2.1 Interlinking of Rivers and Construction of Reservoirs WRD 8637 4416
2.2 Construction of anicuts and regulators WRD 290 30
2.3 Construction of Water harvesting structures such as check dams, recharge shafts, farm ponds, etc.
PR, RD, DoF, WRD & TWAD
800 250
2.4 Desilting & Widening of Channels and Drains, strengthening of embankments & removing water weeds from channels
WRD 750 150
2.5 Repairing, renovating,restoring tanks and traditional water bodies PR, RD & WRD 433 89
2.6 Strengthening infrastructure to manage disaster Concerned Line Depts 10 10
Sub Total 10920 4945
Strategy 3: Coastal Region Interventions
3.1 Construction and rehabilitation of tail end regulators WRD 400 300
3.2 Desalination plants TWAD, CMWSSB 100 100

Tamil Nadu State Action Plan for Climate Change
105
S. No
Strategy Agency
Cost for 12th FYP
(Rupees in crore)
Cost for 13th FYP
(Rupees in crore)
3.3 Construction of Water harvesting structures - check dams farm ponds, etc. RD,WRD,TWAD DoF 300 150
3.4 Desilting & Widening of Channels and Drains, strengthening of embankments & removing water weeds from channels
WRD 400 50
3.5 Repairing, renovating &restoring tanks and traditional water bodies PR, RD & WRD 1 1
3.6 Strengthening infrastructure to manage disaster Concerned Line Dept 70 50
Sub Total 1271 651
4 Strategy 4: Research & Capacity Building
4.1 Establish high resolution weather monitoring, river inflow monitoring, hydrograph monitoring, and early warning system for floods
WRD 50 50
4.2 Assess water availability by region, assess current demand of water by sector and future demand by sector by factoring in Climate change for short, medium and long term time lines
WRD, IIT Madras & TNAU
2 1
4.3 Monitor quality of water to understand the impacts of warming of the atmosphere and for providing remedies
TNPCB 5 5
4.4 Identify vulnerable areas of ground water contamination by point sources of industrial, municipal solid waste landfills and agricultural pollutants
TWAD & TNPCB 1 1
4.5 Map water availability, Minor surface water bodies, Aquifers in time and space, and Water use in conjunction with land use and land classification
PR, RD & WRD 2 2
Sub Total 60 59
5 Strategy 5: Policy Related Interventions
5.1 Introduce pricing regulation for use of piped water for domestic use and drinking water
PR&RD & TWAD 1
1
5.2 Undertake periodical census of medium & minor irrigation projects to check sustainability,detect dis-functionalities & implement remedial measures
WRD
3
3
Sub Total 4 4
GRAND TOTAL 12626 5858
Related Documents


![43253-026: Karnataka Integrated and Sustainable Water ......Cauvery), its water resources are limited (about 1,072 cubic meters [m3] per person per year in eastward flowing rivers,](https://static.cupdf.com/doc/110x72/5ff5561a1c073b67ca5e5b20/43253-026-karnataka-integrated-and-sustainable-water-cauvery-its-water.jpg)


