The PAR Framework Proof of Concept: Initial Findings from a Multi-Institutional Analysis of Federated Postsecondary Data Journal of Asynchronous Learning Networks, Volume 16: Issue 3 63 THE PAR FRAMEWORK PROOF OF CONCEPT: INITIAL FINDINGS FROM A MULTI- INSTITUTIONAL ANALYSIS OF FEDERATED POSTSECONDARY DATA Phil Ice American Public University System Sebastián Díaz West Virginia University Karen Swan University of Illinois Springfield Melissa Burgess American Public University System Mike Sharkey The Apollo Group (University of Phoenix) Jonathan Sherrill Colorado Community College System Dan Huston Rio Salado Community College Hae Okimoto University of Hawaii System ABSTRACT Despite high enrollment numbers, postsecondary completion rates have generally remained unchanged for the past 30 years and half of these students do not attain a degree within six years of initial enrollment. Although online learning has provided students with a convenient alternative to face-to-face instruction, there remain significant questions regarding online learning program quality, particularly when considering patterns of student retention and progression. By aggregating student and course data into one dataset, six postsecondary institutions worked together toward determining factors that contribute to retention, progression, and completion of online learners with specific purposes: (1) to reach consensus on a common set of variables among the six institutions that inform student retention, progression and completion; (2) to explore advantages and/or disadvantages of particular statistical and methodological approaches to assessing factors related to retention, progression and completion. In the relatively short timeframe of the study, 33 convenience variables informing retention, progression, and completion were identified and defined by the six participating institutions. This initiative, named the Predictive Analytics Reporting Framework (PAR) and the initial statistical analyses utilized are described in this paper. KEYWORDS retention, progression, completion, online learning, postsecondary, predictive analytics, data repositories

Welcome message from author
This document is posted to help you gain knowledge. Please leave a comment to let me know what you think about it! Share it to your friends and learn new things together.
Transcript

The PAR Framework Proof of Concept: Initial Findings from a Multi-Institutional Analysis of Federated Postsecondary Data
Journal of Asynchronous Learning Networks, Volume 16: Issue 3 63
THE PAR FRAMEWORK PROOF OF CONCEPT: INITIAL FINDINGS FROM A MULTI-INSTITUTIONAL ANALYSIS OF FEDERATED POSTSECONDARY DATA
Phil IceAmerican Public University SystemSebastián DíazWest Virginia UniversityKaren SwanUniversity of Illinois SpringfieldMelissa BurgessAmerican Public University SystemMike SharkeyThe Apollo Group (University of Phoenix) Jonathan SherrillColorado Community College SystemDan HustonRio Salado Community CollegeHae OkimotoUniversity of Hawaii System
ABSTRACTDespite high enrollment numbers, postsecondary completion rates have generally remained unchanged for the past 30 years and half of these students do not attain a degree within six years of initial enrollment.Although online learning has provided students with a convenient alternative to face-to-face instruction, there remain significant questions regarding online learning program quality, particularly when considering patterns of student retention and progression. By aggregating student and course data into one dataset, six postsecondary institutions worked together toward determining factors that contribute to retention, progression, and completion of online learners with specific purposes: (1) to reach consensus ona common set of variables among the six institutions that inform student retention, progression and completion; (2) to explore advantages and/or disadvantages of particular statistical and methodological approaches to assessing factors related to retention, progression and completion. In the relatively short timeframe of the study, 33 convenience variables informing retention, progression, and completion were identified and defined by the six participating institutions. This initiative, named the Predictive Analytics Reporting Framework (PAR) and the initial statistical analyses utilized are described in this paper.KEYWORDSretention, progression, completion, online learning, postsecondary, predictive analytics, data repositories
The PAR Framework Proof of Concept: Initial Findings from a Multi-Institutional Analysis of Federated Postsecondary Data
64 Journal of Asynchronous Learning Networks, Volume 16: Issue 3
I. INTRODUCTIONDespite high college enrollment numbers, postsecondary completion rates have generally remained unchanged for the past 30 years [1]. Even more disturbing is that out of all students who enroll in postsecondary education, over half do not attain a degree or credential within six years of initial enrollment [2].Postsecondary institutions have implemented retention, progression, and completion support measures for decades. However, these measures have typically been established against traditional face-to-face learning frameworks, thus producing misaligned information for decision-makers. Further, institutional measures have underutilized the capacity to predict factors contributing to retention, progression, and completion via statistical analyses. Already a staple strategy in the online business sector, predictive analytics is being realized as a strategy to inform decision-making related to student progress by proactively looking for opportunities to maximize student achievement. In the academic context these types of decision-making may take the form of business intelligence, learning outcomes assessment, predicting retention, gaining insight into qualitative data through semantic analysis, marketing, informing student success, and a host of other approaches that serve diversified informational needs [3].With the potential to produce an array of actionable data points, postsecondary institutions are beginning to realize the affordances of sharing previously siloed isolated information; hence maximizing the value of the data when viewed across institutions. The Predictive Analytics Reporting (PAR) Framework Proof of Concept project employed this practice by aggregating data from multiple institutions into a single federated dataset in an effort to find new ways of helping students succeed. Through this collective action, postsecondary institutions can collaboratively share experiences, knowledge, and information, thus providing opportunities to ask questions through well-designed research and to discover answers to these questions through multiple lenses.Shared, federated datasets among multiple postsecondary institutions have to potential to promote the development of effective and efficient benchmarking strategies that increase retention, progression, and completion. In the area of developmental education in particular, shared datasets among postsecondary institutions provide opportunities to better inform policy oriented decision-making for at-risk populations.Postsecondary institutions are increasingly placing a fervent emphasis on accreditation and accountability. As policy-makers continue to struggle with definitions of quality in terms of learning effectiveness in face-to-face classrooms, a new set of challenges has emerged in online learning environments. Defining quality—in either environment, is heavily reflective of current economic and societal trends; therefore establishing definitions and associated indicators continues to be a fluid undertaking [4]. Recent innovative developments against a grim economic backdrop have led to extensive policy changes regarding accreditation criteria. The far-reaching effects of these policy changes have additional implications for aligning online learning content to goals and objectives and for evidencing learning effectiveness [5].
A. PAR OverviewThe Predictive Analytics Reporting (PAR) Framework is a project funded by the Bill & Melinda Gates foundation and guided by a management team from the WICHE Cooperative for Educational Technologies (WCET). WCET is a self-funded unit of the Western Interstate Commission for Higher Education (WICHE), a regional compact of fifteen Western states that began operations in 1953 to facilitate resource sharing among the higher education systems in the West. The PAR Framework aims to identify factors impacting loss, progression and completion for postsecondary students, with particular emphasis on students aged 26 and under—a subgroup of particular interest to the grantors who funded this research. In guiding PAR research initiatives, the following two questions were used as a governing paradigm:
The PAR Framework Proof of Concept: Initial Findings from a Multi-Institutional Analysis of Federated Postsecondary Data
Journal of Asynchronous Learning Networks, Volume 16: Issue 3 65
1: What factors influence student loss (as measured in terms of retention)?
1a: How do these factors differ from indicators of completion?1b: Are there unique demographic, pedagogical or institutional factors affecting these indicators?
2: What factors influence momentum (as measured by timely student progression)?2a: How do these differ from profiles of students who are on delayed completion tracks?2b: Are there unique demographic, pedagogical or institutional factors associated with these indicators?
In alignment with its established goals, PAR investigators combined student and course data from six institutions representing the community college, public and private four-year, and for-profit categories into one large, federated dataset with preliminary purposes: (1) to test whether common variables could be applied to data from such disparate institutions, (2) to develop a general predictive model for student retention, progression, and completion, and (3) to discover advantages and/or disadvantages that employing particular statistical and methodological approaches may have on federated datasets. The six participating institutions included American Public University System (APUS), Colorado Community College System, Rio Salado Community College, University of Hawaii System, University of Illinois Springfield, and the University of Phoenix. The project was guided by a management team from the WICHE Cooperative for Educational Technologies (WCET).
B. Purpose of the StudyThe purpose of this study was to create a multi-institutional postsecondary dataset to explore and analyze factors affecting student retention, progression, and completion and to examine future pathways to make predictive analytical solutions available for the broadest number of institutional stakeholders. By aggregating datasets from multiple institutions and applying advanced statistical modeling to identify patterns that predict student performance, barriers to student success can be identified and addressed.Further, more attention can be focused on identifying variables that predictably and reliably improve student progression and completion.Specific goals for the Proof of Concept included:
Demonstrating the tenability of federating and aggregating multi-institutional data sets to be data-mined with the intention of using results to inform decision making regarding student retention, progression, and completion;Creating a data model of variables from the contributions of all participating institutions that have been normalized and commonly defined;Compiling results of federation, analysis, reporting and interpretation efforts associated with this pilot with the intention of offering institutional partners guidance and insights on how to use the results of predictive analyses in decision-making processes, as viewed through the lenses of loss and momentum.
The analysis of the aggregated dataset (n > 3,000,000 course records and n > 640,000 student records)supported the value of exploring statistical and methodological phenomena that can inform future approaches to the use of predictive analytics in online learning. The following research questions, were guided by the paradigmatic goals of PAR and viewed as a first step in the exploration of the federated data set:RQ1: As evidenced by multiple statistical methods employing Exploratory Data Analysis (EDA) approaches, what [demographic and academic] factors are most closely associated with online students’proclivity to remain actively enrolled within an institution?RQ2: When conducting multiple statistical techniques that comprise EDA, what advantages and
The PAR Framework Proof of Concept: Initial Findings from a Multi-Institutional Analysis of Federated Postsecondary Data
66 Journal of Asynchronous Learning Networks, Volume 16: Issue 3
disadvantages are revealed for each method in regards to their efficacy in providing actionable findings for stakeholders in these institutions?
C. Organization of Remaining SectionsThe outline of the article is as follows: Section II provides a synthesis of existing literature in terms of: (1) definitions and measures of student retention, progression and completion in online environments; (2) federated repositories of data and knowledge management in higher education; (3) general trends in analytics for online learning; and (4) general trends in need for increased accountability in higher education. Section III presents the methods and procedures employed toward PAR Framework validation and elicitation of initial findings. Section IV presents the results of the project against the proposed research questions related to retention, progression, and completion. Section V provides a discussion of the results and associated implications. Section VI offers concluding thoughts and next steps planned for the project. As previously mentioned, this study represents a Proof-of-Concept; therefore readers are encouraged to acknowledge this notion and remain informed of future advances regarding the PAR Framework project.
II. LITERATURE REVIEWTo date, evidence describing the effectiveness of online learning has been based largely upon studies featuring individual programs in single institutions. While informative, these studies fail to provide the holistic perspective that can be achieved when analyzing comparable data sets from multiple institutions. By working in isolation, these institutions embark upon this development without collective stakeholder input, thus producing definitions that are either narrowly-defined, or too specific to apply to increasingly diverse populations and instructional delivery platforms. The review of literature attempts to provide insight to areas associated with the aforementioned practices; to shed light on past and current rationales and decisions regarding data; toward paving new directions using predicative analytics.
A. Definitions and Measures of Student Retention, Progression and Completion in Postsecondary Online LearningA review of the literature reveals that attempts to establish singular definitions for many of the constructs germane to this study are at best, difficult. For example, multiple definitions and measures exist among postsecondary institutions for student retention, progression and completion [6-9]. Commonly misunderstood, these various definitions and measures of retention, progression and completion may inadvertently produce completion rates that shine a more positive light on one type of institution or another. For example, both four-year and community colleges are required to report their respective completion rates to the U.S. Department of Education based upon the definition of completion as “the percentage of first-time, full-time, degree seeking enrolled students who graduate after 150 percent of the normal time for completion: six years for four-year and three years for two-year colleges and 200 percent of the normal time it takes to complete a degree” [10]. The application of this overarching definition fails to account for students attending part time, who are returning students, who enrolled in developmental education courses that extend the time from first enrollment to completion, who have not declared a major, and/or who have transferred from another institution. This formula particularly works against community colleges which provide invaluable educational opportunities to students who might otherwise not have them.In terms of the current study, PAR Framework Investigators experienced similar inconsistencies in the identification and definitions of multiple variables germane to retention, progression and completion. For example, while the Academic Status categorical variable (active, inactive, graduated) addresses completion and retention, other variables such as degree hours completed and attempted also help inform this phenomenon. The PAR Framework also allowed, in an a priori fashion, for the possibility that combinations of variables (i.e. multivariate measures) might arise from the analyses as being particularly informative. In summary, although there were attempts to identify single variables within the original list
The PAR Framework Proof of Concept: Initial Findings from a Multi-Institutional Analysis of Federated Postsecondary Data
Journal of Asynchronous Learning Networks, Volume 16: Issue 3 67
of 33 that addressed retention, progression and completion, it was also recognized that the analyses might reveal alternative measures (See Appendix A for the 33 variables and associated definitions).Also unique to this study was a focus on the learning environment. Increasing numbers of postsecondary students enrolled in online courses have prompted many postsecondary institutions to prioritize online learning as an essential and critical component in long-term strategic planning [10]. In their 2011 report, Going the Distance, Online Education in the United States, Allen and Seaman state that the number of students enrolled in postsecondary online courses currently exceeds 6 million, thereby denoting that nearly one-third of all students in postsecondary education are taking at least one online course in the most recent year [11]. Further, findings by the National Center for Education Statistics [12] confirm that between 2000 and 2008, the percentage of undergraduates enrolled in at least one online learning class increased from eight percent to 20 percent, and the percentage enrolled in an online learning degree program doubled from two percent to four percent. These figures point to the need for infrastructural shifts that will effectively and efficiently accommodate online learning, especially in terms of retention, progression and completion.While continued exploration of factors related to face-to-face student retention, progression, and completion remains extremely critical, the demand for online learning also prompts attention to these issues. Existing studies on retention, progression, and completion have been largely established against traditional face-to-face learning frameworks. For example, comparisons of face-to-face to online student retention rates among postsecondary institutions have been reported that retention in online courses and programs ranges anywhere from 5% to as much as 87% below retention in face-to-face courses and programs [13-15]. Early research regarding online learning failed to acknowledge differences between face-to-face and online learning in terms of: research designs, student demographics, and methods of calculating and reporting completion [16]; thereby potentially presenting unbalanced comparisonsbetween the two instructional delivery modalities [17, 18-20]. Within the rapidly-growing area of online learning alone, there exist various platforms and modalities from which students can choose to receive instruction. Hence, comparative studies of this nature often result in a series of catalytic misinterpretations and misrepresentations of data, ultimately leading to misdirected solutions that fall exceedingly short of intended outcomes. Furthermore, comparative studies conducted on online and face-to-face retention expose yet another unsettling notion—the continual stifling of results that could better inform online retention, progression, and completion. Researchers offer several explanations and recommendations for overcoming this obstacle. Kuh and Ikenberry [21] posit that rather than exhibiting a genuine desire to become data-driven institutions, this research is largely due to institutions facing accreditation or other external pressures, forstudent learning to be quickly evidenced and reported. Ice & Burgess [3] assert that the alacrity and extent to which appropriate development takes place directly correlates to society’s current social and economic backdrop. Diaz [22] supports the ability to compare and contrast academic programs—especially with emerging technologies that are making it nearly effortless to merge and compare data. He further recommends that
rather than allowing fear to guide our approaches to evaluation, we should embrace such efforts with a deep conviction that the purpose of evaluating programs is not to label [institutions] with simplistic good/bad dichotomies, but instead to highlight their unique strengths so that students can find a good fit with the institution (p. 7).
The increasing demand for online learning, measures for online retention, progression, and completion are now a top priority for major grantors and postsecondary institutions, yet robust predictive measurements and methods remain scant. This elusiveness implies a paucity of relevant data, which further exposes the limitations that individually-established definitions, categories, and measures of student retention, progression, and completion can incur [23-25].A large portion of the literature regarding retention strategies and measurements is used widely in the
The PAR Framework Proof of Concept: Initial Findings from a Multi-Institutional Analysis of Federated Postsecondary Data
68 Journal of Asynchronous Learning Networks, Volume 16: Issue 3
online business sector. Much of the same logic to determine online customer retention can be applied to online student retention. Kaliski, Booker, & Schumann [26] proposed a potential architecture using a business intelligence methodology for capturing a robust array of student online activity and using this data to adapt instruction according to the learner’s needs. As defined by Stiffler [27], Business Intelligence (BI) is “a system for analyzing collected data, with the purpose of providing a better view of an organization's operations to ultimately improve and enhance decision-making, agility and performance” (p. 65). Although much nomenclature from the business sector is easily translated to education Bejou [28] and Giroux [29] cautions overdependence on the business sector, stating that although there are stark similarities, ‘‘colleges and universities do not simply produce knowledge and new perspectives for students; they also play an influential role in shaping their identities, values, and sense of what it means to become citizens of the world’’ (p. 674). Giroux further emphasizes this premonition by inferring that “higher education might have always had a ‘‘hidden’’ connection with capitalistic models and practices that many people knew existed, [but] was something that was not meant to be spotlighted” (p. 677).
B. Federated Repositories of Data and Knowledge Management in Higher EducationOver a decade ago, Wagner (2000) envisaged factors such as organizational size and complexity [would accelerate] the need to consciously manage knowledge across time and space [30]. In recent years this need has never been more apparent and critical in postsecondary education. One explanation lending to the gradual realization of the need to federate data in academia, however, is partly due to the organizational hurdles for accessing multiple data sources and combining them into a single [31]repository. There are similar trends occurring in public K12 education [32] that inform our attempts at data federation in the university. Efforts to assign identifiers to students in public K12 schools allow longitudinal analysis of achievement data throughout a new conceptual continuum ranging from Kindergarten through graduate school.Given an organization’s critical competency to create conditions that both generate new knowledge and help it to be freely shared [33], federated data bear implications well beyond the types of analysesconducted in this study. Over time, the educational enterprise will adopt more comprehensive Knowledge Management approaches to informing student retention, progression and completion. Knowledge Management (KM) centers on the leveraging of collective wisdom to increase responsiveness and innovation [34]. KM involves a deliberate and systematic coordination of people, technology, processes, and organizational structure to add value through reuse and innovation [35]. Eventually, our current manual data analyses will be automated using a larger system of Enterprise Knowledge Management. For that reason, initiatives like the PAR Framework will eventually inform the designs of these KM systemsthat will inform decision-making, planning and evaluation in academia.
C. General Trends in Analytics for Online LearningThe explosion of “big data” exposes a myriad of research and evaluation opportunities—especially in online learning environments. Big data analytics has largely focused on data warehouses where there is an overabundance of metadata to analyze, such as repositories, websites, and web-user activity where tracking and analyzing are uncomplicated. Testing assumptions, exploring patterns, answering questions, resource discovery, metadata manipulation, interoperability and examining changes, are primary motivators behind collecting big data. The Gartner Predicts 2012 [36] report how IT departments will play a major role in the timeliness of both the collecting and use of big data in one of the predictions,
Through 2015, more than 85 percent of Fortune 500 organizations will fail to effectively exploit big data for competitive advantage. Current trends in smart devices and growing Internet connectivity are creating significant increases in the volume of data available, but the complexity, variety and velocity with which it is delivered combine to amplify the problem substantially beyond the simple issues of volume implied by the popular term "big data." Collecting and analyzing the data is not enough — it must be presented in a timely fashion so that decisions are

The PAR Framework Proof of Concept: Initial Findings from a Multi-Institutional Analysis of Federated Postsecondary Data
Journal of Asynchronous Learning Networks, Volume 16: Issue 3 69
made as a direct consequence that have a material impact on the productivity, profitability or efficiency of the organization. Most organizations are ill prepared to address both the technical and management challenges posed by big data; as a direct result, few will be able to effectively exploit this trend for competitive advantage [36].
D. General Trends in Need for Increased Accountability in Higher EducationAlthough accrediting agencies and schools assess the academic quality of online learning in multiple ways, federal law and regulations do not require accrediting agencies to have separate standards for reviewing online learning. Criteria used to review online learning programs are often either the same criteria used to evaluate face-to-face programs, or alternatively, the criteria vary considerably among online programs. Financial Aid presents yet another disparity in how policies and procedures are appliedto online learning. Despite the lack of sufficient online learning data in recent years, the National Center for Education Statistics (NCES) will be collecting survey data from 2011 through 2013 on several aspects of online learning. Disappointingly, the Office of Federal Student Aid (FSA), responsible for monitoring Title IV compliance, not given the opportunity to provide input on data that would inform financial aid opportunities for online students, is therefore are unsure how the department will benefit from the collected data.To conclude, our challenges to identifying common variables for multiple institutions and to conducting analytics of federated datasets for online learning parallel a broader set of challenges that result from a shift to a globalized knowledge economy. Not only must institutions of higher education grapple with the task of revising curricula for the preparation of knowledge workers, these colleges and universities must also make changes in how to deal with the deluge of data resulting from advances in computational technology and increased attention to transparency and accountability. Much like sectors outside of academia, we need effective models for how to collect, analyze and disseminate data and information that inform postsecondary efficacy and efficiency.
III. METHODOLOGYA. Inclusion in the DatasetThe PAR Framework Proof-of-Concept dataset included all students pursuing an undergraduate degree at the six participating institutions who had taken at least one fully online course in 2010. . For each of these students, all online course activity was captured including developmental courses. A count of all credits attempted and completed during the data collection year, regardless of delivery modality, was also captured. Academic status (graduated, active or inactive), our measure of completion or retention, was measured in the summer of 2011. Although information was collected at both the student level and corresponding course level for students who qualified for inclusion in the dataset, this article focuses on the pertinent variables at the student level.
B. DemographicsData for these analyses include (n = 661,705) student records. Most of these records are from private-for-profit institutions (n = 550,172; 83.1%). Community college records comprise 13.8% (n = 91,128) of records, while public 4-year records reflect a very small proportion (n = 20,405; 3.1%). Albeit relatively small in proportion, the numbers of student records from community college and 4-year public institutions each reflect a respectable absolute sample size regardless.Hispanic-Related Ethnicity was assessed given its conventional use for IPEDS reporting. Hispanic students comprise 7.8% (n = 51,832) of student records, while non-Hispanics comprise 66.4% (n =439,343). For a significant proportion of student records (n = 170,530; 25.8%), Hispanic-related ethnicity was unknown.Females comprise almost two-thirds of student records (n = 428,048; 64.7%). White students comprise

The PAR Framework Proof of Concept: Initial Findings from a Multi-Institutional Analysis of Federated Postsecondary Data
70 Journal of Asynchronous Learning Networks, Volume 16: Issue 3
the largest race category (n = 290,124; 43.8%), followed by those for whom race is unknown and/or not available (n = 172,711; 26.1%); Blacks (n = 105,712; 16.0%); and Hispanic/Latinos (n = 51,137; 7.8%). Several race categories represented less than three percent of total student records: (Asian: 2.4%; Multiple Races: 1.5%; Hawaiian or Pacific Islander: 1.2%).Academic status is categorized as active, graduated, or inactive. The majority of student records reflect an individual who has active status with the institution (n = 282,489; 42.7%). A slightly smaller percentage of students are labeled inactive (n = 264,255; 39.9%), and 17.4% (n = 114,961) attained graduation during the scope of the study.Students in our sample completed, on average, 5.94 (SD = 8.15) courses by the end of the scope of time examined. On average, students had attempted 14.60 degree hours (SD = 9.37) and completed respectively 11.73 hours (SD = 9.87). The average transfer credits for students was 13.09 (SD = 20.35).The average age of students in our sample is 32.43 (SD = 9.32). Roughly one-third of students were 26 years of age or under (n = 205,836; 31.1%), a demography that is of particular interest to the funders of this project.
C. ProceduresAs previously mentioned the Community of Inquiry (CoI) Framework was used as a guide to develop the PAR Framework and is parsed into three phases: (1) Inception Phase; (2) Production Phase; and (3) Delivery Phase.
1. Inception PhaseIn the Inception phase, project goals were affirmed, and timelines and benchmarks agreed upon by all stakeholders. The major tasks in this phase were to obtain institutional review board (IRB) approval and to describe the database structure for federation of data from the six institutions. Timelines for the remainder of the project were based on estimates for time to delivery established in this phase, with IRB timelines serving as a determining factor. The process of data collection revealed a diversity of variables that each institution tracked regarding retention, progression, and completion for students taking online courses. The diversity of the participating institutions served to provide confidence that the methods developed through this project were applicable across higher education contexts; therefore upon this discovery, the investigators and institutional participants agreed to commonly identify and define the selected variables.
2. Production PhaseThe second phase focused on federation activities (e.g. validation, review for completeness, and federated database development), resulting in the submission of comprehensive data sets from the six partner institutions to the project’s technical project manager. Once the federation of data was achieved, SQL scripting for data sorting and pushes to SPSS Modeler were applied. This application was followed by an examination and sorting of descriptive data, application of multiple regression techniques, decision tree analysis, and neural network analysis. Figure 1A below presents the PAR Framework 5-Step Process Model used within the production phase.

The PAR Framework Proof of Concept: Initial Findings from a Multi-Institutional Analysis of Federated Postsecondary Data
Journal of Asynchronous Learning Networks, Volume 16: Issue 3 71
Figure 1A. The PAR Framework 5-Step process Model is comprised of five stages including identification of variables, federating and de-identifying records, applying data analysis, applying statistical methods, and reporting and knowledge
management.
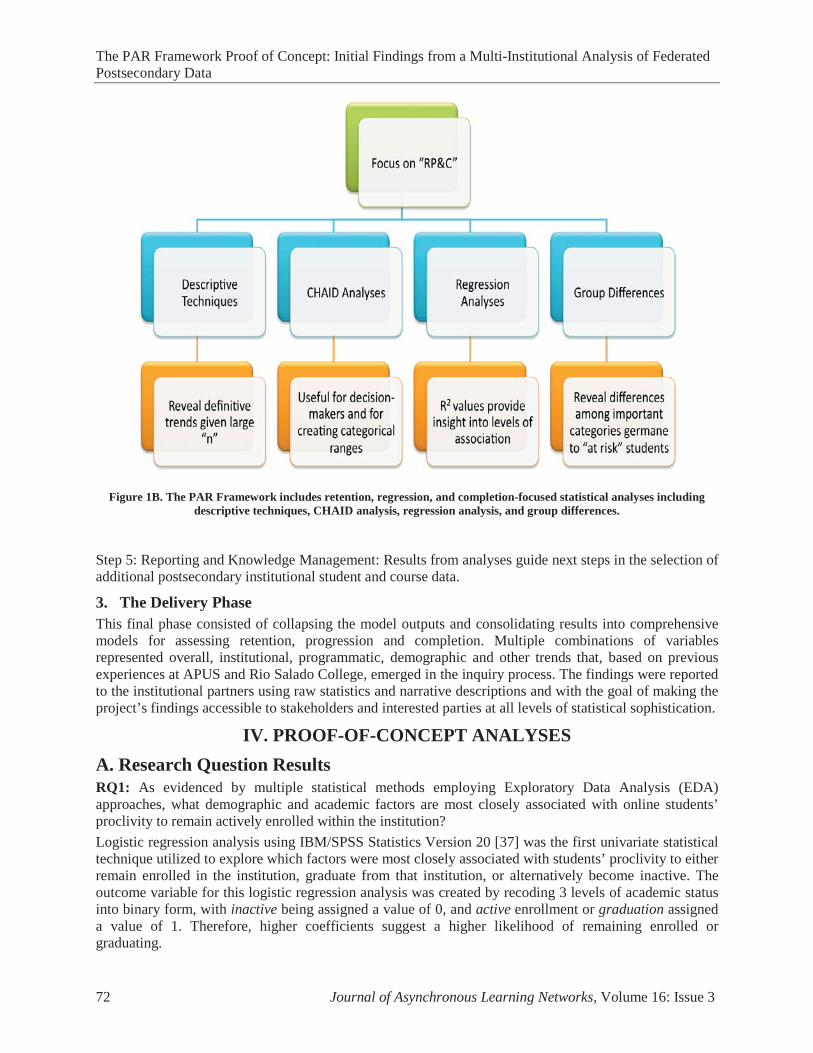
Step 1: Identification of variables. Within the production phase, 33 common variables were identified and commonly defined across the six participating institutions and consistently used across the project. The six participating institutions engaged in a rigorous schedule, including a face to face kickoff conference and regularly scheduled electronic meetings spanning more than 5 months to commonly identify and define variables informing retention, progression, and completion. Initially beginning with 29 variables, further discussions throughout the 3-month period elicited agreement on 33 variables. In addition to variable identification, a codebook was developed and continually revised following refinement of the agreed upon variables (Refer to Appendix A for a listing of the 33 variables and associated definitions).Step 2: Federation and de-identification of student records. Student records from six difference post-secondary institutions were federated, aggregated, and analyzed. Institutional participation was predicated upon the participation of each institution’s IRB officer and all FERPA requirements were adhered to ensure student anonymity.Step 3: Exploratory Data Analysis (EDA). Data were explored for patterns of variance among particular demographic and institutional characteristics.Step 4: Application of statistical methods supporting pattern analysis. The multiple statistical methods used for EDA include the following. Descriptive statistical results are explored first. Linear and logistic regression models were used to explore shared variance among the independent and dependent variables. CHAID (Chi-Square Automated Interaction Detection) is used to identify sample characteristics for which there exist marked differences in outcome variables. Statistical tests of group differences (t-tests; ANOVAs; etc.) helped further reveal these differences (Retention, Progression, and Completion-Focused Statistical Analyses, Fig. 1B).
The PAR Framework Proof of Concept: Initial Findings from a Multi-Institutional Analysis of Federated Postsecondary Data
72 Journal of Asynchronous Learning Networks, Volume 16: Issue 3
Figure 1B. The PAR Framework includes retention, regression, and completion-focused statistical analyses including descriptive techniques, CHAID analysis, regression analysis, and group differences.
Step 5: Reporting and Knowledge Management: Results from analyses guide next steps in the selection of additional postsecondary institutional student and course data.
3. The Delivery PhaseThis final phase consisted of collapsing the model outputs and consolidating results into comprehensive models for assessing retention, progression and completion. Multiple combinations of variables represented overall, institutional, programmatic, demographic and other trends that, based on previous experiences at APUS and Rio Salado College, emerged in the inquiry process. The findings were reported to the institutional partners using raw statistics and narrative descriptions and with the goal of making the project’s findings accessible to stakeholders and interested parties at all levels of statistical sophistication.
IV. PROOF-OF-CONCEPT ANALYSESA. Research Question ResultsRQ1: As evidenced by multiple statistical methods employing Exploratory Data Analysis (EDA) approaches, what demographic and academic factors are most closely associated with online students’ proclivity to remain actively enrolled within the institution?Logistic regression analysis using IBM/SPSS Statistics Version 20 [37] was the first univariate statistical technique utilized to explore which factors were most closely associated with students’ proclivity to eitherremain enrolled in the institution, graduate from that institution, or alternatively become inactive. The outcome variable for this logistic regression analysis was created by recoding 3 levels of academic status into binary form, with inactive being assigned a value of 0, and active enrollment or graduation assigned a value of 1. Therefore, higher coefficients suggest a higher likelihood of remaining enrolled or graduating.
The PAR Framework Proof of Concept: Initial Findings from a Multi-Institutional Analysis of Federated Postsecondary Data
Journal of Asynchronous Learning Networks, Volume 16: Issue 3 73
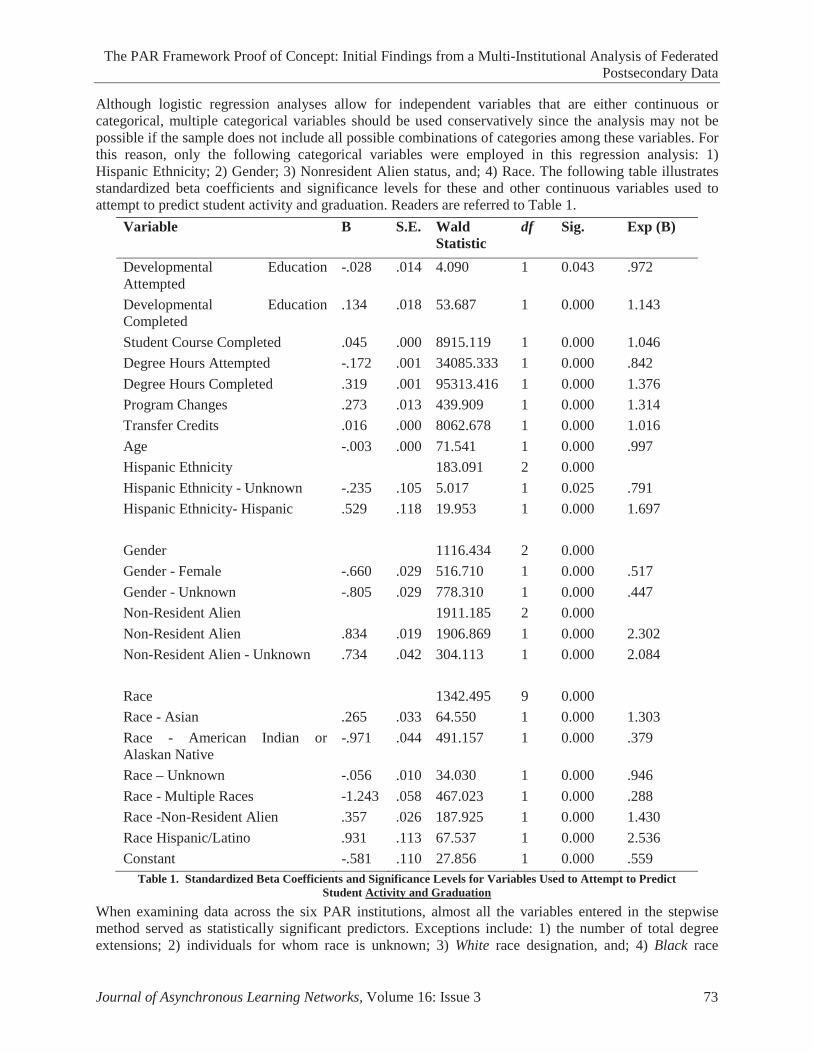
Although logistic regression analyses allow for independent variables that are either continuous or categorical, multiple categorical variables should be used conservatively since the analysis may not be possible if the sample does not include all possible combinations of categories among these variables. For this reason, only the following categorical variables were employed in this regression analysis: 1) Hispanic Ethnicity; 2) Gender; 3) Nonresident Alien status, and; 4) Race. The following table illustrates standardized beta coefficients and significance levels for these and other continuous variables used to attempt to predict student activity and graduation. Readers are referred to Table 1.
Variable B S.E. Wald Statistic
df Sig. Exp (B)
Developmental Education Attempted
-.028 .014 4.090 1 0.043 .972
Developmental Education Completed
.134 .018 53.687 1 0.000 1.143
Student Course Completed .045 .000 8915.119 1 0.000 1.046Degree Hours Attempted -.172 .001 34085.333 1 0.000 .842Degree Hours Completed .319 .001 95313.416 1 0.000 1.376Program Changes .273 .013 439.909 1 0.000 1.314Transfer Credits .016 .000 8062.678 1 0.000 1.016Age -.003 .000 71.541 1 0.000 .997Hispanic Ethnicity 183.091 2 0.000Hispanic Ethnicity - Unknown -.235 .105 5.017 1 0.025 .791Hispanic Ethnicity- Hispanic .529 .118 19.953 1 0.000 1.697
Gender 1116.434 2 0.000Gender - Female -.660 .029 516.710 1 0.000 .517Gender - Unknown -.805 .029 778.310 1 0.000 .447Non-Resident Alien 1911.185 2 0.000Non-Resident Alien .834 .019 1906.869 1 0.000 2.302Non-Resident Alien - Unknown .734 .042 304.113 1 0.000 2.084
Race 1342.495 9 0.000Race - Asian .265 .033 64.550 1 0.000 1.303Race - American Indian or Alaskan Native
-.971 .044 491.157 1 0.000 .379
Race – Unknown -.056 .010 34.030 1 0.000 .946Race - Multiple Races -1.243 .058 467.023 1 0.000 .288Race -Non-Resident Alien .357 .026 187.925 1 0.000 1.430Race Hispanic/Latino .931 .113 67.537 1 0.000 2.536Constant -.581 .110 27.856 1 0.000 .559
Table 1. Standardized Beta Coefficients and Significance Levels for Variables Used to Attempt to Predict Student
When examining data across the six PAR institutions, almost all the variables entered in the stepwise method served as statistically significant predictors. Exceptions include: 1) the number of total degree extensions; 2) individuals for whom race is unknown; 3) White race designation, and; 4) Black race
Activity and Graduation
The PAR Framework Proof of Concept: Initial Findings from a Multi-Institutional Analysis of Federated Postsecondary Data
74 Journal of Asynchronous Learning Networks, Volume 16: Issue 3
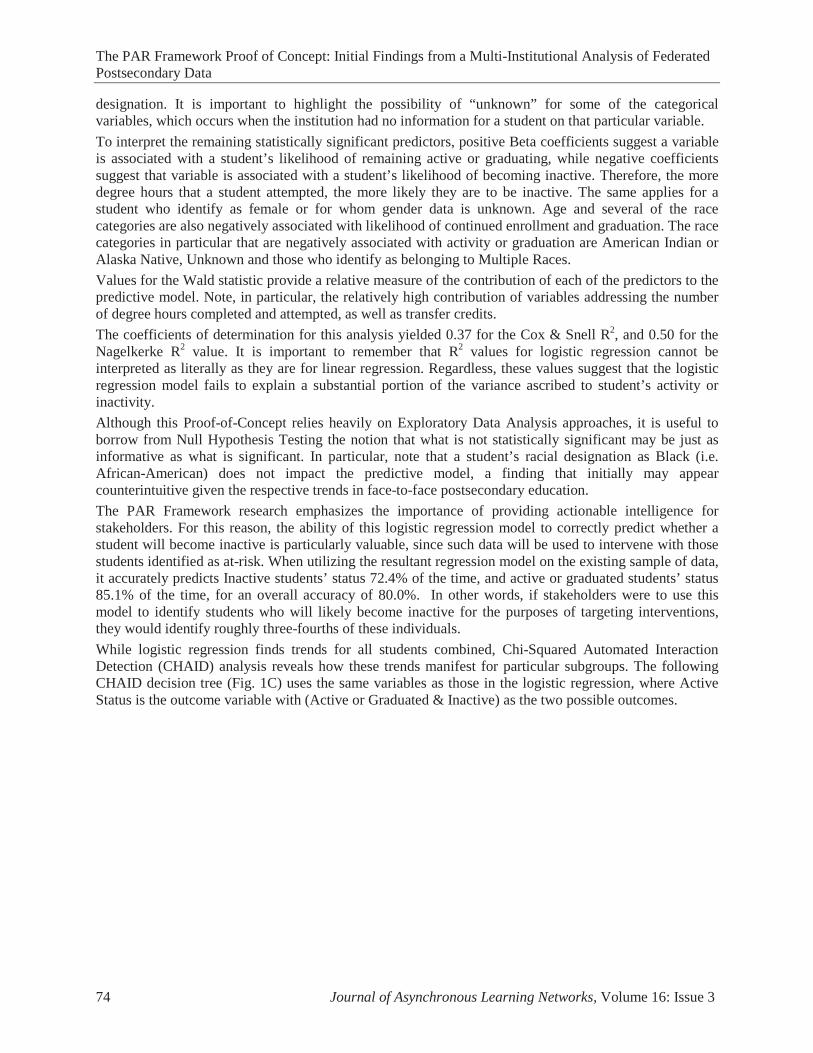
designation. It is important to highlight the possibility of “unknown” for some of the categorical variables, which occurs when the institution had no information for a student on that particular variable.To interpret the remaining statistically significant predictors, positive Beta coefficients suggest a variable is associated with a student’s likelihood of remaining active or graduating, while negative coefficients suggest that variable is associated with a student’s likelihood of becoming inactive. Therefore, the more degree hours that a student attempted, the more likely they are to be inactive. The same applies for astudent who identify as female or for whom gender data is unknown. Age and several of the race categories are also negatively associated with likelihood of continued enrollment and graduation. The race categories in particular that are negatively associated with activity or graduation are American Indian or Alaska Native, Unknown and those who identify as belonging to Multiple Races.Values for the Wald statistic provide a relative measure of the contribution of each of the predictors to the predictive model. Note, in particular, the relatively high contribution of variables addressing the number of degree hours completed and attempted, as well as transfer credits.The coefficients of determination for this analysis yielded 0.37 for the Cox & Snell R2, and 0.50 for the Nagelkerke R2 value. It is important to remember that R2 values for logistic regression cannot be interpreted as literally as they are for linear regression. Regardless, these values suggest that the logistic regression model fails to explain a substantial portion of the variance ascribed to student’s activity or inactivity.Although this Proof-of-Concept relies heavily on Exploratory Data Analysis approaches, it is useful to borrow from Null Hypothesis Testing the notion that what is not statistically significant may be just as informative as what is significant. In particular, note that a student’s racial designation as Black (i.e. African-American) does not impact the predictive model, a finding that initially may appear counterintuitive given the respective trends in face-to-face postsecondary education.The PAR Framework research emphasizes the importance of providing actionable intelligence for stakeholders. For this reason, the ability of this logistic regression model to correctly predict whether a student will become inactive is particularly valuable, since such data will be used to intervene with those students identified as at-risk. When utilizing the resultant regression model on the existing sample of data, it accurately predicts Inactive students’ status 72.4% of the time, and active or graduated students’ status 85.1% of the time, for an overall accuracy of 80.0%. In other words, if stakeholders were to use this model to identify students who will likely become inactive for the purposes of targeting interventions, they would identify roughly three-fourths of these individuals.While logistic regression finds trends for all students combined, Chi-Squared Automated Interaction Detection (CHAID) analysis reveals how these trends manifest for particular subgroups. The following CHAID decision tree (Fig. 1C) uses the same variables as those in the logistic regression, where Active Status is the outcome variable with (Active or Graduated & Inactive) as the two possible outcomes.
The PAR Framework Proof of Concept: Initial Findings from a Multi-Institutional Analysis of Federated Postsecondary Data
Journal of Asynchronous Learning Networks, Volume 16: Issue 3 75
Figure 1C. Chi-Squared Automated Interaction Detection (CHAID) analysis reveals how these trends manifest for particular subgroups.
Exhaustive CHAID analysis using SPSS Answer Tree 3.1 reveals that when examining students from all three types of institutions, the variable most highly associated with a student’s activity status is the number of degree hours completed ( df = 9; p < 0.001). For students who completed no degree hours within the scope of this study, race is the next most highly associated variable (3967.96; df = 9; p < 0.001). This is a node of particular interest since it includes students who attempted some credit hours during the scope of the study, but did not successfully earn any respective credit hours. The great majority of students belonging to this node (88.39%; n = 94,664) ended up as inactive.For White students in this subcategory-node (i.e. 0 degree hours completed), the number of program changes is the next most highly associated variable. The respective variables identified for the remaining race categories are: 1) degree Hours Attempted for Hispanic/Latino or Hawaiian or Pacific Islander students; 2) developmental courses completed for American Indian or Alaska Native students; 3) program
Category % nInactive 39.94 264255Active or Graduated 60.06 397450Total (100.00) 661705
Node 0
Category % nInactive 2.68 1990Active or Graduated 97.32 72349Total (11.23) 74339
Node 10
Category % nInactive 7.89 4026Active or Graduated 92.11 46980Total (7.71) 51006
Node 9
Category % nInactive 15.71 12008Active or Graduated 84.29 64431Total (11.55) 76439
Node 8
Category % nInactive 23.15 10033Active or Graduated 76.85 33314Total (6.55) 43347
Node 7
Category % nInactive 31.75 23161Active or Graduated 68.25 49791Total (11.02) 72952
Node 6
Category % nInactive 39.57 20950Active or Graduated 60.43 31990Total (8.00) 52940
Node 5
Category % nInactive 47.55 45604Active or Graduated 52.45 50302Total (14.49) 95906
Node 4
Category % nInactive 58.52 49206Active or Graduated 41.48 34880Total (12.71) 84086
Node 3
Category % nInactive 72.79 2613Active or Graduated 27.21 977Total (0.54) 3590
Node 2
Category % nInactive 88.39 94664Active or Graduated 11.61 12436Total (16.19) 107100
Node 1
Category % nInactive 85.45 887Active or Graduated 14.55 151Total (0.16) 1038
Node 20
Category % nInactive 43.75 35Active or Graduated 56.25 45Total (0.01) 80
Node 19
Category % nInactive 79.82 704Active or Graduated 20.18 178Total (0.13) 882
Node 18
Category % nInactive 77.87 1165Active or Graduated 22.13 331Total (0.23) 1496
Node 17
Category % nInactive 73.40 1148Active or Graduated 26.60 416Total (0.24) 1564
Node 16
Category % nInactive 84.90 1001Active or Graduated 15.10 178Total (0.18) 1179
Node 15
Category % nInactive 80.10 6095Active or Graduated 19.90 1514Total (1.15) 7609
Node 14
Category % nInactive 87.05 18942Active or Graduated 12.95 2818Total (3.29) 21760
Node 13
Category % nInactive 84.31 28438Active or Graduated 15.69 5293Total (5.10) 33731
Node 12
Category % nInactive 95.00 36249Active or Graduated 4.00 1512Total (5.71) 37761
Node 11
Activity Status Degree Hours CompletedAdj. P-value=0.0000, Chi-square=211553.9942, df=9
>26
(21,26]
(17,21]
(12,17]
(9,12]
(6,9]
(5,6]
(2,5]
(0,2]
<=0 RaceAdj. P-value=0.0000, Chi-square=3967.9640, df=9
Unknown
NonResident Alien
Hawaiin or Pacific Islander
Asian
Multiple Races
American Indian or Alaska Native
Hispanic / Latino
Black
White
Unknown

The PAR Framework Proof of Concept: Initial Findings from a Multi-Institutional Analysis of Federated Postsecondary Data
76 Journal of Asynchronous Learning Networks, Volume 16: Issue 3
changes for Black and Asian students, and; 4) transfer credits for students identified as belonging to multiple races.For students who earned up to two hours during the scope of this study, number of transfer credits was the next most highly associated variable ( df = 6; p < 0.001). The following list illustrates the other second level nodes that resulted in this CHAID analysis. For students who earned between 17 and 21 hours of credit, student courses completed was the next most highly predictive variable, and for students who earned more than 26 credit hours, non-resident alien status was the next highest predictor. For all other credit hours earned categories, degree hours attempted was the next most highly associated variable.At cursory glance, this CHAID analysis reveals that, consistent with the logistic regression, the number of degree hours completed is a variable highly associated with a student’s likelihood of remaining actively enrolled or graduating. For those students who have no degree hours completed (n = 107.100, 88.4% Inactive), race is the variable that is next most highly associated with their activity status. Since students with no degree hours completed represent 16.19% of all students in the study, the breakdowns by race provided through the CHAID decision tree can help stakeholders understand better how attrition manifests among racial subgroups.RQ2: When conducting multiple statistical techniques that comprise EDA, what advantages and disadvantages are revealed for each method in regards to their efficacy in providing actionable findings for stakeholders in these institutions?Admittedly, PAR framework stakeholders represent a diverse set of perspectives, backgrounds, and needs with respect to the data analyses. Within the 6 participating institutions, there are many stakeholders whose main interest is to obtain quantitative results that inform action and decision-making. Even within a given individual institution, however, some stakeholders may have, in contrast, broader research interests that help inform their own investigative agendas. For some stakeholders outside these institutions, the utility they primarily seek from the data analyses may be to compare and contrast the trends in retention, progression and completion across the 3 types of institutions. Both within and among the 6 participating institutions, some stakeholders have interests very focused on exploring how a particular phenomenon is influenced by a small number of variables. Given the PAR Framework’s focus on actionable intelligence, the discussion here is limited primarily to the more pragmatic perspective in which stakeholders are seeking data results that provide actionable intelligence for either intervening with students at risk, or addressing programmatic changes.CHAID analyses offer the advantage of providing data outputs that are more visually appealing and relatively easy for non-statisticians to understand. CHAID analyses also help stakeholders identify sub groups within their institutions that may be particularly at risk for becoming inactive. Whereas logistic regression provides a uni-dimensional perspective on how multiple variables impact an outcome, CHAID analyses provide a more multidimensional approach to the interrelationships of these variables. For example, our logistic regression demonstrated that degree hours completed is the most influential variable on a student’s likelihood for remaining active or having graduated. CHAID analysis similarly detected the importance of this variable. What was different about the CHAID analysis is that it identified different variables of secondary-importance depending on the number of hours a particular student had completed. We believe this type of profiling is much more useful for the stakeholders who are utilizing data for pragmatic purposes.Logistic regression, however, does offer the marked advantage of a predictive model that helps stakeholders identify students who are most likely to become inactive. This information allows educators to identify those students individually and intervene accordingly. In the case of both community college and private-for-profit institutions, the logistic model allowed stakeholders to identify at least three-fourths of students who are at-risk for becoming inactive. A better model, however, is needed for the 4-year public institutions.
The PAR Framework Proof of Concept: Initial Findings from a Multi-Institutional Analysis of Federated Postsecondary Data
Journal of Asynchronous Learning Networks, Volume 16: Issue 3 77
B. Limitations
The following limitations need to be considered carefully when attempting to generalize the results of the study to a larger population:
1. The three types of institutions examined in the study were not equally represented in terms of absolute numbers of student records. Private for-profit institutions comprise over 80% of student records. Therefore, trends in phenomena among these institutions weremore highly influenced by private-for-profit student records. PAR stakeholders did consider the option of weighting results by type of institution. Yet given this study’s goal of identifying trends among students throughout institutions, data were aggregated by student. It is important to remember that as a Proof-of-Concept, the PAR project’s purpose was to investigate the practicability of federating data in a variety of postsecondary settings. For that reason, although the sample sizes were smaller in community colleges and smallest for public 4-year institutions, all categories of institution yielded equally rich lessons-learned within that context.
2. Our ability to fully address all the relationships among the 33 established (as well as subsequent constructed) variables was limited by practical and reasonable considerations of manuscript length. The reader should note that our analyses in this study were limited to student-level data. Additional analyses were conducted on a larger set of course-level data comprised of multiple entries for single students. PAR Framework stakeholders plan to disseminate other related findings in subsequent peer-reviewed manuscripts.
3. The measure for inactivity was based on a common definition that is nuanced somewhat by institution. While some institutions had a very short time span after which a student would be designated inactive, others had more lenient standards. We decided initially to respect each institution’s particular nuanced definition for activity and inactivity, yet we now recognize in hindsight that to make comparisons among the types of institutions a common definition and respective standard are needed in subsequent studies.
4. This study relied heavily on paradigms borrowed from exploratory data analyses. However, we also utilized standard null hypothesis testing approaches to determine whether the findings were statistically significant. Clearly, the large sample sizes explored place this study in the realm of what Tukey [38] would have referred to as uncomfortable science. The primary purpose of this study was to demonstrate that institutions can federate their data repositories, and so can engage in data analysis that better informs their planning and evaluation. We are also interested, however, in potentially finding trends that can be generalized to larger populations. In doing so, we have violated a tenet of null hypothesis testing (NHT) that multiple statistical tests conducted on the same dependent variable need to compensate for potentially inflated Type I error. Given that our focus rested more strongly on identifying any and all relationships among the variables that might serve decision-makers, we ignored this particular NHT principle in the interest of exploratory data analysis.
5. Certain variables had little meaning in the context of particular types of institutions. For example, developmental education courses are almost or entirely nonexistent at the for-profit-online institutions in this study, and at one of the 4-year public institutions.

The PAR Framework Proof of Concept: Initial Findings from a Multi-Institutional Analysis of Federated Postsecondary Data
78 Journal of Asynchronous Learning Networks, Volume 16: Issue 3
V. DISCUSSIONThis study raises many questions about organizational, epistemological, and statistical issues germane to the use of inter-institutional federated data repositories. Organizationally, we believe that the PAR Framework demonstrates the practicality of federating large datasets within and among institutions. It is important to recognize that this federation project was possible due to generous support from our grantors and to substantial work conducted by the partner institutions’ personnel. Therefore, it would be naïve to ignore the resources necessary to carry out a similar initiative elsewhere. Regardless, the PAR framework demonstrates that it is possible to federate student data related to retention, progression and completion across multiple institutions.While we highlight the importance and advantages to federating data across multiple institutions, we also caution academicians to consider carefully the context of that data. Our study found both similarities as well as distinct differences in data trends when comparing each of the three types of institutions with the overall group. We believe that the intra-institutional analyses better serve more pragmatic planning and decision-making for individual colleges and universities, while inter-institutional analyses help inform postsecondary education policy.Invariably, progress towards completion of credit hours remains a very influential factor on student retention, progression and completion. Despite this overall trend among the three types of institutions, we recommend that the academic community explore these phenomena simultaneously among and within institution types. Federated data across institution types serves at least two purposes. First, it allows policymakers and stakeholders to understand how trends in the retention and progression of students enrolled in online courses manifests at the national level. Second, as postsecondary educators grapple with questions related to adoption of online (versus face-to-face) learning, these federated approaches provide invaluable insights for comparisons and contrasts. Yet we also encourage academicians to explore federated data within institution type for the purposes of identifying predictors that are better suited to specific contexts. For example, one of our PAR stakeholders from a private for-profit institution suggested using a ratio of degree hours completed to degree hours attempted as a computed variable to predict activity. Another PAR stakeholder from a 4-year public institution used factor analysis to identify linear combinations of variables. Each of these approaches will be addressed in forthcoming manuscripts.Clearly, both logistic regression and CHAID analyses offer distinct advantages to researchers and decision-makers engaging in analysis of large federated datasets. Even though these two approaches constitute the major focus of this study, we recognize there remain seemingly unlimited approaches for analyzing this data. Tests of group differences, we found, were more often than not statistically significant given our large sample sizes. One challenge we discovered with this approach is that the potential configurations of independent variables allows for a seemingly infinite number of analyses. For this reason, one of our project evaluators sagely challenged our notion that our approaches were purely exploratory. Given the seemingly infinite possibilities for group contrasts with 33 variables, we recognize that even in exploratory data analyses, some a-priori frameworks need to be established in order to limit the number of analyses to a manageable level. In the event of more institutions participating in future PAR-related initiatives, we may also find that multilevel modeling techniques (e.g. HLM) can be particularly informative.
A. Future ResearchFuture goals for expanding the PAR Framework include increasing the number of participating institutions from a wide variety of public, non-profit and for profit institutions, thus increasing the number and the geographic distribution of students in the sample. Some additional areas slated for data miningand analysis include adding data that can provide insight into impact of specific student remediation efforts, the effects of developmental education and its respective sequencing, and student transaction with courses, socioeconomic status, and learner characteristics.
The PAR Framework Proof of Concept: Initial Findings from a Multi-Institutional Analysis of Federated Postsecondary Data
Journal of Asynchronous Learning Networks, Volume 16: Issue 3 79
Expansion of the PAR Framework will also allow researchers to determine if there are cluster effects that were not visible in this initial study. While CHAID analysis revealed discrete branch differences at the institutional level, it may be premature to assume that all institutions will have completely unique decision trees. While the PAR data set was extremely large, we must remain cognizant of the fact that only six institutions data were included. With the addition of more institutions, data clusters may emerge that were not detectable in this phase. If no such clusters emerge the importance of institutional culture will be highlighted, however, the presence of clusters would be equally interesting as it would speak to a shared culture among specific subsets of institutions.Future research should explore carefully the conceptualization of retention, progression and completion. In this study, for example, active enrollment was treated synonymously with graduation for the purposes of comparison to academic inactivity. It remains unclear whether demarcations exist statistically throughout the [inactive active graduated] continuum. As opposed to binary logistic regression, therefore, multinomial regression may be utilized to explore whether this continuum manifests in logistic regression. Future research should also replicate the methods used in this study after developing more consistent measures across institutions for student activity and inactivity. Albeit challenging, future research should also explore for community college contexts a measure of completion that is synonymous with graduation yet does not necessarily necessitate attainment of a degree. In fact, this very issue is being explored for all postsecondary contexts given the changing nature of how students pursue a college education [39].This study demonstrates that even with a relatively small set of variables (n = 33), there are seemingly endless possibilities for approaches to Exploratory Data Analysis. Future research should explore systematically which EDA approaches provide the most effective business intelligence for postsecondary institutions that have finite resources for engaging in this scope of analytics. Furthermore, future policy-focused research should explore the particular variables which provide institutions opportunities for intervention.Admittedly, the six participating institutions involved in the PAR project were highly committed to the use of data-driven decision-making. One should not assume that such a rigorous exploration of student data will be similarly welcome across all postsecondary institutions and contexts. For that reason, future research is needed to explore a variety of organizational phenomena in postsecondary contexts when implementing transparency initiatives. PAR Framework investigators anticipate that the research conducted in this Proof-of-Concept might not be currently possible in some institutions given political sensibilities. The challenges to expanding this initiative to other postsecondary contexts are as much organizational as they are methodological or technical in nature. Therefore, although PAR was heavily focused on quantitative student data, additional research is needed from colleagues with organizational and qualitative perspectives.It is important to remember that this research explored data for students enrolled in online education. Future research should explore whether the overall trends detected in this study manifest similarly in more conventional face-to-face and blended formats. Given that the investigators of this study anticipated that race would have a much more influential effect on activity, more research is needed to explore how potential race-related biases in postsecondary education manifest in face-to-face versus online formats.Warehousing the scope of data analyzed in this study was possible because of information systems commonly used for online learning. Admittedly, the federation of student data in conventional postsecondary face-to-face contexts becomes much more difficult when a Student Information System is unavailable. As utilization of federated datasets increases throughout academia, postsecondary educators can anticipate expectations for implementing some type of information architecture that allows for large-scale federation, not only of student information, but also process measures of learning catalogued by conventional Learning Management Systems. Educators should also anticipate that over time, research communities may expect and demand studies involving larger sample sizes and inter-institutional

The PAR Framework Proof of Concept: Initial Findings from a Multi-Institutional Analysis of Federated Postsecondary Data
80 Journal of Asynchronous Learning Networks, Volume 16: Issue 3
comparisons.
VI. CONCLUSIONThe PAR Framework demonstrates the practicability of federating large datasets among institutions of higher education to better inform strategic planning, decision-making and pedagogical research in online postsecondary contexts. One distinct advantage to this scope of data federation is that it serves to inform trends both within and among institutions. This study represents a very small portion of the data analyses that are possible given the federated PAR dataset. Regardless, it highlights that large-scale federation of postsecondary data serves as a valuable approach to informing postsecondary online learning and offerscompelling evidence that analyses of the normalized, multi-institutional data sets provide meaningful benchmarks for exploring loss and momentum at the student and course level.
VII. ACKNOWLEDGEMENTSThe authors would like to thank those indirectly and directly involved in the PAR Framework Project. First, we would like to thank the collaborative efforts of project officers from both the Bill & Melinda Gates Foundation and WCET/WICHE for their guiding leadership throughout the project. Second, this study would not be possible without the generous contributions of time, data, input, and productive collaboration by representatives from the six participating institutions: American Public University System (APUS), Colorado Community College System, Rio Salado Community College, University of Hawaii System, University of Illinois Springfield, and the University of Phoenix. Third, we would like to acknowledge the Evaluators of this project, Drs. Peter Shea and Ben Arbaugh who kindly offered their expertise and feedback toward ensuring accountability and demonstrable project effectiveness. Lastly, we would like to thank staff from all six participating institutions and WCET who conducted reviews of resources, communicated and managed logistics for meetings and provided unparalleled administrative support toward the facilitation of this project.
VIII. ABOUT THE AUTHORSPhil Ice, Ed.D., is the VP of Research and Development at American Public University System (APUS). His research is focused on the impact of new and emerging technologies on cognition in online learning environments. Work in this area has brought him international recognition in the form of three Sloan-CEffective Practice of the Year Awards (2007, 2009 and 2010 ) and the AliveTek/DLA Innovation on Online Distance Learning Administration Award. Sloan-C has also recognized Phil through awarding a team he lead at APUS with the Gomory Award for Data Driven Quality Improvement in 2009. He has been recognized by industry through membership in Adobe's Education Leaders Group and Adobe's Higher Education Advisory Board, as well as a recipient of the Adobe Higher Education Leaders Impact Award, 2010. Phil's vision for the future of technology in higher education is also demonstrated by his inclusion on the advisory council for the 2011 and 2012 NMC / ELI Horizon Reports. Sebastian Diaz, Ph.D., J.D. serves as Associate Professor and Strategic Planning and Evaluation Consultant for International Student Affairs & Global Services at West Virginia University. His research focuses on developing measures and evaluation methodologies germane to Intellectual Capital and Knowledge Management. Before entering the tenure-track, Sebastian worked as a medical educator at both allopathic and osteopathic institutions.Karen Swan is the Stukel Professor of Educational Leadership at the University of Illinois Springfield (UIS) and a research associate in the UIS Center for Online Learning, Research and Service. Her research has been in the area of media, technology and learning; she has authored or co-authored over 100 publications, several hypermedia programs and two books on such topics. Her current research interests include online learning, ubiquitous computing and learning analytics. Dr. Swan received the 2006 Sloan Consortium award for Outstanding Achievement in Online Learning by an Individual and in 2010 was inducted into the first class of Sloan-C Fellows. She also received the 2010 Distinguished Alumnus award from Teachers College, Columbia University, her alma mater.
The PAR Framework Proof of Concept: Initial Findings from a Multi-Institutional Analysis of Federated Postsecondary Data
Journal of Asynchronous Learning Networks, Volume 16: Issue 3 81
Melissa L. Burgess, Ed.D., is the Director of Research Methodology at American Public University System (APUS). Her research interests focus on both higher education and K-12 sectors, specifically focusing on online curriculum design, implementation, and assessment to include the following platforms and tools: (1) on-demand; (2) learning management systems; (3) multi-user virtual environments; (4) collaborative media; (5) transformed social interactions and digital literacy through gaming platforms; (6) data visualization as a resource for shaping educational research; (7) predictive analytics as a tool for assessing individual student learning; and (8) adaptive or personalized learning environments.Mike Sharkey is the Director of Academic Analytics for the Apollo Group. Mike has been with the Apollo Group (and its flagship institution, the University of Phoenix) since 2002. He has served in a variety of roles all focusing on learning tools and technologies. His current role involves utilizing data analysis and predictive analytics in order to help improve student outcomes. Mike is also a part-time instructor at the university teaching courses in technical communications and business. Prior to joining the Apollo Group, Mike was a manager for Deloitte Consulting in their high-tech manufacturing practice. He has consulted with firms including 3Com, Toshiba, Silicon Graphics, and Ingersoll-Rand. Mike has also held positions with two startup technology firms and an enterprise software applications company. Mike holds a Bachelor’s degree in Mathematics from Lafayette College and an MBA from the University of Arizona. Jonathan Sherrill, MSCIT, is a Data Analyst Professional at the Colorado Community Colleges Online. He combines experience in instruction, computer science, and statistics to tease out retention factors for online students and study the effectiveness of interventions. When he’s not in front of the computer he likes to slog through mud in obstacle course races and buy exotic Group-Ons.Daniel R. Huston, M.A., is the Coordinator of Strategic Systems at Rio Salado College. His work and research focuses on actionable analytics, assessment and predictive modeling.Hae Okimoto, Ph.D., is the Director of Academic Technologies for the University of Hawaii System, responsible for distance learning and the integration of learning technologies in traditional courses, the student information system (Ellucian), and the learning management system (Sakai). Hae began her professional career in student affairs, therefore her research interests have always been in how the application of technology can improve student success and student progress toward their goals. As the public education system in Hawaii, the University of Hawaii System includes 10 campuses and dozens of educational, training and research centers across the Hawaiian Islands.
IX. REFERENCES1. Knapp, L.G., Kelly-Reid, J.E., and Ginder, S.A. Enrollment in Postsecondary Institutions, Fall
2010; Financial Statistics, Fiscal Year 2010; and Graduation Rates, Selected Cohorts, 2002-07(NCES 2012-280). U.S. Department of Education. Washington, DC: National Center for Education Statistics, 2012. Retrieved from http://nces.ed.gov/pubsearch
2. National Center for Education Statistics. IPEDS Spring 2008 Compendium Tables (Table 33, from IPEDS Graduation Rates component). DC: U.S. Department of Education, 2010.
3. Ice, P., and Burgess, M.L., Through the Looking Glass: Emerging Technologies and the Community of Inquiry Framework. In: Z. Akyol & D. R. Garrison (Eds.), Educational communities of inquiry: Theoretical framework, research and practice, University of Calgary, AB, Canada: IGI Global, 2012.
4. Ice, P., Burgess, M. L., Beals, J., and Staley, J.. Aligning Curriculum and Evidencing Learning Effectiveness Using Semantic Mapping of Learning Assets. International Journal of Educational Technology, 2012.
5. Patrizi, C., Ice, P., and Burgess, M.L. Using Semantic Mapping of Learning Assets to Align Curriculum and Evidence Learning Effectiveness in the School of Business. Accreditation in Business Education 2012.
6. Dynarski, S. Does Aid Matter? Measuring the Effect of Student Aid on College Attendance andCompletion (1999). http://nber.org/~confer/99/lssi99/dynarski.pdf.
The PAR Framework Proof of Concept: Initial Findings from a Multi-Institutional Analysis of Federated Postsecondary Data
82 Journal of Asynchronous Learning Networks, Volume 16: Issue 3
7. Parker, A. A Study of Variables that Predict Dropout from Online Learning. International Journal of Educational Technology 1(2), 1999.
8. Kemp. W. Persistence of Adult Learners in Online Learning. The American Journal of Online Learning 16 (2): 65-81 (2002).
9. Astin, R. A Study of Employment and Online Learning Students at a Community College. Community College Research 12(2): 41-49 (1999).
10. Hagedorn, L., How to Define Retention: A New Look to an Old Problem. In: Seidman, A. (Ed.) College Student Retention: Formula for Student Success, Lanham, Maryland: Rowman and Littlefield Publishers, 2012.
11. Allen, I. E., and Seaman, J. Going the Distance: Online Education in the United States 2011.Babson Research Group. National Center for Education Statistics. Learning at a Distance: Undergraduate Enrollment in Online Learning Courses and Degree Programs. NCES 2012154. October, 2011. Washington, DC: National Center for Education Statistics. Retrieved from http://nces.ed.gov/pubs2012/2012154.pdf.
12. Radford, A.W. Learning at a distance: undergraduate enrolment in distance education courses and degree programs. http://nces.ed.gov/pubs2012/2012154.pdf.
13. Brigham, D. Benchmark Information Survey. Unpublished presentation, Excelsior University, 2003.
14. Carr, S. As Online Learning Comes of Age, the Challenge is Keeping the Students. The Chronicle of Higher Education 46(3): 39–41 (2000).
15. Moore, M., and Kearsley, G., Online Learning: A Systems View London: Wadsworth, 1996.16. Roach, R. Staying Connected: Getting Retention Right is High Priority for Online Degree
Programs. Black Issues in Higher Education (October 24, 2002).17. Howell, S. L., Laws, R., and Lindsay, N. K. Reevaluating Course Completion in Online Learning:
Avoiding the Comparison Between Apples and Oranges. Quarterly Review of Online Learning 5(4): 243-310 (2004).
18. Hachey, A.C., Wladis, C.W., and Conway, K.M. Is the Second Time the Charm? Investigating Trends in Online Re-Enrollment, Retention and Success. Journal of Educators Online 9(1): 1-25(2012).
19. Morris, L.V. and Finnegan, C.L. Best Practices in Predicting and Encouraging Student Persistence and Achievement Online. Journal of College Student Retention: Research, Theory & Practice 10(1): 55-64 (2008).
20. Tyler-Smith, K. Early Attrition Among First Time E-Learners: A Review of Factors that Contribute to Dropout, Withdrawal and Non-Completion Rates of Adult Learners Undertaking E-Learning Programs. Journal of Online Learning and Technology 2: 73-85 (2006).
21. Kuh, G.D., and Ikenberry, S., More Than You Think, Less Than We Need: Learning Outcomes Assessment in American Higher Education, National Institute for Learning Outcomes Assessment:University of Illinois, 2009.
22. Diaz, S.R. The Data That Bind Us: Finding Our Hidden Wholeness in Education. In: Callejo-Pérez, D., and J. Ode (Eds.), The Stewardship of Higher Education, Sense Publishers, 2012.
23. Longden, B. Retention Rates – Renewed Interest But Whose Interest is Being Served? Research Papers in Education 17(1): 3–29 (2002).
24. Ozga, J. and Sukhnandan, L. Undergraduate Non-Completion: Developing an Explanatory Model. Higher Education Quarterly 52(3): 316–33 (1998).
25. Reimann, N. Calculating Non-Completion Rates for Modules on Institution-wide Language Programmes: Some Observations on the Nature of Seemingly Objective Figures. Journal of Further and Higher Education 28(2): 139–52 (2004).
26. Kaliski, J. A., Booker, Q.E., and Schumann, P. A Proposed Architecture for Dynamic E-Learning Environments Based on Student Activity and Learning Styles. Global Conference on Business & Finance Proceedings 7(1): 596-600 (2012).
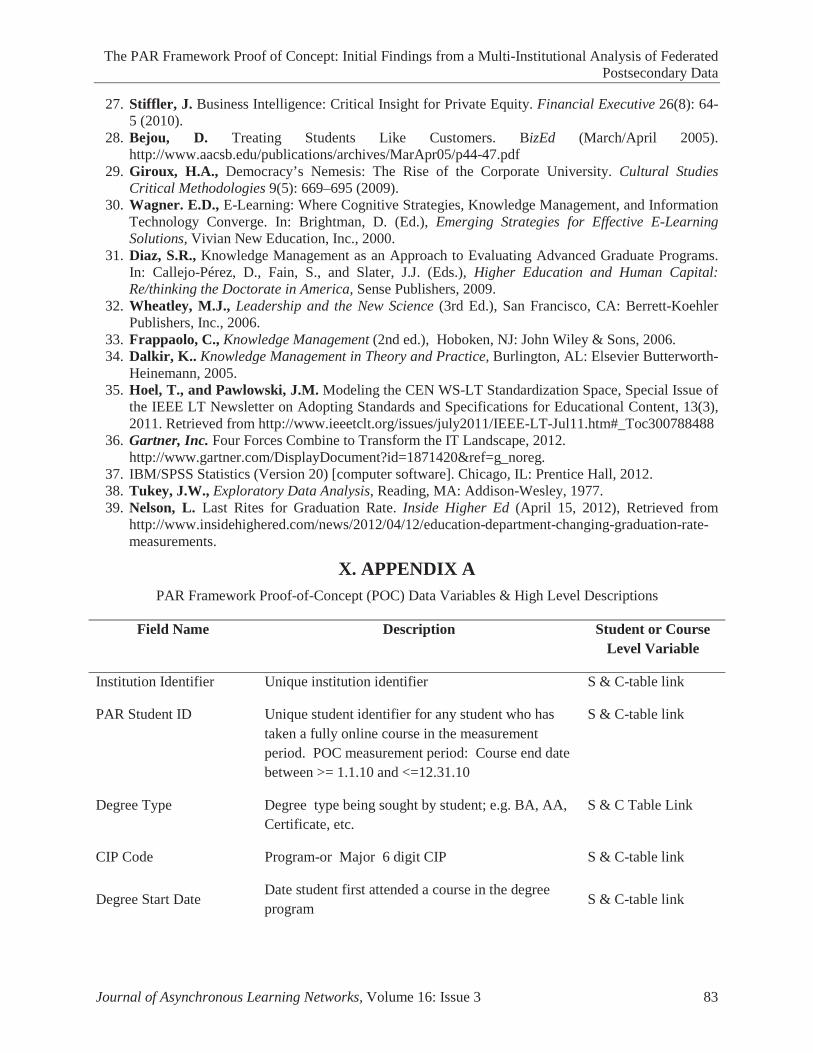
The PAR Framework Proof of Concept: Initial Findings from a Multi-Institutional Analysis of Federated Postsecondary Data
Journal of Asynchronous Learning Networks, Volume 16: Issue 3 83
27. Stiffler, J. Business Intelligence: Critical Insight for Private Equity. Financial Executive 26(8): 64-5 (2010).
28. Bejou, D. Treating Students Like Customers. BizEd (March/April 2005). http://www.aacsb.edu/publications/archives/MarApr05/p44-47.pdf
29. Giroux, H.A., Democracy’s Nemesis: The Rise of the Corporate University. Cultural Studies Critical Methodologies 9(5): 669–695 (2009).
30. Wagner. E.D., E-Learning: Where Cognitive Strategies, Knowledge Management, and Information Technology Converge. In: Brightman, D. (Ed.), Emerging Strategies for Effective E-Learning Solutions, Vivian New Education, Inc., 2000.
31. Diaz, S.R., Knowledge Management as an Approach to Evaluating Advanced Graduate Programs. In: Callejo-Pérez, D., Fain, S., and Slater, J.J. (Eds.), Higher Education and Human Capital: Re/thinking the Doctorate in America, Sense Publishers, 2009.
32. Wheatley, M.J., Leadership and the New Science (3rd Ed.), San Francisco, CA: Berrett-Koehler Publishers, Inc., 2006.
33. Frappaolo, C., Knowledge Management (2nd ed.), Hoboken, NJ: John Wiley & Sons, 2006.34. Dalkir, K.. Knowledge Management in Theory and Practice, Burlington, AL: Elsevier Butterworth-
Heinemann, 2005.35. Hoel, T., and Pawlowski, J.M. Modeling the CEN WS-LT Standardization Space, Special Issue of
the IEEE LT Newsletter on Adopting Standards and Specifications for Educational Content, 13(3), 2011. Retrieved from http://www.ieeetclt.org/issues/july2011/IEEE-LT-Jul11.htm#_Toc300788488
36. Gartner, Inc. Four Forces Combine to Transform the IT Landscape, 2012.http://www.gartner.com/DisplayDocument?id=1871420&ref=g_noreg.
37. IBM/SPSS Statistics (Version 20) [computer software]. Chicago, IL: Prentice Hall, 2012.38. Tukey, J.W., Exploratory Data Analysis, Reading, MA: Addison-Wesley, 1977.39. Nelson, L. Last Rites for Graduation Rate. Inside Higher Ed (April 15, 2012), Retrieved from
http://www.insidehighered.com/news/2012/04/12/education-department-changing-graduation-rate-measurements.
X. APPENDIX APAR Framework Proof-of-Concept (POC) Data Variables & High Level Descriptions
Field Name Description Student or Course Level Variable
Institution Identifier Unique institution identifier S & C-table link
PAR Student ID Unique student identifier for any student who has taken a fully online course in the measurement period. POC measurement period: Course end date between >= 1.1.10 and <=12.31.10
S & C-table link
Degree Type Degree type being sought by student; e.g. BA, AA, Certificate, etc.
S & C Table Link
CIP Code Program-or Major 6 digit CIP S & C-table link
Degree Start DateDate student first attended a course in the degree program S & C-table link

The PAR Framework Proof of Concept: Initial Findings from a Multi-Institutional Analysis of Federated Postsecondary Data
84 Journal of Asynchronous Learning Networks, Volume 16: Issue 3
Multiple Major
Variable indicating whether student was a double/multiple major during the POC measurement period; if not a multiple major, then the value =1. Double or triple majors = values of 2 or 3 accordingly
S
Academic Status
Current academic status as of Summer 2011 or the institutionally-selected best point in time for determining enrollment (e.g Census). Values are Active, Graduated or Inactive/Disenrolled
S
Institution Student Course Completes
Total number of completed courses within the current institution (not including transfer credits or remedial courses) regardless of degree as of 1.1.10
S
Total Degree ExtensionsNumber of times student has extended the duration it will take to get their degree(s) from the date the student entered the institution through 12.31.10
S
Degree Hours Attempted
Total number of credit hours attempted during the POC measurement period (online and on ground) by student, if available, or at census if not. Excludespenalty free drops
S
Degree Hours Completed
Total number of credit hours completed during the POC measurement period with a passing grade where the requirements for passing are determined by institutional policy about completion
S
Gender Variable indicating student’s gender on 1.1.2010 S
Non-Resident Alien Status
Variable indicating whether student is a non-resident alien,
S
RaceStudent’s reported race/ethnicity per the IPEDS2 definition
S
Ethnicity Variable indicating whether student is Hispanic S
Date of Birth Student’s month and year of birth. S
Military Classification Variable indicating student’s military classification S
Veteran Variable indicating whether student is a veteran; S
Transfer Credits Number of transfer credits awarded or accepted by the institution for the program of study as of
S
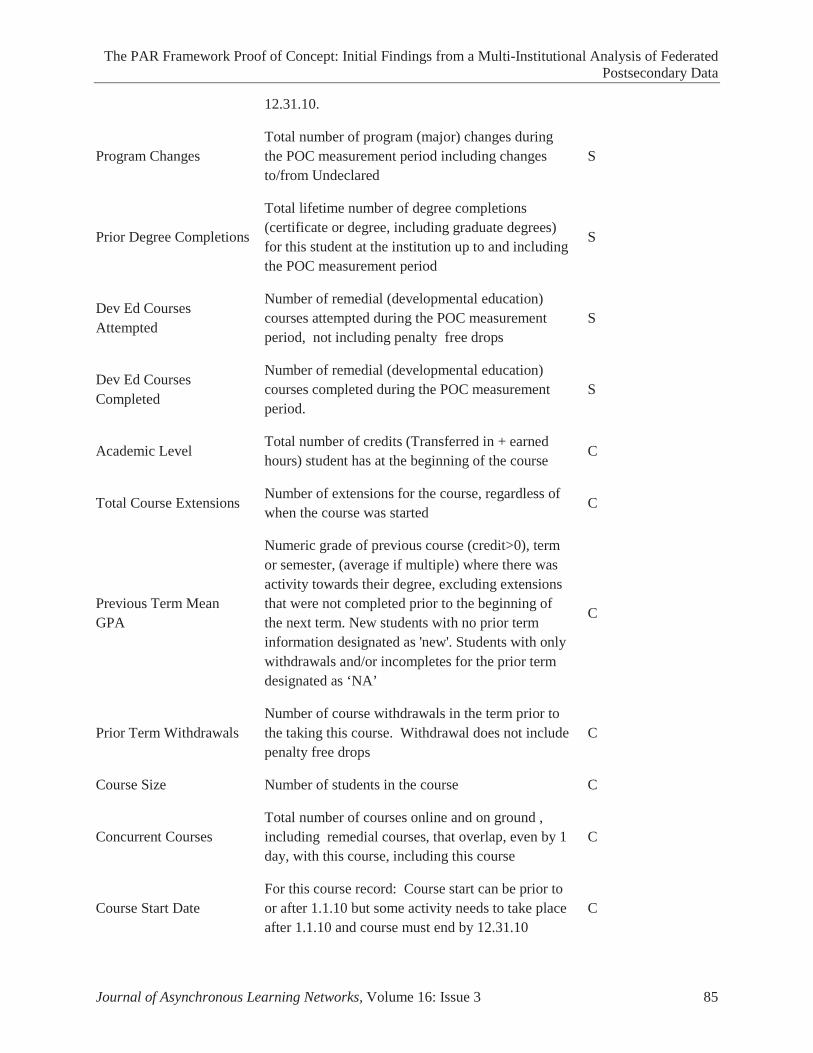
The PAR Framework Proof of Concept: Initial Findings from a Multi-Institutional Analysis of Federated Postsecondary Data
Journal of Asynchronous Learning Networks, Volume 16: Issue 3 85
12.31.10.
Program ChangesTotal number of program (major) changes during the POC measurement period including changes to/from Undeclared
S
Prior Degree Completions
Total lifetime number of degree completions (certificate or degree, including graduate degrees) for this student at the institution up to and including the POC measurement period
S
Dev Ed Courses Attempted
Number of remedial (developmental education)courses attempted during the POC measurement period, not including penalty free drops
S
Dev Ed Courses Completed
Number of remedial (developmental education) courses completed during the POC measurement period.
S
Academic Level Total number of credits (Transferred in + earned hours) student has at the beginning of the course
C
Total Course Extensions Number of extensions for the course, regardless of when the course was started
C
Previous Term Mean GPA
Numeric grade of previous course (credit>0), term or semester, (average if multiple) where there was activity towards their degree, excluding extensions that were not completed prior to the beginning of the next term. New students with no prior term information designated as 'new'. Students with only withdrawals and/or incompletes for the prior term designated as ‘NA’
C
Prior Term Withdrawals Number of course withdrawals in the term prior to the taking this course. Withdrawal does not includepenalty free drops
C
Course Size Number of students in the course C
Concurrent CoursesTotal number of courses online and on ground , including remedial courses, that overlap, even by 1 day, with this course, including this course
C
Course Start Date For this course record: Course start can be prior to or after 1.1.10 but some activity needs to take place after 1.1.10 and course must end by 12.31.10
C

The PAR Framework Proof of Concept: Initial Findings from a Multi-Institutional Analysis of Federated Postsecondary Data
86 Journal of Asynchronous Learning Networks, Volume 16: Issue 3
Course End Date Course end date must be prior to or on 12.31.10 C
Course Grade Grade for the course C
Dev Ed Course
Variable indicating whether the course is a remedial (developmental education ) course and if a remedial course, the delivery method (fully online, onground, hybrid or unknown delivery)
C
Related Documents