Report No. 5221-TO 5221 Togo° lssues and Optons M the Energy Sector June 1985 Report of the joint UNDP/World Bank Energy Sector Assessment IPrograrm This document hasa restricted distribution. Itscontentsmay not be disclosed without authorization from the Government, the UNDP or the WorMd Bank. Public Disclosure Authorized Public Disclosure Authorized Public Disclosure Authorized Public Disclosure Authorized

Welcome message from author
This document is posted to help you gain knowledge. Please leave a comment to let me know what you think about it! Share it to your friends and learn new things together.
Transcript
Report No. 5221-TO 5221Togo° lssues and OptonsM the Energy Sector
June 1985
Report of the joint UNDP/World Bank Energy Sector Assessment IPrograrmThis document has a restricted distribution. Its contents may not be disclosedwithout authorization from the Government, the UNDP or the WorMd Bank.
Pub
lic D
iscl
osur
e A
utho
rized
Pub
lic D
iscl
osur
e A
utho
rized
Pub
lic D
iscl
osur
e A
utho
rized
Pub
lic D
iscl
osur
e A
utho
rized
3'0IT U tDP/NAW D BANK RY SECTC-R ASS2SS sr PRORP
URPORTS ALREADY I S SED
Country Date Number
hndonesia November 1981 3543-I-NM
Mauritius December 1981 3510-MAS
Kenya May 1982 3800-KE
Sri Lanka May 1982 3792-CE
Zimbabwe June 1982 3765-ZIMT
Haiti June 1982 3672-HA
PaDua Ne., Guinea June 1982 3882-PNG
Burundi june 1982 3778-U
Rwanda June 1982 1779-RW
iata-wi Anuust 1938z 3903-MAT
Bangladesh October 1982 3873-BD
Zamib ia anuary 198 4;10-ZA
Turkey March 1983 3877-TU
3oI-via Apur 1933 4213-BO
Eiji iJune 1938 $462-FIJ
o0Lomon Islans June 1983 f494-SOLT
e a Ju ly 1.983 4i82 SE
udan July 1Q83 iSU
ganda July 983 44 5 'C
Ig L g eria August 19 83 4440-UN-
e 2 a August 1983 4T74 NEP
Ga 1ib I aG Novembeir 104ov7er
pe--u January 1984 677 -PE
osta nina January 19-34 465Y-CR
ct. r oanuary arh 1984 4657 MOR
Secvhen 12s fl-ay 1R 6g EHoroi Bi ~~~~Aprr 1, .,T. .. '
_Nitr g a L A P T 9 1 ; ,i 84A 4. 2 4- P-
2 .e-i .'i'j7 8 4 4.ii3's C, T i T
E C i pi-a cuL&- 198$ 4 499C741-ET
a V erde 'Alugust l3 03£
_U'. ea 35i_Algust !Q8iX 5_ 083 - '5U
Ste Vincsnt anl-le Cnref.-aines Serp eamber 198fT 5i93-ST-v
S L 2 S e p t e m"-LOer I S P SLfJ
Paragua- 'ac t obe-- . 154 PA
Tan z an i a 'o\vember 15.i, ' 4 569-TA
Yemen Ar-b RepJlin Decemnber '<a 8L 'o;I 2 -YARLibe. i- Decearber 1981 27 9 -LLR
Aiaurit :aO April 198,3 5224-A4A-U
Ja anl.a 2 April 1985 66J2-
T-jCoi._ o f g__ Apri 1985 5239-IVC
FOR OFFICIAL USE ONLY
Report No. 5221-TO
TOGO
ISSUES AND OPTIONS IN THE ENERGY SECTOR
JUNE 1985
This is one of the series of reports of the Joint UNDP/World Bank EnergySector Assessment Program. Finance for this work has been provided, inpart, by the UNDP Energy Account, and the work has been carried out bythe World Bank. This report has a restricted distribution. Its contentsmay not be disclosed without authorization from the Government, the UNDPor the World Bank.

ABSTRACT
Togo's energy balance is a reflection of the country's economicstructure: a small modern sector, relying on imported petroleum productsand imported electric power, and a large traditional sector in whichfuelwood meets most of the energy needs (70% of total gross supply). Thecountry's resource base has not yet been fully evaluated. Research forhydrocarbons is ongoing; hydro resources have been identified and theproject for a first medium scale power plant is in progress. Forestresources are being exploited without the necessary management measuresto guarantee replenishment. The country's critical economic situationimposes severe constraints on investments and makes it imperative toincrease the efficiency of the sectorial management and of energy use.Economic growth and, as a corollary, energy consumption, are expected tobe moderate in the medium term. Therefore, it is possible to limitprojects to those that have already been initiated, to those that reducethe dependence and the cost of imported oil, and to those that areexpected to have a catalytic effect on the involvement of the privatesector. Given Togo's strategic location in the West African region,coordination of energy programs and joint ventures in the development ofenergy resources offer net economic advantages. Regional integration istherefore a policy to be actively pursued.


ABBREVIATIONS
b/d barrels per day
cal calorie
GDP Gross Domestic Product
GWh gigawatt hour (10 6/kWh)
ha hectare
k thousand
kcal thousand calories
kgoe kilogram of oil
equivalent
kWh kilowatt hour
LPG Liquid Petroleum Gas
(Butane)
M million
MCF thousand cubic feet
MWh megawatt hour (103 kWh)
,,3 cubic meter
toe tons of oil equivalent
This report reflects the conclusions of the energy assessment mission whichvisited Togo in June-July 1983. The mission was composed of Miss UrsulaWeimper (mission leader), and Messrs. E. Symonds (consultant, petroleumeconomist), L. Sayn-Wittgenstein (consultant, forest engineer), A Larreture(consultant, specialist in renewable energy applications), A. Streicher(consultant, energy conservation specialist), and J. Hatfield (consultant,electric energy economist). The mission also received the cooperation ofMr. M. Wilton of the Bank's regional power division. The text for the finalreport was processed by Ms. Norma Kraushaar.

ACRONYMS
ADB African Development BankAFME Agence Francaise de La Maitrise de l'EnergieARD Associates in Rural Development, Inc.BB Brasserie du BeninCEB Communaute Eiectrique de BeninCEET Compagnie d'Energie Electrique de TogoCTF Chemin de Fer TogolaiseCIMAO Societ6 des Ciments de l'Afrique de l'OuestCIMTOGO Ciment du TogoCTL Centrale Thermique de LomeDEF Direction des Productions ForestieresDGT Direction Generale des TransportsECOWAS Economic Community of West AfricaEEC European Economic CommunityESIE Ecole Superieure Interafricaine de l'ElectriciteFAO Organisation des Nations Unies Pour l'Alimentation
et l'AgricultureFED Fonds Europeens de D6veloppementGEMS Global Environmental Monitoring SystemsGPP Groupement Professionnel de PetroleNEPA Nigerian Electric Power AuthorityODEF Office pour le Developpement et l'Exploitation des
Ressources ForestieresOPAT Office des Produits Agricole du TogoOTP Office Togolais de PhosphatesRMTU R6gie Municipale des Transports UrbainesRNET Regie Nationale des Eaux de TogoSBEE Societe Beninoise d'Electricite et d'EauSFCE Services des Forets, Chasses et EnvironmentsSTE Societe Togolaise d'EntreposageSTH Societe Togolaise des HydrocarburesVRA Volta River AuthorityUSAID US Agency for International Development

CONVERSION FACTORS
Monetary: 50 FCFA = I FF
370 FCFA = I US$ (June 1983)
Energy:
Specific Net Calorific Oil
Gravity Value Equivalent
(kcal/kg) (toe/ton)
LPG 0.58 10,700 1.049
Gasoline - Super 0.721 10,500 1.029
- Regular 0.726 10,500 1.029
Kerosene 0.82 10,400 1.02
Gasoil/diesel 0.84 10,200 1.00
Fuel Oil - Light 0.93 9,900 0.97
- Heavy 0.96 9,600 0.94
Electricity - 28.5% efficiency 3,018 kWh 295.88/Gwh
- 100% efficiency 860 kWh 84.314/Gwh
Natural Gas 9,000 m3 0.880/1000 m3
Biogas 5,500 m3 0.539/1000 m3
Fuelwood
(cubic meter solid 25% MC) 0.7 3,500 0.343
Charcoal 7,000 0.686
Corncobs 3,500 0.343
Corn, rice, sorghum and
millet straw 2,500 0.245
Oil palm stems 1,300 0.127
Oil palm fibers 2,500 0.245
Oil palm hulls 4,000 0.392
Oil palm leaves 2,000 0.196
Cotton stalks 4,100 0.402
Cotton seed hulls 3,900 0.382
Groundnut hulls 4,000 0.392
Coffee hulls 3,700 0.363
Rice husks 3,000 0.294
Coconut hulls 4,300 0.422

TABLE OF CONTENTS
I. SUMMARY AND RECOMMENDATIONS0.. aa... aa..... .... 1Resource Development ............ a ... ..a ...... , e ... e a a , a 1
Forestry- .... ..... 2Agricultural Residues..a..ae.... oa.aaaaae .aaao,i .. cs. 3Commercial Energy Resources.e a9aa.aa e a .. a .so a,aaa..a 3Electricity .......................................... 3Petroleum . . . ................ 5.0.c.... 4Demand Management ...O... a.a.. . ...a .a.a.... 5Sector Policy Recommendations. a ... *a aaa..... a.a..aaaaa.. e 6
II. ENERGY AND THE ECONOMY .......... co*a,afa*a*ae@a*aaa*anese 7Economic Backgroundesa a a a ... a ...a a ...........a a a 7Energy Balance: Resources and Consumption ...... a 8
Demand Management by Economic Subsectors,aa-. ...... ,a 10
Household and Artisanal Energy Consumption .a.a a a....... a a 11
Price of Household Fuelsa......aaaaaaaaaaaaaaaaa ac.a. 13Recommendations for Energy Savings.000aaaaaaa a ... 0aa 15Industrial Energy Consumption .... a ... a a.a ....a a 16Conclusions and Recommendations. a e a9 aa a .. aaaa aa 19Energy Consumption in Hotels in Togogo... aa......a. 21Transport Energy Consumptiona . aaaaao aaaa oa 24Shift from Road to Railroadoa.aaaaa.aa*eaa oe.ea e aees 27Improved Efficiency within the Road Transport Mode..,. 28More Efficient Use of Existing Freight CarryingCapacityaaaaaaaaa ...aa e-aaaaa ...aas*a....... *.*a.. 29
Recommendations....aaaa,aaaaaaaaaaaaaaa.aaaaaaaaaa 31
rIII BIOMASS DEVELOPMENT OPTIONSa................aaa a aa*aaa *a0a 32General Situationaaa.aaaaa.asaaaaaaaaaaaea.a ... so.aa 32Inventory and Wood Growth Ratest... 949486464.....a 32Regional Supply-Demand Balance .......a..., 34Reforestation Projects. a a 35Reduction of Energy Losses in Charcoal Productionoo,.a 36Recommendations for a Forestry Strategy. .. ...a.a.O. 37
Agricultural Residues .... ....... a .......... a a a a 39Present Use of Residues. a a a a a a a 41Recommendationa.a.aaaaa...aa.aaa.ae .aaaa ....a.,.a... 41Solar Energya aa aa ... a ........ a aaaaaaa .a aa a aa aa 42
IV. PETROLEUM SECTOR ..............a a. aaaa aaaaaaaaa......... 43
Resource Evaluationa ae a ao aaaaaaa a ... a a. a 43Present and Projected Supplyas.a .............a........ 43Supply Cost and Prices ........a a a a a a a t a 45Oil Procurement Mechanism and Government Controls....a 46Petroleum Retail Prices a a a a 48
Import Cost Saving Opportunities .. ................. , 49Use of the Refinery's Storage Facilitiesa........a..a 49New Oil ProcurementArrangements .... a.aa........ 51Oil Substitution Opportunitiest .a. aae a...aa..a . .. aaa a 51

V. ELECTRIC POWER ............... .......... .................... . 54Role of Electricity ..................... *....... .O. .. 54Characteristics of Togo's Electric System...,......... 55
Interconnected Coastal System...... ..... .... ..... ... 57Togo Coastal System...,,*..,# ......... -............ 57Binational Coastal System (CEB) ............I.... ...... 61Binational Strategy-ooee.e..... ................,, 65
Inland Centers ......... . . .O - .... ... ..... ............ * 66Necessary Short-term Actions ............... ...0 ........ 67Specific Medium-term Issues .... 67Investments in the Inland Centers .......... I........... 69
Tariffs* ..................................... 69CEB's Purchase and Sales Tariffs ............ Al .......... 69CEET's Tariffs ....... .................. S..0... 70
VI. INVESTMENTS, PLANNING AND TECHNICAL ASSISTANCE........... 72
Tr In vetmnts ............. ...... ... .. **........... ,.....,. 74
Energy Planning................ ...,......... S* 74Forestry Institutions......*.** ... ....... .......... 75Biomass and Nonconventional Renewable EnergyResources: Institutional Aspects ......... ........... 77
Petroleum Institutionsti.ou ti..n... ... ......... .. .. 77Electricity....e o t.0.0ct......y..-..........0-....... 78The Communaute Electrique du Benin (C E B ) 78Compagnie Energie Electrique de Togo...........o.. . 79Centrale Thermique de Lome (CTL) ......... 0..00.... 80Energy Conservationo..o..........................o. 80Industrial Energy Conservation............ o.. . 80Transport Sc.... 80Households, Cottage Industry, and Other Sectorsr...... 81
ANNEXES
1,1 Population ........s . 821.2 Projected Population Growth Rateso.t.e s.... ............... 831.3 Population Statistics.,o.o.oo.oo...o................ ... ,. 842. Togo: Energy Balance, 1982, ................................ . 852.1 Togo: Energy Balance, 1982 - Useful Energy Consumption ... oo 862.2 Togo: Energy Balance Projected to 1988 ...............o...... 872.3 Togo: Energy Balance Projected to 1998 ..... o....... ,, .,6 883. Estimate of Fuelwood and Charcoal Consumption
in Households ...................... 440....$ ....... 894. Household Fuelwood Consumption.............................. 935. Artisanal Fuelwood Consumption... ........................... 946. Energy Potential of Agricultural Subproducts................ 967. Hydro Resources of Togo and Benin ........ &6 ........ 978. Power Generation Capacity in Togo 989. Electric Power Supply, Historical Data ...................... 9910. Togo: Electric Demand Projections.....oo................ 10011. Benin: Electric Demand Projections , 10112. Interconnected System - Projection of Generation
Requirements...o ..............o.. o...............o.o.o 102

13.1 Togo: Inland Centers - Peak Demand and PresentInstalled Capacity ..................................................... 103
13.2 Northern Regional Power Center Capacity Balance ............ 10413.3 Togo-Benin: Northern Regional Center Financial
Analysis of Expansion Options ..................... 9.......9 10514.1 Togo: CEET-Existing Tariffs ........... .. ......... , 10614.2 Togo: Proposed Tariff Structure .. 10815. Petroleum Energy Product Sales .............................. 11016. Petroleum Product Consumption to 1988 and 1998 , 11117. Togo-Benin: Petroleum Requirements for
Power Generation .......................................... 11218. 1982: Petroleum Products - Demand of West African
Neighboring Countries. . ... ................. ....... ...... . 11319. West Africa - Petroleum Demand Projections to 1988:
Neighboring Countries ....................................... 11420. West Africa - Petroleum Product Consumption - 1981 .......... 11521. West Africa Petroleum Market - Historial Trends .......... e 11622. West African Refining Capacity ..................... ......... 11723. Petroleum Product Prices - 1983 ... ................ 11824. Petroleum Product Prices - CIF ..... ....................... 11925. Togo: Vehicle Registrations, 1974-1982 .................... .. 12026. Characteristics of the Togolese Vehicle Fleet ............... 12127. Energy Consumption in International
Road Freight Transport ..... .. .......... ....... ... 12428. Energy Consumption in National Road Freight Transport ....... 12729. Energy Consumption in Passenger Transport .................. 130
MAPSIBRD 14196: Togo Transportation and Population DensityIBRD 17684: Benin/Togo Electric SystemIBRD 18438: Togo Forests, Parks, and Intensity of Land Use

I. SUMMARY AND RECOMMENDATIONS
1.1 Togo's economic crisis makes it imperative to avoid unnecessaryenergy investments and inefficient energy consumption. At the same time,the country's long-term reliance on agriculture requires that strongremedial action be taken to maintain self-sufficiency in woodfuels with-out continuing deforestation, and that growing attention be given to thelinks between energy and agricultural development.
1.2 The mission estimates total public investment requirements inthe energy sector at US$110 million for the period 1984-88, which repre-sents about 7% of the country's projected CDP. Almost four-fifths of theinvestments are in the electric sector, for developing hydropower capa-city and improving the transmission and distribution network to reduceoperating costs. About 10% of the investments are allocated towards con-tinuing reforestation projects already initiated to meet the fuelwoodrequirements of major urban centers and to promote rural reforestationprojects. Less than 2% of the investments consist of projects related toenergy conservation at the final consumer level and 5% to the creation ofan oil storage facility. These projects have a short payback period andpotentially could save the economy the equivalent of US$6-10 million peryear (Table 6.1).
1.3 Energy sector management in the broad sense, including not onlythe administration of operating entities in the sector, but also the pro-cedures and policies followed in establishing investment programs andpricing policies, must be significantly strengthened if needed measuresare to be implemented efficiently and in good time. Some of these proj-ects are geared to set up an incentive system to achieve a more activeinvolvement of the private sector. In answer to this requirement, themission proposes technical assistance programs specific to each sub-sector, with an intensive training component. Given the fact that Togoand Benin have similar technical assistance requirements, the missionrecommends coordinating the programs for the two countries in otherenergy subsectors besides electricity, where bi-national programs havebeen established successfully.
Resource Development
'.4 Under present economic and technical conditions, the annualenergy potential of biomass in Togo is estimated at 1.4 Mtoe, whichcompares with a total energy consumption of 0.9 Mtoe. This balanceindicates that, in principle, there are opportunities to replace importedenergy sources with more intensive uses of biomass. Such a development,however, is limited by the concentration of energy demand in specificareas and the lack of technical expertise for project identification andimplementation. Forestry should be singled out as the priority sectorfor the medium-term energy strategy. The conversion of agriculturalresidues into usable energy forms must be preceded by a detailed

agricultural balance. This balance should determine the net volumesavailable on a regional basis, considering soil recycling needs andalternative uses (Chapter III).
Forestry
1.5 With proper management, logo's forests can meet the nation'srequirements for fuelwood and charcoal over the coming decades. Inphysical terms, the major problems to be dealt with are the progressivedegradation of the vegetal cover in northern Togo and shortages of fuel-wood in urban areas, particularly in the south. Several reforestationprojects have been initiated in these critical zones, but their progresshas been slower than expected. The experience, however, is invaluable interms of providing information on biological and climatic constraints,and on the attitude of the population towards reforestation. It has alsopermitted the building of a core of local expertise in the many phases ofplantation and forest management. The experience has shown that in ruralreforestation projects land ownership and exploitation rights have to beclarified and the preference for multipurpose tree species has to betaken into account, and that intensive wood plantations are costly toestablish, technically exacting to manage and difficult to keepfinancialLy viable.
1.6 In view of the financial constraints of the Togolese economyand the low absorbtive capacity of the institution in charge of managingforest resources, the mission recommends in Chapter 3 that between 1983and 1988 the already initiated peri-urban afforestation projects be con-solidated and that rural reforestation projects be initiated under alter-native management systems to test their long-term economic viability.Further, the mission recommends:
(a) further strengthening the existing forestry institutions,particularly those responsible for agro-forestry development.The mission recommends closer cooperation between ODEF and DPF,and use of the former's facilities for training and seedlingproduction.
(b) defining an effective policy to resolve land use conflicts andto set aside land for wood production within agriculturalzones.
(c) increasing efficiency in charcoal production and both charcoaland fuelwood utilization.
1.7 At the end of the decade, Togo will be in a better position todefine a long-term forestry plan. In the mission's view it will benecessary to continue peri-urban plantations. Consideration shouldtherefore be given to the establishment of 4,000 ha of additional energyplantations to supply Lome and 2,000 ha in the Lama Kara area after 1988,which would produce the equivalent of two years growth cf demand in thesetwo cities, and allow the time necessary to promote ruraL reforestationprojects. These projects ideally should be designed as extensions of theprojects already executed.

- 3 -
1.8 The current market price for fuelwood and charcoal does notreflect its economic cost, which includes the cost of reforestation. Themission recommends the establishment of stumpage fees for fuelwood fromnatural forest to enhance private reforestation and to create a soundincentive for conservation, both at the level of charcoal conversion andthat of the final consumer.
Agricultural Residues
1.9 The development of a sound policy for the use of agricuLturalresidues requires creating a center for research and testing. Themission suggests that consideration be given to structuring such a centerwithin the Direction de la Recherche Agronomique or the Direction desEtudes Pedologiques et de l'Ecologie Generale. It is also suggested thattechnology demonstration projects be implemented. In particular, themission recommends implementing a pilot project for briquetting residuesin rural areas near Lome, and studying the economic and technicalfeasibility for enhancing the use of residues in the industrial sector.
Commercial Energy Resources
1.10 Imported petroleum products and electricity make up less than30% of gross energy inputs into the economy. However, the importance ofthese sources is considerably greater when analyzed in terms of effectiveend-use energy (50% of total) and in terms of their cost in foreignexchange (more than 20% of export earnings). The energy intensity of theTogolese economy is expected to grow at a moderate rate. The imple-mentation of basic energy conservation measures and the development ofnational resources will permit energy imports to grow at tolerablelevels. At present, a hydrocarbon exploration campaign is under way inthe offshore area that may result in discoveries leading to long-termforeign exchange relief. The hydro potential is about equal to presentelectricity demand (30 ktoe). Its economic development must be envisagedin the international context and requires backup by interconnectionand/or thermal power.
Electricity
1.11 The main characteristics of the electric power subsector(Chapter 5) are: (a) Electricity supply is restricted to major towns,and less than 30% of the urban population has access to this service.(b) The southern electric system, representing 95% of total demand, isinterconnected with Benin and Ghana and has access to low cost hydropowerfrom Ghana. (c) Isolated centers generate electric power from high costdiesel units. Although the cost differential favors the construction ofa nation-wide interconnected network, large transmission distances andlow load densities in the interior limit the practical possibilitiesuntil the end of this decade. (d) The electricity tariff does notreflect regional differences in supply costs. Consideration should begiven to establishing tariff levels sufficient to recover at least thevariable costs in the regional centers. On the other hand, the tariffstructure is not conducive to capacity and energy savings. The recom-mendations made in the tariff study should be implemented without delay.
- 4 -
1.12 An unprecedented drought affected West Africa in 1983 whichalmost took out of service the Akosombo hydro plant in Ghana, on whichTogo depends for the bulk of its electric supply. Although normal rain-falls have resumed, imports from Ghana are likely to remain curtailed forseveral years. Although spare capacity is sufficient to meet demand, thehigher cost of thermal generation induced the Government to impose severedemand rationing measures: closing down energy intensive industries suchas cement, and increasing the average tariff by 25%. An additionalsurcharge is necessary to compensate for the increased cost of thermalgeneration. Further, it is also necessary to ensure (a) proper operatingand maintenance practices at CEET so that standby reserve capacity isavailable when needed; and (b) coordination of supplies with Benin, byformulating joint short-term operational generation Drograms to makeleast cost operation of the system feasible and consistent with theinterest of each partner, until the load dispatch center envisaged underthe Bank's Nangbeto credit is built.
1.13 Medium- to long-term options for expanding the capacity of thebinational electric system revolve around the proposed West Africaninterconnection (WAPSI) and the development of the primary energyresources available in Togo and Benin. The first hydro power plant(Nangbeto), scheduled to be commissioned in 1988, will Lead to signif-icant fuel economies to both Togo and Benin. A possible next economicproject might be for the binational power company to study the con-struction of a second hydro pLant downstream from Nangbeto.
1.14 The West African interconnection has been proposed to linkNigeria's mixed hydro-thermal system with the predominantly hydro systemsof Ivory Coast and Ghana, and to allow for a least cost development planfor the region as a whole. CEB, the joint Togo-Benin power utility, actsas coordinator for the study of this project. Once the transmission line(in 330 kV) is built, confidence in the system must be developed andoperational problems will have to be mastered. Therefore, it is prudentto formuLate a binational expansion program to meet incrementaL demandassuming that during its first operational phase, tne regional transmis-sion line will predominantly facilitate exchanges of contingency powerand of energy.
Petroleum
1-15 The Government has decided to maintain the STH refinery underminimum mothballing in the hope of finding some economic use for therefining equipment, which otherwise has a low salvage value. A study todetermine the feasibility of converting the refinery's tank farm into apetroleum terminaL has been completed in 1984, and a contract for themanagement of the facility has been signed with Shell-Togo. Grossbenefits accrued from the reduction in the landed cost of importedpetroleum products are expected to be on the order of US$3 million peryear if the terminal serves onLy the Togolese market. In the longer termthe terminal could become a regional transshipment facility. The newstorage facility will permit significant freight savings to be realizedby increasing the average cargo sizes from 4,500 m3 to 20,000 m3. Should

the countries of the region in the future decide to pool their petroleumprocurements, the terminal could receive shipments of up to 100,000 m3.The net benefits to the Government and consumers from the terminaloperations will depend on the efficiency with which the facility ismanaged.
1.16 The existing regulatory system does not offer private oilcompanies an incentive to reduce the landed cost of imports or torationalize distribution costs. The commissioning of the new terminalprovides the opportunity to modify this system. As a first step, themission suggests that the Government define with the importing companiesa methodology for calculating reference landed costs. This methodologywill then be used by the Ministry of Commerce and Transport forevaluating the competetiveness of actual import costs. In the longerterm, consideration could be given to establishing a system of inter-national tenders to supply the market's requirements. Under this system,bids from companies established in Togo as well as from recognized inter-national brokers would be sought periodically. The distribution com-panies would continue to serve the market and be guaranteed adequateremuneration for their services. In order to ensure the efficiency ofthe government's supervisory role, the mission suggests that selectedgovernment officials be trained in all aspects of oil procurementarrangements and in market planning techniques. In addition, it issuggested that the assistance of the established oil companies beobtained in this endeavor.
1.17 The distribution services in the interior of Togo should beimproved, and storage capacity should be built to avoid supply inter-ruptions. The mission suggests that alternative incentives be studied,such as a franchise system under which the companies' share of theprofitable Lom6 market is linked to their share in the provinces, and/orthe establishment of differential retail prices that reflect the fulleconomic cost of supplying regionaL markets.
Demand Management
1.18 As the industrial and transport sectors are the main users ofimported petroleum products and electricity (57% and 31%, respectively,of final consumption of these products), they are important targets inany demand management policy. The potential savings that could beachieved through improved energy efficiency are estimated at about 8% ofconsumption in these sectors (9,000 to 15,000 toe per year). Large scaleinterfuel substitution is not envisaged until the end of the decade,despite the important reductions in the cost of imported fuels that couldbe achieved by replacing fuel oil with coal in Togo's main industries(OTP and CIMAO). 1/ On the other hand, the development of a natural gastransport infrastructure in Nigeria and the discovery of natural gas in
1/ CIMAO was shut down in 1984, and it's financial viability in thelong term is doubtful.
- 6 -
other countries of the region might offer new, more advantageous sub-stitution opportunities. For the medium term, the mission suggestspromoting efficient energy use in all sectors of the economy, includinghouseholds, and enhancing the use of internal energy sources (agricul-tural residues, solar energy in water heating applications, etc.).Direct government involvement should take the form of increasing publicawareness about the energy problem, providing information on measuresconducive to savings, and setting in place adequate pricing policies.Chapter II discusses possible actions leading to higher efficiency, andChapter VI discusses technical assistance requirements to implement theserecommendations.
Sector Policv Recommendations
1.19 The development of an effective energy planning capacity isessential for achieving the two main sector objectives: (a) ensuringcontinuing self-sufficiency in fuelwood, and (b) securing reliablesupplies of petroleum products and electricity at competitive prices.However, the rationalization process in allocating scarce financial andtechnical resources to highest priority programs has to start at thesubsectorial level, before an effective planning mechanism can beestablished at the national energy level. The mission thereforerecommends strengthening planning and project implementation in theinstitutions responsible for forestry, petroleum and electricity, andsetting up groups to coordinate programs within each subsector.
1.20 Private initiative is well developed in Togo. Therefore,government actions should focus on policies leading to the activeinvolvement of the private sector, by creating the necessary economicincentives and providing technical and financial assistance. Decen-tralized energy production, the introduction of new renewable energytechnologies, and simple techniques to enhance more efficient energy useare some of the areas where private sector participation can be costeffective and help to develop new entrepreneurial acitivities.
1.21 Togo is located strategically in a region that has a diver-sified and abundant energy resource base, and a large and rapidly growingconsumer market. Coordination of energy programs among the countries ofthe region and joint development of the resources offer clear economicadvantages for the region as a whole. The progress achieved in inter-connecting the electric systems of Ghana, Togo and Benin, and of Ghanaand the Ivory Coast serves as an incentive to try to expand the coop-erative effort. In addition to the project of creating the West AfricanInterconnected Electric System. coordination should proceed in the areasof petroleum procurement, identification of energy substitution andconservation opportunities, technological research and development, andtraining.

II. ENERGY AND THE ECONOMY
Economic Background
2.1 Togo is a small countrv (56,000 kmi2) with a population of about2.8 million and a per capita GNP of about US$340 (1982). About 90% ofthe population is engaged in traditional activities, mainly food cropagriculture and regional trade. The modern sector development is sus-tained by phosphate mining, which started in 1960. This industry is theprincipal source of foreign exchange earnings, accounting for nearly 40%of export revenues in recent years and for about 30% of governmentrevenues.
2.2 Slow growth and increasing financial disequilibrium have beenthe main features of the economy since the mid-1970s. An expansionarystrategy was adopted during the phosphate price boom of 1974-75 and wasnot adjusted when phosphate prices fell. Heavy public investments in themodern sector were not self-sustaining. The growing financial gap wasfilled by external borrowing, and by 1978 the outstanding debt reached65% of GDP. The deteriorating fiscal situation forced the Government toreconsider economic Dolicies in 1979. In 1983, the Government adopted afinanciaL stabilization program supported by IMF and a structural adjust-ment program backed by the World Bank.
2.3 The rehabilitation program calls for a radical reorientation ofthe economic policy. The objective is to achieve and sustain a higherlevel of economic activity consistent with the constraints imposed by thebalance of payments. A significant untapped development potential hasbeen identified in three sectors: mining, agriculture and industry. Inmining, the most concrete project is a phosphoric acid plant, which wouldprocess new, low-grade phosphate deposits and provide an effective meansto restore the trade balance. If the plant is completed by 1987-88,exports of phosphoric acid could make up 24% of all exports by 1990. Inthe agricultural sector, production could be increased through morecompetitive pricing and marketing policies, and through careful coor-dination of projects and support services in the rural area. The foodcrop strategy is aimed at eventually penetrating regional markets,especially Nigeria. In the industrial sector, more active private parti-cipation could be encouraged. Several measures could be undertaken topromote the establishment of small and medium-sized industries, such as(a) improving the structure of effective protection; (b) offeringincentives to the banking system to finance private investments; and(c) promoting technical assistance to the sector. In addition, therehabilitation of selected state enterprises is intended to increasevalue added, occasionally add to exports, and relieve the Government of amajor financial burden. An IDA-supported Technical Assistance Projecthas been started to help the Government improve its planning capacity andeconomic management, both of which are indispensabLe to successfullycarry out the new economic poLicy.
- 8 -
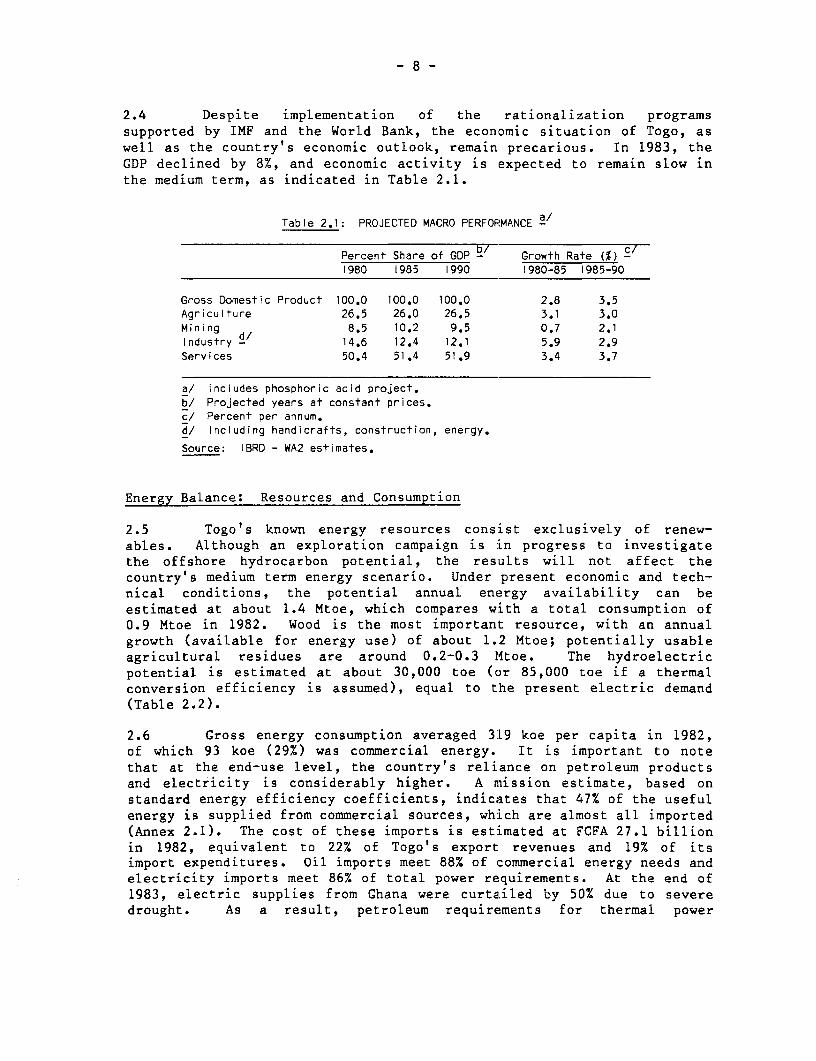
2.4 Despite implementation of the rationalization programssupported by IMF and the World Bank, the economic situation of Togo, aswell as the country's economic outlook, remain precarious. In 1983, theGDP declined by 8%, and economic activity is expected to remain slow inthe medium term, as indicated in Table 2.1.
Table 2.1: PROJECTED MACRO PERFORMANCE 2/
Percent Share of GDP Growth Rate )c1980 1985 1990 1980-85 1985-90
Gross Domestic Product 100.0 100.0 100.0 2.8 3.5Agriculture 26.5 26.0 26.5 3.1 3.0Mining 8.5 10.2 9.5 0.7 2.1Industry - 14.6 12.4 12.1 5.9 2.9Services 50.4 51.4 51.9 3.4 3.7
a/ Includes phosphoric acid project.b/ Projected years at constant prices.c/ Percent per annum.d/ Including handicrafts, construction, energy.
Source: IBRD - WA2 estimates.
Energy Balance: Resources and Consumption
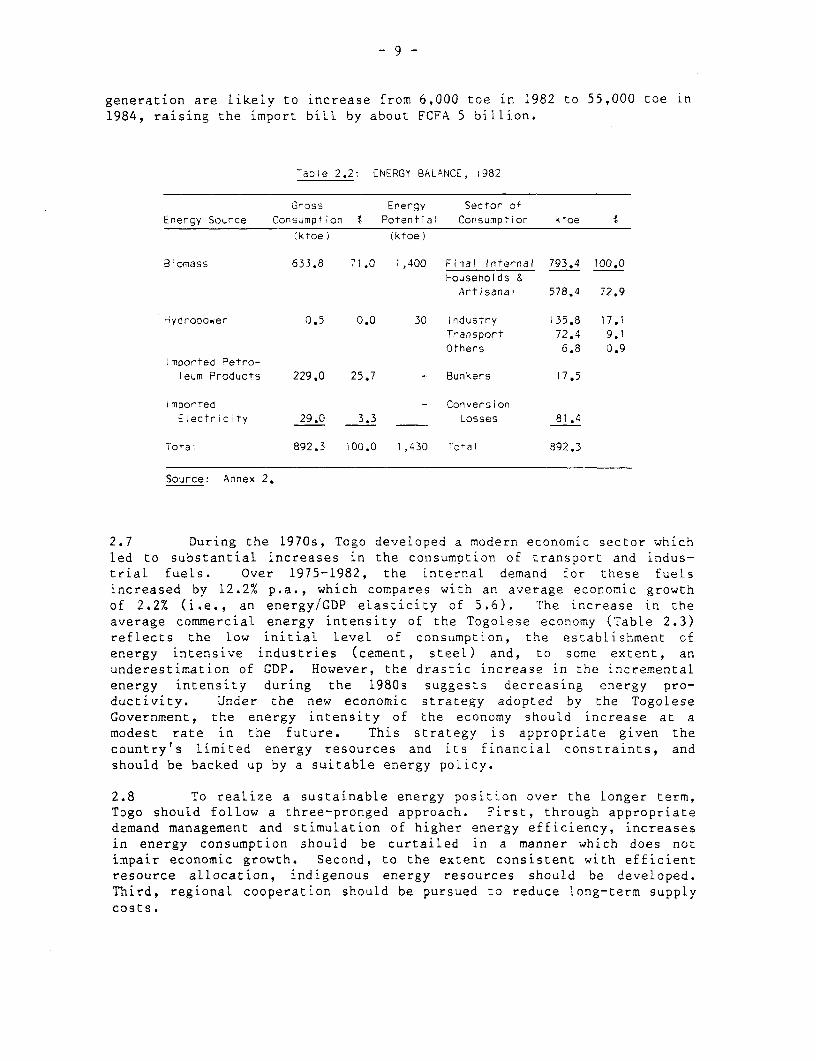
2.5 Togo's known energy resources consist exclusively of renew-ables. Although an exploration campaign is in progress to investigatethe offshore hydrocarbon potential, the results will not affect thecountry's medium term energy scenario. Under present economic and tech-nical conditions, the potential annual energy availability can beestimated at about 1.4 Mtoe, which compares with a total consumption of0.9 Mtoe in 1982. Wood is the most important resource, with an annualgrowth (available for energy use) of about 1.2 Mtoe; potentially usableagricultural residues are around 0.2-0.3 Mtoe. The hydroelectricpotential is estimated at about 30,000 toe (or 85,000 toe if a thermalconversion efficiency is assumed), equal to the present electric demand(Table 2.2).
2.6 Gross energy consumption averaged 319 koe per capita in 1982,of which 93 koe (29%) was commercial energy. It is important to notethat at the end-use level, the country's reliance on petroleum productsand electricity is considerably higher. A mission estimate, based onstandard energy efficiency coefficients, indicates that 47% of the usefulenergy is supplied from commercial sources, which are almost all imported(Annex 2.1). The cost of these imports is estimated at FCFA 27.1 billionin 1982, equivalent to 22% of Togo's export revenues and 19% of itsimport expenditures. Oil imports meet 88% of commercial energy needs andelectricity imports meet 86% of total power requirements. At the end of1983, electric supplies from Ghana were curtailed by 50% due to severedrought. As a result, petroleum requirements for thermal power
-9-
generation are likely to increase from 6,000 toe in 1982 to 55,000 toe in1984, raising the import bill by about FCFA 5 billion.
,aDle 2.2: ENERGY BALANCE, i982
Gross Energy Sector ofEnergy Source Consimp+ion t Potential Consumption ktoe I
(ktoe) (ktoe)
Biomass 633.8 71.0 1,400 Final Internal 793.4 100.0Households &Artisanal 578.4 72.9
4-ydropower 0.5 0.0 30 Industry 135.8 17.1Transport 72.4 9.1Others 6.8 0.9
!mDorted Petro-leum Products 229.0 25.7 - Bunkers 17.5
Imported - ConversionElectricity 29.0 3.3 _ Losses 81.4
Total 892.3 100.0 1,430 Total 892.3
Source: Annex 2.
2.7 During the 1970s, Togo developed a modern economic sector whichled to substantial increases in the consumption of transport and indus-trial fuels. Over 1975-1982, the internal demand for these fuelsincreased by 12.2% p.a., which compares with an average economic growthof 2.2% (i.e., an energy/GDP elasticity of 5.6). The increase in theaverage commercial energy intensity of the Togolese economy (Table 2.3)reflects the low initial level of consumption, the establishment cfenergy intensive industries (cement, steel) and, to some extent, anunderestimation of CDP. However, the drastic increase in the incrementalenergy intensity during the 1980s suggests decreasing energy pro-ductivity. Under the new economic strategy adopted by the TogoleseGovernment, the energy intensity of the economy should increase at amodest rate in the future. This strategy is appropriate given thecountry's limited energy resources arid its financial constraints, andshould be backed up by a suitable energy policy.
2.8 To realize a sustainable energy position over the longer term,Togo should follow a three-pronged approach. First, through appropriatedemand management and stimulation of higher energy efficiency, increasesin energy consumption should be curtailed in a manner which does notimpair economic growth. Second, to the extent consistent with efficientresource allocation, indigenous energy resources should be developed.Third, regional cooperation should be pursued to reduce long-term supplycosts.

- 10 -
Table 2.3: ECONOMIC GROWTH AND COMMERCIAL ENERGY CONSUMPTION
Growti Rates
1975 1980 1982 1980/75 '982/80 1982/75
internal Petroleum Demand
(ktoe) 91.0 I50.0 203.8 '0.5 16.6 12.2
Electricity
(ktoe) 5.3 11.5 12.0 16.7 2.2 i2.4
Total Commercial Energy 96.3 161,5 215.8 i0.9 15.6 12.2
GDP (US$ milions) a/ 912.3 1130.6 1056.0 4.4 3.4 2.1
Average Energy
Intensity b/ 106 143 204
incremental Energy
Intensity b/ 473 13923
a/ in constant 1980 Drices.
b/ toe/Million US$.
Source: Mission estimate.
Demand Management by Economic Subsectors
2.9 The following section studies the current energy use in each
sector of consumption, projects energy demand to 1988 and 1998, and
evaluates energy conservation and substitution opportunities.
2.10 The mission has projected the energy balance to 1988 and 1998
(Table 2.4), with the objective of assessing the aggregate results that
could be achieved through the demand management recommendations made in
this section. These projections are based on the low demand growth
scenario, with gross per capita consumption rising at about 1.5% per
annum (from 319 koe in 1982 to 402 koe in 1998). On the supply side, the
projections assume continued financial restrictions on oil imports and
limits on electricity supplies from Ghana determined by contract Levels
in 1988 and the physical carrying capacity of the existing transmission
line by 1998 taking into account the Benin load. In the event that the
West Africa Interconnection becomes operational in the 1990s, a more
rapid growth of electricity consumption could be envisaged. The latter
also implies that other concomitant conditions to expand electric service
be met (such as the level and distribution of personal income and new
productive applications of eLectricity).

- il -
Table 2.4: PROJECTED 4INAL iNTERNAL DEMAND
'982 1988 1998
(ktoe) 1) (ktoe) () (ktoe) !
Fuelwood - Residues 527 66 627 65 827 58
Charcoal 32 4 57 6 160 II
Petroleum Products 205 26 241 25 375 26
Eiectricity 29 4 39 4 68 5
Toral 793 100 964 100 1,430 100
Averace Annuai Growth Rate 3.3% 4.0%
Source: Anrexes 2.2 and 2.3.
Household and Artisanal Energy Consumption
2.11 The use of energy by households and by cottage industries (71%of total energy consumption in 1982) cannot be differentiated for Lack ofdata. Fuelwood and charcoal are the basic energy sources used for cook-ing. Kerosene, LPG and electricity have only marginally entered thismarket; kerosene is mostly used for lighting (TabLe 2.5).
Table 2.5: TOGO: 1982 HOUSEHOLD AND ARTISANALENERGY CONSUMPT iON
(in tons of oii equivalent)
loiuume Percent
Biomass a/ 557,510 96.4
LPG 469 0.'
Kerosene 14,285 2.5
Electricity 6,087 1.0
Total 578,351 100.0
a/ Annexes 2-5.
Source: Mission esTimates.
2.12 The data base on actual fuelwood and charcoal consumption inTogo is poor. No theoretically sound study has been made to determinethe level of consumption and the relative share of each fuel. The
- 12 -
mission believes past estimates have tended to overstate consumpcion, asexplained in the following paragraphs.
2.13 Level of Consumption. Per capita consumption for cooking isestimated by the mission at 440 kg/year of fuelwood in urban householdsand 528 kg/year in rural households; charcoal consumption is taken at 100kg/year. These estimates were derived from: (a) minimum useful energyrequirements; (b) actual measured charcoal consumption; and (c) com-parison with consumption in other West African countries. They also arebased on the assumption that the efficiency of fuelwood stoves in urbanareas averages 13%, and that of charcoal stoves, 25%. The 20% higherrural consumption estimate reflects the fact that fuelwood is gatheredfreely; hence, there is less incentive for energy savings.
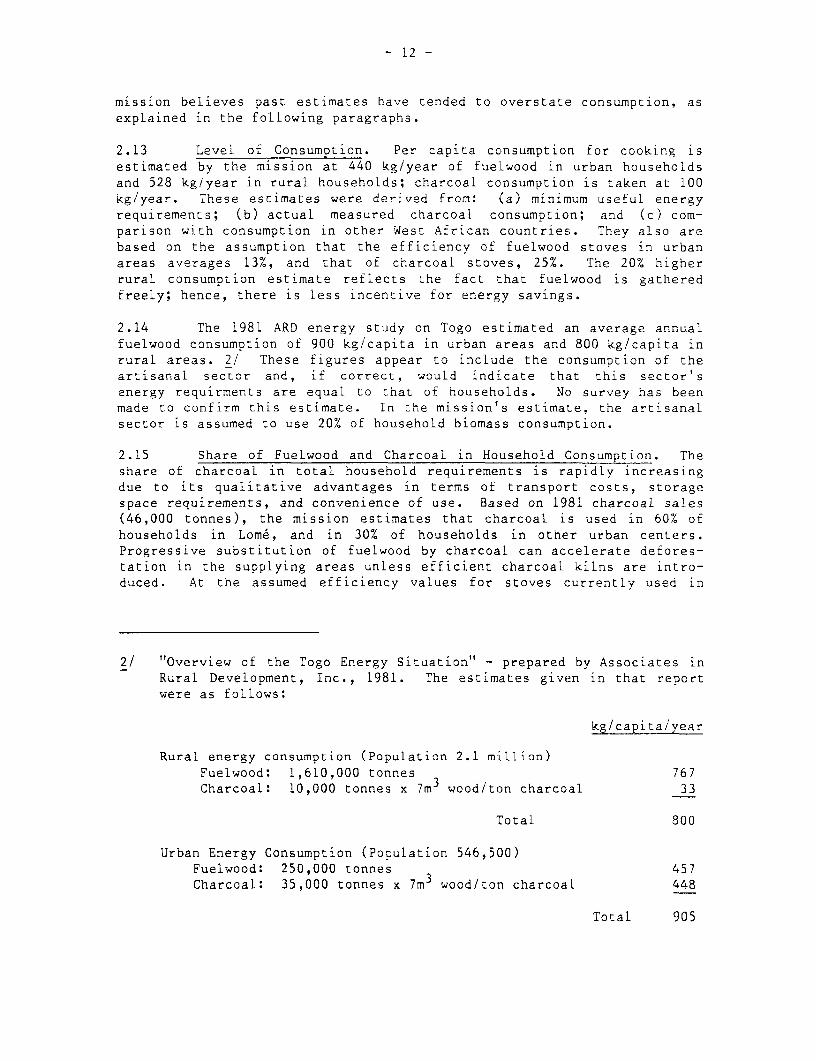
2.14 The 1981 ARD energy study on Togo estimated an average annualfuelwood consumption of 900 kg/capita in urban areas and 800 kg/capita inrural areas. 2/ These figures appear to include the consumption of theartisanal sector and, if correct, would indicate that this sector'senergy requirments are equal to that of households. No survey has beenmade to confirm this estimate. In the mission's estimate, the artisanalsector is assumed to use 20% of household biomass consumption.
2.15 Share of Fuelwood and Charcoal in Household (onsumption. Theshare of charcoal in total household requirements is rapidly increasingdue to its qualitative advantages in terms of transport costs, storagespace requirements, and convenience of use. Based on 1981 charcoal sales(46,000 tonnes), the mission estimates that charcoal is used in 60% ofhouseholds in Lome, and in 30% of households in other urban centers.Progressive substitution of fuelwood by charcoal can accelerate defores-tation in the supplying areas unless efficient charcoal kilns are intro-duced. At the assumed efficiency values for stoves currently used in
2/ "Overview of the Togo Energy Situation" - prepared by Associates inRural Development, Inc., 1981. The estimates given in that reportwere as follows:
kg/capita/year
Rural energy consumption (Population 2.1 million)Fuelwood: 1,610,000 tonnes 767Charcoal: 10,000 tonnes x 7m3 wood/ton charcoal 33
Total 800
Urban Energy Consumption (Population 546,500)Fuelwood: 250,000 tonnes 457Charcoal: 35,000 tonnes x 7m3 wood/ton charcoal 448
Total 905

- 13 -
Togo, the charcoal alternative equals direct fuelwood use only if thethermal efficiency of charcoal conversion is 52%. 3/
Price of Household Fuels
2.16 Typical firewood and charcoal prices are given in Table 2.6.Firewood prices at the village level are'extremely variable, so averagestatistics should be used with great caution. ODEF sells both charcoaland firewood at subsidized prices, but in small quantities that fallshort of demand and do not influence the free market price. Charcoalprices have risen more sharply than firewood prices. For example, theprice of charcoal was FCFA 440 per sac in 1974, FCFA 800 in early 1981,FCFA 1,100 by late 1981, and FCFA 1,200 in 1983. On the other hand, the1975 firewood price of FCFA 800/stere can be compared with the 1983 priceof FCFA 1500. Charcoal prices are expected to continue to rise at afaster rate than firewood prices.
Table 2.6: FIREWOOD AND CHARCOAL PRICES
Firewood FCFA/stere FCFA/kg FCFA/Mcal
ODEF price, Lome 1500 3.57 1.02Free market, Lome 2000-2500 4.76-5.95 1.36-1.70Interior town (La Kara) 2500 5.95 1.70Village market Highly variable 1.5-4 0.43-1.14
Charcoal (CFA/sac) CFA/kg CFA/Mcal
ODEF price, Lome 1200 30.8 4.4Free market, Lome 1500-2000 38.5-51.3 (5.5-7.3)Interior town (Sokod6) 1000-2000 25.6-51.3 (3.7-7.3)
2.17 The analysis of end use costs at the consumer level indicatesthat at present market prices, fuelwood and charcoal are the mosteconomic energy sources for cooking. In addition, access to kerosene andLPG is limited to the higher income groups that can afford to purchase astove. In the longer term, fuelwood prices will have to reflect the
3/ Direct fuelwood utilization:
1 m3 of solid wood 700 kg/m3 x 3,500 kcal/kgx 0.13 (stove efficiency) = 318,500 kcal
Charcoal Conversion1 m3 of solid wood * 700 kg/m3 x 3,500 kcal * 0.52
(charcoal conversion efficiency) * (0.25/stove efficiency)= 318,500 kcal
- 14 -
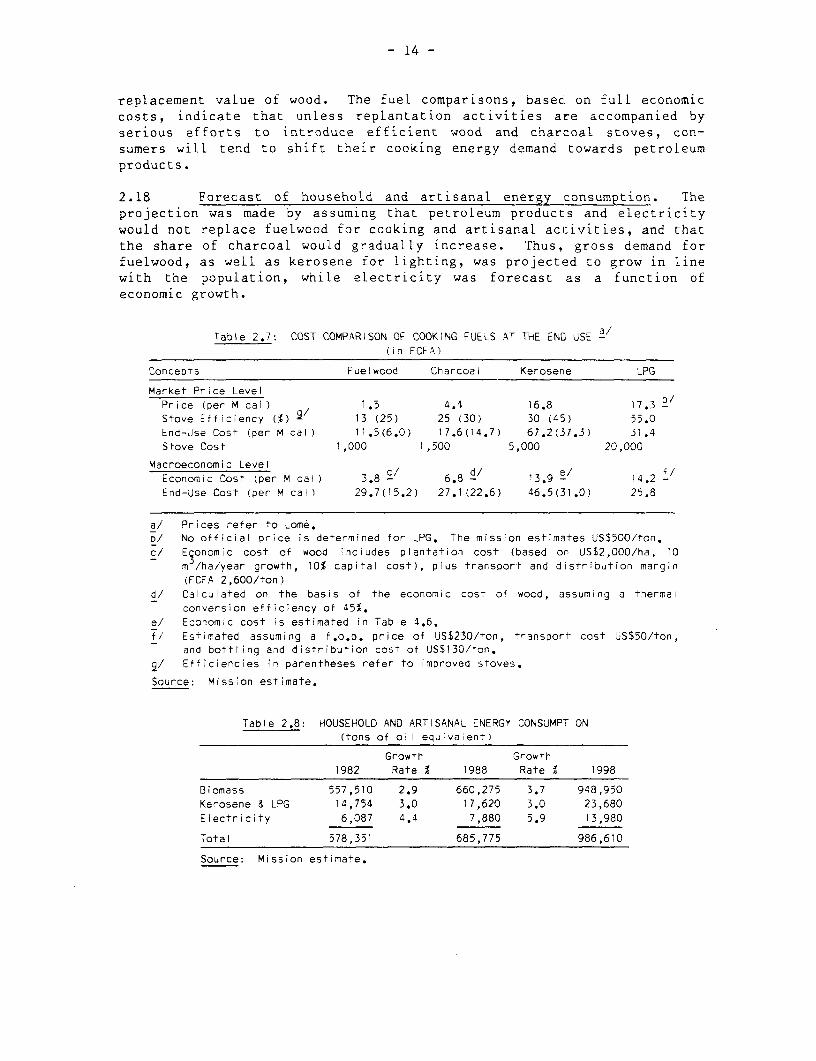
replacement value of wood. The fuel comparisons, basedc on full economiccosts, indicate that unless replantation activities are accompanied byserious efforts to introduce efficient wood and charcoal stoves, con-sumers will tend to shift their cooking energy demand towards petroleumproducts.
2.18 Forecast of household and artisanal energy consumption. Theprojection was made by assuming that petroleum products and electricitywould not replace fuelwood for cooking and artisanal activities, and thatthe share of charcoal would gradually increase. Thus, gross demand forfuelwood, as well as kerosene for lighting, was projected to grow in linewith the population, while electricity was forecast as a function ofeconomic growth.
Table 2.7: COST COMPARISON OF COOKING FUELS AT THE END USE a!(in FCFA)
Concepts Fuelwood Charcoal Kerosene LPG
Market Price Level
Price (per M cal) 1.5 4.4 16.8 17.3 'Stove Efficiency q/ 9/ 13 (25) 25 (30) 30 (45) 55.0
End-Use Cost (per M cal) 11.5(6.0) 17.6(14.7) 67.2(37.3) 31.4
Stove Cost ',000 1,500 5,000 20,000
Macroeconomic Level c/ d/ e/ f/Economic Cost (per M cal ) 3.8 - 6.8 - 13.9 - 14.2 -
End-Use Cost (per M cal) 29.7(15.2) 27.1(22.6) 46.5(31.0) 25.8
a/ Prices refer to Lome.b/ No official price is determined for LPG. The mission estimates US$500/ton.
c/ Economic cost of wood includes plantation cost (based or US$2,000/ha, 10m /ha/year growth, 10% capital cost), plus transport and distribution margin
(FCFA 2,600/ton)d/ Calculated on the basis of the economic cost of wood, assuming a thermai
conversion efficiency of 45%.e/ Economic cost is estimated in Table 4.6.fi Estimated assuming a f.o.o. price of US$230/ton, transporl- cost US$50/ton,
and bottling and distribution cost of US$130/ton.
g/ Efficiencies in parentheses refer to improved stoves.
Source: Mission estimate.
Table 2.8: HOUSEHOLD AND ARTISANAL ENERGY CONSUMPTION(tons of oil equivalent)
Growth Growth
1982 Rate 1 1988 Rate % 1998
Biomass 557,510 2.9 660,275 3.7 948,950
Kerosene & LPG 14,754 3.0 17,620 3.0 23,680
Electricity 6,087 4.4 7,880 5.9 13,980
Total 578,351 685,775 986,610
Source: Mission estimate.
- 15 -
Recommendations for Energy Savings
2.19 The efficiency of the fuelwood chain can, and should, beimproved. At the end-use level, the mission suggests that:
(a) technical assistance be provided to establish a viable stoveprogram in Togo. The present research and development effortsof the Solar Energy Laboratory of the University of Benin inLome on improved clay stoves are insufficient to achieve sig-nificant market penetration. Experiences in other countrieshave shown that the introduction of improved metal stoves inurban areas through commercial channels permits the accel-eration of dissemination and that in rural areas an initialstrong promotional campaign has to be deployed to insure self-sustaining propagation of clay stoves. Tests with the "Ouaga"fuelwood stove have revealed that stoves with a thermal effi-ciency of 40% (about 25% in field tests) can be bulk producedat low cost and with good quality control. In Togo, theeffects of introducing a similar stove can be very important:(a) fuelwood consumption could be cut significantly (25% effi-ciency in the Ouaga stove compared to about 13% in the currentstove); (b) household welfare can be improved, with savings ofFCFA 5,500 in wood purchases, 4/ which compares to an invest-ment of FCFA 1200 per stove; and (c) creation of new artisanalemployment.
2.20 Given the social and economic similarities of Benin and Togo,the mission suggests the establishment of a joint improved stove programfor both countries, with the following components:
(a) Identification of a recipient institution for technicaL assis-tance that would test the adaptability of improved stovedesigns (such as the Ouaga stove) to local conditions andsolve, with the assistance of outside experts, the tech-nological problems of locally manufacturing stoves.
(b) Training of personnel of the recipient institution on thetechnological, social and economic aspects of developing anddisseminating improved stoves.
(c) Training of local artisans in the production of improved stovesand introduction of quality control systems.
(d) Field testing of locally produced stoves and an informationcampaign to alert the consumers to the advantages of the tech-nology.
4/ Fuelwood consumption: urban: 440 kg/capita/year x 5 persons/house-hold x 5 FCFA/kg = 11,000 FCFA/year.
- 16 -
2.21 The program should have as initial targets the markets of thetwo capital cities. This implies that at least three stoves have to beintroduced: a metallic wood stove -- mainly for Cotonou, a metalliccharcoal stove -- mainly for Lome, and a clay wood stove for rural areasof both countries. The mission estimates that the first phase of thisprogram would cost US$400,000 (US$200,000 for each country) over aboutthree years.
2.22 The mission also recommends that a survey of the main artisanalactivities be made to evaluate wood and charcoal consumption in thissector and to identify opportunities for savings. This study shouldinclude edible oil extraction (palm oil), fish and meat smoking, corn andmillet beer fabrication, tuber drying and grinding (corn and maniocflour, gari), baking, salt, metalwork and pottery. This would require asix-month study costing about US$75,000 for each country.
Industrial Energy Consumption
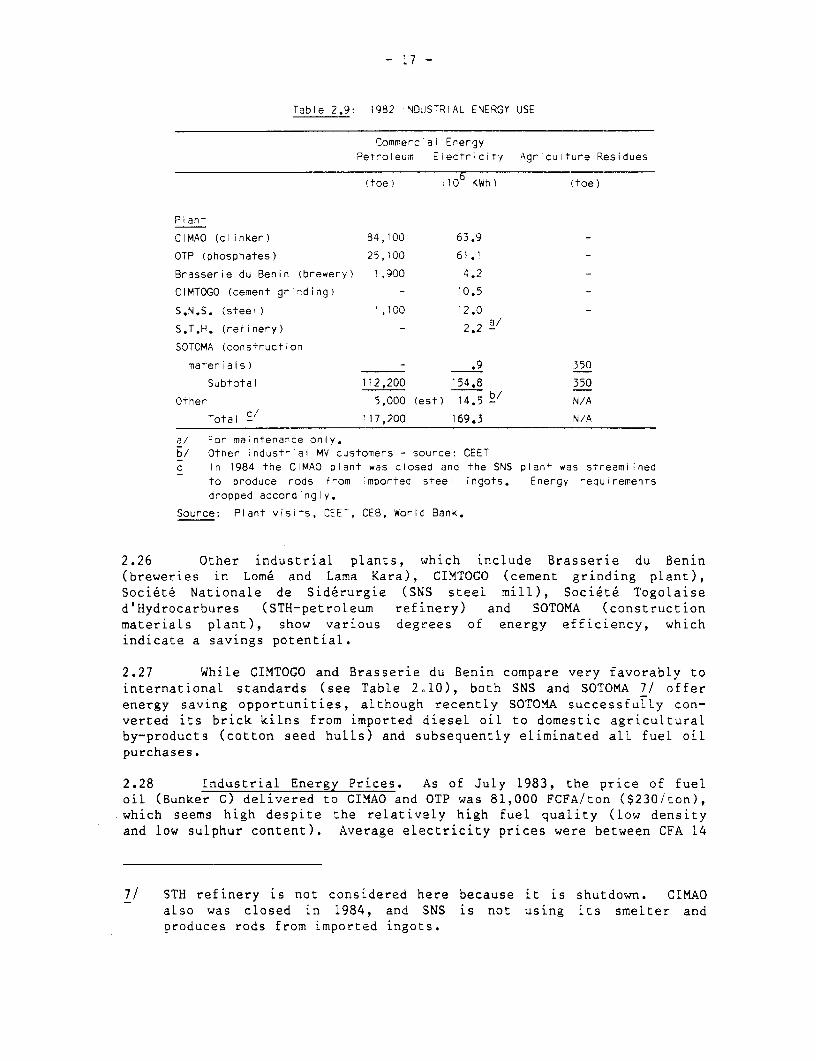
2.23 Current Energy Use Patterns. In 1982, the Togolese industryconsumed roughly 117,000 tons of petroleum products, of which about 87%was fuel oil and the remainder diesel oil, and 162 GWh ot- electric energy(Table 2.9). The CIMAO and OTP plants jointly consamed 93% of thepetroleum products and 77% of the electricity used in the whole sector.Preliminary estimates for 1983 indicate a likely decrease in both fueland electricity consumption for the sector because of lower productionlevels in all activities. 5/
2.24 Plant visits indicated that both OTP's and CIMAO's energy effi-ciencies compare favorably with international standards as their equip-ment is recent and well maintained and operated. For example, CIMAO'sclinker kilns consume an estimated 875 kcal/kg of clinker and thegrinder-predryer another 58 kcal/kg. If fuel preheating and othersecondary fuel uses are included, total fuel-specific consumption isabout 940-950 kcal/kg of clinker, well within the best internationalstandard for similar operation. Electricity specific consumption runs at74-75 kWh/metric ton, which is also a good performance given the highcrude humidity. 6/
2.25 OTP phosphate dryers, which are the major fuel users of thefacility, consume 125-135 kcal/kg of product, which corresponds to 720-790 kcal/kg of water evaporated, or an average thermal efficiency of 80%.
5/ Total petroleum product consumption should not reach 100,000 TOE andelectricity consumption is likely to decrease below 150 GWh.
6/ Average moisture content of crude is between 12 and 16%.
- 17 -
Table 2.9: 1982 iNDUSTRIAL ENERGY USE
Commerc al EnergyPetroleum Eiectricity Agricuiture Residues
6(toe) (10 KWh) (toe)
Plant
CIMAO (clinker) 84,100 63.9 -
OTP (phosphates) 25,100 61.1 _
Brasserie du Benin (brewery) 1,900 4.2 _
CIMTOGO (cement grinding) - 10.5 _
S.N.S. (steei) 1,100 12.0 -
S.T.H. (refinery) - 2.2 3/
SOTOMA (construction
marerials) - .9 350
Subtotal 112,200 154.8 350
Other 5,000 (est) 14.5 b/ N/A
Total c/ 117,200 169.3 N/A
a/ For ma;ntenance only.b/ Other industriai MV customers - source: CEETc In 1984 the CIMAO Dlant was closed and the SNS plant was streamlined
to produce rods from imported steel ingots. Energy requirements
dropped accordingly.
Source: Plant vis,ts, CEET, CE8, World Bank.
2.26 Other industrial plants, which include Brasserie du Benin
(breweries in Lom6 and Lama Kara), CIMTOGO (cement grinding plant),
Societe Nationale de Siderurgie (SNS steel mill), Societe Togolaise
d'Hydrocarbures (STH-petroleum refinery) and SOTOMA (construction
materials plant), show various degrees of energy efficiency, which
indicate a savings potential.
2.27 While CIMTOGO and Brasserie du Benin compare very favorably to
international standards (see Table 2.10), both SNS and SOTOMA 7/ offer
energy saving opportunities, although recently SOTOMA successfully con-
verted its brick kilns from imported diesel oil to domestic agricultural
by-products (cotton seed hulls) and subsequently eliminated all fuel oil
purchases.
2.28 Industrial Energy Prices. As of July 1983, the price of fuel
oil (Bunker C) delivered to CIMAO and OTP was 81,000 FCFA/ton ($230/ton),
which seems high despite the relatively high fuel quality (low density
and low sulphur content). Average electricity prices were between CFA 14
7/ STH refinery is not considered here because it is shutdown. CIMAO
also was closed in 1984, and SNS is not using its smelter and
produces rods from imported ingots.

- 18 -
and 20/kWh for the larger users (CIMAO, OTP, SNS), and between CFA 25 and35/kWh for smaller users. Owing to CEB's source of supply (hydro fromGhana), industrial electricity prices in Togo compares favorably withthose of most developing countries (US¢4-10/kWh).
Table 2.10: ENERGY PERFORMANCE OF MAJOR INDUSTRIAL PLANTS
Fuer 0i Electricity
Current Standard Current Standard
(toe) (KWh)
CIMAO (clinker) .095 0.085-0.097 74-75 65- 80
OTP (phosphates) .013 0.011-0.015 22-28 N/ABrasserie Du Benin (beer) .053 0.050-0.070 120 100-130
CIMTOGO (cement) N/A N/A 35 30- 40
SNS (steel rods) .110 0.080-0.090 1,440 900SOTOMA (Bricks) 0 0.065-0.075 58 - 40- 50
a/ Partially shut down.
Source: WORLD BANK; (Hagler, Bailly & Company).
2.29 Energy Efficiency Improvement Opportunities. Except CIMTOGOand STH, aLl other plants have an energy saving potential. As shown inTable 2.11, energy conservation opportunities in the remaining largeplants (i.e., OTP, CIMAO, Brasserie du Benin, SNS and SOTOMA) may repre-sent up to 9,000 toe or 8% of the petroleum consumption of the sector.This potential is relatively low compared to that of many LDCs where itusually ranges between 10 and 25 percent. This is due to the fact thatmost plants in Togo are recent and well designed. Still, this potentialrepresents a foreign exchange savings of up to CFA 700 million a year.
2.30 More importantly, fuel switching in both CIMAO and OTP fromheavy oil to coal could reduce the sector's petroleum consumption by astaggering 90% and translate into potential foreign exchange savings ofCFA 4 biLlion a year. While coal conversion would definitely improve theplants' competitiveness, the large investment requirements (roughly CFA8-9 billion) and the lack of skills to handle the new fuel make theseswitches unlikeLy before the end of the decade. Postponing the decisionto convert to coal also would allow time to obtain confirmation ofnatural gas resources in neighboring countries and/or in Togo (para.4.31).
2.31 Conservation benefits, on the other hand, may be captured veryquickly, i.e., in less than three years for most opportunities.
2.32 Industrial Energy Demand Forecast. The mission's estimates,based on the assumption that CIMAO will resume operation, indicate thattotal fuel consumption in the industrial area will not increase signif-icantly by 1988 from its 1982 leveL of 117,000 toe, but will increase to165,000-180,000 toe by 1998, an average 2.2-2.7%/year.

- 19 -
Table 2.11: ENERGY SAVING OPPORTUNITIES IN MAJOR INDUSTRIAL
PLANTS - SUMMARY
From conservation From fuel switching
Potential Investment Potential Investment
Savings Required Savings Required
(TOE/Year) (CFA-Million) (TOE/Year) (CFA-Million)
CIMAO 1,700-3,500 170-220 84,000 a/ 5,600 bOTP 2,500-5,100 500-700 25,000 a/ 2,000-3,000 -
Brasserie du Benin 50- 100 5- 8 N/A N/ASNS 150- 250 5- 10 - (1,000) d
SOTOMA 10- 20 e 4- D _ -
Total 5 plants 4,410-8,970 684-943 '110,000) a! 7,600-8,600
a! If Bunker C is repiaced by coal, dol ar savings of $70 (FCFA 25,000) perton of oil dispiaced would result, assuming a de! ivered price of coal of590/ton - (CIF-LOME).
b/ Large uncertainty on investment, as detailed study is required to Droveoroject feasibility.
0/ Includes audit cost.d/ Switch from diesel oil to heavy oil.
e/ Electricity.
2.33 Electricity consumption is projected to increase from 169.3 GWhin 1982 to 195.7-210.3 GWh in 1988 and 285.7-331.5 GWh in 1998, anaverage annual growth rate of 3.3 - 4.3%. This differential rate ofgrowth between fuel and electricity consumption reflects the fact thatmedium size enterprises, operating in the mechanical and metal fields,are expected to grow faster than fuel intensive activities, such asproduction of construction materials.
2.34 The peak electric load is also projected to grow moderatelyfrom 48 MW in 1982 to 55.5 MW in 1988 and 85.5 MW in 1998 (see Table2.12).
Conclusions and Recommendations
(a) The current institutional framework in Togo is not adequate toensure efficient industrial energy planning and assist indus-tries in improving their energy performance. The missiontherefore suggests that the Ministry of Planning and Industryshould attract at least one energy conservation officer (engin-eer) to organize the conservation activities. The Direction del'Hydraulique et de l'Energie has a few capable, young engin-eers. Consideration should be given to transfering one of themto the Ministry of Planning and Industry. A short trainingcourse offshore would be sufficient to qualify this officer forthe following tasks:
- collecting industrial production statistics and forecastsfor major energy users, including OTP, CIMAO and SNS, aspart of their annual survey;
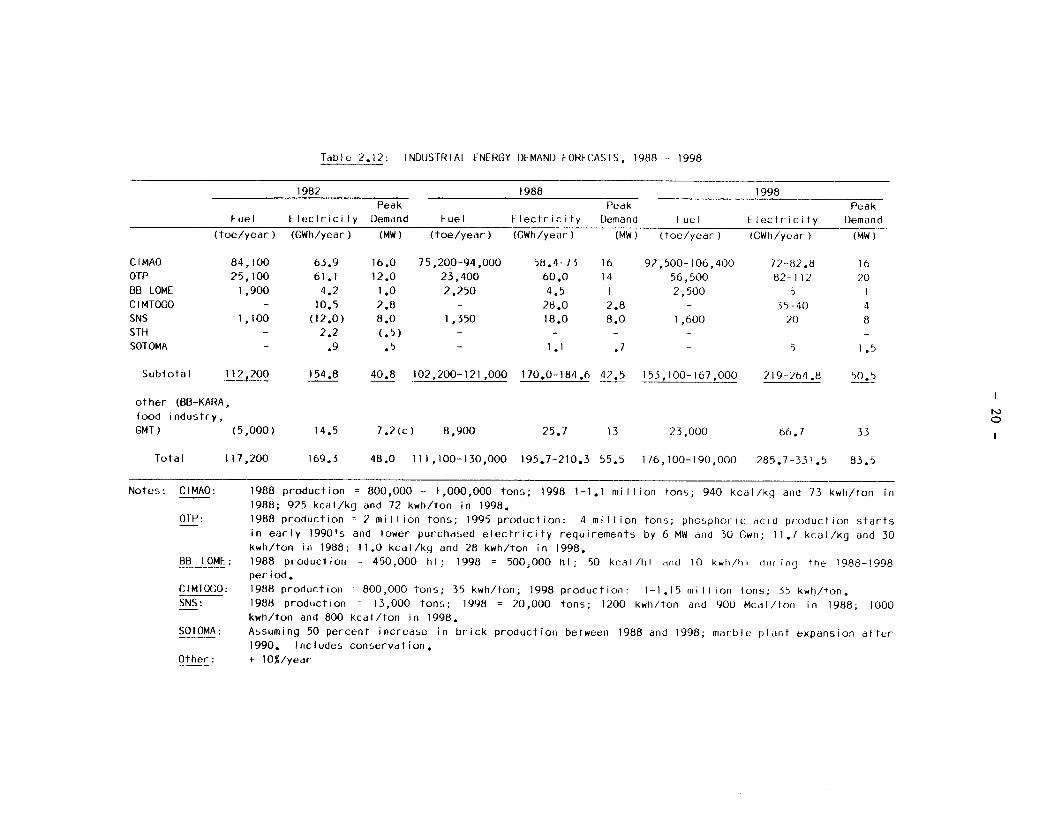
Table 2.12: INDUSTRIAL ENERGY DEMAND FORECASIS, 1988 - 1998
1982 1988 1998Peak Pedk Peak
Fuel Flectricily Demand Fuel Electricity Demand iuel Electricity Demand
(toe/year) (GWh/year) (MW) (toe/year) (GWh/year) (MW) (toe/year) (GWh/year) (MW)
CIMAO 84,100 63.9 16.0 75,200-94,000 58.4-73 16 92,500-106,400 72--82.8 16OTP 25,100 61.1 12.0 23,400 60.0 14 56,500 82-112 20BB LOME 1,900 4.2 1.0 2,250 4.5 1 2,500 5 1CIMTOGO - 10.5 2.8 - 28.0 2.8 - 35-40 4SNS 1,100 (12.0) 8.0 1,350 18.0 8.0 1,600 2( 8STH - 2.2 (.5) - - - - - -SOTOMA - .9 .5 - 1.1 .7 - 5 1.5
Subiotal 112,200 154.8 40.8 102,200-121,000 170.0-184.6 42.5 153,100-167,000 219-264.8 50.5
other (BB-KARA,
food industry, OGMT) (5,000) 14.5 7.2(c) 8,900 25.7 13 23,000 66.7 33
lotal 117,200 169.3 48.0 111,100-130,000 195.7-210.3 55.5 176,100-190,000 285.7-331.5 83.5
Notes: CIMAO: 1988 production = 800,000 - 1,000,000 tons; 1998 1-1.1 million tons; 940 kcal/ky and 73 kwh/Ion in1988; 925 kcal/kg and 72 kwh/ton in 1998.
OTP: 1988 production = 2 million tons; 1995 production: 4 million tons; phosphoric dcid production startsin early 1990's and lower purchased electricity requirements by 6 MW and 30 Gwh; 11.1 kcal/kg and 30kwh/ton in 1988; 11.0 kcal/kg and 28 kwh/ton in 1998.
BB LOME: 1988 productionf 450,000 hl; 1998 = 500,000 hl; 50 kcal/hl dnd 10 kwh/hI during the 1988-1998period.
CIMIOGO: 1988 production= 800,000 tons; 35 kwh/ton; 1998 production: 1-1.15 mnillion tons; 35 kwh/ton.SNS: 1988 production = 13,000 tons; 1998 = 20,000 tons; 1200 kwh/ton and 900 Mcdl/ton in 1988; 1000
kwh/ton and 800 kcal/ton in 1998.SOTOMA: Assuming 50 percent increase in brick production between 1988 arnd 1998; marble plant expansion after
1990. Includes conservation.Other: + 10%/year

- 21 -
- assisting industries with energy conservation programs. Thesame Ministry should organize with a short-term consultantan audit program for major energy users, according to theschedule outlined in Table 2.13. Simultaneously, it shouldprovide them with brochures, pamphlets and similar materialsdescribing energy saving activities and associated costs(available in French from the French Energy ConservationAgency - AFME); disseminate case studies on successfulexperiences (e.g. SOTOMA's switch from oil to cotton seedhulls) and suggest detailed feasibility studies for majorretrofit or fuel switching projects (e.g. OTP);
- finally, conduct a two-day seminar, sponsored by theMinistry of Planning and the Direction de l'Hydraulique etde l'Energie, to inform and train plant engineers andmanagement. Local speakers should be invited and couldinclude representatives from CIMAO, CEET, Hotel du 2 F6vrierand Brasserie du Benin who demonstrated good knowledge andawareness of energy efficiency matters during the in-countrymission.
Table 2.13: TENTATIVE INDUSTRIAL ENERGY CONSERVATION PROGRAM1984-1986
Detailed FeasibilityTraining Audit Study
OTP Dryers operation Presses and Coalcoal use dryers Conversion
CIMAO - Use of waste fuels b/
SNS Electricity and All plant -/ Continuousfuel use casting
Brasserie duBenin - Steam system -
SOTOMA Electricity Electrical -
use system
a/ During rehabilitation project.b/ Before coal conversion, cement plant could use agricultural wastes
(cotton seed, cornstalks or bagasse for which a '5,000 ron excess isanticipated at the fut ure ANIE sugar plant).
Energy Consumption in Hotels in Togo
2.35 Conservation opportunities in the hotel industry exist in thefollowing three areas: (a) building structure; (b) heating, ventilating,and air-conditioning (HVAC) systems; and (c) appliances. Some of theenergy conservation measures that can be introduced are exemplified in
- 22 -
the two largest hotels in Togo visited by the mission, the 2 Fevrier andthe Sarakawa. Both are major energy consumers.
2.36 In 1982, the 2 Fevrier Hotel consumed 10.7 GWh of electricityand 234 m3 of diesel oil. The Sarakawa consumed 6.2 CWh of electricityand an unknown quantity of oil 8/ (probably less than 120 m3). In termsof electricity consumed per room, 2 Fevrier (680 rooms) averaged 15,721kWh and Sarakawa (250 rooms) 24,880 kWh. These numbers compare with USstandards (17,500-19,200 kWh/room in Miami and Hawaii). If the numbersare adjusted for occupancy rates, however, performances fall con-siderably, at 52,403 kWh/room at 2 Fevrier (20% average occupancy rate)and at 35,542 kWh/room at Sarakawa (70% occupancy rate).
2.37 In 1983, however, much better results are expected as aggres-sive energy saving activities are under way, including shutting offequipment where possible, installing timers, repairing/increasing insula-tion, and installing capacitors. Expected 1983 performances are 39,700kWh/occupied room for the 2 Fevrier and 26,300 kWh/room at Sarakawa(Table 2.14).
2.38 These figures indicate that there is still much room for addi-tional savings. The mission estimates that the 2 Fevrier probably couldlower its electricity consumption to 6 GWh/year or 8,800 kWh/room or29,000 kWh/occupied room, and that Sarakawa could achieve an annual elec-tricity consumption of 3.5 GWh/year or 14,000 kWh/room or 20,000 kWh/oc-cupied room.
2.39 Recommendations to achieve such performance are indicatedbelow:
2 Fevrier Sarakawa
Install condensate return sys- . Calibrate instrumentationtem
Increase laundry operating . Investigate economics of solarfactor water heating and preheating
Conduct detailed analysis of . Install additional capaci-electrical system tators
Install energy management . Install energy managementsystem for peak load shaving system for peak load shaving
8/ The chief hotel engineer (Technical Director) had been on the jobfor only a few months at the time of the mission and did not haveall the information available.
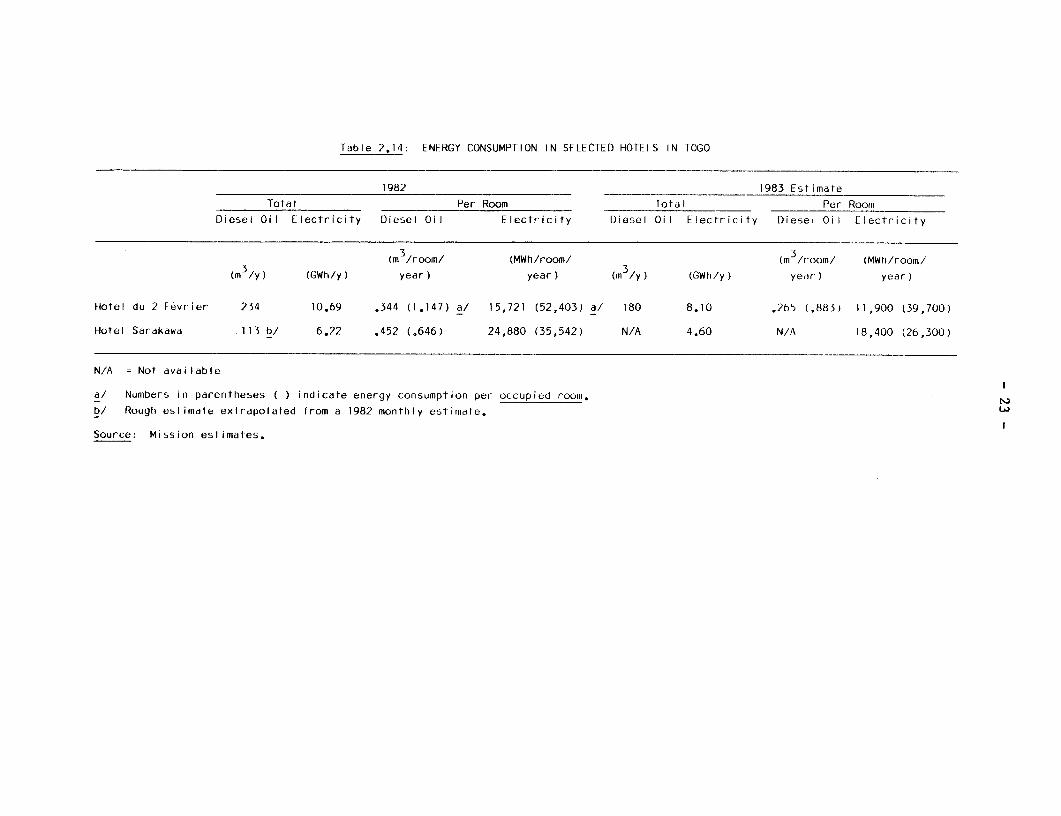
Table 2,14: ENERGY CONSUMPTION IN SELECTED HOTELS IN TOGO
1982 1983 Estimate
Total Per Room Total Per Room
Diesel Oil Electricity Diesel Oil Electricity l)iesel Oil Electricity Diesel Oil Electricity
3 3(m /room/ (MWh/room/ (m /room/ (MWh/room/
(m /y) (GWh/y) year) year) (m /y) (GWh/y) ye,r) year)
Hotel du 2 Fevrier 234 10.69 .344 (1.147) a/ 15,721 (52,403) a/ 180 8.10 .265 (.883) 11,900 (39,700)
Hotel Sardkawa 113 b/ 6.22 .452 (.646) 24,880 (35,542) N/A 4.60 N/A 18,400 (26,300)
N/A = Not dvailable
d/ Numbers in parentheses ( ) indicate energy consumption per occupied room. r
b/ Rough estimate extrapolated from a 1982 monthly estirnate.
Source: Mission estimates.
- 24 -
2.40 Total investments required to implement recommended projects inthe Hotel Fevrier are likely to be CFA 25-45 million and shouLd lead,together with improved maintenance and operation practices, to savings of1-1.5 CWh/year or CFA 30-45 million/year. That is roughly a one yearpayback.
2.41 Total investments required for Sarakawa are estimated atCFA 15-20 million and lead to savings of .75-1 GWh/year or CFA 23-30million, which correspond to less than one year payback.
2.42 As a result of its discussions, the mission concluded thathotel technical staff could carry out these projects by themselves asthey demonstrated good knowledge of energy efficiency matters.
Transport Energy Consumption
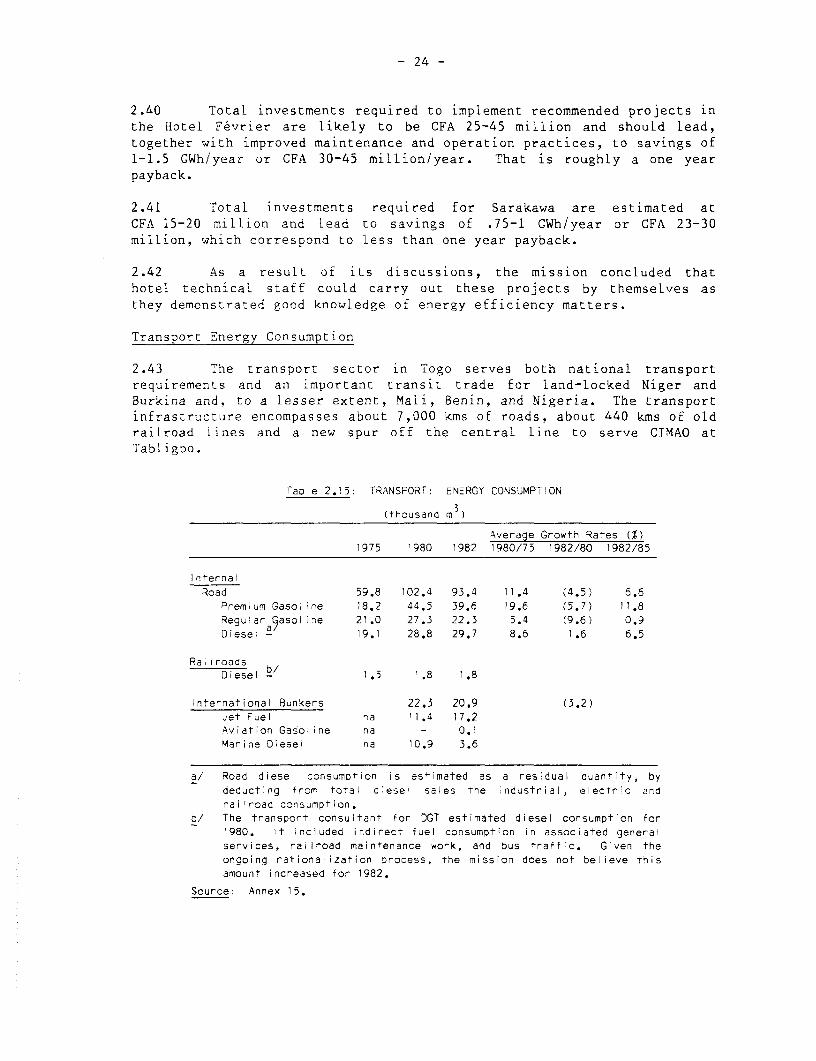
2.43 The transport sector in Togo serves both national transportrequirements and an important transit trade for land-locked Niger andBurkina and, to a lesser extent, Mali, Benin, and Nigeria. The transportinfrastructure encompasses about 7,000 kms of roads, about 440 kms of oldrailroad lines and a new spur off the central line to serve CIMAO atTabligbo.
.abie 2.15: TRANSPORT: ENERGY CONSUMPT ON
(thousand m3)
Average Growth Rates (%)1975 1980 1982 1980/75 1982/80 1982/85
Internal
Road 59.8 102.4 93.4 11.4 (4.5) 6.6Premium Gasoline 18.2 44.5 39.6 19.6 (5.7) 11.8Regular a5asoline 21.0 27.3 22.3 5.4 (9.6) 0.9Diesel - 19.1 28.8 29.7 8.6 1.6 6.5
Ra iroadsDiesel 1.5 1.8 1.8
International Bunkers 22.3 20.9 (3.2)Jet Fuel na 11.4 17.2Aviation Gasoline na - 0.1Marine Diesel na 10.9 3.6
a/ Road diesel consumption is es,imated as a residual quantity, bydeducting from total diesei sales the industrial, electric and
railroad consumption.b/ The transport consuitant for DGT estimated diesel consumption for
1980. It included indirect fuel consumption in associated generalservices, railroad maintenance work, and bus traffic. Given theongoing rationalization Drocess, the mission does not believe thisamount increased for 1982.
Source: Annex 15.
- 25 -
2.44 In 1982, the transport sector consumed roughly 120,000 m3 ofpetroleum products (Table 2.15), equal to about 40% of the country'stotal oil consumption. The energy demand of the sector increased on theaverage by 6.6% p.a. during the 1975-1982 period, which, when compared tothe average economic growth rate, indicates an elasticity of 3. Totalbunker sales in 1982 amounted to about 21,000 m3. Marine diesel saleshave been declining, reflecting price competition from Nigeria andAngola. Domestic air traffic is negligible.
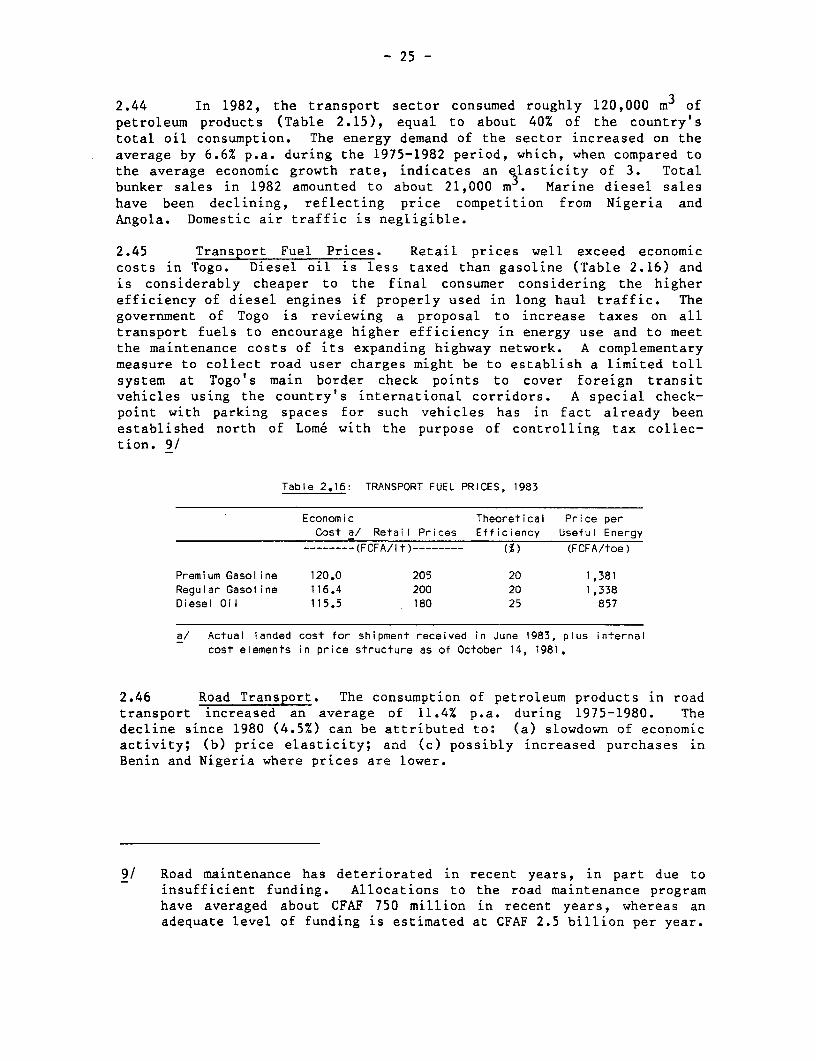
2.45 Transport Fuel Prices. Retail prices well exceed economiccosts in Togo. Diesel oil is less taxed than gasoline (Table 2.16) andis considerably cheaper to the final consumer considering the higherefficiency of diesel engines if properly used in long haul traffic. Thegovernment of Togo is reviewing a proposal to increase taxes on alltransport fuels to encourage higher efficiency in energy use and to meetthe maintenance costs of its expanding highway network. A complementarymeasure to collect road user charges might be to establish a limited tollsystem at Togo's main border check points to cover foreign transitvehicles using the country's international corridors. A special check-point with parking spaces for such vehicles has in fact already beenestablished north of Lome with the purpose of controlling tax collec-tion. 9/
Table 2.16: TRANSPORT FUEL PRICES, 1983
Economic Theoretical Price perCost a! Retail Prices Efficiency Useful Energy
-------(FCFA/lt)-------- (%) (FCFA/toe)
Premium Gasoline 120.0 205 20 1,381Regular Gasoline 116.4 200 20 1,338Diesel Oil 115.5 180 25 857
a! Actual landed cost for shipment received in June 1983, plus internalcost elements in price structure as of October 14, 1981.
2.46 Road Transport. The consumption of petroleum products in roadtransport increased an average of 11.4% p.a. during 1975-1980. Thedecline since 1980 (4.5%) can be attributed to: (a) slowdown of economicactivity; (b) price elasticity; and (c) possibly increased purchases inBenin and Nigeria where prices are lower.
9/ Road maintenance has deteriorated in recent years, in part due toinsufficient funding. Allocations to the road maintenance programhave averaged about CFAF 750 million in recent years, whereas anadequate level of funding is estimated at CFAF 2.5 billion per year.
- 26 -
Table 2.17: COMPARISON OF RETAIL PRICES INNEIGHBORING COUNTRIES, 1983
(FCFA/li ter)
GasolinePremium Regular Gas Oii
Togo 205 200 180
Benin 165 162 132Burkina 285 272 240Niger 240 225 170
Nigeria 104 88 68
Ghana a- 140 116 88
a/ Prices being increased in line with IMF agree-
ment.
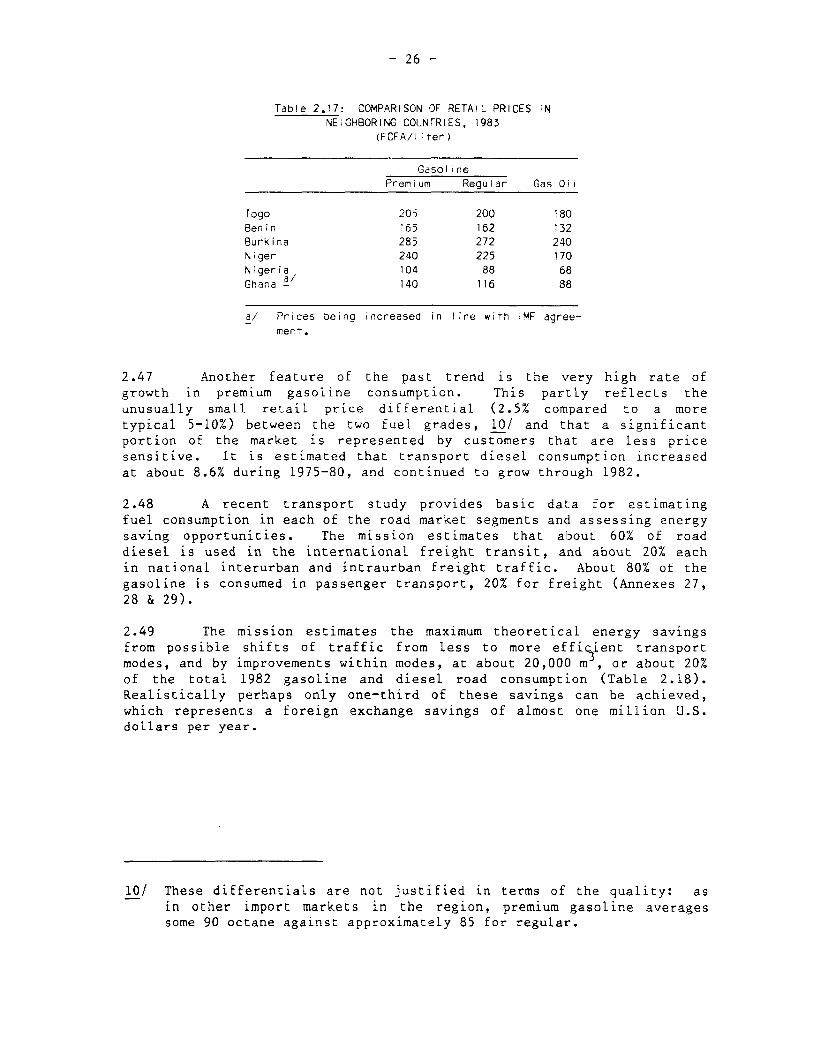
2.47 Another feature of the past trend is the very high rate ofgrowth in premium gasoline consumption. This partly reflects theunusually small retail price differential (2.5% compared to a moretypical 5-10%) between the two fuel grades, 10/ and that a significantportion of the market is represented by customers that are less pricesensitive. It is estimated that transport diesel consumption increasedat about 8.6% during 1975-80, and continued to grow through 1982.
2.48 A recent transport study provides basic data for estimatingfuel consumption in each of the road market segments and assessing energysaving opportunities. The mission estimates that about 60% of roaddiesel is used in the international freight transit, and about 20% eachin national interurban and intraurban freight traffic. About 80% of thegasoLine is consumed in passenger transport, 20% for freight (Annexes 27,28 & 29).
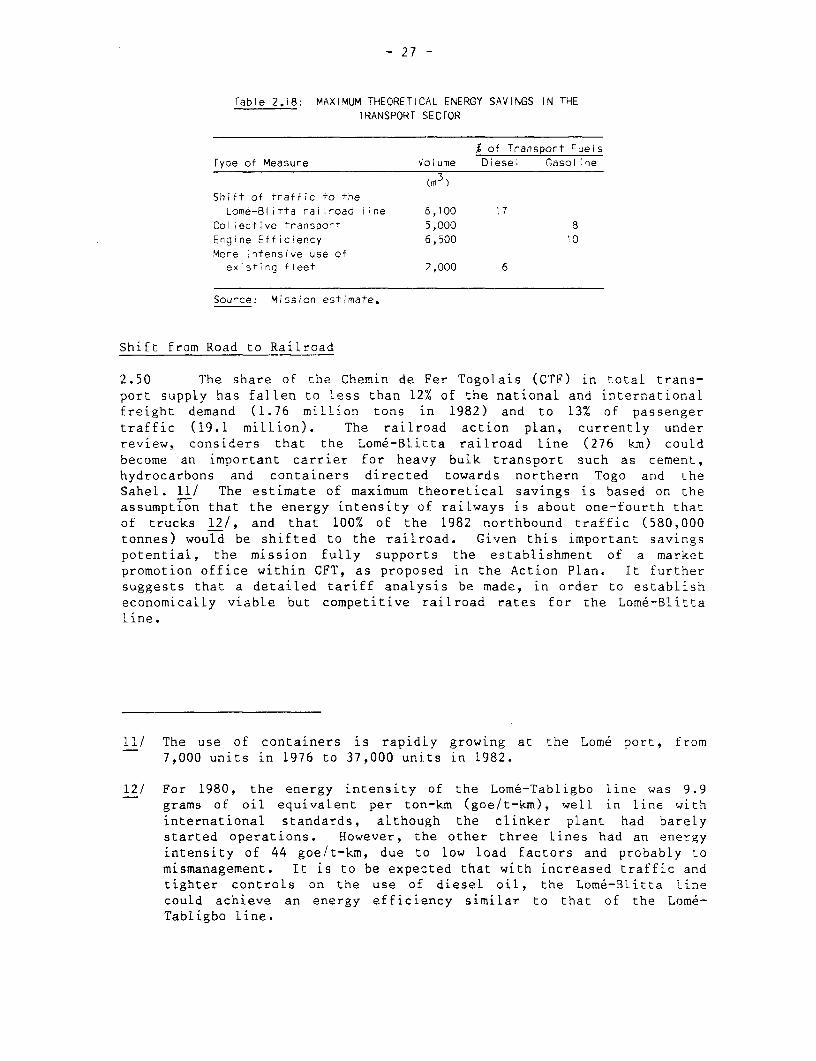
2.49 The mission estimates the maximum theoretical energy savingsfrom possible shifts of traffic from less to more efficient transportmodes, and by improvements within modes, at about 20,000 m , or about 20%of the total 1982 gasoline and diesel road consumption (Table 2.18).Realistically perhaps only one-third of these savings can be achieved,which represents a foreign exchange savings of almost one million U.S.dollars per year.
10/ These differentials are not justified in terms of the quality: asin other import markets in the region, premium gasoline averagessome 90 octane against approximately 85 for regular.
- 27 -
Table 2.18: MAXIMUM THEORETICAL ENERGY SAVINGS IN THE
TRANSPORT SECTOR
% of Transport FueisType of Measure Volume Diesel Gasoline
(m3)
Shift of traffic to theLome-Blitta railroad line 6,100
Coliective transport 5,000 8
Engine Efficiency 6,500 10
Yore intensive use ofexisting fleet 2,000 6
Source: Mission estimate.
Shift from Road to Railroad
2.50 The share of the Chemin de Fer Togolais (CTF) in total trans-port supply has fallen to less than 12% of the national and internationalfreight demand (1.76 million tons in 1982) and to 13% of passengertraffic (19.1 million). The railroad action plan, currently underreview, considers that the Lome-Blitta railroad line (276 km) couldbecome an important carrier for heavy bulk transport such as cement,hydrocarbons and containers directed towards northern Togo and theSahel. 11/ The estimate of maximum theoretical savings is based on theassumption that the energy intensity of railways is about one-fourth thatof trucks 12/, and that 100% of the 1982 northbound traffic (580,000tonnes) would be shifted to the railroad. Given this important savingspotential, the mission fully supports the establishment of a marketpromotion office within CFT, as proposed in the Action Plan. It furthersuggests that a detailed tariff analysis be made, in order to establisheconomically viable but competitive railroad rates for the Lome-Blittaline.
11/ The use of containers is rapidly growing at the Lome port, from7,000 units in 1976 to 37,000 units in 1982.
12/ For 1980, the energy intensity of the Lome-Tabligbo line was 9.9grams of oil equivalent per ton-km (goe/t-km), well in line withinternational standards, although the clinker plant had barelystarted operations. However, the other three lines had an energyintensity of 44 goe/t-km, due to low load factors and probably tomismanagement. It is to be expected that with increased traffic andtighter controls on the use of diesel oil, the Lome-BLitta linecould achieve an energy efficiency similar to that of the Lom6-Tabligbo line.

- 28 -
Improved Efficiency within the Road Transport Mode
2.51 Collective Passenger Traffic. The rate of motorization inTogo 13/ is still only 4.5 vehicles per 1,000 persons in 1982, althoughthe number of new vehicles registered each year increased at a rate ofnine percent per annum between 1975 and 1981. About 80% of all passengervehicles are registered in Lome. The city, with 370,000 inhabitants,already confronts traffic congestion in the main feeder roads towards thecenter. Collective transport services currently are restricted to taxisand mini buses. Larger bus service is practically non-existent, sinceservice with units of more than eight seats is reserved for municipalinstitutions which do not have the financial resources to provide them.It should be noted that in early 1985 the Government imported about 100Japanese mini-buses, which are to be transferred to the private sectorfor service in Lome. It is advisable to also consider introducing busesin inter-city traffic, replacing the traditional taxi-brousse, on routesof high enough passenger demand, such as Lom6 Aneho, where bus servicecould replace inefficient railroad service.
2.52 Expansion of the coLlective transport systems should bepromoted to reduce energy consumption and investment requirements forenlarging the road infrastructure in Lome. However, the policy must takeinto account: (a) the Government's financial constraints; (b) the entre-preneurship of the Togolese people; (c) the characteristics of the pre-sent service, i.e., service from door-to-door and short waiting times;and (d) the relatively low load factor to be expected in the outskirts.
2.53 The mission therefore fully supports the recommendations of theMinistry of Commerce and Transport 14/ to expand the use of minibuses of8-15 seats and to restrict the entrance of new taxis. This would permitthe employment of minibuses on high density routes and taxis on lowerdensity routes. The mission recommends that such a policy be implementedwith a minimum of direct government participation. To that end, theGovernment shouLd: (a) abrogate the municipality's monopoly on busservice; (b) help to organize taxi owners into small enterprises thatcould be eligible for bank loans; 15/ and (c) furnish information onminibus model characteristics, to guide purchasers towards theacquisition of energy efficient and homogeneous units, thereby promotingcheaper maintenance costs.
13/ 12,000 vehicles for a total population of 2.7 million. Does notinclude 2-wheel vehicles.
14/ Etude pilote sur la promotion des transports collectifs urbains aLome - Sept. 1981.
15/ At present, it appears that there are 3 or 4 groups that own 10 to50 taxis, about 20 groups that own 5-10 units, and a multitude ofpersons that own only one taxi operated by a paid driver.
- 29 -
2.54 Assuming that one minibus replaces three taxis, the maximumtheoretical energy savings from replacing the 1,700 taxis currentlyoperating in Lome would be about 5,000 m3 of gasoline. 16/
2.55 Engine Efficiency. Energy savings can be achieved by improvingdriving conditions and operating methods of the existing fleet and byintroducing more efficient vehicles. Thus, the Government should enforceexisting traffic management measures (regulating stopping and parking,enforcing speed limits, etc.) and extend these to other areas where con-gestion must be controlled. Also it is recommended that the city's mainarteries be rehabilitated and paved.
2.56 Incentives and guidance should be provided to ensure theimportation of the most efficient automobiles. It is estimated that atleast 10% of all imported vehicles consist of four to five year-oldsecondhand units. World manufacturers have been extremely successful inimproving the energy efficiency of new models. The most recent carmodels use some 5.5 liters/100 kms -- about half the average consumptionestimated for light vehicles in Togo. Also, new truck models are 10% to20% more energy efficient than past models. This has been achieved inpart by replacing traditional oil filter type engines with turbo-chargedengines and by using lighter materials and improved designs. It isexpected that the automobile industry will be able to improve energyefficiency by an additional 10-15% by 1985. It also has become apparentduring the last four years that vehicles with higher engine ratings havebeen imported into Togo. Ninety percent of private cars and 85% of taxislicenced in 1982 had engine ratings of more than 7 Hp, which contrastswith only 52.5% and 27%, respectively, in 1978. Given the differentialin energy consumption (3 lts/100 km between a 5 and a 7 HP engine), it issuggested that information be provided to vehicle purchasers on adequateengine ratings for the intended use of the vehicle.
2.57 Finally, it must be stressed that diesel powered vehicles aremore energy-efficient than gasoline powered vehicles. The UK Transportand Road Research Laboratory carried out extensive research and foundthat while the general performance of both categories of vehicles wasmuch the same in urban areas as on highways, gasoline-powered cars con-sumed an average of 30% more fuel than diesel cars. It therefore issuggested that diesel engined minibuses be selected both in the new urbancollective transport system, as well as in the proposed intraregional andinterregional bus services (Lome-Aneho; Lome-Kpalime).
More Efficient Use of Existing Freight Carrying Capacity
2.58 The demand for freight transport in Togo and the Sahel coun-tries has been severely affected by the slowdown in economic activity,
16/ Assuming an energy intensity of 0,018 lts/passenger-km for minibusesand 0,0475 lts/p-km for taxis (Annex 29) and a total demand of170,000 p-km in 1982.
- 30 -
leading to a significant surplus in carrying capacity. 17/ Thisaggravates the problem of the transport industry which faces a struc-turally imbalanced flow and fragmentation of the market. The inter-national traffic flow indicates that trucks are being used with anaverage load factor of 55%. 18/ Togo has been quite successful inbuilding up the transit volume towards the Sahel (20,000 tons in 1972/75,to 170,000 tons in 1982), but there is little opportunity to increasebackhaul freight on the north-south route. Only in the longer term, whenthe export potential of the Sahelian countries increases, will thisstructural imbalance improve. This is important because a 10% increasein the load factor would reduce diesel oil consumption by 2,000 m3. Acorrelated issue relates to the common practice of overloading trucks byas much as 50% in departing from Lome. It has been estimated that thisaccelerates the deterioration of Togo's highways, at a cost of aboutFCFA 250 million per year. 19/
2.59 In the national freight sector, the load factor could beimproved by reducing market segmentation. The public sector owns about30% of the truck fleet 20/ and employs it for sector specific andseasonal uses, such as for the transport of agricuLtural products. Thetransfer of part of this demand to the private sector would increaseaverage capacity utilization and therefore achieve energy savings. It isrecommended that future public acquisition of trucks be carefullyevaluated and authorized after a sound economic analysis ofalternatives. It is also suggested that the freight tariff structure berevised to fully reflect incremental costs and that the resulting tariffschedule be used as a guiding document for the transport industry,allowing the market to set the specific transport price.
2.60 Transport Energy Consumption Forecast. The mission estimatesthat internal demand for transport fuels will increase from about90,000 m3 in 1982 to 130,000 m3 in 1988 and to 220,000 m3 in 1998. Theseprojections are based on the assumptions previously stated regarding
17/ According to partial data, the demand for transport to the Saheldecreased by 25% in 1983.
18/ According to the 1982 traffic flow survey, outgoing flow was 330million ton-km, incoming flow 35 million ton-km. The flow towardsTogo originates mainly in Benin and Nigeria.
19/ DGT - Diagnostic sur le transport routier de merchandises, 1983.
20/ For example, OPAT has a monopoly on exporting agricultural products(except cotton). The Soci6te Togolaise de Commercialisation desProduits (STCP) functions as an intermediary and established its ownfleet to transport these products from the regions to Lome. SOTOCOhas 70 trucks and 52 road tractors to transport the cotton produc-tion from the fields to the degraining plants, and fertilizers tothe field.

- 31
economic growth, and on the hypothesis that the energy/CDP elasticitywill gradually decline as a result of increased energy efficiency andprogressive saturation of the market.
Table 2.19: PROJECTION OF ENERGY CONSUMPTION IN TRANSPORT
('000 mJ and £)
Average a/ AverageConcept 1982 Annual Growth 1988 Annual Growth 1998
Internal Consumption 93.4 7.0 130.0 5.5 222.0Gasoline 61.9 6.4 84.6 5.5 144.0Road Diesel 29.7 8.0 43.6 5.2 72.6Railroad Diesel 1.8 - 1.8 11.6 5.4
International Bunkers 20.9 5.0 26.7 5.0 44.0
Total Demand 114.3 156.7 266.0
GDP Growth b/ 3.0 4.2Internal Energy/GDP elasticity 2.3 1.3
a/ Average calculated over five years, assuming that consumption in 1983 has remained atthe level of 1982.
b/ GDP Growth: average excludes the mining sector.
Source: Mission estimates.
Recommendations
(a) Disseminate information on energy saving opportunities in thetransport sector through the Ministry of Commerce and Transportand through the technical vehicle inspection centers.
(b) Revise maximum transport tariffs for road transport, to reflectincremental costs, including vehicle replacement.
(c) Promote the introduction of minibuses in the high densityroutes of Lome by abrogat4ng the municipality's monopoly on busservices, and by assisting private entrepreneurs in obtainingbank loans for the acquisition of minibuses.
(d) Provide guidance to the private sector in selecting energyefficient vehicles, and in correct maintenance and drivingpractices. To this end, training should be provided to thetechnical inspection centers in Lom6 and in the provincialcapitals.
(e) Reduce publicly held transport capacity in areas where servicescan be provided more efficiently by the private sector.

- 32 -
III. BIOMASS DEVELOPMENT OPTIONS
General Situation
3.1 Two serious problems are building up in Togo: (a) soil degra-dation and potential desertification in the northern part of the country,especially in the region of Dapaong and along the Burkina border, wherethe landscape is assuming sahelian characteristics; and (b) the prospectof firewood and charcoal shortages in Lome and in other popuLationcenters.
3.2 Resources have declined to a level where Togo has lost most ofits lumber industry and deforestation is proceeding rapidly, with poten-tially grave environmental consequences. The principal wood-producingareas of Togo are in the central region, roughly between latitudes 6°30'Nand 9°25'N. The forests in this area occur as remnants, surrounded bycultivated areas, or in agricultural transition zones. The coastal plainof Togo is densely populated and largely agricultural, while the vegeta-tion in northern Togo, starting at approximately Lama Kara, is open wood-land mixed with agricultural areas.
3.3 Neither of these problems has yet reached crisis proportions.The fuelwood and charcoal demands of Lom6 and of other centers are stillbeing met and desertification is not at the advanced, almost irreversiblestages which can be observed in many countries in the Sahel. If one con-siders the physical characteristics of climate and soil, then the pros-pects of rehabilitating degraded land and of establishing successfulforestry plantations are good. Decisive action, however, must be takenbefore it is too late.
Inventory and Wood Growth Rates
3.4 There is no recent national forest inventory of Togo. Allanalyses of the country's forest resources ultimately fall back on 1971FAO forest inventory results, which in turn are largely based on aerialphotography carried out in the 1960s. Attempts have been made to updatethe 1971 data through estimates of the rate of deforestation, of theextent of inaccessible areas, and of the reserves not available fortimber production.
3.5 A significant source of information on recent: trends has beenthe Global Environmental Monitoring System (GEMS) of FAO/UNDP, in whichLandsat imagery is used to estimate the rate of deforestation. TheFAO/UNDP GEMS has estimated the current annual rate of deforestation at6,000 ha and the annual degradation of woodland and treed savannah tocultivated savannah and shrub savannah at 10,000 ha. These statisticsprobably understate the seriousness of the situation in agriculturalzones because the data combine deforestation in agricultural zones withincreases in forest cover in game reserves and parks, which occur aslarge blocks and are often not available for wood harvest.

- 33 -
3.6 Forest inventory statistics for Togo therefore should beregarded as rough approximations. National totals are probably reason-ably accurate, but estimates by region or forest type are doubtful.Also, recent information, such as the data from GEMS, deals largely witharea estimates and not with timber volumes and average tree size.Effects of highgrading, of the removal of the large or more desirablespecies, are not considered.
3.7 The Togo forest inventory estimates are also very sensitive tothe definition of what constitutes "forest land" or "woodland", asopposed to "agricultural land" or other non-forest categories. Much ofthe country is covered by transition zones between forestry and agricul-ture or by an irregular pattern of trees alternating with cultivatedareas. It is a difficult and basically arbitrary decision how such landsshould be classified, but the exact procedures followed can have a greatinfluence on the final statistics.
3.8 Some tree cover is almost invariably present in Togo, even inareas classified as agricultural land, where widely scattered trees,which are often fruit trees, play an important role in soil conservationand in reducing the effects of drying winds. Trees on cultivated landprobably make a significant contribution to Togo's total wood supply; thezolumes per hectare are very low, but the areas are large. Volume esti-mates are not available. An estimate of the total wood volume annuallyavailable for energy production is given in Table 3.1 and a projection ofthis wood supply by forest inventory zone is presented in Table 3.2.
Table 3.1: CALCULATION OF ANNUAL WOOD GROWTH
Forest type Area Growth rate Total annual increment
(000 ha) (m /ha/yr) (000 m3/yr)
Dense, semi-deciduousforest 293.1 8 2,345
Dense forest atbase of hills 86.3 8 690
Degraded forest 115.9 2.5 290Wooded savannah i,292.2 2.5 3,230Shrub savannah 513.8 0.5 257Other land 184.0 0.5 92"Productive forest"in above categories (760.0)
Total, forest andwoodlands 2,485.0 6,904
Total, after 30%deduction for recentdeforestation,inaccessible land,and reserves 1,740.0 4,833
Less Non Energy Uses 100
Available for Energy Use 4,733
Source: Mission estimates.
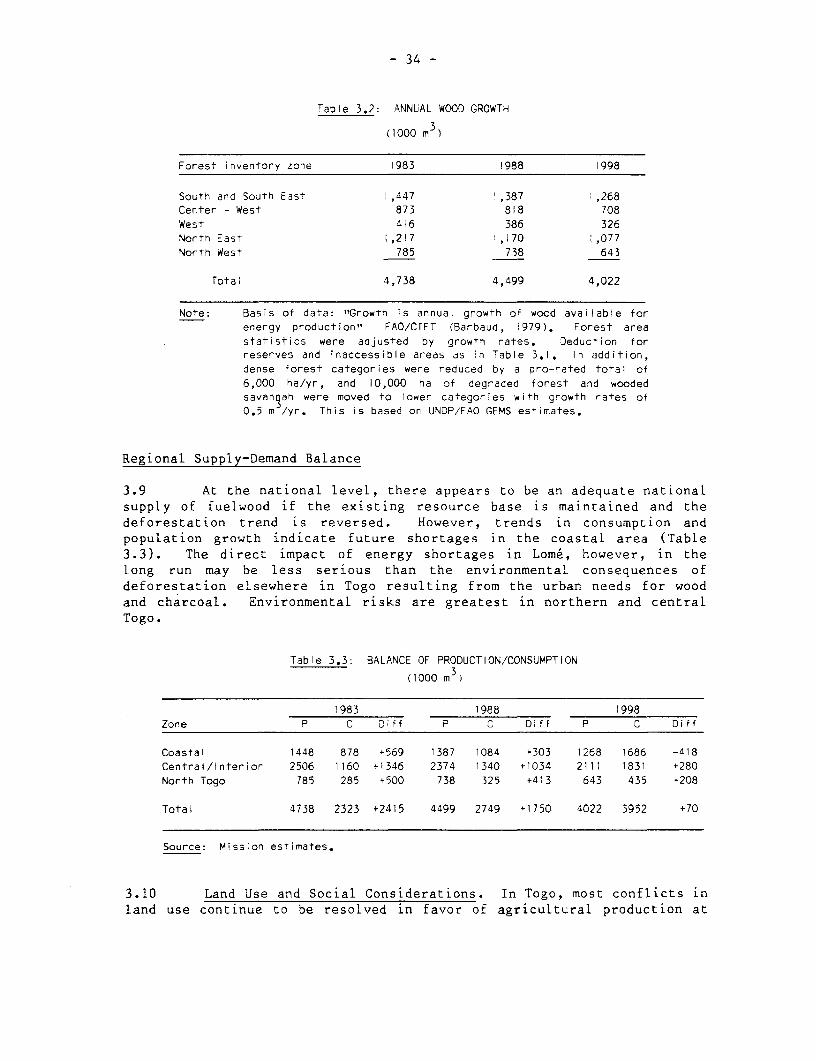
- 34 -
Table 3.2: ANNUAL WOOD GROWTH
(1000 m3)
Forest inventory zone i983 1988 1998
South and South E3st 1,447 1,387 1,268Center - West 873 818 708
West 416 386 326North East 1,217 1,170 1,077
North West 785 738 643
Total 4,738 4,499 4,022
Note: Basis of data: tGrowth is annual growth of wood available for
energy production" FAO/CTFT (Barbaud, 1979). Forest areastatistics were adjusted by growth rates. Deduction forreserves and inaccessible areas as in Table 3.1. In addition,
dense forest categories were reduced by a pro-rated total of
6,000 ha/yr, and 10,000 ha of degraded forest and wooded
savansah were moved to lower categories with growth rates of0.5 m /yr. This is based on UNDP/FAO GEMS estimates.
Regional Supply-Demand Balance
3.9 At the national level, there appears to be an adequate nationalsupply of fuelwood if the existing resource base is maintained and thedeforestation trend is reversed. However, trends in consumption andpopulation growth indicate future shortages in the coastal area (Table3.3). The direct impact of energy shortages in Lome, however, in thelong run may be less serious than the environmental consequences ofdeforestation elsewhere in Togo resulting from the urban needs for woodand charcoal. Environmental risks are greatest in northern and centralTogo.
Table 3.3: BALANCE OF PRODUCTION/CONSUMPTION
(1000 m 3)
1983 1988 1998
Zone P C Diff p C Diff P C Diff
Coastal 1448 878 +569 1387 1084 +303 1268 1686 -418Central/Interior 2506 1160 -1346 2374 1340 +1034 2111 1831 +280
North Togo 785 285 +500 738 325 +413 643 435 +208
Total 4738 2323 +2415 4499 2749 +1750 4022 3952 +70
Source: Mission estimates.
3.10 Land Use and Social Considerations. In Togo, most conflicts inland use continue to be resolved in favor of agricultural production at

- 35 -
the expense of forestry, and there is no effective policy on how land forwood production is to be set aside within the agricultural zones, evenwithin formally planned large agricultural projects. This deficiency con-trasts sharply with the decisive action that Togo has taken to set asideand to protect hunting and game reserves.
3.11 Land use in Togo is based on a strong sense of personal orfamily property and not on a tradition of community property or col-lective management of a resource. This becomes very important ifreforestation is carried out in conjunction with agriculture. The largeragricultural development or colonization projects recognize the patternof private ownership in allocating land for cultivation. For example, atFED Agbassa each family is given 5 ha for cultivation. Settlers showlittle interest in plantations that are not part of their privateproperty and do not appreciate trees, other than fruit trees, that areplanted on their land; agricultural crops appear more profitable.
3.12 This is one reason why progress with reforestation has beenlimited in projects such as FED Agbassa, FED Savanes, and Togo-Nord.Other underlying problems are a lack of suitable land for reforestationand the absence of a firm plan designating forest land within agricul-tural zones. State forests and reserves have been designated, but thereis a need to define smaller forest sites, well distributed within agri-cultural areas. If such lands were designated, then it would be feasibleto establish patterns of land holding which recognize both the desire forprivate land ownership and the biological requirements to establishforests in larger blocks, and not as small isolated groups of trees.
Reforestation Projects
3.13 The overall effect of past reforestation programs has beennegligible, especially when contrasted with the rate of deforestation.The Government forestry organizations lack an effective presence in theheavily agricultural zones. The progress of past reforestation hasfallen far short of objectives. For example, the 1976-1980 Five-YearPlan for the RuraL Development Sector shows that only 1,500 ha have beenreforested, compared to a forecast of 8,500 ha. The estimates of areasplanted include plantations for the production of wood for uses otherthan fuelwood and charcoal, but they probably do not make allowances fortrees that were planted but subsequently died.
3.14 The most visible plantations in Togo are the teak plantations,found in all regions and most frequently in smalL pLantations or asstrips along the main highways. They play a minor role in the energysituation. The total area planted, including old plantations, is esti-mated as 5,000 to 6,000 ha, but many plantations are mismanaged and mostof the older plantations with larger trees have been harvested. Teak isa relatively slow-growing species, but grows well in Togo. It is largelyplanted to produce sawlogs and poles; charcoal produced from teak is saidto be inferior.

- 36 -
3.15 The most important reforestation project is P'roject AFRI in theState Forest of Eto, about 30 km north of Lom6. The project is anindustrial plantation of fast growing species (mostly Eucalyptus tereti-cornis and Eucalyptus terreliana). The first phase of the project aimsto plant 1,600 ha. by 1985; the second phase envisages plantations tocover 4,000 ha by 1989. Annual plantation rates are to average 500ha/year. At the end of the 1983 planting season, 350 ha had beenplanted. The project assumes an eight-year rotation and an annual yieldof 22 m3/ha (which the mission considers to be too high). If this rateshould be achieved, then the project will make an imMortant contributionto the wood supply for Lome (annual yield of 88,000 m ). One should makeallowance for some setbacks and assume that the 4,000 ha will ultimatelyyield 15 m3/ha or 60,000 m3 per year.
3.16 Other projects involving reforestation have made only smallcontributions to the production of fuelwood. Project FED Savanes, theagricultural development near Dapaong, has a target of 150 ha of pLanta-tions, of which only 30 have been planted; planting trees other thanfruit trees has not been a success. At Mango, in the large agriculturaldevelopments of the Namiele project, plantations of trees have beeninsignificant (less than 20 ha) and there appears to be little prospectfor major changes. The Togo-Nord Project, located at Lama-Kara, has con-centrated on agriculture and infrastructure, with little attention toreforestation. ODEF has also recently established abolut 300 ha of fast-growing species near Lama Kara that are in part intended for charcoalproduction. In the same general area, Project FED Agbassa, whichinvolves the cultivation of previously undeveloped land, has an ultimategoal of one hectare of tree plantations for each of the approximately1,000 settler families. However, this is a theoretical figure: only 150ha had been planted by the end of 1982 and the net effect of the projectis probably deforestation.
Reduction of Energy Losses in Charcoal Production
3.17 In view of the strong and probably irreversible trend towardscharcoal utilization, it is suggested that the first priority should beto ensure efficiency in charcoal production. This requires efficient andlow cost methods that are appropriate for wide distribution in Togo.
3.18 At present, charcoal is produced almost entirely by the earth-mound method, which is inefficient both in terms of Labor involved andenergy lost. Very few of the relatively modern portable steel kilns areused by ODEF in its operations at Blitta and Tsevie. The thermalefficiency of these kilns is estimated at 26-33%, which is lower than theconversion rates of 35-45% associated with more efficient kilns that haverigid control of temperature and air flow.
3.19 A cost estimate based on present prices for charcoal and fuel-wood indicat2s that by introducing charcoal kilns with a thermal effi-ciency of about 40%, Lome's charcoal requirements could be supplied fromdistances exceeding 200 kms.

- 37 -
Tabie 3.4: PRODUCTiON COSTS AND PROFITS
(in FCFA)
Fuelwood required Toproduce one ton of
charcoal or firewood Distance Charcoal Firewood
Cost of product atroadside in forest i,750/t 1,626/t
(470/sac) (740/stere)
Delivered cost,after road transport 50 km 12,750/t 2,626/t
100 km 13,750/t 3,626/t
200 km 15,750/t 5,626/t
Assumed selling price 43,750/t 4,945/t
(1750/sac) (2250/stere)
Profit (loss) per m3
of fuelwood 50 km 4,429 1,656i00 km 4,286 942
200 km 4,000 (-486)
Source: Costs are estimates which consider USAID (1981) data and 1974
cost estimates by L. Picard, reported in FAO (1975). The latter
were approximately doubled. A transportation cost of FCFA20/
t/km is assumed. The assumed selling price is the average 1983
free market price.
Recommendations for a Forestry Strategy
3.20 The mission recommends a two-pronged approach to ensure a Long-
term supply for urban fuelwood requirements: (a) establishment of
intensively managed plantations of fast-growing trees, in limited blocks,
at economic distances from Lom6 and Lama Kara; and (b) a major effort in
rural reforestation (village/family forestry and agro forestry).
3.21 The fuelwood requirements of Lome increase at a rate of about
25,000-30,000 m3 per year, and those of Lama Kara at 5,000-6,000 m3
p.a. The mission considers that it will be necessary to expand the areas
of intensive wood pLantation, to avoid increased pressure on defores-
tation near these cities. However, intensive energy plantations are
costly to establish, technically exacting to manage, and difficult to
keep financially viable. For example, the FAO/IC proposed fuelwood
plantations show only a 12% economic rate of return and a 3% financial
rate of return, and this under management and risk assumptions that are
very optimistic. To reduce the risk, the mission recommends the location
of new plantation projects near existing ones. Therefore, the mission
recommends the establishment of an additional 4,000 ha energy plantation
to be started in 1989 to supply Lome and one plantation of 2,000 ha near
Lama Kara. Under the assumption that an average annual growth rate of
15 m3 /ha can be attained (60,000 m3 /year) in the south and a 5 m3 /ha in
- 38 -
Lama Kara (10,000 m3/year), these plantations would onLy meet two yearsincremental demand of these cities. The mission suggests that considera-tion be given to extending the area of the present AFRI project, to addother and, perhaps, marginal areas in the state forests northwest ofTsevie; and that the northern plantation be considered as a possiblebuffer zone for the hunting and game reserves.
3.22 The present annual charcoal and fuelwood consumption in Lome(23,000 t and 160 000 steres, respectively) requires an annual woodvolume of 260,000 m . A realistic estimate of the AFRI project output is60,000 m3 per year. FAO/IC, in a preparation rnission for a possible ADBfinanced forestry project, proposed a 1,850 ha plantation in the Maritimeregion. Should this project be implemented, a further supply of 28,000m3 a year would become available, making a total of 88,000 m3 or one-third of demand. This still leaves 66% of the current market to besupplied by the private sector, which depends on it to earn a revenueduring the dry season. Therefore, the additional plantations proposed bythe mission should not have socially disruptive effects.
3.23 Village/family forestry and agroforestry should be emphasizedas the most economic long term means to ensure Togo's fuelwood supply.MultipLe use benefits are achieved by dispersed small plantings: soilimprovement, environmental protection, industrial raw material. Inaddition, fuelwood trade is one of the few viable sources of ruraLprivate sector non-farm earnings. However, rural reforestation requiresthe gradual buildup of an effective extension service, which at this timeis extremely weak in Togo. The FAO/IC proposal already contains supportfor the services responsible for rural forestry and a nursery program fortree distribution to farmers, which would add the equivalent of 4,500 hain the Kara, Savannes and Maritime regions.
3.24 The proposed plantations should rely on fast-growing species,such as eucalyptus and others that already have been successfully tested.However. no matter how promising the performance of a single speciesmight be, several species must be planted to minimize the risks of insectand disease damage and other undesirable environmental factors. Therural reforestation projects should focus on multipurpose local tree/shrub species, producing minor forest products (such as gums, resines,fruits and nuts, forage, honeys, waxes, etc.) that are appreciated by thepopulation, in order to gain more popular support for these projects.
3.25 The costs of establishing these projects, including technicalassistance for the first five years, are estimated in Table 3.5.Specific institutional strengthening measures and training needs arediscussed in Chapter 6.

- 39 -
Table 3.5: LONG-TERM FUELWOOD STRATEGY
2000 ha area 4000 ha area
(US$ million)
Nursery, soil preparation
planting, maintenance 2.1 4.2Equipment, vehicles 2.0 4.0Equipment, vehicieoperation cost .2 .4
Other operating costs .3 .5Roads, infrastructure .8 1.5Technical assistance .8 1.2
Total 6.2 11.8
Source: Mission estimates.
3.26 The mission recommends that semi-portable cement-block or
masonry kilns be tested. Such kilns have been the subject of research in
the United States and Brazil and they offer all the temperature and air-
flow control options required for conversion efficiency. In addition
their size can be readily modified to adapt to local timber sizes and
production volumes. They are usually built to capacities that are two or
three times higher than portable steel kilns. Other advantages are the
use of local materials (cement, clay), low initial cost, and labor-
intensive operations in construction, possible disassembly and moving of
kiln. The project should be located at an established charcoal opera-
tion, such as Blitta, where comparisons with existing systems can be
made. In addition, a study should be completed to determine the costs of
production, transportation and distribution, as well as the energy losses
at all stages in the production and utilization of charcoal and firewood.
This study should be based on field observations in Togo. The cost of
such a research project is estimated as follows:
US$ million
Technical assistance 0.3
Materials and operating cost 0.2
Study of energy costs, Losses 0.2
Total 0.7
Agricultural Residues
3.27 About 620,000 ha of land is under cultivation in Togo, 110,000
ha of which is empLoyed in cash crop production and 510,000 ha in sub-
sistence farming. The gross theoretical energy potential of residues
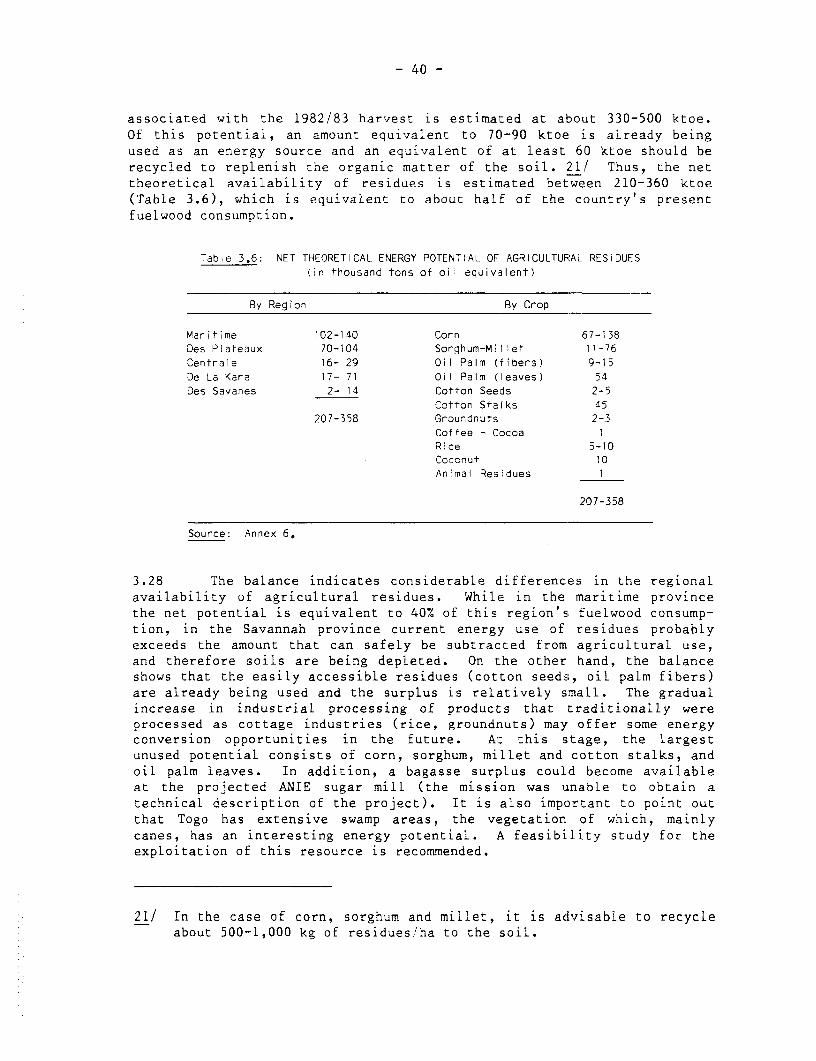
- 40 -
associated with the 1982/83 harvest is estimated at about 330-500 ktoe.Of this potential, an amount equivalent to 70-90 ktoe is already beingused as an energy source and an equivalent of at least 60 ktoe should berecycled to replenish the organic matter of the soil. 21/ Thus, the nettheoretical availability of residues is estimated between 210-360 ktoe(Table 3.6), which is equivalent to abouc half of the country's presentfuelwood consumption.
Table 3.6: NET THEORETICAL ENERGY POTENTIAL OF AGRICULTURAL RESiDUES(in thousand tons of oil equivalent)
By Region By Crop
Maritime 102-140 Corn 67-138Des Plateaux 70-104 Sorghum-Millet 11-76Centrale 16- 29 Oil Palm (fibers) 9-15De La Kara 17- 71 Oil Palm (leaves) 54Des Savanes 2- 14 Cotton Seeds 2-5
Cotton Stalks 45207-358 Groundnuts 2-3
Coffee - Cocoa IRice 5-10Coconut 10Animal Residues 1
207-358
Source: Annex 6.
3.28 The balance indicates considerable differences in the regionalavailability of agricultural residues. While in the maritime provincethe net potential is equivalent to 40% of this region's fuelwood consump-tion, in the Savannah province current energy use of residues probablyexceeds the amount that can safely be subtracted from agricultural use,and therefore soils are being depleted. On the other hand, the balanceshows that the easily accessible residues (cotton seeds, oil palm fibers)are already being used and the surplus is relatively small. The gradualincrease in industrial processing of products that traditionally wereprocessed as cottage industries (rice, groundnuts) may offer some energyconversion opportunities in the future. At this stage, the largestunused potential consists of corn, sorghum, millet and cotton stalks, andoil palm leaves. In addition, a bagasse surplus could become availableat the projected ANIE sugar mill (the mission was unable to obtain atechnical description of the project). It is also important to point outthat Togo has extensive swamp areas, the vegetation of which, mainlycanes, has an interesting energy potential. A feasibility study for theexploitation of this resource is recommended.
21/ In the case of corn, sorghum and miLlet, it is advisable to recycleabout 500-1,000 kg of residues/ha to the soil.
- 41 -
Present Use of Residues
3.29 Sorghum and millet stalks are extensively used as householdfuels in the Savanes region (about 29-58 Mtoe, equivalent to 70% ofavailable material) and in the Kara province (11-22 Mtoe, equivalent to30% of availability). These stalks are also used as constructionmaterial.
3.30 The industrial oil palm sector (3,126 tons of oil in 1981-82)uses approximately 1,500 toe of fibers to meet their internal energyrequirements (steam and electricity). At this time, no surplus is avail-able. In addition, the mission estimates that some 1,500 toe of cottonseed hulls are being used in the cotton processing industry and in thebrick kilns of SOTOMA.
3.31 The artisanal sector appears to be an important user ofresidues, but no information is available to estimate their signif-icance. The mission found, for example, that in the Maritime province,corn stalks and coconut hulls were extensively used for fish smoking, andthat simple changes in the design of the smoke circuits would result inconsiderable energy savings. A similar case can be made for theartisanal oil palm processing sector, which not only has a low energyefficiency but also low oil extraction yields. The mission recommendsthat a detailed survey be made of this sector.
Recommendations
3.32 The mission recommends that caution be exercised in designingnew energy applications for agricultural residues. For each projectspecific area, a detailed agricultural balance should be made to deter-mine net available resources for agricultural production, recycling needsestablished on the basis of soil analysis, and alternative non-energyuses of residues evaluated. Given the linkage that has to be maintainedwith the agricultural sector, the mission suggests that consideration begiven to creating a center for research and testing of residue - energyconversion processes within the Direction de la Recherche Agronomique, orthe Direction des Etudes Pedologiques et de l'Ecologie Generale of theMinistere de l'Amenagement Rural. This center should work in closecollaboration with the Solar Energy Laboratory of the University ofBenin.
3.33 The mission recommends feasibility studies to determine thebest economic use of residues available at: (a) the AFRI reforestationproject, where large surfaces are being planted with corn, in areasawaiting tree plantation; (b) the cotton seed oil factory of IOTO, whichhas about 2,500 tons of seed hulls available; (c) SONAPH's palm oil plantin Agou, which has a surplus of about 2,000-4,000 tons of oil palmshells. These studies should evaluate alternative conversion methods,such as briquetting, direct combustion (of corn stalks in CIMAO's cementboilers), and gasification. A preliminary analysis of these alternativesis presented in Annex 6, which indicates that briquetting would be themost favorable alternative at present.

- 42 -
3.34 The mission recommends that a pilot project of manual briquet-ting be initiated in Togo. One press has been introduced by the Belgiannon-governmental organization (SOSPG) at the leprosarium, and the Direc-tion du Centre de Construction et du Logement has indicated its interestin purchasing a unit. Such a unit with a capacity of 1 T/day couldproduce briquettes for rural household at about FCFA 2,000/toe (See Annex6). The mission suggests that the performance of the existing equipmentbe monitored for six months and, on the basis of these results, a testprogram be introduced in the Maritime province.
3.35 In the rural areas of northern Togo, the mission suggests thata test program be carried out to evaluate the response to the Senegalesegroundnut stove, which would permit an energy efficient use of residuesof small size. 22/
3.36 Biogas development should be envisaged in some of the ranchesof Togo, where sufficient animals are concentrated and where an energyneed exists. As indicated in Annex 6, the potential sites are atNamiele, Adele Ranch, Bena farm, and the Badja Breeding Ranch. Themission does not find the production of biogas based on the Lom6 sewagesystem to be viable.
Solar Energy
3.37 The mission recommends that solar water heating be consideredas an economically attractive energy alternative, and proposes that feas-ibility studies be conducted to install such equipment at Sarakawa Hotelin Lom6 and the Hotel in Lama Kara, and in the larger hospitals through-out the country. In view of the fact that the breweries in Lome and Kara(under German management) have a complete system of water recycling,solar water preheating systems are not likely to be cost effective.
22/ In Senegal, artisans make these stoves from a petroleum barrel withtwo pieces of wood, a chimney in the center of the barrel, and alateral air inlet. Hulls are compressed between the barrel's wallsand the chimney.

- 43 -
IV. PETROLEUM SECTOR
Resource Evaluation
4.1 Togo's offshore sedimentary area has some hydrocarbon poten-tial, in a structure that is part of the Keta Basin which extends west-ward into Ghana and eastward into Nigeria. In November L982, theGovernment entered into a production sharing agreement with a privategroup (Getty Oil-ECOMINT) for the exploration of the total offshore area;this contract was later transferred to another international oil com-pany. A seismic survey (1,020 km) was made in February 1983 which com-pletes previous surveys made between 1968 and 1980. One dry well wasdrilled in 1984, and the operator is evaluating whether to reLinquish theacreage or to continue exploration.
Present and Projected Supply
4.2 In 19|2, Toga imported some 276,000 m3 of refined products, ofwhich 127,000 m were white products. Under the assumption discussed inChapter 2, Togo's petroleum consumption is projected to grow at about4.5% p.a., attaining some 360,000 m3 by 1988. The relative shares ofproducts are expected to shift towards lighter products at the expense ofheavy oils, as indicated in Table 4.1.
Table 4.1: Percentage Distribution of Petroleum
Products
1982 1988
LPG 0.4 0.6Gasolines 22.5 27,2Kerosene 12.4 16,6Diesel Oil 18.7 19.3Fuel Oil 46.6 36.3
Total 100.0 100.0
4.3 Petroleum products are currently being imported by five inter-national oil companies. The oil companies share the price-controlledmarket for gasoline, kerosene and gasoil, compete for the uncontrolledindustrial fuel oil market and for international bunkers, and handletransit imports to Burkina. Offshore imports are delivered toinstallations of the Societe Togolaise d'Entreposage (STE), owned by thefive companies, except industrial fuel oil, which is delivered directlyto OTP and to CIMAO (para 4.10). Small quantities of jet fuel and LPGare trucked in from Ghana and Benin, and in the past from Nigeria. Inaddition, some unquantified volumes of kerosene and probably of otherproducts are smuggled from neighboring countries where retail prices areconsiderably lower. Sizeable, legitimate cross-frontier traffic is

- 44 -
building up, however, in the case of Burkina, a landlocked nation forwhich Togo has traditionally served as a bridge to the rest of the world.
4.4 Petroleum products are imported into the STE deposit locatednear the port. This facility contains seven tanks with a handlingcapacity for only four product streams -- premium and regular gasoline,kerosene and gas oil -- and has a combined volume of only 12,050 m3.
This is equivalent to about one month's consumption of white products atthe 1982 consumption level. Due to the limited storage capacity of STE,the companies import products in shipments of 4-5,000 m3, in batches ofonly 1,500 m for each individual product. The small size of individualshipments results in significantly larger freight costs than warranted iflarger batches of products were imported.
4.5 The refinery, owned by Soci6t6 Togolaise des Hydrocarbures(STH) was commissioned in 1979 and interrupted operations in 1981. Itconsists of a 20,000 b/sd crude unit, a 7,158 b/sd distillate hydro-treater, a 3,020 b/sd catalytic reformer and LPG recovery and bottlingfacility. The refinery was designed to process Nigerian Escravos crudeoil (360 API) and to export products to Western Europe. The Governmentof Togo, in late 1983, decided to close the refinery after a privatelyfunded study confirmed the Bank's previous findings that the refinery'seconomic performance could not be upgraded in the foreseeable future.The government has decided to continue maintaining the refinery under aminimum level of mothballing in view of the remote possibility of futureviable operations and the low salvage value for scrap;ping the refininginstallations. 23/
23/ The mission evaLuated whether the refinery could be reopened toprocess Seme crude (Benin) for a regional market composed of Togo,Benin, Niger, Burkina and Mali. The analysis of this operationindiacted that crude supply restrictions, market uncertainty, andthe refinery configuration made this a non-viable project.Crude Supply: Crude oil output from S6me is likely to peak in 1987-88 at about 8-10,000 BD. Economic limits of production will bereached in the early 1990s.Market Considerations: Although total petroleum requirements of thefive countries is estimated at 15,700 BD in 1982 (80% of therrefinery's installed capacity), most countries have long termprocurement arrangement, limiting their flexibility in changingsuppliers. A more restricted market was considered by grouping theoil requirements of Togo and Benin, and the transshipments throughthe ports of Lome and Cotonou. This market has a volume of about10,000 BD in 1982 projected to 15,000 BD by 1988.Refinery Configuration: The crude oil is unsuited to meet thedemand profile of the market envisaged and extensive secondaryprocessing would be required; most probably FCC and residuedeasphalting would be necessary.The capacities of the FCC unit and supporting deasphalting unit areestimated at 3000 bpsd and 1500 bpsd respectively. The estimated
- 45 -
4.6 The refinery has a usable storage capacity of 243,265 m3 , in 16tanks. This capacity was being used in 1983 to store fuel oil importsfor CIMAO (cement plant) and in 1984, to provide storage capacity forlight product imports made by Burkina. A recent feasibiLity study of theconversion of the refinery's storage facilities into a petroleum productsreceiving terminal 24/ indicated that the additional investment of aboutUS$1 million is justified and that it would provide the opportunity tomake productive use of the personnel still employed at the refinery (179persons in 1983). A contract for the management of the facility wassigned in December 1984.
Supply Cost and Prices
4.7 The landed cost of petroleum products is high in Togo, com-
pared to internationaL standards and to that of neighboring countries,because of: (a) lack of incentives for the private importing companiesto minimize the procurement costs; and (b) high freight costs, due to thesmall storage capacity available at STE. Table 4.2 illustrates theeffect of these factors on those products subject to Government pricecontrol, and indicates that the transport differential in 1982 repre-sented an additional cost of US$2.6 million to the Togolese economy. 25/
erected cost of about US$60 million (in 1983 second quarter pricesneedless to state, these are of small capacity;Economic Evaluation: Before capital recovery (repayment of loan,etc.) the refinery could have a net positive cash flow of about US$5million per annum. When crude oil is $25/barrel and products arepriced at current landed prices in Togo, with capital recovery takeninto account, cash flow will be negative (approximately $3 to $5million). In addition, the first three years will require amanagement team which could cost about $2 million annually.
24/ Study on "Feasibility of the Conversion of the STH Refinery StorageFacilities into a Petroleum Products Receiving Terminal" by WilliamC. Matthews Associates Limited, October 1984.
25/ According to the conversion study (referenced in footnote 24) whichexamined the invoices of 80% of the white product imported betweenJanuary 1982 and June 1984 and compared them with theoreticalprocurement costs calculated on the basis of Platt's average spotcargo prices and AFRA freight rates for general purpose tankers, theaverage FOB price differentiaL with respect to Rotterdam quotationswas US$7/tonne and the average freight differential wasUS$27/tonne. Gross procurement costs could have been reduced byUS$7.3 million during this 29-month period.

- 46 -
Table 4.2: TOGO: LANDED PETROLEUM COSTS(US$/Ton)
Premium Gasoline Kerosene Gas Oil
Effective Cost June 1983
F.o.b. Value 306.2 284.9 245.7Freight 55.5 59.1 57.4Insurance 0.4 0.3 0.4
Landed Cost 362.0 344.4 303.4
World Bank Calculator (May 1983)
F.o.b. Value (Caribbean) 302.0 270.4 237.7Freight - Insurance 21.5 21.4 21.3
Landed Cost 323.5 291.8 259.0
Oil Procurement Mechanism and Government Controls
(a) Past Mechanism:
4.8 Each company imports its own market requirements through inte-
grated channels. The information on each company's CIF costs is cen-
tralized at the Professional Association of Petroleum Importers (GPP),
integrated by all companies and submitted to the Ministry of Commerce and
Transport for two purposes: (a) ex-ante for setting retail prices; and
(b) ex-post for allocating the compensatory funds contained in the Caisse
de Stabilisation. The Ministry is poorly equipped to effectively monitor
the price information that is submitted for its approval. 26/
4.9 In spite of the large variations in the cost elements of the
petroleum product price, retail prices in Togo have only been adjusted in
July 1979, July 1980 and October 1981. To compensate the suppliers for
possible deficits between real and the agreed landed costs (which serves
as the basis for setting the retail price), a stabilization charge was
introduced into the price structure in 1979. The landed costs agreed by
the Government with the oil suppliers have not always matched the changes
in international petroleum prices and the depreciation of the CFA franc.
The mission estimates that between May 1979 and May 1983, effective
landed costs increased an average of 126-143%; while the landed cost
increases approved by Government rose between 149-179% (Table 4.3). On
the other hand, the long delay in reaching agreement probably caused
substantial hardship to companies in the period 1979-1981.
26/ During the mission's visit (July 1983), the Ministry of Commerce and
Transport had just finished revising the data provided for 1980.
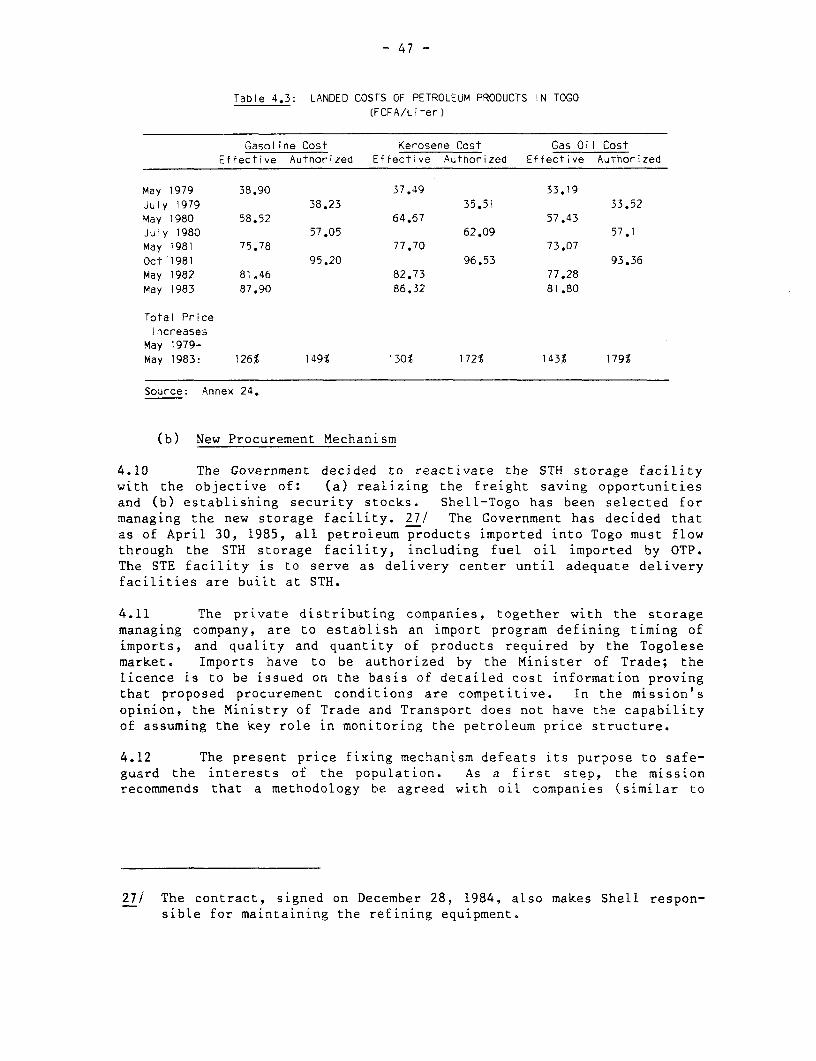
- 47 -
Table 4.3: LANDED COSTS OF PETROLEUM PRODUCTS IN TOGO(FCFA/Li ter)
Gasoline Cost Kerosene Cost Gas Oil CostEffective Authorized Effective Authorized Effective Authorized
May 1979 38.90 37.49 33.19July 1979 38.23 35.51 33.52May 1980 58.52 64.67 57.43July 1980 57.05 62.09 57.1May 1981 75.78 77.70 73.07Oct 1981 95.20 96.53 93.36May 1982 81.46 82.73 77.28May 1983 87.90 86.32 81.80
Total PriceIncreases
May 1979-May 1983: 126% 1491 130 172% 143% 179%
Source: Annex 24.
(b) New Procurement Mechanism
4.10 The Government decided to reactivate the STH storage facilitywith the objective of: (a) realizing the freight saving opportunitiesand (b) establishing security stocks. Shell-Togo has been selected formanaging the new storage facility. 27/ The Government has decided thatas of April 30, 1985, all petroleum products imported into Togo must flowthrough the STH storage facility, including fuel oil imported by OTP.The STE facility is to serve as delivery center until adequate deliveryfacilities are built at STH.
4.11 The private distributing companies, together with the storagemanaging company, are to establish an import program defining timing ofimports, and quality and quantity of products required by the Togolesemarket. Imports have to be authorized by the Minister of Trade; thelicence is to be issued on the basis of detailed cost information provingthat proposed procurement conditions are competitive. In the mission'sopinion, the Ministry of Trade and Transport does not have the capabilityof assuming the key role in monitoring the petroleum price structure.
4.12 The present price fixing mechanism defeats its purpose to safe-guard the interests of the population. As a first step, the missionrecommends that a methodology be agreed with oil companies (similar to
27/ The contract, signed on December 28, 1984, also makes Shell respon-sible for maintaining the refining equipment.

- 48 -
the Arrete Interministeriel No. 79-11 of July 4, 1979 duly revised) 28/for the establishment of the reference price structure. According to theGovernment mandate, the Ministry of Trade and Transport has to establishsuch a price structure for each product shipment. For this purpose, themission urges the Ministry to seek technical assistance for basic train-ing of personnel for the negotiation of the price fixation methodologywith oil companies, and for the set-up of the necessary data base. Inthe longer term, the Government could envisage more substantial changesin the procurement arrangements (see para. 4.20-4.21).
Petroleum Retail Prices
4.13 Petroleum prices are set above economic costs (Table 4.4).Prices for gasoline, kerosene and diesel are fixed by an interministerialCommittee, on the basis of the recommendations of the Ministry ofCommerce and Transport. LPG, fuel oil and bunker fuels are exempt fromprice controls.
4.14 Prices are set uniformly throughout Togo for the four whiteproducts. This is achieved by setting a flat delivery charge ofFCFA 6/lt. 29/ As 80% of sales are made in Lome, this charge issufficient to cover costs, but weakens the incentive to improve thedistribution network in the interior. Supply interruptions are frequent,especially in the rainy season, because no regional storage facilitieshave been built. The mission suggests that consideration be given tolink distribution permits granted in Lome with investments in thedistribution system of the interior.
Table 4.4: PETROLEUM PRODUCT PRICES, 1983(in FCFA/lt)
GasolinesPremium Regular Kerosene Gas Oil
Retail Prices 205 200 135 180Landed Cost - 95.2 91.8 96.5 93.4Economic Cost 120.0 116.4 119.0 115.5Taxes - 68.3 67.4 31.3 32.9Caisse de Stabilisation 16.7 16.2 (15.3) 31.6
a/ Based on reported costs as of October 1981.b/ Excluding Caisse de Stabilisation.
Source: Annex 23.
28/ Average Platt's quotations (Caribbean) plus freight for double portdischarge.
29/ Delivery costs range from FCFA 0.8/lt in Lome to FCFA 19.35/it atDapaong. Renaldo, the largest private trucker of petroleum prod-ucts, charged an average of FCFA 309/vehicle-km, equivalent toFCFA 22 55/m -km. in 1982. Trucks, on the average, have a capacityof 15 ml, but trucks as large as 35 m3 are also usesd.
- 49 -
4.15 As shown in Table 4.4, excluding the stabilization fund, taxesrepresent about one-third of the retail price of gasoline and approxi-mately one-fifth of the final price to consumers of gasoil; net taxes onkerosene are about 10%. There are 11 different taxes, some of which areearmarked while others flow directly into the National Treasury. Themission suggests that the system be simplified by grouping the differentcategories into single concepts and by revising earmarked charges.
4.16 The price structure also makes an allowance of about FCFA 7/ltto cover operating and financial costs as well as profits of the oilcompanies and a margin of FCFA 5-6/lt for the retailer. The companieshave expressed their opinion that these terms do not provide sufficientincentive to expand operations in Togo. 30/ Periodic revisions of thedistribution margins included in the price calculations should be made toensure that an adequate service standard is maintained and that minimuminvestment programs are executed. These revisions should be based on anopen discussion of the companies' financial statements and theirexpansion programs.
Import Cost Saving Opportunities
Use of the Refinery's Storage Facilities
4.17 The feasibility study prepared in 1984 evaluated the economicsof the conversion of the refinery's storage facility under severalscenarios of throughput. The base case assumes the the terminal would beused only for receipt of white oils required for the locaL market, in20,000 tonne parcels. The most optimistic scenario envisages Lome as atransshipment point for the West African region, receiving 80,000 dwtvessels from the Middle East refineries. In the short term, thepossibilities for serving neighboring countries are rather restrictedbecause of recent investments on the storage and port facilities inNigeria and Benin, long term procurements in the case of the Sahelian
30/ Certain importers have encouraged the participation of localinvestors in their Togolese marketing affiliates. Initiated byShell, which now has 50% local ownership, Total has adopted thepolicy with respect to 35% of its local equity, and Texaco withrespect to 30%.

- 50 -
countries, 31/ and surplus storage and refining capacity in Ivory Coastand Ghana.
4.18 The economic evaluation of the project made by the consultantindicated a sound rate of return even under the most conservativethrough-put scenario. Investments are relativeLy small and can be phasedover several years (US$1.05 million initially and additional US$0.6 ifcargos of 80,000 dwt should be handled in the future). Direct operatingcosts are estimated at US$2.3 million per year, including a US$0.5million charge for the lease of the facility. An additional US$0.65million will be required to keep the refinery moth-balled. The benefitsaccrued from the reduction in the CIF price of imported petroleumproducts are estimated at initially US$3.2 million per year in the caseof the base scenario, rising to as much as US$7 million per year if theterminal becomes a regional transshipment facility.
4.19 The operator of the terminal will have to be remunerated on thebasis of a through-put fee. The consultant has calculated a theoreticalfee on the basis of the estimated operating costs and the volume of whiteproducts demanded by the market in 1983 equivalent to FCFA 892 per 100liters. At that fee the operator would have a net profit which could beshared with the government under an agreed contractual mode.
4.20 The consultant also investigated the government's share in theterminal operation. In the existing price structure, major tax items arereferenced to the landed cost of the products. Therefore, a reduction inthe CIF price leads to diminished tax returns. The government will haveto decide whether to transfer to the final consumer, the economies of thenew procurement system or to collect them in the form of new taxes. (Netbenefits to be captured by government are estimated at US$0.4 million peryear). Additional government benefits will derive from the lease pay-ments and from eliminating the heavy burden of the refinery operatingcosts.
4.21 The specific terms of the contract signed with Shell- Togo forthe management of the terminal are not yet known. It is expected thatspecific import mechanisms will be defined shortly. The most importantquestions to be answered refer to: (a) how will the members of GPP agreeto pool their purchases into shipments of at least 20,000 tons; (b) whatincentive does the importer have to obtain favorable conditions for theoil procurement; (c) what incentive does Shell Togo have to enlargen thethrough-put volume at the Togo terminal, given the fact that it is an
31/ The rapid growth of transshipment to Burkina (about 30,000 tons in1983) has been due mainly to the high ex-refinery prices of SIR(Abidjan). This refinery is currently undergoing a rationalizationprogram which, if successful, will make its products competitivewith offshore imports. In that case, the transport cost dif-ferential between the Abidjan-Ouagadougou railroad (FCFA 33-35,000/ton) and the Togo route (estimated at FCFA 32,000/ton-29 FCFA/ton-km) will determine whether it is economic for Burkina touse the storage facility in Lome.
- 51 -
affiliate of the company holding shares in SIR (Ivory Coast) and SAR(Senegal).
New Oil Procurement Arrangements
4.22 Converting the tank farm into a storage facility offers in thelonger term the opportunity of entering into new oil procurement arrange-ments. The mission suggests that consideration be given to openinginternational tenders for meeting Togo's individual oil requirementswhich, if successful, could lead to joint tenders for all countries usingthe storage facility. The purchasing strategy may consist of announcingeach quarter the volumes required, and inviting recognized internationaltraders to submit bids for spot and long term purchase contracts, speci-fying prices and price variation provisions, credit terms, and theability of the supplier to meet delivery dates and product specifi-cations.
4.23 The change towards a tendering system for oil procurement isintended as a mechanism to reduce the landed costs of oil imports bycreating a competitive environment. The private oil companies estab-lished in Togo would be invited to participate in the bidding process andwould continue to distribute products in the local market. The Govern-ment would have to cooperate with the companies in planning oil demandrequirements, and get their technical assistance in establishing offinancial controls and internationally acceptable financing arrange-ments. At present, all these functions are carried out by the privatecompanies established in Togo. It would be necessary to obtain theservices of an experienced oil marketing specialist for managing an oilprocurement arrangement based on international tendering. A feasibilitystudy to demonstrate the advantages of such a procurement mechanism andto evaluate its management costs is strongly recommended before taking adecision.
Oil Substitution Opportunities
4.24 A relative assessment of product specification required byspecific user groups could lead to significant cost savings. Forexample, the mission considers that some of the diesel/gasoil uses couldbe replaced by fuel oil; and in some bulk industrial applications, heavyfuel oil could substitute for the light fuel oil currently beingimported. On the other hand, the mission suggests that an economicanalysis be made of LPG as a transport fuel (replacing gasoline) and anindustrial fuel (replacing gasoil). Togo imports most of its LPG fromGhana, with Nigeria as an alternative source in cases of supply inter-ruptions. Nigeria has a considerable surplus of liquefied petroleumgas. Although the country is actively promoting substitution of petro-leum products by LPG, it is expected that LPG will remain in surplus,given the large production increases anticipated at the refineries andthe extraction plant to be built in association with the gas pipeline.LPG is being bought in Nigeria at prices below economic border prices,which makes it possiuLe to import LPG into Togo at competitive prices.

- 52 -
4.25 Preliminary results of exploration in the Seine field, offshoreof Benin, have indicated the existence of natural gas. Further explora-tory work is necessary to determine the size of the deposit and thechemical composition of the gas. Should the resources be commerciallyexploitable at costs competitive with imported energy options (gas orcoal), the construction of an offshore-onshore pipeline to supply thebulk energy requirements of Benin and Togo should be considered. Ifresources in Seme are not significant enough to warrant exploitation, theconversion of bulk energy consumers to imported coal or imported naturalgas should be evaluated.
4.26 As Nigeria is in the process of developing an internal trans-port infrastructure for natural gas, it may become possible to considerextending a transmission gas pipeline from Lagos to Cotonou and Lom6.The feasibility of such a project will depend on the price of gas and thesize of the market that can be served. The export price for gas in Lagosis likely to be defined in the range between the economic supply cost(estimated at about US$2.00-2.20/MCF) and the opportunity cost expressedin terms of fuel oil (about US$3.50-4.00/MCF). Assuming that natural gasis priced in Lagos at US$2.20/MCF (US$8.63/Gcal) and that the pipelinewould only serve OTP and CIMAO (which will require 100,000 toe in 1988),the landed cost of Nigerian gas in Lome would be about US$13.35/Gcal(US$3.40/MCF), 32/ which compares with a landed cost of imported coal ofabout US$13.4/Gcal (US$90/ton). Evidently the unit transport costdecreases with additional throughput. Because total industrial fuel oildemand in the coastal area of Togo and Benin is only 10% higher than thedemand of the two largest consumers, consideration should be given tousing gas for power generation. Based on the assumptions outlined inChapter 5, the thermal generation requirements of the interconnectedelectric system of Togo and Benin could increase from about 130 GWh in
32/ Landed cost of gas includes the following elements:
US$/MCF
(a) Production and transmission costs including producers'margin and depletion allowance 2.20
(b) Transmission cost Lagos-Cotonou-Lome 1.20-0.36Landed cost: 3.40-2.56
The transmission cost to Benin and Togo was estimated assuming aninvestment cost of US$30 million for a 12" pipeline, over more than200 kms, with two compression stations. Annual costs were calcu-lated assuming 10% opportunity cost of capital, economic life of 25years, and operating costs equal to 5% of investment.
- 53 -
1988 to 960 GWh in 1998. 33/ Adding this load to the gas pipelinethroughput would lower the unit transport cost from US$42.45/1,000 m(US$1.20/MCF) in the case when only the two large industrial consumersare served, to US$32.04/1,000 m3 US$0.91/MCF) if the 1988 thermalelectricity load is included, and to US$12.56/1,000 m3 (US$0.36/MCF) whenthe 1998 load is included. In the event that the WASPI electric inter-connection is built, the pipeline's throughput would be lower thanestimated in the highest case. But the cost differential would be com-pensated by increased security of supply in the integrated energy systemsof the countries of the region. The mission recommends that detailedmarket and cost studies be made to evaluate possible load build-up in thealternate gas pipelines (from Seme or from Lagos) and the costs ofsecondary transmission and distribution once the gas resources at Semehave been fully evaluated and the longer term economic viability of thelarge industrial plants of Togo and Benin has been confirmed.
33/ The electricial load of the interconnected system is estimated at809 GWh in 1988 and 1,638 GWh in 1998. Thermal loads were calcu-lated assuming deliveries from VRA equal to contract levels (528GWh) and generation from the Nangbeto hydropower plant (150 GWh).Gas requirements for power were estimated assuming a factor of 3.559KWh/m of natural gas.

- 54 -
V. ELECTRIC POWER
5.1 The Bank has recently prepared an Electric Power SubsectorMemorandum and consultants have completed studies addressing long termplanning issues 34/ and short term technical assistance requirements ofthe public utilities of Togo and Benin. The master plan was neveradopted. This chapter summarizes the conclusions of the Bank's studiesand highlights areas of uncertainty which merit further analysis.
Role of Electricity
5.2 Electric energy has played a very important role in the modern-ization of Togo's economy. In FY81/82 about three-quarters of electricconsumption was production related (industrv, cottage industry and com-merce), while only 22% of sales went to the household sector. This isthe result of a deliberate policy which assigns priority to the con-nection of industrial and commercial customers. Electric service toresidential customers is limited to urban areas (22-28% of the populationin the larger cities and 4-5% of the population in smaller, newly elec-trified towns). Load growth averaged 18% p.a. over the past twentyyears, to reach 321 GWh (71 MW) in FY81/82. Since 1981, load growth inthe coastal region has slowed down considerably (6.2% between FY80/81 and82/83) 35/ reflecting the economic recession and the large rate increaseof March 1981; on the other hand, the continued strong growth in theinland centers (25% p.a.) is an indication of the still large unsatisfieddemand.
Table 5,i: ELECTRICITY USE BY SECTOR(for FY81/82)
GWh
Large Industries 120 37Medium Industries
and Commerce 107 33Artisans 8 6Residential 71 22Public Lighting 5 2
Total 321 100
Source: CEET and CEB - Annex 10.
34/ "Etude d'Inventaire des Resources Hydroelectriques Potentielles duTogo et du Benin et Plan Directeur de Developpement de la Productionet du Transport," Sir Alexander Gibb & Partners, Tractionel S.A.,1983-84.
35/ In FY83/84, load in the coastal system, excluding CIMAO, was 2%below FY82/83, due to rationing of demand imposed by reducedelectric imDor-s.
- 55 -
5.3 The present electrification policy is reasonable consideringthat 80% of the population lives in rural areas (practicing mainly sub-sistence farming) and that a large portion of the urban population doesnot yet have access to priority services such as potable water andsewage. The future growth of electricity demand is likely to be moremoderate than in the past given the expectations of industrial growth andthe emphasis of the economic program on agricultural development. Thegrowth rate in residential electricity consumption is a function ofpersonal income increases and of the financial resources available to thepublic utility to expand its distribution network. In the agriculturalsector, productive uses of energy consist of water pumping for irrigationand processing of agricultural products which, in most cases, can beprovided more economically by direct use of liquid and solid fuels. Inview of the country's medium term financial constraints, it is appro-priate to seek efficiency in the power sector by streamlining theexisting network to improve the reliability of the electric service andto reduce the present supply cost and by assisting consumers in makinggood use of this form of energy. For the longer term, continued inter-national cooperation is the most promising means to ensure adequate powersupplies at acceptable prices.
Characteristics of Togo's Electric System
5.4 It is important to underline the following characteristicswhich make it expedient to consider the coastal system issues separatelyfrom those of the isolated centers and to study the generation andtransmission functions separately from the distribution function.
(a) There are two public utilities active in the power sector:(i) the national CEET formed in 1963 with the mandate to beresponsible for the generation, transmission and distributionof electric energy in Togo; and (ii) the binational CEB,established under the 1968 treaty between Benin and Togo, witha dual mandate as a public utility for the two countries and asa directorate with the authority to regulate many aspects ofthe electric utility industry. CEB has a monopoly on thegeneration and transmission of energy originating from allinstallations built after the date of the agreement. Excludedfrom this monopoly are small plants (less than 100 kVA),captive plants, and distribution. The treaty is flexible tothe extent that in certain cases CEB can forego the exercise ofits monopoly, as well as accept responsibility for operatinginstallations belonging to the national power entities,including distribution facilities. Since CEET's statutes werenot modified after reaching the international agreement andundergoing a number of corporate changes since 1963, its legalstatus is ill-defined. In the past, CEB has only partiallyfulfilled its mandate, becoming the bulk supplier of energy toTogo and Benin, using imports from Ghana as its only source.The national utilities -- CEET in Togo and SBEE in Benin --continued maintaining thermal back-up capacity in the coastal
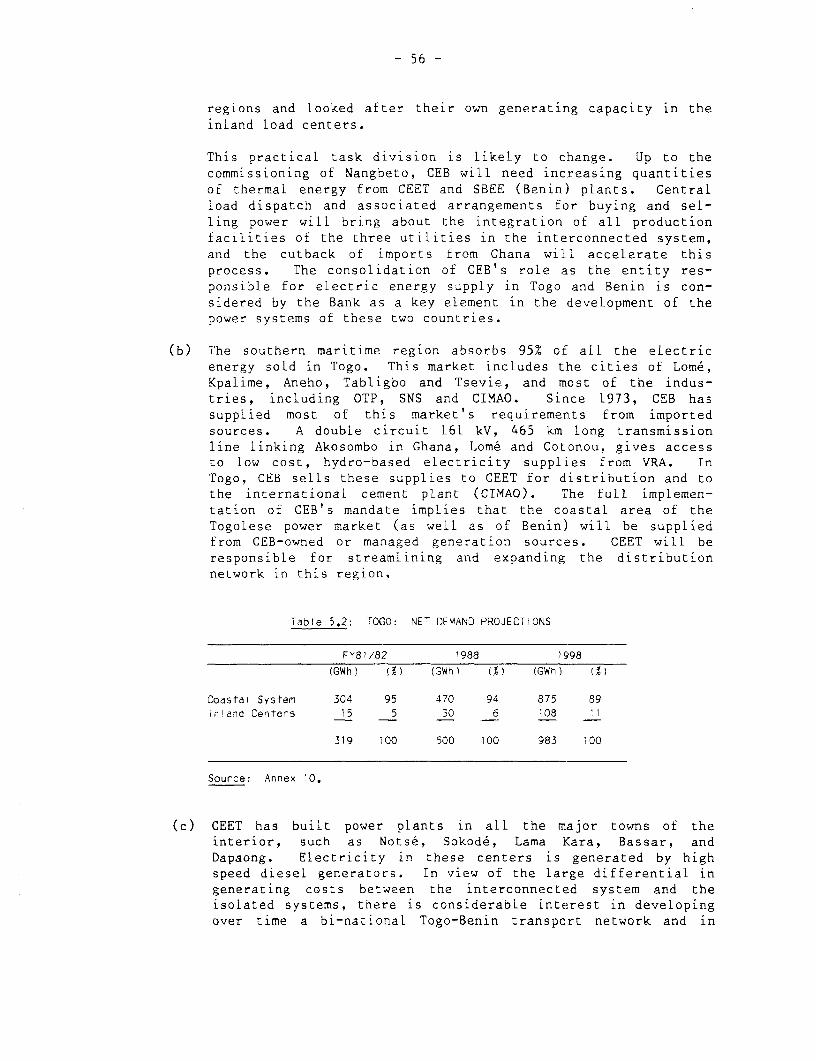
- 56 -
regions and looked after their own generating capacity in theinland load centers.
This practical task division is likely to change. Up to thecommissioning of Nangbeto, CEB will need increasing quantitiesof thermal energy from CEET and SBEE (Benin) plants. Centralload dispatch and associated arrangements for buying and sel-ling power will bring about the integration of all productionfacilities of the three utilities in the interconnected system,and the cutback of imports from Ghana will accelerate thisprocess. The consolidation of CEB's role as the entity res-ponsible for electric energy supply in Togo and Benin is con-sidered by the Bank as a key element in the development of thepower systems of these two countries.
(b) The southern maritime region absorbs 95% of all the electricenergy sold in Togo. This market includes the cities of Lome,Kpalime, Aneho, Tabligbo and Tsevie, and most of the indus-tries, including OTP, SNS and CIMAO. Since 1973, CEB hassupplied most of this market's requirements from importedsources. A double circuit 161 kV, 465 km long transmissionline linking Akosombo in Ghana, Lome and Cotonou, gives accessto low cost, hydro-based electricity supplies from VRA. InTogo, CEB sells these supplies to CEET for distribution and tothe international cement plant (CIMAO). The full implemen-tation of CEB's mandate implies that the coastal area of theTogolese power market (as well as of Benin) will be suppliedfrom CEB-owned or managed generation sources. CEET will beresponsible for streamlining and expanding the distributionnetwork in this region.
Table 5.2: TOGO: NET DEMAND PROJECTIONS
FY8l/82 7988 1998
(GWh) i() (GWhl ) (GWh) (
Coastal System 304 95 470 94 875 89Inland Centers 15 5 30 6 108 11
319 100 500 100 983 100
Source: Annex 10.
(c) CEET has built power plants in all the major towns of theinterior, such as Notse, Sokode, Lama Kara, Bassar, andDapaong. Electricity in these centers is generated by highspeed diesel generators. In view of the large differential ingenerating costs between the interconnected system and theisolated systems, there is considerabLe interest in developingover time a bi-nationaL Togo-Benin transport network and in
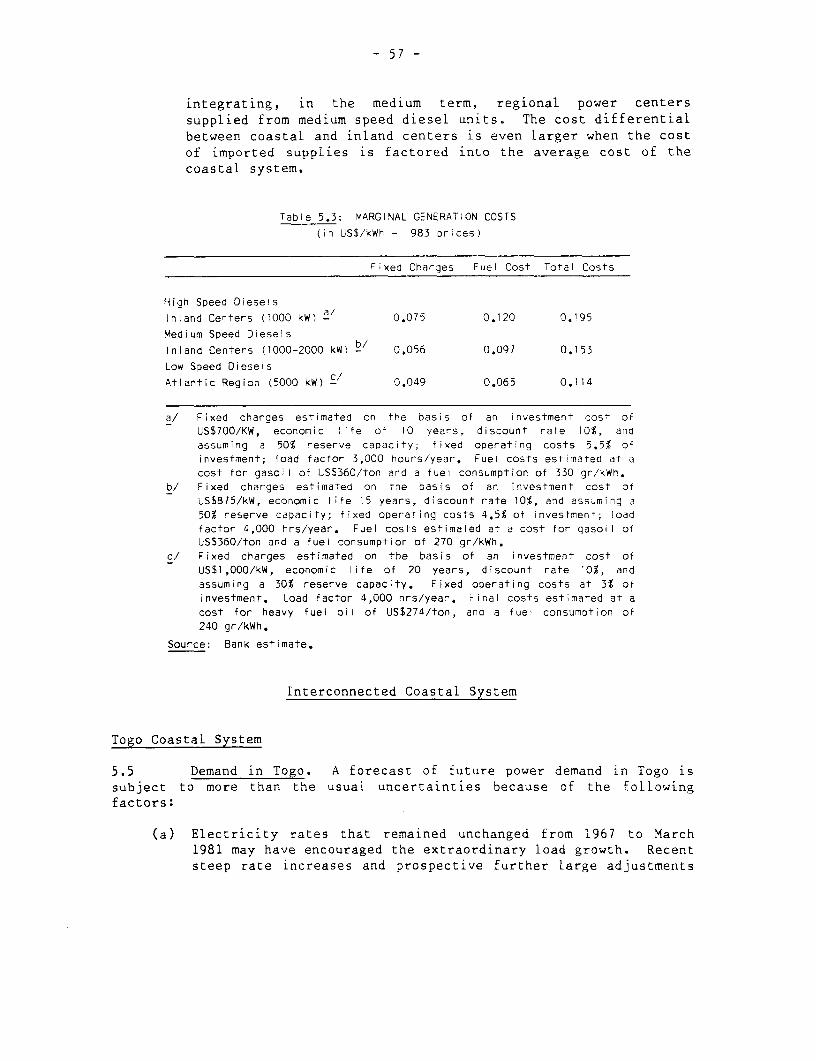
- 57 -
integrating, in the medium term, regional power centers
supplied from medium speed diesel units. The cost differentialbetween coastal and inland centers is even larger when the costof imported supplies is factored into the average cost of thecoastal system.
Table 5.3: MARGINAL GENERATION COSTS
(in US$/kWh - 1983 orices)
Pixed Charges Fuel Cost Total Costs
High Speed Diesefs
Inland Centers (1000 kW) a/ 0.075 0.120 0.-95
Medium Speed Diesels
Inland Centers (1000-2000 kW) b/ 0.056 0.097 0.153
Low Speed Diesels
Atlantic Region (5000 kW) c- 0.049 0.065 0.114
a/ Fixed charges estimated on the basis of an investment cost ofUS$700/KW, economic life of 10 years, discount rate 10%, andassuming a 50% reserve caoacity; fixed operating costs 5.5% ofinvestment; foad factor 3,000 hours/year. Fuel costs estimated at acost for gasoil of US$360/ton and a fuel consumption of 330 gr/kWh.
b/ Fixed charges estimated on tne basis of an investment cost ofUS$875/kW, economic life 15 years, discount rate 10%, and assuming a50% reserve capacity; fixed oDerating costs 4.5% of investment; loadfactor 4,000 hrs/year. Fuel costs estimated at a cost for gasoil ofUS$360/ton and a fuel consumption of 270 gr/kWh.
c/ Fixed charges estimated on the basis of an investment cost ofUS$1,000/kW, economic life of 20 years, discount rate 10%, andassuming a 30% reserve capacity. Fixed operating costs at 3% ofinvestment. Load factor 4,000 hnrs/year. Final costs estimated at acost for heavy fuel oil of US$274/ton, and a fuel consumption of240 gr/kWh.
Source: Bank estimate.
Interconnected Coastal System
Togo Coastal System
5.5 Demand in Togo. A forecast of future power demand in Togo issubject to more than the usual uncertainties because of the followingfactors:
(a) Electricity rates that remained unchanged from 1967 to March1981 may have encouraged the extraordinary load growth. Recentsteep rate increases and prospective further large adjustments

- 58 -
are likely to put a brake on this growth, but the extent of theslowdown is difficult to foresee; 36/
(b) The Togolese economy has gone through cycles of investment boomand sharp contraction in a very short period (1974-1982). Thepace of recovery will depend not only on external factors butalso on the effectiveness of government policies aimed athigher agricuLtural output rather than major ventures inindustry.
5.6 The following load projection is based on a review of severalavailable studies. The resulting single projection is intended only as ascenario for discussing power planning probLems; any detailed studyshould recognize uncertainty by considering higher and lower limits andtheir implications for development strategy. The load projection isbased on the following assumptions:
(a) CEET Distribution: Percentage Growth Rates
Coastal System nland Centers
81-90 90-2000 81-90 90-2000
(percent)
Low VoltageResidential 9.5 8.0 13.3 12.0
Commercial 11.0 9.0 13.0 12.0Streetlighting 6.0 5.0 6.0 5.0
Medium Voltage 7.6 8.0 20.0 15.0
Distribution Losses 13.5 13.5 17.0 15.0
Load Factors 0.61 0.61 0.50 0.50
(b) CEET Wholesale
(i) SNS Production to increase from 5,000 to 13,000 tons/year by1988 and 20,000 tons/year in 1998. Maximu.m electrical peakload 8 MW (load factor around 0.30);
(ii) OTP production to rise from 2.9 to 4.0 million tons/year in1995/96. Maximum electrical load 80 GWh and 16 MW (loadfactor 0.57). Addition of phosphoric acid plant in 1991/92,with production reaching 300,00 tons/year in 1998/99, will
36/ The actual load as of 1983/84 was substantially lower thanpredicted; and CEET expects the load in 1984/85 to be about the sameas the 1981/82 level.

- 59 -
reduce OTP's net purchasing requirements. Maximum elec-trical load (in 2000/01) 100 GWh or 20 MW.
(c) CIMAO Wholesale (CEB load)
Production of cement clinker is assumed at 0.8 to 1.0 milliontons per year in 1988 and 1.1 million tons in 1998. The cor-responding maximum electrical load is 83 GWh and 16 MW (loadfactor 0.59).
5.7 The load projections derived from the foregoing assumptions aresummarized in Table 5.4. The implied average rate of growth in distri-bution sales is 9% in the interconnected system to 1988. Growth of allenergy requirements in Togo (including the large wholesale customers)averages 7.6%, less than half the growth rate for the period 1961-1981.
Table 5.4: TOGO: NET ELECTRIC DEMAND PROJECTIONS IN COASTAL REGION
1981/82 1988 1998
GWh X GWh % GWh X
Sales (GWh)Low Voltage Consumers 82 27 156 33 363 42Medium Voltage Consumers 102 34 166 35 309 35Wholesale Customers 120 39 148 32 203 23
Total Sales 304 100 470 100 875 100
Losses a/ (GWh) 37 70 140Total Requirements (GWh) 34i 540 1019Peak Demand (MW) 74 114 200
a/ Distribution and Transmission.
Source: Annexes 10-12.
5.8 Medium Term Supply/Demand Balance. Until the end of 1983, mostof the electricity requirements of Togo's coastal system were supplied byCEB and purchased from Ghana under contracts that guarantee Togo maximumdeliveries of 42 MW (25 MW for CEET and 17 MW for CIMAO) which, at a 90%availability factor, corresponds to 340 GWh. Thermal generation wasminimal because energy imports were higher than contracted peakdeliveries and imports could be shaped to the load. On December 1, 1983,VRA reduced deliveries by 50% due to power shortages in Ghana. Althoughthe thermal capacity in Togo's coastal system (100 MW net) is sufficientto compensate for the curtailment in imported supplies, demand managementmeasures have been adopted to reduce the cost of the much higher propor-tion of thermal generation in total supplies. These measures consist ofphysical rationing of supplies and a limited tariff increase.
5.9 Substantial generating capacity has been added in Togo, despitethe Treaty provision giving CEB a monopoly on building new generationfacilities. CEET's capacity connected to the coastal system is 17.4 MW,

- 60 -
of which 16 MW (two 8 MW diesel units) were added in 1979. The SocieteNationale de Siderurgie has built the Centrale Thermique de Lom6 (CTL),connected by a 161 kV line to CEB's Tokoin substation. Two gas turbineswith a combined rated peaking capacity of 45 MW have been commissionedand four low-speed diesels with an estimated combined net output of 38.0MW have been installed. Provision has been made in the plant layout forthe future addition of a 28.7 MW steam unit, to form together with thegas turbines a combined cycle unit. 37/ As a form of self-generation, theCTL plant construction should have come under the regulatory powers ofCEB, but there is no indication that CEB has played such a role. The gasturbines alone are only useful as reserve capacity and are normally run afew hours a month for testing. In the fall of 1982, supply for SNS wasmade CEET's responsibility, and in 1984 CEET assumed responsibility forCTL operation. In addition, the OTP phosphate plant has a 14.0 MW cap-tive diesel unit, which can be used only as reserve to the phosphateplant because the controls are not adapted to operations in parallel withthe CEB system.
5.10 Although CEB has the responsibility for planning the expansionof generation and transmission facilities in Togo, and future supplies ofmost of the Togolese power market will result from binational coopera-tion, it is of interest to note what the energy situation would look likefrom a strictly Togolese point of view. Under the assumption thatimported supplies from Ghana will be restored to contract levels, theexisting thermal capacity, added to the country's share in the Nangbetohydroplant, would be sufficient to meet domestic demand until the early1990s. For the longer term expansion requirements, Togo would have torely on increased imports. The primary energy resources that currentlyare available for power generation consist of a hydro potential equi-valent to 500 GWh/year (Table 5.5), which compares to a total incrementalelectric demand of about 700 GWh to 1998.
5.11 In addition, a recent survey of small hydro sites was recentlyconcluded 38/ which identified two good prospective sites with high headsand relatively low costs. These are Ezime, West of Atakpame, with apotential capacity of 2.5 MW and an average output of 10.5 GWh; andTomegbe, south of Badou, with an estimated installable capacity of 8 MWand an output of 30 GWh per year. This survey also recommended moredetailed analysis of site-specific hydraulic conditions, more detaileddesign and cost studies of selected sites, more detailed analysis of
37/ The 161 kV connection to the CEB system was intended to allow(i) the sale of CTL output to CEB when required, and (ii) resale ofCEB deliveries to SNS to CEET at 20 kV from the stepdown substationat the steel plant.
38/ NRECA - Togo - An assessment of decentralized hydropower potential,March 1984. It should be noted that the output estimated for Ezimeis calculated assuming 5,000 hours operation per year, which appearstoo high given the seasonality of rainfalls.
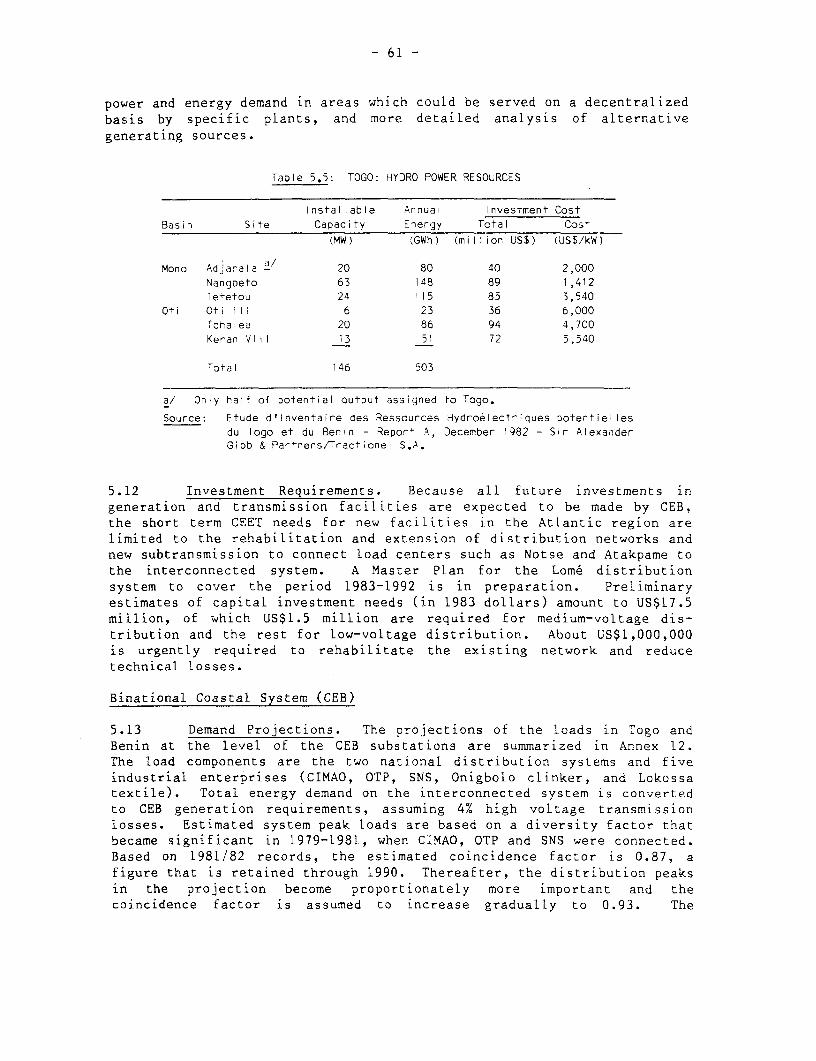
- 61 -
power and energy demand in areas which could be served on a decentralizedbasis by specific plants, and more detailed analysis of alternativegenerating sources.
Table 5.5: TOGO: HYDRO POWER RESOURCES
installable Annual Investment CostBasin Site Capacity Energy Total Cost
(MW) (GWh) (million US$) (US$/kW)
Mono AdJarala a/ 20 80 40 2,000
Nangbeto 63 148 89 1,412Tetetou 24 115 85 3,540
Oti Oti III 6 23 36 6,000Ichaiea 20 86 94 4,700Keran Vlil 13 51 72 5,540
Total 146 503
a/ Only half of potential output assigned to Togo.
Source: Etude d'lnventaire des Ressources Hydro6lectriques Dotentiellesdu Togo et du Benin - Report A, December 1982 - Sir AlexanderGibb & Partners/Tractionel S.A.
5.12 Investment Requirements. Because all future investments ingeneration and transmission facilities are expected to be made by CEB,the short term CEET needs for new facilities in the Atlantic region arelimited to the rehabilitation and extension of distribution networks andnew subtransmission to connect load centers such as Notse and Atakpame tothe interconnected system. A Master Plan for the Lome distributionsystem to cover the period 1983-1992 is in preparation. Preliminaryestimates of capital investment needs (in 1983 dollars) amount to US$17.5million, of which US$1.5 million are required for medium-voltage dis-tribution and the rest for low-voltage distribution. About US$1,000,000is urgently required to rehabilitate the existing network and reducetechnical losses.
Binational Coastal System (CEB)
5.13 Demand Projections. The projections of the loads in Togo andBenin at the level of the CEB substations are summarized in Annex 12.The load components are the two national distribution systems and fiveindustrial enterprises (CIMAO, OTP, SNS, Onigbolo clinker, and Lokossatextile). Total energy demand on the interconnected system is convertedto CEB generation requirements, assuming 4% high voltage transmissioniosses. Estimated system peak loads are based on a diversity factor thatbecame significant in 1979-1981, when CIMAO, OTP and SNS were connected.Based on 1981/82 records, the estimated coincidence factor is 0.87, afigure that is retained through 1990. Thereafter, the distribution peaksin the projection become proportionately more important and thecoincidence factor is assumed to increase gradually to 0.93. The
- 62 -
projected loads for 1998 are about 300 MW and 1,650 GWh, corresponding toan average annual growth rate of 8% over 15 years.
5.14 Medium Term Supply/Demand Balances. Since 1973, CEB is themain supplier of electric power in the binational coastal system. Itowns the transmission lines Akosombo-Lome-Cotonou-Sakete (double circuit,161 kV), Sakete - Onigbolo (single circuit, 161 kV), and four singlecircuit lines (63 kV) from Mome-Hagou to OTP, Anfoin, Tabligbo andLokossa. CEB's customers are the national distribution companies CEET(Togo) and SBEE (Benin), and the regional cement plant CIMAO. Atpresent, its only source of electric power is energy imported fromGhana. Under a contract renewed in 1982 and extended to 1996, the VoltaRiver Authority (VRA) guarantees a maximum capacity of 67 MW (about 528GWh at 90% availability) to Togo and Benin. VRA indicated in 1982 thatit was unwilling to make new formal commitments that might jeopardizeGhana's future needs, and on the other hand, the existing transmissionline imposes a physical constraint to increasing the flow of importedenergy estimated beyond 600 GWh per year.
5.15 The actual supply from VRA to CEB was about 89 MW in 1982, wellabove the contractual limit of 67 MW and sufficient at that time to meetthe combined loads of the coastal regions of Togo and Benin without needfor local generation, except in emergencies. Since then, power shortagesin Ghana have resulted in a 50% reduction of VRA deliveries as ofDecember 1, 1983, and thermal generation in both Togo and Benin aremaking up the shortfall. As illustrated in Table 5.6, there is enoughthermal spare capacity in the system to meet peak demand until the early1990s, especially if demand growth is considerably lower than projectedin this report. However, the cutback implies that 60% of the 1984 loadmust be provided by thermal generation, and that this share will increaseto two-thirds of the total by 1987 should curtailments extend until then.
5.16 CEB's investment program to 1988 comprises the construction ofthe Nangbeto hydro power station, to be commissioned in 1988, the asso-ciated transmission and substation facilities, and a load dispatch centerwhich will permit coordinated least cost operation of the number of dis-persed generating plants in the interconnected system. These investmentrequirements, estimated at US$106 million (in 1982 dollars), will befinanced by IDA and co-financing resources.
5.17 Long-Term Planning. Power planning is subject to three majoruncertainties: the duration of Ghana's import curtailment, the resultsof continued hydro studies, and progress on the West African PowerSystems Interconnection (WAPSI). The Master Plan prepared by consultantsis based on the hydro pre-feasibility studies available at the time andan assumed import ceiling of 600 GWh per year. Integration of storageoperations in Ghana with unregulated production in Togo/Benin was notconsidered. The report on the master plan presents two investmentsequences, one for constant fuel prices (in real terms) and one forrising prices. Both sequences start with the addition in 1991 of a steamcomponent (28 MW) to the two existing CTL gas turbines, thus completingthe combined-cycle plant. Under the constant-price scenario, Adjarala,
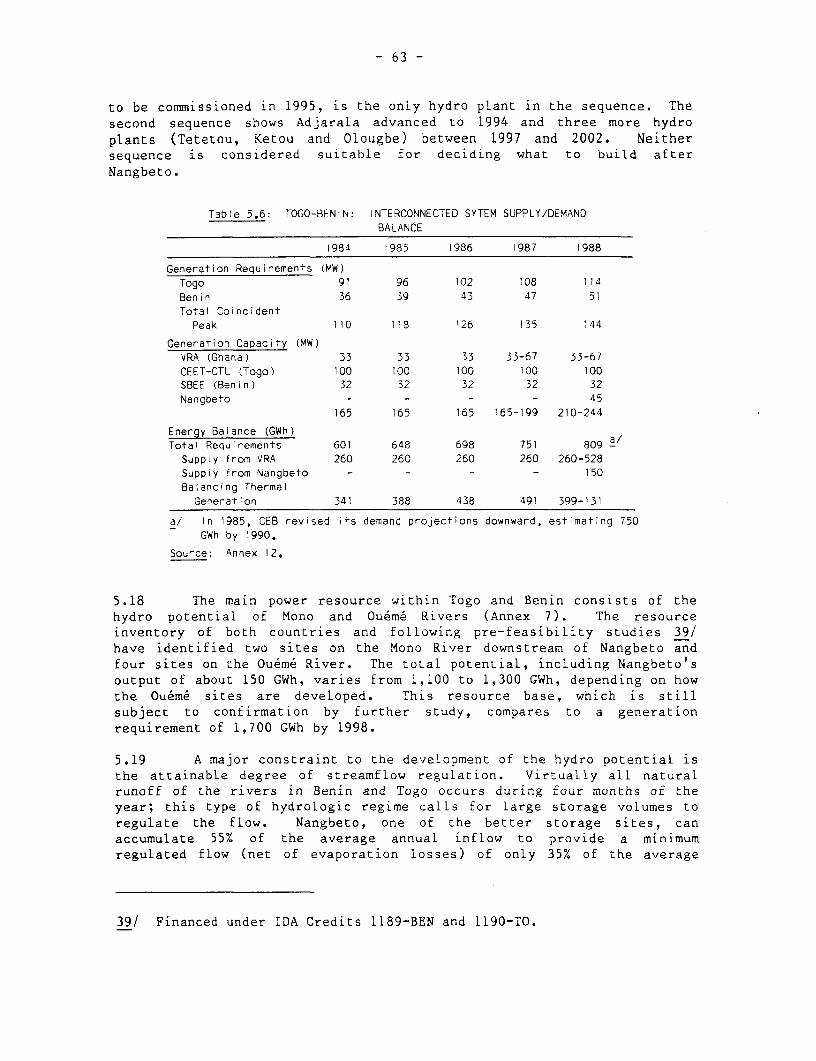
- 63 -
to be commissioned in 1995, is the only hydro plant in the sequence. Thesecond sequence shows Adjarala advanced to 1994 and three more hydroplants (Tetetou, Ketou and Olougbe) between 1997 and 2002. Neithersequence is considered suitable for deciding what to build afterNangbeto.
T3ble 5.6: TOGO-BENIN: INTERCONNECTED SYTEM SUPPLY/DEMANDBALANCE
1984 1985 1986 1987 1988
Generation Requirements (MW)Togo 91 96 102 108 114Benin 36 39 43 47 51Total CoincidentPeak 110 118 '26 135 144
Generation Capacity (MW)VRA (Ghana) 33 33 33 33-67 33-67CEET-CTL (Togo) 100 100 100 100 100SBEE (Benin) 32 32 32 32 32Nangbeto - - - - 45
165 165 165 165-199 210-244
Energy Balance (GWh)Total Requirements 601 648 698 751 809 3Supply from VRA 260 260 260 260 260-528Supply from Nangbeto - - - - 150
Balancing ThermalGeneration 341 388 438 491 399-131
a! In 1985, CEB revised its demand projections downward, estimating 750GWh by 1990.
Source: Annex 12.
5.18 The main power resource within Togo and Benin consists of thehydro potential of Mono and Ouem6 Rivers (Annex 7). The resourceinventory of both countries and following pre-feasibility studies 39/have identified two sites on the Mono River downstream of Nangbeto andfour sites on the Oueme River. The total potential, including Nangbeto'soutput of about 150 GWh, varies from 1,100 to 1,300 GWh, depending on howthe Ou6m6 sites are developed. This resource base, which is stillsubject to confirmation by further study, compares to a generationrequirement of 1,700 GWh by 1998.
5.19 A major constraint to the development of the hydro potential isthe attainable degree of streamflow regulation. Virtually all naturalrunoff of the rivers in Benin and Togo occurs during four months of theyear; this type of hydrologic regime calls for large storage volumes toregulate the flow. Nangbeto, one of the better storage sites, canaccumulate 55% of the average annual inflow to provide a minimumregulated flow (net of evaporation losses) of only 35% of the average
39/ Financed under IDA Credits 1189-BEN and 1190-TO.

- 64 -
flow. The situation will be somewhat better in the (u6me River basinonce several sites are developed in cascade, but in the first stage theregulation problem is the same as on the Mono River. Hence a large partof the hydro energy potential of Togo and Benirn is secondary energy thatwould displace fuel at existing diesel plants. However, the 161 kVinterconnection with Ghana could be used, even after termination of thepresent CEB-VRA contract, to firm up this secondary energy by storingexcess rainy season output in the Akosombo reservoir and supporting theCEB system in the dry season with a return flow of this energy. Even-tually, transmission capacity may limit this possibility, but by thattime WAPSI would have removed the bottleneck. Therefore, even the devel-opment of indigenous hydropower would require simultaneous support fromthe interconnection project.
5.20 One possible other resource is natural gas, as indicated duringthe exploration that led to development of the offshore Seme oil field inBenin. Two additional exploratory wells into the gas structure will bedrilled in 1984-85 to evaluate the base of the reserves. If the depositproves to be commercial, a detailed market study will have to be made toascertain the markets of highest economic return to which this gas can beallocated.
5.21 Other Expansion Options. The imbalance of long term loads andresources suggests that Togo and Benin may be forced to import consider-able volumes of energy to complement indigenous supplies. The mostpromising way, at least to aLleviate this problem, is to continue andexpand regional cooperation. For a number of years CEB has promoted thestudy of an interconnection linking the VRA system in Ghana, the CEBsystem, and the NEPA system in Nigeria. Since Ivory Coast and Ghanacompleted a 220 kV tie line in 1983, the interconnection would link fivecountries. A feasibility study, sponsored by the African DevelopmentBank and coordinated by CEB, is in progress and scheduled for completionin mid-1984. The interest in the project arises from the diversity ofresources in the region: Ghana and Ivory Coast may have temporary hydroenergy surpluses and seasonal excess hydro capacity; Nigeria is headedfor large scale development of gas-fired thermal plant for energy supply,which will permit off-peak energy generation at low marginal cost thatcould be traded for capacity imports at other times. The CEB system isstrategically well placed to absorb part of the transfers within aninterconnected system.
5.22 It must be realistically expected that engineering studies,financing and international agreements on WAPSI will take time. Further-more, implementation is not likely until reservoir storage in Akasombo(Ghana) and Kossou (Ivory Coast) is restored to normal operating levels,which will require careful multi-year planning of Ghana and Ivory Coastpower operations. Finally, the possibility of building thermal plant onthe Ivory Coast (using recently discovered offshore natural gas) couldchange some of the original concepts of the interconnection benefits.
- 65 -
5.,23 The addition of the steam component to the combined cycle plantat CTL appears attractive because the capital cost is low ($17.4 millionor $670/kW) and fuel costs per kWh of the combined cycle plant are aboutthe same as for heavy diesels, for plant capacity factors over 50%.These advantages must be weighed against:
(a) the technological risk of having a combined cycle plant runningon residual fuel, for which there are few precedents in devel-oping countries;
(b) operational problems in the early 1990s (especially in themonths of high runoff) when VRA imports plus Nangbeto outputleave little room under the load curve for operating the com-bined cycle plant at the high capacity factors required forfuel economy; and
(c) the combined cycle plant does nothing to reduce the country'sdependence on imported petroleum fuels.
5.24 Another alternative might be to construct coal-based thermalcapacity in Togo, especially if the clinker plant CIMAO is converted toimported coal. A preliminary comparison of these alternatives isprovided in Table 5.7.
Binational Strategy
5.25 The binational strategy should be to prepare sufficientprojects at feasibility stage to have an alternative ready if the WestAfrican interconnection is delayed. If the interconnection is realizedearlier, any projects that would be more expensive than newly contractedimports could be postponed. Implementation of this strategy requires acontinuation of hydro resource investigations comprising:
(a) improvements to the topographic and hydrometric data bases; 40/
(b) a study of the optimum development of the Mono and Ou6m6 Riversin cascade; and
(c) a feasibility study of the optimum site for the hydropowerdevelopment project on the lower Mono River.
40/ The proposed IDA credits for Nangbeto construction include financingfor these power studies.
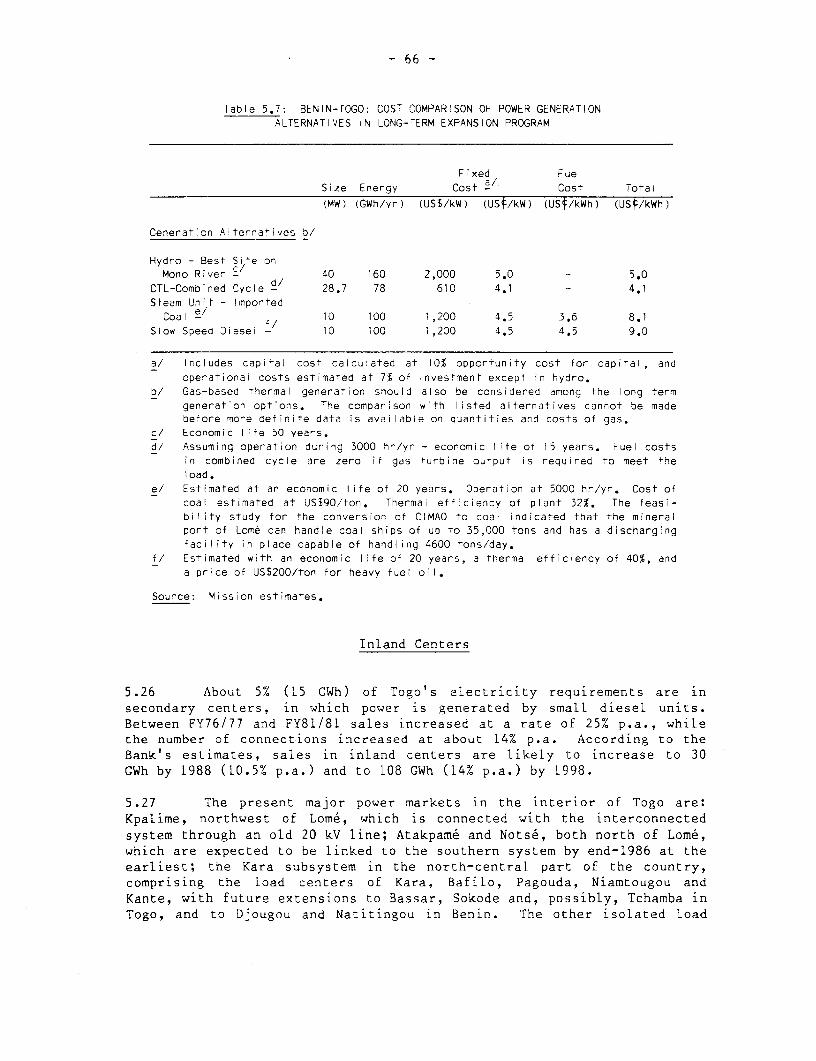
- 66 -
Table 5.7: BENIN-TOGO: COST COMPARISON OF POWER GENER'ATION
ALTERNATIVES IN LONG-TERM EXPANSION PROGRAM
Fixed Fuel
Size Energy Cost Cost Total
(MW) (GWh/yr) (US$/kW) (US¢/kW) (USt/kWh) (US¢/kWh)
Generation A terratives b/
Hydro - Best Site onMono River C/ 40 160 2,000 5.0 - 5.0
CTL-Combined Cycle - 28.7 78 610 4.1 -- 4.1Steam Unit - Imported
Coal e/ 10 100 1,200 4.5 3,6 8.1
Slow Speed Diesel - 10 100 1,200 4.5 4,5 9.0
a/ Includes capital cost calcuiated at 10% opportunity cost for capital, and
operational costs estimated at 7% of investment except in hydro.b/ Gas-based thermal generation should also be considered among the long term
generation options. The comparison with listed alternatives cannot be madebefore more definite data is available on quantities and costs of gas.
c/ Economic life 50 years.d/ Assuming operation during 3000 hr/yr - economic life of 15 years. Fuel costs
in combined cycle are zero if gas turbine output is required to meet theload.
e/ Estimated at an economic life of 20 years. Operation at 5000 hr/yr. Cost of
coal estimated at USS90/ton. Thermal efficiency of plant 32%. The feasi-bility study for the conversion of CIMAO to coal indicated that the mineralport of Lome can handle coal shi ps of up to 35,000 tons and has a dischargingfacility in place capable of handling 4600 tons/day.
f/ Estimated with an economic life of 20 years, a thermal efficiency of 40%, and
a price of US$200/ton for heavy fuel oil.
Source: Mission estimates.
Inland Centers
5.26 About 5% (15 CWh) of Togo's electricity requirements are insecondary centers, in which power is generated by smalL diesel units.Between FY76/77 and FY81/81 sales increased at a rate of 25% p.a., whilethe number of connections increased at about 14% p.a. According to theBank's estimates, sales in inland centers are likely to increase to 30GWh by 1988 (10.5% p.a.) and to 108 GWh (14% p.a.) by 1998.
5.27 The present major power markets in the interior of Togo are:Kpalime, northwest of Lome, which is connected with the interconnectedsystem through an old 20 kV line; Atakpame and Nots6, both north of Lom6,which are expected to be linked to the southern system by end-1986 at theearliest; the Kara subsystem in the north-central part of the country,comprising the load centers of Kara, Bafilo, Pagouda, Niamtougou andKante, with future extensions to Bassar, Sokode and, possibly, Tchamba inTogo, and to Djougou and Natitingou in Benin. The other isolated load
- 67 -
centers are Dapaong and Mango in the extreme north, and Sotouboua-Blitta,halfway between the Kara system and the interconnected system.
5.28 The large difference in generating costs between the inter-connected system and the load centers of the interior favors intercon-nection. The timing for constructing a nationwide transport network is afunction of the transmission distances and the load densities. There areconsiderable margins of uncertainty regarding energy demand growth inspecific Locations. Under the assumptions used by the consultant, thesouth-north interconnection (Lom6-Lama Kara) is economically feasible by1990. However, under more realistic assumptions on fuel costs, thesouth-north interconnection does not appear to be economically feasible(Annex 13.3). In the meantime, sub-transmission lines will be built aswarranted to serve groups of small towns from central power plants andstudies clarifying the issues regarding the long term incremental costsof bulk supplies in the interconnected system (indigenous hydro and/orimported power) can be firmed up.
5.29 CEET intends to implement the regional connections by building66 kV sub-transmission lines and by developing a 20 kV primary distri-bution network throughout Togo. The consultants who studied a masterplan for developing bulk supply to Togo and Benin favor a 33 kV networkto service the interior of both countries, displacing expensive localgeneration by supply from 161 kV trunklines. The economics of eachapproach cannot be fully evaluated until the future development of the161 grid is better known, and this depends in turn on completing furtherinvestigations of hydropower.
Necessary Short-Term Actions
5.30 Almost all of the existing power centers of the interior haveoperational and maintenance problems; the distribution networks showsubstantial voltage fluctuations and energy losses; and none of thesecenters gathers basic data necessary for planning expansion require-ments. This indicates that: (a) training of personnel in properoperational and maintenance practices is of highest priority; (b)standarization of equipment should be sought to reduce the cost of thespare parts inventory; (c) standards for the design of distributionsystems should be developed to minimize losses; and (d) a minimum ofinformation gathering capacity (especially a realistic assessment ofeffective demand) should be developed in each center to assist CEET'sheadquarters in evaluating minimum cost expansion options.
Specific Medium-Term Issues
5.31 Lama Kara. This is the second most important load center inTogo: it serves a population of about 75,000 people, half of them locatedin the city of Lama Kara and the other half in four surrounding towns.There is a considerable margin of uncertainty regarding the short termpower requirements of this center. Peak demand has soared since 1981/82due to the completion of major government and commercial facilities(presidential residence, the party's meeting house, a large hotel, and an

- 68 -
airport). The mission considers it essential that a realistic assessmentof the effective demand of these new large consumers be made for theperiod up to 1987-88, including an estimate of the economic cost of powerfailures and an identification of peak shaving opportunities. It alsowould be advisable to come to an agreement with Togotex (textile), shouldthis plant reinitiate operations, to encourage it to meet its peak energyrequirements from its own diesel generators; the plant's base load beingsupplied by CEET.
5.32 This regional power center is capacity constrained in themedium term. CEET had envisaged transferring from Lome two 8 MW mediumspeed diesel units operating on residual fuel oil and to further build upthe Kara system by connecting other nearby towns. In view of the cut-back of the imported electricity supply from Ghana, these units areneeded to meet the demand of the southern interconnected system.Instead, a 3.7 MW unit operating on gasoil has been transferred to LamaKara. The present configuration does not guarantee supply of the marketin case one of the larger generating units fails (Annex 13). The missiontherefore suggests that the following studies be made at the earliestpossible time:
(a) Feasibility study for the work necessary to operate in parallelgenerating groups installed in Lama Kara. The Master Planadvises to replace one of the step-up transformers and torearrange the equipment of the plant. The mission estimatesthat the cost for installing a new transformer and for auxi-liary work should not exceed US$200,000.
(b) To reassess the generation options in Lama Kara as soon as themedium term power supplies from Ghana are clarified. CEET isconsidering some mini-hydro sites in the Lama Kara area.
5.33 In spite of Lama Kara's medium term capacity constraints, itcontinues to be economic to build sub-transmission lines to Sokode andBassar. The Sokode plant will not be able to service projected demand by1985, and the alternative is to install a 1 MW high speed diesel plant.In addition, the Sokode power plant has several other shortcomings thatneed urgent attention.
5.34 Atakpame-Notse. CEET has decided to go ahead and connect theseload centers with the southern interconnected system. In addition, toimprove the stability of the voltage in the distribution network ofAtakpame, it appears necessary to raise the voltage of the primarydistribution system, to install additional transformers, and to extendthe primary distribution lines.
5.35 Kpalime. This center, located 120 kms northwest of Lome, issupplied from the only small hydropower station operating in Togo and isalso connected to the southern interconnected system by an old trans-mission line, which has a limited carrying capacity (500 KVA) that willnot be able to meet this center's load in the mid-1980s during the dryseason. The consultant for the mascer plan recommends building a new

- 69 -
transmission line at the earliest possible time connecting it to theinterconnected system at Atakpame or Notse. It also appears that thehydro potential of Kpime might be more fully used (water is spilled inthe wet season) by increasing the utilization of the existing generatingcapacity.
5.36 Other Isolated Centers. In other isolated centers, the mediumterm demand in the future is too small to justify connection with largersystems. Thus, for example, the power centers in the region of Savanes(Dapaong and Sansanne) are only considered to be connectable to the Karasystem by mid-1990s, and Blitta only by early 2000.
Investments in the Inland Centers
5.37 CEET's preliminary investment program envisages a medium termcapital expenditure of US$29.1 million (in 1982 dollars, converted atFCFA 330/US$) in the Kara system and of US$5.6 million in other regions,most of which (US$3.2 million) would be used for rural electrification.In Table 6.1 the mission presents its view on CEET's medium term priorityinvestments.
Tariffs
CEB's Purchase and Sales Tariffs
5.38 A distinction must be made between CEB's wholesale purchasesand sales and CEET's sales to final consumers. CEB's purchase agreementwith VRA reflects the cost structure of hydropower, characterized by highfixed charges and low incremental costs. The purchase tariff has athree-part structure, and a similar structure is retained for CEB's salestariff to CEET and SBEE. The level of CEB's purchase and sales tariff asof April 1982 is indicated in Table 5.8. CEB's average purchase cost inFY82 was about US02.5/kWh and its average revenue USe4/kWh. The powerpurchase costs are denominated and payable in US dollars, and subject torevisions every three years, whereas CEB's sales to CEET and SBEE aresettled in FCFA and the sales to CIMAO in dollar equivalents of FCFAbillings. Therefore, CEB incurs a significant exchange risk, given theshort-term fluctuation of the exchange rate.
5.39 A tariff study by EDF-DAFECO was completed in May 1982.Although the long term assumptions need to be reviewed, the studyprovides a useful guide for restructuring CEB's sales tariff in themedium term. The proposed tariff has the following features:(a) elimination of the fixed charges; (b) replacement of metered demandcharge by a charge for contracted capacity; (c) introduction of asignificant differential in capacity charges to CEET and SBEE; and (d) ashift towards lower capacity charges for all customers and much higherenergy charges. (See Annexes 14.1-14.2).
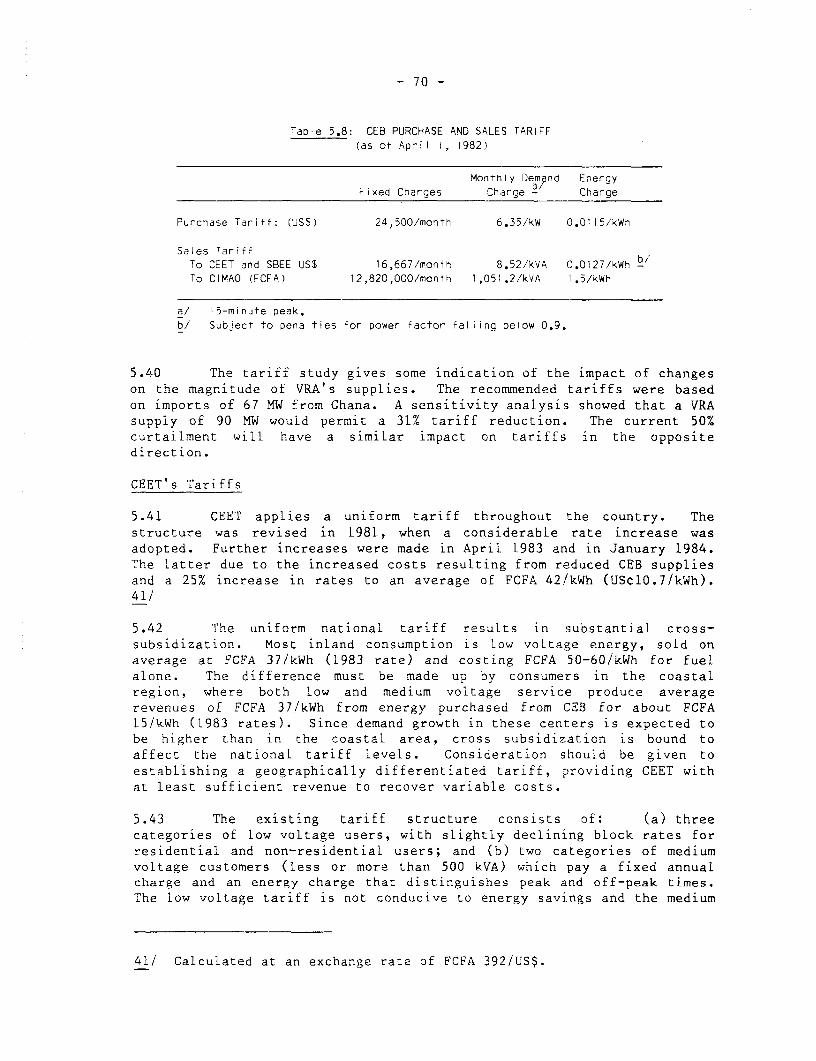
- 70 -
Table 5.8: CEB PURCHASE AND SALES TARIFF
(as of April 1, 1982)
Montnly Dempnd Energy
Fixed Charges Charge - Charge
Purchase Tariff: (US$) 24,500/month 6.35/kW 0.0!15/kWh
Sales TariffTo CEET and SBEE US$ 16,667/month 8.52/kVA 0.0127/kWh b/To CIMAO (FCFA) 12,820,000/month 1,051.2/kVA 1.5/kWh
a/ 15-minute peak.
b/ Subject to penalties for Dower factor falling below 0.9.
5.40 The tariff study gives some indication of the impact of changes
on the magnitude of VRA's supplies. The recommended tariffs were based
on imports of 67 MW from Ghana. A sensitivity analysis showed that a VRA
supply of 90 MW would permit a 31% tariff reduction. The current 50%curtailment will have a similar impact on tariffs in the oppositedirection.
CEET's Tariffs
5.41 CEET applies a uniform tariff throughout the country. The
structure was revised in 1981, when a considerable rate increase was
adopted. Further increases were made in April 1983 and in January 1984.
The latter due to the increased costs resulting from reduced CEB supplies
and a 25% increase in rates to an average of FCFA 42/kWh (USC10.7/kWh).
41/
5.42 The uniform national tariff results in substantial cross-subsidization. Most inland consumption is low voltage energy, sold on
average at FCFA 37/kWh (1983 rate) and costing FCFA 50-60/kWh for fuel
alone. The difference must be made up by consumers in the coastalregion, where both low and medium voltage service produce average
revenues of FCFA 37/kWh from energy purchased from CEB for about FCFA
15/kWh (1983 rates). Since demand growth in these centers is expected tobe higher than in the coastal area, cross subsidization is bound to
affect the national tariff levels. Consideration should be given to
establishing a geographically differentiated tariff, providing CEET with
at least sufficient revenue to recover variable costs.
5.43 The existing tariff structure consists of: (a) threecategories of low voltage users, with slightly declining block rates for
residential and non-residential users; and (b) two categories of medium
voltage customers (less or more than 500 kVA) which pay a fixed annualcharge and an energy charge that distinguishes peak and off-peak times.
The low voltage tariff is not conducive to energy savings and the medium
41/ Calculated at an exchange rate of FCFA 392/US$.
- 71 -
voltage tariff has a low demand charge which does not encourage efficientuse of capacity. A tariff study was made in 1983, 42/ which makes thefollowing structural recommendations:
(a) The theoretical capacity charge and time-of-day energy rate isconverted into a declining block rate for residential customersbecause metering costs would exceed the benefits of a time-of-day rate. To avoid burdening low income customers with thehigh costs of the first block, a special declining block tariffis recommended for residential customers consuming about 375kWh per year. For general residential service the consultantsrecommend a return to the former definition of blocks as hoursof utilization of subscribed capacity;
(b) The almost flat commercial rate would be replaced by adeclining block rate for smaller users (up to about 4.7 kWconnected) and a two-part tariff (subscribed capacity chargeand time-of-day energy rate) for larger consumers;
(c) Medium-voltage customers would all pay a two-part tariff(subscribed capacity charge plus time-of-day energy rate) but,depending on their load factor, they would have a choicebetween low capacity/high energy and high capacity/low energyrates. The rate categories are designed for customers withaverage capacity utilization of 1,700 and 5,300 hours.
5.44 Wholesale tariffs for OTP and SNS were reviewed within theframework of the CEB tariff, before CEET took over supply responsibilityfor these two industrial consumers. The consultants' recommended tariffeliminates the high fixed charge, reduces the demand charge, and replacesthe low flat energy rate by a time-of-day rate. On the assumption thatall requirements of OTP and SNS would be purchased from CEB, the effecton CEET's finances was assumed to be neutral.
5.45 The consultants study was based on the marginal cost prin-ciples. The theoretical results were increased by 18.8% to take intoaccount CEET's financial requirements assuming an average return of 8% onrevalued assets, and including the cost of service to isolated localcenters. The consultants recommend a billing simulation before imple-mentation to verify the revenue levels that would be produced by theproposed tariff. The reduction in supplies from Ghana calls foradditional rate adjustments. On average, the purchase price of CEBenergy is estimated to rise by FCFA 12/kWh, and CEET's January 1984 ratesare expected to produce an increase of the same order. In the interestof efficient pricing, these measures should be followed up by furtherchanges in the tariff structure as recommended by the consultant, afterCEET's clientele has adjusted to the new levels.
42/ Etude de tarification de l'6nergie electrique, EDF - International,1983.
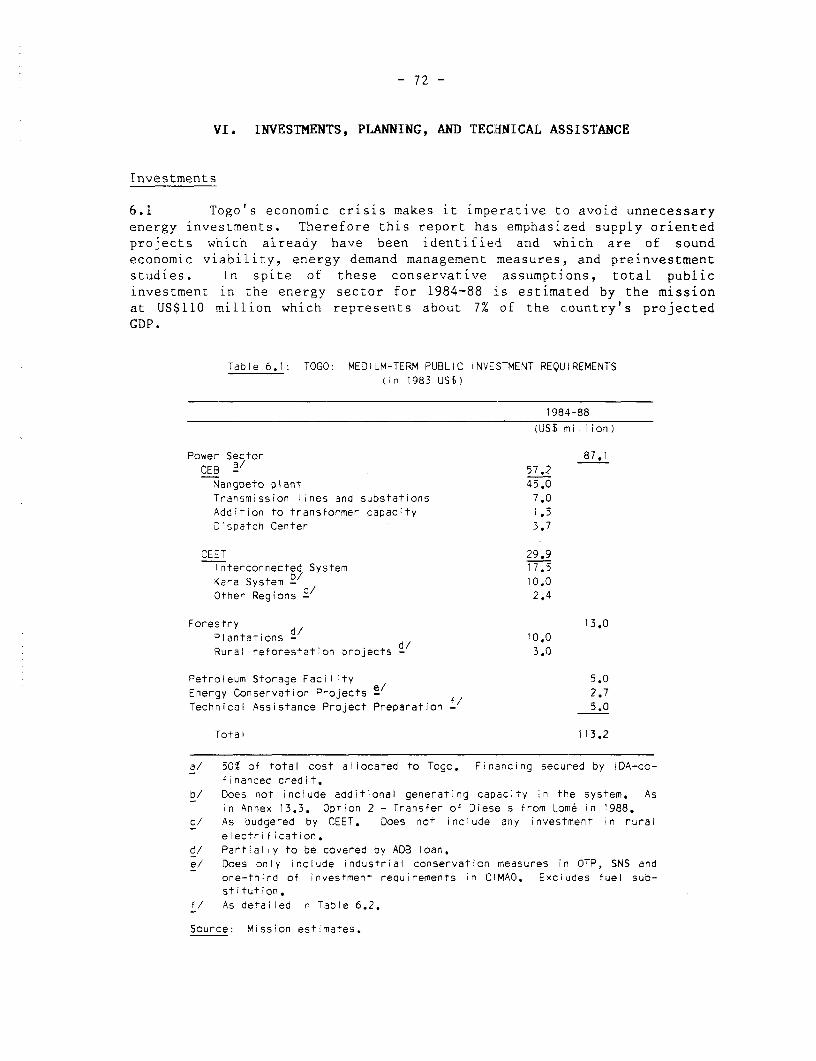
- 72 -
VI. INVESTMENTS, PLANNING, AND TECHNICAL ASSISTANCE
Investments
6.1 Togo's economic crisis makes it imperative to avoid unnecessaryenergy investments. Therefore this report has emphasized supply orientedprojects which already have been identified and which are of soundeconomic viability, energy demand management measures, and preinvestmentstudies. In spite of these conservative assumptions, total publicinvestment in the energy sector for 1984-88 is estimated by the missionat US$110 million which represents about 7% of the country's projectedCDP.
Table 6.1 70GO: MEDIUM-TERM PUBLIC INVESTMENT REQUIREMENTS(ri 1983 US$)
1984-88
(USS million)
Power Sector 87.1CEB a 57.2Nangbeto plant 45.0Transmission lines and substations 7.0Addition to transformer capacity 1.5Dispatch Center 3.7
CEi-T 29.9Interconnected System 17.5Kara System c/ 10.0Other Regions - 2.4
Forestry d/ 13.0Pnlantations -d/ 10.ORural reforestation projects - 3.0
Petroleum Storage Facility e/ 5.0Energy Conservation Projects 52.7Technical Assistance Project Preparation -5.0
Total 113.2
a/ 50 of total cost allocated to Togo. Financing secured by IDA-co-financed credit.
b/ Does not include additional generating capacity in the system. Asin Annex 13.3. Option 2 - Transfer of Diesels from Lome in 1988.
c/ As budgeted by CEET. Does not include any investment in ruralelectrification.
d/ Partially to be covered by ADB loan.e/ Does only include industrial conservation measures in OTP, SNS and
one-third of investment requirements in CIMAO. Exciudes fuel sub-stitution.
f/ As detailed in Table 6.2.
Source: Mission estimates.

- 73 -
6.2 This medium term investment program merits the followingobservations:
(a) The magnitude of the investment exceeds Togo's self-financingcapability. Funds for two-thirds of the electric developmenthave already been secured. During the donors' round tablemeeting to be held in mid-1985 emphasis should be placed ondeveloping interest in the other suggested projects;
(b) The electric sector absorbs about four-fifths of the totalinvestment program, whereas current and projected electricitysupplies provide only 13% of Togo's useful energy require-ments. This large share of CEB can be justified in terms ofthe productivity of the modern sector which is powered byelectricity, by the savings in operating costs from hydroinvestment, and by the backlog of domestic investment thatdevelops quite naturally if a country is supplied by long-termimports. CEET's investments are mainly intended to reducelosses in the existing transmission and distribution networksand to develop a regional load center in Kara;
(c) The investment in forestry projects is indispensable forstrengthening projects that already have been initiated. Alarger investment program is unrealistic at this time, butefforts should be made to build up the absorptive capacity ofthe rural forest service and ODEF to manage the larger scaleinvestments that will have to be undertaken between 1989-1998(estimated at no less than US$40 million) to replenish thecountry's biomass resource base;
(d) Investments in conservation measures have a short paybackperiod. It can safely be assumed that the Togolese economy inthe medium term has an energy saving potential of 10% of con-sumption. In addition, the costs of imported oil could be sig-nificantly reduced by the installation of the storage facility.A realistic estimate allows the possibility of reducing the1988 import bill by US$2 million and reducing fuelwood con-sumption by 250,000 m relative to projected demand. Thereplacement cost of the fuelwood that could be saved by con-servation measures is at least US$7.5 million;
(e) The technical assistance and training projects have beenselected on the basis of their catalytic impact on thecountry's productive potential; they are geared to improve theknowledge and information upon which investment decisions aremade; and to set a scenario for facilitating private sectorinvolvement in the production and better use of energy. Themission considers that non-fungible, low cost funds can beobtained to advance these projects.
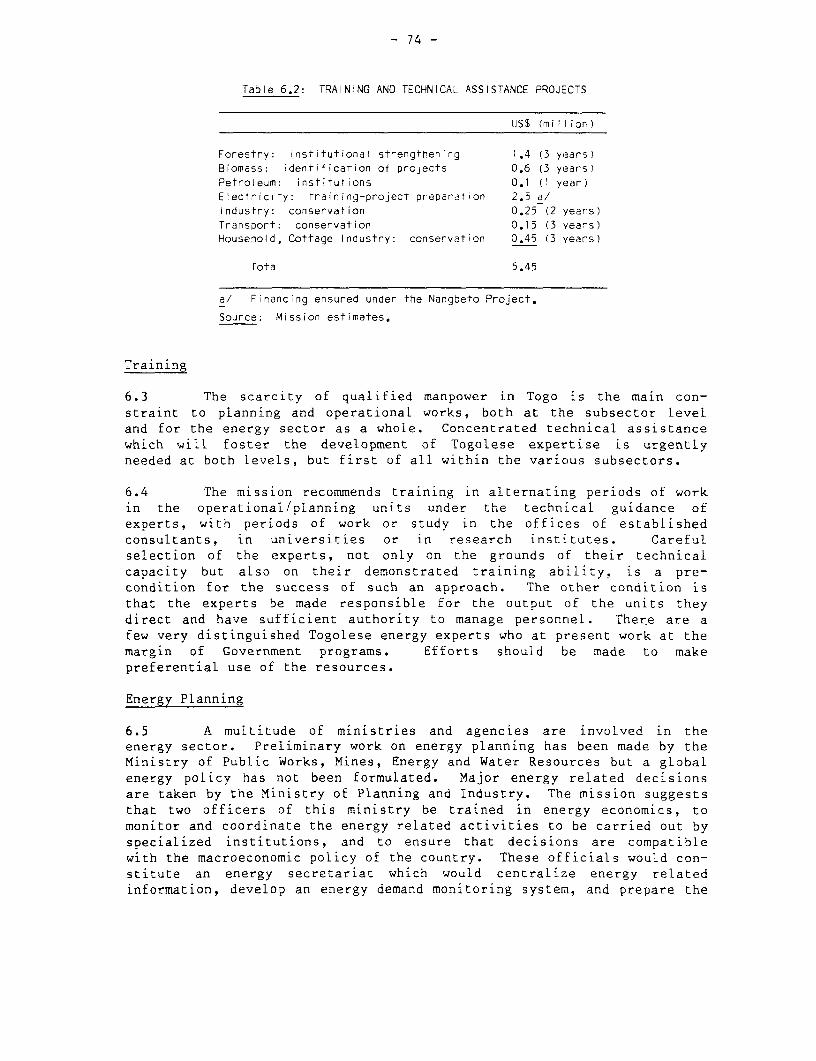
- 74 -
Table 6.2: TRAINING AND TECHNICAL ASSISTANCE PROJECTS
US$ (million)
Forestry: institutional strengthening 1.4 (3 years)
Biomass: identification of projects 0.6 (3 years)
Petroleum: institutions 0.1 (' year)Electricity: training-project preparation 2.5 a/
Industry: conservation 0.25 (2 years)
Transport: conservation 0.15 (3 years)Household, Cottage Industry: conservation 0.45 (3 years)
Total 5.45
a/ Financing ensured under the Nangbeto Project.
Source: Mission estimates.
Training
6.3 The scarcity of qualified manpower in Togo is the main con-
straint to planning and operational works, both at the subsector level
and for the energy sector as a whole. Concentrated technical assistance
which will foster the development of Togolese expertise is urgently
needed at both levels, but first of all within the various subsectors.
6.4 The mission recommends training in alternating periods of work
in the operational/planning units under the technical guidance of
experts, with periods of work or study in the offices of established
consultants, in universities or in research institutes. Careful
selection of the experts, not only on the grounds of their technical
capacity but also on their demonstrated training ability, is a pre-
condition for the success of such an approach. The other condition is
that the experts be made responsible for the output of the units they
direct and have sufficient authority to manage personnel. There are a
few very distinguished Togolese energy experts who at present work at the
margin of Government programs. Efforts should be made to make
preferential use of the resources.
Energy Planning
6.5 A multitude of ministries and agencies are involved in the
energy sector. Preliminary work on energy planning has been made by the
Ministry of Public Works, Mines, Energy and Water Resources but a global
energy policy has not been formulated. Major energy related decisions
are taken by the Ministry of Planning and Industry. The mission suggests
that two officers of this ministry be trained in energy economics, to
monitor and coordinate the energy related activities to be carried out by
specialized institutions, and to ensure that decisions are compatible
with the macroeconomic policy of the country. These officials would con-
stitute an energy secretariat which would centralize energy related
information, develop an energy demand monitoring system, and prepare the
- 75 -
necessary documentation for energy decisions at the level of the economiccabinet.
Forestry Institutions
6.6 Responsibility for forestry in Togo is divided between threeministries:
(a) The Ministry of Rural Development, which includes:- ODEF (Office pour le D6veloppement et l'Exploitation des
Resources Forestieres)- DPF (Direction des Productions Forestieres);
(b) The Ministry of Rural Management, which includes:- SFCE (Service des Forets, Chasses et Environment);
(c) The Ministry of Industries and State Corporations, whichadministers the non-technical activities of ODEF.
6.7 ODEF is the largest and most important forest management orga-nization. It has a strong commercial orientation with responsibility forthe production and marketing of lumber, poles, charcoal and fuelwood. Itis in part self-financing, as revenues from these activities contributeto the ODEF budget. Within these limits, ODEF recognizes the importanceof reforestation and silviculture; it is also the main supplier of seed-lings for reforestation projects throughout Togo.
6.8 DPF is responsible for community forestry, but has only a smallbudget and its activities are largely confined to the "Day of the Tree".SFCE is essentially a control organization, charged with the issuing ofhunting licenses and cutting permits and the supervision of harvestingoperations.
6.9 ODEF's priorities are the industrial projects and DPF does nothave the resources to follow through with a continuous program at thelocal level. The "Day of the Tree" is an excellent educational programand is useful in establishing an awareness of the importance of trees;however, it falls far short of the forestry initiatives required at thevillage level and does not provide for a continuous presence of forestrystaff in rural communities.
6.10 The delegation of forest management licensing and controLfunctions to SFCE, within a ministry other than the Ministry of RuralDevelopment, could lead to problems if the granting of cutting permits isnot coordinated with the cutting schedules implied by reforestation andsilvicultural programs, or if license fees are set at levels that areinconsistent with forest management objectives.
6.11 Peri-urban plantations and rural afforestation are comple-mentary. To achieve the objectives of meeting the country's energy needsof soil conservation and watershed management, a unified forestry policyhas to be implemented, and the two organizations, under the umbrella of
- 76 -
the Ministry of Rural Development, will have to cooperate. Because ODEFhas developed some managerial skills and its project at Tsevie (AFRI) hasreached an efficient operational level, the mission suggests thatspecific items be singled out for initial cooperation. The missionsuggests that consideration be given to the training of DPF staff at theAFRI project. It also suggests that ODEF consider expanding productionand dissemination of seedlings to rural areas, using commercial channelsof distribution.
6.12 The forestry organization in Togo should be strengthened togive much higher priority to energy production and forestry in ruralareas. Related forest policies should also be reviewed.
6.13 The forestry organizations in Togo have neglected forestry inagricultural areas and have emphasized industrial forestry programs.This trend should be reversed by giving a higher priority to forestry inagricultural areas and by increasing the number of professionals andtechnicians in agri-forestry programs. In particular, the number ofextension workers at the community level should be increased to ensure aneffective presence in rural areas. An initial target of ten new posi-tions is suggested.
6.14 ODEF's peri-urban plantations program (extension of ongoingprojects and new ones) creates an immediate need for staff to assist inthe selection of land for plantations, in the choice of species, and tostrengthen the present capabilities in plantation management, silvi-culture and harvesting.
6.15 Initially, one will have to rely on staff trained abroad.However, steps should be taken to initiate a national program of forestrytraining and apprenticeship at established operation such as at thenursery and plantations of Project AFRI. The professional staff of ODEFshould be increased by seven persons trained in the following fields:land inventory, 2; nursery management, 2; silviculture, 2; charcoalproduction, 1.
6.16 Assuming a combination of technical assistance (3 experts) andlocal professionals, the cost of this project over three-years, isestimated as follows:
US$ million
Local salaries, operating funds 0.05Technical assistance 1.35Policy study 0.1
1.4
6.17 The strenthening of the forestry organizations should beaccompanied by a review of relevant policies. A prime objective of thepolicies should be to reverse the present trend towards deforestation andsoil degradation, especially in northern and central Togo where the risks

- 77 -
are greatest. Policies should provide for procedures to set land asidefor reforestation, and they should specify in quantitative terms the areaof forestland that must be retained or reforested in agriculturaldevelopments. Provision should be made for a mandatory rating of landcapability to allow proper land use planning.
Biomass and Non-conventional Renewable Energy Resources:Institutional Aspects
6.18 As a complementary activity to agricultural development andreforestation, the energy potential of agricultural residues and otherrenewable energy resources should be evaluated. The mission recommendsthat a study and experimentation center for agricultural residues be
established within the Ministry of Rural Organization (Ministere del'Amenagement Rural) and its Direction des Etudes P6dologiques et de
1'Ecologie G6nerale, or in the IRAT.
6.19 This center would be responsible for first estabLishing aresidue balance for each of the major agricultural areas of the country,and then would analyze the technical, economic and social aspects ofenergy conversion projects. It is suggested that under a Director, twodivisions be established: (a) a rural division, which would analyze theenergy potential in rural areas and energy needs in agriculture, house-holds and cottage industry; (b) an industrial and urban division, whichwould evaluate the energy potential of agroindustrial residues and urbansolid waste products and assess alternative uses.
6.20 In the initial set-up, the center should be staffed with anagricultural engineer, an industrial engineer familiar with biomassenergy conversion processes, an economist/financial analyst, and a socio-logist. It is suggested that for the first three years an expatriateexpert be provided to set up and direct the center, and to train thelocal staff. The cost of this project is estimated as follows:
US$ millions
Local salaries, operating funds 0.07Technical assistance (1 expert) 0.30Pilot projects: equipment 0.20
Total 0.57
Petroleum Institutions
6.21 The Ministry of Public Works, Mines and Energy oversees theDirection G6nerale de Mines et Geologie, which follows up on petroleumexploration activities in the offshore area. The latter are conducted bya private international group. The refinery STH (Societe Togolaise desHydrocarbures) is under the responsibility of the Ministry of Industryand Public Enterprises and the management of the new petroleum terminal(comprising the petroleum transport and storage facilities of therefinery) has been contracted with Shell-Togo. Oil is imported by five

- 78 -
private enterprises - Mobil, British Petroleum, Shell, Caltex andTotal. They integrate the Groupement Professionnel de Petrole (GPP),which handles relations with the Government. They also own equal sharesof the storage facility STE (Societe Togolaise d'Entreposage). Petroleumprices are set by the Ministry of Commerce and Transport on the basis ofthe cost records provided by GPP. This Ministry also is responsible formonitoring the stabilization fund.
6.22 Once the results of the offshore exploration campaign areavailable, technical assistance programs for the Direction GCnerale deMines et G6ologie can be defined in terms of training requirements,research facilities and legal assistance. UNDP technical assistanceproject will provide this unit with a small laboratory and some trainingfor professionals.
6.23 The issues in the petroleum procurement area require thefollowing assistance: (a) training to ensure efficient management of thepetroleum terminal; (b) training for the Ministry of Commerce andTransport to exercise the supervisory role it is assigned; (c) long-termtraining for independent decision-making on procurement. It is suggestedthat assistance be sought from private oil companies established in Togoand complemented by training in the companies' offshore headquarters,alternated with a master's program in a university.
6.24 For the short term, the mission suggests that technical assis-tance be provided to set up a computerized system to monitor oil imports,landed costs and taxes at the Ministry of Commerce and Transport. Such aprogram can be set up in six months for about US$75,000, consisting ofUS$70,000 in technical assistance, and US$5,000 for a microcomputer.
Electricity
6.25 Two institutions are responsible for electricity supply inTogo; the bi-national power company (CEB), under the supervision of aHigh Commission made up of representatives of Togo and Benin, and anational public utility (CEET), under the supervision of an adminis-trative council made up of representatives of several ministries. TheMinistry of Public Works, Mines, Energy and Water has supervisory res-ponsibility for technical issues and the Ministry of Public Enterpriseshas financial control authority. Under the Bank's Technical EngineeringCredit for the preparation of the Nangbeto project, considerable tech-nicaL assistance is being provided for administrative, financial, andtechnical strengthening of the sector.
The Communaute Electrique du Benin (CEB)
6.26 CEB in principle has a monopoly on generation (including powerimports and exports) and transmission in Togo and Benin, as well asextensive regulatory power over sector activities outside its monopoly,such as the distribution and licensing of self-generation. In practice,implementation of the Treaty's provisions has been only partial. TheNangbeto hydro project will be CEB's first entry into the field of power

- 79 -
generation and the company is also supervising the study of the WestAfrican interconnection that wouLd link the systems of Togo and Beninwith those of Nigeria and Ghana.
6.27 CEB's organization is geared to its present functions as a bulktransmission company. Changes are required to prepare the company toimplement projects such as central load dispatch, Nangbeto, the WestAfrican interconnection, and to further identify the resource base ofTogo and Benin. Furthermore, mechanisms to ensure continuous coor-dination of the activities of CEB, CEET, and SBEE are urgently required.Training should be systematically developed as a function of anticipatedcorporate developments.
6.28 The financial position of CEB is relatively favorable.Imported power from Ghana is sold with an effective 50% markup -- enoughto cover the cost of operating a small asset base and to show asatisfactory financial return. Accounting practices need continuingattention and receivables (6-7 months of revenues) must be reduced.
6.29 CEB has training capabilities that should be strengthened. Themission recommends that an assessment be made of the training needs ofthe national utilities of Togo and Benin in energy planning, operation,maintenance, financial and administrative management, and that a trainingprogram to meet these requirements be set up.
Compagnie Energie Electrique de Togo (CEET)
6.30 CEET was formed in 1963 as a company with limited liability,and its statute makes an allowance for the State to transfer up to 30% ofthe shares to public or private Togolese entities. Its purpose isdefined as the generation, transmission and distribution of electricalenergy in Togo.
6.31 The internal organization of CEET consists of a task divisionfor technical directorates and corresponds to the actual mode of opera-tion of (a) the coastal zone, where the emphasis in on distribution, withthe thermal plant at Lome serving as standby capacity, and (b) isolatedcenters. The operation of isolated load centers inland involves genera-tion, primary and secondary distribution. With the takeover of opera-tional responsibility for CTL and the expansion of the transmission net-work, CEET's organization should be restructured along functional lines.
6.32 CEET's financial situation is poor. According to an externalaudit made for FY81/82, the financial status cannot be evaluated becauseof unreliable accounts. CEET estimated losses at about FCFA 2,200 mil-lion for FY81/82. The most important problem of CEET's finances is thehigh backlog in receivables. As of February 1983, unpaid bills amountedto about six month's revenues from energy sales, of which 86% was owed bythe public sector. CEET's management has proposed a number of measuresto restore the company's financial position which the mission endorses,including settling the accounts with the state, and introducing modernmanagement controls and instruments. The mission further recommends
- 80 -
pursuing efforts to rationalize the company's staffing by strengtheningthe number and expertise of the professional and technical personnel.
Centrale Thermique de Lome (CTL)
6.33 CTL officially is a subsidiary of the Societe Nationale deSiderurgie (SNS) and CTL's 56 employees are on the SNS payroll. TheTogolese authorities have decided to transfer operational responsibilityto CEET. Because of the curtailment of imported power, the CTL'scapacity is urgently needed. New tariff agreements will have to bereached within CEB regarding the rates applicable to thermal energy soldto CEB. In the case of CTL, for which CEET only has operating res-ponsibility, the rate should include an allowance for depreciation and afair return on the net asset value of the Government's investment. Thecorresponding revenue component could either go to the Treasury (thuscompensating the Government in part for the debt service) or be usedwithin CEET to strengthen the sector.
Energy Conservation
6.34 The current institutional framework is not adequate either tomonitor energy consumption or to assist consumers in improving theirenergy performance. The mission therefore suggests that a data collec-tion system be established within the Ministry of Planning and Industryto survey energy consumption in the various subsectors, initially withemphasis on the major industrial energy users. This Ministry shouldmonitor implementation of energy conservation programs and projects to beexecuted on specialized agencies and serve as a liaison for technicalassistance provided for the specific areas.
IndustriaL Energy Conservation
6.35 The mission recommends (Chapter II) energy audits in majorindustries and seminars for increasing awareness on energy saving oppor-tunities. The total cost of such a program over a two-year period isestimated at US$250,000.
Transport Sector
6.36 Technical assistance is already being provided under a Bankproject to the Ministry of Commerce and Transport, which has contributedsubstantially to identifying the issues of the transport sector. How-ever, the mission believes that insufficient efforts have been made intraining Togolese counterparts in the technical and economic aspectsbeing studied. The mission recommends that technical assistance becontinued for implementing the recommendations set out in Chapter II, andfor training a small group of nationals in energy conservation opportu-nities in this sector.

- 81 -
Households, Cottage Industry, and Other Sectors
6.37 The mission recommends that financial assistance be provided tothe Solar Energy Laboratory, converting it into an independent research,testing and dissemination facility for the improvement of the energyefficiency of the fuelwood chain, and for promoting the introduction ofsolar water heaters. This center would operate in liaison with women'sorganizations, and the forestry institutions. This center would also bemade responsible for carrying out a survey of the artisanal sector andsupervising technical assistance to improve current processing techno-logy. The cost of such a program for the initial two years is estimatedas follows:
Component Cost
(US$ thousands)
Stove component:Technical Assistance 50Solar Energy Laboratory 100
Charcoal Kilns:Technical Assistance 20Solar Energy Laboratory 50
Cottage Industry:Survey 75Solar Energy Laboratory 50
Solar Water Heaters:Installation in Hotels & Hospitals 100
Total 445
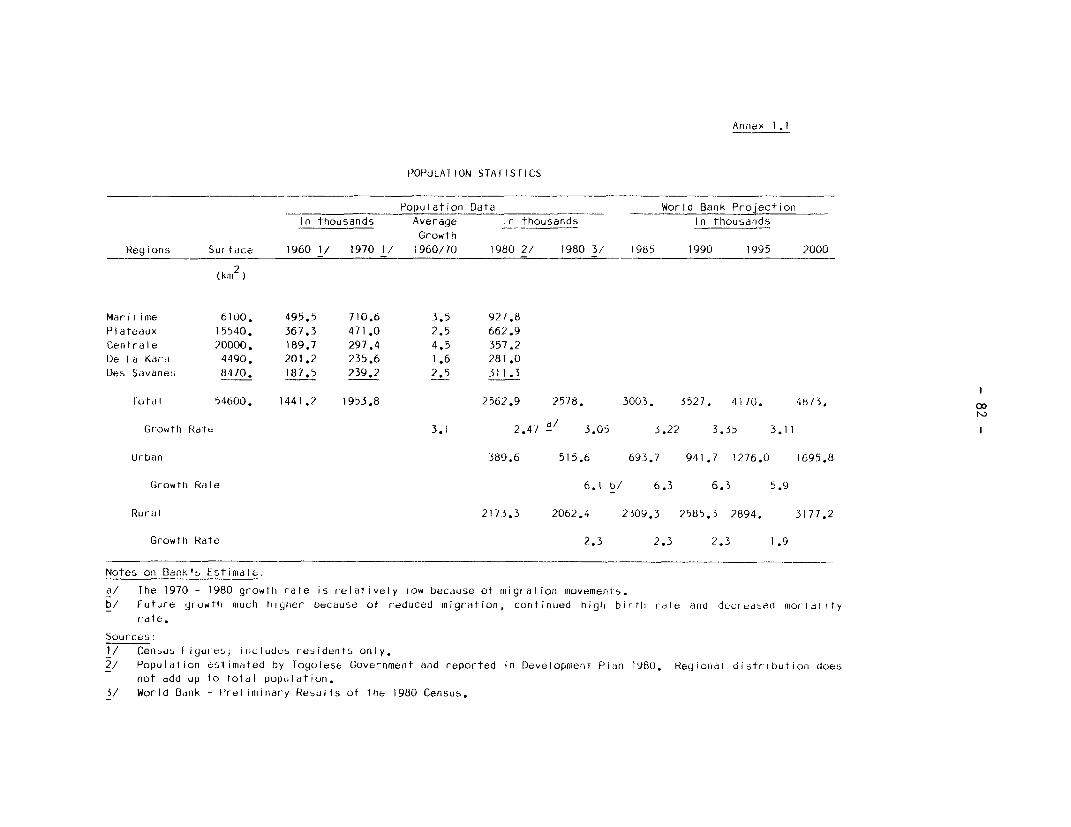
Annlex 1.1
POPULAHION STAtIStICS
Population Data World Bank ProjectionIn thousands Average In thousands In thousands
GrowthRegions Surface 1960 1/ 1970 1/ 1960/70 1980 2/ 1980 3/ 1985 1990 1995 2000
(kiii2 )
Maritime 61u0. 495.5 710.6 3.5 92/.8PlIdtedux 15540. 367.3 471.0 2.5 662.9Centrale 20000. 189.7 297.4 4.5 357.2De [I Kara 4490. 201.2 235.6 1.6 281.0Des Savanes 8470. 187.5 239.2 2.5 311.3
total 54600. 1441.2 1953.8 2562.9 2578. 3003. 3527. 4170. 48/3. 00
Growth) Rate 3.1 2.47 a/ 3.05 3.22 3.35 3.11
Urban 389.6 515.6 693.7 941.7 1276.0 1695.8
Grfowth Rate 6.1 b/ 6.3 6.3 5.9
Rur-al 2173.3 2062.4 2309.3 2585.3 2894. 3177.2
Growth Rate 2.3 2.3 2.3 1.9
Noles on Bank's Estimate:
d/ The 1970 - 1980 growlh rate is relatively low because of migratiotn movements.b/ Future growth much higtier because of reduced migration, continued high birti rate aiid decredsed mortal ity
r-ate.
Sources:
1/ Census figuies; includes residents only.2/ Population estimated by Togolese Government and reported in Development Plan 1980. Regional distribution does
not add up to totdl population.3/ World Bank - Preliminlary Results of the 1980 Census.

- 83 -
Annex 1.2
PROJECTED POPULATION GROWTH RATES(in thousands and % growth rates)
1985 1990 1995 2000
Total population: 3,003 3,527 4,170 4,873Urban 694 942 1,276 1,969Rural 2,309 2,585 2,894 3,177
Growth rates(%)Total population 3.05 3.22 3.35 3.1Urban 6.1 6.3 6.3 5.9Rural 2.3 2.3 2.3 2.3
Source: United Nations - World Bank
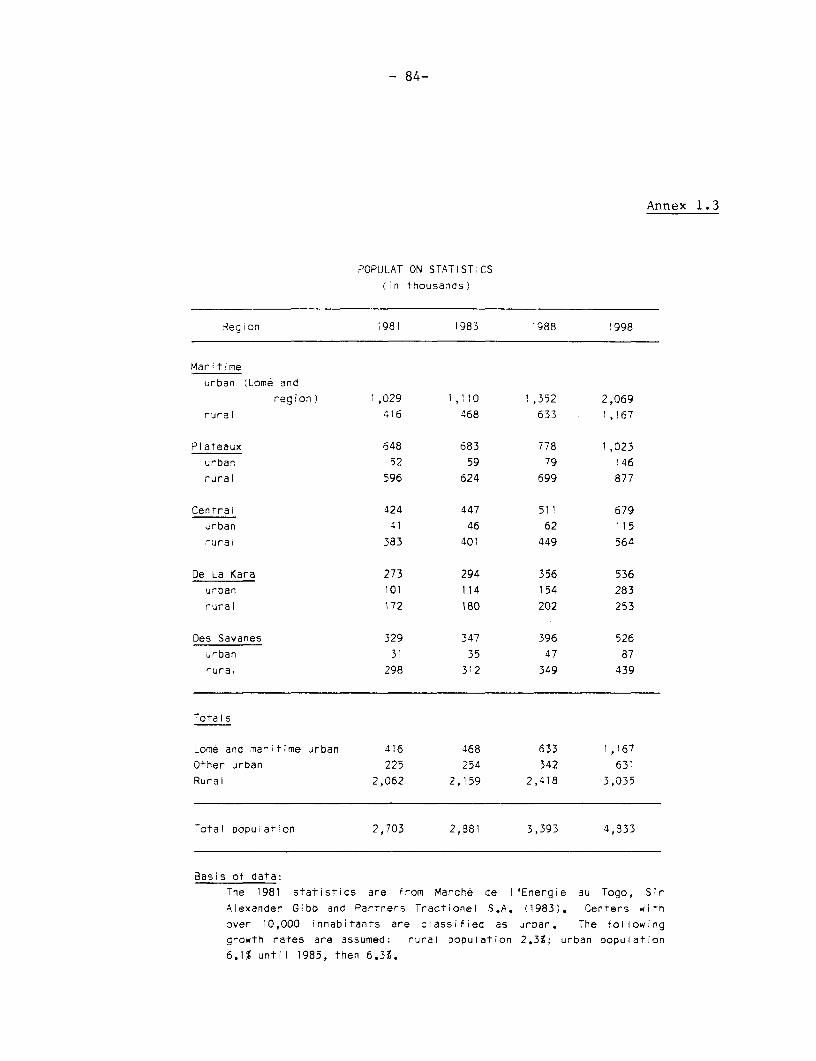
- 84-
Annex 1. 3
POPULATION STATISTICS
(in thousands)
Region i981 1983 '988 1998
Maritime
urban (Lome and
region) 1,029 1,110 1,352 2,069
rural 416 468 633 1,167
Plateaux 648 683 778 1,023
urban 52 59 79 146
rural 596 624 699 877
Centrai 424 447 511 679
urban 41 46 62 115
rural 383 401 449 564
De La Kara 273 294 356 536
urban 101 114 154 283
rural 172 180 202 253
Des Savanes 329 347 396 526
urban 31 35 47 87
rural 298 312 349 439
7ota l s
Lome and maritime urban 416 468 633 1,167
Other urban 225 254 342 631
Rural 2,062 2,159 2,418 3,035
Total population 2,703 2,381 3,393 4,833
Basis of data:
The 1981 statistics are from Marche de l'Energie au Togo, Sir
Alexander Gibb and Partners Tractionel S.A. (1983). Centers with
over 10,000 inhabitants are classified as urban. The tol lowing
growth rates are assumed: rural Dopulation 2.3%; urban population
6.1% until 1985, then 6.3Z.
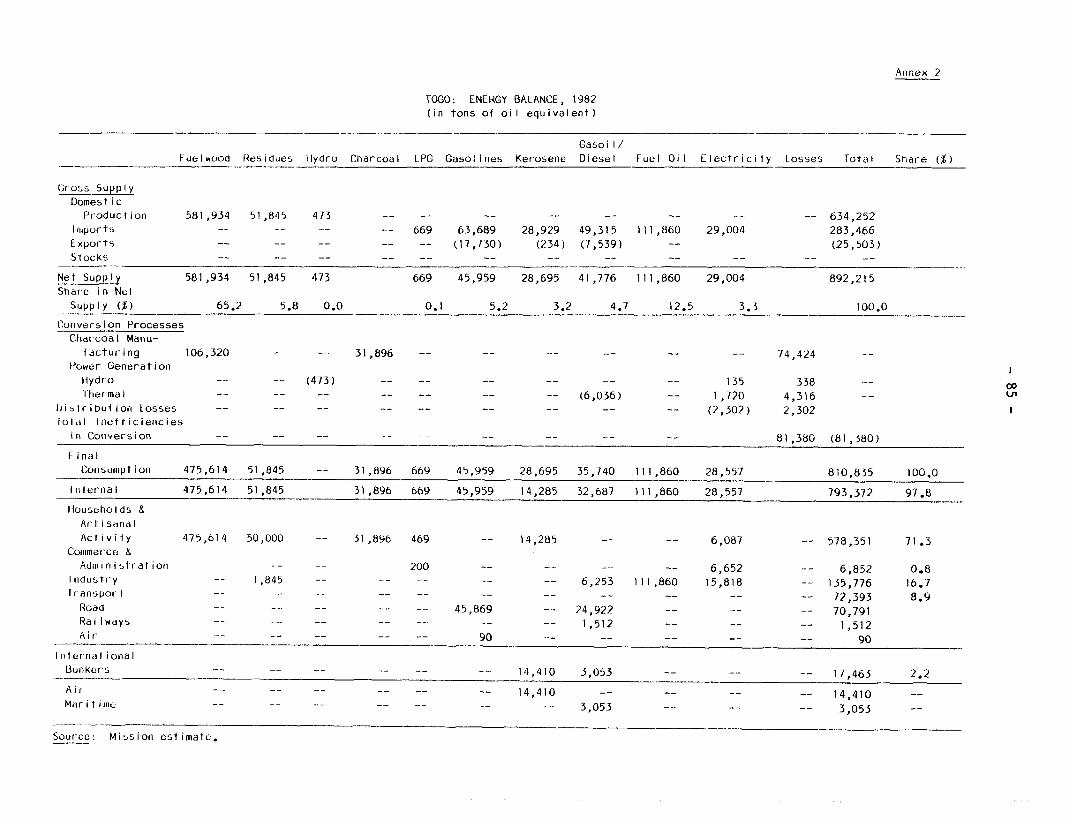
Annex 2
TOGO: ENERGY BALANCE, 1982
(in tons of oil equivalent)
Gasoil/
Fuelwood Residues Hlydro Charcoal LPG Gasolines Kerosene Diesel Fuel Oil Electricity Losses total Share (%)
Gross Supply
DomesticProduclion 581,934 51,845 473 - -- -- -- -- -- 634,252
liimports -- -- -- 669 63,689 28,929 49,315 111,860 29,004 283,466
Exports -- __ __ __ __ (17,730) (234) (7,539) __ (25,503)
Stocks -
Net Supply 581,934 51,845 473 669 45,959 28,695 41,776 111,860 29,004 892,215
Share in Ne
Supply (X) 65.2 5.8 0.0 0.1 5.2 3.2 4.7 12.5 3.3 100.0
Conversion ProcessesCharcoal Manu-
facturing 106,320 -- -- 31,896 -- -- -- -- -- -- 74,424 --
tlower Generationtiydro -- - (473) -- -- -- -- -- -- 135 338 -c
Thermdl -- -- -- -- -- (6,036) -- 1,720 4,316 _- U'
l)i Iributi on Losses -- -- -- -- -- -- -- -- -- (2,302) 2,302
iold I Inefticienciesin Conversion -- -- -- - - - - -- -- 81,380 (81,380)
FinalConsuliiptioln 475,614 51,845 -- 31,896 669 45,959 28,695 35,740 111,860 28,557 810,835 100.0
Internal 475,614 51,845 31,896 669 45,959 14,285 32,687 111,860 28,557 793,372 97.8
llouseholds sArtisanal
Activity 475,614 50,000 - 31,896 469 -- 14,285 -- -- 6,087 -- 578,351 71.3
Commer-ce &Admiinis1ration 200 -- 6,652 -- 6,852 0.8
Industry -- 1,845 -- -- -- -- 6,253 111,860 15,818 -- 135,776 16.7
Iransport -- -- -- -- -- -- -- 72,393 8.9
Road -- -- 45,869 -- 24,922 -- -- -- 70,791
RailwdyS -- -- -- -- -- -- 1,512 1-- -- ,512
Air -- 90 90
InternationalBunker-s -- -- -- -- -- 14,410 3,053 -- -- -- 17,463 2.2
Ai- -- -- -- -- -- 14,410 -- -- -- 14,410 --
Marnthud -- -t -I f i- l~ e- 3,053 3,053
Sour-ce: Mission estimate.
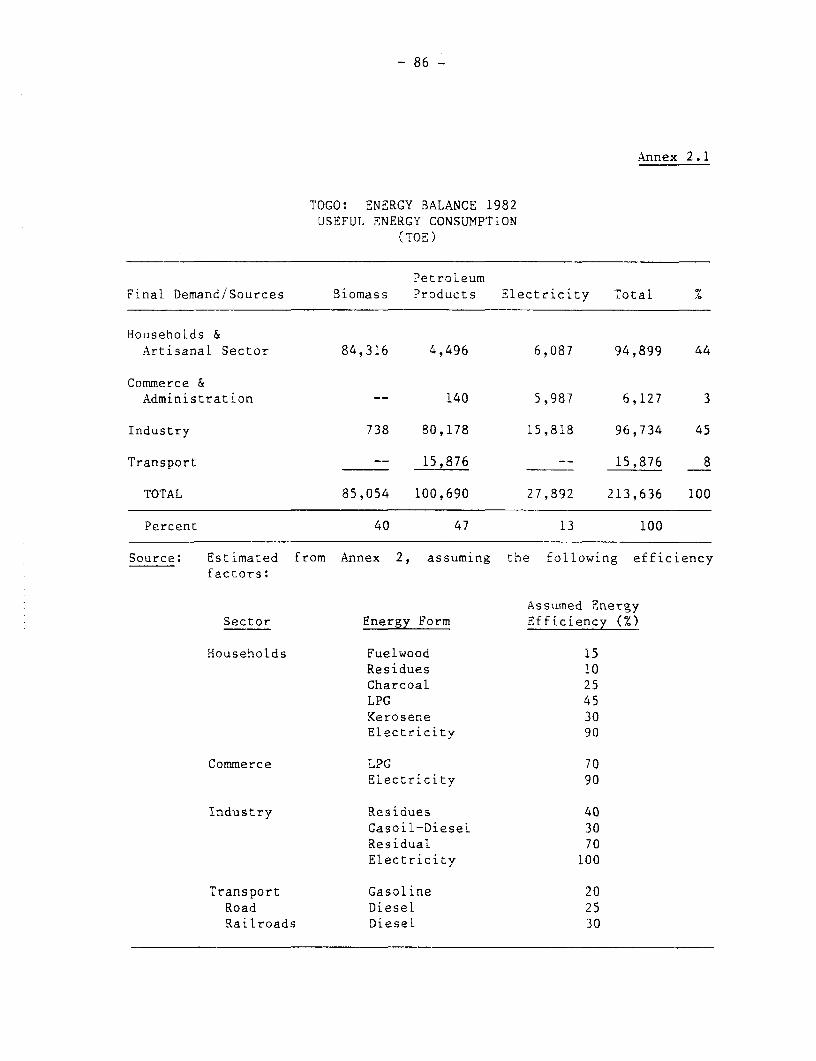
- 86 -
Annex 2.1
TOGO: ENERGY BALANCE 1982USEFUL ENERGY CONSUMPTION
(TOE)
PetroleumFinal Demand/Sources Biomass Products Electricity TotaL x
Households &Artisanal Sector 84,316 4,496 6,087 94,899 44
Commerce &Administration -- 140 5,987 6,127 3
Industry 738 80,178 15,818 96,734 45
Transport -- 15,876 -- 15,876 8
TOTAL 85,054 100,690 27,892 213,636 100
Percent 40 47 13 100
Source: Estimated from Annex 2, assuming the following efficiencyfactors:
Assumed EnergySector Energy Form Efficiency (%)
Households Fuelwood 15Residues 10Charcoal 25LPG 45Kerosene 30ELectricity 90
Commerce LPG 70Electricity 90
Industry Residues 40Gasoil-Diesel 30Residual 70Electricity 100
Transport Gasoline 20Road Diesel 25Railroads Diesel 30
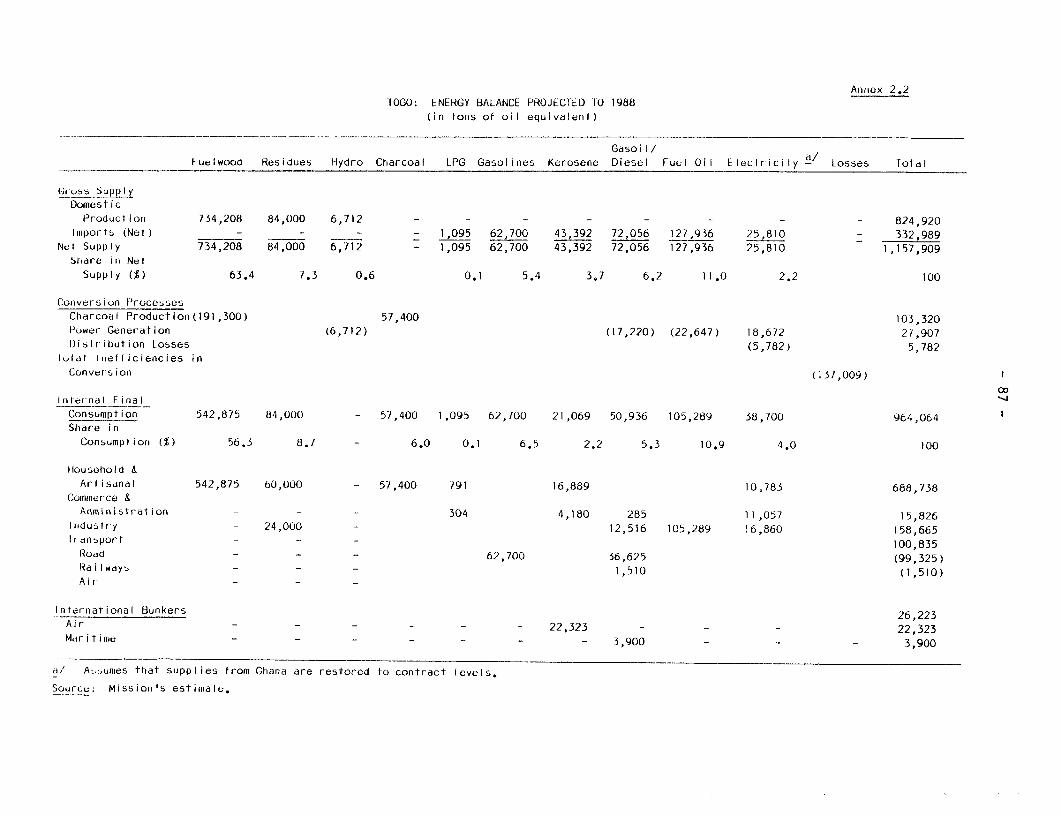
Annex 2.2IOGO: ENERGY BALANCE PROJECTED TO 1988
(in tons of oil equivalent)
Gasoil/ Fuelwood Residues Hydro Charcoal LPG Gasolines Kerosene Diesel Fuel Oil Electricity - Losses Tolal
GIrSb Supp) I y
DomesticProduction 734,208 84,000 6,712 - - - - - 824,920
Imports (Net) - - - - 1,095 62,700 43,392 72,056 127,936 25,810 - 332,989Nel Supply 734,208 84,000 6,712 - 1,095 62,700 43,392 72,056 127,936 25,810 1,157,909Slhare in Net
Supply (%) 63.4 7.3 0.6 0.1 5.4 3.7 6.2 11.0 2.2 100
Cujiversion ProcessesChdrcoal Production(191,300) 57,400 103,320Pvwer Generation (6,712) (17,220) (22,647) 18,672 2/,907D)istribulion Losses (5,782) 5,782
lulaI Iniefficiencies inConver'sion (137,009)
00liI)ernel FinalConsumption 542,875 84,000 - 57,400 1,095 62,700 21,069 50,936 105,289 38,700 964,064 1Share inConsumption (%) 56.3 8.7 - 6.0 0.1 6.5 2.2 5.3 10.9 4.0 100
Household &Artisdnal 542,875 60,OUO - 57,400 791 16,889 10,783 688,738
Comrmerce &Administration - - - 304 4,180 285 11,057 15,826
I[idustry - 24,000 - 12,516 105,289 16,860 158,665Irdnsport - - - 100,835Road - - - 62,700 36,625 (99,325)RdilWdys - - - 1,510 (1,510)Air - - -
International Bunkers 26,223Air - - - - - - 22,323 - - 22,323MariIi ime - - -- - 3,900 3,900
a' A,-umes that supplies from Ghana are restored to contract levels.
Source: Mission's estimate.

Annex 2.3
lOGO; ENERGY BALANCE PROJECTED TO 1998
(in tons of oil equivalent)
Gasoil/
Fuelwood Residues Hydro Charcoal lPG Gasolines Kerosene Diesel Fuel Oil Electricity - losses Total
Gross SupplyDomestic
Production 1,223,650 139,000 6,796 - - - - - - - 1,369,446
luimports (Net) - - - 2,433 106,730 64,118 141,887 224,165 33,104 - 572,437
Net Supply 1,223,650 139,000 6,796 - 2,433 106,730 64,118 141,887 224,165 33,104 1,941,883
Share in Net
Supply (%) 63.0 7.2 0.3 0.1 5.5 3.3 7.3 11.5 1.7 100.0
Conversian ProcessesCharcoal Production 535,300 160,600 374,700
Power Generation 6,796) (44,940) (76,890) 43,345 85,281
Distribution losses (8,409)
lotal Inefficiencies inConversion (468,390) oo
I-inal Consumption 1,473,493
l
Inter-nal Final
Consumption 688,350 139,000 160,600 2,433 106,730 27,758 90,597 147,275 68,040 1,430,783
Share in
Consurnption (Z) 48.1 9.7 11.2 0.2 7.5 1.9 6.3 i 03 4.8 iO0.0
Househlold &Cottage Industry 688,350 100,000 - 160,600 1,825 - 21,905 21,212 993,892
Commerce &Administr-ation 608 - 5,853 460 22,140 29,661
Industry 39,000 24,612 147,275 24,088 234,975Transpor-i - - 172,255
Road - - 106,730 60,985 167,715
Railways - - 4,540 4,540
ill1ernational Bunkers 42,710
Air - - 36,360
Maritime - - 6,350
a/ Assumes that imported electricity from Ghana are at least equal to the VRA-CEB contract levels.
Source: Mission's estimate.
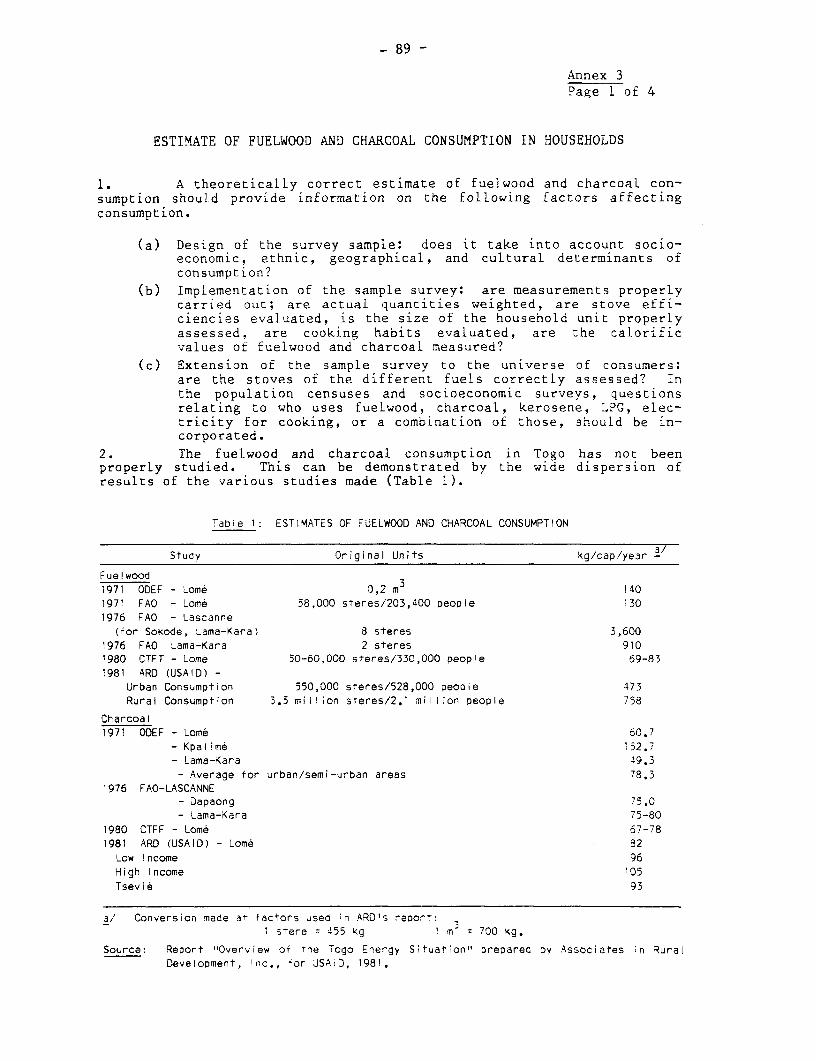
- 89 -
Annex 3Page 1 of 4
ESTIMATE OF FUELWOOD AND CHARCOAL CONSUMPTION IN HOUSEHOLDS
1. A theoretically correct estimate of fuelwood and charcoal con-sumption should provide information on the following factors affectingconsumption.
(a) Design of the survey sample: does it take into account socio-economic, ethnic, geographical, and cultural determinants ofconsumption?
(b) Implementation of the sample survey: are measurements properlycarried out; are actual quantities weighted, are stove effi-ciencies evaluated, is the size of the household unit properlyassessed, are cooking habits evaluated, are the calorificvalues of fuelwood and charcoal measured?
(c) Extension of the sample survey to the universe of consumers:are the stoves of the different fuels correctly assessed? Inthe population censuses and socioeconomic surveys, questionsrelating to who uses fuelwood, charcoal, kerosene, LPG, elec-tricity for cooking, or a combination of those, should be in-corporated.
2. The fuelwood and charcoal consumption in Togo has not beenproperly studied. This can be demonstrated by the wide dispersion ofresults of the various studies made (Table 1).
Table 1: ESTIMATES OF FUELWOOD AND CHARCOAL CONSUMPTION
Study Original Units kg/cap/year -
Fuelwood1971 ODEF - Lome 0,2 m3 140197' FAO - Lome 58,000 steres/203,400 people 1301976 FAO - Lascanne
(for Sokode, Lama-Kara) 8 steres 3,600i976 FAO Lama-Kara 2 steres 9101980 CTFT - Lome 50-60,000 steres/330,000 people 69-831981 ARD (USAID) -
Urban Consumption 550,000 steres/528,000 peooie 473Rural Consumption 3.5 million steres/2.1 million people 758
Charcoal1971 ODEF - Lome 60.7
- Kpalim6 -i2.7
- Lama-Kara -19.3
- Average for urban/semi-urban areas 78.31976 FAO-LASCANNE
- Dapaong 75.0
- Lama-Kara 75-801980 CTFF - Lome 67-78
1981 ARD (USAID) - Lome 32
Low income 96High Income 105Tsevie 93
a/ Conversion made at factors used n ARD's reoort:1 stere = 455 kg m 700 kg.
Source: Report "Overview of -he Togo i-nergy Situation" prepared bv Associates :n RuraiDeveloDment, Enc., tor JSAiD, 1981.
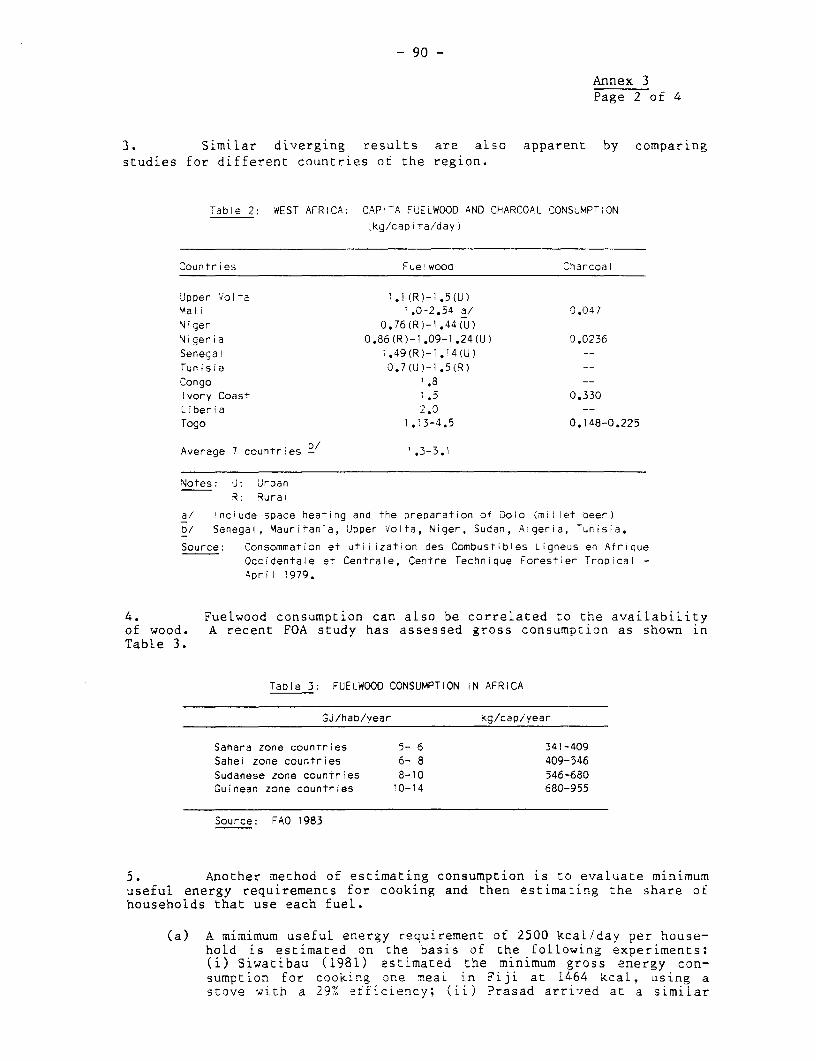
- 90 -
Annex 3Page 2 of 4
3. Similar diverging results are also apparent by comparingstudies for different countries of the region.
Table 2: WEST AFRICA: CAPITA FUELWOOD AND CHARCOAL CONSUMPTION
(kg/caoita/day)
Countries Fuelwood Charcoal
iJpper Volta 1.*i(R)-1.5(U)Mali 1.0-2.54 a/ 0.047Niger 0.76(R)-1.44(U)Nigeria 0.86(R)-1.09-1.24(U) 0.0236Senegal 1.49(R)-I.14(U) --
Tunisia 0.7(U)-I.5(R) --
Congo '.8 --
Ivory Coast 1,5 0.330Liberia 2.0 --
Togo 1.13-4.5 0.148-0.225
Average 7 countries b/ 1.3-3.1
Notes: U: UrbanR: Rural
a/ inciude space heating and the DreDaration of 3010 (millet beer)b/ Senegal, Mauritania, Upper Volta, Niger, Sudan, Algeria, Tunisia.
Source: Consommation et utilization des Combustibles Ligneus en AfriqueOccidentale eT Centrale, Centre Technique Forestier Tropical -April 1979.
4. Fuelwood consumption can also be correlated to the availabilityof wood. A recent FOA study has assessed gross consumption as shown inTable 3.
Table 3: FUELWOOD CONSUMPTION IN AFRICA
GJ/hab/year kg/cap/year
Sahara zone countries 5- 6 341-409Sahel zone countries 6- 8 409-546Sudanese zone countries 8-10 546-680Guinean zone countries 10-14 680-955
Source: FAO 1983
5. Another method of estimating consumption is to evaluate minimumuseful energy requirements for cooking and then estimating the share ofhouseholds that use each fuel.
(a) A mimimum usefuL energy requirement of 2500 kcal!day per house-hold is estimated on the basis of the folLowing experiments:(i) Siwatibau (1981) estimated the minimum gross energy con-sumption for cooking one meal in Fiji at 1464 kcal, using ascove with a 29'. efficiency; (ii) Prasad arrived at a similar
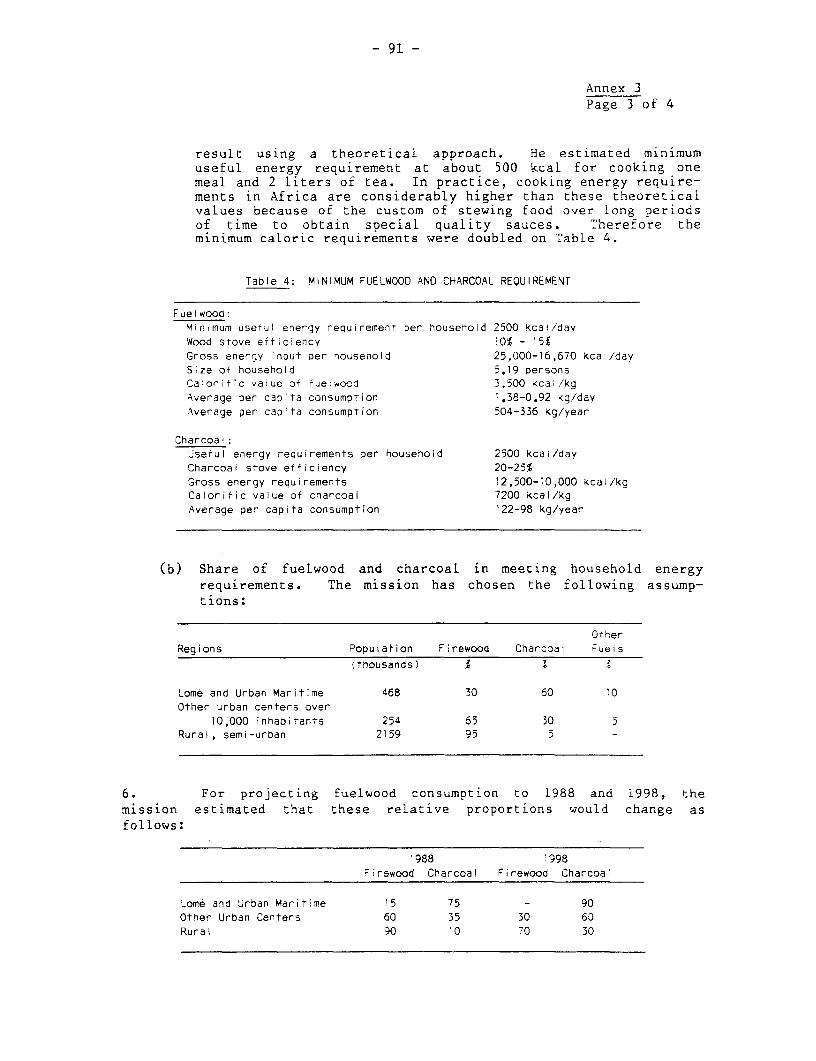
- 91 -
Annex 3Page 3 of 4
result using a theoretical approach. He estimated minimumuseful energy requirement at about 500 kcal for cooking onemeal and 2 liters of tea. In practice, cooking energy require-ments in Africa are considerably higher than these theoreticalvalues because of the custom of stewing food over long periodsof time to obtain special quality sauces. Therefore theminimum caloric requirements were doubled on Table 4.
Table 4: MINIMUM FUELWOOD AND CHARCOAL REQUIREMENT
Fuelwood:Minimum useful energy requirement per household 2500 kcal/davWood stove efficiency 1i0 - 15ZGross energy inout Der nousehold 25,000-16,670 kcal/daySize ot household 5.19 personsCalorific vaiue of iuelwood 3,500 K<cal/kgAverage per capita consumption 1.38-0.92 vg/dayAverage per caqita consumption 504-336 kg/year
Charcoal:Useful energy requirements per household 2500 kcal/dayCharcoal stove efficiency 20-25%Gross energy requirements 12,500-10,000 kcai/kgCalorific value of charcoal 7200 kcal/kgAverage per capita consumption 122-98 kg/year
(b) Share of fuelwood and charcoaL in meeting household energyrequirements. The mission has chosen the following assump-tions:
OtherRegions Population Firewood Charcoal Fuels
(thousands) %
Lome and Urban Maritime 468 30 60 10Other urban centers over
10,000 inhaoitants 254 65 30 5Rural, semi-urban 2159 95 5 -
6. For projecting fuelwood consumption to 1988 and 1998, themission estimated that these relative proportions would change asfollows:
'988 1998virewood Charcoal Firewooa Charcoal
Lome and Urban Maritime 15 75 - 90Other Urban Centers 60 35 30 60Rural 90 'O 70 30
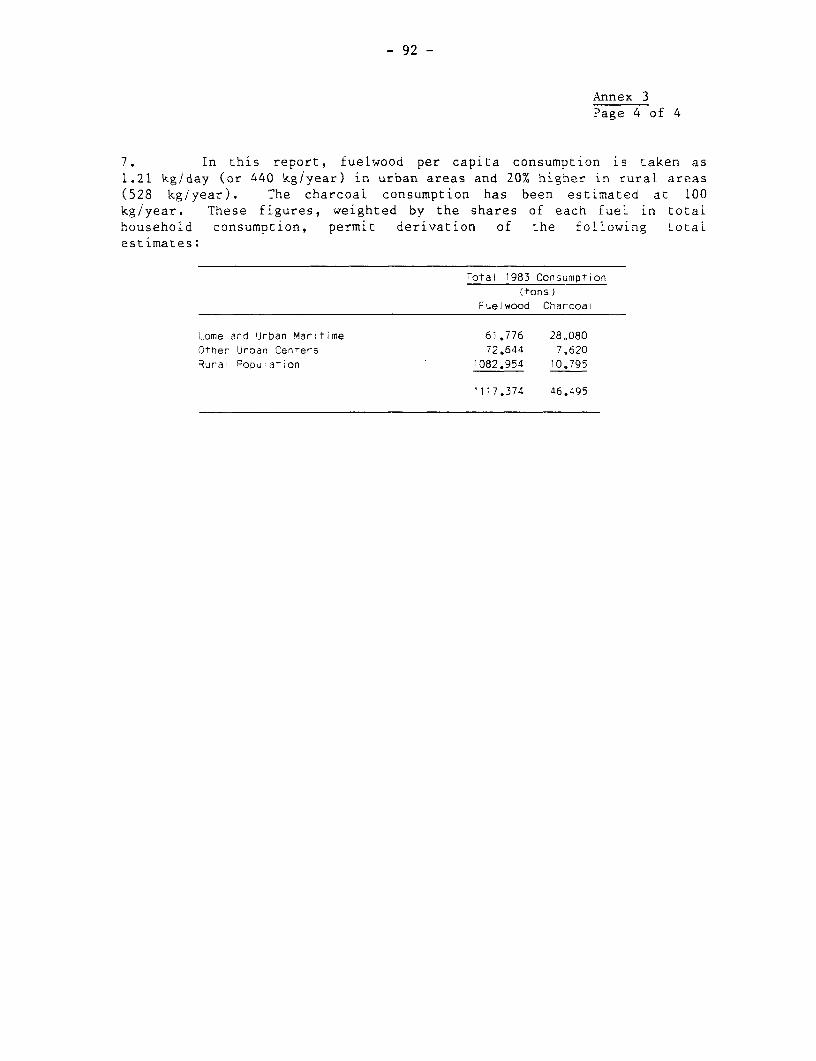
- 92 -
Annex 3Page 4 of 4
7. In this report, fuelwood per capita consumption is taken as1.21 kg/day (or 440 kg/year) in urban areas and 20% higher in rural areas(528 kg/year). The charcoal consumption has been estimated at 100kg/year. These figures, weighted by the shares of each fuel in totalhousehold consumption, permit derivation of the following tocaiestimates:
Total 1983 Consumption
(tons)Fuelwood Charcoa!
Lome and Urban Mar;7time 61.776 28,,080
Other Urban Centers 72.644 7,620
Rural Popuiation 1082.954 10,,795
'117.374 46.495
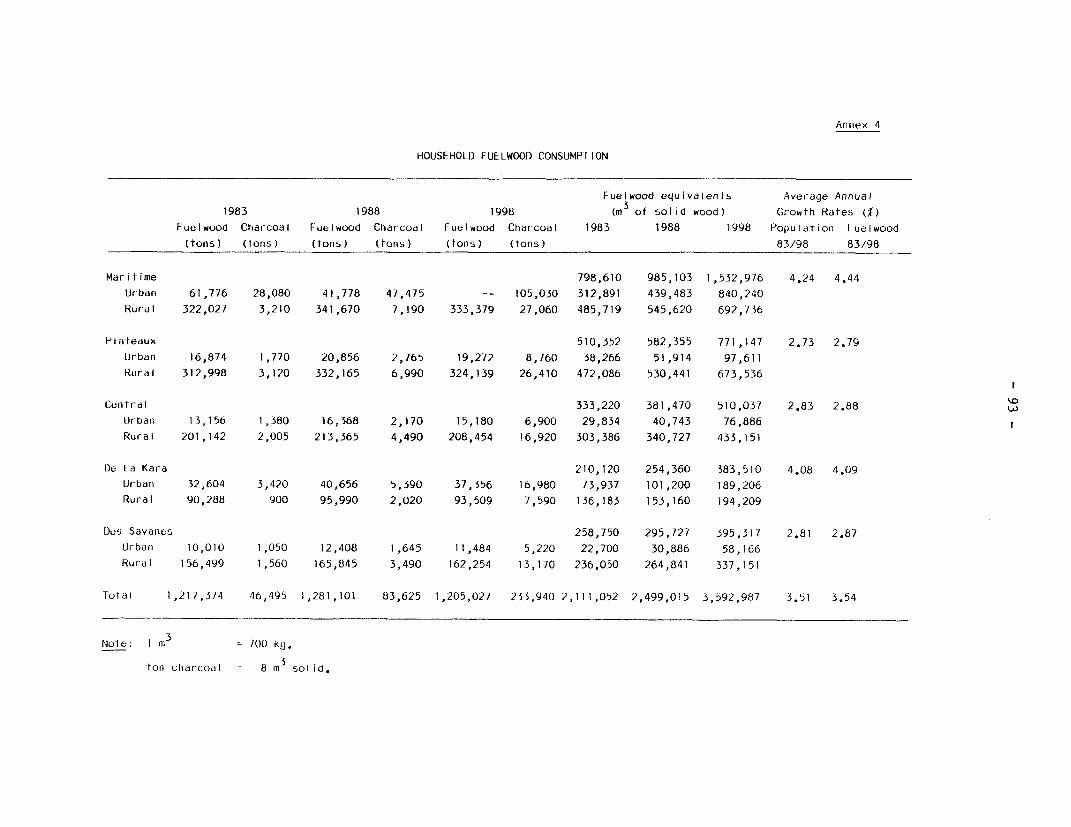
Annex 4
HOUSEHOLD FUELWOOD CONSUMPTION
Fuelwood equivalents Average Annual
1983 1988 1998 (m3 of solid wood) Growth Rateb (%)
Fuelwood Charcoal Fuelwood Charcoal Fuelwood Charcoal 1983 1988 1998 Populdtion F-uelwood
(tons) (tons) (tons) (tons) (tonls) (tons) 83/98 83/98
Maritime 798,610 985,103 1,532,976 4.24 4.44
Urban 61,776 28,080 41,778 47,475 -- 105,030 312,891 439,483 840,240
Rural 322,027 3,210 341,670 7,190 333,379 27,060 485,719 545,620 692,736
Plateaux 510,352 582,355 771,147 2.73 2.79
Urban 16,874 1,770 20,856 2,765 19,272 8,760 38,266 51,914 97,611
Rural 312,998 3,120 332,165 6,990 324,139 26,410 472,086 530,441 673,536
Cen tdl 333,220 381,470 510,037 2.83 2.88
Urbanl 13,156 1,380 16,368 2,170 15,180 6,900 29,834 40,743 76,886
Rural 201,142 2,005 213,365 4,490 208,454 16,920 303,386 340,727 433,151
[)e La Kara 210,120 254,360 383,510 4.08 4.09
Urban 32,604 3,420 40,656 5,390 37,356 16,980 73,937 101,200 189,206
Rural 90,288 900 95,990 2,020 93,509 7,590 136,183 153,160 194,209
Des Savanes 258,750 295,727 395,317 2.81 2.87
Urban 10,010 1,050 12,408 1,645 11,484 5,220 22,700 30,886 58,166
Rural 156,499 1,560 165,845 3,490 162,254 13,170 236,050 264,841 337,151
lotal 1,217,314 46,495 1,281,101 83,625 1,205,027 233,940 2,111,052 2,499,015 3,592,987 3.51 3.54
Nole: 1 m 3 700 kg.
ton charcoal 8 m3 solid.
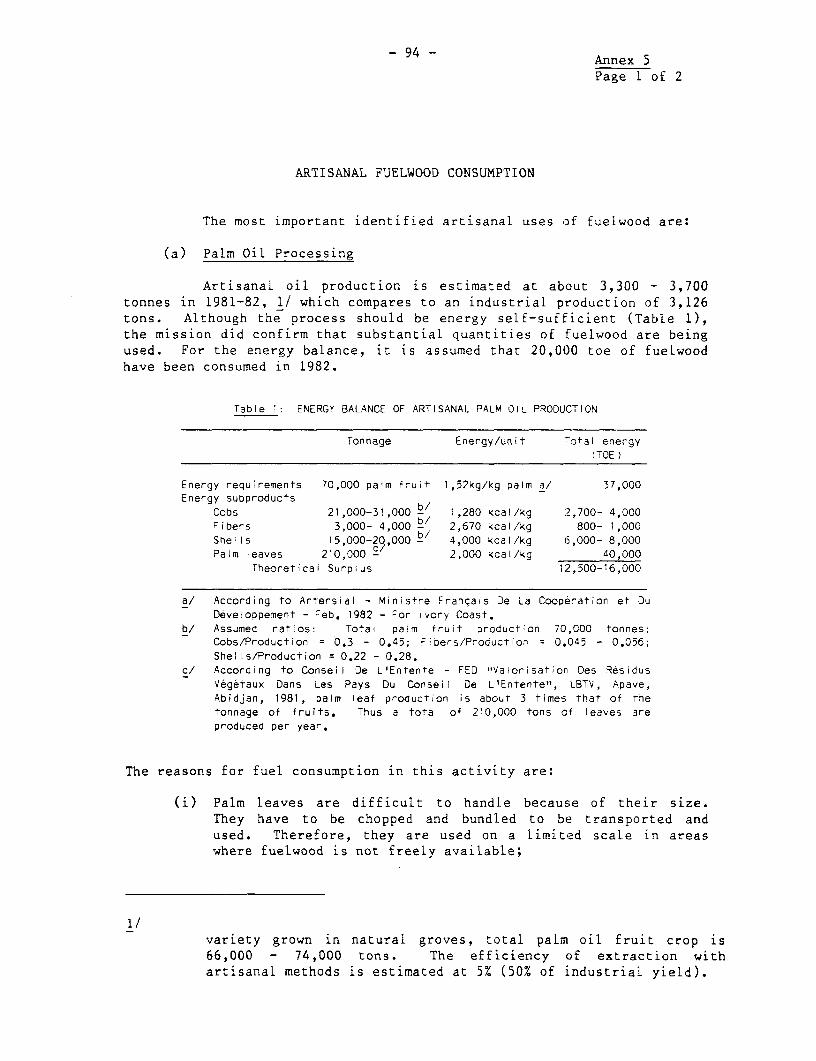
-94 - Annex 5Page 1 of 2
ARTISANAL FUELWOOD CONSUMPTION
The most important identified artisanal uses of fuelwood are:
(a) Palm Oil Processing
Artisanal oil production is estimated at about 3,300 - 3,700tonnes in 1981-82, 1/ which compares to an industrial production of 3,126tons. Although the process should be energy self-sufficient (Table 1),the mission did confirm that substantial quantities of fuelwood are beingused. For the energy balance, it is assumed that 20,000 toe of fuetwoodhave been consumed in 1982.
Table ?: ENERGY BALANCE OF ARTISANAL PALIM OIL PRODUCTION
Tonnage Energy/unit otal energy(TOE)
Energy requirements 70,000 palm fruit 1,52kg/kg palm a/ 37,000Energy subproducts
Cobs 21,000-31,000 b/ 1,280 kcal/kg 2,700- 4,000Fibers 3,000- 4,000 b/ 2,670 kcal/kg 800- 1,000ShelIs 15,000-20,000 bl 4,000 kcal/kg 6,000- 8,000Palm leaves 210,000 2,000 kcal/kg 40,000
Theoretical Surpius 12,500-16,000
a/ According to Artersial - Min,stre Francais De La Cooperation et Du
Developpement - Feb. 1982 - For Ivory Coast.b/ Assumed ratios: Total palnm fruit oroduction 70,000 tonnes;
Cobs/Production = 0.3 - 0.45; Fibers/Production 0.045 - 0.056;Shells/Production = 0.22 - 0.28.
c/ According to Conseil De L'Entente - FED "Valorisatior Des ResidusVegetaux Dans Les Pays Du Conseil De L'Entente", LBTV, Apave,Abidjan, 1981, palm leaf production is about 3 times that of thetonnage of fruits. Thus a total of 210,000 tons of leaves areproduced per year.
The reasons for fuel consumption in this activity are:
(i) Palm leaves are difficult to handle because of their size.They have to be chopped and bundled to be transported andused. Therefore, they are used on a limited scale in areaswhere fuelwood is not freely available;
1/variety grown in natural groves, total palm oil fruit crop is66,000 - 74,000 tons. The efficiency of extraction withartisanal methods is estimated at 5% (50% of industrial yield).

Annex 5Page 2 of 2
(ii) The cobs are mostly used as fertilizers;
(iii) The fibres are pressed in the form of cakes and put to dry onthe walls of houses. They are used for lighting and asdecorations;
(iv) Shells are dried and when possible sold to blacksmiths.
Palm oil production has been estimated from the following sources:
(i) Quantities of palmiste supplied by artisans to OPAT, accordingto Bouche F, Warnant M. "Rapport de synthese de la missiond'assistance technique. Bilan diagnostique du secteur ruralan Togo" - IBRD-IDA-May-June 1983;
(ii) Yields obtained from natural palm groves according toInstitute de recherches pour les huiles et oleagineux manuelde l'huilerie de palme serie scientifique Paris 1967;
(iii) The yields obtained in artisanal processing are estimatedaccording to Artersial - Ministre Francais De La Coop6rationEt Du D6veloppement: Innovation et adaptation de technologiespour l'industrialisation des pays Africans. Les industriesagro-alimentaires, cas de l'huile de paLme - February 1982;
(b) Bakeries
Almost all the bread in Togo is baked in fuelwood ovens. Totalinputs of flour amount to 45,000 tons in 1980. Assuming a ratio of 0.8tons of wood/ton of flour, and that 60% of flour is used for bakingbread, total fuelwood consumption can be estimated at about 21,000 ton ofwood (or 7,400 toe).
(c) Fish smoking and drying
Fishing is a relatively scarcely developed activity, in partbecause the coastal front is small. Total annual catch is estimated at10,000 tons. Assuming that 30% is preserved through smoking and that theprocess requires 2 m3 of wood per ton of fish, total fuelwood consumptionis estimated at 6,000 m3 (or 1440 toe).
(d) Other artisanal production
Other food (such as akassa), metal (blacksmith), pottery andrelated activities are important fuelwood users. However, very littleinformation is available regarding this demand.
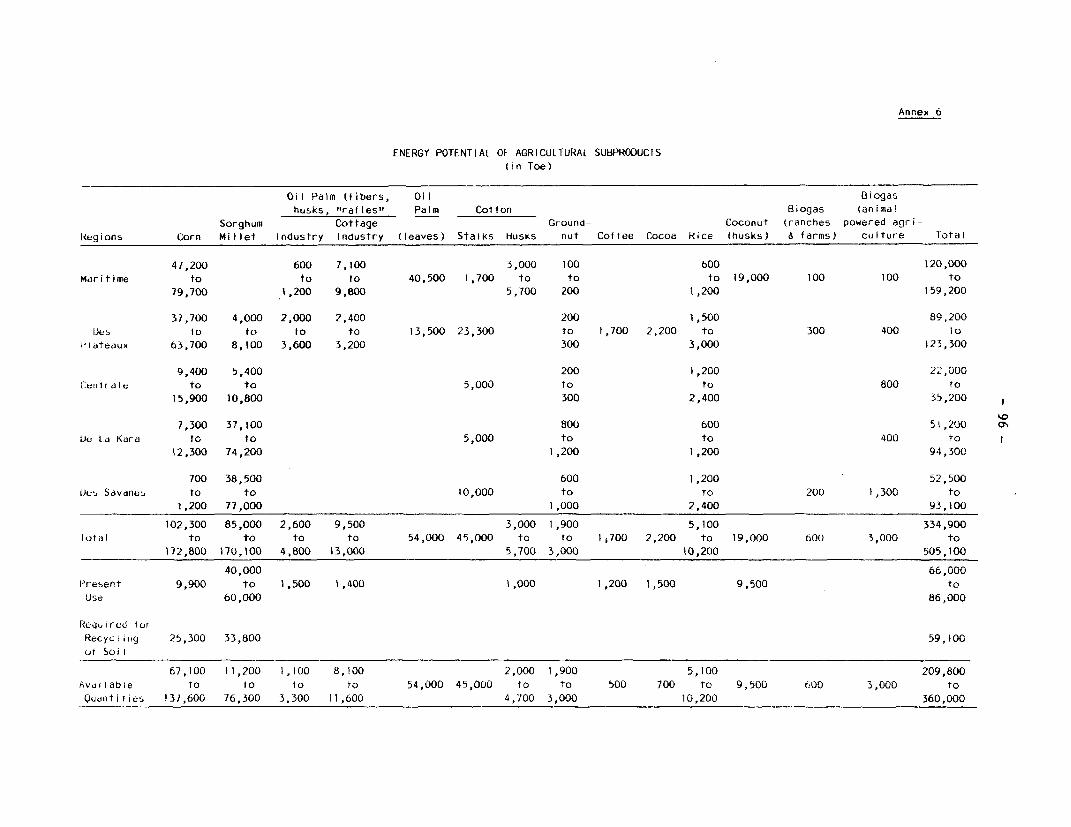
Annex 6
ENERGY POTENTIAL OF AGRICULTURAL SUBPRODUCTS(in Toe)
Oil Palm (fibers, Oil 8iogas
husks, "rafles" Palm Cotton Biogas (animal
Sorghum Cottage Ground- Coconut (ranches powered agri-
Regions Corn Millet Industry Industry (leaves) Stalks Husks nut Coftee Cocoa Rice (husks) farms) culture 1otal
47,200 600 7,100 3,000 100 600 120,000
Maritime to to to 40,500 1,700 to to to 19,000 100 100 to
79,700 1,200 9,800 5,700 200 1,200 159,200
37,700 4,000 2,000 2,400 200 1,500 89,200
IDes to to to to 13,500 23,300 to 1,700 2,200 to 300 400 to
I'Idteaux 63,700 8,100 3,600 3,200 300 3,000 123,300
9,400 5,400 200 1,200 22,000
(ilrdle to to 5,000 to to 800 to
15,900 10,800 300 2,400 35,200
7,300 37,100 800 600 51,200 o
Je tLd Kda-a to to 5,000 to to 400 to
12,300 74,200 1,200 1,200 94,300
700 38,500 600 1,200 52,500
D)us Savdnes to to 10,000 to to 200 1,300 to
1,200 77,000 1,000 2,400 93,100
102,300 85,000 2,600 9,500 3,000 1,900 5,100 334,900
lotal to to to to 54,000 45,000 to to 1,700 2,200 to 19,000 600 3,000 to
172,800 170,100 4,800 13,000 5,700 3,000 10,200 505,100
40,000 6e,0O0
'r-esent 9,900 to 1,500 1,400 1,000 1,200 1,500 9,500 to
Use 60,000 86,000
Required torRecyclliig 25,300 33,800 59,100
ot SoiI
67,100 11,200 1,100 8,100 2,000 1,900 5,100 209,800
Avadilable to to to to 54,000 45,000 to to 500 700 to 9,500 tOO 3,000 to
Quaritines 137,600 76,300 3,300 11,600 4,700 3,000 10,200 360,000
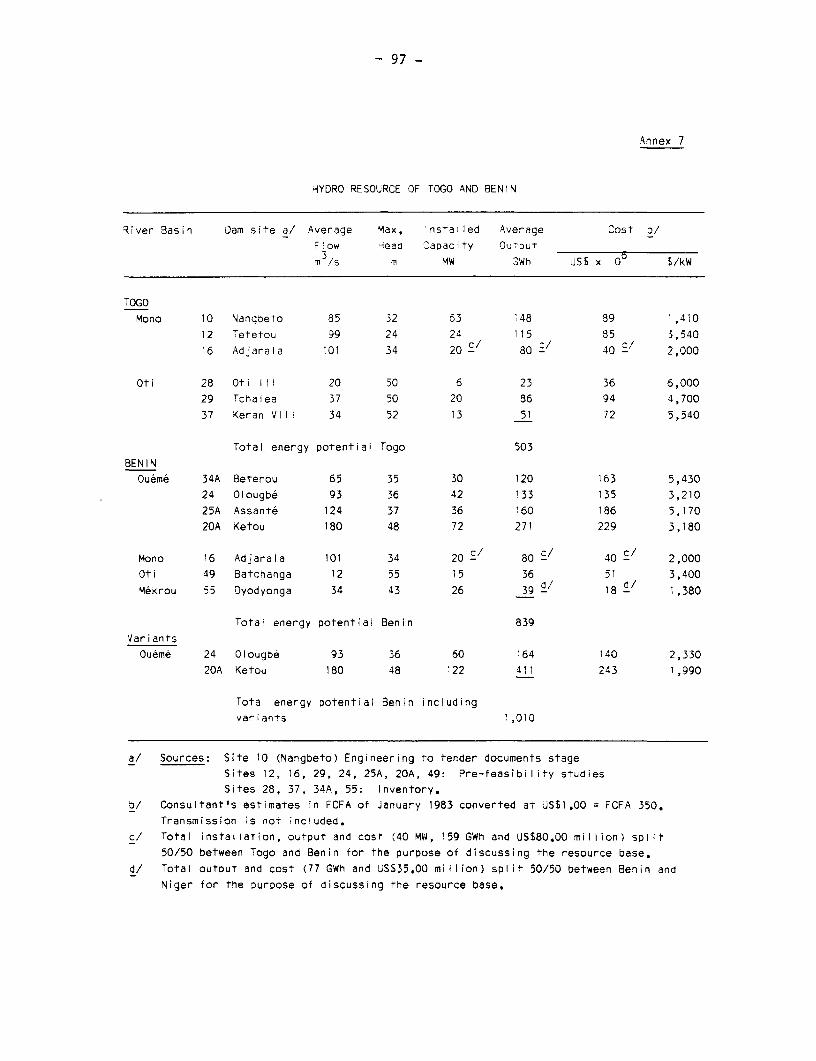
- 97 -
Annex 7
HYDRO RESOURCE OF TOGO AND BENIN
River Basin Dam site a/ Average Max. installed Average Cost D/Flow Head Capacity Ou-pur
m3/s m MW GWh US$ x 0 S/kW
TOGOMono 10 Nangbeto 85 32 63 '48 89 1,410
12 Tetetou 99 24 24 115 85 3,540
16 Adiarala 101 34 20 2" 80 '/ 40 2,000
Oti 28 Oti II 20 50 6 23 36 6,000
29 Tchalea 37 50 20 86 94 4,700
37 Keran VIII 34 52 13 51 72 5,540
Total energy potential Togo 503
BENINOueme 34A Beterou 65 35 30 120 163 5,430
24 Olougbe 93 36 42 133 135 3,210
25A Assant6 124 37 36 160 186 5,170
20A Ketou 180 48 72 271 229 3,180
Mono 16 Adjarala 101 34 20 c" 80 c/ 40 c/ 2,000
Oti 49 Batchanga 12 55 15 36 51 3,400
M6krou 55 Dyodyonga 34 43 26 39 2' 18 d/ 1,380
Total energy potential Benin 839
Variants
Oueme 24 Olougbe 93 36 60 164 140 2,330
20A Ketou 180 48 122 411 243 1,990
Total energy potential Benin includingvariants ',010
a/ Sources: Site 10 (Nangbeto) Engineering to tender documents stageSites 12, 16, 29, 24, 25A, 20A, 49: Pre-feasibility studies
Sites 28, 37, 34A, 55: Inventory.b/ Consultant's estimates in FCFA of January 1983 converted at US$1.00 = FCFA 350.
Transmission is not included.
c/ Total installation, output and cost (40 MW, 159 GWh and US$80.00 million) split
50/50 between Togo and Benin for the purpose of discussing the resource base.
d/ Total output and cost (77 GWh and US$35.00 million) split 50/50 between Benin andNiger for the purpose of discussing the resource base.

- 98 -
Annex 8
POWER GENERATION CAPACITY IN TOGO
Peak DemandLocation Type Net Capacity 1981/1982
(MW) (MW)
Coastal System:
CEET-Lome Diesel d/ 17.5Kpalime Hydro 1.4
CTL -Lome Diesel a/ e/ 38.0Gas Turbines f/ 45.0
OTP -Lome Diesel b/ 14.0
TOTAL SYSTEM 77.9 (115.9) c/ 74.0
Isolated Centers: (CEET)
Atakpame 1.0 0.6Nutse 0.4 N/ASokode 1.3 0.8Bassar 0.4 0.2Sotouboua 0.4 0.1Lama Kara 6.0 1.7Dapaong 0.7 0.3Self-Producers Diesel 3.0
Biomass 0.9
a/ Diesel units to be commissioned in mid-1985.b/ Diesels at OTP cannot supply the network.c/ Figure in brackets refers to capacity available at end of 1984.d/ CEET-Lome-Sulze units (16 MW) can operate on heavy, fuel oil.e/ Diesels at CTL can use heavy fuel oil.f/ Can run on a 60/40 to 75/25 mix of heavy fuel oil and gasoil.g/ All other thermal units use gasoil.

Annex 9
ELECTRIC POWER SUPPLY alHISTORICAL DATA
(in GWh)
Average Annual1972 1973 1974 1975 1976 1977 1978 1979 1980 Growth
b/I
CEET (Lom6) 44.4 57.6 67.6 79.5 88.7 108.9 133.8 149.6 176.6 18.84Generation 44.4 7.1 0.5 1.8 - 0.3 0.1 0.2 2.2From CEB - 50.5 67.1 77.7 88.7 108.6 133.7 149.4 174.4
IndustriesOTP 36.4 74.7CIMAO 0.8 43.9SNS 9.9 23.7TABLIGBO (CEET) 2.0
Provincial Centers (CEET) 4.4 4.2 3.0 3.6 4.6 7.5 7.9 10.9 13.1 14.67Hydro 2.9 2.4 0.8 0.8 0.9 1.0 1.2 1.5 1.6Thermal 1.5 1.8 2.2 2.8 3.7 6.5 6.7 9.4 11.5
a/ Does not include auto generation.b/ Change from calendar year to fiscal year, 1977 adjusted; following data allocated to the next year.
Source: Overview of the Togo Energy Situation, Associates in Rural Development, Inc., November 1981.

Annex 10
TOGO: ElECTRIC DEMAND PROJECt IONS
FY1981/82 1988 1998
Gross Peak Gross Peak Gross Peak Annual Growth Rates %Sales Demand Demand Sdles Delrdind Demand Sales Demand Demdnd Grosb Energy Demriand
(GWh) (GWh) (MW) (GWh) (GWh) (MW) (GWh) (GWh) (GWh) 1982/88 1988/98
Coastal Interconnected 304 329 74 410 520 108 875 980 189 7.3 6.5
Low Voltage 82 41 156 70 363 145
Medium Voltdge 102 166 309
Wholesa le Custonmers
SNS 14 4 18 8 20 8
OIP 60 14 60 14 100 20
CIMAO 46 15 70 16 83 16
C)
Isoldted Centers 155 18.5 4.3 29.6 35.3 8 108 127 29.5 10.5 13.7 C
[ama Kara 11 13 3 26 31 7 95 112 26
Others 4.5 5.5 1.3 3.6 4.3 1.0 13 15 3.5
Assumptions: CEET Distribution
Distribution losses: Coastal system: 13.5% throughout the period - does nol incude supply of wholesale cuslomers.
I sol ated
systems: 17% in 1988; 15% in the 1990's.
Transmission losses: Coastal system: 4% included in gross demanid.
load Factors: Coastal systemi: 0.61 and isoldted center-s 0.50 throughout per iod.
Wholesale Customers: Production to increase as indicated in Table 2.12.
Load factors around the fol lowing values: SNS: 0.30
OTP: 0.57
CIMAO: 0.59
Source: Power Sector- Memordndum: adble 3.1: Adjusted to target yedrs of energy absessmenl.

Annex 11BENIN: ELECTRIC DEMAND PROJECTIONS
1981/82 1988 1998 Annual Growth Rates %Gross Peak Gross Peak Gross Peak Gross Energy Demand
Sales Demand Demand Sales Demand Demand Sales Demand Demand 1982/88 1988/98(GWh) (GWh) ( MW) (GWh) (GWh) (MW) (GWh) (GWh) (GWh)
A. World Bank:Interconnected System 151 28 258 48 595 106 8.6 8.7
SBEE- Distribution Coastal 137 24 217 38 484 85 7.3 8.4Low Voltage 67 109 239Medium Voltage 45 73 177
Btoh icon-Abomey 11 2 35 7 14.0 12.3Low Voltage - - 5.5 15Medium Voltage - - - 3.5 15
Wholesale customersOnigbolo 14 4 30 8 70 12 12.4 8,8Lokossa lextile - - - - - - - 6 2 -
0I oildted Centers 13.7 3.0 22.8 5.1 84 19 -Zou-(Abomey-Bohicon) 3.7 4.7 1.0 - - - - -Low Voltage 2.6 I NT t RCONNE C f L DMedium Voltage 1.1
Borgou: 8.0 1.7 18 4 56 67 14 13.3 14.0Parakou 6.5 14 43.4Other towns - - - I - - 7.6
Atacora - 1.0 0.3 - 3.8 1.1 17 5 23 16.2
Total Benin 165 31 281 52 679 120 8.5 9.2a) Source: Power Sector MemorandumAssumptions: I 1) Abomey-Bohicon to be connected by 1986.
2) Losses: Interconnected Systems - 17% in 1982; 16% in 1988; 14% in 1998Isolated Centers = 19% in 1982; 17% in 1988; 16% in 1998.
3) Load Factors: Distribulion: Interconnected system 0.65; Isolated Centers: Zou-Borgou: 0,54; Atacora 0.38,Wholesale customiers: Onigbolo: 0.66
4) Lokossa textile: As indicated in fable 2.4 - Energy Assessment mission considers that the energyrequirements will be significantly lower than estimated in Power Sector Memorandum.
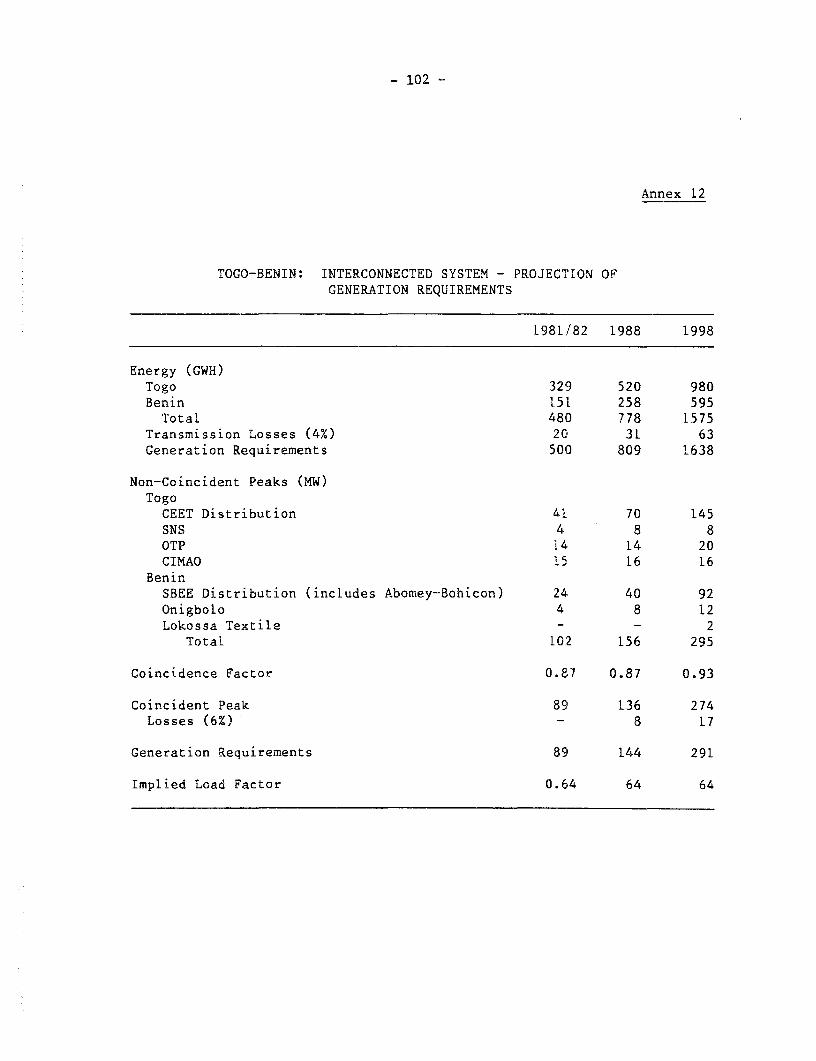
- 102 -
Annex 12
TOGO-BENIN: INTERCONNECTED SYSTEM - PROJECTION OFGENERATION REQUIREMENTS
1981/82 1988 1998
Energy (GWH)Togo 329 520 980Benin 151 258 595Total 480 778 1575
Transmission Losses (4%) 20 31 63Generation Requirements 501) 809 1638
Non-Coincident Peaks (MW)TogoCEET Distribution 41 70 145SNS 4 8 8OTP 14 14 20CIMAO 15 16 16
BeninSBEE Distribution (includes Abomey-Bohicon) 24 40 92Onigbolo 4 8 12Lokossa Textile - - 2
Total 102 156 295
Coincidence Factor 0.87 0.87 0.93
Coincident Peak 89 136 274Losses (6%) - 8 17
Generation Requirements 89 144 291
Implied Load Factor 0.64 64 64

- 103 -
Annex 13.1
TOGO: INLAND CENTERS
PEAK DEMAND AND PRESENT INSTALLED CAPACITY
Region/Centers Capacity (KW) - Peak Demand (KW)
Nominal Effective i981/82 - 983 ' 985 ' 1990 c/
Plateaux
Atakpame 2200 2/ 970 600 858 2006 2455
Kpalim6 1700 1400 683 899 1285
Notse 412 400 255 379 601
Centre
Sokode 1450 1280 750 955 1177 1825
Sotouboua 370 370 100 143 185 310
Kara
Lama Kara 10400 b/ 9500 1700 4807 5530
BafiloPagouda
Niamtougou
Kante
Bassar 450 400 200 215 267 402
Savannes
Savanne - Mango in construction 73 137 264
Dapaong 660 300 461 582 842
a/ As reported in Master Plan - Report E - Page 2.15.
b/ IMGO V16 and IMGO V12 damaged.
c/ 1 x 4 MWPC; I x 3.7 MWPC, and 5 x 540 KW (Cummins). The two groups cannot operate in
parallel.
Source: a) Master Plan and Power Sector Memorandum.
b) Power Sector Memorandum.
c) Master Plan - Report B - Volume 2 - Togo.
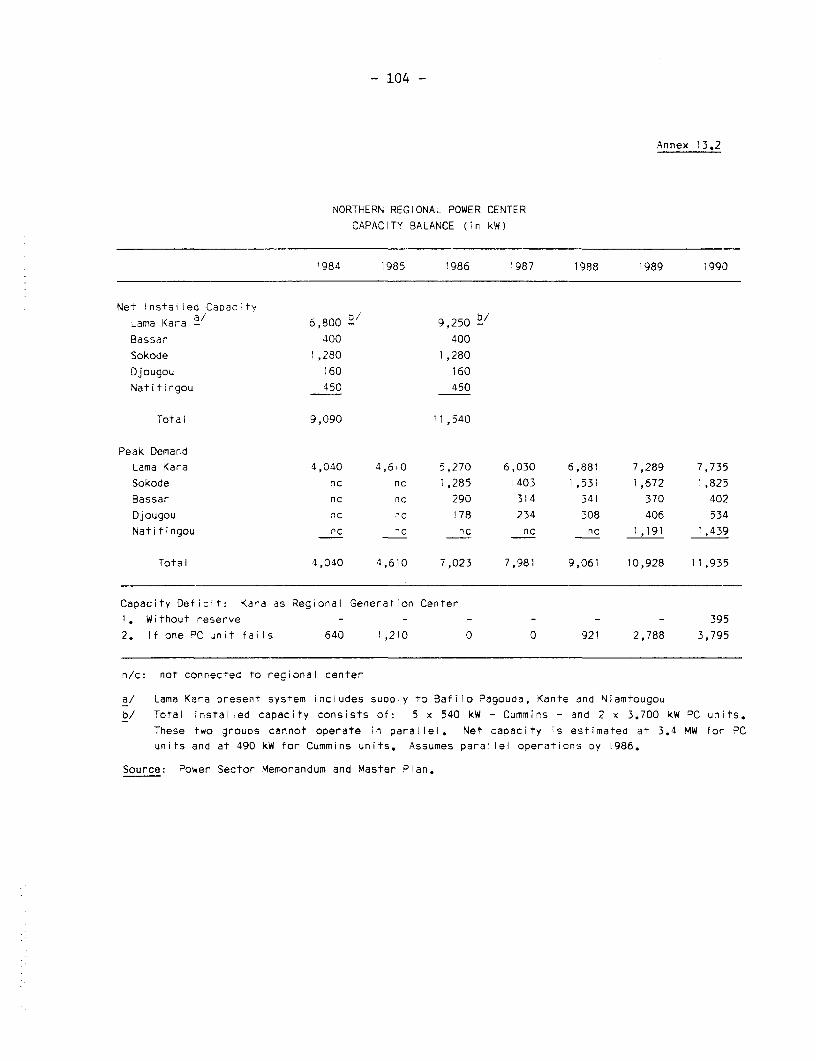
- 104 -
Annex 13.2
NORTHERN REGIONAL POWER CENTER
CAPACITY BALANCE (in kW)
'984 1985 '986 1987 1988 1989 199o
Net Installed CaDacity
Lama Kara a/ 6,800 - 9,250 b/
Bassar 400 400
Sokode 1,280 1,280
Djougou 160 160
Natitingou 450 450
Total 9,090 11,540
Peak Demand
Lama Kara 4,040 4,6iO 5,270 6,030 6,881 7,289 7,735
Sokode nc nc 1,285 t403 1,531 1,672 1,825
Bassar nc nc 290 314 341 370 402
Djougou nc nc 178 234 308 406 534
Natitingou nc nc nc nc nc 1,191 1,439
Total 4,040 4,610 7,023 7,981 9,061 10,928 11,935
Capacity Deficit: Kara as Regional Generation Center
1. Without reserve - - - - - - 395
2. If one PC unit fails 640 1,210 0 0 921 2,788 3,795
n/c: not connected to regional center
a/ Lama Kara present system inciudes supply to Bafilo Pagouda, Kante and Niamtougou
b/ Total installed capacity consists of: 5 x 540 kW - Cummins - and 2 x 3.700 kW PC units.
These two groups cannot operate in parallei. Net capacity is estimated at 3.4 MW for PC
units and at 490 kW for Cummins units. Assumes parallel operations Dy 1986.
Source: Power Sector Memorandum and Master Plan.
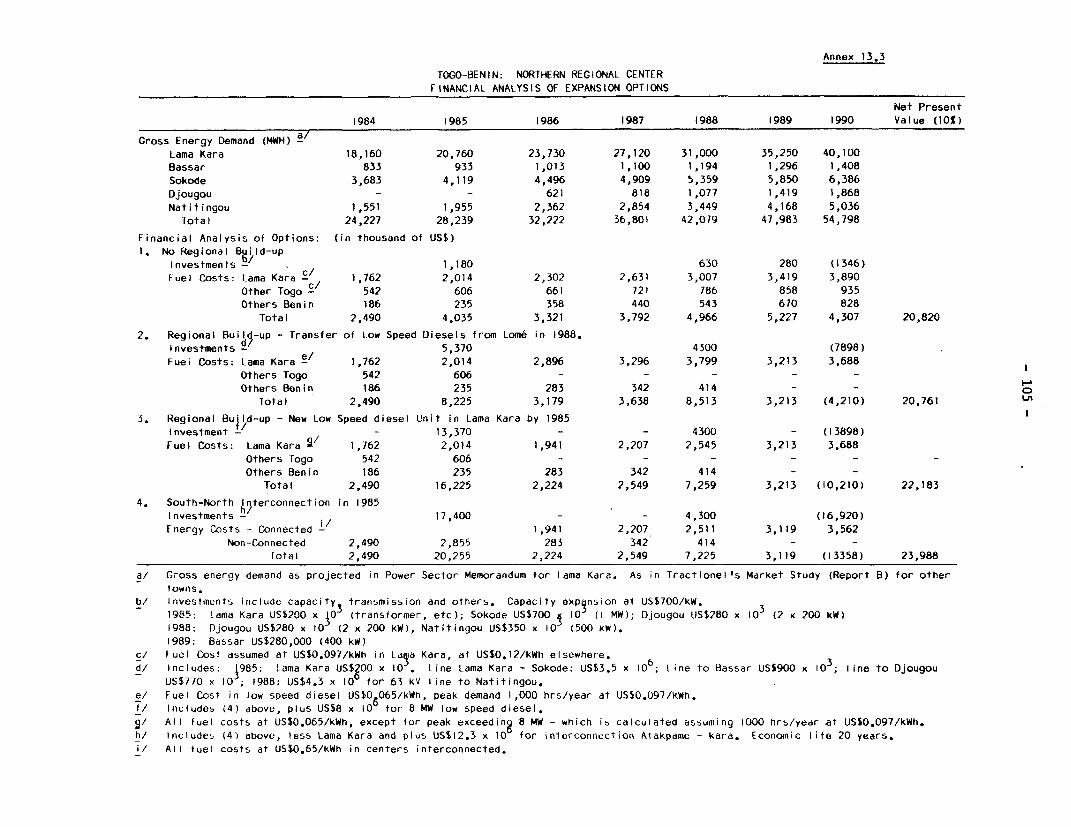
Annex 13.3
TOGO-BENIN: NORTHERN REGIONAL CENTER
FINANCIAL ANALYSIS OF EXPANSION OPTIONS
Net Present
1984 1985 1986 1987 1988 1989 1990 Value (10%)
Gross Energy Demand (MWH) a/Lama Kara 18,160 20,760 23,730 27,120 31,000 35,250 40,100
Bassar 833 933 1,013 1,100 1,194 1,296 1,408
Sokode 3,683 4,119 4,496 4,909 5,359 5,850 6,386
Djougou - - 621 818 1,077 1,419 1,868
Natitingou 1,551 1,955 2,362 2,854 3,449 4,168 5,036
Total 24,227 28,239 32,222 36,801 42,079 47,983 54,798
Financial Analysis of Options: (in thousand of USS)
1. No Regional Build-up
Investments b/ 1,180 630 280 (1346)
Fuel Costs: Lama Kara c 1,762 2,014 2,302 2,631 3,007 3,419 3,890
Other Togo c 542 606 661 721 786 858 935
Others Benin 186 235 358 440 543 670 828
Total 2,490 4,035 3,321 3,792 4,966 5,227 4,307 20,820
2. Regional Build-up - Transfer of Low Speed Diesels from Lome in 1988.
Investments di 5,370 4300 (7898)
Fuel Costs: Lama Kara e/ 1,762 2,014 2,896 3,296 3,799 3,213 3,688 1
Others Togo 542 606 - - - - -
Others Benin 186 235 283 342 414 - -C
Total 2,490 8,225 3,179 3,638 8,513 3,213 (4,210) 20,761
3. Regional Build-up - New Low Speed diesel Unit in Lama Kara by 1985
Investment - - 13,370 - - 4300 - (13898)
Fuel Costs: Lama Kara i/ 1,762 2,014 1,941 2,207 2,545 3,213 3,688
Others Togo 542 606 - - - - - -
Others Benin 186 235 283 342 414 - -
Total 2,490 16,225 2,224 2,549 7,259 3,213 (10,210) 22,183
4. South-North Interconnection in 1985
Investments h/ 17,400 - - 4,300 (16,920)
Energy Costs - Connected - 1,941 2,207 2,511 3,119 3,562
Non-Connected 2,490 2,855 283 342 414 - -
Total 2,490 20,255 2,224 2,549 7,225 3,119 (13358) 23,988
a/ Gross energy demand as projected in Power Sector Memorandum for Lama Kara. As in Tractionel s Market Study (Report B) for other
towns.
b/ Investments include capacity transmission and others. Capacity exp nsion at US$700/kW.
1985: Lama Kara US$200 x Q3 (transformer, etc); Sokode US$700 i 10 (I MW); Djougou US$280 x 103 (2 x 200 kW)
1988: Djougou US$280 x 10 (2 x 200 kW), Natitingou US$350 x 10 (500 kW).
1989: Bassar US$280,000 (400 kW)
c/ Fuel Cost assumed at US$0.097/kWh in Lama Kara, at US$0.12/kWh elsewhere. 6 3
d/ Includes: 985 Lama Kara UST00 x 10 , Line Lama Kara - Sokode: US$3,5 x 10⁶; Line to Bassar USS900 x 10 ; line to Djougou
US$770 x 10; 1988: US$4.3 x 10 for 63 kV line to Natitingou.
e/ Fuel Cost in low speed diesel US$0 6065/kWh, peak demand 1,000 hrs/year at US$0.097/kWh.
f/ Includes (4) dbove, plus US$8 x 10 for 8 MW low speed diesel,
q/ All fuel costs at US$0.065/kWh, except for peak exceeding 8 MW - which ib calculated assuming 1000 hrs/year at US$0.097/kWh.
h/ Includes (4) above, less Lama Kara and plus US$12.3 x 10 for interconnectioa Atakpame - kara. Economic life 20 years.
i/ All fuel costs at US$0.65/kWh in centers interconnected.

- 106 -
Annex 14.1Page 1 of 2
TOGO
CEET-EXISTING TARIFFS(January 1984)
1. Low Voltage
1.1 ResidentialUp to 100 kWh/month FCFA 50/kWhFrom 101 to 200 kWh/month FCFA 46/kWhAbove 200 kWh/month FCFA 44/kWh
1.2 CommercialUp to 100 kWh/month FCFA 46/kWhFrom 101 to 200 kWh/month FCFA 44/kWhAbove 200 kWh/month FCFA 42/kWh
1.3 Public LightingOne single block FCFA 44/kWh
2. Medium Voltage
2.1 Power Subscribed < 500 kVAAnnual fixed charge: FCFA 15,000 per kVA subscribed.Energy Chargefrom 18 h to 23 h FCFA 47/kWhfrom 06 h to 18 h FCFA 36/kWh a/from 23 h to 06 h FCFA 32/kWh a/
Additional tax for Lighting FCFA 12/kWh
2.2 Power Subscribed > 500 kVAAnnual fixed charge: FCFA 15,000 per kVA subscribed.Energy Chargefrom 18 h to 23 h FCFA 45/kWhfrom 06 h to 18 h FCFA 34/kWh a/from 23 h to 06 h FCFA 32/kWh a/
3. Societe Nationale de Siderurgie (SNS)Fixed Charge US$5,600 per monthDemand Charge US$7.62/kVA/monthEnergy Charge US$0.0148/kWhAdditional Energy Charge FCFA 2.0/kWh
Note: Billing and collection for Fixed, Demand, and Energy charges aretemporarily made by CEB on behalf of CEET.
a/ Off-peak tariff applicabLe only to consumers with more than 200hours of utilization of their power subscribed.

- 107 -
Annex 14.1Page 2 of 2
4. Office Togolais des Phosphates (OTP)Fixed Charge FCFA 13,380,000 per monthDemand Charge US$6.92 per kVA/month blEnergy Charge US$0.01461/kWhAdditional Energy Charge FCFA 2.0/kWh
Note: Billing and collection for Fixed, Demand, and Energy charges aretemporarily made by CEB on behalf of CEET.
5. Meter Rent and DepositsA charge for meter rent and an advance deposit are payable by
all consumers. A charge for meter maintenance is payable by mediumvoltage consumers.
b/ Multiplied by [I - (cos 0 - 0.8)] if power factor drops below 0.8.
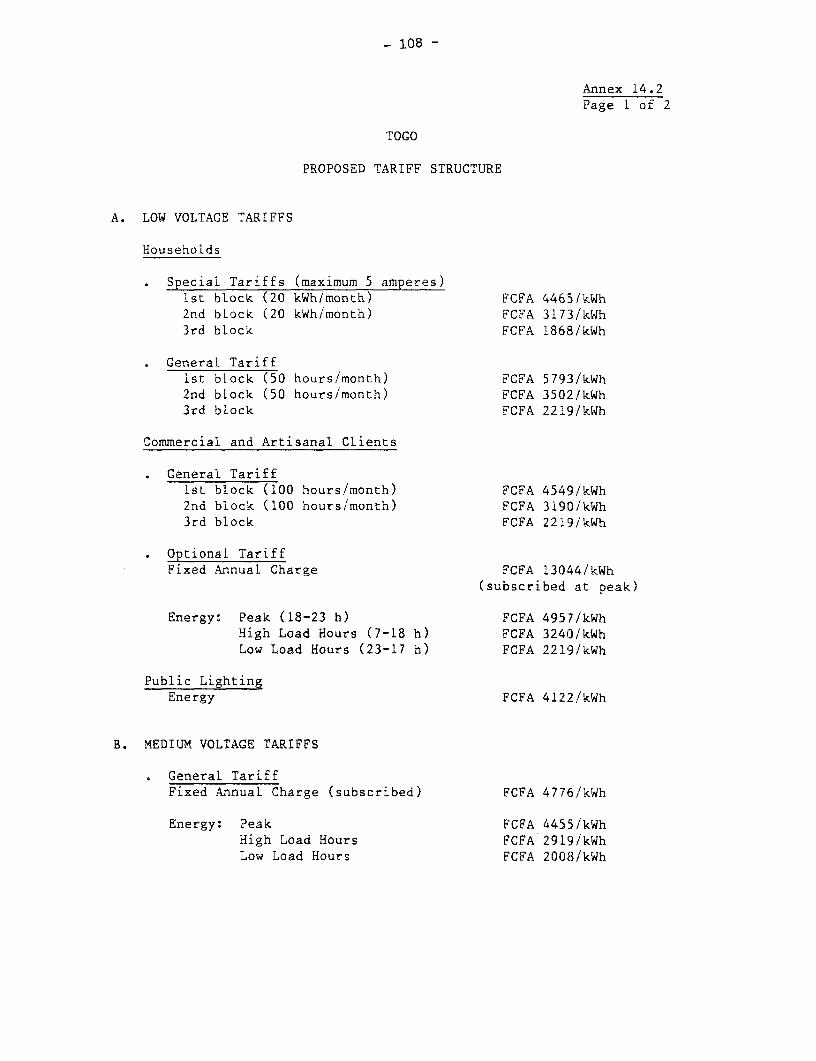
- 108 -
Annex 14.2Page 1 of 2
TOGO
PROPOSED TARIFF STRUCTURE
A. LOW VOLTAGE TARIFFS
Households
Special Tariffs (maximum 5 amperes)1st block (20 kWh/month) FCFA 4465lkWh2nd bLock (20 kWh/month) FCFA 3173/kWh3rd bLock FCFA 1868/kWh
General Tariffist block (50 hours/month) FCFA 5793/kWh2nd block (50 hours/month) FCFA 3502/kWh3rd block FCFA 2219/kWh
Commercial and Artisanal Clients
D General Tariff1st block (100 hours/month) FCFA 4549/kWh2nd block (100 hours/month) FCFA 3190/kWh3rd block FCFA 2219/kWh
Optional TariffFixed Annual Charge FCFA 13044/kWh
(subscribed at peak)
Energy: Peak (18-23 h) FCFA 4957/kWhHigh Load Hours (7-18 h) FCFA 3240/kWhLow Load Hours (23-17 h) FCFA 2219/kWh
Public LightingEnergy FCFA 4122/kWh
B. MEDIUM VOLTAGE TARIFFS
General TariffFixed Annual Charge (subscribed) FCFA 4776/kWh
Energy: Peak FCFA 4455/kWhHigh Load Hours FCFA 2919/kWhLow Load Hours FCFA 2008/kWh

- 109 -
Annex 14.2Page 2 of 2
Long Utilization TariffFixed Annual Charge (subscribed) FCFA 20580/kWh
Energy: Peak FCFA 3798/kWhHigh Load Hours FCFA 2489/kWhLow Load Hours FCFA 1702/kWh
Source: CEET-Etude Tarifaire, EDF International, Juin 1983, Tables X.1and X.2
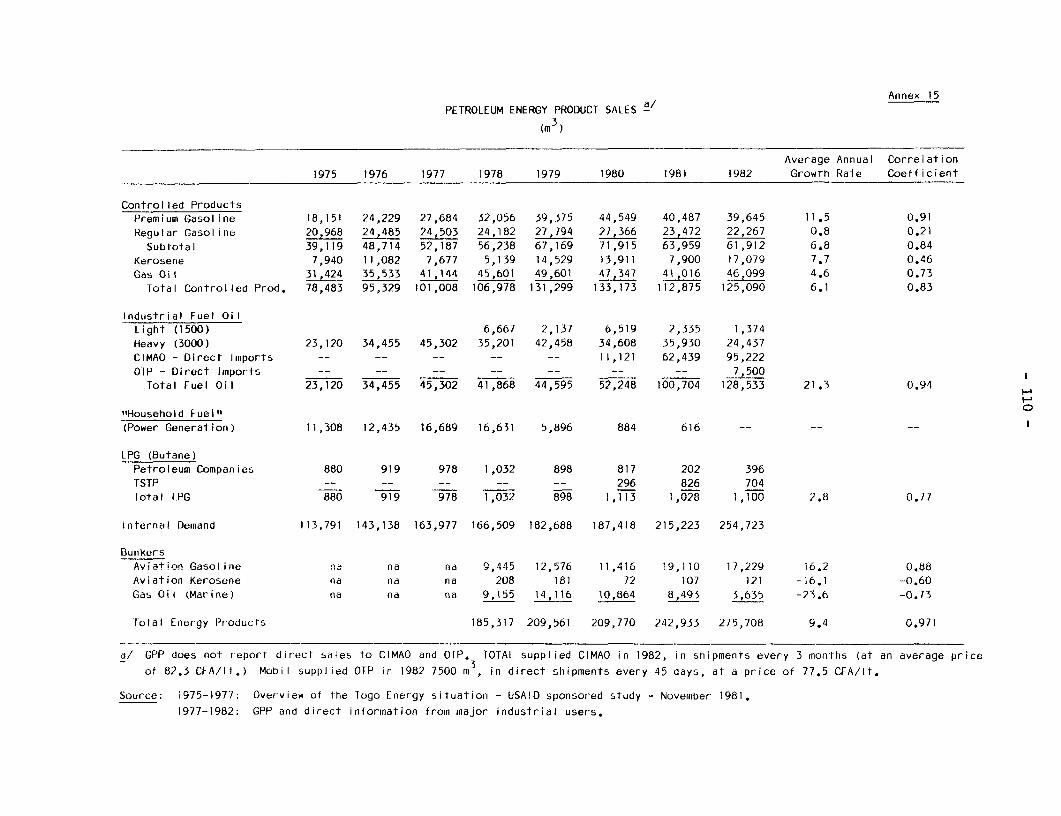
Annex 15
PETROLEUM ENERGY PRODUCT SALES3
Average Annual Correlation
1975 1976 1977 1978 1979 1980 1981 1982 Growth Rate Coefficient
Controlled ProductsPremium Gasoline 18,151 24,229 27,684 32,056 39,375 44,549 40,487 39,645 11.5 0.91
Regular Gasoline 20,968 24,485 24,503 24,182 27,794 27,366 23,472 22,267 0.8 0.21Subtotal 39,119 48,714 52,187 56,238 67,169 71,915 63,959 61,912 6.8 0.84
Kerosene 7,940 11,082 7,677 5,139 14,529 13,911 7,900 17,079 7.7 0.46
Gas Oil 31,424 35,533 41,144 45,601 49,601 47,347 41,016 46,099 4.6 0.73
Total Controlled Prod. 78,483 95,329 101,008 106,978 131,299 133,173 112,875 125,090 6.1 0.83
Industrial Fuel OilLight (1500) 6,667 2,137 6,519 2,335 1,374Heavy (3000) 23,120 34,455 45,302 35,201 42,458 34,608 35,930 24,437CIMAO - Direct Imports - - - - -- -- 11,121 62,439 95,222
OTP - Direct Imports -- -- -- -- -- -- -- 7,500Total Fuel Oil 23,120 34,455 45,302 41,868 44,595 52,248 100,704 128,533 21.3 0.94 H
"Household Fuel" °(Power Generation) 11,308 12,435 16,689 16,631 5,896 884 616 -- -- --
LPG (Butane)
Petroleum Companies 880 919 978 1,032 898 817 202 396TSTP -- -- -- -- -- 296 826 704
Total LPG 880 919 978 1,032 898 1,113 1,028 1,100 2.8 0.77
Internal Demand 113,791 143,138 163,977 166,509 182,688 187,418 215,223 254,723
Bunkers
Aviation Gasoline nd na na 9,445 12,576 11,416 19,110 17,229 16.2 0.88
Aviation Kerosene na na na 208 181 72 107 121 -16.1 -0.60
Gas Oil (Marine) na na na 9,155 14,116 10,864 8,493 3,635 -23.6 -0.73
lotal Energy Products 185,317 209,561 209,770 242,933 275,708 9.4 0.971
a/ GPP does not report direci sales to CIMAO and OTP. TOTAL supplied CIMAO in 1982, in shipments every 3 months (at an average price
of 82.3 CFA/lt.) Mobil supplied OTP in 1982 7500 m , in direct shipments every 45 days, at a price of 77.5 CFA/lt.
Source: 1975-1977: Overview ot the Togo Energy situation - USAID sponsored study - November 1981.
1977-1982: GPP and direct information from major industrial users.
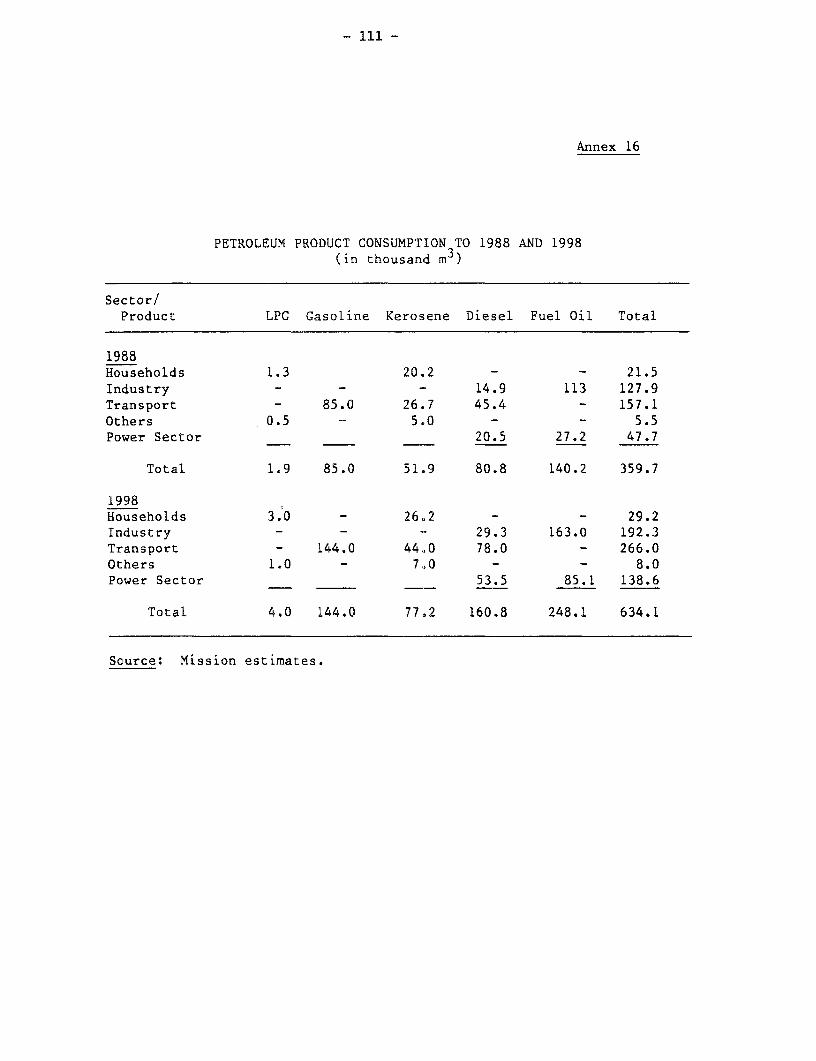
- 111 -
Annex 16
PETROLEUM PRODUCT CONSUMPTION TO 1988 AND 1998(in thousand m3)
Sector/Product LPG Gasoline Kerosene Diesel Fuel Oil Total
1988Households 1.3 20.2 - - 21.5Industry - - - 14.9 113 127.9Transport - 85.0 26.7 45.4 - 157.1Others 0.5 - 5.0 - - 5.5Power Sector _ 20.5 27.2 47.7
Total 1.9 85.0 51.9 80.8 140.2 359.7
1998Households 3.0 - 26.2 - - 29.2Industry - - - 29.3 163.0 192.3Transport - 144.0 44.0 78.0 - 266.0Others 1.0 - 7.0 - - 8.0Power Sector 53.5 85.1 138.6
Total 4.0 144.0 77.2 160.8 248.1 634.1
Source: Mission estimates.

Annex 17
TOGO-BENIN: PETROLEUM REQUIREMENTS FOR POWER GENERATION a/
Generation Specific Oil ConsumptionRequirements b/ Energy 1984 1988 1998
(GWh) Consumption Diesel Fuel Oil Diesel Fuel Oil Diesel Fuel Oil1984 1988 1998 (gm/kWh) (m3) (m3) (m3) (m3) (fn3) (n3
Interconnected System:
Demand 604 707 1,254
Togo 417 492 839
Benin 187 215 415
Supply
Imports 252 500 575
Domestic: 352 207 679 49,180 64,130 10,107 44,291 31,586 91,263 HS8EE-Cotonou-Old 3 - - 275 988 - - - - - 4
Cotonou-New 30 469 25 230 - 7,420 - 17,065 - 6,183CEET-Lome 76 - - 235 21,389 - - - - -
Lome--Diesel 83 135 259 240 5,964 16,065 9,700 26,130 18,610 50,130
Lome-
Gas Turbine 140 2 197 360-680 15,090 40,645 407 1,096 12,976 34,950OTP-Self-Generation 20 - (240) 5,749 -
Isolaled Systems: 36 60 134 300 12,934 - - 48,144Togo 20 29 61 7,186 - 10,419 - 21,916Benin 16 31 73 5,748 - 11,138 - 26,228
Total Oil Consumption 64,130 64,130 31,664 44,291 79,730 91,263In Togo 55,378 56,710 20,526 27,226 53,502 85,080In Benin 6,736 7,420 11,138 17,065 26,228 6,183
d/ Based on1 Mission's low demand estimate.
b/ Losses estimated at: Interconnected System: 17% in 1982; 15% in 1984; 13% in 1988; 11% in 1998.
Isolated Centers: 20% duty paid.

Annex 18
1982: PETROLEUM PRODUCTS - DEMAND OF WEST AFRICAN NEIGHBORING COUNTRIES
(m3)
Motor Aviation Non- To al liquidsGasolines Kerosene Gas Oil Fuel Oil LPG Kero Gasoline Specified (m ) B/D
TOGO: Market Sales 61,912 17,079 49,734 128,533 1,100 17,229 121 275,708 4,750
BENIN: Total Sales 36,855 21,598 48,805 -- 1,129 19,514 105 135,720 2,338
BURKINA FASO: Totdl Sales 69,813 4,287 30,600 48,385 -- n.a. n.a. 153,085 2,638From Togo 23,931 (9,194) (280) (33,405)From Benin (8,423) (8,423)
NIGER: Total Sales 60,000 6,270 107,100 670 1/4,040 2,998From Benin 668 (114,973) (114,973)
MALI: Total Sales 74,428 15,363 63,856 3,090 419 137,80 171,604 2,957From Benin a/ 1,290 40 2,550 - - - - 3,880 67
Other Tratfic b/
From Benin (188) (188)
Total Consumption 303,008 64,597 300,095 187,722 2,648 50,523 1,564 910,157 15,682 '% Share 33.3 7.1 33.0 20.6 0.3 5.6 0.2 100.0
TotalBenin-Togo Consumption
& Traffic 123,988 38,717 110,283 136,247 2,229 37,023 226 123,584 572,297 9,861% Share 21.7 6.8 19.7 23.8 0.4 6.5 0.0 21.6 100.0
Sources: Togo: GPP a/ CIMAO & OTP.Benin: Sonacop and Statistics Port of Cotonou.Burkina Faso: IMF-Economic Report-June 1983.Niger: WB-Energy Assessment.
Mali: Transenerg study on energy situation in Mali.
Notes: Conversion Factors Used: Light Fuel Oil: Sp. Gr. 0.93
Heavy Fuel Oil: Sp. Gr. 0.96
LPG: Sp. Gr. 0.54
Traffic through Port of Contonou - converted at Sp. Gr. 0.90
a! Mali: as indicated in Report: "Planification de I'Energie" - Transenerg, April.b/ Traffic does not include shipment-s to Togo nor to Nigeria.

Annex 19
WEST AFRICA - PETROLEUM DEMAND PROJECTION TO 1988: NEIGHBORING COUNIRIES
(in m3
Gasoil/ Non- Trotal
LPG Gasoline Kerosene Diesel Fuel Oil Specific Total B/D
Total Demand:
Ta go Dm 1,800 85,000 51,900 80,800 140,200 359,/0O 6,198
Benin a 2,062 76,823 58,982 85,280 57,565 280,712 4,837
Niger - n.a. 77,140 16,330 164,560 4,390 262,420 4,522
Burkina Faso d- n.a. 93,556 5,745 41,007 64,840 205,148 3,535
Mali e/ 516 90,970 40,988 89,820 11,709 234,003 4,032
Total 4,378 423,489 173,945 461,467 278,704 1,341,983 23,123
Relative Share 0.2 31.6 13.0 34.4 20.8 100.0
Demand through Togo-Benin
Togo - Total Demand 1,800 85,000 51,900 80,800 140,200 359,700 6,198
Benin - Total Demand 2,062 76,823 58,982 85,280 57,565 280,722 4,837
Niger - Transit Benin - - - - - 154,070 154,070 2,655
Burkina Faso -
- Transit Benin-togo - 32,070 375 12,320 - 11,290 56,055 966
Mali - Transit Benin 1,820 56 3,590 -- 5,466 94
Total 3,862 195,713 111,313 181,990 197,765 165,360 856,0i3 14,750
a/ Assessment Report, IBRD
b/ Assessment Report, !BRD
c/ Assessrnenl Repor1 , IBRD
d/ IMF - Economic Report - Mission project ions at 5% p.a.
e/ Rapport d'Etude - Ministere de I 'Energie et des Mines - By Transenerg - April 1983. Low hypolheesis.
Iransil through beniin supplies only the requirements of the Region of Gao.
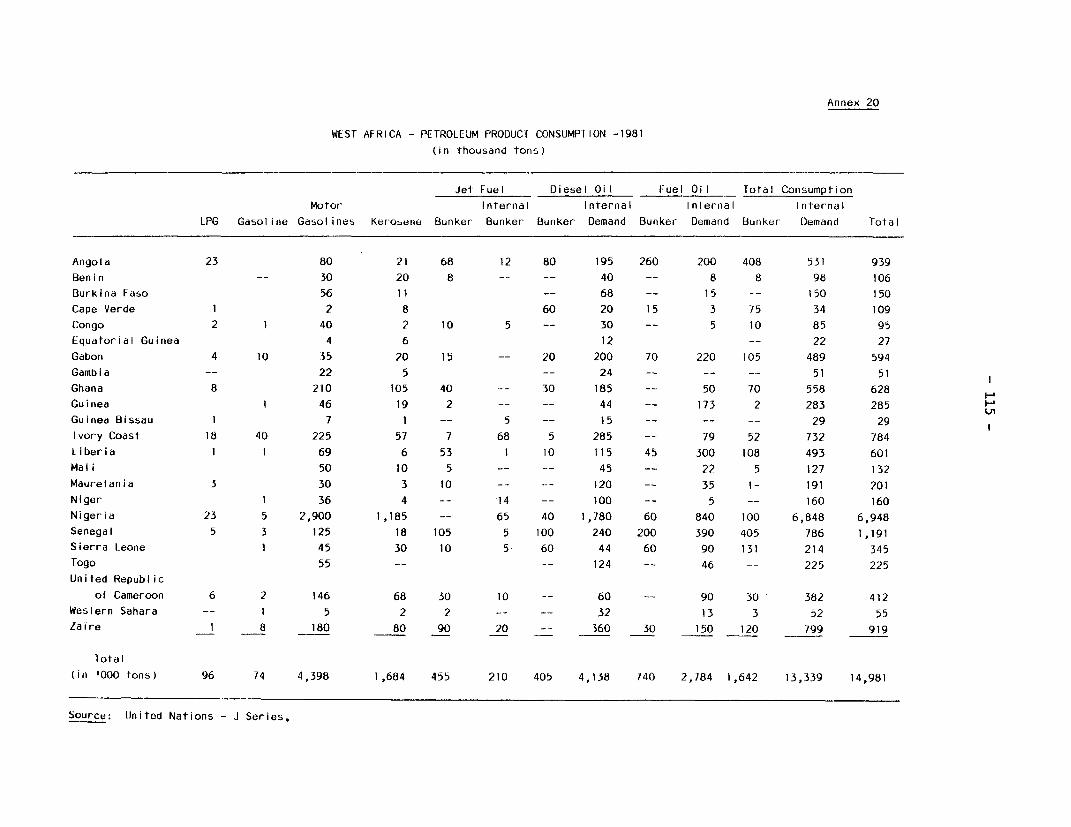
Annex 20
WEST AFRICA - PETROLEUM PRODUCi CONSUMPTION -1981
(in thousand tons)
Jet Fuel Diesel Oil Fuel Oil Total Consumption
Motor Internal Internal Iniernal Internal
LPG Gasoline Gasol ineb Kerobene Bunker Bunker Bunker Demand Bunker Demand Bunker Demand Total
Angola 23 80 21 68 12 80 195 260 200 408 531 939
Benin -- 30 20 8 -- -- 40 -- 8 8 98 106
Burkina Faso 56 11 -- 68 -- 15 -- 150 150
Cape Verde 1 2 8 60 20 15 3 75 34 109
Congo 2 1 40 2 10 5 -- 30 -- 5 10 85 95
Equatorial Guinea 4 6 12 -- 22 27
Gabon 4 10 35 20 15 -- 20 200 70 220 105 489 594
Gambia -- 22 5 -- 24 -- -- - 51 51
Ghana 8 210 105 40 -- 30 185 -- 50 70 558 628
Guinea 1 46 19 2 -- -- 44 -- 173 2 283 285
Guinea Bissau 1 7 1 -- 5 -- 15 -- -- -- 29 29
Ivory Coast 18 40 225 57 7 68 5 285 -- 79 52 732 784
Liberia 1 1 69 6 53 1 10 115 45 300 108 493 601
Mali 50 10 5 -- -- 45 -- 22 5 127 132
Mauretania 3 30 3 10 -- -- 120 -- 35 1- 191 201
Niger 1 36 4 -- 14 -- 100 -- 5 -- 160 160
Nigeria 23 5 2,900 1,185 -- 65 40 1,780 60 840 100 6,848 6,948
Senegal 5 3 125 18 105 5 100 240 200 390 405 786 1,191
Sierra Leone 1 45 30 10 5 60 44 60 90 131 214 345
Togo 55 -- -- 124 -- 46 -- 225 225
United Republic
of Cameroon 6 2 146 68 30 10 -- 60 -- 90 30 382 412
Western Sahara -- 1 5 2 2 -- -- 32 13 3 52 55
Zaire 1 8 180 80 90 20 -- 360 30 150 120 799 919
Total
(in '000 tons) 96 74 4,398 1,684 455 210 405 4,138 740 2,784 1,642 13,339 14,981
Source: United Nations - J Series.
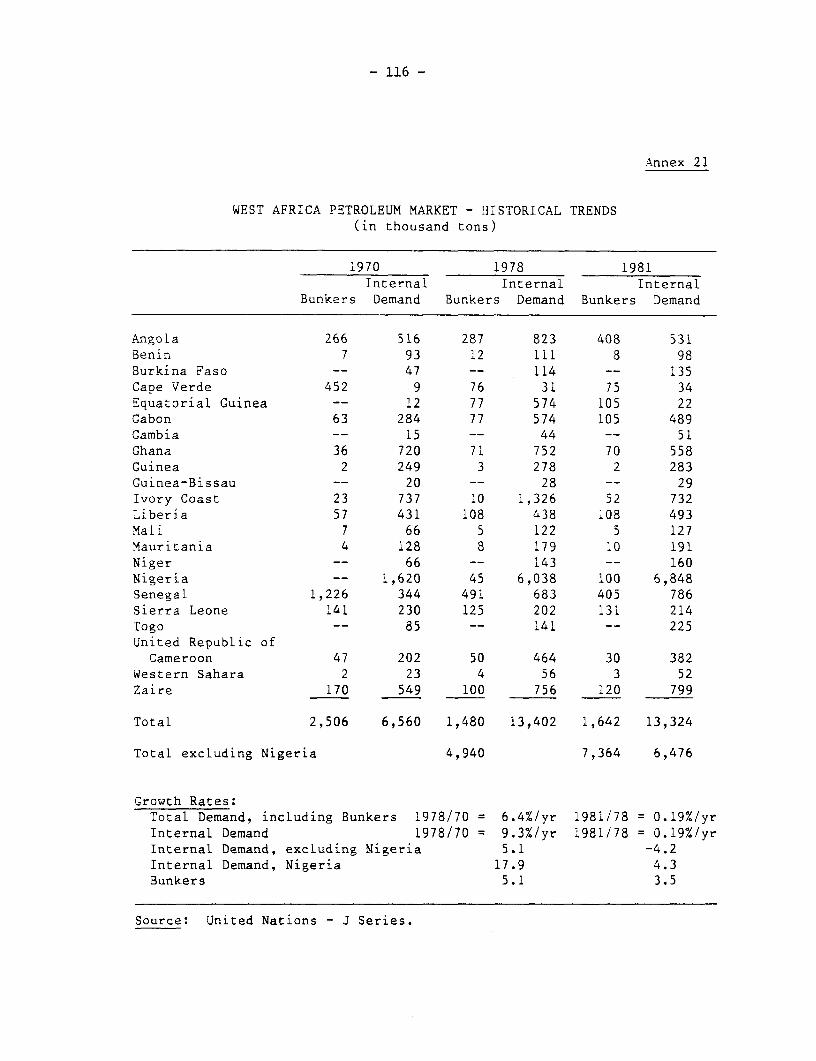
- 116 -
Annex 21
WEST AFRICA PETROLEUM MARKET - HISTORICAL TRENDS(in thousand tons)
1970 1978 1981Internal Internal Internal
Bunkers Demand Bunkers Demand Bunkers Demand
Angola 266 516 287 823 408 531Benin 7 93 12 lll 8 98Burkina Faso -- 47 -- 114 -- 135
Cape Verde 452 9 76 31 75 34Equatorial Guinea -- 12 77 574 105 22
Gabon 63 284 77 574 105 489Gambia -- 15 -- 44 -- 51
Ghana 36 720 71 752 70 558Guinea 2 249 3 278 2 283Guinea-Bissau -- 20 -- 28 -- 29Ivory Coast 23 737 10 1,326 52 732Liberia 57 431 i08 438 108 493Mali 7 66 5 122 5 127Mauritania 4 128 8 179 10 191Niger -- 66 -- 143 -- 160Nigeria -- 1,620 45 6,038 100 6,848SenegaL 1,226 344 491 683 405 786Sierra Leone 141 230 125 202 131 214Togo -- 85 -- 141 -- 225United Republic ofCameroon 47 202 50 464 30 382
Western Sahara 2 23 4 56 3 52Zaire 170 549 100 756 120 799
Total 2,506 6,560 1,480 13,402 1,642 13,324
Total excluding Nigeria 4,940 7,364 6,476
Growth Rates:
Total Demand, including Bunkers 1978/70 = 6.4%/yr 1981/78 = 0.19%/yrInternal Demand 1978/70 = 9.3%/yr 1981/78 = 0.19%/yrInternal Demand, excluding Nigeria 5.1 -4.2Internal Demand, Nigeria 17.9 4.3Bunkers 5.1 3.5
Source: United Nations - J Series.
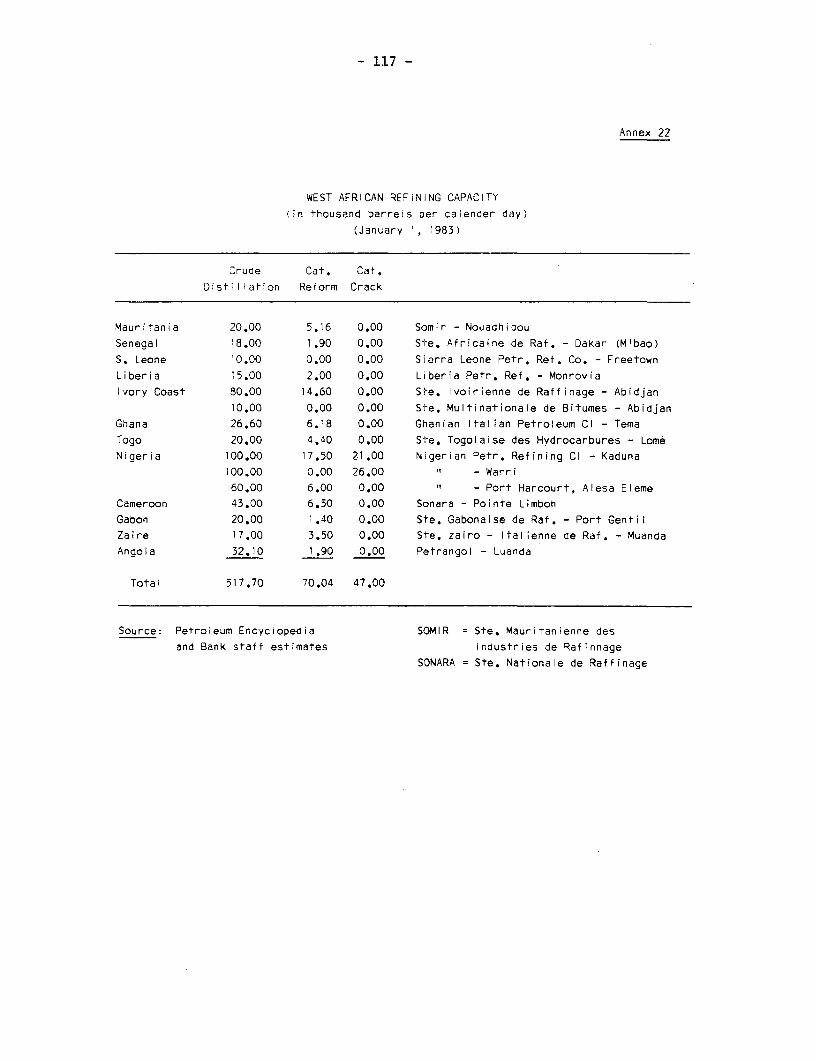
- 117 -
Annex 22
WEST AFRICAN REFINING CAPACITY
(in thousand barrels oer caiender day)
(January 1, '983)
Cruce Cat. Cat.
Distillation Reform Crack
Mauritania 20.00 5.16 0.00 Somir - Nouadhibou
Senegal 18.00 1.90 0.00 Ste. Africaine de Raf. - Dakar (M'bao)
S. Leone 10.00 0.00 0.00 Sierra Leone Petr. Ref. Co. - Freetown
Liberia 15.00 2.00 0.00 Liberia Petr. Ref. - Monrovia
Ivory Coast 80.00 14.60 0.00 Ste. Ivoirienne de Raffinage - Abidjan
10.00 0.00 0.00 Ste. Multinationale de Bitumes - Abidjan
Ghana 26.60 6.18 0.00 Ghanian Italian Petroleum Cl - Tema
Togo 20.00 4.40 0.00 Ste. Togolaise des Hydrocarbures - Lome
Nigeria 100.00 17.50 21.00 Nigerian Petr. Refining Cl - Kaduna
100.00 0.00 26.00 - Warri
60.00 6.00 0.00 - Port Harcourt, Alesa Eleme
Cameroon 43.00 6.50 0.00 Sonara - Pointe Limboh
Gabon 20.00 1.40 0.00 Ste. Gabonaise de Raf. - Port Gentil
Zaire 17.00 3.50 0.00 Ste. zairo - italienne de Raf. - Muanda
Angola 32.10 1.90 0.00 Petrangol - Luanda
Total 517.70 70.04 47.00
Source: Petroleum Encyclopedia SOMIR = Ste. Mauritanienne des
and Bank staff estimates Industries de Rafinnage
SONARA = Ste. Nationale de Raffinage
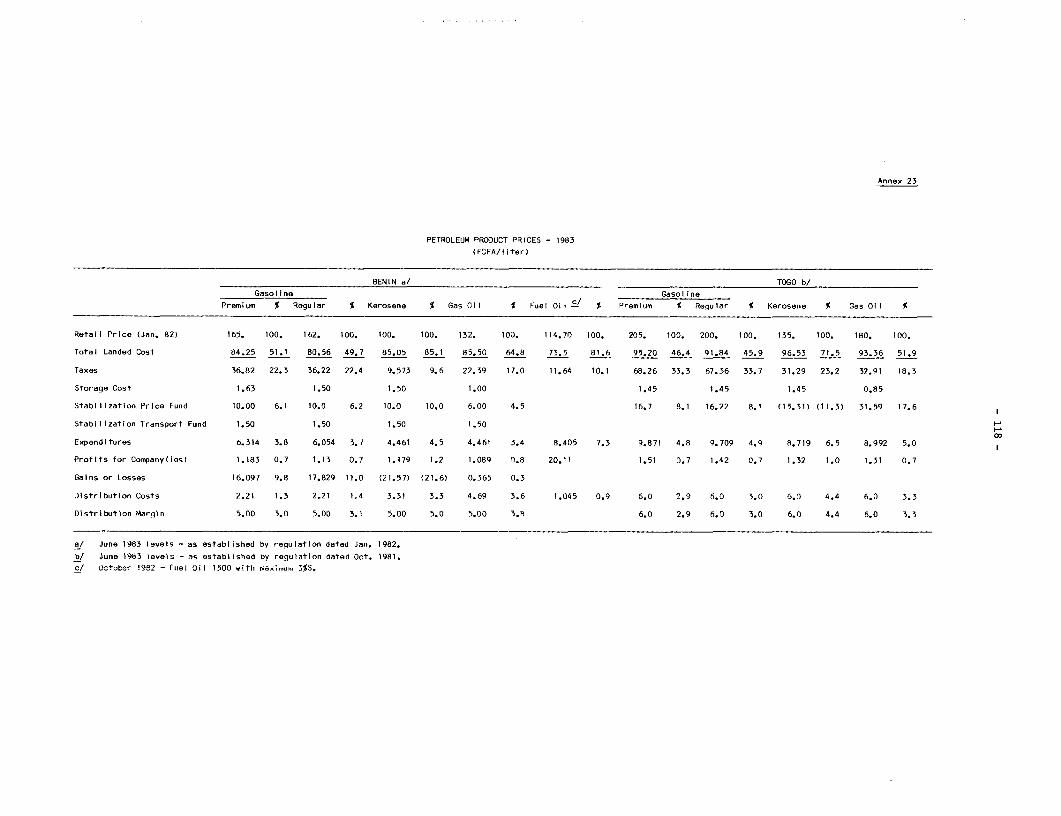
Annex 23
PETROLEUM PRODUCT PRICES - 1983
(FCFA/l Iter)
BENIN a/ TOGO b/Gasoline Gasoline
Premium % Regular % Kerosene % Gas Oil % Fuel Oi ic/ % Premium % Reqular S Kerosene S Gas OI I
RetaIl Price (Jan. 82) 165. 100. 162. 100. 100. 100. 132. 100. 114.70 100. 205. 100. 200. 100. 135. 100. 180. 100.
Total Landed Cost 84.25 51.1 80.56 49.7 85.05 85.1 85.50 64.8 73.5 81.6 95.20 46.4 91.84 45.9 96.53 71.5 93.36 51.9
Taxes 36.82 22.3 36.22 22.4 9.573 9.6 22.39 17.0 11.64 10.1 68.26 33.3 67.36 33.7 31.29 23.2 32.91 18.3
Storage Cost 1.63 1.50 1.50 1.00 1.45 1.45 1.45 0.85
Stabilization Price Fund 10.00 6.1 10.0 6.2 10.0 10.0 6.00 4.5 16.7 8.1 16.22 8.1 (15.311 (11.3) 31.59 17.6
Stabi I ization Transport Fund 1.50 1.50 1.50 1.50
Expenditures 6.314 3.8 6.054 3.7 4.461 4.5 4.461 3.4 8.405 7.3 9.871 4.8 9.709 4.9 8.719 6.5 8.992 5.0 1
Profits for Company(ies) 1.183 0.7 1.13 0.7 1.179 1.2 1.089 0.8 20.11 1.51 0.7 1.42 0.7 1.32 1.0 1.31 0.7
Gains or Losses 16.097 9.8 17.829 11.0 (21.57) (21.6) 0.365 0.3
Distrlbution Costs 2.21 1.3 2.21 1.4 3.31 3.3 4.69 3.6 1.045 0.9 6.0 2.9 6.0 3.0 6.0 4.4 6.0 3.3
Distributlon Margin 5.00 3.0 5.00 3.1 5.00 5.0 5.00 3.8 6.0 2.9 6.0 3.0 6.0 4.4 6.0 3.3
a/ June 1983 levels - as established by regulation dated Jan. 1982.
b/ June 1983 levels - as established by regulation dated Oct. 1981.c/ October 1982 - Fuel Oil 1500 with maximumu 3%S.
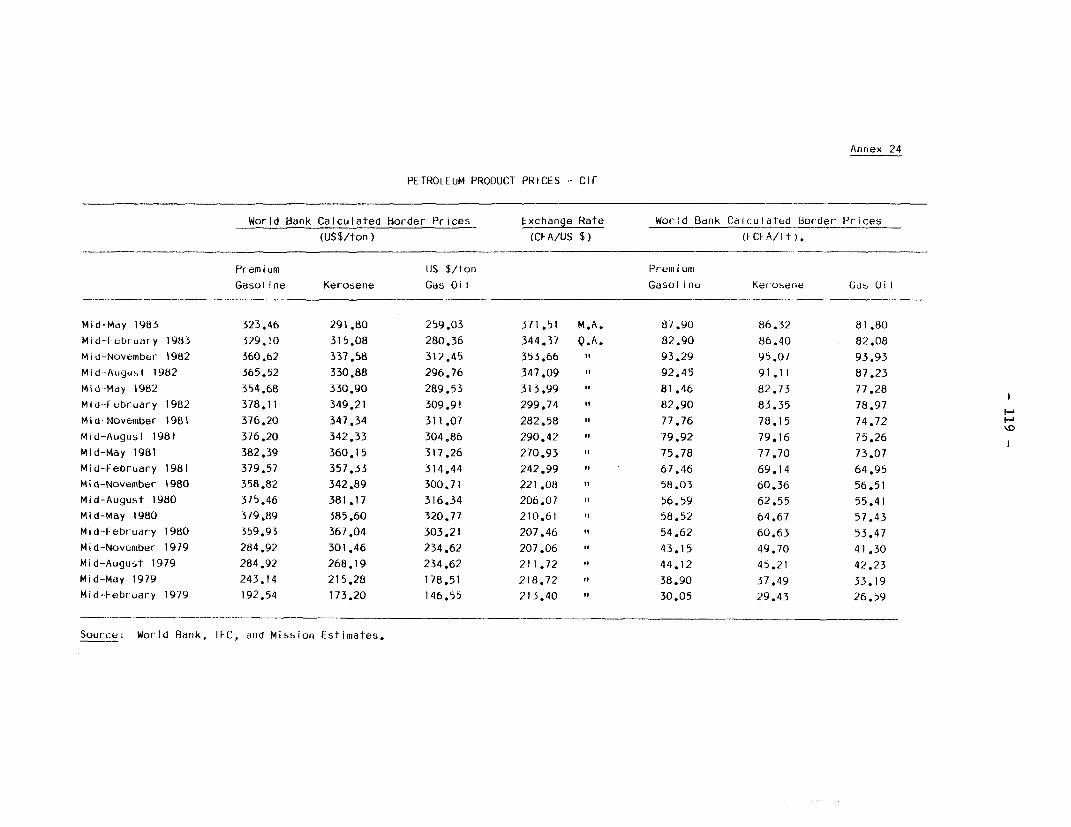
Annex 24
PETROLEUM PRODUCT PRICES - CIF
World Bank Calculated Border Prices Exchange Rate World Bdnk Calculated Bor-der Prices
(US$/ton) (CFA/US $) (FCFA/lt),
Premium US $/ton Premium
Gasoline Kerosene Gds Oil Gasoline Ker-obene Gds Oil
Mid-Mdy 1983 323.46 291.80 259.03 371.51 M.A. 87.90 86.32 81.80
Mid-lebruary 1983 329.10 315.08 280.36 344.37 Q.A. 82.90 86.40 82.08
Mid-November 1982 360.62 337.58 312.45 353.66 " 93.29 95.07 93.93
Mid-Aujguist 1982 365.52 330.88 296.76 347.09 " 92.45 91.11 87.23
Mid-May 1982 354.68 330.90 289.53 313.99 " 81.46 82.13 77.28
Mid-February 1982 378.11 349.21 309.91 299.74 " 82.90 83.35 78.97
Mid-November 1981 376.20 347.34 311.07 282.58 " 77.76 78.15 74.72 I'
Mid-August 1981 376.20 342.33 304.86 290.42 79.92 79.16 75.26
Mid-May 1981 382.39 360.15 317.26 270.93 75.78 77.70 73.07
Mid-February 1981 379.57 357.33 314.44 242.99 " 67.46 69.14 64.95
Mid-November 1980 358.82 342.89 300.71 221.08 " 58.03 60.36 56.51
Mid-August 1980 375.46 381.17 316.34 206.07 56.59 62.55 55.41
Mid-May 1980 319.89 385.60 320.77 210.61 58.52 64.67 57.43
Mid-Febr-uary 1980 359.93 367.04 303.21 207.46 " 54.62 60.63 53.47
Mid-November 1979 284.92 301.46 234.62 207.06 43.15 49.70 41.30
Mid-Augu,t 1979 284.92 268.19 234.62 211.72 44.12 45.21 42.23
Mid-Mdy 1979 243.14 215.28 178.51 218.72 " 38.90 37.49 33.19
Mid-February 1979 192.54 173.20 146.55 213.40 30.05 29.43 26.59
Sour-ce; World Bank, IFC, and Mission Estimates.

Annex 25
lOGO: VEHICLE RtGISIRAIION, 1974-1982 a/
(in kms)
New Regisirations
1974 1975 1976 1977 1978 1979 1980 1981 1982
Adminiistrative Classificaliogn
Passenger Cars 1,325 i,545 1,804 2,084 2,335 2,602 2,379 2,687 2,600
Pick-ups 333 465 515 817 722 1,039 897 637 560
Trucks 3.5t - 9t 101 119 128 282 210 167 162 137 82
over 91 29 22 60 113 124 114 80 129 80
ROdd Tractors 20 29 77 74 98 50 56 34 51
trailers 15 24 80 103 116 60 52 40 53
Minibuses -- -- 239 362
Buses 4 27 30 -- -- -- 10 27 18
Special Vehicles 18 64 62 21 9 150 52 34 II
Total 1,845 2,295 2,756 3,494 3,614 4,182 3,688 3,964 3,817
d/ there is no breakdown available between Government and private owned vehicles or detdi Led stdl ist ics on total vehicle
tleet. T-he estimdted vehicle fleet in 1981 is given in lable 6.
Source: General Directorate of Transport, Lome, September 1982 and October 1983.
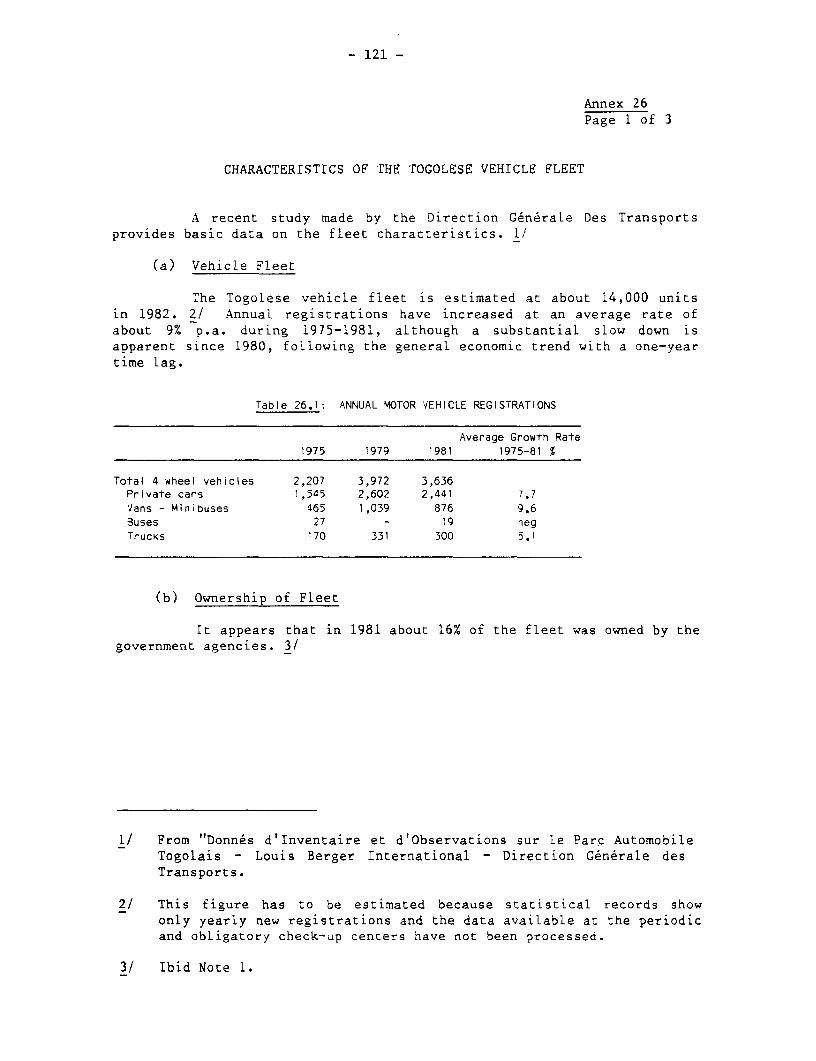
- 121 -
Annex 26Page 1 of 3
CHARACTERISTICS OF THE TOGOLESE VEHICLE FLEET
A recent study made by the Direction CGneraLe Des Transportsprovides basic data on the fleet characteristics. 1/
(a) Vehicle Fleet
The Togolese vehicle fleet is estimated at about 14,000 unitsin 1982. 2/ Annual registrations have increased at an average rate ofabout 9% p.a. during 1975-1981, aLthough a substantial slow down isapparent since 1980, following the general economic trend with a one-yeartime lag.
Table 26.1: ANNUAL MOTOR VEHICLE REGISTRATIONS
Average Growth Rate1975 1979 1981 1975-81 %
Total 4 wheei vehicles 2,207 3,972 3,636Private cars 1,545 2,602 2,441 7.7Vans - Minibuses 465 1,039 876 9.6Buses 27 - 19 neg
Trucks 170 331 300 5.1
(b) Ownership of Fleet
It appears that in 1981 about 16% of the fleet was owned by thegovernment agencies. 3/
1/ From "Donnes d'Inventaire et d'Observations sur le Parc AutomobileTogolais - Louis Berger International - Direction Generale desTransports.
2/ This figure has to be estimated because statistical records showonly yearly new registrations and the data available at the periodicand obligatory check-up centers have not been processed.
3/ Ibid Note 1.
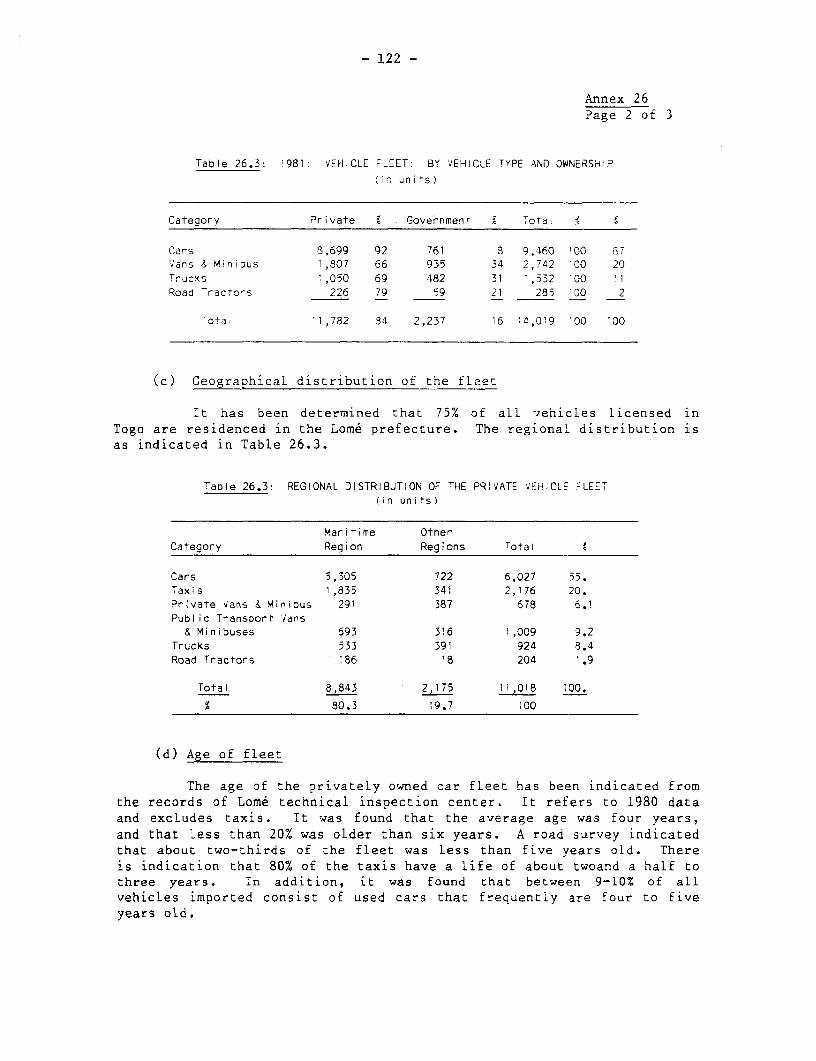
- 122 -
Annex 26Page 2 of 3
Table 26.3: 1981: VEHICLE FLtEET: BY VEHICLE TYPE AND OWNERShIP
(in units)
Category Private X Government ota To
Cars 2,699 92 761 S 9,460 100 67Vans & Minibus 1,807 66 935 34 2,742 '00 20TrucKS ,050 69 482 31 1,532 '00 1'Road -racTors 226 79 59 21 285 '00 2
~otaI '1,782 34 2,237 16 14,019 100 '00
(c) Geographical distribution of the fleet
It has been determined that 75% of all vehicles licensed inTogo are residenced in the Lom6 prefecture. The regional distribution isas indicated in Table 26.3.
Table 26.3: REGlONAL DISTRIBUTION OF THE PRIVATE VEHICLE FLEET(in units)
Maritime OtherCategory Region Regions Total
Cars 5,305 722 6,027 55.Taxis 1,835 341 2,176 20.Private Vans & Minibus 291 387 678 63.Public Transport Vans& Minibuses 693 316 1,009 9.2
TrucKs 533 391 924 8.4Road Tractors '86 18 204
Total 8,843 2,175 11,018 '00.
a 80,3 19.7 1o0
(d) Age of fleet
The age of the privately owned car fleet has been indicated fromthe records of Lome technical inspection center. It refers to 1980 dataand excludes taxis. It was found that the average age was four years,and that Less than 20% was older than six years. A road survey indicatedthat about two-thirds of the fleet was less than five years old. Thereis indication that 80% of the taxis have a life of about twoand a half tothree years. In addition, it was found that between 9-10% of allvehicles imported consist of used cars that frequently are four to fiveyears old.

- 123 -
Annex 26Page 3 of 3
(e) Engine rating
It is also apparent that the engine-ratings of the cars Licensedhave increased substantially during the last four years. In 1982, 90% oflicensed private cars had engine ratings of 7 or more Hp, contrastingwith only 52.5% in 1978. Among taxis, the proportion of cars with 7 ormore Hp increased from 27% in 1978 to 85% in 1982. Given the fact that50-60% of alL person transport is made by taxi, change in cylinder ratinghas an important effect on petroleum consumption.
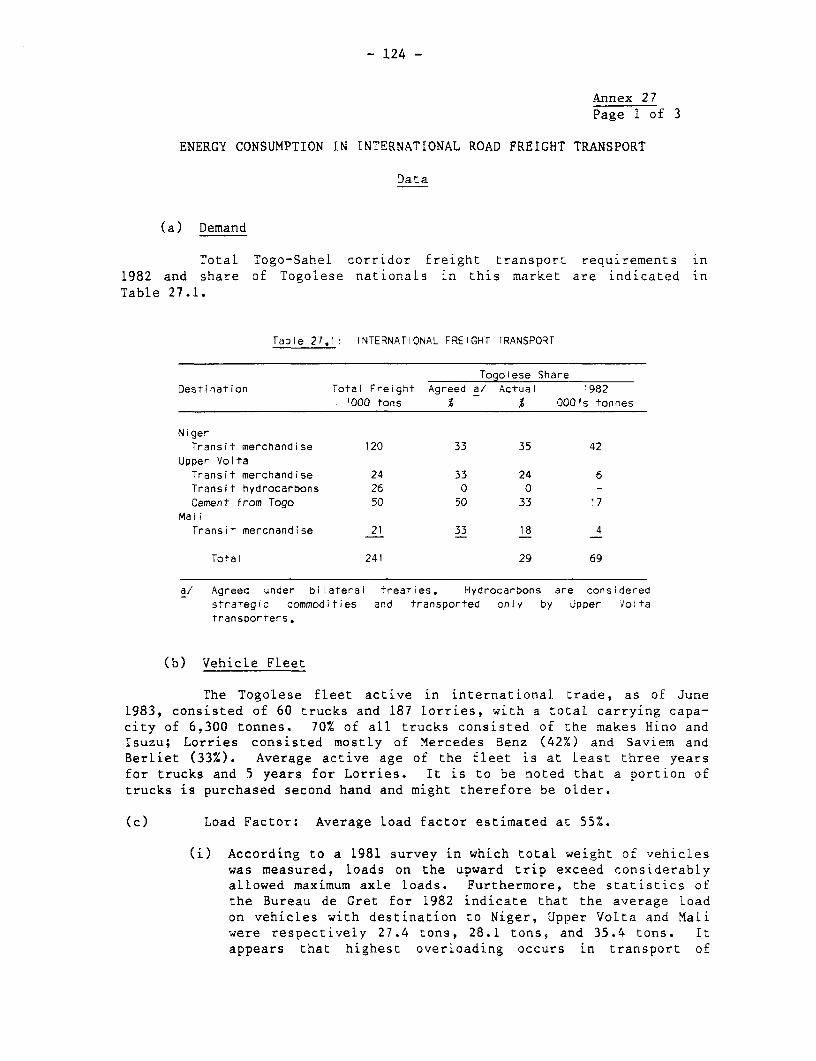
- 124 -
Annex 27Page 1 of 3
ENERGY CONSUMPTION IN INTERNATIONAL ROAD FREIGHT TRANSPORT
Data
(a) Demand
Total Togo-Sahel corridor freight transport requirements in1982 and share of TogoLese nationals in this market are indicated inTable 27.1.
Table 27.1: INTERNATIONAL FREIGHT TRANSPORT
Togolese ShareDestination Totai Freight Agreed a/ Actual 1982
1000 tons % % 000's tonnes
NigerTransit merchandise 120 33 35 42
Upper VoltaTransit merchandise 24 33 24 6Transit hydrocarbons 26 0 0 -Cement from Togo 50 50 33 17
MaiiTransit merchandise 21 33 18 4
Total 241 29 69
a/ Agreed under bilateral treaties. Hydrocarbons are consideredstrategic commodities and transported only by Upper Voltatransporters.
(b) Vehicle Fleet
The Togolese fleet active in international trade, as of June1983, consisted of 60 trucks and 187 lorries, with a total carrying capa-city of 6,300 tonnes. 70% of all trucks consisted of the makes Hino andIsuzu; Lorries consisted mostly of Mercedes Benz (42%) and Saviem andBerliet (33%). Average active age of the fleet is at least three yearsfor trucks and 5 years for Lorries. It is to be noted that a portion oftrucks is purchased second hand and might therefore be older.
(c) Load Factor: Average load factor estimated at 55%.
(i) According to a 1981 survey in which total weight of vehicLeswas measured, loads on the upward trip exceed considerablyallowed maximum axle loads. Furthermore, the statistics ofthe Bureau de Gret for 1982 indicate that the average loadon vehicles with destination to Niger, Upper Volta and Maliwere respectively 27.4 tons, 28.1 tons, and 35.4 tons. Itappears that highest overloading occurs in transport of

- 125 -
Annex 27Page 2 of 3
cereals (corn, millet, rice, wheat) powdered milk, sugar,batteries, and cement (35 to 41 tonnes).
(ii) Very low load factors appear to exist in the downwardtrip. This is evident from the total international flowfigures:Total outbound 320,000 tons - 330 million ton-kmTotal inbound 80,000 tons - 35 million ton-km
A significant portion of the inbound traffic corresponds totrade with Benin.
The very low transport requirements from the Sahel towards Togo is due tothe preference of using railroads in Ivory Coast and Benin.
(d) Use of total fleet (1982)
DistributionTonnes Tons-kms Average distance
Types of Vehicles % kms
Vans a/ 3 250TrucKs b/ 15 9 550Lorries c/ 82 90 '000
Total 100 100
Total 1982: 400 365 million
a/ Vans are used mostly to transport fruits, vegetables, beer andtextiles between Lome and Cotonou. Payload assumed 1.5 tons.
b/ Trucks mainly used for trade with Benin and for transporting con-struction material. Some trucks are based in Sokode ror foodtransport to Upper Volta.
c/ Lorries serve the long distance hauls from Lome to Sahel countries(1,000 kms to Ouagadougou and 1,250 kms to Niamey). include regularLorries, container carriers and tank trucks.
(e) Average annual utilization of vehiclesIn the international trade, it is estimated that average annual
use is on the order of 50,000 kms. This relatively low utilizationfactor is due to the long waiting time in loading and unloading.
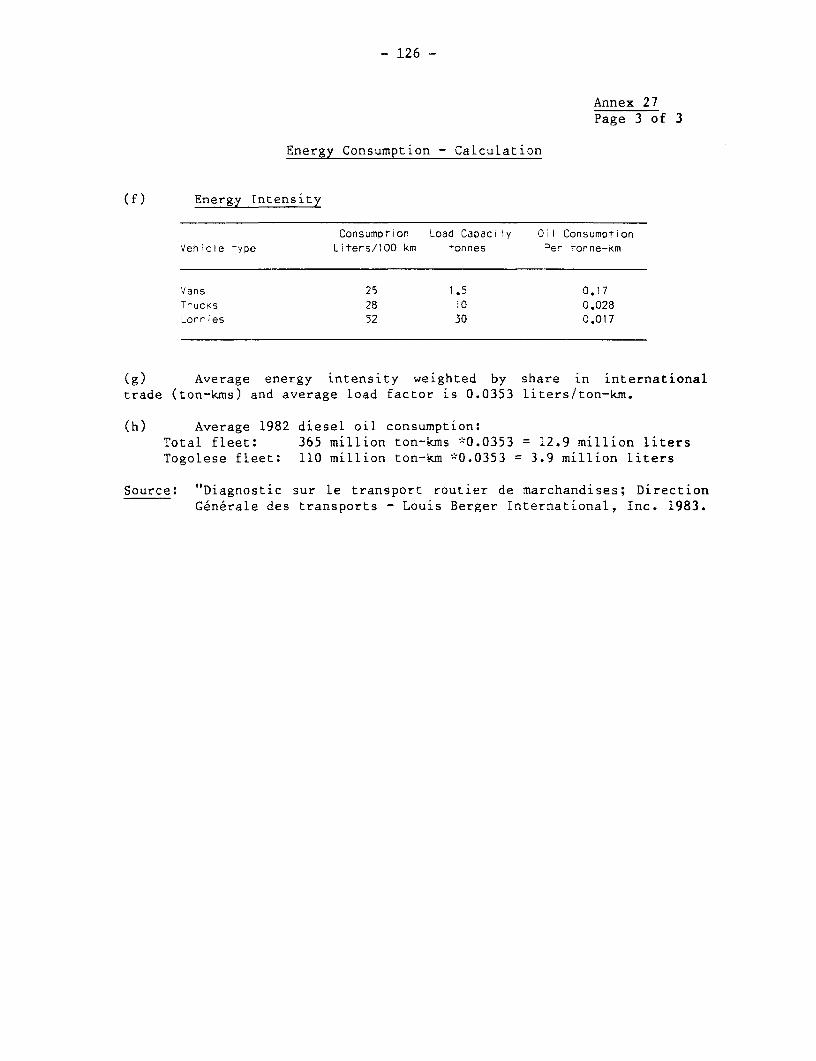
- 126 -
Annex 27Page 3 of 3
Energy Consumption - Calculation
(f) Energy Intensity
Consumption Load Capacity Oil ConsumptionVehicle type Liters/100 km tonnes Per tonne-Km
Vans 25 1.5 0.17Trucks 28 10 0.028Lorries 52 30 0.017
(g) Average energy intensity weighted by share in internationaltrade (ton-kms) and average load factor is 0.0353 liters/ton-km.
(h) Average 1982 diesel oil consumption:Total fleet: 365 million ton-kms *0.0353 = 12.9 million litersTogolese fleet: 110 million ton-km *0.0353 3.9 million liters
Source: "Diagnostic sur le transport routier de marchandises; DirectionGenerale des transports - Louis Berger International, Inc. 1983.
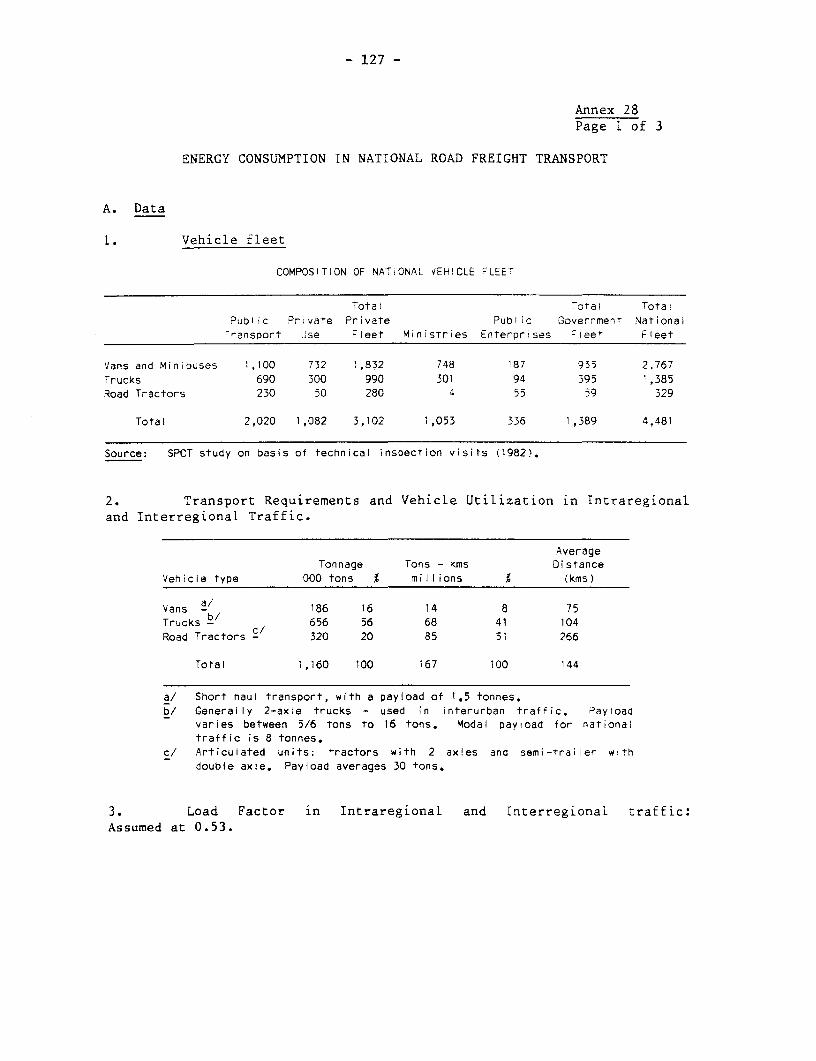
- 127 -
Annex 28Page 1 of 3
ENERGY CONSUMPTION IN NATIONAL ROAD FREIGHT TRANSPORT
A. Data
1. Vehicle fleet
COMPOSITION OF NATIONAL VEHICLE FLEET
Total otal TotalPublic Private Private Public Government NationaiTransport Use Fleet Ministries Enterprises mleet Fleet
Vans and Minibuses 1,100 732 1,832 748 187 935 2.767Trucks 690 300 990 301 94 395 1,385Road Tractors 230 ,0 280 4 55 59 329
Total 2,020 1,082 3,102 1,053 336 1,389 4,481
Source: SPCT study on basis of technical inspection visits (1982).
2. Transport Requirements and Vehicle Utilization in Intraregionaland Interregional Traffic.
AverageTonnage Tons - kms Distance
Vehicie type 000 tons % millions (kms)
Vans '1 186 16 14 8 75Trucks b/ 656 56 68 41 104Road Tractors - 320 20 85 51 266
Total 1,160 100 167 100 144
a/ Short haul transport, with a payload of 1.5 tonnes.b/ Generally 2-axle trucks - used in interurban traffic. Payload
varies between 5/6 tons to 16 tons. Modal pavyoad for nationaltraffic is 8 tonnes.
c/ Articulated units: tractors with 2 axles ana semi-trailer withdouble axle. Payload averages 30 tons.
3. Load Factor in Intraregional and Interregional traffic:Assumed at 0.53.

- 128 -
Annex 28Page 2 of 3
Preliminary data from the traffic flow study showed thefollowing values:
Number of Total Averagevehicles per load per Loadaverage day tons vehicleFactor a
Vans 2429 512 0.21 14%Trucks (light) 593 1789 3.02 38%Trucks (heavy) 75 842 11.23 37%
a/ Local factor calculated assuming payload is 1.5 tonnesfor vans, 8 tons for trucks and 30 tons for heavytonnes.
These load factor estimates appear to be too low. The trafficflow study indicated that demand for transport in intraregional andinterregional trade was better balanced than the international flow, asindicated by the following flow tonnages:
Type '000 tons
Total freight: 1160Intra-regional 640Maritime region (400)
Interregional 520Upward bound (340)Downward bound (180)
However, the reasons why load factors may be considerably lowerthan estimated flow tonnages are the relatively large share of governmentowned fleet with low load factors, the seasonality of transport demand,and the 1982 surplus capacity.
4. Utilization Factor
The transport study estimates an average of 50-60,000 kms/yearutilization of privately owned fleet and of 20,000 - 30,000 kms/year forgovernment owned fleet.
5. Intracity Transport Requirements
There is no data available to evaluate transport requirementswithin Lom6.

- 129 -
Annex 28Page 3 of 3
B. Calculations of Energy Consumption
6. Energy Intensity
Consumption Load Capacity Oil ConsumptionVehicle type iters!100 kms (tonnes) (per ton/km)
Vans i3.5 1.5 0.09Trucks 28 8. 0.028
Lorries 52 30. 0.017
The average energy consumption, weighted by the share of eachvehicle type in total freight transport requirements (in tons-kms) and bythe average load factor (0.53), is 0,516 liters/tons-kms.
7. Energy Consumption
The share of diesel engines in the category "vans" is notknown. In the following, it is assumed that all vans have sparkengines. All trucks and lorries are assumed to have diesel engines.
(a) Intra-Interregional traffic: oil consumption is estimated atGasoline: 2,400 m3 (energy intensity 0.170)Diesel: 6,900 m3 (energy intensity 0,0451)
based on energy intensity, load factor and share in totaltraffic.
(b) Total consumption, including city transport, can be estimatedon the basis of average per vehicle consumption, annualutilization factor, and total number of vehicles in eachcategory.
Vans a/ b/ gasoline 9,900 m3Trucks b/ c/ diesel 11,300 m3Lorries b/ c/ diesel 5,500 m3
a/ The number of vans is estimated at two-thirds of total numberof vehicles in this category. The rest is allocated tominibuses.
b/ Utilization factor used in all categories was 20,000 km/yearfor government owned and 50,00 km/year for privately ownedfleet.
c/ Given the fact that many trucks in this trade are worn-out, itis estimated that only 70% of all registered vehicles areoperating.
Source of data: "Diagnostic sur le Transport Routier de Marchandises",Direction CGnerale des Transports - Louis BergerInternational, Inc., 1983.
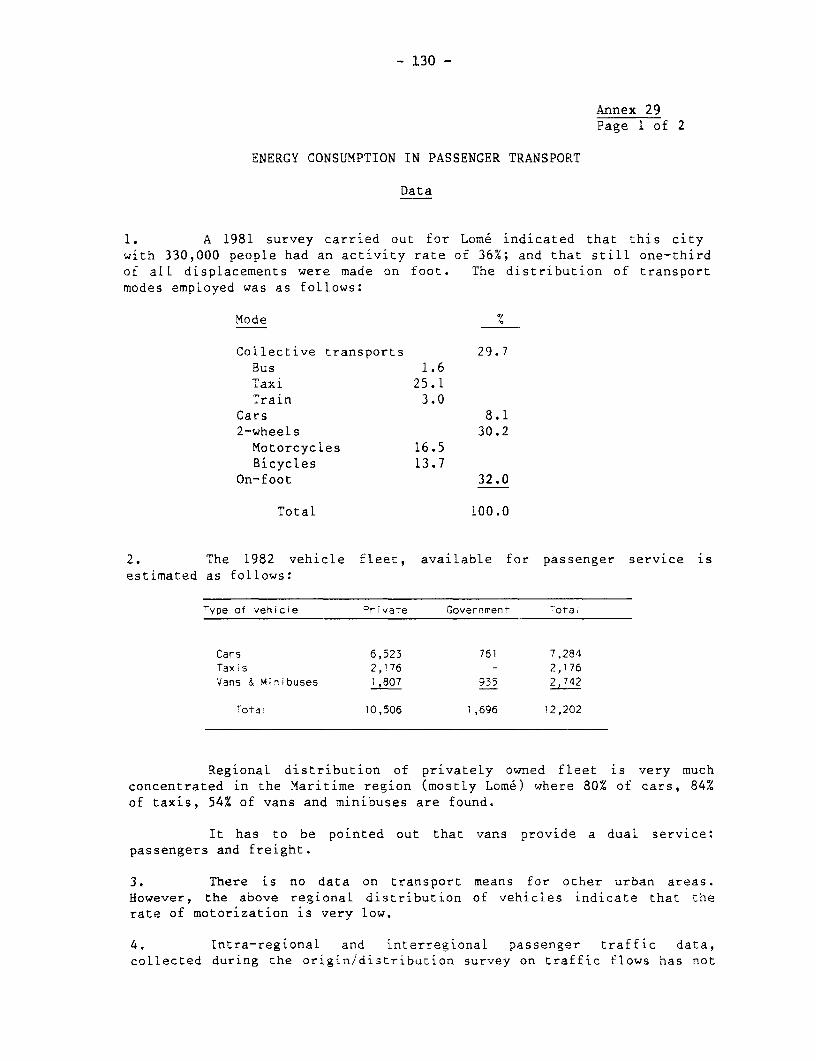
- 130 -
Annex 29Page 1 of 2
ENERGY CONSUMPTION IN PASSENGER TRANSPORT
Data
1. A 1981 survey carried out for Lome indicated that this citywith 330,000 people had an activity rate of 36%; and that still one-thirdof all displacements were made on foot. The distribution of transportmodes employed was as follows:
Mode %
Collective transports 29.7Bus 1.6Taxi 25.1Train 3.0
Cars 8.12-wheels 30.2Motorcycles 16.5Bicycles 13.7
On-foot 32.0
Total 100.0
2. The 1982 vehicle fleet, available for passenger service isestimated as follows:
Type of vehicle Private Government Total
Cars 6,523 761 7,284Taxis 2,176 - 2,176
Vans & Minibuses 1,807 935 2,742
Total 10,506 1,696 12,202
Regional distribution of privately owned fleet is very muchconcentrated in the Maritime region (mostly Lome) where 80% of cars, 84%of taxis, 54% of vans and minibuses are found.
It has to be pointed out that vans provide a dual service:passengers and freight.
3. There is no data on transport means for other urban areas.However, the above regional distribution of vehicles indicate that therate of motorization is very low.
4. Intra-regional and interregional passenger traffic data,collected during the origin/distribution survey on traffic flows has not
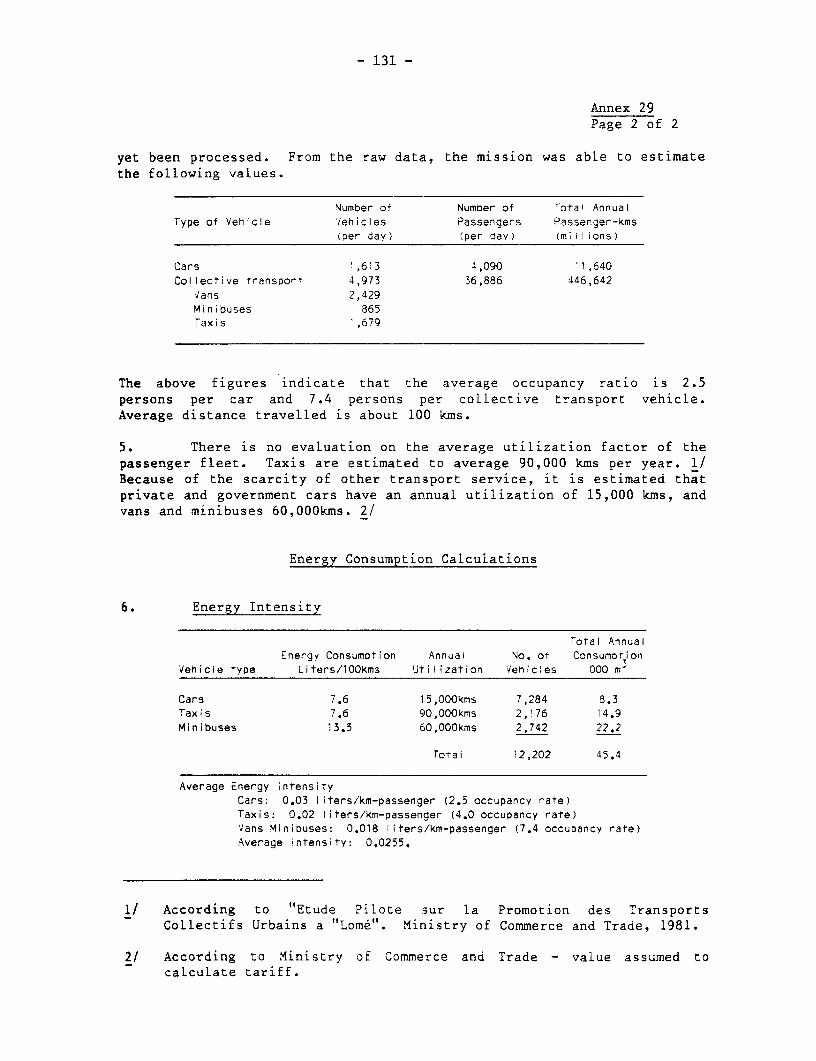
- 131 -
Annex 29Page 2 of 2
yet been processed. From the raw data, the mission was able to estimatethe following values.
Number of Number of rotal AnnualType of Vehicle Vehicles Passengers Passenger-Kms
(per day) (per day) (miilions)
Cars ',613 1,090 '1,640Collective transporT 1,973 36,886 .146,642
ians 2,429Minibuses 865Taxis ',679
The above figures indicate that the average occupancy ratio is 2.5persons per car and 7.4 persons per collective transport vehicle.Average distance travelled is about 100 kms.
5. There is no evaluation on the average utilization factor of thepassenger fleet. Taxis are estimated to average 90,000 kms per year. 1/Because of the scarcity of other transport service, it is estimated thatprivate and government cars have an annual utilization of 15,000 kms, andvans and minibuses 60,000kms. 2/
Energy Consumption Calculations
6. Energy Intensity
,otal AnnualEnergy Consumption Annual No. of Consumotion
Vehicle type Liters/lOOkms Utilization Vehicles 000 m'
Cars 7.6 15,000kms 7,284 8.3Taxis 7.6 90,OOOkms 2,176 14.9Minibuses 13.5 60,000kms 2,742 22.2
ToTal 12,202 45.4
Average Energy intensityCars: 0.03 liters/km-passenger (2.5 occupancy rate)Taxis: 0.02 liters/km-passenger (4.0 occupancy rate)Vans Minibuses: 0.018 liters/km-passenger (7.4 occupancy rate)Average intensity: 0.0255.
1/ According to "Etude Pilote sur la Promotion des TransportsCollectifs Urbains a "Lom6". Ministry of Commerce and Trade, 1981.
2/ According to Ministry of Commerce and Trade - value assumed tocalcuLate tariff.

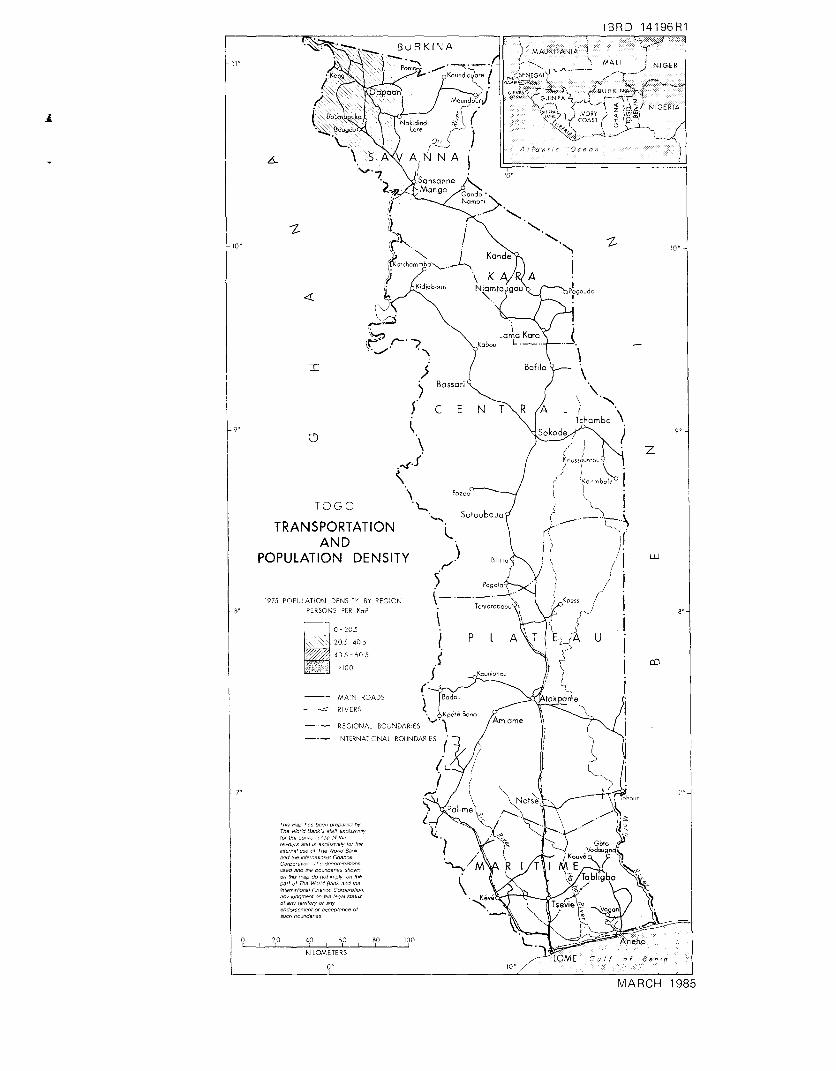
IBRD 14196R1
/ MAURITANIA
IRoog Koen2dloute i r)SENEG~E~dh *~ MALI 9 NIGER
* z RDapa < GUNEK 7~~~~~ S C BURKIN[~A jDapoon M I / Ao<dou<J e ssAu XUINrAi < rs *V2)@ Zz j NIGERIA
^ \ S AR Ag~~~~AN N A i _,
I $ ( BNcfSAo.
1-Z
Tid~ e O OoNiamto u goas P.9-do
TRANSPORTATION
POPULATION DENSITY )!
975 POPL ATION DENS T> BY REGION Pogoo Kpe-80 PERSONS PER Kr Tch\
0 Q-20 5 \< 5205-405 P U40 5- 60Q5 s
MAIN ROADS ; dtkpameRIVERS
-. - REGIONAL BOUNDARIES MAlame
NTERNA- ONAL BOUNDAR E5
70~ ~~~~~~~~~~~~~~~~~~7rOe Weno Oank<S <&P
f.,~~~~~~~~X1e th\,\
P0 ,he C0h hhe Gl 8-k -d&eoodf,s 6n -hone 0 fr thene
olnteMdlf tte ol Tht V/enld Bark.% {Vd ,b'.
KIe.rlOe TErSeo,.j M,E forCC
par! Gl rhe Wf *' Bane ero 'hfe ¢v.\X.o In&rnteora/eForatt,,ce fo ,rPoroo .\2\s/I1\Mah,ny,OOdent or the legol sota hv o t g of td01ee 0000 or ace0n0 f, \ p0n enh oun,nereest |otaooe== ==
0 20 40 68 E0 155Q : nhKIE/ON,ETERS LM ;/ pf
O 10M
MARCH 1985

I
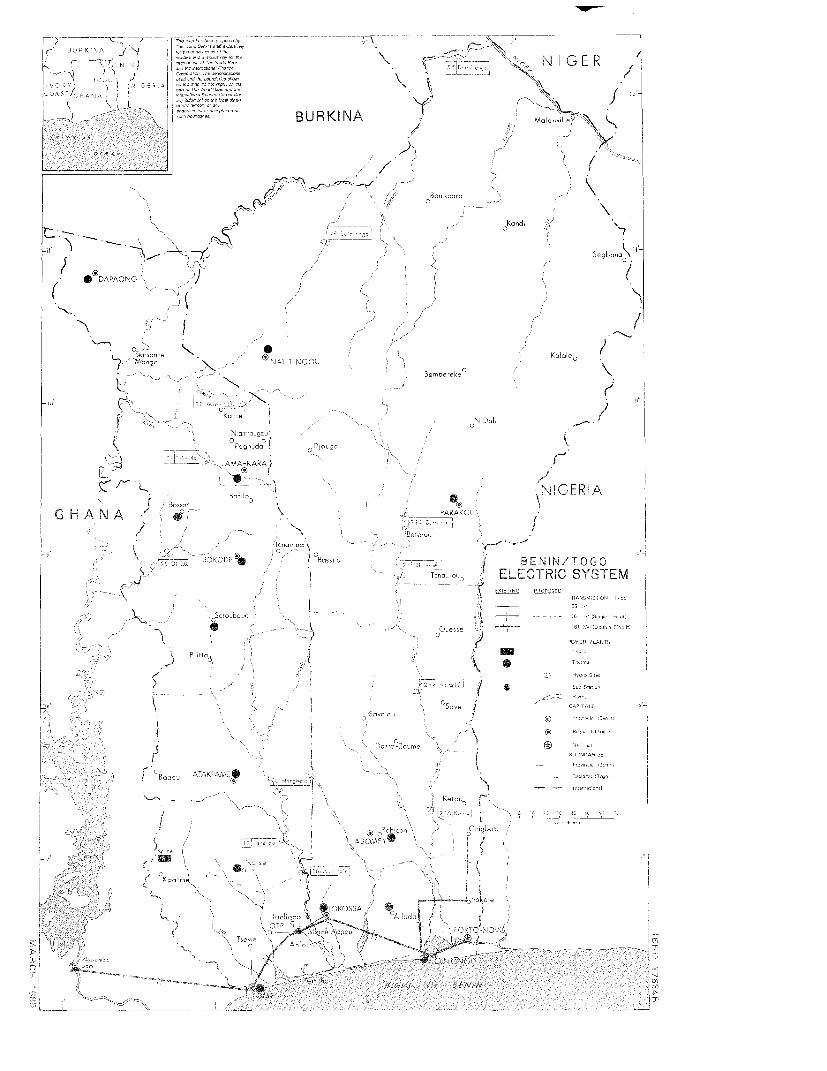
INRK >JA ....--7R,J -- I __
BURKINA '- Z m .K IF -- ~~~~~~~~~~ $~~and,
A -r Y~~~~~~~~~~~~~~~~~~~~~~~~~~~~~~~~~~~~~~~~~0DA>ACNG)
7 Us9oago ®~~~~~~~NA IT NGO-U Beb'ee
K -~~~~~~~~~~~~~~~~~~~~ -) ...-
LAMA-KARA C
Bo>a N~~~~~~~~~~~~~~~~~~~~ CE: P 1A
G H A N A N iv0
Ak o~~K~OKa CV -1ENINTCBa>s ~ ~ :h. aY TEM~,' tear> ELECTRIC SYSE
-~~~~~~~~~~~~~~~~~~~~~1 ~~~~ ~ ~ ~ ~ ~ -
S - 0~~~~~~~~~~~~~~~S F> T-r ,
Sot-s~~~~~~~~~~~~Kt
J S 5~~~~~~~~~~~~~~~S
RI~~~~~~5
T,~~~~~~~~~~snS
f FJ0O~~~~~~~~~~~~~~~~~~~~ 6 liI

Id w
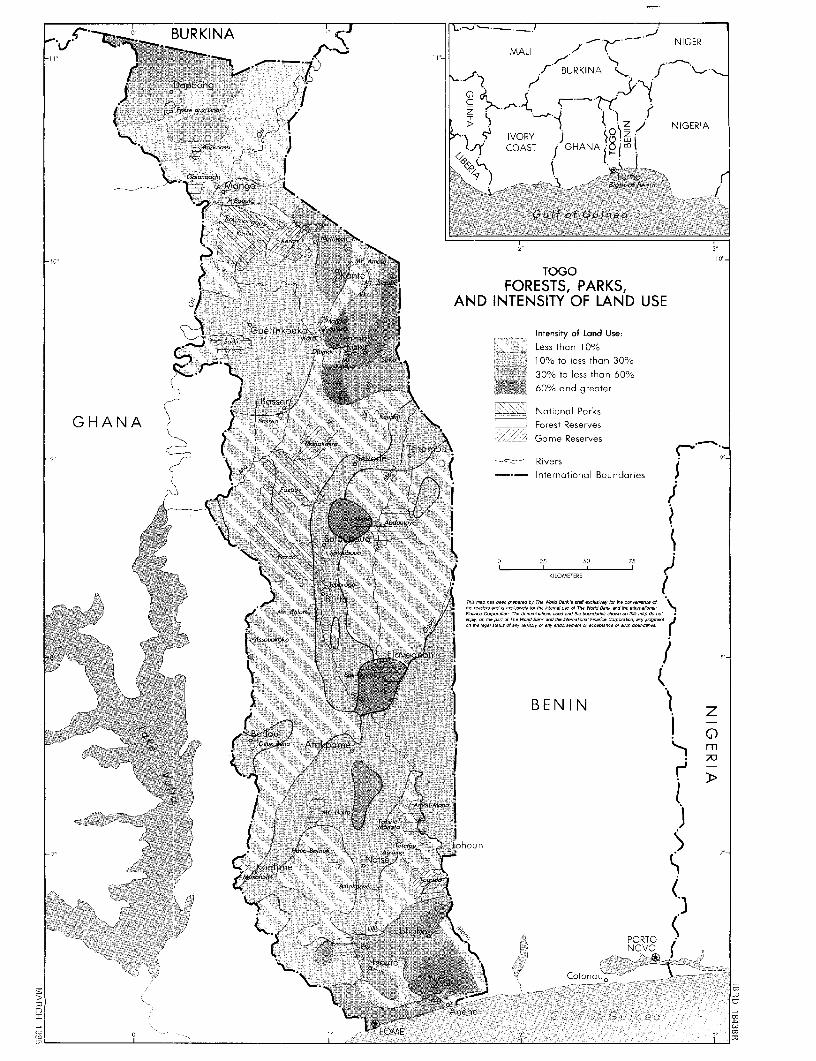
_vC , BURKINA S MALI r NIGERMALI
r119 Kt 7- --. ;4 12 r BURKINA
( - Fgsseacc n /5;Z ,, 5 Z j NIGERIA0" < .: _ t .o't ; 9 ' Sa IVORY j 0 *I .syoussl (>_J J g/d C COAST f GHANA '2!
Mang&- K .- 3 <t-iLornL N
--o- Q i4 . -0; f0 0 0f i 000 -0 GCutIf of Guinea
TOGO
/ Cl = , E grwr¢iFORESTS, PARKS,o/ : ) =< <z-; - tj AND INTENSITY OF LAND USE
nG ouk to tIntensity of Land Use:
eN) Sf opX {J _ Less than 10%SAc' 10%~~~~I'/ to less than 30%
30% to less than 60%2 i / 2 .---. k- AN: . 60% and greater
z / {;~~Bossortf/ L-
G H A N A ) ) t - 0 0 ;;<)/ *\ . National ParksGHANA ~ ~ ~ ~~asc 9 N____Forest Reserves
F Maffakaist, ~~~~~~Gamne Reserves
9 (3i -0 X z _--t 4( Rivers IiInternational Bu ndaries
<s!s s siz Th cOt Oct cc TheCb!h aca>iffb sissel
_ - jjAssssckakc 5K LOrMEER5
I I~~~~~~~~~ ' <-- <? ; g !3 a: ~~~Atc^ o m
sIc>~~~~~~
K ;= -1' i; .I 03~N .30 ; ; -MD
>-iDiLD;'j>s / ? ' / Tetes TaiJhoun
v ;i 0 i -:( C J J t X Notse 6 ,r -
c$> a\S Sbet Amv F!N sK N~~~~~~~~~~~~~~~NV
.~~~~~~ .- y Tarbl .b. .G
C:9k MI Cotoncu >V` in7-3
> 1-
n~~~~~~~~~~~~~~~~~~~~~~~~~~~~~iil e
2 0 03~~~
Related Documents