Name: Shailesh Kumar Registration Number: 511035200 Semester: 3 rd Specialized Stream: Information Systems Management MBA SEMESTER III MB0050 – Research Methodology- 4 Credits Assignment Set- 1 (60 Marks) Question 1: Why should a manger know about research when the job entails managing people, products, events, environments, and the like? Answer: Research simply means a search for facts – answers to questions and solutions to problems. It is a purposive investigation. It is an organized inquiry. It seeks to find explanations to unexplained phenomenon to clarify the doubtful facts and to correct the misconceived facts. Research is the organized and systematic inquiry or investigation which provides information for solving a problem or finding answers to a complex issue. Research in business: Often, organization members want to know everything about their products, services, programs, etc. Your research plans depend on what information you need to collect in order to make major decisions about a product, service, program, etc. Research provides the needed information that guides managers to make informed decisions to successfully deal with problems. The more focused you are about your resources, products, events and environments what you want to gain by your research, the more effective and efficient you can be in your research, the shorter the time it will take you and ultimately the less it will cost you. Manager’s role in research programs of a company: Managing people is only a fraction of a manager's responsibility - they have to manage the operations of the department, and often have responsibilities towards the profitability of the organization. Knowledge of research can be very helpful for a good manager. Question 2: a. How do you evolve research design for exploratory research? Briefly analyze. b. Briefly explain Independent, dependent and extraneous variables in a research design. Answer: a. Research design for e xploratory research: Research simply means a search for facts – answers to questions and solutions to problems. It is a purposive investigation. It is an organized inquiry. It seeks to find explanations to unexplained phenomenon to clarify the doubtful facts and to correct the misconceived facts. Although any typology of research is inevitably arbitrary, Research may be classified crudely according to its major intent or the methods. It is also known as formulating research. It is preliminary study of an unfamiliar problem about which the researcher has little or no knowledge. It is ill-structured and much less focused on pre- determined objectives. It usually takes the form of a pilot study. The purpose of this research may

Welcome message from author
This document is posted to help you gain knowledge. Please leave a comment to let me know what you think about it! Share it to your friends and learn new things together.
Transcript
8/3/2019 511035200 MB0050 Research Methodology
http://slidepdf.com/reader/full/511035200-mb0050-research-methodology 1/14
Name: Shailesh Kumar Registration Number: 511035200 Semester: 3rd
Specialized Stream: Information Systems Management
MBA SEMESTER III MB0050 – Research Methodology- 4 Credits
Assignment Set- 1 (60 Marks)
Question 1: Why should a manger know about research when the job entails managing people,
products, events, environments, and the like?
Answer:
Research simply means a search for facts – answers to questions and solutions to problems. It is a
purposive investigation. It is an organized inquiry. It seeks to find explanations to unexplained
phenomenon to clarify the doubtful facts and to correct the misconceived facts. Research is the
organized and systematic inquiry or investigation which provides information for solving a problem or
finding answers to a complex issue.
Research in business:
Often, organization members want to know everything about their products, services, programs, etc.
Your research plans depend on what information you need to collect in order to make major decisions
about a product, service, program, etc. Research provides the needed information that guides
managers to make informed decisions to successfully deal with problems.
The more focused you are about your resources, products, events and environments what you want to
gain by your research, the more effective and efficient you can be in your research, the shorter the time
it will take you and ultimately the less it will cost you.
Manager’s role in research programs of a company:
Managing people is only a fraction of a manager's responsibility - they have to manage the operationsof the department, and often have responsibilities towards the profitability of the organization.
Knowledge of research can be very helpful for a good manager.
Question 2:
a. How do you evolve research design for exploratory research? Briefly analyze.
b. Briefly explain Independent, dependent and extraneous variables in a research design.
Answer:
a. Research design for exploratory research:
Research simply means a search for facts – answers to questions and solutions to problems. It is a
purposive investigation. It is an organized inquiry. It seeks to find explanations to unexplained
phenomenon to clarify the doubtful facts and to correct the misconceived facts. Although any
typology of research is inevitably arbitrary, Research may be classified crudely according to its
major intent or the methods.
It is also known as formulating research. It is preliminary study of an unfamiliar problem about
which the researcher has little or no knowledge. It is ill-structured and much less focused on pre-
determined objectives. It usually takes the form of a pilot study. The purpose of this research may
8/3/2019 511035200 MB0050 Research Methodology
http://slidepdf.com/reader/full/511035200-mb0050-research-methodology 2/14
Name: Shailesh Kumar Registration Number: 511035200 Semester: 3rd
Specialized Stream: Information Systems Management
be to generate new ideas, or to increase the researcher’s familiarity with the problem or to make a
precise formulation of the problem or to gather information for clarifying concepts or to
determine whether it is feasible to attempt the study. Katz conceptualizes two levels of
exploratory studies. “At the first level is the discovery of the significant variable in the situations;
at the second, the discovery of relationships between variables.”
b. Independent and dependent and extraneous variables in a research design:
The research designer understandably cannot hold all his decisions in his head. Even if he could,
he would have difficulty in understanding how these are inter-related. Therefore, he records his
decisions on paper or record disc by using relevant symbols or concepts. Such a symbolic
construction may be called the research design or model. A research design is a logical and
systematic plan prepared for directing a research study.
Dependent and Independent variables:
A magnitude that varies is known as a variable. The concept may assume different quantitative
values, like height, weight, income, etc. Qualitative variables are not quantifiable in the strictest
sense of objectivity. However, the qualitative phenomena may also be quantified in terms of thepresence or absence of the attribute considered. Phenomena that assume different values
quantitatively even in decimal points are known as „continuous variables ‟. But, all variables need
not be continuous. Values that can be expressed only in integer values are called „non -continuous
variables ‟. In statistical term, they are also known as „discrete variable ‟. For example, age is a
continuous variable; whereas the number of children is a non-continuous variable. When changes
in one variable depends upon the changes in one or more other variables, it is known as a
dependent or endogenous variable, and the variables that cause the changes in the dependent
variable are known as the independent or explanatory or exogenous variables. For example, if
demand depends upon price, then demand is a dependent variable, while price is the independent
variable.
And if, more variables determine demand, like income and prices of substitute commodity, thendemand also depends upon them in addition to the own price. Then, demand is a dependent
variable which is determined by the independent variables like own price, income and price of
substitute.
Extraneous variable:
The independent variables which are not directly related to the purpose of the study but affect the
dependent variable are known as extraneous variables. For instance, assume that a researcher
wants to test the hypothesis that there is relationship between children’s school performance andtheir self-concepts, in which case the latter is an independent variable and the former, the
dependent variable. In this context, intelligence may also influence the school performance.
However, since it is not directly related to the purpose of the study undertaken by the researcher,it would be known as an extraneous variable. The influence caused by the extraneous variable on
the dependent variable is technically called as an „experimental error ‟. Therefore, a research
study should always be framed in such a manner that the dependent variable completely
influences the change in the independent variable and any other extraneous variable or variables.
Question 3:
a. Differentiate between ‘Census survey’ and ‘ Sample Survey’
b. Analyse multi-stage and sequential sampling.
8/3/2019 511035200 MB0050 Research Methodology
http://slidepdf.com/reader/full/511035200-mb0050-research-methodology 3/14
Name: Shailesh Kumar Registration Number: 511035200 Semester: 3rd
Specialized Stream: Information Systems Management
Answer:
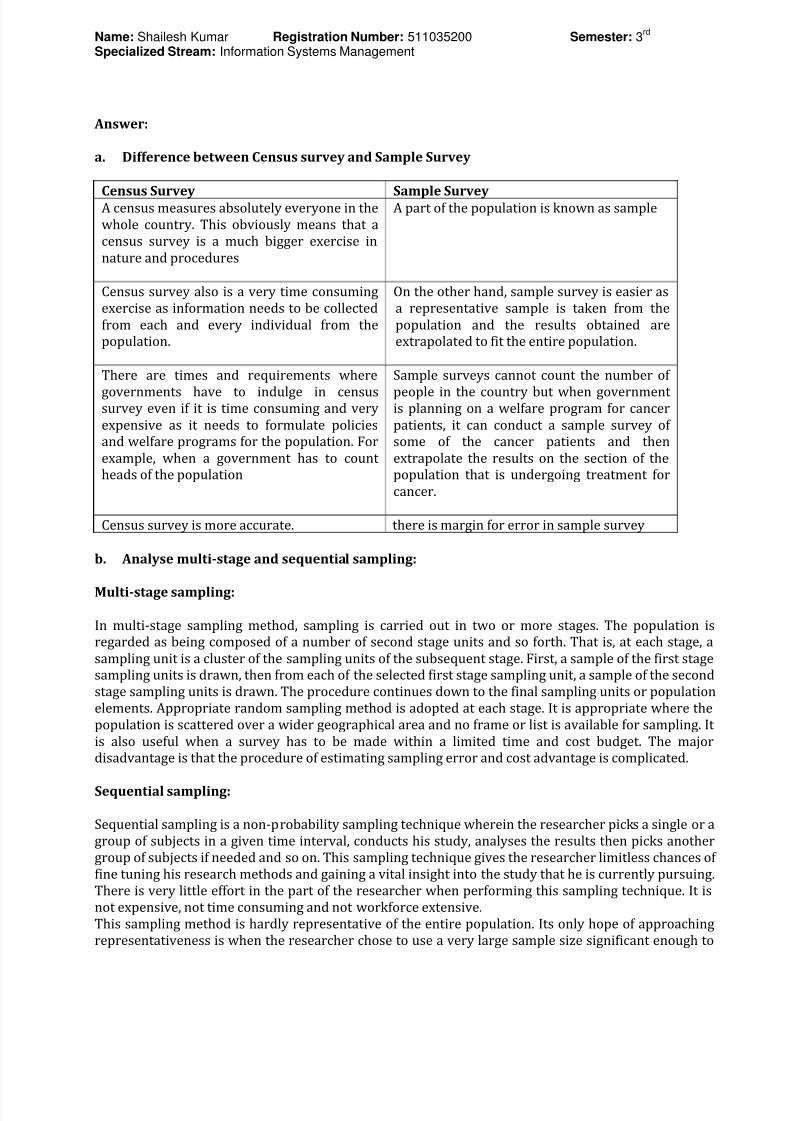
a. Difference between Census survey and Sample Survey
Census Survey Sample SurveyA census measures absolutely everyone in the
whole country. This obviously means that a
census survey is a much bigger exercise in
nature and procedures
A part of the population is known as sample
Census survey also is a very time consuming
exercise as information needs to be collected
from each and every individual from the
population.
On the other hand, sample survey is easier as
a representative sample is taken from the
population and the results obtained are
extrapolated to fit the entire population.
There are times and requirements where
governments have to indulge in censussurvey even if it is time consuming and very
expensive as it needs to formulate policies
and welfare programs for the population. For
example, when a government has to count
heads of the population
Sample surveys cannot count the number of
people in the country but when government is planning on a welfare program for cancer
patients, it can conduct a sample survey of
some of the cancer patients and then
extrapolate the results on the section of the
population that is undergoing treatment for
cancer.
Census survey is more accurate. there is margin for error in sample survey
b. Analyse multi-stage and sequential sampling:
Multi-stage sampling:
In multi-stage sampling method, sampling is carried out in two or more stages. The population is
regarded as being composed of a number of second stage units and so forth. That is, at each stage, a
sampling unit is a cluster of the sampling units of the subsequent stage. First, a sample of the first stage
sampling units is drawn, then from each of the selected first stage sampling unit, a sample of the second
stage sampling units is drawn. The procedure continues down to the final sampling units or population
elements. Appropriate random sampling method is adopted at each stage. It is appropriate where the
population is scattered over a wider geographical area and no frame or list is available for sampling. It
is also useful when a survey has to be made within a limited time and cost budget. The major
disadvantage is that the procedure of estimating sampling error and cost advantage is complicated.
Sequential sampling:
Sequential sampling is a non-probability sampling technique wherein the researcher picks a single or a
group of subjects in a given time interval, conducts his study, analyses the results then picks another
group of subjects if needed and so on. This sampling technique gives the researcher limitless chances of
fine tuning his research methods and gaining a vital insight into the study that he is currently pursuing.
There is very little effort in the part of the researcher when performing this sampling technique. It is
not expensive, not time consuming and not workforce extensive.
This sampling method is hardly representative of the entire population. Its only hope of approaching
representativeness is when the researcher chose to use a very large sample size significant enough to
8/3/2019 511035200 MB0050 Research Methodology
http://slidepdf.com/reader/full/511035200-mb0050-research-methodology 4/14
Name: Shailesh Kumar Registration Number: 511035200 Semester: 3rd
Specialized Stream: Information Systems Management
represent a big fraction of the entire population. Due to the aforementioned disadvantages, results
from this sampling technique cannot be used to create conclusions and interpretations pertaining to
the entire population.
Question 4: List down various measures of central tendency and explain the difference betweenthem?
Answer:
Measures of Central Tendency:
The term central tendency refers to the "middle" value or perhaps a typical value of the data, and is
measured using the mean, median, or mode. Each of these measures is calculated differently, and the
one that is best to use depends upon the situation.
Analysis of data involves understanding of the characteristics of the data. The following are the
important characteristics of a statistical data:
Central tendency
Dispersion
Skew ness
Kurtosis
In a data distribution, the individual items may have a tendency to come to a central position or an
average value. For instance, in a mark distribution, the individual students may score marks between
zero and hundred. In this distribution, many students may score marks, which are near to the average
marks, i.e. 50. Such a tendency of the data to concentrate to the central position of the distribution is
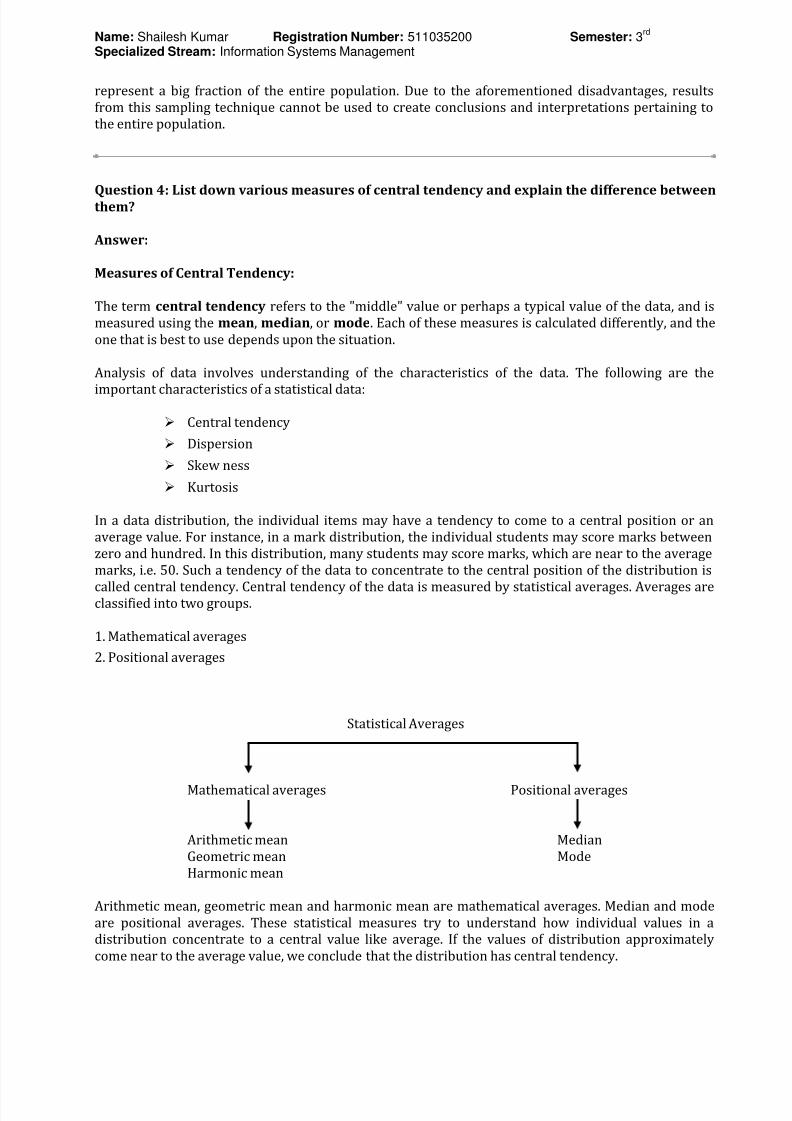
called central tendency. Central tendency of the data is measured by statistical averages. Averages areclassified into two groups.
1. Mathematical averages
2. Positional averages
Statistical Averages
Mathematical averages Positional averages
Arithmetic mean Median
Geometric mean Mode
Harmonic mean
Arithmetic mean, geometric mean and harmonic mean are mathematical averages. Median and mode
are positional averages. These statistical measures try to understand how individual values in a
distribution concentrate to a central value like average. If the values of distribution approximately
come near to the average value, we conclude that the distribution has central tendency.
8/3/2019 511035200 MB0050 Research Methodology
http://slidepdf.com/reader/full/511035200-mb0050-research-methodology 5/14
Name: Shailesh Kumar Registration Number: 511035200 Semester: 3rd
Specialized Stream: Information Systems Management
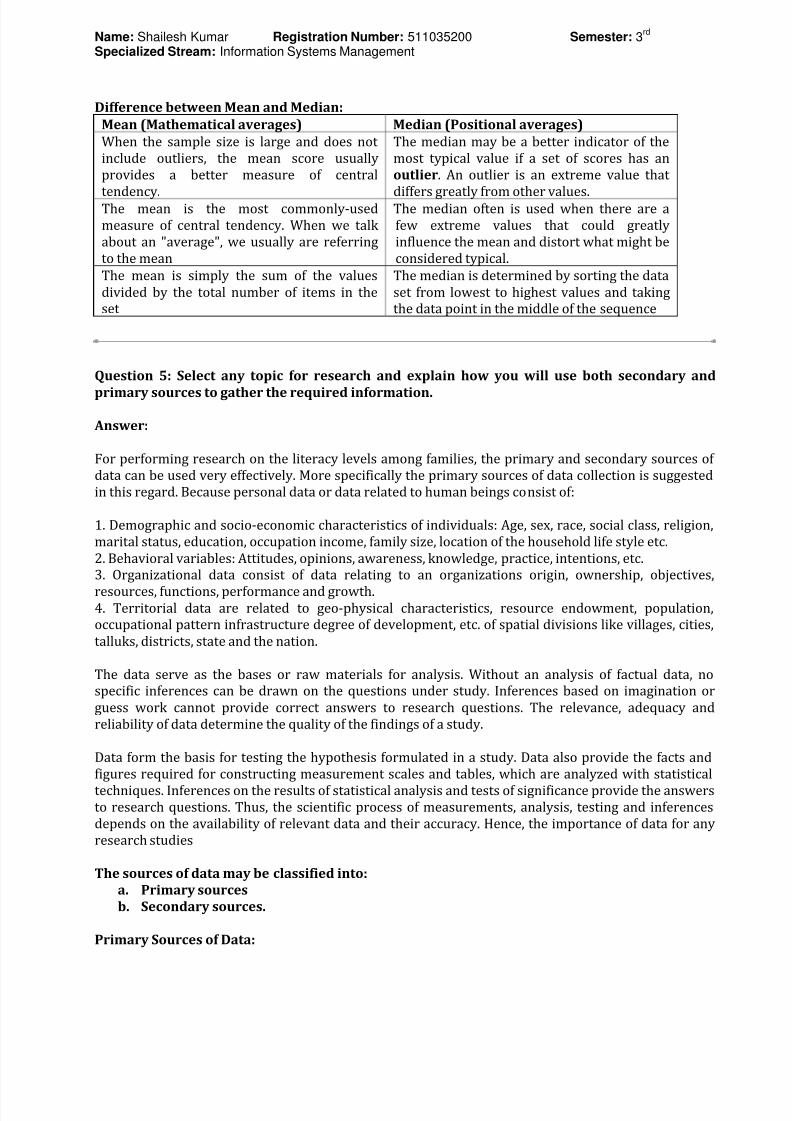
Difference between Mean and Median:
Mean (Mathematical averages) Median (Positional averages)
When the sample size is large and does not
include outliers, the mean score usually
provides a better measure of central
tendency.
The median may be a better indicator of the
most typical value if a set of scores has an
outlier. An outlier is an extreme value that
differs greatly from other values.The mean is the most commonly-used
measure of central tendency. When we talk
about an "average", we usually are referring
to the mean
The median often is used when there are a
few extreme values that could greatly
influence the mean and distort what might be
considered typical.
The mean is simply the sum of the values
divided by the total number of items in the
set
The median is determined by sorting the data
set from lowest to highest values and taking
the data point in the middle of the sequence
Question 5: Select any topic for research and explain how you will use both secondary and
primary sources to gather the required information.
Answer:
For performing research on the literacy levels among families, the primary and secondary sources of
data can be used very effectively. More specifically the primary sources of data collection is suggested
in this regard. Because personal data or data related to human beings consist of:
1. Demographic and socio-economic characteristics of individuals: Age, sex, race, social class, religion,
marital status, education, occupation income, family size, location of the household life style etc.
2. Behavioral variables: Attitudes, opinions, awareness, knowledge, practice, intentions, etc.
3. Organizational data consist of data relating to an organizations origin, ownership, objectives,
resources, functions, performance and growth.4. Territorial data are related to geo-physical characteristics, resource endowment, population,
occupational pattern infrastructure degree of development, etc. of spatial divisions like villages, cities,
talluks, districts, state and the nation.
The data serve as the bases or raw materials for analysis. Without an analysis of factual data, no
specific inferences can be drawn on the questions under study. Inferences based on imagination or
guess work cannot provide correct answers to research questions. The relevance, adequacy and
reliability of data determine the quality of the findings of a study.
Data form the basis for testing the hypothesis formulated in a study. Data also provide the facts and
figures required for constructing measurement scales and tables, which are analyzed with statistical
techniques. Inferences on the results of statistical analysis and tests of significance provide the answersto research questions. Thus, the scientific process of measurements, analysis, testing and inferences
depends on the availability of relevant data and their accuracy. Hence, the importance of data for any
research studies
The sources of data may be classified into:
a. Primary sources
b. Secondary sources.
Primary Sources of Data:
8/3/2019 511035200 MB0050 Research Methodology
http://slidepdf.com/reader/full/511035200-mb0050-research-methodology 6/14
Name: Shailesh Kumar Registration Number: 511035200 Semester: 3rd
Specialized Stream: Information Systems Management
Primary sources are original sources from which the researcher directly collects data that have not
been previously collected e.g.., collection of data directly by the researcher on brand awareness, brand
preference, brand loyalty and other aspects of consumer behaviour from as ample of consumers by
interviewing them,. Primary data are first-hand information collected through various methods such as
observation, interviewing, mailing etc.
Advantage of Primary Data:
It is original source of data
It is possible to capture the changes occurring in the course of time.
It flexible to the advantage of researcher.
Extensive research study is based of primary data
Disadvantage of Primary Data:
Primary data is expensive to obtain
It is time consuming
It requires extensive research personnel who are skilled.
It is difficult to administer
Methods of Collecting Primary Data:
Primary data are directly collected by the researcher from their original sources. In this case, the
researcher can collect the required date precisely according to his research needs, he can collect them
when he wants them and in the form he needs them. But the collection of primary data is costly and
time consuming. Yet, for several types of social science research required data are not available from
secondary sources and they have to be directly gathered from the primary sources. In such cases where
the available data are in appropriate, inadequate or obsolete, primary data have to be gathered. They
include: socioeconomic surveys, social anthropological studies of rural communities and tribal
communities, sociological studies of social problems and social institutions. Marketing research,
leadership studies, opinion polls, attitudinal surveys, readership, radio listening and T.V. viewing
surveys, knowledge-awareness practice (KAP) studies, farm managements studies, businessmanagement studies etc. There are various methods of data collection. A ‘Method’ is different from a
‘Tool’ while a method refers to the way or mode of gathering data, a tool is an instruments used for themethod. For example, a schedule is used for interviewing. The important methods are (a) observation,
(b) interviewing,(c)mail survey,(d)experimentation,(e) simulation and (f) projective technique. Each of
these methods is discussed in detail in the subsequent sections in the later chapters.
Secondary Sources of Data:
These are sources containing data which have been collected and compiled for another purpose. The
secondary sources consists of readily compendia and already compiled statistical statements and
reports whose data may be used by researchers for their studies e.g., census reports , annual reports
and financial statements of companies, Statistical statement, Reports of Government Departments,Annual reports of currency and finance published by the Reserve Bank of India, Statistical statements
relating to Co-operatives and Regional Banks, published by the NABARD, Reports of the National
sample survey Organization, Reports of trade associations, publications of international organizations
such as UNO, IMF, World Bank, ILO, WHO, etc., Trade and Financial journals newspapers etc.
Secondary sources consist of not only published records and reports, but also unpublished records.
The latter category includes various records and registers maintained by the firms and organizations,
e.g., accounting and financial records, personnel records, register of members, minutes of meetings,
inventory records etc.
8/3/2019 511035200 MB0050 Research Methodology
http://slidepdf.com/reader/full/511035200-mb0050-research-methodology 7/14
Name: Shailesh Kumar Registration Number: 511035200 Semester: 3rd
Specialized Stream: Information Systems Management
Features of Secondary Sources:
Though secondary sources are diverse and consist of all sorts of materials, they have certain common
characteristics. First, they are readymade and readily available, and do not require the trouble of
constructing tools and administering them
Second, they consist of data which a researcher has no original control over collection andclassification. Both the form and the content of secondary sources are shaped by others. Clearly, this is
a feature which can limit the research value of secondary sources. Finally, secondary sources are not
limited in time and space. That is, the researcher using them need not have been present when and
where they were gathered
Use of Secondary Data:
The second data may be used in three ways by a researcher. First, some specific information from
secondary sources may be used for reference purpose. For example, the general statistical information
in the number of co-operative credit societies in the country, their coverage of villages, their capital
structure, volume of business etc., may be taken from published reports and quoted as background
information in a study on the evaluation of performance of cooperative credit societies in a selecteddistrict/state.
Second, secondary data may be used as bench marks against which the findings of research maybe
tested, e.g., the findings of a local or regional survey may be compared with the national averages; the
performance indicators of a particular bank may be tested against the corresponding indicators of the
banking industry as a whole; and so on.
Finally, secondary data may be used as the sole source of information for a research project. Such
studies as securities Market Behaviour, Financial Analysis of companies, Trade in credit allocation in
commercial banks, sociological studies on crimes, historical studies, and the like, depend primarily on
secondary data. Year books, statistical reports of government departments, report of public
organizations of Bureau of Public Enterprises, Censes Reports etc., and serve as major data sources forsuch research studies
Advantages of Secondary Data:
Secondary sources have some advantages:
Secondary data, if available can be secured quickly and cheaply. Once their source of
documents and reports are located, collection of data is just matter of desk work. Event he
tediousness of copying the data from the source can now be avoided, thanks to Xeroxing
facilities.
Wider geographical area and longer reference period may be covered without much cost. Thus,
the use of secondary data extends the researcher’s space and time reach. The use of secondary data broadens the data base from which scientific generalizations can be
made.
Environmental and cultural settings are required for the study.
The use of secondary data enables a researcher to verify the findings bases on primary data. It
readily meets the need for additional empirical support. The researcher needs not wait the time
when additional primary data can be collected.
Disadvantages of Secondary Data:
8/3/2019 511035200 MB0050 Research Methodology
http://slidepdf.com/reader/full/511035200-mb0050-research-methodology 8/14
Name: Shailesh Kumar Registration Number: 511035200 Semester: 3rd
Specialized Stream: Information Systems Management
The use of a secondary data has its own limitations.
The most important limitation is the available data may not meet our specific needs. The
definitions adopted by those who collected those data may be different; units of measure may
not match; and time periods may also be different.
The available data may not be as accurate as desired. To assess their accuracy we need to know
how the data were collected. The secondary data are not up-to-date and become obsolete when they appear in print, because
of time lag in producing them. For example, population census data are published two or three
years later after compilation and no new figures will be available for another ten years.
Finally, information about the whereabouts of sources may not be available to all social
scientists. Even if the location of the source is known, the accessibility depends primarily on
proximity. For example, most of the unpublished official records and compilations are located
in the capital city, and they are not within the easy reach of researchers based in far off places.
Evaluation of Secondary Data:
When a researcher wants to use secondary data for his research, he should evaluate them before
deciding to use them.
1) Data Pertinence:
The first consideration in evaluation is to examine the pertinence of the available secondary
data to the research problem under study. The following questions should be considered.
What are the definitions and classifications employed? Are they consistent?
What are the measurements of variables used? What is the degree to which they conform to the
requirements of our research?
On the basis of above consideration, the pertinence of the secondary data to the research on hand
should be determined, as a researcher who is imaginative and flexible may be able to redefine his
research problem so as to make use of otherwise unusable available data.
2) Data Quality:
If the researcher is convinced about the available secondary data for his needs, the next step is to
examine the quality of the data. The quality of data refers to their accuracy, reliability and
completeness. The assurance and reliability of the available secondary data depends on the
organization which collected them and the purpose for which they were collected. What is the
authority and prestige of the organization? Is it well recognized? Is it noted for reliability? It is capable
of collecting reliable data? Does it use trained and well qualified investigators? The answers to these
questions determine the degree of confidence we can have in the data and their accuracy. It is
important to go to the original source of the secondary data rather than to use an immediate source
which has quoted from the original. Then only, the researcher can review the cautionary and othercomments that were made in the original source.
3) Data Completeness:
The completeness refers to the actual coverage of the published data. This depends on the
methodology and sampling design adopted by the original organization. Is the methodology sound? Is
the sample size small or large? Is the sampling method appropriate? Answers to these questions may
indicate the appropriateness and adequacy of the data for the problem under study. The question of
possible bias should also be examined. Whether the purpose for which the original organization
collected the data had a particular orientation? Has the study been made to promote the organization’s
8/3/2019 511035200 MB0050 Research Methodology
http://slidepdf.com/reader/full/511035200-mb0050-research-methodology 9/14
Name: Shailesh Kumar Registration Number: 511035200 Semester: 3rd
Specialized Stream: Information Systems Management
own interest? How the study was conducted? These are important clues. The researcher must be on
guard when the source does not report the methodology and sampling design. Then it is not possible to
determine the adequacy of the secondary data for the researcher’s study.
Question 6:a. Explain the role of Graphs and Diagrams?
b. What are the Types and General rules for graphical representation of data?
Answer:
a) Role of Graphs and Diagrams:
In presenting the data of frequency distributions and statistical computations, it is often desirable to
use appropriate forms of graphic presentations. In additions to tabular forms, graphic presentation
involves use of graphics, charts and other pictorial devices such as diagrams. These forms and devices
reduce large masses of statistical data to a form that can be quickly understood at the glance. The
meaning of figures in tabular form may be difficult for the mind to grasp or retain. “Properlyconstructed graphs and charts relieve the mind of burdensome details by portraying facts concisely,
logically and simply.” They, by emphasizing new and significant relationship, are also useful in
discovering new facts and in developing hypothesis.
The device of graphic presentation is particularly useful when the prospective readers are non-
technical people or general public. It is useful to even technical people for dramatizing certain points
about data; for important points can be more effectively captured in pictures than in tables. However,
graphic forms are not substitutes for tables, but are additional tools for the researcher to emphasize
the research findings.
Graphic presentation must be planned with utmost care and diligence. Graphic forms used should be
simple, clear and accurate and also be appropriate to the data. In planning this work, the followingquestions must be considered.
a. What is the purpose of the diagram?
b. What facts are to be emphasized?
c. What is the educational level of the audience?
d. How much time is available for the preparation of the diagram?
e. What kind of chart will portray the data most clearly and accurately?
Role of Graphs:
Because graphs provide a compact, rhetorically powerful way of representing research findings, recent theories of science have postulated their use as a distinguishing feature of science. Studies have shown
that the use of graphs in journal articles correlates highly with the hardness of scientific fields, both
across disciplines and across subfields of psychology.
Role of Diagrams:
Recent technological advances have enabled the large-scale adoption of diagrams in a diverse range of
areas. Increasingly sophisticated visual representations are emerging and, to enable effective
communication, insight is required into how diagrams are used and when they are appropriate for use.
8/3/2019 511035200 MB0050 Research Methodology
http://slidepdf.com/reader/full/511035200-mb0050-research-methodology 10/14
Name: Shailesh Kumar Registration Number: 511035200 Semester: 3rd
Specialized Stream: Information Systems Management
The pervasive, everyday use of diagrams for communicating information and ideas serves to illustrate
the importance of providing a sound understanding of the role that diagrams can, and do, play.
Research in the field of diagrams aims to improve our understanding of the role of diagrams, sketches
and other visualizations in communication, computation, cognition, creative thought, and problem
solving. These concerns have triggered a surge of interest in the study of diagrams.
The study of diagrammatic communication as a whole must be pursued as an interdisciplinaryendeavor. Diagrams attract a large number of researchers from virtually all related fields, placing the
conference as a major international event in the area.
b) Types and General rules for graphical representation of data:
Graphical representation is done of the data available. This is very important step of statistical analysis.
We will be discussing the organization of data. The word 'Data' is plural for 'datum'; datum means
facts. Statistically the term is used for numerical facts such as measures of height, weight and scores on
achievement and intelligence tests.
Graphs and diagram leave a lasting impression on the mind and make intelligible and easily
understandable the salient features of the data. Forecasting also becomes easier with the help of graph.Thus it is of interest to study the graphical representation of data.
The graphical representation of data is categorized as basic five types:
1) Bar graph
2) Pie graph
3) Line graph
4) Scatter plot
5) Histogram
Examples of graphical representation of data:
Let us see some examples of graphical representation of data.
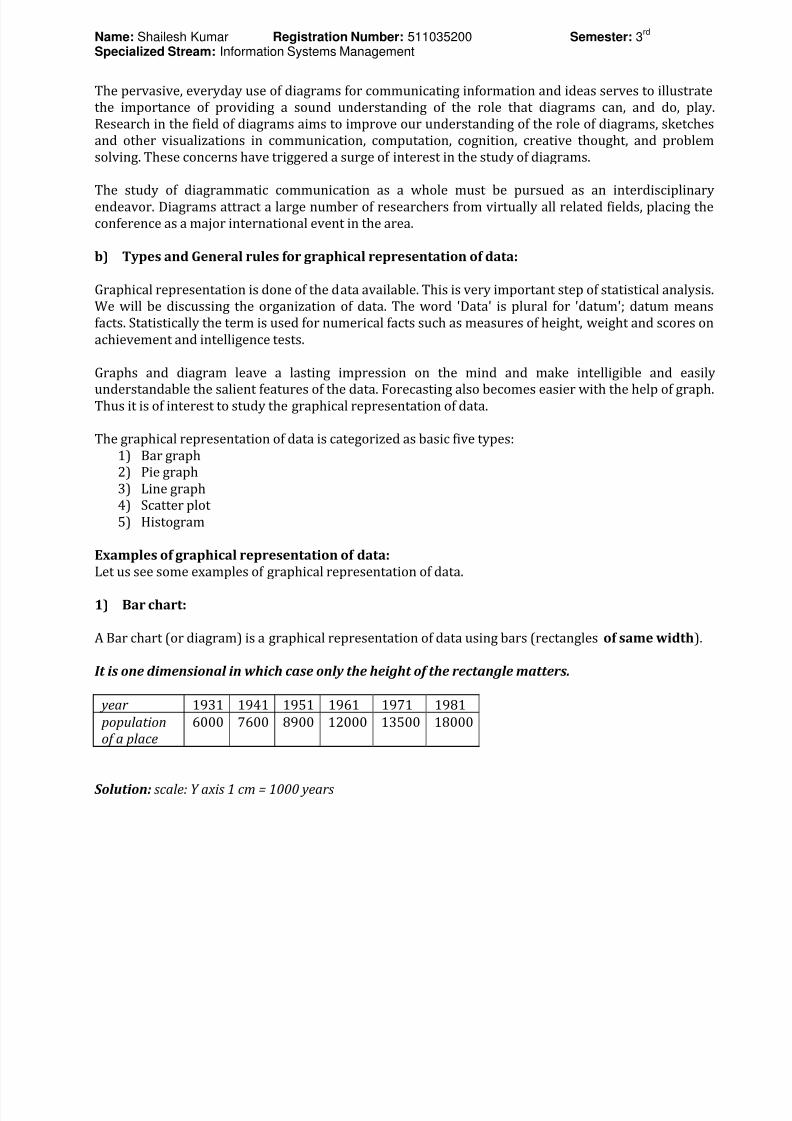
1) Bar chart:
A Bar chart (or diagram) is a graphical representation of data using bars (rectangles of same width).
It is one dimensional in which case only the height of the rectangle matters.
year 1931 1941 1951 1961 1971 1981
populationof a place
6000 7600 8900 12000 13500 18000
Solution: scale: Y axis 1 cm = 1000 years
8/3/2019 511035200 MB0050 Research Methodology
http://slidepdf.com/reader/full/511035200-mb0050-research-methodology 11/14
Name: Shailesh Kumar Registration Number: 511035200 Semester: 3rd
Specialized Stream: Information Systems Management
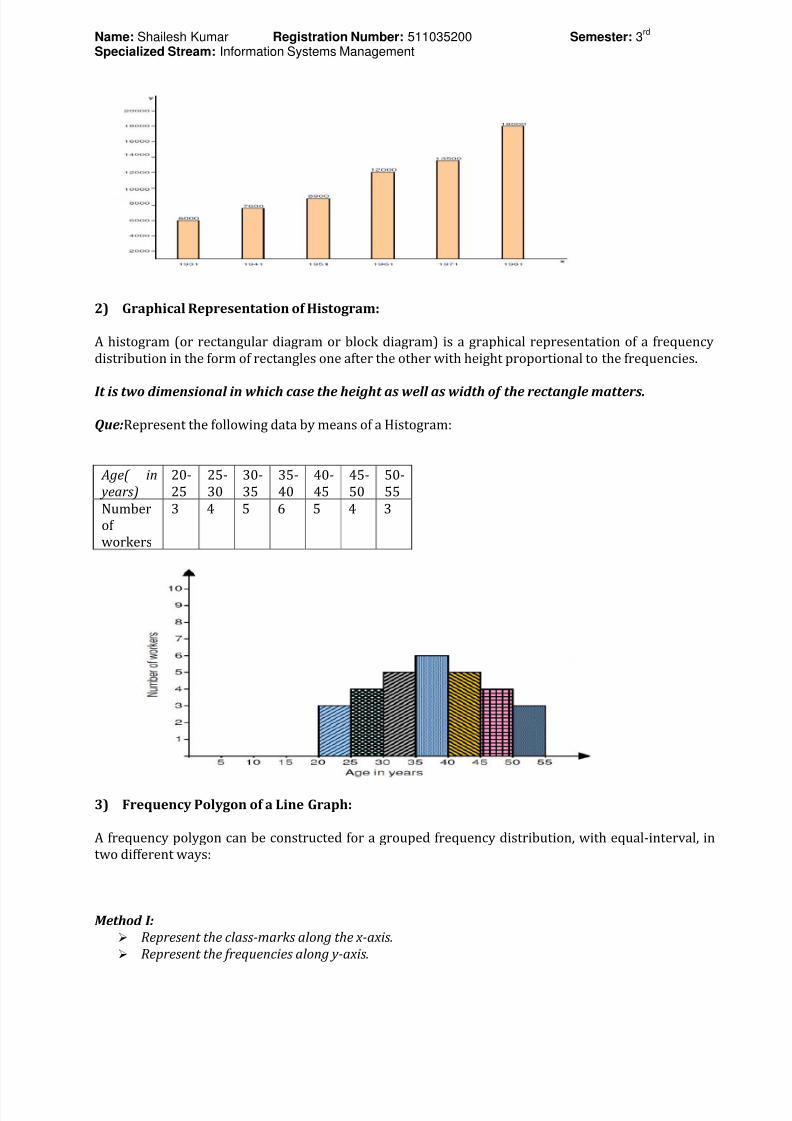
2) Graphical Representation of Histogram:
A histogram (or rectangular diagram or block diagram) is a graphical representation of a frequency
distribution in the form of rectangles one after the other with height proportional to the frequencies.
It is two dimensional in which case the height as well as width of the rectangle matters.
Que:Represent the following data by means of a Histogram:
Age( in years)
20-
25
25-
30
30-
35
35-
40
40-
45
45-
50
50-
55
Number
of
workers
3 4 5 6 5 4 3
3) Frequency Polygon of a Line Graph:
A frequency polygon can be constructed for a grouped frequency distribution, with equal-interval, in
two different ways:
Method I:
Represent the class-marks along the x-axis. Represent the frequencies along y-axis.
8/3/2019 511035200 MB0050 Research Methodology
http://slidepdf.com/reader/full/511035200-mb0050-research-methodology 12/14
Name: Shailesh Kumar Registration Number: 511035200 Semester: 3rd
Specialized Stream: Information Systems Management
Join these points, in order, by straight lines. The points at each end is joined to the immediate higher(or lower) class mark at zero frequency so
as to complete the polygon.
Method II:
Represent a histogram of the given data.
Join the mid points of the tops of the adjacent rectangles by straight lines. The mid points at each end are joined to the immediate higher (or lower) at zero frequency so asto complete the polygon.
The two classes, one at each end, are to be included.
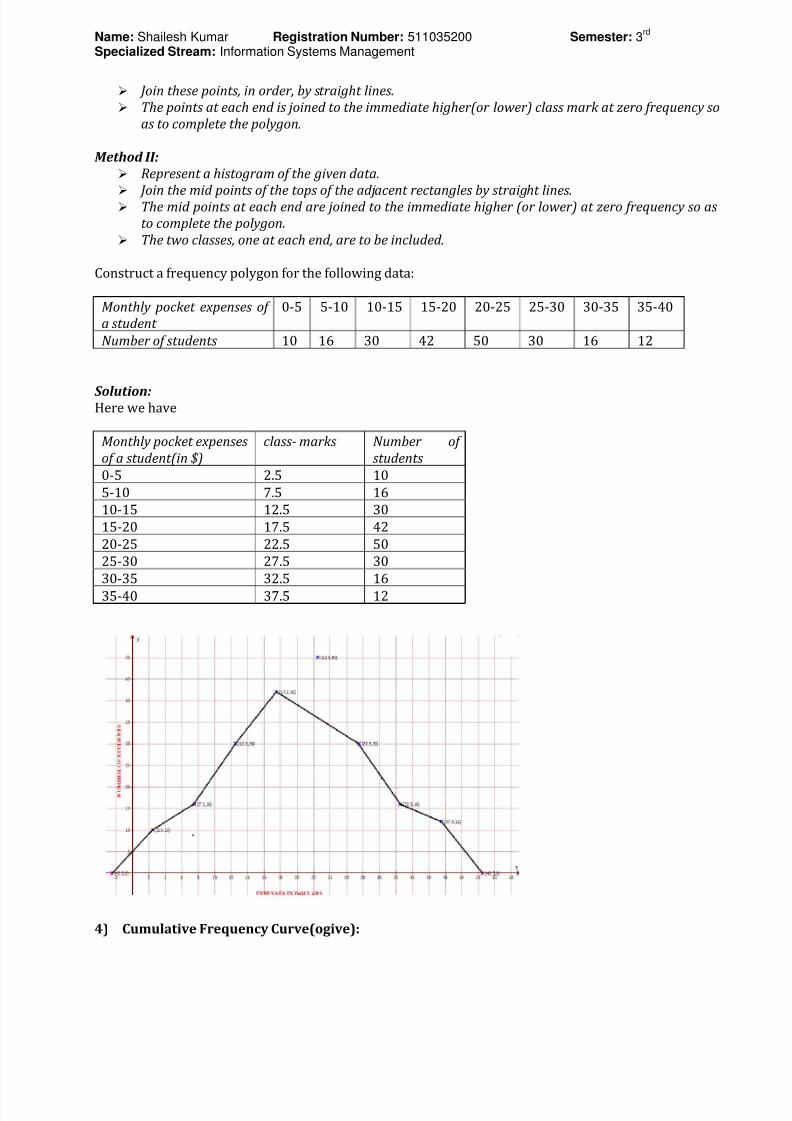
Construct a frequency polygon for the following data:
Monthly pocket expenses of a student
0-5 5-10 10-15 15-20 20-25 25-30 30-35 35-40
Number of students 10 16 30 42 50 30 16 12
Solution: Here we have
Monthly pocket expensesof a student(in $)
class- marks Number of students
0-5 2.5 10
5-10 7.5 16
10-15 12.5 30
15-20 17.5 42
20-25 22.5 50
25-30 27.5 30
30-35 32.5 16
35-40 37.5 12
4) Cumulative Frequency Curve(ogive):
8/3/2019 511035200 MB0050 Research Methodology
http://slidepdf.com/reader/full/511035200-mb0050-research-methodology 13/14
Name: Shailesh Kumar Registration Number: 511035200 Semester: 3rd
Specialized Stream: Information Systems Management
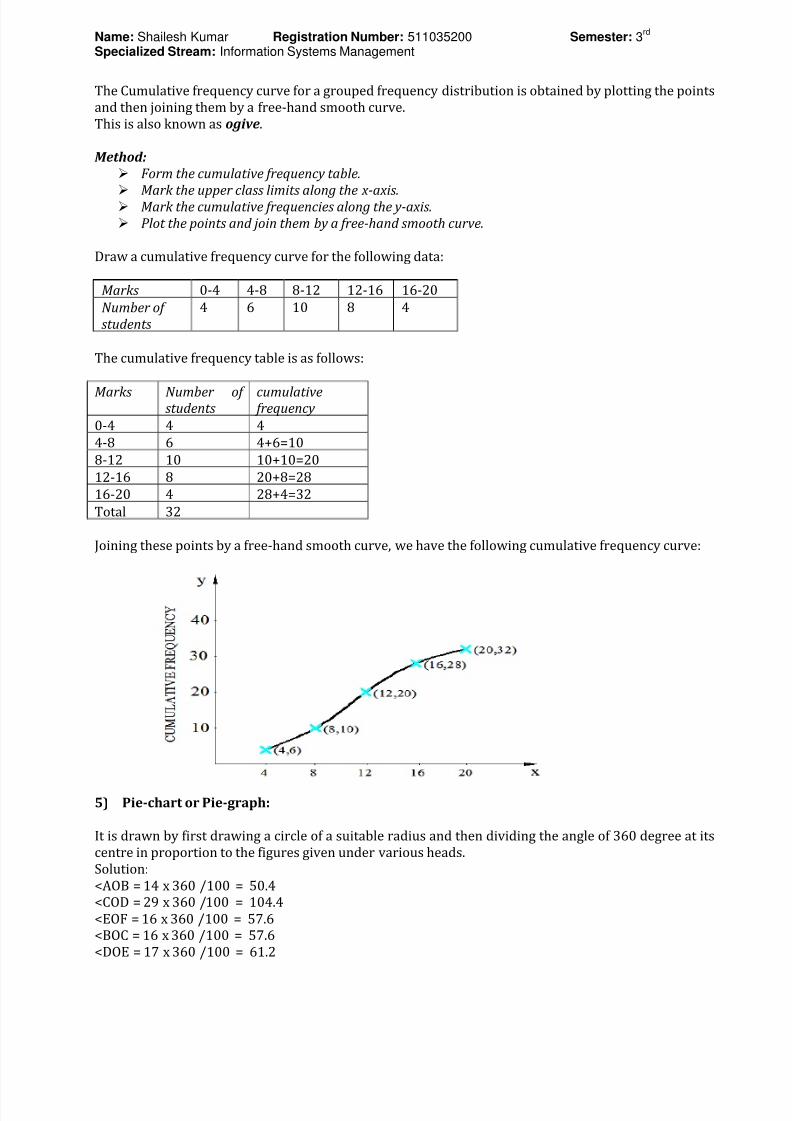
The Cumulative frequency curve for a grouped frequency distribution is obtained by plotting the points
and then joining them by a free-hand smooth curve.
This is also known as ogive.
Method:
Form the cumulative frequency table.
Mark the upper class limits along the x-axis. Mark the cumulative frequencies along the y-axis. Plot the points and join them by a free-hand smooth curve.
Draw a cumulative frequency curve for the following data:
Marks 0-4 4-8 8-12 12-16 16-20
Number of students
4 6 10 8 4
The cumulative frequency table is as follows:
Marks Number of students
cumulative frequency
0-4 4 4
4-8 6 4+6=10
8-12 10 10+10=20
12-16 8 20+8=28
16-20 4 28+4=32
Total 32
Joining these points by a free-hand smooth curve, we have the following cumulative frequency curve:
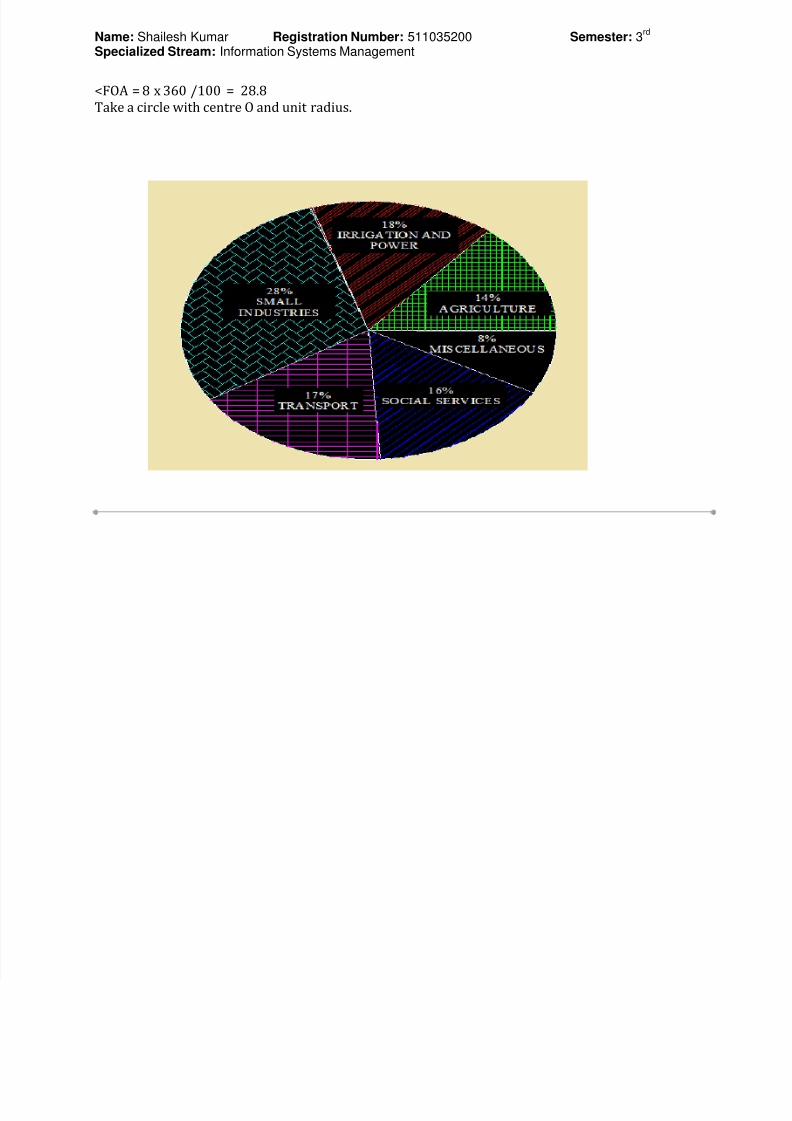
5) Pie-chart or Pie-graph:
It is drawn by first drawing a circle of a suitable radius and then dividing the angle of 360 degree at its
centre in proportion to the figures given under various heads.
Solution:
<AOB = 14 x 360 /100 = 50.4
<COD = 29 x 360 /100 = 104.4
<EOF = 16 x 360 /100 = 57.6
<BOC = 16 x 360 /100 = 57.6
<DOE = 17 x 360 /100 = 61.2
8/3/2019 511035200 MB0050 Research Methodology
http://slidepdf.com/reader/full/511035200-mb0050-research-methodology 14/14
Name: Shailesh Kumar Registration Number: 511035200 Semester: 3rd
Specialized Stream: Information Systems Management
<FOA = 8 x 360 /100 = 28.8
Take a circle with centre O and unit radius.
Related Documents