5–1 Operations and Supply Chain Management CHASE | SHANKAR | JACOBS 14 e

5–1. 5–2 Chapter Five Copyright © 2014 by The McGraw-Hill Companies, Inc. All rights reserved. McGraw-Hill/Irwin.
Dec 14, 2015
Welcome message from author
This document is posted to help you gain knowledge. Please leave a comment to let me know what you think about it! Share it to your friends and learn new things together.
Transcript

5–1
Operations andSupply Chain Management
CHASE | SHANKAR | JACOBS
14e

5–2
StrategicCapacityManagement
Chapter FiveCopyright © 2014 by The McGraw-Hill Companies, Inc. All rights reserved.McGraw-Hill/Irwin

5–3
Cop
yri
gh
t ©
20
14
by M
cGra
w H
ill E
du
cati
on
(In
dia
) Pri
vate
Lim
ited
. A
ll ri
gh
ts
rese
rved
.
Learning Objectives
• LO5–1: Explain what capacity management is and why it is strategically important.
• LO5–2: Exemplify how to plan capacity.
• LO5–3: Evaluate capacity alternatives using decision trees.
• LO5–4: Compare capacity planning in services to capacity planning in manufacturing

5–4
Cop
yri
gh
t ©
20
14
by M
cGra
w H
ill E
du
cati
on
(In
dia
) Pri
vate
Lim
ited
. A
ll ri
gh
ts
rese
rved
.Economies of Scale Made of Steel
• The Economics of Very Big Ships
• Economy of Container Ships– Allows a T-shirt made in China to be sent to the Netherlands
for just 2.5 cents.
– The Eleonora Maersk and the other seven ships in her class are among the largest ever built:
– Almost 400 m long, or the length of four soccer fields, and another half-field across.
– The ships can carry 7,500 or so 40-foot containers, each of which can hold 70,000 T-shirts.
• On this voyage, the Eleonora was carrying supplies for Europe’s New Year celebrations: 1,850 tons of fireworks, including 30 tons of gunpowder.
5–5
Cop
yri
gh
t ©
20
14
by M
cGra
w H
ill E
du
cati
on
(In
dia
) Pri
vate
Lim
ited
. A
ll ri
gh
ts
rese
rved
.
Capacity Management in Operations
• Capacity – the ability to hold, receive, store, or accommodate
• In business, viewed as the amount of output that a system is capable of achieving over a specific period of time
• Capacity management needs to consider both inputs and outputs

5–6
Cop
yri
gh
t ©
20
14
by M
cGra
w H
ill E
du
cati
on
(In
dia
) Pri
vate
Lim
ited
. A
ll ri
gh
ts
rese
rved
.Capacity Planning Time Durations
• Greater than one year
Long range
• Monthly or quarterly plans covering the next 6 to 18 months
Intermediate range
• Less than one month
Short range

5–7
Cop
yri
gh
t ©
20
14
by M
cGra
w H
ill E
du
cati
on
(In
dia
) Pri
vate
Lim
ited
. A
ll ri
gh
ts
rese
rved
.Strategic Capacity Planning
• Determining the overall level of capacity-intensive resources that best supports the company’s long-range competitive strategy– Facilities– Equipment– Labor force size

5–8
Cop
yri
gh
t ©
20
14
by M
cGra
w H
ill E
du
cati
on
(In
dia
) Pri
vate
Lim
ited
. A
ll ri
gh
ts
rese
rved
.Capacity Planning Concepts
• Capacity utilization rate – a measure of how close the firm is to its best possible operating level
• Economies of scale – the idea that as a planet gets larger and volume increases, the average cost per unit tends to drop
• Diseconomies of scale – at some point, the plant becomes too large and average cost per unit begins to increase
5–9
Cop
yri
gh
t ©
20
14
by M
cGra
w H
ill E
du
cati
on
(In
dia
) Pri
vate
Lim
ited
. A
ll ri
gh
ts
rese
rved
.Capacity Planning Concepts
• Capacity focus – the idea that a production facility works best when it is concentrated on a limited set of production objectives– Focused factory or plant within a plant (PWP) concept
• Capacity flexibility – the ability to rapidly increase or decrease product levels or the ability to shift rapidly from one product or service to another– Comes from the plant, processes, and workers or from
strategies that use the capacity of other organizations

5–10
Cop
yri
gh
t ©
20
14
by M
cGra
w H
ill E
du
cati
on
(In
dia
) Pri
vate
Lim
ited
. A
ll ri
gh
ts
rese
rved
.
Capacity Flexibility
•Ability to quickly adapt to change•Zero-changeover time
Flexible Plants
•Flexible manufacturing systems•Simple, easily set up equipment
Flexible Processes
•Ability to switch from one kind of task to another quickly•Multiple skills (cross training)
Flexible Workers
5–11
Cop
yri
gh
t ©
20
14
by M
cGra
w H
ill E
du
cati
on
(In
dia
) Pri
vate
Lim
ited
. A
ll ri
gh
ts
rese
rved
.
Considerations in Changing Capacity
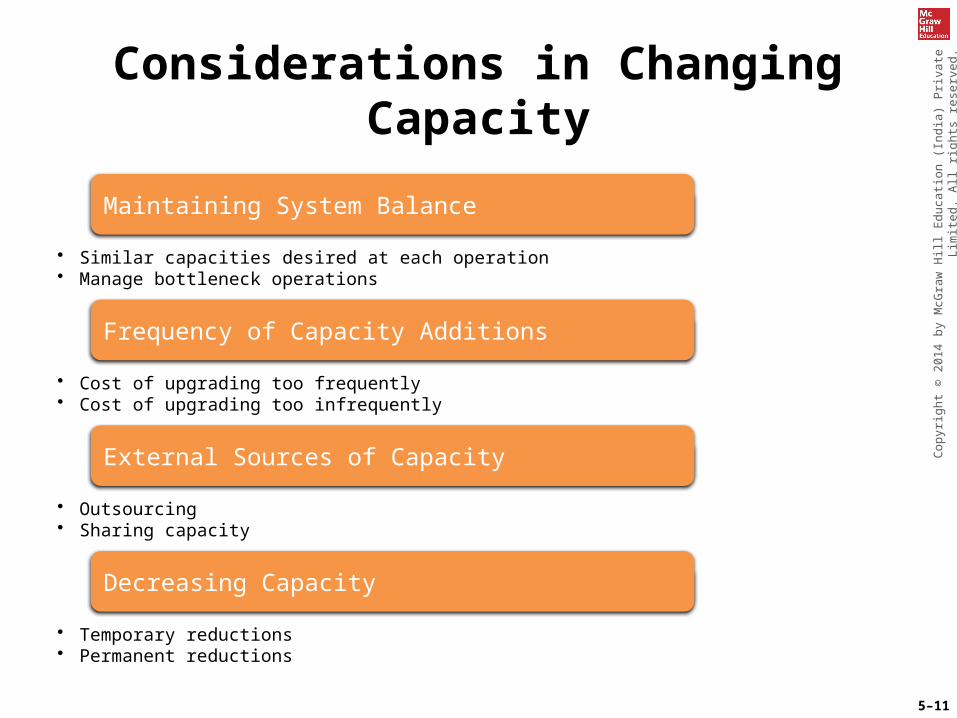
Maintaining System Balance
• Similar capacities desired at each operation• Manage bottleneck operations
Frequency of Capacity Additions
• Cost of upgrading too frequently• Cost of upgrading too infrequently
External Sources of Capacity
• Outsourcing• Sharing capacity
Decreasing Capacity
• Temporary reductions• Permanent reductions

5–12
Cop
yri
gh
t ©
20
14
by M
cGra
w H
ill E
du
cati
on
(In
dia
) Pri
vate
Lim
ited
. A
ll ri
gh
ts
rese
rved
.
Frequent versus Infrequent Capacity
Expansions

5–13
Cop
yri
gh
t ©
20
14
by M
cGra
w H
ill E
du
cati
on
(In
dia
) Pri
vate
Lim
ited
. A
ll ri
gh
ts
rese
rved
.
Determining Capacity Requirements
Use forecasting to predict sales for
individual products
Calculate labor and equipment requirements to meet forecasts
Project labor and equipment
availability over the planning
horizon

5–14
Cop
yri
gh
t ©
20
14
by M
cGra
w H
ill E
du
cati
on
(In
dia
) Pri
vate
Lim
ited
. A
ll ri
gh
ts
rese
rved
.
Example 5.1—Determining Capacity
Requirements• Stewart Company produces two
flavors of salad dressing.– Paul’s and Newman’s
• Each is available in bottles and single-serving bags.
• What are the capacity and labor requirements for the next five years?

5–15
Cop
yri
gh
t ©
20
14
by M
cGra
w H
ill E
du
cati
on
(In
dia
) Pri
vate
Lim
ited
. A
ll ri
gh
ts
rese
rved
.
Determining Capacity Requirements
Year
1 2 3 4 5
Paul’sBottles (000s) 60 100 150 200 250
Plastic bags (000s)
100 200 300 400 500
Newman’sBottles (000s) 75 85 95 97 98
Plastic bags (000s)
200 400 600 650 680
Step 1: Use forecasting to predict sales for individual products

5–16
Cop
yri
gh
t ©
20
14
by M
cGra
w H
ill E
du
cati
on
(In
dia
) Pri
vate
Lim
ited
. A
ll ri
gh
ts
rese
rved
.
Determining Capacity Requirements
Bottling Operation Bagging Operation
Year
1 2 3 4 5
Bottles (000s) 135 185 245 297 348
Plastic bags (000s) 300 600 900 1050 1180
Step 2: Calculate equipment and labor requirements

5–17
Cop
yri
gh
t ©
20
14
by M
cGra
w H
ill E
du
cati
on
(In
dia
) Pri
vate
Lim
ited
. A
ll ri
gh
ts
rese
rved
.
Determining Capacity Requirements
Year
1 2 3 4 5
Plastic Bag Operation
Percentage capacity utilized 24 48 72 84 94
Machine requirement 1.2 2.4 3.6 4.2 4.7
Labor requirement 3.6 7.2 10.8 12.6 14.1
Bottle Operation
Percentage capacity utilized 30 41 54 66 77
Machine requirement 0.9 1.23 1.62 1.98 2.31
Labor requirement 1.8 2.46 3.24 3.96 4.62
Step 3: Project equipment and labor availabilities
Excel: Capacity Requirements
For the Excel template visit www.mhhe.com/sie-chase14e

5–18
Cop
yri
gh
t ©
20
14
by M
cGra
w H
ill E
du
cati
on
(In
dia
) Pri
vate
Lim
ited
. A
ll ri
gh
ts
rese
rved
.
Decision Trees for Capacity Analysis
• A decision tree is a schematic model of the sequence of steps in a problem – including the conditions and consequences of each step.
• Decision trees help analysts understand the problem and assist in identifying the best solution.
• Decision tree components include the following:– Decision nodes – represented with squares
– Chance nodes – represented with circles
– Paths – links between nodes

5–19
Cop
yri
gh
t ©
20
14
by M
cGra
w H
ill E
du
cati
on
(In
dia
) Pri
vate
Lim
ited
. A
ll ri
gh
ts
rese
rved
.Example 5.2: Decision Trees
• The owner of Hackers Computer Store is evaluating three options – expand at current site, expand to a new site, do nothing.
• The decision process includes the following assumptions and conditions.– Strong growth has a 55% probability– New site cost is $210,000
Payoffs: strong growth = $195,000; weak growth = $115,000
– Expanding current site cost is $87,000 (in either year 1 or 2) Payoffs: strong growth = $190,000; weak growth =
$100,000– Do nothing
Payoffs: strong growth = $170,000; weak growth = $105,000

5–20
Cop
yri
gh
t ©
20
14
by M
cGra
w H
ill E
du
cati
on
(In
dia
) Pri
vate
Lim
ited
. A
ll ri
gh
ts
rese
rved
.Example 5.2: Decision Trees
• Calculate the value of each alternative

5–21
Cop
yri
gh
t ©
20
14
by M
cGra
w H
ill E
du
cati
on
(In
dia
) Pri
vate
Lim
ited
. A
ll ri
gh
ts
rese
rved
.Example 5.2: Decision Trees
• Diagram the problem chronologically
Decision
Events
Decision

5–22
Cop
yri
gh
t ©
20
14
by M
cGra
w H
ill E
du
cati
on
(In
dia
) Pri
vate
Lim
ited
. A
ll ri
gh
ts
rese
rved
.Example 5.2: Decision Trees
• Calculate value of each branch
$765,000
$365,000
$863,000
$413,000
$843,000
$850,000
$525,000

5–23
Cop
yri
gh
t ©
20
14
by M
cGra
w H
ill E
du
cati
on
(In
dia
) Pri
vate
Lim
ited
. A
ll ri
gh
ts
rese
rved
.
Example 5.2• Work backwards to calculate the value of each
decision/event
$765,000
$365,000
$863,000
$413,000
$843,000
$850,000
$525,000
$660,500
$703,750 Do nothing = $850,000
Do nothing = $703,750
Do nothing has higher value than expand, so choose to do nothing
Do nothing has higher value than expand or move, so choose to do nothing

5–24
Cop
yri
gh
t ©
20
14
by M
cGra
w H
ill E
du
cati
on
(In
dia
) Pri
vate
Lim
ited
. A
ll ri
gh
ts
rese
rved
.Example 5.2: Decision Trees
• Decision tree analysis with net present value calculations
Excel: Decision Trees
For the Excel template visit www.mhhe.com/sie-chase14e

5–25
Cop
yri
gh
t ©
20
14
by M
cGra
w H
ill E
du
cati
on
(In
dia
) Pri
vate
Lim
ited
. A
ll ri
gh
ts
rese
rved
.Planning Service Capacity
Manufacturing Capacity
Goods can be stored for later use.
Goods can be shipped to other locations.
Volatility of demand is relatively low.
Service Capacity
Capacity must be available when service is needed –
cannot be stored.
Service must be available at customer demand
point.
Much higher volatility is typical.

5–26
Cop
yri
gh
t ©
20
14
by M
cGra
w H
ill E
du
cati
on
(In
dia
) Pri
vate
Lim
ited
. A
ll ri
gh
ts
rese
rved
.Capacity Utilization and Service Quality
• The relationship between service capacity utilization and service quality is critical.– Utilization is measured by the portion of time
servers are busy.
• Optimal levels of utilization are context specific.– Low rates are appropriate when the degree of
uncertainty (in demand) is high and/or the stakes are high (e.g., emergency rooms, fire departments).
– Higher rates are possible for predictable services or those without extensive customer contact (e.g., commuter trains, postal sorting).

5–27
Cop
yri
gh
t ©
20
14
by M
cGra
w H
ill E
du
cati
on
(In
dia
) Pri
vate
Lim
ited
. A
ll ri
gh
ts
rese
rved
.
Service Quality• Rate of service utilization and service
quality are directly linked.
Arrivals exceed services – many customers are never served
Sufficient capacity to provide quality service
Service quality declines – disruptions or high arrival levels lead to long wait times
Related Documents