Measuring Quality of Services Source: A. Parasuraman University of Miami

5. Measuring Quality of Service
Jan 02, 2016
Welcome message from author
This document is posted to help you gain knowledge. Please leave a comment to let me know what you think about it! Share it to your friends and learn new things together.
Transcript

Measuring Quality of Services
Source: A. Parasuraman University of Miami
Issues How do customers perceive and evaluate service quality?What are managers’ perceptions about service quality?Do discrepancies exist between the perceptions of customers and those of managers?Can customers’ and managers’ perceptions be combined into a general model of service quality?How can service organizations improve customer service and achieve excellence?
2

Services and Their Customer Expectations
HospitalPatient receive the correct treatments?Patient treated courteously by all personnel?Hospital environment support patient recovery?
BankCustomer’s transactions completed with precision?Bank comply with government regulations?Customer’s statements accurate?

Service quality is more difficult to measure than for goodsService quality perceptions depend on
Expectations versus realityProcess and outcome
Types of service qualityNormal: Routine service deliveryExceptional: How problems are handled
Quality Management In Services

SERVQUAL: Measuring Service Quality
5

Determinants of Perceived Service Quality
Dimensions of Service Quality
1. Access2. Communication3. Competence4. Courtesy5. Credibility6. Reliability7. Responsiveness8. Security9. Tangibles10.
Understanding/Knowing the Customer
ExpectedService
PerceivedService
ServiceQuality
Gap
PerceivedServiceQuality
Word ofMouth
PersonalNeeds
PastExperience
External Communication
to Customers
6
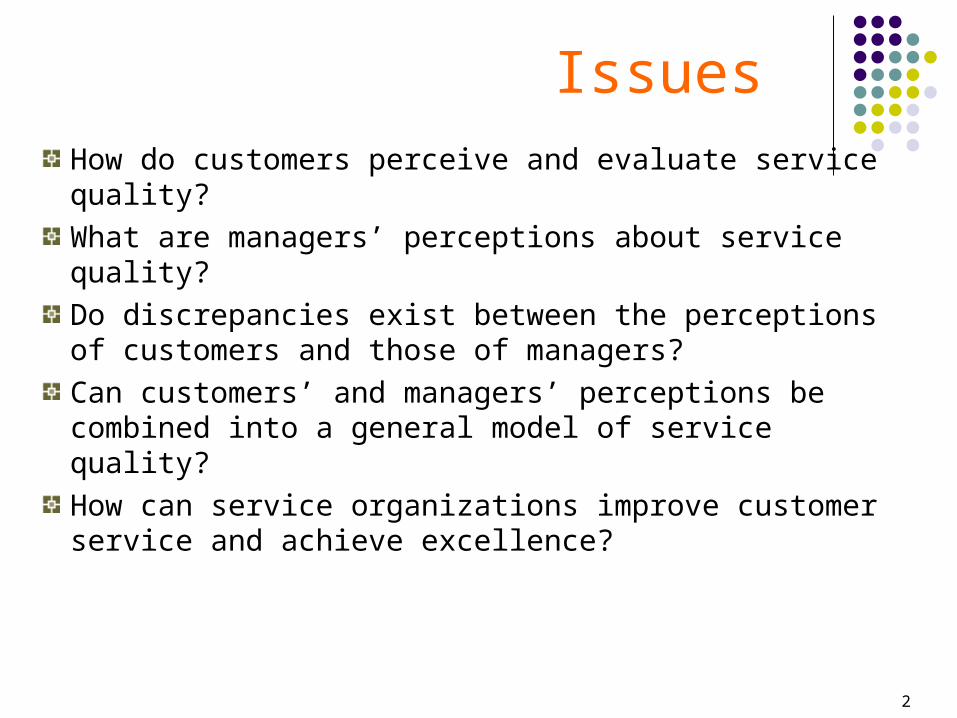
Correspondence between SERVQUAL Dimensions and Original Ten Dimensions for Evaluating
Service QualityOriginal Ten
Dimensions forEvaluating Service
Quality
TANGIBLESRELIABILITYRESPONSIVENESSCOMPETENCE
COURTESY
CREDIBILITY
SECURITY
ACCESS
COMMUNICATION
UNDERSTANDING/ KNOWING THECUSTOMER
TANGIBLES RELIABILITY RESPONSIVENESS ASSURANCE EMPATHY
SERVQUAL Dimensions
7

Definitions of the SERVQUAL Dimensions
Tangibles: Appearance of physical facilities, equipment, personnel, and communication materials.Reliability: Ability to perform the promised service and accurately.Responsiveness: Willingness to help customers and provide prompt service.
8

Definitions of the SERVQUAL Dimensions
Assurance: Knowledge and courtesy of employees and their ability to inspire trust and confidence.Empathy: Caring, individualized attention the firm provides its customers.
9

Relative Importance of Service Dimensions [Study
1]
TANGIBLES 11%
EMPATHY 16%
RELIABILITY 32%
ASSURANCE 19%
RESPONSIVENESS
22%
10

Relative Importance of Service Quality Dimensions [Study 2]
Mean Number of Points Allocated out of 100 Points
37
9
1318
23
29
12
17
19
23
28
12
18
20
23
33
11
1519
23
32
14
1518
21
Computer Manufacturer All Companies Retail Chain
Auto Insurer Life InsurerReliability Responsiveness Assurance Empathy Tangibles
11

1.00
0.00
-1.00
-2.00Tangibles Reliability Responsive-
nessAssurance Empathy
Mean SERVQUAL Scores by Service Dimension
[Study 1]
12

Nature of Service Expectations
Desired Service
Zoneof
Tolerance
Adequate Service
Level Customers Believe Can and Should Be
Delivered
Minimum Level Customers Are Willing
to Accept
13

Gap Model of Service Quality
Customer
Company
Customer Perceptions
Customer Expectations
Gap 5
Service Delivery Designs
Gap 2
Service Delivery
Gap 3Communications
to Customers
Gap 4
Perceptions of Customer Expectations
Gap
1
Source: Zeithaml & Bitner

Gap Model of Service Quality
Gap 5: Customer Perceptions - Customer Expectations Gap 1: Not Knowing What Customers Expect
Company Perception of Customer Expectations - Actual
Gap 2: Not Selecting the Right Design Standards
Service Design Standards - Company Perception of Customer Expectations

Gap Model of Service Quality
Gap 3: Not Delivering to Service Standards:
The Operations GapActual Service Performance - Standards
Gap 4: Not Matching Performance to Promises
Actual Service Performance - Promised Performance
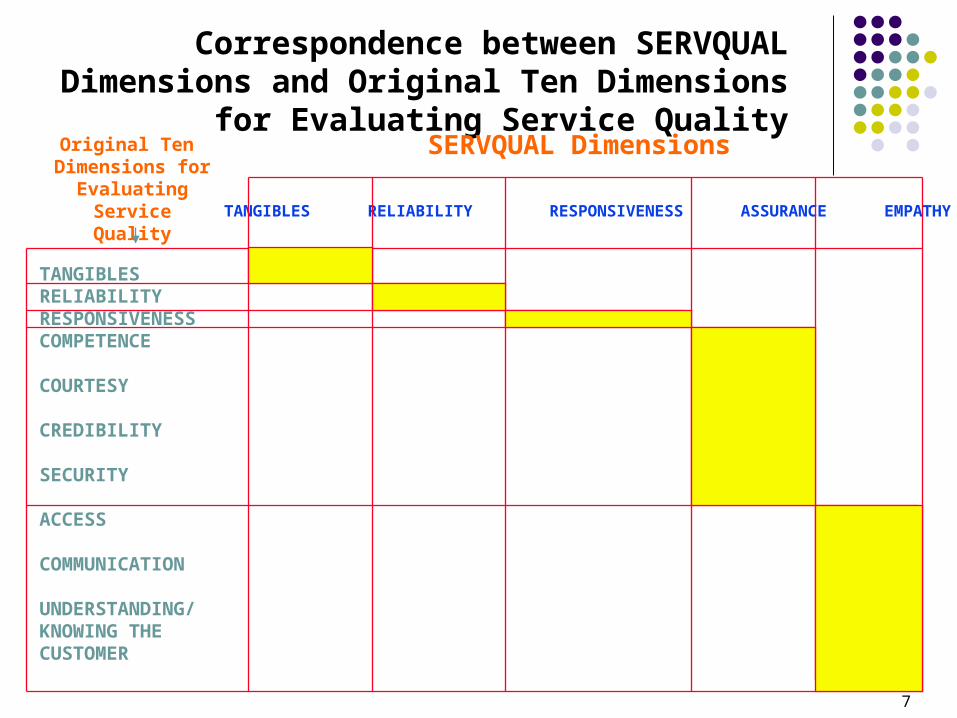
Gap 3: Translating the Service Standards into the Delivery
Operation
Gap 3a: Operational Design
People: Employees, Managers, & Customers
Process: Role of Service Blueprinting
Equipment/Facilities, i.e., Tangibles Plus a Whole Lot More
Gap 3b: Operational Control
Ensuring the Quality of the Outcome, Especially When Using Intermediaries
Enhancing the Operational Design Through Feedback

Gap 3: Role of Employees in Operational Design & Delivery
Staffing and Scheduling ShortcomingsIneffective RecruitmentRole Ambiguity & Role ConflictWrong Skills for Process - Equipment ElementsFlaws in Evaluation & Compensation SystemsLack of Empowerment & Teamwork
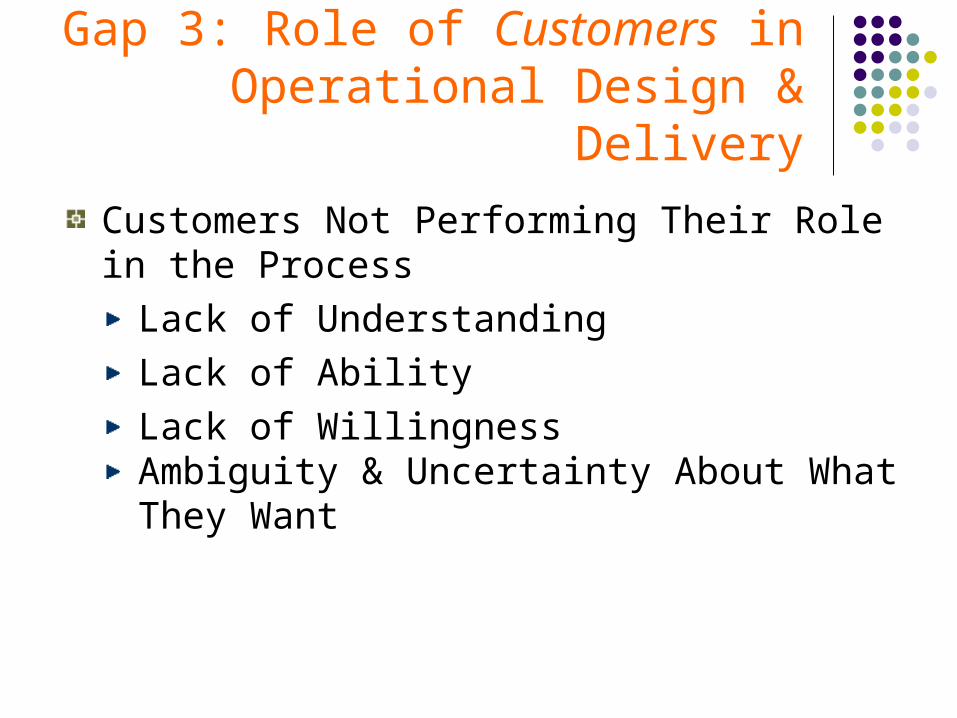
Gap 3: Role of Customers in Operational Design & Delivery
Customers Not Performing Their Role in the Process
Lack of UnderstandingLack of AbilityLack of WillingnessAmbiguity & Uncertainty About What They Want
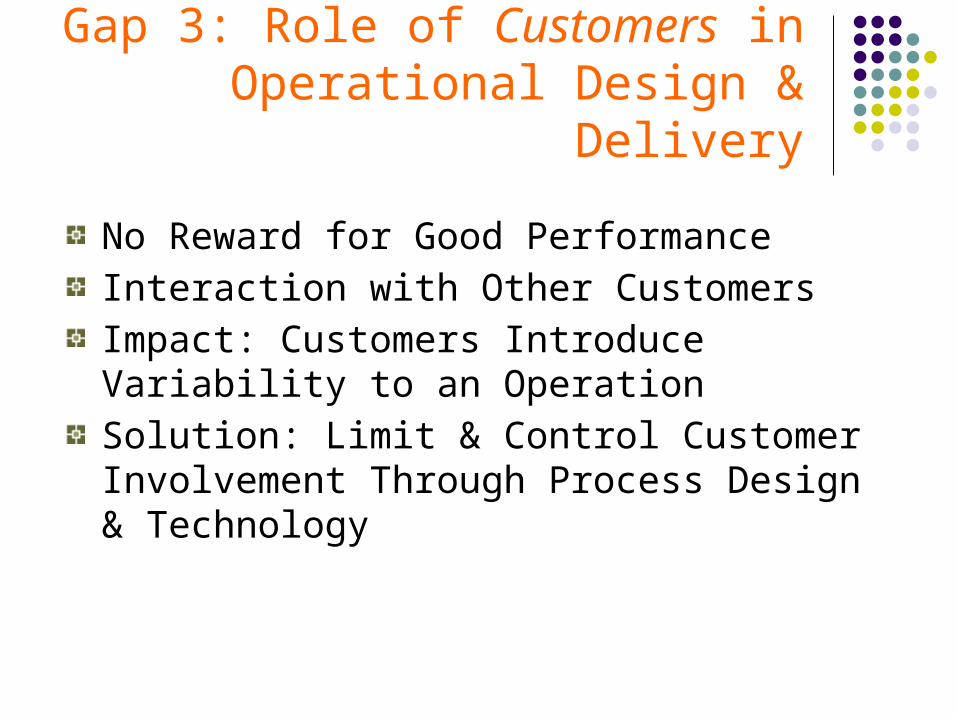
Gap 3: Role of Customers in Operational Design & Delivery
No Reward for Good PerformanceInteraction with Other CustomersImpact: Customers Introduce Variability to an OperationSolution: Limit & Control Customer Involvement Through Process Design & Technology
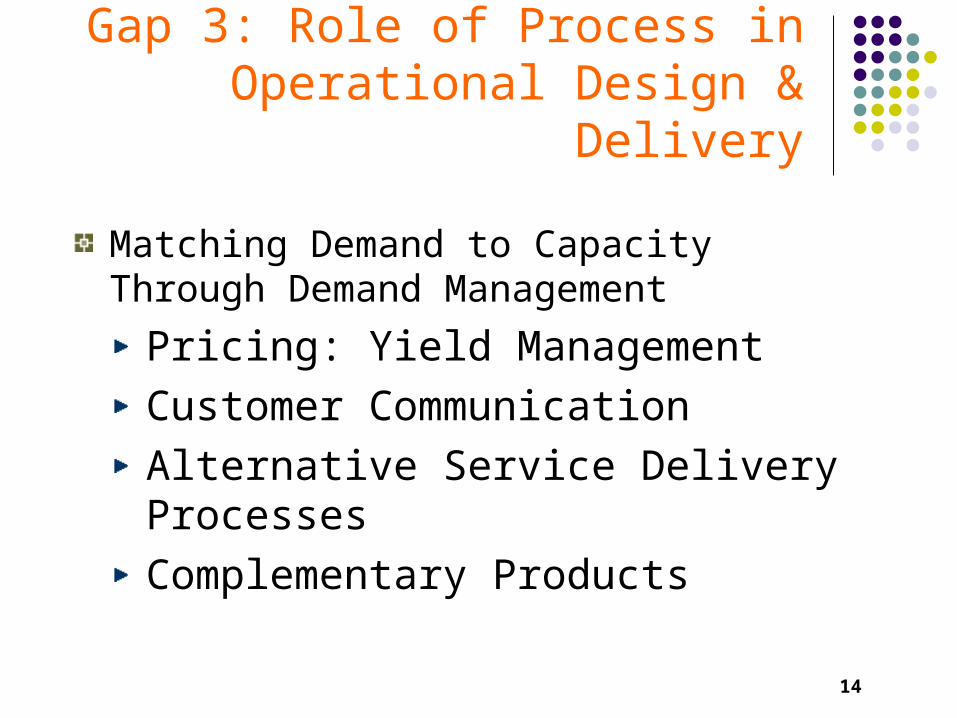
Gap 3: Role of Process in Operational Design & Delivery
Matching Demand to Capacity Through Demand Management
Pricing: Yield ManagementCustomer CommunicationAlternative Service Delivery ProcessesComplementary Products
14
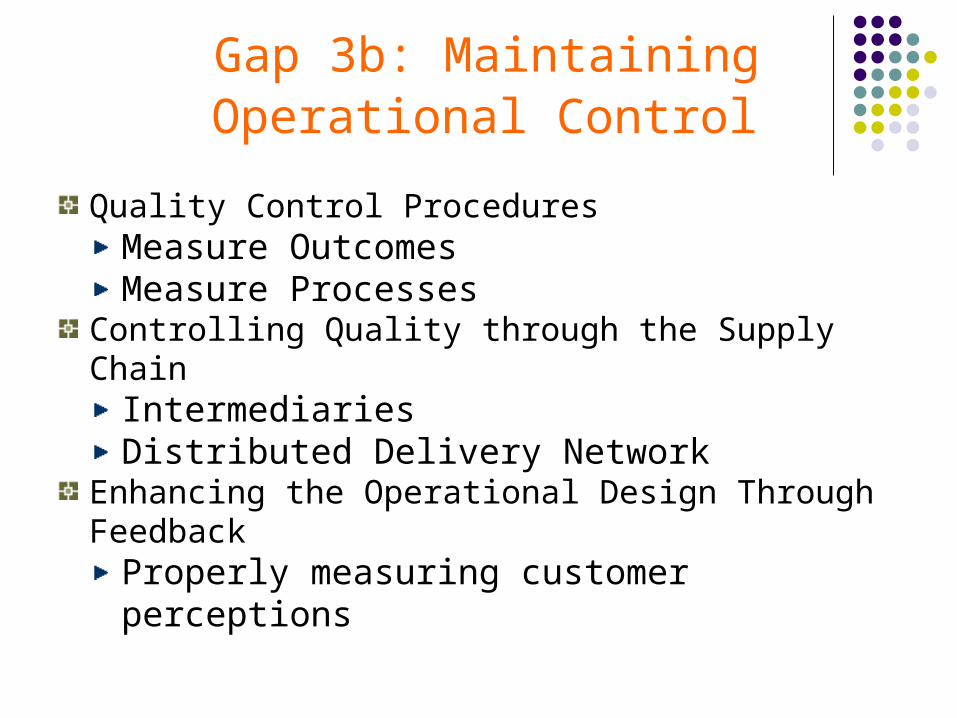
Gap 3b: Maintaining Operational Control
Quality Control ProceduresMeasure OutcomesMeasure Processes
Controlling Quality through the Supply ChainIntermediariesDistributed Delivery Network
Enhancing the Operational Design Through Feedback
Properly measuring customer perceptions

TWO APPROACHES FOR MEASURING MSA AND MSS
Two-Column Format QuestionnaireDirect measures of MSA and MSS
Three-Column Format QuestionnaireDifference-score measures of MSA and MSS
23

TWO-COLUMN FORMAT
Please think about the quality of service ________ offers compared to the two different levels of service defined below:
MINIMUM SERVICE LEVEL - the minimum level of service performance you consider
adequate. DESIRED SERVICE LEVEL - the level of service performance you desire.
For each of the following statements, please indicate: (a) how ______’s performance compares with your minimum service level by circling one of the numbers in the first column; and (b) how ______’s performance compares with your desired service level by circling one of the numbers in the second column. Compared to My Minimum Compared to My Desired Service Level ____’s Service Level ____’s Service Performance is: Service Performance is: The No The No
When it comes to … Lower Same Higher Opin- Lower Same Higher Opin- ion ion
1. Prompt service 1 2 3 4 5 6 7 8 9 N 1 2 3 4 5 6 7 8 9 N to policyholders
2. Employees who are 1 2 3 4 5 6 7 8 9 N 1 2 3 4 5 6 7 8 9 N consistently courteous
24

THREE-COLUMN FORMAT
We would like your impressions about ________’s service performance relative to your expectations. Please thinkabout the two different levels of expectations defined below:
MINIMUM SERVICE LEVEL - the minimum level of service performance you consider adequate.
DESIRED SERVICE LEVEL - the level of service performance you desire.
For each of the following statements, please indicate: (a) your minimum service level by circling one of the numbersin the first column; and (b) your desired service level by circling one of the numbers in the second column; and (c)your perception of ___________’s service by circling one of the numbers in the third column.
My Minimum My Desired My Perception Service Service of ____’s Service Level is: Level is: Performance is:
No
When it comes to … Low High Low High Low High Opin- ion
1. Prompt service 1 2 3 4 5 6 7 8 9 1 2 3 4 5 6 7 8 9 1 2 3 4 5 6 7 8 9 N
to policyholders
2. Employees who are 1 2 3 4 5 6 7 8 9 1 2 3 4 5 6 7 8 9 1 2 3 4 5 6 7 8 9 N
consistently courteous
25

Measurement Error: Percent of Respondents Answering Incorrectly
Two-ColumnFormat
Three-ColumnFormat
ComputerManufacturer 8.6% 0.6%
Retail Chain 18.2% 1.8%
Auto Insurer 12.2% 1.6%
Life Insurer 9.9% 2.7%
Type of Company
26

Mean Service Quality Scores (Combined Across All Companies)
TWO-COLUMN FORMATQUESTIONNAIRE
THREE-COLUMN FROMATQUESTIONNAIRE
MSA Scores MSS Scores MSA Scores MSS Scores
Reliability 6.8 5.9 0.2 -1.0
Responsiceness 6.7 5.7 0.3 -1.1
Assurance 6.8 5.9 0.4 -0.9
Empathy 6.5 5.6 0.2 -1.2
Tangibles 7.1 6.4 1.1 -0.2
SERVQUAL Dimensions
27

Revised SERVQUAL Items
28
Reliability1. Providing services as promised2. Dependability in handling customers'
service problems3. Performing services right the first
time4. Providing services at the promised
time5. Keeping customers informed about
when services will be performed

Revised SERVQUAL Items
29
Responsiveness6. Prompt service to customers7. Willingness to help customers8. Readiness to respond to customers' requestsAssurance 9. Employees who instill confidence in
customers10. Making customers feel safe in their
transactions11. Employees who are consistently courteous12. Employees who have the knowledge to
answer customer questions
Revised SERVQUAL Items
30
Empathy13. Giving customers individual attention14. Employees who deal with customers
in a caring fashion15. Having the customer's best interest
at heart16. Employees who understand the
needs of their customers

Revised SERVQUAL Items
31
Tangibles17. Modern equipment18. Visually appealing facilities19. Employees who have a neat, professional appearance20. Visually appealing materials associated
with the service21. Convenient business hours

Definition of e-Service Quality (e-SQ)
e-SQ is the extent to which a Website facilitates efficient and effective shopping, purchasing and delivery of products and services.
32

Dimensions of e-Service Quality from Focus Groups
AccessEase of NavigationEfficiencyCustomization/ PersonalizationSecurity/Privacy
ResponsivenessAssurance/TrustPrice KnowledgeSite AestheticsReliabilityFlexibility
33

Reliability
SAMPLE ATTRIBUTESSite does not crashAccurate billingAccuracy of orderAccuracy of account informationHaving items in stockTruthful informationMerchandise arrives on time
DEFINITION
Correct technical functioning of the site and the accuracy of service promises, billing and product information.
34
Efficiency
SAMPLE ATTRIBUTES
Site is well organizedSite is simple to useSite provides information in reasonable chunksSite allows me to click for more information if I need it
DEFINITION
The site is simple to use, structured properly, and requires a minimum of information to be input by the customer.
35

e-Service Quality vs. Traditional SQ
Several dimensions are the same, but specific attributes underlying them are differente-SQ involves some new dimensions Empathy -- and other ‘hi-touch’ oriented attributes -- do not seem to be as critical for e-SQ except when customers experience problems;
36
Technology Readiness (TR)
An organization’s ability to use technology effectively in marketing to and serving customers critically depends on the technology readiness of its customers and employees
Technology Readiness (TR) refers to “people’s propensity to embrace and use new technologies for accomplishing goals in home life and at work
37
Key Insights from Qualitative Research Studies
TR doesn’t just refer to possessing technical skills; TR is much more a function of people’s beliefs and feelings about technologyPeople’s beliefs can be positive about some aspects of technology but negative about other aspectsThe relative strengths of the of positive and negative beliefs determine a person’s receptivity to technology
38

Receptive toTechnology
NeutralResistant toTechnology
Technology-Beliefs Continuum
39
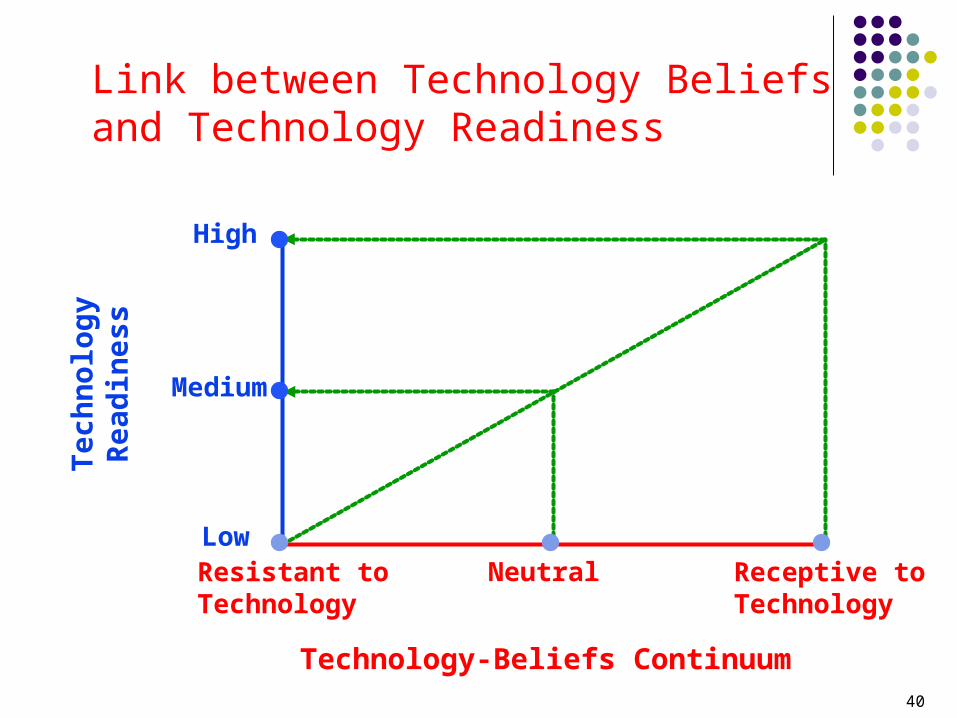
Link between Technology Beliefs and Technology Readiness
High
Receptive toTechnology
NeutralResistant toTechnology
Low
Medium
Tec
hn
olo
gy
Rea
din
ess
Technology-Beliefs Continuum40

Key Insights from Quantitative Research Studies
TR consists of four facets or dimensions that are fairly independent of one anotherPeople’s ratings on a set of belief statements about technology can be combined to create a reliable and valid measure of TR -- i.e., a “Technology Readiness Index” [TRI]The TRI is a good predictor of people’s technology-related behaviors and preferencesA meaningful typology of customers can be created based on their TR scores on the four dimensions
41

Definitions of the TR Drivers
Optimism: Positive view of technology; belief that it offers increased control, flexibility and efficiencyInnovativeness: Tendency to be a technology pioneer and thought leaderDiscomfort: Perceived lack of control over technology and a feeling of being overwhelmed by itInsecurity: Distrust of technology and skepticism about its working properly
42

OPT. TRIINS.DIS.INN.
Mean TRScores
TR Scores by Dimension and Overall TRI
0
0,5
1
1,5
2
2,5
3
3,5
4
4,5
1 2 3 4 5
US 1999 US 2000 US 2001 Austria 2001
* **
*Austrian and US scores are signifcantly different

Characteristics of Technology Segments
Optimism Innovative- Dis- Insecu- ness comfort
rity
Explorers High High Low LowPioneers High High High HighSkeptics Low Low Low LowParanoids High Low High HighLaggards Low Low High High
44
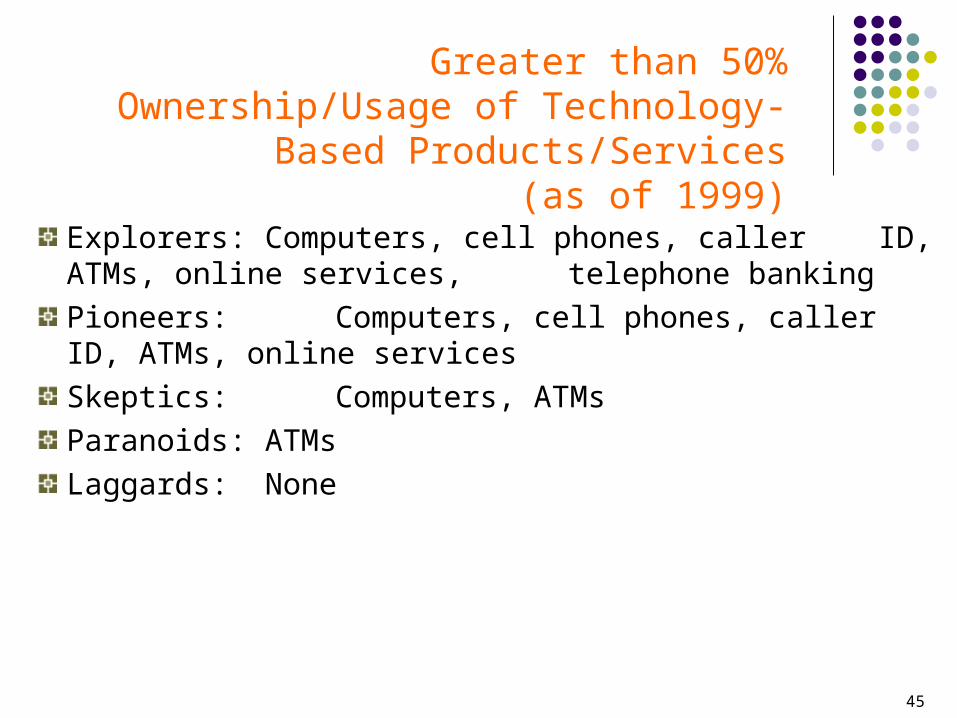
Greater than 50% Ownership/Usage of Technology-Based Products/Services
(as of 1999)
Explorers: Computers, cell phones, caller ID, ATMs, online services, telephone bankingPioneers: Computers, cell phones, caller ID, ATMs, online servicesSkeptics: Computers, ATMsParanoids: ATMsLaggards: None
45

END
Related Documents