March 2013 The Rise of Connected Devices Long Ellis, VP & GM, Direct Media

4A’s Transformation 2013 - March 12 - Flurry - Long Ellis
Aug 19, 2015
Welcome message from author
This document is posted to help you gain knowledge. Please leave a comment to let me know what you think about it! Share it to your friends and learn new things together.
Transcript

March 2013
The Rise of Connected DevicesLong Ellis, VP & GM, Direct Media
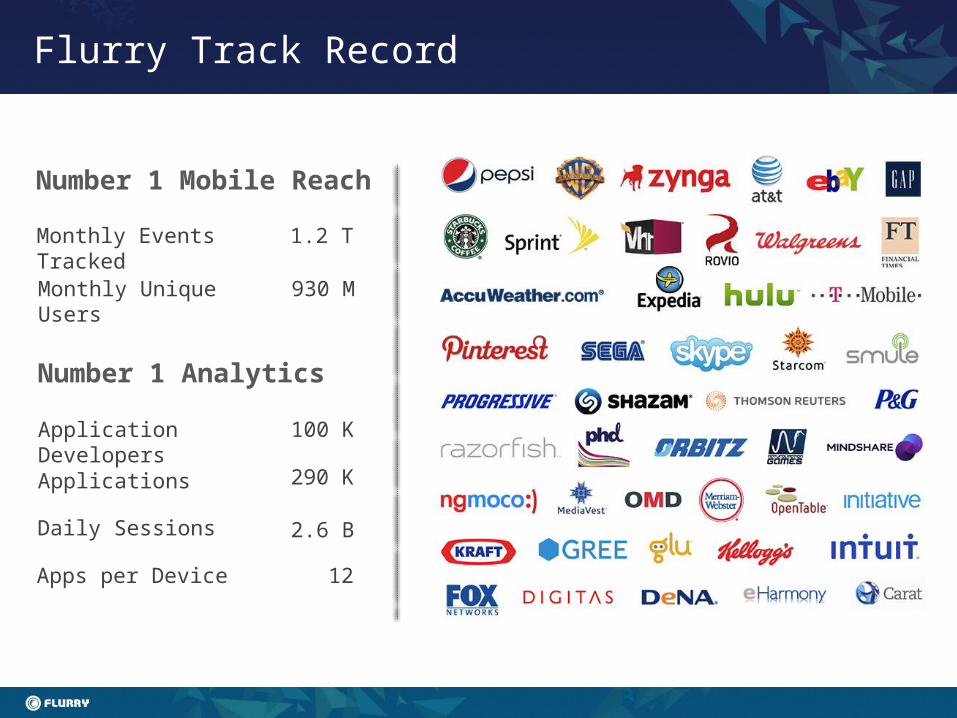
930 MMonthly Unique Users
Number 1 Mobile Reach
Flurry Track Record
Number 1 Analytics
100 KApplication Developers
290 KApplications
2.6 BDaily Sessions
1.2 TMonthly Events Tracked
12Apps per Device
Dec 2010 Dec 2011 Dec 2012 -
20
40
60
80
100
120
140
160
180
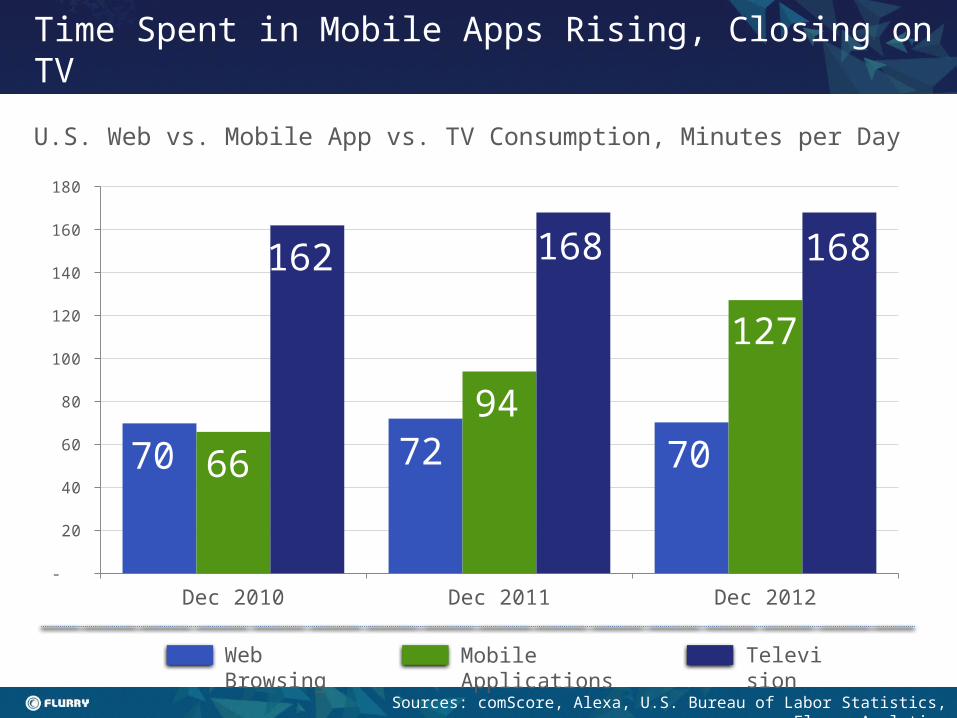
Sources: comScore, Alexa, U.S. Bureau of Labor Statistics, Flurry Analytics
70
162
66 72
168
9470
168
127
Mobile ApplicationsWeb Browsing Television
Time Spent in Mobile Apps Rising, Closing on TV
U.S. Web vs. Mobile App vs. TV Consumption, Minutes per Day

5am 6am 7am 8am 9am 10am 11am 12pm 1pm 2pm 3pm 4pm 5pm 6pm 7pm 8pm 9pm 10pm 11pm 12am 1am 2am 3am 4am 0%
10%
20%
30%
40%
50%
60%
70%
Sources: TV & Internet dayparts from analysis by Michael Zimbalist (2/10); Nielsen National People Meter; comScore Media Metrix Mobile application daypart from analysis by Flurry (8/11); Flurry Analytics, n = 15.2M DAUs
Primetime All The Time for Apps
Daypart Comparison, People 15+ Using Medium in U.S.
TELEVISION INTERNET iOS & ANDROID APPS
Hour of Day
% o
f Aud
ienc
e Us
ing
5am 6am 7am 8am 9am 10am 11am 12pm 1pm 2pm 3pm 4pm 5pm 6pm 7pm 8pm 9pm 10pm 11pm 12am 1am 2am 3am 4am 0%
1%
2%
3%
4%
5%
6%
7%
8%
9%
% o
f Aud
ienc
e Us
ing
Hour of Day
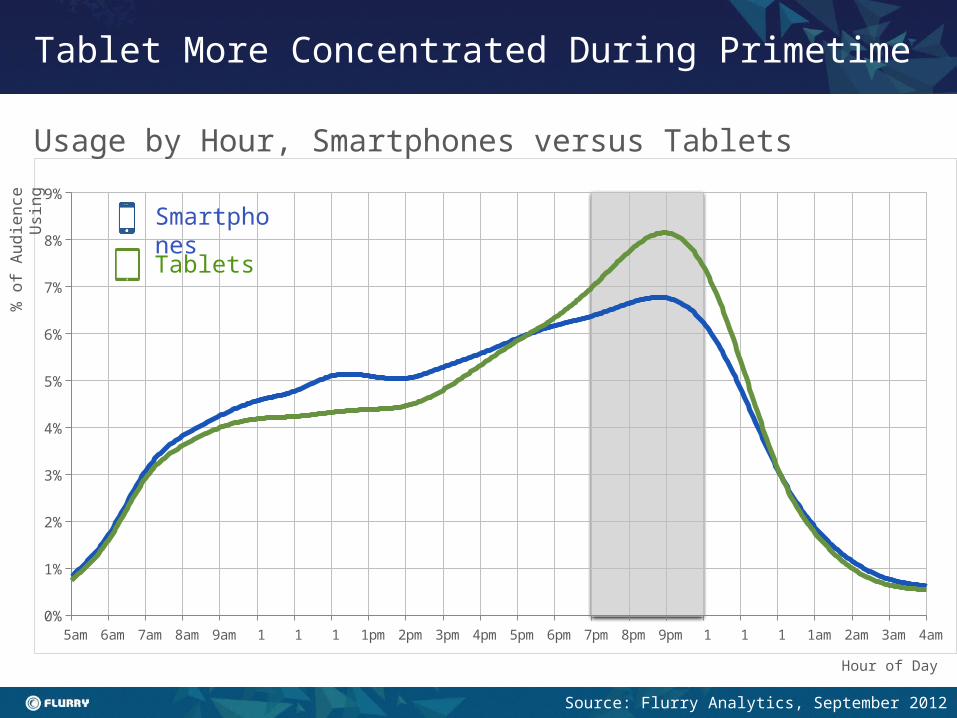
Source: Flurry Analytics, September 2012
Smartphones
Tablets
Tablet More Concentrated During Primetime
Usage by Hour, Smartphones versus Tablets
TV Print Web Radio Mobile
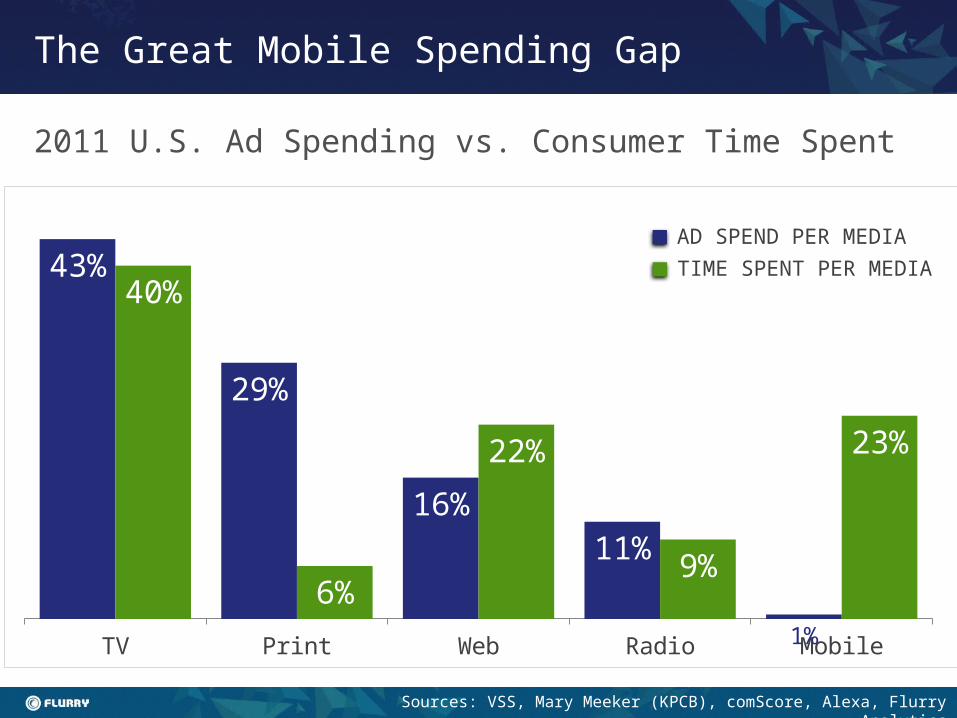
43%
29%
16%11%
1%
40%
6%
22%
9%
23%
Sources: VSS, Mary Meeker (KPCB), comScore, Alexa, Flurry Analytics
TIME SPENT PER MEDIAAD SPEND PER MEDIA
The Great Mobile Spending Gap
2011 U.S. Ad Spending vs. Consumer Time Spent
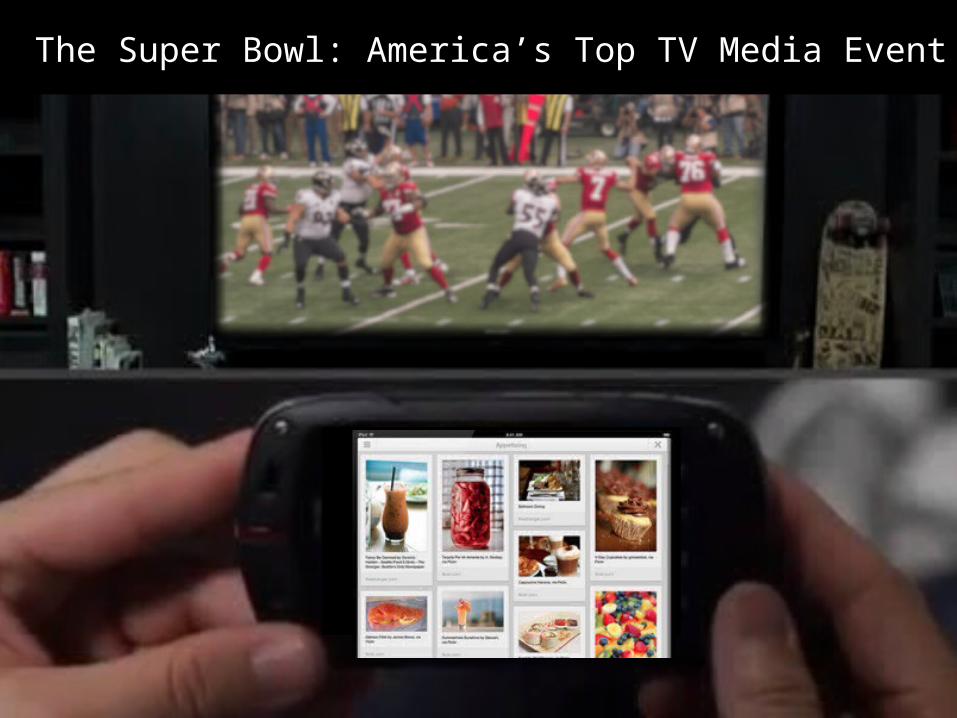
The Super Bowl: America’s Top TV Media Event
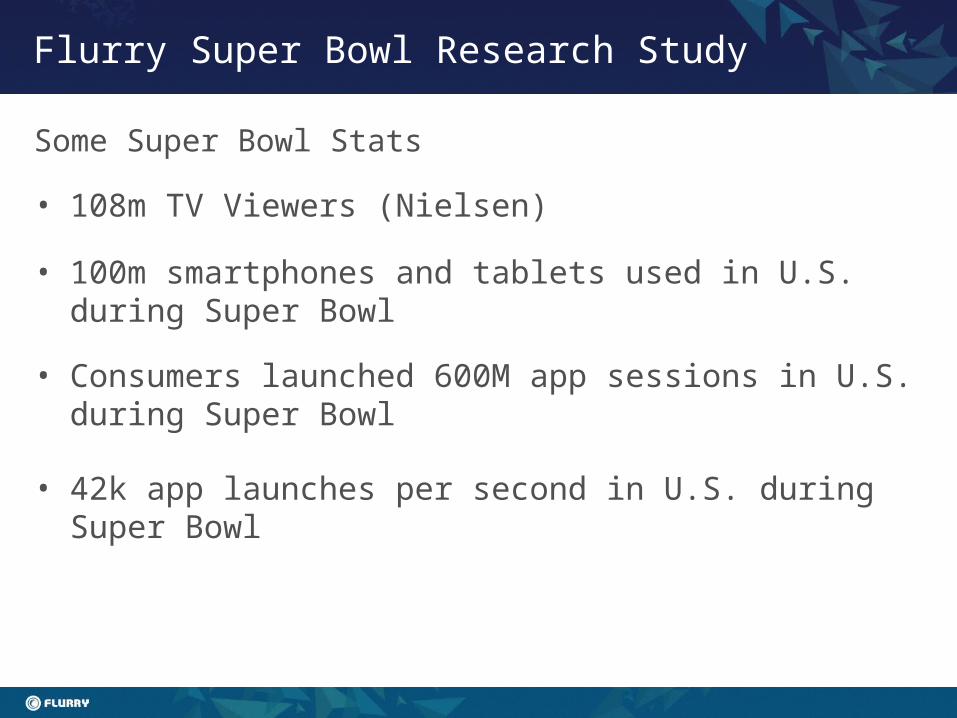
• 108m TV Viewers (Nielsen)
• 100m smartphones and tablets used in U.S. during Super Bowl
• Consumers launched 600M app sessions in U.S. during Super Bowl
• 42k app launches per second in U.S. during Super Bowl
Flurry Super Bowl Research Study
Some Super Bowl Stats
Source: Flurry Analytics
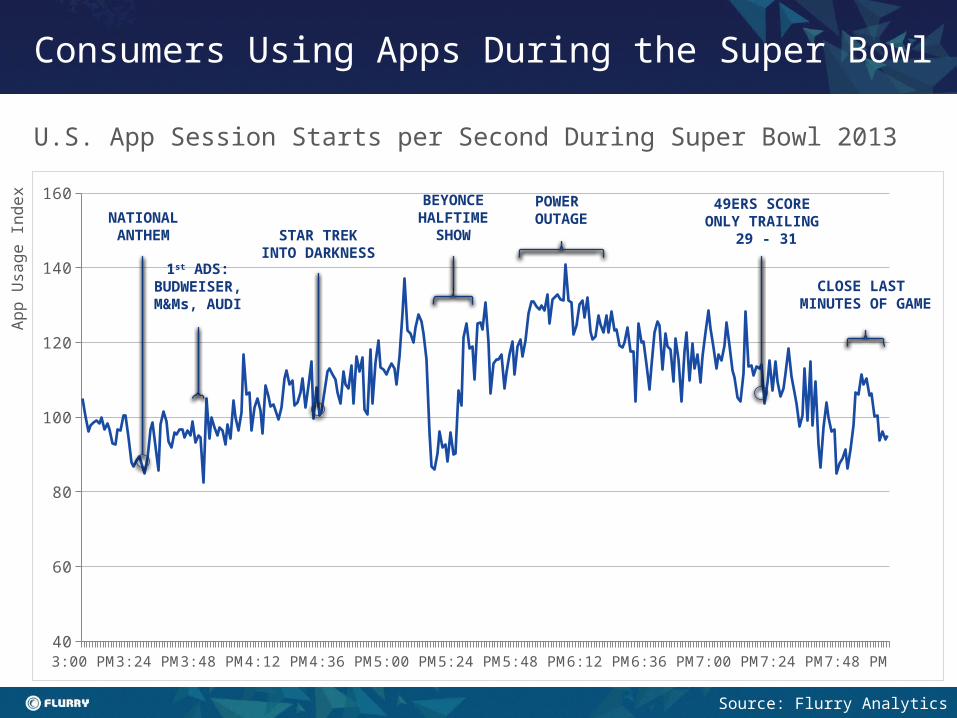
Consumers Using Apps During the Super Bowl
U.S. App Session Starts per Second During Super Bowl 2013
3:00 PM 3:17 PM 3:34 PM 3:51 PM 4:08 PM 4:25 PM 4:42 PM 4:59 PM 5:16 PM 5:33 PM 5:50 PM 6:07 PM 6:24 PM 6:41 PM 6:58 PM 7:15 PM 7:32 PM 7:49 PM40
60
80
100
120
140
160BEYONCEHALFTIME
SHOW
POWER OUTAGE
CLOSE LAST MINUTES OF GAME
NATIONALANTHEM
1st ADS:BUDWEISER, M&Ms, AUDI
STAR TREKINTO DARKNESS
49ERS SCOREONLY TRAILING
29 - 31
App
Usag
e In
dex
Source: Flurry Analytics
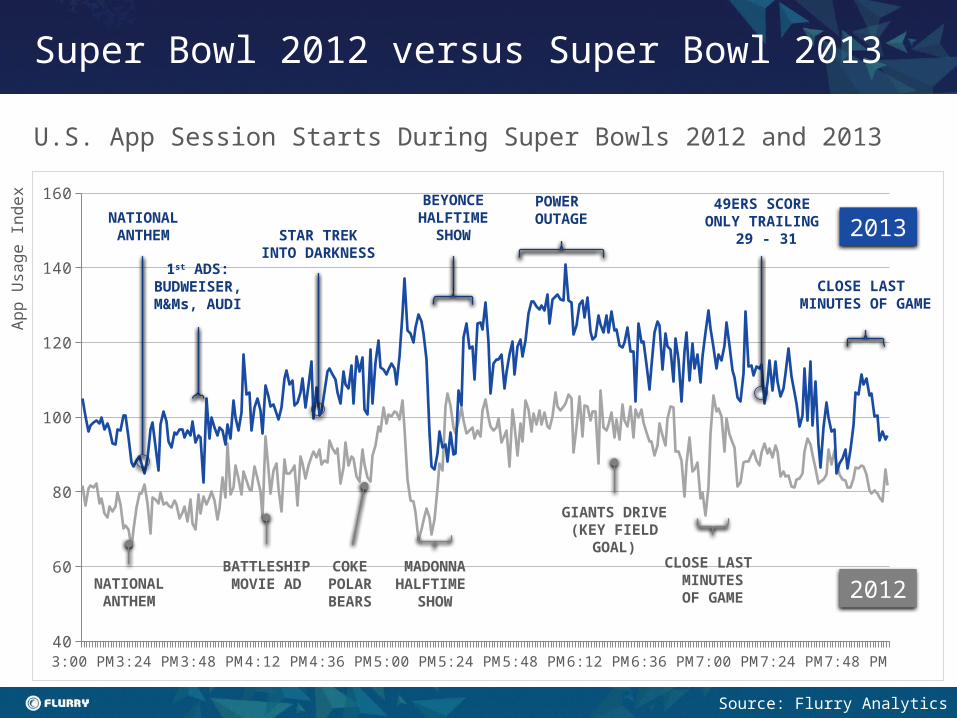
Super Bowl 2012 versus Super Bowl 2013
U.S. App Session Starts During Super Bowls 2012 and 2013
3:00 PM 3:17 PM 3:34 PM 3:51 PM 4:08 PM 4:25 PM 4:42 PM 4:59 PM 5:16 PM 5:33 PM 5:50 PM 6:07 PM 6:24 PM 6:41 PM 6:58 PM 7:15 PM 7:32 PM 7:49 PM40
60
80
100
120
140
160
MADONNAHALFTIME
SHOW
CLOSE LAST MINUTESOF GAME
NATIONALANTHEM
BATTLESHIP MOVIE AD
GIANTS DRIVE (KEY FIELD GOAL)
BEYONCEHALFTIME
SHOW
POWER OUTAGE
CLOSE LAST MINUTES OF GAME
NATIONALANTHEM
1st ADS:BUDWEISER, M&Ms, AUDI
COKEPOLARBEARS
STAR TREKINTO DARKNESS
49ERS SCOREONLY TRAILING
29 - 31 2013
2012
App
Usag
e In
dex
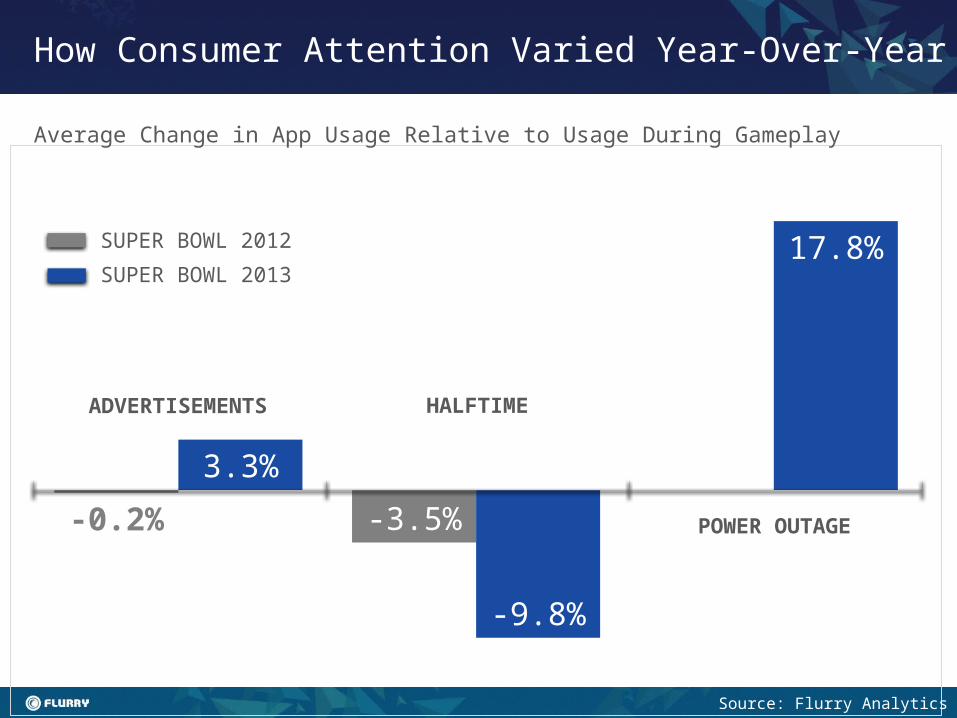
-0.2% -3.5%
3.3%
-9.8%
17.8%SUPER BOWL 2013
SUPER BOWL 2012
POWER OUTAGE
HALFTIMEADVERTISEMENTS
Source: Flurry Analytics
How Consumer Attention Varied Year-Over-Year
Average Change in App Usage Relative to Usage During Gameplay

• Mobile Apps usage concurrent with TV viewing
• Just because the TV is on doesn’t mean consumers are watching– 41% of consumers use tablets while watching TV daily (Nielsen)– 39% of consumers use smartphones while watching TV daily
(Nielsen)
• Marketers need to think about effective reach vs. pure reach
• Marketers have an opportunity to make mobile a larger part of the media mix to extend effective reach.
Take Aways

March 2013
Thank you!Long Ellis, VP & GM, Direct Media
Related Documents