Gradstein, F. M., Ludden, J. N., et al., 1992 Proceedings of the Ocean Drilling Program, Scientific Results, Vol. 123 40. PROBABILISTIC ZONATION OF EARLY CRETACEOUS MICROFOSSIL SEQUENCES, ATLANTIC AND INDIAN OCEANS, WITH SPECIAL REFERENCE TO LEG 123 1 Felix M. Gradstein, 2,3 Zehui Huang, 3 Doug Merrett, 3 and James G. Ogg 4 ABSTRACT A database was built of 378 stratigraphic events, including first and last stratigraphic occurrences (FO/LO) of calcareous nannofossils, foraminifers, and dinocysts, and geomagnetic reversal occurrences in Latest Jurassic through Early Cretaceous deep marine strata of 10 Atlantic and three Indian Ocean drilling sites. A total 136 different events are included, about one third of which are unique to either ocean; however, this number may decrease when more Indian Ocean ODP sites become available for study. Using the complete data set, with the quantitative stratigraphy methods STRATCOR and RASC, we calculated closely comparable optimum sequences of average first and last occurrence positions. The preferred zonal solution, based on the STRATCOR method, includes 56 events, each of which occurs in 3 or more sites and comprises 6 geomagnetic reversal events, 25 nannofossils, 5 planktonic and 8 benthic foraminifers, and 12 dinocysts. Eight assemblage zones of Tithonian through Albian age have been recognized that correlate most of these sites. The nannofossil events, Cruciellipsis cuvillieri FO, Tubodiscus verenae FO, Rucinolithus wisei LO, and Chiastozygus litterarius FO, in the Atlantic Ocean are half a stage or more older than those in the Indian Ocean. Stratigraphic ranges of the benthic foraminifers Haplophragmium inconstans, Trochammina quinqueloba, and Dorothia praehauteriviana, differ significantly among sites. The same is true for the dinocyst events Phoberocysta neocomica LO and Druggidium apicopaucicum LO, rendering these taxa less useful for zonation and correlation. INTRODUCTION We propose a quantitative zonation using nannofossil, fora minifer, dinocyst, and geomagnetic reversal events in Uppermost Jurassic and Lower Cretaceous sediments in 10 Atlantic and 3 Indian Ocean sites. Indian Ocean sites are from DSDP Leg 27 and from ODP Leg 123, which had as one objective the study of Mesαzoic biostratigraphy and biochronology in relation to the Atlantic oceanic record. Conventional biostratigraphy generally lacks direct integra tion between individual microfossil disciplines before building a multiple zonation and rarely gives insight in the actual geographic distributions of taxa and zones. To a great extent, this is a result of the considerable regional diversity of the microfossil record, the degree of specialization needed to "digest" data from any one microfossil group, such as coccolithophorids, benthic fora minifers, and dinocysts, and the lack of standardized recording and retrieval procedures in stratigraphic paleontology. In addi tion, conventional qualitative methods are poorly suited for inte grating records prior to zonation. For the ultimate in conventional stratigraphic resolution, considerable emphasis is placed on the end points of (micro) fossil ranges in key sections. Unfortunately, few sites provide consistent order and presence of all "zonal" or "index" taxa proposed, which leads to considerable subjective judgment on the part of individual scientists regarding zonation, based on the perceived "true" order of taxa. Modern quantitative zonation and correlation techniques pro vide a means for calculating average or total stratigraphic ranges for a variety of fossil taxa in one integrated and more objective 1 Gradstein, F. M., Ludden, J. N., et al., 1992. Proc. ODP, Sci. Results, 123: College Station, TX (Ocean Drilling Program). 2 Atlantic Geoscience Centre, Bedford Institute of Oceanography, Dartmouth, Nova Scotia B2Y 4A2, Canada. Department of Geology, Dalhousie University, Halifax, Nova Scotia B3H 3J5, Canada. Department of Earth and Atmospheric Sciences, Purdue University, West Lafayette, IN 47907, U.S.A. zonation. If average ranges are one's objective, then the procedure treats local inconsistencies in relative position of the end points of ranges (first and last occurrence events) as local, random deviations from estimated average event locations. Using error bars, uncertainty may be exposed in the total stratigraphic ranges of taxa. Estimates of errors emphasize the probabilistic, rather than deterministic, nature of stratigraphic solutions. In this man ner, debate about a so called "true" zonation is circumvented. If total stratigraphic ranges are one's objective, as with qualitative, deterministic biostratigraphic methodology, then stratigraphic in consistencies are assumed to result from missing data and are eliminated by filling in the data gaps, until a consistent database is obtained. Probabilistic techniques can be used to calculate usable zonations in noisy data sets that contain many sites and are suitable for groups of fossils, where a large deviation occurs between local and average stratigraphic ranges, as with many benthic organisms. Quantitative techniques allow one to calculate integrated zo nations and their correlations quickly and easily, once the data have been standardized. The process is iterative between interim answers and data, such that taxonomic bias, stratigraphic outliers, and absence of stratigraphic and taxonomic communality among sites may be quickly identified. Next, corrective measures may be taken to optimize zonations using "filtered" data, much like step wise filtering of geophysical data during processing. The richness of stratigraphic data in DSDP and ODP holes varies with location, determined by depositional conditions and the degree of diagenetic alteration. Studies of these data have given insight into Jurassic and Early Cretaceous stratigraphy, but most previous stratigraphic research was performed either inde pendently on the basis of a certain fossil group among several holes (Habib, 1977, 1982) or on the basis of several fossil groups in one or two drilling sites in the form of a stratigraphic summary of a drilling leg. Jansa et al. (1979) and Ogg (1987) were the first to use various groups of fossils (nannofossils, dinoflagellates, and ammonites) and geomagnetic polarity to correlate holes (e.g., DSDP Holes 534A and 603B). Gradstein (1986) synthesized empirically Mesozoic biozonations of various fossil groups in the northwestern Atlantic Ocean. 759

Welcome message from author
This document is posted to help you gain knowledge. Please leave a comment to let me know what you think about it! Share it to your friends and learn new things together.
Transcript
Gradstein, F. M., Ludden, J. N., et al., 1992Proceedings of the Ocean Drilling Program, Scientific Results, Vol. 123
40. PROBABILISTIC ZONATION OF EARLY CRETACEOUS MICROFOSSIL SEQUENCES,ATLANTIC AND INDIAN OCEANS, WITH SPECIAL REFERENCE TO LEG 1231
Felix M. Gradstein,2,3 Zehui Huang,3 Doug Merrett,3 and James G. Ogg4
ABSTRACT
A database was built of 378 stratigraphic events, including first and last stratigraphic occurrences (FO/LO) ofcalcareous nannofossils, foraminifers, and dinocysts, and geomagnetic reversal occurrences in Latest Jurassic throughEarly Cretaceous deep-marine strata of 10 Atlantic and three Indian Ocean drilling sites. A total 136 different events areincluded, about one-third of which are unique to either ocean; however, this number may decrease when more IndianOcean ODP sites become available for study. Using the complete data set, with the quantitative stratigraphy methodsSTRATCOR and RASC, we calculated closely comparable optimum sequences of average first and last occurrencepositions. The preferred zonal solution, based on the STRATCOR method, includes 56 events, each of which occurs in3 or more sites and comprises 6 geomagnetic reversal events, 25 nannofossils, 5 planktonic and 8 benthic foraminifers,and 12 dinocysts. Eight assemblage zones of Tithonian through Albian age have been recognized that correlate most ofthese sites. The nannofossil events, Cruciellipsis cuvillieri FO, Tubodiscus verenae FO, Rucinolithus wisei LO, andChiastozygus litterarius FO, in the Atlantic Ocean are half a stage or more older than those in the Indian Ocean.Stratigraphic ranges of the benthic foraminifers Haplophragmium inconstans, Trochammina quinqueloba, and Dorothiapraehauteriviana, differ significantly among sites. The same is true for the dinocyst events Phoberocysta neocomica LOand Druggidium apicopaucicum LO, rendering these taxa less useful for zonation and correlation.
INTRODUCTION
We propose a quantitative zonation using nannofossil, fora-minifer, dinocyst, and geomagnetic reversal events in UppermostJurassic and Lower Cretaceous sediments in 10 Atlantic and 3Indian Ocean sites. Indian Ocean sites are from DSDP Leg 27 andfrom ODP Leg 123, which had as one objective the study ofMesαzoic biostratigraphy and biochronology in relation to theAtlantic oceanic record.
Conventional biostratigraphy generally lacks direct integra-tion between individual microfossil disciplines before building amultiple zonation and rarely gives insight in the actual geographicdistributions of taxa and zones. To a great extent, this is a resultof the considerable regional diversity of the microfossil record,the degree of specialization needed to "digest" data from any onemicrofossil group, such as coccolithophorids, benthic fora-minifers, and dinocysts, and the lack of standardized recordingand retrieval procedures in stratigraphic paleontology. In addi-tion, conventional qualitative methods are poorly suited for inte-grating records prior to zonation. For the ultimate in conventionalstratigraphic resolution, considerable emphasis is placed on theend-points of (micro) fossil ranges in key sections. Unfortunately,few sites provide consistent order and presence of all "zonal" or"index" taxa proposed, which leads to considerable subjectivejudgment on the part of individual scientists regarding zonation,based on the perceived "true" order of taxa.
Modern quantitative zonation and correlation techniques pro-vide a means for calculating average or total stratigraphic rangesfor a variety of fossil taxa in one integrated and more objective
1 Gradstein, F. M., Ludden, J. N., et al., 1992. Proc. ODP, Sci. Results, 123:College Station, TX (Ocean Drilling Program).
2 Atlantic Geoscience Centre, Bedford Institute of Oceanography, Dartmouth,Nova Scotia B2Y 4A2, Canada.
Department of Geology, Dalhousie University, Halifax, Nova Scotia B3H 3J5,Canada.
Department of Earth and Atmospheric Sciences, Purdue University, WestLafayette, IN 47907, U.S.A.
zonation. If average ranges are one's objective, then the proceduretreats local inconsistencies in relative position of the end-pointsof ranges (first and last occurrence events) as local, randomdeviations from estimated average event locations. Using errorbars, uncertainty may be exposed in the total stratigraphic rangesof taxa. Estimates of errors emphasize the probabilistic, ratherthan deterministic, nature of stratigraphic solutions. In this man-ner, debate about a so-called "true" zonation is circumvented. Iftotal stratigraphic ranges are one's objective, as with qualitative,deterministic biostratigraphic methodology, then stratigraphic in-consistencies are assumed to result from missing data and areeliminated by filling in the data gaps, until a consistent databaseis obtained. Probabilistic techniques can be used to calculateusable zonations in noisy data sets that contain many sites and aresuitable for groups of fossils, where a large deviation occursbetween local and average stratigraphic ranges, as with manybenthic organisms.
Quantitative techniques allow one to calculate integrated zo-nations and their correlations quickly and easily, once the datahave been standardized. The process is iterative between interimanswers and data, such that taxonomic bias, stratigraphic outliers,and absence of stratigraphic and taxonomic communality amongsites may be quickly identified. Next, corrective measures may betaken to optimize zonations using "filtered" data, much like step-wise filtering of geophysical data during processing.
The richness of stratigraphic data in DSDP and ODP holesvaries with location, determined by depositional conditions andthe degree of diagenetic alteration. Studies of these data havegiven insight into Jurassic and Early Cretaceous stratigraphy, butmost previous stratigraphic research was performed either inde-pendently on the basis of a certain fossil group among severalholes (Habib, 1977, 1982) or on the basis of several fossil groupsin one or two drilling sites in the form of a stratigraphic summaryof a drilling leg. Jansa et al. (1979) and Ogg (1987) were the firstto use various groups of fossils (nannofossils, dinoflagellates, andammonites) and geomagnetic polarity to correlate holes (e.g.,DSDP Holes 534A and 603B). Gradstein (1986) synthesizedempirically Mesozoic biozonations of various fossil groups in thenorthwestern Atlantic Ocean.
759
F. M. GRADSTEIN, Z. HUANG, D. MERRETT, J. G. OGG
For a more comprehensive understanding of deep-water Me-sozoic biostratigraphy, one must draw on as much informationfrom various stratigraphic disciplines (foraminifers, nannofossils,dinoflagellates, geomagnetic polarity) as possible, preferably ina quantitative way. The stratigraphy developed on the basis of acertain fossil group in a single hole or a small area almost alwayssuffers from redeposition and diagenetic alteration (dissolution),and sometimes misidentification. This stratigraphy may not becomplete and representative enough because of diachroneity ofsome species.
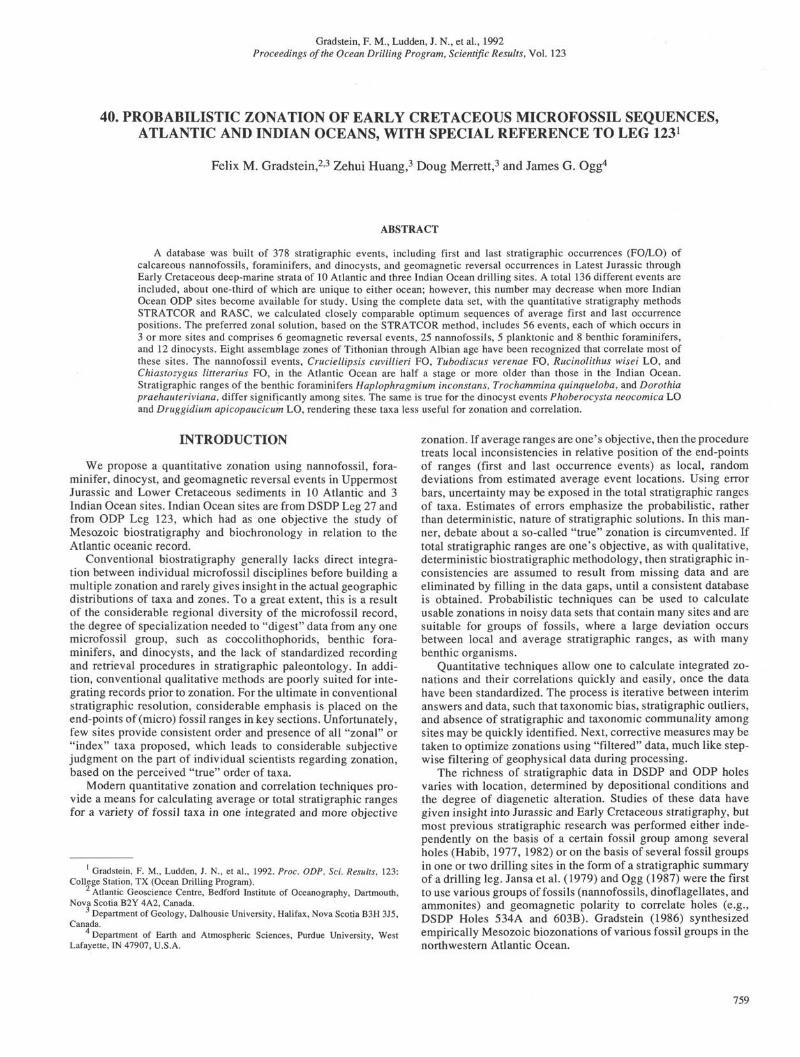
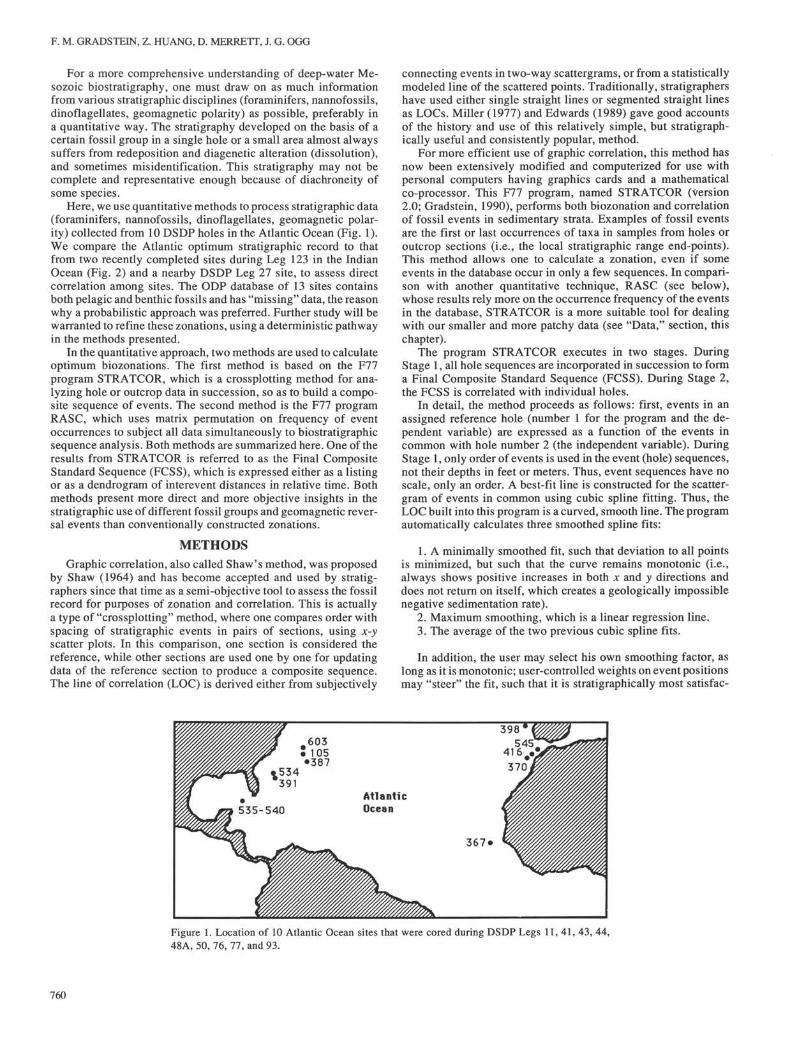
Here, we use quantitative methods to process stratigraphic data(foraminifers, nannofossils, dinoflagellates, geomagnetic polar-ity) collected from 10 DSDP holes in the Atlantic Ocean (Fig. 1).We compare the Atlantic optimum stratigraphic record to thatfrom two recently completed sites during Leg 123 in the IndianOcean (Fig. 2) and a nearby DSDP Leg 27 site, to assess directcorrelation among sites. The ODP database of 13 sites containsboth pelagic and benthic fossils and has "missing" data, the reasonwhy a probabilistic approach was preferred. Further study will bewarranted to refine these zonations, using a deterministic pathwayin the methods presented.
In the quantitative approach, two methods are used to calculateoptimum biozonations. The first method is based on the F77program STRATCOR, which is a crossplotting method for ana-lyzing hole or outcrop data in succession, so as to build a compo-site sequence of events. The second method is the F77 programRASC, which uses matrix permutation on frequency of eventoccurrences to subject all data simultaneously to biostratigraphicsequence analysis. Both methods are summarized here. One of theresults from STRATCOR is referred to as the Final CompositeStandard Sequence (FCSS), which is expressed either as a listingor as a dendrogram of interevent distances in relative time. Bothmethods present more direct and more objective insights in thestratigraphic use of different fossil groups and geomagnetic rever-sal events than conventionally constructed zonations.
METHODSGraphic correlation, also called Shaw's method, was proposed
by Shaw (1964) and has become accepted and used by stratig-raphers since that time as a semi-objective tool to assess the fossilrecord for purposes of zonation and correlation. This is actuallya type of "crossplotting" method, where one compares order withspacing of stratigraphic events in pairs of sections, using x-yscatter plots. In this comparison, one section is considered thereference, while other sections are used one by one for updatingdata of the reference section to produce a composite sequence.The line of correlation (LOC) is derived either from subjectively
connecting events in two-way scattergrams, or from a statisticallymodeled line of the scattered points. Traditionally, stratigraphershave used either single straight lines or segmented straight linesas LOCs. Miller (1977) and Edwards (1989) gave good accountsof the history and use of this relatively simple, but stratigraph-ically useful and consistently popular, method.
For more efficient use of graphic correlation, this method hasnow been extensively modified and computerized for use withpersonal computers having graphics cards and a mathematicalco-processor. This F77 program, named STRATCOR (version2.0; Gradstein, 1990), performs both biozonation and correlationof fossil events in sedimentary strata. Examples of fossil eventsare the first or last occurrences of taxa in samples from holes oroutcrop sections (i.e., the local stratigraphic range end-points).This method allows one to calculate a zonation, even if someevents in the database occur in only a few sequences. In compari-son with another quantitative technique, RASC (see below),whose results rely more on the occurrence frequency of the eventsin the database, STRATCOR is a more suitable tool for dealingwith our smaller and more patchy data (see "Data," section, thischapter).
The program STRATCOR executes in two stages. DuringStage 1, all hole sequences are incorporated in succession to forma Final Composite Standard Sequence (FCSS). During Stage 2,the FCSS is correlated with individual holes.
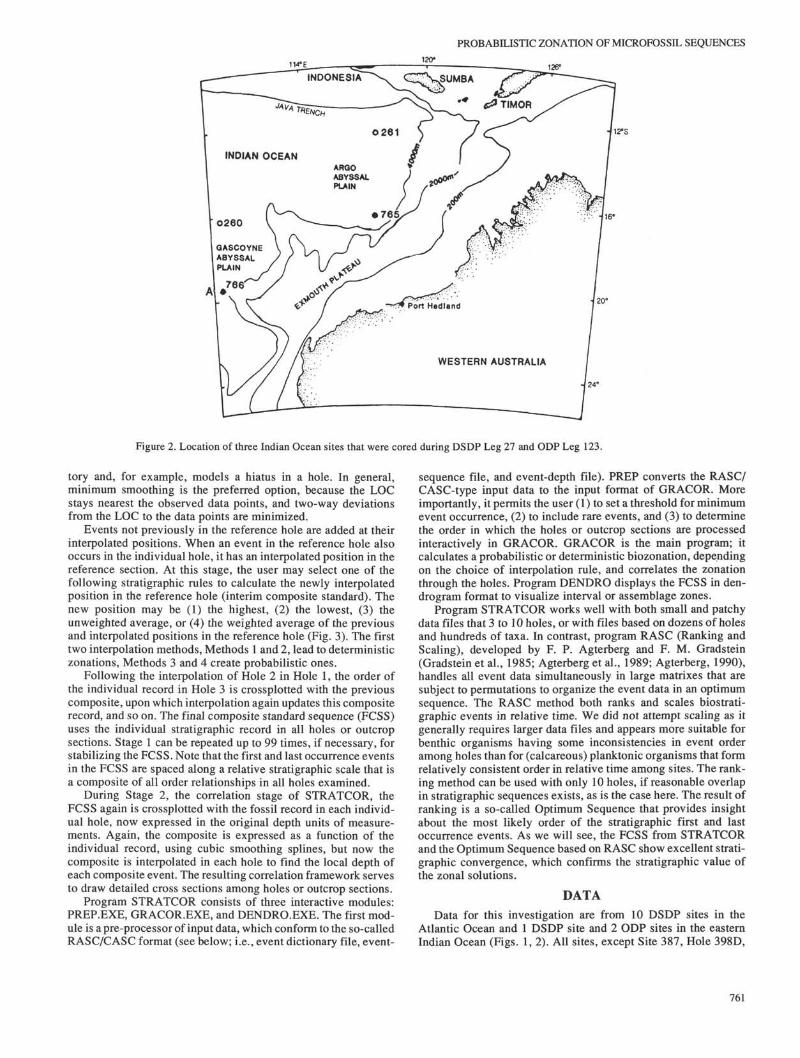
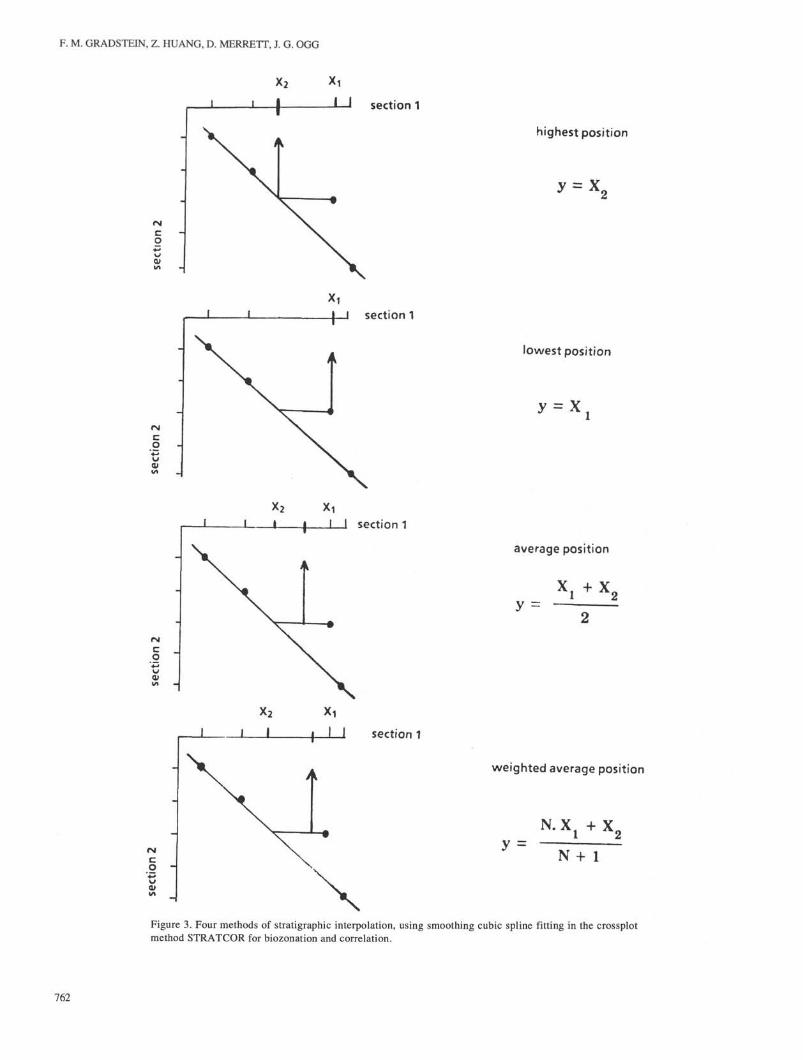
In detail, the method proceeds as follows: first, events in anassigned reference hole (number 1 for the program and the de-pendent variable) are expressed as a function of the events incommon with hole number 2 (the independent variable). DuringStage 1, only order of events is used in the event (hole) sequences,not their depths in feet or meters. Thus, event sequences have noscale, only an order. A best-fit line is constructed for the scatter-gram of events in common using cubic spline fitting. Thus, theLOC built into this program is a curved, smooth line. The programautomatically calculates three smoothed spline fits:
1. A minimally smoothed fit, such that deviation to all pointsis minimized, but such that the curve remains monotonic (i.e.,always shows positive increases in both x and y directions anddoes not return on itself, which creates a geologically impossiblenegative sedimentation rate).
2. Maximum smoothing, which is a linear regression line.3. The average of the two previous cubic spline fits.
In addition, the user may select his own smoothing factor, aslong as it is monotonic; user-controlled weights on event positionsmay "steer" the fit, such that it is stratigraphically most satisfac-
603I 105•387
AtlanticOcean
398*545
41 6
367'
Figure 1. Location of 10 Atlantic Ocean sites that were cored during DSDP Legs 11, 41, 43, 44,48A, 50, 76, 77, and 93.
760
PROBABILISTIC ZONATION OF MICROFOSSIL SEQUENCES
126°
16"
12 S
20°
24"
Figure 2. Location of three Indian Ocean sites that were cored during DSDP Leg 27 and ODP Leg 123.
tory and, for example, models a hiatus in a hole. In general,minimum smoothing is the preferred option, because the LOCstays nearest the observed data points, and two-way deviationsfrom the LOC to the data points are minimized.
Events not previously in the reference hole are added at theirinterpolated positions. When an event in the reference hole alsooccurs in the individual hole, it has an interpolated position in thereference section. At this stage, the user may select one of thefollowing stratigraphic rules to calculate the newly interpolatedposition in the reference hole (interim composite standard). Thenew position may be (1) the highest, (2) the lowest, (3) theunweighted average, or (4) the weighted average of the previousand interpolated positions in the reference hole (Fig. 3). The firsttwo interpolation methods, Methods 1 and 2, lead to deterministiczonations, Methods 3 and 4 create probabilistic ones.
Following the interpolation of Hole 2 in Hole 1, the order ofthe individual record in Hole 3 is crossplotted with the previouscomposite, upon which interpolation again updates this compositerecord, and so on. The final composite standard sequence (FCSS)uses the individual stratigraphic record in all holes or outcropsections. Stage 1 can be repeated up to 99 times, if necessary, forstabilizing the FCSS. Note that the first and last occurrence eventsin the FCSS are spaced along a relative stratigraphic scale that isa composite of all order relationships in all holes examined.
During Stage 2, the correlation stage of STRATCOR, theFCSS again is crossplotted with the fossil record in each individ-ual hole, now expressed in the original depth units of measure-ments. Again, the composite is expressed as a function of theindividual record, using cubic smoothing splines, but now thecomposite is interpolated in each hole to find the local depth ofeach composite event. The resulting correlation framework servesto draw detailed cross sections among holes or outcrop sections.
Program STRATCOR consists of three interactive modules:PREP.EXE, GRACOR.EXE, and DENDRO.EXE. The first mod-ule is a pre-processor of input data, which conform to the so-calledRASC/CASC format (see below; i.e., event dictionary file, event-
sequence file, and event-depth file). PREP converts the RASC/CASC-type input data to the input format of GRACOR. Moreimportantly, it permits the user (1) to set a threshold for minimumevent occurrence, (2) to include rare events, and (3) to determinethe order in which the holes or outcrop sections are processedinteractively in GRACOR. GRACOR is the main program; itcalculates a probabilistic or deterministic biozonation, dependingon the choice of interpolation rule, and correlates the zonationthrough the holes. Program DENDRO displays the FCSS in den-drogram format to visualize interval or assemblage zones.
Program STRATCOR works well with both small and patchydata files that 3 to 10 holes, or with files based on dozens of holesand hundreds of taxa. In contrast, program RASC (Ranking andScaling), developed by F. P. Agterberg and F. M. Gradstein(Gradstein et al., 1985; Agterberg et al., 1989; Agterberg, 1990),handles all event data simultaneously in large matrixes that aresubject to permutations to organize the event data in an optimumsequence. The RASC method both ranks and scales biostrati-graphic events in relative time. We did not attempt scaling as itgenerally requires larger data files and appears more suitable forbenthic organisms having some inconsistencies in event orderamong holes than for (calcareous) planktonic organisms that formrelatively consistent order in relative time among sites. The rank-ing method can be used with only 10 holes, if reasonable overlapin stratigraphic sequences exists, as is the case here. The result ofranking is a so-called Optimum Sequence that provides insightabout the most likely order of the stratigraphic first and lastoccurrence events. As we will see, the FCSS from STRATCORand the Optimum Sequence based on RASC show excellent strati-graphic convergence, which confirms the stratigraphic value ofthe zonal solutions.
DATA
Data for this investigation are from 10 DSDP sites in theAtlantic Ocean and 1 DSDP site and 2 ODP sites in the easternIndian Ocean (Figs. 1, 2). All sites, except Site 387, Hole 398D,
761
F. M. GRADSTEIN, Z. HUANG, D. MERRETT, J. G. OGG
X2
I I I | I I section 1
highest position
lowest position
y x .
average position
y —x , + x 2
weighted average position
y =N + 1
Figure 3. Four methods of stratigraphic interpolation, using smoothing cubic spline fitting in the crossplotmethod STRATCOR for biozonation and correlation.
762
PROBABILISTIC ZONATION OF MICROFOSSIL SEQUENCES
and Site 766, bottomed in Jurassic oceanic basement and werealready below a water depth of 4 km during the Early Cretaceous.Site 387 and Hole 398D originated in Earliest Cretaceous timeand were in a paleowater depth of between 2.7 and 4 km (Jansa etal., 1979). Site 766, located on volcanic sills of Chron Mi l ageat the northwestern Australian ocean/continent boundary, wasless than 1500 m deep during Early Cretaceous time (Ludden,Gradstein, et al., 1990).
The stratigraphic events included in this study are the firstoccurrence (FO) and/or last occurrence (LO) of important plank-tonic (PF) and benthic (BF) foraminifers, nannofossils (N) anddinoflagellates (P), which are often observed and commonly con-sidered for stratigraphy of individual holes, and geomagneticreversal events (M). We did not include rare fossil groups, suchas ammonites and ostracods, and also excluded radiolarians andcalpionellids because of an absence of systematic data among allsites examined. Once such data are available, it should be an easymatter to add and recalculate the zonations and correlations.
The data were collected mainly from research papers in rele-vant DSDP and ODP Initial Reports volumes and in other publi-cations. The quantity and quality of stratigraphic data vary fromhole to hole for various reasons. Apart from geological factors,such as depositional conditions and diagenetic process, coringinterval, core recovery, and sampling density are the major factorsdetermining the quantity and quality of the data from these holes.Detailed geomagnetic polarity study is limited to DSDP Holes534A and 603B (Ogg, 1983, 1987). Important foraminifers
(planktonic and benthic) are sparse in most of these holes, mainlybecause of dissolution and difficulties when separating the fossilsfrom the calcareous host rock. Calcareous nannofossil data aremore abundant and dominate our database. Systematic studiesabout dinoflagellates were conducted for DSDP Holes 105, 387,391,534A and 603B (Habib, 1972, 1978,1979; Habib and Drugg,1983, 1987). More stratigraphically useful data can be found inthe western Atlantic Ocean than in the eastern Atlantic or Indianoceans.
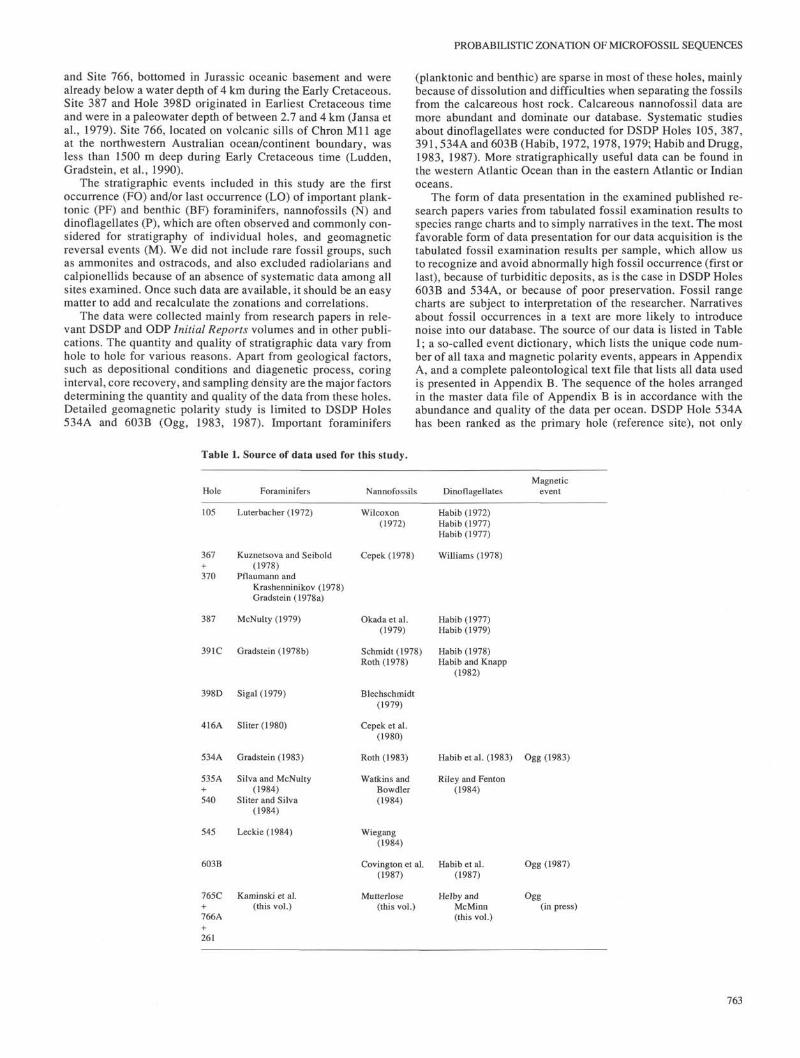
The form of data presentation in the examined published re-search papers varies from tabulated fossil examination results tospecies range charts and to simply narratives in the text. The mostfavorable form of data presentation for our data acquisition is thetabulated fossil examination results per sample, which allow usto recognize and avoid abnormally high fossil occurrence (first orlast), because of turbiditic deposits, as is the case in DSDP Holes603B and 534A, or because of poor preservation. Fossil rangecharts are subject to interpretation of the researcher. Narrativesabout fossil occurrences in a text are more likely to introducenoise into our database. The source of our data is listed in Table1; a so-called event dictionary, which lists the unique code num-ber of all taxa and magnetic polarity events, appears in AppendixA, and a complete paleontological text file that lists all data usedis presented in Appendix B. The sequence of the holes arrangedin the master data file of Appendix B is in accordance with theabundance and quality of the data per ocean. DSDP Hole 534Ahas been ranked as the primary hole (reference site), not only
Table 1. Source of data used for this study.
Hole
105
367+370
387
391C
398D
416A
534A
535A+540
545
603B
765C+766A
+261
Foraminifers
Luterbacher (1972)
Kuznetsova and Seibold(1978)
Pflaumann andKrashenninikov (1978)Gradstein (1978 a)
McNulty (1979)
Gradstein (1978b)
Sigal(1979)
Sliter(1980)
Gradstein (1983)
Silva and McNulty(1984)
Sliter and Silva(1984)
Leckie(1984)
Kaminski et al.(this vol.)
Nannofossils
Wilcoxon(1972)
Cepek(1978)
Okada et al.(1979)
Schmidt (1978)Roth (1978)
Blechschmidt(1979)
Cepek et al.(1980)
Roth (1983)
Watkins andBowdler(1984)
Wiegang(1984)
Covington et al.(1987)
Mutterlose(this vol.)
Dinoflagellates
Habib (1972)Habib (1977)Habib (1977)
Williams (1978)
Habib (1977)Habib (1979)
Habib (1978)Habib and Knapp
(1982)
Habib etal. (1983)
Riley and Fenton(1984)
Habib et al.(1987)
Helby andMcMinn(this vol.)
Magneticevent
Ogg (1983)
Ogg (1987)
Ogg(in press)
763
F. M. GRADSTEIN, Z. HUANG, D. MERRETT, J. G. OGG
because it had more events, but also because it covered a longergeological time period.
A special problem was created when in several sites first andlast occurrences of four taxa were anomalously close together. InSite 534, this involved Dorothia praehauteriviana FO and LO(BF) at 1167 and 1149 mbsf, respectively, and Lenticulina nodosaFO and LO (BF) at 1167 and 1149 mbsf, respectively. In Site 370,L. nodosa LO (BF) was recorded only one sample above L. nodosaFO, and the same was true for L. barremiana FO and LO (BF) inSite 766, and for Tubodiscus verenae FO and LO (N) in Site 261.Because this involved mostly benthic foraminifers suggests either(1) that the environment was favorable for their local existencefor a short time only or (2) that dissolution was important part ofdestroying the stratigraphic range. During trial runs to calculateand compare both STRATCOR FCSS and RASC Optimum Se-quence with and without this record, solutions converged mostwith the record of L. nodosa LO and D. praehauteriviana LOdeleted altogether, and this practice was adopted. In addition,crossplots with the FCSS showed that L. barremiana LO in Site766 at 275 mbsf, and T. verenae LO in Site 261 at 449 mbsf wereoutliers. Hence, this relatively unimportant information also wasomitted. Should further studies indicate that such outliers areindicative of diachroneity, their use may be reinstated.
ZONAL COMPUTATIONZonal computations proceeded in three steps. First, we calcu-
lated an FCSS, using the data of all 13 holes. Next, we comparedthe FCSS with the Optimum Sequence using RASC to assessmethod-dependent trends. Third, we compared the FCSS in 10Atlantic holes with that in 3 Indian Ocean sites to emphasizeinteroceanic differences in zonation. Finally, we propose a "uni-versal" zonation, which may be used easily for geological corre-lation.
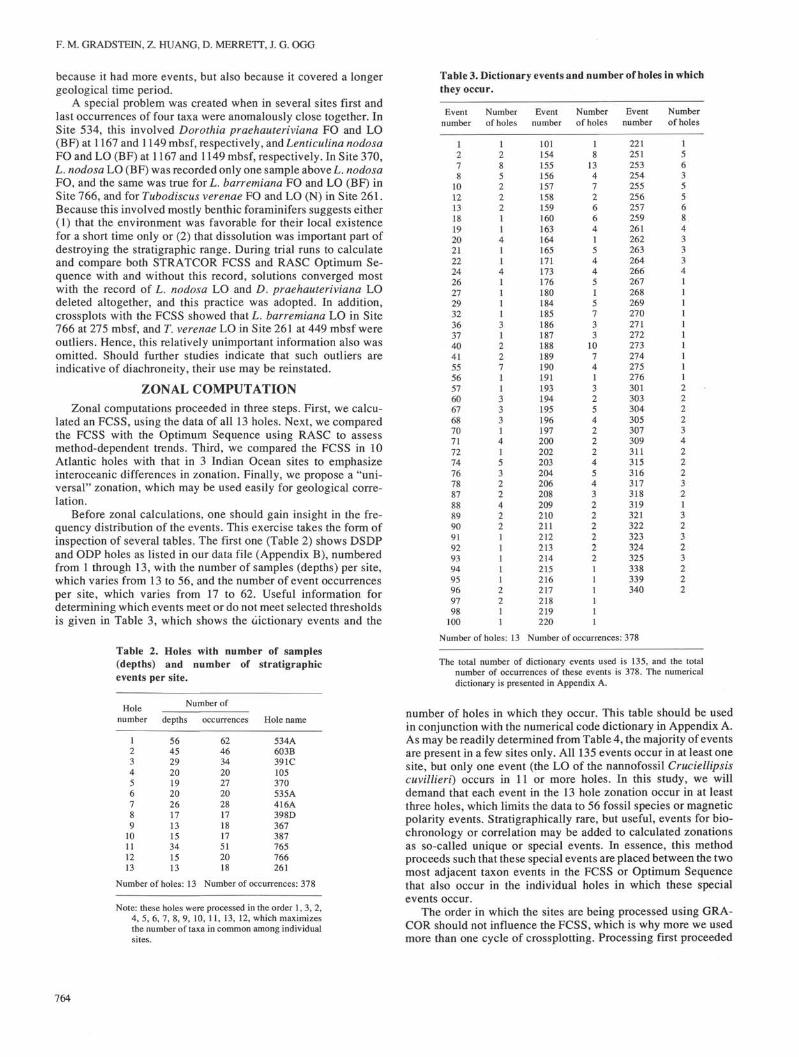
Before zonal calculations, one should gain insight in the fre-quency distribution of the events. This exercise takes the form ofinspection of several tables. The first one (Table 2) shows DSDPand ODP holes as listed in our data file (Appendix B), numberedfrom 1 through 13, with the number of samples (depths) per site,which varies from 13 to 56, and the number of event occurrencesper site, which varies from 17 to 62. Useful information fordetermining which events meet or do not meet selected thresholdsis given in Table 3, which shows the dictionary events and the
Table 2. Holes with number of samples(depths) and number of stratigraphicevents per site.
Table 3. Dictionary events and number of holes in whichthey occur.
Holenumber
123456789
10111213
Number of
depths
56452920192026171315341513
occurrences
62463420272028171817512018
Hole name
534A603B391C105370535A416A398D367387765766261
Number of holes: 13 Number of occurrences: 378
Note: these holes were processed in the order 1,3,2,4, 5, <S 7 8 9, 10, 11, 13, 12, which maximizes
Eventnumber
1278
10121318192021222426272M
3236374041555657606768707172747678878889909192939495969798
100
Numberof holes
1285222114114111131227113331415322422111112211
Number of holes: 13
Eventnumber
101154155156157158159160163164165171173176180184185186187188189190191193194195196197200202203204206208209210211212213214215216217218219220
Numberof holes
18
134726641544515733
1074132542224543222222111111
Number of occurrences
Eventnumber
221251253254255256257259261262263264266267268269270271272273274275276301303304305307309311315316317318319321322323324325338339340
:378
Numberof holes
1563556843334111111111122223422232132323222
the number of taxa in common among individualsites.
The total number of dictionary events used is 135, and the totalnumber of occurrences of these events is 378. The numericaldictionary is presented in Appendix A.
number of holes in which they occur. This table should be usedin conjunction with the numerical code dictionary in Appendix A.As may be readily determined from Table 4, the majority of eventsare present in a few sites only. All 135 events occur in at least onesite, but only one event (the LO of the nannofossil Cruciellipsiscuvillieri) occurs in 11 or more holes. In this study, we willdemand that each event in the 13 hole zonation occur in at leastthree holes, which limits the data to 56 fossil species or magneticpolarity events. Stratigraphically rare, but useful, events for bio-chronology or correlation may be added to calculated zonationsas so-called unique or special events. In essence, this methodproceeds such that these special events are placed between the twomost adjacent taxon events in the FCSS or Optimum Sequencethat also occur in the individual holes in which these specialevents occur.
The order in which the sites are being processed using GRA-COR should not influence the FCSS, which is why more we usedmore than one cycle of crossplotting. Processing first proceeded
764
PROBABILISTIC ZONATION OF MICROFOSSIL SEQUENCES
Table 4. Distribution of dic-tionary events by the numberof holes in which they occur.
Numberof holes
131087654321
Frequencyof events
11344
1015183643
Cumulativfrequency
1259
1323385692
135
All 135 events occur in at leastone hole, 56 in at least threeholes, and so forth; Only oneevent occurs in at least 11or more sites ("Cumulative Fre-quency" column). The "Frequen-cy of Events" column indicateshow many taxa occur in 1, 2, 3,and so forth, holes.
with all Atlantic sites such that the number of events in commonper crossplot was maximized, and then Indian Ocean sites wereprocessed. For each cycle, this order was Sites 534, 391,603, 105,370, 535, 416, 367, 387, 398, 765, 261, and 766.
Because the event-sequence file includes both first and lastoccurrences of fossils, the weighted average position (Fig. 3D)was chosen for stratigraphic interpolation using GRACOR. Forthis reason, the final result of our successive crossplots is aprobabilistic zonation that depicts average (first or last occur-rence) event positions. When interpolating the designated compo-site standard sequence with events in the individual hole, eventpositions in the reference sequence are always based on theweighted average of the old and newly interpolated positions, andthe minimum smoothing factor is always used. The spline fit witha minimum smoothing factor minimizes the deviations to allpoints and maximizes stratigraphic "truthfulness," which is whywe prefer it for interpolation. Only in Site 367 did the minimumsmoothing factor fail to calculate a best fit, possibly because ofviolation of monotony during inverse interpolation in the middlepart of the section near 940 m, where a condensed sequenceappears to exist between Chrons M10 and M i l . The averagesmoothing factor, between the minimum and the maximum (linearbest fit) worked fine for Site 367.
As mentioned, the weight of every event appearing in thecrossplot can be varied from -1 (for ignoring it) to +1 (for steeringthe spline through it) to obtain a satisfactory LOC. In Site 370,Hedbergella delrioensis FO (P) is far too low stratigraphically andreceived a weight of - 1 . No other event in any other hole wasweighted, because the crossplots did not reveal more obviousoutliers as a result of random factors.
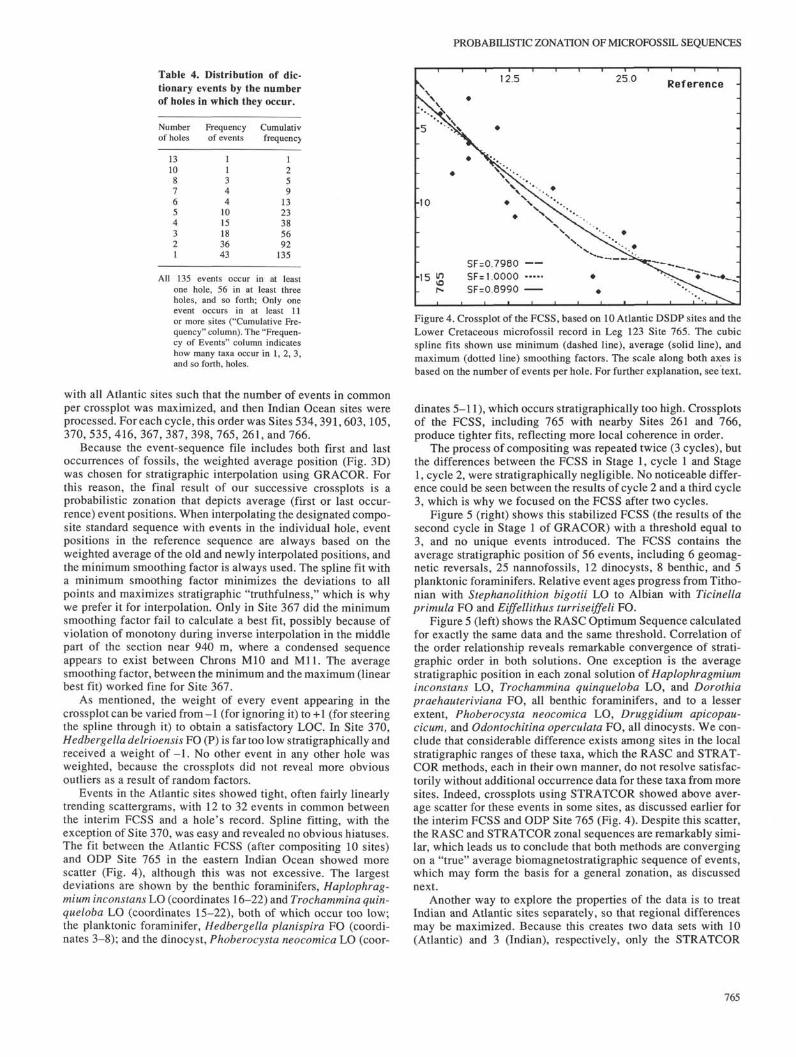
Events in the Atlantic sites showed tight, often fairly linearlytrending scattergrams, with 12 to 32 events in common betweenthe interim FCSS and a hole's record. Spline fitting, with theexception of Site 370, was easy and revealed no obvious hiatuses.The fit between the Atlantic FCSS (after compositing 10 sites)and ODP Site 765 in the eastern Indian Ocean showed morescatter (Fig. 4), although this was not excessive. The largestdeviations are shown by the benthic foraminifers, Haplophrag-mium inconstans LO (coordinates 16-22) and Trochammina quin-queloba LO (coordinates 15-22), both of which occur too low;the planktonic foraminifer, Hedbergella planispira FO (coordi-nates 3-8); and the dinocyst, Phoberocysta neocomica LO (coor-
12.5 25.0 Reference
-10
• ' 5 gSF=O.7980SF= 1.0000SF=O.8990
Figure 4. Crossplot of the FCSS, based on 10 Atlantic DSDP sites and theLower Cretaceous microfossil record in Leg 123 Site 765. The cubicspline fits shown use minimum (dashed line), average (solid line), andmaximum (dotted line) smoothing factors. The scale along both axes isbased on the number of events per hole. For further explanation, see text.
dinates 5-11), which occurs stratigraphically too high. Crossplotsof the FCSS, including 765 with nearby Sites 261 and 766,produce tighter fits, reflecting more local coherence in order.
The process of compositing was repeated twice (3 cycles), butthe differences between the FCSS in Stage 1, cycle 1 and Stage1, cycle 2, were stratigraphically negligible. No noticeable differ-ence could be seen between the results of cycle 2 and a third cycle3, which is why we focused on the FCSS after two cycles.
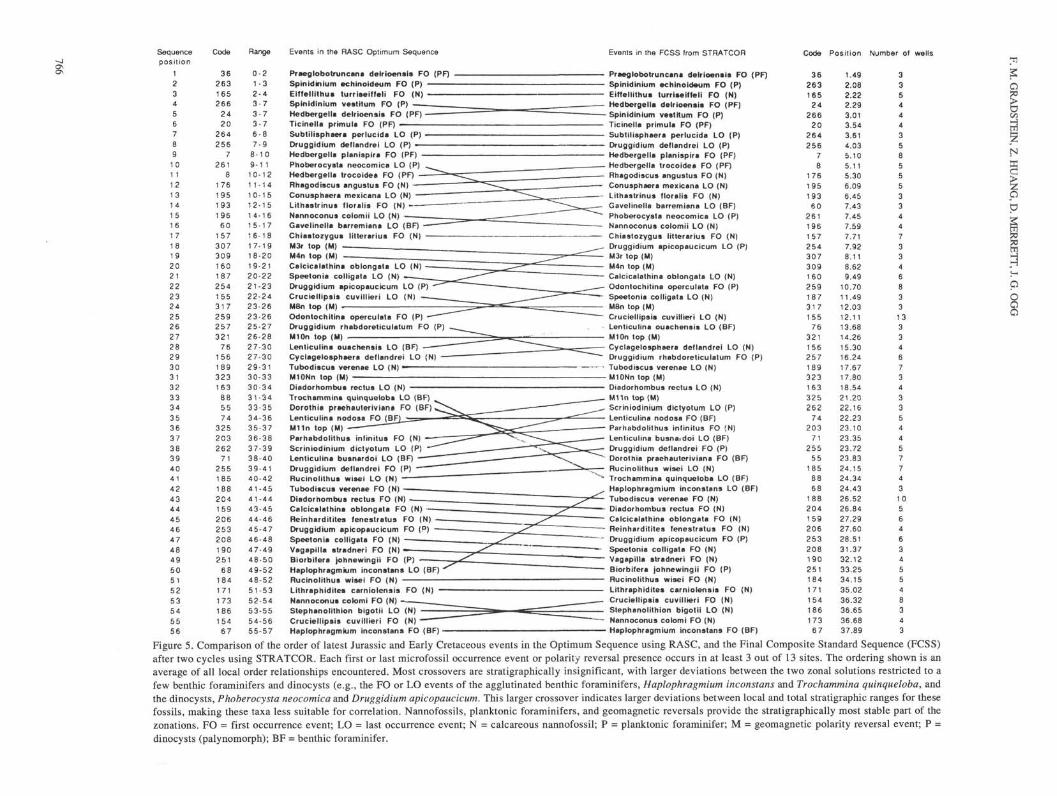
Figure 5 (right) shows this stabilized FCSS (the results of thesecond cycle in Stage 1 of GRACOR) with a threshold equal to3, and no unique events introduced. The FCSS contains theaverage stratigraphic position of 56 events, including 6 geomag-netic reversals, 25 nannofossils, 12 dinocysts, 8 benthic, and 5planktonic foraminifers. Relative event ages progress from Titho-nian with Stephanolithion bigotii LO to Albian with Ticinellaprimula FO and Eiffellithus turriseiffeli FO.
Figure 5 (left) shows the RASC Optimum Sequence calculatedfor exactly the same data and the same threshold. Correlation ofthe order relationship reveals remarkable convergence of strati-graphic order in both solutions. One exception is the averagestratigraphic position in each zonal solution of Haplophragmiuminconstans LO, Trochammina quinqueloba LO, and Dorothiapraehauteriviana FO, all benthic foraminifers, and to a lesserextent, Phoberocysta neocomica LO, Druggidium apicopau-cicum, and Odontochitina operculata FO, all dinocysts. We con-clude that considerable difference exists among sites in the localstratigraphic ranges of these taxa, which the RASC and STRAT-COR methods, each in their own manner, do not resolve satisfac-torily without additional occurrence data for these taxa from moresites. Indeed, crossplots using STRATCOR showed above aver-age scatter for these events in some sites, as discussed earlier forthe interim FCSS and ODP Site 765 (Fig. 4). Despite this scatter,the RASC and STRATCOR zonal sequences are remarkably simi-lar, which leads us to conclude that both methods are convergingon a "true" average biomagnetostratigraphic sequence of events,which may form the basis for a general zonation, as discussednext.
Another way to explore the properties of the data is to treatIndian and Atlantic sites separately, so that regional differencesmay be maximized. Because this creates two data sets with 10(Atlantic) and 3 (Indian), respectively, only the STRATCOR
765
Sequenceposition
1
234
5
6
7
8
9
1 01 112
1 31 41 51 61 71 81 92 0
2 1
2 2
2 3
2 4
2 5
2 6
2 7
2 8
293 0
31
3 2
3 3
3 4
3 5
3 6
3 7
3 8
3 9
4 0
4 14 2
4 3
4 4
4 5
4 6
4 7
4 8
4 9
5 0
5 1
5 2
5 3
5 4
5 5
5 6
Code
3 6
2 6 3
1 6 5
2 6 6
2 4
2 0
2 6 4
2 5 6
7
2 6 1
8
1 761 951 931 9 6
6 0
1 573 0 7
3 0 9
1 6 0
1 8 7
2 5 4
1 553 1 7
2 5 9
2 5 7
3 2 1
7 6
1 561 8 9
3 2 3
1 638 8
5 5
7 4
3 2 5
2 0 3
2 6 2
7 1
2 5 5
1 8 5
1 8 8
2 0 4
1 5 9
2 0 6
2 5 3
2 0 8
1 9 0
2 5 1
6 8
1 841 711 731 8 6
1 5 4
6 7
Range
0 - 2
1-3
2 - 4
3 - 7
3 - 7
3 - 7
6 - 8
7 - 9
8-1 09-1 1
10-1211-1410-1512-1514-1615-17
16-1817-1918-2019-2120-2221-2322-2423-2623-2625-2726-2827-3027-3029-3130-3330-3431-3433-3534-3635-3736-3837-3938-4039-4140-4241-4541-4443-4544-4645-4746-4847-4948-5049-5248-5251-5352-5453-5554-5655-57
Events in the RASC Optimum Sequence
Praeglobotruncana delrioensis FO (PF)Spinidinium echinoideum FO (P)Eiffellithus turriseiffeli FO (N)Spinidinium vestitum FO (P)Hedbergella delrioensis FO (PF)Ticinella primula FO (PF) ^ —Subtilisphaera perlucida LO (P)Druggidium deflandrei LO (P) —Hedbergella planispira FO (PF) -Phoberocysta neocomica LO (P)Hedbergella trocoidea FO (PF)Rhagodiscus angustus FO (N)Conusphaera mexicana LO (N)Lithastrinus floralis FO (N) -Nannoconus colomii LO (N)Gavelinella barremiana LO (BF)Chiaatozygus litterarius FO (N)M3r top (M)M4n top (M)CalcicalathimSpeetonia coDruggidium aCruciellipsisMβn top (M) —
Odontochitina operculata FO (P)Druggidium rhabdoreticulatum FO (P)MIOn top (M)Lenticulina ouachensis LO (BF)Cyclagelosphaera deflandrei LO (N)Tubodiscus verenae LO (N) -M10Nn top (M)
Diadorhombus rectus LO (N)Trochammina quinqueloba LO (BF)Dorothia praehauteriviana FO (BF)Lenticulina nodosa FO (BFM11n top (M)Parhabdolithus infinitus FO (N)Scriniodinium dictyotum LO (P)Lenticulina busnardoi LO (BF)Druggidium deflandrei FO (P)Rucinolithus wisei LO (N)Tubodiscus verenae FO (N)Diadorhombus rectus FO (N)Calcicalathina oblongata FO (N)Reinharditites fenestratus FO (N) -Druggidium apicopaucicum FO (P)Speetonia colligate FO (N)Vagapilla stradneri FO (N)Biorbifera johnewingii FO (P)Haplophragmium inconstans LO (BF)Rucinolithus wisei FO (N)
Lithraphidites carniolensis FO (N)Nannoconus cok>mi FO (N)Stephanolithion bigotii LO (N)Cruciellipsis cuvillieri FO (N)Haplophragmium inconstans FO (BF)
Events in the FCSS from STRATCOR
Praeglobotruncana delrioensis FO (PF)Spinidinium echinoideum FO (P)Eiffehithus turri eiffeli FO (N)Hedbergella delrioensis FO (PF)Spinidinium vestitum FO (P)Ticinella primula FO (PF)Subtilisphaera perlucida LO (P)Druggidium deflandrei LO (P)Hedbergella planispira FO (PF)Hedbergella trocoidea FO (PF)Rhagodiscus angustus FO (N)Conusphaera mexicana LO (N)Lithastrinus floralis FO (N)Gavelinella barremiana LO (BF)Phoberocysta neocomica LO (P)Nannoconus colomii LO (N)Chiastozygus litterarius FO (N)Druggidium apicopaucicum LO (P)M3r top (M)M4n top (M)
Calcicalathina obiongata LO (N)Odontochitina operculata FO (P)Speetonia colligate LO (N)Mθn top (M)Cruciellipsis cuvillieri LO (N)Lenticulina ouachensis LO (BF)M10n top (M)Cyclagelosphaera deflandrei LO (N)Druggidium rhabdoreticulatum FO (P)Tubodiscus verenae LO (N)M10Nn top (M)Diadorhombus rectus LO (N)M11n top (M)Scriniodinium dictyotum LO (P)Lenticulina nodosa FO (BF)Parhabdolithus infinitus FO (N)Lenticulina busna.doi LO (BF)Druggidium deflandrei FO (P)Dorothia praehauteriviana FO (BF)Rucinolithus wisei LO (N)Trochammina quinqueloba LO (BF)Haplophragmium inconstans LO (BF)Tubodiscus verenae FO (N)Diadorhombus rectus FO (N)Calcicalathina oblongata FO (N)Reinharditites fenestratus FO (N)
" Druggidium apicopaucicum FO (P)Speetonia colligate FO (N)Vagapilla stradneri FO (N)Biorbifera johnewingii FO (P)Rucinolithus wisei FO (N)Lithraphidites carniolensis FO (N)Cruciellipsis cuvill ieri FO (N)Stephanolithion bigotii LO (N)Nannoconus cok>mi FO (N)Haplophragmium inconstans FO (BF)
;octe
3 6
2 6 3
1 6 5
2 4
2 6 6
2 0
2 6 4
2 5 6
7
8
1 7 6
1 9 5
1 9 3
6 0
2 6 1
1 9 6
1 5 7
2 5 4
3 0 7
3 0 9
1 602 5 9
1 8 7
3 1 7
1 5 5
7 6
3 2 1
1 5 6
2 5 7
1 893 2 3
1 6 3
3252 6 2
7 4
2 0 3
7 1
2 5 5
5 5
1 8 5
8 8
6 8
1 8 8
2 0 4
1 5 9
2 0 6
2 5 3
2 0 8
1 9 0
2 5 1
1 8 4
1 7 1
1 5 4
1 861 7 3
6 7
Position
1.492.082.222.293.013.543.614.035.105.115.306.096.457.437.457.597.717.928.118.629.49
10.701 1.4912.0312.1113.6814.2615.3016.2417.6717.8018.5421.2022.1622.2323.1023.3523.7223.8324.1524.3424.4326.5226.8427.2927.6028.5131.3732.1233.2534.1535.0236.3236.6536.6837.89
Number of wells
3
3
5
4
4
4
3
5
8
5
5
5
3
3
4
4
7
3
3
4
6
8
3
3
1 33
3
4
6
7
3
4
3
3
5
4
4
5
7
7
4
3
1 05
6
4
6
34
5
5
4
834
3
O
Figure 5. Comparison of the order of latest Jurassic and Early Cretaceous events in the Optimum Sequence using RASC, and the Final Composite Standard Sequence (FCSS)after two cycles using STRATCOR. Each first or last microfossil occurrence event or polarity reversal presence occurs in at least 3 out of 13 sites. The ordering shown is anaverage of all local order relationships encountered. Most crossovers are stratigraphically insignificant, with larger deviations between the two zonal solutions restricted to afew benthic foraminifers and dinocysts (e.g., the FO or LO events of the agglutinated benthic foraminifers, Haplophragmium inconstans and Trochammina quinqueloba, andthe dinocysts, Phoberocysta neocomica and Druggidium apicopaucicum. This larger crossover indicates larger deviations between local and total stratigraphic ranges for thesefossils, making these taxa less suitable for correlation. Nannofossils, planktonic foraminifers, and geomagnetic reversals provide the stratigraphically most stable part of thezonations. FO = first occurrence event; LO = last occurrence event; N = calcareous nannofossil; P = planktonic foraminifer; M = geomagnetic polarity reversal event; P =dinocysts (palynomorph); BF = benthic foraminifer.
PROBABILISTIC ZONATION OF MICROFOSSIL SEQUENCES
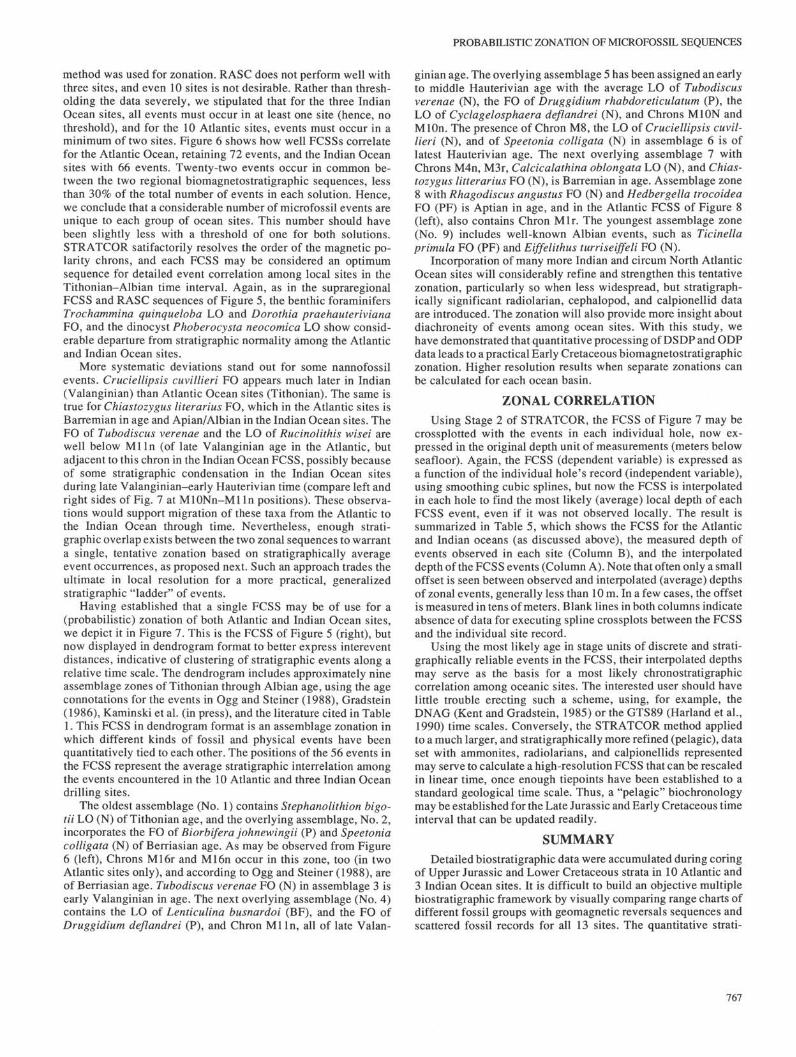
method was used for zonation. RASC does not perform well withthree sites, and even 10 sites is not desirable. Rather than thresh-olding the data severely, we stipulated that for the three IndianOcean sites, all events must occur in at least one site (hence, nothreshold), and for the 10 Atlantic sites, events must occur in aminimum of two sites. Figure 6 shows how well FCSSs correlatefor the Atlantic Ocean, retaining 72 events, and the Indian Oceansites with 66 events. Twenty-two events occur in common be-tween the two regional biomagnetostratigraphic sequences, lessthan 30% of the total number of events in each solution. Hence,we conclude that a considerable number of microfossil events areunique to each group of ocean sites. This number should havebeen slightly less with a threshold of one for both solutions.STRATCOR satifactorily resolves the order of the magnetic po-larity chrons, and each FCSS may be considered an optimumsequence for detailed event correlation among local sites in theTithonian-Albian time interval. Again, as in the supraregionalFCSS and RASC sequences of Figure 5, the benthic foraminifersTrochammina quinqueloba LO and Dorothia praehauterivianaFO, and the dinocyst Phoberocysta neocomica LO show consid-erable departure from stratigraphic normality among the Atlanticand Indian Ocean sites.
More systematic deviations stand out for some nannofossilevents. Cruciellipsis cuvillieri FO appears much later in Indian(Valanginian) than Atlantic Ocean sites (Tithonian). The same istrue for Chiastozygus literarius FO, which in the Atlantic sites isBarremian in age and Apian/Albian in the Indian Ocean sites. TheFO of Tubodiscus verenae and the LO of Rucinolithis wisei arewell below Ml In (of late Valanginian age in the Atlantic, butadjacent to this chron in the Indian Ocean FCSS, possibly becauseof some stratigraphic condensation in the Indian Ocean sitesduring late Valanginian-early Hauterivian time (compare left andright sides of Fig. 7 at MIONn-Mlln positions). These observa-tions would support migration of these taxa from the Atlantic tothe Indian Ocean through time. Nevertheless, enough strati-graphic overlap exists between the two zonal sequences to warranta single, tentative zonation based on stratigraphically averageevent occurrences, as proposed next. Such an approach trades theultimate in local resolution for a more practical, generalizedstratigraphic "ladder" of events.
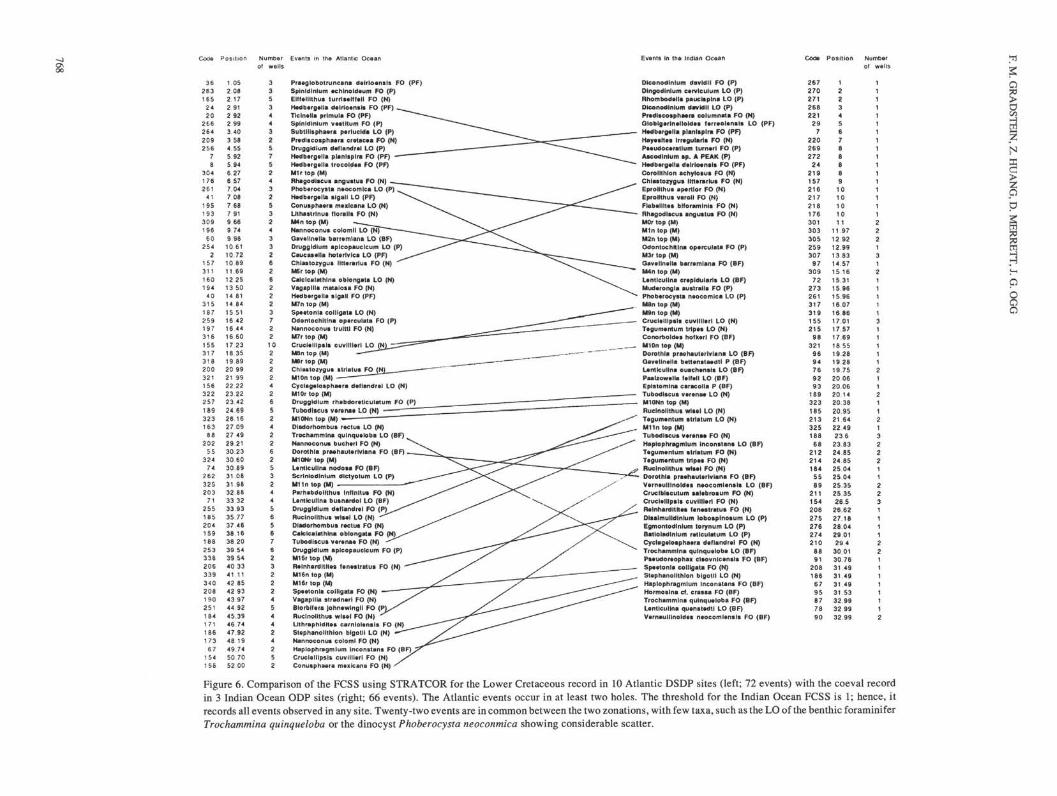
Having established that a single FCSS may be of use for a(probabilistic) zonation of both Atlantic and Indian Ocean sites,we depict it in Figure 7. This is the FCSS of Figure 5 (right), butnow displayed in dendrogram format to better express intereventdistances, indicative of clustering of stratigraphic events along arelative time scale. The dendrogram includes approximately nineassemblage zones of Tithonian through Albian age, using the ageconnotations for the events in Ogg and Steiner (1988), Gradstein(1986), Kaminski et al. (in press), and the literature cited in Table1. This FCSS in dendrogram format is an assemblage zonation inwhich different kinds of fossil and physical events have beenquantitatively tied to each other. The positions of the 56 events inthe FCSS represent the average stratigraphic interrelation amongthe events encountered in the 10 Atlantic and three Indian Oceandrilling sites.
The oldest assemblage (No. 1) contains Stephanolithion bigo-tii LO (N) of Tithonian age, and the overlying assemblage, No. 2,incorporates the FO of Biorbifera johnewingii (P) and Speetoniacolligata (N) of Berriasian age. As may be observed from Figure6 (left), Chrons M16r and M16n occur in this zone, too (in twoAtlantic sites only), and according to Ogg and Steiner (1988), areof Berriasian age. Tubodiscus verenae FO (N) in assemblage 3 isearly Valanginian in age. The next overlying assemblage (No. 4)contains the LO of Lenticulina busnardoi (BF), and the FO ofDruggidium deflandrei (P), and Chron Ml In, all of late Valan-
ginian age. The overlying assemblage 5 has been assigned an earlyto middle Hauterivian age with the average LO of Tubodiscusverenae (N), the FO of Druggidium rhabdoreticulatum (P), theLO of Cyclagelosphaera deflandrei (N), and Chrons Ml ON andMIOn. The presence of Chron M8, the LO of Cruciellipsis cuvil-lieri (N), and of Speetonia colligata (N) in assemblage 6 is oflatest Hauterivian age. The next overlying assemblage 7 withChrons M4n, M3r, Calcicalathina oblongata LO (N), and Chias-tozygus litterarius FO (N), is Barremian in age. Assemblage zone8 with Rhagodiscus angustus FO (N) and Hedbergella trocoideaFO (PF) is Aptian in age, and in the Atlantic FCSS of Figure 8(left), also contains Chron Mir. The youngest assemblage zone(No. 9) includes well-known Albian events, such as Ticinellaprimula FO (PF) and Eiffelithus turriseiffeli FO (N).
Incorporation of many more Indian and circum North AtlanticOcean sites will considerably refine and strengthen this tentativezonation, particularly so when less widespread, but stratigraph-ically significant radiolarian, cephalopod, and calpionellid dataare introduced. The zonation will also provide more insight aboutdiachroneity of events among ocean sites. With this study, wehave demonstrated that quantitative processing of DSDP and ODPdata leads to a practical Early Cretaceous biomagnetostratigraphiczonation. Higher resolution results when separate zonations canbe calculated for each ocean basin.
ZONAL CORRELATIONUsing Stage 2 of STRATCOR, the FCSS of Figure 7 may be
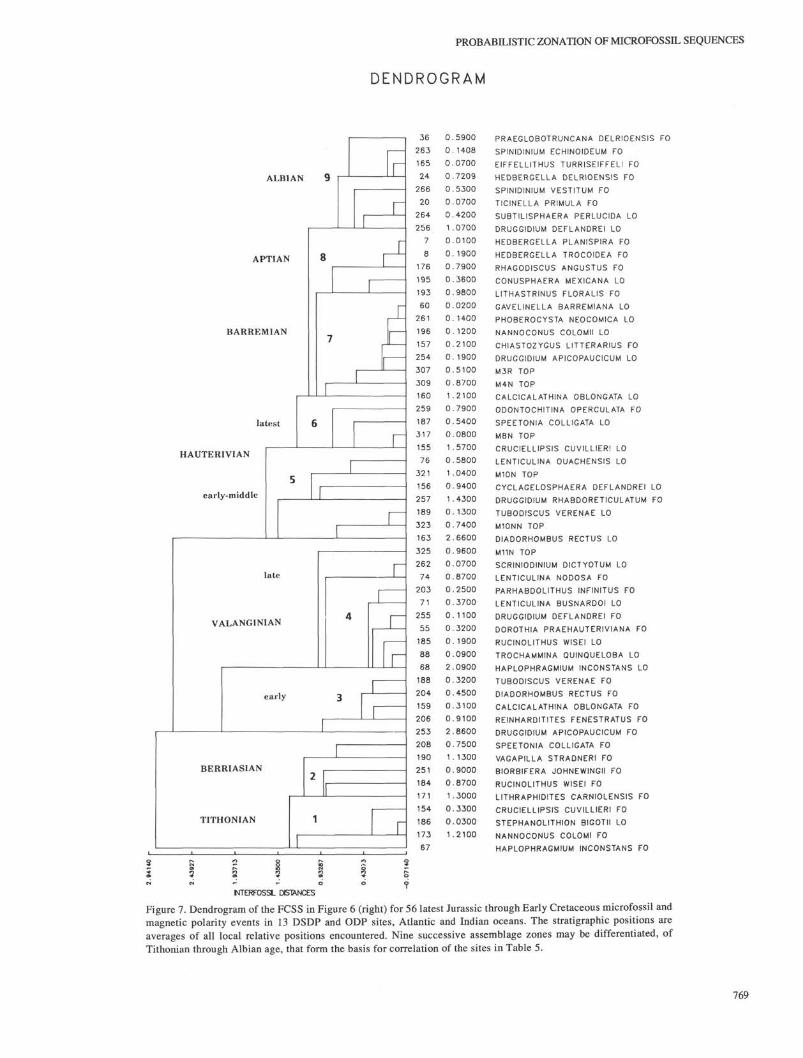
crossplotted with the events in each individual hole, now ex-pressed in the original depth unit of measurements (meters belowseafloor). Again, the FCSS (dependent variable) is expressed asa function of the individual hole's record (independent variable),using smoothing cubic splines, but now the FCSS is interpolatedin each hole to find the most likely (average) local depth of eachFCSS event, even if it was not observed locally. The result issummarized in Table 5, which shows the FCSS for the Atlanticand Indian oceans (as discussed above), the measured depth ofevents observed in each site (Column B), and the interpolateddepth of the FCSS events (Column A). Note that often only a smalloffset is seen between observed and interpolated (average) depthsof zonal events, generally less than 10 m. In a few cases, the offsetis measured in tens of meters. Blank lines in both columns indicateabsence of data for executing spline crossplots between the FCSSand the individual site record.
Using the most likely age in stage units of discrete and strati-graphically reliable events in the FCSS, their interpolated depthsmay serve as the basis for a most likely chronostratigraphiccorrelation among oceanic sites. The interested user should havelittle trouble erecting such a scheme, using, for example, theDNAG (Kent and Gradstein, 1985) or the GTS89 (Harland et al.,1990) time scales. Conversely, the STRATCOR method appliedto a much larger, and stratigraphically more refined (pelagic), dataset with ammonites, radiolarians, and calpionellids representedmay serve to calculate a high-resolution FCSS that can be rescaledin linear time, once enough tiepoints have been established to astandard geological time scale. Thus, a "pelagic" biochronok>gymay be established for the Late Jurassic and Early Cretaceous timeinterval that can be updated readily.
SUMMARYDetailed biostratigraphic data were accumulated during coring
of Upper Jurassic and Lower Cretaceous strata in 10 Atlantic and3 Indian Ocean sites. It is difficult to build an objective multiplebiostratigraphic framework by visually comparing range charts ofdifferent fossil groups with geomagnetic reversals sequences andscattered fossil records for all 13 sites. The quantitative strati-
767
•oóβ
3 6
2 6 3
1 6 5
2 4
2 0
2 6 6
2 6 4
2 0 9
2 5 6
78
3 0 4
1 7 6
2 6 1
4 1
1 9 5
1 9 3
3 0 9
1 9 6
6 0
2 5 4
2
1 5 7
31 11 6 0
1 9 4
4 0
31 51 8 7
2 5 9
1 9 7
3 1 6
1 5 5
3 1 7
3 1 8
2 0 0
3 2 1
1 5 6
3 2 2
2 5 7
1 8 9
3 2 3
1 6 3
8 8
2 0 2
5 5
3 2 4
7 4
2 6 2
3 2 5
2 0 3
7 1
2 5 5
1 8 5
2 0 4
1 5 9
1 8 8
2 5 3
3 3 8
2 0 6
3 3 9
3 4 0
2 0 8
1 9 0
2 5 1
1 8 4
1 7 1
1 8 6
1 7 3
6 7
1 541 5 8
Position
1 052 082 172 912 922 993 403 584 555 925 946 276 577 047 087 687 919 669 749 98
10.6110 7210 8911 6912 2513 5014 8114 84
15 5116 4216 4416 6017 2318 3519 8920 9921 9922 2223 2223 4224 6926 1627 0927 4929 2130 2330.6030 8931 0831 9832 8833 3233 9335 7737 4638 1638 2039 5439 5440 3341.1142 8542 9343 9744 9245 3946 7447 9248 1949.7450 7052 00
Numberoi wells
3
3
5
3
4
4
3
25
7
5
2
4
3
2
5
3
24
3
3
2
6
2
6
2
2
2
3
7
2
2
1 0
2
2
2
2
4
2
6
5
2
4
22
6
25
3
24
4
5
6
5β
7
6
2
3
2
2
2
4
5
4
4
24
25
2
Ms in the Atlantic Ocea
Praeglobotrunc•π• dβlrloensls FO (PF)Spinldlnlum achlnold um FO (P)Eiff llithus turrli lft ll FO (N)Hedb rg lla d lrlo nsh> FO (PF)Tlcln lla primula FO (PF)Spinldlnlum v ttltum FO (P)Subtlllspha ra perluclda LO (P)Pr dltcospha ra cretac a FO (N)Druggldlum d flandr l LO (P)Hβdb rg lla plaπlaplra FO (PF)H db rgella trocoid a FO (PF)M i r t o p (M)Rhagodlscus angustut FO (N)Phob rocysta n ocomlca LO (P)Hβdb rgβlla slgall LO (PF)Conuspha ra m xlcana LO (N)Uthastrlnu> florallt FO (N)M4n top (M)Nannoconus colomli LO (N;Gavelinella barr mlana LO (BF)Druggldlum aplcopauclcum LO (P)Caueas lla hot rlvlca LO (PF)Chlastozygut lltt rarlus FO (N)MSr top (M)Calclcalathlna oblongata LO (N)Vagapllla matalosa FO (N)H db rg lla slgall FO (PF)M7n top (M)Sp βtonla colhgata LO (N)Odontochitlna operculata FO (P)Nannoconut trulttl FO (N)M7r top (M)Crucl l l ipil i cuvllllerl LO (NM8n top (M)Mβr top (M)Chlaitozygui ttrlatut FO (N,M10n top (M)Cyclag lospha ra d flandr l LO (N)M10r top (M)Druggldium rhabdor tlculatum FO (P)Tubodlscut v r na LO (N)M10Nn top (M)Dladorhombus r ctut LO (N)Trochammlna quinqueloba LO (BF)Nannoconut buch rl FO (N)Dorothla praβhaut rlvlana FO (BF)M10Nr top (M)Uπtlcullna nodosa FO (BF)Scrlnlodlnlum dlctyotum LO (P)M11n top (M) . 'Parhabdollthus Inflnltu* FO (N)Lβntleullna busnàrdol LO (BF)Druggldlum d tlandr l FO (P)Ruclnollthut wls l LO (N)Dladorhombus r ctut FO (N)Calelcalaihina oblongata FO (N)Tubodlscut v r na FO (N)Druggldlum aplcopauclcum FO (P)MISrtop (M)R lnhardltlt s f n ttratus FO (N)M16n top (M)M16r top (M)Sp tonla colligate FO (N)Vagapllia stradn ri FO (N)Blorblf ra John wlngll FO (Ruclnollthus wit l FO (N)Llthraphldlt t carnlol nsls FO (N)Stβphanollthlon blgotll LO (N)Nannoconus coloml FO (N)Haplophragmlum Inconstant FO (BF)Crucielllpsis cuvllllβrl FO (N)Conusphaβra mβxicana FO (N)
Events In the Indian Ocean
Dlconodlnlum davldll FO (P)Dlngodlnlum c rvlculum LO (P)Rhombod lla pauelspina LO (P)Dlconodlnlum davMII LO (P)Pr dlscospha ra columnata FO (N)Qloblg rln llold s l rr ol ntis LO (PF)H db rg lla planltplra FO (PF)Hay lt Irr gulari FO (N)Pa udoc ratlum turn rl FO (P)Ascodlnlum tp. A PEAK (P)H db rg lla d lrlo nsls FO (PF)Corollthloπ achylosus FO (N)Chlattozygut lltt rarlus FO (N)Eprollthus ap rtlor FO (N)Eprolithus varoll FO (N)Flab illt t bHoraminls FO (N)Rhagodlscus angustus FO (N)MOr top (M)Min top (M)M2n top (M)
Odontochrtlna operculata FO (P)M3r top (M)Qav lln lla barr mlana FO (BF)M4n top (M)Lβntlcullna cr pldularls LO (BF)Mud rongla australls FO (P)Phob rocysta n ocomlca LO (P)Mβn top (M)M»n top (M)Cruci lllpslt cuvllli rl LO (N)T gum ntum trlp t LO (N)Conorbold s hofk rl FO (BF)M10n top (M)Dorothla praehaut rlvlana LO (BF)Qav lln lla bett mtaedtl P (BF)L nticulln ouach n t l t LO (BF)Paalxow lla l lf ll LO (BF)Epl tomlna caracolla P (BF)Tubodltcut v r na LO (N)MIONn top (M)Ruclnollthus wis l LO (N)Tsgum ntum strlatum LO (N)M11n top (M)Tubodlscut v r na FO (N)Haplophragmlum Inconstant LO (BF)T gum ntum ttriatum FO (N)T gum ntum tripes FO (N)Ruclnollthut wis l FO (N)Dorothla pra haut rlvlana FO (BF)V rn ulllnold s n ocoml nsls LO (BF)Cruclblscutum tal brotum FO (N)Crucl lllptlt cuvllll rl FO (N)R lnhardltlt * f n stratus FO (N)Dlttlmulldlnlum lobotplnotum LO (P)Egmontodlnlum torynum LO (P)Batloladlnlum retlculatum LO (P)Cyclag lospha ra d flandr l FO (N)Trochammlna quinqueloba LO (BF)Ps udor ophax clsovnlc nsls FO (BF)Sp tonia colllgata FO (N)St phanollthlon blgotll LO (N)Haplophragmlum Inconstans FO (BF)Hormoslna cf. crassa FO (BF)Trochammlna quinqueloba FO (BF)Lentlctilina qu nst dtl LO (BF)Vβrn ulllnold t n ocoml nsls FO (BF)
Code
2 6 7
2 7 0
2 7 1
2 6 8
2 2 1
2 9
7
2 2 0
2 6 9
2 7 2
2 4
2 1 9
1 5 7
2 1 6
2 1 7
2 1 8
1 7 6
3 0 1
3 0 3
3 0 5
2 5 9
3 0 7
9 7
3 0 9
7 2
2 7 3
2 6 1
3 1 7
3 1 9
1 5 5
2 1 5
9 8
3 2 1
9 6
9 4
7 6
9 2
9 3
1 8 9
3 2 3
1 8 5
2 1 3
3 2 5
1 8 8
6 8
2 1 2
2 1 4
1 8 4
5 5
8 9
2 1 1
1 5 4
2062752 7 6
2 7 4
2 1 0
8 8
9 1
2 0 8
1 8 6
6 7
9 5
8 7
7 8
9 0
Position
1
2
2
3
4
S
6
78
β
β
8
9
1 0
1 0
1 0
1 0
1111 9712 9212.9913 8314.5715 1615.3115 9615 9616 0716 8617 0117.5717 6918 5519 2819 2819 7520 0620 0620 1420 38
209521 6422 492 3 6
23 8324 8524.8525 04
250425 3525 3526.5
26 6227.1828.0429 0129 4
30 0130 7631.4931 4931 4931 S332.9932 9932.99
Numberol wells
1
1
1
1
1
1
1
1
1
1
1
1
1
1
1
1
1
2221
3
1
21
1
1
1
1
3
1
1
1
1
1
21
1
2
1
1
21
3222
1
1
223
1
1
1
1
22
1
1
1
1
1
1
1
2
o
Figure 6. Comparison of the FCSS using STRATCOR for the Lower Cretaceous record in 10 Atlantic DSDP sites (left; 72 events) with the coeval record
in 3 Indian Ocean ODP sites (right; 66 events). The Atlantic events occur in at least two holes. The threshold for the Indian Ocean FCSS is 1; hence, it
records all events observed in any site. Twenty-two events are in common between the two zonations, with few taxa, such as the LO of the benthic foraminifer
Trochammina quinqueloba or the dinocyst Phoberocysta neoconmica showing considerable scatter.
PROBABILISTIC ZONATION OF MICROFOSSIL SEQUENCES
DENDROGRAM
ALBIAN
APTIAN
BARREMIAN
5
0.5900 PRAEGLOBOTRUNCANA DELRIOENSIS FO
0.1408 SPINIDINIUM ECHINOIDEUM FO
0.0700 EIFFELLITHUS TURRISEIFFELI FO
0.7209 HEDBERGELLA DELRIOENSIS FO
0.5300 SPINIDINIUM VESTITUM FO
0.0700 TICINELLA PRIMULA FO
0.4200 SUBTILISPHAERA PERLUCIDA LO
1.0700 DRUGGIDIUM DEFLANDREI LO
0.0100 HEDBERGELLA PLANISPIRA FO
0.1900 HEDBERGELLA TROCOIDEA FO
0.7900 RHAGODISCUS ANGUSTUS FO
0.3600 CONUSPHAERA MEXICANA LO
0.9800 LITHASTRINUS FLORALIS FO
0.0200 GAVELINELLA BARREMIANA LO
0.1400 PHOBEROCYSTA NEOCOMICA LO
0.1200 NANNOCONUS COLOMII LO
0.2100 CHIASTOZYGUS LITTERARIUS FO
0.1900 DRUGGIDIUM APICOPAUCICUM LO
0.5100 M3R TOP
0.8700 M4N TOP
1.2100 CALCICALATHINA OBLONGATA LO
0.7900 ODONTOCHITINA OPERCULATA FO
0.5400 SPEETONIA COLLIGATA LO
0.0800 M8N TOP
1.5700 CRUCIELLIPSIS CUVILLIER! LO
0.5800 LENTICULINA OUACHENSIS LO
1 .0400 M10N TOP
0.9400 CYCLAGELOSPHAERA DEFLANDREI LO
1.4300 DRUGGIDIUM RHABDORETICULATUM FO
0.1300 TUBODISCUS VERENAE LO
0.7400 M10NN TOP
2.6600 DIADORHOMBUS RECTUS LO
0.9600 M11N TOP
0.0700 SCRINIODINIUM DICTYOTUM LO
0.8700 LENTICULINA NODOSA FO
0.2500 PARHABDOLITHUS INFINITUS FO
0.3700 LENTICULINA BUSNARDOI LO
0.1100 DRUGGIDIUM DEFLANDREI FO
0.3200 DOROTHIA PRAEHAUTERIVIANA FO
0.1900 RUCINOLITHUS WISEI LO
0.0900 TROCHAMMINA QUINQUELOBA LO
2.0900 HAPLOPHRAGMIUM INCONSTANS LO
0.3200 TUBODISCUS VERENAE FO
0.4500 DIADORHOMBUS RECTUS FO
0.3100 CALCICALATHINA OBLONGATA FO
0.9100 REINHARDITITES FENESTRATUS FO
2.8600 DRUGGIDIUM APICOPAUCICUM FO
0.7500 SPEETONIA COLLIGATA FO
1.1300 VAGAPILLA STRADNERI FO
0.9000 BIORBIFERA JOHNEWINGII FO
0.8700 RUCINOLITHUS WISEI FO
1.3000 LITHRAPHIDITES CARNIOLENSIS FO
0.3300 CRUCIELLIPSIS CUVILLIERI FO
0.0300 STEPHANOLITHION BIGOTII LO
1.2100 NANNOCONUS COLOMI FO
HAPLOPHRAGMIUM INCONSTANS FO
NTERFOSSL DISTANCES
Figure 7. Dendrogram of the FCSS in Figure 6 (right) for 56 latest Jurassic through Early Cretaceous microfossil andmagnetic polarity events in 13 DSDP and ODP sites, Atlantic and Indian oceans. The stratigraphic positions areaverages of all local relative positions encountered. Nine successive assemblage zones may be differentiated, ofTithonian through Albian age, that form the basis for correlation of the sites in Table 5.
769
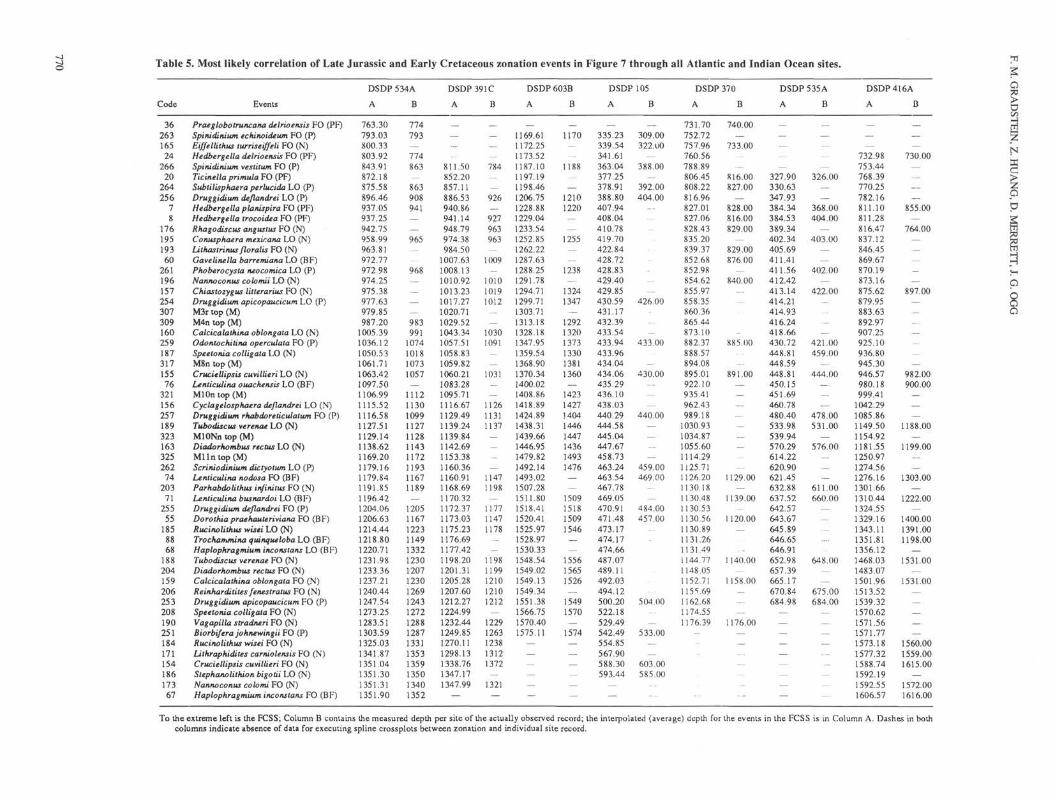
Table 5. Most likely correlation of Late Jurassic and Early Cretaceous zonation events in Figure 7 through all Atlantic and Indian Ocean sites.
Code Events
36 Praeglobotruncana delrioensis FO (PF)263 Spinidinium echinoideum FO (P)165 Eiffellithus turriseiffeli FO (N)
24 Hedbergella delrioensis FO (PF)266 Spinidinium vestitum FO (P)
20 Ticinella primula FO (PF)264 Subtilisphaera perlucida LO (P)256 Druggidium deflandrei LO (P)
7 Hedbergella planispira FO (PF)8 Hedbergella trocoidea FO (PF)
176 Rhagodiscus angustus FO (N)195 Conusphaera mexicana LO (N)193 Lithastrinus floralis FO (N)
60 Gavelinella barremianahO (BF)261 Phoberocysta neocomica LO (P)196 Nannoconus colomii LO (N)157 Chiastozygus litterarius FO (N)254 Druggidium apicopaucicum LO (P)307 M3r top (M)309 M4π top (M)160 Calcicalathina oblongata LO (N)259 Odoniochitina operculata FO (P)187 Speetonia colligala LO (N)317 M8ntop(M)155 Cruciellipsis cuvillieri LO (N)
76 Lenticulina ouachensis LO (BF)321 Ml On top (M)156 Cyclagelosphaera deflandrei LO (N)257 Druggidium rhabdoreticulatum FO (P)189 Tubodiscus verenae LO (N)323 MIONn top (M)163 Diadorhombus rectus LO (N)325 Ml lntop(M)262 Scriniodinium dictyotum LO (P)
74 Lenticulina nodosa FO (BF)203 Parhabdolithus infinitus FO (N)
71 Lenticulina busnardoi LO (BF)255 Druggidium deflandrei FO (P)
55 Dorothia prae hauler iviana FO (BF)18 5 Rucinolithus wisei LO (N)
88 Trochammina quinqueloba LO (BF)68 Haplophragmium inconstans LO (BF)
18 8 Tubodiscus verenae FO (N)204 Diadorhombus rectus FO (N)159 Calcicalathina oblongata FO (N)206 Reinharditites fenestratus FO (N)253 Druggidium apicopaucicum VO (P)208 Speetonia colligata FO (N)190 Vagapilla stradneri FO (N)251 Biorbifera johnewingii FO (P)184 Rucinolithus wisei FO (N)171 Lithraphidites carniolensis FO (N)154 Cruciellipsis cuvillieri FO (N)186 Stephanolithion bigotii LO (N)173 Nannoconus colomi FO (N)
67 Haplophragmium inconstans FO (BF)
DSDP 534A
A
763.30793.03800.33803.92843.91872.18S75.58896.46937.05937.25942.75958.99963.81972.77972.98974.25975.38977.63979.85987.20
1005.391036.121050.531061.711063.421097.501106.991115.521116.581127.511129.141138.621169.201179.161179.841191.851196.421204.061206.631214.441218.801220.711231.981233.361237.211240.441247.541273.251283.511303.591325.031341.871351.041351.301351.311351.90
B
774
793
774
863
863
908
941—
965
968
983
991
1074101810731057
1112113010991127112811431172119311671189
1205116712231149133212301207123012691243127212881287133113531359135013401352
DSDP 391C
A
811.50852.20857.11886.53940.86941.14948.79974.38984.50
1007.631008.131010.921013.231017.271020.711029.521043.341057.511058.831059.821060.211083.281095.711116.671129.491139.241139.841142.691153.381160.361160.911168.691170.321172.371173.031175.231176.691177.421198.201201.311205.281207.601212.271224.991232.441249.851270.111298.131338.761347.171347.99
B
_
784
_
926
927
963
963
1009
101010191012
__
10301091
—
—
1031
112611311137
_
—
—
11471198
117711471178
._
_
11981199121012101212
—
12291263123813121372
—
1321
DSDP603B
A
1169.611172.251173.521187.101197.191198.461206.751228.881229.041233.541252.851262.221287.631288.251291.781294.711299.711303.711313.181328.181347.951359.541368.901370.341400.021408.861418.891424.891438.311439.661446.951479.821492.141493.021507.281511.801518.411520.411525.971528.971530.331548.541549.021549.131549.341551.381566.751570.401575.11
—
——_
B
1170—
__
1188
—
12101220——
1255——
1238_
13241347
129213201373133013811360
—
14231427140414461447143614931476
—
1509151815091546
—
155615651526
15491570
1574—
_——
DSDP 105
A
335.23339.54341.61363.04377.25378.91388.80407.94408.04410.78419.70422.84428.72428.83429.40429.85430.59431.17432.39433.54433.94433.96434.04434.06435.29436.10438.03440.29444.58445.04447.67458.73463.24463.54467.78469.05470.91471.48473.17474.17474.66487.07489.11492.03494.12500.20522.18529.49542.49554.85567.90588.30593.44
B
309.00322.00
—
388.00—
392.00404.00
—
—
426.00
-
433.00
-
430.00
—
440.00—
—
—
459.00469.00
484.00457.00
-–
504.00
533.00_
__
603.00585.00
_..
DSDP 370
A
731.70752.72757.96760.56788.89806.45808.22816.96827.01827.06828.43835.20839.37852.68852.98854.62855.97858.35860.36865.44873.10882.37888.57894.08895.01922.10935.41962.43989.18
1030.931034.871055.601114.291125.711126.201130.181130.481130.531130.561130.891131.261131.49i 144.771148.051152.711155.691162.681174.551176.39
_
B
740.00
733.00_
816.00827.00
—
828.00816.00829.00
829.00876.00
840.00—
885.00
—
891.00—_
—
—
_
—
1129.00—
1139.00
1120.00—
1140.00
1158.00_
1176.00—
—
—
DSDP535AA
_
—
327.90330.63347.93384.34384.53389.34402.34405.69411.41411.56412.42413.14414.21414.93416.24418.66430.72448.81448.59448.81450.15451.69460.78480.40533.98539.94570.29614.22620.90621.45632.88637.52642.57643.67645.89646.65646.91652.98657.39665.17670.84684.98
—
——
_——
B
—
326.00—
368.00404.00
403.00_
—
402.00
422.00
—
421.00459.00
—
444.00—_
—
478.00531.00
576.00_
__
611.00660.00
—
648.00
675.00684.00
—
_
—
-
—
DSDP416A
A
—
732.98753.44768.39770.25782.16811.10811.28816.47837.12846.45869.67870.19873.16875.62879.95883.63892.97907.25925.10936.80945.30946.57980.18999.41
1042.291085.861149.501154.921181.551250.971274.561276.161301.661310.441324.551329.161343.111351.811356.121468.031483.071501.961513.521539.321570.621571.561571.771573.181577.321588.741592.191592.551606.57
B
—730.00
—
—
—
855.00—
764.00
—
_
—
897.00
—
-
—
982.00900.00
—
1188.00
1199.00—
1303.00
1222.00
1400.001391.001198.00
1531.00
1531.00
1560.001559.001615.00
1572.001616.00
To the extreme left is the FCSS; Column B contains the measured depth per site of the actually observed record; the interpolated (average) depth for the events in the FCSS is in Column A. Dashes in bothcolumns indicate absence of data for executing spline crossplots between zonation and individual site record.
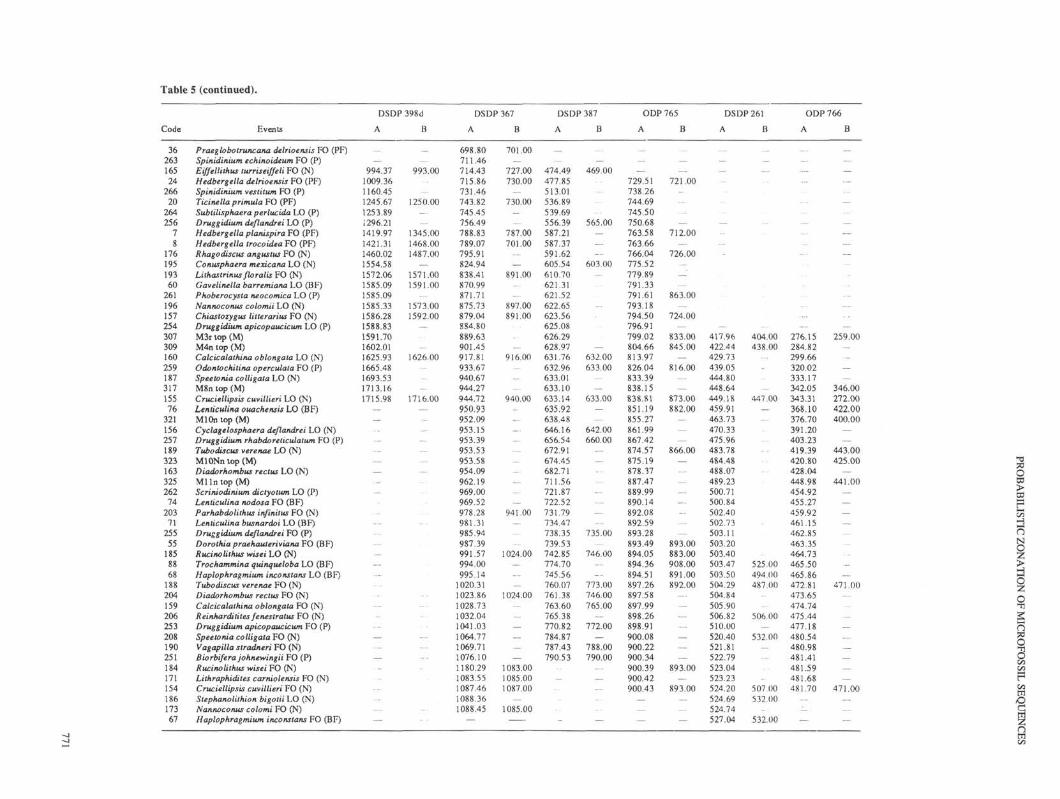
Table 5 (continued).
Code Events
36 Praeglobolruncana delrioensis FO (PF)263 Spinidinium echinoideum FO (P)165 Eiffellithus turriseiffeli FO (N)24 Hedbergella delrioensis FO (PF)
266 Spinidinium vestitum FO (P)20 Ticinella primula FO (PF)
264 Subtilisphaera perlucida LO (P)256 Druggidium deflandrei LO (P)
7 Hedbergella planispira FO (PF)8 Hedbergella trocoidea FO (PF)
176 Rhagodiscus angustus FO (N)195 Conusphaera mexicana LO (N)193 Lithastrinusßoralis FO (N)60 Gavelinella barremiana LO (BF)
261 Phoberocysta neocomica LO (P)196 Nannoconus colomii LO (N)157 Chiastozygus litterarius FO (N)254 Druggidium apicopaucicum LO (P)307 M3r top (M)309 M4n top (M)160 Calcicalathina oblongata LO (N)259 Odontochitina operculata FO (P)187 Speetonia colligata LO (N)317 M8ntop(M)155 Cruciellipsis cuvillieri LO (N)76 Lenticulina ouachensis LO (BF)
321 Ml On top (M)156 Cyclagelosphaera deflandrei LO (N)257 Druggidium rhabdoreticulalum FO (P)189 Tubodiscus verenae LO (N)323 MlONntop(M)163 Diadorhombus rectus LO (N)325 Ml In top (M)262 Scriniodinium dictyotum LO (P)74 Lenticulina nodosa FO (BF)
203 Parhabdolithus infinitus FO (N)71 Lenticulina busnardoi LO (BF)
255 Druggidium deflandrei FO (P)55 Dorothia praehauteriviana FO (BF)
185 Rucinolithus wisei LO (N)88 Trochammina quinqueloba LO (BF)68 Haplopkragmium inconstans LO (BF)
18 8 Tubo discus verenae FO (N)204 Diadorhombus rectus FO (N)159 Calcicalathina oblongata FO (N)206 Reinharditites fenestratus FO (N)253 Druggidium apicopaucicum FO (P)208 Speetonia colligata FO (N)190 Vagapilla stradneri FO (N)251 Biorbifera johnewingii FO (P)184 Rucinolithus wisei FO (N)171 Lithraphidites carniolensis FO (N)154 Cruciellipsis cuvillieri FO (N)186 Stephanolithion bigotii LO (N)173 Nannoconus colomi FO (N)67 Haplophragmium inconstans FO (BF)
DSDP 398d
A
994.371009.361160.451245.671253.891296.211419.971421.311460.021554.581572.061585.091585.091585.331586.281588.831591.701602.011625.931665.481693.531713.161715.98
_
—
—
—-–
-–
-
...._
B
993.00
1250.00
1345.001468.001487.00
1571.001591.00
1573.001592.00
—
1626.00
—1716.00
__
—
_
DSDP 367
A
698.80711.46714.43715.86731.46743.82745.45756.49788.83789.07795.91824.94838.41870.99871.71875.73879.04884.80889.63901.45917.81933.67940.67944.27944.72950.93952.09953.15953.39953.53953.58954.09962.19969.00969.52978.28981.31985.94987.39991.57994.00995.14
1020.311023.861028.731032.041041.031064.771069.711076.101180.291083.551087.461088.361088.45
B
701.00
727.00730.00
730.00
787.00701.00
891.00
897.00891.00
_916.00
_—
940.00__.
_.—
...
_—
941.00
_
1024.00—-___._
1024.00__
1083.001085.001087.00
—1085.00
DSDP 387
A
474.49477.85513.01536.89539.69556.39587.21587.37591.62605.54610.70621.31621.52622.65623.56625.08626.29628.97631.76632.96633.01633.10633.14635.92638.48646.16656.54672.91674.45682.71711.56721.87722.52731.79734.47738.35739.53742.85774.70745.56760.07761.38763.60765.38770.82784.87787.43790.53
_
_
B
—469.00
565.00—
—603.00
—
—
—632.00633.00
_—
633.00
—642.00660.00
—
—
—735.00
746.00
-–-–
773.00746.00765.00
—772.00
—788.00790.00
—
ODP 765
A
_—
729.51738.26744.69745.50750.68763.5876366766.04775.52779.89791.33791.61793.18794.50796.91799.02804.66813.97826.04833.39838.15838.81851.19855.27861.99867.42874.57875.19878.37887.47889.99890.14892.08892.59893.28893.49894.05894.36894.51897.26897.58897.99898.26898.91900.08900.22900.34900.39900.42900.43
B
.__
721.00--
712.00—
726.00
—'—
863.00
724.00_
833.00845.00
~816.00
—873.00882.00
—
—866.00
- .———
893.00883.00908.00891.00892.00
—
——
—893.00
893.00
DSDP 261
A
_—
—
—417.96422.^4429.73439.05444.80448.64449.18459.91463.73470.33475.96483.78484.48488.07489.23500.71500.84502.40502.73503.11503.20503.40503.47503.50504.29504.84505.90506.82510.00520.40521.81522.79523.04523.23524.20524.69524.74527.04
B
—
...
404.00438.00
—447.00
_
525.00494.00487.00
506.00__
532.00
_507.00532.00
_.532.00
ODP 766
A
—
-
—276.15284.82299.66320.02333.17342.05343.31368.10376.70391.20403.23419.39420.80428.04448.98454.92455.27459.92461.15462.85463.35464.73465.50465.86472.81473.65474.74475.44477.18480.54480.98481.41481.59481.68481.70
B
—
——
————
—_
—259.00
_346.00272.00422.00400.00
443.00425.00
—441.00
_
_
471.00_
_
_
471.00
1>torHnN
o
1
o
F. M. GRADSTEIN, Z. HUANG, D. MERRETT, J. G. OGG
graphic methods, STRATCOR and RASC, provide powerful andefficient tools for solving this problem. STRATCOR also is suitedfor smaller data sets, such as those encountered here.
The STRATCOR-derived Final Composite Standard Sequence(FCSS) displays the most likely, average order of 56 stratigraphicevents based on geomagnetic reversals and the average range end-points of nannofossils, planktonic and benthic foraminifers, anddinocysts. Each event occurs in at least three sites. Nine assem-blage zones of Tithonian through Albian age are proposed; thezonation may be refined using more data, although for optimumresolution, it is best to erect separate Atlantic and Indian Oceanzonations. Using STRATCOR, the FCSS also is correlatedthrough all ocean sites.
ACKNOWLEDGMENTSThis study and its manuscript benefitted from scientific advice
provided by Inger Lise Kristiansen, Mike Kaminski, Jurgen Mut-terlose, and Sherwood Wise. Doug Williams, Frits Agterberg, andJill Mutschler-Fontenot suggested improvements of the manu-script. We are grateful for the support provided by these col-leagues. Art Jackson and Frank Thomas, Dartmouth, Nova Scotia,gave valuable technical assistance. The authors acknowledgefinancial support for this study from the Geological Survey ofCanada (to FMG and DM), the National Science and EngineeringResearch Council (NSCERC) (to ZH), and the National ScienceFoundation (to JGO).
REFERENCES
Agterberg, F. P., 1990. Automated Stratigraphic Correlation: New York(Elsevier).
Agterberg, F. P., Gradstein, F. M., Nel, L. D., Lew, S. N., Heller, M.,Gradstein, W. S., D'Iorio, M. D., Gillis, D., and Huang, Z., 1989.Program RASC (ranking and scaling). Com. Quant. Stratigr. IUGS,Version 12 (manual and diskette).
Blechschmidt, C , 1979. Biostratigraphy of calcareous nannofossils: Leg47B, Deep Sea Drilling Project. In Sibuet, J., Ryan, W.B.F., et al.,Init. Repts. DSDP, 47(Pt. 2): Washington (U.S. Govt. Printing Office),327-360.
Cepek, P., 1978. Mesozoic calcareous nannoplankton of the eastern NorthAtlantic, Leg 41. In Lancelot, Y.,Seibold, E.,et ah, Init. Repts. DSDP,41: Washington (U.S. Govt. Printing Office), 667-688.
Cepek, P., Gartner, S., and Cool, T., 1980. Mesozoic calcareous nanno-fossils, Deep Sea Drilling Project Sites 415 and 416, Moroccan Basin.In Lancelot, Y., Winterer, E. L., et al., Init. Repts. DSDP, 50: Wash-ington (U.S. Govt. Printing Office), 345-354.
Covington, J. M., and Wise, S. W., Jr., 1987. Calcareous nannofossilbiostratigraphy of a Lower Cretaceous deep-sea fan complex, DeepSea Drilling Project Leg 93, Site 603, lower continental rise off CapeHatteras. In van Hinte, J. E., Wise, S. W., Jr., et al., Init. Repts. DSDP,93 (Pt. 2): Washington (U.S. Govt. Printing Office), 617-660.
Edwards, L. E., 1984. Insight on why graphic correlation (Shaw'smethod) works./. GeoL, 92:583-597.
Gradstein, F. M., 1978a. Foraminifera from DSDP Site 370, Leg 41,eastern North Atlantic Ocean. In Talwani, M., Udintsev, G., et al.,Init. Repts. DSDP, 38-41 (Supplement to Vols. XXXVIII, XXXIX,XL, and XLI): Washington (U.S. Govt. Printing Office), 779-782.
, 1978b. Biostratigraphy of Lower Cretaceous Blake Nose andBlake-Bahama Basin foraminifers, DSDP Leg 44, western NorthAtlantic Ocean. In Benson, W. E., Sheridan, R. E., et al., Init. Repts.DSDP, 44: Washington (U.S. Govt. Printing Office), 663-702.
_, 1983. Paleoecology and stratigraphy of Jurassic abyssal fora-minifera in the Blake-Bahama Basin, Deep Sea Drilling Project Leg76, Sites 533 and 534. In Gradstein, F. M., Sheridan, R. E., et al., Init.Repts. DSDP, 76: Washington (U.S. Govt. Printing Office), 537-560.
1986. Northwestern Atlantic Mesozoic biostratigraphy. InVogt, P. R., and Tucholke, B. (Eds.), The Geology of North America,Vol. M, The Western North Atlantic Region: Alexandria, VA (Geol.Soc. Am.), 507-525.
_, 1990. Program STRATCOR (Version 1.6) for zonation and
Gradstein, F. M., and Agterberg, F. P., 1982. Models of Cenozoic fora-miniferal stratigraphy, northwestern Atlantic margin. In Cubitt, J. M.,and Reyment, R. A. (Eds.), Quantitative Stratigraphic Correlation:Chichester (Wiley), 265-270.
Gradstein, F. M., Agterberg, F. P., Brower, J. C , Schwarzacher, W., 1985.Quantitative Stratigraphy: New York (Reidel and Unesco Publ. Co.).Habib, D., 1972. Dinoflagellate stratigraphy, Leg XI, Deep Sea Drill-ing Project. In Hollister, C. D., Ewing, J. I., et al., Init. Repts. DSDP,11: Washington (U.S. Govt. Printing Office), 367-426.
, 1977. Comparison of Lower and Middle Cretaceous palyno-stratigraphic zonations in the western North Atlantic. In Swain, F. M.(Ed.), Stratigraphic Micropaleontology of Atlantic Basin and Border-lands: New York (Elsevier), 341-368.
1979. Palynostratigraphy of Cretaceous sediments from Site387, western Bermuda Rise. In Tucholke, B. E., and Vogt, P. R., etal., Init. Repts. DSDP, 43: Washington (U.S. Govt. Printing Office),585-590.
, 1978. Palynostratigraphy of the Lower Cretaceous section at
correlation of fossil events. Geol. Surv. Can. Rept., 2285 (incl. manual+ program diskette).
DSDP Site 391, Blake-Bahama Basin, and its correlation in the NorthAtlantic. In Benson, W. E., Sheridan, R. E., et al., Init. Repts. DSDP,44: Washington (U.S. Govt. Printing Office), 887-898.
Habib, D., and Knapp, S., 1982. Stratigraphic utility of Cretaceous smallacritarchs. Micropaleontology, 28:335-371.
Habib, D., and Drugg, W. S., 1983. Dinoflagellate age of Middle Juras-sic-Early Cretaceous sediments in the Blake-Bahama Basin. In Grad-stein, F. M., Sheridan, R. E., et al., Init. Repts. DSDP, 76: Washington(U.S. Govt. Printing Office), 623-638.
, 1987. Palynology of Sites 603 and 605, Leg 93, Deep SeaDrilling Project. In van Hinte, J. E., Wise, S. W., Jr., et al., Init. Repts.DSDP, 93(Pt. 2): Washington (U.S. Govt. Printing Office), 751-776.
Harland, W. B., Armstrong, R. L., Cox, A. V., Craig, L. E., Smith, A. G.,and Smith, D. G., 1990. A Geological Time Scale: Cambridge (Cam-bridge Univ. Press).
Jansa, L. F., Enos, P., Tucholke, B. E., Gradstein, F. M., and Sheridan,R. E., 1979. Mesozoic-Cenozoic sedimentary formations of the NorthAmerican Basin; western North Atlantic. In Talwani, M., Hay, W.,and Ryan, W.B.F., (Eds.), Deep Drilling Results in the AtlanticOcean: Continental Margins and Paleoenvironment Washington(Am. Geophys. Union), Maurice Ewing Ser., 3:1-57.
Kent, D. V., and Gradstein, F. M., 1985. A Jurassic and Cretaceousgeochronology. Geol. Soc. Am. Bull., 96:1419-1427.
Kuznetsova, K. I., and Seibold, I., 1978. Foraminifers from the UpperJurassic and Lower Cretaceous of the eastern Atlantic (DSDP Leg 41,Sites 367 and 370). In Lancelot, Y., Seibold, E., et al., Init. Repts.DSDP, 41: Washington (U.S. Govt. Printing Office), 515-538.
Leckie, R. M., 1984. Mid-Cretaceous planktonic foraminiferal biostra-tigraphy off central Morocco, Deep Sea Drilling Project Leg 79, Sites545 and 547. In Hinz, K., Winterer, E. L., et al., Init. Repts. DSDP,79: Washington (U.S. Govt. Printing Office), 579-620.
Lowrie, W., and Ogg, J. G., 1985. A magnetic polarity time scale for EarlyCretaceous and Late Jurassic. Earth Planet. Sci. Lett., 76:341-349.
Ludden, J. N., and Gradstein, F. M., et al., 1990. Proc. ODP, Init. Repts.,123: College Station, TX (Ocean Drilling Program).
Luterbacher, H., 1972. Foraminifera from the Lower Cretaceous andUpper Jurassic of the northwestern Atlantic. In Hollister, C. D.,Ewing, J. I., et al., Init. Repts. DSDP, 11: Washington (U.S. Govt.Printing Office), 561-594.
McNulty, C. L., 1979. Smaller Cretaceous foraminifers of Leg 43, DeepSea Drilling Project. In Tucholke, B. E., and Vogt, P. R., et al., Init.Repts. DSDP, 43: Washington (U.S. Govt. Printing Office), 487-506.
Miller, F. X., 1977. The graphic correlation method in biostratigraphy.In Kauffman, E. G., and Hazel, J. E. (Eds.), Concepts and Methods ofBiostratigraphy: Strousburg, PA (Hutchinson and Ross), 165-186.
Ogg, J. G., 1983. Magnetostratigraphy of Upper Jurassic and LowermostCretaceous sediments, Deep Sea Drilling Project Site 534, westernNorth Atlantic. In Gradstein, F. M., Sheridan, R. E., et al., Init. Repts.DSDP, 76: Washington (U.S. Govt. Printing Office), 685-698.
, 1987. Early Cretaceous magnetic polarity time scale and themagnetostratigraphy of Deep Sea Drilling Project Sites 603 and 534,western central Atlantic. In van Hinte, J. E., Wise, S. W., Jr., et al.,Init. Repts. DSDP, 93 (Pt. 2): Washington (U.S. Govt. Printing Of-fice), 849-880.
_, in press. Jurassic magnetic polarity time scale. In Westermann,G.E.G. (Ed)., Circum-Pacific Jurassic: New York (Elsevier).
772
PROBABILISTIC ZONATION OF MICROFOSSIL SEQUENCES
Ogg, J. G., and Steiner, M. B., 1988. Late Jurassic and Early Cretaceousmagnetic polarity time scale. In Rocha, R. (Ed.), Proc. 2nd Int. Symp.Jurassic Stratigr. (Lisbon, Sept. 1987), 1125-1138.
Okada, H., and Thierstein, H. R., 1979. Calcareous nannoplankton—Leg43, Deep Sea Drilling Project. In Tucholke, B. E., and Vogt, P. R., etal., Init. Repts. DSDP, 43: Washington (U.S. Govt. Printing Office),507-574.
Pflaumann, U., and Krasheninnikov, V. A., 1978. Early Cretaceous plank-tonic foraminifers from eastern North Atlantic, DSDP Leg 41. InLancelot, Y., Seibold, E., et al., Init. Repts. DSDP, 41: Washington(U.S. Govt. Printing Office), 539-564.
Riley, L. A., and Fenton, J.P.G., 1984. Palynostratigraphy of the Berria-sian to Cenomanian sequence at Deep Sea Drilling Project Site 535,Leg 77, southeastern Gulf of Mexico. In Buffler, R. T., Schlager, W.,et λ.Jnit. Repts. DSDP, 11: Washington (U.S. Govt. Printing Office),675-690.
Roth, P. R., 1983. Jurassic and Lower Cretaceous calcareous nannofossilsin the western North Atlantic (Site 534): biostratigraphy, preser-vation, and some observations on biogeography and paleoceano-graphy. In Gradstein, F. M., Sheridan, R. E., et al., Init. Repts. DSDP,76: Washington (U.S. Govt. Printing Office), 587-622.
Roth, P. R., 1978. Cretaceous nannoplankton biostratigraphy and ocean-ography of the northwestern Atlantic Ocean. In Benson, W. E., Sheri-dan, R. E., et al., Init. Repts. DSDP, 44: Washington (U.S. Govt.Printing Office), 731-760.
Schmidt, R. R., 1978. Calcareous nannoplankton from the western NorthAtlantic, DSDP Leg 44. In Benson, W. E., Sheridan, R. E., et al., Init.Repts. DSDP, 44: Washington (U.S. Govt. Printing Office), 703-730.
Shaw, A. B., 1964. Time in Stratigraphy: New York (McGraw-Hill).Sigal, J., 1979. Chronostratigraphy and ecostratigraphy of Cretaceous
formations recovered on DSDP Leg 47B, Site 398. In Sibuet, J., Ryan,W.B.F., et al., Init. Repts. DSDP, 47 (Pt. 2): Washington (U.S. Govt.Printing Office), 287-326.
Silva, I. P., and McNulty, C. L. 1984. Planktonic foraminifers andcalpionellids from Gulf of Mexico sites, Deep Sea Drilling ProjectLeg 77. In Buffler, R. T., Schlager, W., et al., Init. Repts. DSDP, 77:Washington (U.S. Govt. Printing Office), 547-584.
Sliter, W. V., 1980. Mesozoic foraminifers and deep-sea benthic environ-ments from Deep Sea Drilling Project Sites 415 and 416, eastern NorthAtlantic. In Lancelot, Y., Winterer, E. L., et al., Init. Repts. DSDP,50: Washington (U.S. Govt. Printing Office), 353^28.
Sliter, W. V., and Silva, I. P., 1984. Autochthonous and displaced (alloch-thonous) Cretaceous benthic foraminifers from Deep Sea DrillingProject Leg 77, Sites 535, 536, 537, 538 and 540, Gulf of Mexico. InBuffler, R. T., Schlager, W., et al., Init. Repts. DSDP, 11: Washington(U.S. Govt. Printing Office), 593-629.
Watkins, D. K., and Bowdler, J. L., 1984. Cretaceous nannofossils fromDeep Sea Drilling Project Leg 77, southeast Gulf of Mexico. InBuffler, R. T., Schlager, W., et al., Init. Repts. DSDP, 11: Washington(U.S. Govt. Printing Office), 649-674.
Wiegand, G. E., 1984. Cretaceous nannofossils from the northwest Afri-can margin, Deep Sea Drilling Project Leg 79. In Hinz, K., Winterer,E. L., et al., Init. Repts. DSDP, 79: Washington (U.S. Govt. PrintingOffice), 563-579.
Wilcoxon, J. A., 1972. Calcareous nannoplankton ranges, Leg 11, DeepSea Drilling Project. In Hollister, C. D., Ewing, J. I., et al., Init. Repts.DSDP, 11: Washington (U.S. Govt. Printing Office), 459^74.
Williams, G. L., 1978. Palynological biostratigraphy, Deep Sea DrillingProject Sites 367 and 370. In Talwani, M., Udintsev, G., et al., Init.Repts. DSDP, 3 8 ^ 1 (Supp. Vol. 38, 39, 40, and 41): Washington(U.S. Govt. Printing Office), 779-782.
123B-116Date of initial receipt: 18 January 1991Date of acceptance: 2 April 1991
773
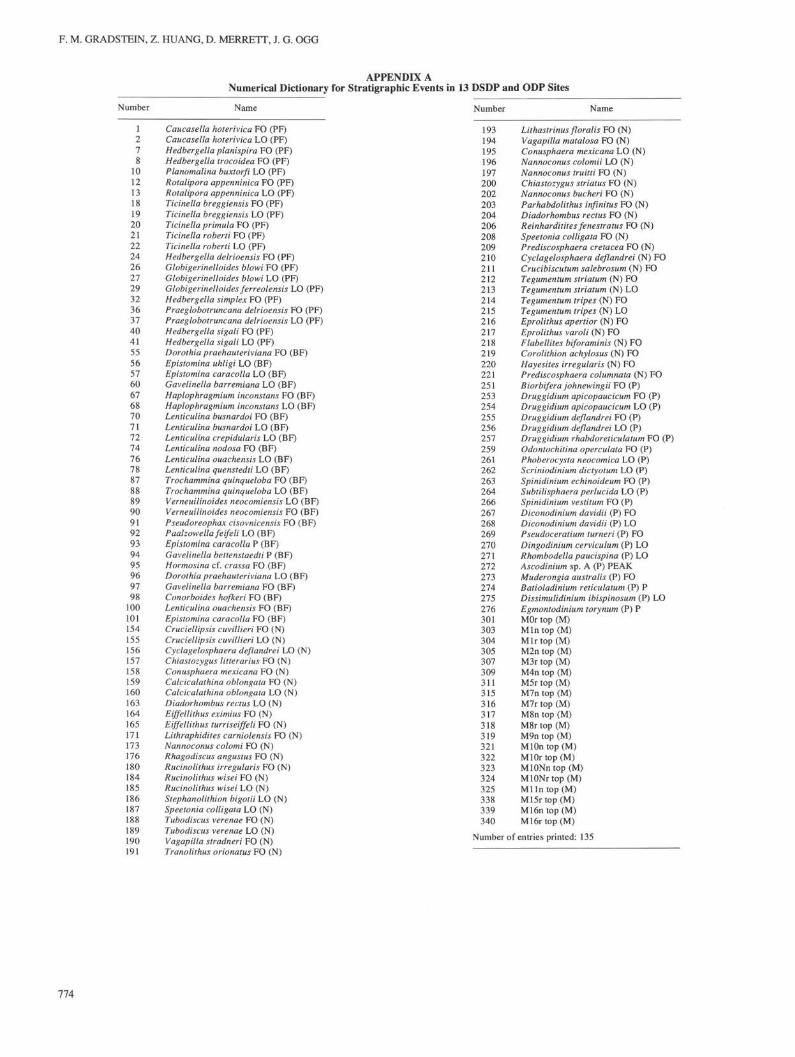
F. M. GRADSTEIN, Z. HUANG, D. MERRETT, J. G. OGG
APPENDIX ANumerical Dictionary for Stratigraphic Events in 13 DSDP and ODP Sites
Number Name Number Name
1 Caucasella hoterivica FO (PF)2 Caucasella hoterivica LO (PF)7 Hedbergella planispira FO (PF)8 Hedbergella trocoidea FO (PF)
10 Planomalina buxtorfi LO (PF)12 Rotalipora appenninica FO (PF)13 Rotalipora appenninica LO (PF)18 Ticinella breggiensis FO (PF)19 Ticinella breggiensis LO (PF)20 Ticinella primula FO (PF)21 Ticinella roberti FO (PF)22 Ticinella roberti LO (PF)24 Hedbergella delrioensis FO (PF)26 Globigerinelloides blowi FO (PF)27 Globigerinelloides blowi LO (PF)29 Globigerinelloides ferreolensis LO (PF)32 Hedbergella simplex FO (PF)36 Praeglobotruncana delrioensis FO (PF)37 Praeglobotruncana delrioensis LO (PF)40 Hedbergella sigali FO (PF)41 Hedbergella sigali LO (PF)55 Dorothia praehauteriviana FO (BF)56 Epistomina uhligi LO (BF)57 Epistomina caracolla LO (BF)60 Gavelinella barremiana LO (BF)67 Haplophragmium inconstans FO (BF)68 Haplophragmium inconstans LO (BF)70 Lenticulina busnardoi FO (BF)71 Lenticulina busnardoi LO (BF)72 Lenticulina crepidularis LO (BF)74 Lenticulina nodosa FO (BF)76 Lenticulina ouachensis LO (BF)78 Lenticulina quenstedti LO (BF)87 Trochammina quinqueloba FO (BF)88 Trochammina quinqueloba LO (BF)89 Verneuilinoides neocomiensis LO (BF)90 Verneuilinoides neocomiensis FO (BF)91 Pseudoreophax cisovnicensis FO (BF)92 Paalzowellafeifeli LO (BF)93 Epistomina caracolla P (BF)94 Gavelinella bettenstaedti P (BF)95 Hormosina cf. crassa FO (BF)96 Dorothia praehauteriviana LO (BF)97 Gavelinella barremiana FO (BF)98 Conorboides hofkeri FO (BF)
100 Lenticulina ouachensis FO (BF)101 Epistomina caracolla FO (BF)154 Cruciellipsis cuvillieri FO (N)155 Cruciellipsis cuvillieri LO (N)156 Cyclagelosphaera deflandrei LO (N)157 Chiastozygus litterarius FO (N)158 Conusphaera mexicana FO (N)159 Calcicalathina oblongata FO (N)160 Calcicalathina oblongata LO (N)163 Diadorhombus rectus LO (N)164 Eiffellithus eximius FO (N)165 Eiffellithus turriseiffeli FO (N)171 Lithraphidites carniolensis FO (N)173 Nannoconus colomi FO (N)176 Rhagodiscus angustus FO (N)180 Rucinolithus irregularis FO (N)184 Rucinolithus wisei FO (N)185 Rucinolithus wisei LO (N)186 Stephanolithion bigotii LO (N)187 Speetonia colligata LO (N)188 Tubodiscus verenae FO (N)189 Tubodiscus verenae LO (N)190 Vagapilla stradneri FO (N)191 Tranolithus orionatus FO (N)
193 Lithastrinus floralis FO (N)194 Vagapilla matalosa FO (N)195 Conusphaera mexicana LO (N)196 Nannoconus colomii LO (N)197 Nannoconus truitti FO (N)200 Chiastozygus striatus FO (N)202 Nannoconus bucheri FO (N)203 Parhabdolithus infinitus FO (N)204 Diadorhombus rectus FO (N)206 Reinharditites fenestratus FO (N)208 Speetonia colligata FO (N)209 Prediscosphaera cretacea FO (N)210 Cyclagelosphaera deflandrei (N) FO211 Crucibiscutum salebrosum (N) FO212 Tegumentum striatum (N) FO213 Tegumentum striatum (N) LO214 Tegumentum tripes (N) FO215 Tegumentum tripes (N) LO216 Eprolithus apertior (N) FO217 Eprolithus varoli (N) FO218 Flabellites biforaminis (N) FO219 Corolithion achylosus (N) FO220 Hayesites irregularis (N) FO221 Prediscosphaera columnata (N) FO251 Biorbifera johnewingii FO (P)253 Druggidium apicopaucicum FO (P)254 Druggidium apicopaucicum LO (P)255 Druggidium deflandrei FO (P)256 Druggidium deflandrei LO (P)257 Druggidium rhabdoreticulatum FO (P)259 Odontochitina operculata FO (P)261 Phoberocysta neocomica LO (P)262 Scriniodinium dictyotum LO (P)263 Spinidinium echinoideum FO (P)264 Subtilisphaera perlucida LO (P)266 Spinidinium vestitum FO (P)267 Diconodinium davidii (P) FO268 Diconodinium davidii (P) LO269 Pseudoceratium turneri (P) FO270 Dingodinium cerviculum (P) LO271 /?hombodella paucispina (P) LO272 Ascodinium sp. A (P) PEAK273 Muderongia australis (P) FO274 Batioladinium reticulatum (P) P275 Dissimulidinium ibispinosum (P) LO276 Egmontodinium torynum (P) P301 MOrtop(M)303 Mlntop(M)304 Mlrtop(M)305 M2n top (M)307 M3r top (M)309 M4n top (M)311 M5r top (M)315 M7ntop(M)
316 M7rtop(M)
317 M8ntop(M)
318 M8rtop(M)
319 M9ntop(M)
321 MlOπtop(M)322 MlOrtop(M)323 MlONπtop(M)324 MlONrtop(M)325 Ml In top (M)338 M15rtop(M)339 M16ntop(M)340 M16rtop(M)
Number of entries printed: 135
774
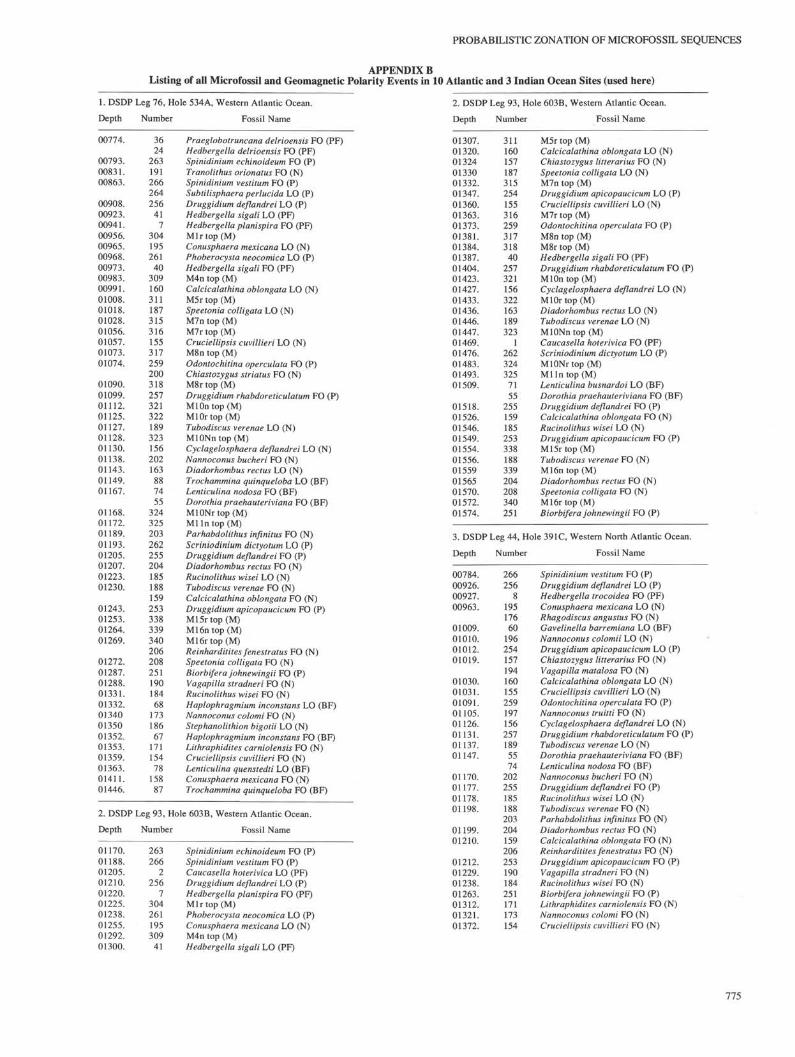
PROBABILISTIC ZONATION OF MICROFOSSIL SEQUENCES
APPENDIX BListing of all Microfossil and Geomagnetic Polarity Events in 10 Atlantic and 3 Indian Ocean Sites (used here)
1. DSDP Leg 76, Hole 534A, Western Atlantic Ocean.
Depth Number Fossil Name
Praeglobotruncana delrioensis FO (PF)Hedbergella delrioensis FO (PF)Spinidinium echinoideum FO (P)Tranolithus orionatus FO (N)Spinidinium vestitum FO (P)Subtilisphaera perlucida LO (P)Druggidium deflandrei LO (P)Hedbergella sigali LO (PF)Hedbergella planispira FO (PF)Mir top (M)Conusphaera mexicana LO (N)Phoberocysta neocomica LO (P)Hedbergella sigali FO (PF)M4n top (M)Calcicalathina oblongata LO (N)M5r top (M)Speetonia colligata LO (N)M7n top (M)M7r top (M)Cruciellipsis cuvillieri LO (N)M8n top (M)Odontochitina operculata FO (P)Chiastozygus striatus FO (N)M8r top (M)Druggidium rhabdoreticulatum FO (P)MlOntop(M)MlOrtop(M)Tubodiscus verenae LO (N)MlONntop(M)Cyclagelosphaera deflandrei LO (N)Nannoconus bucheri FO (N)Diadorhombus rectus LO (N)Trochammina quinqueloba LO (BF)Lenticulina nodosa FO (BF)Dorothia praehauteriviana FO (BF)MlONrtop(M)Ml In top (M)Parhabdolithus infinitus FO (N)Scriniodinium dictyotum LO (P)Druggidium deflandrei FO (P)Diadorhombus rectus FO (N)Rucinolithus wisei LO (N)Tubodiscus verenae FO (N)Calcicalathina oblongata FO (N)Druggidium apicopaucicum FO (P)M15rtop(M)M16ntop(M)M16rtop(M)Reinharditites fenestratus FO (N)Speetonia colligata FO (N)Biorbifera johnewingii FO (P)Vagapilla stradneri FO (N)Rucinolithus wisei FO (N)Haplophragmium inconstans LO (BF)Nannoconus colomi FO (N)Stephanolithion bigotii LO (N)Haplophragmium inconstans FO (BF)Lithraphidites carniolensis FO (N)Cruciellipsis cuvillieri FO (N)Lenticulina quenstedti LO (BF)Conusphaera mexicana FO (N)Trochammina quinqueloba FO (BF)
2. DSDP Leg 93, Hole 603B, Western Atlantic Ocean.
Depth Number Fossil Name
Spinidinium echinoideum FO (P)Spinidinium vestitum FO (P)Caucasella hoterivica LO (PF)Druggidium deflandrei LO (P)Hedbergella planispira FO (PF)Mir top (M)Phoberocysta neocomica LO (P)Conusphaera mexicana LO (N)M4n top (M)Hedbergella sigali LO (PF)
00774.
00793.
00831.00863.
00908.
00923.00941.
00956.
00965.
00968.
00973.
00983.
00991.
01008.
01018.
01028.
01056.
01057.
01073.
01074.
01090.
01099.01112.
01125.
01127.
01128.
01130.
01138.01143.
01149.
01167.
01168.01172.
01189.
01193.
01205.
01207.
01223.
01230.
01243.
01253.01264.
01269.
01272.
01287.
01288.
01331.
01332.
01340
01350
01352.
01353.
01359.
01363.01411.
01446.
3624263191266264256417
3041952614030916031118731531615531725920031825732132218932315620216388745532432520326225520418518815925333833934020620825119018468173186671711547815887
01170.
01188.
01205.
01210.
01220.
01225.01238.
01255.01292.
01300.
2632662
2567
30426119530941
2. DSDP Leg 93, Hole 603B, Western Atlantic Ocean.
Depth Number Fossil Name
M5r top (M)Calcicalathina oblongata LO (N)Chiastozygus Htterarius FO (N)Speetonia colligata LO (N)M7n top (M)Druggidium apicopaucicum LO (P)Cruciellipsis cuvillieri LO (N)M7r top (M)Odontochitina operculata FO (P)M8n top (M)M8r top (M)Hedbergella sigali FO (PF)Druggidium rhabdoreticulatum FO (P)Ml On top (M)Cyclagelosphaera deflandrei LO (N)MlOrtop(M)Diadorhombus rectus LO (N)Tubodiscus verenae LO (N)MIONntop (M)Caucasella hoterivica FO (PF)Scriniodinium dictyotum LO (P)MlONrtop(M)Mllntop(M)Lenticulina busnardoi LO (BF)Dorothia praehauteriviana FO (BF)Druggidium deflandrei FO (P)Calcicalathina oblongata FO (N)Rucinolithus wisei LO (N)Druggidium apicopaucicum FO (P)M15rtop(M)Tubodiscus verenae FO (N)M16n top (M)Diadorhombus rectus FO (N)Speetonia colligata FO (N)M16rtop(M)Biorbifera johnewingii FO (P)
3. DSDP Leg 44, Hole 391C, Western North Atlantic Ocean.
Depth Number Fossil Name
Spinidinium vestitum FO (P)Druggidium deflandrei LO (P)Hedbergella trocoidea FO (PF)Conusphaera mexicana LO (N)Rhagodiscus angustus FO (N)Gavelinella barremiana LO (BF)Nannoconus colomii LO (N)Druggidium apicopaucicum LO (P)Chiastozygus Htterarius FO (N)Vagapilla matalosa FO (N)Calcicalathina oblongata LO (N)Cruciellipsis cuvillieri LO (N)Odontochitina operculata FO (P)Nannoconus truitti FO (N)Cyclagelosphaera deflandrei LO (N)Druggidium rhabdoreticulatum FO (P)Tubodiscus verenae LO (N)Dorothia praehauteriviana FO (BF)Lenticulina nodosa FO (BF)Nannoconus bucheri FO (N)Druggidium deflandrei FO (P)Rucinolithus wisei LO (N)Tubodiscus verenae FO (N)Parhabdolithus infinitus FO (N)Diadorhombus rectus FO (N)Calcicalathina oblongata FO (N)Reinharditites fenestratus FO (N)Druggidium apicopaucicum FO (P)Vagapilla stradneri FO (N)Rucinolithus wisei FO (N)Biorbifera johnewingii FO (P)Lithraphidites carniolensis FO (N)Nannoconus colomi FO (N)Cruciellipsis cuvillieri FO (N)
01307.
01320.01324
01330
01332.
01347.
01360.
01363.
01373.
01381.01384.
01387.
01404.
01423.
01427.
01433.
01436.
01446.
01447.
01469.
01476.
01483.
01493.
01509.
01518.
01526.
01546.
01549.
01554.
01556.
01559
01565
01570.01572.
01574.
311160157187315254155316259317318402573211563221631893231
2623243257155255159185253338188339204208340251
00784.
00926.
00927.
00963.
01009.
01010.
01012.
01019.
01030.
01031.
01091.01105.
01126.
01131.
01137.
01147.
01170.
01177.
01178.
01198.
01199.
01210.
01212.
01229.
01238.
01263.
01312.
01321.
01372.
2662568
195176601962541571941601552591971562571895574202255185188203204159206253190184251171173154
775
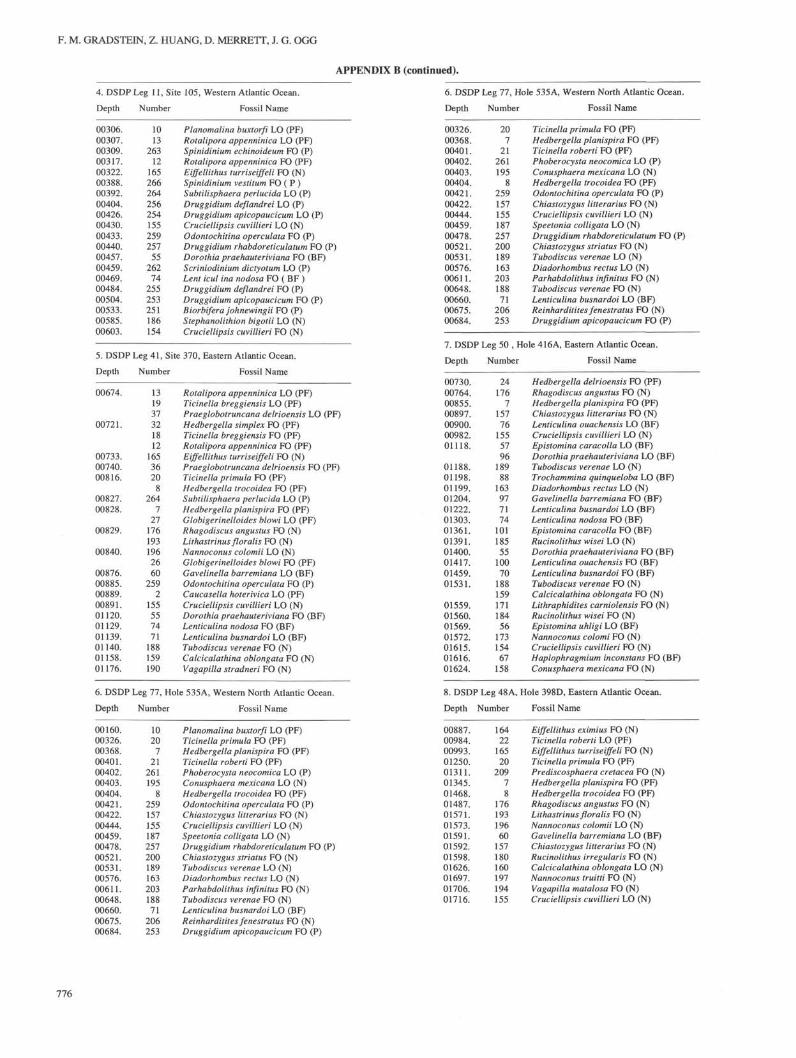
F. M. GRADSTEUM, Z. HUANG, D. MERRETT, J. G. OGG
APPENDIX B (continued).
00306.00307.00309.00317.00322.00388.00392.00404.00426.00430.00433.00440.00457.00459.00469.00484.00504.00533.00585.00603.
1013
263121652662642562541552592575526274255253251186154
4. DSDP Leg 11, Site 105, Western Atlantic Ocean.
Depth Number Fossil Name
Planomalina buxtorfi LO (PF)Rotalipora appenninica LO (PF)Spinidinium echinoideum FO (P)Rotalipora appenninica FO (PF)Eiffellithus turriseiffeli FO (N)Spinidinium vestitum FO ( P )Subtilisphaera perlucida LO (P)Druggidium deflandrei LO (P)Druggidium apicopaucicum LO (P)Cruciellipsis cuvillieri LO (N)Odontochitina operculata FO (P)Druggidium rhabdoreticulatum FO (P)Dorothia praehauteriviana FO (BF)Scriniodinium dictyotum LO (P)Lent icul ina nodosa FO ( BF )Druggidium deflandrei FO (P)Druggidium apicopaucicum FO (P)Biorbifera johnewingü FO (P)Stephanolithion bigotii LO (N)Cruciellipsis cuvillieri FO (N)
5. DSDP Leg 41, Site 370, Eastern Atlantic Ocean.
Depth Number Fossil Name
Rotalipora appenninica LO (PF)Ticinella breggiensis LO (PF)Praeglobotruncana delrioensis LO (PF)Hedbergella simplex FO (PF)Ticinella breggiensis FO (PF)Rotalipora appenninica FO (PF)Eiffellithus turriseiffeli FO (N)Praeglobotruncana delrioensis FO (PF)Ticinella primula FO (PF)Hedbergella trocoidea FO (PF)Subtilisphaera perlucida LO (P)Hedbergella planispira FO (PF)Globigerinelloides blowi LO (PF)Rhagodiscus angustus FO (N)Lithastrinus floralis FO (N)Nannoconus colomii LO (N)Globigerinelloides blowi FO (PF)Gavelinella barremiana LO (BF)Odontochitina operculata FO (P)Caucasella hoterivica LO (PF)Cruciellipsis cuvillieri LO (N)Dorothia praehauteriviana FO (BF)Lenticulina nodosa FO (BF)Lenticulina busnardoi LO (BF)Tubodiscus verenae FO (N)Calcicalathina oblong at a FO (N)Vagapilla stradneri FO (N)
6. DSDP Leg 77, Hole 535A, Western North Atlantic Ocean.
Depth Number Fossil Name
Planomalina buxtorfi LO (PF)Ticinella primula FO (PF)Hedbergella planispira FO (PF)Ticinella roberti FO (PF)Phoberocysta neocomica LO (P)Conusphaera mexicana LO (N)Hedbergella trocoidea FO (PF)Odontochitina operculata FO (P)Chiastozygus litterarius FO (N)Cruciellipsis cuvillieri LO (N)Speetonia colligata LO (N)Druggidium rhabdoreticulatum FO (P)Chiastozygus striatus FO (N)Tubodiscus verenae LO (N)Diadorhombus rectus LO (N)Parhabdolithus infinitus FO (N)Tubodiscus verenae FO (N)Lenticulina busnardoi LO (BF)Reinharditites fenestratus FO (N)Druggidium apicopaucicum FO (P)
00674.
00721.
00733.00740.00816.
00827.00828.
00829.
00840.
00876.00885.00889.00891.01120.01129.01139.01140.01158.01176.
1319373218121653620Qδ
2647
27
176
193
196
26
60
259
2
155
55
74
71
188
159
190
00160.00326.00368.
00401.00402.00403.
00404.00421.00422.
00444.
00459.00478.
00521.00531.00576.
00611.00648.00660.
00675.00684.
1020
7
21
261
195
8259
157
155
187
257
200
189
163
203
188
71
206
253
00326.
00368.00401.00402.
00403.00404.00421.
00422.00444.
00459.
00478.00521.00531.
00576.00611.
00648.
00660.00675.00684.
20
721
261
195
8259
157
155
187
257
200
189
163
203
188
71
206
253
6. DSDP Leg 77, Hole 535A, Western North Atlantic Ocean.
Depth Number Fossil Name
Ticinella primula FO (PF)Hedbergella planispira FO (PF)Ticinella roberti FO (PF)Phoberocysta neocomica LO (P)Conusphaera mexicana LO (N)Hedbergella trocoidea FO (PF)Odontochitina operculata FO (P)Chiastozygus litterarius FO (N)Cruciellipsis cuvillieri LO (N)Speetonia colligata LO (N)Druggidium rhabdoreticulatum FO (P)Chiastozygus striatus FO (N)Tubodiscus verenae LO (N)Diadorhombus rectus LO (N)Parhabdolithus infinitus FO (N)Tubodiscus verenae FO (N)Lenticulina busnardoi LO (BF)Reinharditites fenestratus FO (N)Druggidium apicopaucicum FO (P)
7. DSDP Leg 50 , Hole 416A, Eastern Atlantic Ocean.
Depth Number Fossil Name
Hedbergella delrioensis FO (PF)Rhagodiscus angustus FO (N)Hedbergella planispira FO (PF)Chiastozygus litterarius FO (N)Lenticulina ouachensis LO (BF)Cruciellipsis cuvillieri LO (N)Epistomina caracolla LO (BF)Dorothia praehauteriviana LO (BF)Tubodiscus verenae LO (N)Trochammina quinqueloba LO (BF)Diadorhombus rectus LO (N)Gavelinella barremiana FO (BF)Lenticulina busnardoi LO (BF)Lenticulina nodosa FO (BF)Epistomina caracolla FO (BF)Rucinolithus wisei LO (N)Dorothia praehauteriviana FO (BF)Lenticulina ouachensis FO (BF)Lenticulina busnardoi FO (BF)Tubodiscus verenae FO (N)Calcicalathina oblongata FO (N)Lithraphidites carniolensis FO (N)Rucinolithus wisei FO (N)Epistomina uhligi LO (BF)Nannoconus colomi FO (N)Cruciellipsis cuvillieri FO (N)Haplophragmium inconstans FO (BF)Conusphaera mexicana FO (N)
8. DSDP Leg 48A, Hole 398D, Eastern Atlantic Ocean.
Depth Number Fossil Name
Eiffellithus eximius FO (N)Ticinella roberti LO (PF)Eiffellithus turriseiffeli FO (N)Ticinella primula FO (PF)Prediscosphaera cretacea FO (N)Hedbergella planispira FO (PF)Hedbergella trocoidea FO (PF)Rhagodiscus angustus FO (N)Lithastrinus floralis FO (N)Nannoconus colomii LO (N)Gavelinella barremiana LO (BF)Chiastozygus litterarius FO (N)Rucinolithus irregularis FO (N)Calcicalathina oblongata LO (N)Nannoconus truitti FO (N)Vagapilla matalosa FO (N)Cruciellipsis cuvillieri LO (N)
00730.
00764.00855.00897.
00900.00982.01118.
01188.01198.
01199.01204.
01222.01303.01361.
01391.
01400.01417.
01459.01531.
01559.01560.01569.01572.01615.01616.01624.
24
176
7157
76
155
57
96
189
88
163
97
71
74
101
185
55
100
70
188
159
171
184
56
173154
67
158
00887.00984.00993.
01250.01311.
01345.
01468.
01487.01571.
01573.01591.01592.
01598.01626.01697.
01706.01716.
16422
165
20
209
7
8
176
193
196
60
157
180
160
197
194
155
776
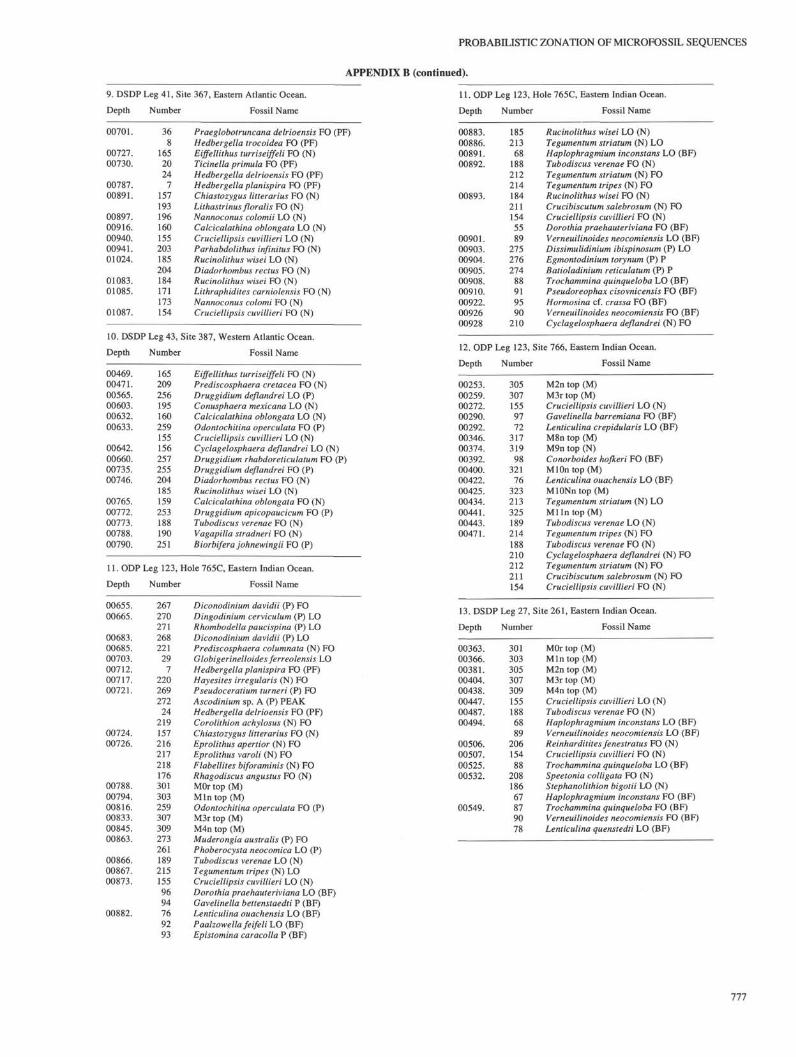
PROBABILISTIC ZONATION OF MICROFOSSIL SEQUENCES
APPENDIX B (continued).
9. DSDP Leg 41, Site 367, Eastern Atlantic Ocean.
Depth Number Fossil Name
00701. 36
00727.00730.
00787.00891.
00897.00916.00940.00941.01024.
01083.01085.
01087.
16520247
157193196160155203185204184171173154
Praeglobotruncana delrioensis FO (PF)Hedbergella trocoidea FO (PF)Eiffellithus turriseiffeli FO (N)Ticinella primula FO (PF)Hedbergella delrioensis FO (PF)Hedbergella planispira FO (PF)Chiastozygus litterarius FO (N)Lithastrinus floralis FO (N)Nannoconus colomii LO (N)Calcicalathina oblongata LO (N)Cruciellipsis cuvillieri LO (N)Parhabdolithus infinitus FO (N)Rucinolithus wisei LO (N)Diadorhombus rectus FO (N)Rucinolithus wisei FO (N)Lithraphidites carniolensis FO (N)Nannoconus colomi FO (N)Cruciellipsis cuvillieri FO (N)
00469.00471.00565.00603.00632.00633.
00642.00660.00735.00746.
00765.00772.00773.00788.00790.
165209256195160259155156257255204185159253188190251
10. DSDP Leg 43, Site 387, Western Atlantic Ocean.
Depth Number Fossil Name
Eiffellithus turriseiffeli FO (N)Prediscosphaera cretacea FO (N)Druggidium deflandrei LO (P)Conusphaera mexicana LO (N)Calcicalathina oblongata LO (N)Odontochitina operculata FO (P)Cruciellipsis cuvillieri LO (N)Cyclagelosphaera deflandrei LO (N)Druggidium rhabdoreticulatum FO (P)Druggidium deflandrei FO (P)Diadorhombus rectus FO (N)Rucinolithus wisei LO (N)Calcicalathina oblongata FO (N)Druggidium apicopaucicum FO (P)Tubodiscus verenae FO (N)Vagapilla stradneri FO (N)Biorbifera johnewingii FO (P)
11. ODP Leg 123, Hole 765C, Eastern Indian Ocean.
Depth Number Fossil Name
Diconodinium davidii (P) FODingodinium cerviculum (P) LORhombodella paucispina (P) LODiconodinium davidii (P) LOPrediscosphaera columnata (N) FOGlobigerinelloides ferreolensis LOHedbergella planispira FO (PF)Hayesites irregularis (N) FOPseudoceratium turneri (P) FOAscodinium sp. A (P) PEAKHedbergella delrioensis FO (PF)Corolithion achylosus (N) FOChiastozygus litterarius FO (N)Eprolithus apertior (N) FOEprolithus varoli (N) FOFlabellites biforaminis (N) FORhagodiscus angustus FO (N)MOr top (M)MIn top (M)Odontochitina operculata FO (P)M3r top (M)M4n top (M)Muderongia australis (P) FOPhoberocysta neocomica LO (P)Tubodiscus verenae LO (N)Tegumentum tripes (N) LOCruciellipsis cuvillieri LO (N)Dorothia praehauteriviana LO (BF)Gavelinella bettenstaedti P (BF)Lenticulina ouachensis LO (BF)Paalzowellafeifeli LO (BF)Epistomina caracolla P (BF)
00655.00665.
00683.00685.00703.00712.00717.00721.
00724.00726.
00788.00794.00816.00833.00845.00863.
00866.00867.00873.
00882.
267270271268221
297
220269272
242191572162172181763013032593073092732611892151559694769293
11. ODP Leg 123, Hole 765C, Eastern Indian Ocean.
Depth Number Fossil Name
Rucinolithus wisei LO (N)Tegumentum striatum (N) LOHaplophragmium inconstans LO (BF)Tubodiscus verenae FO (N)Tegumentum striatum (N) FOTegumentum tripes (N) FORucinolithus wisei FO (N)Crucibiscutum salebrosum (N) FOCruciellipsis cuvillieri FO (N)Dorothia praehauteriviana FO (BF)Verneuilinoides neocomiensis LO (BF)Dissimulidinium ibispinosum (P) LOEgmontodinium torynum (P) PBatioladinium reticulatum (P) PTrochammina quinqueloba LO (BF)Pseudoreophax cisovnicensis FO (BF)Hormosina cf. crassa FO (BF)Verneuilinoides neocomiensis FO (BF)Cyclagelosphaera deflandrei (N) FO
12. ODP Leg 123, Site 766, Eastern Indian Ocean.
Depth Number Fossil Name
00883.00886.00891.00892.
00893.
00901.00903.00904.00905.00908.00910.00922.0092600928
185213
681882122141842111545589
275276274
88919590
210
00253.00259.00272.00290.00292.00346.00374.00392.00400.00422.00425.00434.00441.00443.00471.
3053071559772
317319
98321
76323213325189214188210212211154
M2n top (M)M3r top (M)Cruciellipsis cuvillieri LO (N)Gavelinella barremiana FO (BF)Lenticulina crepidularis LO (BF)M8n top (M)M9n top (N)Conorboides hofkeri FO (BF)MlOntop(M)Lenticulina ouachensis LO (BF)MlONntop(M)Tegumentum striatum (N) LOMllntop(M)Tubodiscus verenae LO (N)Tegumentum tripes (N) FOTubodiscus verenae FO (N)Cyclagelosphaera deflandrei (N) FOTegumentum striatum (N) FOCrucibiscutum salebrosum (N) FOCruciellipsis cuvillieri FO (N)
13. DSDP Leg 27, Site 261, Eastern Indian Ocean.
Depth Number Fossil Name
MOr top (M)MIn top (M)M2n top (M)M3r top (M)M4n top (M)Cruciellipsis cuvillieri LO (N)Tubodiscus verenae FO (N)Haplophragmium inconstans LO (BF)Verneuilinoides neocomiensis LO (BF)Reinharditites fenestratus FO (N)Cruciellipsis cuvillieri FO (N)Trochammina quinqueloba LO (BF)Speetonia colligata FO (N)Stephanolithion bigotii LO (N)Haplophragmium inconstans FO (BF)Trochammina quinqueloba FO (BF)Verneuilinoides neocomiensis FO (BF)Lenticulina quenstedti LO (BF)
00363.00366.00381.00404.00438.00447.00487.00494.
00506.00507.00525.00532.
00549.
3013033053073091551886889
20615488
20818667879078
777
Related Documents


