American Solar Challenge 2003 Structural Report Team Lux – Yale University Prepared by David Johnson Introduction This report details the construction and safety features behind The John Lee, Yale University’s 2003 entry into the American Solar Challenge. The vehicle is designed to be as light and robust as possible. It is important to note that since many of the systems analyzed in this vehicle use the same materials, the entire materials library for the vehicle is located in Appendix C – Global Assumptions. Mechanical Systems Analysis • Front Suspension The front suspension of The John Lee mounts a single front wheel using an upright and two A-arms (see Figure 1 below). An in-wheel motor manufactured by NGM is bolted to the upright using an aluminum threaded ring and 5 1/4”-20 cap screws. The rim is attached to the motor via 5 pins and a 3.7” diameter-locking ring. The system is sprung via a 6.5” maximum extension Rock Shox SID Rear Race air shock absorber (see Figure 2 below). The main structural member is an aluminum box beam that forms the upright. The A arms are formed from welded titanium tubing. The titanium was welded by a professional welder at Sikorsky Aircraft Company using 6-4 Ti welding rod. The weld used Argon front-side and back-side shielding to prevent oxidation. The welds were visually inspected after completion to verify that no white discoloration of the metal had occurred, which would signal oxidation. The aluminum box beam was welded by a professional welder in the Chemistry Department at Yale. Material Specifications The upright is manufactured from welded 1/8” thick 7075 T6 aluminum plate. The material properties for all 7075 T6 aluminum used in the car are given in Appendix C – Global Assumptions. The A-arms are manufactured from 6-4 titanium alloy and 3-2.5 titanium alloy. Their main structures are 3-2.5 Ti 1.25” O.D. tubes with 0.045” wall thickness. The shock mount and the end plugs into which the rod ends are threaded are manufactured from 6-4 Ti. The specifications for these materials are given in Appendix C. The rod ends used in the front suspension are manufactured by Alinabal from 4130 CrMo steel. The rod ends attaching the A arms to the frame have a 0.500” shaft diameter with a maximum load rating of 10,000 lbs. The rod ends attaching the A arms to the upright have a 0.625” shaft diameter with a maximum load rating of 11,000 lbs. Loading Conditions The suspension was loaded using a 3G (where G refers to the weight suspended by that wheel) vertical load, a 2G fore-aft load, and a 1G lateral turning load. The front suspension is designed to handle 40-50% of the vehicle weight, so the G used in the analysis was 250lbs (see “Weight” in Appendix C for itemized component weights to verify the overall mass of the vehicle is less than or equal to 500lbs). Finally during heavy turns a torque of ~10in*G (the ‘10’ is based on the wheel radius) is induced.

Welcome message from author
This document is posted to help you gain knowledge. Please leave a comment to let me know what you think about it! Share it to your friends and learn new things together.
Transcript
American Solar Challenge 2003 Structural Report Team Lux – Yale University Prepared by David Johnson
Introduction This report details the construction and safety features behind The John Lee, Yale
University’s 2003 entry into the American Solar Challenge. The vehicle is designed to be as light and robust as possible.
It is important to note that since many of the systems analyzed in this vehicle use the same materials, the entire materials library for the vehicle is located in Appendix C – Global Assumptions.
Mechanical Systems Analysis • Front Suspension
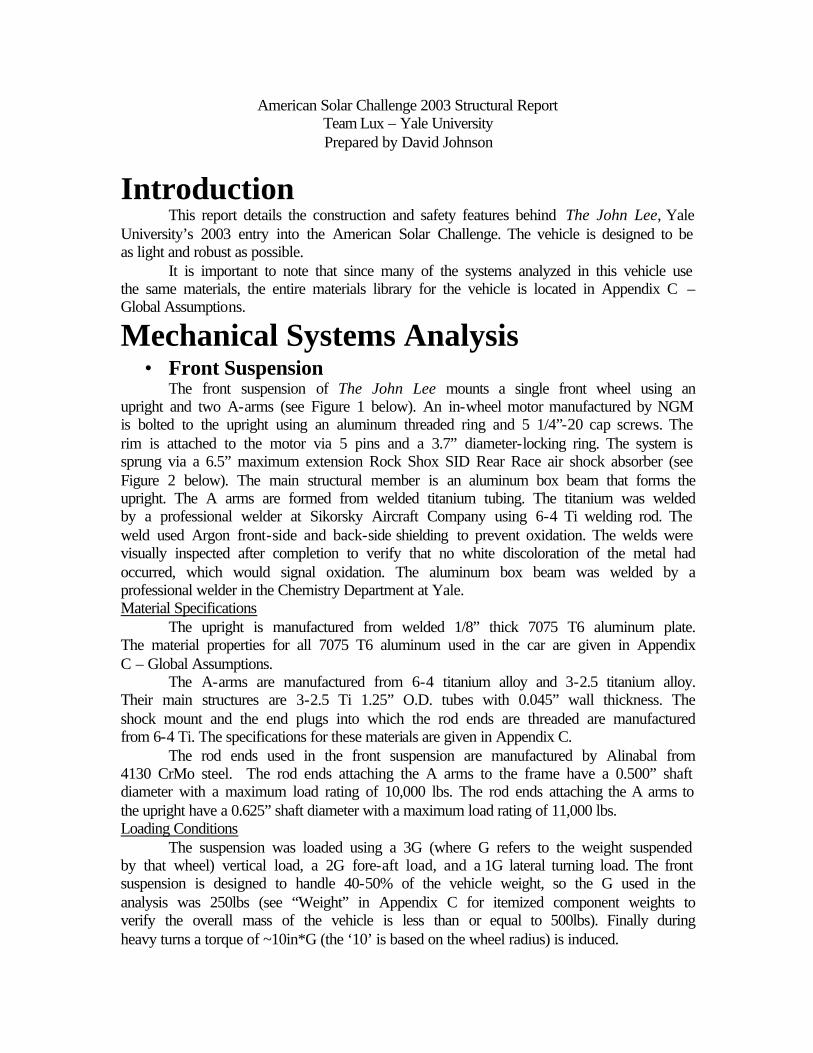
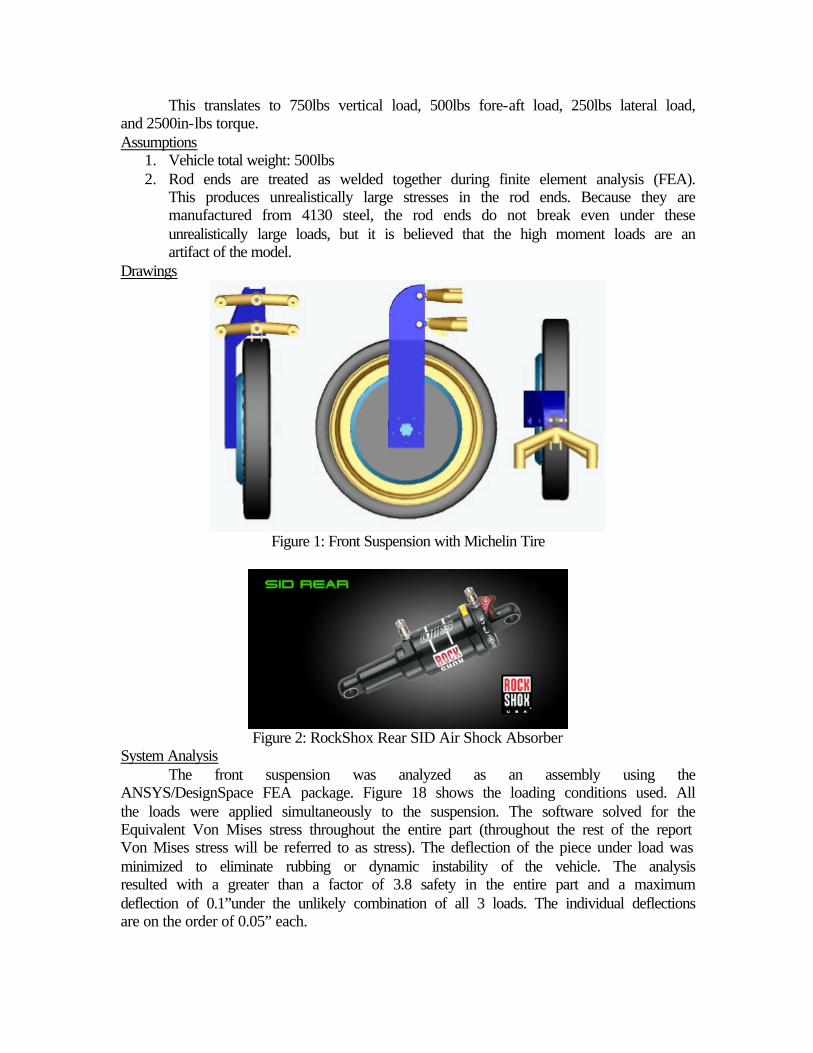
The front suspension of The John Lee mounts a single front wheel using an upright and two A-arms (see Figure 1 below). An in-wheel motor manufactured by NGM is bolted to the upright using an aluminum threaded ring and 5 1/4”-20 cap screws. The rim is attached to the motor via 5 pins and a 3.7” diameter-locking ring. The system is sprung via a 6.5” maximum extension Rock Shox SID Rear Race air shock absorber (see Figure 2 below). The main structural member is an aluminum box beam that forms the upright. The A arms are formed from welded titanium tubing. The titanium was welded by a professional welder at Sikorsky Aircraft Company using 6-4 Ti welding rod. The weld used Argon front-side and back-side shielding to prevent oxidation. The welds were visually inspected after completion to verify that no white discoloration of the metal had occurred, which would signal oxidation. The aluminum box beam was welded by a professional welder in the Chemistry Department at Yale. Material Specifications
The upright is manufactured from welded 1/8” thick 7075 T6 aluminum plate. The material properties for all 7075 T6 aluminum used in the car are given in Appendix C – Global Assumptions.
The A-arms are manufactured from 6-4 titanium alloy and 3-2.5 titanium alloy. Their main structures are 3-2.5 Ti 1.25” O.D. tubes with 0.045” wall thickness. The shock mount and the end plugs into which the rod ends are threaded are manufactured from 6-4 Ti. The specifications for these materials are given in Appendix C.
The rod ends used in the front suspension are manufactured by Alinabal from 4130 CrMo steel. The rod ends attaching the A arms to the frame have a 0.500” shaft diameter with a maximum load rating of 10,000 lbs. The rod ends attaching the A arms to the upright have a 0.625” shaft diameter with a maximum load rating of 11,000 lbs. Loading Conditions
The suspension was loaded using a 3G (where G refers to the weight suspended by that wheel) vertical load, a 2G fore-aft load, and a 1G lateral turning load. The front suspension is designed to handle 40-50% of the vehicle weight, so the G used in the analysis was 250lbs (see “Weight” in Appendix C for itemized component weights to verify the overall mass of the vehicle is less than or equal to 500lbs). Finally during heavy turns a torque of ~10in*G (the ‘10’ is based on the wheel radius) is induced.
This translates to 750lbs vertical load, 500lbs fore-aft load, 250lbs lateral load, and 2500in-lbs torque. Assumptions
1. Vehicle total weight: 500lbs 2. Rod ends are treated as welded together during finite element analysis (FEA).
This produces unrealistically large stresses in the rod ends. Because they are manufactured from 4130 steel, the rod ends do not break even under these unrealistically large loads, but it is believed that the high moment loads are an artifact of the model.
Drawings
Figure 1: Front Suspension with Michelin Tire
Figure 2: RockShox Rear SID Air Shock Absorber
System Analysis The front suspension was analyzed as an assembly using the
ANSYS/DesignSpace FEA package. Figure 18 shows the loading conditions used. All the loads were applied simultaneously to the suspension. The software solved for the Equivalent Von Mises stress throughout the entire part (throughout the rest of the report Von Mises stress will be referred to as stress). The deflection of the piece under load was minimized to eliminate rubbing or dynamic instability of the vehicle. The analysis resulted with a greater than a factor of 3.8 safety in the entire part and a maximum deflection of 0.1”under the unlikely combination of all 3 loads. The individual deflections are on the order of 0.05” each.
Based on the titanium fatigue limit of 60ksi, the front A arms are well within specification and will not fail due to fatigue. Conclusions
The results of the analysis are found in Figures 19, 20 and 21. The first shows the deflection of the component under the loads assumed as stated above. The second picture shows the stress level in the part, and the third picture charts the safety factor in the part. The analysis shows that the minimum safety factor in the part is 3.8 and the maximum deflection is 0.1”. These will provide for the safe operation of the vehicle.
• Rear Suspension The John Lee uses trailing arms for its two rear wheels. These wheels do not steer
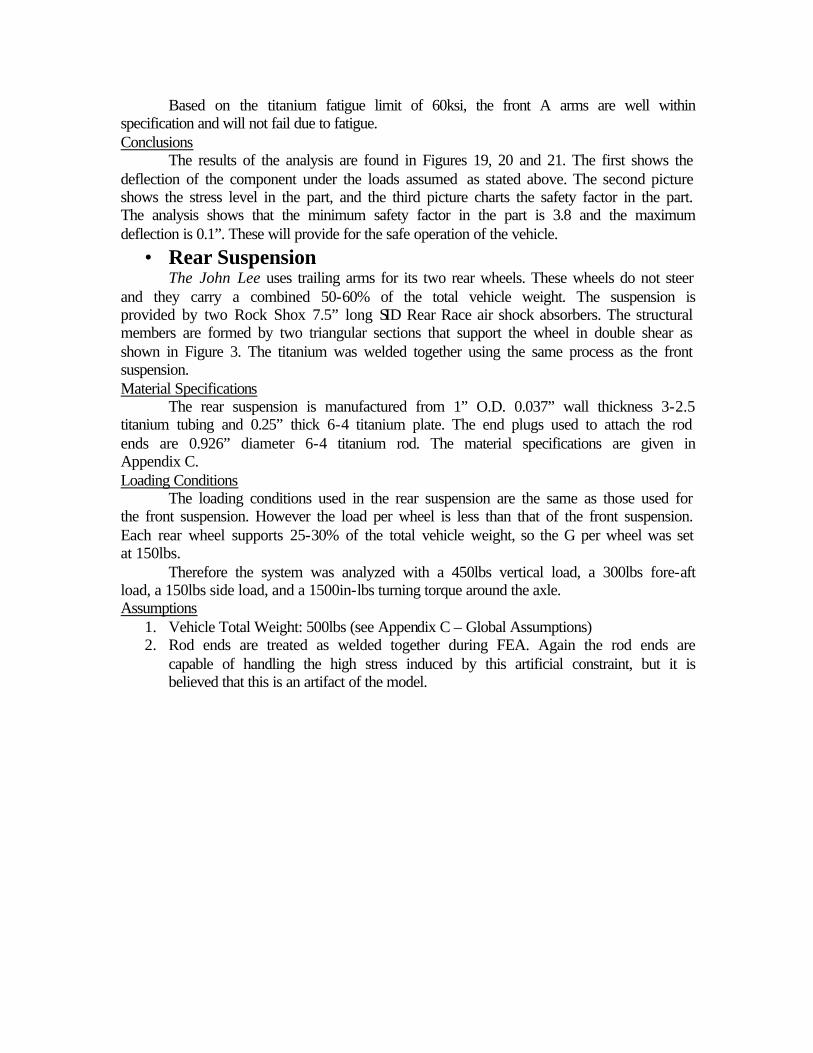
and they carry a combined 50-60% of the total vehicle weight. The suspension is provided by two Rock Shox 7.5” long SID Rear Race air shock absorbers. The structural members are formed by two triangular sections that support the wheel in double shear as shown in Figure 3. The titanium was welded together using the same process as the front suspension. Material Specifications
The rear suspension is manufactured from 1” O.D. 0.037” wall thickness 3-2.5 titanium tubing and 0.25” thick 6-4 titanium plate. The end plugs used to attach the rod ends are 0.926” diameter 6-4 titanium rod. The material specifications are given in Appendix C. Loading Conditions
The loading conditions used in the rear suspension are the same as those used for the front suspension. However the load per wheel is less than that of the front suspension. Each rear wheel supports 25-30% of the total vehicle weight, so the G per wheel was set at 150lbs.
Therefore the system was analyzed with a 450lbs vertical load, a 300lbs fore-aft load, a 150lbs side load, and a 1500in-lbs turning torque around the axle. Assumptions
1. Vehicle Total Weight: 500lbs (see Appendix C – Global Assumptions) 2. Rod ends are treated as welded together during FEA. Again the rod ends are
capable of handling the high stress induced by this artificial constraint, but it is believed that this is an artifact of the model.
Drawings
Figure 3: Rear Suspension Views
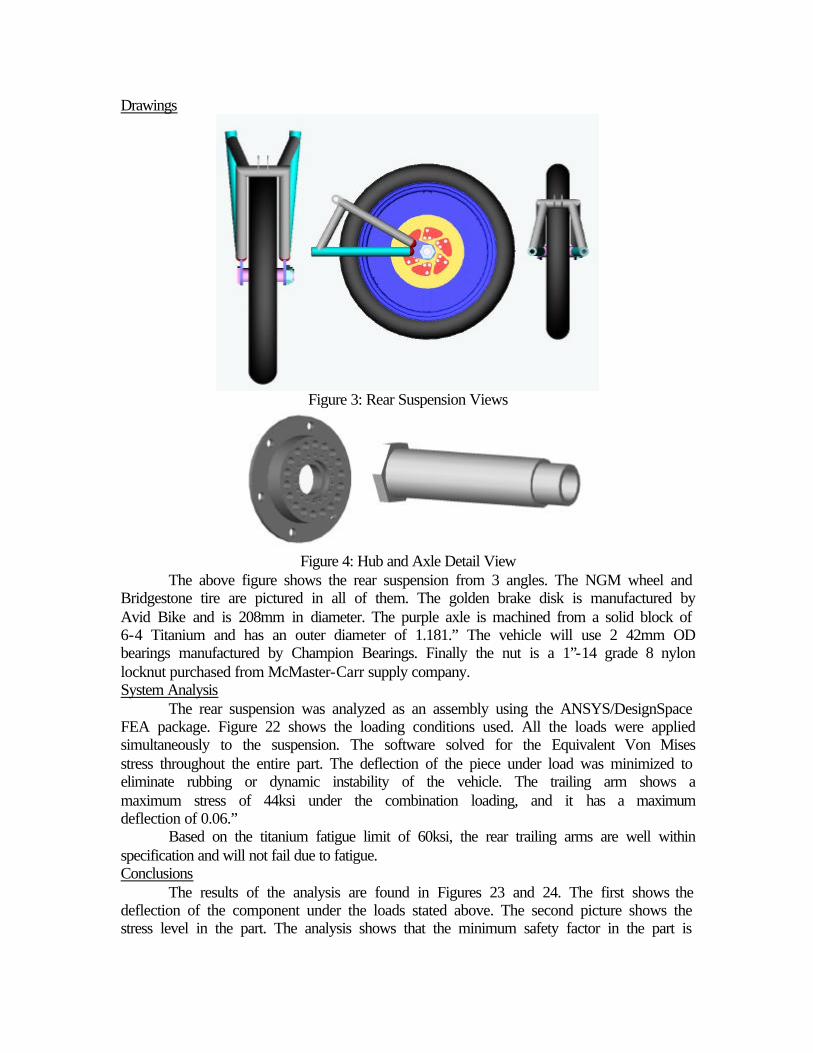
Figure 4: Hub and Axle Detail View
The above figure shows the rear suspension from 3 angles. The NGM wheel and Bridgestone tire are pictured in all of them. The golden brake disk is manufactured by Avid Bike and is 208mm in diameter. The purple axle is machined from a solid block of 6-4 Titanium and has an outer diameter of 1.181.” The vehicle will use 2 42mm OD bearings manufactured by Champion Bearings. Finally the nut is a 1”-14 grade 8 nylon locknut purchased from McMaster-Carr supply company. System Analysis
The rear suspension was analyzed as an assembly using the ANSYS/DesignSpace FEA package. Figure 22 shows the loading conditions used. All the loads were applied simultaneously to the suspension. The software solved for the Equivalent Von Mises stress throughout the entire part. The deflection of the piece under load was minimized to eliminate rubbing or dynamic instability of the vehicle. The trailing arm shows a maximum stress of 44ksi under the combination loading, and it has a maximum deflection of 0.06.”
Based on the titanium fatigue limit of 60ksi, the rear trailing arms are well within specification and will not fail due to fatigue. Conclusions
The results of the analysis are found in Figures 23 and 24. The first shows the deflection of the component under the loads stated above. The second picture shows the stress level in the part. The analysis shows that the minimum safety factor in the part is
2.4 and the maximum deflection is 0.06”. These will provide for the safe operation of the vehicle.
• Brakes The John Lee uses Avid MTB mechanical disk brakes on the two rear wheels and an
Avid Arch Rival rim brake in the front. The vehicle is also equipped with a regenerative braking system on the front wheel. In normal operation it is expected that the majority of the braking will occur using the front wheel regenerative brake. However, the mechanical braking system is capable of meeting the braking requirement in the 2003 ASC regulations.
In order to have a balanced dual independent braking system, the front/rear braking systems run on different cables. One pull of the brake lever produces equal travel in both braking systems. Material Specifications
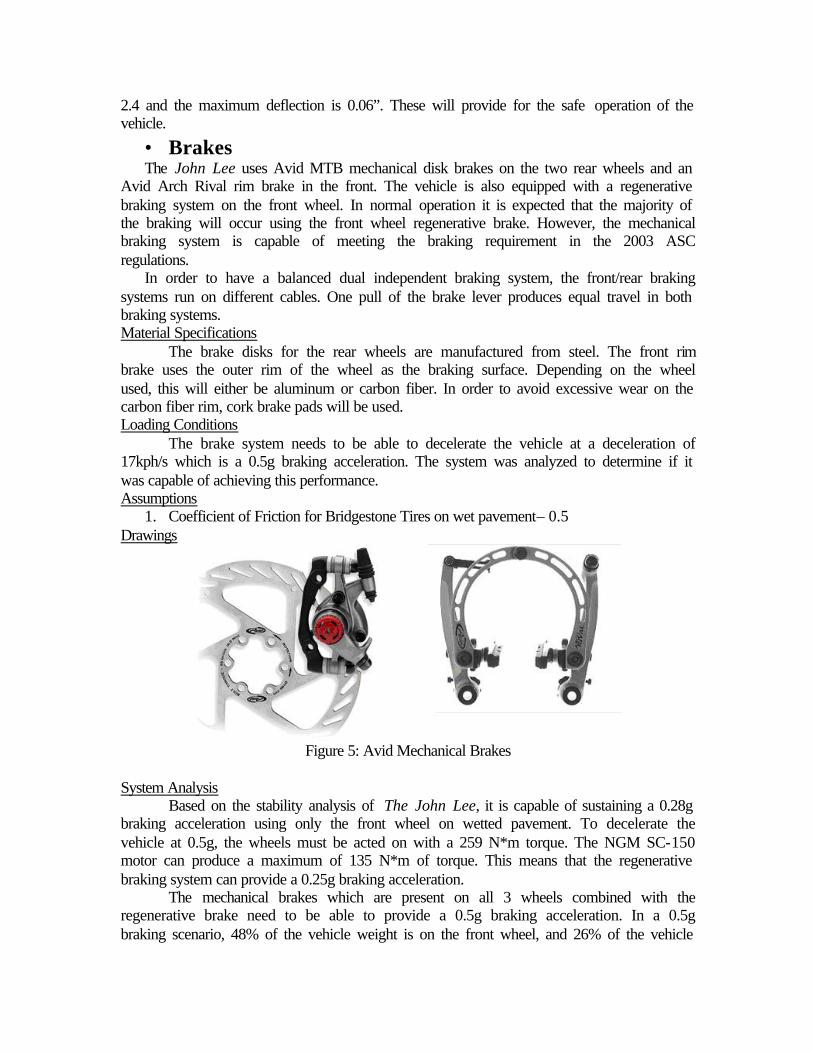
The brake disks for the rear wheels are manufactured from steel. The front rim brake uses the outer rim of the wheel as the braking surface. Depending on the wheel used, this will either be aluminum or carbon fiber. In order to avoid excessive wear on the carbon fiber rim, cork brake pads will be used. Loading Conditions
The brake system needs to be able to decelerate the vehicle at a deceleration of 17kph/s which is a 0.5g braking acceleration. The system was analyzed to determine if it was capable of achieving this performance. Assumptions
1. Coefficient of Friction for Bridgestone Tires on wet pavement– 0.5 Drawings
Figure 5: Avid Mechanical Brakes
System Analysis
Based on the stability analysis of The John Lee, it is capable of sustaining a 0.28g braking acceleration using only the front wheel on wetted pavement. To decelerate the vehicle at 0.5g, the wheels must be acted on with a 259 N*m torque. The NGM SC-150 motor can produce a maximum of 135 N*m of torque. This means that the regenerative braking system can provide a 0.25g braking acceleration.
The mechanical brakes which are present on all 3 wheels combined with the regenerative brake need to be able to provide a 0.5g braking acceleration. In a 0.5g braking scenario, 48% of the vehicle weight is on the front wheel, and 26% of the vehicle
weight is on each of the rear wheels. This means that the rear wheels can contribute a total of 0.26g braking acceleration before the wheels start to skid. The Avid disk brakes can provide ~550N of deceleration each. This allows for a total of 0.5g of braking. However the tires will not handle it, so this leaves 0.24g that the front wheel has to provide. This is within the range of the NGM regenerative braking, and it is also within the 0.25g range of the front mechanical brake. Conclusions
The braking system can safely decelerate the vehicle to meet the requirement set in regulation 6.12.1. This is assuming a coefficient of friction of 0.5 and the results improve as this number increases.
• Steering Material Specifications
The steering arms are manufactured from 7075 T6 aluminum. See Appendix C for the specifications of this material.
The rod ends used in the coupling mechanism are manufactured by Alinabal from aluminum and have a shank diameter of 0.375”. They have a maximum load rating of 3230lbs.
The aluminum tubes used in the steering linkage are composed of 3003 aluminum with a 1” OD and0.045” wall. They have a column buckling maximum load greater than 300lbs each. This far exceeds the 50lbs estimated load produced by the steering apparatus. Loading Conditions
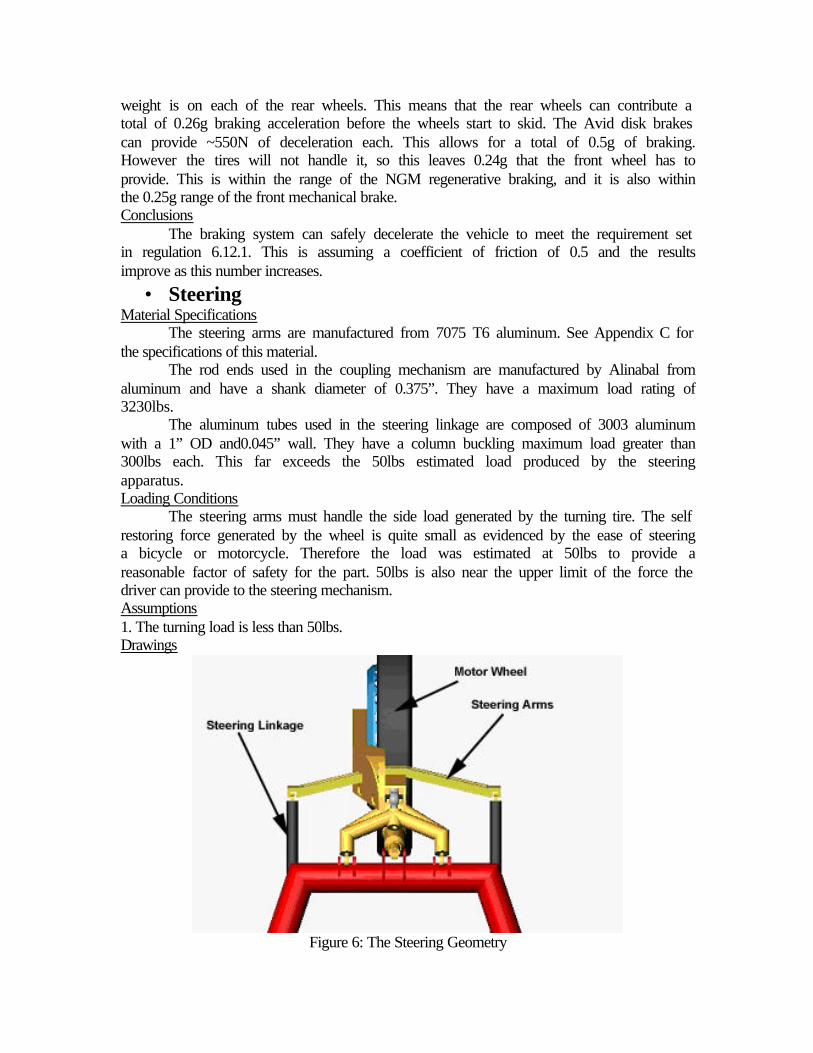
The steering arms must handle the side load generated by the turning tire. The self restoring force generated by the wheel is quite small as evidenced by the ease of steering a bicycle or motorcycle. Therefore the load was estimated at 50lbs to provide a reasonable factor of safety for the part. 50lbs is also near the upper limit of the force the driver can provide to the steering mechanism. Assumptions 1. The turning load is less than 50lbs. Drawings
Figure 6: The Steering Geometry
System Analysis The steering arms were analyzed using DesignSpace to determine if they could handle the 50lbs turning load. The results show a factor of 3 safety in the part on this very high estimate of the load. See Figure 25 for the loading conditions in the FEA model. See Figures 26 and 27 for the maximum deformation and the stress distribution in the part. Conclusions
Based on the results of the FEA and the column buckling strength of the tubes, the steering system is more than strong enough to handle the turning forces caused by the vehicle.
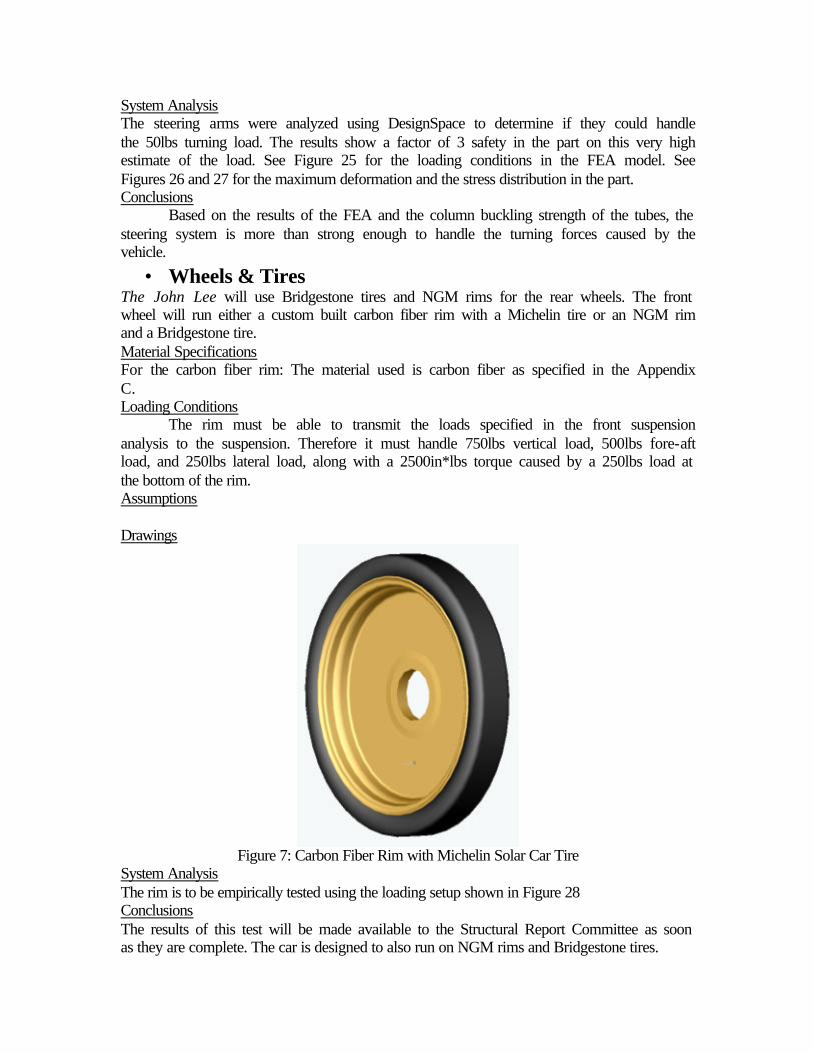
• Wheels & Tires The John Lee will use Bridgestone tires and NGM rims for the rear wheels. The front wheel will run either a custom built carbon fiber rim with a Michelin tire or an NGM rim and a Bridgestone tire. Material Specifications For the carbon fiber rim: The material used is carbon fiber as specified in the Appendix C. Loading Conditions
The rim must be able to transmit the loads specified in the front suspension analysis to the suspension. Therefore it must handle 750lbs vertical load, 500lbs fore-aft load, and 250lbs lateral load, along with a 2500in*lbs torque caused by a 250lbs load at the bottom of the rim. Assumptions Drawings
Figure 7: Carbon Fiber Rim with Michelin Solar Car Tire
System Analysis The rim is to be empirically tested using the loading setup shown in Figure 28 Conclusions The results of this test will be made available to the Structural Report Committee as soon as they are complete. The car is designed to also run on NGM rims and Bridgestone tires.
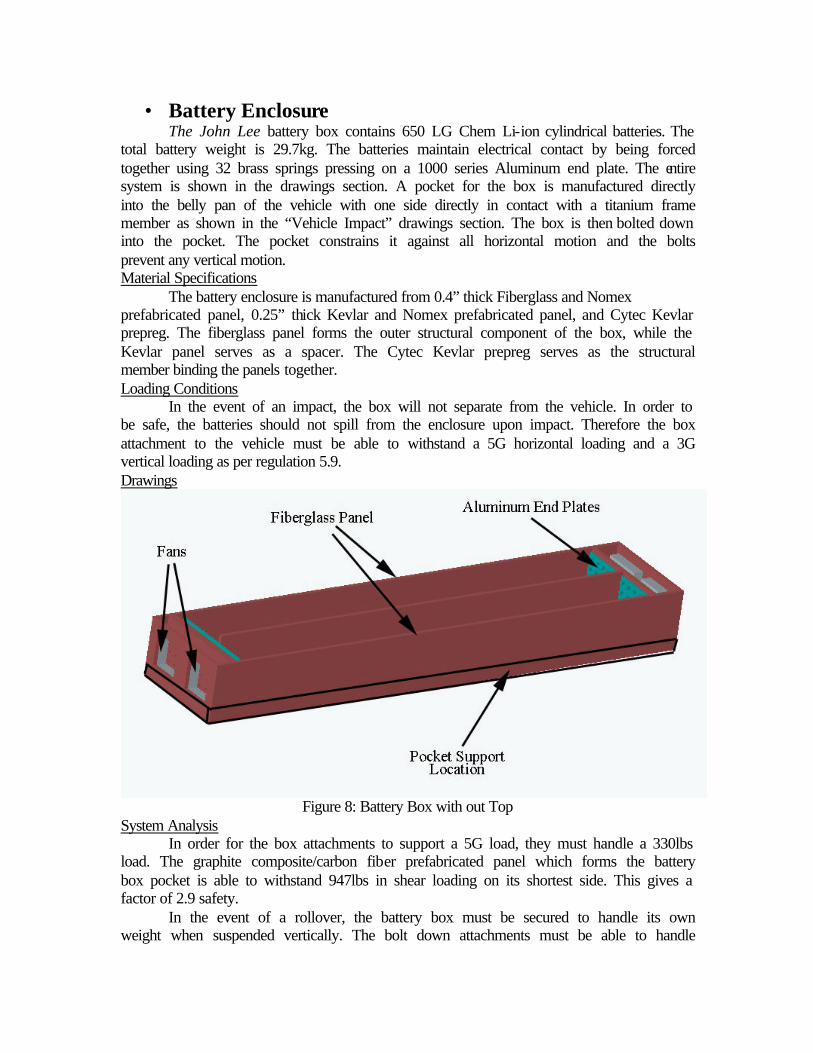
• Battery Enclosure The John Lee battery box contains 650 LG Chem Li-ion cylindrical batteries. The
total battery weight is 29.7kg. The batteries maintain electrical contact by being forced together using 32 brass springs pressing on a 1000 series Aluminum end plate. The entire system is shown in the drawings section. A pocket for the box is manufactured directly into the belly pan of the vehicle with one side directly in contact with a titanium frame member as shown in the “Vehicle Impact” drawings section. The box is then bolted down into the pocket. The pocket constrains it against all horizontal motion and the bolts prevent any vertical motion. Material Specifications
The battery enclosure is manufactured from 0.4” thick Fiberglass and Nomex prefabricated panel, 0.25” thick Kevlar and Nomex prefabricated panel, and Cytec Kevlar prepreg. The fiberglass panel forms the outer structural component of the box, while the Kevlar panel serves as a spacer. The Cytec Kevlar prepreg serves as the structural member binding the panels together. Loading Conditions
In the event of an impact, the box will not separate from the vehicle. In order to be safe, the batteries should not spill from the enclosure upon impact. Therefore the box attachment to the vehicle must be able to withstand a 5G horizontal loading and a 3G vertical loading as per regulation 5.9. Drawings
Figure 8: Battery Box with out Top
System Analysis In order for the box attachments to support a 5G load, they must handle a 330lbs
load. The graphite composite/carbon fiber prefabricated panel which forms the battery box pocket is able to withstand 947lbs in shear loading on its shortest side. This gives a factor of 2.9 safety.
In the event of a rollover, the battery box must be secured to handle its own weight when suspended vertically. The bolt down attachments must be able to handle
66lbs divided between them. The bolt down attachment inserts into the carbon fiber have a combined surface area of 4in^2 which gives a pullout strength of 2400lbs total. Conclusions The battery box will not separate in an accident or rollover.
• Suspension Mount Points The strength of the suspension brackets was analyzed using ANSYS/DesignSpace. Material Specifications The suspension components are attached to the frame using brackets machined from 0.25” thick 6-4 Titanium plate. Loading Conditions The loading conditions are suspension loads as used before. They are shown in Figures 29 and 32. Assumptions
1. The vehicle weight is under 500lbs. 2. The frame members are fixed when in reality they are attached to a moving
vehicle. This causes the loads found in the analysis to he higher than those in reality because the car is allowed to move under load.
System Analysis The results of the front suspension mount point analysis are given in Figures 30
and 31. The maximum deformation of the front suspension mount brackets is 0.04,” and the minimum safety factor is 3.9. In the rear suspension, the minimum safety factor is 2.44, which is shown in Figure 33. It should be noted that the safety factor increases as the amount of tube included in the model increases. This is because the load reduces when it has more material to be sheared into. The entire frame was not included in the model due to computational power limitations. A rough estimate of the safety factor of the entire frame is a ratio of half the length of the rear tube to the length included in the analysis multiplied by the minimum safety factor. This accounts for the possibility that both suspensions could be loaded at the same time, and thus only half the over all tube length is used. This gives a minimum safety factor of 3.66. Conclusions
These results show that the suspension brackets are in no danger of breaking due to suspension loading. This is an especially important aspect of the vehicle safety as it has been shown to have been a critical failing point of vehicles in the past.
Vehicle Impact • Specifications The John Lee’s main structural members are formed from 2.5” O.D. 0.037” thick wall
3-2.5 Titanium tubes wrapped with 3 plies of AGP370-5H/3501-6 Hexcel Carbon Fiber arranged in a 0°/120°/60° wrap. The details of the material are available in Appendix C – Global Assumptions under “Carbon Fiber.” The vehicle’s members are arranged in an isosceles triangle with the major vertex facing forward. Each of the 3 wheels is mounted at a vertex of the triangle. The front wheel is the only steering wheel and it is also the drive wheel. The suspension components are attached to the frame using brackets machined from 0.25” thick 6-4 Titanium plate. These brackets are welded onto the frame tubing before it is wrapped in carbon fiber. The frame is permanently bonded to the bottom of the vehicle at the same time that it is wrapped in carbon fiber. The wrapping
serves the double purpose of strengthening the tube and structurally bonding the titanium frame the underbelly of the vehicle.
The bonding process used to attach the frame to the body is structurally identical to that used by Sikorsky Aircraft Company in the construction of their composite helicopter blades. Before bonding the titanium is cleaned and primed using the same process as used in manufacturing helicopter blades in order to promote an excellent bond with the composites. This process allows for the members to be analyzed as one structural member.
To add additional protection in the case of a rear impact, structural core material, either Nomex or Rohacell foam, will be bonded between the two rear roll cage support tubes to provide compressive support. These core materials have impressively high compressive strengths and the impact is spread over a large area, so the load is very effectively transmitted to the main frame structure.
Driver restraint is accomplished by a Simpson 5 point racing harness. The shoulder harness and lap belts are secured to brackets mounted in the carbon fiber wrap around the titanium frame tubes, or if possible, cinched directly around the tubes themselves. The groin belt is attached to a bracket mounted directly into the belly pan of the vehicle.
The outer shell of the vehicle is of composite construction. The upper shell is composed of 2 layers of Cytec Kevlar prepreg bonded on either side of 0.3125” thick Nomex core. The shell is supported with carbon fiber prefabricated panel ribs. The lower shell is made using two layers of Hexcel carbon fiber prepreg bonded on either side of 0.4” thick Nomex core. The windshield is permanently bonded to the upper shell and is composed of shatter resistant 0.09” thick polycarbonate, tinted to block UV and bright sun.
The ballast carrier is a pocket laid into the composite shell of the left fairing. The ballast will be securely bolted into the pocket to prevent any horizontal or vertical motion. The purpose of placing the ballast in the fairing is to lower the vehicle’s center of mass to increase its drivability and braking performance. The fairing is structurally attached to the body of the vehicle via two bolts and a composite ring. The bolts are rated at 10,000lbs shear load total, so they will not fail due to loading from the ballast. The pullout strength of the bolt inserts is 600lbs each. Thus the ballast is firmly attached to the vehicle.
• Drawings Structural Components of the Vehicle

1. Top View
Figure 9: Top View of Vehicle with all major components
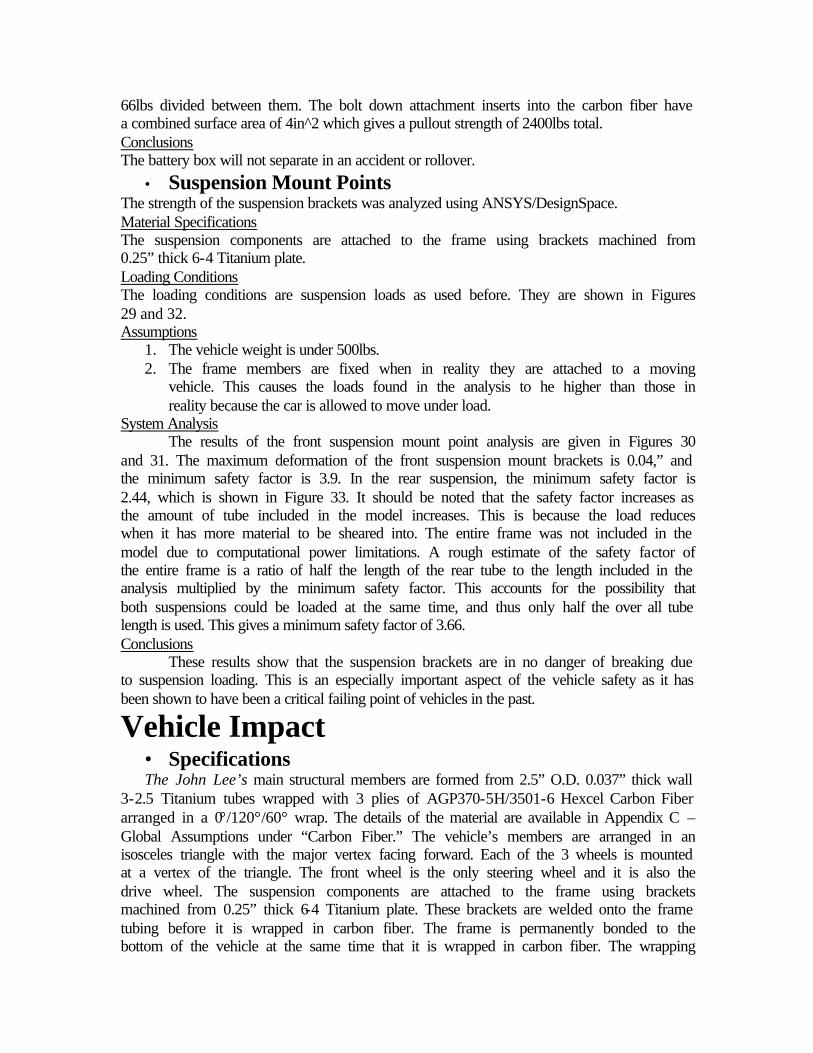
2. Front View
Figure 10: Front View of the Vehicle Showing Structural Members
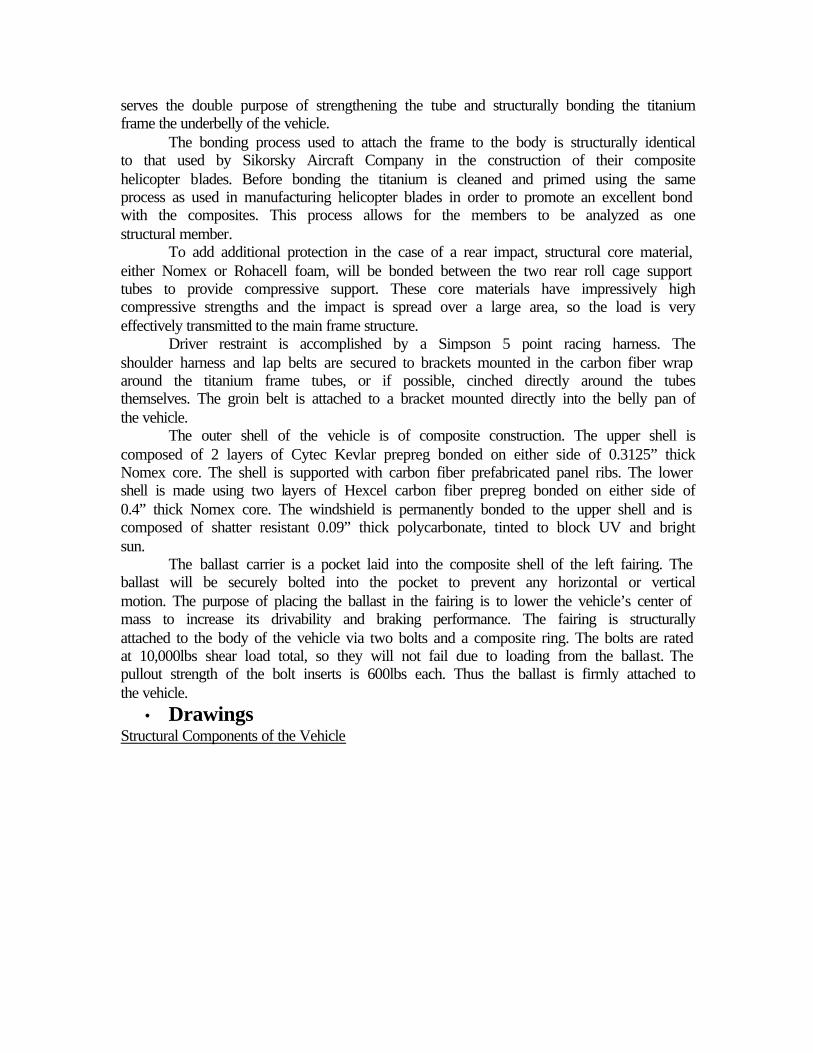
3. Side View
Figure 11: Side View of the Vehicle Showing Structural Members
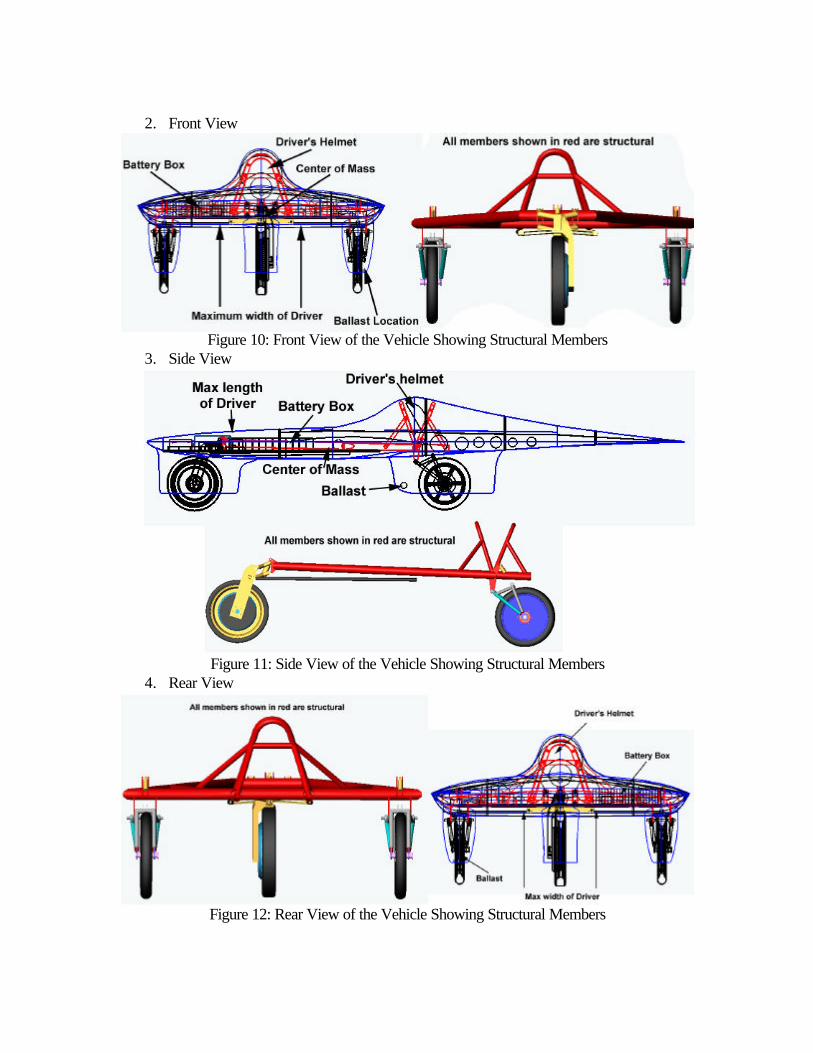
4. Rear View
Figure 12: Rear View of the Vehicle Showing Structural Members

5. Isometric View
Figure 13: ISO View of the Vehicle
Diver’s Compartment 1. Top View
Figure 14: Top View of Driver’s Compartment

2. Front View
Figure 15: Front View of Driver’s Compartment
3. Side View
Figure 16: Side View of Driver’s Compartment
Isometric Drawing of the Body and Solar Array
Figure 17: ISO View of the Vehicle with Solar Array
• Analysis The impact analysis of the vehicle was performed using a beam model in ANSYS.
The stiffening affect of the bottom of the vehicle being bound to the bottom of the frame was not included in this analysis. Therefore this is a worst case effect of the loads. The frame of The John Lee is located sufficiently high off the ground that the 35cm bumper height stated in the structural report instructions passes completely beneath the vehicle. Therefore all analysis has been done assuming a 45cm high bumper. This represents the height of bumpers on many SUVs and the grill on other vehicles.
It is important to consider the implications of having a bumper impact beneath the frame of the vehicle. In a head on collision with a low bumper vehicle such as a sports car, it is possible that the solar car would ride up on top of the other vehicle’s hood. In a head on collision this is severely mitigated by the presence of the front suspension as the forward-most component of the vehicle. The front suspension is very strong in a head on impact. Its analysis showed a minimum factor of 4 safety in a 500lbs fore-aft load. This translates to being able to withstand a 2000lbs fore-aft load before yielding. The ultimate strength of the material increases its ultimate load tolerance to 2380lbs at minimum. Therefore a significant portion of the load, if not all of it, will be directed into the frame, preventing the vehicle from riding up on the hood of the sports car. Similar protection exists in the rear from the rear suspension.
Should the accident involve a side impact, we must consider the unlikely event that the vehicle does ride up on the impacting vehicle’s hood. In this case the carbon fiber underbelly must carry the full weight of the solar car. In this area, the carbon fiber underbelly is specifically reinforced to handle the driver’s weight. Because it is structurally attached to the frame via the carbon fiber wrapping, the underbelly can support an estimated 1250lbs load distributed across the bottom of the driver compartment. This translates to supporting the full weight of the driver with a factor of 7 safety, and by extension the full weight of The John Lee with a factor of 2.5 safety.
In performing the impact analysis, the in-plane loads were considered directly and applied to the frame. The ANSYS beam model shows greater than a factor of 2 safety in all of the in-plane impact scenarios. To determine the safety of the out-of-plane loads, the worst case scenario was considered. The load was taken at 90º with respect to the bottom plane of the car. This is the worst roll case with a completely out-of-plane load. These were analyzed for all nodes that would normally take load in a roll over accident. Combining the results of the completely out-of-plane loads and the in-plane loads we know that an impact can at most produce the sum of these two load vectors (and given the load requirement of 3G on the intermediate loads, it will be far less than the sum). Because even the sum of these loads is within the factor of safety, we see that the frame passes the loading requirements for any intermediate impact between horizontal and vertical impact.
The roll cage was analyzed separately from the frame. The 5 loading scenarios are shown for the fore and aft roll cage (two intermediates between horizontal and vertical for a forward roll, two intermediates between horizontal and vertical for a side roll, and vertical). The parts pass with a factor of 1.9 safety.
The impact analysis results show greater than a factor of 1.9 safety in all collisions. This is acceptable given the additional strength given by vehicle ribs and the belly pan of the vehicle, and that only one roll cage was considered in each analysis and

in most scenarios, both will contribute to the protection of the driver. The results are organized in Appendix B. In the case of rear impact, a structural core material bonded to the frame and belly pan of the vehicle will transmit the load directly to the frame, while keeping the impacting vehicle away from the driver’s head. Either Nomex with a crush strength of 95psi or Rohacell 31A foam with a crush strength of 58psi will be used. The impact is spread over an area of 48in^2 which gives the Nomex a load capability of 4560lbs and the Rohacell a load capability of 2800lbs. Combined with the titanium spars present in the rear, this provides more than enough structure to effectively transmit the load to the rear spar as is analyzed in the ANSYS model.
During impact the driver’s restraints will be required to handle an acceleration comparable to that handled by the frame. This means that the driver’s restraints must at worst handle a 5G load, where G is the driver mass, set at 176lbs. Therefore the driver’s restraints must handle 900lbs of load. Therefore the supports must be able to handle that 900lbs distributed among them with a minimum safety factor of 2. In a lateral impact, the lap belts take most of the load. In the cases of front and rear impacts, the shoulder harness and the groin belt take the majority of the load. All of the mounting locations except for the groin belt are attached directly to the titanium frame. This has been shown to be able to handle point loads of 2500lbs with a factor of 2.4 safety. Since the belt is to be looped directly around the frame, those attachment points are not in question. The groin belt is the only attachment point that relies on the shear strength of the carbon fiber. The 45° in-plane shear strength of the carbon fiber prepreg is 17ksi, and the groin belt insert has a total contact surface area of 0.08in^2 with the composite. This gives a shear strength of 1360lbs. Given that the shoulder harness will halve the load, that is a total safety factor of 3.02.
Finally the behavior of the outer shell in an accident needs to be determined. The shell is attached rigidly to the body, and is unlikely to move in the event of an impact. However, should the shell move, the roll cage will prevent any components from impinging on the driver’s head and neck area, thus avoiding injury. Furthermore the shell is designed to be as light as possible with very little structural strength beyond the ability to support its own weight. Thus an impact will crush the shell rather than dislodge it from its mountings and create a potentially dangerous moving object.
• Conclusions Impact Scenario Summaries:
1. Front in-plane Impact: 18ksi maximum stress – minimum safety factor 5.8 2. Front Corner Impact: 20ksi maximum stress – SF = 5.25 3. Side 1 Impact: 37ksi max stress – SF = 2.8 4. Side 2: Impact: 32ksi max stress – SF = 3.3 5. Rear Impact: 37ksi max stress – SF = 2.8 6. Forward Roll 1: 56ksi max stress – SF = 1.9 7. Forward Roll 2: 19.4ksi max stress – SF = 5.4 8. Side Roll 1: 51ksi max stress – SF = 2 9. Side Roll 2: 51ksi max stress – SF = 2 10. Vertical: 45ksi max stress – SF = 2.33 11. Rear Roll 1: 43ksi max stress – SF = 2.4 12. Rear Roll 2: 40ksi max stress – SF = 2.6
In the event of an impact, the worst case analysis shows that the vehicle passes with a minimum safety factor of 1.9. This analysis does not take into account the structural bond of the belly pan to the frame, and it does not consider the carbon fiber ribs which support the body. These contributions are minor, but do add strength and stiffness to the system. Based on this analysis the frame does not deform excessively in impact to injure the driver in any way, and it also does not break under load. Further more, because of its light mass, The John Lee will tend to rebound in collisions rather than take the full static load. This combination of factors makes The John Lee a race worthy vehicle.
Appendix A. Mechanical Systems Supporting Documentation
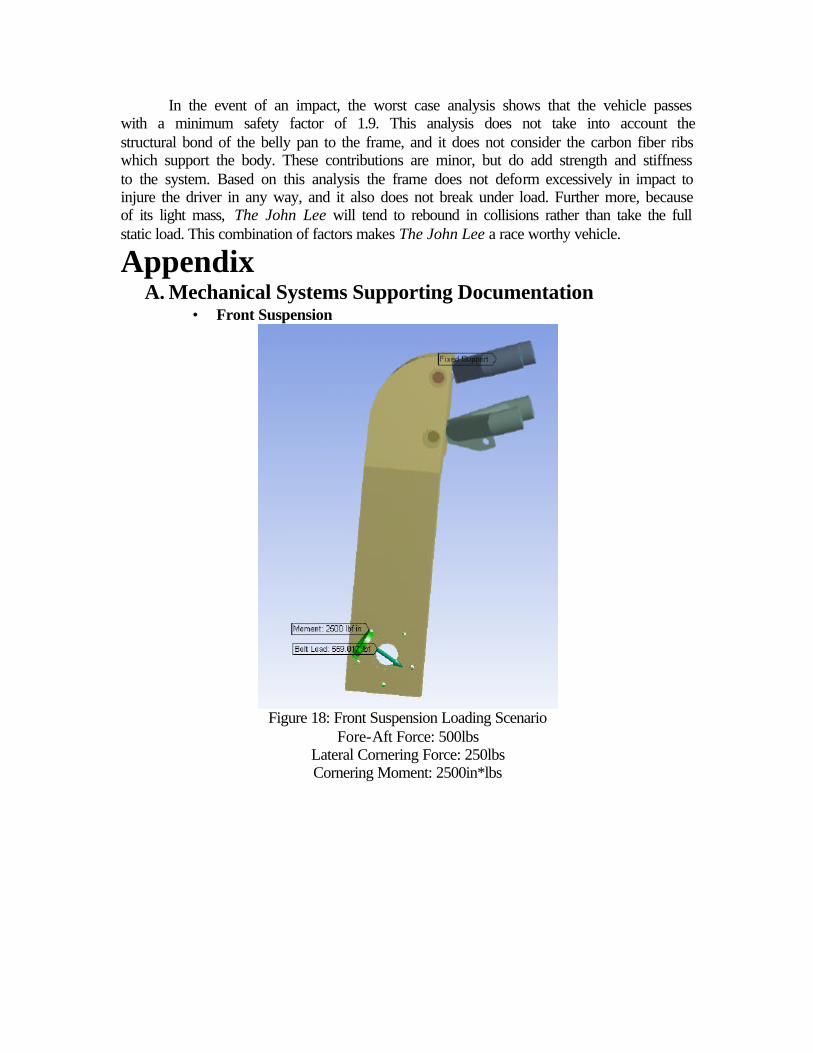
• Front Suspension
Figure 18: Front Suspension Loading Scenario
Fore-Aft Force: 500lbs Lateral Cornering Force: 250lbs Cornering Moment: 2500in*lbs

Figure 19: Front Suspension Deformation under Load
Max Deformation: 0.117”
Figure 20: Stress in Front Suspension Under Load
Max Stress: 35560psi
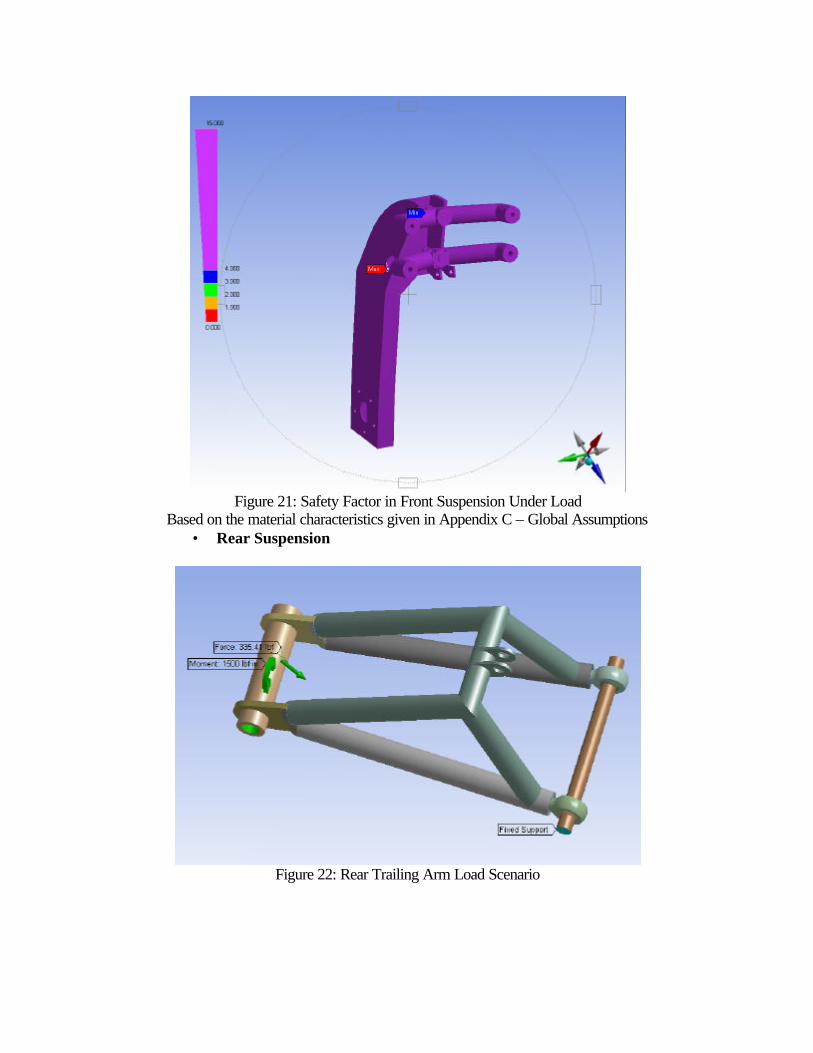
Figure 21: Safety Factor in Front Suspension Under Load
Based on the material characteristics given in Appendix C – Global Assumptions • Rear Suspension
Figure 22: Rear Trailing Arm Load Scenario

Figure 23: Rear Trailing Arm Torque Deformation
Max Deformation: 0.0585”
Figure 24: Rear Trailing Arm Stress
Max Stress: 44160psi
• Steering
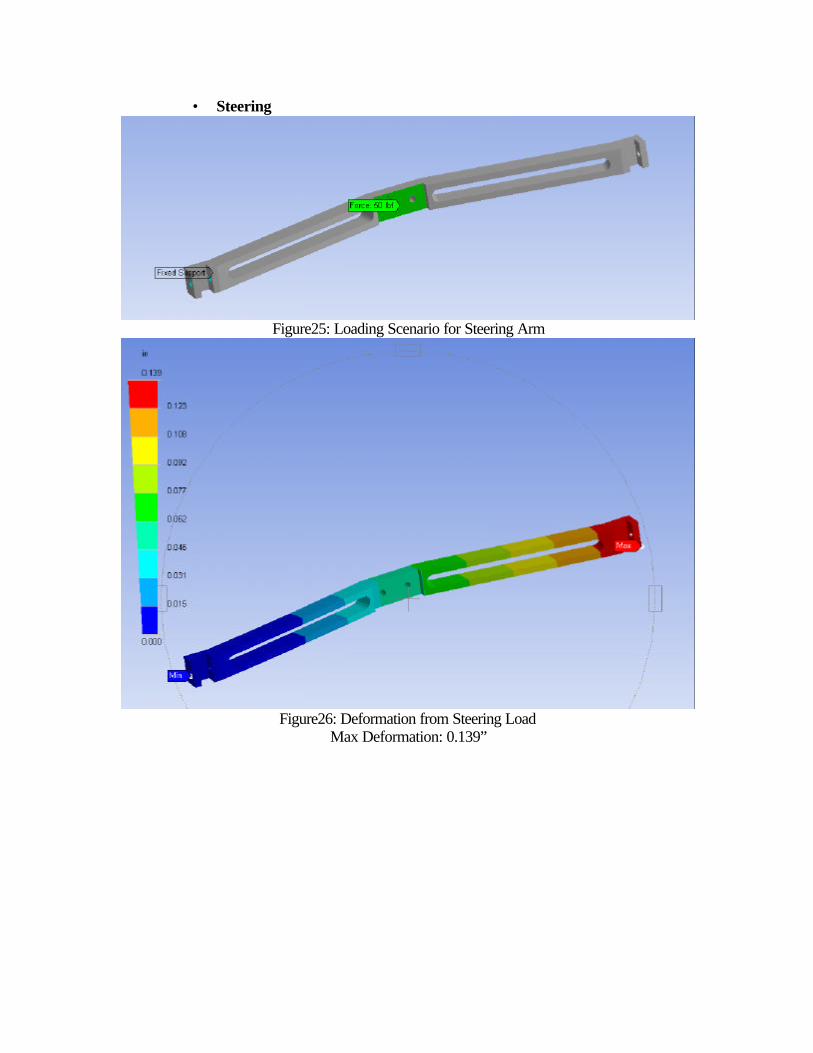
Figure25: Loading Scenario for Steering Arm
Figure26: Deformation from Steering Load
Max Deformation: 0.139”
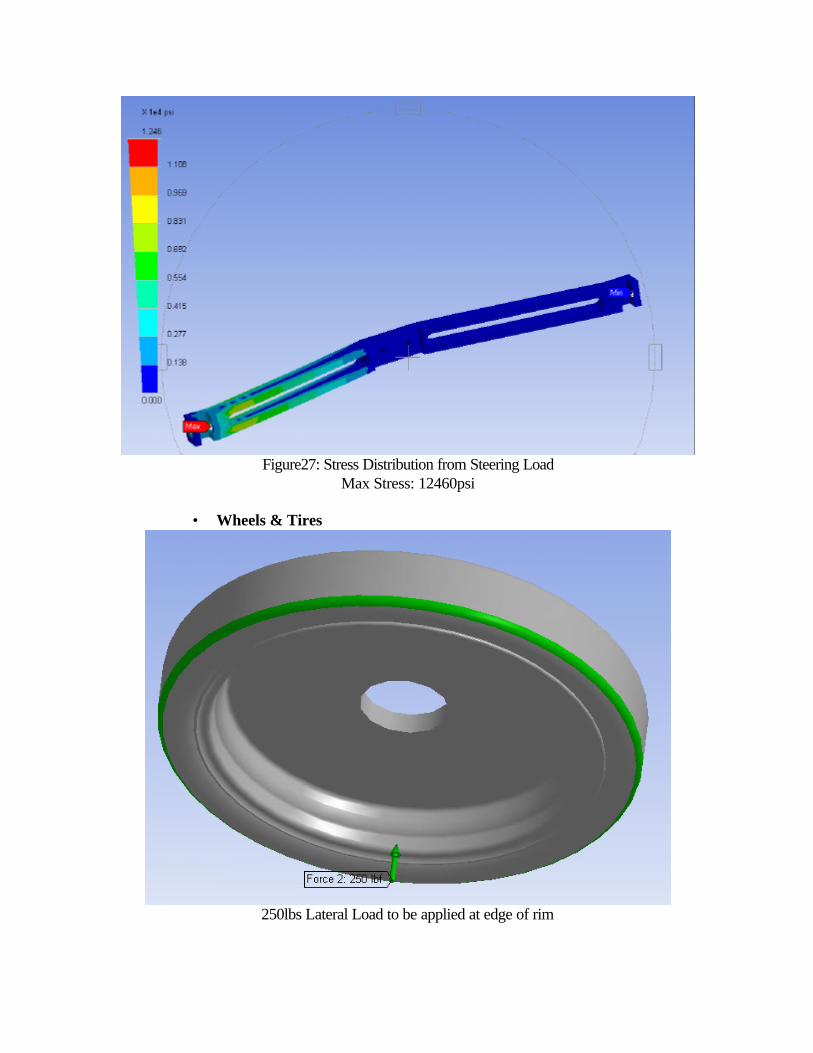
Figure27: Stress Distribution from Steering Load
Max Stress: 12460psi
• Wheels & Tires
250lbs Lateral Load to be applied at edge of rim
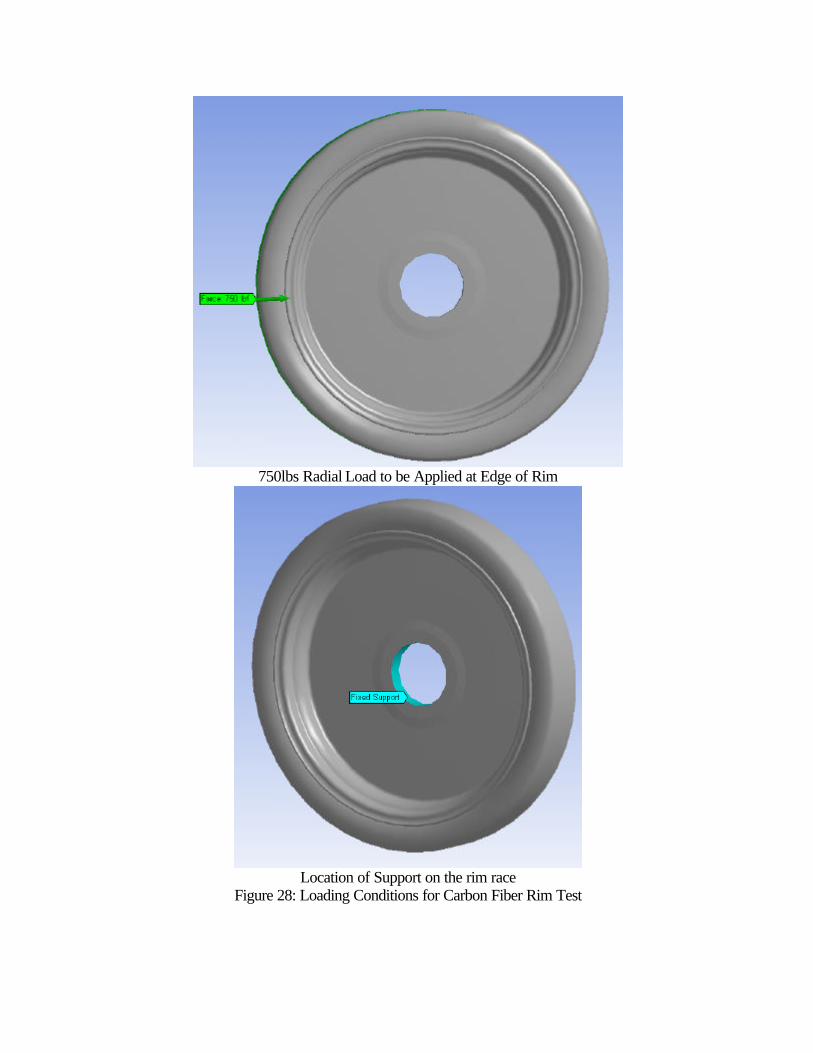
750lbs Radial Load to be Applied at Edge of Rim
Location of Support on the rim race
Figure 28: Loading Conditions for Carbon Fiber Rim Test

• Suspension Mount Points
Figure 29: Front Suspension Loading Condition for ANSYS/DesignSpace Analysis
Moment: 6787in*lbs Bolt Load: 750lbs
Figure 30: Front Suspension Deformation
Max Deformation: 0.0416”
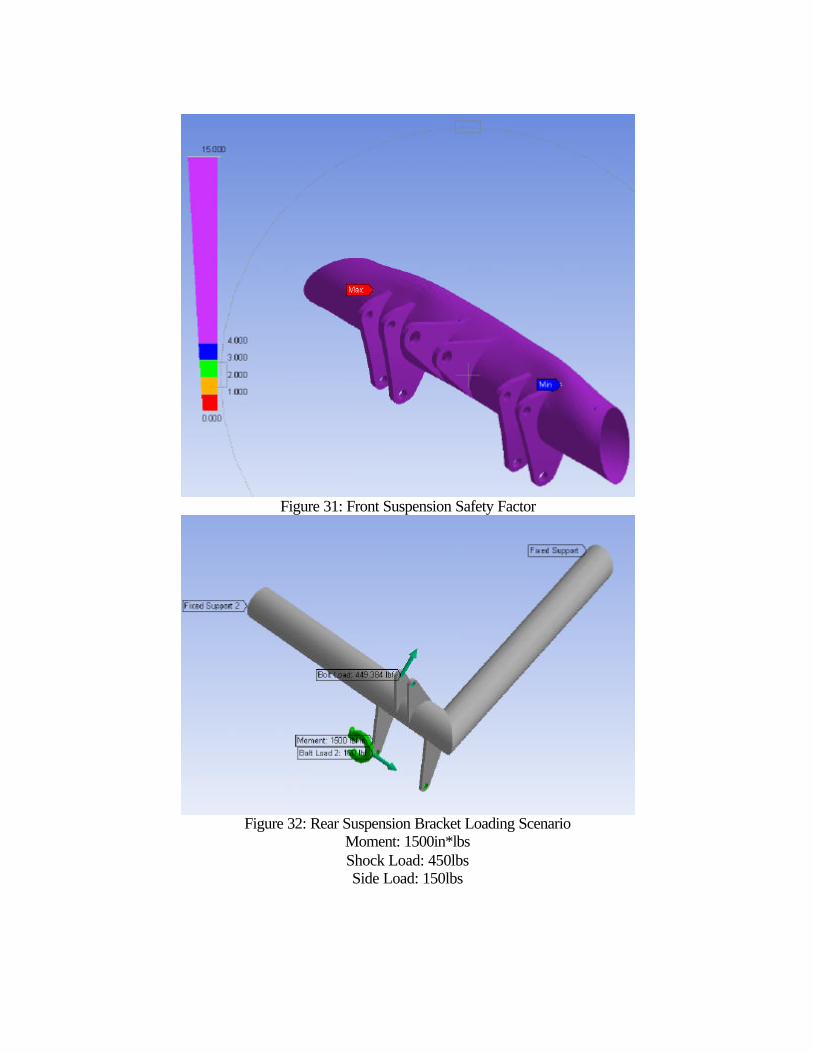
Figure 31: Front Suspension Safety Factor
Figure 32: Rear Suspension Bracket Loading Scenario
Moment: 1500in*lbs Shock Load: 450lbs Side Load: 150lbs
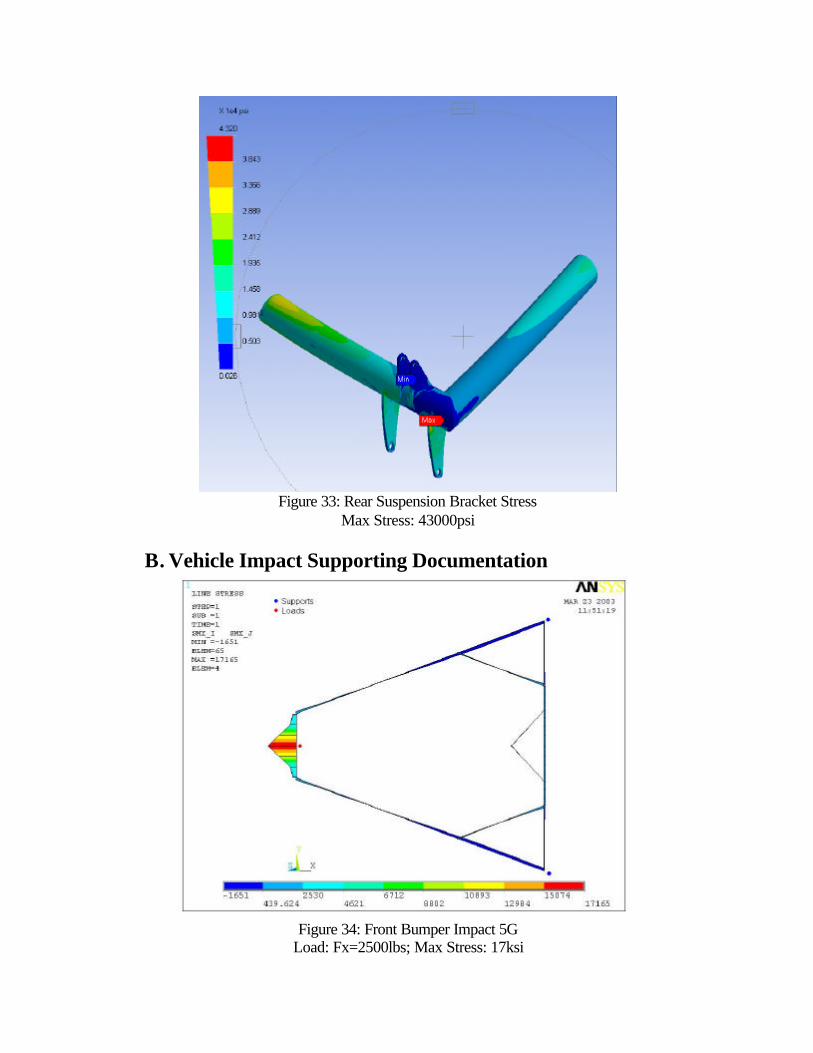
Figure 33: Rear Suspension Bracket Stress
Max Stress: 43000psi
B. Vehicle Impact Supporting Documentation
Figure 34: Front Bumper Impact 5G
Load: Fx=2500lbs; Max Stress: 17ksi

Figure 35: Front Corner Impact 5G
Load: Fy = -2500lbs; Max Stress: 3160psi
Figure 36: Front Corner Impact 5G
Load: Fx=2500lbs; Max Stress: 19659psi Any front corner impact can be generated from the combination of these two loading scenarios. Both show their stress to be far below the 50,000 psi safety limit we have set on the material.
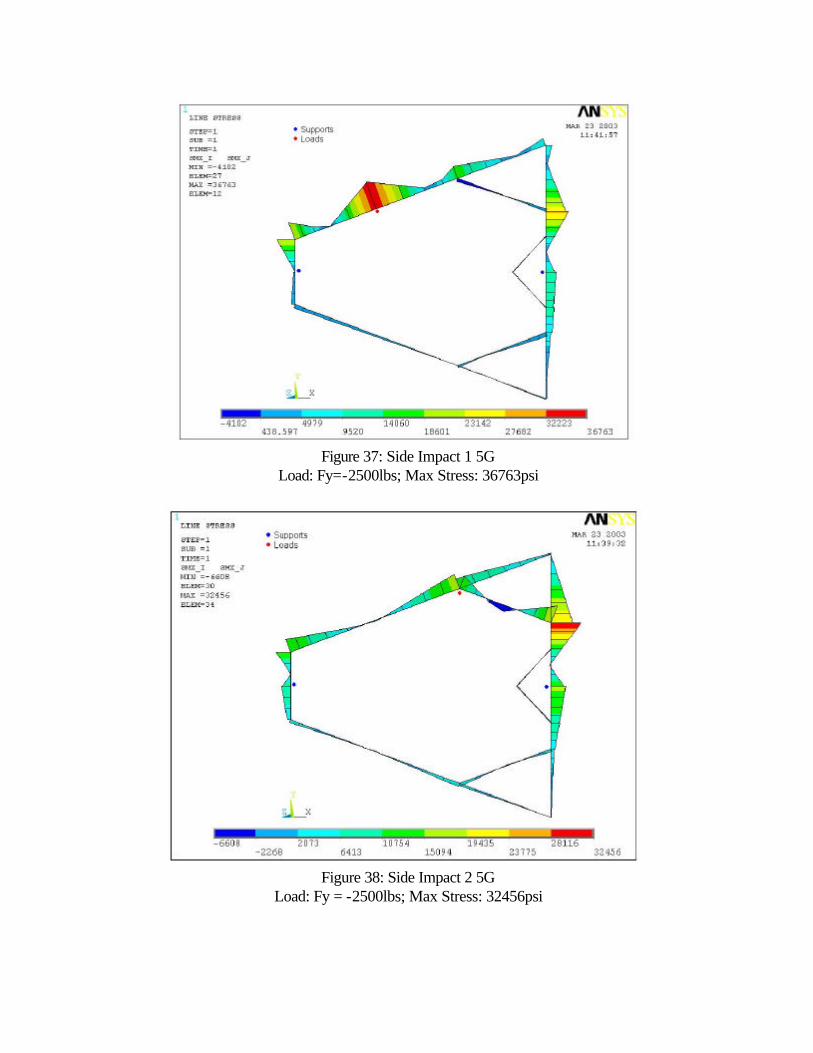
Figure 37: Side Impact 1 5G
Load: Fy=-2500lbs; Max Stress: 36763psi
Figure 38: Side Impact 2 5G
Load: Fy = -2500lbs; Max Stress: 32456psi
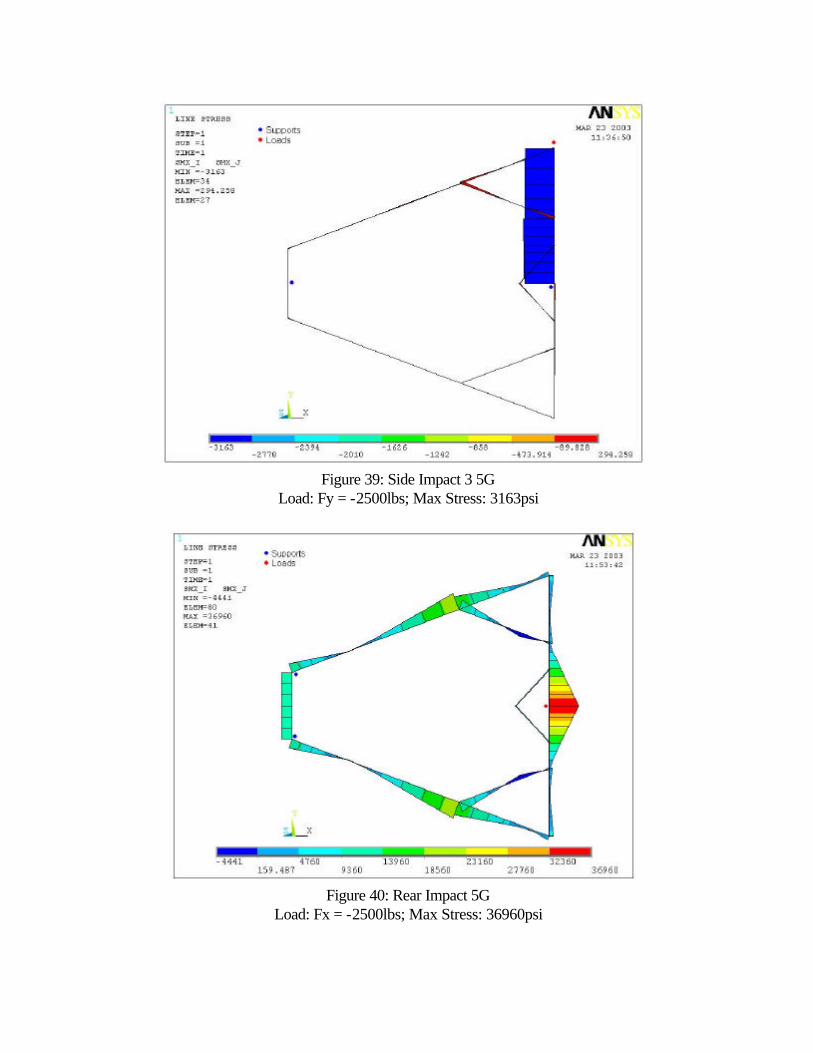
Figure 39: Side Impact 3 5G
Load: Fy = -2500lbs; Max Stress: 3163psi
Figure 40: Rear Impact 5G
Load: Fx = -2500lbs; Max Stress: 36960psi
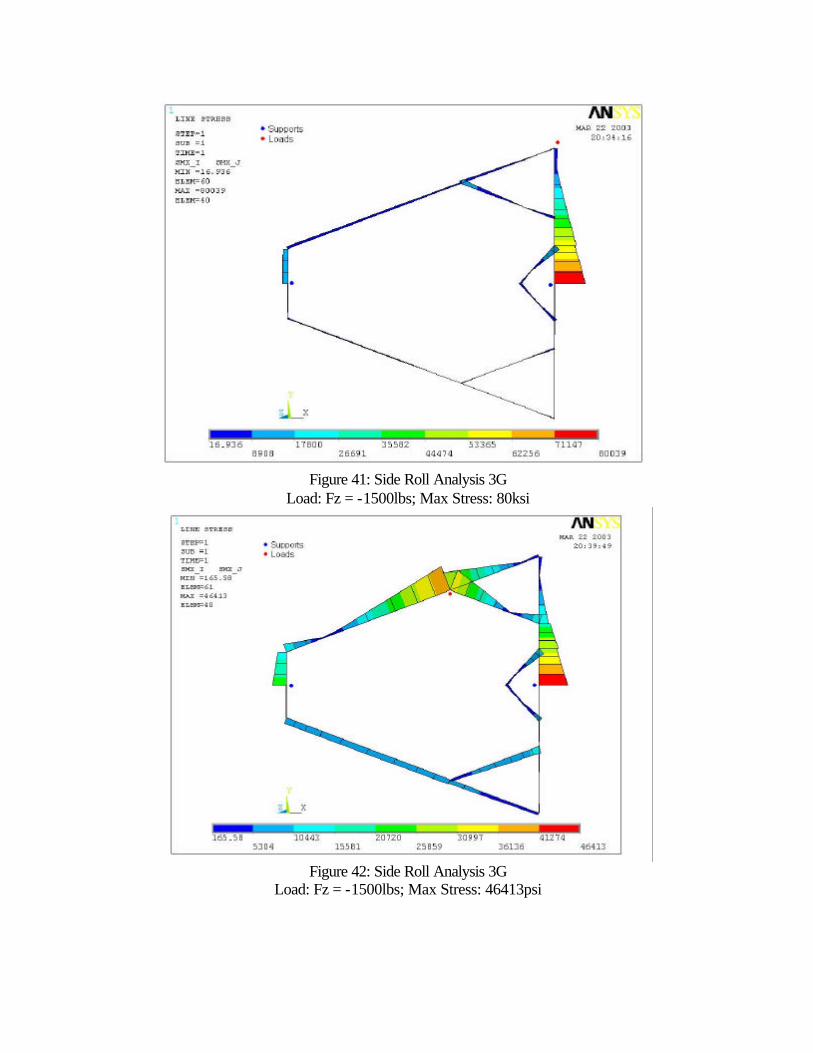
Figure 41: Side Roll Analysis 3G
Load: Fz = -1500lbs; Max Stress: 80ksi
Figure 42: Side Roll Analysis 3G
Load: Fz = -1500lbs; Max Stress: 46413psi

Figure 43: Side Roll Analysis 3G
Load: Fz = -1500lbs; Max Stress: 38ksi
Figure 44: Side Roll Analysis 3G
Load: Fz = -1500lbs; Max Stress: 23586psi
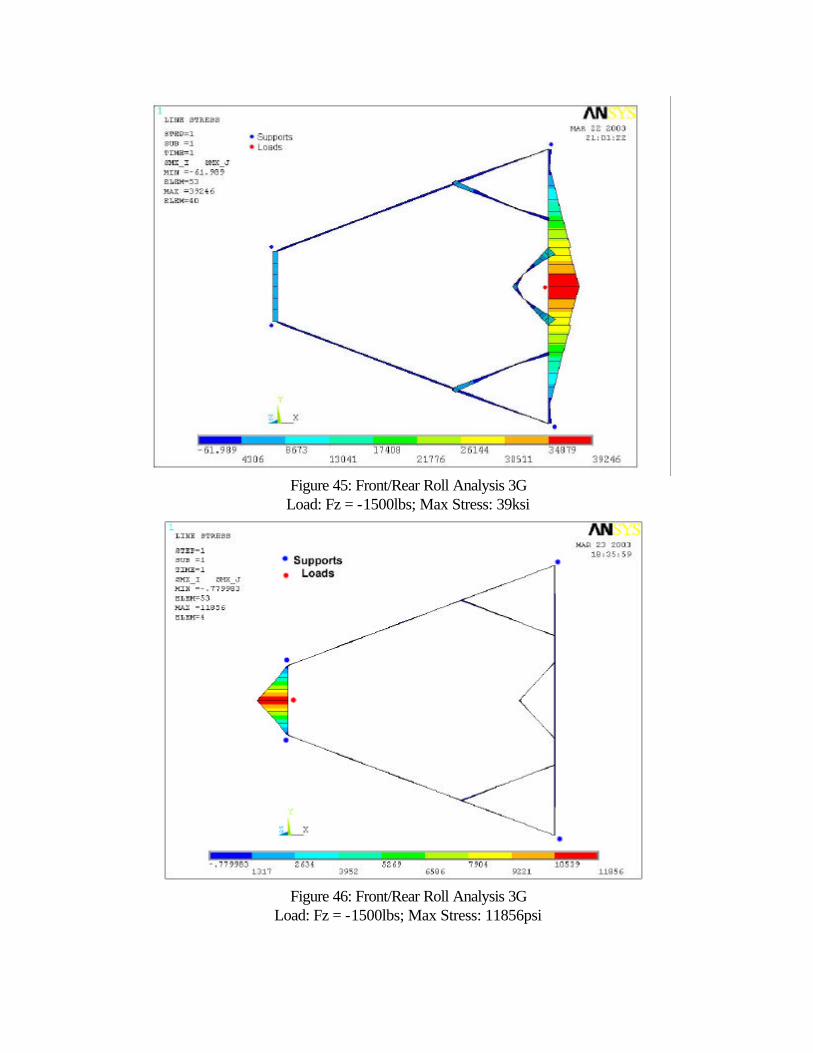
Figure 45: Front/Rear Roll Analysis 3G Load: Fz = -1500lbs; Max Stress: 39ksi
Figure 46: Front/Rear Roll Analysis 3G
Load: Fz = -1500lbs; Max Stress: 11856psi

Figure 47: Front/Rear Roll Analysis 3G Load: Fz = -1500lbs; Max Stress: 45ksi
Figure 48: Load Scenario for 30 degree from Horizontal forward roll – Forward Roll
Cage

Figure 49: Stress Distribution for 30 degree from Horizontal forward roll – Forward Roll
Cage
Figure 50: Deformation from 30 degrees from Horizontal forward roll – Forward Roll
Cage
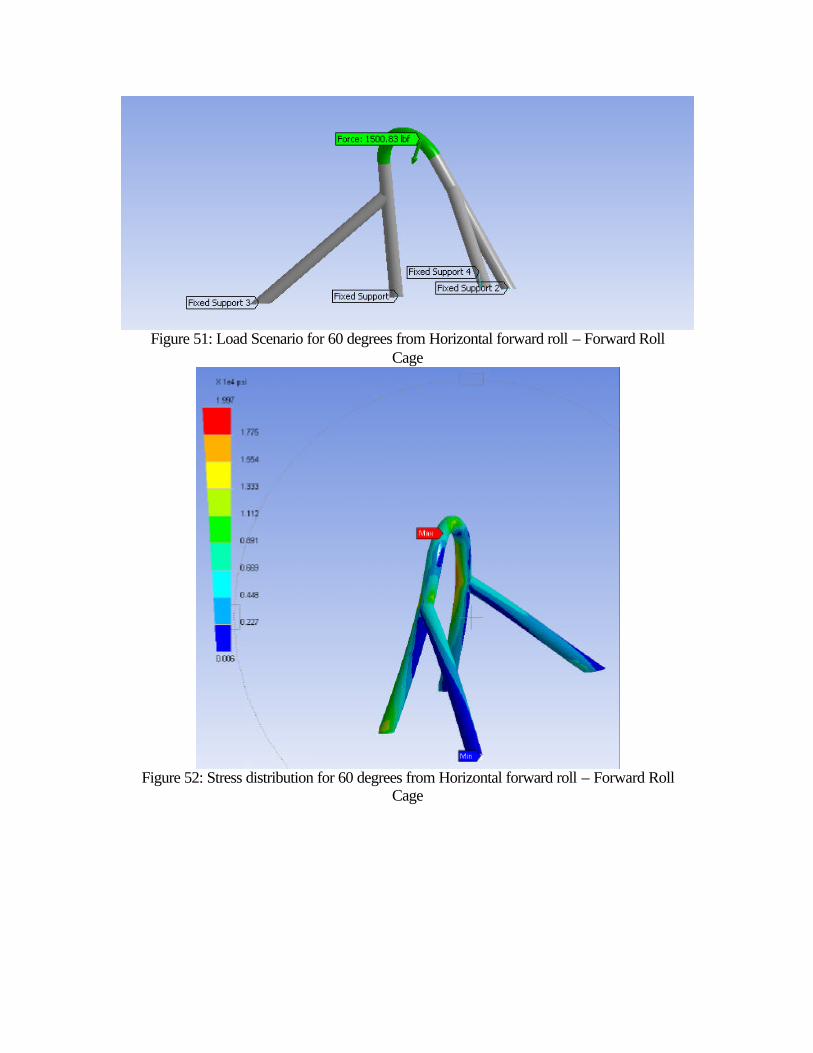
Figure 51: Load Scenario for 60 degrees from Horizontal forward roll – Forward Roll
Cage
Figure 52: Stress distribution for 60 degrees from Horizontal forward roll – Forward Roll
Cage

Figure 53: Deformation from 60 degrees from Horizontal forward roll – Forward Roll
Cage
Figure 54: Loading Scenario for 30° Side Roll – Forward Roll Cage
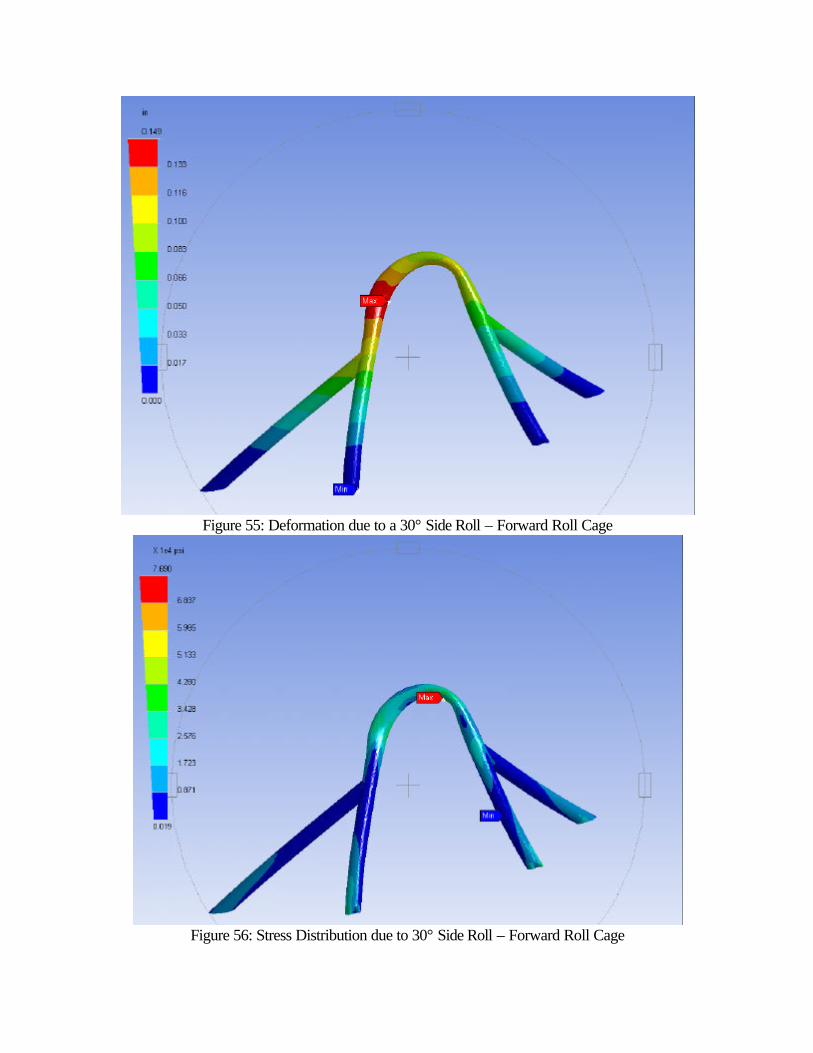
Figure 55: Deformation due to a 30° Side Roll – Forward Roll Cage
Figure 56: Stress Distribution due to 30° Side Roll – Forward Roll Cage

Figure 57: Loading Scenario for 60° Side Roll – Forward Roll Cage
Figure 58: Deformation due to 60° Side Roll – Forward Roll Cage
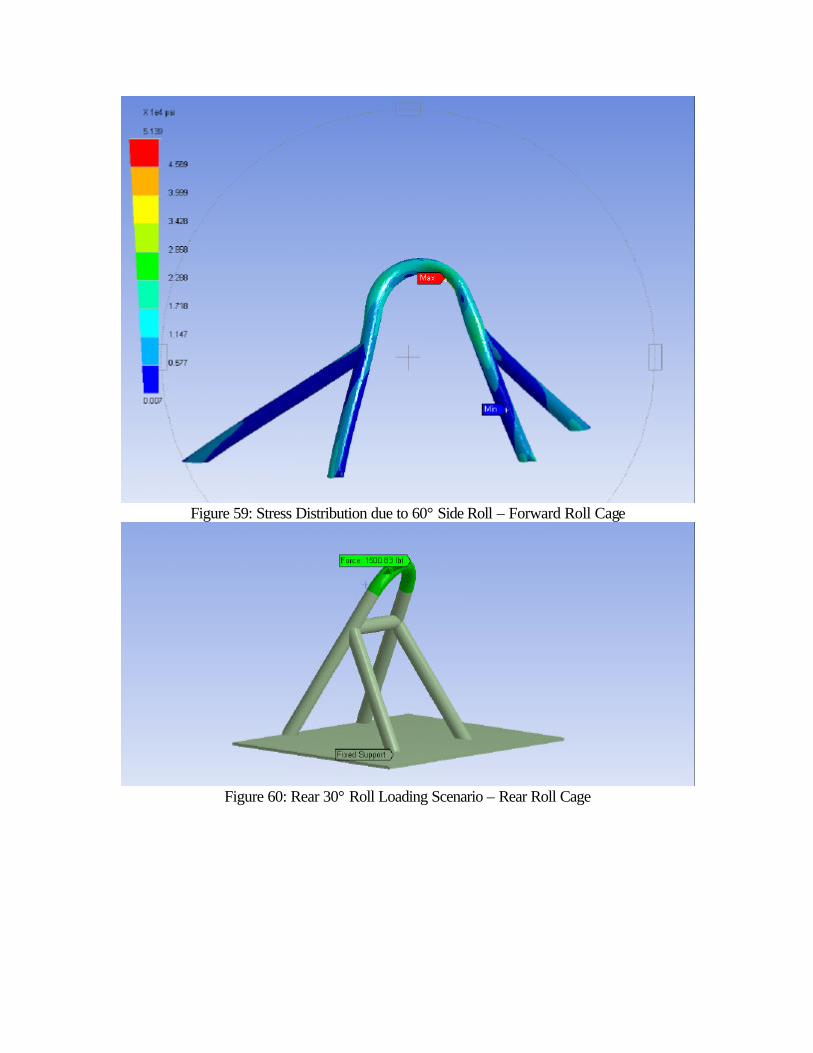
Figure 59: Stress Distribution due to 60° Side Roll – Forward Roll Cage
Figure 60: Rear 30° Roll Loading Scenario – Rear Roll Cage
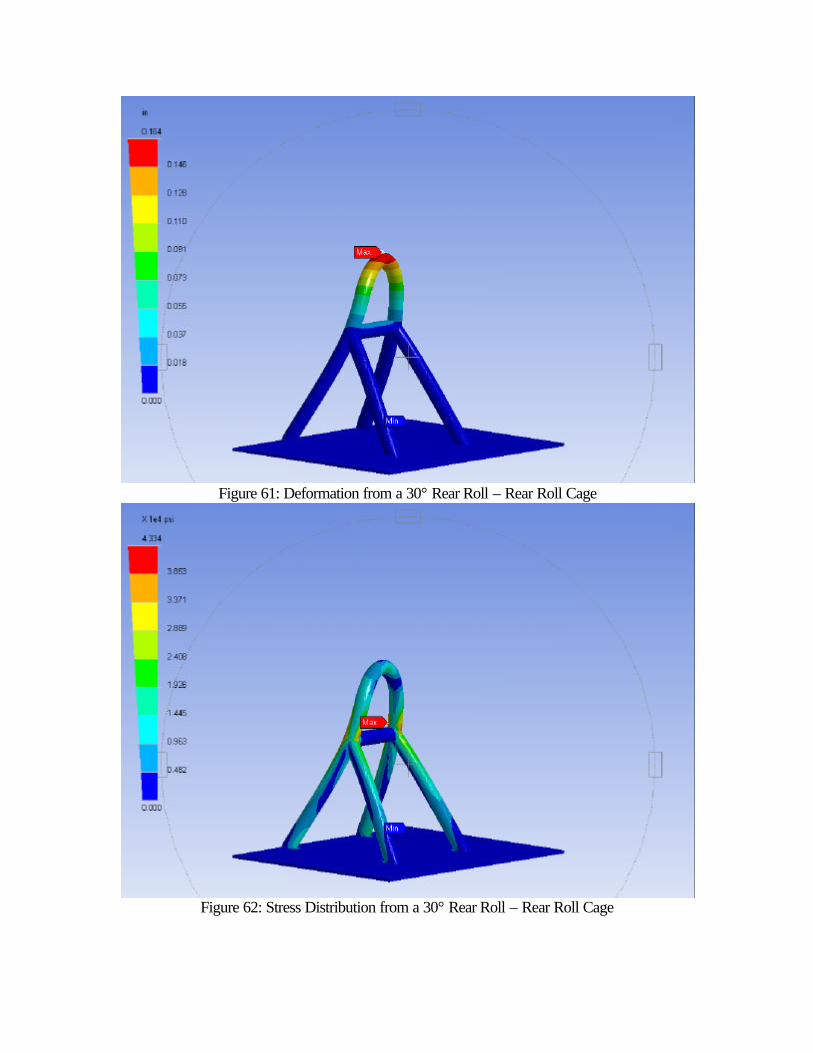
Figure 61: Deformation from a 30° Rear Roll – Rear Roll Cage
Figure 62: Stress Distribution from a 30° Rear Roll – Rear Roll Cage
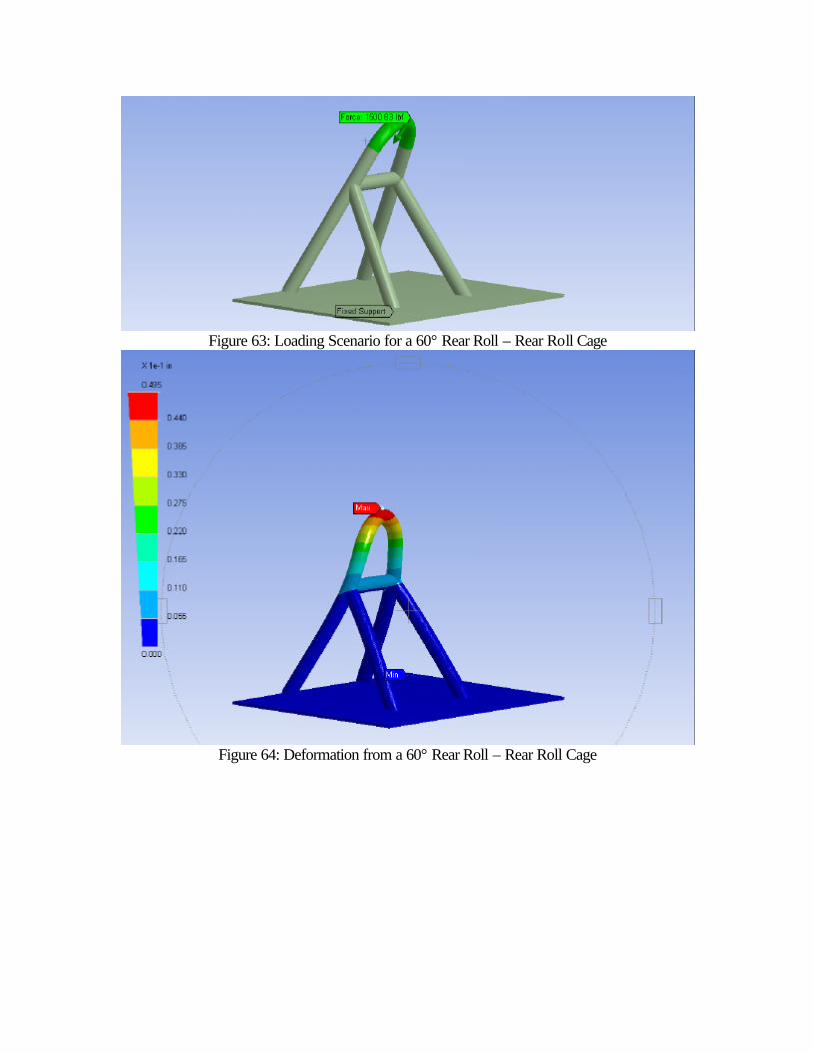
Figure 63: Loading Scenario for a 60° Rear Roll – Rear Roll Cage
Figure 64: Deformation from a 60° Rear Roll – Rear Roll Cage

Figure 65: Stress Distribution from a 60° Rear Roll – Rear Roll Cage
Figure 66: Loading Scenario for a 30° Side Roll – Rear Roll Cage
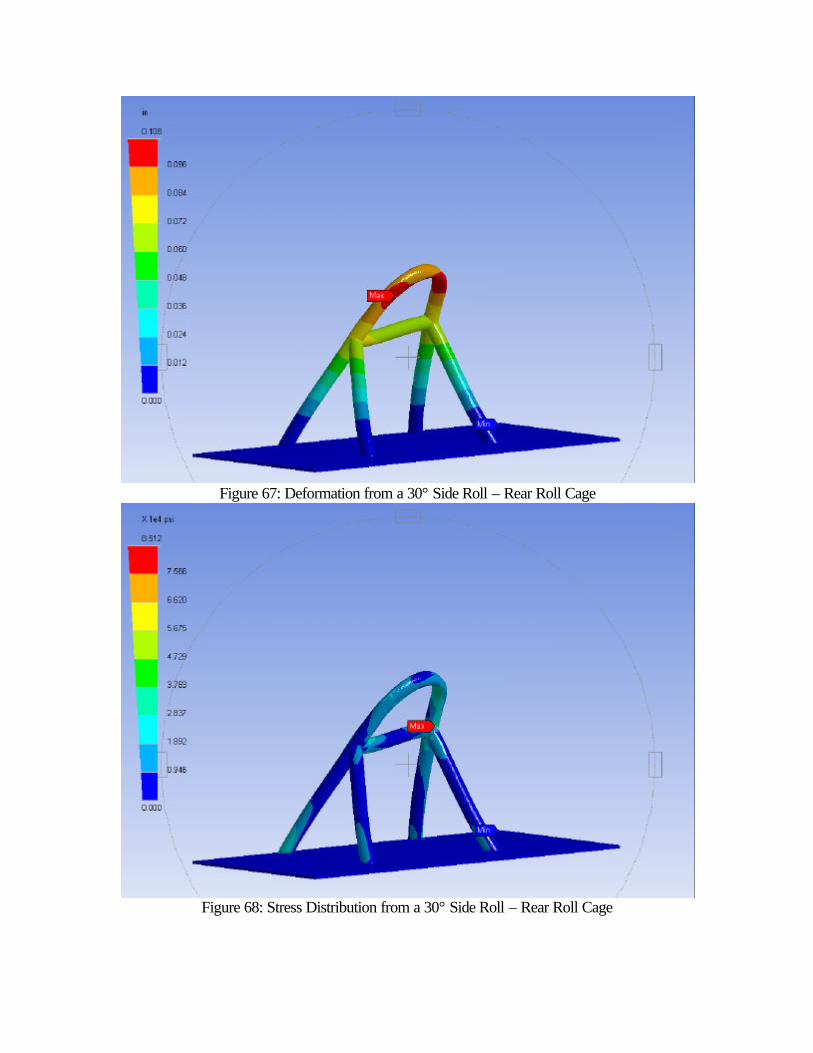
Figure 67: Deformation from a 30° Side Roll – Rear Roll Cage
Figure 68: Stress Distribution from a 30° Side Roll – Rear Roll Cage
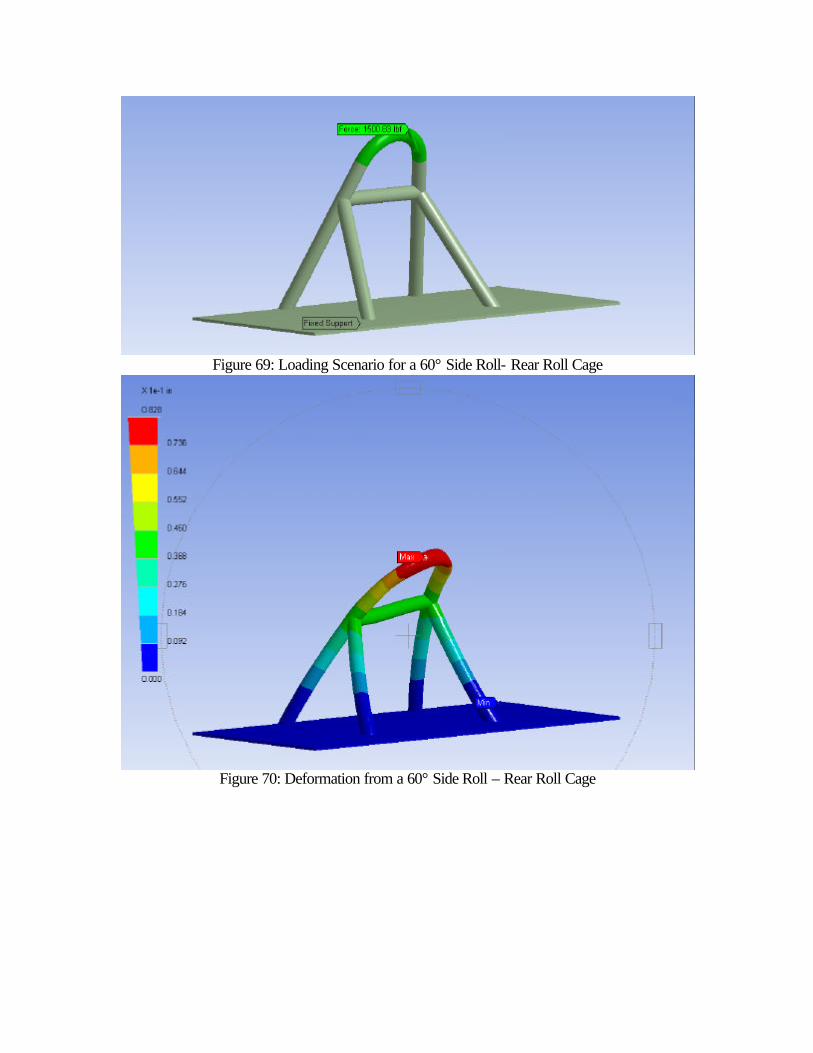
Figure 69: Loading Scenario for a 60° Side Roll- Rear Roll Cage
Figure 70: Deformation from a 60° Side Roll – Rear Roll Cage

Figure 71: Stress Distribution from a 60° Side Roll – Rear Roll Cage
C. Global Assumptions • Materials
1. 7075 T6 Aluminum Tensile Yield Strength: 73ksi Tensile Ultimate Strength: 85ksi Compressive Yield Strength: 73ksi Modulus: 11 msi Fatigue: 48ksi
2. 3-2.5 Titanium Alloy Tensile Yield Strength: 105,000 psi Tensile Ultimate Strength: 125,000 psi Compressive Yield Strength: 105,000 psi Modulus: 14 msi Fatigue: Unlimited cycles below 60ksi
3. 6-4 Titanium Alloy Tensile Yield Strength: 134,000 psi

Tensile Ultimate Strength: 155,000 psi Compressive Yield Strength: 134,000 psi Modulus: 14 msi Fatigue: Unlimited cycles below 60ksi
4. Hexcel Carbon Fiber 8552 AS4 Prepreg Quasi-Isotropic Tensile Strength: 107,000 psi (Ply Orientation: 25/50/25) 0º Tensile Strength: 320,000 psi 0º Tensile Modulus: 20.5 msi 90º Tensile Strength: 11700 psi 90º Tensile Modulus: 1.39 msi 0º Compressive Strength: 222,000 psi 0º Compressive Modulus: 18.6 msi These properties are only valid on un-expired material that is autoclave cured. Our material is before its expiration date and it will be cured in an autoclave according to the specified curing cycle.
5. Nomex Low Density Core Compressive Strength: 95psi
6. Rohacell 31A Foam Compressive Strength: 58psi
• Weight
Vehicle Weight 224.109 kg 495.28 Lbs
Subsection Theorectical Weight Constructed Weight Qty Total Thry. Total Constr. NotesFront Suspension 22.744 1 22.744Rear Suspension 6.181 2 12.362Frame 12.353 1 12.353Lower Aeroshell 17 1 17Upper Aeroshell 13.5 9.5 1 13.5Ribs 3.6 1 3.6Electronics 48.35 1 48.35Driver 81 81 1 81Solar Array 13.2 1 13.2
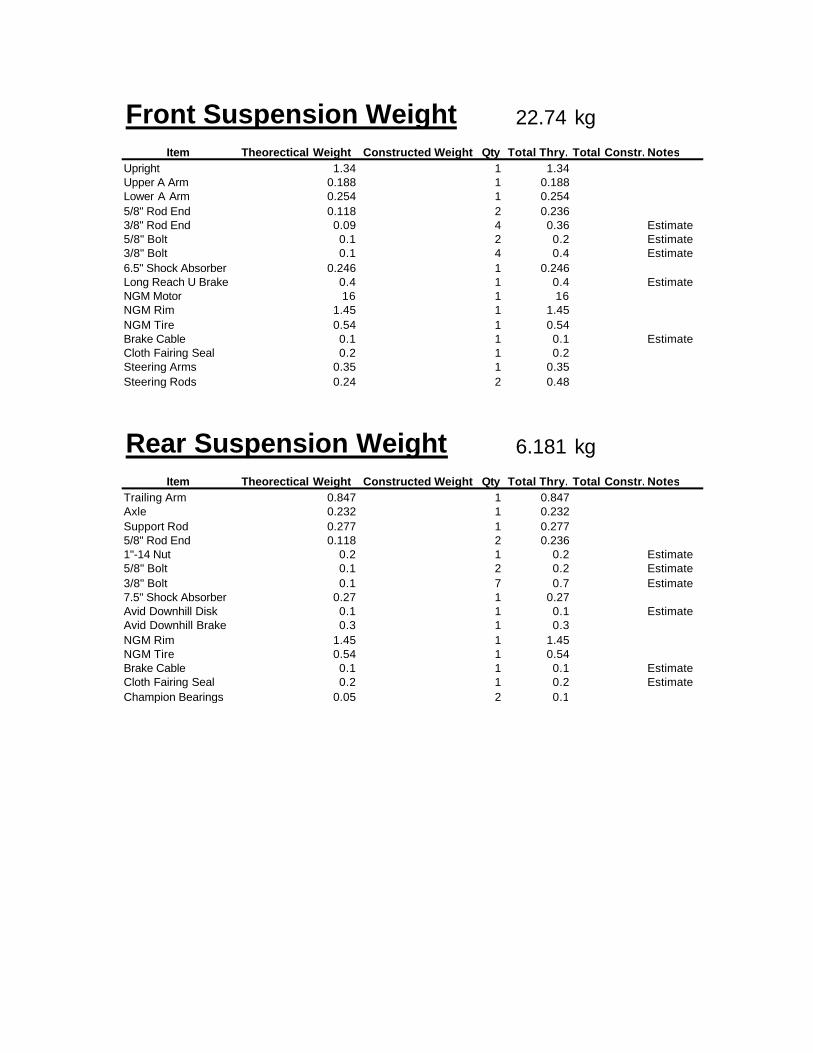
Front Suspension Weight 22.74 kg
Item Theorectical Weight Constructed Weight Qty Total Thry. Total Constr. NotesUpright 1.34 1 1.34Upper A Arm 0.188 1 0.188Lower A Arm 0.254 1 0.2545/8" Rod End 0.118 2 0.2363/8" Rod End 0.09 4 0.36 Estimate5/8" Bolt 0.1 2 0.2 Estimate3/8" Bolt 0.1 4 0.4 Estimate6.5" Shock Absorber 0.246 1 0.246Long Reach U Brake 0.4 1 0.4 EstimateNGM Motor 16 1 16NGM Rim 1.45 1 1.45NGM Tire 0.54 1 0.54Brake Cable 0.1 1 0.1 EstimateCloth Fairing Seal 0.2 1 0.2Steering Arms 0.35 1 0.35Steering Rods 0.24 2 0.48
Rear Suspension Weight 6.181 kg
Item Theorectical Weight Constructed Weight Qty Total Thry. Total Constr. NotesTrailing Arm 0.847 1 0.847Axle 0.232 1 0.232Support Rod 0.277 1 0.2775/8" Rod End 0.118 2 0.2361"-14 Nut 0.2 1 0.2 Estimate5/8" Bolt 0.1 2 0.2 Estimate3/8" Bolt 0.1 7 0.7 Estimate7.5" Shock Absorber 0.27 1 0.27Avid Downhill Disk 0.1 1 0.1 EstimateAvid Downhill Brake 0.3 1 0.3NGM Rim 1.45 1 1.45NGM Tire 0.54 1 0.54Brake Cable 0.1 1 0.1 EstimateCloth Fairing Seal 0.2 1 0.2 EstimateChampion Bearings 0.05 2 0.1
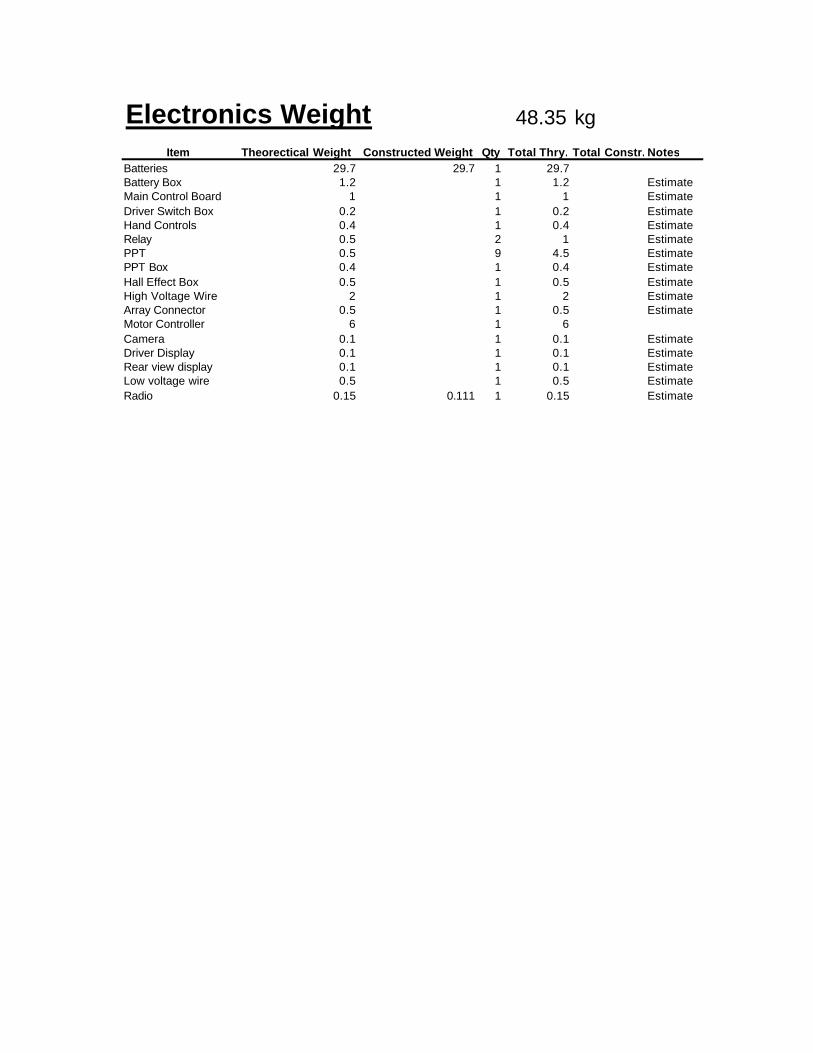
Electronics Weight 48.35 kg
Item Theorectical Weight Constructed Weight Qty Total Thry. Total Constr. NotesBatteries 29.7 29.7 1 29.7Battery Box 1.2 1 1.2 EstimateMain Control Board 1 1 1 EstimateDriver Switch Box 0.2 1 0.2 EstimateHand Controls 0.4 1 0.4 EstimateRelay 0.5 2 1 EstimatePPT 0.5 9 4.5 EstimatePPT Box 0.4 1 0.4 EstimateHall Effect Box 0.5 1 0.5 EstimateHigh Voltage Wire 2 1 2 EstimateArray Connector 0.5 1 0.5 EstimateMotor Controller 6 1 6Camera 0.1 1 0.1 EstimateDriver Display 0.1 1 0.1 EstimateRear view display 0.1 1 0.1 EstimateLow voltage wire 0.5 1 0.5 EstimateRadio 0.15 0.111 1 0.15 Estimate
Related Documents