Damara WA Pty Ltd 245Ͳ02 PNP Ͳ Coastal Monitoring Action Plan Rev 0.docx 53 4. Basis for Monitoring Action Plan 4.1. EROSION MONITORING PROTOCOL An approach to determine coastal monitoring recommendations for each tertiary sediment cell along the PNP coast is outlined here (Table 12). A monitoring hierarchy based on physical vulnerability and the presence of infrastructure has been developed, that supports several levels of management and their corresponding monitoring objectives (Table 3). Recommendations are based on this hierarchy, with refinement of applicable monitoring techniques based on the local morphology and existing knowledge of coastal dynamics. Table 12: Steps Used to Identify Monitoring Recommendations Step 1 Determine physical vulnerability Step 2 Evaluate presence of coastal infrastructure Step 3 Assign monitoring level based on risk, to define ‘basic’ techniques Step 4 Review applicability of monitoring techniques Step 5 Recommend monitoring It is important to note that the guidance for monitoring discussed here is based on a conceptual assessment of cell specific vulnerability and considers infrastructure assets only. Further, it should be recognised that the guidance provided is not wholly prescriptive as each LGA is likely to have different priorities and concerns with respect to their ongoing coastal management, including financial capacity. Further refinement may require consideration of environmental and social ‘values’ that each LGA assigns to discrete coastal areas in addition to the consideration of infrastructure assets presented here. Physical vulnerability was evaluated on a cellͲby cell basis through review of available coastal change information, including vegetation line changes collated as part of the Managing Coastal Vulnerability Project, coastal setback studies 101 and published coastal change studies. Physical vulnerability was indicated by: x Relative variability of vegetation lines, with a decadal range (generalised) of >40m indicating high vulnerability, and <10m indicating low vulnerability; x Historic patterns of behaviour, with ongoing erosion or significant stepͲchanges indicating high vulnerability and stability or accretion indicating low vulnerability; x Acute erosion allowance >25m suggests high vulnerability and <10m low vulnerability. High, medium or low vulnerability was used to identify the width of a coastal zone (80m, 50m or 20m) in which infrastructure may be considered subject to erosion threat. The relative density of infrastructure across this zone was used to assign a risk rating of high, medium or low, taking into account the distance from shore. This rating was subjective, with resilient coastal infrastructure not included in the rating, where its presence was known to the consultant. An understanding of the relative need to monitor for coastal trend, acute response or to coͲordinate active coastal management was based on the distance of infrastructure from the shore (Figure 18). In terms of SPP 2.6 allowances, distance greater than 2xS1 suggests monitoring for trend, and less than S1 suggests active management.

Welcome message from author
This document is posted to help you gain knowledge. Please leave a comment to let me know what you think about it! Share it to your friends and learn new things together.
Transcript
Damara WA Pty Ltd
245 02 PNP Coastal Monitoring Action Plan Rev 0.docx 53
4. Basis for Monitoring Action Plan
4.1. EROSION MONITORING PROTOCOLAn approach to determine coastal monitoring recommendations for each tertiary sedimentcell along the PNP coast is outlined here (Table 12). A monitoring hierarchy based onphysical vulnerability and the presence of infrastructure has been developed, that supportsseveral levels of management and their corresponding monitoring objectives (Table 3).Recommendations are based on this hierarchy, with refinement of applicable monitoringtechniques based on the local morphology and existing knowledge of coastal dynamics.
Table 12: Steps Used to Identify Monitoring Recommendations
Step 1 Determine physical vulnerabilityStep 2 Evaluate presence of coastal infrastructureStep 3 Assign monitoring level based on risk, to define ‘basic’ techniquesStep 4 Review applicability of monitoring techniquesStep 5 Recommend monitoring
It is important to note that the guidance for monitoring discussed here is based on aconceptual assessment of cell specific vulnerability and considers infrastructure assets only.Further, it should be recognised that the guidance provided is not wholly prescriptive aseach LGA is likely to have different priorities and concerns with respect to their ongoingcoastal management, including financial capacity. Further refinement may requireconsideration of environmental and social ‘values’ that each LGA assigns to discrete coastalareas in addition to the consideration of infrastructure assets presented here.
Physical vulnerability was evaluated on a cell by cell basis through review of available coastalchange information, including vegetation line changes collated as part of the ManagingCoastal Vulnerability Project, coastal setback studies 101 and published coastal changestudies. Physical vulnerability was indicated by:
Relative variability of vegetation lines, with a decadal range (generalised) of >40mindicating high vulnerability, and <10m indicating low vulnerability;Historic patterns of behaviour, with ongoing erosion or significant step changesindicating high vulnerability and stability or accretion indicating low vulnerability;Acute erosion allowance >25m suggests high vulnerability and <10m lowvulnerability.
High, medium or low vulnerability was used to identify the width of a coastal zone (80m,50m or 20m) in which infrastructure may be considered subject to erosion threat. Therelative density of infrastructure across this zone was used to assign a risk rating of high,medium or low, taking into account the distance from shore. This rating was subjective, withresilient coastal infrastructure not included in the rating, where its presence was known tothe consultant. An understanding of the relative need to monitor for coastal trend, acuteresponse or to co ordinate active coastal management was based on the distance ofinfrastructure from the shore (Figure 18). In terms of SPP 2.6 allowances, distance greaterthan 2xS1 suggests monitoring for trend, and less than S1 suggests active management.

Damara WA Pty Ltd
245 02 PNP Coastal Monitoring Action Plan Rev 0.docx 54
Table 13: Monitoring Levels and Intended Use
Monitoring‘Level’
RiskLevel
MonitoringPurpose
Type ofMonitoring
Intended Use
0 Low Context Qualitative Supports a wider understandingof behaviour to suit contextualanalysis of sediment cellbehaviour.
1 Low Trend Qualitative Supports forecast of time forwhich a foreshore buffer may giveprotection (before hazard phase).Should allow distinction between
a trend and a fluctuation.2 Medium Hazard Quantitative Supports estimation of the
likelihood of events requiringmanagement action. Greaterprecision may be needed to limitearly interventions.
3 High ActiveManagement
Quantitative Supports decision making foractive management, such asstabilization works or sandbypassing.
In turn, monitoring ‘levels’ are aligned to a range of techniques (detailed in the associatedmonitoring manual) that generally increase in accuracy, cost and capacity and timerequirements (Table 14). For example, Level 0 techniques are low cost, low resolution, easyto implement, and generally require less time; whereas Level 3 techniques are moreexpensive (external funding required), higher resolution, normally needing externalconsultants, with longer timeframes for collection and analysis.
Table 14: Coastal Monitoring ‘Levels’ and Associated Monitoring Techniques
Monitoring Level0 1 2 3
Mon
itorin
gTe
chni
que Photo Monitoring
Beach WidthBeach ProfilesSpatial Survey CoverageOblique Aerial ImageryVertical Aerial Imagery ( )Hydrographic SurveyLIDAR Monitoring
( ) indicates this method may be used at a lower level; Arrows indicate the method may beused at a higher level (with modification).
Descriptions of typical monitoring methods are outlined in the PNP Monitoring Manual,prepared in parallel with this document. Corresponding applications for the identifiedmonitoring levels are described following:
Damara WA Pty Ltd
245 02 PNP Coastal Monitoring Action Plan Rev 0.docx 55
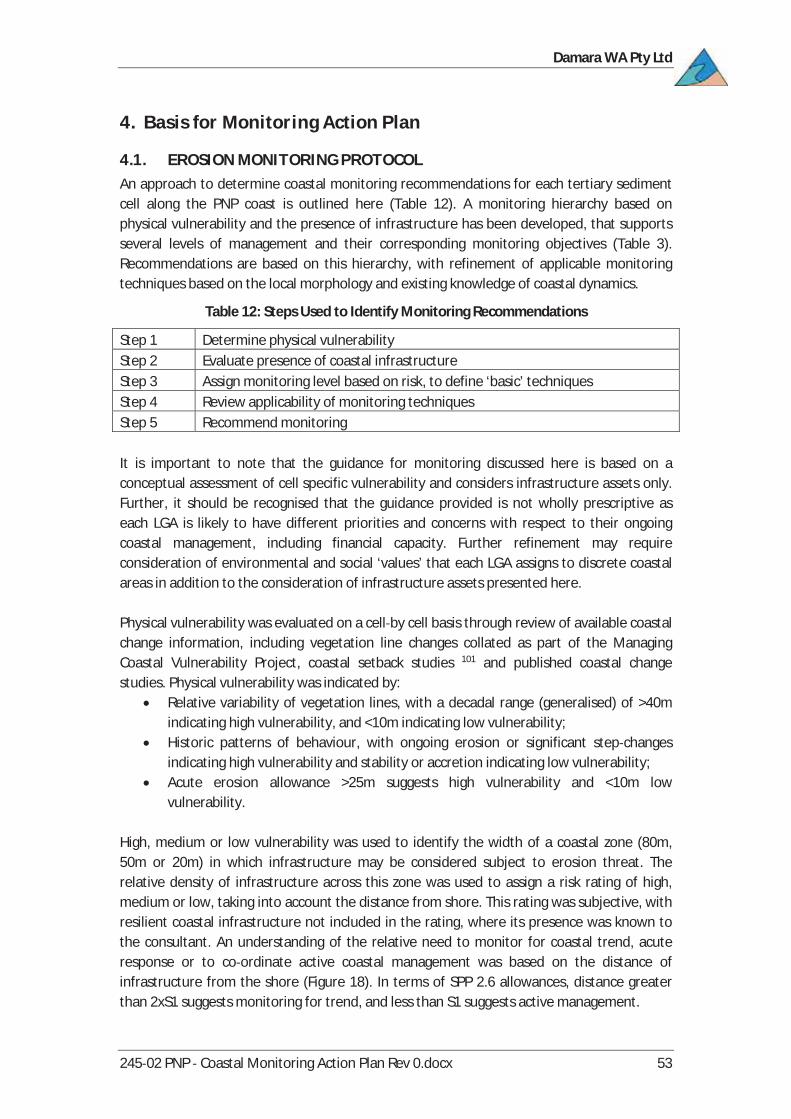
Photographic monitoring:A qualitative method of beach change assessment, useful due to its low cost and the abilityfor non technical support, such as community groups, to complete monitoring. Refinementto the use of photographic monitoring may include definition of photo points 40 and use ofsmartphone applications to collate community photographs 102. Photographic monitoringmay be used effectively at different levels depending upon coverage and frequency ofcollection (Table 15). Monitoring locations may correspond to (i) stress points adjacent tocoastal infrastructure; (ii) indicators points that are ‘representative’ of an extended length ofcoast; or (iii) sinks and source points, typically near the boundary of coastal compartments.For use in a detailed monitoring program (Level 3), photographic monitoring should capturelocations used for management triggers at a high frequency, supporting quantitativemonitoring such as profiles at a lower frequency.
Table 15: Photographic Monitoring Levels
Monitoring Coverage FrequencyLevel 0 Key Stress Points Annual or Twice YearlyLevel 1 Indicator Points MonthlyLevel 2 Sinks, Sources & Indicators MonthlyLevel 3 Trigger Points Weekly in peak season
Complete coverage of a spatial unit (say of a sediment cell) is generally more cost effectiveby aerial photography (obliques or vertical imagery) than by land based photographs.
Beach Width:A quantitative method of beach change assessment, useful due to its low cost and ease ofmeasurement, which may be used for Level 1 or 2 monitoring (Table 14). Further refinementof this technique may include identification of beach levels, through reference to a fixedfeature or installed marker. Beach width measurement should be supported by concurrentphotographic monitoring, to demonstrate that the width measurement is meaningful for asignificant length of coast. Beach width measurement is of reduced value where the coastalvaries significantly alongshore, and therefore it is only appropriate for measurement atindicator sites which are ‘representative’ for an extended length of coast, such as along along straight section of coast. Beach width variation is often systematic along acompartmentalised coast, such that a minimum of three points of measurement in a cellmay be sufficient to attribute much of the character of coastal change (see Section 3.4.3).
Table 16: Beach Width Monitoring Levels
Monitoring Coverage FrequencyLevel 1 Indicator Points
(minimum of 3 per cell)Annual or Twice Yearly
Level 2 Indicator Points(increased density)
Annual or Twice Yearly
Level 3 Inadequate due to uncertainty associated with beach levels
A program of monthly beach width measurement is recommended as an initial means ofidentifying the appropriate months of the year for annual or twice yearly monitoring.
Damara WA Pty Ltd
245 02 PNP Coastal Monitoring Action Plan Rev 0.docx 56
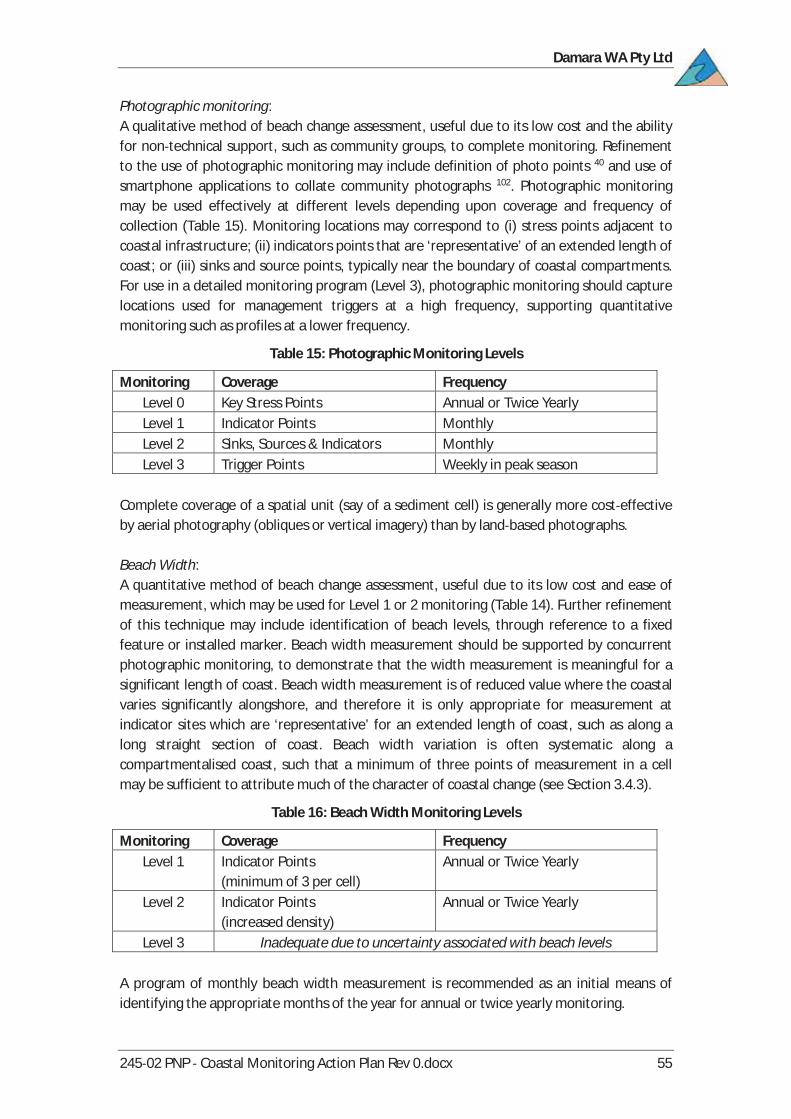
Beach Profiles:A quantitative method of beach change assessment, which may be used at a range of levelsdepending on coverage and frequency (Table 17). Beach profile measurement should besupported by concurrent photographic monitoring, to demonstrate that the profile ismeaningful for a significant length of coast. When used on parts of the coast which may varyin aspect, such as adjacent to structures or rock features, profile should be related toalongshore beach measurements, such a beach crest line and a start of vegetation line.Where a complete description of volumetric change is required (note Figure 16), highdensity beach profile measurements may be combined with hydrographic surveys.
Table 17: Beach Profile Monitoring Levels
Monitoring Coverage FrequencyLevel 1 Indicator Profiles
(minimum of 3 per cell)Five Yearly
Level 2 Indicator Profiles(typically 5 7 per cell)
Annual or Twice Yearly
Level 3 Distributed Profiles(typically 50 250m spacing)
Annual or Twice Yearly
Spatial Survey Coverage:An intensive quantitative method for beach change assessment, which is not typically usedfor low level monitoring due to cost (Table 18). Available scanning methods are mostly validfor the section of coast above water and therefore are often conducted in parallel withhydrographic survey when a complete description of volumetric change is required (Figure16). Physical limitations to access may leave a gap between the two types of survey.
Table 18: Spatial Survey Coverage Monitoring Levels
Monitoring Coverage FrequencyLevel 1 Not considered suitable due to costLevel 2 Area to be quantified Every 5 to 10 YearsLevel 3 Area to be quantified
(preferably whole cell)Annual
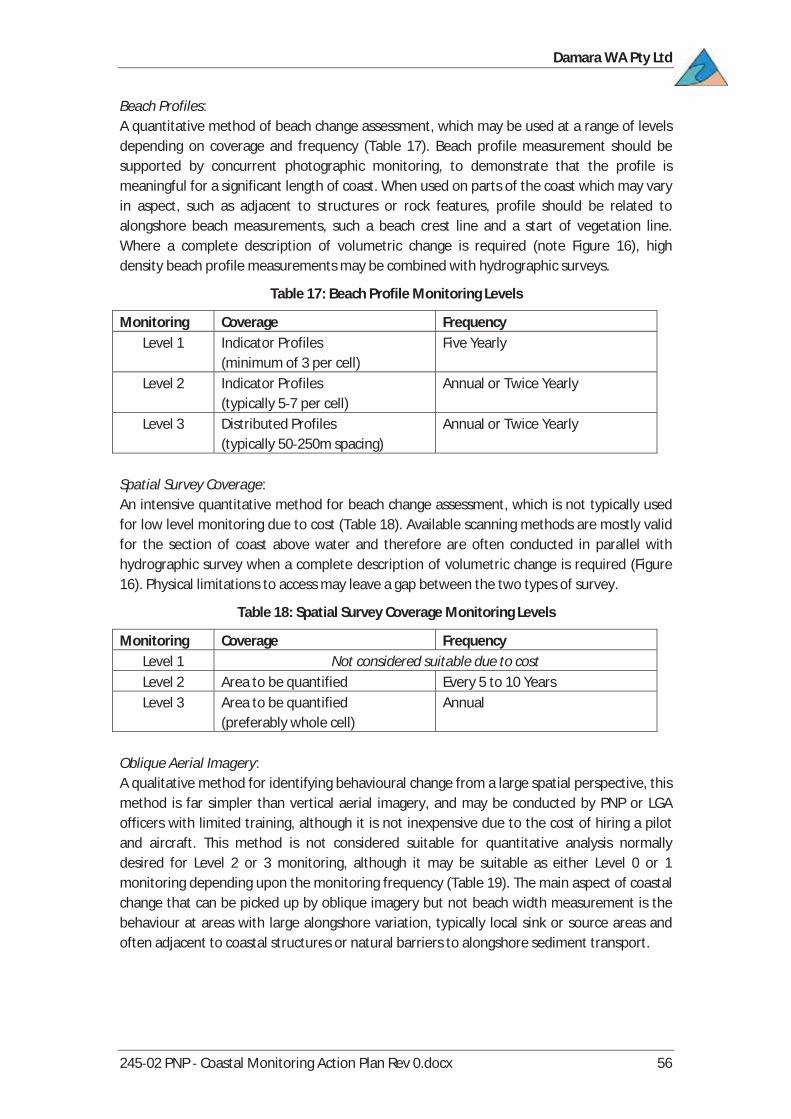
Oblique Aerial Imagery:A qualitative method for identifying behavioural change from a large spatial perspective, thismethod is far simpler than vertical aerial imagery, and may be conducted by PNP or LGAofficers with limited training, although it is not inexpensive due to the cost of hiring a pilotand aircraft. This method is not considered suitable for quantitative analysis normallydesired for Level 2 or 3 monitoring, although it may be suitable as either Level 0 or 1monitoring depending upon the monitoring frequency (Table 19). The main aspect of coastalchange that can be picked up by oblique imagery but not beach width measurement is thebehaviour at areas with large alongshore variation, typically local sink or source areas andoften adjacent to coastal structures or natural barriers to alongshore sediment transport.
Damara WA Pty Ltd
245 02 PNP Coastal Monitoring Action Plan Rev 0.docx 57
Table 19: Oblique Aerial Imagery Monitoring Levels
Monitoring Coverage FrequencyLevel 0 Area to be described
(preferably whole cell)Every 5 to 10 Years
Level 1 Area to be described(preferably whole cell)
Annual or Twice Yearly
Level 2 Limited quantitative analysis due to field of viewLevel 3 Limited quantitative analysis due to field of view
Vertical Aerial Imagery:Georeferenced vertical aerial imagery provides a quantitative measure of coastal change at alarge spatial perspective. This has been the main method of capturing coastal change alongthe Western Australian coast since the 1950s. Interpretation of vertical imagery is typicallyundertaken using various ‘markers’ including the swash line, the beach crest, wrack lines(especially high water marks) and the line of coastal vegetation. Each of these measures maybehave slightly differently to the overall beach volume and therefore care should be takento ensure that meaningful measures are used at each site. Despite these constraints, in mostsituations vertical aerial imagery is suitable for assessment of beach change, with theeffective monitoring level determined by the frequency of photography capture (Table 20).
Table 20: Vertical Aerial Imagery Monitoring Levels
Monitoring Coverage FrequencyLevel 1 Area to be quantified
(preferably whole cell)Every 10 Years
Level 2 Area to be quantified(preferably whole cell)
Every 5 Years
Level 3 Area to be quantified(preferably whole cell)
Annual
Hydrographic Survey:A quantitative measure of coastal change underneath the water surface, this methodrequires a skipper, vessel, specialised equipment and team and therefore is a relatively highcost approach, only suited to high levels of monitoring (Table 21). The greatest need forhydrographic surveys occurs where it is necessary to develop a volumetric understanding ofcoastal change, including the possibility of post storm recovery (see Section 2.5.1). Partialcoverage by hydrographic survey may therefore be appropriate if cross shore sedimentmovement is focused on dynamic sites, such as in the vicinity of coastal structures.
Table 21: Hydrographic Survey Monitoring Levels
Monitoring Coverage FrequencyLevel 1 Not considered suitable due to costLevel 2 Area to be quantified
(focused on dynamic sites)Every 5 to 10 Years
Level 3 Area to be quantified(preferably whole cell)
Annual
Damara WA Pty Ltd
245 02 PNP Coastal Monitoring Action Plan Rev 0.docx 58
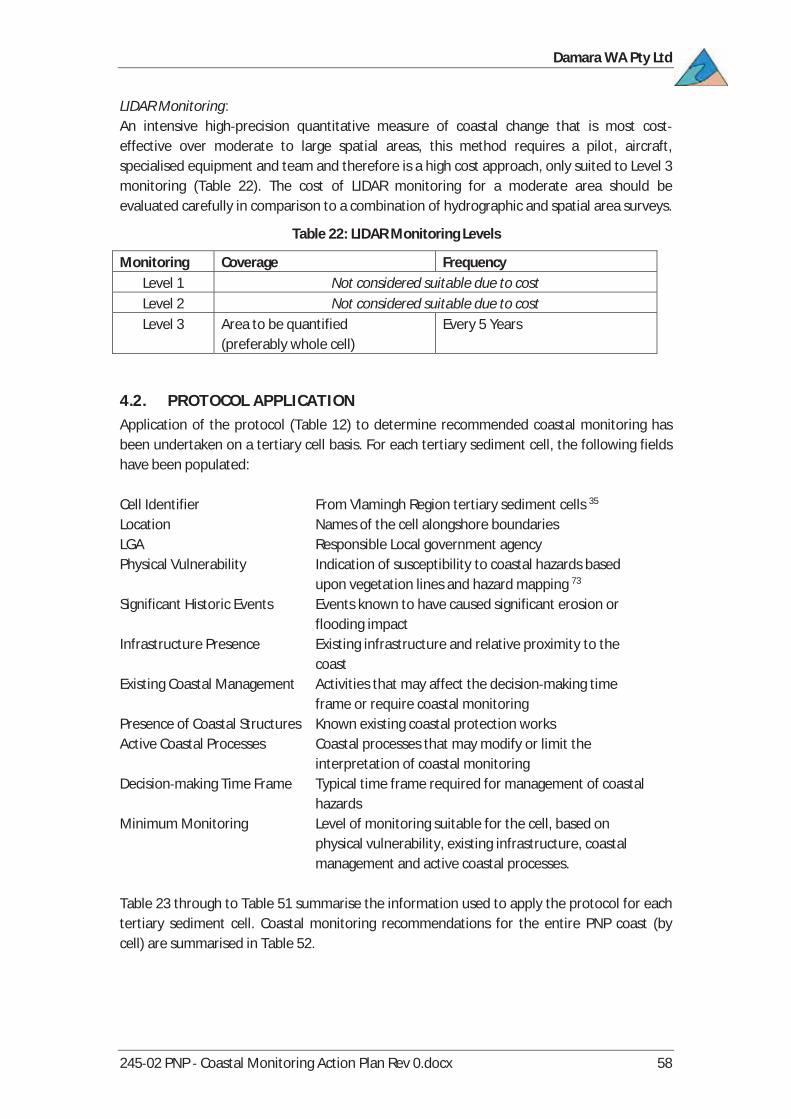
LIDAR Monitoring:An intensive high precision quantitative measure of coastal change that is most costeffective over moderate to large spatial areas, this method requires a pilot, aircraft,specialised equipment and team and therefore is a high cost approach, only suited to Level 3monitoring (Table 22). The cost of LIDAR monitoring for a moderate area should beevaluated carefully in comparison to a combination of hydrographic and spatial area surveys.
Table 22: LIDAR Monitoring Levels
Monitoring Coverage FrequencyLevel 1 Not considered suitable due to costLevel 2 Not considered suitable due to costLevel 3 Area to be quantified
(preferably whole cell)Every 5 Years
4.2. PROTOCOL APPLICATIONApplication of the protocol (Table 12) to determine recommended coastal monitoring hasbeen undertaken on a tertiary cell basis. For each tertiary sediment cell, the following fieldshave been populated:
Cell Identifier From Vlamingh Region tertiary sediment cells 35
Location Names of the cell alongshore boundariesLGA Responsible Local government agencyPhysical Vulnerability Indication of susceptibility to coastal hazards based
upon vegetation lines and hazard mapping 73
Significant Historic Events Events known to have caused significant erosion orflooding impact
Infrastructure Presence Existing infrastructure and relative proximity to thecoast
Existing Coastal Management Activities that may affect the decision making timeframe or require coastal monitoring
Presence of Coastal Structures Known existing coastal protection worksActive Coastal Processes Coastal processes that may modify or limit the
interpretation of coastal monitoringDecision making Time Frame Typical time frame required for management of coastal
hazardsMinimum Monitoring Level of monitoring suitable for the cell, based on
physical vulnerability, existing infrastructure, coastalmanagement and active coastal processes.
Table 23 through to Table 51 summarise the information used to apply the protocol for eachtertiary sediment cell. Coastal monitoring recommendations for the entire PNP coast (bycell) are summarised in Table 52.

Damara WA Pty Ltd
245 02 PNP Coastal Monitoring Action Plan Rev 0.docx 59
Table 23: CMAP Protocol Application for Cape Peron to Bird Island
Cell Identifier R06D14.c (see Figure 21)Location Cape Peron to Bird IslandLGA RockinghamPhysical Vulnerability Moderate erosion associated with movement of salientInfrastructure Presence One building within 11m, three shacks within 25m, Point
Peron Rd within 25mActive Coastal Processes Salient response implies high importance of plan form
measurementDecision making Time Frame 5 yearsMinimum Monitoring Level 11) Photographic Monitoring Monthly monitoring to cover beaches2) Beach Widths 1. North – Existing Track (TBA)
2. Pt Peron Rd3) Oblique Imagery Annual or twice yearly4) Vertical Imagery Every 5 to 10 years
Table 24: CMAP Protocol Application for Bird Island to Seal Island
Cell Identifier R06D14.b (see Figure 21)Location Bird Island to Seal IslandLGA RockinghamPhysical Vulnerability Moderate erosion associated with movement of salient
(north) and general retreat (central)Infrastructure Presence Arcadia Drive within 10m, shacks within 25mActive Coastal Processes Salient response implies importance of plan form
measurementDecision making Time Frame 5 yearsMinimum Monitoring Level 11) Photographic Monitoring Monthly monitoring to cover beach area2) Beach Widths Annual or twice
yearly1. Todd Ave2. Boundary Rd3. Gloucester Ave
3) Oblique Imagery Annual or twice yearly4) Vertical Imagery Every 5 to 10 years
Damara WA Pty Ltd
245 02 PNP Coastal Monitoring Action Plan Rev 0.docx 60
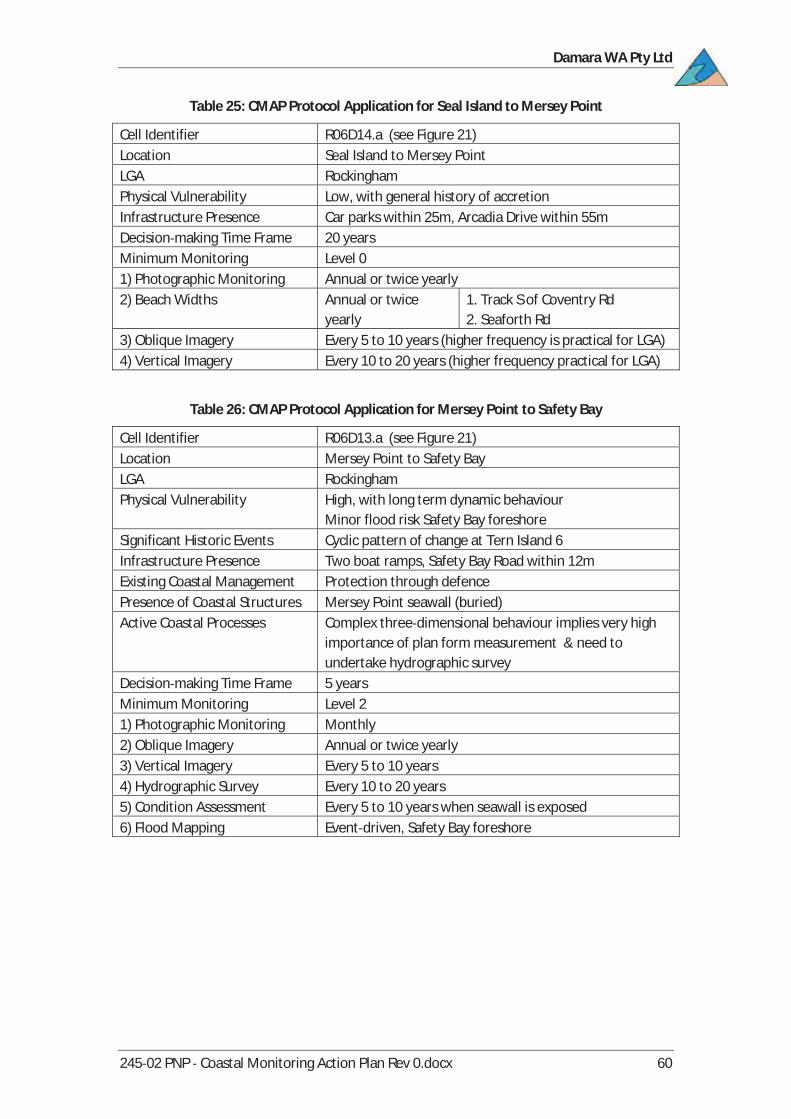
Table 25: CMAP Protocol Application for Seal Island to Mersey Point
Cell Identifier R06D14.a (see Figure 21)Location Seal Island to Mersey PointLGA RockinghamPhysical Vulnerability Low, with general history of accretionInfrastructure Presence Car parks within 25m, Arcadia Drive within 55mDecision making Time Frame 20 yearsMinimum Monitoring Level 01) Photographic Monitoring Annual or twice yearly2) Beach Widths Annual or twice
yearly1. Track S of Coventry Rd2. Seaforth Rd
3) Oblique Imagery Every 5 to 10 years (higher frequency is practical for LGA)4) Vertical Imagery Every 10 to 20 years (higher frequency practical for LGA)
Table 26: CMAP Protocol Application for Mersey Point to Safety Bay
Cell Identifier R06D13.a (see Figure 21)Location Mersey Point to Safety BayLGA RockinghamPhysical Vulnerability High, with long term dynamic behaviour
Minor flood risk Safety Bay foreshoreSignificant Historic Events Cyclic pattern of change at Tern Island 6Infrastructure Presence Two boat ramps, Safety Bay Road within 12mExisting Coastal Management Protection through defencePresence of Coastal Structures Mersey Point seawall (buried)Active Coastal Processes Complex three dimensional behaviour implies very high
importance of plan form measurement & need toundertake hydrographic survey
Decision making Time Frame 5 yearsMinimum Monitoring Level 21) Photographic Monitoring Monthly2) Oblique Imagery Annual or twice yearly3) Vertical Imagery Every 5 to 10 years4) Hydrographic Survey Every 10 to 20 years5) Condition Assessment Every 5 to 10 years when seawall is exposed6) Flood Mapping Event driven, Safety Bay foreshore

Damara WA Pty Ltd
245 02 PNP Coastal Monitoring Action Plan Rev 0.docx 61
Figure 21: Woodman Point to Mersey Point, Secondary Cells 12 to 20
Damara WA Pty Ltd
245 02 PNP Coastal Monitoring Action Plan Rev 0.docx 62
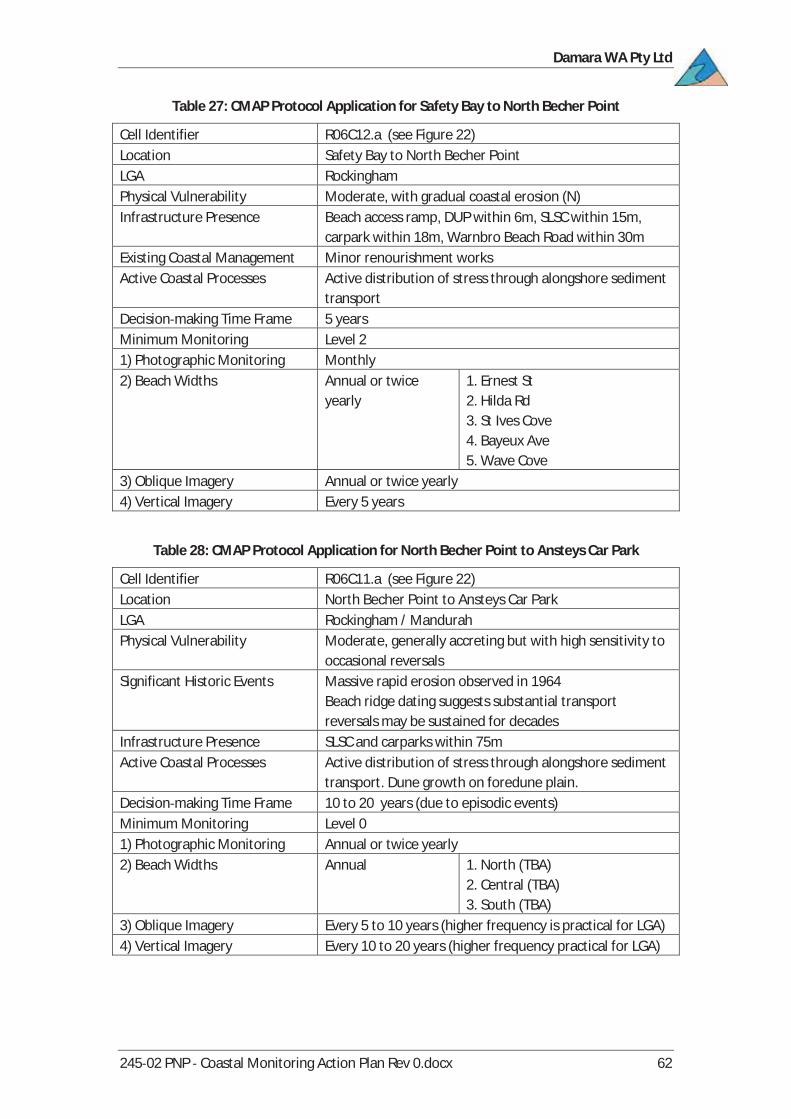
Table 27: CMAP Protocol Application for Safety Bay to North Becher Point
Cell Identifier R06C12.a (see Figure 22)Location Safety Bay to North Becher PointLGA RockinghamPhysical Vulnerability Moderate, with gradual coastal erosion (N)Infrastructure Presence Beach access ramp, DUP within 6m, SLSC within 15m,
carpark within 18m, Warnbro Beach Road within 30mExisting Coastal Management Minor renourishment worksActive Coastal Processes Active distribution of stress through alongshore sediment
transportDecision making Time Frame 5 yearsMinimum Monitoring Level 21) Photographic Monitoring Monthly2) Beach Widths Annual or twice
yearly1. Ernest St2. Hilda Rd3. St Ives Cove4. Bayeux Ave5. Wave Cove
3) Oblique Imagery Annual or twice yearly4) Vertical Imagery Every 5 years
Table 28: CMAP Protocol Application for North Becher Point to Ansteys Car Park
Cell Identifier R06C11.a (see Figure 22)Location North Becher Point to Ansteys Car ParkLGA Rockingham / MandurahPhysical Vulnerability Moderate, generally accreting but with high sensitivity to
occasional reversalsSignificant Historic Events Massive rapid erosion observed in 1964
Beach ridge dating suggests substantial transportreversals may be sustained for decades
Infrastructure Presence SLSC and carparks within 75mActive Coastal Processes Active distribution of stress through alongshore sediment
transport. Dune growth on foredune plain.Decision making Time Frame 10 to 20 years (due to episodic events)Minimum Monitoring Level 01) Photographic Monitoring Annual or twice yearly2) Beach Widths Annual 1. North (TBA)
2. Central (TBA)3. South (TBA)
3) Oblique Imagery Every 5 to 10 years (higher frequency is practical for LGA)4) Vertical Imagery Every 10 to 20 years (higher frequency practical for LGA)

Damara WA Pty Ltd
245 02 PNP Coastal Monitoring Action Plan Rev 0.docx 63
Table 29: CMAP Protocol Application for Ansteys Car Park to San Remo
Cell Identifier R06C10.b (see Figure 22)Location Ansteys Car Park to San RemoLGA RockinghamPhysical Vulnerability Moderate, with history of transferred erosionSignificant Historic Events San Remo groyne built in 2005Infrastructure Presence Car parks within 15m, Sabina Drive within 35mExisting Coastal Management Occasional dune managementPresence of Coastal Structures San Remo groyneActive Coastal Processes Active distribution of sediment by alongshore transport.Decision making Time Frame 5 to 10 yearsMinimum Monitoring Level 11) Photographic Monitoring Monthly2) Beach Widths Annual or twice yearly 1. Palisades Blvd
2. Bight Reefs Rd3. Madora Beach Rd
3) Beach Profiles Twice yearly4) Oblique Imagery Annual or twice yearly5) Vertical Imagery Every 5 to 10 years6) Condition Assessment Every 5 years
Table 30: CMAP Protocol Application for San Remo to Roberts Point
Cell Identifier R06C10.a (see Figure 22)Location San Remo to Roberts PointLGA MandurahPhysical Vulnerability High, with history of transferred erosionSignificant Historic Events Successive phases of groyne & seawall construction, with
stresses in 1970s and intermittently from 1995 stormsInfrastructure Presence Ormsby Terrace within 15m, housing within 20 to 40mExisting Coastal Management Annual sand bypassing, dune management, sea defencesPresence of Coastal Structures northern beaches groyne field, Seashells seawall,
entrance seawall and training walls, Janis St groyneActive Coastal Processes Structures limit meaning of beach widths. Dune fencing
limits interpretation of vegetation linesDecision making Time Frame AnnualMinimum Monitoring Level 31) Photographic Monitoring Monthly or fortnightly2) Beach Widths*may be extracted from profiles
Annual or twice yearly 1. Acheron Rd2. Cook St/Wade St3. Stewart St
3) Beach Profiles Twice yearly4) Oblique Imagery Annual or twice yearly5) Vertical Imagery Annual6) Hydrographic Surveys Annual (nearshore), 5 yearly (further offshore)7) Condition Assessment Every 5 years

Damara WA Pty Ltd
245 02 PNP Coastal Monitoring Action Plan Rev 0.docx 64
Figure 22: Mersey Point to Robert Point, Secondary Cells 10 to 13

Damara WA Pty Ltd
245 02 PNP Coastal Monitoring Action Plan Rev 0.docx 65
Table 31: CMAP Protocol Application for Robert Point to Dawesville
Cell Identifier R06C9.b (see Figure 23)Location Robert Point to DawesvilleLGA MandurahPhysical Vulnerability Limited due to rock features
Locally high sensitivity to bypassing at Falcon & AvalonSignificant Historic Events Increased sensitivity following construction of Dawesville
Channel, completed in 1994Infrastructure Presence Hall Head Parade, Rakoa Street, Gretel Drive and
Spinaway Parade within 25mExisting Coastal Management Influenced by Dawesville annual sand bypassingActive Coastal Processes Structural controls encourage vertical rather than
horizontal beach change, limiting use of beach widths.Decision making Time Frame AnnualMinimum Monitoring Level 21) Photographic Monitoring Monthly2) Beach Widths*may be extracted from profiles
Annual or twice yearly 1. Oversby St2. Daydream Plaza3. Philante St4. Mercedes Ave5. Cesia Lane
3) Beach Profiles Limited to Falcon & Avalon every 5 years4) Oblique Imagery Annual or twice yearly5) Vertical Imagery Every 5 years6) Hydrographic Surveys Every 5 years
Damara WA Pty Ltd
245 02 PNP Coastal Monitoring Action Plan Rev 0.docx 66
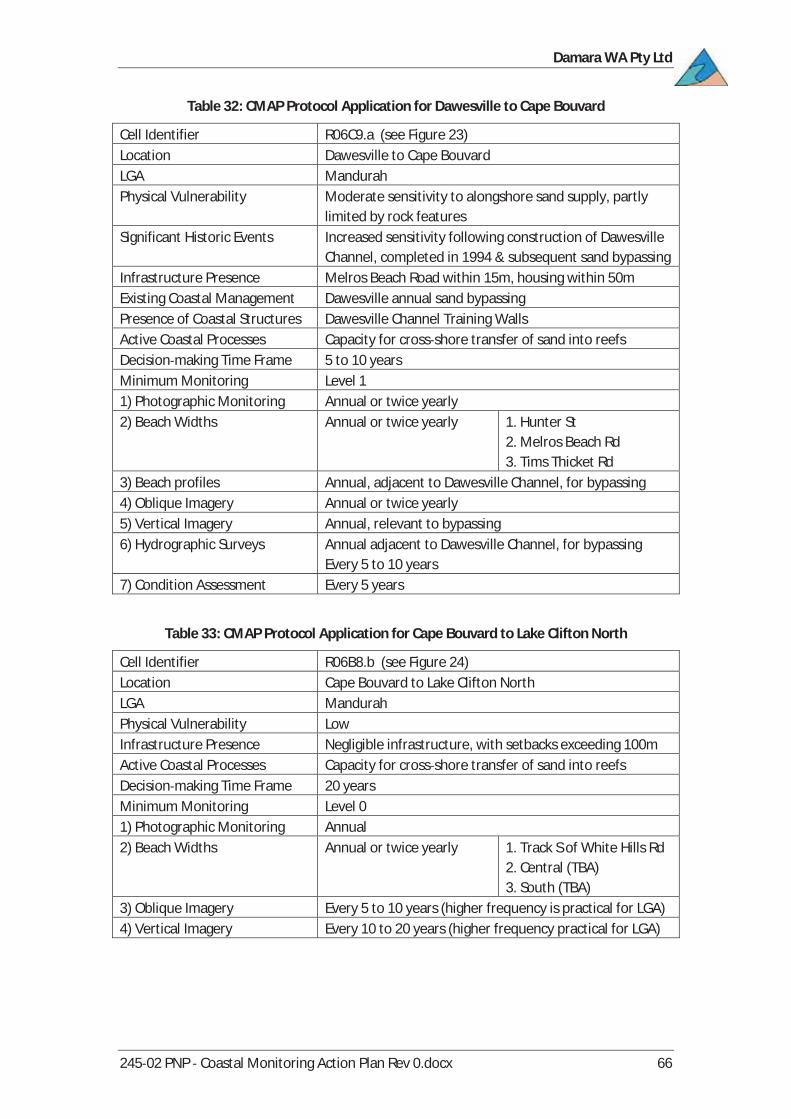
Table 32: CMAP Protocol Application for Dawesville to Cape Bouvard
Cell Identifier R06C9.a (see Figure 23)Location Dawesville to Cape BouvardLGA MandurahPhysical Vulnerability Moderate sensitivity to alongshore sand supply, partly
limited by rock featuresSignificant Historic Events Increased sensitivity following construction of Dawesville
Channel, completed in 1994 & subsequent sand bypassingInfrastructure Presence Melros Beach Road within 15m, housing within 50mExisting Coastal Management Dawesville annual sand bypassingPresence of Coastal Structures Dawesville Channel Training WallsActive Coastal Processes Capacity for cross shore transfer of sand into reefsDecision making Time Frame 5 to 10 yearsMinimum Monitoring Level 11) Photographic Monitoring Annual or twice yearly2) Beach Widths Annual or twice yearly 1. Hunter St
2. Melros Beach Rd3. Tims Thicket Rd
3) Beach profiles Annual, adjacent to Dawesville Channel, for bypassing4) Oblique Imagery Annual or twice yearly5) Vertical Imagery Annual, relevant to bypassing6) Hydrographic Surveys Annual adjacent to Dawesville Channel, for bypassing
Every 5 to 10 years7) Condition Assessment Every 5 years
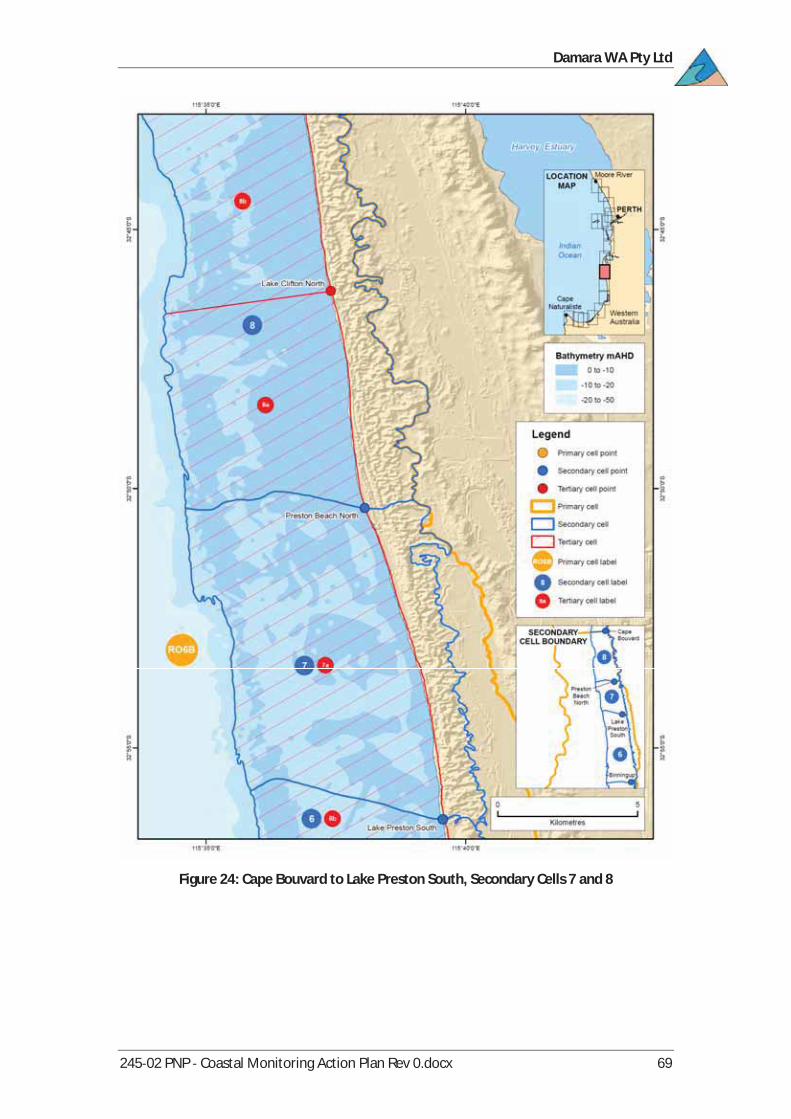
Table 33: CMAP Protocol Application for Cape Bouvard to Lake Clifton North
Cell Identifier R06B8.b (see Figure 24)Location Cape Bouvard to Lake Clifton NorthLGA MandurahPhysical Vulnerability LowInfrastructure Presence Negligible infrastructure, with setbacks exceeding 100mActive Coastal Processes Capacity for cross shore transfer of sand into reefsDecision making Time Frame 20 yearsMinimum Monitoring Level 01) Photographic Monitoring Annual2) Beach Widths Annual or twice yearly 1. Track S of White Hills Rd
2. Central (TBA)3. South (TBA)
3) Oblique Imagery Every 5 to 10 years (higher frequency is practical for LGA)4) Vertical Imagery Every 10 to 20 years (higher frequency practical for LGA)

Damara WA Pty Ltd
245 02 PNP Coastal Monitoring Action Plan Rev 0.docx 67
Figure 23: Robert Point to Cape Bouvard, Secondary Cell 9

Damara WA Pty Ltd
245 02 PNP Coastal Monitoring Action Plan Rev 0.docx 68
Table 34: CMAP Protocol Application for Lake Clifton North to Preston Beach North
Cell Identifier R06B8.a (see Figure 24)Location Lake Clifton North to Preston Beach NorthLGA Mandurah / WaroonaPhysical Vulnerability LowInfrastructure Presence Negligible infrastructure, with setbacks exceeding 100mActive Coastal Processes Capacity for cross shore transfer of sand into reefsDecision making Time Frame 20 yearsMinimum Monitoring Level 01) Photographic Monitoring Annual2) Beach Widths Annual or twice yearly 1. W of Boundary Lake
2. W of Lake Clifton Airstrip3. W of Lake Pollard
3) Oblique Imagery Every 5 to 10 years (higher frequency is practical for LGA)4) Vertical Imagery Every 10 to 20 years (higher frequency practical for LGA)
Table 35: CMAP Protocol Application for Preston Beach North to Lake Preston South
Cell Identifier R06B7.a (see Figure 24)Location Preston Beach North to Lake Preston SouthLGA WaroonaPhysical Vulnerability Low, with high sensitivity to dune mobilityInfrastructure Presence Limited. Preston Beach car park within 80m, building
setbacks exceed 200mActive Coastal Processes Capacity for cross shore transfer of sand into reefs
Sand sheet movement within nearshore lagoonMobile coastal dunes
Decision making Time Frame 20 yearsMinimum Monitoring Level 01) Photographic Monitoring Annual2) Beach Widths Annual or twice yearly 1. North (TBA)
2. Mitchell Rd3. South (TBA)
3) Oblique Imagery Every 5 to 10 years (higher frequency is practical for LGA)4) Vertical Imagery Every 10 to 20 years (higher frequency practical for LGA)5) Dune monitoring Annual
Damara WA Pty Ltd
245 02 PNP Coastal Monitoring Action Plan Rev 0.docx 69
Figure 24: Cape Bouvard to Lake Preston South, Secondary Cells 7 and 8
Damara WA Pty Ltd
245 02 PNP Coastal Monitoring Action Plan Rev 0.docx 70
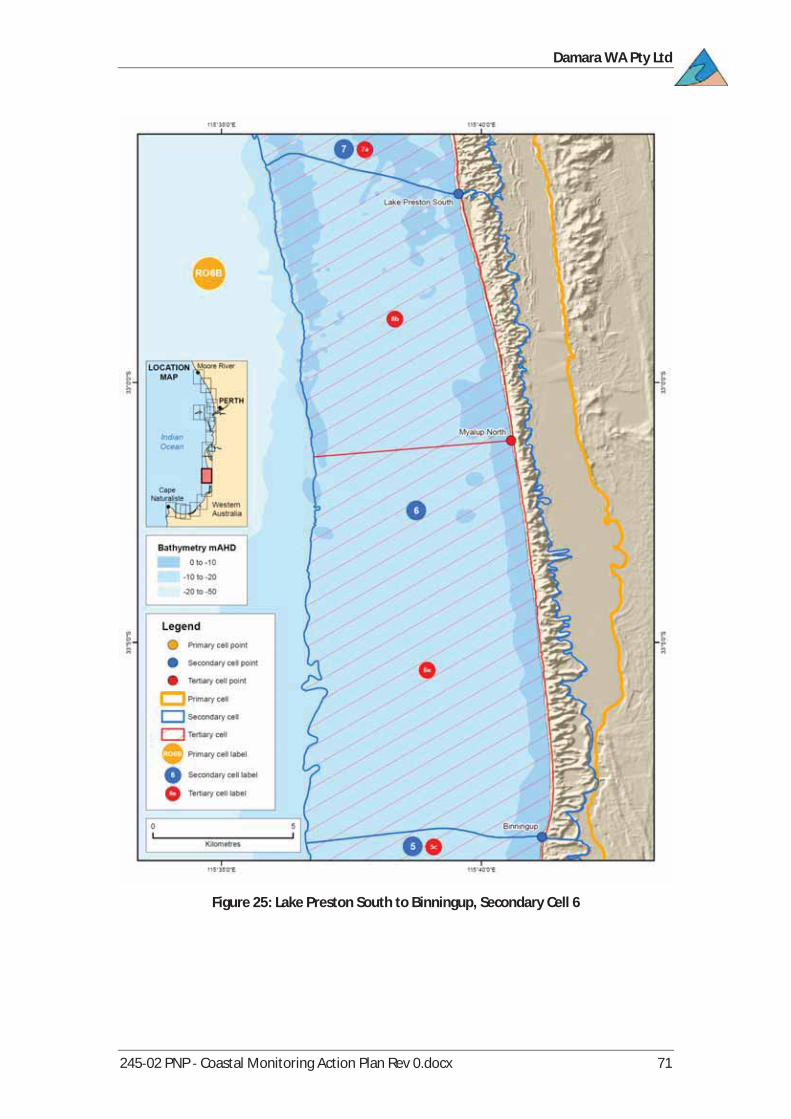
Table 36: CMAP Protocol Application for Lake Preston South to Myalup North
Cell Identifier R06B6.b (see Figure 25)Location Lake Preston South to Myalup NorthLGA Waroona / HarveyPhysical Vulnerability Moderate to high, with long term and modern history
both erosional. High sensitivity to dune mobility.Significant Historic Events Transferred erosion in 1980s and 1990s following severe
erosion to the southInfrastructure Presence Negligible infrastructure, with setbacks exceeding 100mActive Coastal Processes Mobile coastal dunesDecision making Time Frame 5 to 10 yearsMinimum Monitoring Level 11) Photographic Monitoring Monthly, for indicator sites2) Beach Widths Annual or twice yearly 1. North (TBA)
2. Central (TBA)3. South (TBA)
3) Oblique Imagery Annual or twice yearly4) Vertical Imagery Every 5 to 10 years5) Dune monitoring Annual
Table 37: CMAP Protocol Application for Preston Beach North to Lake Preston South
Cell Identifier R06B6.a (see Figure 25)Location Myalup North to BinningupLGA HarveyPhysical Vulnerability High, with long term erosional structure and modern
history of acute erosion. High sensitivity to dune mobility.Significant Historic Events Rapid erosion between 1955 and 1972
Dune destabilisation following industrial waste disposalInfrastructure Presence Binningup beach ramp, Harvey Diversion, Indian Ocean
Drive within 55m, Southern Seawater Alliancedesalination plant pipeline leads to inshore risers
Presence of Coastal Structures Binningup beach rampActive Coastal Processes Mobile coastal dunesDecision making Time Frame 5 to 10 years, with Annual at Binningup beach rampMinimum Monitoring Level 11) Photographic Monitoring Monthly, for indicator sites2) Beach Widths Annual or twice yearly 1. W of ‘causeway’
2. Myalup3. West Coast Drive
3) Oblique Imagery Annual or twice yearly4) Vertical Imagery Every 5 to 10 years5) Dune monitoring AnnualLocal Monitoring Binningup beach ramp6) Beach profiles / crest line Annual (Sep Oct)
Damara WA Pty Ltd
245 02 PNP Coastal Monitoring Action Plan Rev 0.docx 71
Figure 25: Lake Preston South to Binningup, Secondary Cell 6
Damara WA Pty Ltd
245 02 PNP Coastal Monitoring Action Plan Rev 0.docx 72
Table 38: CMAP Protocol Application for Binningup to Buffalo Road
Cell Identifier R06B5.c (see Figure 26)Location Binningup to Buffalo RoadLGA HarveyPhysical Vulnerability Moderate, long term erosion locally offset by rock
platform. High sensitivity to dune mobility.Dune destabilisation following industrial waste disposal
Infrastructure Presence Negligible infrastructure, with setbacks exceeding 100mActive Coastal Processes Mobile coastal dunesDecision making Time Frame 5 to 10 yearsMinimum Monitoring Level 11) Photographic Monitoring Monthly, for indicator sites2) Beach Widths Annual or twice yearly 1. Valentine Rd
2. Central, N of blowouts3. Buffalo Rd, S of blowouts
3) Oblique Imagery Annual or twice yearly4) Vertical Imagery Every 5 to 10 years5) Dune monitoring Annual
Table 39: CMAP Protocol Application for Buffalo Road to Leschenault South
Cell Identifier R06B5.b (see Figure 26)Location Buffalo Road to Leschenault SouthLGA HarveyPhysical Vulnerability Moderate, long term erosion. High sensitivity to dune
mobility.Significant Historic Events Dune destabilisation following industrial waste disposalInfrastructure Presence Negligible infrastructure, car park within 50mActive Coastal Processes Mobile coastal dunesDecision making Time Frame 5 to 10 yearsMinimum Monitoring Level 11) Photographic Monitoring Monthly, for indicator sites2) Beach Widths Annual or twice yearly 1. S of Buffalo Rd access
2. Access track3. South (TBA)
3) Oblique Imagery Annual or twice yearly4) Vertical Imagery Every 5 to 10 years5) Dune monitoring Annual
Damara WA Pty Ltd
245 02 PNP Coastal Monitoring Action Plan Rev 0.docx 73
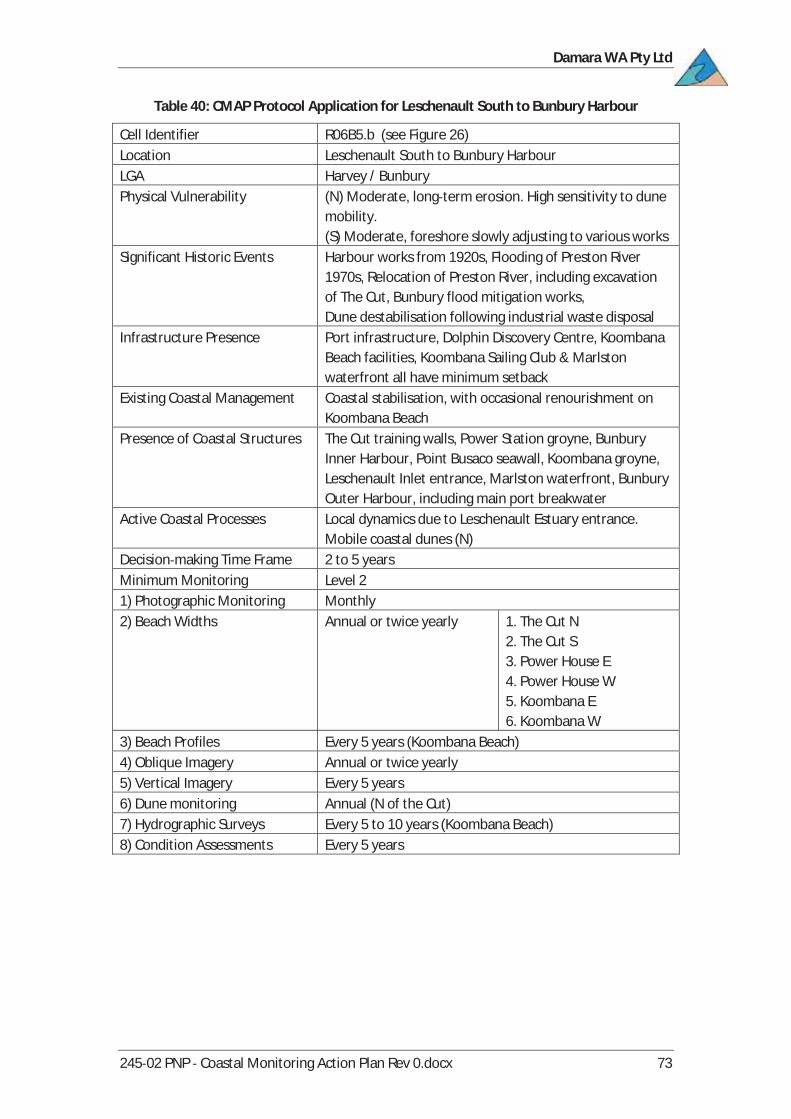
Table 40: CMAP Protocol Application for Leschenault South to Bunbury Harbour
Cell Identifier R06B5.b (see Figure 26)Location Leschenault South to Bunbury HarbourLGA Harvey / BunburyPhysical Vulnerability (N) Moderate, long term erosion. High sensitivity to dune
mobility.(S) Moderate, foreshore slowly adjusting to various works
Significant Historic Events Harbour works from 1920s, Flooding of Preston River1970s, Relocation of Preston River, including excavationof The Cut, Bunbury flood mitigation works,Dune destabilisation following industrial waste disposal
Infrastructure Presence Port infrastructure, Dolphin Discovery Centre, KoombanaBeach facilities, Koombana Sailing Club & Marlstonwaterfront all have minimum setback
Existing Coastal Management Coastal stabilisation, with occasional renourishment onKoombana Beach
Presence of Coastal Structures The Cut training walls, Power Station groyne, BunburyInner Harbour, Point Busaco seawall, Koombana groyne,Leschenault Inlet entrance, Marlston waterfront, BunburyOuter Harbour, including main port breakwater
Active Coastal Processes Local dynamics due to Leschenault Estuary entrance.Mobile coastal dunes (N)
Decision making Time Frame 2 to 5 yearsMinimum Monitoring Level 21) Photographic Monitoring Monthly2) Beach Widths Annual or twice yearly 1. The Cut N
2. The Cut S3. Power House E4. Power House W5. Koombana E6. Koombana W
3) Beach Profiles Every 5 years (Koombana Beach)4) Oblique Imagery Annual or twice yearly5) Vertical Imagery Every 5 years6) Dune monitoring Annual (N of the Cut)7) Hydrographic Surveys Every 5 to 10 years (Koombana Beach)8) Condition Assessments Every 5 years
Damara WA Pty Ltd
245 02 PNP Coastal Monitoring Action Plan Rev 0.docx 74
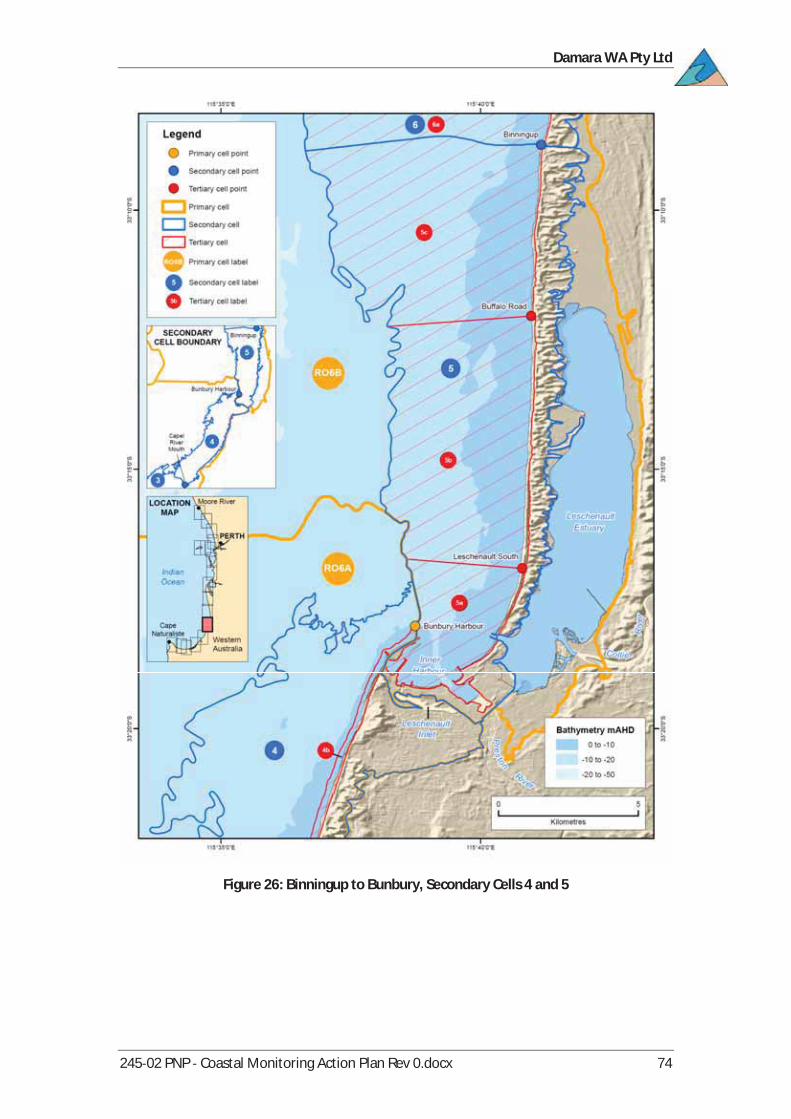
Figure 26: Binningup to Bunbury, Secondary Cells 4 and 5

Damara WA Pty Ltd
245 02 PNP Coastal Monitoring Action Plan Rev 0.docx 75
Table 41: CMAP Protocol Application for Bunbury Harbour to Stirling Beach
Cell Identifier R06A4.b (see Figure 27)Location Bunbury Harbour to Stirling BeachLGA Bunbury / CapelPhysical Vulnerability Moderate, with sensitivity to storm events but extensive
presence of rock features. High sensitivity to dunemobility S of Bunbury.
Significant Historic Events Repeated phases of acute erosionInfrastructure Presence Ocean Drive within 10m, larger setback for Dalyellup,
flood diversion drain outletPresence of Coastal Structures Surf Club flexmat seawallActive Coastal Processes Active distribution of stress through alongshore sediment
transport. Dune mobility.Decision making Time Frame Annual * (highly episodic)Minimum Monitoring Level 21) Photographic Monitoring Monthly2) Beach Widths Annual or twice yearly 1. Beach Rd
2. Norton Promenade3. Hutt Dr
3) Beach Profiles Following severe erosion events (Back Beach)4) Oblique Imagery Annual or twice yearly5) Vertical Imagery Every 5 years6) Dune monitoring Annual (S of Bunbury)7) Condition Assessments Every 5 years, if seawall is exposed
Table 42: CMAP Protocol Application for Stirling Beach to Capel River Mouth
Cell Identifier R06A4.a (see Figure 27)Location Stirling Beach to Capel River MouthLGA CapelPhysical Vulnerability Low, with historic slow accretion. Moderate sensitivity to
dune mobility, with risk of breaching to lowlandsInfrastructure Presence Limited infrastructure, carpark, buildings within 60mExisting Coastal Management Dune stabilisationActive Coastal Processes Active distribution of stress through alongshore sediment
transport. Dune processes active adjacent to lowlands.Decision making Time Frame 5 to 10 yearsMinimum Monitoring Level 11) Photographic Monitoring Monthly (indicator points)2) Beach Widths Annual or twice yearly 1. North (TBA)
2. South (TBA)3) Oblique Imagery Annual or twice yearly4) Vertical Imagery Every 5 years5) Dune monitoring Annual6) Flood Mapping Following extreme flood events
Damara WA Pty Ltd
245 02 PNP Coastal Monitoring Action Plan Rev 0.docx 76
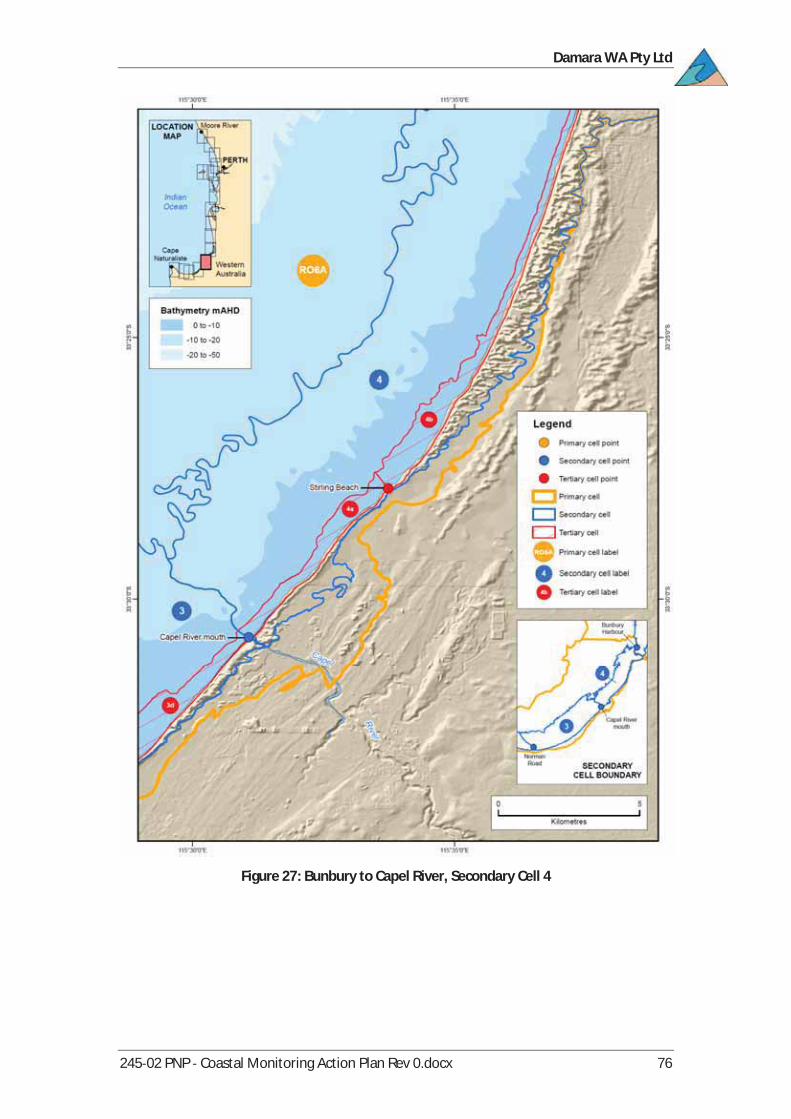
Figure 27: Bunbury to Capel River, Secondary Cell 4
Damara WA Pty Ltd
245 02 PNP Coastal Monitoring Action Plan Rev 0.docx 77
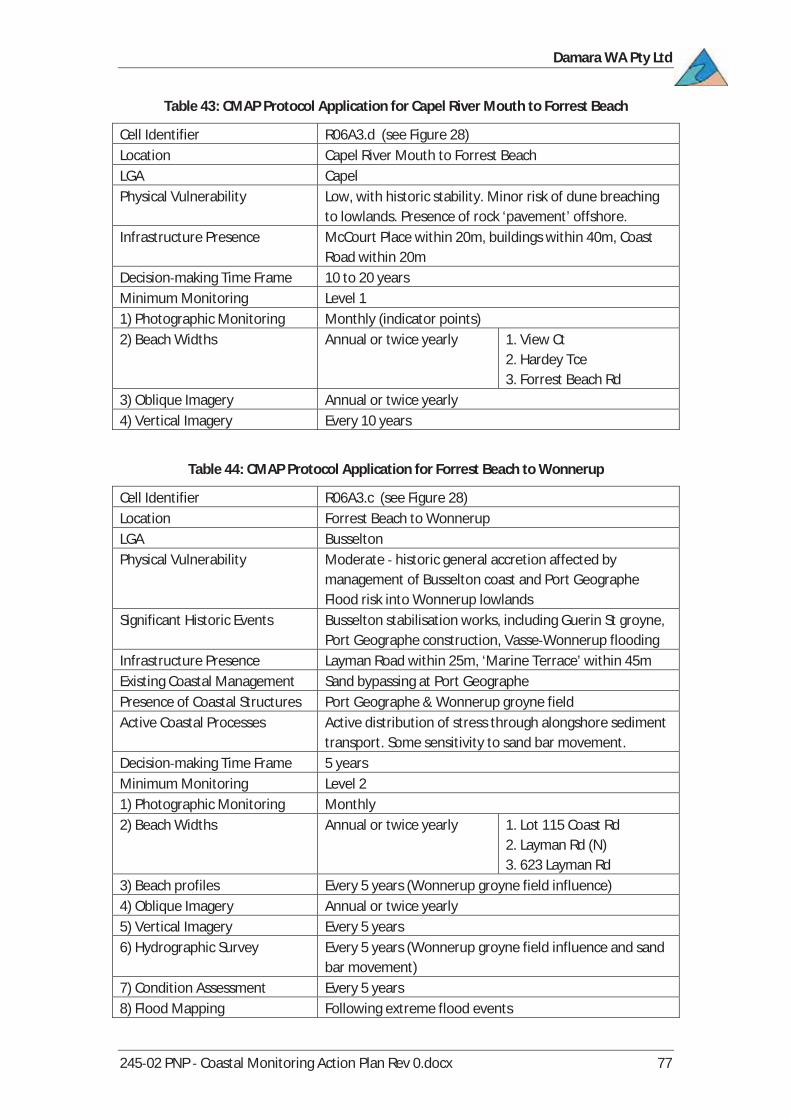
Table 43: CMAP Protocol Application for Capel River Mouth to Forrest Beach
Cell Identifier R06A3.d (see Figure 28)Location Capel River Mouth to Forrest BeachLGA CapelPhysical Vulnerability Low, with historic stability. Minor risk of dune breaching
to lowlands. Presence of rock ‘pavement’ offshore.Infrastructure Presence McCourt Place within 20m, buildings within 40m, Coast
Road within 20mDecision making Time Frame 10 to 20 yearsMinimum Monitoring Level 11) Photographic Monitoring Monthly (indicator points)2) Beach Widths Annual or twice yearly 1. View Ct
2. Hardey Tce3. Forrest Beach Rd
3) Oblique Imagery Annual or twice yearly4) Vertical Imagery Every 10 years
Table 44: CMAP Protocol Application for Forrest Beach to Wonnerup
Cell Identifier R06A3.c (see Figure 28)Location Forrest Beach to WonnerupLGA BusseltonPhysical Vulnerability Moderate historic general accretion affected by
management of Busselton coast and Port GeographeFlood risk into Wonnerup lowlands
Significant Historic Events Busselton stabilisation works, including Guerin St groyne,Port Geographe construction, Vasse Wonnerup flooding
Infrastructure Presence Layman Road within 25m, ‘Marine Terrace’ within 45mExisting Coastal Management Sand bypassing at Port GeographePresence of Coastal Structures Port Geographe & Wonnerup groyne fieldActive Coastal Processes Active distribution of stress through alongshore sediment
transport. Some sensitivity to sand bar movement.Decision making Time Frame 5 yearsMinimum Monitoring Level 21) Photographic Monitoring Monthly2) Beach Widths Annual or twice yearly 1. Lot 115 Coast Rd
2. Layman Rd (N)3. 623 Layman Rd
3) Beach profiles Every 5 years (Wonnerup groyne field influence)4) Oblique Imagery Annual or twice yearly5) Vertical Imagery Every 5 years6) Hydrographic Survey Every 5 years (Wonnerup groyne field influence and sand
bar movement)7) Condition Assessment Every 5 years8) Flood Mapping Following extreme flood events

Damara WA Pty Ltd
245 02 PNP Coastal Monitoring Action Plan Rev 0.docx 78
Figure 28: Capel River to Wonnerup, Secondary Cell 3 (East)
Damara WA Pty Ltd
245 02 PNP Coastal Monitoring Action Plan Rev 0.docx 79
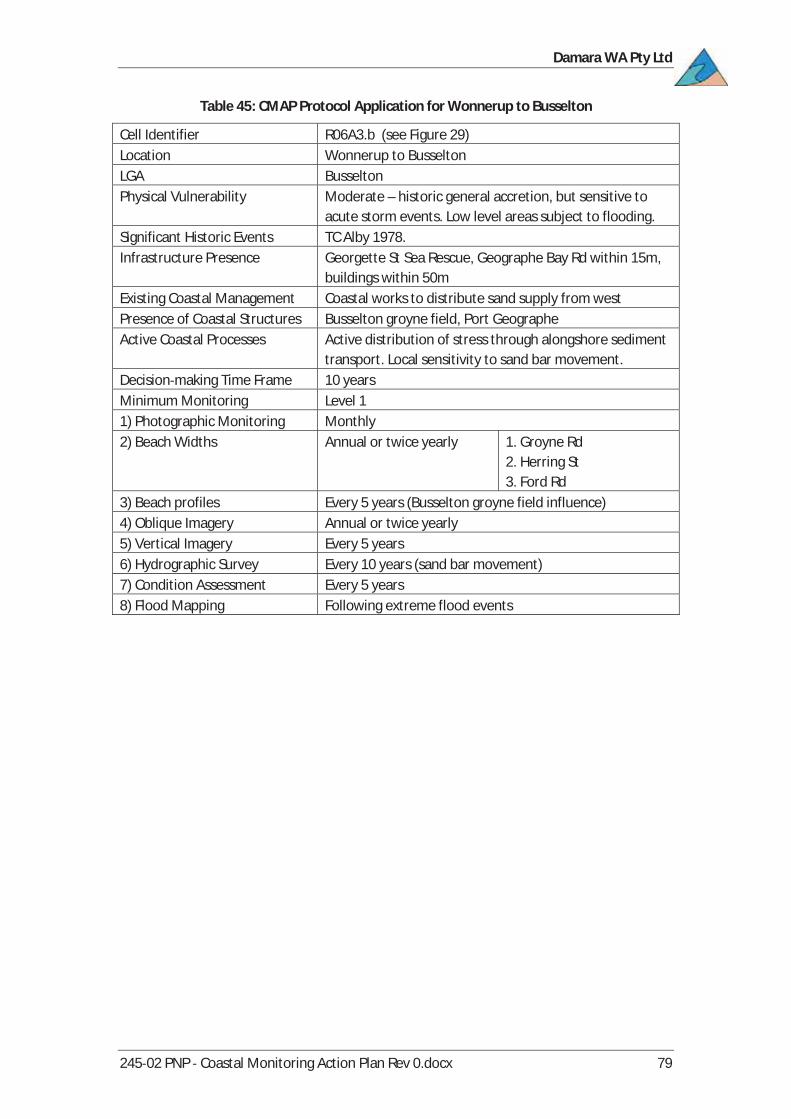
Table 45: CMAP Protocol Application for Wonnerup to Busselton
Cell Identifier R06A3.b (see Figure 29)Location Wonnerup to BusseltonLGA BusseltonPhysical Vulnerability Moderate – historic general accretion, but sensitive to
acute storm events. Low level areas subject to flooding.Significant Historic Events TC Alby 1978.Infrastructure Presence Georgette St Sea Rescue, Geographe Bay Rd within 15m,
buildings within 50mExisting Coastal Management Coastal works to distribute sand supply from westPresence of Coastal Structures Busselton groyne field, Port GeographeActive Coastal Processes Active distribution of stress through alongshore sediment
transport. Local sensitivity to sand bar movement.Decision making Time Frame 10 yearsMinimum Monitoring Level 11) Photographic Monitoring Monthly2) Beach Widths Annual or twice yearly 1. Groyne Rd
2. Herring St3. Ford Rd
3) Beach profiles Every 5 years (Busselton groyne field influence)4) Oblique Imagery Annual or twice yearly5) Vertical Imagery Every 5 years6) Hydrographic Survey Every 10 years (sand bar movement)7) Condition Assessment Every 5 years8) Flood Mapping Following extreme flood events
Damara WA Pty Ltd
245 02 PNP Coastal Monitoring Action Plan Rev 0.docx 80
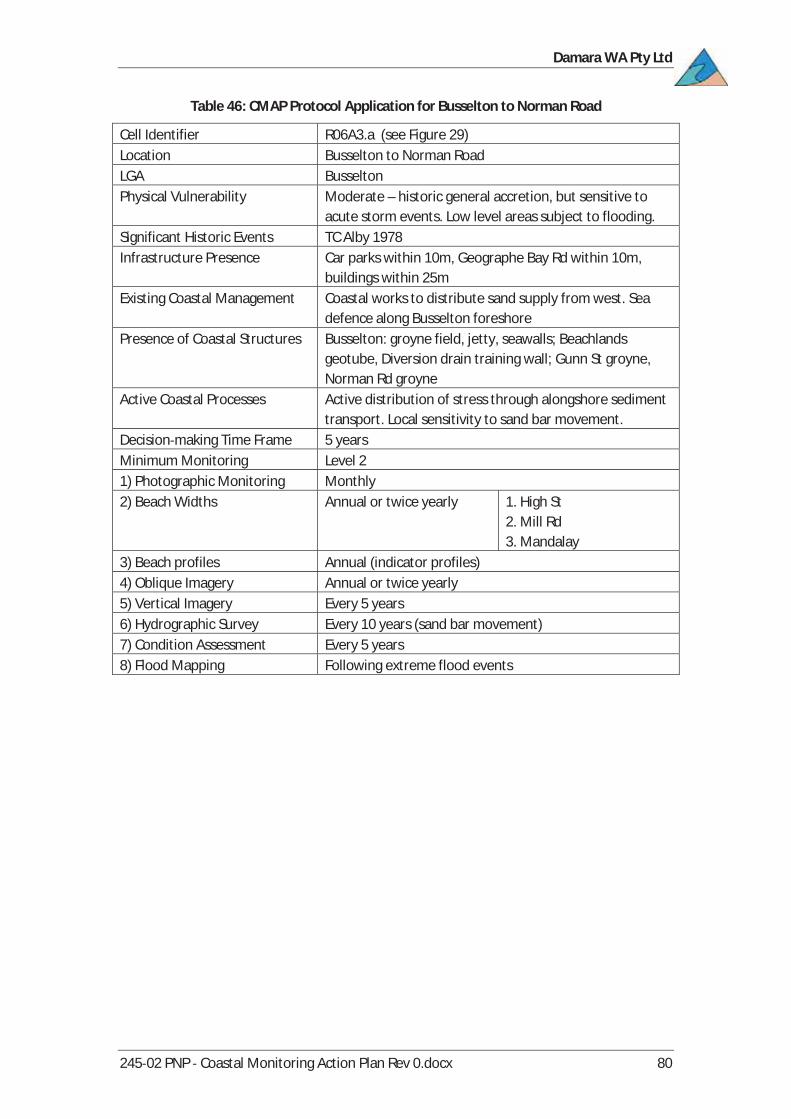
Table 46: CMAP Protocol Application for Busselton to Norman Road
Cell Identifier R06A3.a (see Figure 29)Location Busselton to Norman RoadLGA BusseltonPhysical Vulnerability Moderate – historic general accretion, but sensitive to
acute storm events. Low level areas subject to flooding.Significant Historic Events TC Alby 1978Infrastructure Presence Car parks within 10m, Geographe Bay Rd within 10m,
buildings within 25mExisting Coastal Management Coastal works to distribute sand supply from west. Sea
defence along Busselton foreshorePresence of Coastal Structures Busselton: groyne field, jetty, seawalls; Beachlands
geotube, Diversion drain training wall; Gunn St groyne,Norman Rd groyne
Active Coastal Processes Active distribution of stress through alongshore sedimenttransport. Local sensitivity to sand bar movement.
Decision making Time Frame 5 yearsMinimum Monitoring Level 21) Photographic Monitoring Monthly2) Beach Widths Annual or twice yearly 1. High St
2. Mill Rd3. Mandalay
3) Beach profiles Annual (indicator profiles)4) Oblique Imagery Annual or twice yearly5) Vertical Imagery Every 5 years6) Hydrographic Survey Every 10 years (sand bar movement)7) Condition Assessment Every 5 years8) Flood Mapping Following extreme flood events
Damara WA Pty Ltd
245 02 PNP Coastal Monitoring Action Plan Rev 0.docx 81
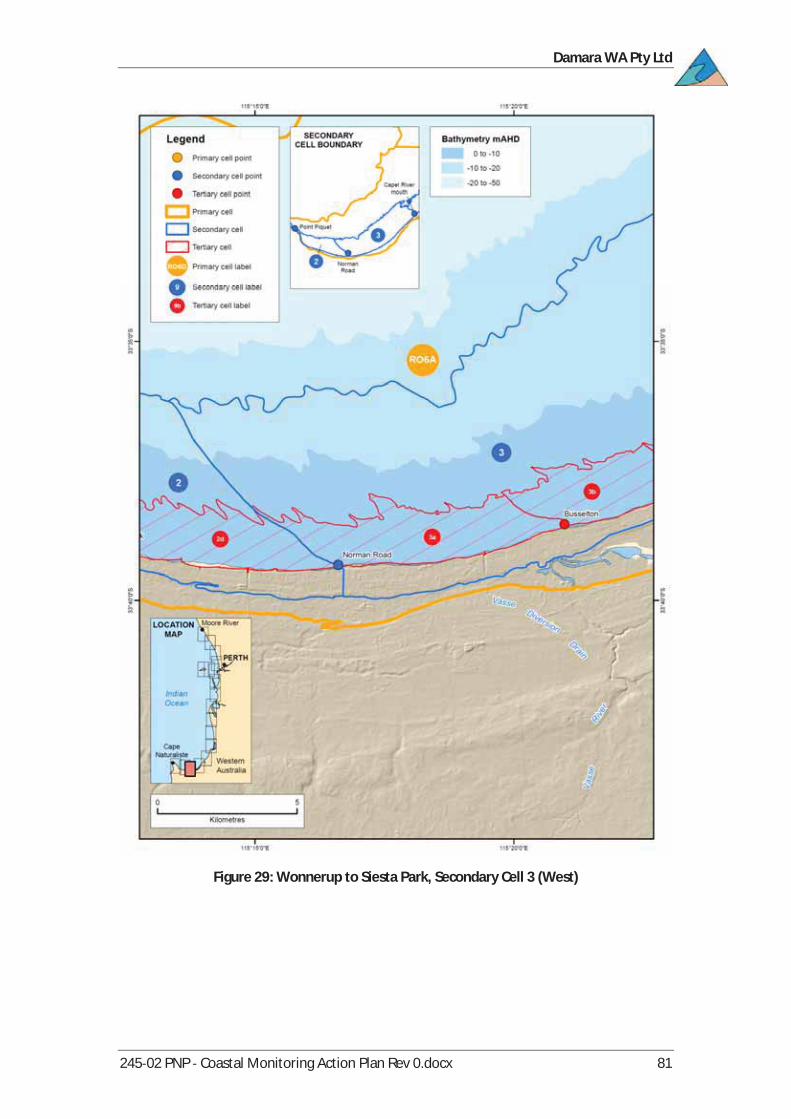
Figure 29: Wonnerup to Siesta Park, Secondary Cell 3 (West)
Damara WA Pty Ltd
245 02 PNP Coastal Monitoring Action Plan Rev 0.docx 82
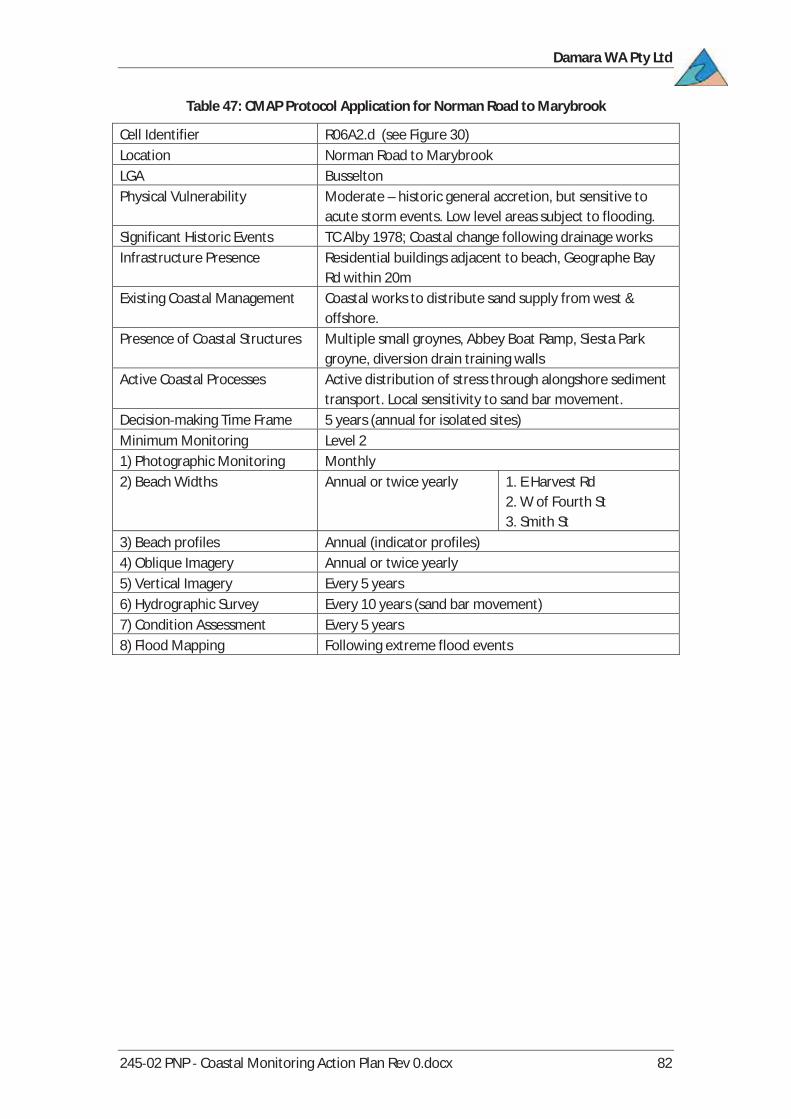
Table 47: CMAP Protocol Application for Norman Road to Marybrook
Cell Identifier R06A2.d (see Figure 30)Location Norman Road to MarybrookLGA BusseltonPhysical Vulnerability Moderate – historic general accretion, but sensitive to
acute storm events. Low level areas subject to flooding.Significant Historic Events TC Alby 1978; Coastal change following drainage worksInfrastructure Presence Residential buildings adjacent to beach, Geographe Bay
Rd within 20mExisting Coastal Management Coastal works to distribute sand supply from west &
offshore.Presence of Coastal Structures Multiple small groynes, Abbey Boat Ramp, Siesta Park
groyne, diversion drain training wallsActive Coastal Processes Active distribution of stress through alongshore sediment
transport. Local sensitivity to sand bar movement.Decision making Time Frame 5 years (annual for isolated sites)Minimum Monitoring Level 21) Photographic Monitoring Monthly2) Beach Widths Annual or twice yearly 1. E Harvest Rd
2. W of Fourth St3. Smith St
3) Beach profiles Annual (indicator profiles)4) Oblique Imagery Annual or twice yearly5) Vertical Imagery Every 5 years6) Hydrographic Survey Every 10 years (sand bar movement)7) Condition Assessment Every 5 years8) Flood Mapping Following extreme flood events

Damara WA Pty Ltd
245 02 PNP Coastal Monitoring Action Plan Rev 0.docx 83
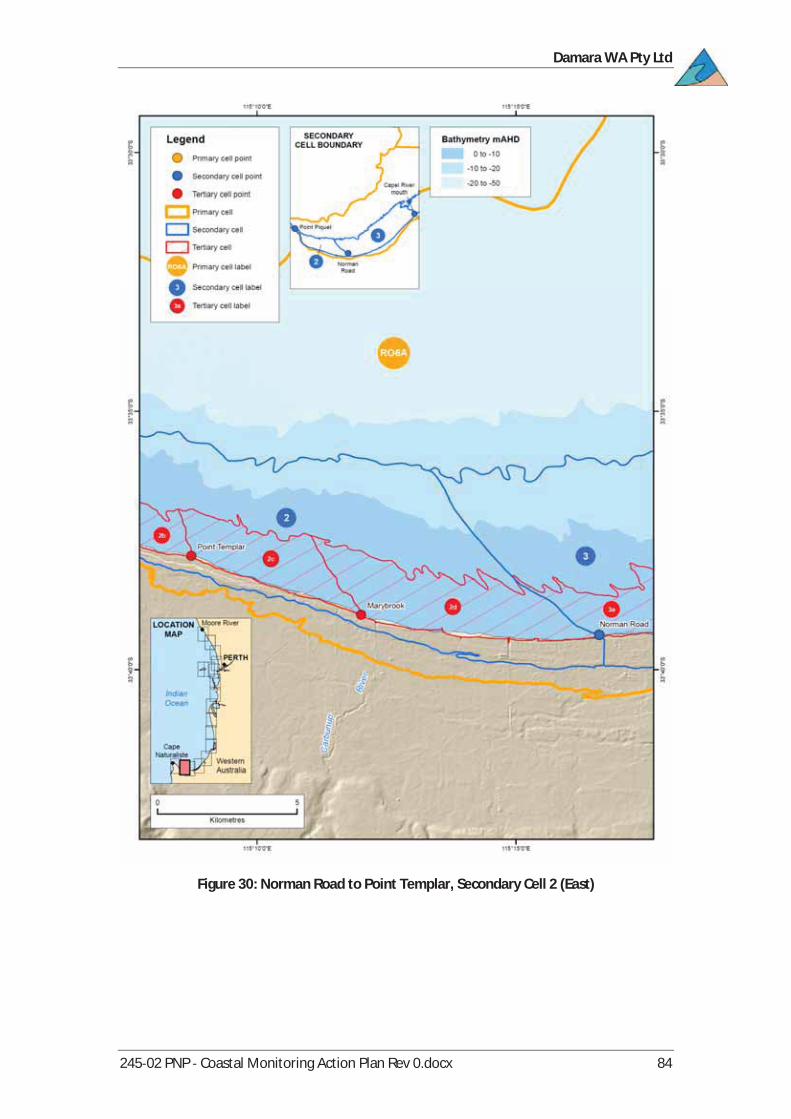
Table 48: CMAP Protocol Application for Marybrook to Point Templar
Cell Identifier R06A2.c (see Figure 30)Location Marybrook to Point TemplarLGA BusseltonPhysical Vulnerability Moderate – historic general accretion, but sensitive to
acute storm events. Low level areas subject to flooding.Toby Inlet breaching risk.
Significant Historic Events Coastal change following drainage worksInfrastructure Presence Boat ramp, Geographe Bay Rd within 50mExisting Coastal Management Coastal works to distribute sand supply from west &
offshore.Presence of Coastal Structures Diversion drain training walls, minor coastal structuresActive Coastal Processes Active distribution of stress through alongshore sediment
transport. High sensitivity to sand bar movement.Decision making Time Frame 10 yearsMinimum Monitoring Level 11) Photographic Monitoring Monthly2) Beach Widths Annual or twice yearly 1. Vernon Track
2. Toby Inlet Bridge3. Lagoona Pl
3) Oblique Imagery Annual or twice yearly4) Vertical Imagery Every 5 to 10 years5) Hydrographic Survey Every 10 years (sand bar movement)6) Condition Assessment Every 5 years7) Flood Mapping Following extreme flood events
Damara WA Pty Ltd
245 02 PNP Coastal Monitoring Action Plan Rev 0.docx 84
Figure 30: Norman Road to Point Templar, Secondary Cell 2 (East)

Damara WA Pty Ltd
245 02 PNP Coastal Monitoring Action Plan Rev 0.docx 85
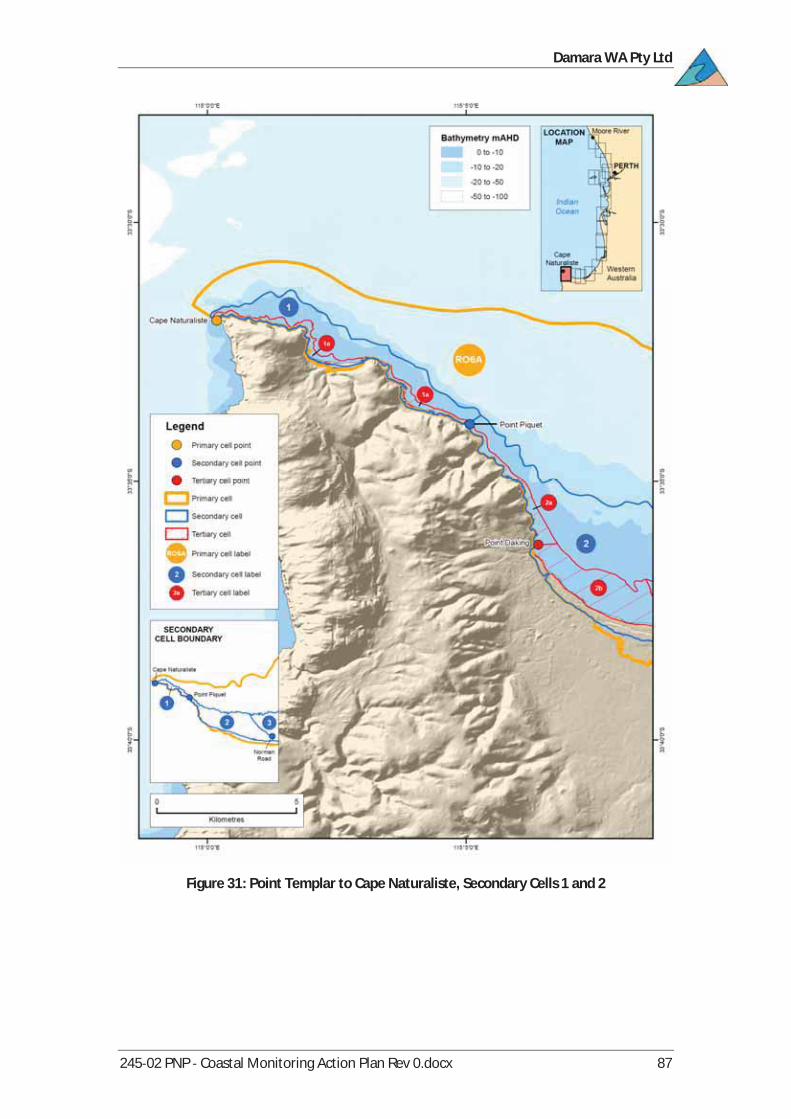
Table 49: CMAP Protocol Application for Point Templar to Point Daking
Cell Identifier R06A2.b (see Figure 31)Location Point Templar to Point DakingLGA BusseltonPhysical Vulnerability Low, with history of accretion, although local erosion
following bar movement and previous acute erosion.Lagoon breaching risk.
Significant Historic Events Embayment infillingInfrastructure Presence Bay View Cres within 10m, Vincent Rd within 20m,
Geographe Bay Rd within 35m, buildings within 35mPresence of Coastal Structures Quindalup seawall (buried), minor coastal structuresActive Coastal Processes Local sensitivity to sand bar movement.Decision making Time Frame 10 yearsMinimum Monitoring Level 11) Photographic Monitoring Monthly2) Beach Widths Annual or twice yearly 1. Wilson Ave
2. Tulloh St3. Chester Way
3) Oblique Imagery Annual or twice yearly4) Vertical Imagery Every 5 to 10 years5) Hydrographic Survey Every 10 years (Dunn Bay Bar movement)6) Condition Assessment Every 5 years7) Flood Mapping Following extreme flood events
Table 50: CMAP Protocol Application for Point Daking to Point Piquet
Cell Identifier R06A2.a (see Figure 31)Location Point Daking to Point PiquetLGA BusseltonPhysical Vulnerability Low, as mostly rocky shoreInfrastructure Presence Boat ramp, Bay View Cres & Hurford St adjacent to beach,
Buildings within 10mActive Coastal Processes Rocky shore limits coastal mobilityDecision making Time Frame 5 yearsMinimum Monitoring Level 21) Photographic Monitoring Monthly2) Oblique Imagery Annual or twice yearly3) Vertical Imagery Every 5 years
Damara WA Pty Ltd
245 02 PNP Coastal Monitoring Action Plan Rev 0.docx 86
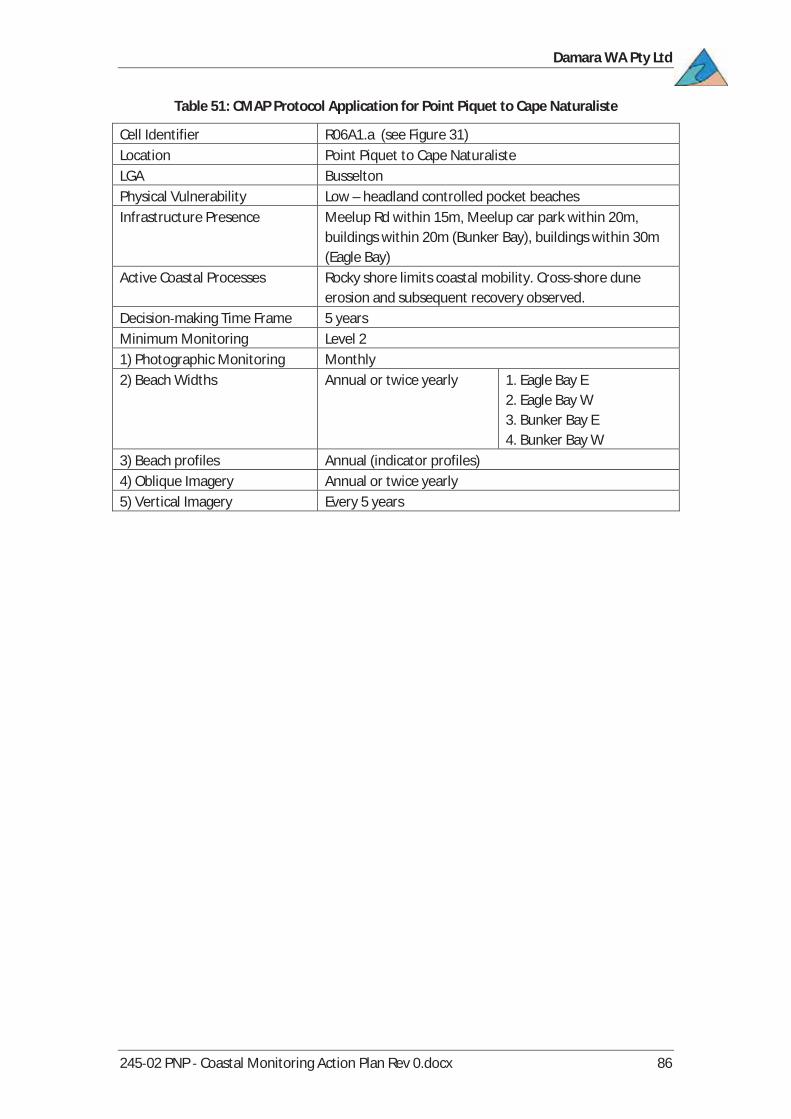
Table 51: CMAP Protocol Application for Point Piquet to Cape Naturaliste
Cell Identifier R06A1.a (see Figure 31)Location Point Piquet to Cape NaturalisteLGA BusseltonPhysical Vulnerability Low – headland controlled pocket beachesInfrastructure Presence Meelup Rd within 15m, Meelup car park within 20m,
buildings within 20m (Bunker Bay), buildings within 30m(Eagle Bay)
Active Coastal Processes Rocky shore limits coastal mobility. Cross shore duneerosion and subsequent recovery observed.
Decision making Time Frame 5 yearsMinimum Monitoring Level 21) Photographic Monitoring Monthly2) Beach Widths Annual or twice yearly 1. Eagle Bay E
2. Eagle Bay W3. Bunker Bay E4. Bunker Bay W
3) Beach profiles Annual (indicator profiles)4) Oblique Imagery Annual or twice yearly5) Vertical Imagery Every 5 years
Damara WA Pty Ltd
245 02 PNP Coastal Monitoring Action Plan Rev 0.docx 87
Figure 31: Point Templar to Cape Naturaliste, Secondary Cells 1 and 2

Damara WA Pty Ltd
245 02 PNP Coastal Monitoring Action Plan Rev 0.docx 88
Table 52: Summary of Recommended Coastal Monitoring
LGA
TertiarySediment
Cell
Tim
eFr
ame
Mon
itorin
gLe
vel
Phot
oM
onito
ring
Beac
hW
idth
Beac
hPr
ofile
s
Spat
ialC
over
age
Obl
ique
Aeria
ls
Vert
ical
Aeria
ls
Rem
ote
Sens
ing
Hydr
osu
rvey
Dune
Mob
ility
Stru
ctur
eCo
nditi
on
Floo
dM
appi
ng
Rock
ingh
am
R06D14.c 5 1 M A 5R06D14.b 5 1 M A 5R06D14.a 20 0 A 5 10R06D13.a 5 2 M A 5 10R06C12.a 5 2 M A 5R06C11.a 10 0 A 5 10R06C10.b 5 1 M 2A A 5
Man
dura
h R06C10.a 1 3 M 2A A 5 AR06C9.b 1 2 M (5) A 5 5R06C9.a 5 1 M A 5 10 5R06B8.b 20 0 A 5 10
WaroonaR06B8.a 20 0 A 5 10R06B7.a 20 0 A A 5
Harv
ey
R06B6.b 5 1 M A 5R06B6.a 5 1 M (A) A 5R06B5.c 5 1 M A 5R06B5.b 5 1 M A 5
BunburyR06B5.a 2 2 M (5) A 5 10R06A4.b 1 2 M A 5
Capel R06A4.a 5 1 M A 5
Buss
elto
n
R06A3.d 10 1 M A 5R06A3.c 5 2 M (5) A 5 5R06A3.b 10 1 M (5) A 5 (10)R06A3.a 5 2 M A A 5 (10)R06A2.d 5 2 M A A 5 (10)R06A2.c 10 1 M A 5 (10)R06A2.b 10 1 M A 5 10R06A2.a 5 2 M A 5R06A1.a 5 2 M A A 5
M Monthly monitoring N Approximate number of years between surveys (5, 10 or 20)A Annual monitoring (N) Brackets indicate monitoring covers a limited part of the cell2A Twice yearly monitoring Monitoring undertaken on either annually or event basis
Application of the coastal monitoring protocol to the PNP coast suggests several spatialpatterns, which relate either to local morphology or the intensity of existing coastaldevelopment. The risk based protocol generally supports the comparative levels of existingcoastal monitoring undertaken by the various LGAs (i.e. higher for Mandurah and Busselton).Typical monitoring activities at each level have been drawn from the existing monitoringprograms 58,59 and therefore are very similar to activities presently undertaken at Mandurahand Busselton.
Damara WA Pty Ltd
245 02 PNP Coastal Monitoring Action Plan Rev 0.docx 89
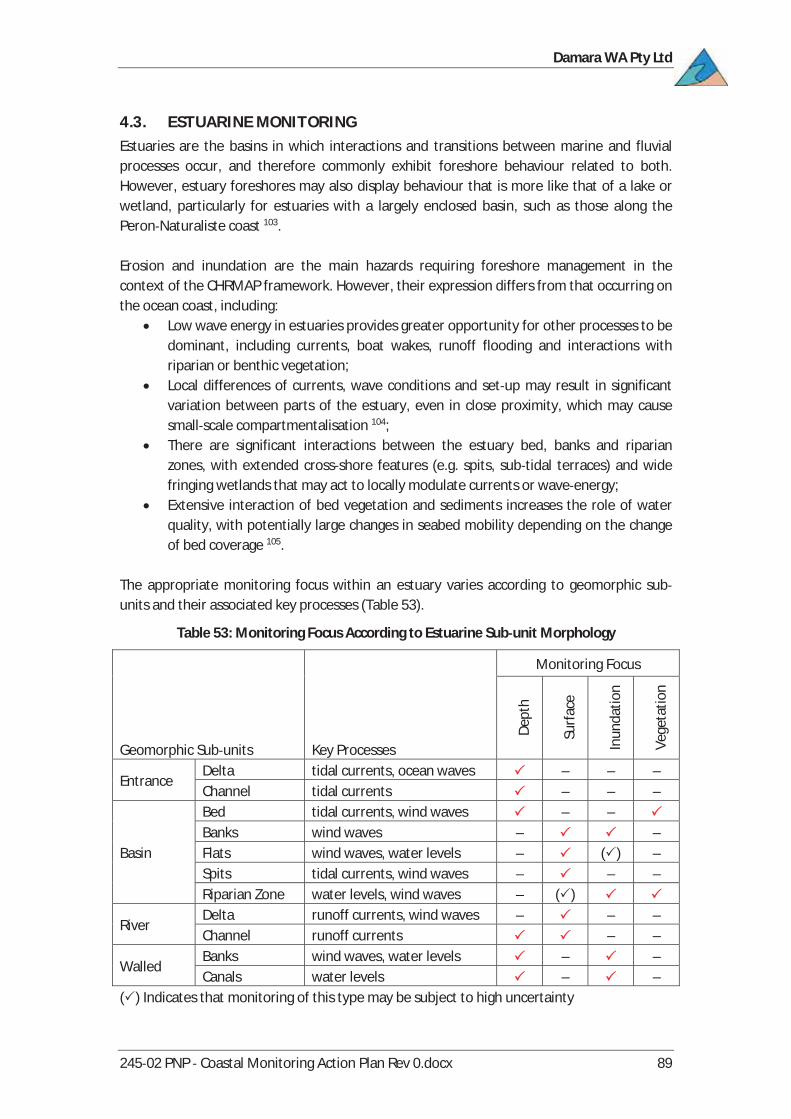
4.3. ESTUARINE MONITORINGEstuaries are the basins in which interactions and transitions between marine and fluvialprocesses occur, and therefore commonly exhibit foreshore behaviour related to both.However, estuary foreshores may also display behaviour that is more like that of a lake orwetland, particularly for estuaries with a largely enclosed basin, such as those along thePeron Naturaliste coast 103.
Erosion and inundation are the main hazards requiring foreshore management in thecontext of the CHRMAP framework. However, their expression differs from that occurring onthe ocean coast, including:
Low wave energy in estuaries provides greater opportunity for other processes to bedominant, including currents, boat wakes, runoff flooding and interactions withriparian or benthic vegetation;Local differences of currents, wave conditions and set up may result in significantvariation between parts of the estuary, even in close proximity, which may causesmall scale compartmentalisation 104;There are significant interactions between the estuary bed, banks and riparianzones, with extended cross shore features (e.g. spits, sub tidal terraces) and widefringing wetlands that may act to locally modulate currents or wave energy;Extensive interaction of bed vegetation and sediments increases the role of waterquality, with potentially large changes in seabed mobility depending on the changeof bed coverage 105.
The appropriate monitoring focus within an estuary varies according to geomorphic subunits and their associated key processes (Table 53).
Table 53: Monitoring Focus According to Estuarine Sub unit Morphology
Geomorphic Sub units Key Processes
Monitoring Focus
Dept
h
Surf
ace
Inun
datio
n
Vege
tatio
n
EntranceDelta tidal currents, ocean waves – – –Channel tidal currents – – –
Basin
Bed tidal currents, wind waves – –Banks wind waves – –Flats wind waves, water levels – ( ) –Spits tidal currents, wind waves – – –Riparian Zone water levels, wind waves – ( )
RiverDelta runoff currents, wind waves – – –Channel runoff currents – –
WalledBanks wind waves, water levels – –Canals water levels – –
( ) Indicates that monitoring of this type may be subject to high uncertainty
Damara WA Pty Ltd
245 02 PNP Coastal Monitoring Action Plan Rev 0.docx 90
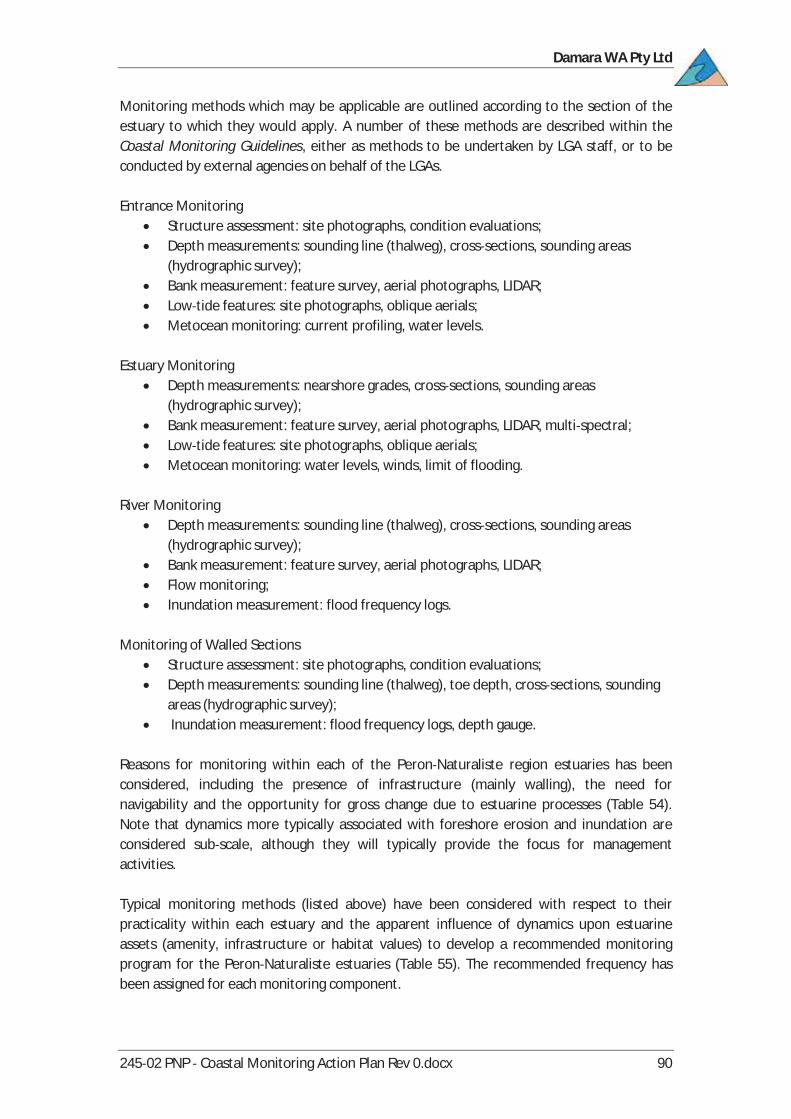
Monitoring methods which may be applicable are outlined according to the section of theestuary to which they would apply. A number of these methods are described within theCoastal Monitoring Guidelines, either as methods to be undertaken by LGA staff, or to beconducted by external agencies on behalf of the LGAs.
Entrance MonitoringStructure assessment: site photographs, condition evaluations;Depth measurements: sounding line (thalweg), cross sections, sounding areas(hydrographic survey);Bank measurement: feature survey, aerial photographs, LIDAR;Low tide features: site photographs, oblique aerials;Metocean monitoring: current profiling, water levels.
Estuary MonitoringDepth measurements: nearshore grades, cross sections, sounding areas(hydrographic survey);Bank measurement: feature survey, aerial photographs, LIDAR, multi spectral;Low tide features: site photographs, oblique aerials;Metocean monitoring: water levels, winds, limit of flooding.
River MonitoringDepth measurements: sounding line (thalweg), cross sections, sounding areas(hydrographic survey);Bank measurement: feature survey, aerial photographs, LIDAR;Flow monitoring;Inundation measurement: flood frequency logs.
Monitoring of Walled SectionsStructure assessment: site photographs, condition evaluations;Depth measurements: sounding line (thalweg), toe depth, cross sections, soundingareas (hydrographic survey);Inundation measurement: flood frequency logs, depth gauge.
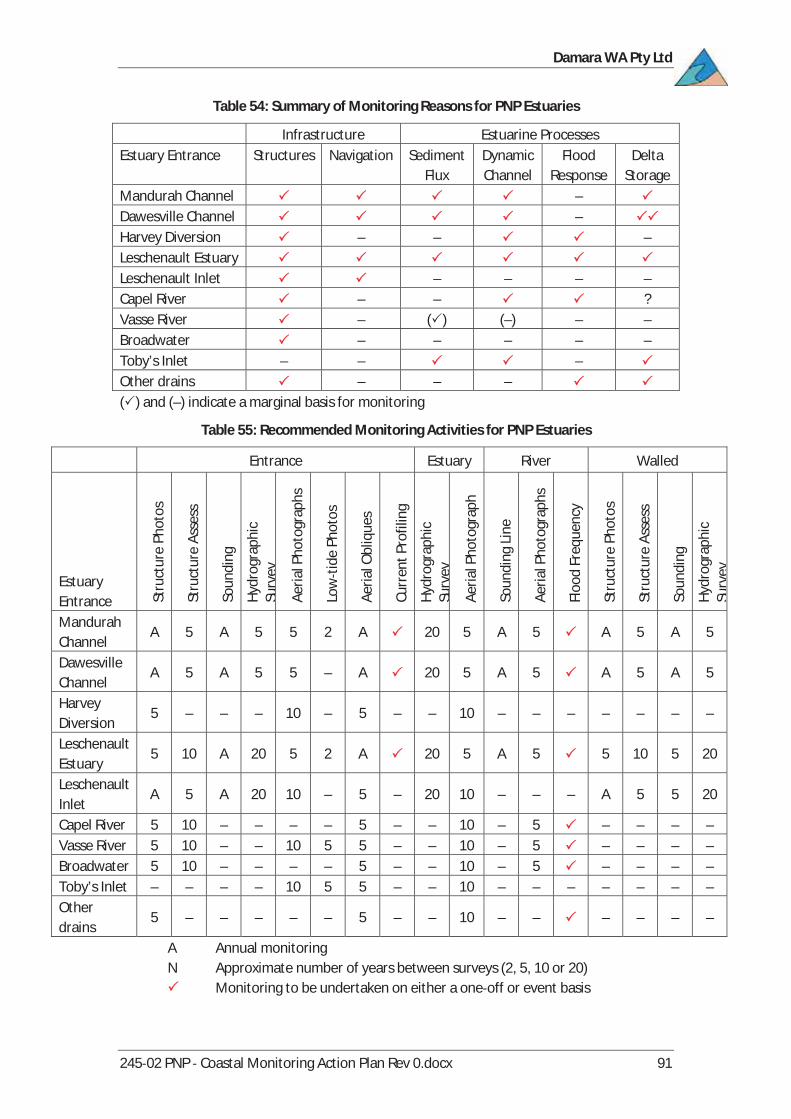
Reasons for monitoring within each of the Peron Naturaliste region estuaries has beenconsidered, including the presence of infrastructure (mainly walling), the need fornavigability and the opportunity for gross change due to estuarine processes (Table 54).Note that dynamics more typically associated with foreshore erosion and inundation areconsidered sub scale, although they will typically provide the focus for managementactivities.
Typical monitoring methods (listed above) have been considered with respect to theirpracticality within each estuary and the apparent influence of dynamics upon estuarineassets (amenity, infrastructure or habitat values) to develop a recommended monitoringprogram for the Peron Naturaliste estuaries (Table 55). The recommended frequency hasbeen assigned for each monitoring component.
Damara WA Pty Ltd
245 02 PNP Coastal Monitoring Action Plan Rev 0.docx 91
Table 54: Summary of Monitoring Reasons for PNP Estuaries
Infrastructure Estuarine ProcessesEstuary Entrance Structures Navigation Sediment
FluxDynamicChannel
FloodResponse
DeltaStorage
Mandurah Channel –Dawesville Channel –Harvey Diversion – – –Leschenault EstuaryLeschenault Inlet – – – –Capel River – – ?Vasse River – ( ) (–) – –Broadwater – – – – –Toby’s Inlet – – –Other drains – – –( ) and (–) indicate a marginal basis for monitoring
Table 55: Recommended Monitoring Activities for PNP Estuaries
Entrance Estuary River Walled
EstuaryEntrance St
ruct
ure
Phot
os
Stru
ctur
eAs
sess
Soun
ding
Hydr
ogra
phic
Surv
ey
Aeria
lPho
togr
aphs
Low
tide
Phot
os
Aeria
lObl
ique
s
Curr
entP
rofil
ing
Hydr
ogra
phic
Surv
ey
Aeria
lPho
togr
aph
Soun
ding
Line
Aeria
lPho
togr
aphs
Floo
dFr
eque
ncy
Stru
ctur
ePh
otos
Stru
ctur
eAs
sess
Soun
ding
Hydr
ogra
phic
Surv
ey
MandurahChannel
A 5 A 5 5 2 A 20 5 A 5 A 5 A 5
DawesvilleChannel
A 5 A 5 5 – A 20 5 A 5 A 5 A 5
HarveyDiversion
5 – – – 10 – 5 – – 10 – – – – – – –
LeschenaultEstuary
5 10 A 20 5 2 A 20 5 A 5 5 10 5 20
LeschenaultInlet
A 5 A 20 10 – 5 – 20 10 – – – A 5 5 20
Capel River 5 10 – – – – 5 – – 10 – 5 – – – –Vasse River 5 10 – – 10 5 5 – – 10 – 5 – – – –Broadwater 5 10 – – – – 5 – – 10 – 5 – – – –Toby’s Inlet – – – – 10 5 5 – – 10 – – – – – – –Otherdrains
5 – – – – – 5 – – 10 – – – – – –
A Annual monitoringN Approximate number of years between surveys (2, 5, 10 or 20)
Monitoring to be undertaken on either a one off or event basis
Damara WA Pty Ltd
245 02 PNP Coastal Monitoring Action Plan Rev 0.docx 92
5. Coastal Monitoring Action Plan SummaryThis coastal monitoring and action plan has been prepared on behalf of the PNP to supportdecision making for both active coastal management and adaptation for risk mitigation.Objectives include developing a plan that is sustainable, long term and standardised, whichis intended to reduce duplication of effort, encourage economies of scale and supportcomprehension of large scale coastal dynamics. A challenge faced when developing this planis that the coastal management issues faced by each LGA vary significantly.
Existing monitoring programs were used as a foundation for this plan, with monitoringactivities linked to different levels of coastal management decision making. A risk basedprotocol was developed, based on physical vulnerability, existing infrastructure, coastalmanagement and active coastal processes, to identify an appropriate suite of monitoringsuitable within tertiary sediment cells. Application of the coastal monitoring protocol to thePNP coast suggests several spatial patterns, which relate either to local morphology or theintensity of existing coastal development.
The risk based protocol generally supports the comparative levels of existing coastalmonitoring undertaken by the various LGAs (i.e. higher for Mandurah and Busselton). Due tothe foundation of the protocol, monitoring activities for sites with existing monitoringprograms are closely related to the existing monitoring programs.
An important distinction between the recommended and existing monitoring programs is asignificant difference in decision making time frames. Existing monitoring programs,particularly those for LGAs with low density coastal development, have historically reliedheavily on the use of vegetation lines to describe coastal change. As a proxy for coastalmovement, they are most meaningful employed on coasts with large development setbacks,over time frames in the order of 20 30 years. In the context of the CHRMAP frameworkdescribed in the State Coastal Planning Policy, coastal monitoring must support LGA decisionmaking over shorter time frames. Different sets of monitoring activity have beenrecommended according to the inferred decision making time frame.
Relatively high frequency monitoring of discrete beach widths along the entire PNP coasthas been recommended as a simple means to help distinguish between short and longerterm coastal dynamics. Beach width locations have been recommended based upon thesediment cells framework developed for the Peron Naturaliste coast. Hence the beach widthmonitoring, in combination with aerial imagery, is intended to provide a cost effectiveapproach that supports interpretation of regional behaviour or interactions betweenadjacent sediment cells, without requiring intense monitoring along the wider coast.

Damara WA Pty Ltd
245 02 PNP Coastal Monitoring Action Plan Rev 0.docx 93
Various elements of coastal monitoring and activities have been discussed in this document.This section summarises the recommended actions and ongoing monitoring tasks in brief.Targeted information may be obtained from the following sections and specific tables:
Metocean Monitoring Section 3.2 Table 6Inundation Monitoring Section 3.5Coastal Erosion Monitoring Sections 3.4 & 4.2 Table 52Estuarine Monitoring Section 4.3 Table 55
Recommendations include identification of ongoing coastal and estuarine monitoringprograms, supporting preliminary assessment, possible scientific questions and long terminvestigations relevant to coastal monitoring and management within the PNP region.
Preliminary AssessmentSelection of appropriate seasonal timing for more expensive discrete measurements (e.g.beach profiles) requires local understanding, as it may vary over relatively small spatialscales. It is recommended that for sites without an existing monitoring record, a three yearprogram of monthly beach width monitoring be used to describe seasonal behaviour.
State and Commonwealth Government MonitoringExisting levels of data collection by State and Commonwealth Government agencies provideinformation necessary to support the interpretation of coastal monitoring, including aerialphotography capture, hydrographic surveys, wave, tide, stream and meteorological data. Itis recommended that the PNP continue to actively support this data collection, as reducedinformation will affect the capacity for LGAs to make coastal management decisions.
Ongoing Monitoring by LGAsCoastal change information is mainly locally relevant to each LGA, and therefore coordination of coastal erosion monitoring or estuarine monitoring is largely managed byLGAs. The set of monitoring activities appropriate for each tertiary sediment cell or each ofthe PNP region’s main estuaries have been recommended in Sections 3.4, 4.2 and 4.3.
Monitoring activities for each LGA are summarised in Table 56. Details regarding thefrequency of monitoring and coverage are discussed in the relevant sections for inundationmonitoring, coastal erosion monitoring and estuarine monitoring.
The role of the PNP, as a collaborative body for nine different LGAs provides an opportunityfor co ordinated management of the coastal and estuarine data, although requiringadditional resources. Co ordinated data management and integration may further supportregional interpretation of coastal monitoring.
Capacity for flood mapping, which is only likely to be required on an occasional andintermittent basis, may be appropriately developed within a central agency, that cansubsequently support individual LGAs for mapping after a severe flood event. This capacitymay be held by the PNP, a State Government agency, or specialist capacity developed withina single LGA.

Damara WA Pty Ltd
245 02 PNP Coastal Monitoring Action Plan Rev 0.docx 94
Table 56: Summary of Monitoring Activities per LGA
Coastal Erosion Monitoring Estuarine Monitoring
Rock
ingh
am
Man
dura
h
War
oona
Harv
ey
Bunb
ury
Cape
l
Buss
elto
n
Man
dura
h
Mur
ray
Harv
ey
Dard
anup
Bunb
ury
Cape
l
Buss
elto
n
Photo MonitoringBeach WidthBeach ProfilesSpatial CoverageOblique Aerial ImageryVertical Aerial ImageryRemote SensingHydro surveyDune MobilityCondition AssessmentFlood MappingCurrent Profiling
Scientific QuestionsImproved understanding of nearshore wave processes is required, particularly tocharacterise reef influences and bed friction. Short term deployment of multiple inshoreinstruments is necessary to evaluate these processes. The scientific nature of the requiredinvestigations may imply a need for academic or State Government co ordination.
Coast estuary sediment transfers are not presently well understood in the PNP region andhave implications for long term change. Characterisation of entrance channel flow patternsand the corresponding capacity for sediment transfer is required for effective managementof major PNP estuaries, including Peel Harvey system and Leschenault Estuary.
Long term InvestigationsThe potential benefits and limitations of repeating the regional scale LIDAR undertaken in2008/09 should be understood by PNP. It is recommended that the PNP develop a dialoguewith State government agencies to support regional scale LIDAR with a target date in therange of 2030 to 2040.
Over decades, coastal change will expose different sections of underlying rock formationsalong the PNP coast. It is recommended PNP member agencies collectively develop capacityto co ordinate geophysical assessments within the PNP region. Definition of a scope,collation of existing information and a test case are recommended within 2016 2025.
Characterisation of coastal sediments is required for effective coastal change projections. Asediment sampling plan should be developed (by the State) to support co ordinatedcollation of sediment information, supplemented by academic data collection.
Damara WA Pty Ltd
245 02 PNP Coastal Monitoring Action Plan Rev 0.docx 95
6. References
1 WAPC (2014) Coastal Hazard Risk Management and Adaptation Planning Guidelines. Department ofPlanning. Perth: Government of Western Australia.
2 WAPC (2013) State Planning Policy No.2.6 State Coastal Planning Policy Guidelines. Department ofPlanning. Perth: Government of Western Australia.
3 Standards Australia/Standards New Zealand (2006) HB 203:2006 Environmental risk management –Principles and process (third edition 2006), Standards Australia Sydney, Standards New ZealandWellington
4 Searle DJ, Semeniuk V & Woods PJ. (1988) Geomorphology, stratigraphy and Holocene history of theRockingham Becher Plain, south western Australia. Journal of the Royal Society of WesternAustralia, 70 (4): 89 109.
5 Eliot M & Travers A. (2011) Dynamics of Scarborough Beach, City of Stirling, Western Australia. Coast& Ports 2011. Proceedings : 20th Australasian Coastal and Ocean Engineering Conference and the13th Australasian Port and Harbour Conference : diverse and developing held 28 30 September2011, Perth Convention Exhibition Centre / ISBN: 9780858258860 (CD ROM)
6 Hollings B. (2004) Sediment Dynamics of Warnbro Sound, Western Australia, UnpublishedEngineering Honours Thesis. University of Western Australia.
7 Paul MJ & Searle JD. (1978) Shoreline Movements Geographe Bay Western Australia. FourthAustralia Conference on Coastal and Ocean Engineering, Adelaide, 8 10 Nov 1978.
8 Andrew WS. (2003) Busselton Foreshore – Erosion Management of Residential Development. Reportto DPI (Maritime).
9 Shore Coastal. (2008) Inspection of Coastal Protection Structures. Prepared for the Shire ofBusselton.
10 Ryan G. (1993) Water Levels In Peel Inlet and Harvey Estuary Before and After Dawesville Channel.Department of Marine and Harbours. Report DMH D10/92.
11 Jones A. (2005) Potential coastal erosion of the Swan Coastal Plain due to long term sea level rise.Cities and critical infrastructure and risk assessment methods projects, Minerals and GeohazardsDivision, Geoscience Australia.
12 Damara WA Pty Ltd. (2012) Shire of Busselton Coastal Erosion Study, Assessment of Climate ChangeImpacts. Prepared for the Shire of Busselton
13 Eliot M. (2012) Sea level variability influencing coastal flooding in the Swan River region, WesternAustralia, Continental Shelf Research, 33, 14 2.
14 Van Koningsveld M, Davidson MA & Huntley DA. (2005) Matching Science with CoastalManagement Needs: The Search for Appropriate Coastal State Indicators. Journal of CoastalResearch, 21 (3): 399 411.
15 Payo A, Hall J, French JR, Sutherland J & Nicholls RJ. (2015) Geomorphic State Indicators for CoastalManagement over Decade and Longer Time Scales. ICOASST Working Papers. Unpublished.
16 Hearty PJ & O’Leary MJ. (2008) Carbonate eolianites, quartz sands, and Quaternary sea level cycles,Western Australia: A chronostratigraphic approach. Quaternary Geochronology, 3: 26 55.
17 Wyrwoll K H, Zhu ZR, Kendrick GA, Collins LB & Eisenhauser A. (1995) Holocene sea level events inWestern Australia: revisiting old questions. In: CW Finkl (ed.) Holocene cycles: climate, sea level,and coastal sedimentation. Journal of Coastal Research, special issue no. 17: 321–326. CoastalEducation and Research Foundation
18 Short AD. (2010) Sediment transport around Australia Sources, mechanisms, rates, and barrierforms. Journal of Coastal Research, 395 402.
19 Searle DJ & Logan BW. (1978) A Report on Sedimentation in Geographe Bay. Sedimentology andMarine Geology Group, Department of Geology, University of Western Australia.

Damara WA Pty Ltd
245 02 PNP Coastal Monitoring Action Plan Rev 0.docx 96
20 Richardson L, Mathews E & Heap A. (2005) Geomorphology and Sedimentology of the SouthWestern Planning Area of Australia: Review and synthesis of relevant literature in support ofRegional Marine Planning. Geoscience Australia Report Record 2005/17.
21 Clarke DJ & Eliot IG. (1983) Mean sea level variations and beach width fluctuation at Scarborough,Western Australia. Marine Geology, 51: 251 267.
22 Byrne A, Rogers M & Byrne G. (1987) Dawesville Channel, Western Australia – Coastal ProcessStudies. 8th Australasian Conference on Coastal and Ocean Engineering, Launceston, 30 Nov – 4Dec, 1987.
23 Bicknell C. (2006) Review of Sand Bypassing at Dawesville and Mandurah. Coastal EngineeringInvestigation. Department for Planning & Infrastructure. Technical Report No 446.
24 Cowell PJ & Barry S. (2012) Coastal recession risk in the Busselton Rockingham coastal cell due toclimate change. University of Sydney. Prepared for Department of Planning, the Department ofTransport and the Commonwealth Department of Climate Change and Energy Efficiency.
25 Sutherland J (2010) Guidelines on Beach Monitoring for Coastal Erosion. Created for theCommission of the European Communities Research Directorate General.
26 Collins LB. (1988) Sediments and history of the Rottnest Shelf, Southwestern Australia: a swelldominated, non tropical carbonate margin. Sedimentary Petrology, 60: 15–29.
27 L.Collins, pers comm. (2013)28 Hodgkin EP & Hesp PA. (1998) Estuaries to salt lakes: Holocene transformation of the estuarine
ecosystems of southwestern Australia. Marine and Freshwater Research, 49: 183 20129 Bufarale G, O’Leary MJ, Bourget J & Collins L. (2015) Geographe Bay Shallow Seismic Survey. Field
Report – September, 2015.30 Feng M, Craig P, Fandry C, Greenwood J, Nugzar M, Pearce A & Symonds G. (2006) Physical
Oceanography of the South Western Australian Shelf. In: Keesing JK, Heine JN, Babcock RC, CraigPD & Koslow JA (eds). (2006) Strategic Research Fund for the Marine Environment Final Report.Volume 2: The SRFME core projects. Strategic Research Fund for the Marine Environment, CSIRO,Australia. 11 53.
31 Radford B, Van Niel KP & Holmes K. (2008) WA Marine Futures: Benthic Modelling and MappingFinal Report. Centre for Marine Futures, The University of Western Australia.
32 Gentilli J. (1972) Australian Climate Patterns. Thomas Nelson Ltd. Sydney.33 Masselink G & Pattiaratchi CB. (2001) Seasonal changes in beach morphology along the sheltered
coastline of Perth, Western Australia. Marine Geology,172 (3 4): 243 263.34 Stul T, Eliot I & Pattiaratchi C. (2007) Sediment cells along the Perth metropolitan coast. In:
Proceedings of 2007 Coasts and Ports Australasian Conference, Melbourne, Australia, 18 20 July2007.
35 Stul T, Gozzard JR, Eliot IG & Eliot MJ (2012) Coastal Sediment Cells between Cape Naturaliste andthe Moore River, Western Australia. Report prepared by Damara WA Pty Ltd and GeologicalSurvey of Western Australia for the Western Australian Department of Transport, Fremantle.http://www.transport.wa.gov.au/mediaFiles/marine/MAC_R_CoastalSedimentCellsReport.pdf
36 Wells MR, Oma VPM & Richards NLB. (1985) Shire of Rockingham – a study of land resources andplanning considerations. Department of Agriculture, Western Australia, Technical Report 44.
37 Sloss CR, Shepherd M & Hesp P. (2012) Coastal Dunes: Geomorphology. Nature EducationKnowledge 3(10):2.
38 McArthur WM & Bettenay E. (1974) Development and Distribution of Soils of the Swan CoastalPlain, Western Australia. CSIRO, Soil Publication No. 16.
39 Wright LD & Thom BG. (1977) Coastal depositional landforms: A morphodynamic approach.Progress in Physical Geography,1: 412 459.
40 Department of Transport: DoT. (2012) How to Photo Monitor Beaches.http://www.transport.wa.gov.au/mediaFiles/marine/MAC_IS_HowToPhotoMonitorBeaches.pdf
41 Dolan R, Fenster MS & Holme SJ. (1991) Temporal Analysis of Shoreline Recession and Accretion.Journal of Coastal Research, 7 (3), 723 744.

Damara WA Pty Ltd
245 02 PNP Coastal Monitoring Action Plan Rev 0.docx 97
42 Larson M, Capobianco & Hanson H. (2000) Relationship between beach profiles and waves at Duck,North Carolina, determined by canonical correlation analysis. Marine Geology, 163, 275 288.
43 Munoz Perez JJ, Medina R & Tejedor B. (2001) Evolution of longshore beach contour linesdetermined by the EOF method. Scientia Marina, 65 (4), 393 402.
44 Eliot I, Nutt C, Gozzard B, Higgins M, Buckley E & Bowyer J. (2011). Coastal Compartments ofWestern Australia: A Physical Framework for Marine & Coastal Planning. Report to theDepartments of Environment & Conservation, Planning and Transport. Damara WA Pty Ltd,Geological Survey of Western Australia and Department of Environment & Conservation, WesternAustralia.
45 Damara WA Pty Ltd. (2009) The Yalgorup Coast: Binningup to Cape Bouvard, Western Australia.Prepared for the Departmen of Planning and Department of Conservation and EnvironmentWestern Australia.
46 Damara WA Pty Ltd. (2015) Harvey Coastal Hazard Risk Management and Adaptation Plan.Summary of Key Issues. Report 246 00 08.
47 French J & Burningham H. (2009) Mapping the connectivity of large scale coastal geomorphologicalsystems: Coastal system mapping with Cmap Tools tutorial. Science Report SC060074/PR2. JointDEFRA and Environment Agency Flood and Coastal Erosion Risk Management R & D Programme,Environment Agency and Department for Environment, Food and Rural Affairs, United Kingdom.
48 ACIL Tasman Pty Ltd. (2012) Climate Change Adaptation Options Assessment. Developing FlexibleAdaptation Pathways for the Peron Naturaliste Coastal Region of Western Australia.
49 Simpson MC, Mercer Clarke CSL, Clarke JD, Scott D & Clarke AJ. (2012) Coastal setbacks in LatinAmerica and the Caribbean: final report, a study of emerging issues and trends that informguidelines for coastal planning and development. Inter American Development Bank. TechnicalNote No. IDB TN – 476.
50 Dolan R, Hayden BP & Heywood J. (1978) A new photogrammetric method for determiningshoreline erosion. Coastal Engineering, 2(1), 21–39.
51 Healy TR & Dean RG. (2000) Methodology for delineation of coastal hazard zone and developmentsetback for open duned coasts. In: Herbich (ed). Handbook of Coastal Engineering. McGraw Hill,ch 19, 1 30.
52 Cambers J. (1998) Planning for Coastline Change. 1: Coastal Development Setback Guidelines inAntigua and Barbuda. COSALC: Coast and Beach Stability in the Caribbean Islands.
53 Environment Waikato. (2002) Coastal Hazards & Development Setback Recommendations SummaryReport.
54 Pranzini E & Wetzel L. (eds) (2009) Beach Erosion Monitoring: Results from BEACHMED e/OpTIMALProject, Optimisation des Techniques Integrees de Monitorage Appliquees aux Littoraux, NuovaGrafi ca Fiorentina, Florence, Italy.
55 Pattiaratchi C, Imberger J, Zaker N & Svenson T. (1995). Perth Coastal Waters Study. Project P2:Physical Measurements. Perth: Centre for Water Research.
56 Department of Environmental Protection. (1996) The Southern Metropolitan Coastal Waters Study(1991 1994) Final Report. Department of Environmental Protection, Report 17.
57 Rose E. (2001) The Dynamics of Flow Between Cockburn Sound and Sepia Depression. HonoursThesis, Department of Environmental Engineering, The University of Western Australia.
58 Department of Transport (2013) Mandurah Northern Beaches Coastal Monitoring Program. DoTTechnical Report 14843401.
59 Shore Coastal (2013) Busselton Coastal Management Program (2014 2018). For City of Busselton.SCR1211
60 Northern Agricultural Catchments Council: NACC. (2011) Geraldton Volunteer Beach MonitoringManual.
61 Damara WA Pty Ltd. (2011) Port Geographe Entrance Modification. Preliminary Design Criteria.Report 95 02 Rev A.
62 Department of Transport. (2010) AWAC data collection and analysis report. Alkimos 2008 2009.Technical Report 485.

Damara WA Pty Ltd
245 02 PNP Coastal Monitoring Action Plan Rev 0.docx 98
63 Wang ZB, Karssen B, Fokkink RJ & Langerak A. (1998) A dynamic/empirical model for long termmorphological development of estuaries, In: Dronkers J.& Scheffers MBAM. (eds), Physics ofestuaries and coastal seas, Balkema, Rotterdam, 1998, pp 279 286.
64 Colman RW. (1983) Estuaries of South Coast Western Australia and their Entrance Morphologies.Honours Thesis, Department of Geography, University of Western Australia.
65 Fitzgerald DM, Fenster MS, Argow BA & Buynevich IV. (2008) Coastal impacts due to sea level rise.Annual Review of Earth and Planetary Sciences, 36: 601 647.
66 Town Planning Department. (1974) Coastal Erosion. Town Planning Department, Perth, WesternAustralia.
67 Loureiro C., Ferreira Ó & Cooper JAG. (2012) Extreme erosion on high energy embayed beaches:influence of megarips and storm grouping. Geomorphology, 139, 155 171.
68 McNinch JE. (2004) Geologic control in the nearshore: shore oblique sandbars and shorelineerosional hotspots, mid Atlantic Bight, USA. Marine Geology, 211: 121 141.
69 Eliot M. (2013) Application of Geomorphic Frameworks to Sea Level Rise Impact Assessment.Prepared for Geoscience Australia by Damara WA Pty Ltd, Report 193 01.
70 CSIRO. (2007) Climate Change in Australia.71 Williams S & Spyrou A. (2012) Geophysical Investigation for Subsurface Lithology Along the
Foreshore of Cottesloe Beach. GBG Maps Report No. 70096.72 Pugh D. (1987) Tides, Surges and Mean Sea Level. John Wiley & Sons Ltd, London.73 Damara WA Pty Ltd. (2012) Coastal Hazard Mapping for Economic Analysis of Climate Change
Adaptation in the Peron Naturaliste Region. Report 169 01 Rev 0.74 Easton A. (1970) The tides of the continent of Australia. Research Paper No. 37, Horace Lamb
Centre of Oceanographical Research, Flinders University.75 Wallingford (HR). (2007) Eurotop. Wave Overtopping of Sea Defences and Related Structures:
Assessment Manual.76 Shore Coastal Pty Ltd. (2015) Busselton Storm Surge Response Plan. Technical Report for City of
Busselton. SCR1505.77 Christina da Silva, Department of Transport, pers comm., (2015).78 Macpherson L, Haigh I & Pattiaratchi C. (2011). Coastal flooding in the Peel Harvey Estuary and the
effects of mean sea level rise. In Proceedings of the 20th Australasian Coastal and OceanEngineering Conference and the 13th Australasian Port and Harbour Conference : diverse anddeveloping. (pp. 446 451). Barton ACT, Australia: Engineers Australia and Australia and theInstitute of Professional Engineers New Zealand.
79 Pattiaratchi C & Buchan S. (1991) Implications of long term climate change for the Leeuwin Current.Journal of the Royal Society of Western Australia, 74: 133 140.
80 Department of Transport. (2010) Sea Level Change in Western Australia. Application to CoastalPlanning. Discussion Paper.
81 World Meteorological Organization. (1998) Guide to Wave Analysis and Forecasting. WMO No. 702,Geneva, Switzerland.
82 Seashore Engineering (2014) Mandurah Eastern Foreshore Revetment. Climate Change AssessmentReport. Report SE006 01 Draft B.
83 CIRIA/CUR (1991) Construction Industry Research and Information Association (CIRIA) and Centrefor Civil Engineering Research and Codes (CUR). 1991. Manual on the Use of Rock in Coastal andShoreline Engineering, CIRIA Special Publication 83/CUR Report 154, CIRIA, London and CUR, TheNetherlands.
84 Oliver J, Plotkin D, Lesnik J & Pirie D (1998) Condition and Performance Rating Procedures for RubbleBreakwaters and Jetties, Technical Report REMR OM 24, U.S. Army Construction EngineeringResearch Laboratory, Champaign, IL.(http://owww.cecer.army.mil/techreports/plorub/plorubb.remr.post.pdf)
85 US Army Corps of Engineers (2006) Coastal Engineering Manual; Monitoring, Maintenance andRepair of Coastal Projects, Part IV, Chapter 8, EM 1110 02 1110.

Damara WA Pty Ltd
245 02 PNP Coastal Monitoring Action Plan Rev 0.docx 99
86 McKay DT. (1998) REMR Management System Navigation Structures: A Simple Condition andPerformance Rating Procedure for Riverine Stone Training Dikes and Revetments. TechnicalReport REMR OM 21. U.S. Army Construction Engineering Research Laboratory, Champaign, IL.
87 Pirie D, Plotkin D, Kubinski J, Foltz S & McKay D. (2005). Condition and Performance RatingProcedures for Nonrubble Breakwaters and Jetties. Technical Report REMR OM 26. EngineerResearch and Development Center, Champaign IL. Construction Engineering Research Lab.
88 Damara WA Pty Ltd. (2009) Perth Metropolitan Region. Coastal Protection Structures. FieldInspections & Condition Assessments. Report 81 01 Rev 0.
89 Sumer BM & Fredsoe J. (2002) The Mechanics of Scour in the Marine Environment. Advanced Serieson Ocean Engineering 17. World Scientific, Singapore.
90 Larson M & Kraus NC. (1989) SBEACH: Numerical Model for Simulating Storm induced BeachChange; Report 1. Empirical Foundation and Model Development. Technical Report CERC 89 9RPT 1, Vicksburg, Mississippi: U.S. Army Engineer Waterways Experiment Station, CoastalEngineering Research Center.
91 Larson M, Kraus NC & Byrnes MR. (1990) SBEACH: Numerical Model for Simulating Storm InducedBeach Change: Report 2 Numerical Formulation and Model Tests. Technical Report, CERC 89– 9,RPT 2, Vicksburg, Mississippi: U.S. Army Engineer Waterways Experiment Station, CoastalEngineering Research Center, Vicksburg, Mississippi.
92 Deigaard R, Fredsøe J, Hedegaard IB, Zyserman JA & Andersen OH. (1988) Littoral Drift Model forNatural Environments, 21st International Conference on Coastal Engineering, Málaga.
93 Tecchiato S, Collins L, Parnum I, Stevens A. (2014) The influence of geomorphology and sedimentaryprocesses on benthic habitat distribution an dlittoral sediment dynamics: Geraldton, WesternAustralia. Marine Geology 359: 148 162.
94 Searle DJ & Semeniuk V. (1985) The Natural Sectors of the Inner Rottnest Shelf Coast Adjoining theSwan Coastal Plain. Journal of the Royal Society of Western Australia, 67: 116 136.
95Le Provost, Semeniuk & Chalmer. (1986) Sediment sources, transport paths and sinks of the InnerRottnest Shelf between Bunbury and Rockingham for use in determining volumes of littoral driftpast the proposed Dawesville Cut. Draft report R149 prepared for Riedel & Byrne ConsultingEngineers.
96 Stul T. (2005) Physical characteristics of Perth beaches, Western Australia. Honours Thesis, UWA,Perth.
97 Damara WA Pty Ltd (2010) Port Geographe Sand Management, Busselton Sediment Sampling. ForCity of Busselton and Department of Transport.
98 Gao S & Collins M. (1992) Net sediment transport patterns inferred from grain size trends, basedupon definition of "transport vectors" Sedimentary Geology, 80: 47 60.
99 JFA Consultants. (2006) Dawesville and Mandurah Sand Bypassing: Analysis of Sediment Samplescollected on 16 March 2006. Prepared for the Department of Planning and Infrastructure, Perth.
100 Oceanica Pty Ltd. (2007) Mandurah Channel Entrance Sand Bypassing Programme. 2006 PlumeMonitoring and Sediment Characterisation Data Report. Report No. 548/1.
101 Oceanica & Shore Coastal. (2010) Compilation and Review of Application of Schedule One of StatePlanning Policy 2.6. Prepared for the Department for Planning and Infrastructure. Report754_001/01.
102 Northern Agricultural Catchments Council: NACC. (2014) Using PhotoMon for MonitoringEnvironmental Change – User Manual (June 2014).http://nacc.com.au/wp content/uploads/2015/05/Photomon Users Guide.pdf.
103 Ryan DA, Heap AD, Radke L & Heggie DT. (2003) Conceptual Models of Australia’s Estuaries andCoastal Waterways. Applications for Coastal Resource Management. Geoscience Australia Record2003/09.
104 Eliot M, Travers A & Eliot I. (2006) Landforms of Como Beach, Western Australia. Journal of CoastalResearch, 22(1), 63 77.
105 Damara WA Pty Ltd. (2008) South Yunderup Approach Channel Sedimentation Assessment. For theDepartment of Planning and Infrastructure. Report 40.31 01 Rev B.
Related Documents