\"-"\ \. i.S'- 'CL;\' , -:-- .:... ! i l V01. VIII & IX DecelTlber 1997 & 1998 Society of Extension Education Anand (Gujarat) E.E.I., G.A.U., ANAND - 388 110, INDIA.

Welcome message from author
This document is posted to help you gain knowledge. Please leave a comment to let me know what you think about it! Share it to your friends and learn new things together.
Transcript

\"-"\ \. i.S'- 'CL;\' ,-:-.:... !
i l
V01. VIII & IX DecelTlber 1997 & 1998
Society of Extension Education Anand (Gujarat)
E.E.I., G.A.U., ANAND - 388 110, INDIA.
1.
2.
3.
4.
5.
6.
1.
2.
Executive Council - -
(Reg. No. Guj. 737/Kheda & F/478/Khedal1990)
Dr. B. T. Patel, President. Director of Extension Education GAU, Ahmedabad-388 004
Dr. H. L. Patel, Vice President, Principal, EEl, GAU Anand - 388 110
Dr. J. C. Trivedi, Secretary-cum-Treasurer, Extension Educationist, EEl, GAU, Anand - 388 110
Prof. G. M. Patel, Joint Secretary Asstt. Extn. Educationist, EEl, GAU, Anand - 388 110
Dr. V. V. Mayani, Chief Editor, Prof. of Extension Education, SACA, GAU, Anand-388 110
Dr. A O. Kher, Member Dy. Director of Extension Education GAU, Junagadh-362 001
7. Dr. K. F. Patel, Member Dy. Director of Extension Education, GAU, Anand-388 11 0
8. Dr. M. M. Padheria, Member Dy Director of Extension Education, GAU, Sardar KrushiNagar-385 506
9. Dr. R. B. Patel, Member Prof. of Extension Education, N. M. College of Agriculture, GAU, Navsari-396 450.
10. Dr. M. A. Munshi, Member Prof. of Extension Education, College of Agriculture, GAU, Junagadh-362 001
11. Dr. K. A Thakkar, Member Asso. Extension Educationist, AspeEY College of Home Science, GAU, Sardar KrushiNagar-385 506
12. Dr. M. N. Popat, Member, Asso. Extension Educationist, EEl, GAU, Anand-388 110
Editorial Board
Dr. V. V. Mayani, Chief Editor, Prof. of Extension Education, B.AC.A, GAU., Anand-388 110
Dr. M. A Munshi, Editor Prof. of Extension Education, College of Agriculture, GAU, Junagadh-362 001
5.
3. Dr. M. C. Soni, Asso. Editor IIC Prof. of Extension Education, College of Agriculture, GAU, Sardar Krishnagar-385 506
4. Dr. V. D. Joshi, Asso. Editor, Prof. of Extension Education, N. M. College of Agriculture, GAU, Navsari-396 450
Dr. M. N. Popat, Asso. Editor, Asso. Extension Educationist, EEl, GAU, Anand-388 110
EDITORIAL
It is a great pleasure to me to. place this 8th and 9th Volume of Gujarat Journal of Exten~ion Education before you. This Volume contains thirty eight research papers,· espeCially based on the researches conducted by the. contributor members in the different areas viz. adoption and diffusion of technology and constraints that come in the way C?f~ransfer of / technology.
Due to certain unforeseen reasons the publication of this volume is delayed but I am sure that readers will appreciate the content of the volume. I hope that this volume shall prove useful to the scientists,scholars, extension and social workers who are engaged in behavioural science in general and Extension Education in particular.
During the period, we lost our three life members of the Society, one Dr. M. M. PadHeria, Dy Director of Extn. Edu., GAU, S. K. Nagar, Prof. V. K. Patel, Asstt. Extn. Educationist, Arnej and Prot P. B. Patel, DEE Office, GAU, Ahmedabad. We feel deep sorrow on their sad and sudden demise.
I extend my heartiest thanks to Dr. B. T. Patel. Dr. H. L. Patel, Dr. J. C. Trivedi, Dr~ K. F. Patel· and Prof. G. M. Patel who planned the ways of financial difficulties and made Some how possible the publication of the volume. I also express my sin·cere thanks to Dr. M. A. Munshi, Editor and Dr. V. D. Joshi, Dr. M. N. Popat and Dr. M. C. Soni, Asso. Editors for editorial help.
Last but not least, I would like to thank Mr. Manoj R Bhatt and Sunil R. Patel for sparing time for proof reading.
Every possible efforts have been made to improve the quality and standard of the journal, the constructive suggestions and healthy comments for future improvements are always welcome. Finally, I extend my cordial thanks to all the .members of the Society as· well as contributors of the research papers for their kind cooperation.
Anand V. V. Mayani Dt. 08-03-2001 Chief Editor
Society of Extension Education Anand Gujarat
II HAPPY TO ANNOUNCEII
SHRI KHUSHALBHAI REVABHAI PATEL MEDAL - CUM - CASH PRIZE
II FROM : APRIL • 1992 II
for tIie st:utfents of 8th Semester in lJJ. Sc. f%ri.) tfegree in ~n 'Etluaztion
For Details Contact :
SECRETARY • CUM • TREASURER SOCIETY OF EXTENSION EDUCATION, GUJARAT
EXTENSION EDUCATION INSTITUTE, GUJARAT AGRICULTURAL UNIVERSITY,
ANAND CAMPUS, ANAND - 388 110 (GUJARAT)
d'
" '

THIRD EXECUTIVE COUNCIL (Since 1-5-97 onwards)
Dr. B. T. Patel President
Dr. H. L. Patel Vice-President
Dr. J. C. Trivedi SecretarylTreasurer
Prof. G. M. Patel Joint Secretary
Dr. V. V. Mayani Chief-Editor
Dr. K. F. Patel Member
Dr. A. O. Kher Member
Dr. M. M. Padheria Member
Dr. R. B. Patel Member
Dr. M. A. Munshi Dr. M. N. Popat Dr. K. A. Thakkar Member Member Member
Dr. V. V. Mayani Chief-Editor
Dr. M. A. Munshi Editor
Dr. M. C. Soni Asso. Editor
Dr. V. D. Joshi Asso. Editor
Dr. M. N. Papat Asso. Editor
Gujarat Journal of
Extension Education Volume - VIII & IX 1997 & 1998 Contents
I. Growers' Adoption Behaviour of Production Technologies of Irrigated Wheat A. B. Mundhwa, Ashok A. Patel and B. T. Patel
2./ Adoption of indigenous practices of Groundnut Cultivation by Groundnut 6 ~"
Growers in South Saurashtra Zone P. R. Kanani, A. 0. Kher, and V. J. Savaliya
3. Role of Awareness Camps in Improving Knowledge of Rural Women 1I in Environmental Sanitation Dhriti Solanki and Pushpa Gupta
4. Adoption of Agricultural Technologies Among Different Categories 14 of Farmers in Kheda District K. Jagadeeshawara, H. L. Patel and K. V. Naik
5. Gain in Knowledge by the Life Member Farmers' Through Krushi-Go-Vidya 19 Farm Magazine N. J. Hingu and N. R. Patel
6. Farm Telecast Viewing Behaviour of TV Owning Farmers 23 R. K. Dani and B. B. Patel
7. Adoption Constraints of Biogas Plants 28 S. D. Dhakar, S. N. Ojha and L. S. Bareth
8. Impact of Short Term Training in Terms of Increase in Knowledge, 33 Adoption and Yield of the Farmers 1. P. Bhatt, R. B. Patel and V. D. Joshi
9. Constraints Perceived and Suggestions Offered by Supervisory Extension Staff 37 for Effective Implementation of RAWE Programme Ashok Kumar Sharma, S. L. Intodia and Rajeev Bairathi
10. Extent of Water Utilization and Its Management Aspect by Tribal and 42 Non Tribal Farmers in Command Area of Surat District (Guj.) M. C. Patel and S. K. Waghmare
11. Income Generation and Expenditure Pattern of Tribal Farmers 46 of South Eastern Madhya Pradesh M. A. Khan, P. N. Sharma and M. L. Sharma
12. Academic Performance of Agricultural Students 53 S. R. Kosamhi and M. S. Trivedi
13. Impact of Institutional Training on Knowledge of Tribal Farmers 57 F. L. Sharma, and S. L. lntodia
14. Identification and Adoption of Indigenous Technical Knowledge (ITKs) 63 by sugarcane Growers S. R. Patel, R. B. Patel and V. D. Joshi
15. Motivating Factors of Girl Students for Agricultural Degree Course 69 N. Mohanty and N. R. Patel
16. Impact of Soil Conservation Programme on Improved Farm Practices 74 J. D. Sarkar, K. K. Shrivastava and L. S. Bareth
17. Constraints Experienced by the Beneficiaries in Adption of Watershed 82 Management Technology 1. B. Patel, R. S. Vekaria and G. M. Patel
RESEARCH NOTES :
18. Contribution of Rural Women in Post Harvest operations -A case of 86 Southern Rajasthan Meena Stl11adhya, S. L. lntodia and P. K. Dashora
19. Home Science Education and Development of Human Resources 89 Among Women. S. Ahlawat and G. Goyal
20. Sway of Selected Factors on the Technical Knowledge of Small Peasants. 95 N. B. Chauhan and 0. S. Rathore
21. Role of Selected Characteristics of Paddy Growers on Knowledge 98 Adoption and Production S. R. Patel, R. S. Vekaria and R. D. Pandya
22. Job Satisfaction of Village Level Workers Working Under T & V system 101 M. N. Popat, S. M. Nandvana and D. M. Thakrar
23,. Migration Habit and Overall Technological Gap of The Tribal Farmers 103 A. 1. Patel and J. C. Trivedi
24. Extent of Adoption of Lime Production Technology by Lime Growers 106 V. V. Mayani and V. S. Patel
25. A Knowledge Test to Measure Wheat Growers' Knowledge about Wheat 109 Production Technology M. S. Trivedi and B. T. Patel
26. Impact of Institutional Training Programme on Farm Women under 111 TWA Project H. V. Gosai, M. A. MUllshi, V. J. Savaliya, and P. R. Kanani
27. Communication Sources Utilized by Urd Growers in the Tribal Areas 113 of Rajasthan L. S. Bareth and S. L. lntodia
,28. Constraints Experienced by Hybrid-6 Cotton Growers 119 B. N. Kalsariya, M. N. Popat and M. A. Munshi
29. Impact of Tribal Training Centre on Knowledge and Adoption of Participant 122 and Non-Participant Farmers In Dahod District B. S. Patel and R. R. Acharya
30. Impact of Co-operative Sugar Factories in Sugarcane Growers 125 of South Gujarat S. D. Kavad, R. B. Patel and V. D. Joshi
31. Entrepreneurial Behaviour of Farmers 128 R. Vijayaraghavan
32. Constraints Faced by Dairy Personnel in Milk Procurement in laipur 130 District of Rajasthan Rajeev Bairathi, Ram Chandra and F. L. Sharma
33. Training Needs of Rural Women 134 R. F. Thakor and K. F. Patel
34. Constraints in use of Chemical Fertilizer among the Tribals 138 of Bastar (M.P.) R. S. Sengar
35. Correlates of Knowledge about Ginger Production Technology 141 P. G. PatiZ. S. B. Vidhate and G. K. Waman
36./Constraints in Adoption of Recommended Mustard Cultivation Technology 146 K. M. Patel and M. C. Soni
37. Information Seeking Behaviour of Mandarin Growers in Ihalawar District 149 of Rajasthan N. K. Panjabi, F. L. Sharma and Anis Mohammed
38. Inter-Relationship among Dimensions of Entrepreneurship 152 M. M. Patel and Amit Chatterjee
Guj. J. Extn. Edu. VIII & IX 1997 & 1998
Growers' Adoption Behaviour of Production Technologies of Irrigated Wheat
A. B. Mundhwa1, Ashok A. PateP and B. T. PateP
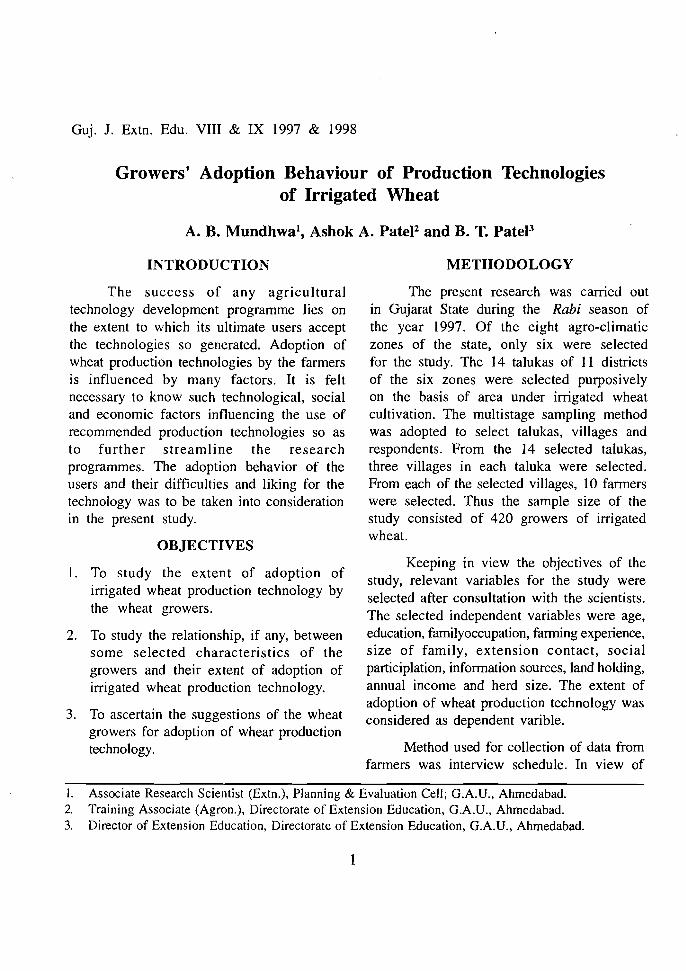
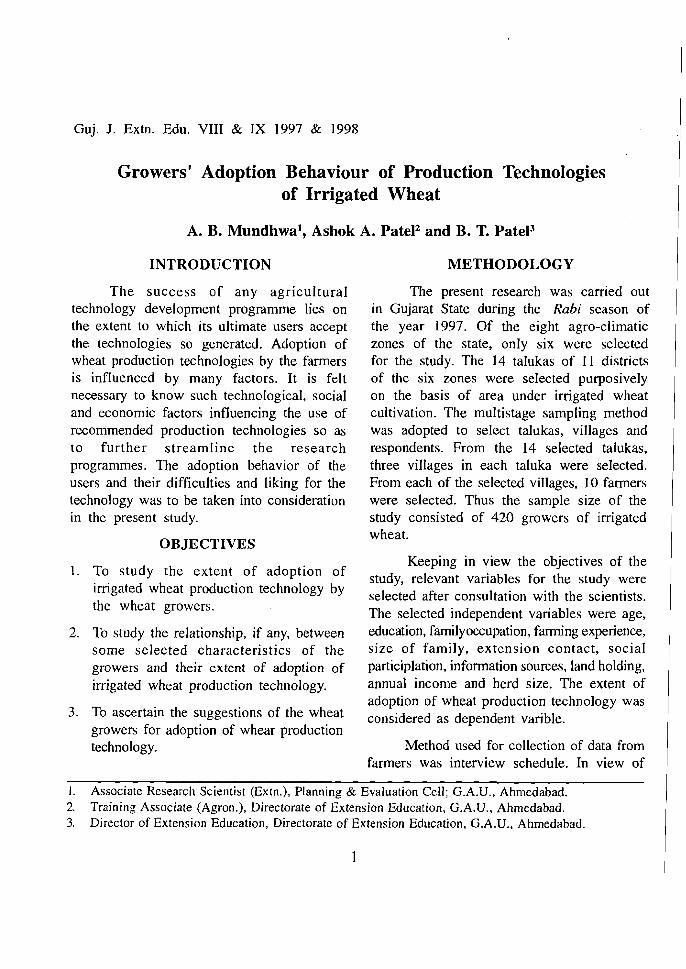
INTRODUCTION
The success of any agricultural technology development programme lies on the extent to which its ultimate users accept the technologies so generated. Adoption of wheat production technologies by the farmers is influenced by many factors. It is felt necessary to know such technological, social and economic factors influencing the use of recommended production technologies so as to further streamline the research programmes. The adoption behavior of the users and their difficulties and liking for the technology was to be taken into consideration in the present study.
OBJECTIVES
I. To study the extent of adoption of irrigated wheat production technology by the wheat growers.
2. To study the relationship, if any, between some selected characteristics of the growers and their extent of adoption of irrigated wheat production technology.
3. To ascertain the suggestions of the wheat growers for adoption of whear production technology.
METHODOLOGY
The present research was carried out in Gujarat State during the Rabi season of the year 1997. Of the eight agro-c1imatic zones of the state, only six were selected for the study. The 14 talukas of II districts of the six zones were selected purposively on the basis of area under irrigated wheat cultivation. The multistage sampling method was adopted to select talukas, villages and respondents. From the 14 selected talukas, three villages in each taluka were selected. From each of the selected villages, 10 farmers were selected. Thus the sample size of the study consisted of 420 growers of irrigated wheat.
Keeping in view the objectives of the study, relevant variables for the study were selected after consultation with the scientists. The selected independent variables were age, education, familyoccupation, farming experience, size of family, extension contact, social participlation, information sources, land holding, annual income and herd size. The extent of adoption of wheat production technology was considered as dependent varible.
Method used for collection of data from farmers was interview schedule. In view of
I. Associate Research Scientist (Extn.), Planning & Evaluation CelI; G.A.U., Ahmedabad. 2. Training Associate (Agron.), Directorate of Extension Education, G.A.U., Ahmedabad. 3. Director of Extension Education, Directorate of Extension Education, G.A.U., Ahmedabad.
1
Growers' Adoption Behaviour...
the objectives of the study, various statistical Moreover, the farmers having irrigation measures including coefficient of correlation facilities are economically better off due to were used for analysis of data. adoption of multiple croping systems. This
might have raised their aspirations leading to RESULTS AND DISCUSSION
higher adoption of irrigated wheat production The data were collected, classified, technology.
tabulated and analysed in view of the These findings are in confirmation with
objectives of the study. The fact and findings the findings of Prasad (1980), Rabari (1983)
derived after analyzing the information are discussed hereafter.
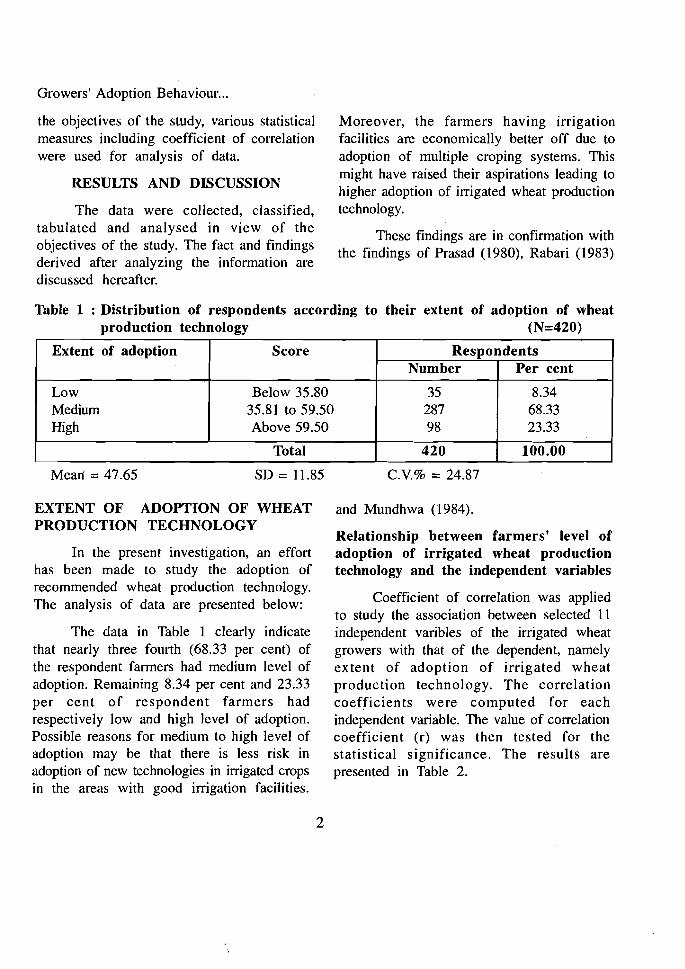
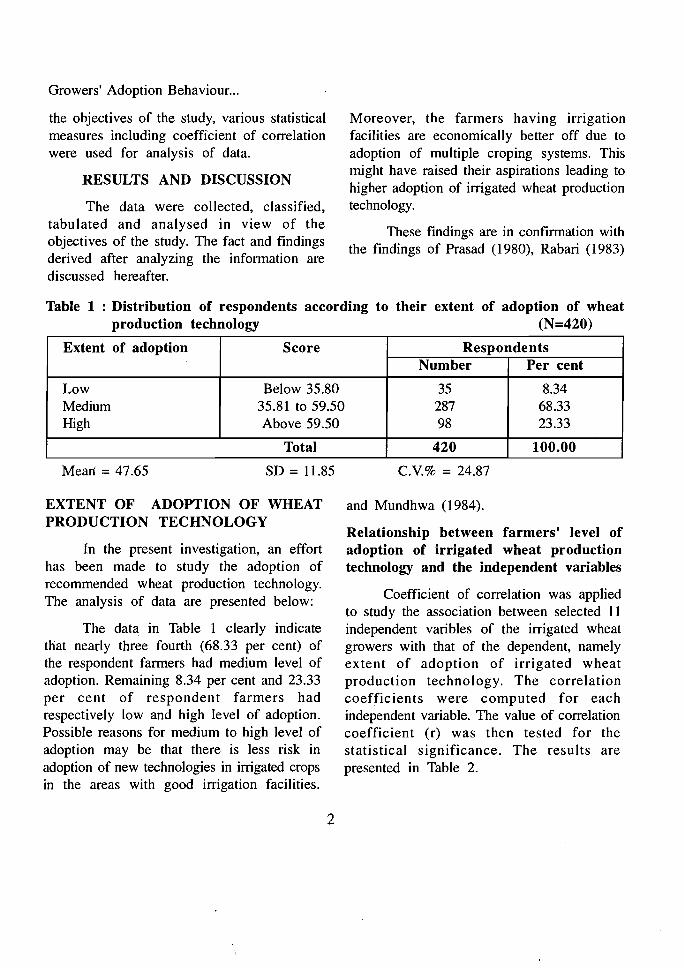
Table 1 : Distribution of respondents according to their extent of adoption of wheat production technology (N=420)
Extent of adoption Score Respondents Number Per cent
Low Medium High
Below 35.80 35.81 to 59.50 Above 59.50
35 287 98
8.34 68.33 23.33
Total 420 100.00
Mearl = 47.65 SD = 11.85
EXTENT OF ADOPTION OF WHEAT PRODUCTION TECHNOLOGY
In the present investigation, an effort has been made to study the adoption of recommended wheat production technology. The analysis of data are presented below:
The data in Table 1 clearly indicate that nearly three fourth (68.33 per cent) of the respondent farmers had medium level of adoption. Remaining 8.34 per cent and 23.33 per cent of respondent farmers had respectively low and high level of adoption. Possible reasons for medium to high level of adoption may be that there is less risk in adoption of new technologies in irrigated crops in the areas with good irrigation facilities.
2
C.Y.% = 24.87
and Mundhwa (1984).
Relationship between farmers' level of adoption of irrigated wheat production technology and the independent variables
Coefficient of correlation was applied to study the association between selected II independent varibles of the irrigated wheat growers with that of the dependent, namely extent of adoption of irrigated wheat production technology. The correlation coefficients were computed for each independent variable. The value of correlation coefficient (r) was then tested for the statistical significance. The results are presented in Table 2.
Guj. J. Extn. Edu. VIII & IX 1997 & 1998
Growers' Adoption Behaviour of Production Technologies of Irrigated Wheat
A. B. Mundhwa1, Ashok A. PateF and B. T. PateP
INTRODUCTION
The sUCcess of any agricultural technology development programme lies on the extent to which its ultimate users accept the technologies so generated. Adoption of wheat production technologies by the farmers is influenced by many factors. It is felt necessary to know such technological, social and economic factors influencing the use of recommended production technologies so as to further streamline the research programmes. The adoption behavior of the users and their difficulties and liking for the technology was to be taken into consideration in the present study.
OBJECTIVES
I. To study the extent of adoption of irrigated wheat production technology by the wheat growers.
2. To study the relationship, if any, between some selected characteristics of the growers and their extent of adoption of irrigated wheat production technology.
3. To ascertain the suggestions of the wheat growers for adoption of whear production technology.
METHODOLOGY
The present research was carried out in Gujarat State during the Rabi season of the year 1997. Of the eight agro-climatic zones of the state, only six were selected for the study. The 14 talukas of II districts of the six zones were selected purposively on the basis of area under irrigated wheat cultivation. The multistage sampling method was adopted to select talukas, villages and respondents. From the 14 selected talukas, three villages in each taluka were selected. From each of the selected villages, 10 farmers were selected. Thus the sample size of the study consisted of 420 growers of irrigated wheat.
Keeping in view the objectives of the study, relevant variables for the study were selected after consultation with the scientists. The selected independent variables were age, education, familyoccupation, farming experience, size of family, extension contact, social participlation, information sources, land holding, annual income and herd size. The extent of adoption of wheat production technology was considered as dependent varible.
Method used for collection of data from farmers was interview schedule. In view of
I. Associate Research Scientist (Extn.), Planning & Evaluation Cell; G.A.U., Ahmedabad. 2. Training Associate (Agron.), Directorate of Extension Education, G.A.U., Ahmedabad. 3. Director of Extension Education, Directorate of Extension Education, G.A.V., Ahmedabad.
I
Growers' Adoption Behaviour...
the objectives of the study, various statistical Moreover, the farmers having irrigation measures including coefficient of correlation facilities are economically better off due to were used for analysis of data. adoption of multiple croping systems. This
might have raised their aspirations leading toRESULTS AND DISCUSSION higher adoption of irrigated wheat production The data were collected, classified, technology.
tabulated and analysed in view of the These findings are in confirmation with
objectives of the study. The fact and findings the findings of Prasad (1980), Rabari (1983) derived after analyzing the information are discussed hereafter.
Table 1 : Distribution of respondents according to their extent of adoption of wheat production technology (N=420)
Extent of adoption Score Respondents Number Per cent
Low Medium High
Below 35.80 35.81 to 59.50 Above 59.50
35 287 98
8.34 68.33 23.33
Total 420 100.00
Mean = 47.65 so = 11.85
EXTENT OF ADOPTION OF WHEAT PRODUCTION TECHNOLOGY
In the present investigation, an effort has been made to study the adoption of recommended wheat production technology. The analysis of data are presented below:
The data in Table 1 clearly indicate that nearly three fourth (68.33 per cent) of the respondent farmers had medium level of adoption. Remaining 8.34 per cent and 23.33 per cent of respondent farmers had respectively low and high level of adoption. Possible reasons for medium to high level of adoption may be that there is less risk in adoption of new technologies in irrigated crops in the areas with good irrigation facilities.
2
C.V.% = 24.87
and Mundhwa (1984).
Relationship between farmers' level of adoption of irrigated wheat production technology and the independent variables
Coefficient of correlation was applied to study the association between selected 11 independent varibles of the irrigated wheat growers with that of the dependent, namely extent of adoption of irrigated wheat production technology. The correlation coefficients were computed for each independent variable. The value of correlation coefficient (r) was then tested for the statistical significance. The results are presented in Table 2.
Growers' Adoption Behaviour...
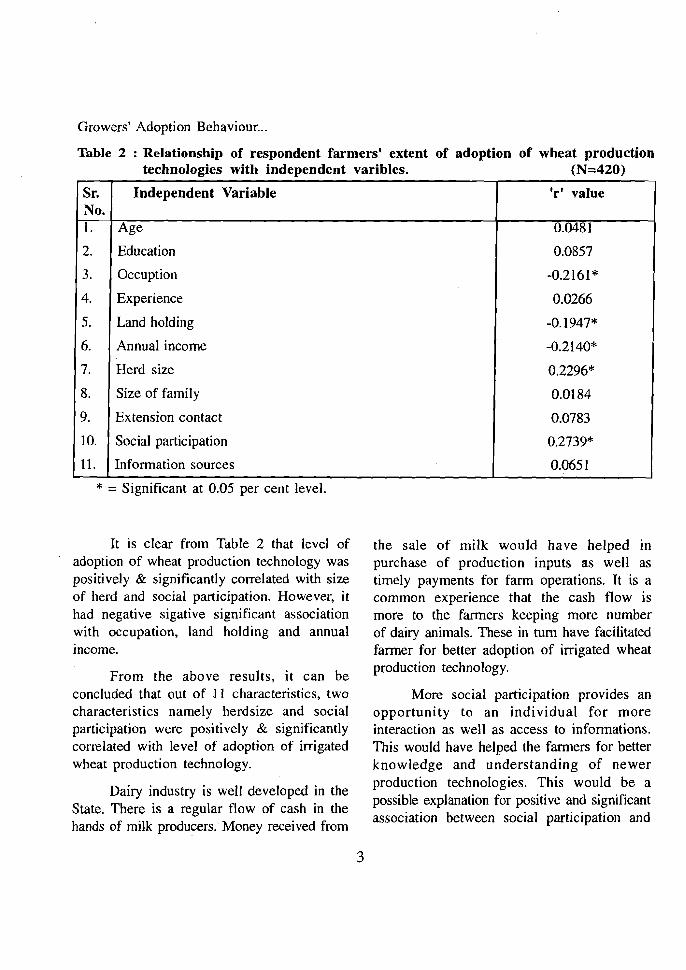
Table 2 : Relationship of respondent farmers' extent of adoption of wheat production technologies with independent varibles. (N=420)
Sr. No.
Independent Variable I r ' value
I.
2.
3.
4.
5.
6.
7.
8.
9.
10.
11.
Age
Education
Occuption
Experience
Land holding
Annual income
Herd size
Size of family
Extension contact
Social participation
Information sources
0.0481
0.0857
-0.2161 *
0.0266
-0.1947*
-0.2140*
0.2296*
0.0184
0.0783
0.2739*
0.0651
* = Significant at 0.05 per cent level.
It is clear from Table 2 that level of adoption of wheat production technology was positively & significantly correlated with size of herd and social participation. However, it had negative sigative significant association with occupation, land holding and annual income.
From the above results, it can be concluded that out of 11 characteristics, two characteristics namely herdsize and social participation were positively & significantly correlated with level of adoption of irrigated wheat production technology.
Dairy industry is well developed in the State. There is a regular flow of cash in the hands of milk producers. Money received from
the sale of milk would have helped in purchase of production inputs as well as timely payments for farm operations. It is a common experience that the cash flow is more to the farmers keeping more number of dairy animals. These in turn have facilitated farmer for better adoption of irrigated wheat production technology.
More social participation provides an opportunity to an individual for more interaction as well as access to informations. This would have helped the farmers for better knowledge and understanding of newer production technologies. This would be a possible explanation for positive and significant association between social participation and
3
Growers' Adoption Behaviour...
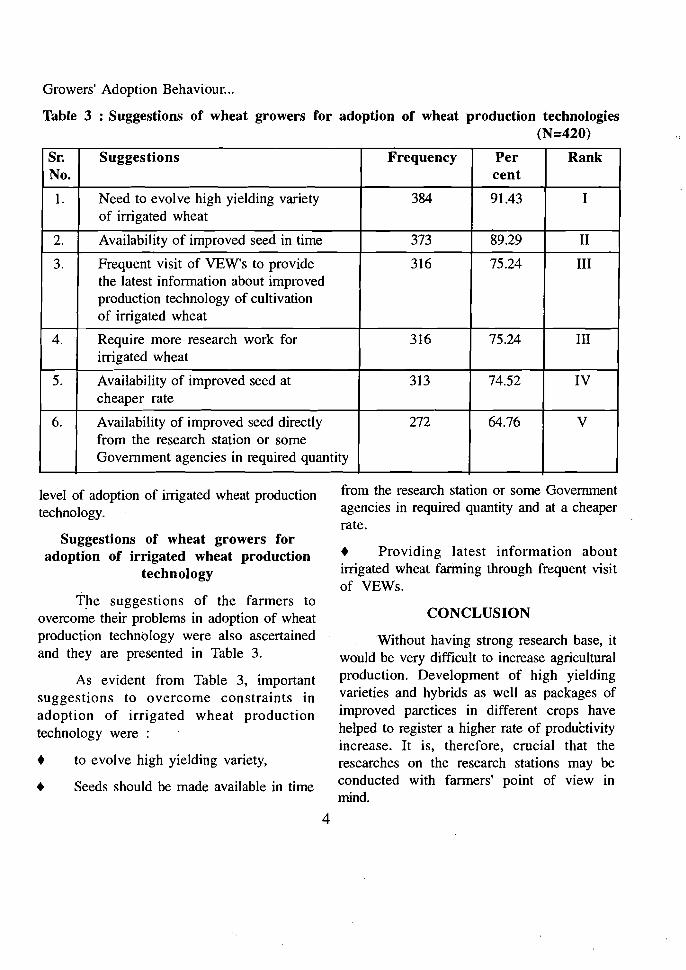
Table 3 : Suggestions of wheat growers for adoption of wheat production technologies (N=420)
Sr. No.
Suggestions Frequency Per cent
Rank
1. Need to evolve high yielding variety of irrigated wheat
384 91.43 I
2. Availability of improved seed in time 373 89.29 II
3. Frequent visit of YEW's to provide the latest information about improved production technology of cultivation of irrigated wheat
316 75.24 III
4. Require more research work for irrigated wheat
316 75.24 III
5. Availability of improved seed at cheaper rate
313 74.52 IV
6. Availability of improved seed directly from the research station or some Government agencies in required quantity
272 64.76 V
level of adoption of irrigated wheat production technology.
Suggestions of wheat growers for adoption of irrigated wheat production
technology
TJ1e suggestions of the farmers to overcome their problems in adoption of wheat production technology were also ascertained and they are presented in Table 3.
As evident from Table 3, important suggestions to overcome constraints in adoption of irrigated wheat production technology were :
• to evolve high yielding variety,
• Seeds should be made available in time
4
from the research station or some Government agencies in required quantity and at a cheaper rate.
• Providing latest information about irrigated wheat farining through frequent visit of VEWs.
CONCLUSION
Without having strong research base, it would be very difficult to increase agricultural production. Development of high yielding varieties and hybrids as well as packages of improved parctices in different crops have helped to register a higher rate of productivity increase. It is, therefore, crucial that the researches on the research stations may be conducted with fanners' point of view in mind.

Growers' Adoption Behaviour...
The major findings of the study are as under;
Nearly three-fourth (68.33 per cent) of the respondent farmers had medium level of adoption of irrigated wheat production technology.
Out of eleven ~haracteristics of the respondent fanners, two characteristics namely herdsize and social participation were positively and significantly correlated. Occupation, land holding and annual income were negatively and significantly correlated with extent of adoption of irrigated wheat production technology.
There is a need to evolve highyielding variety and also that improved seed should be made available. Frequent visit of YEWs is necessary to provide latest infonnation
about wheat production technology to the farmers. These were the important suggestions given by the irrigated wheat growers.
IMPLICATIONS
Wheat growers had medium level of adoption of wheat production technology. Hence, media mix approach such as frequent visit of YEWs, motivating the fanners to attend programmes, organization of front line demonstrations, & more use of print and electronic media is necessary to provide latest infonnation about irrigated wheat production technology to the growers.
Research efforts may be concentrated on evloving high yielding, early maturing, disease and pest resistance variety of irrigated wheat for the fanning community.
REFERENCES
Prasad, D. N. (1980). The Constraints in Adoption of Paddy Technology in Saran District of Bihar State. Unpublished Master's thesis, GAU, Anand Campus, Anand, p 133.
Rabari, B. M. (1983). Constraints Experienced by the Maize Growers in Adoption of Hybrid Maize Technology. Unpublished Master's thesis, GAU, Anand Campus, Anand, pp 167-171.
Mundhwa, A. B. (1984). A study of Constraints in Adoption of Improved Technology in Cultivation of High Yielding Rainfed Wheat in Bhal Area of Gujarat State. Unpublished Master's thesis, GAU, Anand Campus, Anand, p 95.
.:. Ifwe spend our lives in loving, we have no leisure to complain, or to feel unhappiness.
- JOSEPH JOUBERT
5

Guj. J. Extn. Edu. VIII & IX 1997 & 1998
Adoption of indigenous practices of Groundnut Cultivation by Groundnut Growers in South Saurashtra Zone
P. R. KananP, A. O. Kher2 and v: J. Savaliya3
INTRODUCTION
Saurashtra is the bowl of groundnut edible oil where the groundnut crop is the dominant crop in terms of area and production. Some farmers of this area adopt several indigenous practices of groundnut cultivation and get economically good returns. However these practices are not known and adopted by all the farmers of the area.
Keeping this in view the study was carried out with following specific objectives.
OBJECTIVES
I. To know the adoption level of groundnut growers with respect to the indigenOl,ls practices of groundnut cultivation.
2. To know the constraints in adoption of the indigenous practices related to groundnut cultivation.
METHODOLOGY
In order to achieve the above objectives a sample of 120 respondents representing eight villages from four talukas from South Saurashtra zone was drawn by using random sampling technique.
The adoption index exercised by Manju (1996) was used with slight modification according to the local situation. Adoption index for each practice adopted by the respondents was calculated and ranked. The respondents were asked to mention the constraints in adoption of indigenous practices. They were grouped into six major heads. The mean scores for all the constraints were calculated, and on the basis of mean score all the constraints were assigned ranks within the groups. The overall ranks to all constraints were also assigned and calculated. The data were collected by personal interview and analysed in the light of objectives.
RESULTS AND DISCUSSION
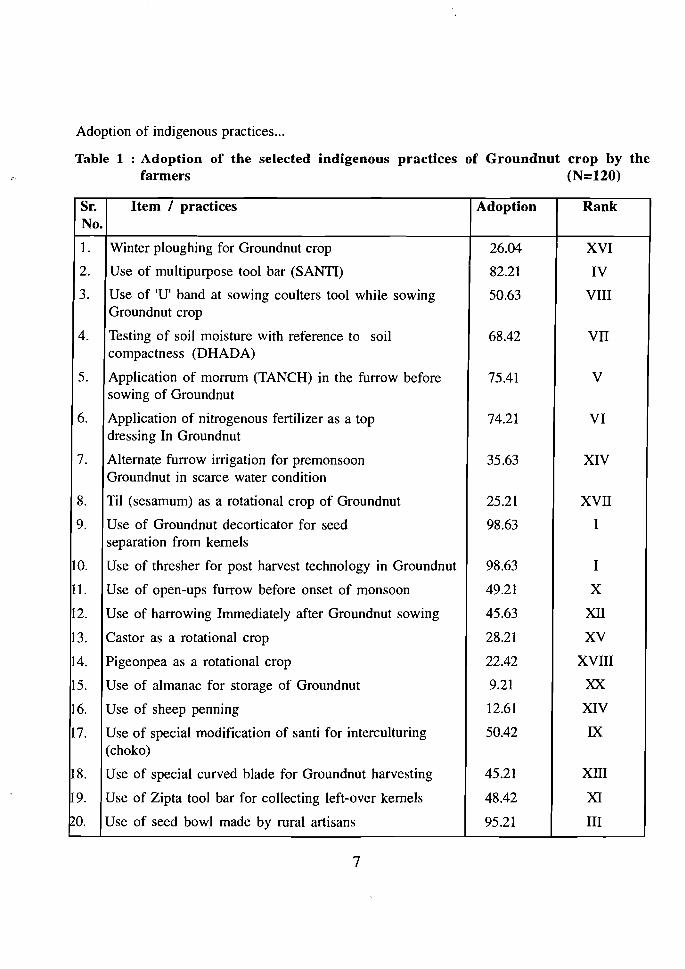
The results regarding the adoption of the selected indigenous practices of groudnut are presented in Table 1. From the data presented in Table I, it can be observed that the adoption above 70 per cent were found in the practices viz. use thresher for post harvest technology of groundnut and use of groundnut decorticator for seed separation from kernels (98.63 per cent), use of seed bowl by rural artisans (95.21 per cent), use of multi purpose tool bar (SANTI) (82.21 per cent), application of morrum (TANCH)
1. Assistant Professor, Deptt. of Extension Education, College of Agriculture, GAD., JUNAGADIi-362 001 2. Deputy Director of Extension Education (Zone), GAD., JUNAGADH- 362 001 3. Agricultural Officer, Deptt. of Extension Education, College of Agriculture. GAD.• ruNAGADH-362001
6
Adoption of indigenous practices...
Table 1 : Adoption of the selected indigenous practices of Groundnut crop by the farmers (N=120)
Sr. No.
Item / practices Adoption Rank
1. Winter ploughing for Groundnut crop 26.04 XVI
2. Use of multipurpose tool bar (SANTI) 82.21 IV
3. Use of 'V' band at sowing coulters tool while sowing Groundnut crop
50.63 VIII
4. Testing of soil moisture with reference to soil compactness (DHADA)
68.42 VII
5. Application of morrum (TANCH) in the furrow before sowing of Groundnut
75.41 V
6. Application of nitrogenous fertilizer as a top dressing In Groundnut
74.21 VI
7. Alternate furrow irrigation for premonsoon Groundnut in scarce water condition
35.63 XIV
8. Til (sesamum) as a rotational crop of Groundnut 25.21 XVII
9. Use of Groundnut decorticator for seed separation from kernels
98.63 I
10. Use of thresher for post harvest technology in Groundnut 98.63 I
11. Use of open-ups furrow before onset of monsoon 49.21 X
l2. Use of harrowing Immediately after Groundnut sowing 45.63 XII
13. Castor as a rotational crop 28.21 XV
14. Pigeonpea as a rotational crop 22.42 XVIII
l5. Use of almanac for storage of Groundnut 9.21 XX
l6. Use of sheep penning 12.61 XIV
17. Use of special modification of santi for interculturing (choko)
50.42 IX
18. Use of special curved blade for Groundnut harvesting 45.21 XIII
19. Use of Zipta tool bar for collecting left-over kernels 48.42 XI
00. Use of seed bowl made by rural artisans 95.21 III
7
Adoption of indigenous practices...
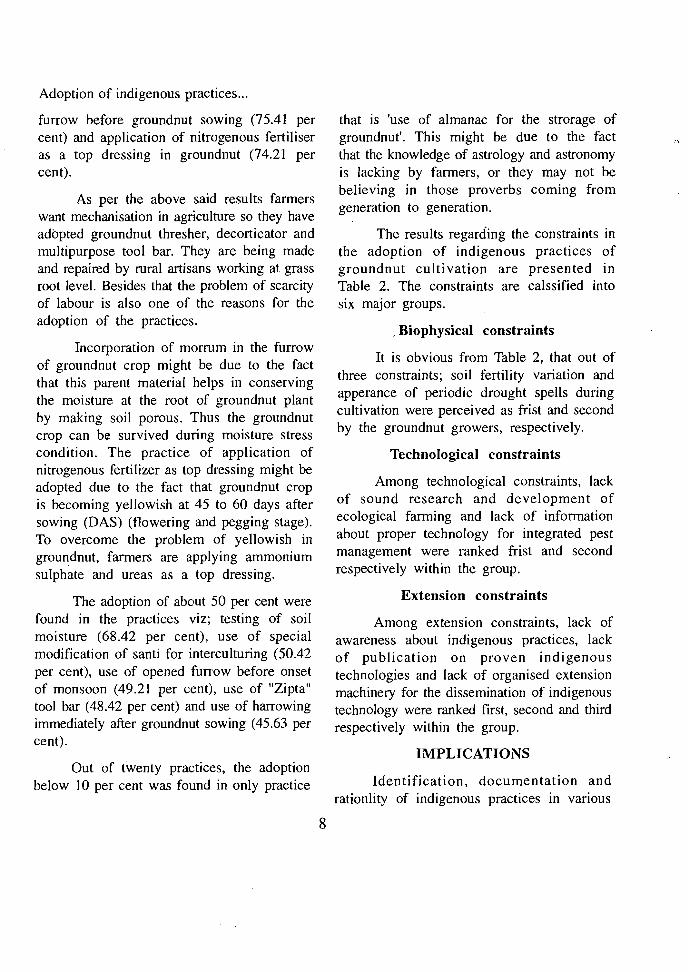
furrow before groundnut sowing (75.41 per cent) and application of nitrogenous fertiliser as a top dressing in groundnut (74.21 per cent).
As per the above said results farmers want mechanisation in agriculture so they have adopted groundnut thresher, decorticator and multipurpose tool bar. They are being made and repaired by rural artisans working at grass root level. Besides that the problem of scarcity of labour is also one of the reasons for the adoption of the practices.
Incorporation of morrum in the furrow of groundnut crop might be due to the fact that this parent material helps in conserving the moisture at the root of groundnut plant by making soil porous. Thus the groundnut crop can be survived during moisture stress condition. The practice of application of nitrogenous fertilizer as top dressing might be adopted due to the fact that groundnut crop is becoming yellowish at 45 to 60 days after sowing (DAS) (flowering and pegging stage). To overcome the problem of yellowish in groundnut, farmers are applying ammonium sulphate and ureas as a top dressing.
The adoption of about 50 per cent were found in the practices viz; testing of soil moisture (68.42 per cent), use of special modification of santi for interculturing (50.42 per cent), use of opened furrow before onset of monsoon (49.21 per cent), use of "Zipta" tool bar (48.42 per cent) and use of harrowing immediately after groundnut sowing (45.63 per cent).
Out of twenty practices, the adoption below 10 per cent was found in only practice
that is 'use of almanac for the strorage of groundnut'. This might be due to the fact that the knowledge of astrology and astronomy is lacking by farmers, or they may not be believing in those proverbs coming from generation to generation.
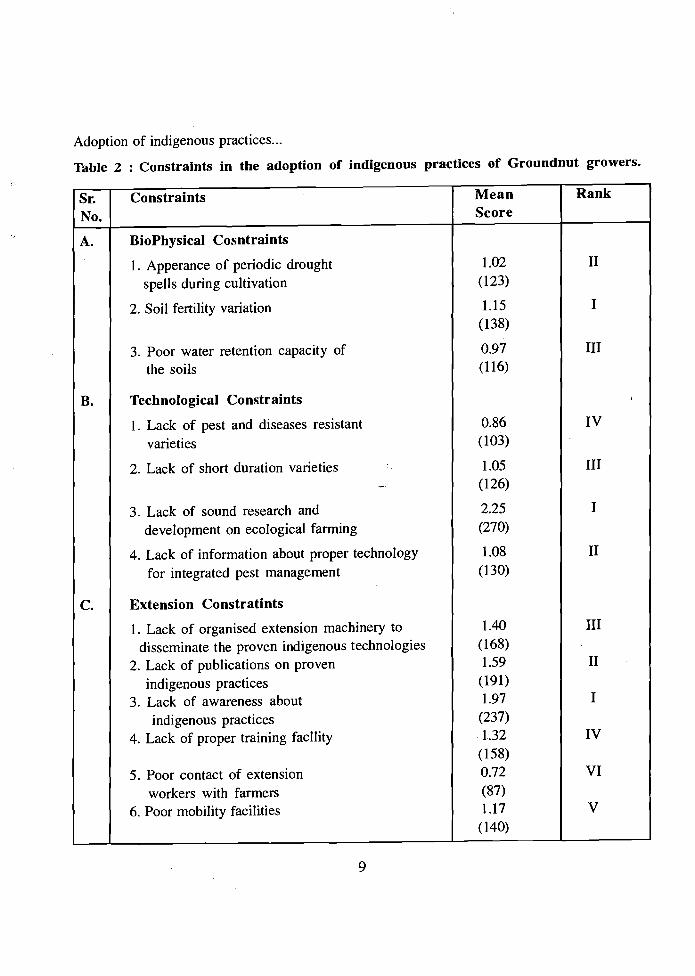
The results regarding the constraints in the adoption of indigenous practices of groundnut cultivation are presented in Table 2. The constraints are calssified into six major groups.
~ Biophysical constraints
It is obvious from Table 2, that out of three constraints; soil fertility variation and apperance of periodic drought spells during cultivation were perceived as frist and second by the groundnut growers, respectively.
Technological constraints
Among technological constraints, lack of sound research and development of ecological farming and lack of information about proper technology for integrated pest management were ranked frist and second respectively within the group.
Extension constraints
Among extension constraints, lack of awareness about indigenous practices, lack of publication on proven indigenous technologies and lack of organised extension machinery for the dissemination of indigenous technology were ranked first, second and third respectively within the group.
IMPLICATIONS
Identification, documentation and rationlity of indigenous practices in various
8
Adoption of indigenous practices...
Table 2 : Constraints in the adoption of indigenous practices of Groundnut growers.
Sr. No.
Constraints Mean Score
Rank
A. BioPhysical Cosntraints
1. Apperance of periodic drought 1.02 II spells during cultivation (123)
2. Soil fertility variation 1.15 I (138)
3. Poor water retention capacity of 0.97 III the soils (116)
B. Technological Constraints ,
1. Lack of pest and diseases resistant 0.86 IV varieties (103)
2. Lack of short duration varieties 1.05 III - (126)
3. Lack of sound research and 2.25 I development on ecological farming (270)
4. Lack of information about proper technology 1.08 II for integrated pest management (130)
C. Extension Constratints
1. Lack of organised extension machinery to 1.40 III
disseminate the proven indigenous technologies (168)
2. Lack of publications on proven 1.59 II indigenous practices (191)
3. Lack of awareness about 1.97 I indigenous practices (237)
4. Lack of proper training facIlity ·1.32 IV (158)
5. Poor contact of extension 0.72 VI workers with farmers (87)
6. Poor mobility facilities 1.17 V (140)
9
Adoption of indigenous practices...
crops are needed in other parts of the state indigenous knowledge systems, the research which calls for sincere efforts on the parts scientists should systemically classify the of agricultural scientists and extension information according to discipline. On station machinery. and on farm research projects should be
conducted by the respective scientists based Integrating indigenous knowledge on the classified indigenous knowledge system.
systems and reseach station technologies after If the results proved to be useful they should receiving the feed back information concerning
be recommended for the peasantry.
REFERENCES
Manju, S. P. (1996) Indigenous practices in coconut farming in Thrissur district. M.Sc. (Agri.) Thesis (Unpublished), Kerala Agric. Uni. Thrissure, Kerala.
,----------------, : THOSE WHO :
: WILL ADJUST :
: AND CHANGE :
: WITH THE TIMES : I I I WILL BE I I I : WINNERS, OTHER :
: WILL FALL BY : I . I I THE ROADSIDE. I ~ J
10

Guj. J. Extn. Edu. VIII & IX 1997 & 1998
Role of Awareness Camps in Improving Knowledge of Rural Women in Environmental Sanitation
Dhriti SolankP and Pushpa Gupta2
INTRODUCTION
To minimize the losses on account of the disease and enviornmental sanitation, a project "Integrated Sanitation, Water And Community Health" (ISWACH) was started in the Rajasthan state in 1986. It is implemented by the Rajasthan Govt. with support from UNICEF and financial assistance from SIAD (Swedish International Development Authority). One of the important activities of the project is to organise awareness camps in health and sanitation for rural women, since number of environmental sanitation camps have been organised, it was considered worthwhile to study the impact of these camps. Therefore, the present study was conducted with specific objective to study the impact of awareness camps on knowledge of rural women in selected' components of enviornmental sanitation.
METHODOLOGY
The study was conducted in five Panchayat Samities namely Girwa, Gogunda, Kherwada, Badgoan and Jhadol of Udaipur district of Rajasthan State, where women awareness camps on environmental sanitation have been organised.
Ex-Post facto research design was used. The sample for present study consisted of 99 participants (those rural women who have attended the enviornmental sanitation camps during the period August, 1988 to February, 1989) and 70 non-participants (those women who were not exposed to any camp). Personal interview technique was used to collect the required information. 'Z' test was used to find out significance of difference in knowledge between participants and non-participants.
RESULTS AND DISCUSSION
Majority of the respondents were illiterate, married, belonged to lower caste group, having nuclear families of less than five members. The group represented all the age groups from younger to older.
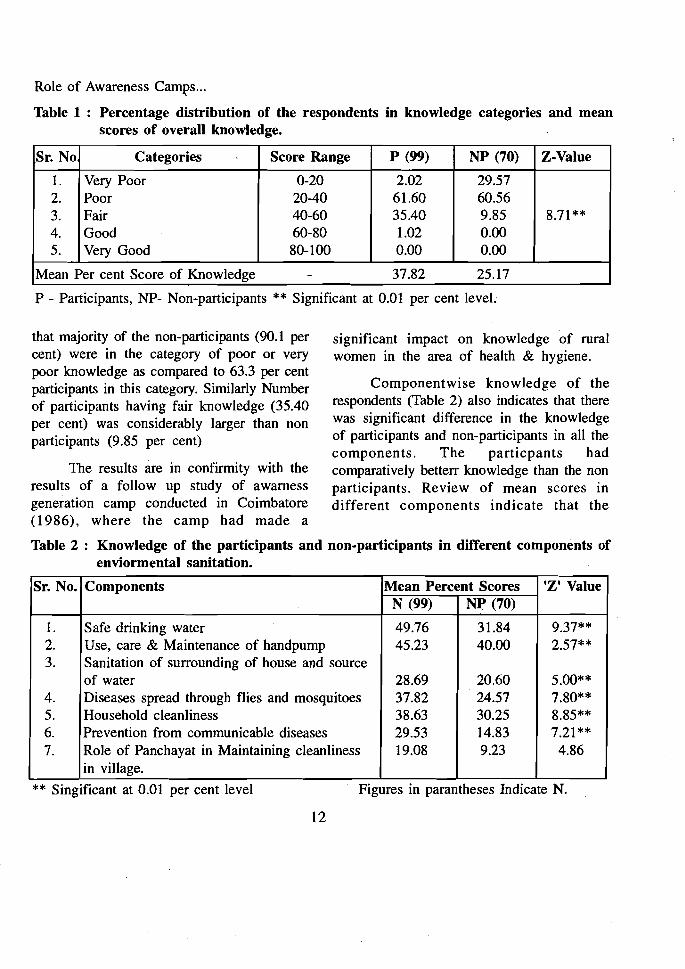
Table 1, Indicates that there was a significant difference in the overall knowledge of participants and non-participants in environmental sanitation, as the 'Z' value was found to be significant at .01 percent level. Mean percent score of the participants (37.82· per cent) was higher than that of nonparticipants.
Further distribution of respondents in different categories of knowledge highlights
1. Assistant Professor, Directorate of Extension Education, R.A.U., Campus: Udaipur. (Raj.) 2. Dean and Professor, College of Home Science, R.A.U., Campus: Udaipur. (Raj.)
11
Role of Awareness Camps...
Table 1 : Percentage distribution of the respondents in knowledge categories and mean scores of overall knowledge.
Sr. No Categories Score Range P (99) NP (70) Z-Value
I. 2. 3. 4. 5.
Very Poor Poor Fair Good Very Good
0-20 20-40 40-60 60-80 80-100
2.02 61.60 35.40 1.02 0.00
29.57 60.56 9.85 0.00 0.00
8.71 **
Mean Per cent Score of Knowledge - 37.82 25.17
P - Participants, NP- Non-participants ** Significant at 0.01 per cent leveL
that majority of the non-participants (90.1 per cent) were in the category of poor or very poor knowledge as compared to 63.3 per cent participants in this category. Similarly Number of participants having fair knowledge (35.40 per cent) was considerably larger than non participants (9.85 per cent)
The results are in confirmity with the results of a follow up study of awarness generation camp conducted in Coimbatore (1986), where the camp had made a
significant impact on knowledge of rural women in the area of health & hygiene.
Componentwise knowledge of the respondents (Table 2) also indicates that there was significant difference in the knowledge of participants and non-participants in all the components. The particpants had comparatively betterr knowledge than the non participants. Review of mean scores in different components indicate that the
Table 2 : Knowledge of the participants and non-participants in different components of enviormental sanitation.
Sr. No. Components . Mean Percent Scores 'Z'Value N (99) NP (70)
I. 2. 3.
4. 5. 6. 7.
Safe drinking water Use, care & Maintenance of handpump Sanitation of surrounding of house and source of water Diseases spread through flies and mosquitoes Household cleanliness Prevention from communicable diseases Role of Panchayat in Maintaining cleanliness in village.
49.76 45.23
28.69 37.82 38.63 29.53 19.08
31.84 40.00
20.60 24.57 30.25 14.83 9.23
9.37** 2.57**
5.00** 7.80** 8.85** 7.21 **
4.86
** Singificant at 0.01 per cent level Figures in parantheses Indicate N.
12
Role of Awareness Camps...
CONCLUSION
participants had average knowledge in the It can be concluded that participants components viz. safe drinking water and use, had comparatively better knowledge than the care & maintenance of handpump with MPS non-participants in all the components of of 49.76 and 45.23 respectively, whereas non environmental sanitation, which implies that participants had average knowldge in these awareness camps had helped the rural women components (MPS 31.84 & 40.00). Both the to enhance their knowledge in sanitation groups had very poor knowledge in the aspect.component "Role of Panchayat".
REFERENCES
Editorial, 1987. Awareness generation camp Intodia, S. L. and Upadhyay. R (1991). The for rural women in vi vekanandapuram. village contact drive A technique in rural Social Welfare. Vol. XXXIV, No.9, Page communication. A case study, Rajasthan 1 and 31. Agricultural University, Bikaner.
•:. Friendship is like earthenware, once broken it can be mended; love is like a mirror, once broken that ends it
- JOSH BILLINGS
.:. When we do not know the truth of a matter, it is well that there should be a common error to fix the spirits of men
-PASCAL
.:. The tree which needs two arms to span its girth sparang from the tiniest shoot. You tower, nine stories high, rose from a little mound of earth. A journey of a thousand miles began with a single step.
-LAO-TSE
13
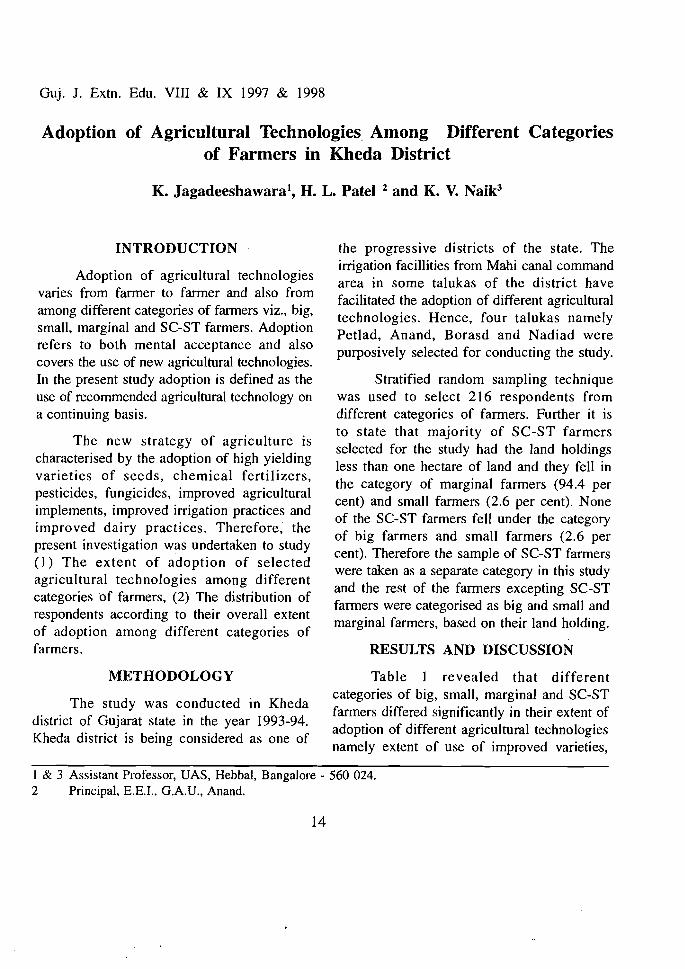
Guj. J. Extn. Edu. VIII & IX 1997 & 1998
Adoption of Agricultural Technologies Among Different Categories of Farmers in Kheda District
K. Jagadeeshawaral , H. L. Patel 2 and K. V. Naik3
INTRODUCTION
Adoption of agricultural technologies varies from farmer to farmer and also from among different categories of farmers viz., big, small, marginal and SC-ST farmers. Adoption refers to both mental acceptance and also covers the use of new agricultural technologies. In the present study adoption is defined as the use of recommended agricultural technology on a continuing basis.
The new strategy of agriculture is characterised by the adoption of high yielding varieties of seeds, chemical fertilizers, pesticides, fungicides, improved agricultural implements, improved irrigation practices and improved dairy practices. Therefore, the present investigation was undertaken to study (1) The extent of adoption of selected agricultural technologies among different categories of farmers, (2) The distribution of respondents according to their overall extent of adoption among different categories of farmers.
METHODOLOGY
The study was conducted in Kheda district of Gujarat state in the year 1993-94. Kheda district is being considered as one of
the progressive districts of the state. The irrigation facillities from Mahi canal command area in some talukas of the district have facilitated the adoption of different agricultural technologies. Hence, four talukas namely Petlad, Anand, Borasd and Nadiad were purposively selected for conducting the study.
Stratified random sampling technique was used to select 216 respondents from different categories of farmers. Further it is to state that majority of SC-ST farmers selected for the study had the land holdings less than one hectare of land and they fell in the category of marginal farmers (94.4 per cent) and small farmers (2.6 per cent). None of the SC-ST farmers fell under the category of big farmers and small farmers (2.6 per cent). Therefore the sample of SC-ST farmers were taken as a separate category in this study and the rest of the farmers excepting SC-ST farmers were categorised as big and small and marginal farmers, based on their land holding.
RESULTS AND DISCUSSION
Table 1 revealed that different categories of big, small, marginal and SC-ST farmers differed significantly in their extent of adoption of different agricultural technologies namely extent of use of improved varieties,
I & 3 Assistant Professor, UAS, Hebbal, Bangalore - 560 024. . 2 Principal, E.E.L, GAU., Anand.
14

Adoption of Agricultural Technologies...
Table 1 : Mean index of extent of adoption of different agricultural technologies among four different categories of farmers. (N=216)
Sr. No.
Technologies Big farmers
Small farmers
Marginal farmers
SC-ST farmers
F values
I. Extent of use of improved varieties
100.00 ]00.00 ]00.00 ]00.00 -
2. Extent of use of fertilizers
68.30 70.35 58.00 42.72 ]4.33*
3. Extent of use of pesticides
63.00 52.]8 36.00 ] 4.83 5.78*
4. Extent of use of fungicides
27.90 20.62 20.00 9.00 2.55*
5. Extent of use of irrigation practices
60.58 6] .80 57.00 49.94 1.19
6. Extent of use of improved dairy practices
79.] 5 80.92 84.00 68.00 22.30*
* Significant at 0.05 per cent level
chemical fertilizers, pesticides, fungicides, improved agricultural implements, improved irrigation practices and improved dairy practices. The discussion of the table is as follows.
EXTENT OF USE OF IMPROVED VARIETIES
The extent of use of recommended seeds of high yielding varieties for different crops was found to be ]00 per cent in all the categories of farmers, thus it can be inferred that extent of use of improved varieties and hybrid varieties of different crops namely, paddy, wheat, tobacco, oilseeds, bajra and vegetable crops was maximum i.e., ]00 per cent. Therefore agriculture modernisation and extent of adoption in case of improved variety was 100 per cent in Kheda district. The possible reason for ]00 per cent use of high
yielding varieties by all categories of farmers is due to the availability of irrigation facilities and high income derived from commercial crops. The efforts of Agricultural University, Department of Agriculture, Extension Agencies and Seed Agencies might have contributed for introduction of High Yielding Varieties in Kheda district. The present findings confirm with the findings of Negi (1971) and Patel (1992).
EXTENT OF USE OF CHEMICAL FERTILIZERS
It was revealed that the index value of extent of use of chemical fertilizers for different crops was highest in case of small and big farmers (70.35 per cent) and (68.30 per cent) respectively, while in case of marginal farmers, the index value of extent of use of fertilizers was more than half (58.00 per cent)
15

Adoption of Agricultural Technologies...
Table 2 : Distribution of respondents according to overall extent of adoption among different categories of farmers. (N=216)
Sr. Particulars Big Small Maginal SC-ST Total No. farmers farmers farmers farmers farmers
No % No % No % No % No %
1.
2.
3.
Low
(upto 44.32)
Medium
(44.33-72. I 7)
High
(72. I 8& above)
Total·
9
31
20
60
15.00
51.60
33.33
100.00
8
34
18
60
13.33
56.60
30.00
'100.00
8
33
19
60
13.33
55.00
31.66
100.00
10
20
6
36
27.77
55.55
16.66
100.00
35
118
63
216
16.20
54.62
29.18
100.00
Mean 0.6342 0.6282
S.D. 0.1200 0.1628
F value 19.54*
whereas in case of SC-ST farmers the index value of extent of use of fertilizers was less than half (42.72 per cent). The probable reason for high index of extent of use of recommended chemical fertilizers by big and small farmers may be due to their better financial position when compared to marginal and SC-ST farmers. Therefore it can be inferred that extent of use of fertilizer is more pronounced in higher strata of the society. The findings get the support from the findings of Ramakrishnappa (1985) and Ingle (1989) and Patel (1992).
EXTENT OF USE OF RECOMMENDED PESTICIDES
0.5625 0.4539 0.5825
0.0972 0.0925 0.1393
* Significant at 0.01 per cent level
different crops was found to be 63.00 per cent in case of big farmers and 52.18 per cent in case of small farmers. Whereas in case of marginal and SC-ST farmers the index of use of plant protection measures was lowest Le., 36.00 per cent and 14.83 per cent respectively. The possible reason for the use of pesticides to aforesaid extent by big, small, marginal and SC-ST farmers may be due to that the pesticides were costly to all categories of farmers specially marginal and SC-ST farmers may not be affording to purchase such costly inputs.
EXTENT OF USE OF RECOMMENDED FUNGICIDES
The findings revealed that the index It was revealed that the index value of value of use of recommended fungicides for
extent of use of recommended pesticides for controlling diseases of different crops was
16
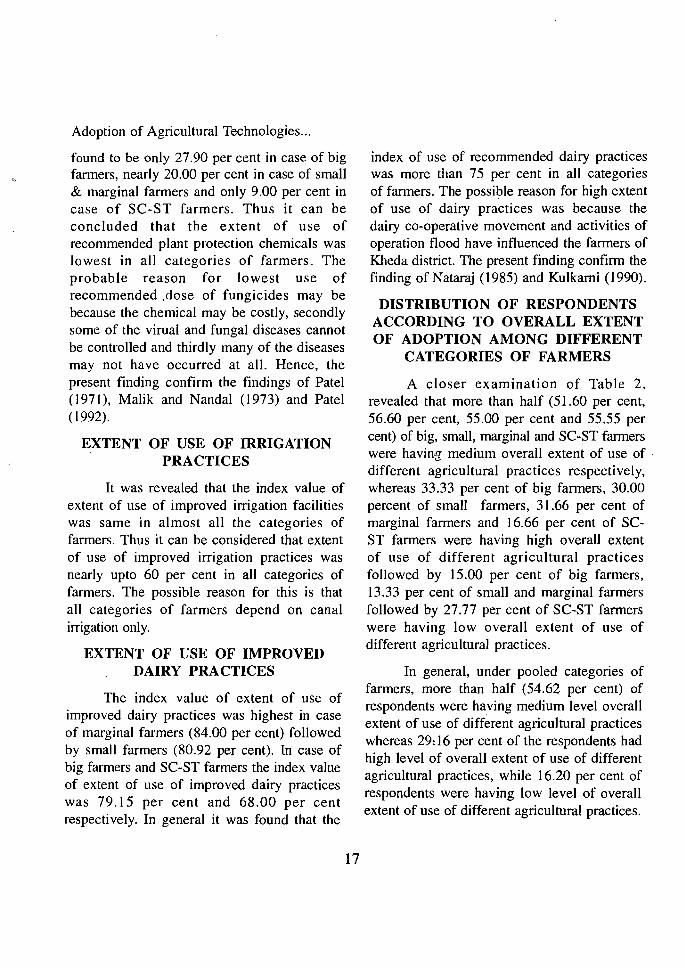
Adoption of Agricultural Technologies...
found to be only 27.90 per cent in case of big farmers, nearly 20.00 per cent in case of small & marginal farmers and only 9.00 per cent in case of SC-ST farmers. Thus it can be concluded that the extent of use of recommended plant protection chemicals was lowest in all categories of farmers. The probable reason for lowest use of recommended .dose of fungicides may be because the chemical may be costly, secondly some of the virnal and fungal diseases cannot be controlled and thirdly many of the diseases may not have occurred at all. Hence, the present finding confirm the findings of Patel (1971), Malik and Nandal (1973) and Patel (1992).
EXTENT OF USE OF IRRIGATION PRACTICES
It was revealed that the index value of extent of use of improved irrigation facilities was same in almost all the categories of farmers. Thus it can be considered that extent of use of improved irrigation practices was nearly upto 60 per cent in all categories of farmers. The possible reason for this is that all categories of farmers depend on canal irrigation only.
EXTENT OF USE OF IMPROVED DAIRY PRACTICES
The index value of extent of use of improved dairy practices was highest in case of marginal farmers (84.00 per cent) followed by small farmers (80.92 per cent). In case of big farmers and SC-ST farmers the index value of extent of use of improved dairy practices was 79.15 per cent and 68.00 per cent respectively. In general it was found that the
index of use of recommended dairy practices was more than 75 per cent in all categories of farmers. The possible reason for high extent of use of dairy practices was because the dairy co-operative movement and activities of operation flood have influenced the farmers of Kheda district. The present finding confirm the finding of Nataraj (1985) and Kulkarni (1990).
DISTRIBUTION OF RESPONDENTS ACCORDING TO OVERALL EXTENT OF ADOPTION AMONG DIFFERENT
CATEGORIES OF FARMERS
A closer examination of Table 2, revealed that more than half (51.60 per cent, 56.60 per cent, 55.00 per cent and 55.55 per cent) of big, small, marginal and SC-ST farmers were having medium overall extent of use of . different agricultural practices respectively, whereas 33.33 per cent of big farmers, 30.00 percent of small farmers, 31.66 per cent of marginal farmers and 16.66 per cent of SCST farmers were having high overall extent of use of different agricultural practices followed by 15.00 per cent of big farmers, 13.33 per cent of small and marginal farmers followed by 27.77 per cent of SC-ST farmers were having low overall extent of use of different agricultural practices.
In general, under pooled categories of farmers, more than half (54.62 per cent) of respondents were having medium level overall extent of use of different agricultural practices whereas 29~ 16 per cent of the respondents had high level of overall extent of use of different agricultural practices, while 16.20 per cent of respondents were having low level of overall extent of use of different agricultural practices.
17

Adoption of Agricultural Technologies ...
The computed F value 19.54 indicated highly significant differences among different categories of farmers with respect to use of overall extent of use of different agricultural practices. The present finding is in confirmity with the finding of Patel (1992).
CONCLUSION
It was found that the different categories of big, small, marginal and SC-ST farmers differed in their extent of adoption of different agricultural technologies namely
extent of use of improved varieties, chemical fertilizers, pesticides, fungicides, improved irrigation practices and improved dairy practices.
The positive significant differences among four different categories of farmers were found in case of extent of use of chemical fertilizers, pesticides, fungicides, and improved dairy practices. Whereas, extent of use of improved varieties and improved irrigation practices exhibited non-significant differences among different categories of farmers.
REFERENCES
Ingle, P. O. and Wayazude, N. R., 1989, Adoption of Agricultural Technologies in Rainfed farming project. Maha. J. Extn. Edu., Vol. VIII, 1989, pp. 189-192.
Kulkarni, U.Y., Bhopale, R. S. and Chede, P.N., 1990, Constraints in the adoption of Dairy technologies by Dairy farmers. Maha J. Extn. Edu., Vol. IX, 1990, pp. 137140.
Malik, H. S. and Nandal, D. S., 1973, Adoption of improved technology. Kurukshetra, 21 (12) : 14-16.
Nataraj, M. S. and Channegowda, M. B., 1985, Adoption behaviour of dairyman in relation to their personal characteristics. Mysore J. Agril Sci., 21 : 354-358
Negi, L. S., 1971, Role of plant pathology in modernising agriculture. Paper presented at the second International Symposium of Plant Pathology held at I.A.R.I., New Delhi from January 27 to February 3.
18
Patel, K. E, 1992, Level of adoption of some improved practices of Massouri paddy cultivation. M.Sc. Thesis (Unpub.), South Gujarat University, Surat.
Patel, N.R., 1996, Dynamics of Adoption of New Agricultural Technology and Consequences in watershed areas of Banaskantha and Mehsana district of Gujarat. Ph.D. Thesis (Unpub.), G.A.U., Dept. of Extension Education, Sardar Krishinagar.
Ramakrishnappa, K.Y., 1985, A case study on impact of village adoption programme in the Rainfed Area of Dharwad district of Karnataka State. M.Sc. (Agri.) thesis (Unpub.), U.A.S., Bangalore.

Guj. J. Extn. Edu. VIII & IX 1997 & 1998
Gain in Knowledge by the Life Member Farmers' Through Krushi-Go-Vidya Farm Magazine
N. J. Hingu l and N. R. PateP
INTRODUCTION
Farm magazines are popular in communicating modern technologies to the peasantry by virtue of their regular publication.
The farm magazines provide technological know-how to the farmers at regular intervals and also increase the knowledge of farmers regarding improved package of practices of different crops and other allied fields. It is assumed that individuals who read farm magazine are likely to gain more knowledge about agricultural technology. But the question is that how far such farm magazines are actually read by their readers and up to what extent readers have gained knowledge.
'Krushi-Go-Vidya' (KGV) is the oldest farm magazine published by Gujarat Agricultural University since 1948. Looking to this facts, the present study was carried out with following objectives : (I) To measure the gain in knowledge about agricultural technology by the farmer life members through 'KrushiGo-Vidya' farm magazine, (2) To find out the relationship between selected characteristics of the respondents and their gain in knowledge about agricultural technology through 'KrushiGo-Vidya' farm magazine:
METHODOLOGY
The present study was conducted in Kheda district of Gujarat state. Five talukas viz., Anand, Borsad, Matar, Petlad and Nadiad were selected purposively for this study, where farmer life members were more then ten in number. In all 105 farmer life members were selected as the respondents.
All the respondents were enrolled as a life member of 'Krushi-Go-Vidya' before September, 1994. Hence, all the five issues published from August, 1994 to December, 1994 were selected for finding out gain in knowledge.
A suitable teacher-made test was developed and used to measure gain in knowledge of the farmer life members. For this, initially 80 items were collected from five selected issues of 'Krushi-Go-Vidya'. After discussion with experts and scientists, finally 50 items covering recommended package of practices of summer paddy and mustard and other items on irrigation, fertilizer, plant protection measures, horticulture, animal husbandry were selected to test the gain in knowledge about agricultural technology through 'Kmshi-Go-Vidya' farm magazine by the farmer life members. One and zero score were given to correct and incorrect answers
I. P. G. Student, BACA, G.A.D., Anand 2. Associate Extension Educationist E.E.I., G.A.V., Anand
19
Gain in Knowledge by...
respeatively. Thus, the final score obtained is RESULTS AND DISCUSSION known as gain knowledge score.
Gain in knowledge by the farmer life The data were analysed by using mean, members: standard deviation, percentage, coefficient of correlation and path analysis.
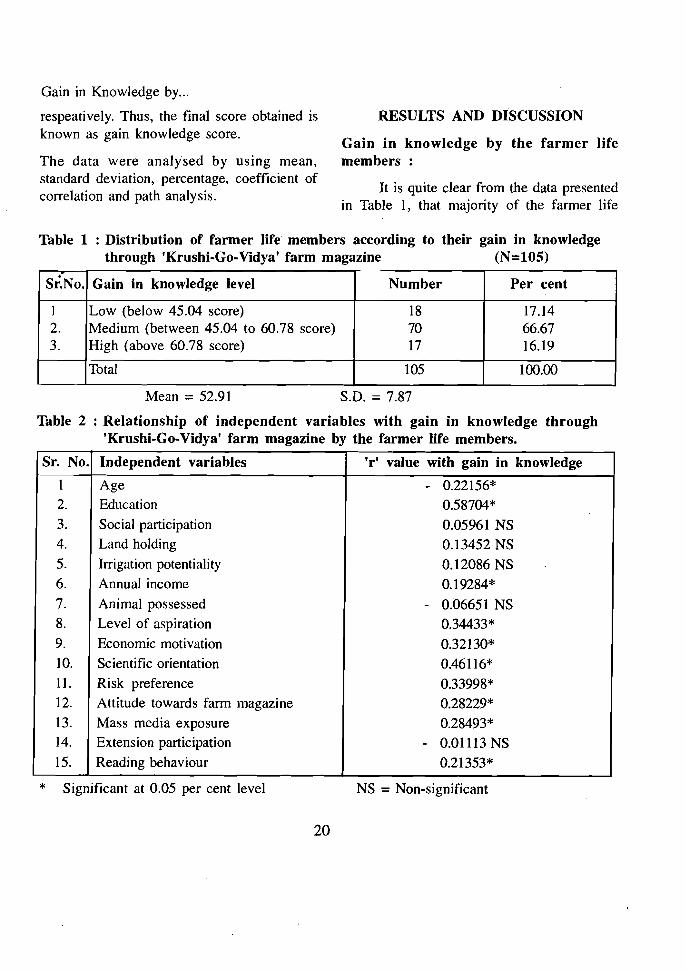
It is quite clear from the data presented in Table 1, that majority of the farmer life
Table 1 : Distribution of farmer life members according to their gain in knowledge through 'Krushi·Go·Vidya' farm magazine (N=10S)
SiNo. Gain in knowledge level Number Per cent
I 2. 3.
Low (below 45.04 score) Medium (between 45.04 to 60.78 score) High (above 60.78 score)
18 70 17
17.14 66.67 16.19
Total 105 100.00
Mean = 52.91 S.D. = 7.87
Table 2 : Relationship of independent variables with gain in knowledge through 'Krushi.Go.Vidya' farm magazine by the farmer life members.
Sr. No. Independent variables 'r' value with gain in knowledge
1 Age - 0.22156* 2. Education 0.58704* 3. Social participation 0.05961 NS 4. Land holding 0.13452 NS 5. Irrigation potentiality 0.12086 NS 6. Annual income 0.19284* 7. Animal possessed - 0.06651 NS 8. Level of aspiration 0.34433* 9. Economic motivation 0.32130* 10. Scientific orientation 0.46116* II. Risk preference 0.33998* 12. Attitude towards farm magazine 0.28229* 13. Mass media exposure 0.28493* 14. Extension participation - 0.01113 NS 15. Reading behaviour 0.21353*
* Significant at 0.05 per cent level NS = Non-significant
20
Gain in Knowledge by...
members (66.67 percent) had medium level of gain in knowledge. This finding is in conformity with the findings of Ram Kumar and Pushkaran (1990) and Joshi (1993).
Relationship of independent variables with gain in knowledge by the respondents :
Perusal of the data presented in Table 2 show that the independent variables like education, annual income, level of aspiration, economic motivation, scientific orientation, risk preference, attitude towards 'Krushi-Go-Vidya'
mass media exposure and reading behaviour of the fanner life members were positively and significantly related and age was negatively and significantly related with gain in knowledge.
On the other hand, the varibles viz., social participation, land holding, irrigation potentiality, animal possessed and extension participation showed non-significant relationship with gain in knowledge.
This finding is supported by Joshi (1993).
Table 3 : Path co-efficient of the independent variables with gain in knowledge of farmer life members
Sr. No.
Varibles Direct effect
Total indirt:~t effect
Substantial indirect effect through
1 2
XI Age -0.1490 -0.0726 -0.0524 (X2)
-0.0550 (X)()
X 2 Education 0.4252 0.1618 0.1190 (X)()
-0.0686 (X9)
Xc> Annual income 0.0016 0.1913 0.1371 (X2)
0.0600 (X)()
Xx Level of aspiration 0.0886 0.2558 0.2000 (X2)
0.0408 (X)()
X 9 Economic motivation -0.1527 0.4741 0.1910
(X2)
0.1648 (X)()
X)() Scientific orientation 0.2274 0.2336 0.2224 (X2)
-0.1107 (X)
XI) Risk preference -0.0200 0.3600 0.1949 (X
2)
0.1701 (X
IO )
X I2 Attitude towards fann magazine 0.1717 0.1106 0.0775 (X
IO)
0.0746 (X2)
X I3 Mass media exposure 0.0492 0.2358 0.1566 (X
2)
0.0581 (X)()
XIS Reding behaviour 0.1440 0.0696 0.0349 (X2)
0.0213 (X)()
21
Gain in Knowledge by...
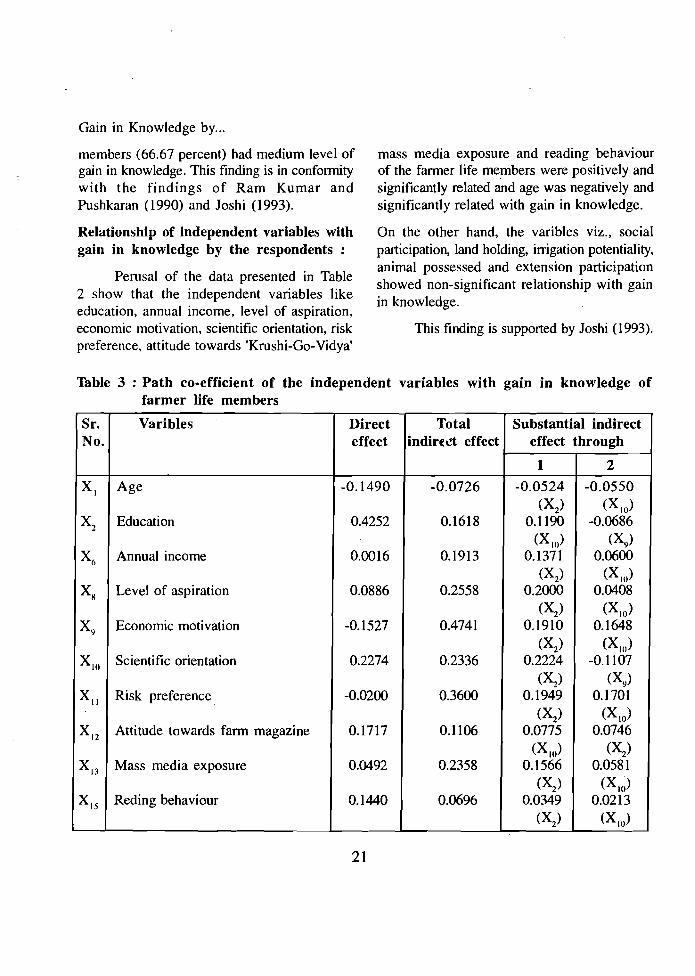
Path analysis :
The results of path analysis are presented in Table 3.
Direct effect :
It was observed from Table 3 that the education exerted the highest direct positive effect on gain in knowledge as the path coefficient was 0.4252 followed by scientific orientation (0.2274).
Total indirect effect :
So far as the total indirect effect is concerned, economic motivation had the highest positive total indirect effect (0.4741) on gain in knowledge followed by risk preference (0.3600).
Substantial indirect effect :
Scientific orientation exerted highest positive first order substantial indirect effect (0.2224) on gain in knowledge through education, followed by level of aspiration (0.2000) through education.
The second order largest positive substantial indirect effect was exerted by risk
preference (0.1701) through scientific orientation followed by economic motivation (0.1648).
CONCLUSION
It is concluded that majority of the farmer life members possessed medium level of gain in knowledge. The variables age, education, annual income, level of aspiration, economic motivation, scientific orientation, risk preference, attitude towards farm magazine, mass media exposure and reading behaviour were positively correlated with gain in knowledge.
Among all the variables education and scientific orientation exerted the highest direct effect on g~in in knowledge.
IMPLICATIONS
Psychological characteristics like level of aspiration, economic motivation, scientific orientation, risk preference and attitude towards farm magazine have influenced the gain in knowledge, therefore, extension worker should try to manipulate these variables while working with farming community.
REFERNCES
Joshi, K. M. 1993. A study of readership pattern, readability and effectiveness of farm magazine 'Krushi-Go-Vidya' among the readers. Unpublished M.Sc. (Agri.) Thesis, GAU, Navsari.
22
Ram Kumar, S. and Pushkaran, P.S. 1990. Kno'7'ledge level of the participants and non-participants of the correspondence course in Dairying. Ind. J. of Ext. Edu. 26 (1&2) : 107-109.

Guj. J. Extn. Edu. VIII & IX 1997 & 1998
Farm Telecast Viewing Behaviour of TV Owning Farmers
R. K. DanP and B. B. PateP
INTRODUCTION
Agricultural information is disseminated to the farmers through mass media like news paper, radio, television etc. They try to satisfy the information need of the people. But, TV is the most exciting means of communication ever devised by man. Ahmedabad Doordarshan has been entrusted the responsibility of providing an agricultural programme "GRAM JAGAT" for Gujarat state. The value of any programme can only be judged through audience response and hence, the present study entitled "Farm Telecast Viewing Behaviour of TV Owning Farmers" was carried out with the following objectives.
OBJECTIVES
I. To know the awareness about farm telecast programmes of tele-viewing farmers.
2. To identify the different viewing dimensions of respondents towards farm telecast.
3. To know the levels of televiewing behaviour of TV owning contact and noncontact farmers.
METHODOLOGY
The present study was conducted in Panchmahals district of Gujarat state. Santrampur taluka was purposively selected
because investigator belonged to this taluka and was aware of local people and no study has been carried out sofar related to farm telecast. A random sample of 120 respondents comprising 70 contact farmers and 50 noncontact farmers who possessed their own TV set and having land were selected from 10 villages of Santrampur taluka of Panchmahals district of Gujarat state with the help of VLW working under T&V system.
The tool of the study was interview schedule. To know the awareness and different viewing dimensions, frequencies and percentages were carried out to identify the level of farm telecast viewing behaviour of the respondents. The total score was calculted, summed up and grouped as low, medium and high level of behaviour with the help of S. D. and mean.
RESULTS AND DISCUSSION
In the present study, the theoretical framework for the concept of viewing behaviour was based on the assumption that behaviour being the function of knowledge, attitude and skills of an individual had different manifestation depending upon their level of need disposition. This vewing behaviour was defined as propensity of an individual (rural audience) to watch television of the farm television programmes with greater curiousity. so as to possess the capacity of inducing influence in
1. P. G. Student (Extn.), BACA, GAU, Anand 2, Assoc. Extension Educationist, EEl, GAU, Anand
23
Farm Telecast Viewing Behaviour...
him. Specifically, it refers to the farmers pattern of watching farm telecast, their preferences and interest while viewing the programme as well as carrying its acquired information to influence others.
(A) Awarencess Regarding the Agricultural ~rogramme.
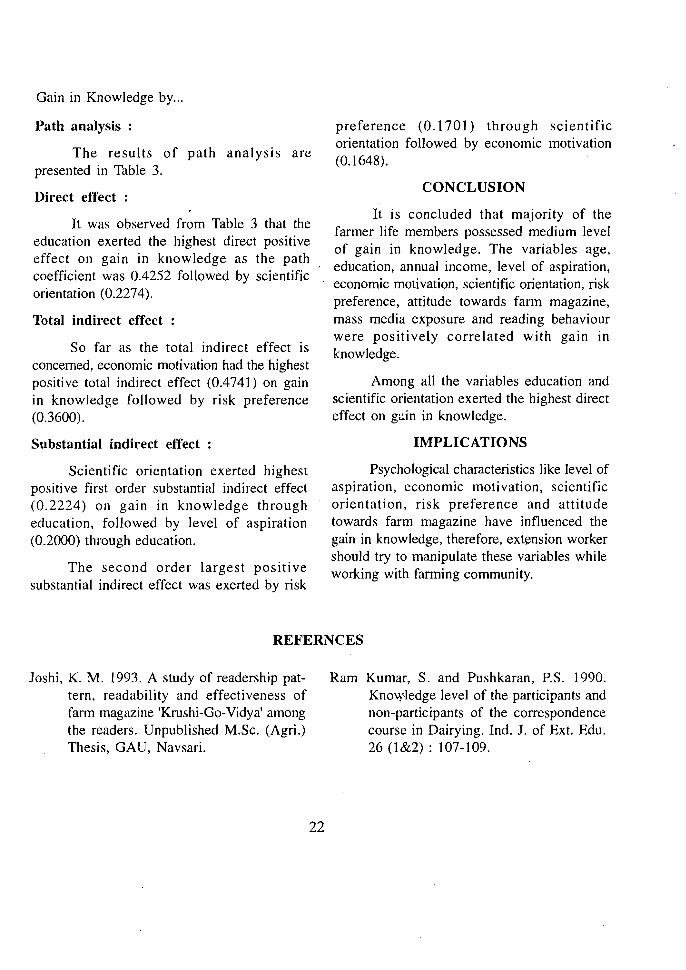
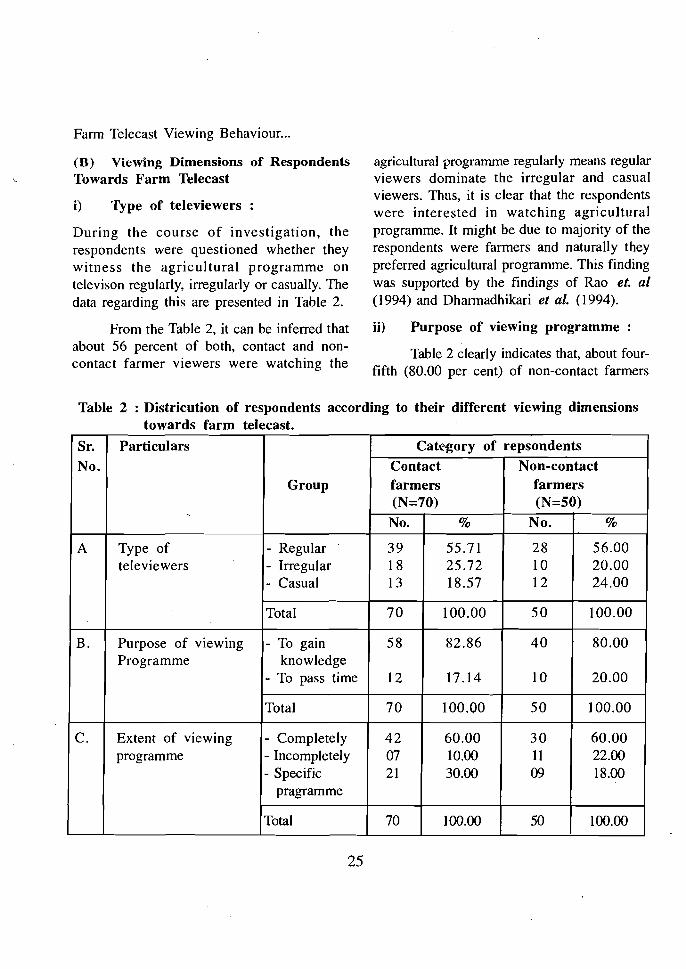
It is important to know whether the respondents were aware about the name and schedule of the agricultural programme replayed by Doordarshan Kendra. Information regarding this was collected from the respondents and presented in Table 1.
In terms of time and duration, majority (84.29 per cent) of the contact farmers and non-contact farmers (82 per cent) were aware
of agricultural programme telecast by Doordarshan kendra.
It is evident from Table 1 that, most of the contact (88.57 per cent) and non-contact (90.00 per cent) farmer respondents were knowing the name of agricultural programme. Nearly equal percentage (85.71 and 84 per cent) of both the contact and non-contact farmers were aware about the day of agricultural programme telecast by Doordarshan Kendra. This might be due to the fact that majority of the respondents had agriculture as their main occupation and they might be eager to get more and more information from the TV. This finding was in line with the findings of Bhople and Mouje (1989).
Table 1 : Distribution of respondents according to their awareness about farm telecast progaramme
Sr. Particulars Category of repsondent
No. Contact Non-contact farmers farmers (N=70) (N=50)
No. % No. % A Name of programme
i. Knowing ii. Not-knowing
62 08
88.57 11.43
45 05
90.00 10.00
B. Day of programme I. Knowing II. Not-knowing
60 10
85.71 14.29
42 08
84.00 16.00
C. Time and Duration of programme. 1. Knowing ii. Not-knowing
59 11
84.29 15.71
41 09
82.00 18.00
24
Farm Telecast Viewing Behaviour...
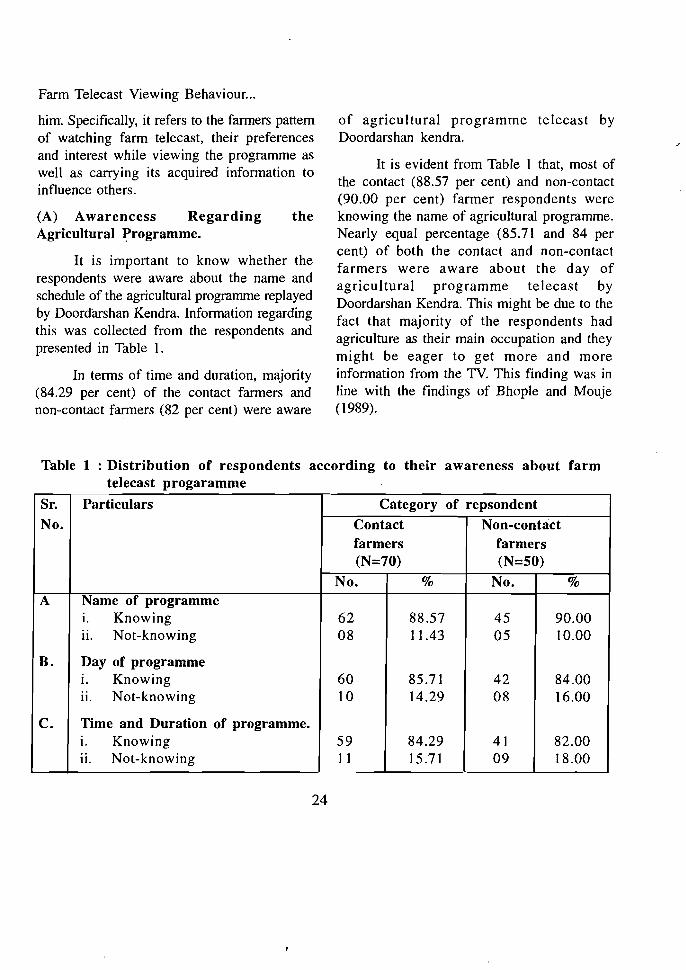
(B) Viewing Dimensions of Respondents Towards Farm Telecast
i) Type of televiewers :
During the course of investigation, the respondents were questioned whether they witness the agricultural programme on televison regularly, irregularly or casually. The data regarding this are presented in Table 2.
From the Table 2, it can be inferred that about 56 percent of both, contact and noncontact farmer viewers were watching the
agricultural programme regularly means regular viewers dominate the irregular and casual viewers. Thus, it is clear that the respondents were interested in watching agricultural programme. It might be due to majority of the respondents were farmers and naturally they preferred agricultural programme. This finding was supported by the findings of Rao et. al (1994) and Dharmadhikari et al. (1994).
ii) Purpose of viewing programme
Table 2 clearly indicates that, about fourfifth (80.00 per cent) of non-contact farmers
Table 2 : Districution of respondents according to their different viewing dimensions towards farm telecast.
Sr.
No.
Particulars
,
Group
Catt'>gory of repsondents
Contact Non-contact farmers farmers (N=70) (N=SO)
% No.No. %
A Type of televiewers
- Regular - Irregular - Casual
39 18 13
55.71 25.72 18.57
28 10 12
56.00 20.00 24.00
Total 70 100.00 50 100.00
B. Purpose of viewing Programme
- To gain knowledge
- To pass time
58
12
82.86
17.14
40
10
80.00
20.00
Total 70 100.00 50 100.00
C. Extent of viewing programme
- Completely - Incompletely - Specific
pragramme
42 07 21
60.00 10.00 30.00
30 11 09
60.00 22.00 18.00
Total 70 100.00 50 100.00
25
Farm Telecast Viewing Behaviour...
Table 3 : Distribution of respondents according to their level of farm telecast viewing behaviour
Sr.
No.
Particulars
Contact farmers (N=70)
No. %
Category of repsondents
Non-contact farmers (N=50)
No. %
Chisquare value
Xl
A Low 07 10.00 1 ] 22.00
B. Meidum 46 65.71 34 68.00 6.56*
C. High 17 24.29 05 10.00
Total 70 100.00 50 ]00.00
Significant at 0.05 per cent level Combine Mean = 16.02
viewed the programme to gain knowledge. Thus, it can be inferred that large majority of the respondents watch the programme to increase their knowledge which would ultimately help in increasing their farm production.
iii) Extent of viewing programme :
The information regarding extent of viewing agricultural programme was collected and presented in Table 2. This indicates that both the categories i.e. contact and non-contact viewing farmers viewed the programme completely (60 per cent) and rest of them were unable to view the complete programme because they feel tired after a day long working in the field.
It means, the information disseminated through TV was worth trying and they might have grasped the information easily.
d. f. = 2 Combine S.». = 2.74
C) Farm Telecast Viewing Behaviour
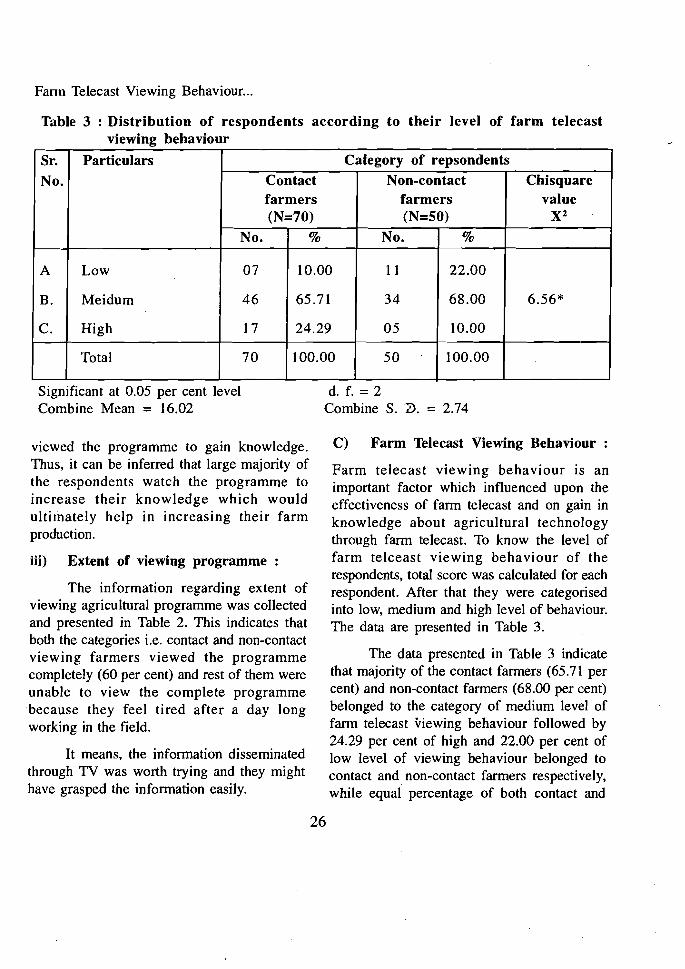
Farm telecast viewing behaviour is an important factor which influenced upon the effectiveness of farm telecast and on gain in knowledge about agricultural technology through farm telecast. To know the level of farm telceast viewing behaviour of the respondents, total score was calculated for each respondent. After that they were categorised into low, medium and high level of behaviour. The data are presented in Table 3.
The data presented in Table 3 indicate that majority of the contact farmers (65.71 per cent) and non-contact farmers (68.00 per cent) belonged to the category of medium level of farm telecast viewing behaviour followed by 24.29 per cent of high and 22.00 per cent of low level of viewing behaviour belonged to contact and non-contact farmers respectively, while equal percentage of both contact and
26
Fann Telecast Viewing Behaviour...
non-contact farmers were helonged to low and '- high level (10 per cent) of) farm telecast
viewing behaviour respectively. The X2 value 6.56 showed that the contact and non-contact farmers differed significantly in their farm telecast viewing behaviour.
Thus, it can be concluded that majority of the contact and non-contact farmers belonged to medium level of fann telecast viewing behaviour. These findings were in agreement with the findings of Dharmadhikari et. al. (1993) and Rao et. al. (1994).
CONCLUSION
From the above study, it can be concluded that majority of the contact and noncontact viewing farmers were aware about the
name, day, time and duration of agricultural programme telecasted by Doordarshan kendra. About half of them were regular viewers who were completely viewing the farm telecast programme to gain the agriculture knowledge and showed the medium"level of farm telecast viewing behaviour.
IMPLICATIONS
The planner and programme producer of farm telecast should always keep in mind the personal and socio-economic characteristic of the target audience and information related to advance teclmology in agricultural programme should be telecasted at suitable time considering local situation and fulfilling the changing need of the farmers.
REFERENCES
Bhople, R. S. and Mouje, D. S. (1989). Viewing Behaviour and Reaction of Farm Television Viewers. MJEE, 8 : 301-304
Dharmadhikari, S. D., Sundarswamy Band Shinde, P. S. (1994). Televiewing Behaviour of TV Owning Farmers, MJEE, 13 : 287-290
Rao, N. R; Sangle, G. K. and Chole, R R (1994). Television Viewing Behaviour of Farmers in Marthawada. MJEE, 13 : 1-3.
.:. The best creed we can have is charity toward the creeds of others - JOSH BILLINGS
.:. The secret ofhappiness is curiosity - NoRMAH DOUGLAS
27
Guj. J. Extn. Edu. VIII & IX 1997 & 1998
Adoption Constraints of Biogas Plants
s. D. Dhakar1, S. N. OjhaZ and L. S. Bareth3
INTRODUCTON
To popularise the biogas Govt. is providing technical know-how as well as subsidy and banks are giving loaning facility for biogas plant construction. It has been observed that most of the biogas plants installed in rural areas are not working properly. Looking to these the present study was undertaken with the following specific objectives.
OBJECTIVES
1. To identify the major constraints perceived by biogas plant owners regarding its successful use.
2. To study the relationship between personal attributes of farmers with constraints related to its continuous use.
METHODOLOGY
The study was conducted in Bhilwara district of Rajasthan because this district has suffcient number of biogas plant holders. From the total I I panchayat samities of the district, only three panchayat samities viz. Asind, Mandelgarh and Sahada were selected purposively.
Out of total 114 biogas plant holders of three panchayat samities, nearly 50 per cent (60) biogas plant holders were selected
randomly. Keeping in view the objectives of the study, structured questionnaire was developed and the data was collected by personal interview method. To know the comparison among constraints, relationship jf any between the variables, percentage, correlation and multiple regression analysis tests were applied to derive the conclusions.
RESULTS AND DISCUSSION
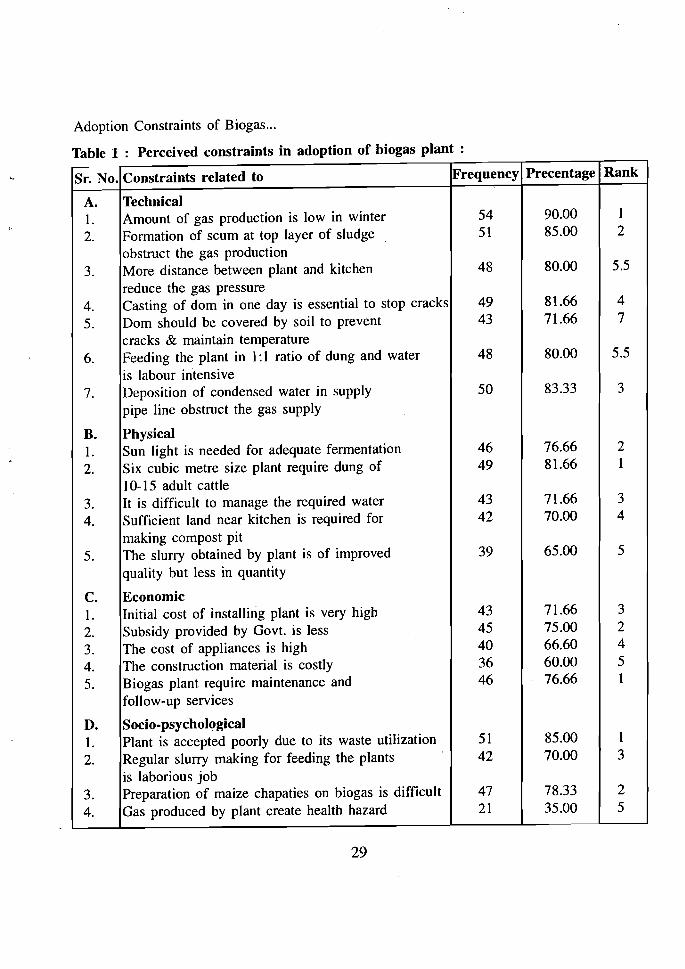
To findout the major constraints regarding efficient use of biogas plants, the responses received from the respondents were converted into percentage and the results have been depicted in Table I .
A. Technical Constraints
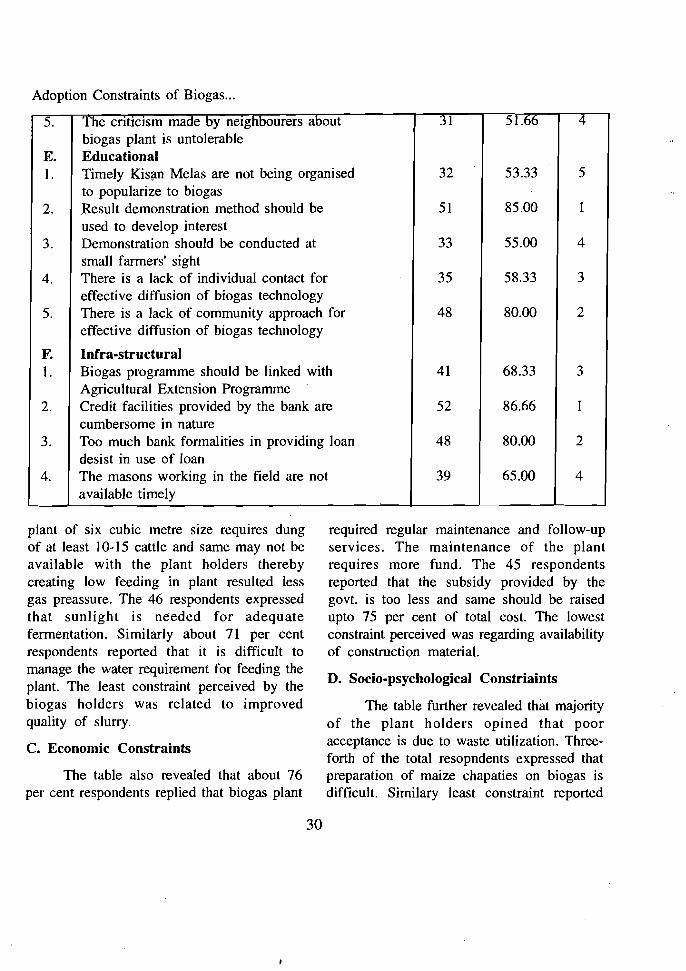
Table 1 indicates that majority of the respondents i.e. 90 percent expressed that amount of gas production is low in winter season where as 85 percent reported that formation of scum on top layer of sludge obstructs the gas production. About 83 percent respondents reported that deposition of condensed water in gas pipe line obstruct the flow of gas. Least constraint perceived was related to cover the dom with soil to prevent the cracks.
B. Physical Constraints
The Table 1 revealed that about 81 percent of the total respondents reported that
1&2 Asstt. Prof. Directorate of Extension Education, RAU, Udaipur (Raj.) 3. Asstt. Prof. Krishi Vigyan Kendra. Dholpur (Raj.)
28
Adoption Constraints of Biogas...
Table 1 : Perceived constraints in adoption of biogas plant :
FrequencyConstraints related to Sr. No. Precentage Rank
A. I. 2.
3.
4. 5.
6.
7.
B. 1. 2.
3. 4.
5.
C. 1. 2. 3. 4. 5.
D. 1. 2.
3. 4.
Technical Amount of gas production is low in winter Formation of scum at top layer of sludge obstruct the gas production More distance between plant and kitchen reduce the gas pressure Casting of dom in one day is essential to stop cracks Dom should be covered by soil to prevent cracks & maintain temperature Feeding the plant in I: I ratio of dung and water is labour intensive Deposition of condensed water in supply pipe line obstruct the gas supply
Physical Sun light is needed for adequate fermentation Six cubic metre size plant require dung of 10-15 adult cattle It is difficult to manage the required water Sufficient land near kitchen is required for making compost pit The slurry obtained by plant is of improved quality but less in quantity
Economic Initial cost of installing plant is very high Subsidy provided by Govt. is less The cost of appliances is high The construction material is costly Biogas plant require maintenance and follow-up services
Socio-psychological Plant is accepted poorly due to its waste utilization Regular slurry making for feeding the plants is laborious job Preparation of maize chapaties on biogas is difficult Gas produced by plant create health hazard
54 51
48
49 43
48
50
46 49
43 42
39
43 45 40 36 46
51 42
47 21
90.00 85.00
80.00
81.66 71.66
80.00
83.33
76.66 81.66
71.66 70.00
65.00
71.66 75.00 66.60 60.00 76.66
85.00 70.00
78.33 35.00
I 2
5.5
4 7
5.5
3
2 I
3 4
5
3 2 4 5 I
I 3
2 5
29
Adoption Constraints of Biogas...
5. The cntlcIsm made by nelghbourers about biogas plant is untolerable
31 51.66 4
E. Educational l. Timely Kisfln Melas are not being organised
to popularize to biogas 32 53.33 5
2. Result demonstration method should be used to develop interest
51 85.00 1
3. Demonstration should be conducted at small farmers' sight
33 55.00 4
4. There is a lack of individual contact for effective diffusion of biogas technology
35 58.33 3
5. There is a lack of community approach for effective diffusion of biogas technology
48 80.00 2
F. Infra-structural l. Biogas programme should be linked with
Agricultural Extension Programme 41 68.33 3
2. Credit facilities provided by the bank are cumbersome in nature
52 86.66 1
3. Too much bank formalities in providing loan desist in use of loan
48 80.00 2
4. The masons working in the field are not available timely
39 65.00 4
plant of six cubic metre size requires dung of at least 10-15 cattle and same may not be available with the plant holders thereby creating low feeding in plant resulted less gas preassure. The 46 respondents expressed that sunlight is needed for adequate fermentation. Similarly about 71 per cent respondents reported that it is difficult to manage the water requirement for feeding the plant. The least constraint perceived by the biogas holders was related to improved quality of slurry.
C. Economic Constraints
The table also revealed that about 76 per cent respondents replied that biogas plant
required regular maintenance and follow-up services. The maintenance of the plant requires more fund. The 45 respondents reported that the subsidy provided by the govt. is too less and same should be raised upto 75 per cent of total cost. The lowest constraint perceived was regarding availability of construction material.
D. Socio-psychological Constriaints
The table further revealed that majority of the plant holders opined that poor acceptance is due to waste utilization. Threeforth of the total resopndents expressed that preparation of maize chapaties on biogas is difficult. Similary least constraint reported
30
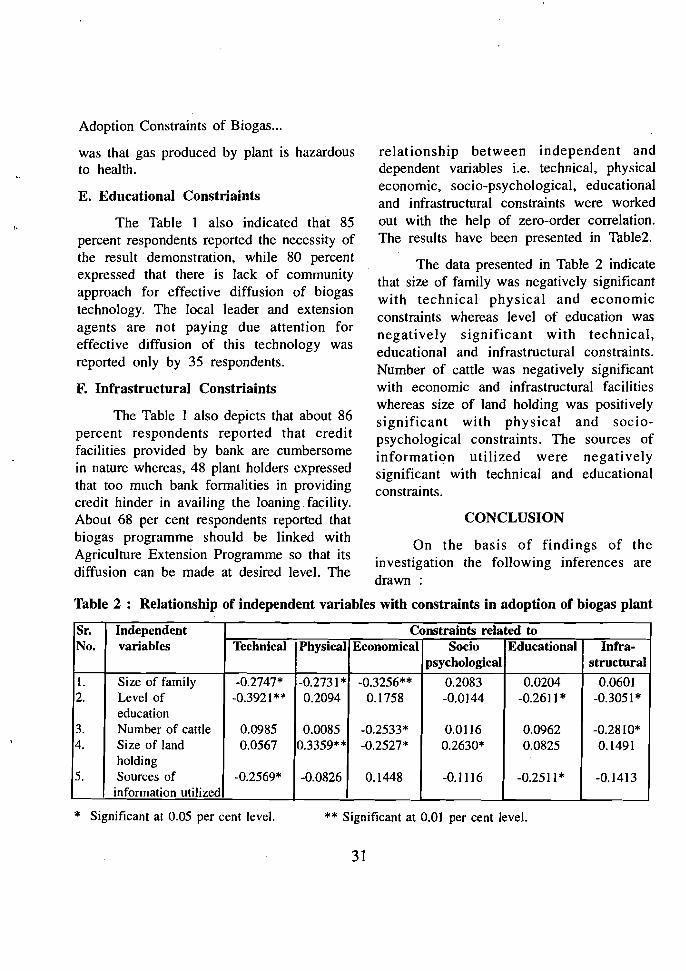
Adoption Constraints of Biogas...
was that gas produced by plant is hazardous to health.
E. Educational Constriaints
The Table I also indicated that 85 percent respondents reported the necessity of the result demonstration, while 80 percent expressed that there is lack of community approach for effective diffusion of biogas technology. The local leader and extension agents are not paying due attention for effective diffusion of this technology was reported only by 35 respondents.
F. Infrastructural Constriaints
The Table I also depicts that about 86 percent respondents reported that credit facilities provided by bank are cumbersome in nature whereas, 48 plant holders expressed that too much bank formalities in providing credit hinder in availing the loaning .facility. About 68 per cent respondents reported that biogas programme should be linked with Agriculture Extension Programme so that its diffusion can be made at desired level. The
relationship between independent and dependent variables i.e. technical, physical economic, socio-psychological. educational and infrastructural constraints were worked out with the help of zero-order correlation. The results have been presented in Table2.
The data presented in Table 2 indicate that size of family was negatively significant with technical physical and economic constraints whereas level of education was negatively significant with technical, educational and infrastructural constraints. Number of cattle was negatively significant with economic and infrastructural facilities whereas size of land holding was positively significant with physical and sociopsychological constraints. The sources of information utilized were negatively significant with technical and educational constraints.
CONCLUSION
On the basis of findings of the investigation the following inferences are drawn :
Table 2 : Relationship of independent variables with constraints in adoption of biogas plant
Sr. Independent Constraints related to No. variables Technical Physical Economical Socio
psychological Educational Infra-
structural
l. 2.
3. 4.
5.
Size of family Level of education Number of cattle Size of land holding Sources of
information utilized
-0.2747* -0.3921 **
0.0985 0.0567
-0.2569*
-0.2731* 0.2094
0.0085 0.3359**
-0.0826
-0.3256** 0.1758
-0.2533* -0.2527*
0.1448
0.2083 -0.0144
0.0116 0.2630*
-0.1116
0.0204 -0.2611 *
0.0962 0.0825
-0.2511 *
0.0601 -0.3051*
-0.2810* 0.1491
-0.1413
* Significant at 0.05 per cent level. ** Significant at 0.01 per cent level.
31

Adoption Constraints of Biogas...
The findings revealed that gas production was relatively low in winter season thereby can't full-fill the requirement of gas for preparation of meal. Size of plant was not match-up with number of the cattle which resulted poor in feeding of plant there by less gas production.
Biogas plant require heavy maintenance and regular follow-up services which need financial assistance. It is also not possible to prepare maize chapaties on biogas which is the major food of the area.
So far educational constraints are concerned, result demonstration must be conducted properly at small farmers sight.
Too much bank formalities for giving the loan and that too of cumbersome in nature were also reported by 48 plant holders.
Size of family, level of education and sources of information utilized were negatively significant with technical constraints.
Size of land holding was positively significant with physical constraints. Level of education and number of cattle were negatively significant with infrastructural constraints, whereas level of education, number of cattle and size of land holding were negatively significant with economic constraints.
REFERENCES
Prasad, A. and Gupta, (1982) "Biogas Plants in Rajasthan -A study" - Changing village Vol. 4 No.6: 31-48.
Biswas, T. D. (1977) "Biogas plant : "Prospectus and limitation". Invention intelligence. January - Feb.
Joglekar V. R. (1982) "Biogas plant : A source of manures, cooking fuel and cleanliness of village". Financial Agriculture Vol. XIV, No. 2-3 : 64-65.
Kanwade W. R. and Ingle N. C. (1984). "Scope of biogas plant" Rural India. SeptOct. PP. 139.
•:.
.:.
The wiseman never discourages nor disturbs but rather appeases and exhorts people
Every body lives and acts partly according to his own, partly according to other people's ideas
- LEO TOLSTOY.
32
Guj. J. Extn. Edu. VIII & IX 1997 & 1998
Impact of Short Term Training in Terms of Increase in Knowledge, Adoption and Yield of the Farmers
J. P. Bhaut t R. B. PateP and V. D. JoshP
INTRODUCTION
The advancement of any country can be estimated in terms of investment it makes in intellectual development (investment in education and training). For a country where 82 per cent of total population lives in over 6.5 lakhs villages and 70 per cent of the people depends on agriculture for their livelihood, the investment in man power resources development should be heavily skewed in favour of rural masses. What investment we make on the education and training of farmers, farm women and the young farmers, should be a proposition worth examining.
Emphasizing the growing needs of farmer's education and training, Gujarat Agricultural University has initiated a scheme for establishing Sardar Smruti Kendras in Gujarat from the year 1976-77. Sradar Smruti Kendra, Navsari was started in Mrach, 1978. Since than, short term training is being imparted to the farmers, farm women and young farmers. The main objective of this short term training is to produce change in farmers in respect of their present knowledge, adoption, ways of thinking, their attitudes or their conduct. But it is worth important to check whether this objective is attained or not. The present study is aimed to measure impact in terms of knowledge, adoption and yield of farmers.
OBJECTIVES
1. To study the level of knowledge of trained and untrained farmers regarding improved practices of paddy crop.
2. To study the level of adoption of trained and untrained farmers regarding improved practices of paddy crop.
3. To compare the yield of paddy crop obtained by the trained and untrained farmers.
METHODOLOGY
The study was conducted in Valsad district of Gujarat state. During January 1987 to December 1988, eight training classes of 3 days duration on crop production were organised by Sardar Smruti Kendra, ·Navsari. Four hundred farmers of eleven villages of Valsad diftrict were imparted training.
Out of 400 farmers, one hundred were selected by using proportionate random sampling method. The same number of untrained farmers from each village were selected randomly by obtaining list of farmers from Talati-cum-Mantri of the respective villages. In this way, in all 200 respondents were selected for the study.
For measuring the knowledge, a scale developed by Jha and Singh (1970) was
I. Research Officer, Jai Research Foundation, Valvada 396 108 2. Associate Professor, Ext. Edn. Dept. N. M. College of Agriculture, Navsari 396 450 3. Associate Professor, Ext. Edn. Dept. N.M.College of Agriculture, GAU Navsari-396 450
33
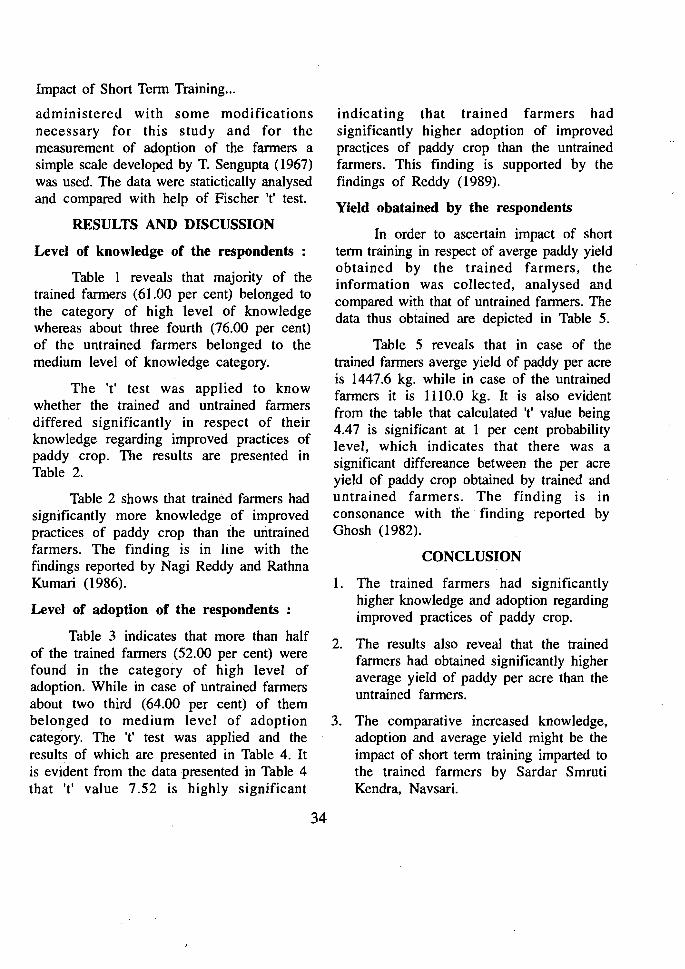
Impact of Short Term Training...
administered with some modifications necessary for this study and for the measurement of adoption of the farmers a simple scale developed by T. Sengupta (1967) was used. The data were statictically analysed and compared with help of Fischer 't' test.
RESULTS AND DISCUSSION
Level of knowledge of the respondents
Table I reveals that majority of the trained farmers (61.00 per cent) belonged to the category of high level of knowledge whereas about three fourth (76.00 per cent) of the untrained farmers belonged to the medium level of knowledge category.
The 't' test was applied to know whether the trained and untrained farmers differed significantly in respect of their knowledge regarding improved practices of paddy crop. The results are presented in Table 2.
Table 2 shows that trained farmers had significantly more knowledge of improved practices of paddy crop than the untrained farmers. The finding is in line with the findings reported by Nagi Reddy and Rathna Kuman (1986).
Level of adoption of the respondents :
Table 3 indicates that more than half of the trained farmers (52.00 per cent) were found in the category of high level of adoption. While in case of untrained farmers about two third (64.00 per cent) of them belonged to medium level of adoption categ'ory. The 't' test was applied and the results of which are presented in Table 4. It is evident from the data presented in Table 4 that 't' value 7.52 is highly significant
34
indicating that trained farmers had significantly higher adoption of improved practices of paddy crop than the untrained farmers. This finding is supported by the findings of Reddy (1989).
Yield obatained by the respondents
In order to ascertain impact of short term training in respect of averge paddy yield obtained by the trained farmers, the information was collected, analysed and compared with that of untrained farmers. The data thus obtained are depicted in Table 5.
Table 5 reveals that in case of the trained farmers averge yield of paddy per acre is 1447.6 kg. while in case of the untrained farmers it is 1110.0 kg. It is also evident from the table that calculated 't' value being 4.47 is significant at 1 per cent probability level, which indicates that there was a significant differeance between the per acre yield of paddy crop obtained by trained and untrained farmers. The finding is in consonance with the' finding reported by Ghosh (1982).
CONCLUSION
1. The trained farmers had significantly higher knowledge and adoption regarding improved practices of paddy crop.
2. The results also reveal that the trained farmers had obtained significantly higher average yield of paddy per acre than the untrained farmers.
3. The comparative increased knowledge, adoption and average yield might be the impact of short term training imparted to the trained farmers by Sardar Smruti Kendra, Navsari.
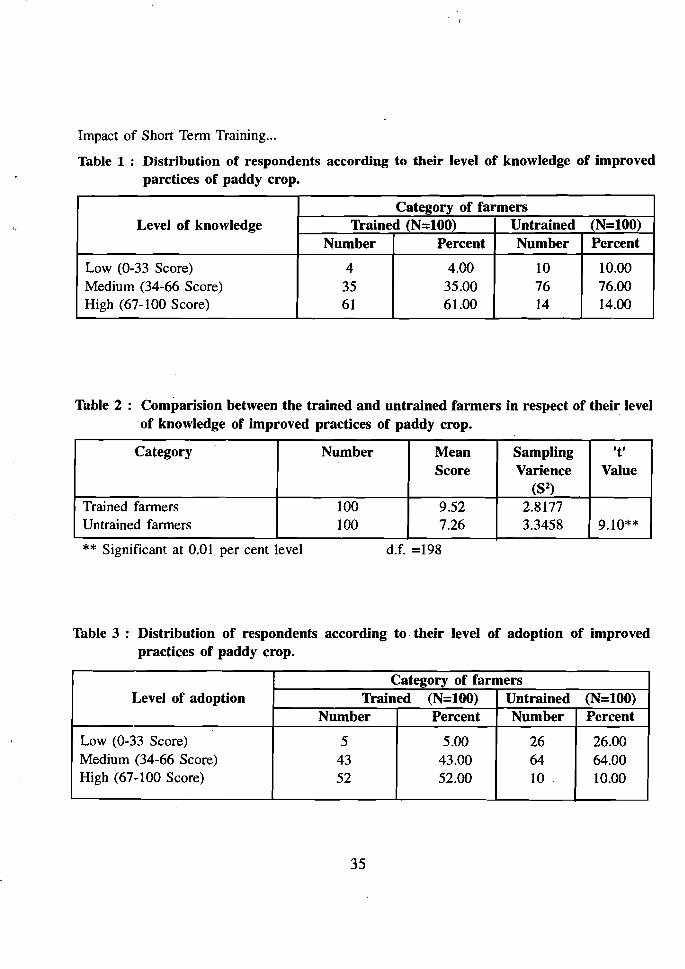
Impact of Short Term Training...
Table 1 : Distribution of respondents according to their level of knowledge of improved parctices of paddy crop.
Level of knowledge Category of farmers
Trained (N=100) Untrained Number Percent Number
(N=100) Percent
Low (0-33 Score) Medium (34-66 Score) High (67-100 Score)
4 35 61
4.00 35.00 61.00
10 76 14
10.00 76.00 14.00
Table 2: Comparision between the trained and untrained farmers in respect of their level of knowledge of improved practices of paddy crop.
Category Number Mean Score
Sampling Varience
(S2)
't' Value
Trained farmers Untrained farmers
100 100
9.52 7.26
2.8177 3.3458 9.10**
** Significant at 0.01 per cent level d.f. =198
Table 3 : Distribution of respondents according to their level of adoption of improved practices of paddy crop.
Level of adoption Category of farmers
Trained (N=100) Untrained (N=100) Number Percent Number Percent
Low (0-33 Score) Medium (34-66 Score) High (67-100 Score)
5 43 52
5.00 43.00 52.00
26 64 10
26.00 64.00 10.00
35
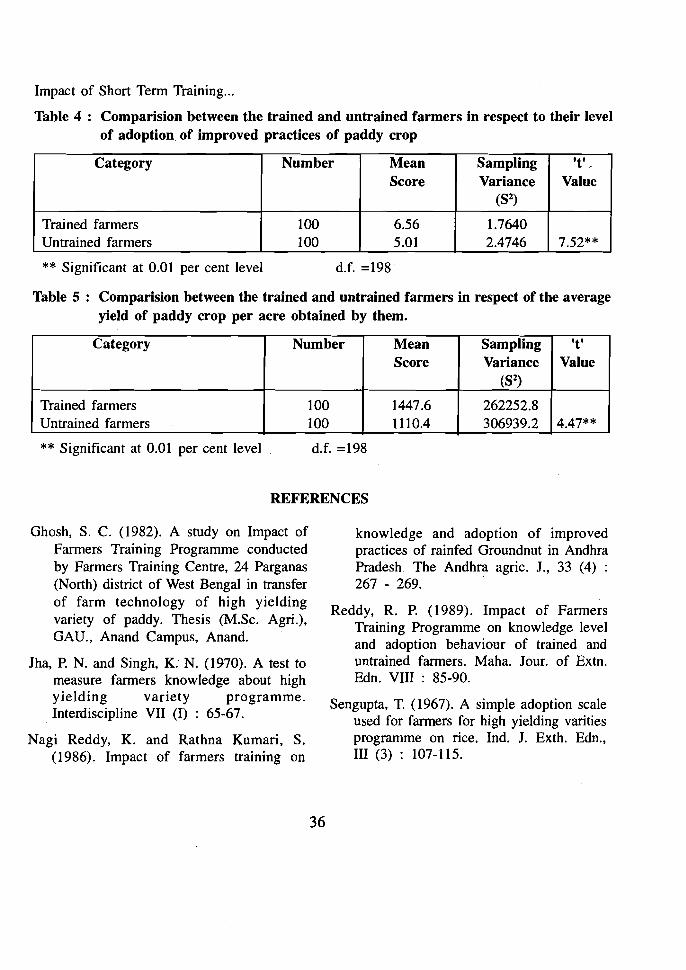
Impact of Short Term Training...
Table 4: Comparision between the trained and untrained farmers in respect to their level of adoption of improved practices of paddy crop
Category Number Mean Score
Sampling Variance
(S2)
't' . Value
Trained farmers Untrained farmers
100 100
6.56 5.01
1.7640 2.4746 7.52**
** Significant at 0.01 per cent level d.f. =198
Table 5 : Comparision between the trained and untrained farmers in respect of the average yield of paddy crop per acre obtained by them.
Category Number Mean Score
Sampling Variance
(S2)
't' Value
Trained farmers Untrained farmers
100 100
1447.6 1110.4
262252.8 306939.2 4.47**
** Significant at 0.01 per cent level d.f. =198
REFERENCES
Ghosh, S. C. (1982). A study on Impact of knowledge and adoption of improved Fanners Training Programme conducted practices of rainfed Groundnut in Andhra by Farmers Training Centre, 24 Parganas Pradesh The Andhra agric. J., 33 (4) : (North) district of West Bengal in transfer 267 - 269. of farm technology of high yielding
Reddy, R. P. (1989). Impact of Farmersvariety of paddy. Thesis (M.Sc. Agri.),
Training Programme on knowledge level GAU., Anand Campus, Anand. and adoption behaviour of trained and
Jha, P. N. and Singh, K. N. (1970). A test to untrained fanners. Maha. Jour. of Extn. measure fanners knowledge about high Edn. VIII : 85-90. yielding variety programme. Sengupta, T. (1967). A simple adoption scale
. Interdiscipline VII (1) : 65-67. used for fanners for high yielding varities Nagi Reddy, K. and Rathna Kumari, S. programme on rice. Ind. J. Exth. Edn.,
(1986). Impact of farmers training on III (3) : 107-115.
36
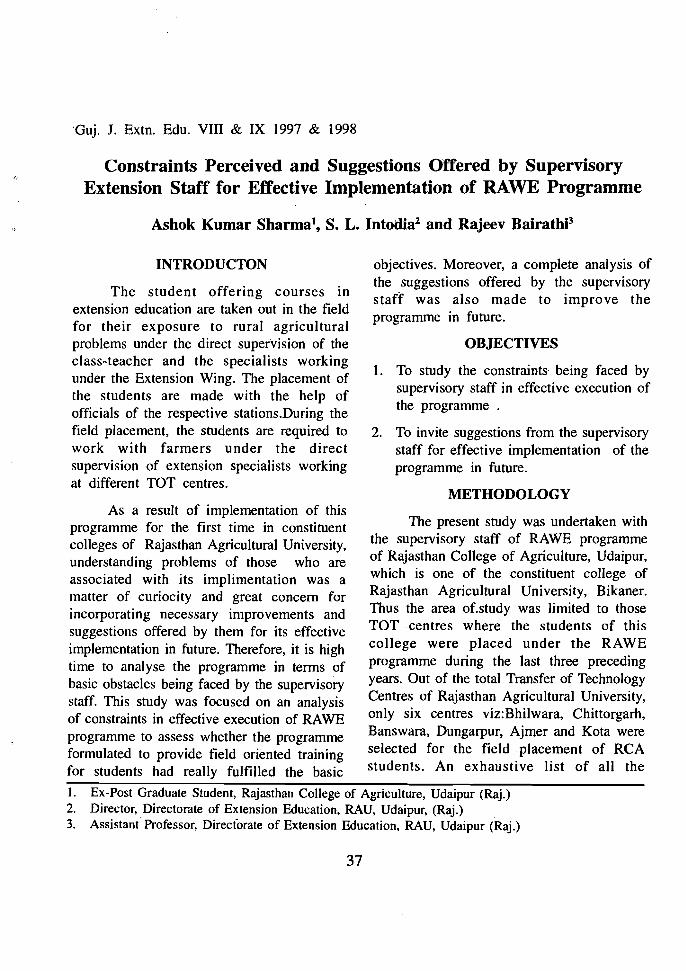
'Guj. 1. Extn. Edu. VIII & IX 1997 & 1998
Constraints Perceived and Suggestions Offered by Supervisory Extension Staff for Effective Implementation of RAWE Programme
Ashok Kumar Sharmal, S. L. Intodia2 and Rajeev BairathP
INTRODUCTON
The student offering courses in extension education are taken out in the field for their exposure to rural agricultural problems under the direct supervision of the class-teacher and the specialists working under the Extension Wing. The placement of the students are made with the help of officials of the respective stations.During the field placement, the students are required to work with farmers under the direct supervision of extension specialists working at different TOT centres.
As a result of implementation of this programme for the first time in constituent colleges of Rajasthan Agricultural University, understanding problems of those who are associated with its implimentation was a matter of curiocity and great concern for incorporating necessary improvements and suggestions offered by them for its effective implementation in future. Therefore, it is high time to analyse the programme in terms of basic obstacles being faced by the supervisory staff. This study was focused on an analysis of constraints in effective execution of RAWE programme to assess whether the programme formulated to provide field oriented training for students had really fulfilled the basic
objectives. Moreover, a complete analysis of the suggestions offered by the supervisory staff was also made to improve the programme in future.
OBJECTIVES
1. To study the constraints being faced by supervisory staff in effective execution of the programme .
2. To invite suggestions from the supervisory staff for effective implementation of the programme in future.
METHODOLOGY
The present study was undertaken with the s~pervisory staff of RAWE programme of Rajasthan College of Agriculture, Udaipur, which is one of the constituent college of Rajasthan Agricultural University, Bikaner. Thus the area of.study was limited to those TOT centres where the students of this college were placed under the RAWE programme during the last three preceding years. Out of the total Transfer of Technology Centre~ of Rajasthan Agricultural University, only SIX centres viz:Bhilwara, Chittorgarh, Banswara, Dungarpur, Ajmer and Kota were selected for the field placement of RCA students. An exhaustive list of all the
I. E~-Post Gr~duate Student, Rajasthan College of Agriculture, Udaipur (Raj.) 2. Dlr~ctor, DIrectorate ~f E~tension Education, RAU, Udaipur, (Raj.) 3. AssIstant Professor, DIrectorate of Extension Education, RAU, Udaipur (Raj.)
37
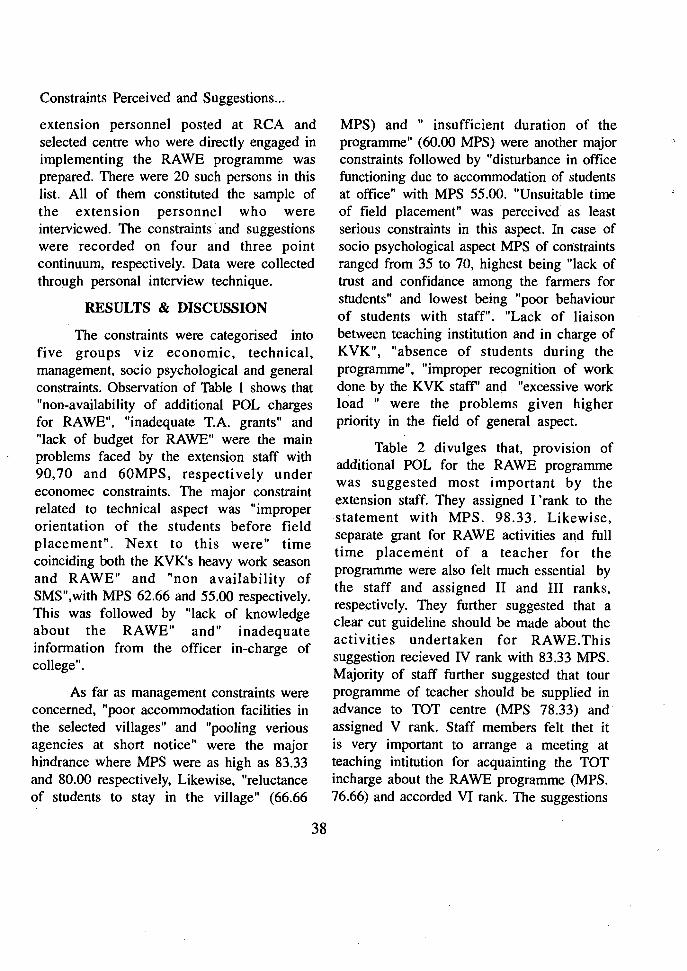
Constraints Perceived and Suggestions...
extension personnel posted at RCA and selected centre who were directly engaged in implementing the RAWE programme was prepared. There were 20 such persons in this list. All of them constituted the sample of the extension personnel who were interviewed. The constraints and suggestions were recorded on four and three point continuum, respectively. Data were collected through personal interview technique.
RESULTS & DISCUSSION
The constraints were categorised into five groups viz economic, technical, management, socio psychological and general constraints. Observation of Table I shows that "non-availability of additional POL charges for RAWE", "inadequate T.A. grants" and "lack of budget for RAWE" were the main problems faced by the extension staff with 90,70 and 60MPS, respectively under economec constraints. The major constraint related to technical aspect was "improper orientation of the students before field placement". Next to this were" time coinciding both the KVK's heavy work season and RAWE" and "non availability of SMS",with MPS 62.66 and 55.00 respectively. This was followed by "lack of knowledge about the RAWE" and" inadequate information from the officer in-charge of college".
As far as management constraints were concerned, "poor accommodation facilities in the selected villages" and "pooling verious agencies at short notice" were the major hindrance where MPS were as high as 83.33 and 80.00 respectively, Likewise, "reluctance of students to stay in the village" (66.66
38
MPS) and " insufficient duration of the programme" (60.00 MPS) were another major constraints followed by "disturbance in office functioning due to accommodation of students at office" with MPS 55.00. "Unsuitable time of field placement" was perceived as least serious constraints in this aspect. In case of socio psychological aspect MPS of constraints ranged from 35 to 70, highest being "lack of trust and confidance among the farmers for students" and lowest being "poor behaviour of students with staff". "Lack of liaison between teaching institution and in charge of KVK", "absence of students during the programme", "improper recognition of work done by the KVK staff' and "excessive work load " were the problems given higher priority in the field of general aspect.
Table 2 divulges that, provision of additional POL for the RAWE programme was suggested most important by the extension staff. They assigned I 'rank to the statement with MPS. 98.33. Likewise, separate grant for RAWE activities and full time placement of a teacher for the programme were also felt much essential by the staff and assigned II and III ranks, respectively. They further suggested that a clear cut guideline should be made about the activities undertaken for RAWE.This suggestion recieved IV rank with 83.33 MPS. Majority of staff further suggested that tour programme of teacher should be supplied in advance to TOT centre (MPS 78.33) and· assigned V rank. Staff members felt thet it is very important to arrange a meeting at teaching intitution for acquainting the TOT incharge about the RAWE programme (MPS. 76.66) and accorded VI rank. The suggestions

Constraints Perceived and Suggestions...
Table 1 : Extent of constraints being faced by the supervisory staff in effective execution of RAWE programme.
Sr.No. Constraint MPS Rank
A : ECONIMIC 1. Unable to contact the students ferquently because of
(a) Heavy Pressure of work 46.66 4 (b) Inadequate T. A. grants 70.00 2
2 Non-availability of additional POL charge for RAWE 90.00 1 3 Lack of budget provision 60.00 3
B: TECHNICAL I. Students were not properly oriented before field placement 70.00 1 2. Inadequate information about the RAWE 46.66 5 3. Lack of knowledge about the programme 51.66 4 4. Time coinciding both the KVK's heavy work season and
RAWE 61.66 2
5. Non availability of SMS 55.0 3 C:MANAGEMENT
I. Reluctance of students to stay in the village 66.66 3 2. Short duration of the programme 60.00 4 3. Non-availability of the accommodation facilities in the
selected villages 83.33 1
4. Unsuitable time of field placement 51.66 6 5. Difficult to pool out various agencies for different activities
in short duration 80.00 2
6. Accommodating students at office disturbs the office functioning
55.00 5
D: SOCIO-PSYCHOLOGICAL 1. Lack of interest on the part of students 56.66 3 2. Non cooperation and vested interest of the farmers 41.66 4 3. Lack of trust and confidence among the farmers for students 70.00 1 4. Poor behaviour of students with staff 35.00 5 5. Non cooperation from Department of Agriculture 66.66 2
F:GENERAL I. Excessive work load 55.00 4 2. Lack of liaison between teaching institution and incharge of
KVK 83.33 1
. 3. The work done by KVK staff is not properly recoginsed 56.66 3 4. Not instructed through the proper authority 51.66 5 5. Students misuse the office facilities 46.66 6 6. Students remain absent which creates nroblems. 66.66 2
39

Constraints Perceived and Suggestions...
Table 2 : Suggestions from the supervisory staff for effective execution of the RAWE programme
Sr. No. Suggestions MPS Rank
1. Separate grant for undertaking RAWE activities 86.66 2
2. Increased duration of RAWE to alteast one crop season 63.33 8
3. Provision for acquainting the TOT incharge about the programme
76.66 6
4. Provision of additional POL should be made at TOT centre for this programme
98.33 1
5. A clear-cut guideline for the activities to be undertaken in RAWE programme
83.33 4
6. Full time placement of teachers to supervise the work done by students
85.00 3
7. Budget provision for RAWE activities at roT centre 71.66 7
8. Provision of token for the practising family 56.77 9
9. Tour programme of team of teachers be supplied in Advance to TOT centre.
78.33 5
of budget provision for RAWE at roT centre was placed at VII rank with MPS 71.66. It is interesting to note that increased duration of RAWE was not given much importance by extension staff and it got VIII rank with 63.33 MPS. The last rank was assigned to the provision of token for the practising family. One 'officer incharge of KVK has suggested that students of RCA sho~ld be adjusted in nearby villages at Udaipur as the staff members of RCA are already acquainted with the area and known to the students. One supervisory staff member of college suggested that training under RAWE should be divided into two parts one month during kharif period and one month during rabi season. He further
40
suggested for frequent supervison of students by the KVK staff.
CONCLUSION
The major constraints realised by extension supervisory staff were nonavailability of additional POL charge for RAWE programme, inadequate TA grant, poor orientation of the 'student befor field placement, poor accommodation facilities in the selected villages, lack of trust and confidence among the farmers for students, lack of liaison between teaching institution and incharge of KVK and absence of students during the programme.
Constraints Perceived and Suggestions...
The supevisory extension staff strongly programme, full time placement of a teacher suggested the provision of additional POL for the RAWE and a clear cut guideline about and separate grant for the RAWE the activities of the RAWE.
L~
REFERENCES
Kulkarni, S. Y.; Rahad, B. G. and Rathore, Khan Subeydeen (1993) "A study on A. R. (1991) "Reactions of staff, students effectiveness of Extension Wing as and fanners towards RAWE Programme" Instructional Laboratory for Agricultural Maharashtra Journal of Extension Students". M.Sc. Ag. Thesis Education, X (2); 149-153. (unpublished), RCA, Udaipur.
r----------------, THAT IS NOT MY JOB .
EVERYBODY
WAS SURE THAT
SOMEBODY
WOULD DO IT.
ANYBODY
COULD HAVE DONE IT
BUT
NOBODY DID IT. ~-- J
41
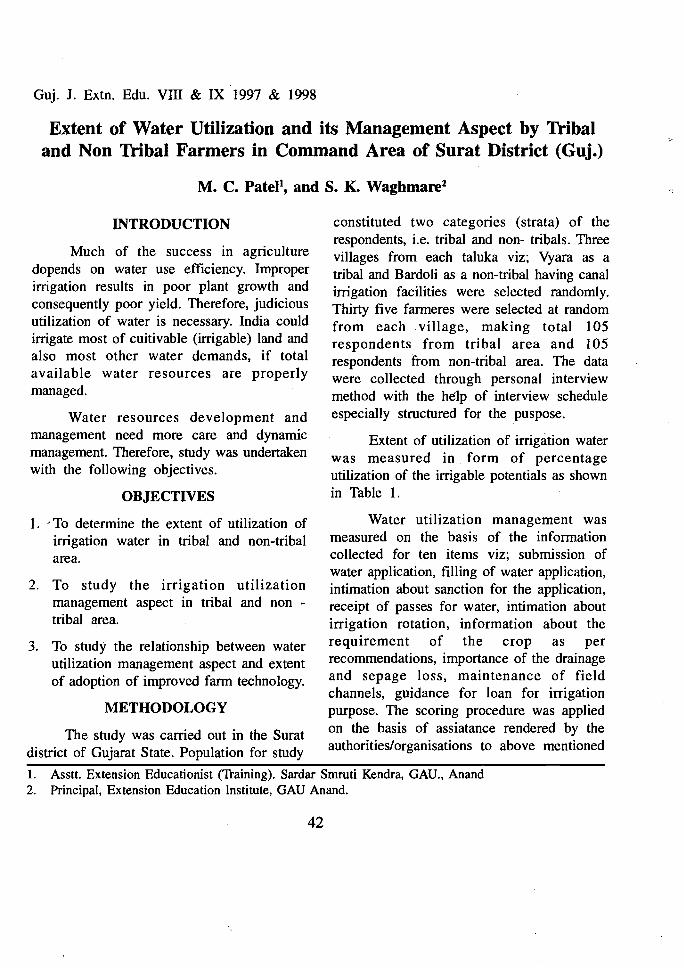
Guj. J. Extn. Edu. VIII & IX 1997 & 1998
Extent of Water Utilization and its Management Aspect by Tribal and Non Tribal Farmers in Command Area of Surat District (Guj.)
M. C. Patell, and S. K. Waghmare2
'. INTRODUCTION
Much of the success in agriculture dopends on water use efficiency. Improper irrigation results in poor plant growth and consequently poor yield. Therefore, judicious utilization of water is necessary. India could irrigate most of cuitivable (irrigable) land and also most other water demands, if total available water resources are properly managed.
Water resources development and management need more care and dynamic management. Therefore, study was undertaken with the following objectives.
OBJECTIVES
I. / To determine the extent of utilization of irrigation water in tribal and non-tribal area.
2. To study the irrigation utilization management aspect in tribal and non tribal area.
3. To study the relationship between water utilization management aspect and extent of adoption of improved farm technology.
METHODOLOGY
The study was carried out in the Surat district of Gujarat State. Population for study
constituted two categories (strata) of the respondents, i.e. tribal and non- tribals. Three villages from each taluka viz; Vyara as a tribal and Bardoli as a non-tribal having canal irrigation facilities were selected randomly. Thirty five farmeres were selected at random from each .village, making total 105 respondents from tribal area and 105 respondents from non-tribal area. The data were collected through personal interview method with the help of interview schedule especially structured for the puspose.
Extent of utilization of irrigation water was measured in. form of percentage utilization of the irrigable potentials as shown in Table 1.
Water utilization management was measured on the basis of the information collected for ten items viz; submission of water application, filling of water application, intimation about sanction for the application, receipt of passes for water, intimation about irrigation rotation, information about the requirement of the crop as per recommendations, importance of the drainage and sepage loss, maintenance of field channels, guidance for loan for irrigation purpose. The scoring procedure was applied on the basis of assiatance rendered by the authorities/organisations to above mentioned
1. Asstt. Extension Educationist (Training). Sardar Smruti Kendra, GAU., Anand 2. Principal, Extension Education Institute, GAU Anand.
42

Extent of Water Utilization...
items. The infonnation was collected and measured with the scoring system. i.e. low assistance (up to 4), medium assistance (4 to 6) and high assistance (above 6).
RESULTS AND DISCUSSION
Extent of utilization of irrigation water
The data presented in Table I revealed that maximum utilization of irrigation water was done by both the categories of farmers i.e.82.85 and 77.05 percent of the respondents from tribal and non-tribal areas, respectively. The statistical analysis showed independence between extent of utilization of irrigation water and categories of fanners. The finding of the study is in aggrement with the finding of Chate (1983) and Timbadia (1991).
Water utilization management aspect
The managment system refers to the assistance rendered by various authorities / organisations to various items mentioned in methodology para. This aspect plays crucial role in the command area, therefore, it was decided to examine the management role played by the authorities / organisations. The infonnation in this respect is summarised in Table 2. The data indicate that about half of the tribal fanners received medium assistance, followed by low assistance by one third of the tribal farmers. Only 18:09 per cent of the tribal fanners received high assistance. In case of non-tribal fanners majority (56.11 per cent) of the farmers received high assistance where as 40.00 per cent non-tribal fanners received medium assistance in respect of irrigation utilization management and only 3.81 per cent of the fanners received low assistance.
43
The chi-square test indicated sigificant association between categories of farmers and assistance renderad in respect of water utilization management. The results revealed that non-tribal farmers had received better assistance from various organizations / authorities than tribal fanners.
It clearly shows that in tribal area fanners do need the assistance in respect of irrigation manegement and its related aspects. Thus the authority has played a crucial role in this regard. These findings are in line with the results reported by Shrinivasan (1984) and Tripathi and Kushwaha (1984) who observed low to high irrigation utilization management in command area.
Correlation between water utilization management aspect and extent of adoption of improved farm technology
The 'r' value presented in Table 3 indicate that the 'r' value was positive and significant for tribal farmers and non significant for non - tribal farmers. This suggests that in tribal area, water utilization management system played an important role in the extent of adoption of improved farm technology, whereas, in non-tribal area water management system did not affect the extent of adoption of improved farm technology. These results are in aggrement with the finding of PatH (1977) and Mathur (1980).
CONCLUSION
I. Maximum utiliZation of irrigation water in command area was done by the farmers of both the categorie~ i.e.82.05 percent and 79.05 percent of the respondents from tribal and non-tribal areas, respectively.
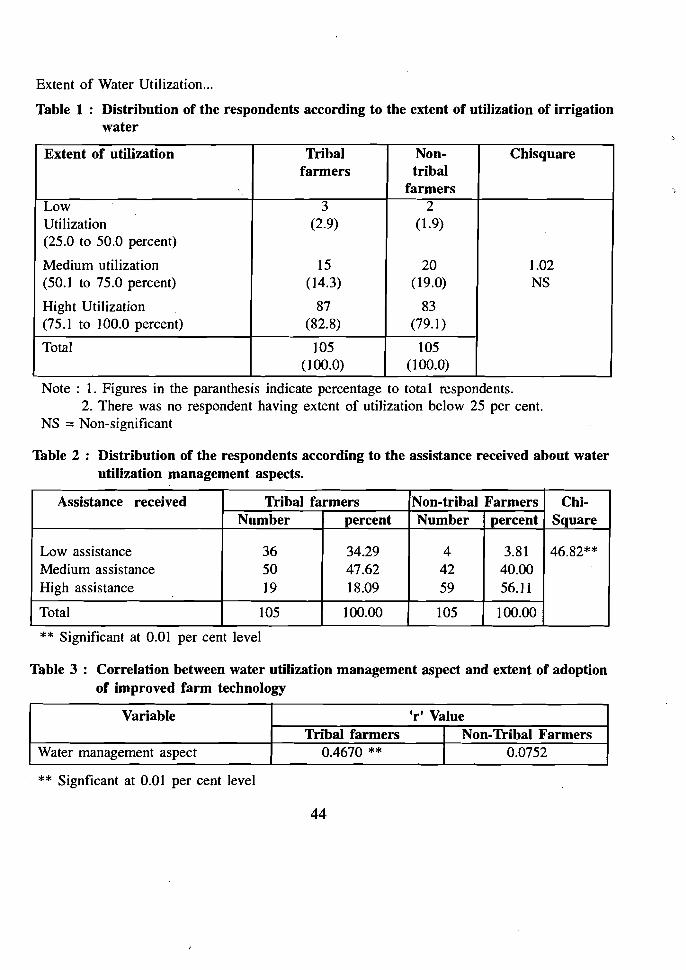
Extent of Water Utilization...
Table 1 : Distribution of the respondents according to the extent of utilization of irrigation water
'" Extent of utilization Tribal
farmers Non-tribal
farmers
Chisquare
Low Utilization (25.0 to 50.0 percent)
Medium utilization (50.1 to 75.0 percent)
Hight Utilization (75.1 to 100.0 percent)
3 (2.9)
15 (14.3)
87 (82.8)
2 (1.9)
20 (19.0)
83 (79.1)
1.02 NS
Total 105 (100.0)
105 (100.0)
Note: 1. Figures in the paranthesis indicate percentage to total respondents. 2. There was no respondent having extent of utilization below 25 per cent.
NS = Non-significant
Table 2 : Distribution of the respondents according to the assistance received about water utilization management aspects.
Assistance received Tribal farmers Non-tribal Farmers Chi-SquareNumber percent Number percent
Low assistance Medium assistance High assistance
36 50 19
34.29 47.62 18.09
4 42 59
3.81 40.00 56.11
46.82**
Total 105 100.00 105 100.00
** Significant at 0.01 per cent level
Table 3: Correlation between water utilization management aspect and extent of adoption of improved farm technology
Variable 'r'Value Tribal farmers Non-Tribal Farmers
Water management aspect 0.4670 ** 0.0752
. ** Signficant at 0.01 per cent level
44
Extent of Water Utilization...
2. It was observed that farmers of tribal area received low assistance in respect of irrigation utilization management as compared to farmers of non-tribal area.
3. Water management system showed significant positive relationship with the adoption of improved farm technology in
. tribal area, where as it was non-significant in non-tribal area.
IMPLICATION
1. Rotational distribution of water IS
essential for uniform distribution of
irrigation supplies and it should operate with considerable flexibility, if it is to be truely efficient. It should be based on consumptive use of water at different stages of crop growth.
2. There is a need to educate farmers on scientific farming and water mangement and to motivate them to have more participation in various development agencies to accrue the benfits of the technology.
REFERENCES
Chate, V. K. (1983). Irrigation utilization and technological change in the Jayakwadi Command Area. M. Sc. (Agri) thesis (unpublished), Submitted to MAU., Parbhani.
Mathur, N. (1980). Integrated development of water resources Kurukshetra, XXIX (3) : 10-13.
Pati!, S. M. (1977). Need for establishing model water co-operative in India. Arthvikas, XIII (1) : 65-68.
Shrinivasan, G. S. (1984). Farmers' perception and performance for irrigation farming in
Memawathi project Area, Karnataka State. The Mysore J. of Agri - Sci., XVIII (2) : 175.
Timbadia, C. K. (1991). Extent of irrigation utilization and technological change in Kakrapar Command Area of South Gujarat M. Sc. (Agri) thesis (unpublished). Submitted to GAU., Navsari.
Tripathi, R. P. and Kushwaha, N. S. (1984). Effective use of irrigation water for crop production. Indian Farmers' Digest. XVII (5-8) : 39-41.
,-----------------------, I .:. If every man could read the hearts of others, there would be I I more men anxious to descend than to rise in life I I I I - ROUSSEAU I ~------------------- J
45
Guj. J. Extn. Edu. VIII & IX 1997 & 1998
Income Generation and Expenditure Pattern of Tribal Farmers of South Eastern Madhya Pradesh
M. A. Khanl , P. N. Sharma~ and M. L. Sharma3
INTRODUCTION
The produces of agriculture sector of tribal areas are generally not sufficient to the level of annual requirements of their families, this may be the prime reason by which the tribals are also involved in animal husbandry, labour works etc. and are going to the forests for the collection of forest produces like fuel wood, 'Mahua', tendu leave, 'Harraseed', bamboo, honey etc, which provide them some rupees to buy the necessary house hold items. These source of income (other than agriculture) have a great improtance in the tribals' economy to sustain their income for the Iivilihood, because their problem is only being with needs of two meals a day for the family and consequently giving birth to other problems like fever and diseases and ends with provision of roof over their heads, that is why, when they try to find the fulfillment of these bare necessity, every thing else including education received a cold shoulder. Tribals mainly expend their incomes on household items including liquors. Therefore, the present study was designed to study the various income generation sources and their contribution to total income and the expenditure pattern of tribal farmers with the following specific objectives.
(1) To study the involvement of tribal farmers in various occupations.
(2) To study the extent of earning and expenditure pattern of tribal fanners.
(3) To determine average annual earning from various sources and average expenditure on various modes of tribal farmers.
METHODOLOGY
The present study was conducted in the maximum tribal populated district of Madhya Pradesh, Bastar, the biggest district of M.P. that is divided into two agricultural districts namely North Bastar and South Bastar. South bastar agriculture district was selected due to high percentage of tribal population than the north bas tar agriculture district. This agriculture district has three tehsils. The tehsil Dantewara and block Dantewara was selected due to maximum population among other tehsils and respective blocks respectively.
On the basis of distance from block headquarters, the whole block was divided into four equal strata and from the total villages of each strata 15 per cent villages were selected randomly which is total 10. Ten percent tribal farmers from each selected
I. Research Associate (Agril. Extn.), Directorate of Extension, IOKY, Raipur (M.P.) 2. Director of Extension Services, Directorate of Extension, IOKY, Raipur (M.P.) 3. Asstt. Professor (Agril. Extn.), Directorate of Extension, IOKY, Raipur (M.P.)
46
Income Generation and Expenditure...
villages were selected randomly from the list of farmers which was prepared in consultation with the concerned village sarpanch, school teachers, patwari, RAEO etc. Thus the total size of sample was 107 tribal farmers.
The data were collected by personal interview method with the help of structured interview schedule which was prepared and edited according to the requirement needed after pretesting.
RESULTS AND DISCUSSION
The distribution of respondents according to their involvement in various occupations shows (Table 1) that all the respondents were involved in agriculture. Animal husbandry, forest product collection and prepartion of liquors were also the important subsidiary occupations practiced by the 90.65, 82.24 and 73.83 per cent respondents respectively. It was also found that 40.19 per cent respondents were labourer, 10.28 per cent were in some services and 2.80 percent respondents were engaged in some other business. The table also reveales that, although agriculture was their main occupation but the majority of the respondents depend on other occupations also for the purpose of earning to meet the families' requirements. Out of the total respondents who prepared liquors, 43.93 per cent did not sale it to market for earning since they consumed it by themselves. It was also found that 40.19 percent respondents were labourers and it was doing largely for earning purpose.
It is evident from the Table 2 that the majority of the respondents, 67.29 per cent were practising three to four and 26.17 per
47
cent were involved in 5 to 6 occupations, 5.61 per cent respondents were found to be involved in 1 to 2 occupations, also 0.93 per cent respondents were having involvement in more than 6 occupations.
The data compiled in Table 3 show that among various sources of income, 42.06 per cent respondents earned more than 50 per cent of their total income ~rom
agriculture, 37.38 per cent earned upto 50 per cent from agriculture. Minor forest products were found second important sources of income by which 4.67 and 72.90 per cent respondents got above 50 and upto 50 per cent annual income respectively, while, 10.28, 9.34 and 2.80 per cent respondents received more than 50 per cent annual income from labour, services and animal husbandry respectively. Also 48.60, 28.97, 18.97 and 2.80 per cent respondents reported that they got upto 50 per cent annual income from animal husbandry, labour, liquors and businesses respectively. It was also found that 97.20, 89.73, 70.10, 60.75, 48.60, 22.43 and 20.56 per cent respondents did not recieve any monetary earning from business, service, liquor, labour, animal husbandry, minor forest products and agriculture respectively. This clearly indicates the sustaination of income by the tribal farmers through various sources.
The data complied in Table 4 show the annual family income of respondents. It was found that, 21.49 per cent respondents were below the poverty line having less than Rs.. 6500 per annum family income, while majority of respondents, 58.87 per cent had low and low-medium annual income, 7.48 per cent respondents had medium and only 4.68
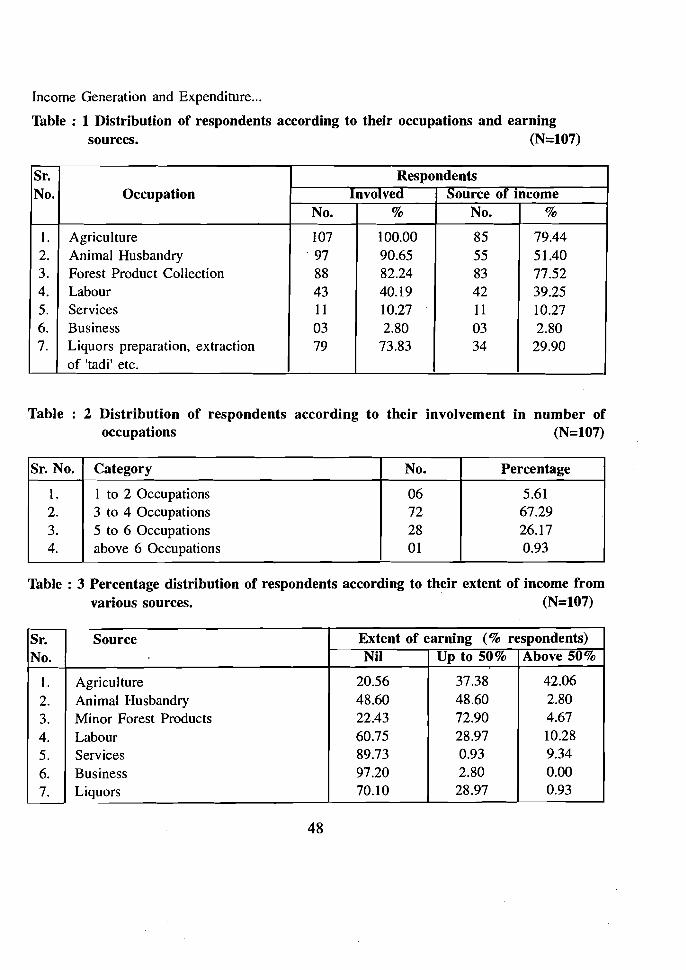
Income Generation and Expenditure...
Table : 1 Distribution of respondents according to their occupations and earning sources. (N=107)
Sr. Respondents No. Occupation Involved Source of mcome
No. % No. %
l. 2. 3. 4. 5. 6. 7.
Agriculture Animal Husbandry Forest Product Collection Labour Services Business Liquors preparation, extraction of 'tadi' etc.
107 ·97
88 43 11 03 79
100.00 90.65 82.24 40.19 10.27 2.80
73.83
85 55 83 42 11 03 34
79.44 51.40 77.52 39.25 10.27 2.80
29.90
Table : 2 Distribution of respondents according to their involvement in number of occupations (N=107)
Sr. No. Category No. Percentage
l. I to 2 Occupations 06 5.61 2. 3 to 4 Occupations 72 67.29 3. 5 to 6 Occupations 28 26.17 4. above 6 Occupations 01 0.93
Table : 3 Percentage distribution of respondents according to their extent of income from various sources. (N=107)
Sr. Source Extent of earning (% respondents) No. Nil Up to 50% Above 50%
l. 2. 3. 4. 5. 6. 7.
Agriculture Animal Husbandry Minor Forest Products Labour Services Business Liquors
20.56 48.60 22.43 60.75 89.73 97.20 70.10
37.38 48.60 72.90 28.97 0.93 2.80 28.97
42.06 2.80 4.67 10.28 9.34 0.00 0.93
48
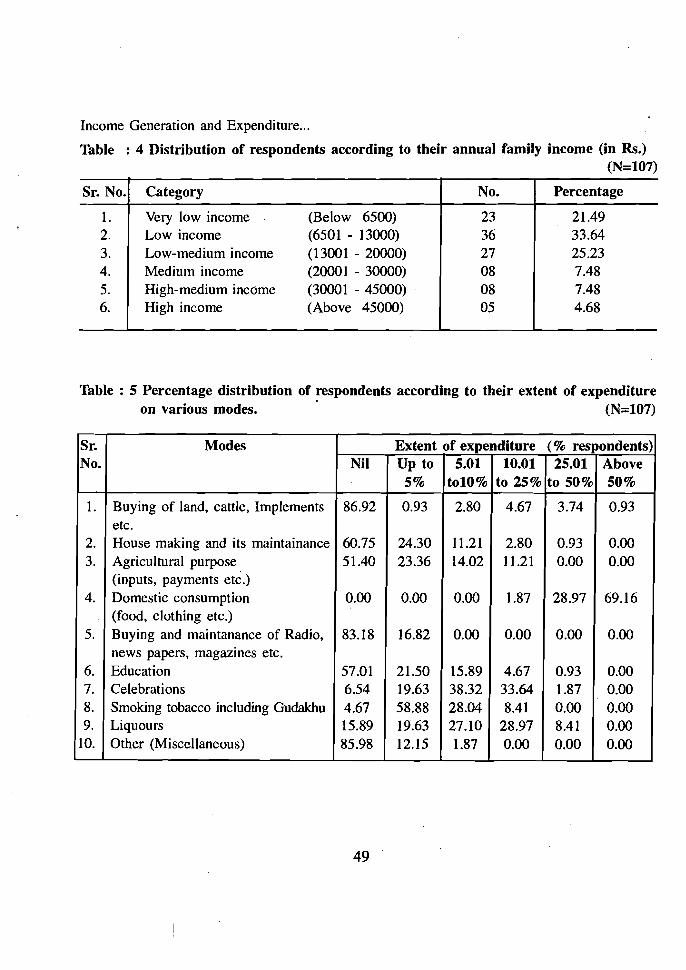
Income Generation and Expenditure...
Table : 4 Distribution of respondents according to their annual family income (in Rs.) (N=107)
Sr. No. Category No. Percentage
1. Very low income (Below 6500) 23 21.49 2. Low income (6501 - 13000) 36 33.64 3. Low-medium income (13001 - 20000) 27 25.23 4. Medium income (20001 - 30000) 08 7.48 5. High-medium income (30001 - 45000) 08 7.48 6. High income (Above 45000) 05 4.68
Table : 5 Percentage distribution of respondents according to their extent of expenditure on various modes. . (N=107)
Sr. Modes Extent of expenditure (% respondents) No. Nil Up to
5% 5.01
tol0% 10.01
to 25% 25.01
to 50% Above 50%
1. Buying of land, cattle, Implements etc.
86.92 0.93 2.80 4.67 3.74 0.93
2. House making and its maintainance 60.75 24.30 11.21 2.80 0.93 0.00 3. Agricultural purpose
(inputs, payments etc.) 51.40 23.36 14.02 11.21 0.00 0.00
4. Domestic consumption (food, clothing etc.)
0.00 0.00 0.00 1.87 28.97 69.16
5. Buying and maintanance of Radio, news papers, magazines etc.
83.18 16.82 0.00 0.00 0.00 0.00
6. Education 57.01 21.50 15.89 4.67 0.93 0.00 7. Celebrations 6.54 19.63 38.32 33.64 1.87 0.00 8. Smoking tobacco including Gudakhu 4.67 58.88 28.04 8.41 0.00 0.00 9. Liquours 15.89 19.63 27.10 28.97 8.41 0.00
10. Other (Miscellaneous) 85.98 12.15 1.87 0.00 0.00 0.00
49
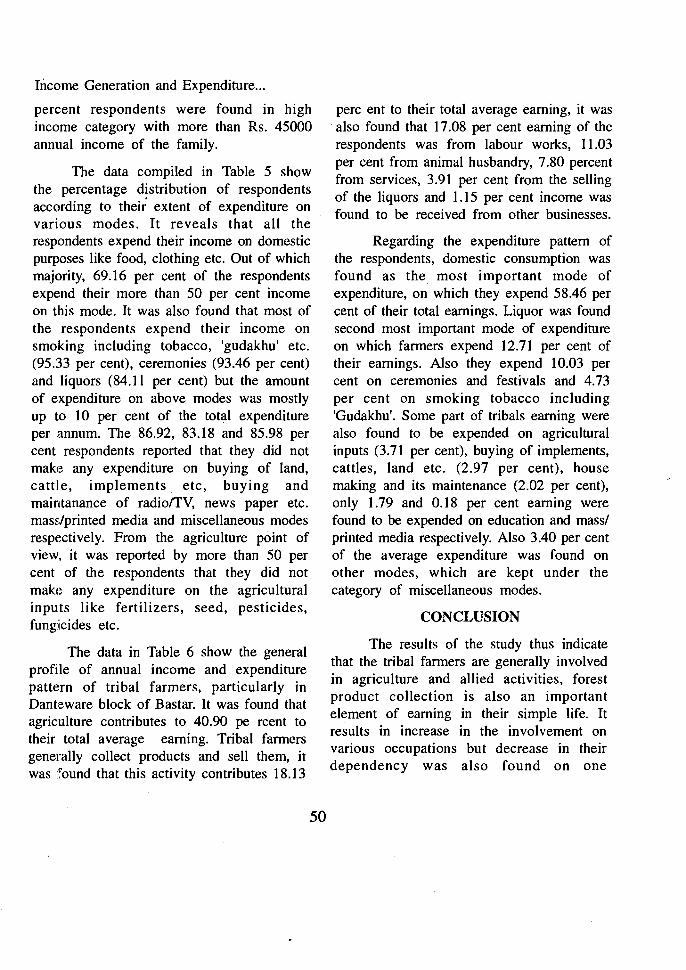
Income Generation and Expenditure...
percent respondents were found in high income category with more than Rs. 45000 annual income of the family.
The data compiled in Table 5 show the percentage distribution of respondents according to their extent of expenditure on various modes. It reveals that all the respondents expend their income on domestic purposes like food, clothing etc. Out of which majority, 69.16 per cent of the respondents expend their more than 50 per cent income on this mode. It was also found that most of the respondents expend their income on smoking including tobacco, 'gudakhu' etc. (95.33 per cent), ceremonies (93.46 per cent) and liquors (84. 1I per cent) but the amount of expenditure on above modes was mostly up to 10 per cent of the total expenditure per annum. The 86.92, 83.18 and 85.98 per cent respondents reported that they did not make any expenditure on buying of land, cattle, implements. etc, buying and maintanance of radiolTV, news paper etc. mass/printed media and miscellaneous modes respectively. From the agriculture point of view, it was reported by more than 50 per cent of the respondents that they did not make any expenditure on the agricultural inputs like fertilizers, seed, pesticides, fungicides etc.
The data in Table 6 show the general profile of annual income and expenditure pattern of tribal farmers, particularly in Danteware block of Bastar. It was found that agriculture contributes to 40.90 pe rcent to their total average earning. Tribal farmers generally collect products and sell them, it was found that this activity contributes 18.13
50
perc ent to their total average earning, it was . also found that 17.08 per cent earning of the respondents was from labour works, 11.03 per cent from animal husbandry, 7.80 percent from services, 3.91 per cent from the selling of the liquors and 1.15 per cent income was found to be received from other businesses.
Regarding the expenditure pattern of the respondents, domestic consumption was found as the most important mode of expenditure, on which they expend 58.46 per cent of their total earnings. Liquor was found second most important mode of expenditure on which farmers expend 12.71 per cent of their earnings. Also they expend 10.03 per cent on ceremonies and festivals and 4.73 per cent on smoking tobacco including 'Gudakhu'. Some part of tribals earning were also found to be expended on agricultural inputs (3.71 per cent), buying of implements, cattles, land etc. (2.97 per cent), house making and its maintenance (2.02 per cent), only 1.79 and 0.18 per cent earning were found to be expended on education and mass/ printed media respectively. Also 3.40 per cent of the average expenditure was found on other modes, which are kept under the category of miscellaneous modes.
CONCLUSION
The results of the study thus indicate that the tribal farmers are generally involved in agriculture and allied activities, forest product collection is also an important element of earning in their simple life. It results in increase in the involvement on various occupations but decrease in their dependency was also found on one
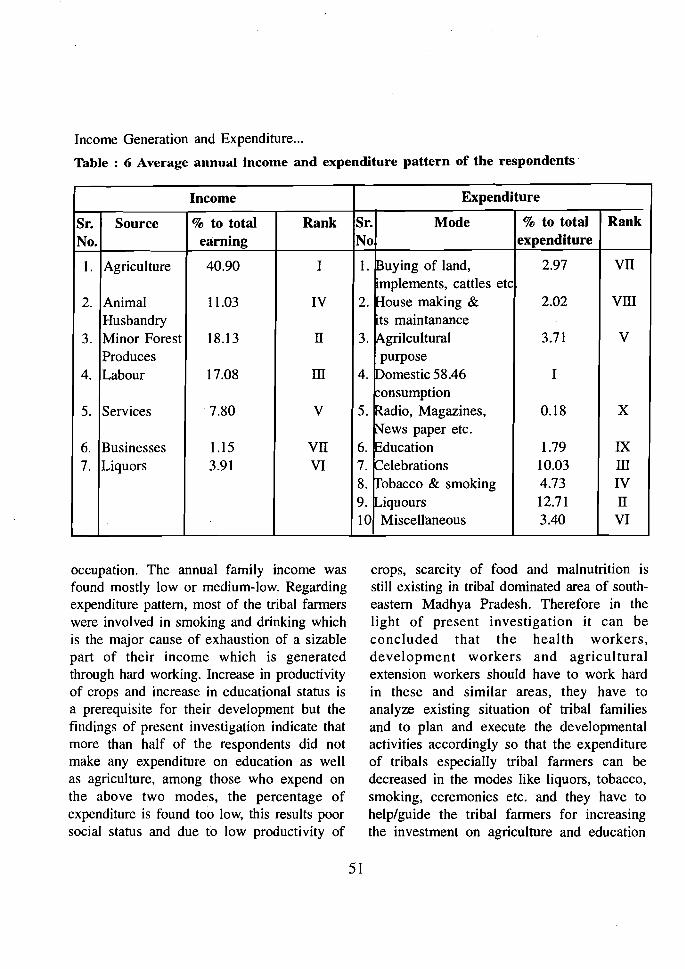
Income Generation and Expenditure...
Table: 6 Average annual income and expenditure pattern of the respondents
Income Expenditure
Sr. Source % to total Rank Sr. Mode % to total Rank
No. earning No expenditure
I. Agriculture 40.90 I 1. auying of land, 2.97 VII .mplements, cattles etc
2. Animal 11.03 IV 2. House making & 2.02 Vill Husbandry 'ts maintanance
3. Minor Forest 18.13 II 3. Agrilcultural 3.71 V Produces purpose
4. Labour 17.08 ill 4. Domestic 58.46 I ~onsumption
5. Services 7.80 V 5. Radio, Magazines, 0.18 X News paper etc.
6. Businesses 1.15 VII 6. Education 1.79 IX 7. Liquors 3.91 VI 7. Celebrations 10.03 ill
8. Tobacco & smoking 4.73 IV 9. dquours 12.71 II 10 Miscellaneous 3.40 VI
occupation. The annual family income was found mostly low or medium-low. Regarding expenditure pattern, most of the tribal farmers were involved in smoking and drinking which is the major cause of exhaustion of a sizable part of their income which is generated through hard working. Increase in productivity of crops and increase in educational status is a prerequisite for their development but the findings of present investigation indicate that more than half of the respondents did not make any expenditure on education as well as agriculture, among those who expend on the above two modes, the percentage of expenditure is found too low, this results poor social status and due to low productivity of
crops, scarcity of food and malnutrition is still existing in tribal dominated area of southeastern Madhya Pradesh. Therefore in the light of present investigation it can be concl uded that the heal th workers, development workers and agricultural extension workers should have to work hard in these and similar areas, they have to analyze existing situation of tribal families and to plan and execute the developmental activities accordingly so that the expenditure of tribals especially tribal farmers can be decreased in the modes like liquors, tobacco, smoking, ceremonies etc. and they have to help/guide the tribal farmers for increasing the investment on agriculture and education
51

Income Generation and Expenditure...
and Govt. have to provide necessary items, the socioeconomic status of tribal fanners will things for increasing the pace of educational not be possible to rapidly change forward. and agricultural development without which
REFERENCES
Anonymous (1987) "Tribal development programme household incomes in tribal programme - an evaluation study of IRDP areas of Pangi and Spiti of Himanchal in Singhbhum district, Bihar. "ISAE, New Pradesh." Agricultural Situations in India, Delhi, India; Evaluation cell. Punjab 41 : 12, pp 961-964. National Bank.
Shanna, H. R.; Moorti, T. V. and Singh, K. Khan, M. A. (1996) "A study on tribal (1988) "Extent of income inequalities and
farmers of Dantewara block of Bastar poverty in tribal areas of Himanchal district, M. P, with reference to adoption Pradesh. Journal of Rural Development, of selected agricultural technologies." Hyderabad, Vol. 7 (3) pp 323-332. M.Sc. Thesis (Unpublished), IGAU,
Shrivastava, R. S. (1986) " A sociological Raipur.
study of labour among the Muriya tribes Moorti, T. Y.; Sharma, H. R. and Thakur, D. of Bastar district of M.P." Bulletin of the
S. (1987) "Impact of development tribals, Bhopal, Vol. XIV, No. 1 & 2, pp 27-44.
r--~--------------------,
I .:. There are some occasions in which a man must tell half his I secret, in order to conceal the rest; but there is seldom one in I which a man should tell it all I I - LORD CHESTERFIELD II .:. I can promise to be frank, but I can't promise to be impartial I
-GOETHEI I .+. Everything works for the best, even the worst intentions. I • I -LORD MELBOURNE ~-------------- J
52
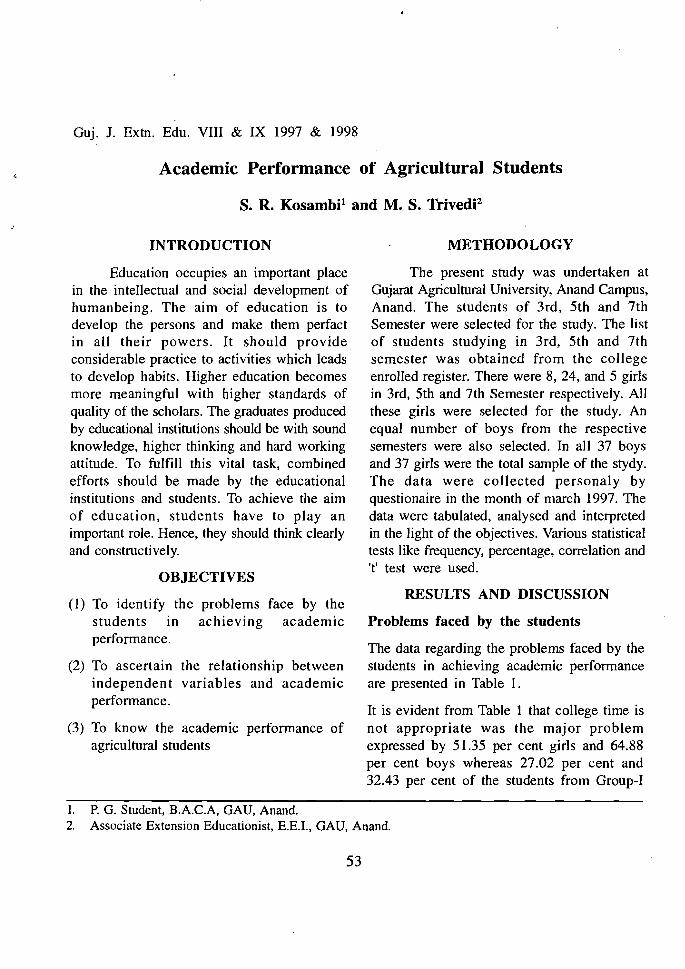
Guj. J. Extn. Edu. VIII & IX 1997 & 1998
Academic Performance of Agricultural Students
S. R. KosambP and M. S. TrivedP
INTRODUCTION
Education occupies an important place in the intellectual and social development of humanbeing. The aim of education is to develop the persons and make them perfact in all their powers. It should provide considerable practice to activities which leads to develop habits. Higher education becomes more meaningful with higher standards of quality of the scholars. The graduates produced by educational institutions should be with sound knowledge, higher thinking and hard working attitude. To fulfill this vital task, combined efforts should be made by the educational institutions and students. To achieve the aim of education, students have to play an important role. Hence, they should think clearly and constructively.
OBJECTIVES
(I) To identify the problems face by the students in achieving academic performance.
(2) To ascertain the relationship between independent variables and academic performance.
(3) To know the academic performance of agricultural students
METHODOLOGY
The present study was undertaken at Gujarat Agricultural University, Anand Campus, Anand. The students of 3rd, 5th and 7th Semester were selected for the study. The list of students studying in 3rd, 5th and 7th semester was obtained from the college enrolled register. There were 8, 24, and 5 girls in 3rd, 5th and 7th Semester respectively. All these girls were selected for the study. An equal number of boys from the respective semesters were also selected. In all 37 boys and 37 girls were the total sample of the stydy. The data were collected personaly by questionaire in the month of march 1997. The data were tabulated, analysed and interpreted in the light of the objectives. Various statistical tests like frequency, percentage, correlation and 'tt test were used.
RESULTS AND DISCUSSION
Problems faced by the students
The data regarding the problems faced by the students in achieving academic performance are presented in Table 1.
It is evident from Table 1 that college time is not appropriate was the major problem expressed by 51.35 per cent girls and 64.88 per cent boys whereas 27.02 per cent and 32.43 per cent of the students from Group-I
1. P. G. Student, B.A.C.A, GAU, Anand. 2. Associate Extension Educationist, E.E.I., GAU, Anand.
53
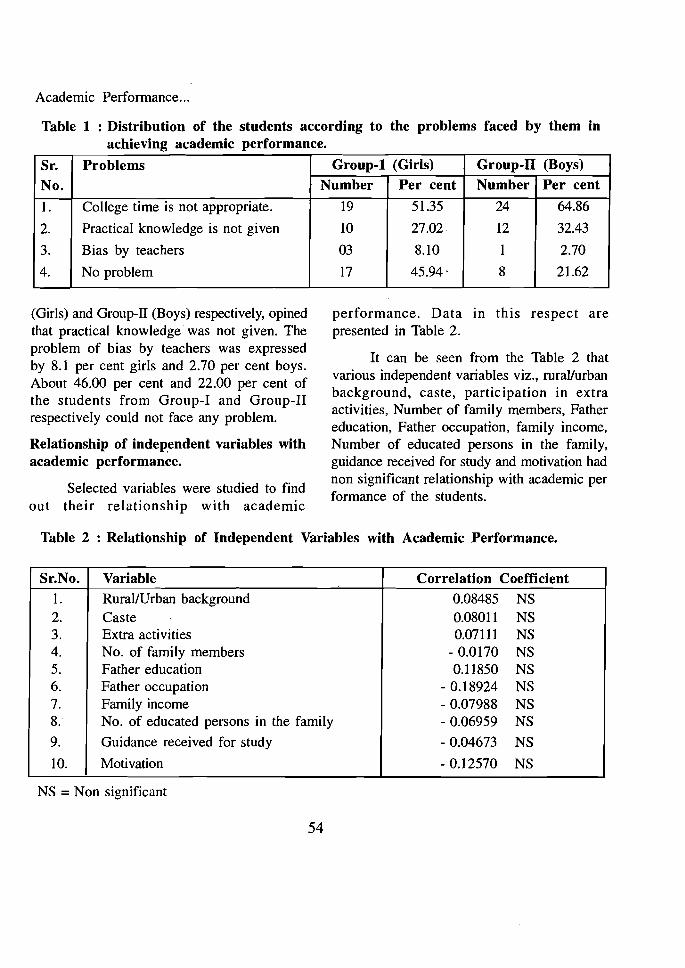
Academic Performance...
Table 1 : Distribution of the students according to the problems faced by them in achieving academic performance.
Sr. Problems Group-l (Girls) Group-II (Boys)
No. Number Per cent Number Per cent
I.
2.
3.
4.
College time is not appropriate.
Practical knowledge is not given
Bias by teachers
No problem
19
10
03
17
51.35
27.02
8.10
45.94
24
12
1
8
64.86
32.43
2.70
21.62
(Girls) and Group-II (Boys) respectively, opined that practical knowledge was not given. The problem of bias by teachers was expressed by 8. I per cent girls and 2.70 per cent boys. About 46.00 per cent and 22.00 per cent of the students from Group-I and Group-II respectively could not face any problem.
Relationship of indep,endent variables with academic performance.
Selected variables were studied to find out their relationship with academic
performance. Data in this respect are presented in Table 2.
It can be seen from the Table 2 that various independent variables viz., mral/urban background, caste, participation in extra activities, Number of family members, Father education, Father occupation, family income, Number of educated persons in the family, guidance received for study and motivation had non significant relationship with academic per formance of the students.
Table 2 : Relationship of Independent Variables with Academic Performance.
Sr.No. Variable Correlation Coefficient
I. 2. 3. 4. 5. 6. 7. 8.
9.
10.
Rural/Urban background Caste Extra activities No. of family members Father education Father occupation Family income No. of educated persons in the family
Guidance received for study
Motivation
0.08485 NS 0.08011 NS 0.07111 NS
- 0.0170 NS 0.11850 NS
- 0.18924 NS - 0.07988 NS - 0.06959 NS
- 0.04673 NS
- 0.12570 NS
NS =Non significant
54

Academic Performance...
Comparison between boys and girls in respect of differnetvariables.
The data in respect of comparison between boys and girls are presented in Table-3.
Table 3 Portrays that caste, extra activities, number of family members, father occupation, family income, number of educated persons in the family, guidance received for study and motivation, were found non significant whereas rural/urban background father education and academic performance of the students differ significantly for both the group. The probable reason for rural/urban background might be that the students from urban area were very active due to the various
media exposure than rural area. Higher education of the father played a significant role to guide them at various stages of study. Academic performance of the girls was higher than boys because girls were more sincere in study than boys.
CONCLUSION
It can be concluded that...
(1) College time is not appropriate and practical knowledge is not given were the major problems faced by the agriculture students.
(2) The relationship between socio-personal and economic characteristics of the students viz. ruraVurban background, caste,
Table 3 : Comparison between boys and girls in respect of different variables.
Sr. No.
Name of variable Group-I (Girls)
Mean Score
Group-II (Boys)
Mean Score
't' value
I Rural/Urban background 1.4595 1.1892 2.5584 * 2 Caste 2.5135 2.4865 0.1845 NS
3 Extra activities 3.1351 3.7027 - 1.4719 NS
4 No. of family members 5.1081 5.3784 - 0.7347 NS
5 Father education 3.8378 3.4324 2.5335 * 6 Father occupation 3.1892 3.6757 - 1.5002 NS
7 Family income 76243.24 63794.59 1.5682 NS
8 No. of educated persons in
the family 4.6486 4.3784 1.0567 NS
9 Guidance received for study ·2.6757 2.9730 - 0.9477 NS
10 Acadimic performance 6.7495 6.1530 3.0916 * II Motivation 1.0270 1.1081 - 0.9115 NS
* Significant at 0-05 per cent level.
55
Academic PerfoQrnmnarunt1ic~e~..~.-----------------------------
extra activities, father education, father occupation, number of family members, family income, number of educated persons in the family, guidance received for study, motivation and their academic performance were found to be nonsignificant.
(3) There was significant difference between boys and girls in respect of rural/urban background, father education and academic performance.
IMPLICATION
The teacher should motivate the students and try to avoid the problem of bias for better academic performance of the students, university authority should prepare course curriculum practical oriented and change the college time on experimental base which might be create interest among students towards study.
REFERENCES
Jamuar, K. K. 1961. Investigation of some psychological factors underlying the study habits of college students. Ph. D. Thesis, Patna Universit,y, Patna.
Lad, K. D. 1976. A study of the relationship between study habits and academic performance of second year and third year B.Sc. (Agri.) students of Gujarat Agricultural University. Thesis M.Sc. (Agri.), G.A.U., Anand.
•:.
.:.
.:.
We don't know life: how can we know death ? - CONFUCIUS
It is always easy to be on the negative side. If a man were now to deny that there is salt upon the table, you could not reduce him to an absurdity
- SAMUEL JOHNSON
To find out what one is fitted to do and to secure an opportunity to do it is the key to happiness.
-JOHN DEWEY
56
Guj. J. Extn. Edu. VIII & IX 1997 & 1998
Impact of Institutional Training on Knowledge of Tribal Farmers
F. L. Sharma1 and S. L. Intodia2
INTRODUCTION
The transfer of modern agricultural practices to tribal farmers with pre-conceived thoughts of traditional farming, calls for a well developed and organised training programme for tribal farmers. Training is critical input for the farmers for quick transfer of technology and a way to improve their agriculture and uplift their socio-econmic condition. Thus, the importance of training as an indispensable instrument for human resource development at any level can not be ignored. In this context the Vidya Bhawan Krishi Vigyan Kendra has organised per-season kharif training programme on cereal, pulse and oilseed crops. Keeping these points in view present study was conducted with the following objective :
"To study the gain in knowledge of the tribal farmers after attending the training with regards to improved agricultural practices of cereal, pulse and oilseeds crop".
METHODOLOGY
The Vidya Bhawan Krishi Vigyan Kendra is organising institutional and noninstitutional vocational training programmes for fanners, farm women and youths of the Udaipur district. Three pre-kharif on-campus training courses were conducted on cereal,
pulse and oilseed crops for the tribal farmers. For impact assessment of the training, maize, urad and groundnut were selected from cereal, pulse and oilseed crops respectively, because these crops are mainly grown in the area by the farmers. The respondents who were called for attending the short duration trainings constituted the sample for this study. The number of farmers who attended the cereal, oilseed and pulse training programme were 36, 36 and 31, respectively.
In total 103 tribal farmers participated in these training courses from panchyat samiti of Gounda, Jhadol and Kotra of the Udaipur district.
Measurement of Knowledge
Keeping the theme of training in mind, schedules were developed for each training programme for data collection. They were applied to the trainees before and after the training programme. The correct response was given '1' score, whereas, '0' for wrong response. The mean percent knowledge was computed by the following formula.
Total Score Obtained ------- X 100
Potential Score
1. Assistant Professor, Depertment of Extn. Education, RAU, Udaipur (Raj.) 2. Director, Directorate of Extension Education, RAU, Udaipur. (Raj.)
57
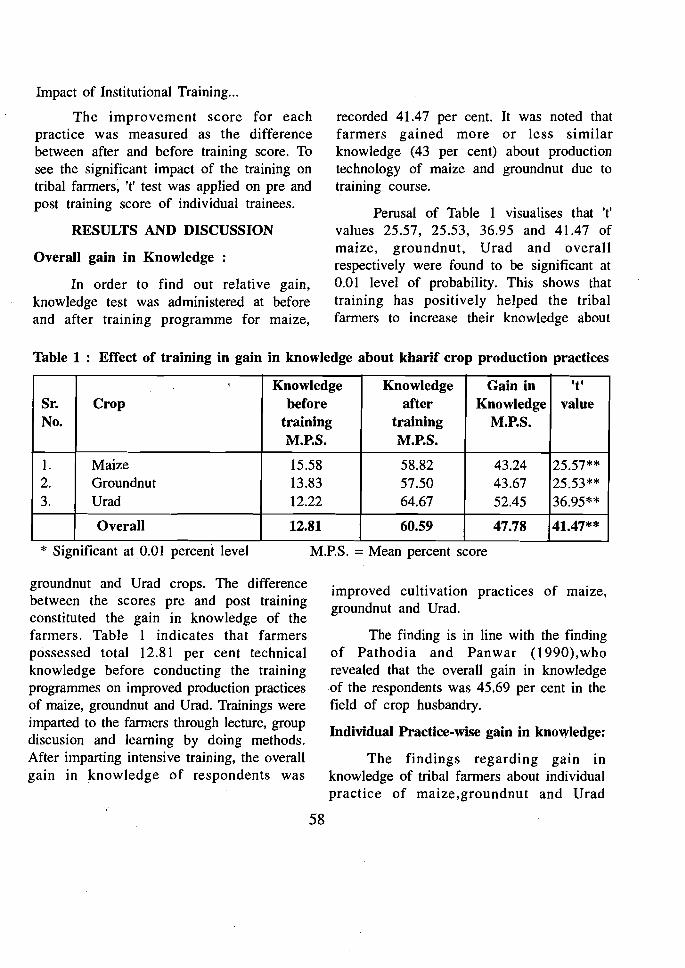
Impact of Institutional Training...
The improvement score for each practice was measured as the difference between after and before training score. To see the significant impact of the training on tribal farmers; 't' test was applied on pre and post training score of individual trainees.
RESULTS AND DISCUSSION
Overall gain in Knowledge :
In order to find out relative gain, knowledge test was administered at before and after training programme for maize,
recorded 41.47 per cent. It was noted that farmers gained more or less similar knowledge (43 per cent) about production technology of maize and groundnut due to training course.
Perusal of Table I visualises that 't' values 25.57, 25.53, 36.95 and 41.47 of maize, groundnut, Urad and overall respectively were found to be significant at 0.01 level of probability. This shows that training has positively helped the tribal farmers to increase their knowledge about
Table 1 : Effect of training in gain in knowledge about kharif crop production practices
Sr. No.
'.
Crop Knowledge
before training M.P.S.
Knowledge after
training M.P.S.
Gain in Knowledge
M.P.S.
't' value
l. 2,
3.
Maize Groundnut Urad
15.58 13.83 12.22
58.82 57.50 64.67
43.24 43.67 52.45
25.57** 25.53** 36.95**
Overall 12.81 60.59 47.78 41.47**
* Significant at 0.01 percent level
groundnut and Urad crops. The difference between the scores pre and post training constituted the gain in knowledge of the farmers. Table I indicates that farmers possessed total 12.81 per cent technical knowledge before conducting the training programmes on improved production practices of maize,- groundnut and Urad. Trainings were imparted to the farmers through lecture, group discusion and learning by doing methods. After imparting intensive training, the overall gain in knowledge of respondents was
M.P.S. = Mean percent score
improved cultivation practices of maize, groundnut and Urad.
The finding is in line with the finding of Pathodia and Panwar (1990), who revealed that the overall gain in knowledge of the respondents was 45.69 per cent in the field of crop husbandry.
Individual Practice-wise gain in knowledge:
The findings regarding gain in knowledge of tribal farmers about individual practice of maize,groundnut and Urad
58
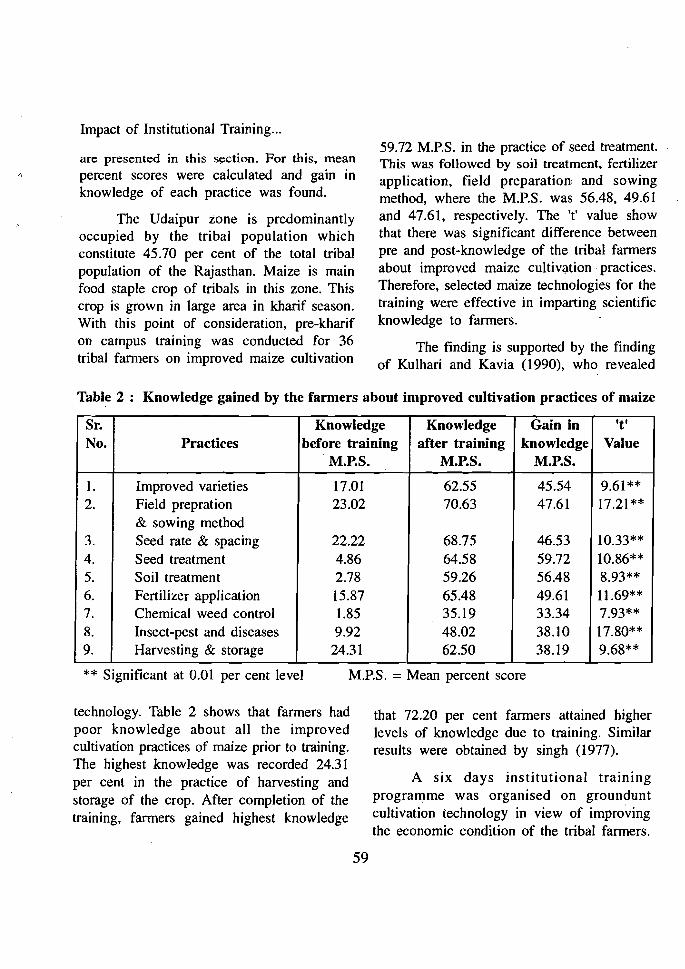
Impact of Institutional Training...
are presented in this s~ction. For this, mean percent scores were calculated and gain in knowledge of each practice was found.
The Udaipur zone is predominantly occupied by the tribal population which constitute 45.70 per cent of the total tribal population of the Rajasthan. Maize is main food staple crop of tribals in this zone. This crop is grown in large area in kharif season. With this point of consideration, pre-kharif on campus training was conducted for 36 tribal farmers on improved maize cultivation
59.72 M.P.S. in the practice of seed treatment. This was followed by soil treatment, fertilizer application, field preparation and sowing method, where the M.P.S. was 56.48, 49.61 and 47.61, respectively. The It' value show that there was significant difference between pre and post-knowledge of the tribal farmers about improved maize cultiv;;ttion practices. Therefore, selected maize technologies for the training were effective in imparting scientific knowledge to farmers.
The finding is supported by the finding of Kulhari and Kavia (1990), who revealed
Table 2 : Knowledge gained by the farmers about improved cultivation practices of maize
Sr. No. Practices
Knowledge before training
M.P.S.
Knowledge after training
M.P.S.
Gain in knowledge
M.P.S.
It' Value
I. 2.
3. 4. 5. 6. 7. 8. 9.
Improved varieties Field prepration & sowing method Seed rate & spacing Seed treatment Soil treatment Fertilizer application Chemical weed control Insect-pest and diseases Harvesting & storage
17.01 23.02
22.22 4.86 2.78 15.87 1.85 9.92
24.31
62.55 70.63
68.75 64.58 59.26 65.48 35.19 48.02 62.50
45.54 47.61
46.53 59.72 56.48 49.61 33.34 38.10 38.19
9.61** 17.21 **
10.33** 10.86** 8.93** 11.69** 7.93** 17.80** 9.68**
** Significant at 0.01 per cent level M.P.S. = Mean percent score
technology. Table 2 shows that farmers had poor knowledge about all the improved cultivation practices of maize prior to training. The highest knowledge was recorded 24.31 per cent in the practice of harvesting and storage of the crop. After completion of the training. farmers gained highest knowledge
that 72.20 per cent farmers attained higher levels of knowledge due to training. Similar results were obtained by singh (1977).
A six days institutional training programme was organised on groundunt cultivation technology in view of improving the economic condition of the tribal farmers.
59
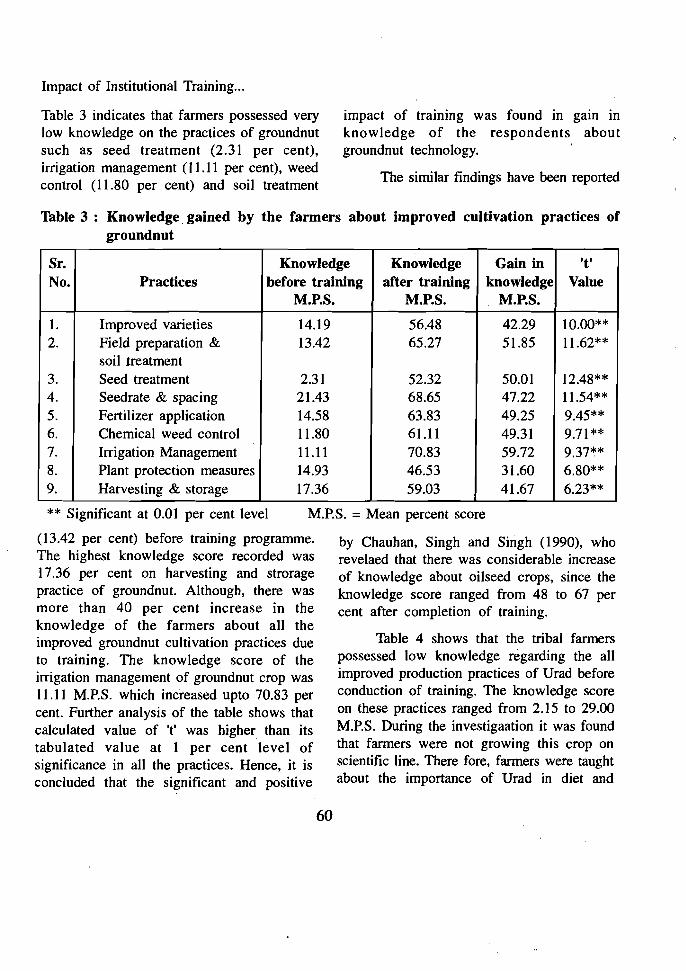
Impact of Institutional Training...
Table 3 indicates that farmers possessed vety impact of training was found in gain in low knowledge on the practices of groundnut knowledge of the respondents about such as seed treatment (2.31 per cent), groundnut technology. . irrigation management (11.11 per cent), weed control (11.80 per cent) and soil treatment The similar findings have been reported
Table 3 : Knowledge, gained by the farmers about improved cultivation practices of groundnut
Sr. No. Practices
Knowledge before training
M.P.S.
Knowledge after training
M.P.S.
Gain in knowledge
M.P.S.
't' Value
I. 2.
3. 4. 5. 6. 7. 8. 9.
Improved varieties Field preparation & soil treatment Seed treatment Seedrate & spacing Fertilizer application Chemical weed control Irrigation Management Plant protection measures Harvesting & storage
14.19 13.42
2.31 21.43 14.58 11.80 11.11 14.93 17.36
56.48 65.27
52.32 68.65 63.83 61.11 70.83 46.53 59.03
42.29 51.85
50.01 47.22 49.25 49.31 59.72 31.60 41.67
10.00** 11.62**
12.48** 11.54** 9.45** 9.71 ** 9.37** 6.80** 6.23**
** Significant at 0.01 per cent level M.P.S. = Mean percent score
(13.42 per cent) before training programme. by Chauhan, Singh and Singh (1990), who The highest knowledge score recorded was revelaed that there was considerable increase 17.36 per cent on harvesting and strorage of knowledge about oilseed crops, since the practice of groundnut. Although, there was knowledge score ranged from 48 to 67 per more than 40 per cent increase in the cent after completion of training. knowledge of the farmers about all the
Table 4 shows that the tribal farmers improved groundnut cultivation practices due possessed low knowledge regarding the allto training. The knowledge score of the improved production practices of Urad before irrigation management of groundnut crop was conduction of training. The knowledge score 11.11 M.P.S. which inc'reased upto 70.83 per on these practices ranged from 2.15 to 29.00 cent. Further analysis of the table shows that M.P.S. During the investigaation it was found calculated value of 't' was higher than its that farmers were not growing this crop ontabulated value at I per cent level of scientific line. There fore, farmers were taught significance in all the practices. Hence, it is about the importance of Urad in diet andconcluded that the significant and positive
60
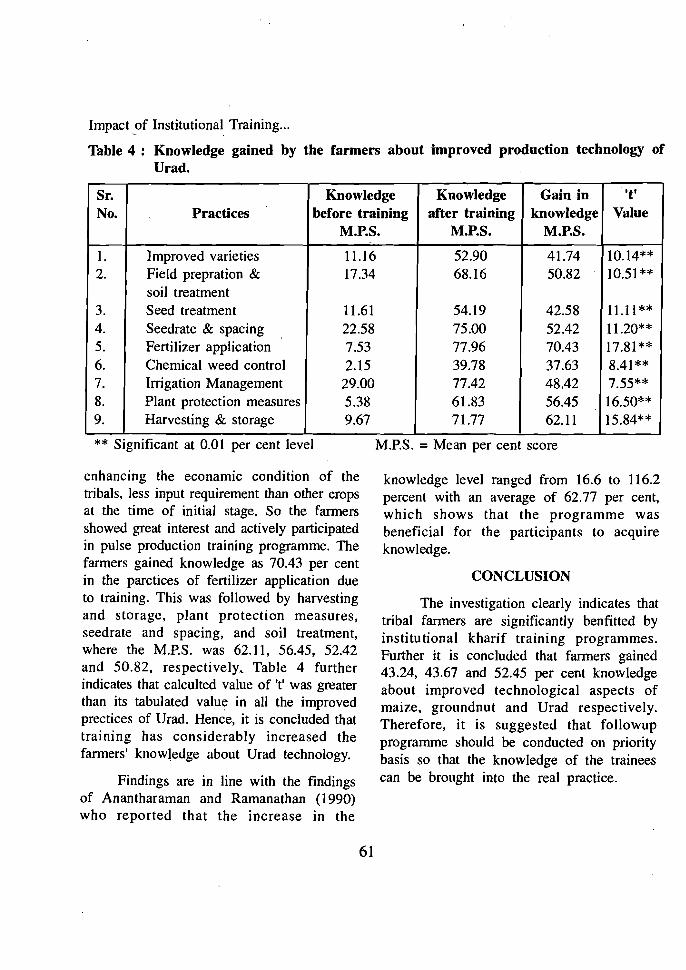
Impact _of Institutional Training...
Table 4: Knowledge gained by the farmers about improved production technology of Urad.
Sr. No. Practices
Knowledge before training
M.P.S.
Knowledge after training
M.P.S.
Gain in knowledge
M.P.S.
't' Value
1. 2.
3. 4. 5. 6. 7. 8. 9.
Improved varieties Field prepration & soil treatment Seed treatment Seedrate & spacing Fertilizer application Chemical weed control Irrigation Management Plant protection measures Harvesting & storage
11.16 17.34
11.61 22.58 7.53 2.15
29.00 5.38 9.67
52.90 68.16
54.19 75.00 77.96 39.78 77.42 61.83 71.77
41.74 50.82
42.58 52.42 70.43 37.63 48.42 56.45 62.11
10.14** 10.51**
11.11 ** 11.20** 17.81** 8.41 ** 7.55** 16.50** 15.84**
** Significant at 0.01 per cent level
enhancing the econamic condition of the tribals, less input requirement than other crops at the time of initial stage. So the farmers showed great interest and actively participated in pulse production training programme. The farmers gained knowledge as 70.43 per cent in the parctices of fertilizer application due to training. This was followed by harvesting and storage, plant protection measures, seedrate and spacing, and soil treatment, where the M.P.S. was 62.11, 56.45, 52.42 and 50.82, respectively~ Table 4 further indicates that calculted value of 't' was greater than its tabulated value in all the improved prectices of Urad. Hence, it is concluded that training has considerably increased the farmers' knowledge about Urad technology.
Findings are in line with the findings of Anantharaman and Ramanathan (1990) who reported that the increase in the
61
M.P.S. = Mean per cent score
knowledge level ranged from 16.6 to 116.2 percent with an average of 62.77 per cent, which shows that the programme was beneficial for the participants to acquire knowledge.
CONCLUSION
The investigation clearly indicates that tribal farmers are significantly benfitted by institutional kharif training programmes. Further it is concluded that farmers gained 43.24, 43.67 and 52.45 per cent knowledge about improved technological aspects of maize, groundnut and Urad respectively. Therefore, it is suggested that followup programme should be conducted on priority basis so that the knowledge of the trainees can be brought into the real practice.
Impact of Institutional Training...
REFERENCES
Ananthraman, M. and Ramanathan, S. (1990). Impact of training programme on tuber crops. Indian Jr. of Ext. Edu., Vol. 26 (1&2) 103-106.
Chuhan, K. N. K., Singh, R. N. and Singh, M. P. (1990). Impact of training on knowledge of improved agricultural practices of arid-zone. Indian Jr. of Ext. Edu. Vol. 26 (3&4), 64-66.
Kulhari, V. S. & Kavia, Z. D. (1990). Impact of training on gain in knowledge about
fruits and vegetable cultivation. Raj. Jr. of Ext. Edu. I (I). 56-60.
Pathodia, R. S. and Panwar, J. S. (1990). Impact of short durtion agricultural training programme on gain in knowledge by farmers. Raj. Jr. of Ext. Edu. I (I), 53-55.
Singh, A. S. (1977). Impact of farmers training programme. Indian Jr. of Adult Education, 38 (5), 25.
.:.
.:.
.:.
.:.
.:.
He began to realize the deep truth that no one, broadly speaking, ever wishes to hear what you have been doing.
- ANGELA THIRKELL
Winners do not do different things They do things differently
-SHIVKHERA
Success comes to those who keep striving. While failure stalks those who give up
A candle which is not lit cannot light others; A teacher who is also not learning cannot teach others
It is only when we forget all our learning that we begin to know
- HENRY DAVID THOREAU
62
Guj. J. Extn. Edu. VIII & IX 1997 & 1998
Identification and. Adoption of Indigenous Technical Knowledge (ITKs) by Sugarcane Growers
s. R. PateP, R. B. PateF and V. D. JoshP
INTRODUCTION
Traditional values which are suitable in nature need to be compared with the values of modem technological systems. The modem agricultural science is different and some times contradictory· to the traditional agricultural knowledge possessed· by the farmers. The traditional practices of agriculture will disappear unless their values are promoted. For destruction in vast storage of traditional agricultural practices modern patterns are· largely responsible. As long as we shall follow the western notion that individual greed is more important than community need, we will certainly put ourselves in danger. Now it is the time that we have to think about farmer's right and Dunkel's draft. There is a growing need of the present situation to disseminate the traditional agricultural wisdom of the farmers and to give it due consideration and encouragement, so that farmers could use it as a local resource. This can be done by having a very clear concept of what the traditional knowledge is.
The word "tradi tional" means transmission of community values and behaviour which are shared by the members of a soiciety which is rooted since long past.
Dr. Hasnain defined it as "a part of culture which is being necessarily followed by society and expressed in form of oral, social and physical behaviour".
Reijntjes. et. al. (1993) have defined Indigenous knowledge as the knowledge of people living in a certain area, generated by their own and their ancestors' experiences and including knowledge originating from elsewhere which has been internalised by the local people.
With this concept in mind it was thought essential to identify some of the ITKs alongwith its adoption among the farming community of South Gujarat. The South Gujarat having a prominent area of Sugarcane crop, it was thought essential to restrict this study only on the crop of sugarcane only with following specific objectives :
OBJECTIVES
I. To identify indigenous sugarcane technological knowledge prevailing among the farming community of South Gujarat.
2. To study the extent of adoption of ITKs.
3. To know the reasons behind use of IrKs.
4. To know experts' opinion towards ITKs.
1. P. G. Student, N. M. College of Agriculture, G.A.U., Navsari 2. Prof. & Head, Department of Extn. Edu., N. M. College of Agriculture, GAU. Navsari. 3. Asso. Prof. Department of Extn. Edu., N. M. College of Agriculture, GAU., Navsari
63
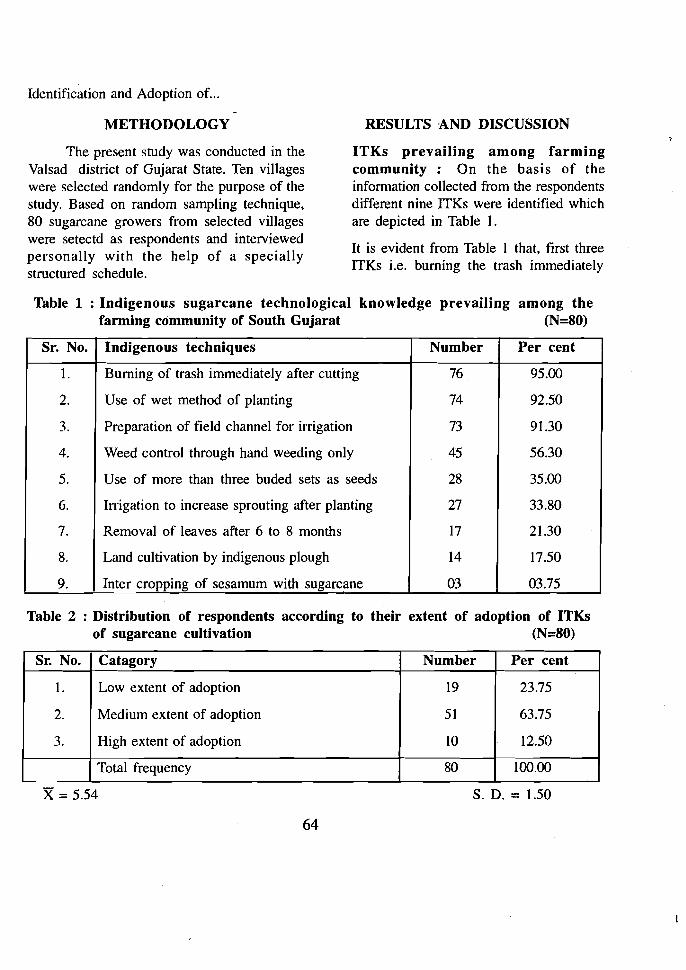
Identification and Adoption of...
METHODOLOGY
The present study was conducted in the Valsad district of Gujarat State. Ten villages were selected randomly for the purpose of the study. Based on random sampling technique, 80 sugarcane growers from selected villages were setectd as respondents and interviewed personally with the help of a specially structured schedule.
RESULTS AND DISCUSSION
ITKs prevailing among farming community: On the basis of the information collected from the respondents different nine ITKs were identified which are depicted in Table I.
It is evident from Table I that, first three ITKs i.e. burning the trash immediately
Table 1 : Indigenous sugarcane technological knowledge prevailing among the farming community of South Gujarat (N=80)
Sr. No. Indigenous techniques Number Per cent
1.
2.
3.
4.
5.
6.
7.
8.
9.
Burning of trash immediately after cutting
Use of wet method of planting
Preparation of field channel for irrigation
Weed control through hand weeding only
Use of more than three buded sets as seeds
Irrigation to increase sprouting after planting
Removal of leaves after 6 to 8 months
Land cultivation by indigenous plough
Inter cropping of sesamum with sugarcane
76
74
73
45
28
27
17
14
03
95.00
92.50
91.30
56.30
35.00
33.80
21.30
17.50
03.75
Table 2 : Distribution of respondents according to their extent of adoption of ITKs of sugarcane cultivation (N=80)
Sr. No. Catagory Number Per cent
1.
2.
3.
Low extent of adoption
Medium extent of adoption
High extent of adoption
19
51
10
23.75
63.75
12.50
Total frequency 80 100.00
x = 5.54 S. D. = 1.50
64
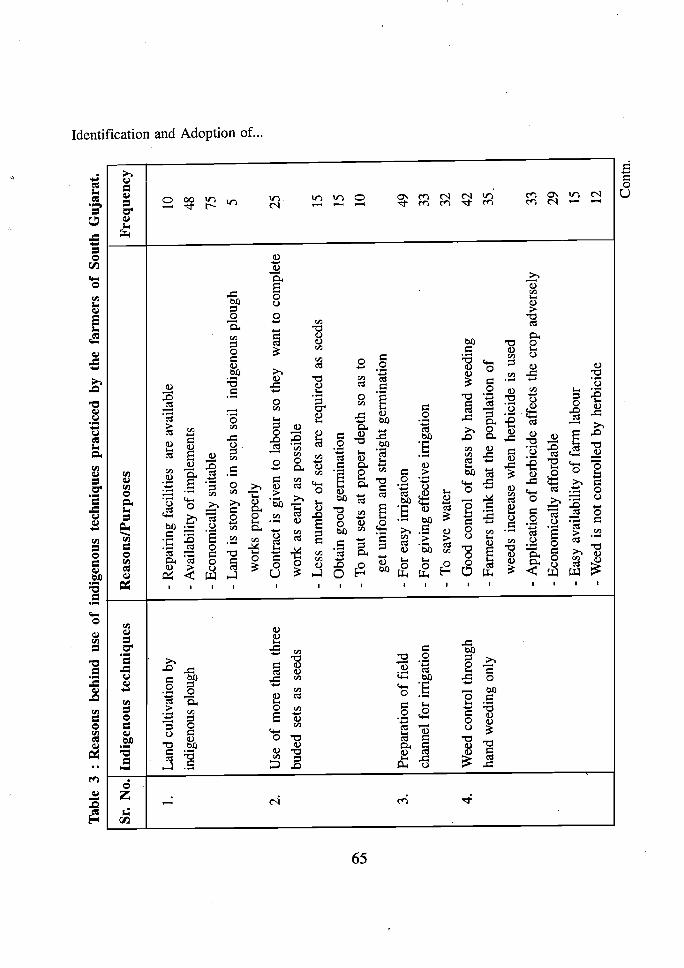
.....
0..
(1
)
Tab
le 3
: R
easo
ns b
ehin
d us
e of
ind
igen
ous
tech
niqu
es p
ract
iced
by
the
farm
ers
of S
outh
Guj
arat
. ::
l a.
::n
()
Sr.
No.
In
dige
nous
tec
hniq
ues
Rea
sons
/Pur
pose
s F
requ
ency
a o' ::
l
1.
Lan
d cu
ltiva
tion
by
indi
geno
us p
loug
h
2.
Use
of
mor
e th
an t
hree
bude
d se
ts a
s se
eds
3.
Pre
para
tion
of
fiel
d
chan
nel
for
irri
gatio
n
4.
Wee
d co
ntro
l th
roug
h
hand
wee
ding
onl
y
-R
epai
ring
fac
ilitie
s ar
e av
aila
ble
-A
vaila
bilit
y of
impl
emen
ts
-E
cono
mic
ally
sui
tabl
e
-L
and
is s
tony
so
in s
uch
soil
indi
geno
us p
loug
h
wor
ks p
rope
rly
-C
ontr
act
is g
iven
to
labo
ur s
o th
ey
wan
t to
com
plet
e
wor
k as
ear
ly a
s po
ssib
le
-L
ess
num
ber
of s
ets
are
requ
ired
as
seed
s
-O
btai
n go
od g
erm
inat
ion
-T
o pu
t se
ts a
t pr
oper
dep
th s
o as
to
get
unif
orm
and
str
aigh
t ge
rmin
atio
n
-F
or e
asy
irri
gatio
n
-F
or g
ivin
g ef
fect
ive
irri
gati
on
-T
o sa
ve w
ater
-G
ood
cont
rol
of
gras
s by
han
d w
eedi
ng
-F
arm
ers
thin
k th
at t
he p
opul
atio
n o
f
wee
ds i
ncre
ase
whe
n he
rbic
ide
is u
sed
-A
ppli
cati
on o
f he
rbic
ide
affe
cts
the
crop
adv
erse
ly
-E
cono
mic
ally
aff
orda
ble
-E
asy
avai
labi
lity
of f
arm
lab
our
-W
eed
is n
ot c
ontr
olle
d by
her
bici
de
§10
0
..
;l>48
0
..
o "C75
a.
o ::
l5
o ~
25
15
15
10
49
33
32
42
35
33
29
15
12 Con
tn.

-0.
0'1
0'1
Sr.
No.
In
dige
nous
tec
hnig
uues
R
easo
ns/P
urpo
ses
Fre
quen
cy
5.
Hea
vy i
rrig
atio
n to
inc
reas
e -
Goo
d an
d sp
eedy
ger
min
atio
n 15
sp
rout
ing
.aft
er p
lant
ing
-A
fter
pla
ntin
g, h
eavy
irr
igat
ion
nece
ssar
y 13
-F
or
incr
easi
ng m
oist
ure
hold
ing
capa
city
of
soil
10
6.
Rem
oval
of
leav
es a
fter
6
-T
rash
are
use
d as
man
ure
in s
oil
15
to 8
mon
th
-S
unli
ght
reac
hes
to t
he s
oil
13
-T
o co
ntro
l in
sect
-pes
t 13
-S
ugar
cane
set
s ga
in g
ood
nutr
ient
s so
gir
th
9
of
sets
inc
reas
e
-U
se a
s fo
od t
o an
imal
3
7.
Bur
ning
of
tras
h -
Eas
y re
mov
al o
f le
aves
57
im
med
iate
ly a
fter
cut
ting
-
Soi
l be
com
e lo
ose
and
fria
ble
48,
-D
ue t
o bu
rnin
g he
at,
grow
th o
f la
m c
rop
35
beco
mes
spe
edy.
-T
o co
ntro
l in
sect
-pes
t/di
seas
es
27
-T
o re
duce
wee
d po
pula
tion
25
-
To
incr
ease
nut
rien
t st
atus
of
soil
by
ash
24
-E
cono
mic
ally
sui
tabl
e 17
-
To
carr
y ou
t ti
llag
e op
erat
ion
easi
ly f
or n
ext
crop
10
8.
Inte
rcro
ppin
g o
f se
sam
um
-F
or
redu
cing
cos
t o
f pr
oduc
tion
2
wit
h su
garc
ane
-S
esam
um s
eeds
sho
uld
be p
rodu
ced
for
hous
e 1
Con
sum
ptio
n
g - S III -n o' ::I
III
::I 0. :>
0. .g :=.
o ::I o :-'>

Identification and Adoption of...
after cutting, use wet method of planting and preparation of field channel for irrigation were the important indigenous techniques encountered by 95.00, 92.50 and 91.30 per cent of the respondents as first, second and third rank respectively. The less important ITKs were : (1) Intercropping of seasamum with sugarcane, (ii) cultivation of land by indigenous plough and (iii) removal of leaves after 6 to 8 months.
Extent of adoption of ITKs : The extent of adoption was also one of the objectives
and the data received are presented in Table 2.
The data presented in Table 2 reveal that the majority (63.75 per cent) of the respondents had medium extent of adoption followed by low (23.75 per cent) and high (12.50 per cent) extent of adoption of ITKs in sugarcane crop.
Reasons behind the use of ITKs : Regarding reasons for adoption of such ITKs, the responses of the farmers were recorded and are presented in Table 3..The
Table 4 : Experts' opinion towards ITKs in sugarcane crop (N=5)
Sr. Opinion
No. ITKs Practically true
Scientifically true
Not true
1. Buming of trash 2 2 1 immediately after cutting (40.00) (40.00) (20.00)
2. Use of wet methods 3 2 0 of planting (60.00) (40.00) (0.00)
3. Preparation of field 3 2 0 channel for irrigation (60.00) (40.00) (0.00)
4. Weed control through 2 0 3 hand weeding only (40.00) (0.'00) (60.00)
5. Use of more than three 3 1 1 buded sets as seeds (60.00) (20.00) (20.00)
6. Heavy irrigation to increase 0 3 2 sprouting after planting (0.00) (60.00) (40.00)
7. Removal of leaves 0 3 2 after 6 to 8 months (0.00)) (60.00) (40.00) .
8. Land cultivation by I 0 4 indigenous plough (20..00) (0.00) (80.00)
9. Intercropping of sesamum 0 1 4 with sugarcane (0.00) (20.00) . (80.00)
Total frequency 14 (31.11)
14 (31.11)
17 (37.78)
67
Identification and Adoption of...
reasons for each ITK is presented in the table which is self explanatory, hence, no detail discussion of this table is given.
Generally it is believed that the scientists do not believe all the ITKs adopted by farmers as true or having a scientific base. But some of the ITKs are tested by the scientists and they found some truth behind it. Keeping this in mind expert's opinion regarding ITKs was sought for and are presented in Table 4.
It is evident from the Table 4 that majority (37.78 per cent) scientists said that ITKs in sugarcane crop were not true followed by practically true and scientifically true (31.11 per cent).
CONCLUSION
The findings of the study indicate that majority of the farmers adopting the ITKs in sugarcane cultivation were: (i) burning of trash immediately after cutting, (ii) use of wet method of planting and (iii) preparation of field channel for irrigation. Also there is the medium extent of adoption of ITKs of sugarcane cultivation.
IMPLICATION
Farmers believe in their own techniques. So necessary modification be made in this ITKs which give higher yield and suitable to their existing situation. Also extension machin~ry should arrange training programme, demonstration on such ITKs and spread it over other farming community.
REFERENCES
Gupta, S. L. : Singh, S. P. and Dubey, V. K. (1994). "Traditional wisdom: A conceptual Exploration" Interaction, XXII (1) : p. 3-25
.:. An abstract style is always bad. Your sentences should be full of stones, metals, chairs, tables, animals, men and women.
-ALAIN
.:. No man's credit is as good as his money -E. W.HOWE
.:. Nobody minds having what is too good for them
68
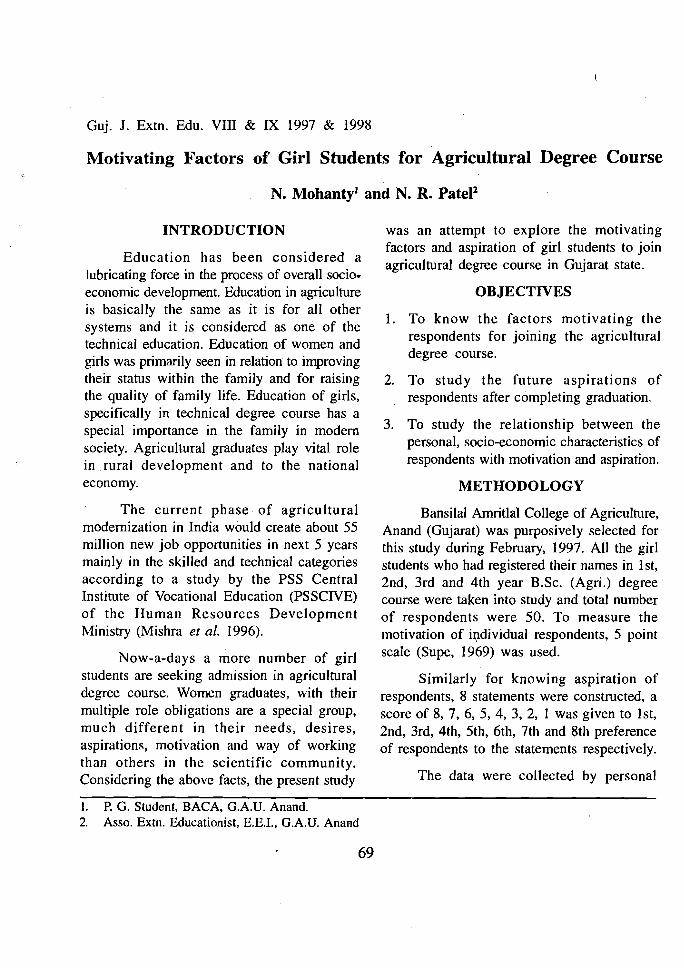
Guj. J. Extn. Edu. VIII & IX 1997 & 1998
Motivating Factors of Girl Students for Agricultural Degree Course
N. Mohantyl and N. R. PateP
INTRODUCTION
Education has been considered a lubricating force in the process of overall socio~
economic development. Education in agriculture is basically the same as it is for all other systems and it is considered as one of the technical education. Education of women and girls was primarily seen in relation to improving their status within the family and for raising the quality of family life. Education of girls, specifically in technical degree course has a special importance in the family in modern society. Agricultural graduates play vital role in .rural development and to the national economy.
The current phase· of agricultural modernization in India would create about 55 million new job opportunities in next 5 years mainly in the skilled and technical categories according to a study by the PSS Central Institute of Vocational Education (PSSCIVE) of the Human Resources Development Ministry (Mishra et ai. 1996).
Now-a-days a more number of girl students are seeking admission in agricultural degree course. Women graduates, with their multiple role obligations are a special group, much different in their needs, desires, aspirations, motivation and way of working than others in the scientific community. Considering the above facts, the present study
was an attempt to explore the motivating factors and aspiration of girl students to join agricultural degree course in Gujarat state.
OBJECTIVES
1. To know the factors motivating the respondents for joining the agricultural degree course.
2. To study the future aspirations of respondents after completing graduation.
3. To study the relationship between the personal, socio-economic characteristics of respondents with motivation and aspiration.
METHODOLOGY
Bansiial Amritial College of Agriculture, Anand (Gujarat) was purposively selected for this study during February, 1997. All the girl students who had registered their names in 1st, 2nd, 3rd and 4th year B.Sc. (Agri.) degree· course were taken into study and total number of respondents were 50. To measure the motivation of iI,ldividual respondents, 5 point scale (Supe, 1969) was used.
Similarly for knowing aspiration of respondents, 8 statements were constructed, a score of 8, 7, 6, 5, 4, 3, 2, I was given to 1st, 2nd, 3rd, 4th, 5th, 6th, 7th and 8th preference of respondents to the statements respectively.
The data were collected by personal
I. P. G. Student, BACA, G.A.V. Anand. 2. Asso. Extn. Educationist, E.E.L, G.A.D. Anand
69
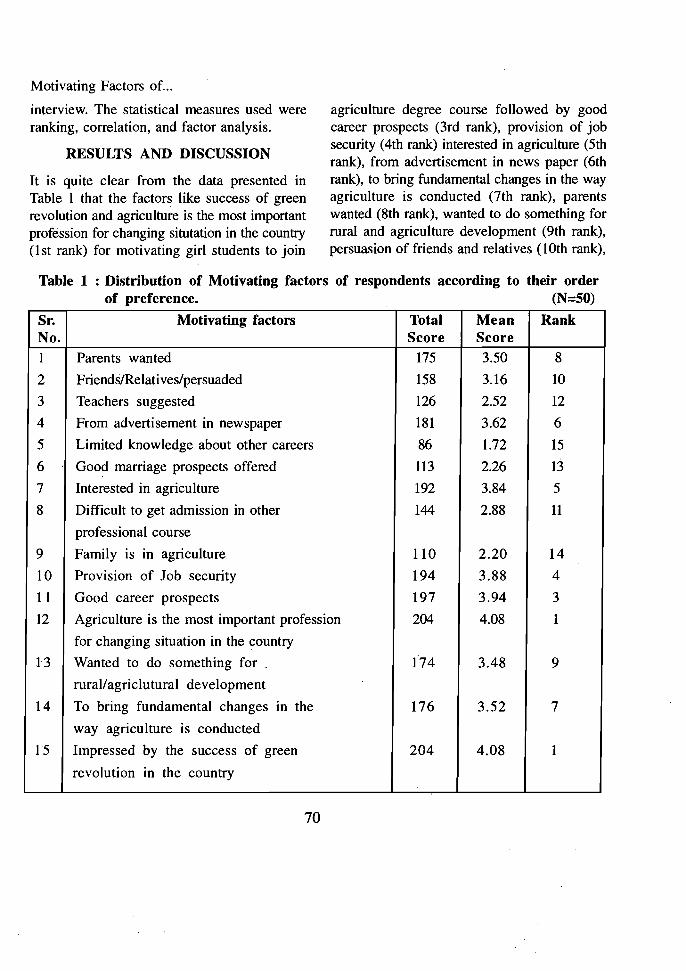
Motivating Factors of...
interview. The statistical measures used were ranking, correlation, and factor analysis.
RESULTS AND DISCUSSION
It is quite clear from the data presented in Table I that the factors like success of green revolution and agriculture is the most important profession for changing situtation in the country (lst rank) for motivating girl students to join
agriculture degree course followed by good career prospects (3rd rank), provision of job security (4th rank) interested in agriculture (5th rank), from advertisement in news paper (6th rank), to bring fundamental changes in the way agriculture is conducted (7th rank), parents wanted (8th rank), wanted to do something for rural and agriculture development (9th rank), persuasion of friends and relatives (10th rank),
Table 1 : Distribution of Motivating factors of respondents according to their order of preference. (N=SO)
Sr. No.
Motivating factors Total Score
Mean Score
Rank
1 Parents wanted 175 3.50 8
2 Friends/Relatives/persuaded 158 3.16 10
3 Teachers suggested 126 2.52 12
4 From advertisement in newspaper 181 3.62 6
5 Limited knowledge about other careers 86 1.72 15
6 Good marriage prospects offered 113 2.26 13
7 Interested in agriculture 192 3.84 5
8 Difficult to get admission in other
professional course
144 2.88 11
9 Family is in agriculture 110 2.20 14
10 Provision of Job security 194 3.88 4
1 I Good career prospects 197 3.94 3
12 Agriculture is the most important profession
for changing situation in the country
204 4.08 1
13 Wanted to do something for
rural/agriclutural development
174 3.48 9
14 To bring fundamental changes in the
way agriculture is conducted
176 3.52 7
15 Impressed by the success of green
revolution in the country
204 4.08 1
70

Motivating Factors of...
difficult to get admission in to other professional course (11 th rank), teachers suggested (12th rank), good marriage prospects offered (13th rank), family is in agriculture (14th rank) and limited knowledge about other career (15th rank).
Table 2 indicates that respondents preferred a job in Agriculture department /
consuming and their financial position may be an obstacle, setting up own fanning and model farm house requires possession of more cultivated land with all infrastructure facilities, agriculture oriented business needs more financial stability, rural management and business management needs. intellectual ability and also a time consuming.
Table 2 : Distribution of aspiration of respondents according to their preference (N=50)
Sr. No.
Aspiration statement Total Score
Mean Score
Rank
l
2
3
4
5
6
7
8
Research (Ph.D.) in agriculture
Job in agriculture Dept./University/Bank
Business management
Rural, management
Setting up model farm house
Own farming in village
Job in private company
To start agriculture oriented business
278
349
228
229
150
96
271
201
5.56
6.98
4.56
4.58
3.00
1.92
5.42
4.02
2
l
5
4
7
8
3
6
University / Bank (1 st rank), followed by research (2nd rank), job in private company (3rd rank), rural management (4th rank), business management (5th rank), to start agriculture oriented business (6th rank), setting up model farm house (7th rank), and own fanning in village (8th rank).
It can be inferred that after completion of agriclutural degree course, respondents aspired for a job in agriculture dept. /university/ bank/private company for economic security in life as it is very important now-a-days, research in agriculture needs more time
Data presented in Table 3 indicates that family educational status had positive and significant relationship with motivation of girl students because with high educational status of family, family members know the importance of higher technical education for girls in modem age. Residentia! place of girl students had positive (r=0.20726) relationship with motivation means urbanity, exposure to mass media may motivate girl students to join agricultural degree course.
Family income had positive (r=O.1 0305) relationship with motivation means familIes
71

Motivating Factors of...
Table 3 : Relationship between presonal and socio-economic charcteristics with Motivation of respondents (N=50) ,;
Sr. No.
Independent varibles Coefficient of correlation 'r' Value
I Residential place 0.20726 2 Age 0.00972 3 Caste 0.00523 4 Education at entry level - 0.14744 5 Family type 0.07426 6 Marital status -0.12752 7 Family size - 0.06510 8 Family educational status 0.37579* 9 Occupation of father - 0.16578 10 Annual income of family 0.10305 II Land holding - 0.22028 12 Social participation of father - 0.23947
13 Rating of agriculture degree course - 0.24919
* Significant at 0.05 per cent level.
having medium and low income level motivate girl students to join agricultural degree course as there is better provision of job security.
Table 4 shows that family educational status had significant and positive relation with aspiration of girl students. It may be due to realization of the value of higher professional education, the girl students aspired high in their career growth and diversity to other field after . completion of agricultural degree course.
Annual income of family had significant and positive relationship with aspiration of girl students. It may happen with sound economic base of family the girl students aspire high in studying technical education.
Motivation had significant and positive relationship with aspiration. This is due to
72
Critical value (2tail 0.05) +/-0.27841
when girl students were motivated to join higher technical education, they aspired for establishing themselves in present society, after completion of agricultural degree course.
Social participation of father had negative and significant relationship with aspiration. The reason could be father may not divert sufficient time to think regarding future aspiration of their duaghters. Rating of agricultural degree course had significant and negative relation with aspiration. Most of the respondent's rating agricultural degree course was medium which do affect their aspiration after joining agricultural course. The reason may be pay and compensation, social status is low as compared to other technical course studied by girls.
, I
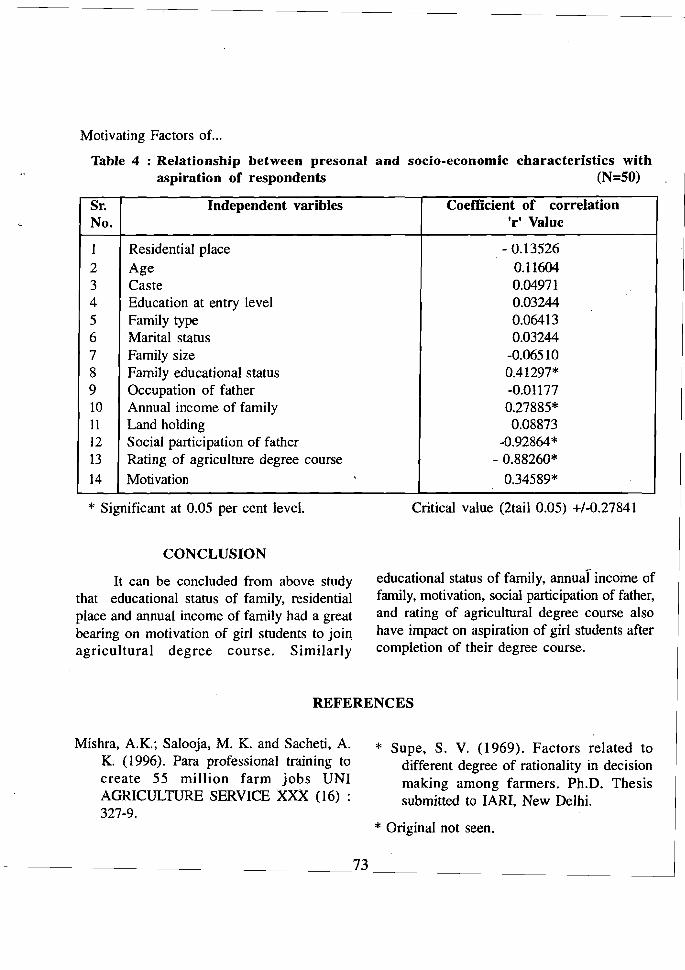
Motivating Factors of...
Table 4 : Relationship between presonal and socio-economic characteristics with aspiration of respondents (N=50)
Sr. No.
Independent varibles Coefficient of correlation 'r' Value
I Residential place - 0.13526 2 Age 0.11604 3 Caste 0.04971 4 Education at entry level 0.03244 5 Family type 0.06413 6 Marital status 0.03244 7 Family size -0.06510 8 Family educational status 0.41297* 9 Occupation of father -0.01177 10 Annual income of family 0.27885* 11 Land holding 0.08873 12 Social participation of father -0.92864* 13 Rating of agriculture degree course - 0.88260* 14 Motivation 0.34589*
* Significant at 0.05 per cent level.
CONCLUSION
It can be concluded from above study that educational status of family, residential place and annual income of family had a great bearing on motivation of girl students to join agricultural degree course. Similarly
Critical value (2tail 0.05) +/-0.27841
educational status of family, annual" income of family, motivation, social participation of father, and rating of agricultural degree course also have impact on aspiration of girl students after completion of their degree course.
REFERENCES
Mishra, A.K.; Salooja, M. K. and Sacheti, A. K. (1996). Para professional training to create 55 million farm jobs UNI AGRICULTURE SERVICE XXX (16) 327-9.
* Supe, S. V. (1969). Factors related to different degree of rationality in decision making among farmers. Ph.D. Thesis submitted to IARI, New Delhi.
* Original not seen.
Guj. J. Extn. Edu. VIII & IX 1997 & 1998
Impact of Soil Conservation Programme on Improved Farm Practices
J. D. SarkarI, K. K. Shrivastava2 and L. S. Bareth3
INTRODUCTION
The soil and water conservation approach helps to improve the productivity of both lands and crops. Location specific technology based on soil and water is playing a major role for sustainable food production in fanning. The soil conservation scheme was funding since last so many years, but there was no clear response to it from the side of the farmers. Most of the area and production of M. P. state is under rainfed conditions and very little area is under irrigation. Many of agricultural practices developed in areas of rainfed agriculture are concerned primarily with the conservation of soil and water. The present study has been undertaken with a view to evaluate the impact on farmers, who have adopted or not adopted the soil conservation programme in Katni block of Jabalpur district (M.P.)
OBJECTIVES
1. To identify the factors leading to the adoption and nonadoption of soil conservation programme.
2. To study the soil conservation programme on adoption of improved farm practices namely high yielding varieties of wheat and chemical fertilizers.
3. To find out the relationship between soil conservation practices with the personal attributes of the respondents.
METHODOLOGY
Katni block of Jabalpur district of M.P. state was purposively selected for the study. All the six villages where the soil conservation
programme was carried out were selected. A list of villages falling under the soil conservation programme was prepared and all the participants were listed. Among the participants in the programme, a random sample of 50 farmers was drawn. The interview schedule was also administered to the adopters and also
to an equal number of non-adopters of the
same universe to have a comparative picture of adopters and non-adopters of the soil
conservation programme. The data have been presented in frequency as well as percentage. Statistical analysis was done to test the association between personal and socio-economic variables with adoption of improved farm practices (Improved seed and chemical fertilizers), chi-square test was used. Independent vaiables were-Age (below 30 and above 30 years), Education (illiterate and
literate), size of land holding (small land holding and big holding) and income (upto Rs. 6000 and above Rs. 6000/year). Dependent variables
were high yielding varieties and chemical fertilizers (Nitrogen, phosphorus and potashic fertilizers).
1,2,3. Asstt. Prof. Deptt. of Agricultural Extension, College of Agriculture, IGKVV, Raipur-492 012 (M.P.)
74
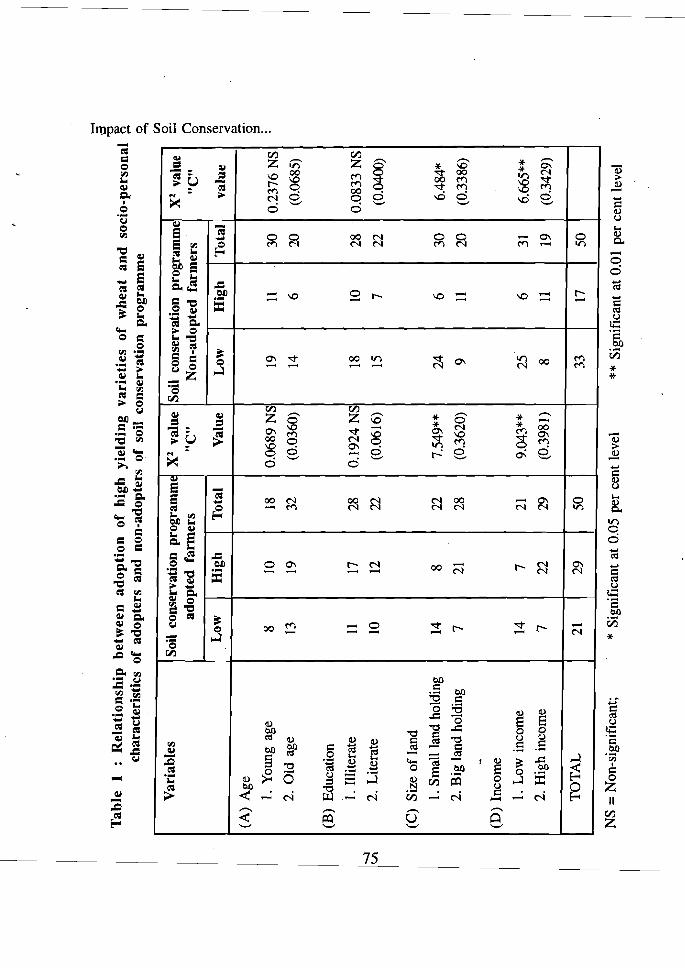
CI.l
...... ;g
Tab
le
1 :
Rel
atio
nsh
ip
bet
wee
n a
do
pti
on
o
f hi
gh y
ield
ing
var
ieti
es o
f w
hea
t an
d s
ocio
-per
sona
l ~
ch
arac
teri
stic
s of
ado
pter
s an
d no
n-ad
opte
rs o
f so
il co
nser
vati
on p
rogr
amm
e g,
9.V
aria
bles
So
il co
nser
vatio
n programm~
adop
ted
farm
ers
X2
valu
e "C
" So
il co
nser
vatio
n pr
ogra
mm
e N
on-a
dopt
ed f
arm
ers
X2 v
alue
"e
" va
lue
Low
H
igh
Tot
al
Val
ue
Low
H
igh
Tot
al
(A)
Age
1. Y
oung
age
8
10
18
0.06
89 N
S 19
11
30
0.
2376
NS
2. O
ld a
ge
(B)
Edu
catio
n
13
19
32
(0.0
360)
14
6
20
(0.0
685)
1. l
Uit
erat
e II
17
28
0.
1924
NS
18
10
28
0.08
33 N
S 2.
Lite
rate
(C)
Size
of
land
10
12
22
(0.0
616)
15
7
22
(0.0
400)
1. S
mal
l la
nd h
oldi
ng
14
8 22
7.
549*
* 24
6
30
6.48
4*
2. B
ig l
and
hold
ing
-(D
) In
com
e
7 21
28
(0
.362
0)
9 II
20
(0
.338
6)
1. L
ow i
ncom
e 14
7
21
9.04
3**
25
6 31
6.
665*
* 2.
Hig
h in
com
e 7
22
29
(0.3
981)
8
II
19
(0.3
429)
TO
TA
L
21
29
50
33
17
50
NS
= N
on-s
igni
fica
nt;
* Si
gnif
ican
t at
0.0
5 pe
r ce
nt l
evel
**
Sig
nifi
cant
at
0.01
per
cen
t le
vel
Impact of Soil Conservation ...
RESULTS AND DISCUSSION
Association between personal attributes and adoption of "high yielding varieties of wheat
The Table 1 reveals the association between the age of the farmers who have adopted the soil conservation programme and those who had not adopted the soil conservation programme with adoption of high yielding varieties of wheat. It is observed from the table that Chi-square was found to be 0.0692 in case of farmers who have adopted the soil conservation programme, while Chisquare value was found to be 0.238 in the case of farmers who have not adopted the soil conservation programme. In both the cases Chi-square value are non-significant which conclude that there is no association between age of the farmers who have adopted or notadopted the soil conservation programme with the adoption of wheat varieties. In case of education, X2 value was found to be 0.192 of farmers who have adopted the soil conser vation programme while Chi-square value was found to be 0.0833 in case of farmers who have not adopted the soil conservation programme. In both the cases values are nonsignificant.
The values of X2 in case of size of land holding with high yielding varieties of wheat are significantly associated in both the cases, which conclude that there is association between size of land holding of the farmers who have adopted or not adopted the soil conservation programme' with adoption of wheat.
In case of income, the value of Chisquare was found to be 9.043 who have
76
adopted the soil conservation programme, while 6.665 in the case of farmer who have not
. adopted the soil conservation programme. In both the cases values are highly significant hence there is association between income of the farmers who have adopted or not-adopted the soil conservation programme with the adoption of wheat.
Association between personal attributes and adoption of Nitrogenous fertilizers
The Table 2 reveals about the association between the personal characteristics of the farmers who have adopted the soil conservation programme and those who have not adopted the soil conservation programme with the adoption of nitrogenous fertilizer. It is observed from the contingency table that Chisquare value was found to be 0.4995 in case of farmers who have adopted the soil conservation programme, while X2 value was found to be 4.088 in the case of farmers who have not-adopted. the soil conservation programme. In both the cases Chi-square values were not significant at 0.05 level of probability.
In case of education, the X2 value 2.297 and 1.333 for the farmers who have adopted the soil conservation programme and who have not-adopted the soil conservation programme. In both the cases the Chi-square values were non-significant which conclude that there is no association between education of farmers who have adopted/not-adopted the soil conservation programme with the adoption of nitrogenous fertilizers.
The values of X2 in case of size of land holding with adoption of nitrogenous fertilizer for wheat crop were significantly associated
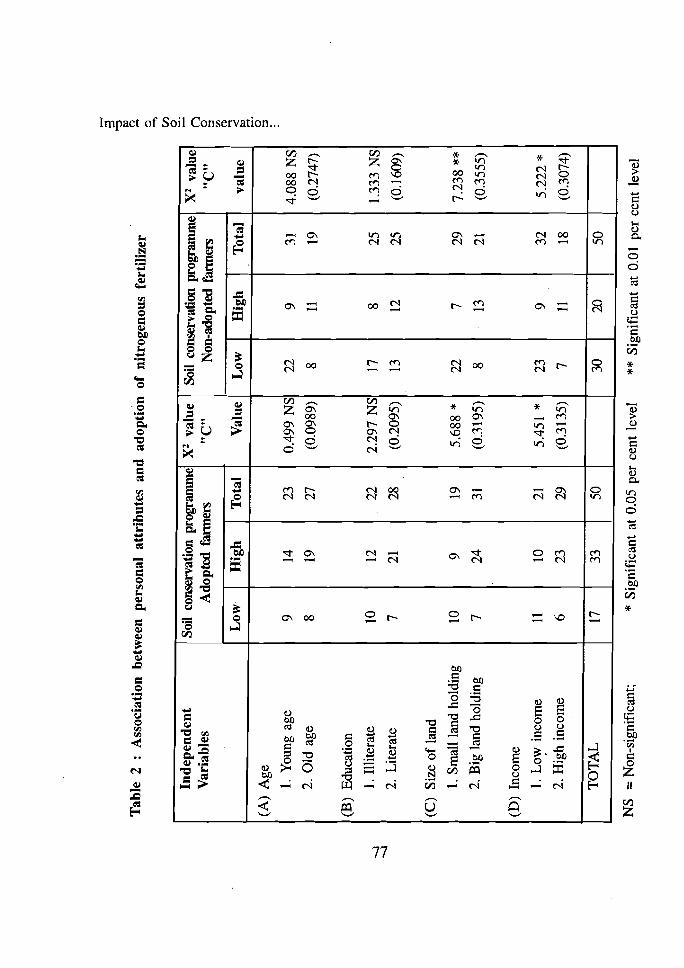
Tab
le 2
:
Ass
ocia
tion
be
twee
n p
erso
nal
att
rib
ute
s an
d
ado
pti
on
of
nit
rog
eno
us
fert
iliz
er
Ind
epen
den
t V
aria
bles
So
il co
nser
vati
on p
rogr
anun
e A
dopt
ed f
anne
rs
X2
val
ue
"c"
Soil
cons
erva
tion
prog
ranu
ne
Non
-ado
pted
fan
ners
X2
val
ue
"C"
val
ue
Low
H
igh
T
otal
V
alue
L
ow
H
igh
T
ota
l
(A)
Age
1. Y
oung
age
9
14
23
0.49
9 N
S
22
9 31
4.
088
NS
2. O
ld a
ge
(B)
Edu
cati
on
8 19
27
(0
.098
9)
8 11
19
(0
.274
7)
1. I
IIit
erat
e 10
12
22
2.
297
NS
17
8 25
1.
333
NS
2. L
iter
ate
(C)
Siz
e o
f la
nd
7 21
28
(0
.209
5)
13
12
25
(0.1
609)
1. S
mal
l la
nd h
oldi
ng
10
9 19
5.
688
* 22
7
29
7.23
8 **
2.
Big
lan
d ho
ldin
g
(D)
Inco
me
7 24
31
(0
.319
5)
8 13
21
(0
.355
5)
I. L
ow i
ncom
e 11
10
21
5.
451
* 23
9
32
5.22
2 *
2. H
igh
inco
me
6 23
29
(0
.313
5)
7 11
18
(0
.307
4)
TO
TA
L
17
33
50
30
20
50
NS
=
Non
-sig
nifi
cant
; *
Sig
nifi
cant
at
0.05
per
cen
t le
vel
** S
igni
fica
nt a
t 0.
01
per
cent
lev
el

Impact of Soil Conservation...
in both the cases, which conclude that there is association between size of land holding of the farmers who have adopted or not-adopted the soil conservation programme with the adoption of nitrogenous fertilizer.
In case of income, the value of Chisquare was found to be 5.451 who have adopted the soil conservation programme, while 5.222 in case of farmer who have not adopted the programme. In both the cases values were significant. Hence, there was association between income of farmers who have adoptedl not-adopted the soil conserveation programme with the adoption of nitrogen fertilizer.
Association between attributes and adoption of phosphatic fertilizer
The Table 3 reveals the association between the age of the farmers who have adopted the soil conservation programme and those who have not adopted the soil conservation programme with adoption of phosphatic fertilizer. The Chi-Square values were 0.9353 and 2.605 in case of adopters and non-adopters of soil conservation programme with age, respectively. This concludes that there is no association between age of the farmers who have adopted or notadopted the soil conservation programme with the adoption of phosphatic fertilizer.
In case of education, the Chi-square value was found to be 0.6432 for the adopters of the soil conservation programme while Chisquare value found to be 2.710 for nonadopters of soil conservation programme. In both the cases Chi-square values were not significant, indicating no association between the variables.
78
The value of Chi-square was found to be 3.679 in the case of farmers who have adopted the soil conservation programme, while Chi-square value was 4.919 in the case of farmers who have not-adopted the soil conservation programme with education. In both the cases the X2 values were not significant at 0.05 level of probability.
In case of income, the X2 value 6.254 for the adopters and 6.148 for non-adopters of soil conservation programmes lead to conclude that there is association between income of the farmers who have adopted or not-adopted the soil conservation programme with the use of phosphatic fertilizer.
Association between personal attributes of farmers and adoption of potashic fertilizer
The Table 4 reveals the association between the personal attributes of farmers who have adopted the soil conservation programme and those who have not adopted the soil conservation programme with adoption of potashic fertilizer. It is observed from the contingency table that personal attributes of the adopters of soil conservation programme as well as the non-adopters of the programme were not associated with the adoption of potashic fertilizer. Thus it can be concluded that there is no association between age, education, size of land holdings and income of the farmers who have adopted or not-adopted the soil conservation programme with the adoption of potashic fertilizer.

Tab
le 3
A
ssoc
iati
on b
etw
een
adop
tion
of
phos
phat
ic f
erti
lize
r an
d so
cio-
econ
omic
var
iabl
es
Ind
epen
den
t V
aria
bles
So
il co
nser
vati
on p
rogr
amm
e ad
opte
d fa
rmer
s X
2 va
lue
"C"
Soil
cons
erva
tion
pro
gram
me
Non
-ado
pted
far
mer
s X2
val
m
"C"
valu
eL
ow
Hig
h T
otal
V
alue
L
ow
Hig
h T
otal
(A)
Age
1. Y
oung
age
11
15
26
0.
935
NS
19
10
29
2.60
5 N
S 2.
Old
age
(B)
Edu
catio
n
7 17
24
(0
.135
2)
9 12
21
(0
.222
4)
1. I
llite
rate
10
14
24
10
.643
2 N
S 18
9
27
2.71
0 N
S 2.
Lit
erat
e
(C)
Size
of
land
8 18
26
(0
.112
6)
10
13
23
(0.2
267)
1. S
mal
l la
nd h
oldi
ng
10
9 19
3.
679
NS
19
8 27
4.
919
NS
2. B
ig l
and
hold
ing
(D)
Inco
me
8 23
31
(0
.261
7)
9 14
23
(0
.299
1)
1. L
ow i
ncom
e 11
9
20
6.25
4*
20
8 28
6.
148*
2.
Hig
h in
com
e 7
23
30
(0.3
333)
8
14
22
(0.3
303)
TO
TA
L
18
32
50
28
22
50
n o ::l en
C1> .., <: ~
o' ::l
NS
= N
on-s
igni
fica
nt;
* Si
gnif
ican
t at
0.0
5 pe
r ce
nt l
evel
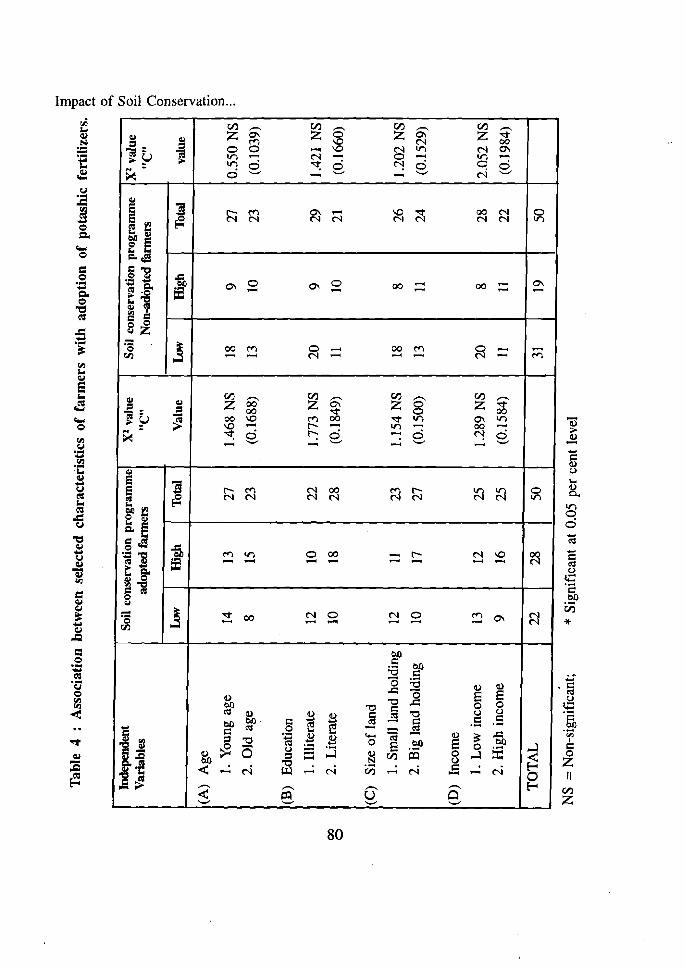
3 .....
Tab
le 4
: A
ssoc
iatio
n be
twee
n se
lect
ed c
hara
cter
isti
cs o
f fa
rmer
s w
ith a
dopt
ion
of p
otas
hic
fert
iliz
ers.
] .... o ....,
00
o
Inde
pend
ent
Var
iabl
es
Soil
cons
erva
tion
pro
gram
me
adop
ted
fann
ers
X2
valu
e "C
" So
il co
nser
vati
on p
rogr
amm
e N
on-a
dopt
ed f
anne
rs
X2
valu
e "C
"
valu
elA
M'
Hig
h T
otal
V
alue
l.<
M'
Hig
h T
otal
(A)
Ag
e
1. Y
oung
ag
e 14
13
27
1.
468
NS
18
9
27
0.5
50
NS
2.
Old
ag
e
(B)
Edu
cati
on
8 15
23
(0
.168
8)
13
10
23
(0.1
039)
1. I
llit
erat
e 12
10
22
1.
773
NS
20
9
29
1.42
1 N
S
2. L
iter
ate
(C)
Siz
e o
f la
nd
10
18
28
(0.1
849)
11
10
21
(0
.166
0)
1. S
mal
l la
nd h
oldi
ng
12
11
23
1.15
4 N
S
18
8 26
1.
202
NS
2.
Big
lan
d ho
ldin
g
(D)
Inco
me
10
17
27
(0.1
500)
13
11
24
(0
.152
9)
1. L
ow
inc
ome
13
12
25
1.28
9 N
S
20
8 28
2.
052
NS
2.
Hig
h in
com
e 9
16
25
(0.1
584)
II
11
22
(0
.198
4)
TO
TA
L
22
28
50
3]
19
50
Cf.l ~
n o :s '" ~ <: ~
o' :s
. N
S =
Non
-sig
nifi
cant
; *
Sig
nifi
cant
at
0.05
per
cen
t le
vel
Impact of Soil Conservation...
CONCLUSION
From the above findings it could be concluded that
1. High yielding varieties of wheat were adopted by the farmers irrespective of adopters or non-adopters of soil conservation programme.
2. The high yielding varieties of wheat, use of nitrogenous fertilizer depended mainly on size of land holding and income, age and education had no association with the adopters and non-adopters of soil conservation programme.
3. The independent variable, income showed singificant association with both adopters and non-adopters of soil conservation programme for the use phosphatic fertilizers, while age and education showed no relationship.
4. The independent variables as age, education, size of land holding and income
have no association with the use of potashic fertilizer, irrespective of the participants or non-participants of the soil conservation programme.
IMPLICATION
The results of research indicate that both categories of farmers adopted high yielding varieties hence the efforts should be made to make aware the farmers regarding its yielding potentiality and the importance of soil conservation programme through various extension methods, the income had significant association for adoption of soil conservation programme, hence extension agency should implement employment generating programme at village level. The demonstration should be conducted at farmers' field regarding the use of high yielding varieties alongwith chemical fertilizers (Nitrogen, phosphorus and potashic). The field visit of farmers on Research Station should be conducted, so they can see and be convinced with new technology.
REFERNCES
Ingle, P. O. and Wayazada, M. R. (1989). Adoption of Agriculutre Technology in Rainfed Farming Project. Maha. Jr. of Extn. Edu., 8 : 189-192.
Prasad, M.S.; T. Visunmurthys and Chandrasekhar, K. (1990). An evaluation of Training Programme on soil and water
conservation resources in dry land areas. Indian Jr. of Extn. Edu., 26 (3&4) : 64-66.
Tyage, B. D. and Tyagi, A. K. (1988). Variable influencing Technological gap in sugarcane cuitivation. Indian Jr. Extn. Edu., 24(3&4) : 82-84.
81

Guj. J. Extn. Edu. VIII & IX 1997 & 1998
Constraints Experienced by the Beneficiaries in Adption of Watershed Management Technology
J. B. Patelt, R. S. Vekaria2 and G. M. PateP
INTRODUCTION
Water, soil and vegetation are the most vital resources for agriculture. Agriculture productivity depends on how efficiently these resorces are conserved and managed on agricultural land. The rainfed agriculture is a mainstay of the global agrarian economy as it occupies about 84 percent of the total cultivated area in the world. The importance of rainfed farming in Indian economy is well known. In our country, out of 329 million ha. of total area, 143 million ha. area is under cultivation. Out of this cultivated area 108 million ha. area is of land is under rainfed agriculture (Khaper and Rao, 1987).
The Gujarat State is predominently the State of dryland agriculture. Out of 96 lakh ha. cultivated area, 88 percent is drought prone receiving an annual rainfall less than 1000 mm or less. (Anonymous, 1984). The technology developed for dryland agriculture has proved beneficial but has not made much impact on agricultural production even at present level of improved technology This indicates that these technologies still have some constraints. For understanding the constraints faced by the beneficiaries in adoption of Watershed Management Technology, this study was under taken.
OBJECTIVES
To identify the constraints faced by beneficiaries in adoption of Watershed Management Technology and their suggestions to evercome the constraints were the objectives of this study.
METHODOLOGY
The study was conducted In
Panchmahals district. Four villeges of Zalod Subdivision, where the National Watershed Development Project was implemented, were selected. The study consisted of two categories namely beneficiaries and non-beneficiaries. Out of four selected villages 15 beneficiaries and 15 non-beneficiaries were selected randomly from each village. making a total sample of 120 farmers. The data were collected from the respondents through well structured pretested interview schedule for the purpose.
RESULTS AND DISCUSSION
The major constraints experienced by beneficiaries and non beneficiaries were noted. The responses were compiled and percentage were calculated. The data in this regard are presented in Table 1.
The data presented in Table 1 reveal that 'Lack of finance", 'Lack of Training, Lack of
I. P. G. Student, N.M.C.A. GAU, Navsari. 2. Asso. Professor, N.M.C.A., GAU, Navsari 3. Asstt. Ext. Educationist, E.E.I., GAU, Anand.
82
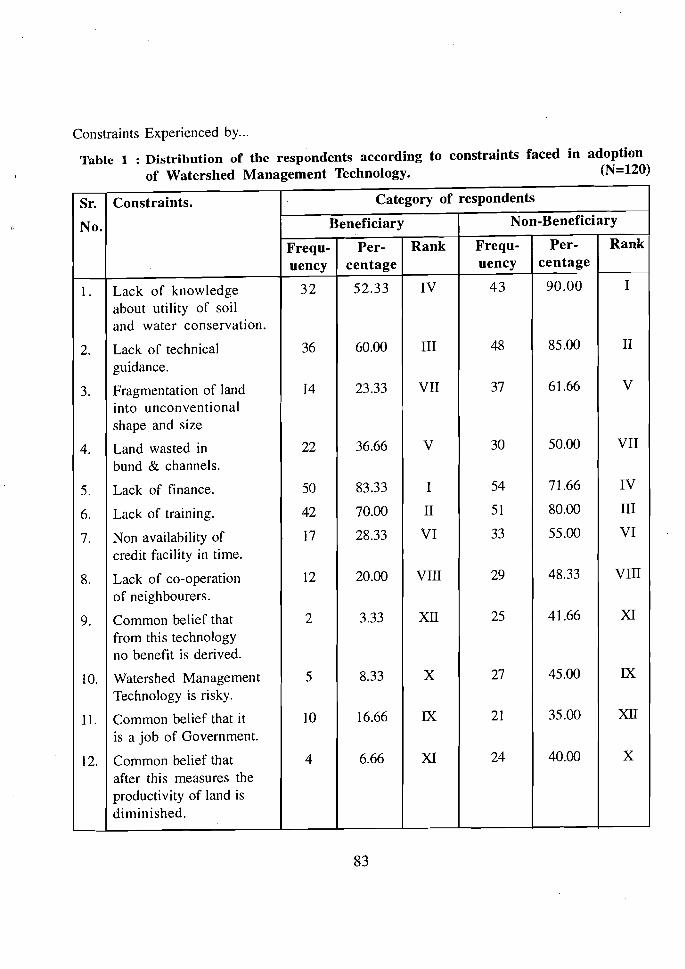
Constraints Experienced by...
Table 1 : Distribution of the respondents according to constraints faced in adoption of Watershed Management Technology. (N=120)
Category of respondentsConstraints.
Beneficiary
Sr. Non-BeneficiaryNo.
Per- RankFrequcentage
RankPer-Frequuency
I centageuency
90.0043IV52.3332
about utility of soil and water conservation.
III
Lack of knowledgel.
II85.004860.00
guidance.
VII
36Lack of technical2.
V61.663723.33
into unconventional shape. and size
V
14Fragmentation of land3.
VII50.003036.66
bund & channels.
I
22Land wasted in 4.
IV71.665483.3350Lack of finance.5. III80.0051II70.0042Lack of training.6. VI55.0033VI28.3317
credit facility in time.
VIII
Non availability of7.
VIII48.332920.00
of neighbourers.
12Lack of co-operation8.
XI41.6625XII3.332
from this technology no benefit is derived.
Common belief that9.
IX45.0027X8.335 Technology is risky. Watershed Management10.
XII35.0021IX16.66
is a job of Government.
XI
10Common belief that it II.
X40.00246.66
after this measures the productivity of land is diminished.
4Common belief that 12.
83
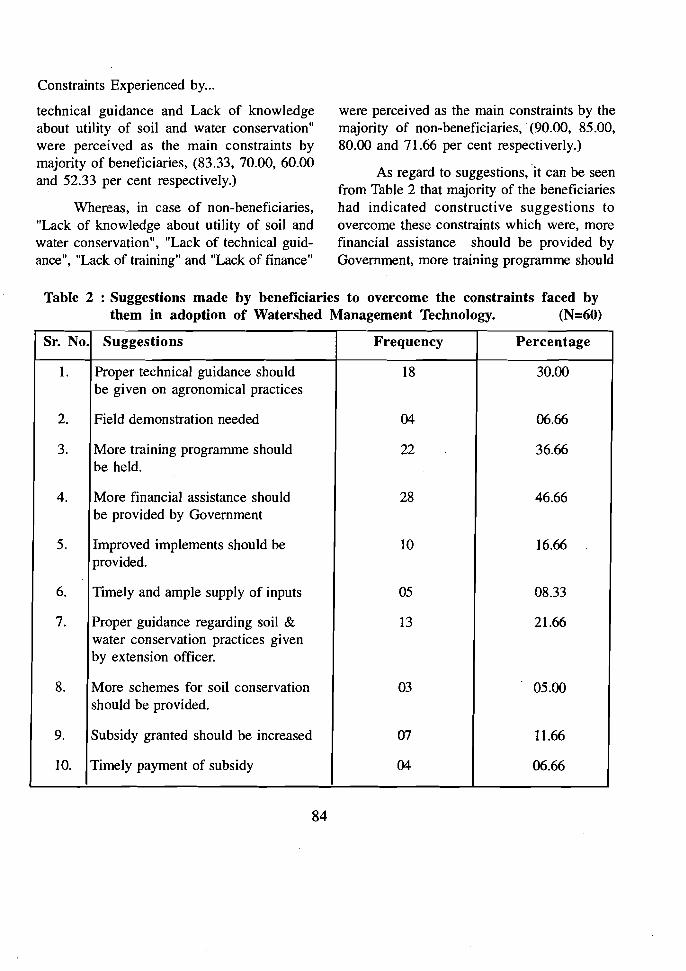
Constraints Experienced by...
technical guidance and Lack of knowledge about utility of soil and water conservation" were perceived as the main constraints by majority of beneficiaries, (83.33, 70.00, 60.00 and 52.33 per cent respectively.)
Whereas, in case of non-beneficiaries, "Lack of knowledge about utility of soil and water conservation", "Lack of technical guidance", "Lack of training" and "Lack of finance"
were perceived as the main constraints by the majority of non-beneficiaries, (90.00, 85.00, 80.00 and 71.66 per cent respectiverly.)
As regard to suggestions,it can be seen from Table 2 that majority of the beneficiaries had indicated constructive suggestions to overcome these constraints which were, more financial assistance should be provided by Government, more training programme should
Table 2 : Suggestions made by beneficiaries to overcome the constraints faced by them in adoption of Watershed Management Technology. (N=60)
Sr. No. Suggestions Frequency Percentage
1. Proper technical guidance should be given on agronomical practices
18 30.00
2. Field demonstration needed 04 06.66
3. More training programme should be held.
22 36.66
4. More financial assistance should be provided by Government
28 46.66
5. Improved implements should be provided.
10 16.66
6. Timely and ample supply of inputs 05 08.33
7. Proper guidance regarding soil & water conservation practices given by extension officer.
13 21.66
8. More schemes for soil conservation should be provided.
03 05.00
9. Subsidy granted should be increased 07 11.66
10. Timely payment of subsidy 04 06.66
84
Constraints Experienced by...
be imparted and proper technical guidance should be given on agronomical practices (46.66, 36.66 and 30.00 per cent respectively.)
CONCLUSION
The major constraints faced by beneficiaries and non-beneficiaries were lack of finance, lack of training, lack of knowledge about utility of soil and water conservation practices.
The most important suggestions offered by the beneficiaries were more financial assistan~e provided by government and more training programme should be held.
IMPLICATION
There is need to provide training and give technical knowledge about Watershed Managemant Technology and provide adequate financial assistance to cover large area under this treatment.
REFERNCES
Anonymous (1984) : "A general guideline on Watershed Development Programme for Rainfed Agriculture, (WDP) Govt. of Karnataka.
Khaper, S. D. & Rao, B. H. (1987 : "Role of Agricultural Engineering in high productivity of Dry land Agriculture". Agricultural Engineering Today,ll (i) 71-79
.:. He who defines his conduct by ethics imprisons his song-bird in a cage.
-KAHLIL GffiRAN
.:. The need ofexercise is a modern superstition, invented by people who ate too much and had nothing to think about. Athletics don't make any body either longlived or useful.
-GEORGE SANTAYANA
.:. Cooperation is thorough conviction that nobody can get there unless everybody gats there.
85
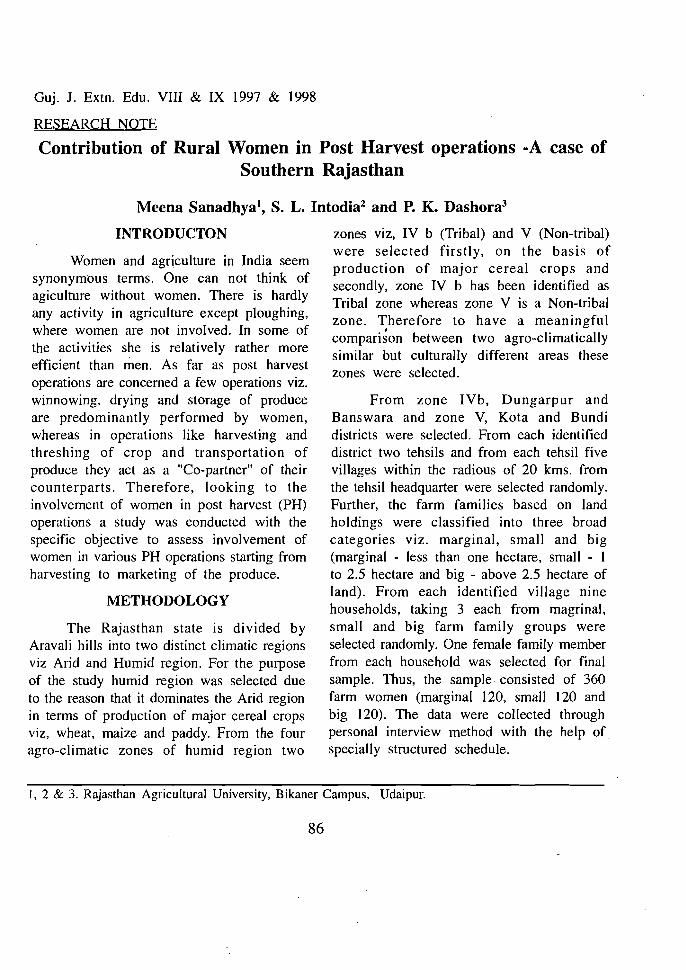
Guj. J. Extn. Edu. VIII & IX 1997 & 1998
RESEARCH NOTE
Contribution of Rural Women in Post Harvest operations -A case of Southern Rajasthan
Meena Sanadhya1, S. L. Intodia2 and P. K. Dashora3
INTRODUCTON
Women and agriculture in India seem synonymous terms. One can not think of agiculture without women. There is hardly any activity in agriculture except ploughing, where women are not involved. In some of the activities she is relatively rather more efficient than men. As far as post harvest operations are concerned a few operations viz. winnowing, drying and storage of produce are predominantly performed by women, whereas in operations like harvesting and threshing of crop and transportation of produce they act as a "Co-partner" of their counterparts. Therefore, looking to the involvement of women in post harvest (PH) operations a study was conducted with the specific objective to assess involvement of women in various PH operations starting from harvesting to marketing of the produce.
METHODOLOGY
The Rajasthan state is divided by Aravali hills into two distinct climatic regions viz Arid and Humid region. For the purpose of the study humid region was selected due to the reason that it dominates the Arid region in terms of production of major cereal crops viz, wheat, maize and paddy. From the four agro-c1imatic zones of humid region two
zones viz, IV b (Tribal) and V (Non-tribal) were selected firstly, on the basis of production of major cereal crops and secondly, zone IV b has been identified as Tribal zone whereas zone V is a Non-tribal zone. Therefore to have a meaningful compari~on between two agro-c1imatically similar but culturally different areas these zones were selected.
From zone IVb, Dungarpur and Banswara and zone V, Kota and Bundi districts were selected. From each identified district two tehsils and from each tehsil five villages within the radious of 20 kms. from the tehsil headquarter were selected randomly. Further, the farm families based on land holdings were classified into three broad categories viz. marginal, small and big (marginal - less than one hectare, small - I to 2.5 hectare and big - above 2.5 hectare of land). From each identified village nine households, taking 3 each from magrinal, small and big farm family groups were selected randomly. One female family member from each household was selected for final sample. Thus, the sample. consisted of 360 farm women (marginal 120, small 120 and big 120). The data were collected through personal interview method with the help of. specially structured schedule.
I, 2 & 3. Rajasthan Agricultural University, Bikaner Campus, Udaipur.
86
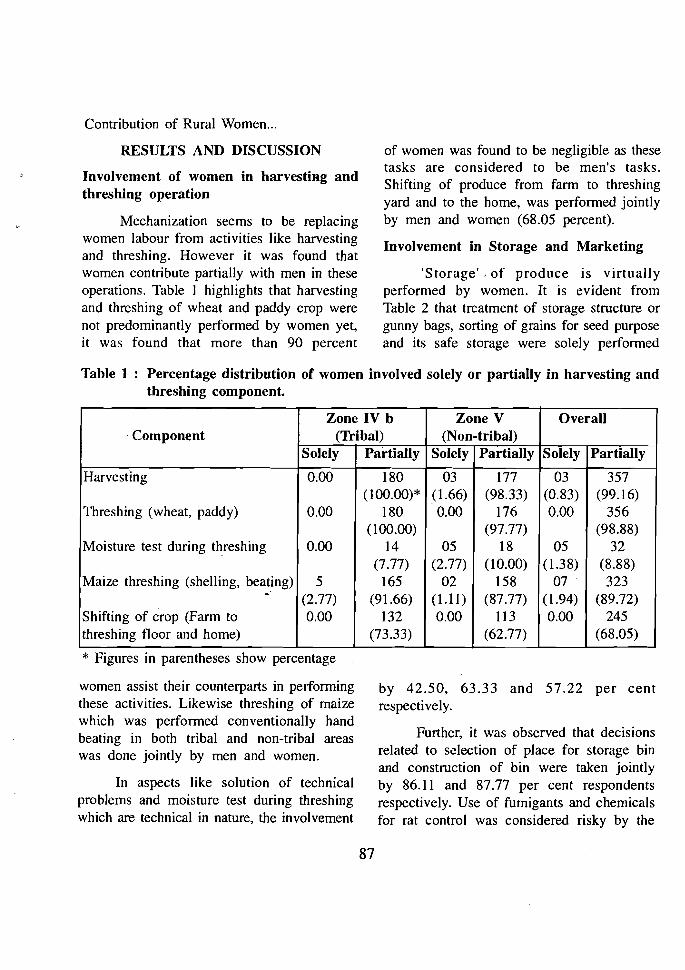
Contribution of Rural Women...
RESULTS AND DISCUSSION
Involvement of women in harvestiRg and threshing operation
Mechanization seems to be replacing women labour from activities like harvesting and threshing. However it was found that women contribute partially with men in these operations. Table I highlights that harvesting and threshing of wheat and paddy crop were not predominantly perfonned by women yet, it was found that more than 90 percent
of women was found to be negligible as these tasks are considered to be men's tasks. Shifting of produce from fann to threshing yard and to the home, was perfonned jointly by men and women (68.05 percent).
Involvement in Storage and Marketing
'Storage' . of produce is virtually performed by women. It is evident from Table 2 that treatment of storage structure or gunny bags, sorting of grains for seed purpose and its safe storage were solely perfonned
Table 1 : Percentage distribution of women involved solely or partially in harvesting and threshing component.
Zone IV b Zone V Overall .Component (Tribal) (Non-tribal)
Solely Partially Solely Partially Solely Partially
Harvesting 0.00 180 03 177 03 357 (100.00)* (1.66) (98.33) (0.83) (99.16)
Threshing (wheat, paddy) 0.00 180 0.00 176 0.00 356 (100.00) (97.77) (98.88)
Moisture test during threshing 0.00 14 05 18 05 32 (7.77) (2.77) (10.00) (1.38) (8.88)
Maize threshing (shelling, beating) . 5 (2.77)
165 (91.66)
02 (1.11)
158 (87.77)
07 (1.94)
323 (89.72)
Shifting of crop (Fann to 0.00 132 0.00 113 0.00 245 threshing floor and home) (73.33) (62.77) (68.05)
* Figures in parentheses show percentage
women assist their counterparts in perfonning these activities. Likewise threshing of maize which was perfonned conventionally hand beating in both tribal and non-tribal areas was done jointly by men and women.
In aspects like solution of technical problems and moisture test during threshing which are technical in nature, the involvement
by 42.50, 63.33 and 57.22 per cent respectively.
Further, it was observed that decisions related to selection of place for storage bin and construction of bin were taken jointly by 86.11 and 87.77 per cent respondents respectively. Use of fumigants and chemicals for rat control was considered risky by the
87
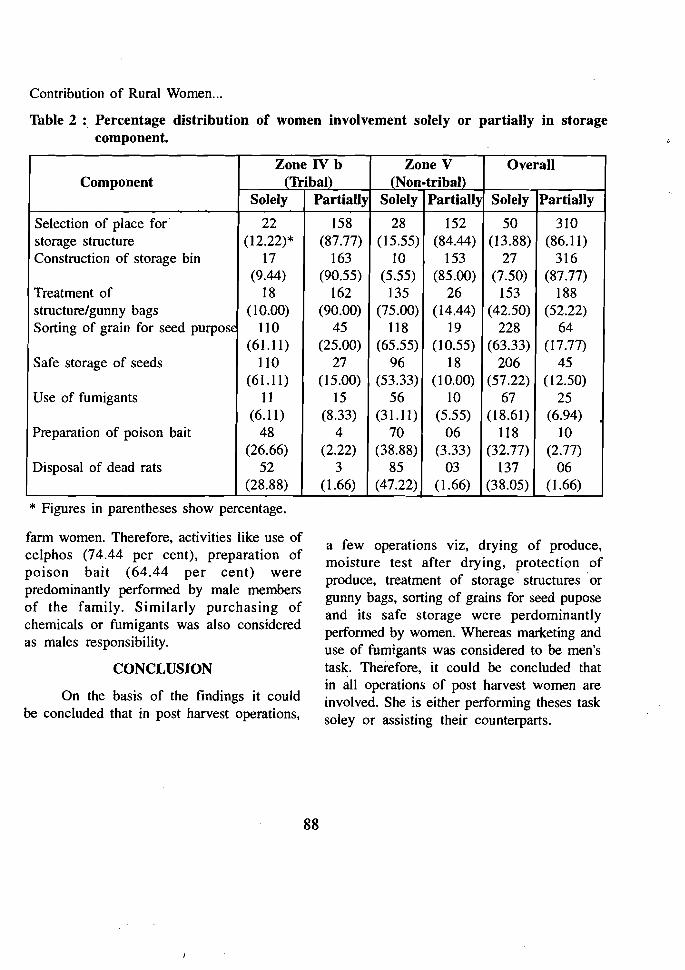
Contribution of Rural Women...
Table 2 : Percentage distribution of women involvement solely or partially in storage component.
Zone IV b Zone V Overall (Non-tribal)Component (Tribal)
Solely Partially Solely Partially Solely Partially
Selection of place for· 22 158 28 152 50 310 (87.77) (15.55) (84.44)(12.22)* (13.88) (86.11)storage structure
Construction of storage bin 17 163 15310 27 316 (9.44) (90.55) (5.55) (7.50)(85.00) (87.77)
Treatment of 18 162 135 26 153 188 (10.00) (90.00) (75.00) (14.44) (42.50)structure/gunny bags (52.22)
Sorting of grain for seed purpose 110 45 19 64118 228 (61.11) (25.00) (65.55) (10.55) (63.33) (17.77)
Safe storage of seeds 27 96 18 45110 206 (6l.I1) (53.33)(15.00) (10.00) (57.22) (12.50)
Use of fumigants 15 5611 IO 67 25 (6.11) (8.33) (31.11) (5.55) (18.61) (6.94)
Preparation of poison bait 48 4 70 06 118 10 (26.66) (2.22) (38.88) (3.33) (32.77) (2.77)
Disposal of dead rats 52 3 85 03 137 06 (28.88) (1.66) (47.22) (1.66) (1.66)(38.05)
* Figures in parentheses show percentage.
farm women. Therefore, activities like use of celphos (74.44 per cent), preparation of poison bait (64.44 per cent) were predominantly performed by male members of the family. Similarly purchasing of chemicals or fumigants was also considered as males responsibility.
CONCLUSION
On the basis of the findings it could be concluded that in post harvest operations,
a few operations viz, drying of produce, moisture test after drying, protection of produce, treatment of storage· structures .or gunny bags, sorting of grains for seed pupose and its safe storage were perdominantly performed by women. Whereas marketing and use of fumigants was considered to be men's task. Therefore, it could be concluded that in all. operations of post harvest women are involved. She is either performing theses task soley or assisting their counterparts.
88
Guj. J. Extn. Edu. VIII & IX 1997 & 1998
RESEARCH NOTE
Home Science Education and Development of Human Resources Among Women.
S. Ahlawat1 and G. GoyaP
INTRODUCTION
To what extent course curriculum of Home Science colleges under SAUs is adequate for achieveing their overall as well as areawise objectives of developing knowledge and skill among students and to what extent beneficiaries of Home Science Education find this Home Science knowledge afld skill applicable in their day to day life is still unknown.
To fulfil this research gap in the area of Home Science, the present study was under taken with the following· objectives.
OBJECTIVES
I. To determine the opinion of H. Sc. teachers and graduating students towards adequacy of B. Sc. Home Science course curriculum for achieving its overall and areawise objectives.
2. To seek the opinion of H. Sc. teachers and graduating students towards applicability of Home Scicence knowledge and skill.
METHODOLOGY
The study was conducted in five Home Science colleges of four selected State Agricultural University of Northern India. All
the Deans, Heads of Department, teachers and the graduating students during the academic year of 1996-97 were treated as the respondents of the study. As many as 358 (119 teachers and 239 students) were respondents of the study. Data were collected through questionnaire. Mean scores and ranks were calculated to analyse the opinions of teachers and students. Rank co-relation was used to find out the interdependence between the ranks assigned by the teachers and graduating students to the adequacy and applicability of course curriculum of different areas. Paired It' test was applied to determine significance of difference between mean scores assigned by the Home Science teachers and graduating students to the adequacy and applicability of course curriculum of different areas..
RESULTS AND DISCUSSION
Adequacy· of B. Sc. Home Science course curriculum for achieving its overall objectives:
The mean scores given in Table 1 indicate that H.Sc. course curriculum was perceived as partially adequate by the teachers as well as the students for achieving the overall objectives of B. Sc. Home Science programme.
1. Asso. Prof. H.Sc. Ext. Edu., ASPEE College of Home Science, GAU., S.K. Nagar. 2. Professor, H.Sc. Ext. Edu., College of Home Science PAU, Ludhiana
89

Home Science Education...
Objective wise ranks assigned by the Home science teachers revealed that B. Sc. (H.Sc.) course curriculum was more adequate "to enable students to use family resources judiciously", "To use latest household technology for better family living," and" to manage home successfully."
The ranks assigned by graduating students indicated that B. Sc. (H.Sc.) course curriculum was more adequate "to enable students to manage home successfully", "to prepare students for successful family living" and "to be wise consumers". Data given in Table I also reveal that the teachers as well the students perceivedB. Sc. Home Science course curriculum less adequate to prepare students for emploment and to develop leadership qualities among students. Teachers also perceived curriculum as less adequate "to acquaint students about contemporary problems of society. and ways of solving the contemporary problems intelligently". Students also perceived B. Sc. (H. Sc.) curriculum as less adequate for providing them knowledge about their legal rights." Rank correlation value (r = 0.85**) revealed that there was significantly high co-relation between ranks assigned by H. Sc.teachers and the students. A significant difference between the mean scores of teachers and the students was indicated by the calculated "t" value given in Table 1 i.e. 7.29**:
Area wise adequacy of Home Science course curriculum as expressed by the respondents.
A look at the data given in Table 2 clearly indicates that the teachers as well as the students perceived course curriculum of all areas as partially adequate.
90
Comparison of overall means along with ranks of knowledge and skill showed that teachers as well as graduating students perceived course curriculum of Foods and Nutrition more adequate than other areas for developing knowledge followed by course curriculum of Child Development.
The teachner as well as the students perceived course curriculum of Basic Sciences as least adequate for developing knowledge. From the overall mean score of skill and their ranks it is evident that teachers as well the students perceived course curriculum of Home Scince education and Extension more adequate for developing skill followed by course curriculum of Foods and Nutrition. Teachers perceived course curriculum of agriculture as least adequate for developing skill where as students perceived course curriculum of Basic sciences as least adequate for developing skill.
Rank correlation to test the correlation between ranks of the teachers and the students on knowledge as well as on skill revealed a high agreement between their ranks as evident from the 'r' values given in Table 2.
The application of t-test revealed significant difference between the overall means of the teachers and the students for both knowledge as well as for skill. Overall lower mean scores of students for knowledge and skill in each area (except in agriculture for skill) implies that the students reflected lesser satisfaction with areawise adequacy of B. Sc. (H.Sc.) curriculum than teacher for developing knowledge as well as skill.

Home Science Education...
Table 1 : Adequacy of B. Sc. (H. Sc.) course curriculum for achieving its overall objectives as expressed by the respondents.
Sr. No.
Overall objectives of H.Sc. programme
;
H. Sc. Teachers (n=119) Students (n=239)
Mean ,Score
Rank Mean Score
Rank
B.Sc., (H.Sc.) Curriculum I. Develops overall personality of students 2.76 8 2.53 8
2. Provides students with opportunities for satisfying their interests
2.67 9 2.28 12
3. Prepares students for employment 2.24 15 2.15 15
4. Develops desired values and appreciation among students
2.66 10 2.36 11
5. Empowers students by providing knowledge about their legal rights
2.55 12 2.27 13
6. Enables students to manage home successfully
2.91 3 2.81 1.5
7. Perpares students for successful family living
2.86 4.5 2.81 1.5
8. Enables students to use family resources judiciously
2.92 1.5 2.71 5
9. Enables students to use latest thouse hold technology for better family living
2.92 1.5 2.61 6.5
10. Prepares students for diversified training opportunities for use in future day to day life
2.62 11 2.40 9
11. Prepares students to be wise consumers 2.86 4.5 2.77 3
12. Acquaints students with different problems of contemporary society and ways of solving problems intelligently
2.48 13 2.39 10
13. Develops leadership qualities among students
2.43 14 2.20 14
14. Enables students to build up healthy relationship within and outside thefamily'
2.83 6 2.61 6.5
15. Provides knowledge about welfare/ development activities for vulnerable groups (women, children and aged)
2.82 7 2.73 4
I I I I '
I ** significant at 0.01 per cent level.
91

::c:
o a (b
In
(") ~.
::;,
(")
(b
Tab
le 2
:
Are
a w
ise
adeq
uacy
of
Hom
e S
cien
ce c
ours
e cu
rric
ulum
exp
eres
sed
by
the
resp
onde
nts.
t'I1
go Sr
. A
rea
of B
.Sc.
(H
.Sc.
) O
vera
ll m
eans
of
Tea
cher
s(n=
119
Ove
rall
mea
ns o
f S
tude
nts
(n=
239)
N
o.
cour
se c
urri
culu
m
Kno
wle
dgf
Ran
k
Ski
ll
Ran
k K
now
ledg
e R
ank
Ski
ll
Ran
k
1.
Chi
ld D
evel
opm
ent
(n=2
1)
2.87
2
2.61
3.
5 2.
58
2 2.
34
5
2.
Clo
thin
g an
d T
extil
e (n
=21)
2.
79
3 2.
61
3.5
2.49
4
2.37
3
3.
Food
s an
d N
utri
tion
(n=3
6)
2.92
1
2.68
2
2.72
1
2.56
2
4.
Hom
e M
anag
emen
nt (
n=24
) 2.
71
5 2.
60
5 2.
53
3 2.
35
4
5.
H.S
c. E
xtn.
Edu
catio
n (n
=17)
2.
73
4 2.
69
1 2.
42
5 2.
58
1
6.
Bas
ic s
cice
nce
(n=3
7)
2.34
8
2.23
6
2.i5
8
2.14
7
7.
Hum
aniti
es (
n=21
) 2.
62
6 -
-2.
17
7 -
-8.
A
gric
ultu
re (
n=57
) 2.
47
7 2.
20
7 2.
19
6 2.
24
6
* S
igni
fica
nt a
t 0.
05 p
er c
ent
leve
l L
-t
= 8
.81
**
I
** S
igni
fica
nt a
t 0.
01 p
er c
ent
leve
l t
= 3
.:;' I"
,
r =
0.9
0**
r=O~
(") ~
.... o' ::;,
\0
N
Not
e :
n un
?er
each
are
a re
pres
ents
num
ber
of te
ache
r re
spon
dent
s

Home Science Education...
Table 3 : Applicability of Home Science knowledge and skiU as expressed by H.Sc. Teachers and graduating students
Home Science teachers StudentsSr. Areas of H.Sc. curriculum (n=239)No. (n=119)
Overall means RankOverall means Rank
Child Development 2.19I. 2.35 3 3 2. Clothing and Textile 2.08 4 2.11 4 3. Food and Nutrition 12.40 2 2.32 4. Home Management 2.292.56 1 2
Home Science Extn. Education 5. 1.94 2.045 5 6. Agriculture & Animal Science 1.64 6 1.83 6
I I I r = 0.94
NS = Non significant ** = Significant at O.Olper cent level
Applicability of H. Sc~ knowledge and skill. Highly significant correlation was found between the ranks of the teachers and theFrom the data given in Table 3, it is students on 1 percent level of significance.evident that the teachers expressed maximum No significant difference between the overall applicability of knowledge and skill of Home mean scores of teachers and the studentsManagement followed by Foods and indicated that statistically also there was noNutrition. Teachers as well as the students significant difference between the perceptions expressed lowest applicability of knowledge of the teachers as well as the students. and skill of Agricultural and Animal
Husbandry areas. Among the core areas of CONCLUSION Home Science, teachers as well as graduating
From the findings of the study it isstudents expressed least applicability of concluded that the students perceived Home knowledge and skill of Home Science Science course curriculum less adequate than Extension Education. Urban background of teachers for achieving over all as well asmajority of respondents and no immediate area wise objectives of developing knl;)wledge applicability of H.Sc.Extension Education and skill. The students perceived lessknowledge and skill in day to day life may applicability of course curriculm of Childbe the reasons of opinion by respondents as Development, Foods and Nuttrition and Home least applicability of Agriculture and H. Sc. Management areas in comparision of H.Sc.Extension Education areas. teachers.
93

Home Science Education...
RECOMMENDATIONS
Since Home Science programme in SAUs is said to be a professional educational programme, it is imperative to strengthen its curriculum by making it more practical oriented for developing skill and more
profession oriented by adding courses' related to entrepreneurship development so that H.Sc. graduates can be enabled to enter into highly competitive job market. The teaching of courses in Basic sciences, Humanities and in Agricultural Sciences must be deviated from theoretical to applied teaching.
If you DON'T LIKE your work,
You will need three times the energy
To force yourself to work
To resist the force
And finally to work.
If you LIKE your work,
Your work no more
For work, when like it
Is work no longer
But sheer enjoyment.
If you LOVE your work
Your desire to do it will
be like wind to propel your
ship with much less fuel...
If you ENJOY your work
.you will work and work
without counting the hours
and you will reap and enjoy
more earnings as well
94
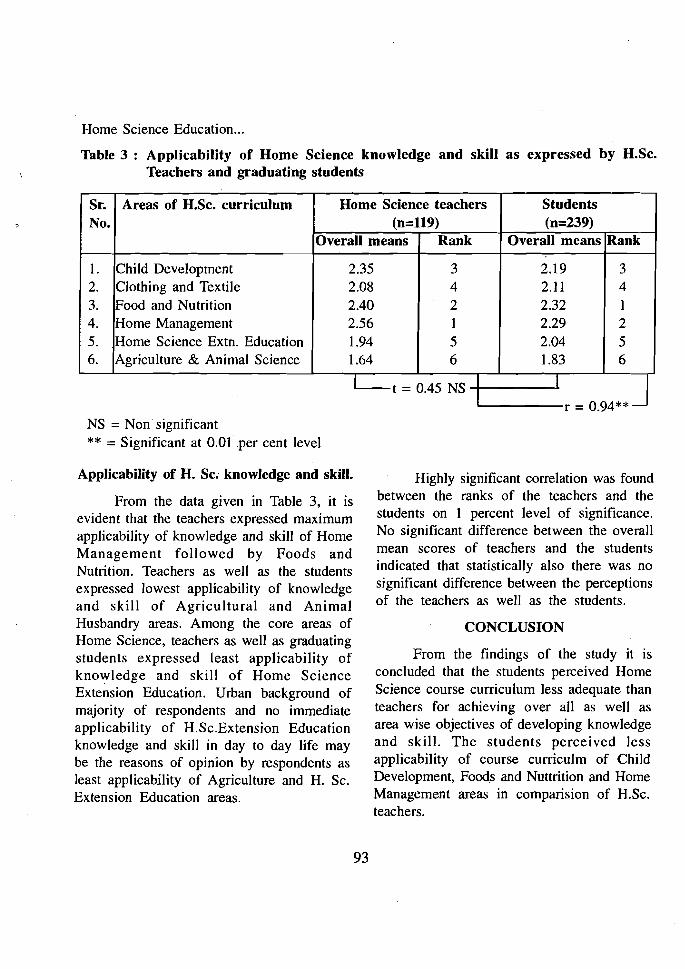
Home Science Education...
Table 3 : Applicability of Home Science knowledge and skill as expressed by H.Sc. Teachers and graduating students
Home Science teachers StudentsSr. Areas of H.Sc. curriculum (n=239)(n=119)No.
Rank Overall means RankOverall means
1. Child Development 2.35 3 2.19 3 Clothing and Textile 42. 2.08 4 2.11
3. Food and Nutrition 2.40 2 2.32 1 4. Home Management 2.56 1 2.29 2 5. Home Science Extn. Education 1.94 2.045 5 6. Agriculture & Animal Science 1.64 1.83 66
I I I r = 0.94
NS = Non significant ** = Significant at 0.01 .per cent level
Applicability of H. Sc~ knowledge and skill. Highly significant correlation was found between the ranks of the teachers and theFrom the data given in Table 3, it is students on I percent level of significance.evident that the teachers expressed maximum No significant difference between the overall applicability of knowledge and skill of Home mean scores of teachers and the studentsManagement followed by Foods and indicated that statistically also there was noNutrition. Teachers as well as the students significant difference between the perceptions expressed lowest applicability of knowledge of the teachers as well as the students. and skill of Agricultural and Animal
Husbandry areas. Among the core areas of CONCLUSION Home Science, teachers as well as graduating
From the findings of the study it isstudents expressed least applicability of concluded that the students perceived Home knowledge and skill of Home Science Science course curriculum less adequate than Extension Education. Urban background of teachers for achieving over all as well asmajority of respondents and no immediate area wise objectives of developing knowledge applicability of H.Sc.Extension Education and skill. The students perceived lessknowledge and skill in day to day life may applicability of course curriculm of Childbe the reasons of opinion by respondents as Development, Foods and Nuttrition and Home least applicability of Agriculture and H. Sc. Management areas in comparision of H.Sc.Extension Education areas. teachers.
93

Home Science Education...
RECOMMENDATIONS
Since Home Science programme in SAUs is said to be a professional educational programme, it is imperative to strengthen its curriculum by making it more practical oriented for developing skill and more
profession oriented by adding courses' related to entrepreneurship development so that H.Sc. graduates can be enabled to enter into highly competitive job market. The teaching of courses in Basic sciences, Humanities and in Agricultural Sciences must be deviated from theoretical to applied teaching.
If you DON'T LIKE your work,
You will need three times the energy
To force yourself to work
To resist the force
And finally to work.
If you LIKE your work,
Your work no more
For work, when like it
Is work no longer
But sheer enjoyment.
If you LOVE your work
Your desire to do it will
be like wind to propel your
ship with much less fuel...
If you ENJOY your work
you will work and work
without counting the hours
and you will reap and enjoy
more earnings as well
94

Guj. 1. Extn. Edu. VIII & IX 1997 & 1998
RESEARCH NOTE
Sway of Selected Factors on the Technical Knowledge of Small Peasants
N. B. Chauhanl and O. S. Rathore2
INTRODUCTION
Modernization among peasants can be brought thorough the knowledge of modern scientific technology. Knowledge is one of the important components of behaviour, which plays a major role in the overt and covert behaviour of an Individual. In fact knowledge influences the intellectual phase of human behaviour resulting both favourable and unfavourable responses. The demand for knowledge and production of knowledge are the basic requirements for peasantry modernization. It could be said therefore, that a complete working knowledge is very essential to bringforth positive attitude and proper adoption of scientific technology in the peasants.
Considering the above facts, it was worthwhile to delineate the relationship of technical knowledge.in terms of modern practices of maize crop and animal husbandry with some of the selected factors of small peasants.
METHODOLOGY
The study was conducted in Dung"arpur district of Rajasthan State. A random sample of total 150 small peasants, who had below two hectares of land holding and adopted maize as a major crop with animal husbandry, was
selected from the twelve villiages of all the three tehsils of Dungarpur district. The data were collected with the help of interview schedule from the selected small peasants. Knowledge regarding modern practices of maize crop and animal husbandry were measured with the help of scales developed by Jha and Singh (1970) and Sharma (1990), respectively. The co-efficient of correlation Cr') was used to findout the relationship of selected factors of small peasants with their technical knowledge.
RESULTS AND DISCUSSION
The data in Table 1 indicate that majority (56.67 and 57.33 per' cent) of the small peasants had low level of knowledge regarding modern practices of maize crop and animal husbandry respectively. The probable reasons for above findings were poor contact of change agencies, low education, low cosmopoliteness and low level of aspiration.
It could be inferred from the results in Table 2 that extent of knowiedge regarding modern practices of maize crop was found" positively significant with education, contact of change agency, organisational participation, mass media exposure, landholding, sociotechno-economic change and all psychological
1. Asso. Professor, Department of Extension Education" BACA. GAU, Anand 2. Retired Professor and Head and Director of Extension Education, RAU. Udaipur. (Raj.)
95

I
Sway of Selected Factors...
Table 1 : Distribution of respondents according to their extent of knowledge regarding modern practices of Maize and Animal Husbandry.
Knowledge regarding Knowledge regardingSr. Level modern practices of modern practices of No.
Maize crop Animal Husbandry N=150 N=150
Per cent No. Per centNo.
Low 56.67 57.3385 86
36.00 422. Medium 54 28.00
3. High 11 7.33 14.6722
Total 100.00150 150 100.00
variables, other than secularism. While it was found negetively significant with age and secularism.
Whereas, extent of knowledge regarding modern practices of animal husbandry of small peasants, was found positively significant with their education, caste, change agency contact, organisational participation, mass media exposure, land holding, occupation, sociotechno-economic change, level of aspiration, educational aspiration for son, empathy, nonfatalism, cosmopoliteness, economic motivation, scientific orientation, risk orientation and overall modernization. While it was found negatively significant with age and secularism. This revealed that small peasants who had positive orientation towards education, aspiration, empathy, scientism, cosmopoliteness, risk orientation, social and communication activities influenced their level of technical knowledge. Probable reasons for the significant role of
96
psychological variabies on the knowledge of modern technology might be due to the fact that Dungarpur is one of the districts· of Rajasthan, where peasants' economy is dependent only on agriculture. Dependency of peasants only on agriculture might have made some of the peasants psychologicaly strong as far as agricultural development is concerned.
IMPLICATIONS
It is observed that majority of the small peasants had low level of technical knowledge, at the same time some of the personal, social, communication and psychological variables contributed significantly to improve their knowledge. It is therefore, recommended that high· efforts should be made by different agencies so as to enable small peasants to change their psychology in positive direction for the improvement of their level of technical knowledge.
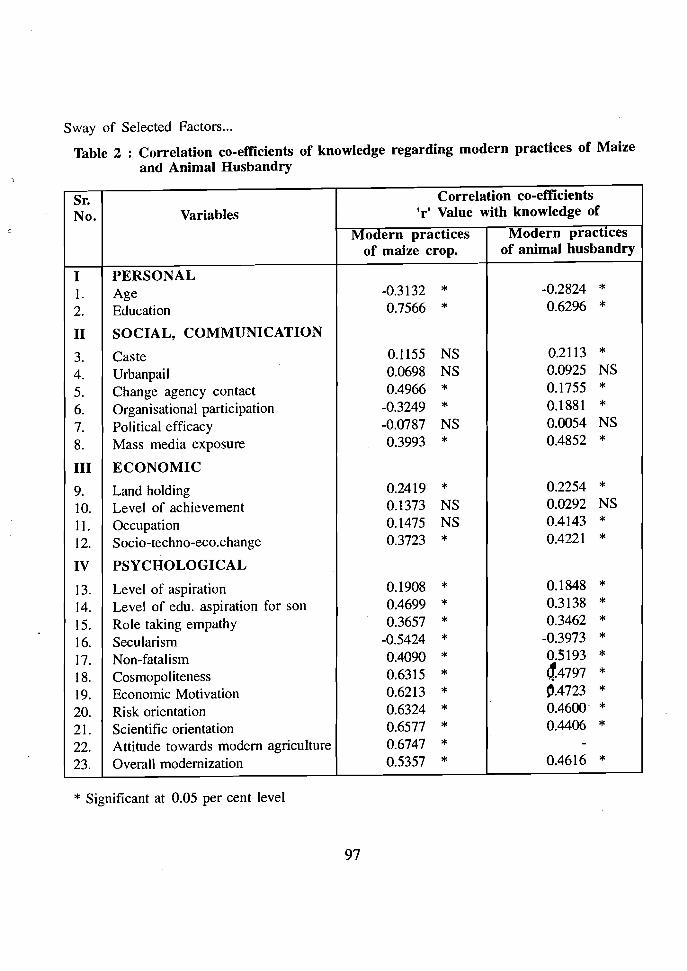
Sway of Selected Factors...
Table 2 : Correlation co-efficients of knowledge regarding modern practices of Maize and Animal Husbandry
Sr. No. Variables
Correlation co-efficients 'r' Value with knowledge of
Modern practices of maize crop.
Modern practices of animal husbandry
I PERSONAL 1. Age -0.3132 * -0.2824 * 2. Education 0.7566 * 0.6296 * II SOCIAL, COMMUNICATION
3. Caste 0.1155 NS 0.2113 * 4. Urbanpail 0.0698 NS 0.0925 NS
5. Change agency contact 0.4966 * 0.1755 * 6. Organisational participation -0.3249 * 0.1881 * 7. Political efficacy -0.0787 NS 0.0054 NS
8. Mass media exposure 0.3993 * 0.4852 * III ECONOMIC
9. Land holding 0.2419 * 0.2254 * 10. Level of achievement 0.1373 NS 0.0292 NS
II. Occupation 0.1475 NS 0.4143 * 12. Socio-techno-eco.change 0.3723 * 0.4221 * IV PSYCHOLOGICAL
13. Level of aspiration 0.1908 * 0.1848 * 14. Level of edu. aspiration for son 0.4699 * 0.3138 * 15. Role taking empathy 0.3657 * 0.3462 * 16. Secularism -0.5424 * -0.3973 * 17. Non-fatalism 0.4090 * 0.5193 * 18. Cosmopoliteness 0.6315 * ~4797 * 19. 20.
Economic Motivation Risk orientation
0.6213 * 0.6324 *
0.4723 * 0.4600' *
21. Scientific orientation 0.6577 * 0.4406 * 22. Attitude towards modern agriculture 0.6747 * -23. Overall modernization 0.5357 * 0.4616 *
* Significant at 0.05 per cent level
97
Guj. J. Extn. Edu. VIII & IX 1997 & 1998
RESEARCH NOTE
Role of Selected Characteristics of Paddy Growers on Knowledge, Adoption and Production
s. R. Patel" R. S. Vekaria2 and R. D. Pandya3
INTRODUCTION
It is a well known fact that the hard core of poverty is found in rural areas. The poorest section belongs to families of land less labourers, small and marginal farmers, schedule caste and schedule tribes. India has the largar concentration of tribal in the world, except Africa. Gujarat ranks fifth after Madhya Pradesh, Orissa, Bihar and Maharashtra. In Gurarat, it is mainly concentrated in eastern parts of the state from Dang to Surat district in south, Banakantha district in north. Their economy is mainly based on agriculture and partially forest base produce.
Rice is the age old crop of surat district. After implementation of Ukai-kakrapar project and establishment of Main Irrigation Research Station, Regional Rice Research station for drilled and transplanted paddy, the rice production per hectare of this area is higher than of those of all over India. Looking to the importance and existing situation in this area, the present study entitled, "Relationship between selected characteristics of tribal and non-tribal rice growers and their knowledge level, extent of adoption and yield perfonnanc~
regarding the improved rice production technology was undertaken in surat District.
METHDOLOGY
Stratified multistage random sampling
with proportional allocation was followed to select the rice rowers for this study. In all 100 tribal rice growers were .selected for the study who were in proportion to the rice growers from ten villages of Bardoli and Vyara talukas. Likewise, 100 non-tribal rice growers from the same villages were selected randomly keeping the family size and type constant as that of tribal rice growers.
The data were collected with the help of personal interview schedule which was specially constructed in accordance with the objectives. To identify the relationship between selected characteristics of rice growers and their knowledge level, extent of edoption and yield perfonnance, correlation coefficient was used.
RESULTS AND DISCUSSION
In order to know such relationship the data in this regards were collected and presented in Table 1.
Relationship between selected characteristics of tribal rice gowers and their knowledge level :
A close exmaination of Table I reveals that among all characteristics, education (0.63141 **, 0.39820**) social participation (0.25895**, 0.33760**), scientific orientation (0.25491 **, 0.33590**), risk preference (0.25529**,0.26380**), use of fonnal soucres
1. Ex-post graduate student. NMCA, GAU, Navsari. 2. Asso. prof. Department of Extenl'ion Education, NMCA, GAU, Navsari. 3. Asstt. prof. Department of Extension Education, NMCA, GAU, Navsari.
98
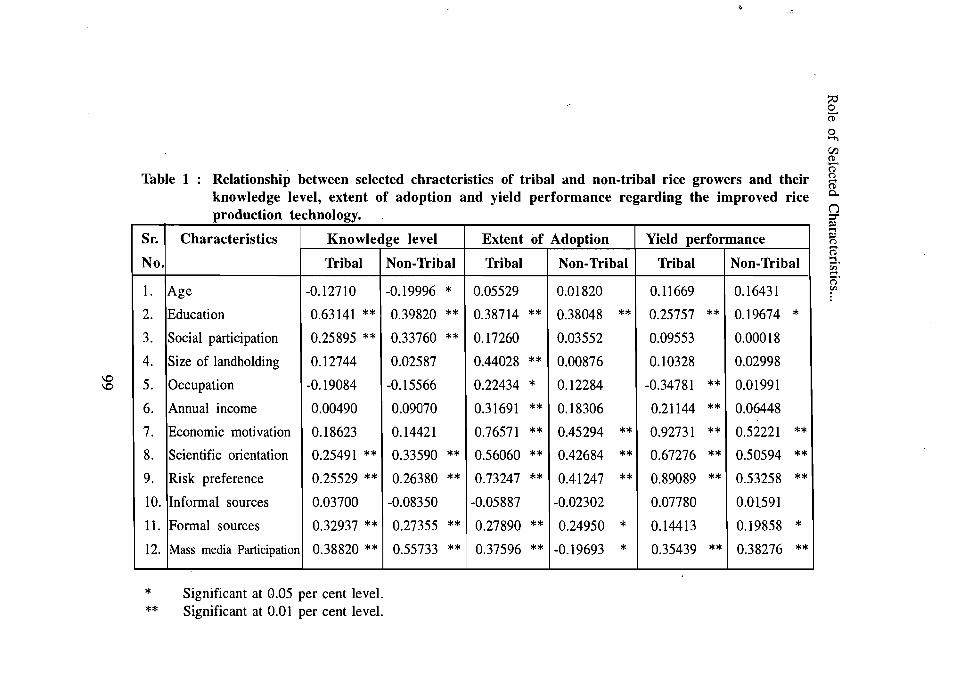
Table 1 Relationship between selected chracteristics of tribal and non-tribal rice growers and their knowledge level, extent of adoption and yield performance regarding the improved rice production technology.
Sr. Characteristics Knowledge level Extent of Adoption Yield performance
No. Tribal Non-Tribal Tribal Non-Tribal Tribal Non-Tribal
I. Age -0.12710 -0.19996 * 0.05529 0.01820 0.11669 0.16431
2. Education 0.63141 ** 0.39820 ** 0.38714 ** 0.38048 ** 0.25757 ** 0.19674 *
3. Social participation 0.25895 ** 0.33760 ** 0.17260 0.03552 0.09553 0.00018
4. Size of landholding 0.12744 0.02587 0.44028 ** 0.00876 0.10328 0.02998
5. Occupation -0.19084 -0.15566 0.22434 * 0.12284 -0.34781 ** 0.01991
6. Annual income 0.00490 0.09070 0.31691 ** 0.18306 0.21144 ** 0.06448
7. Economic motivation 0.18623 0.14421 0.76571 ** 0.45294 ** 0.92731 ** 0.52221 **
8. Scientific orientation 0.25491 ** 0.33590 ** 0.56060 ** 0.42684 ** 0.67276 ** 0.50594 **
9. Risk preference 0.25529 ** 0.26380 ** 0.73247 ** 0.41247 ** 0.89089 ** 0.53258 **
10. Informal sources 0.03700 -0.08350 -0.05887 -0.02302 0.07780 0.01591
II. Formal sources 0.32937 ** 0.27355 ** 0.27890 ** 0.24950 * 0.14413 0.19858 *
12. Mass media Participation 0.38820 ** 0.55733 ** 0.37596 ** -0.19693 * 0.35439 ** 0.38276 **
Significant at 0.05 per cent level. * ** Significant at 0.01 per cent level.
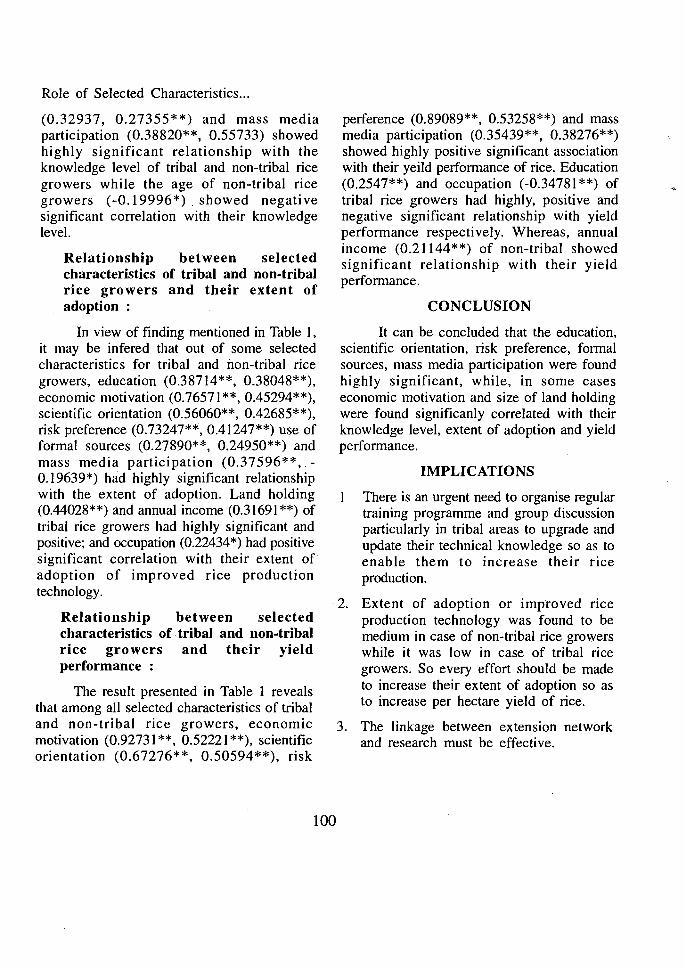
Role of Selected Characteristics...
(0.32937, 0.27355**) and mass media participation (0.38820**, 0.55733) showed highly significant relationship with the knowledge level of tribal and non-tribal rice growers while the age of non-tribal rice growers (-0.19996*). showed negative significant correlation with their knowledge level.
Relationship between selected characteristics of tribal and non-tribal rice growers and their extent of adoption:
In view of finding mentioned in Table I, it may be infered that out of some selected characteristics for tribal and non-tribal rice growers, education (0.38714**, 0.38048**), economic motivation (0.76571 **, 0.45294**), scientific orientation (0.56060**, 0.42685**), risk preference (0.73247**, 0.41247**) use of formal sources (0.27890**, 0.24950**) and mass media participation (0.37596**,. 0.19639*) had highly significant relationship with the extent of adoption. Land holding (0.44028**) and annual income (0.31691 **) of tribal rice growers had highly significant and positive; and occupation (0.22434*) had positive significant correlation with their extent of adoption of improved rice production technology.
Relationship between selected characteristics of· tribal and non-tribal rice growers and their yield performance :
The result presented in Table I reveals that among all selected characteristics of tribal and non-tribal rice growers, economic motivation (0.92731 **, 0.52221 **), scientific orientation (0.67276**, 0.50594**), risk
perference (0.89089**, 0.53258**) and mass media participation (0.35439**, 0.38276**) showed highly positive significant association with their yeild performance of rice. Education (0.2547**) and occupation (-0.34781 **) of tribal rice growers had highly, positive and negative significant relationship with yield performance respectively. Whereas, annual income (0.21144**) of non-tribal showed significant relationship with their yield performance.
CONCLUSION
It can be concluded that the education, scientific orientation, risk preference, formal sources, mass media participation were found highly significant, while, in some cases economic motivation and size of land holding were found significanly correlated with their knowledge level, extent of adoption and yield performance.
IMPLICATIONS
There is an urgent need to organise regular training programme and group discussion particularly in tribal areas to upgrade and update their technical knowledge so as to enable them to increase their rice production.
·2. Extent of adoption or improved rice production technology was found to be medium in case of non-tribal rice growers while it was low in case of tribal rice growers. So every effort should be made to increase their extent of adoption so as to increase per hectare yield of rice.
3. The linkage between extension network and research must be effective.
100

Guj. J. Extn. Edu. VIII & IX 1997 & 1998
RESEARCH NOTE
Job Satisfaction of Village Level Workers Working Under T & V system
M. N. Popatl , S. M. Nandvana2 and D. M. Thakrar3
INTRODUCTION
Training and visit system has been introduced in Gujarat state since April, 1978. The T and V system is playing a crucial role in transfer of latest agricultural technology to the farmers' fields. Village Level Extension Worker (VLW) is the pivotal person working under this system. He is the grassroot worker and the backbone of the system and forms the vital link between the farmers and the Government machinery. The credibility and effectiveness of the system depend to a considerable extent on VLW's job satisfaction. In view of this, the study was undertaken to explore the "Job satisfaction of VLWs working under training and Visist System.
METHODOLOGY
This study was conducted in Junagadh district of Gujarat State. The district covers two sub-divisions viz., Junagadh and Veraval. Out of total 139 VLWs, 75 VLWs those who
had attended fortnightly meetings were selected as respondents. The job satisfaction of the respondents was measured by using the scale which was originally suggested by Cantrill (1965) and later on developed by Chakravarthy (1971).
A list of 12 job factors was prepared. The scoring procedure for each factor was -5 to +5 on job satisfaction ladder. To avoid the plus and minus sign 5 was added. Thus, the range of score on a job factor was from o to 10. The respondents were categorised into three groups viz., low, medium and high by using mean + standard deviation.
A structured schedule was used for data collection. In light of the objectives the data were analysed, tabulated and interpretation was done.
RESULTS AND DISCUSSION
Table 1 shows that two-third [66.67 percent] of the VLWs exhibited moderate level
Table 1 : Distribution of VLWs at Different levels of Job satisfaction (N=75)
Category Score range Frequency Percent
Low Medium High
up to 72 73 to 102 Above 102
13 50 12
17.33 66.67 16.00
Mean = 86.97 SD = 15.02 CV = 17.27%
1. Associate Extension Educationist, EEl, GAD., Anand 2. Ex post graduate student, College of Agriculutre, GAD., Junagadh. 3. Asstt. Prof. of Extn. College of Agriculture, GAD., Junagadh.
101

Job Satisfaction...
of job satisfaction. This was followed by low (17.33 per cent) and high (16 per cent) level of job satisfaction, respectively.
To show the relative importance of each of the 12 job factors, the mean score of each factor was computed on the basis of the scores obtained by responents. The scores, thus obtained for each job factor were summed up. The total score of each statement was divided by the total number of respondents to calculate the mean score. Ranking of the job factors was done on the basis of this mean score of individual factor. The factors by their rank order are presented in Table 2.
The data in Table 2 reveal that the job item "Relation with co-workers" got Rank I. This was followed by guidance about various subjects from higher officers (Rank II), share of agricultural development programme of their districtlsub division (Rank III) , security of job (rank IV), relation with superiors (Rank V), freedom of work (Rank VI), status, respect & prestige as a person they received from
others (Rank VII), social status for job (Rank VIII), aspiration for further progress (Rank IX), time taken by authorities to solve the professional problem (Rank X), award & recognition for good work (Rank XI) and opportunity for further promotion (Rank XII) in decending order.
CONCLUSION AND IMPLICATION
Based on the findings, it may be concluded that relation with co-workers; guidance about various subjects from higher officers; and share in agricultural development programme in districtlsub- division in that order were the job areas to which VLWs give more importance.
In order to improve level of job satisfaction of VLWs the administrators should concentrate efforts to strengthen the inservice training, especially in communication method & their field of specialization. The administrators should think over on difficulties faced by VLWs in performing their job & efforts should be made to solve the same.
Table 2 : Relative Importance of Job Satisfactional statements (N=75)
Sr. No. Statements Meap score Rank
I. Relation with co-workers 8.71 I 2. Guidance about various subjects from higher officers 8.56 II 3. Share in agril. dev. prog. of your districtlsub-divison 8.51 III 4. Job security 8.41 IV 5. Relation with superiors 8.40 V 6. Freedom of work 7.96 VI 7. Status, respect & prestige as a person you perceived
from others 7.25 VII 8. Social status for job 7.03 VIII 9. Aspiration for further progress 6.89 IX 10. Time taken by authorities to solve the professional problem. 6.12 X II. Award & recognition for good work 5.21 XI 12. Opportunity for further promotion 3.95 XII
102
Guj. J. Extn. Edu. VIII & IX 1997 & 1998
RESEARCH NOTE
Migration Habit and Overall Technological Gap of the Tribal Farmers
A. J. Pate" and J. C. TrivedF
INTRODUCTION
There are altogether 427 tribal communities all over India. Among these, ninty four percent Indian tribes are living in rural India and --S7.00 per cent of them are agriculturist and agricultural labourers having very low literacy level (16.35 per cent). In Gujarat 92.68 per cent tribes are living in rural areas and 86.00 per cent are agriculturist and agricultural labourers having 21.14 per cent of literacy. Tribal areas being hilly, rocky and the land being undulating, shallow having inferior type and very less awareness of agriculture resulting in backwardness. The tribal agriculture is mostly of subsistence in nature and characterised by the production of food grains just sufficient to meet their requirements generally at low level of living. The use of local seeds, growing rainfed crops, use of family labours, use of crude tools and implements production of self consumption constitute the main elements of such agriculture. Agricultur is the only source of livelihood for them. Their land is comparatively' poor in quality and particularly without irrigation facilities. The agricultural production is far from assured and stable. Tribal farmers followed single cropping pattern. It is clear that not only capital or finance is the barrier of the tribal farmers but their ignorance towards new
agricultural technology and conservativeness are also the obstacles in their progress. The ignorance of tribal farmers never persuades them to adopt the modem technology. The physical and mental separation of the tribal is responsible for their economic and social backwardness. They remain aloof from the rest of the society for generations. The isolation of the tribal areas from the out side world has prevented the tribal from being exposed to new ideas and they are therefore, extremely tradition bound and prime in their approach.
METHODOLOGY
The present study was conducted in tribal area of Vadodara district of Gujarat state. Out of twelve talukas of Vadodara district, three talukas namely (1) Chhotaudepur (2) Naswadi and (3) Pavijetpur were purposively selected. These talukas possess more than fifty per cent of the tribal population and ITDP Chhotaudepur is also operating in these talukas.
The villages in each selected talukas were classified into there groups viz. (i) high (ii) medium and (iii) Low communication facilities score developed by Murthy and Singh and two villages from each group were selected randomly. Thus six villages from each taluka were selected. In all 18 villages were selected from the above three talukas for the
1. Asstt. Research Scientist (Ext. Edu.) Wheat Reaearch Station, GAD, Vijapur. 2. Extension Educationist, Extension Education Institute, G.A.D., Anand.
103
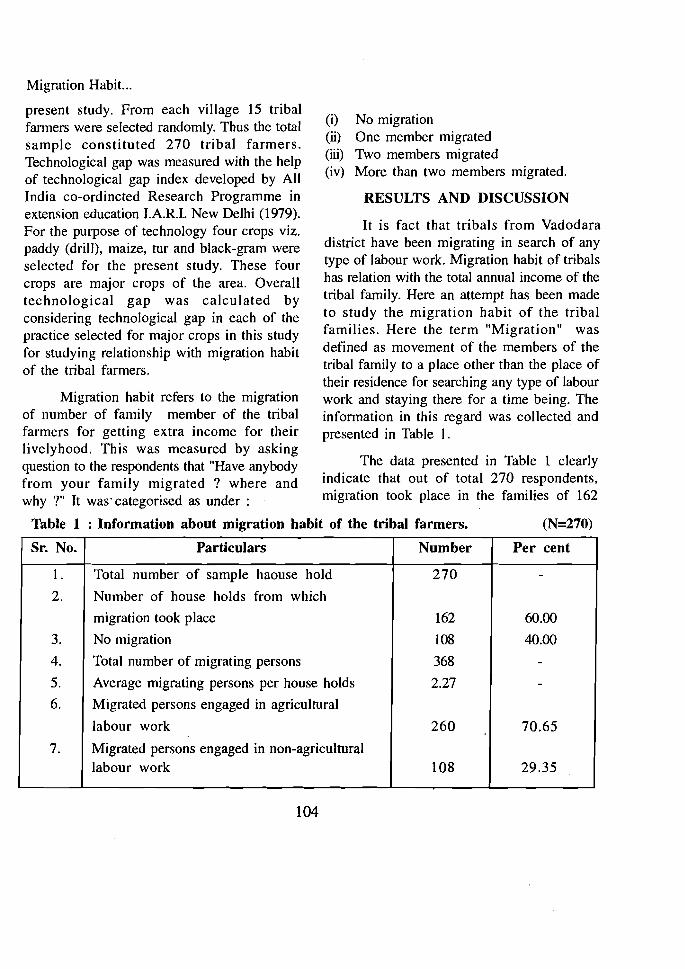
Migration Habit...
present study. From each village 15 tribal farmers were selected randomly. Thus the total sample constituted 270 tribal farmers. Technological gap was measured with the help of technological gap index developed by All India co-ordincted Research Programme in extension education LA.R.I. New Delhi (1979). For the purpose of technology four crops viz. paddy (drill), maize, tur and black-gram were selected for the present study. These four crops are major crops of the area. Overall technological gap was calculated by considering technological gap in each of the practice selected for major crops in this study for studying relationship with migration habit of the tribal farmers.
Migration habit refers to the migration of number of family member of the tribal farmers for getting extra income for their livelyhood. This was measured by asking question to the respondents that "Have anybody
(i) No migration (ii) One member migrated (iii) Two members migrated (iv) More than two members migrated.
RESULTS AND DISCUSSION
It is fact that tribals from Vadodara district have been migrating in search of any type of labour work. Migration habit of tribals has relation with the total annual income of the tribal family. Here an attempt has been made to study the migration habit of the tribal families. Here the term "Migration" was defined as movement of the members of the tribal family to a place other than the place of their residence for searching any type of labour work and staying there for a time being. The information in this regard was collected and presented in Table I.
The data presented in Table 1 clearly from your family migrated ? where and indicate that out of total 270 respondents, why?" It was' categorised as under: migration took place in the families of 162
Table 1 : Information about migration habit of the tribal farmers. (N=270)
Sr. No. Particulars Number Per cent
1.
2.
3.
4.
5.
6.
7.
Total number of sample haouse hold
Number of house holds from which
migration took place
No migration
Total number of migrating persons
Average migrating persons per house holds
Migrated persons engaged in agricultural
labour work
Migrated persons engaged in non-agricultural labour work
270
162
108
368
2.27
260
108
-
60.00
40.00
--
70.65
29.35
104

Migration Habit...
respondents (60.00 per cent). The total number of migrating persons was 368 and the average number of migrating persons per house holds was 2.27. Out of total migrating persons, 70.65 per cent were engged in agricultural labour work, while 29.35 per cent of them were found to be engaged in non-agricultural labour work.
This finding was in confirmity with those of Nigra (1982) and Trivedi (1984).
To ascertain the relationship between migration habit of the respondents and their overall technological gap, the correlation coefficient was applied. The zero order correlation is given in Table 2. The observed relationship is dicussed under subtitle as follows.
Table 2 : Zero order correlation coefficient between migration habit of the tribal farmers and. their overall technological gap. (n=270)
Sr. No. Name of variable r value
1. Migration habit - 0.21383*
* Significant at 0.05 per cent level
The calculated correlation coefficient value of r =-0.21383 was significant at 0.05 level. It implies that as the migration habit increases, the overall technological gap decreases.
The probable reasons might be that the economic conditions of the tribal farmers was poor. They followed the single cropping pattern because there was limited irrigation facility. They have to be migrated in search of seasonal agricultural labour work in the forward areas where assured irrigation facilities are available. At the time of migration, the tribal farmers might have come in contact with the progressive farmers and they might have heard and seen the different high yielding varieties and their bumper yields. They might have seen the different no cost as well as low cost technologies of the various crops and it could have increased their knowledge level regarding the recommended technologies of various crops. When they come back from the migrated place, they might have adopted these new technologies on their own farms. So the migration habit increases, the overall technological gap decreases.
105
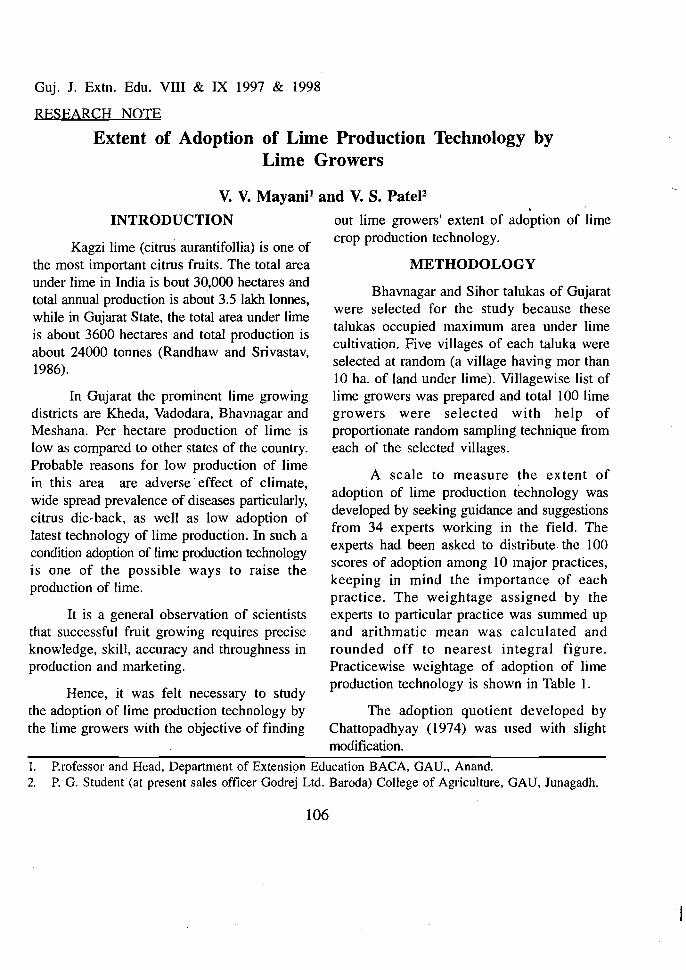
Guj. J. Extn. Edu. VIII & IX 1997 & 1998
RESEARCH NOTE
Extent of Adoption of Lime Production Technology by Lime Growers
V. V. MayanP and V. S. PateP
INTRODUCTION
Kagzi lime (citrus aurantifollia) is one of the most important citrus fruits. The total area under lime in India is bout 30,000 hectares and total annual production is about 3.5 lakh lonnes, while in Gujarat State, the total area under lime is about 3600 hectares and total production is about 24000 tonnes (Randhaw and Srivastav, 1986).
In Gujarat the prominent lime growing districts are Kheda, Vadodara, Bhavnagar and Meshana. Per hectare production of lime is low as compared to other states of the country. Probable reasons for low production of lime in this area are adverse· effect of climate, wide spread prevalence of diseases particularly, citrus die-back, as well as low adoption of latest technology of lime production. In such a condition adoption of lime production technology is one of the possible ways to raise the production of lime.
It is a general observation of scientists that successful fruit growing requires precise knowledge, skill, accuracy and throughness in production and marketing.
Hence, it was felt necessary to study the adoption of lime production technology by the lime growers with the objective of finding
. out lime growers' extent of adoption of lime crop production technology.
METHODOLOGY
Bhavnagar and Sihor talukas of Gujarat were selected for the study because these talukas occupied maximum area under lime cultivation. Five villages of each taluka were selected at random (a village having mor than 10 ha. of land under lime). Villagewise list of lime growers was prepared and total 100 lime growers were selected with help of proportionate random sampling technique from each of the selected villages.
A scale to measure the extent of adoption of lime production technology was developed by seeking guidance and suggestions from 34 experts working in the field. The experts had been asked to distribute the 100 scores of adoption among 10 major practices, keeping in mind the importance of each practice. The weightage assigned by the experts to particular practice was summed up and arithmatic mean was calculated and rounded off to nearest integral figure. Practicewise weightage of adoption of lime production technology is shown in Table 1.
The adoption quotient developed by Chattopadhyay (1974) was used with slight modification.
1. P.rofessor and Head, Department of ExtensiQn Education BACA, GAD., Anand. 2. P. G. Student(at present sales officer Godrej Ltd. Baroda) College of Agriculture, GAD, Junagadh.
106
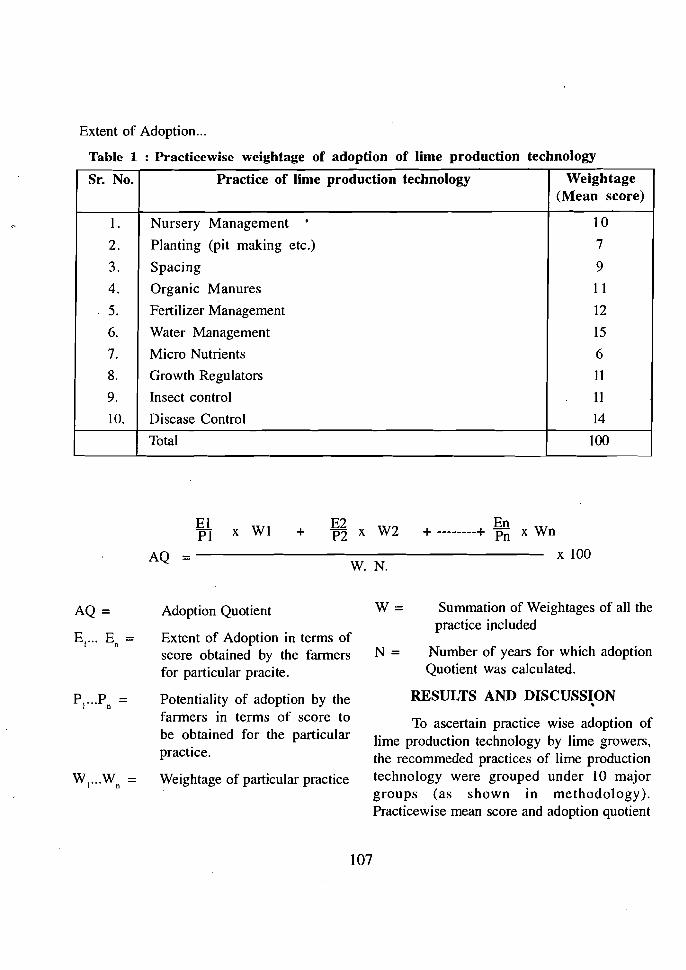
Extent of Adoption ...
Table 1 : Practicewise weightage of adoption of lime production technology
Sr. No. Practice of lime production technology Weightage (Mean score)
1. Nursery Management . 10
2. Planting (pit making etc.) 7
3. Spacing 9
4. Organic Manures 11
5. Fertilizer Management 12
6. Water Management 15
7. Micro Nutrients 6
8. Growth Regulators 11
9. Insect control 11
10. Disease Control
Total
14
100
EI E2 EnPI x WI + P2 x W2 + --------+ Pn x Wn
x 100AQ = W. N.
Summation of Weightages of all the AQ = Adoption Quotient W = practice included
Extent of Adoption in terms ofE1••• En = Number of years for which adoption score obtained by the farmers N = Quotient was calculated. for particular pracite.
RESULTS AND DISCUSSIONPotentiality of adoption by the PI"'Pn = farmers in terms of score to To ascertain practice wise adoption of be obtained for the particular lime production technology by lime growers, practice. the recommeded practices of lime production
WI",W = Weightage of particular practice technology were grouped under 10 major n
groups (as shown in methodology). Practicewise mean score and adoption quotient
107
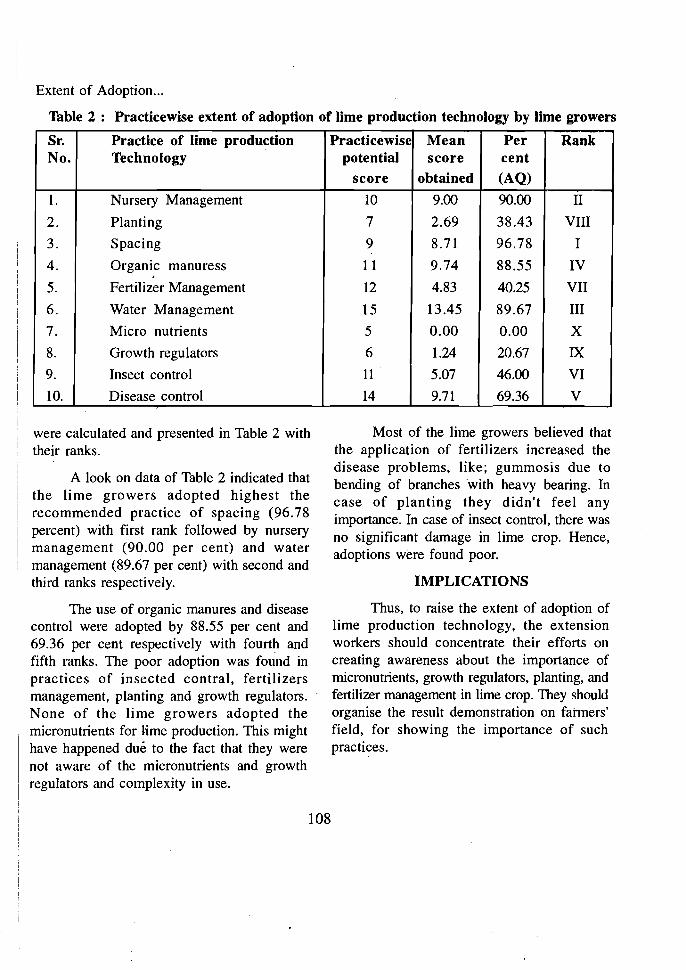
Extent of Adoption ...
Table 2: Practicewise extent of adoption of lime production technology by lime growers
Sr. No.
Practice of lime production Technology
Practicewise potential
score
Mean score
obtained
Per cent (AQ)
Rank
l.
2.
3.
4.
5.
6.
7.
8.
9.
10.
Nursery Management
Planting
Spacing
Organic manuress
Fertilizer Management
Water Management
Micro nutrients
Growth regulators
Insect control
Disease control
10
7
9
11
12
15
5
6
11
14
9.00
2.69
8.71
9.74
4.83
13.45
0.00
1.24
5.07
9.71
90.00
38.43
96.78
88.55
40.25
89.67
0.00
20.67
46.00
69.36
II
VIII
I
IV
VII
III
X
IX
VI
V
were calculated and presented in Table 2 with their ranks.
A look on data of Table 2 indicated that the lime growers adopted highest the recommended practice of spacing (96.78 percent) with first rank followed by nursery management (90.00 per cent) and water management (89.67 per cent) with second and third ranks respectively.
The use of organic manures and disease control were adopted by 88.55 per cent and 69.36 per cent respectively with fourth and fifth ranks. The poor adoption was found in practices of insected contral, fertilizers management, planting and growth regulators. None of the lime growers adopted the micronutrients for lime production. This might have happened due to the fact that they were not aware of the micronutrients and growth regulators and complexity in use.
108
Most of the lime growers believed that the application of fertilizers increased the disease problems, like; gummosis due to bending of branches with heavy bearing. In case of planting they didn't feel any importance. In case of insect control, there was no significant damage in lime crop. Hence, adoptions were found poor.
IMPLICATIONS
Thus, to raise the extent of adoption of lime production technology, the extension workers should concentrate their efforts on creating awareness about the importance of micronutrients, growth regulators, planting, and fertilizer management in lime crop. They should organise the result demonstration on faimers' field, for showing the importance of such practices.

Guj. J. Extn. Edu. VIII & IX 1997 & 1998
RESEARCH NOTE
A Knowledge Test to Measure Wheat Growers' Knowledge about Wheat Production Technology
M. S. TrivedP and B. T. PateF
INTRODUCTION
The wide yield gap in tribal farming areas exits between the average yield of common farmers (1996 kg/ha) and actual potential yield (2800 kg/ha) in demonstration plots of the wheat (Anonymous, 1990). This may be due to the lack of knowledge of recommended technology of wheat crop. Knowledge of recommended wheat cultivation practices play a vital role in adoption of the technology by the farmers.
For measuring the knowledge level of wheat growers with respect to tribal area, it is essential to develop the standardized knowledge test. Knowledge means those behaviour and test situations which emphasise the remembering either by recognition or recall of ideas, material or phenomena (Bloom et al. 1965).
Efforts have' been made to develp a standardised knowledge test which can measure the level of knowledge regarding recommended technology of wheat crop in a scientific manner. Initially, 48 items were selected for developing knowledge test. The method of item analysis used by Jha and Singh (1970) was followed so as to yield three kinds of indices viz. "item difficulty", "item discrimination" and "item validity". For this
purpose the items were administered to 48 respondents of Sabarkantha District selected at random
As a result of this, final format of the knowledge test was formed which contained 25 items (Appendix-I)
Reliability of the test.
To know the reliability of the knowledge test, the test retest method (r=0.9056**) and the split halves method (r=0.8844**) were used.
Validity of the Test
For testing the validity of the test, the known group technique was used which showed very high validity of the test. Similarly,
.. the significant coefficient of Biserial correlation reflected positively about the validity of the items included in the test battery.
CONCLUSION
This knowledge test could be used effectively for measuring wheat growers' knowledge about recommended technology of wheat crop. Consequently the categorization of wheat growers could be made on the basis of their knowledge level. Extension strategies viz. training programme, diffusion and communication of technology' for speedy adoption may be planned according to knowledge level of wheat growers.
I. Associate Extension Eucationist, Extension Education Institute, G.A.U., Anand. 2. .Director of Extension Education, Gujarat Agricultural Univerity, Ahmedabad.
109
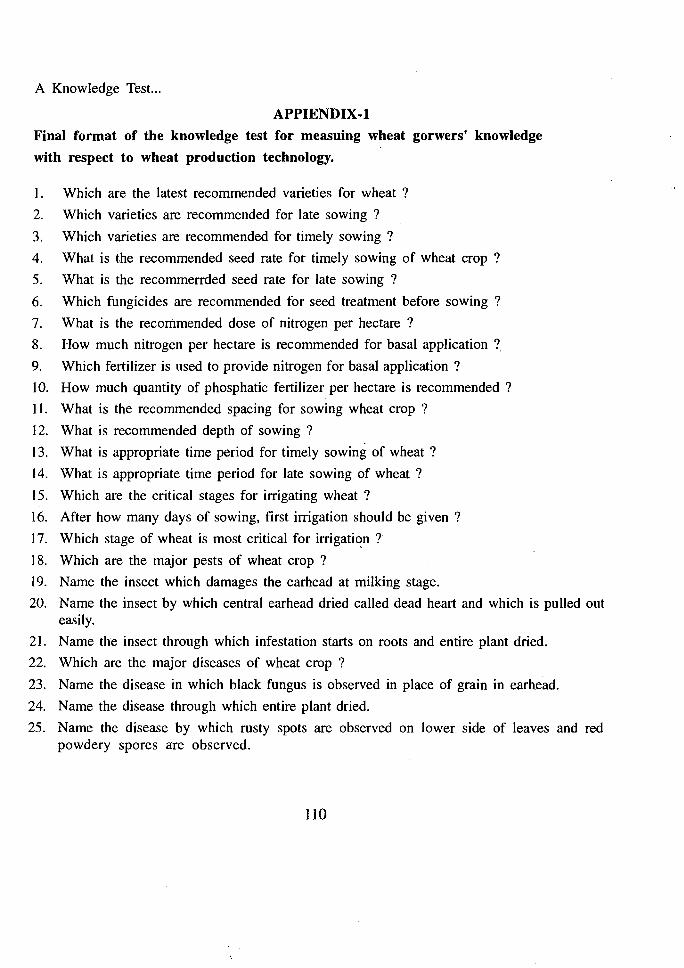
A Knowledge Test...
APPIENDIX-l
Final format of the knowledge test for measuing wheat gorwers' knowledge
with respect to wheat production technology.
I . Which are the latest recommended varieties for wheat ?
2. Which varieties are recommended for late sowing ?
3. Which varieties are recommended for timely sowing?
4. What is the recommended seed rate for timely sowing of wheat crop ?
5. What is the recommerrded seed rate for late sowing?
6. Which fungicides are recommended for seed treatment before sowing ?
7. What is the recommended dose of nitrogen per hectare?
8. How much nitrogen per hectare is recommended for basal application ?
9. Which fertilizer is used to provide nitrogen for basal application ?
10. How much quantity of phosphatic fertilizer per hectare is recommended ?
II. What is the recommended spacing for sowing wheat crop ?
12. What is recommended depth of sowing ?
13. What is appropriate time period for timely sowing of wheat?
14. What is appropriate time period for late sowing of wheat ?
15. Which are the critical stages for irrigating wheat?
16. After how many days of sowing, first irrigation should be given?
17. Which stage of wheat is most critical for irrigati~n ?
18. Which are the major pests of wheat crop ?
19. Name the insect which damages the earhead at milking stage.
20. Name the insect by which central earhead dried called dead heart and which is pulled out easily.
21. Name the insect through which infestation starts on roots and entire plant dried.
22. Which are the major diseases of wheat crop ?
23. Name the disease in which black fungus is observed in place of grain in earhead.
24. Name the disease through which entire plant dried.
25. Name the disease by which rusty spots are observed on lower side of leaves and red powdery spores are observed.
110
Guj. J. Extn. Edu. VIIl & IX 1997 & 1998
RESEARCH NOTE
Impact of Institutional Training Programme on Farm Women under TWA Project
H. V. GosaP, M. A. MunshP, V. J. Savaliya3 and P. R. Kanani4
INTRODUCTION
Agricultural and allied activities are still the main occupation of rural women in India and also in Gujarat Majority of farm operations contributing to 70 per cent of the total work are done by women. These women need to be trained to improve thier skill and knowledge through scientific orientation to modern agricultural technology. Realizing the importance of such training the Government of Gujarat is organizing such trainings, exclusively for farm women on need base. The programme i.e. Training Women in Agriculture (TWA) is implemented in Gujarat since 1990. A considerable time of eight years has passed to its implementation. Hence it was felt necessary to know the impact of TWA project. The study was undertaken with the following specific objective :
To know the differences in knowledge as well as adoption of improved groundnut production technology (G.P.T.) and yield of groundnut between trained and untrained farm women.
METHODOLOGY
The study was undertaken in Junagadh district during 1997-98. A sample of 90
trained and 90 untrained farm women representing 9 villages of Junagadh, Bhesan and Mendarda talukas of Junagadh district was drawn by using multiple random sampling technique.
In order to exarriine the knowledge and adoption of G.P.T. by the respondents, the standardized knowledge test developed by Popat et al. (1985) and adoption quotient developed by Chattopadhyay (1974) were used. The responses were collected by way of personal interview. The data were analyzed in the light of objective.
RESULTS AND DISCUSSION
Trained and untrained farm women were compared in terms of their knowledge ~nd
adoption of G.P.T. as well as yield of groundnut. The mean score of trained and untrained farm women were calculated separately. For comparison of both the groups, 'Z' test was applied. The result presented in Table 1 indicated that the mean scores for yield of groundnut in respect of trained and unitraned farm women were 253 and 1.63 respectively. The difference of mean between trained and untrained farm women was 0.90 and 'Z' value was 7.704 which is highly significant.
1. P. G. Student, College of Agriculture, GAD, Junagadh. 2. Professor, Dept. of Extn. Edu., College of AgriI. GAD., Junagudh. 3: AgriI. Officer, Dept. of Extn. Edu., College of AgriI. GAD., Junagudh. 4. Assn. Prof., Dept. of Extn. Edu., College of Agril. GAD., Junagudh.
111
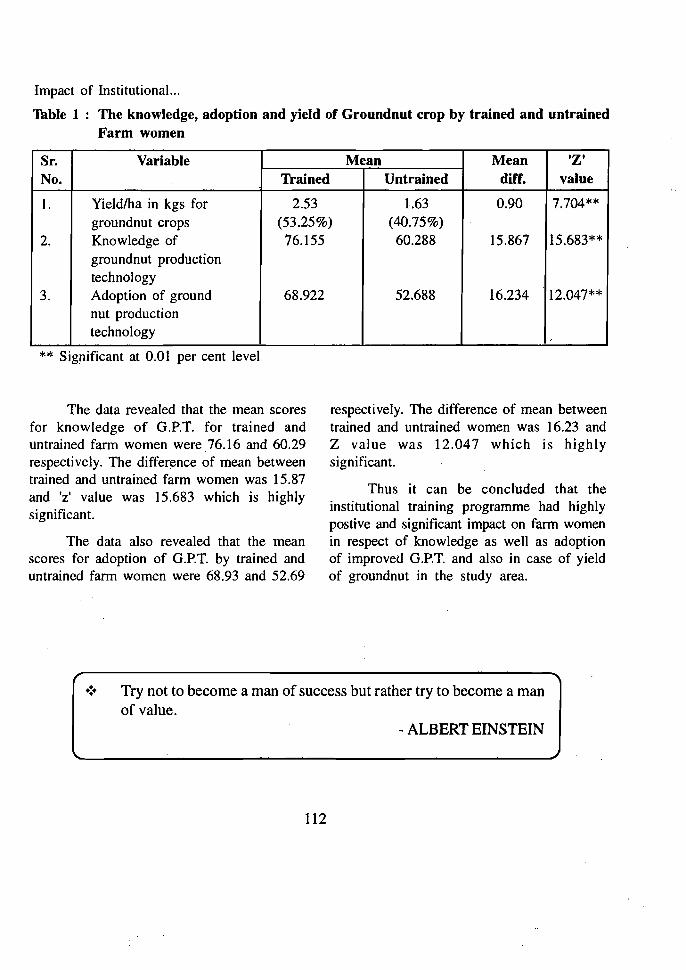
Impact of Institutional...
Table 1 : The knowledge, adoption and yield of Groundnut crop by trained and untrained Farm women
Sr. Variable Mean Mean diff.
'Z' valueNo. Trained Untrained
I.
2.
3.
Yield/ha in kgs for groundnut crops Knowledge of groundnut production technology Adoption of ground nut production technology
2.53 (53.25%) 76.155
68.922
1.63 (40.75%) 60.288
52.688
0.90
15.867
16.234
7.704**
15.683**
12.047**
** Significant at 0.01 per cent level
The data revealed that the mean scores for knowledge of G.P.T. for trained and untrained farm women were 76.16 and 60.29 respectively. The difference of mean between trained and untrained farm women was 15.87 and 'z' value was 15.683 which is highly significant.
The data also revealed that the mean scores for adoption of G.P.T. by trained and untrained farm women were 68.93 and 52.69
respectively. The difference of mean between trained and untrained women was 16.23 and Z value was 12.047 which is highly significant.
Thus it can be concluded that the institutional training programme had highly postive and significant impact on farm women in respect of knowledge as well as adoption of improved G.P.T. and also in case of yield of groundnut in the study area.
.:. Try not to become a man of success but rather try to become a man of value.
- ALBERT EINSTEIN
Il2
Guj. J. Extn. Edu. VIII & IX 1997 & 1998
RESEARCH NOTE
Communication Sources Utilized by Urd Growers in the Tribal Areas of Rajasthan
L.S. Bareth1 and S. L. Intodia2
INTRODUCTION
The scientific information and its effective communication by different scientific institutions, Department of Agriculture, other agencies and organizations is considered to be most important ingradient of rural development strategy. The communication requires a series of interrelated and communicable line system to generate and diffuse new information and technological innovations. In this process of transfer of technology, a large number of agencies are engaged where line of inter mediately field functionaries and 'several other types of media are working. Some of these agencies or media are very effective as compared to others and have their own credit worthiness in communication of messages.
. In this study an effort has been made to identify different sources of information and to locate the most utilized sources for developing a suitable approach to evolve an effective communication strategy. Hence the study was undertaken with the following specific objectives;
1. To study the sources of Agricultural information being used by the farmers regarding the improved package of parctices of urd cultivation.
2. To find out the association between selected variables with sources of Agricultural information used by the urd growers.
METHODOLOGY
There are nine agro climatic zones in Rajasthan of which two zones namely Subhumid southern plains & Araveli Hills (IV A) and Humid southern plains (IV B) were drawn on the basis of highest percentage of tribal population (45.70%) in the state and urd is grown as major pulse crop in kharif season. From each zone, three tehsils with maximum area from each of the three categories viz high, medium and low urd producing area, were drawn. At the next stage of sampling two VEW circles from each tehsil on the basis of highest pulse area were selected. Thus, 12 village circles were drawn from which 192 urd growers (50% small and 50% margind) were drawn by systematic random samplipg technique.
RESULTS AND DISCUSSION
Extent of sources of information used by the urd growers of zone IV A
An over-view of Table 1 depicts that 'Village Extension Workers' (2.58ms) was the
I. Assn. Professor (Extn. Edu.) Directorate of Extension Education, RAU, Udaipur (Raj.) 2. Director, Directorate of Extension Education, RAU, Udaipur (Raj.)
113
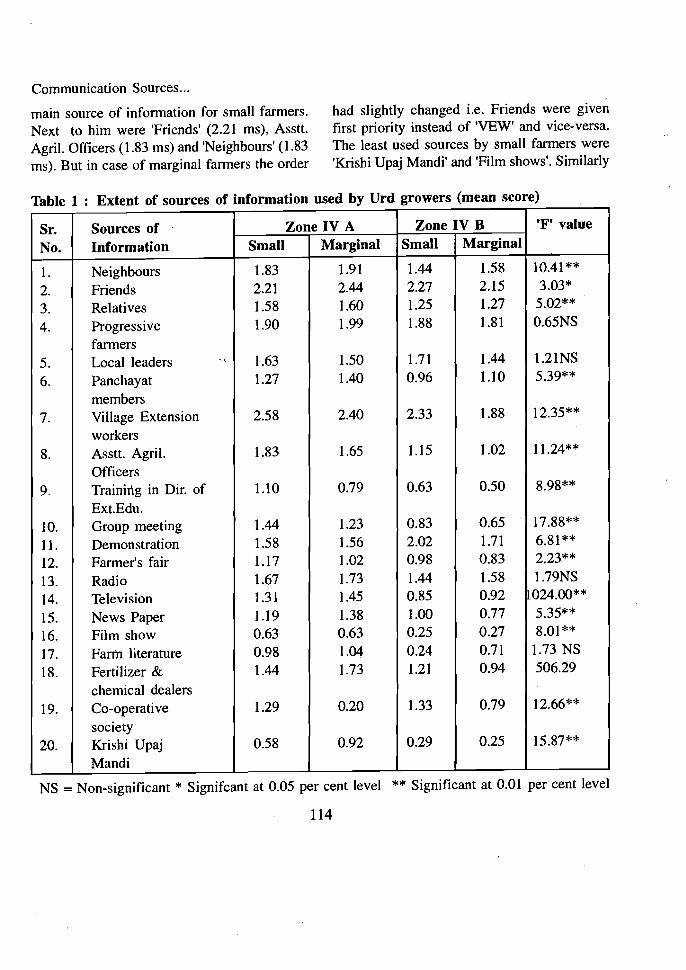
Communication Sources...
had slightly changed i.e. Friends were given main source of information for small farmers. Next to him were 'Friends' (2.21 ms), Asstt. first priority instead of 'YEW' and vice-versa.
Agril. Officers (1.83 ms) and 'Neighbours' (1.83 The least used sources by small farmers were
ms). But in case of marginal farmers the order 'Krishi Upaj Mandi' and 'Film shows'. Similarly
Table 1 : Extent of sources of information used by Urd growers (mean score)
Sr. No.
Sources of Information
Zone IV A Zone IV B 'F' value
Small Marginal Small Marginal
I. Neighbours 1.83 1.91 1.44 1.58 10.41**
2. Friends 2.21 2.44 2.27 2.15 3.03*
3. Relatives 1.58 1.60 1.25 1.27 5.02**
4. Progressive farmers
1.90 1.99 1.88 1.81 0.65NS
5. Local leaders -, 1.63 1.50 1.71 1.44 1.21NS
6. Panchayat members
1.27 1.40 0.96 1.10 5.39**
7. Village Extension workers
2.58 2.40 2.33 1.88 12.35**
8. Asstt. Agril. Officers
1.83 1.65 1.15 1.02 11.24**
9. Training in Dir. of Ext.Edu.
1.10 0.79 0.63 0.50 8.98**
10. Group meeting 1.44 1.23 0.83 0.65 17.88**
11. Demonstration 1.58 1.56 2.02 1.71 6.81**
12. Farmer's fair 1.17 1.02 0.98 0.83 2.23**
13. Radio 1.67 1.73 1.44 1.58 1.79NS
14. Television 1.31 1.45 0.85 0.92 024.00**
15. News Paper 1.19 1.38 1.00 0.77 5.35**
16. Film show 0.63 0.63 0.25 0.27 8.01 **
17. Farm literature 0.98 1.04 0.24 0.71 1.73 NS
18. Fertilizer & chemical dealers
1.44 1.73 1.21 0.94 506.29
19. Co-operative society
1.29 0.20· 1.33 0.79 12.66**
20. Krishi Upaj Mandi
0.58 0.92 0.29 0.25 15.87**
NS = Non-significant * Signifcant at 0.05 per cent level ** Significant at 0.01 per cent level
114
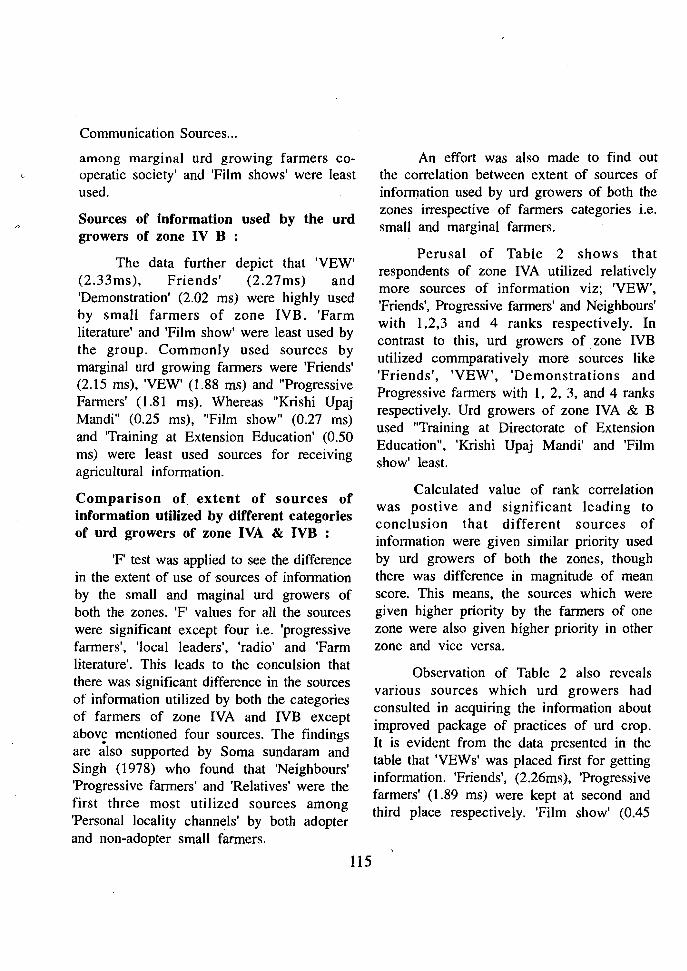
Communication Sources...
among marginal urd growing farmers cooperatic society' and 'Film shows' were least used.
Sources of information used by the urd growers of zone IV B
The data further depict that 'VEW' (2.33ms), Friends' (2.27ms) . and 'Demonstration' (2.02 ms) were highly used by small farmers of zone IVB. 'Farm literature' and 'Film show' were least used by the group. Commonly used sources by marginal urd growing farmers were 'Friends' (2.15 ms), 'VEW' (1.88 ms) and "Progressive Farmers' (1.81 ms). Whereas "Krishi Upaj Mandi" (0.25 ms), "Film show" (0.27 ms) and 'Training at Extension Education' (0.50 ms) were least used sources for receiving agricultural information.
Comparison of, extent of sources of information utilized by different categories of urd growers of zone IVA & IVB :
'F' test was applied to see the difference in the extent of use of sources of information by the small and maginal urd growers of both the zones. 'F' values for all the sources were significant except four i.e. 'progressive farmers', 'local leaders', 'radio' and 'Farm literature'. This leads to the conculsion that there was significant difference in the sources of information utilized by both the categories of farmers of zone IVA and IVB except abov~ mentioned four sources. The findings are also supported by Soma sundaram and Singh (1978) who found that 'Neighbours' 'Progressive farmers' and 'Relatives' were the first three most utilized sources among 'Personal locality channels' by both adopter and non-adopter small farmers.
115
An effort was also made to find out the correlation between extent of sources of information used by urd growers of both the zones irrespective of farmers categories i.e. small and marginal farmers.
Perusal of Table 2 shows that respondents of zone IVA utilized relatively more sources of information viz; 'VEW', 'Friends', Progressive farmers' and Neighbours' with 1,2,3 and 4 ranks respectively. In contrast to this, urd growers of zone IVB utilized commparatively more sources like 'Friends', 'VEW', 'Demonstrations and Progressive farmers with 1, 2, 3, and 4 ranks respectively. Urd growers of zone IVA & B used "Training at Directorate of Extension Education", 'Krishi Upaj Mandi' and 'Film show' least.
Calculated value of rank correlation was postive and significant leading to conclusion that different sources of information were given similar priority used by urd growers of both the zones, though there was difference in magnitude of mean score. This means, the sources which were given higher priority by the farmers of one zone were also given higher priority in other zone and vice versa.
Observation of Table 2 also reveals various sources which urd growers had consulted in acquiring the information about improved package of practices of urd crop. It is evident from the data presented in the table that 'VEWs' was placed first for getting information. 'Friends', (2.26ms), 'Progressive farmers' (1.89 ms) were kept at second and third place respectively. 'Film show' (0.45
Communication Sources...
ms), 'Krishi Upaj Mandi' (0.49) and 'Farm 'F' value was highly significant which literature (0.74 ms) were least utilized sour~es. indicates that there was a great variation in for the purpose. different sources used by the urd growers. In
other words. urd growing farmers used these Further test of analysis of variance 'F' sources with different intensity for getting the
was also applied to see the difference if any information for improved cultivation. in extent of use in various sources. Calculated
Table 2: Comparison of extent of sources of information used by Urd growing farmers :
Sr. Sources of Zone IV A Zone IV B Pooled No. Information M.S. Rank M.S. Rank
1. Neighbours 1.88 4 1.51 6.5 1.69 2. Friends 2.32 2 2.21 1 2.26 3. Relatives 1.59 7 1.26 8 1.43 4. Progressive farmers 1.94 3 1.84 4 1.89 5. Local leaders 1.56 10 1.57 5 1.57 6. Panchayat members 1.33 12.5 1.03 12 1.18 7. Village level workers 2.49 1 2.10 2 2.29 8. Asstt. Agril.Officers 1.74 5 1.08 9 1.46 9. Training in Dir. of
Ext.Edu. 0.95 17 0.56 17 0.78
10. Group meeting 1.33 12.5 0.73 16 1.03 11. Demonstration 1.57 9 1.86 3 1.69 12. Fanner's fair. 1.09 15 0.91 13 1.05 13. Radio 1.70 6 1.51 6.5 1.53 14. Television 1.38 11 0.89 14.5 1.13 15. News Paper 1.28 14 0.89 14.5 1.06 16. Film show 0.63 20 0.26 20 0.45 17. Fann literature 1.01 16 0.48 18 0.74 18. Fertilizer &che. dealers 1.58 8 1.07 10 1.32 19. Co-operative society 0.74 19 1.06 11 0.91 20. Krishi Upaj Mandi 0.75 18 0.27 19 0.49·
r =0.92 F Value 123.83** s
MS =Mean Score t =9.96** r = Rank Correlation **
s
= Significant at 0.01 per cent level
116
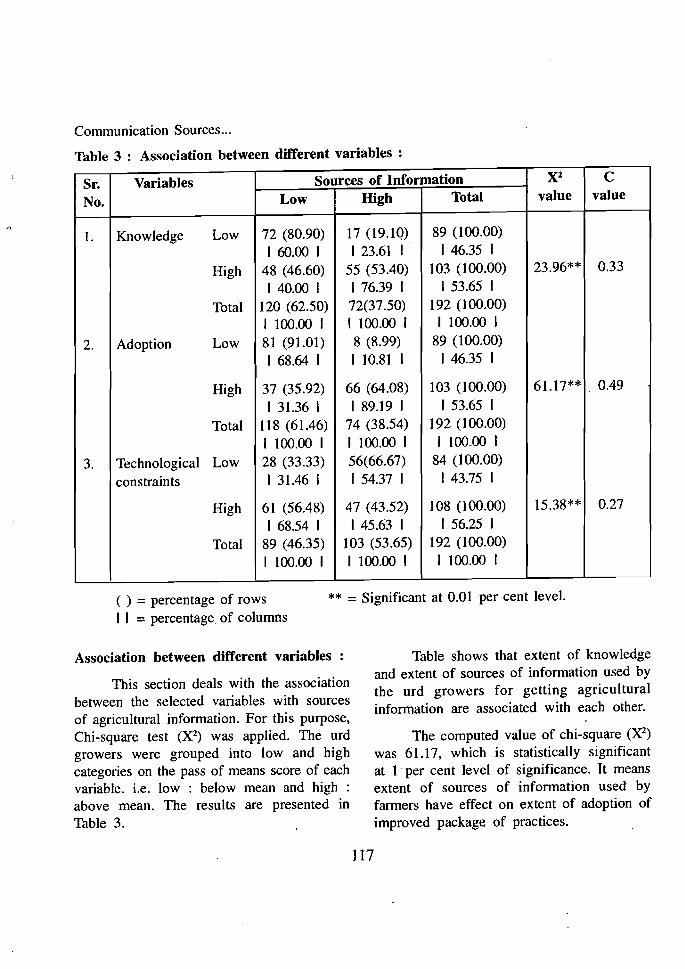
Communication Sources...
Table 3 : Association between different variables :
Sr. No.
Variables Sources of Information X2
value C
valueLow High Total
1. Knowledge Low 72 (80.90) 17 (19.10) 89 (100.00) 160.00 I I 23.61 I I 46.35 I
High 48 (46.60) 55 (53.40) 103 (100.00) 23.96** 0.33
140.00 I I 76.39 I 153.65 I
Total 120 (62.50) 72(37.50) 192 (100.00) I 100.00 I I 100.00 I I 100.00 I
2. Adoption Low 81 (91.01) 8 (8.99) 89 (100.00) 168.64 I I 10.81 I I 46.35 I
High 37 (35.92) 66 (64.08) 103 (100.00) 61.17** 0.49
I 31.36 I I 89.19 I I 53.65 I Total 118 (61.46) 74 (38.54) 192 (100.00)
I 100.00 I I 100.00 I I 100.00 I
3. Technological Low 28 (33.33) 56(66.67) 84 (100.00)
constraints I 31.46 I I 54.37 I 143.75 I
High 61 (56.48) 47 (43.52) 108 (100.00) 15.38** 0.27
I 68.54 I 145.63 I I 56.25 I Total 89 (46.35) 103 (53.65) 192 (100.00)
I 100.00 I I 100.00 I I 100.00 I
( ) = percentage of rows ** = Significant at 0.01 per cent level. .
I I = percentage of columns
Association between different variables
This section deals with the association between the selected variables with sources of agricultural information. For this purpose, Chi-square test (X2) was applied. The urd growers were grouped into low and high categories on the pass of means score of each variable. i.e. low : below mean and high : above mean. The results are presented in Table 3.
Table shows that extent of knowledge and extent of sources of information used by the urd growers for getting agricultural information are associated with each other.
The computed value of chi-square (X2) was 61.17, which is statistically significant at 1· per cent level of significance. It means extent of sources of information used by farmers have effect on extent of adoption of improved package of practices.
117

Communication Sources...
In case of association with technological constraints, the calculated value of chi-square (X2) was 15.38 which was greater than tabulated value at 1 degree of freedom at 1 per cent level of significance. From the above observation it could be concluded that there is significant association between the sources of infonnation used and technological constraints perceived by urd growing respondents.
CONCLUSION
From the above· results it could be concluded that
1. Small and marginal urd growing fanners used more frequently the sources like
'VEW', 'Friends', 'Relatives' and 'Progressive fanners'.
2. There was great variation in different sources used by urd growers of both the zones.
3. There was significant difference in extent to which different sources of infonnation were used by small and marginal urd growers of zone IVA & IVB.
4. There was significant association between the use of sources of infonnation with selected variables viz; knowledge,
.adoption and technological constraints.
.:.
•:.
•:.
.:.
What we have'to learn to do we learn by doing
- ARISTOTLE.
It is better to be a dog in peaceful times than to be a man in times of unrest.
- CHINESE PROVERB.
Sincewe can not get what we like let us like what we can get.
Challenge is a part of life taket itin stride knowing that you will win most of the time, lose some of the time but become a better person either way for having tried"
- PROMOD BATIA
118
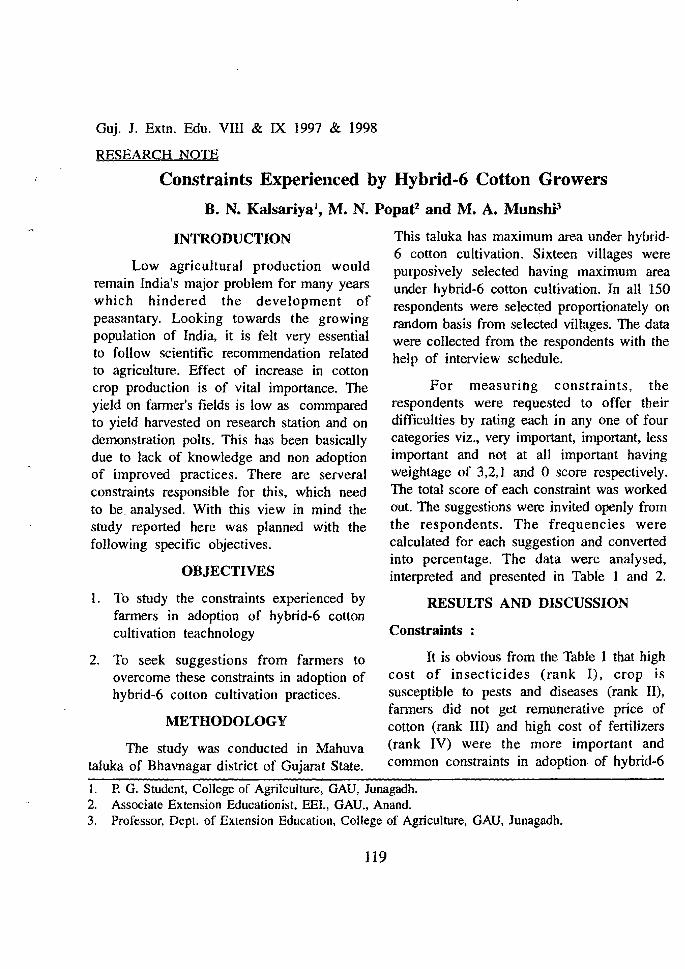
Guj. J. Extn. Edu. VIII & IX 1997 & 1998
RESEARCH NOTE
Constraints Experienced by Hybrid-6 Cotton Growers
B. N. Kalsariya1, M. N. Popat2 and M. A. MunshP
INTRODUCTION
Low agricultural production would remain India's major problem for many years which hindered the development of peasantary. Looking towards the growing population of India, it is felt very essential to follow scientific recommendation related to agriculture. Effect of increase in cotton crop production is of vital importance. The yield on farmer's fields is low as commpared to yield harvested on research station and on demonstration polts. This has been basically due to lack of knowledge and non adoption of improved practices. There are serveral constraints responsible for this, which need to be analysed. With this view in mind the study reported here was planned with the following specific objectives.
OBJECTIVES
1. To study the constraints experienced by farmers in adoption of hybrid-6 cotton cultivation teachnology
2. To seek suggestions from farmers to overcome these constraints in adoption of hybrid-6 cotton cultivation practices.
METHODOLOGY
The study was conducted in Mahuva taluka of Bhavnagar district of Gujarat State.
This taluka has maximum area under hybrid6 cotton cultivation. Sixteen villages were purposively selected having maximum area under hybrid-6 cotton cultivation. In all 150 respondents were selected proportionately on random basis from selected villages. The data were collected from the respondents with the help of interview schedule.
For measuring constraints, the respondents were requested to offer their difficulties by rating each in anyone of four categories viz., very important, important, less important and not at all important having weightage of 3,2,1 and 0 score respectively. The total score of each constraint was worked out. The suggestions were invited openly from the respondents. The frequencies were calculated for each suggestion and converted into percentage. The data were analysed, interpreted and presented in Table 1 and 2.
RESULTS AND DISCUSSION
Constraints :
It is obvious from the Table 1 that high cost of insecticides (rank I), crop is susceptible to pests and diseases (rank 11), farmers did not get remunerative price of cotton (rank III) and high cost of fertilizers (rank IV) were the more important and common constraints in adoption of hybrid-6
1. P. G. Student, College of Agrilculture, GAD, Junagadh. 2. Associate Extension Educationist, EEI., GAD., Anand. 3. Professor, Dept. of Extension Education, College of Agriculture, GAD, Junagadh.
119

mstraints Experienced...
(N=150)able 1 : Constraints faced by the Hybrid-6 cotton Growers.
Sr. No.
Constraints Mean score
Rank
1. Soil is not suitable for cotton cultivation 0.32 XXIV
2. High cost of seed 0.90 XVII
3. Non availability of finance in time 0.82 XIX
4. Labour reguirement is high 1.66 X
5. Non availability of labourers during season 1.52 XIII
6. High Wages of labourers 1.71 IX
7. High cost of fertillizer 2.62 IV
8. Non availability of chemical fertilizers 0.22 XXV
9. Complicated teachniques for application of fertilizers 0.68 XXII
to. Paucity of farm yard manure 1.58 XII
11. More labourers' requirement in application of recommended organic manure (EY.M.)
0.72 XXI
12. High cost of insecticides 2.99 I
13. Non availability of plant protection chemicals 0.10 XXVII
14. Application of plant protection measures is a complicated technique
1.44 XV
15. Application of plant protection measures is against social customs
0.09 XXVIII
16. Non availablility of certified seed 0.13 XXVI
17. Lack of irrigation facility 1.62 XI
18. Irregular supply of electricity 2.48 VI
19. Lack of improved implements 0.79 XX
20. Lack of technical guidance 2.59 V
21. Lack of knowledge 2.17 VII
22. Crop is susceptible to pests and diseases 2.91 n 23. Lack of storage facility 0.66 XXIII
24. Do not get remunerative price of cotton 2.66 ill
25. Do not get money of sold cotton in time 0.83 XVIII
26. Fluctuation of cotton price (product) 1.99 VIII
27. Winter crop is not possible due to late maturity of hybrid-6 cotton
0.95 XVI
28. Cotton cultivation is risky 1.50 XIV
120
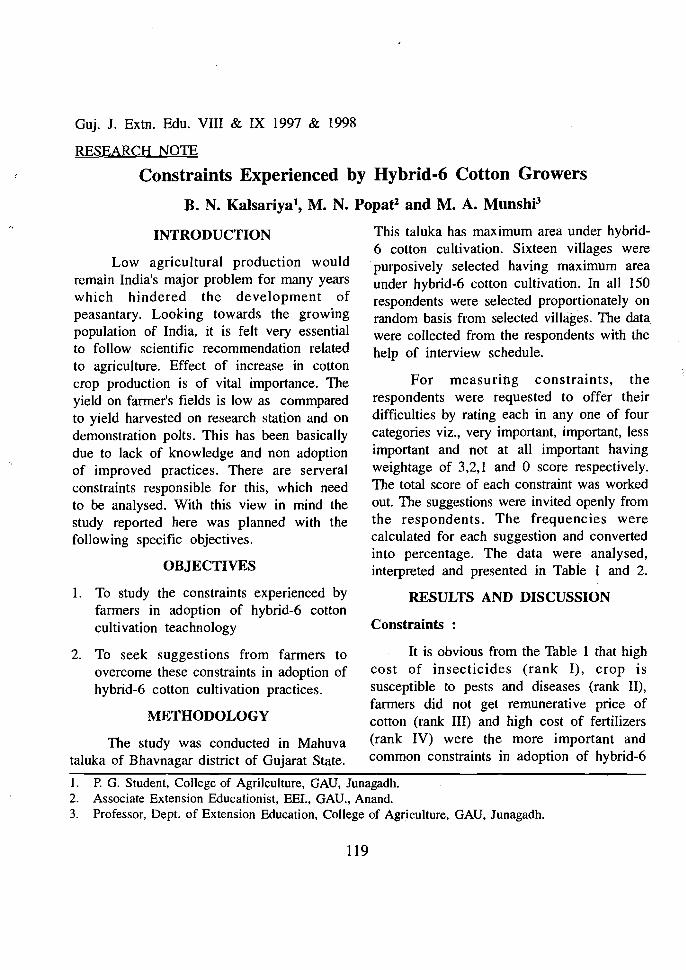
Guj. J. Extn. Edu. VIII & IX 1997 & 1998
RESEARCH NOTE
Constraints Experienced by Hybrid-6 Cotton Growers
B. N. Kalsariyat, M. N. Popat2 and M. A. MunshP
INTRODUCTION
Low agricultural production would remain India's major problem for many years which hindered the development of peasantary. Looking towards the growing population of India, it is felt very essential to follow scientific recommendation related to agriculture. Effect of increase in cotton crop production is of vital importance. The yield on farmer's fields is low as commpared to yield harvested on research station and on demonstration polts. This has been basically due to lack of knowledge and non adoption of improved practices. There are serveral constraints responsible for this, which need to be analysed. With this view in mind the study reported here was planned with the following specific objectives.
OBJECTIVES
1. To study the constraints experienced by farmers in adoption of hybrid-6 cotton cultivation teachnology
2. To seek suggestions from farmers to overcome these constraints in adoption of hybrid-6 cotton cultivation practices.
METHODOLOGY
The study was conducted in Mahuva taluka of Bhavnagar district of Gujarat State.
This taluka has maximum area under hybrid6 cotton cultivation. Sixteen villages were purposively selected having maximum area under hybrid-6 cotton cultivation. In all 150 respondents were selected proportionately on random basis from selected villages. The data were collected from the respondents with the help of interview schedule.
For measuring constraints, the respondents were requested to offer their difficulties by rating each in anyone of four categories viz., very important, important, less important and not at all important having weightage of 3,2,1 and 0 score respectively. The total score of each constraint was worked out. The suggestions were invited openly from the respondents. The frequencies were calculated for each suggestion and· converted into percentage. The data were· analysed, interpreted and presented in Table I and 2.
RESULTS AND DISCUSSION
Constraints :
It is obvious from the Table 1 that high cost of insecticides (rank I), crop is susceptible to pests and diseases (rank II), farmers did not get remunerative price of cotton (rank III) and high cost of fertilizers
(rank IV) were the more important and common constraints in adoption of hybrid-6
1. P. G. Student, College of Agrilculture, GAU, Junagadh. 2. Associate Extension Educationist, EEI., GAU., Anand. 3. Professor, Dept. of Extension Education, College of Agriculture, GAU, Junagadh.
119

Constraints Experienced...
Table 1 : Constraints faced by the Hybrid-6 cotton Growers. (N=lS0)
Sr. No.
Constraints Mean score
Rank
1. Soil is not suitable for cotton cultivation 0.32 XXIV 2. High cost of seed 0.90 XVII 3. Non availability of finance in time 0.82 XIX 4. Labour reguirement is high 1.66 X 5. Non availability of labourers during season 1.52 XIII 6. High Wages of labourers 1.71 IX 7. High cost of fertillizer 2.62 IV 8. Non availability of chemical fertilizers 0.22 XXV 9. Complicated teachniques for application of fertilizers 0.68 XXII 10. Paucity of farm yard manure 1.58 XII II. More labourers' requirement in application
of recommended organic manure (F. YM.) 0.72 XXI
12. High cost of insecticides 2.99 I 13. Non availability of plant protection chemicals 0.10 XXVII 14. Application of plant protection measures is a
complicated technique 1.44 XV
15. Application of plant protection measures is against social customs
0.09 XXVIII
16. Non availablility of certified seed 0.13 XXVI 17. Lack of irrigation facility 1.62 XI 18. Irregular supply of electricity 2.48 VI 19. Lack of improved implements 0.79 XX 20. Lack of technical guidance 2.59 V 21. Lack of knowledge 2.17 VII 22. Crop is susceptible to pests and diseases 2.91 II 23. Lack of storage facility 0.66 XXIII 24. Do not get remunerative price of cotton 2.66 III 25. Do not get money of sold cotton in time 0.83 XVIII 26. Fluctuation of cotton price (product) 1.99 VIII 27. Winter crop is not possible due to late
maturity of hybrid-6 cotton 0.95 XVI
28. Cotton cultivation is risky 1.50 XIV
120

Constraints Experienced...
cotton production teachnology as experienced by the respondents. Lack of technical guidance, irregular supply of electricity and lack of knowledge ranked 5th, 6th and 7th as expressed by the hybrid-6 cotton growers respectively.
Fluctuation of cotton price in the market, high wages of labourers, labour requirement is high, lack of irrigation facility and paucity of farm yard manure were other major constraints in adoption of hyrid-6 cotton technology which secured 8th, 9th, 10th, I Ith and 12th rank respectively.
SUGGESTIONS
As regrad to suggestions, it can be seen from the Table 2 that reasonable prices of the product be given (61.33%), timely and adequate loan be made available and if failure of crop due to natural hazard, loan should be considered for remission (56.66%), Government should provide subsidy in seeds, fertilizer and insecticides (52.00%), regular electric power be given (44.00) were important suggestions made by majority of the respondents.
Table 2 : Suggestions offered by the Hybrid-6 Cotton growers (N=lS0)
Sr. No.
Suggestions Frequency per cent
t. Reasonable prices of the product 92 61.33 2. Timely and adequate loan be made available and be given if
failure of crop due to natural hazard, loan should be considered for remission.
85 56.66
3. Government should provide subsidy in seeds, fertilizers and insectides
78 52.00
4. Electric power be given regularly 66 44.00 5. Fair price of hybrid cotton seeds, fertilizers and insecticides 58 38.66 6. Training be given well in advance for hybrid
cotton production technology 52 34.66
7. Irrigation facilities be increased 43 28.66 8. Seeds and fertilizers should be made available in time 29 ' 19.33 9. Disease resistant variety should be developed 27 18.00 10. Organisation of crop demonstrations 25 16.66 11. Technical guidance regarding new farm technology
should be given to the farmers 20 13.33
12. Village level workers should frequently contact the farmers to make them aware about the farm technology
16 10.66
13. Easy availability of improved implements at subsidised rate 15 10.00 14. Customer service of tractor be made available at subsidised rate 13 08.66 15. Local availibility of insecticides 08 05.33 16. Fixation of cotton prices 07 04.66 17. Timely availibility of diesel 03 02.00
121
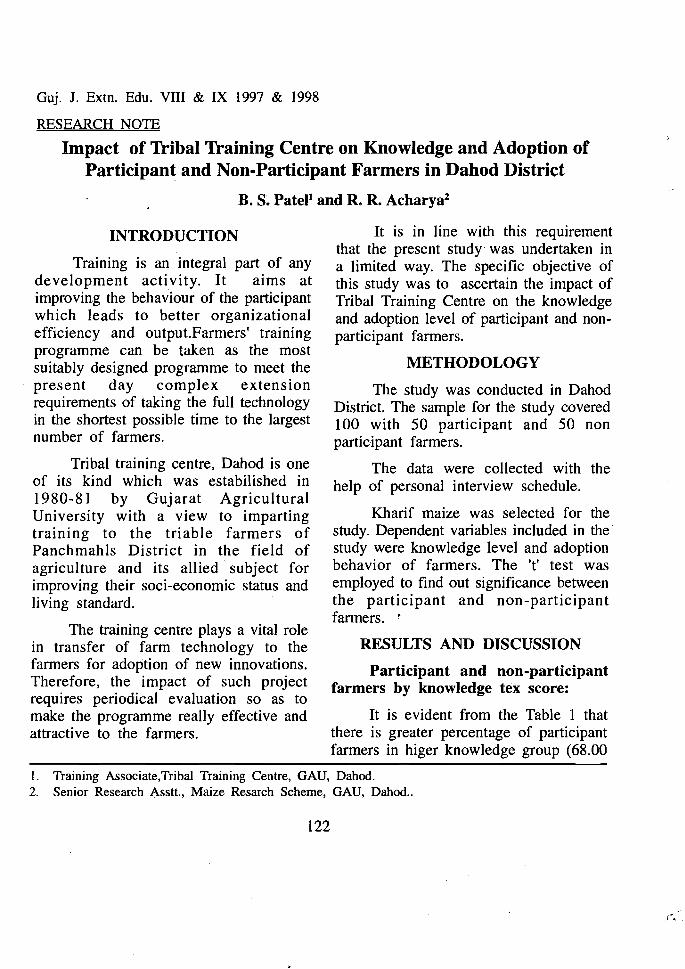
Guj. 1. Extn. Edu. VIII & IX 1997 & 1998
RESEARCH NOTE
Impact of Tribal Training Centre on Knowledge and Adoption of Participant and Non-Participant Farmers in Dahod District
B. S. Pate" and R. R. Acharya2
INTRODUCTION
Training is an integral part of any development activity. It aims at improving the behaviour of the participant which leads to better organizational efficiency and output.Farmers' training programme can be taken as the most suitably designed programme to meet the present day complex extension requirements of taking the full technology in the shortest possible time to the largest number of farmers.
Tribal training centre, Dahod is one of its kind which was estabilished in 1980-81 by Gujarat Agricultural University with a view to imparting training to the triable farmers of Panchmahls District in the field of agriculture and its allied subject for improving their soci-economic status and living standard.
The training centre plays a vital role in transfer of farm technology to the farmers for adoption of new innovations. Therefore, the impact of such project requires periodical evaluation so as to make the programme really effective and attractive to the farmers.
It is in line with this requirement that the present study was undertaken in a limited way. The specific objective of this study was to ascertain the impact of Tribal Training Centre on the knowledge and adoption level of participant and nonparticipant farmers.
METHODOLOGY
The study was conducted in Dahod District. The sample for the study covered 100 with 50 participant and 50 non participant farmers.
The data were collected with the help of personal interview schedule.
Kharif maize was selected for the study. Dependent variables included in the study were knowledge level and adoption behavior of farmers. The 't' test was employed to find out significance between the participant and non-participant farmers. •
RESULTS AND DISCUSSION
Participant and non-participant farmers by knowledge tex score:
It is evident from the Table 1 that there· is greater percentage of participant farmers in higer knowledge group (68.00
1. Training Associate,Tribal Training Centre, GAU, Dahod. 2. Senior Research AssU., Maize Resarch Scheme, GAU, Dahod..
122
J'.~ ,
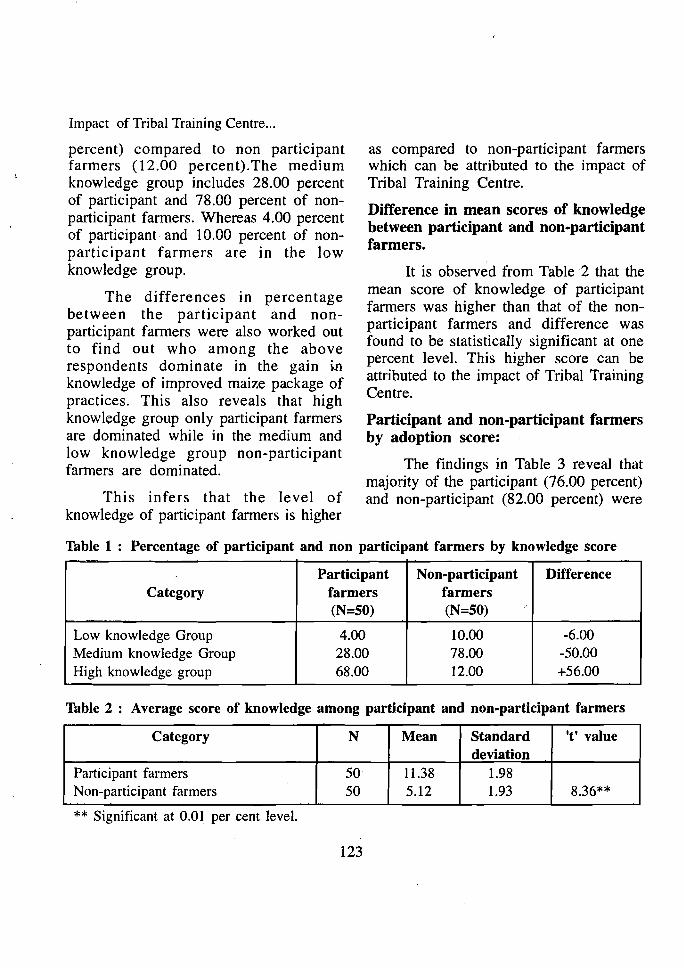
Impact of Tribal Training Centre...
percent) compared to non participant farmers (12.00 percent).The medium knowleclge group includes 28.00 percent of participant and 78.00 percent of nonparticipant farmers. Whereas 4.00 percent of participant and 10.00 percent of nonparticipant farmers are in the low knowledge group.
The differences in percentage between the participant and nonparticipant farmers were also worked out to find out who among the above respondents dominate in the gain ~n
knowledge of improved maize package of practices. This also reveals that high knowledge group only participant farmers are dominated while in the medium and low knowledge group non-participant farmers are dominated.
This infers that the level of knowledge of participant farmers is higher
as compared to non-participant farmers which can be attributed to the impact of Tribal Training Centre.
Difference in mean scores of knowledge between participant and non-participant farmers.
It is observed from Table 2 that the mean score of knowledge of participant farmers was higher than that of the nonparticipant farmers and difference was found to be statistically significant at one percent level. This higher score can be attributed to the impact of Tribal Training Centre.
Participant and non-participant farmers by adoption score:
The findings in Table 3 reveal that majority of the participant (76.00 percent) and non-participant (82.00 percent) were
Table 1 : Percentage of participant and non participant farmers by knowledge score
Category Participant
farmers (N=SO)
Non-participant farmers (N=SO)
Difference
Low knowledge Group Medium knowledge Group High knowledge group
4.00 28.00 68.00
10.00 78.00 12.00
-6.00 -50.00 +56.00
Table 2 : Average score of knowledge among participant and non-participant farmers
Category N Mean Standard deviation
't' value
Participant farmers Non-participant farmers
50 50
11.38 5.12
1.98 1.93 8.36**
** Significant at 0.01 per cent level.
123
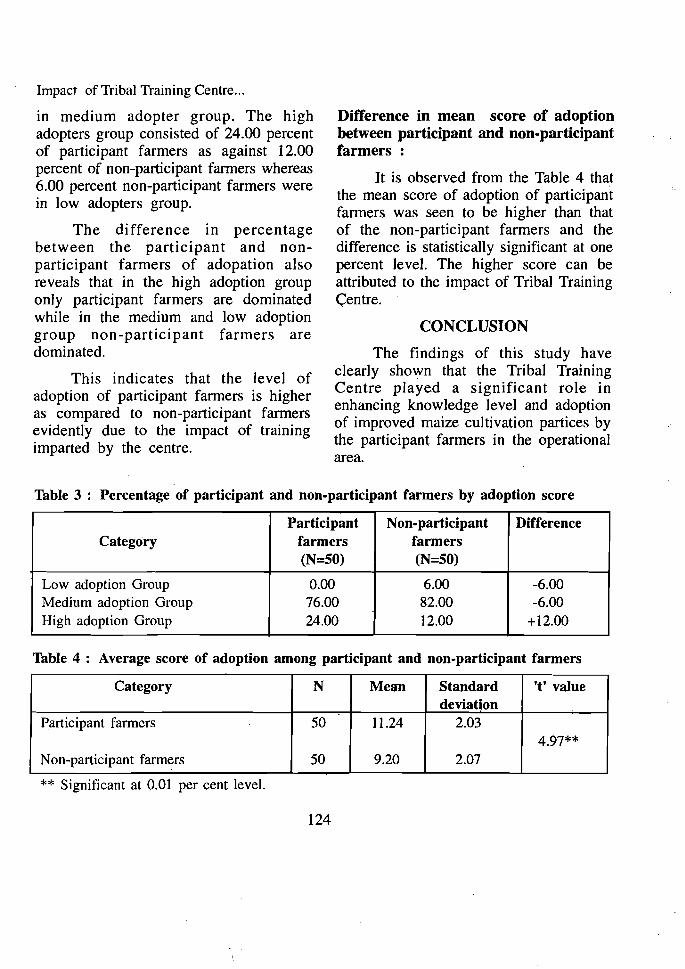
Impact of Tribal Training Centre...
in medium adopter group. The high adopters group consisted of 24.00 percent of participant farmers as against 12.00 percent of non-participant farmers whereas 6.00 percent non-participant farmers were in low adopters group.
The difference in percentage between the participant and nonparticipant farmers of adopation also reveals that in the high adoption group only participant farmers are dominated while in the medium and low adoption group non-participant farmers are dominated.
This indicates that the level of adoption of participant farmers is higher as compared to non-participant farmers evidently due to the impact of training imparted by the centre.
Difference in mean score of adoption between participant and non-participant farmers:
It is observed from the Table 4 that the mean score of adoption of participant farmers was seen to be higher than that of the non-participant farmers and the difference is statistically significant at one percent level. The higher score can be attributed to the impact of Tribal Training <;entre.
CONCLUSION
The findings of this study have clearly shown that the Tribal Training Centre played a significant role in enhancing knowledge level and adoption of improved maize cultivation partices by the participant farmers in the operational area.
Table 3 : Percentage of participant and non-participant farmers by adoption score
Category Participant
farmers (N=50)
Non-participant farmers (N=50)
Difference
Low adoption Group Medium adoption Group High adoption Group
0.00 76.00 24.00
6.00 82.00 12.00
-6.00 -6.00
+12.00
Table 4 : Average score of adoption among participant and non-participant farmers
Category N Mean Standard deviation
't' value
Participant farmers
Non-participant farmers
50
50
11.24
9.20
2.03
2.07 4.97**
** Significant at 0.01 per cent level.
124
Guj. J. Extn. Edu. VIII & IX 1997 & 1998
RESEARCH NOTE
Impact of Co-operative Sugar Factories in Sugarcane Growers of South Gujarat
s. D. Kavadt, R. B. PateJZ and ~ D. JoshP
INTRODUCTION
A well - known enunciation of cooperative aims has been "better farming, better business and better living', in ascending order. This enunciation has been justified by the cooperative sugar factories. All cooperative sugar factories have been working as a nuclei for development of rural areas around their factories.
The cooperative sugar factories have their own definite objectives. Keeping these objectives in view, the cooperative sugar factories are working and provide Extension services and welfare to member sugarcane growers to increase their crop production. So, it is necessary to know as to what extent the sugar cooperatives have helped their members specially sugarcane growers to increase their knowledge and how far they have helped in convincing the farmers to adopt recommended sugarcane production technologies.
OBJECTIVES
I. To sfudy knowledge level of sugracane growers about recommended sugarcane production technology.
2. To study the extent of adoption of recommended sugarcane Production technology by sugarcane growers.
METHODLOGY
In the present investigation. the population for the study consisted of two groups namely member sugracane growers and non-member sugracane of sugar factories located in Surat, Valsad and Bharuch districts of Gujarat state. Two co-operative sugar factories were selected from each district. From each selected co-operative sugar factory, two villages were selected at random. Thus, in all twelve villages selected. Eight nonmembers and eight members were selected from each village making a total sample of 188 (94 members and 94 non-members) respondents by matching some personal and socio-economic characterstics. The data were collected with the help of structured schedule by personal interview. The data were classified, tabulated and analysed in the light of the objectives of the study. For measuring the impact of co-operative' sugar factory, 't' value was calculated.
RESULTS AND DISCUSSION
Level of knowledge of sugarcane growers about recommended sugarcane production technology.
Data regarding knowledge of sugarcane Production technology are presented in Table 1.
I. P. G. Student, Dept. of Extn. Edu., N.M.CA, GAD., Navsari. 2. Professor and Head, Dept., of Extn. Edu., N.M.C.A., GAD, Navsari. 3. Asso. Prof. Dept. of Extn., Edu. N.M.CA., GAD, Navsari
125

Impact of Co-operative...
Table 1 : Level of knowledge of member and non-member Sugarcane growers about sugarcane production technology.
Level of knowledge Sugarcane growers
Member (N=94) Non-member (N=94) Number percent Number percent
Low (below 26 score)
Medium (27 to 46 score)
High (above 46 score)
2
62
30
2.13
65.96
31.91
32
60
2
34.04
63.83
2.13
TOTAL 94 100.00 94 100.00
The data presented in Table I indicate that majority (65.96 percent) of members possessed medium level of knowledge followed by 31.91 per cent of respondents who had high level. of knowledge while majority (63.83 percent) of non members were found to be in the category of medium level of knowledge followed by 34.04 percent respondents with low level of knowledge.
The It' test was applied to know whether the member and non member sugarcane growers differed significantly in respect of their knowledge regarding
sugarcane production technology. The data pertaining to this have been presented in Table 2.
Data presented in Table 2 clearly indicate that the Sugarcane growers are the members of any of the Sugar factories had significantly higher knowledge about sugarcane production growers as compared to non-member sugarcane growers. This may be only due to the extension service in transferring the sugarcane technology rendered by surgar cooperatives and the frequent contacts of members with the extension functionaries of sugar factory.
Table 2 : Comparison between member and non-member of Sugarcane growers in respect of their knowledge regarding sugarcane production technology.
Category of respondents
Number Mean Score
Sampling Variance
't' Value
Members
Non-members
94
94
43.35
29.50
46.79
47.61 13.83**
** Signifiacnt at 0.01 per cent level
126
Guj. J. Extn. Edu. VIII & IX 1997 & 1998
RESEARCH NOTE
Impact of Co-operative Sugar Factories in Sugarcane Growers of South Gujarat
s. D. Kavad l , R. B. PateP and ~ D. JoshP
INTRODUCTION
A well - known enunciation of cooperative aims has been "better farming, better business and better living', in ascending order. This enunciation has been justified by the cooperative sugar factories. All cooperative sugar factories have been working as a nuclei for development of rural areas around their factories.
The cooperative sugar factories have their own definite objectives. Keeping these objectives in view, the cooperative sugar factories are working and provide Extension services and welfare to member sugarcane growers to increase their crop production. So, it is necessary to know as to what extent the sugar cooperatives have helped their members specially sugarcane growers to increase their knowledge and how far they have helped in convincing the farmers to adopt recommended sugarcane production technologies.
OBJECTIVES
I. To sfudy knowledge level of sugracane growers about recommended sugarcane production technology.
2. To study the extent of adoption of recommended sugarcane Production technology by sugarcane growers.
METHODLOGY
In the present investigation the population for the study consisted of two groups namely member sugracane growers and non-member sugracane of sugar factories located in Surat, Valsad and Bharuch districts of Gujarat state. Two co-operative sugar factories were selected from each district. From each selected co-operative sugar factory, two villages were selected at random. Thus, in all twelve villages selected. Eight nonmembers and eight members were selected from each village making a total sample of 188 (94 members and 94 non-members) respondents by matching some personal and socio-economic characterstics. The data were collected with the help of structured schedule by personal interview. The data were classified, tabulated and analysed in the light of the objectives of the stud~. For measuring the impact of co-operative sugar factory, 't' value was calculated.
RESULTS AND DISCUSSION
Level of knowledge of sugarcane growers about recommended sugarcane production technology.
Data regarding knowledge of sugarcane Production technology are presented in Table 1.
1. 2. :t
P. G. Student, Dept. bf Extn. Edu., N.M.C.A., GAU., Navsari. Professor and Head, Dept., of Extn. Edu., N.M.C.A., GAU, Navsari. Asso. Prof. Dept. of Extn., Edu. N.M.C.A., GAU, Navsari
'
125
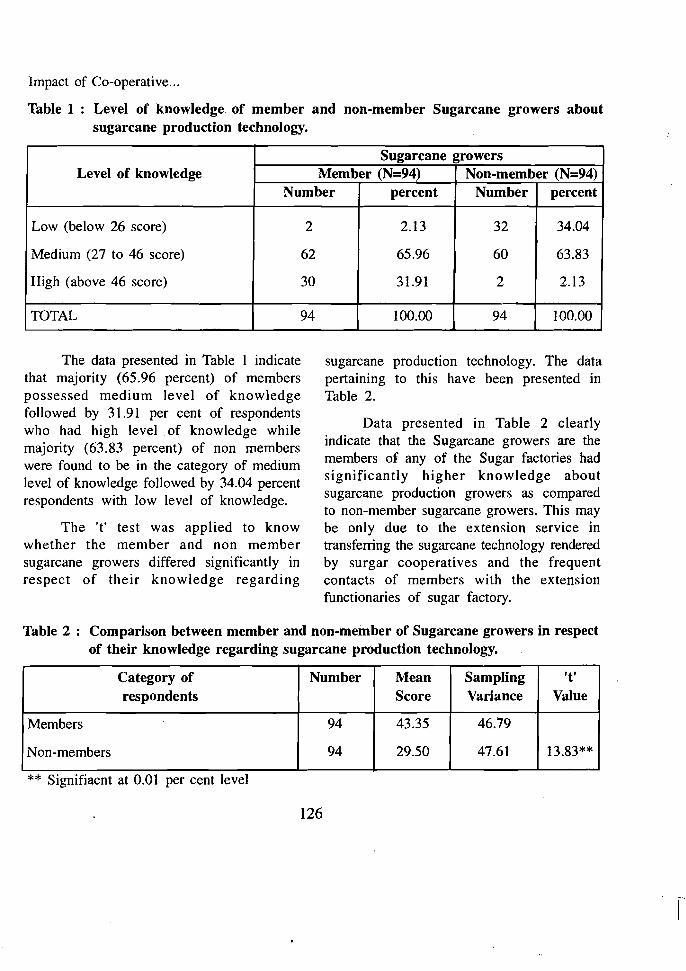
Impact of Co-operative...
Table 1 : Level of knowledge of member and non-member Sugarcane growers about sugarcane production technology.
Level of knowledge Sugarcane growers
Member (N=94) Non-member (N=94) Number percent Number percent
Low (below 26 score)
Medium (27 to 46 score)
High (above 46 score)
2
62
30
2.13
65.96
31.91
32
60
2
34.04
63.83
2.13
TOTAL 94 100.00 94 100.00
The data presented in Table 1 indicate that majority (65.96 percent) of members possessed medium level of knowledge followed by 31.91 per cent of respondents who had high level of knowledge while majority (63.83 percent) of non members were found to be in the category of medium level of knowledge followed by 34.04 percent respondents with low level of knowledge.
The It' test was applied to know whether the member and non member sugarcane growers differed significantly in respect of their knowledge regarding
sugarcane production technology. The data pertaining to this have been presented in Table 2.
Data presented in Table 2 clearly indicate that the Sugarcane growers are the members of any of the Sugar factories had significantly higher knowledge about sugarcane production growers as compared to non-member sugarcane growers. This may be only due to the extension service in transferring the sugarcane technology rendered by surgar cooperatives and the frequent contacts of members with the extension functionaries of sugar factory.
Table 2 : Comparison between member and non-member of Sugarcane growers in respect of their knowledge regarding sugarcane production technology.
Category of respondents
Number Mean Score
Sampling Variance
't' VaIue
Members
Non-members
94
94
43.35
29.50
46.79
47.61 13.83**
** Signifiacnt at 0.01 per cent level
126
I
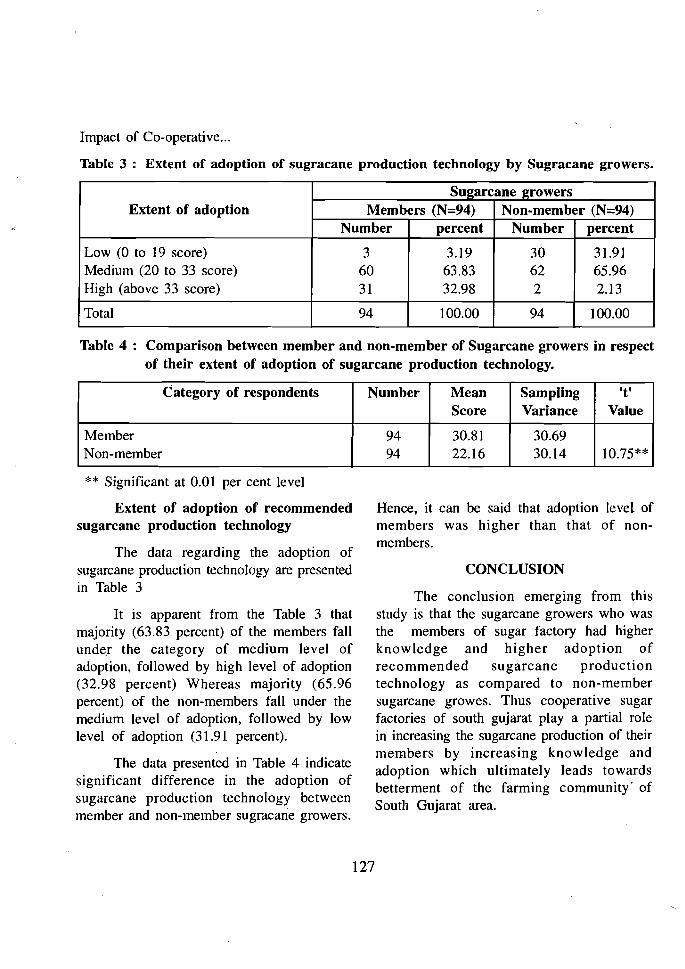
Impact of Co-operative...
Table 3 : Extent of adoption of sugracane production technology by Sugracane growers.
Extent of adoption SU2arcane 2rowers
Members (N=94) Non-member (N=94) Number percent Number percent
Low (0 to 19 score) Medium (20 to 33 score) High (above 33 score)
3 60 31
3.19 63.83 32.98
30 62 2
31.91 65.96 2.13
Total 94 100.00 94 100.00
Table 4: Comparison between member and non-member of Sugarcane growers in respect of their extent of adoption of sugarcane production technology.
Category of respondents Number Mean Score
Sampling Variance
't' Value
Member Non-member
94 94
30.81 22.16
30.69 30.14 10.75**
** Significant at 0.01 per cent level
Extent of adoption of recommended sugarcane production technology
The data regarding the adoption of sugarcane production technology are presented in Table 3
It is apparent from the Table 3 that majority (63.83 percent) of the members fall under the .category of medium level of adoption, followed by high level of adoption (32.98 percent) Whereas majority (65.96 percent) of the non-members fall under the medium level of adoption, followed by low level of adoption (31.91 percent).
The data presented in· Table 4 indicate significant difference in the adoption of sugarcane production technology between member and non-member sugracane growers.
Hence, it can be said that adoption level of members was higher than that of nonmembers.
CONCLUSION
The conclusion emerging from this study is that the sugarcane growers who was the members of sugar factory had higher knowledge and higher adoption of recommended sugarcane production technology as compared to non-member sugarcane growes. Thus cooperative sugar factories of south gujarat play a partial role in increasing the sugarcane production of their members by increasing knowledge and adoption which ultimately leads towards betterment of the farming community' of South Gujarat area.
127
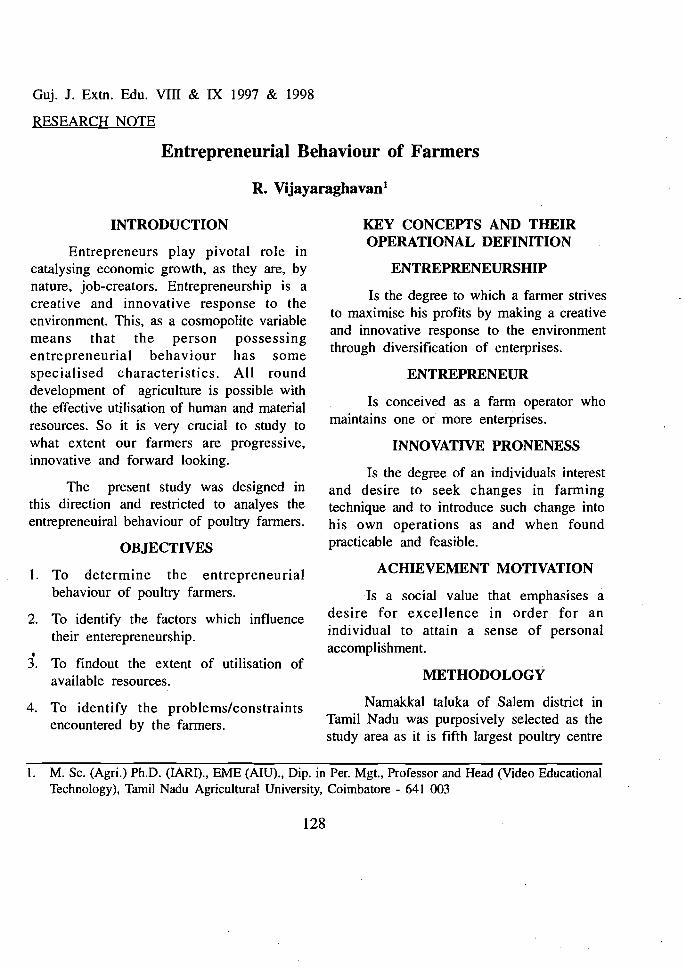
Guj. J. Extn. Edu. VIII & IX 1997 & 1998
RESEARCH NOTE
Entrepreneurial Behaviour of Farmers
R. Vijayaraghavan1
INTRODUCTION
Entrepreneurs play pivotal role in catalysing economic growth, as they are, by nature, job-creators. Entrepreneurship is a creative and innovative response to the environment. This, as a cosmopolite variable means that the person possessing entrepreneurial behaviour has some specialised characteristics. All round developme~t of agriculture is possible with the effective utilisation of human and material resources. So it is very crucial to study to what extent our farmers are progressive, innovative and forward looking.
The present study was designed in this direction and restricted to analyes the entrepreneuiral behaviour of poultry farmers.
OBJECTIVES
I. To determine the entrepreneurial behaviour of poultry farmers.
2. To identify the factors which influence their enterepreneurship.
•3. To findout the extent of utilisation of
available resources.
4. To identify the problems/constraints encountered by the farmers.
KEY CONCEPTS AND THEIR OPERATIONAL DEFINITION
ENTREPRENEURSHIP
Is the degree to which a farmer strives to maximise his profits by making a creative and innovative response to the environment through diversification of enterprises.
ENTREPRENEUR
Is conceived as a farm operator who maintains one or more enterprises.
INNOVATIVE PRONENESS
Is the degree of an individuals interest and desire to seek changes in farming technique and to introduce such change into his own operations as and when found
. practicable and feasible.
ACHIEVEMENT MOTIVATION
Is a social value that emphasises a desire for excellence in order for an individual to attain a sense of personal accomplishment.
METHODOLOGY
Namakkal taluka of Salem district in Tamil Nadu was purposively selected as the study area as it is fifth largest poultry centre
l. M. Sc. (Agri.) Ph.D. (lARI)., EME (AIU).. Dip. in Per. Mgt., Professor and Head (Video Educational Technology), Tamil Nadu Agricultural University. Coimbatore - 641 003
128
Entrepreneurial Behaviour...
in the world. It is also called as the poultry belt of Tamil Nadu and Egg city. Among five blocks of this popular taluka, Puduchathiram block was selected as it had maximum number of poultry brids. Again by using the same parameter seven villages of this block were selected (Thathayankarpatti, Pappinaickenpatti, Thalambady, Karadipatti, Navani, Uduppam and Thanathampatti villages).
A fanner who runs poultry enterprise as a commercial venture in these villages had the probability of having been included as a respondent for the research. Employing proportionate random sampling technique, 120 respondents were included.
MEASUREMENT OF ENTREPRENEURIAL BHAVIOUR
Nandapurkar (1982) had measured enterpreneurial behaviour of small fannes by developing a scale with ten components of enterpreneurial behaviour. Raghavacharyalu (1983) developed a scale using seven components of entrepreneurial behaviour. The same scale was administered by Porchezhian and Vijayaraghavan (1991) with some modification. This scale was used in this research.
RESULTS AND DISCUSSION
More than 80 per cent of the respondents had expressed economic agin and prior income as major factors influencing
129
entrepreneurship. Among the technological factors, guidance from private agencies was expressed by cent per cent of the fanners. In personal factors, majority of them had expressed achievement motivation. Among the sociological factors 'previous occupations' and "societal influence" were found to be key factors. Availability of inputs and good market potential were the m~or factors under physical and market factors respectively.
Regarding water and poultry manure,. cent per cent made full utilisation of these resources. Land was utilized Partially by majority.
Regarding credit, 61.50 per cent of the respondents did not use credit facilities.
The problems encountered by the respondents as expressed by them were; non remunerative egg prices (100 per cent), high cost of feed (90 per cent), presence of IBD diseases (79.17 per cent), high capital investment (75 per cent), high expense for construction of cages (72 per cent), marketing (71.67 per cent), maintenance of health of brids (68.33 per cent), involvement of risk and uncertainty (60 per cent).
IMPLICATION
Entrepreneurial training programmes should be tailored to the needy fanners to inculcate and promote entrepreneurial behaviour in them.
Guj. J. Extn. Edu. VIII & IX 1997 & 1998
RESEARCH NOTE
Constraints Faced by Dairy Personnels in Milk Procurment in Jaipur District of Rajasthan
Rajeev BairathP, Ram Chandra2 and F. L. Sharma3
INTRODUCTON
Sound milk procurement is important for millions of small milk producer and hundreds of dairy plants either in cooperative sector or in private sector. This is the only agency that link both the milk producer and the dairy plants: Therefore, there is an urgent need for taking up bold steps for raising milk procurement upto desired level. Though the formulation of any plan is an important aspect, yet more important is actual implementation of the programme in the field condition where numerous problems are encountered. Until now, not much empirical evidence based on scientifically planned study was available regarding actual factors impeding the milk procurement at society and union level. While it is vital to delineate these constraints at different levels, still more important is to assess the degree of seriousness of each of the constraints. In view of these facts, the present study was undertaken with the following objectives:
OBJECTIVES
(1) To find out the constraints in milk procurement expressed by society under study area.
(2) To identify factors affecting constraints perceived by the respondents.
METHODOLOGY
The study was conducted in purposively selected Milk producer Cooperative Union Limited (MPCUL), jaipur [Rajasthan]. Out of 22 milk routs of Jaipur District Milk Producers Cooperative Union Limited, four milk routs viz;Dadu, Chomu, Sanganer and Chaksu were selected randomly for the study. Two Milk Cooperative Societies were identified randomly from each selected route to make a total of eight dairy cooperative societies. Thus, a total of 40 respondents from eight, societies were included for the study.The data were collected with the help of strucred interview schedule through personal interview method. The statistical methods used for data analysis were mean, S.D, correlation and t-test.
RESULTS AND DISCUSSION
Keeping in view the low rate of milk porcurement in dairy cooperative, study was carried out to delineate the constraints impeding in milk procurement as viewed by members of managing committee of society and union officials engaged in milk procurement.
1. Asst. Prof., Directorate of Extension Education, RAU, Udaipur. (Raj.) 2. Principle Scientist and Head, Division of Dairy Extension, N D R I, Kamal. 3. Asst. Prof., Department of Extension Education, RAU, Udaipur. (Raj.)
130
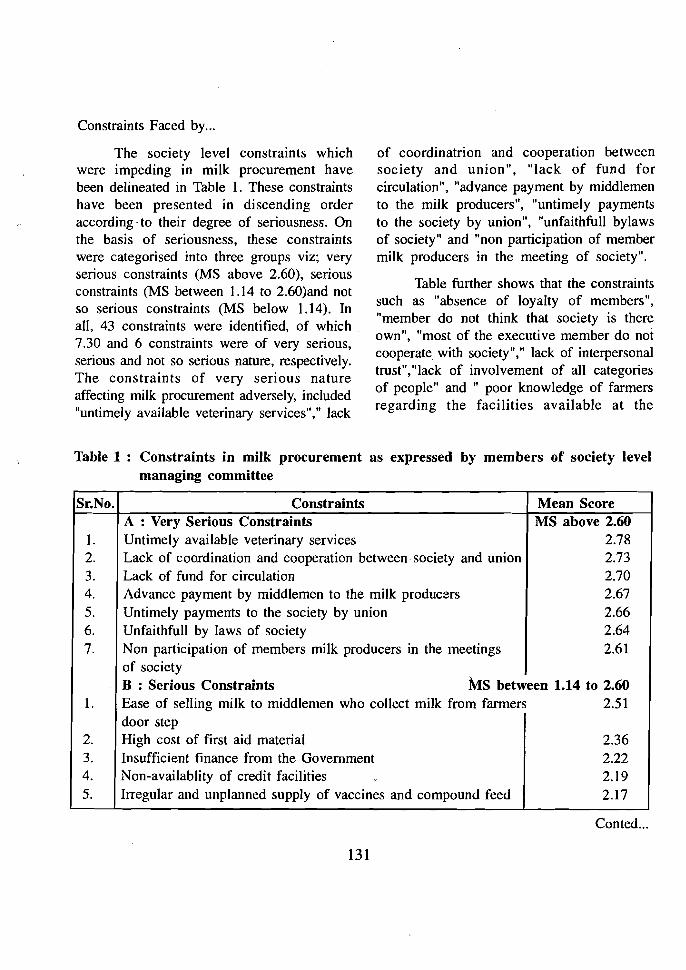
Constraints Faced by...
The society level constraints which were impeding in milk procurement have been delineated in Table I. These constraints have been presented in discending order according· to their degree of seriousness. On the basis of seriousness, these constraints were categorised into three groups viz; very serious constraints (MS above 2.60), serious constraints (MS between 1.14 to 2.60)and not so serious constraints (MS below 1.14). In all, 43 constraints were identified, of which 7.30 and 6 constraints were of very serious, serious and not so serious nature, respectively. The constraints of very serious nature affecting milk procurement adversely, included "untimely available veterinary services"," lack
Table 1 : Constraints in milk procurement managing committee
of coordinatrion and cooperation between society and union", "lack of fund for circulation", "advance payment by middlemen to the milk producers", "untimely payments to the society by union", "unfaithfull bylaws of society" and "non participation of member milk producers in the meeting of society".
Table further shows that the constraints such as "absence of loyalty of members", "member do not think that society is there own", "most of the executive member do not cooperate with society"," lack of interpersonal trust","lack of involvement of all categories of people" and" poor knowledge of farmers regarding the facilities available at the
as expressed by members of society level
Sr.No.1 Constraints I Mean Score A : Very Serious Constraints MS above 2.60
I. Untimely available veterinary services 2.78 2. Lack of coordination and cooperation between society and union 2.73 3. Lack of fund for circulation 2.70 4. Advance payment by middlemen to the milk producers 2.67 5. Untimely payments to the society by union 2.66 6. Unfaithfull by laws of society 2.64 7. Non participation of members milk producers in the meetings 2.61
of society B : Serious Constraints MS between 1.14 to 2.60
I. IEase of selling milk to middlemen who collect milk from farmers 2.51 door step
2. High cost of first aid material 2.36 3. Insufficient finance from the Government 2.22 4. Non-availablity of credit facilities 2.19 5. Irregular and unplanned supply of vaccines and compound feed 2.17
Conted...
131
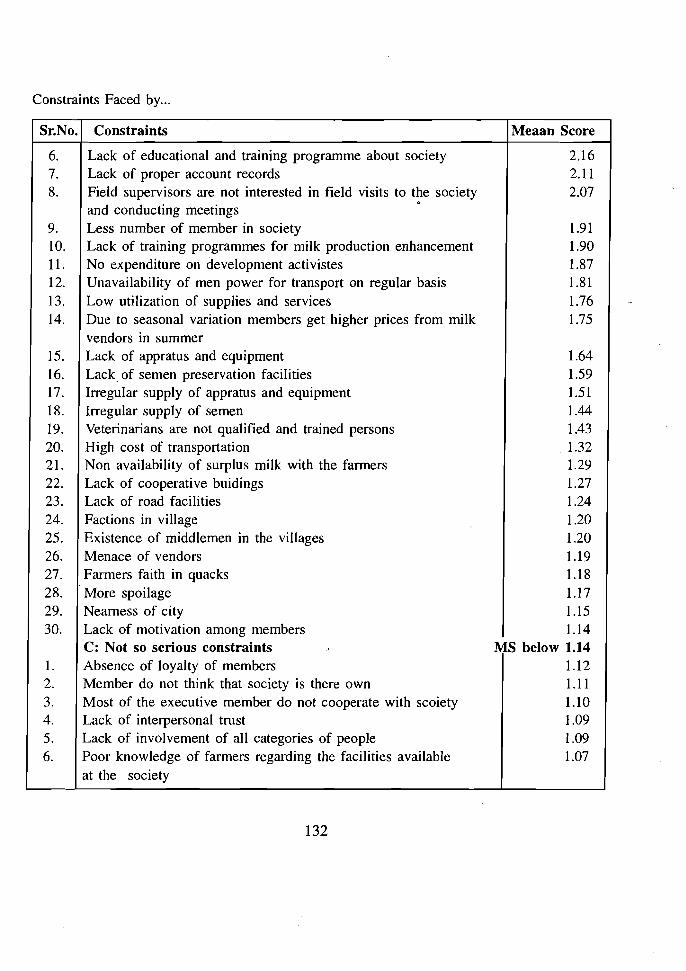
Constraints Faced by...
Sr.N0.1 Constraints Meaan Score
6. Lack of educational and training programme about society 2.16 7. Lack of proper account records 2.11 8. Field supervisors are not interested in field visits to the society 2.07
and conducting meetings ~
9. Less number of member in society 1.91 10. Lack of training programmes for milk production enhancement 1.90 II. No expenditure on development activistes 1.87
1.8112. Unavailability of men power for transport on regular basis 1.7613. Low utilization of supplies and services
14. Due to seasonal variation members get higher prices from milk 1.75 vendors in summer
]5. Lack of appratus and equipment 1.64 1.5916. Lack of semen preservation facilities
17. Irregular supply of appratus and equipment 1.51 ]8. Irregular supply of semen 1.44 19. Veterinarians are not qualified and trained persons 1.43 20. High cost of transportation 1.32 21. Non availability of surplus milk with the farmers 1.29 22. Lack of cooperative buidings 1.27 23. Lack of road facilities 1.24 24. Factions in village 1.20 25. Existence of middlemen in the villages 1.20 26. Menace of vendors 1.19 27. Farmers faith in quacks 1.18 28. . More spoilage 1.17 29. Nearness of city 1.15 30. Lack of motivation among members . 1.14
C: Not so serious constraints MS below 1.14 ] . Absence of loyalty of members 1.12 2. Member do not think that society is there own 1.11 3. Most of the executive member do not cooperate with scoiety 1.10 4. Lack of interpersonal trust 1.09 5. Lack of involvement of all categories of people 1.09 6. Poor knowledge of farmers regarding the facilities available 1.07
at the society
132
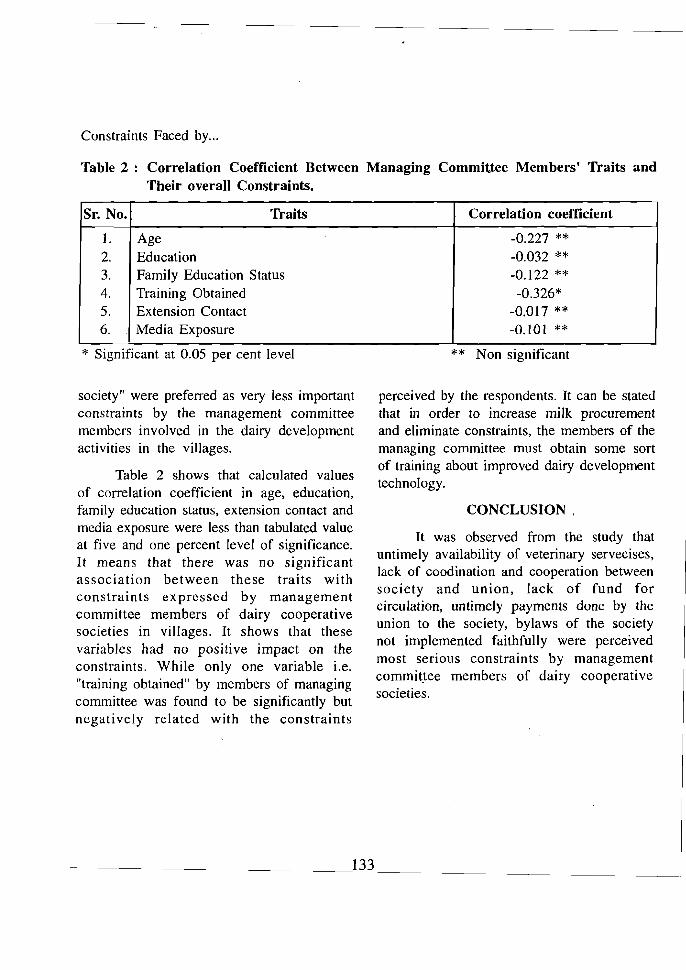
Constraints Faced by...
Table 2 : Correlation Coefficient Between Managing Committee Members' Traits and Their overall Constraints.
Sr. No. Traits Correlation coefficient
1.
2. 3. 4. 5. 6.
Age Education Family Education Status Training Obtained Extension Contact Media Exposure
-0.227 ** -0.032 ** -0.122 ** -0.326*
-0.017 ** -0.101 **
* Significant at 0.05 per cent level
society" were preferred as very less important constraints by the management committee members involved in the dairy development activities in the villages.
Table 2 shows that calculated values of correlation coefficient in age, education, family education status, extension contact and media exposure were less than tabulated value at five and one percent level of significance. It means that there was no significant association between these traits with constraints expressed by management committee members of dairy cooperative societies in villages. It shows that these variables had no positive impact on the constraints. While only one variable i.e. "training obtained" by members of managing committee was found to be significantly but negatively related with the constraints
** Non significant
perceived by the respondents. It can be stated that in order to increase milk procurement and eliminate constraints, the members of the managing committee must obtain some sort of training about improved dairy development technology.
CONCLUSION .
It was observed from the study that untimely availability of veterinary servecises, lack of coodination and cooperation between society and union, lack of fund for circulation, untimely payments done by the union to the society, bylaws of the society not implemented faithfully were perceived most serious constraints by management commit,tee members of dairy cooperative societies.
Guj. J. Extn. Edu. VIII & IX 1997 & 1998
RESEARCH NOTE
Training Needs of Rural Women
R. F. Thakor1 and K. F. PateP INTRODUCTION
Women play a significant role in agricultural life in India as they contribute one third of labour force required for farming operations and allied enterprises. Their involvement in agricultural operations is besides their usual obligation of discharging domestic work. Their role in the social and economic development of the nation in now being recogised gradually. Intensive farming practices have put them to more hardwork and totally pre-occupied without much)eisure. However, women in rural areas are generally less responsive to the improved technologies, Since they are not exposed to these technologies, Therefore, it is a need of time to train the women talk in different areas of agriculture and animal husbandry to keep them abreast of the latest innovations available. So as to pinpoint the areas requiring training to the rural women engaged in different farming practices, the present study was conducted _with the objective, viz, to assess the training needs of rural women with regards to agriculture and animal husbandry enterprises.
METHODOLOGY
Kheda district of Gujarat state was selected purposively, Stratified random sampling technique was emloyed to select the sample. Out of ten talukas of the district, four talukas were selected randomly. The list
of villages each selected taluka were obtained from the district gazatte. Further, from this list, four villages from each taluka were selected using simple random sampling technique. From each selected village, list of rural women were obtained. This listed rural women were then classified into three categories viz, small, medium and large based on their land holding. Finally, from the selected villages four rural women each from three categories were selected at random. Thus, the total sample for the study was confined to 192 rural women. Out of this 180 rural women were available at the time of interview. Therefore, the sample size was restricted to 180 respondents.
Assessment of training needs :
To measure the intensity of trammg needs, tweleve areas in agriculture and nine in Animal Husbandry in which rural women needed training were identified for the study in consultation with extension specialists and Agricultural scientists. A three point rating scale (Needed, less needed, not needed) was employed to measure the training needs of rural women in selected areas. Respondents were interviewed personally. They were asked to indicate anyone of alternative responeses against each selected items depending upon their training requirement. The data were analysed by using frequency distribution and percentages.
I. Training Orgaizer, Krishi Vigyan Kendra, Mundra-(Gujarat) 2. Dy. Director of Extension Education (Zone), GAU, Anand.
134
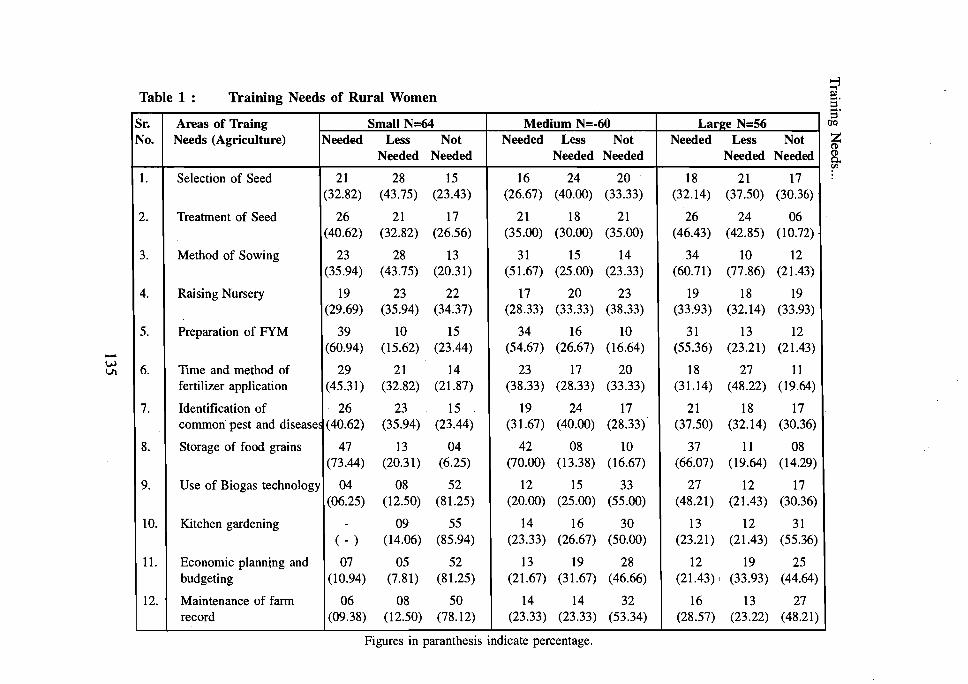
Table 1 : Training Needs of Rural Women
-w VI
Sr. Areas of Traing Small N=64 Medium N=-60 Large N=56 No. Needs (Agriculture) Needed Less Not
Needed Needed
21 28 15
Needed Less Not Needed Needed
16 24 20
Needed Less Not Needed Needed
18 21 171. Selection of Seed (32.82) (43.75) (23.43) (26.67) (40.00) (33.33) (32.14) (37.50) (30.36)
2. Treatment of Seed 26 21 17 21 18 21 26 24 06 (40.62) (32.82) (26.56) (35.00) (30.00) (35.00) (46.43) (42.85) (10.72)
3. Method of Sowing 23 28 13 31 15 14 34 10 12 (35.94) (43.75) (20.31) (51.67) (25.00) (23.33) (60.71) (77.86) (21.43)
4. Raising Nursery 19 23 22 17 20 23 19 18 19 (29.69) (35.94) (34.37) (28.33) (33.33) (38.33) (33.93) (32.14) (33.93)
5. Preparation of FYM 39 10 15 34 16 10 31 13 12 (60.94) (15.62) (23.44) (54.67) (26.67) (16.64) (55.36) (23.21) (21.43)
6. Time and method of 29 21 14 23 17 20 18 27 11 fertilizer application (45.31) (32.82) (21.87) (38.33) (28.33) (33.33) (31.14) (48.22) (19.64)
7. Identification of 26 23 15 19 24 17 21 18 17 common pest and disease~ (40.62) (35.94) (23.44) (31.67) (40.00) (28.33) (37.50) (32.14) (30.36)
8. Storage of food grains 47 13 04 42 08 10 37 11 08 (73.44) (20.31) (6.25) (70.00) (13.38) (16.67) (66.07) (19.64) (14.29)
9. Use of Biogas technology 04 08 52 12 15 33 27 12 17 (06.25) (12.50) (81.25) (20.00) (25.00) (55.00) (48.21) (21.43) (30.36)
10. Kitchen gardening - 09 55 14 16 30 13 12 31 ( - ) (14.06) (85.94) (23.33) (26.67) (50.00) (23.21) (21.43) (55.36)
11. Economic planntng and 07 05 52 13 19 28 12 19 25 budgeting (10.94) (7.81) (81.25) (21.67) (31.67) (46.66) (21.43) I (33.93) (44.64)
12. Maintenance of fann 06 08 50 14 14 32 16 13 27 record (09.38) (12.50) (78.12) (23.33) (23.33) (53.34) (28.57) (23.22) (48.21)
Figures in paranthesis indicate percentage.
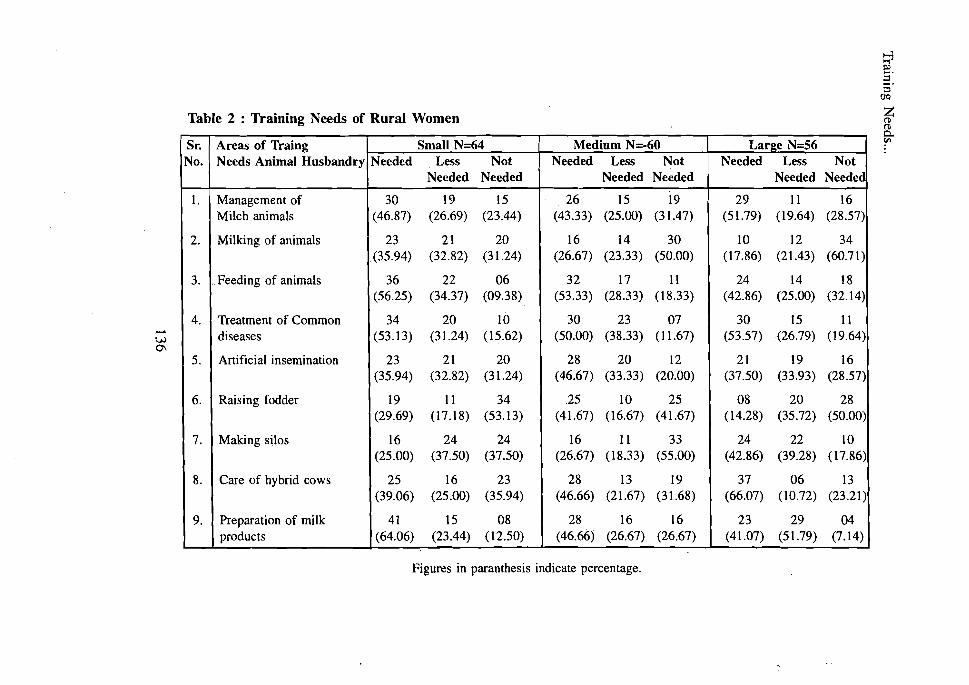
~ ~. ::l S'
OQ
Z (1)Table 2 : Training Needs of Rural Women (1)
0en
..... VJ 0\
Sr. Areas of Traing Small N=64 Medium N=·60 Larl~e N=S6 No. Needs Animal Husbandry Needed Less Not
Needed Needed
30 19 15
Needed Less Not Needed Needed
26 15 19
Needed Less Not Needed Needed
29 11 161. Management of Milch animals (46.87) (26.69) (23.44) (43.33) (25.00) (31.47) (51.79) (19.64) (28.57)
2. Milking of animals 23 21 20 16 14 30 10 12 34 (35.94) (32.82) (31.24) (26.67) (23.33) (50.00) (17.86) (21.43) (60.71)
3. .. Feeding of animals 36 22 06 32 17 11 24 14 18 (56.25) (34.37) (09.38) (53.33) (28.33) (18.33) (42.86) (25.00) (32.14)
4. Treatment of Common 34 20 10 30 23 07 30 15 11 diseases (53.13) (31.24) (15.62) (50.00) (38.33) (11.67) (53.57) (26.79) (19.64)
5. Artificial insemination 23 21 20 28 20 12 21 19 16 (35.94) (32.82) (31.24) (46.67) (33.33) (20.00) (37.50) (33.93) (28.57)
6. Raising fodder 19 11 34 .25 10 25 08 20 28 (29.69) (17.18) (53.13) (41.67) (16.67) (41.67) (14.28) (35.72) (50.00)
7. Making silos 16 24 24 16 11 33 24 22 10 (25.00) (37.50) (37.50) (26.67) (18.33) (55.00) (42.86) (39.28) (17.86)
8. Care of hybrid cows 25 16 23 28 13 19 37 06 13 (39.06) (25.00) (35.94) (46.66) (21.67) (31.68) (66.07) (10.72) (23.21)
9. Preparation of milk 41 15 08 28 16 16 23 29 04 products (64.06) (23.44) (12.50) (46.66) (26.67) (26.67) (41.07) (51.79) (7.14)
Figures in paranthesis indicate percentage.
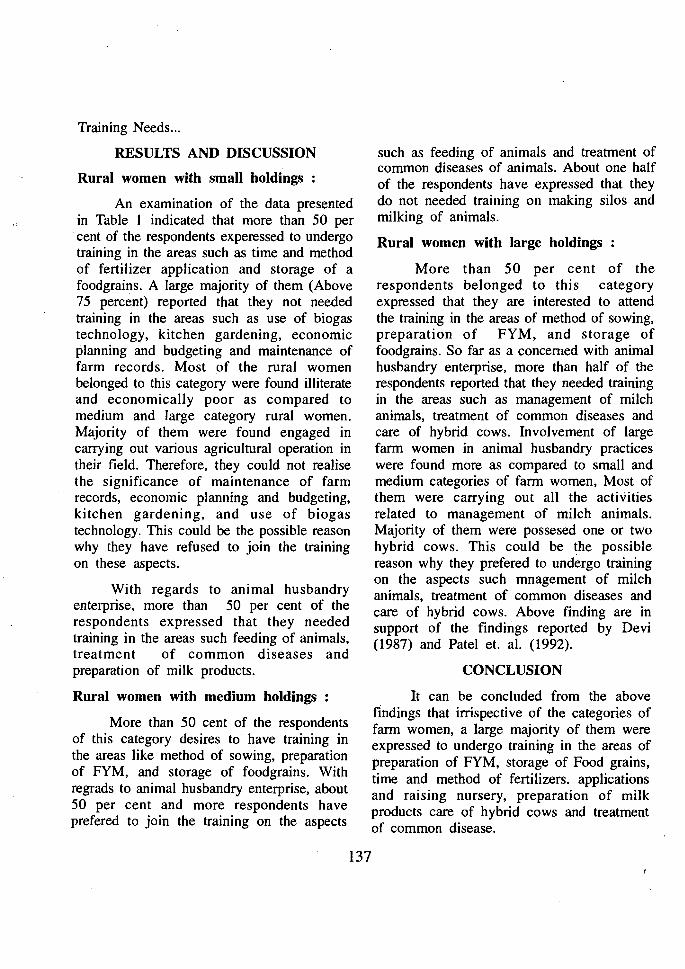
Training Needs...
RESULTS AND DISCUSSION
Rural women with small holdings :
An examination of the data presented in Table 1 indicated that more than 50 per
.cent of the respondents experessed to undergo training in the areas such as time and method of fertilizer application and storage of a foodgrains. A large majority of them (Above 75 percent) reported that they not needed training in the areas such as use of biogas technology, kitchen gardening, economic planning and budgeting and maintenance of farm records. Most of the rural women belonged to this category were found illiterate and economically poor as compared to medium and large category rural women. Majority of them were found engaged in carrying out various agricultural operation in their field. Therefore, they could not realise the significance of maintenance of farm records, economic planning and budgeting, kitchen gardening, and use of biogas technology. This could be the possible reason why they have refused to join the training on these aspects.
With regards to animal husbandry enterprise, more than 50 per cent of the respondents expressed that they needed training in the areas such feeding of animals, treatment of common diseases and preparation of milk products.
Rural women with medium holdings
More than 50 cent of the respondents of this category desires to have training in the areas like method of sowing, preparation of FYM, and storage of foodgrains. With regrads to animal husbandry enterprise, about 50 per cent and more respondents have prefered to join the training on the aspects
such as feeding of animals and treatment of common diseases of animals. About one half of the respondents have expressed that they do not needed training on making silos and milking of animals.
Rural women with large holdings :
More than 50 per cent of the respondents belonged to this category expressed that they are interested to attend the training in the areas of method of sowing, preparation of FYM, and storage of foodgrains. So far as a concerned with animal husbandry enterprise, more than half of the respondents reported that they needed training in the areas such as management of milch animals, treatment of common diseases and care of hybrid cows. Involvement of large farm women in animal husbandry practices were found more as compared to small and medium categories of farm women, Most of them were carrying out all the activities related to management of milch animals. Majority of them were possesed one or two hybrid cows. This could be the possible reason why they prefered to undergo training on the aspects such mnagement of milch animals, treatment of common diseases and care of hybrid cows. Above finding are in support of the findings reported by Devi (1987) and Patel et. al. (1992).
CONCLUSION
It can be concluded from the above findings that irrispective of the categories of farm women, a large majority of them were expressed to undergo training in the areas of preparation of FYM, storage of Food grains, time and method of fertilizers. applications and raising nursery, preparation of milk products care of hybrid cows and treatment of common disease.
137
Guj. J. Extn. Edu. VIII & IX 1997 & 1998
RESEARCH NOTE
Constraints in Use of Chemical Fertilizer among the Tribals of Bastar (M.P.)
R. S. Sengar1
INTRODUCTON
During the last decade the fertilizer consumption in India has increased ten fold in terms of Nitrogen and twenty time in terms of phosphatic fertilizer.
The consumption of chemical fertilizer per unit of cropped area in Madhya Pradesh is 31 kg/ha and the consumption of chemical fertlizer in Bastar District is only 15.09 kgl ha (N), 5. IO kg/ha (P
2 Os) and 1.7 (kglha)
(~). There are many constraints for lower consumption of chemical fertilizer.
It is high time that the problems of farmers be critically observed and facts about lower consumption of chemjcal fertilizer be identified and efforts be made to increase fertilizer onsumption.
Keeping this view in mind, the present study was carried out with following objectives.
OBJECTIVES
(I) To identify the constraints towards lower consumption of chemical fertilizer among the tribals of Bastar (M. P.).
(2) To find out the suggestions to increase consumption of chemical fertilizer among the tribals.
METHODOLOGY
Bastar district has been divided into four Agriculture units viz., Kanker, Kondagaon, Jagdalpur and Dantewada out of which Jagdalpur Agriculture unit was purposively selected for this study. There are ten blocks in Jagdalpur Agriculture unit, out of which three blocks were selected and two villages were randomly ~elected from each block. From each village, 20 farmers were selected at. random making the total sample of 120 farmers.
Constraints faced by the farmers in use of chemical fertilizer were recorded in a schedule prepared for the purpose.
Response towards Research system, Extension approach, Socio Economic condition, Technology, Psychology and availability etc. were recorded as major constraints and many sub constraints were also recorded on a three point continuum i.e., Agree, Undecided and disagree and the score was calculated against each sub constriaint.
The rank position of the each sub constraint was decided on the basis of mean score against each constraint.
I. Junior Scientist (Extension Education, ZARS, IOAU, Raipur), Kumhrawand, Jagdalpur, District - Bastar (M. P.) 494 005.
138
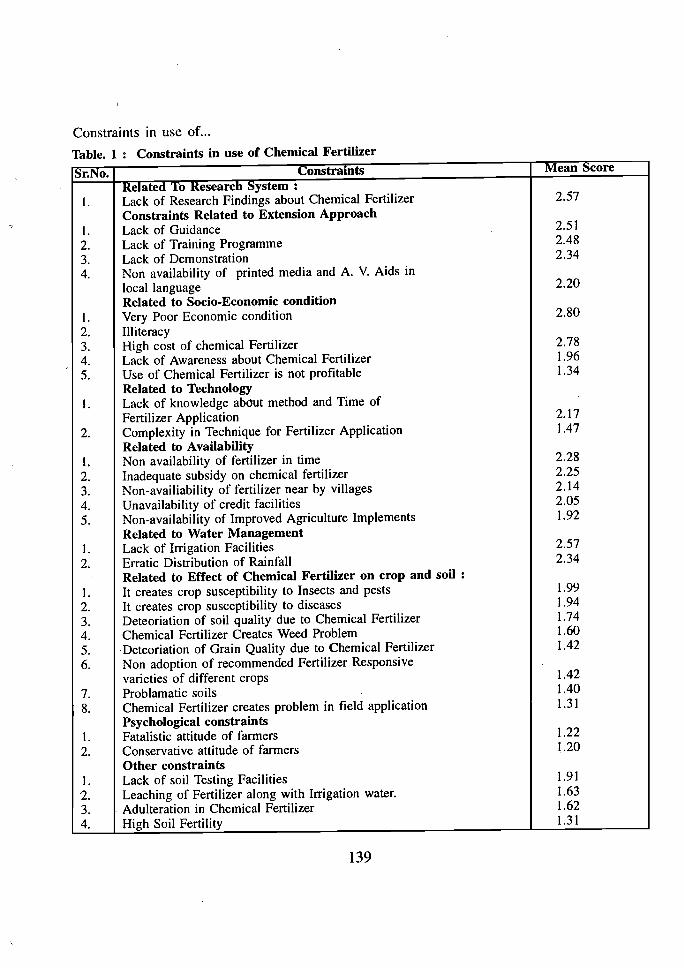
Constraints in use of...
Table. 1: Constraints in use of Chemical Fertilizer
Sr.No. Constramts Mean Score
Kelated '10 Research System: I. Lack of Research Findings about Chemical Fertilizer
Constraints Related to Extension Approach
2.57
I. Lack of Guidance 2.51
2. Lack of Training Programme 2.48
3. 4.
Lack of Demonstration Non availability of printed media and A. V. Aids in
2.34
local language Related to Socio-Economic condition
2.20
I. 2.
Very Poor Economic condition Illiteracy
2.80
3. High cost of chemical Fertilizer 2.78
4. Lack of Awareness about Chemical Fertilizer 1.96
5.
I.
Use of Chemical Fertilizer is not profitable Related to Technology Lack of knowledge abdut method and Time of
1.34
Fertilizer Application 2.17
2. Complexity in Technique for Fertilizer Application Related to Availability
1.47
I. Non availability of fertilizer in time 2.28
2. Inadequate subsidy on chemical fertilizer 2.25
3. Non-availiability of fertilizer near by villages 2.14
4. Unavailability of credit facilities 2.05
5. Non-availability of Improved Agriculture Implements Related to Water Management
1.92
I. Lack of Irrigation Facilities 2.57
2. Erratic Distribution of Rainfall Related to Effect of Chemical Fertilizer on crop and soil :
2.34
I. It creates crop susceptibility to Insects and pests 1.99
2. It creates crop susceptibility to diseases 1.94
3. Deteoriation of soil quality due to Chemical Fertilizer 1.74
4. Chemical Fertilizer Creates Weed Problem 1.60
5. 6.
Deteoriation of Grain Quality due to Chemical Fertilizer Non adoption of recommended Fertilizer Responsive
1.42
varieties of different crops 1.42
7. Problamatic soils 1.40
8. Chemical Fertilizer creates problem in field application Psychological constraints
1.31
I. Fatalistic attitude of farmers 1.22
2. Conservative attitude of farmers Other constraints
1.20
I. Lack of soil Testing Facilities 1.91
2. Leaching of Fertilizer along with Irrigation water. 1.63
3. Adulteration in Chemical Fertilizer 1.62
4. High Soil Fertility 1.31
139
Constraints in use of...
RESULTS AND DISCUSSION
On the basis of the findings of this study, it was observed that there were numerous constraints which affected the use of chemical fertilizers among the tribals.
Lack of research findings about chemical fertilizer and lack of guidance and training programme were the major constraints related to research system and extension approach respectively. So far as socio-economic condition of the tribals was concerned, they rated their poor economic condition and high cost of chemical fertilizers as the major constraints whereas lack of knowledge about method and time of fertilizer application was the main technological constraint. With regard to availability of chemical fertilizers, farmers considered nonavailability of fertilizers in time and inadequate subsidy to be the major constraints. Lack of irrigation facilities and erratic distribution of rainfall were the main constraints related to water management. Regarding constraints in relation to effect of chemical fertilizer on crop and soil, they
opined "Chemical fertilizers create crop susceptibility to insects, pests and diseases and deteriorate soil quality" as the major constraints. Fatalistic and conservative attitude of farmers was the major psychological constraint where as lack of soil testing facilities, leaching of fertilizer alongwith irrigation water and adulteration in chemical fertilizer were some other important constraints in the use of chemical fertilizers among the tribals.
CONCLUSION
It can be concluded on the basis of findings from this study that there are numerous constraints in use of chemical fertilizer among the tribal farmers. This investigation shows that most of these constraints are beyond the control of the farmers, it is therefore suggested that the Govt. should prepare immediate and appropriate long term action plan to over come these. A sincere effort is also needed on the part of research station and the state Extension officers to device way for elimination of these constraints.
•:. This is the miracle that happens every time to those who really love : the more they give, the more they posses's of that precious nourishing love from which flowers and children have their strength and which could help all human beings if they would take it without doubting...
- RAINER MARIA RILKE
140

Guj. J. Extn. Edu. VIII & IX 1997 & 1998
RESEARCH NOTE
Correlates of Knowledge about Ginger Production Technology
P. G. Patilt, S. B. Vidhate2 and G. K. Waman3
INTRODUCTION
The per unit production of ginger mainly depends upon the technical know-how and extent of its use by the ginger growers. Therefore, it was thought opportune to probe into the level of knowledge of the ginger growers about the recommended ginger production technology.
Keeping this background in view, the present research study was planned during the year 1997 with the objectives as :
(l) To ascertain the knowledge level of the Ginger growers about recommended technology of the ginger production.
(2) To find out the relationship between the selected charcteristics of the Ginger growers and their level of knowledge of the recommended Ginger production technology.
METHODOLOGY
The research study was carried out in purposively selected Satara district of Maharashtra State because of more area under ginger crop. For the purpose of study two tehsils namely Satara and Koregaon from the Satara district were selected. Five villages
each from satara and Koregaon tehsils were selected. Thus, totally 10 villages were selected with the help of two stage random sampling technique. From the selected villages, 150 ginger growers were sampled by using equal interval method of random sampling. The data were collected with the help of a specially structured schedule.
For the measurement of knowledge, a comprehensive list of the package of practices recommended for crop was prepared in consultation with horticulture experts. Accordingly, 12 critical practices were identified for study viz. soil type, primary tillage, improved varieties, seedrate, seed treatment, sowing time, sowing methods, fertilizer management, interculturing, water management, pest and disease control and harvesting. The scores were assigned as 2, 1 and zero for complete, partial and no knowledge about the recommended parctices of Ginger production technology respectively. After summing up the total scores of all the practices for each ginger grower, they were categorised into three groups as under
i Low - Score upto 38 ii Medium - Score 39 to 54 iii High - Score 55 and above
1. Asst. Prof. of Extension Education, College of Agri. Dhule (M.S.) 2. Ex-Post Graduate Student, M.P.K.Y., Rahuri (M.S.) 3. Junior Research As~istant, Extension Education Section, College of Agri. Dhule (M. S.)
141
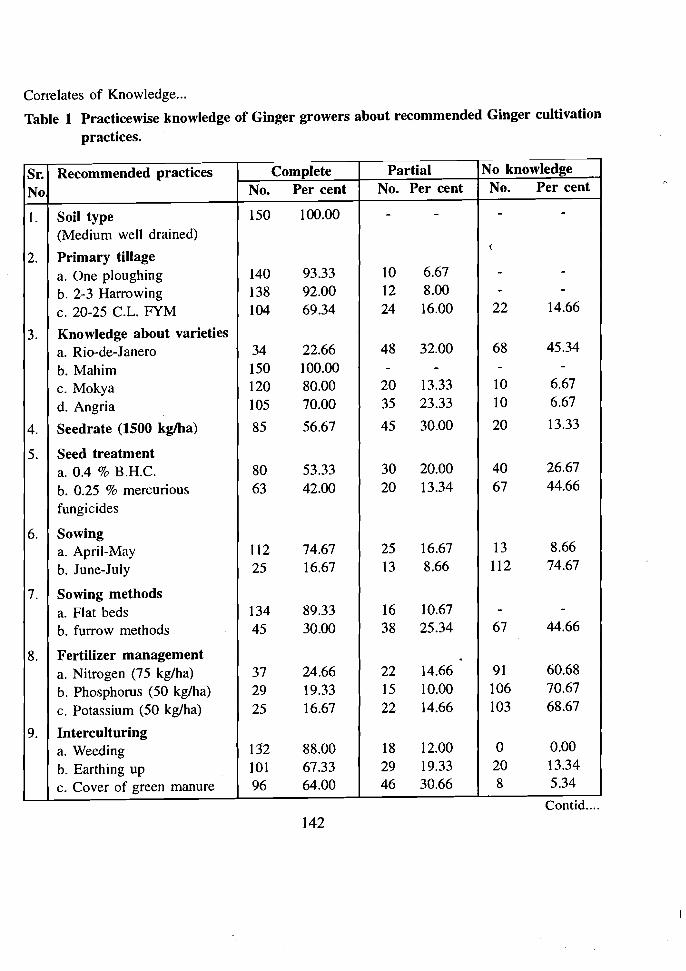
--
Correlates of Knowledge...
Table 1 Practicewise knowledge of Ginger growers about recommended Ginger cultivation practices.
Recommended practices No Sr.
No.
150 (Medium well drained) Soil type I.
Primary tillage2. 140a. One ploughing 138b. 2-3 Harrowing 104c. 20-25 c.L. FYM
Knowledge about varieties 3. a. Rio-de-Janero b. Mahim c. Mokya d. Angria
Seedrate (1500 kglha) 4.
Seed treatment 5. a. 0.4 % B.H.C. b. 0.25 % mercurious fungicides
Sowing6. a. April-May b. June-July
Sowing methods 7. a. Flat beds b. furrow methods
Fertilizer management 8. a. Nitrogen (75 kg/ha) b. Phosphorus (50 kg/ha) c. Potassium (50 kg/ha)
Interculturing9. a. Weeding b. Earthing up c. Cover of green manure
34 150
Partial No knowledge No. Per cent No. Per cent
- -- -
(
10 6.67 - -12 8.00 - -24 16.00 22 14.66
48 32.00 68 45.34
- - - -20 13.33 10 6.67 35 23.33 10 6.67
45 30.00 20 13.33
30 20.00 40 26.67 20 13.34 67 44.66
25 16.67 13 8.66 13 8.66 112 74.67
16 10.67 - -38 25.34 67 44.66
. 22 14.66 91 60.68 15 10.00 106 70.67 22 14.66 103 68.67
18 12.00 0 0.00 29 19.33 20 13.34 46 30.66 8 5.34
120 80.00 105 70.00
85 56.67
80 53.33 63 42.00
112 74.67 25 16.67
134 89.33 45 30.00
37 24.66 29 19.33 25 16.67
132 88.00 101 67.33 96 64.00
Contid.... 142
Complete Per cent
100.00
93.33 92.00 69.34
22.66 100.00
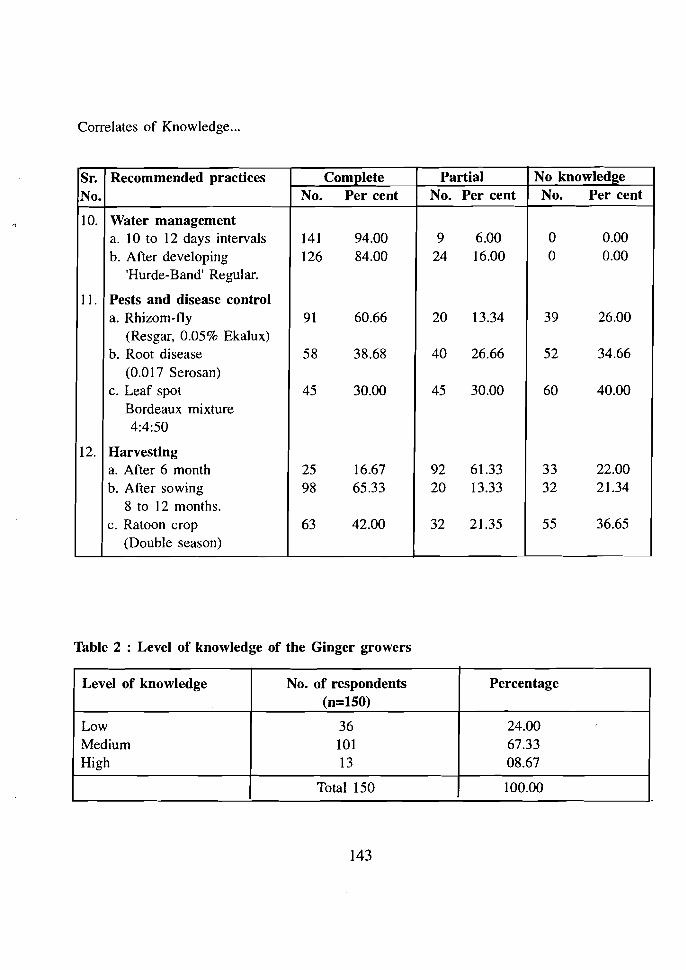
Correlates of Knowledge...
Sr. Recommended practices Complete Partial No knowlede:e No. No. Per cent No. Per cent No. Per cent
10. Water management a. 10 to 12 days intervals 141 94.00 9 6.00 0 0.00 b. After developing
'Hurde-Band' Regular. 126 84.00 24 16.00 0 0.00
11. Pests and disease control a. Rhizom-f1y
(Resgar, 0.05% Ekalux) 91 60.66 20 13.34 39 26.00
b. Root disease (0.017 Serosan)
58 38.68 40 26.66 52 34.66
c. Leaf spot Bordeaux mixture 4:4:50
45 30.00 45 30.00 60 40.00
12. Harvesting a. After 6 month 25 16.67 92 61.33 33 22.00 b. After sowing
8 to 12 months. 98 65.33 20 13.33 32 21.34
c. Ratoon crop (Double season)
63 42.00 32 21.35 55 36.65
Table 2 : Level of knowledge of the Ginger growers
Level of knowledge No. of respondents (n=150)
Percentage
Low 36 24.00 Medium 101 67.33 High 13 08.67
Total 150 100.00
143
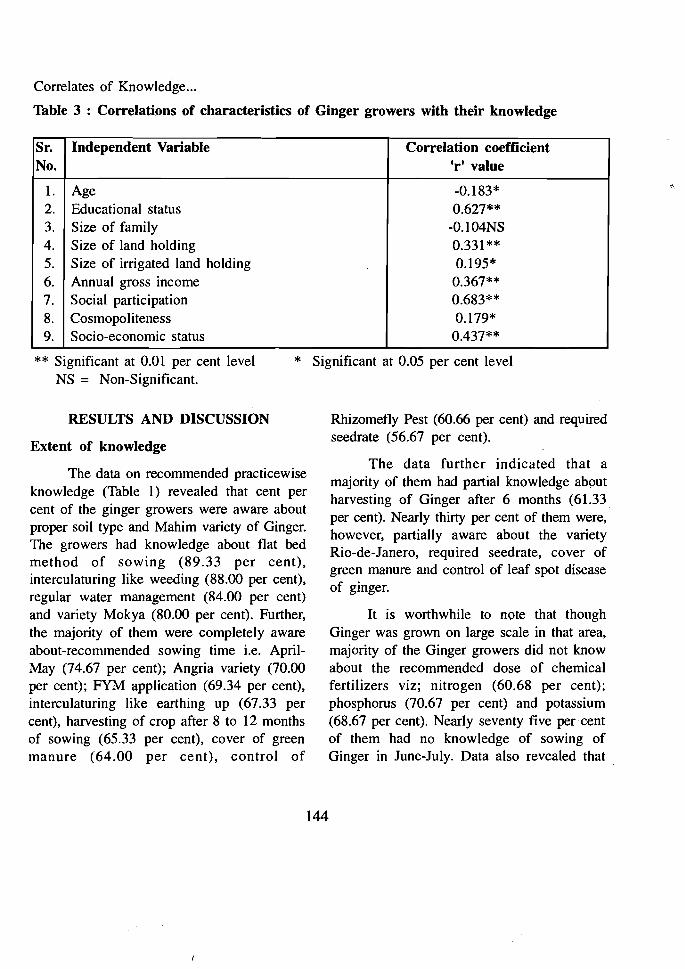
Correlates of Knowledge...
Table 3 : Correlations of characteristics of Ginger growers with their knowledge
Sr. No.
Independent Variable Correlation coefficient 'r'value
1. 2. 3. 4. 5. 6. 7. 8. 9.
Age Educational status Size of family Size of land holding Size of irrigated land holding Annual gross income Social participation Cosmopoliteness Socio-economic status
-0.183* 0.627**
-O.104NS 0.331 ** 0.195*
0.367** 0.683** 0.179* 0.437**
** Significant at 0.01 per cent level * NS = Non-Significant.
RESULTS AND DISCUSSION
Extent of knowledge
The data on recommended practicewise knowledge (Table I) revealed that cent per cent of the ginger growers were aware about proper soil type and Mahim variety of Ginger. The growers had knowledge about flat bed method of sowing (89.33 per cent), interculaturing like weeding (88.00 per cent), regular water management (84.00 per cent) and variety Mokya (80.00 per cent). Further, the majority of them were completely aware about-recommended sowing time Le. AprilMay (74.67 per cent); Angria variety (70.00 per cent); FYM application (69.34 per cent), interculaturing like earthing up (67.33 per cent), harvesting of crop after 8 to 12 months of sowing (65.33 per cent), cover of green manure (64.00 per cent), control of
~.
Significant at 0.05 per cent level
Rhizomefly Pest (60.66 per cent) and required seedrate (56.67 per cent).
The data further indicated that a majority of them had partial knowledge about harvesting of Ginger after 6 months (61.33 per cent). Nearly thirty per cent of them were, however, partially aware about the variety Rio-de-Janero, required seedrate, cover of green manure and control of leaf spot disease of ginger.
It is worthwhile to note that though Ginger was grown on large scale in that area, majority of the Ginger growers did not know about the recommended dose of chemical fertilizers viz; nitrogen (60.68 per cent); phosphorus (70.67 per cent) and potassium (68.67 per cent). Nearly seventy five percent of them had no knowledge of sowing of Ginger in June-July. Data also revealed that .
144
Correlates of Knowledge...
the Ginger growers had no knowledge about variety Rio-de-Janero (45.35 per cent), seed treatment with 0.25 per cent mercurious fungicides and furrow method of sowing (44.66 per cent) and control of leaf spot disease of Ginger (40.00 per cent). Rade and Pawar (1983), Pawar and patil (1990) also reported the similar observations while studying the Ginger growers.
Based on overall knowledge, it is observed from the data in Table 2 that the highest percentage (67.33 per cent) of Ginger growers had medium level of knowledge followed by those having low (24.00 per cent) knowledge level. These findings were in conformity with those of Sivaraman and Palanippan (1984), Pawar and Patil (1990) regarding Turmeric and Ginger growers respectively.
Correlates of knowledge
The correlation analysis between independent variables and knowledge
(Table 3) revealed that out of nine selected independent variables, seven had positive and significant relationship with know ledge. However, variable 'age' was found to have negative but significant relationship with knowledge of the Ginger growers and size of family had negative but non-significant relationship with knowledge of the ginger growers. The variables education, size of land holding, annual gross income, social participation and socio-economic status had highly significant relationship with knowledge at 0.01 level of probability while size of irrigated land holding and cosmpoliteness both were significant at 0.05 level of probability. It is quite obvious that person with higher education, more size of land holding and more annual gross income would keep himself abreast with latest know-how regrading Ginger cultivation. These findings are in line with the findings of Jagtap (1984) and Pandya & Vekaria (1994) regarding Potato and Banana growers respectively.
.:. It is better for you to be free of fear lying upon a pallet,
than to have a golden conch and a rich table and be full
of trouble
- EPICURUS
145
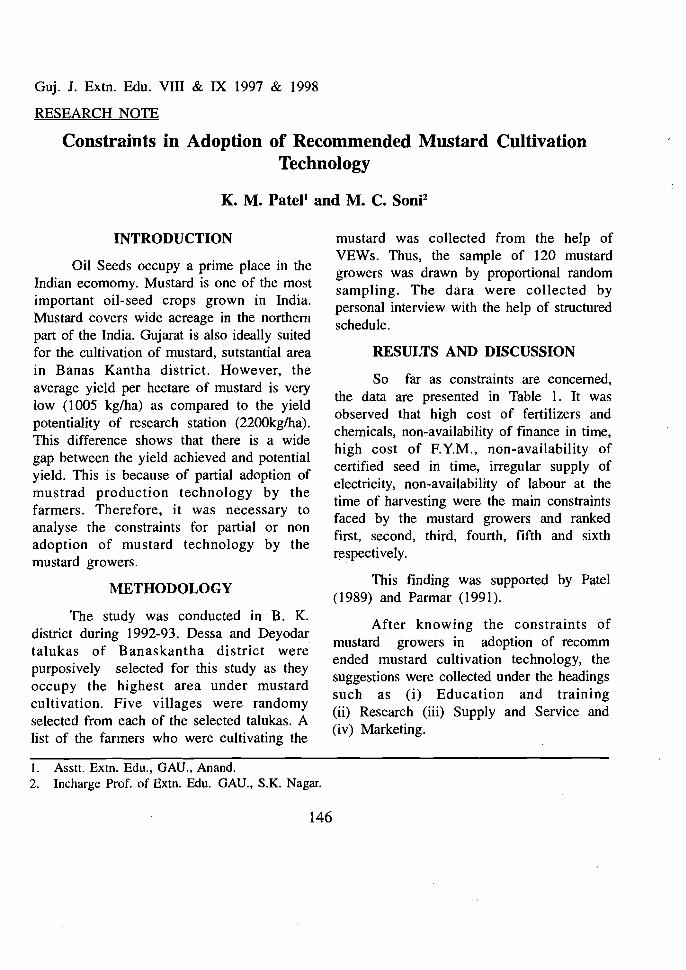
Guj. J. Extn. Edu. VIII & IX 1997 & 1998
RESEARCH NOTE
Constraints in Adoption of Recommended Mustard Cultivation Technology
K. M. PateJl and M. C. SonP
INTRODUCTION
Oil Seeds occupy a prime place in the Indian ecomomy. Mustard is one of the most important oil-seed crops grown in India. Mustard covers wide acreage in the northern part of the India. Gujarat is also ideally suited for the cultivation of mustard, sutstantial area in Banas Kantha district. However, the average yield per hectare of mustard is very low (1005 kg/ha) as compared to the yield potentiality of research station (2200kglha). This difference shows that there is a wide gap between the yield achieved and potential yield. This is because of partial adoption of mustrad production technology by the farmers. Therefore, it was necessary to analyse the constraints for partial or non adoption of mustard technology by the mustard growers.
METHODOLOGY
The study was conducted in B. K. district during 1992-93. Dessa and Deyodar ta1ukas of Banaskantha district were purposively selected for this study as they occupy the highest area under mustard cultivation. Five villages were randomy selected from each of the selected talukas. A list of the farmers who were cultivating the
mustard was collected from the help of VEWs. Thus, the sample of 120 mustard growers was drawn by proportional random sampling. The dara were collected by personal interview with the help of structured schedule.
RESULTS AND DISCUSSION
So far as constraints are concerned, the data are presented in Table 1. It was observed that high cost of fertilizers and chemicals, non-availability of finance in time, high cost of F.Y.M., non-availability of certified seed in time, irregular supply of electricity, non-availability of labour at the time of harvesting were the main constraints faced by the mustard growers and ranked first, second, third, fourth, fifth and sixth respectively.
This finding was supported by Patel (1989) and Parmar (1991).
After knowing the constraints of mustard growers in adoption of recomm ended mustard cultivation technology, the suggestions were collected under the headings such as (i) Education and training (ii) Research (iii) Supply and Service and (iv) Marketing.
1. Asstt. Extn. Edu., GAD., Anand. 2. Incharge Prof. of Extn. Edu. GAD., S.K. Nagar.
146
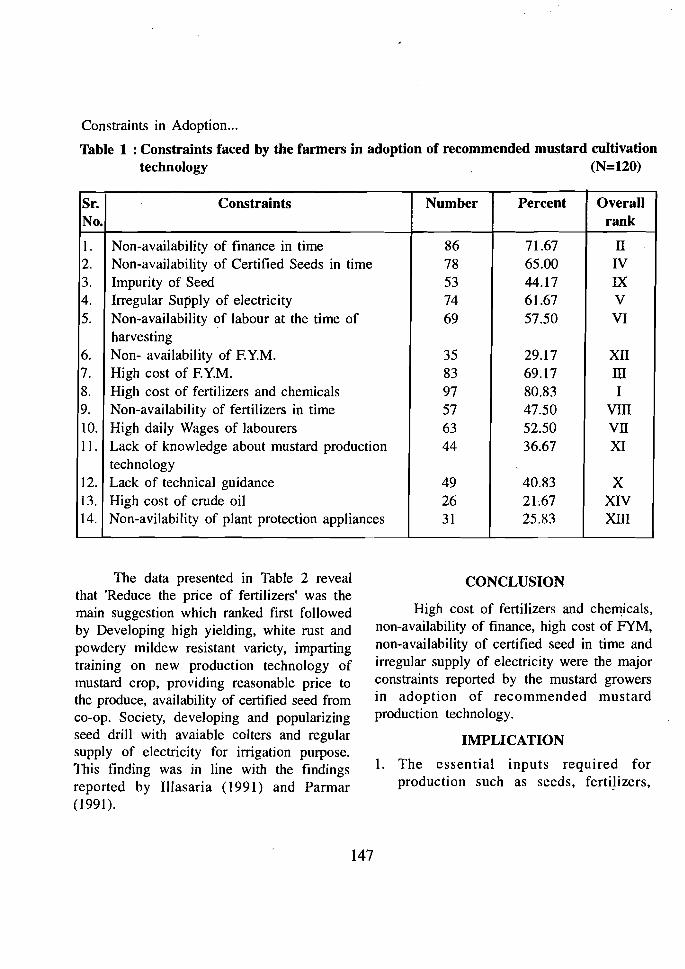
Constraints in Adoption...
Table 1 : Constraints faced by the farmers in adoption of recommended mustard cultivation technology (N=120)
Sr. No.
Constraints Number Percent Overall rank
I. Non-availability of finance in time 86 71.67 IT 2. Non-availability of Certified Seeds in time 78 65.00 IV 3. Impurity of Seed 53 44.17 IX 4. Irregular Supply of electricity 74 61.67 V 5. Non-availability of labour at the time of
harvesting 69 57.50 VI
6. Non- availability of F.Y.M. 35 29.17 XII 7. High cost of F. Y.M. 83 69.17 m 8. High cost of fertilizers and chemicals 97 80.83 I 9. Non-availability of fertilizers in time 57 47.50 vm 10. High daily Wages of labourers 63 52.50 VII II. Lack of knowledge about mustard production
technology 44 36.67 XI
12. Lack of technical guidance 49 40.83 X 13. High cost of crude oil 26 21.67 XIV 14. Non-avilability of plant protection appliances 31 25.83 xm
The data presented in Table 2 reveal that 'Reduce the price of fertilizers' was the main suggestion which ranked first followed by Developing high yielding, white rust and powdery mildew resistant variety, imparting training on new production technology of mustard crop, providing reasonable price to the produce, availability of certified seed from co-op. Society, developing and popularizing seed drill with avaiable colters and regular supply of electricity for irrigation purpose. This finding was in line with the findings reported by IIIasaria (1991) and Parmar (1991).
147
CONCLUSION
High cost of fertilizers and che~icals,
non-availability of finance, high cost of FYM, non-availability of certified seed in time and irregular supply of electricity were the major constraints reported by the mustard growers in adoption of recommended mustard production technology.
IMPLICATION
1. The essential inputs required for production such as seeds, fertilizers,

Constraints in Adoption... ·
Table 2 : Suggestions from the Mustard growers for improving the productivity of the mustard crop (N=120)
Sr. No.
Suggestions Number Percent Rank
Education and Training
1. Imparting training on new production technology of mustard crop
Research
88 73.33 ill,
2. Developing high yielding, white rust and powdery mildue resistant.
99 82.50 IT
3. Developing and popularizing seed drill with variable colters
Supply and services
73 60.83 VI
4. Reducing the price of fertilizers
107 89.17 I
5. Regular supply of electricity for irrigation purpose
65 54.17 vn
6. Availability of certified seed from Co-op. Society
82 68.33 V
7. Reducing the price of crude oil 31 25.83 X 8. Availability of Plant protection appliances
on hired basis in the villages. 53 44.17 Vill
9. Writing impact messages through printed literatures.
Marketing
46 38.33 IX
10. Providing reasonable price to the produce.
87 72.50 IV
2.
3.
insecticides etc. should be ensured on reduced rates to the farmers through co-operative societies and Govt. agencies. Farm finance should be extended timely and from single agency as far as possible. Top Priority should be given to the supply of electricity in agricultural sector.
4.
5.
All the possible efforts should be made to encourage such type of farmers. Efforts should be made so that recommended technology is moved to farmer's field at appropriate time without much time lag to accelerate
148
'.t
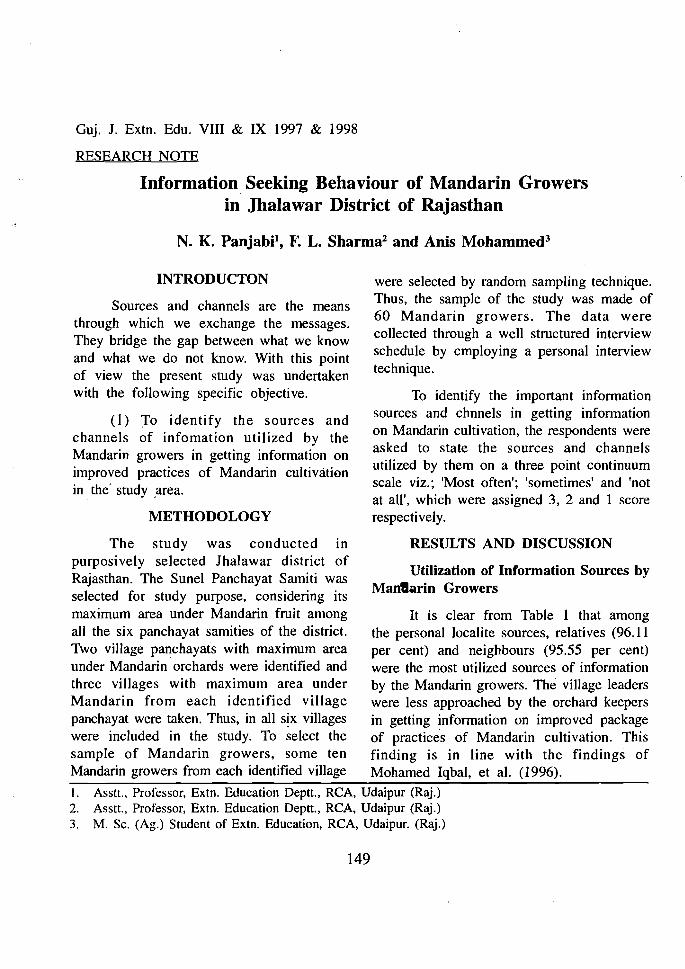
Guj. 1. Extn. Edu. VIII & IX 1997 & 1998
RESEARCH NOTE
Information Seeking Behaviour of Mandarin Growers in Jhalawar District of Rajasthan
N. K. PanjabP, F. L. Sharma2 and Anis Mohammed3
INTRODUCTON
Sources and channels are the means through which we exchange the messages. They bridge the gap between what we know and what we do not know. With this point of view the present study was undertaken with the following specific objective.
(I) To identify the sources and channels of infomation utilized by the Mandarin growers in getting information on improved practices of Mandarin cultivation in the' study ,area.
METHODOLOGY
The study was conducted in purposively selected lhalawar district of Rajasthan. The Sunel Panchayat Samiti was selected for study purpose, considering its maximum area under Mandarin fruit among all the six panchayat samities of the district. Two village panchayats with maximum area under Mandarin orchards were identified and three villages with maximum area under Mandarin from each identified village panchayat were taken. Thus, in all s~x villages were included in the study. To select the sample of Mandarin growers, some ten Mandarin growers from each identified village
were selected by random sampling technique. Thus, the sample of the study was made of 60 Mandarin growers. The data were collected through a well structured interview schedule by cmploying a personal interview technique.
To identify the important information sources and chnnels in getting information on Mandarin cultivation, the respondents were asked to state the sources and channels utilized by them on a three point continuum scale viz.; 'Most often'; 'sometimes' and 'not at all', which were assigned 3, 2 and 1 score respectively.
RESULTS AND DISCUSSION
Utilization of Information Sources by Man8arin Growers
It is clear from Table 1 that among the personal localite sources, relatives (96.11 per cent) and neighbours (95.55 per cent) were the most utilized sources of information by the Mandarin growers. The village leaders were less approached by the orchard keepers in getting information on improved package of practices of Mandarin cultivation. This finding is in line with the findings of Mohamed Iqbal, et aI. (1996).
I. Asstt., Professor, Extn. Education Deptt., RCA, Udaipur (Raj.) 2. Asstt., Professor, Extn. Education Deptt., RCA, Udaipur (Raj.) 3. M. Sc. (Ag.) Student of Extn. Education, RCA, Udaipur. (Raj.)
149
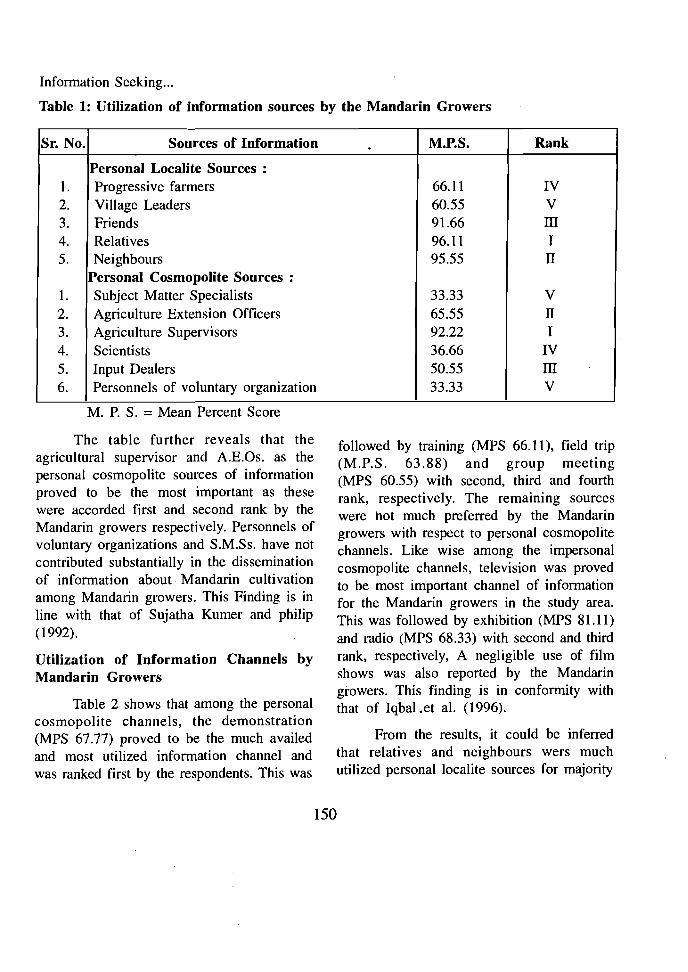
Infonnation Seeking...
Table 1: Utilization of information sources by the Mandarin Growers
Sr. No. Sources of Information . M.P.S. Rank
Personal Localite Sources : l. Progressive farmers 66.11 IV 2. Village Leaders 60.55 V 3. Friends 91.66 III 4. Relatives 96.11 I 5. Neighbours
Personal Cosmopolite Sources : 95.55 II
1. Subject Matter Specialists 33.33 V 2. Agriculture Extension Officers 65.55 II 3. Agriculture Supervisors 92.22 I 4. Scientists 36.66 IV 5. Input Dealers 50.55 III 6. Personnels of voluntary organization 33.33 V
M. P. S. = Mean Percent Score
The table further reveals that the agricultural supervisor and A.E.Os. as the personal cosmopolite sources of infonnation proved to be the most important as these were accorded first and second rank by the Mandarin growers respectively. Personnels of voluntary organizations and S.M.Ss. have not contributed substantially in the dissemination of information about· Mandarin cultivation among Mandarin growers. This Finding is in Hne with that of Sujatha Kumer and philip (1992).
Utilization of Information Channels by Mandarin Growers
Table 2 shows that among the personal cosmopolite channels, the demonstration (MPS 67.77) proved to be the much availed and most utilized information channel and was ranked first by the respondents. This was
followed by training (MPS 66.11), field trip (M.P.S. 63.88) and group meeting (MPS 60.55) with second, third and fourth rank, respectively. The remaining sources were hot much preferred by the Mandarin growers with respect to personal cosmopolite channels. Like wise among the impersonal cosmopolite channels, television was proved to be most important channel of infonnation for the Mandarin growers in the study area. This was followed by exhibition (MPS 81.11) and radio (MPS 68.33) with second and third rank, respectively, A negligible use of film shows was also reported by the Mandarin growers. This finding is in confonnity with that of Iqbal.et al. (1996).
From the results, it could be inferred that relatives and neighbours wers much utilized personal localite sources for majority
150

Infonnation Seeking...
Table 2: Utilization of information channels by the Mandarin Growers
Sr. No. Channels of Information M.P.S. Rank
Personal Cosmpolite Channels 1. Training 66.11 IT 2. Group Meeting 60.55 IV 3. Demonstration 67.77 I 4. Fanners Fair 46.11 Vill 5. Educational Tour 53.33 V 6. Field Day 49.44 VI 7. Field Trip 63.88 ill 8. Lecture
Impersonal Cosmpolite Channels 35.00 Vill
1. Radio 68.33 ill 2. Television 92.22 I 3. News Papers 38.33 IV 4. Film Shows 33.33 VII 5. Farm publications 35.55 V 6. Traditional Media (Puppet Show, Local song etc) 34.44 VI .
7. Exhibition 81.11 IT
M. P. S. = Mean Percent Sc?re
of Mandarin growers. because of easy accessibility. Likewise agricultural supervisors and A.E.Os. were much utilized as personal cosmopolite sources by the respondents. On the other hand, scientists, S.M.Ss and personnel of voluntary organizations were less utilized. This may be because of their less availability in the villages.
Among personal cosmopolite channels, demonstration and training have attracted
attention of more number of respondents. Most of the Mandarin orchard keepers in the study area were well to do and had personal T. V. sets. They might have watched the agricultural programmes telecasted for the benefit of orchard keepers regularly. Farmers have also utilized exhibitions conducted by department of Horticulture as a channel of infonnation. These reasons justify the results.
151

Guj. J. Extn. Edu. VIII & IX 1997 & 1998
RESEARCH NOTE
Inter-Relationship among Dimensions of Entrepreneurship
M. M. PateP and Amit Chatterjee2 '.
INTRODUCTION
Entrepreneurship means the function of creating something new, organising, coordinating, and undertaking risk and handling economic uncertainty. It also includes the function of seeing investment and production opportunity, .organizing an enterprise to undertake a new production process raising capital, hiring labour, arranging for the supply of raw material and selecting top managers for day to day operation of the enterprise (Higgins 1971).
Thus, entrepreneurship is a complex phenomenon. The definition of entrepreneurship has never been differentiated on the basis of enterprises and hence could be extended to agricultural entrepreneurs without any restriction.
Keeping the above facts in view, this study was relation entrepreneu
designed to analyse the interamong dimensions of
rship sugarcane growers.
METHODOLOGY
Sugarcane growers of the designated zone of Bhopal Sugar Industries Ltd. were considered as universe, to explore their entrepreneurship. To select sample for the
study, a multistage random sampling technique was used. At first stage out of 48 sugarcane purchasing centres, 10 were selected randomly. At the second stage, two villages from each selected purchasing centres were selected. At the third stage, 200 respondents were selected by using proportionate random sampling method. The data were collected by using interview schedule developed for the study. The 13 psychological dimensions of entrepreneurship considered in the present study were - risk taking, future orientation, goal oriented hard work; persistency, realistic, drive for independeny, ability to exploit situation, success oriented decision, opportunity seeking, competitiveness, innovativeness, dynamic leadership and challenge acceptance.
Zero-order correlation analysis was perfomed for analysis of interrelation.
RESULTS AND DISCUSSION
Inter-relations among the dimensions of enterpreneurship
Table I presents the inter-relationship among the dimensions of entreprenership. It is obvious from the table that there is considerable extent of inter-relations among the dimensions of enterpreneurship.
I. Asso. Professor, Department of Extn. Edu., R.A.K. College of Agriculture, JNKVV, Sehore (M.P.) 2. Asstt. Professor; Department of Extn. Edu., R.A.K. College of Agriculture, JNKVV, Sehore (M.P.)
152
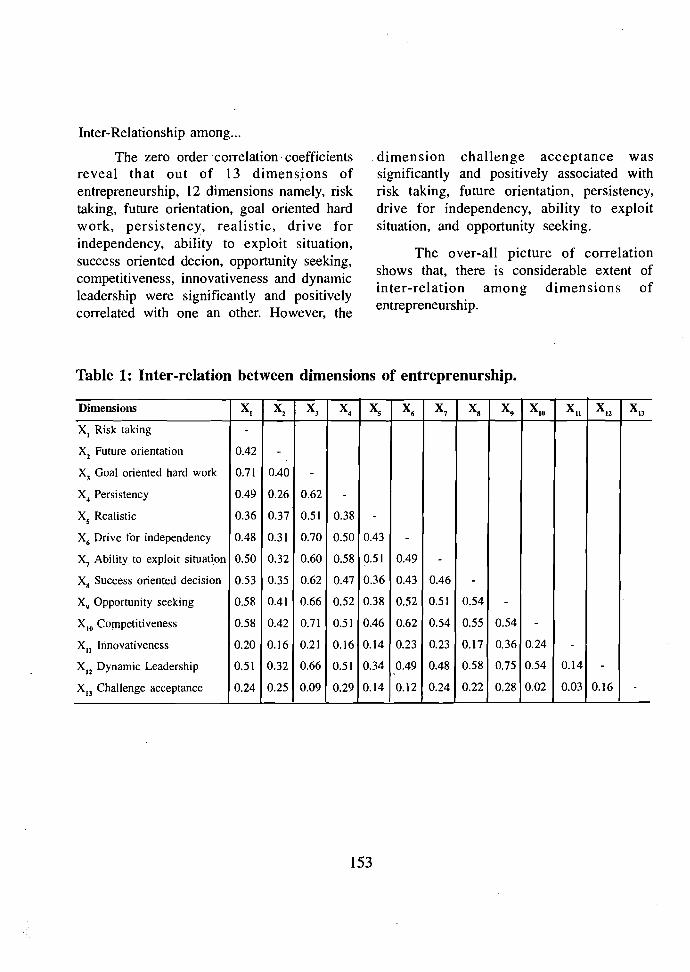
Inter-Relationship among...
The zero order .correlation .coefficients reveal that out of 13 dimens,ions of entrepreneurship, 12 dimensions namely, risk taking, future orientation, goal oriented hard work, persistency, realistic, drive for independency, ability to exploit situation, success oriented decion, opportunity seeking, competitiveness, innovativeness and dynamic leadership were significantly and positively correlated with one an other. However, the
. dimension challenge acceptance was significantly and positively associated with risk taking, future orientation, persistency, drive for independency, ability to exploit situation, and opportunity seeking.
The over-an picture of correlation shows that, there is considerable extent of inter-relation among dimensions of entrepreneurship.
Table 1: Inter-relation between dimensions of entreprenurship.
Dimensions XI X2
X3 X4 Xs X
6 X, Xs X9 XIII Xu X
l2 XI3
Xl Risk taking -X
2 Future orientation 0.42 -
X3
Goal oriented hard work 0.71 0.40 -X4 Persistency 0.49 0.26 0.62 -Xs Realistic 0.36 0.37 0.51 0.38 -X
6 Drive for independency 0.48 0.31 0.70 0.50 0.43 -
X, Ability to exploit situation 0.50 0.32 0.60 0.58 0.51 0.49 -Xx Success oriented decision 0.53 0.35 0.62 0.47 0.36 0.43 0.46 -X9 Opportunity seeking 0.58 0.41 0.66 0.52 0.38 0.52 0.51 0.54 -X
IO Competitiveness 0.58 0.42 0.71 0.51 0.46 0.62 0.54 0.55 0.54 -
Xu Innovativeness 0.20 0.16 0.21 0.16 0.14 0.23 0.23 0.17 0.36 0.24 -X
I2 Dynamic Leadership 0.51 0.32 0.66 0.51 0.34 0.49 0.48 0.58 0.75 0.54 0.14 -
XI3 Challenge acceptance 0.24 0.25 0.09 0.29 0.14 0.12 0.24 0.22 0.28 0.02 0.03 0.16 -
153
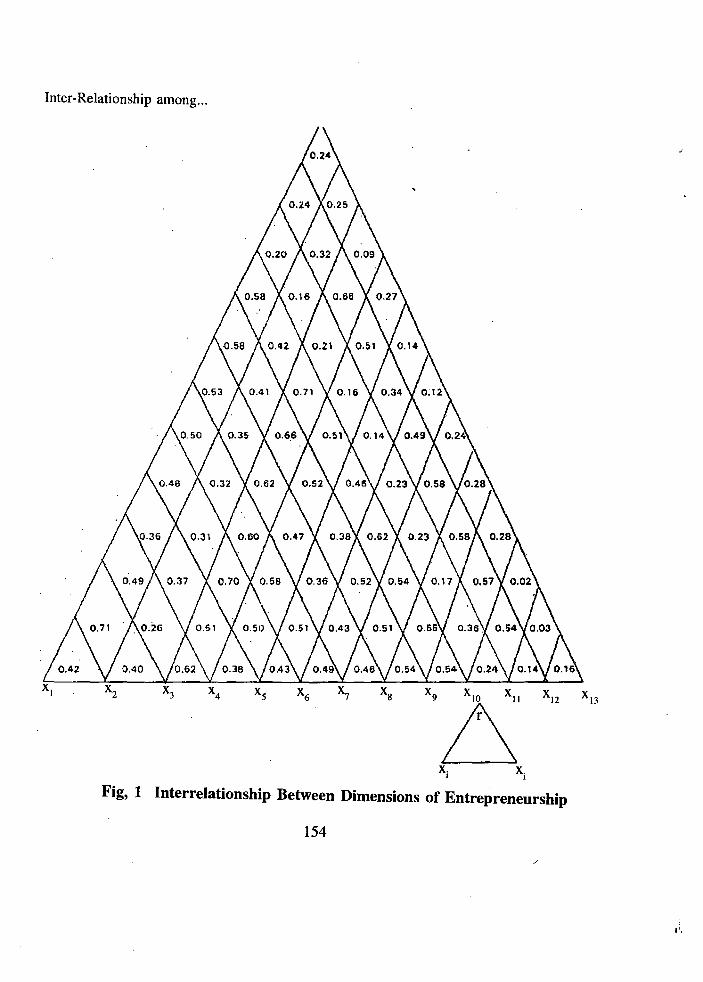
Inter-Relationship among...
x4 xs x6 x9 X x xJ2 13Ii'x.1 Xi
Fig, 1 Interrelationship Between Dimensions of Entrepreneurship
154
/'
"

, SUGGESTIONS FOR CONTRIBUTORS General Requirements :
Articles must be original report of research in extension education which includes the fields of agriculture,· animal husbandry, dairying, home science and other related fields. The paper sent for publication has. neither been pUblished nor submitted for publication elsewhere. The papers are accepted subject to editorial revision, if considered necessary. The life members of the society will be given priority in publication. The right for acceptance of articles will be solely with Editorial Board. Manuscript :
The manuscript should be typed in double space on one side of 30 x 20 cm paper with 4 cm margin. Text should have the sub-division, namely Introduction, Methodology, Results and Discustion, Conclusion and Implications (if any). Introduction should be brief. References to previous work in support of findings should be minimum. Tables should be designed in a manner to fit 14 x 19 cm space in printing. Line drawings and graphs should be prepared in black water-proof ink on smooth white drawing paper or tracing paper atleast twice the size of final reproduction. Research Note :
It should include title of research followed by name/s of the author/so It should consist of two or three typed full-scapes with minimum references. References :
The references should be arranged in the alphabetical order of the surname of the first author. Few examples are given below which illustrate the form that references should take. Book:
Bhagat, Rekha and Mathur, P. N. 1989. Mass media and farm women, New Delhi Intellectual Publishing House. Journal:
Hedge, V. G. and Chhanegowda, M. B. 1989. Influence of personal characteristics of Agril. Assistants on their job performance. Indian Journal of Extension Education, 15 (3-4) : 101-102. Thesis:
Patel, B. T. 1980. A study of factors influencing successful functioning of village milk producers co-operative societies in Karia district of Gujarat, thesis (Ph.D.) IARI, New Delhi. Reprints:
Each main author has to pay Rs. 25/- for the cost of 25 reprints to be supplied to him. Copyright:
The Gujarat Journal of Extension Education is the property of Society of Extension Education, Anand (Gujarat). Articles and illustrations published in this journal could be quoted provided the source is acknowledged. Address for correspondence :
The correspondence concerning business matters should be addressed to the Secretarycum-Treasurer, Gujarat Society of Extension Education, Extension Education Institute, Gujarat Agricultural University, Anand Campus Anand-388 110. The demand draft be issued in favour of "Society of Extension Education, Anand (Gujarat)".
,
155
Society of Extension Education (Gujarat)
Regi. No. Guj-737 Kheda &' F/4781KhedalJan-1990
Proceedings of General Body Meeting of the Society of Extension Education held on 30th April. 1997 at 17.00 Drs. at Anand.
The General Body meeting of SEEG was held on 30th April, 1997 at GAU., Anand Campus, Anand at 17.00 Hrs. Dr. K. G. Upadhyay, Professor of Dairy Science College, Anand remained as Chief Guest on behalf of Director of Campus, GAU., Anand. Dr. H. L. Patel, IIC President, SEEG, welcomed all members of SEEG as well as Dr. K. G. Upadhyay. Chief Guest and conducted business of meeting as per Agenda. In all 82 members were present in the General Body meeting.
1. Confirmation of the Proceedings of the last G.B. meeting
The last proceedings of G. R meeting of SEEG, held on 27th January, 1996 at Sardar Hall, GAU, Navsari at 17.00 Hrs. were confirmed and approved unanimously by the house.
2. Approval of Annual statement of Accounts and review of Auditor's report
Prof. G. M. Patel, Joint Secretary, SEEG presented the statement of accounts showing income and expenditure as on 31.3.1996 audited by Mis. M.A. Shah & Co., Anand which was accepted and approved unanimously by the house.
3. Notes of the work done by the Executive Council as well as Editorial Board
As per rules and regulations, the members at the annual meeting should take note of the activities carried out by the Executive Council and Editorial Board. at various meetings during the period under report. Dr. J. C. Trivedi, SecretarylTreasurer, SEEG, has presented the brief review of the work done by Executive Council and Editorial Board at various meetings dudng period under report which was accepted and approved unanimously by the house.
4. Report of the activities of the Society
Dr. J. C. Trivedi, SecretarylTreasurer, SEEG presented the report of the activities of the Society which was accepted unanimously by the house.
5. Any other items with the permission of Chair
1. Presentation of Election Report by Election Officer :
The Executive Council of SEEG in its 13th meeting dated 16.11.96 took a decision to give open election for 7 (seven) posts of Executive Council members and Dr. J. C. Patel, Prof. of Biochemistry, RA.C.A., Anand was appointed as Election Officer. He made all the procedure of election and presented final report in G.B. wherein he declared that totally 9
156
(Nine) nominations were received in time limit and 2 (two) members withdrew their nominations within prescribed time limit. Hence there will be only 7 (seven) nominations which have been declared as elected Executive Council members.
At this point, Dr. A. A. Patel has raised objection that he has not received letter as well as nomination form. Dr Trivedi has replied that all the members on roll have been sent letters and if address is changed members should inform their changed address..
2. General suggestions of the members
For increasing participation of members it was suggested that D.E.E. should either call a meeting or give direct permission to members.
As regards next meet seminar topic following suggestions received.
(i) How to increase productivity of scientists (ii) High tech in milk production (iii) Avoidance of Ext. activities including training activities. (iv) Experience of retired scientists. (v) Case study of Development workers
Members suggested that above topics can be discussed during seminar. But the next turn comes to Junagadh zone so they will think and decide about topic/date etc.
No more balance on hand should be kept during March ending.
Retired members may be given farewell.
3. Address of Dr. K. G. Upadhyay, Chief Guest
Dr. K. G. Upadhyay in his address wished that society should grow year after year. He further stated that in 21st Century individual development is most important. Everydoby should feel that activity is their own hence they should take active part. If individuals are motivated their efficiency and productivity will be increased in any organization. The quality of organization is based on management of individuals who work in it. He sincerely expressed thanks to organizer for inviting him as a Chief Guest.
Dr. J. C. Trivedi, Secretary!Trasurer expressed thanks to all members, to all donors and to those who extended help in making annual meet cum symposium a success. He also expressed sincere thanks to Dr. K. G. Upadhyay, Chief Guest? Dr. J. C. Patel, Election Officer and to the Director of Campus, GAU Anand for providing all facilities and help to society.
Thereafter meeting came to an end.
Sd/· (H. L. Patel) IIc President
Sd/· (J. C. Trivedi)
Secretary!Treasurer)
157
Report of the Activities of The SEEG
I
(Submitted to General Body Meeting held at Anand on 30.4.1997 at 17.00 hrs.)
It gives me a great pleasure to place before General Body Meeting of the SEEG the
progress of the activities of the Society of Extension Education, Gujarat during last year.
Membership position :
As per the rules and regulation 6-C-(ii) the current membership position is as under :
1. Life members - 258
2. Institutional members - 008
3. Honorary members - 002
4. Ordinary members - 040
5. Patrons - 002
Total - 310
Organisation of the seminar
Last year, the annual meet cum saminar was held at GAU Navsari Campus on 27th
January 1996. The seminar was inaugurated by Dr. D. N. Pandya, Ex, Director of Extension
Education, GAU, Shri Moghabhai Desai, Hon'ble Chairman, Navsari peoples Co-operative
Bank vere the Chief Guest on the occasion. The seminar was attended by 74 life members
and other delegates/participants, who have presented more than 32 papers. The theme of the
seminar was "Role of Co-operative Organizations in Rural Development". Abstracts of all
papers were printed in fifth meet seminar souvenir. It was also decided to hold sixth Annual
meet at Anand Campus and today you all have witnessed the same.
Publication of Gujarat Journal of Extension Education
Uptill now we have published totally 7 volumes of the Journal. The combine volume
of 6 & 7 i.e. December, 1995 and December, 1996 is published with totally 47 papers and
which is in your hands. By this we have made our publication regular Now Vol. No. 8 Le.
December 1997 will be published regularly.
158
Khusalbhai Revabhai Patel Medal cum Cash Prize
Up till now we have awarded 2 medal cum cash prizes of Rs. 500/- to the following candidates.
1. Shri G. N. Solanki December, 1991.
2. Shri J. S. Upadhyay - December, 1992-February-1993.
Today the said medal cum cash prize of Rs. 500/- have been awarded to following camdidates.
1. Shri Ajay Maganlal Marvania - February-March, 1994.
2. Shri Shailesh Dalpatbhai Patel - Aug. - Sept., 1994.
3. Shri Dipakkumar Mafatbhai Patel - Aug. - Sept., 1995.
Financial position
The statemet showing income and expenditure account headwise has been presented by Prof. G. M. Patel and which was circulated to all members. In addition to this the Society has following 5 1/
2 year Kishan Vikas Patras :
l. Rs. 16,000/- purchased on 16.1.1992.
2. Rs. 08.000/- purchased on 5.3.1992.
3. Rs. 20,000/- purchased on 22.3.1994
4. Rs. 10,000/- purchased on 22.3.1994
Friends, I sincerely thank all of you and especially members of Executive council and Editorial Board for helping to perform my job as a secretary-cum-Treasurer. I heartily extend my special thanks to prof. G. M. Patel, Joint Secretary.
Sd/· (J. C. Trivedi)
Date : 30.04.1997 Secretaryrrreasurer
159
Society of Extension Education (Gujarat)
(Regi. No. Guj.737 Kheda and F/478/KhedalJan. 1990)
Proceeding of General Body Meeting of the Society of Extension Education held on 9th Jan. 1998 at 17.00 hrs at Auditorium, Gujarat AgriI. University, Junagadh Campus, ", Junagadh.
The General Body meeting of SEEG was held on 9th Jan. 1998 at Auditorium, GAD Junagadh Campus, Junagadh at 17.00 Hrs. Shri G. B. Kasad, Retd. Additional Director, Dept. of Agriculture, Gujarat State remained present as Chief Guest. Dr. B. T. Patel, President, SEEG welcomed all the members of SEEG as well as Retired Scientists and conducted the business of the meeting as per agenda. In all 89 members were present in the General Body Meeting.
1. Confirmation of the proceedings of the last G. B. meeting
The last proceedings of G. B. meeting of SEEG, held on 30th April, 1997 at Anand at 17.00 hrs. were confirmed and approved unanimously by the house.
2. Approval of Annual Statement of Accounts and Review of Auditor's report.
Prof. G. M. Patel, Jt. Secretary, SEEG presented the statement of accounts showing income and expenditure as on 31.3.97 audited by MIs. M. A. Shah and Co., Anand which was accepted and approved unanimously by the house.
3. Note of the work done by the Executive Council as well as Editorial Board.
As per rules and regulations, the members at the annual meeting should take note of the activities carried out by the Executive Council and Editorial Board at various meetings during the period under report. Dr. J. C. Trivedi, Secretary-cum-Treasurer, SEEG has presented the brief review of the work done by Executive Council and Editorial Board at various meetings during period under report which was accepted and approved unanimously by the house.
4. Report of the activities of the Society.
Dr. J. C. Trivedi, Secretary-cum-Treasurer, SEEG presented the report of the activities of the society which was accepted unanimously by the house.
5. Any other items with the permission of Chair.
(1) Increasing rates of membership fees/seminar participation fees.
Dr. J. C. Trivedi, Secretary-cum-Treasurer has informed the I1buse that membership fees as well as seminar participation fees are lowest as compared to other professional societies in the country. Hence, he proposed increase in membership fees / seminar participation fees for approval by the house as under:
160
A. Membership Fees.
(i) Ordinary/student member Rs. 100/- yearly (ii) Life member Rs. 600/(iii) Corporatellnstitutional member Rs. 1000/- for 15 yrs (iv) Pattons (Individual or Institution) Rs. 5000/- or more (v) Library subscription Rs. 100/- (Annualy for Single Volume) (vi) Library subscription Rs. 200/- (Joint Volume of two years)
B. Seminar participation fees : (for one day seminar)
(i) Member of SEEG Rs. 100/(ii) For Non-members Rs. 200/
The rates of advertisements for Journal and Souvenir will remain as such.
At this point, Prof. C. S. Patel has suggested that such proposal should first discussed m the Executive Council and then put before General Body meeting.
President of the Society replied that this point was noted for the future. Aftersome discussion the increasing in membership fees/seminar participation fees has been approved by the house with effect from I st April, 1998.
(2) Genral suggestions of the members :
Dr. D. N. Pandya has suggested that topic of the seminar should be selected in such a way that Four Zones DDEElProf. of Extension Education/Research Scientists should prepare a key papers related to the main topic so that discussion can be made in depth.
'Prof. C. S. Patel has suggested that Distance Education should be included in P. G. Course and also suggested that. individual communication should be made to the members.
Dr. R. B. Patel insisted on quality of out-put of seminar and requested to members of the house for giving their suggestions in this aspect. He further suggested that zone-wise at least three papers from each zone should be collected and discussion should be made in depth based on the theme of the seminar, so that some out-put can be broughtout. He also suggested for giving recognisation for best paper presentation.
Dr. A. O. Kher has suggested that if we organise seminar for two days than we can overcome such difficulties of presentation/quality of theme/effectiveness of seminar etc.
Prof. M. C. Patel has suggested that seminar Registration fees should be increased and Journal publication is made biannual so as to economise in the cost.
Dr. R. F. Thakor has suggested that for each paper Rs. 50/- should be collected so that best paper presentation award can be made possible.
Prof. C. S. Patel has suggested that the Extension Educationist should be included in Sardar Patel Award, awarded by Govt. of Gujarat, Society should made some efforts in this regard.
161

Prof. K. M. Patel suggested that retired scientists should be motivated for the membership of the society.
Dr. D. N. Pandya has suggested to strengthen the financial position of the society. Outside authors should be motivated to become lifemembers of the society as well as voluntrary donation should be given by the members.
Dr. M. A. Munshi has also suggested that each member should collect atleast Rs. 1000/- as donation voluntarily to strengthen the society.
Prof. P. R. Kanani has suggested to the house for thinking about best Extension Educationist award for the future.
Dr. B. T. Patel, President of the Society has opined that looking to the resources of the society and availability of time all points will be taken care in future.
(3) To approve appointment of auditors :
As per rules 6-C-3, G.B. has unanimosuly approved the name of MIs. M. A. Shah and Co., Anand as auditors of SEEG.
(4) Address of Shri G. B. Kasad, Chief Guest.
Shri G. B. Kasad in his address opined that society is a regulatory body and working successfully for the cause of the society. The President and Executive Council as well as Editorial Board working very hard, though they are facing many difficulties. The accounts of the Society is regularly maintained and discussed in G. B. Meeting. This activities are additional work of each members of the society. However, all the members are co-ordialy and cooperatively working for fulfilling the objectives of the society. He also expressed his happiness about concent given by the members for increasing 'the membership fees etc. The work of organisation of Seminar is required well Planning, management and the members have done this job effectively. He also told that while doing the work, some crticisum will come in the way but we have to stick to our work for which we are meant. He also congratulated to the members of the society for giving recognisation to retired Scientists by honouring them at the annual meet-cum-seminar of the society.
Dr. J. C. Trivedi, Secretary-cum-Treasurer expressed thanks to all Members, All Donors and to those who extended their help in making annual meet-cum-seminar a success. He also expressed sincere thanks to Shri G. B. Kasad, Chief Guest and Dr. V. J. Patel, Director of Campus, GAU, Junagdh for providing all the facilities and help to the Society.
Thenafter meeting comes to an end.
Sd/(B. T. Patel)
Presedent
Sd/(J. C. Trivedi)
Secretary-cum-Treasurer
162
Report of the Activities of the S.E.E.G.
(Submitted to General Body meeting held at GAU Junagadh on 9·1·1998 at 17.00 hrs.)
" It gives me a great pleasure to place before G.B. of S.E.E.G. the progress of the activities of the Society of Extension Education, Gujarat during the last year.
Membership position
As per the rules and regulation 6-C (ii) the current membership position is as under. (As on 31-12-1997).
1. Life members 266
2. Institutional 008
3. Honorary members 002
4. Patrons 002
5. Ordinary members 040
318
Organisation of the symposium
The Sixth Annual Meet cum Symppsium was held on 30-4-1997 at G.A.U. Anand. The topic of the symposium was' Challenges of Extension Education in 21st century'. The symposium was inaugurated by Dr. V. S. Patel Vice-Chancellor, S. P. University, Vallabh Vidyanagar. Dr. C. H. Rana, Vice-Chancellor, Gujarat Agril. University, Sardar Krushinagar presided over the function. He released the symposium souvenir and presented Shri K. R. Patel Medal cum cash prizes to the students. The symposium was sttended by 82 participants/ delegates/members etc. The symposium souvenir was printed and circulated to all participants/ delagates.
It was also decided to hold seventh Annual Meet cum seminar at Junagadh and today we are here for the same.
Publication of Gujarat Journal of Extension Education
Uptillnow we have published totally seven volumes of the journal. The combine volume of 6 & 7 i.e. December 1995 and 1996 was published with 47 papers. Looking to the financial aspects it was decided that combine volume of· December-1997 and 1998 will be published during December 1998 which makes our publication regular.
163

Khushalbhai Revebhai medal cum Cash prize
Uptillnow 'we have awarded Shri K. R. Patel medal cum cash prizes to the following students.
l. Shri G. N. Solanki... Dece. 1991
2. Shri J. B. Upadhyay... Dec. 1992&93
3. Shri A. N. Marvania... Feb.March.94
4. Shri S. D. Patel... Aug. Sept.1994
5. Shri D. M. Patel... Aug.Sept. 1995
Financial position
The statement showing income and expenditure for the year ending 31-3-1997 has been presented by prof. G. M. Patel, Joint Secretary, SEEG and was circulated to all members present in the house. Further I am to inform the members that at present the society has following 51
/ 2
years Kisan Vikas patras.
l. Rs. 30,000/- purchased on 22-3-1994... Matured on 22-9-99
2. Rs. 33,600/- purchased on 21-7-1997 Matured on 21-1-2003
3. Rs. 12,400 purchased on 06-9-1997 Matured on 06-3-2003
Friends, I sincerely thank all of you and especially members of Executive Council and Editorial Board for helping me to perform my job as a Secretary and Treasurer.
Sd/-Anand (J. C. Trivedi) Dt. 9-1-98 SecretraylTreasurer.
164

[I OBITUAJITJ)
Prof. P. B. Patel
Prof. P. B. Patel, Publication Officer, Office of the Directorate of Extension
Education, GAU, Ahmedabad met with a heart attack and expired
on 23-12-2000.
Prof. P. B. Patel was born on 1st June, 1951 at PIMPAL, Taluka-Chanasma,
Dist. Mehsana (Gujarat). He Joined in Gujarat Agricultural University
on 1-7-1975 as a Agricultural Supervisor at Halvad. There after he worked on
various positions in Gujarat Agricultural University. He did his M.Sc. (AgrL)
in Extension Education. He was life member of Society of Extension Education,
Gujarat.
All the members of the Society of Extension Education, Gujarat convey
their deep condolences to the bereaved family and pay to the Almighty to great
peace to the departed soul.
. Editor

Society of Extension Education, Extension Education Institute, G.A.U., Anand - 388 110 (GujaraO
The membership fees of S.E.E.G. and Rates of Advertisement are as under with effect from 1st April. 1998.
A. Membership Fees :
i) Ordinary/student member Rs. 100 /- Yearly
ii) Life member Rs. 600/
iii) Corporate / institutional member Rs. 1000/- for 15 years
iv) Patrons (Individual or Institution) Rs. 5000/- or more
v) Library subscription ... Rs. 100/- (annually for single volume)
vi) Library subscription .,. Rs. 200/- Goint volume of two years)
B. Seminar Particiption Fees : (for one day seminar)
i) Member of S.E.E.G. Rs. 100/
ii) For Non-members Rs. 200/
c. Rates of Advertisements (Journal or Souvenir)
i) Full Page (inner) .... Rs. 1200/
ii) Half Page (inner) Rs. 600/
iii) Quarter Page (inner) Rs. 300/
iv) Cover Page (3rd) Rs. 1500/
v) Cover Page (4th) Rs. 2500/
All remittances and correspondence relating to sUbscription, membership, advertisement etc. should be addressed to Secretary-cum-Treasurer, Sosiety of Extension Education, Extension Education Institute, Gujarat Agricultural University, Anand-388 110. (Gujarat) The Demand draft should be issued in favour of 'SOCIETY OF EXTENSION EDUCATION, ANAND, GUJARAT'.
Secretary / Treasurer.
Related Documents