19 UK Economic Outlook July 2017 3 – UK Housing market outlook Key points • House prices in the UK were not impacted by the UK’s decision to leave the EU as quickly as expected, though price growth stalled in the second half of 2016 and is now showing signs of a slowdown. Transaction volumes appear to have suffered more, but these effects are compounded by other factors such as stamp duty reform. • We anticipate that the rest of 2017 will see the slowdown in the housing market continue, yielding annual house price growth of around 3.7%, down from 7% in 2016. In our main scenario, house price inflation will pick up slightly again in later years averaging around 4% until 2025. We find that housebuilding at the level proposed by the government, although welcome, may only have a small effect in constraining house price rises in the short term. • The London housing market has been most severely impacted by economic and policy uncertainty and the recent changes to stamp duty. Price inflation in London in the first four months of 2017 was around 4% compared with around 13% for the same period in 2016. We project that London’s housing market will continue to slow with only 2.8% and 3.8% house price growth on average in 2017 and 2018 respectively. • Elsewhere in the UK, the East and Southern regions of England will continue to grow above the UK average, but Northern Ireland and the North East will continue to lag behind. • There is a huge disparity in how sub-regional housing markets have performed since the recession. Whilst the average house price across the UK has grown by 17% since mid-2007, over a quarter of all local authorities are still ‘under water’. The region that has seen the greatest decline is Northern Ireland, where on average house prices are 44% below their pre-recession peak. • There has also been a structural shift in London’s housing market recently, as house price growth has moved outward from the capital. Growing unaffordability within London, coupled with policy reform, has seen house price rises in prime central boroughs slow whilst price rises in the outer boroughs and the commuter belt have accelerated. Over the last two years, house prices in the outer boroughs have risen 9 percentage points faster than inner boroughs, whilst house price growth in the fastest growing cities within the commuter belt exceeded that in London by 4 percentage points in 2016. Introduction In this section, we explore how the UK housing market has been performing recently and present our projections for house price inflation until 2025. We also present new analysis of regional and sub-regional trends in the market showing the shifting patterns of growth since the recession. The discussion below begins by briefly reviewing recent housing market developments (Section 3.1) and then goes on to assess future UK and regional house price prospects in Section 3.2. Section 3.3 presents our new research into the development of sub-regional markets.

Welcome message from author
This document is posted to help you gain knowledge. Please leave a comment to let me know what you think about it! Share it to your friends and learn new things together.
Transcript
19UK Economic Outlook July 2017
3 – UK Housing market outlook
Key points• House prices in the UK were not
impacted by the UK’s decision to leave the EU as quickly as expected, though price growth stalled in the second half of 2016 and is now showing signs of a slowdown. Transaction volumes appear to have suffered more, but these effects are compounded by other factors such as stamp duty reform.
• We anticipate that the rest of 2017 will see the slowdown in the housing market continue, yielding annual house price growth of around 3.7%, down from 7% in 2016. In our main scenario,housepriceinflationwillpick up slightly again in later years averaging around 4% until 2025. Wefindthathousebuildingatthelevel proposed by the government, although welcome, may only have a small effect in constraining house price rises in the short term.
• The London housing market has been most severely impacted by economic and policy uncertainty and the recent changestostampduty.PriceinflationinLondoninthefirstfourmonthsof2017 was around 4% compared with around 13% for the same period in 2016. We project that London’s housing market will continue to slow with only 2.8% and 3.8% house price growth on average in 2017 and 2018 respectively.
• Elsewhere in the UK, the East and Southern regions of England will continue to grow above the UK average, but Northern Ireland and the North East will continue to lag behind.
• There is a huge disparity in how sub-regional housing markets have performed since the recession. Whilst the average house price across the UK has grown by 17% since mid-2007, over a quarter of all local authorities are still ‘under water’. The region that has seen the greatest decline is Northern Ireland, where on average house prices are 44% below their pre-recession peak.
• There has also been a structural shift in London’s housing market recently, as house price growth has moved outward from the capital. Growing unaffordability within London, coupled with policy reform, has seen house price rises in prime central boroughs slow whilst price rises in the outer boroughs and the commuter belt have accelerated. Over the last two years, house prices in the outer boroughs have risen 9 percentage points faster than inner boroughs, whilst house price growth in the fastest growing cities within the commuter belt exceeded that in London by 4 percentage points in 2016.
IntroductionIn this section, we explore how the UK housing market has been performing recently and present our projections forhousepriceinflationuntil2025. We also present new analysis of regional and sub-regional trends in the market showing the shifting patterns of growth since the recession.
Thediscussionbelowbeginsbybrieflyreviewing recent housing market developments (Section 3.1) and then goes on to assess future UK and regional house price prospects in Section 3.2. Section 3.3 presents our new research into the development of sub-regional markets.
20 UK Economic Outlook July 2017
Figure 3.1 – Annual rate of house price inflation
Source: ONS
-20
-15
-10
-5
0
5
10
15
Jan2017
Jan2016
Jan 2015
Jan2014
Jan2013
Jan2012
Jan2011
Jan2010
Jan2009
Jan2008
Jan2007
Jan2006
Year-
on-ye
ar %
chan
ge
EU Referendum
Figure 3.2 – Cumulative house price inflation by year
Source: ONS
-2
0
2
4
6
8
10
DecNovOctSepAugJulJunMayAprMarFebJan
20152014 2016 2017
Cum
ulat
ive
perc
enta
ge g
row
thre
lativ
e to
pre
viou
s De
cem
ber
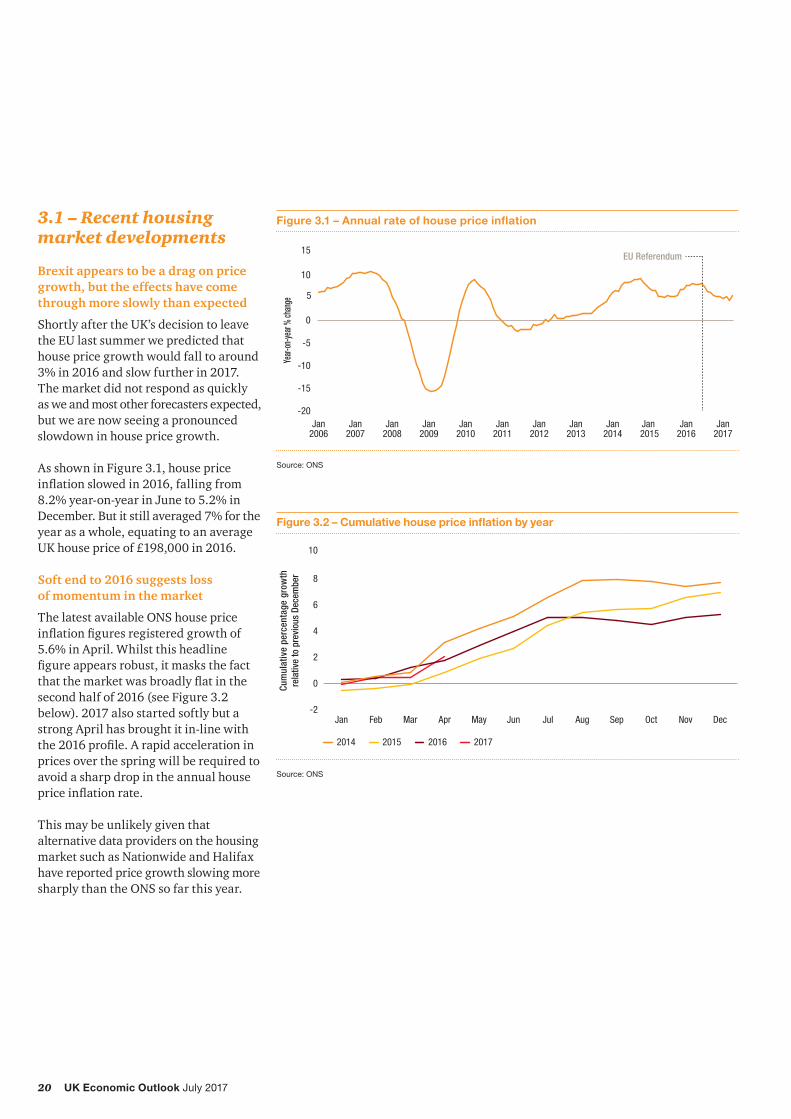
3.1 – Recent housing market developments
Brexit appears to be a drag on price growth, but the effects have come through more slowly than expected
Shortly after the UK’s decision to leave the EU last summer we predicted that house price growth would fall to around 3% in 2016 and slow further in 2017. The market did not respond as quickly as we and most other forecasters expected, but we are now seeing a pronounced slowdown in house price growth.
As shown in Figure 3.1, house price inflationslowedin2016,fallingfrom8.2% year-on-year in June to 5.2% in December. But it still averaged 7% for the year as a whole, equating to an average UK house price of £198,000 in 2016.
Soft end to 2016 suggests loss of momentum in the market
The latest available ONS house price inflationfiguresregisteredgrowthof5.6% in April. Whilst this headline figureappearsrobust,itmasksthefactthatthemarketwasbroadlyflatinthesecond half of 2016 (see Figure 3.2 below). 2017 also started softly but a strong April has brought it in-line with the2016profile.Arapidaccelerationinprices over the spring will be required to avoid a sharp drop in the annual house priceinflationrate.
This may be unlikely given that alternative data providers on the housing market such as Nationwide and Halifax have reported price growth slowing more sharply than the ONS so far this year.
21UK Economic Outlook July 2017
Figure 3.3 – Annual growth in UK housing transactions
Source:
-80
-60
-40
-20
0
20
40
60
80
100
Jan2017
Jan2016
Jan2015
Jan2014
Jan2013
Jan2012
Jan2011
Jan2010
Jan2009
Jan2008
Jan2007
Jan2006
Stamp duty reform effectiveEU Referendum
Year-
on-ye
ar %
chan
ge
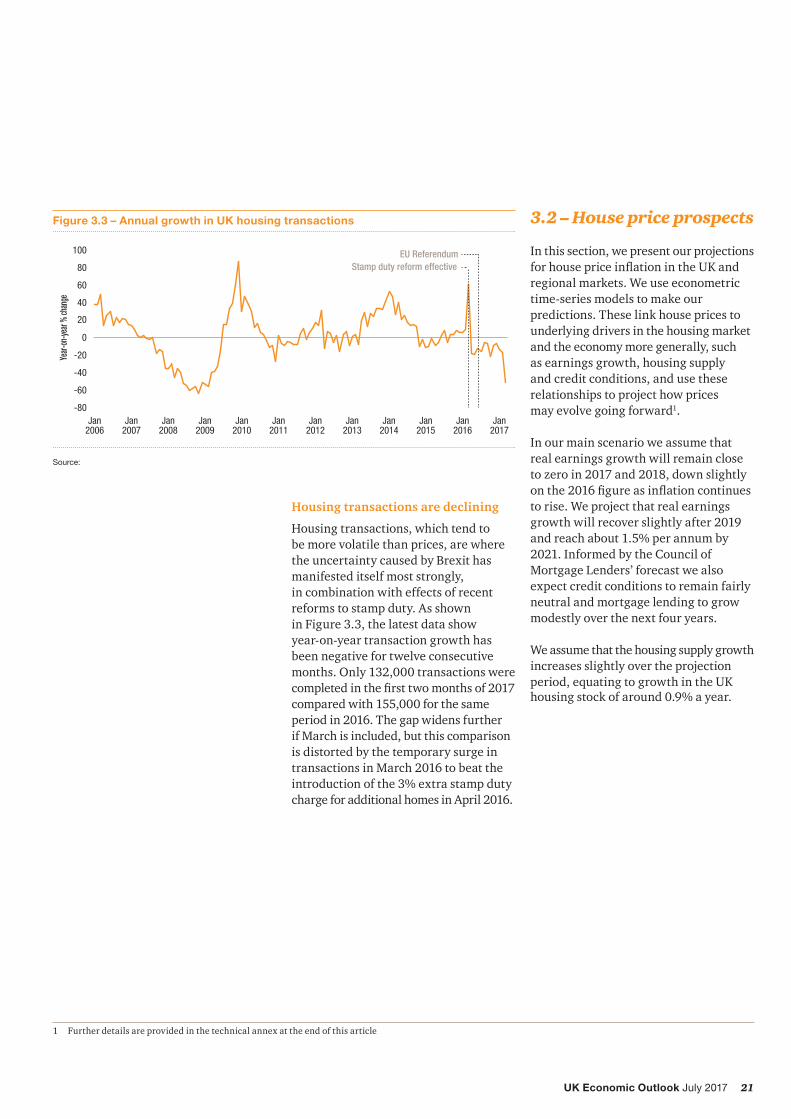
Housing transactions are declining
Housing transactions, which tend to be more volatile than prices, are where the uncertainty caused by Brexit has manifested itself most strongly, in combination with effects of recent reforms to stamp duty. As shown in Figure 3.3, the latest data show year-on-year transaction growth has been negative for twelve consecutive months. Only 132,000 transactions were completedinthefirsttwomonthsof2017compared with 155,000 for the same period in 2016. The gap widens further if March is included, but this comparison is distorted by the temporary surge in transactions in March 2016 to beat the introduction of the 3% extra stamp duty charge for additional homes in April 2016.
1 Further details are provided in the technical annex at the end of this article
3.2 – House price prospects
In this section, we present our projections forhousepriceinflationintheUKandregional markets. We use econometric time-series models to make our predictions. These link house prices to underlying drivers in the housing market and the economy more generally, such as earnings growth, housing supply and credit conditions, and use these relationships to project how prices may evolve going forward1.
In our main scenario we assume that real earnings growth will remain close to zero in 2017 and 2018, down slightly onthe2016figureasinflationcontinuesto rise. We project that real earnings growth will recover slightly after 2019 and reach about 1.5% per annum by 2021. Informed by the Council of Mortgage Lenders’ forecast we also expect credit conditions to remain fairly neutral and mortgage lending to grow modestly over the next four years.
We assume that the housing supply growth increases slightly over the projection period, equating to growth in the UK housing stock of around 0.9% a year.
22 UK Economic Outlook July 2017
House price growth slows in 2017 but price-to-earnings ratio still growing
In our main scenario, we project that house prices in the UK will grow at an average of around 3.7% this year. This is slightly less pessimistic than our projection of around 1% for 2017 made this time last year, in light of the less severe impacts of Brexit manifested thus far.
In the medium term, house prices are expected to grow at a slightly higher average rate of around 4% a year as earnings growth is assumed to strengthen. This would imply that house prices continue to outstrip earnings growth as a result of continued structural weakness in supply.
Our analysis suggests that the average residential property in the UK could be worth approximately £220,000 in 2017, £8,000 higher than in 2016, and could rise to over £300,000 by 2025.
Turning to the regional picture, we expect toseesomesignificantchangeswithLondon in particular experiencing substantial headwinds. The capital city hasseenthehighesthousepriceinflationof any UK region in eight out of the last ten years. But we expect this trend to reverse in 2017 and 2018 due to challenging affordability and London’s status as the UK’s most outward-facing region with the greatest exposure to the risks of Brexit.
Figure 3.4 – UK house price inflation main scenario projection
Source: ONS house price index historical data, PwC projections
-10
-5
0
5
10
15
20
2024202220202018201620142012201020082006200420022000
Year-
on-ye
ar %
chan
ge
Table 3.1: UK main scenario house price inflation and average house prices
Year Main scenario (% growth) Main scenario (£)
2016 (Actual) 7.0% £212,000
2017 3.7% £220,000
2018 3.9% £228,000
2019 3.9% £237,000
2020-2025 4.1% average growth £302,000 in 2025
Source: PwC analysis based on ONS house price index
23UK Economic Outlook July 2017
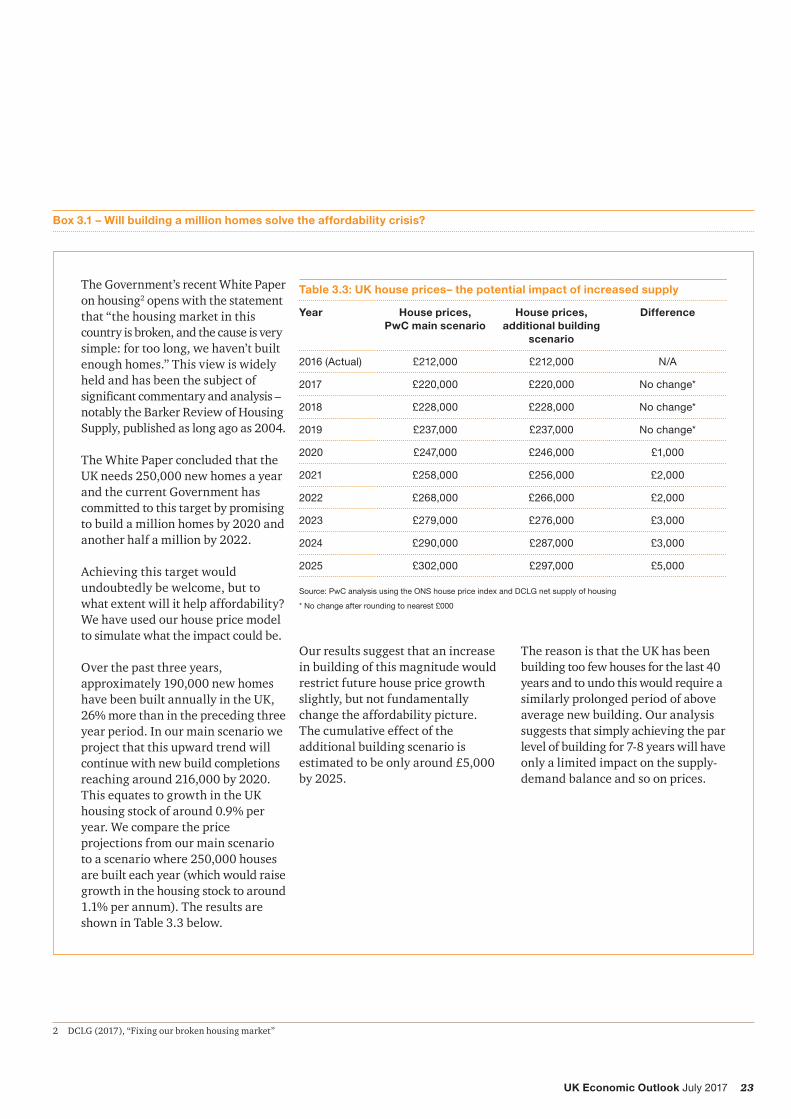
Box 3.1 – Will building a million homes solve the affordability crisis?
The Government’s recent White Paper on housing2 opens with the statement that “the housing market in this country is broken, and the cause is very simple: for too long, we haven’t built enough homes.” This view is widely held and has been the subject of significantcommentaryandanalysis–notably the Barker Review of Housing Supply, published as long ago as 2004.
The White Paper concluded that the UK needs 250,000 new homes a year and the current Government has committed to this target by promising to build a million homes by 2020 and another half a million by 2022.
Achieving this target would undoubtedly be welcome, but to what extent will it help affordability? We have used our house price model to simulate what the impact could be.
Over the past three years, approximately 190,000 new homes have been built annually in the UK, 26% more than in the preceding three year period. In our main scenario we project that this upward trend will continue with new build completions reaching around 216,000 by 2020. This equates to growth in the UK housing stock of around 0.9% per year. We compare the price projections from our main scenario to a scenario where 250,000 houses are built each year (which would raise growth in the housing stock to around 1.1% per annum). The results are shown in Table 3.3 below.
Our results suggest that an increase in building of this magnitude would restrict future house price growth slightly, but not fundamentally change the affordability picture. The cumulative effect of the additional building scenario is estimated to be only around £5,000 by 2025.
The reason is that the UK has been building too few houses for the last 40 years and to undo this would require a similarly prolonged period of above average new building. Our analysis suggests that simply achieving the par level of building for 7-8 years will have only a limited impact on the supply-demand balance and so on prices.
2 DCLG (2017), “Fixing our broken housing market”
Table 3.3: UK house prices– the potential impact of increased supply
Year House prices, PwC main scenario
House prices, additional building
scenario
Difference
2016 (Actual) £212,000 £212,000 N/A
2017 £220,000 £220,000 No change*
2018 £228,000 £228,000 No change*
2019 £237,000 £237,000 No change*
2020 £247,000 £246,000 £1,000
2021 £258,000 £256,000 £2,000
2022 £268,000 £266,000 £2,000
2023 £279,000 £276,000 £3,000
2024 £290,000 £287,000 £3,000
2025 £302,000 £297,000 £5,000
Source: PwC analysis using the ONS house price index and DCLG net supply of housing
* No change after rounding to nearest £000
24 UK Economic Outlook July 2017
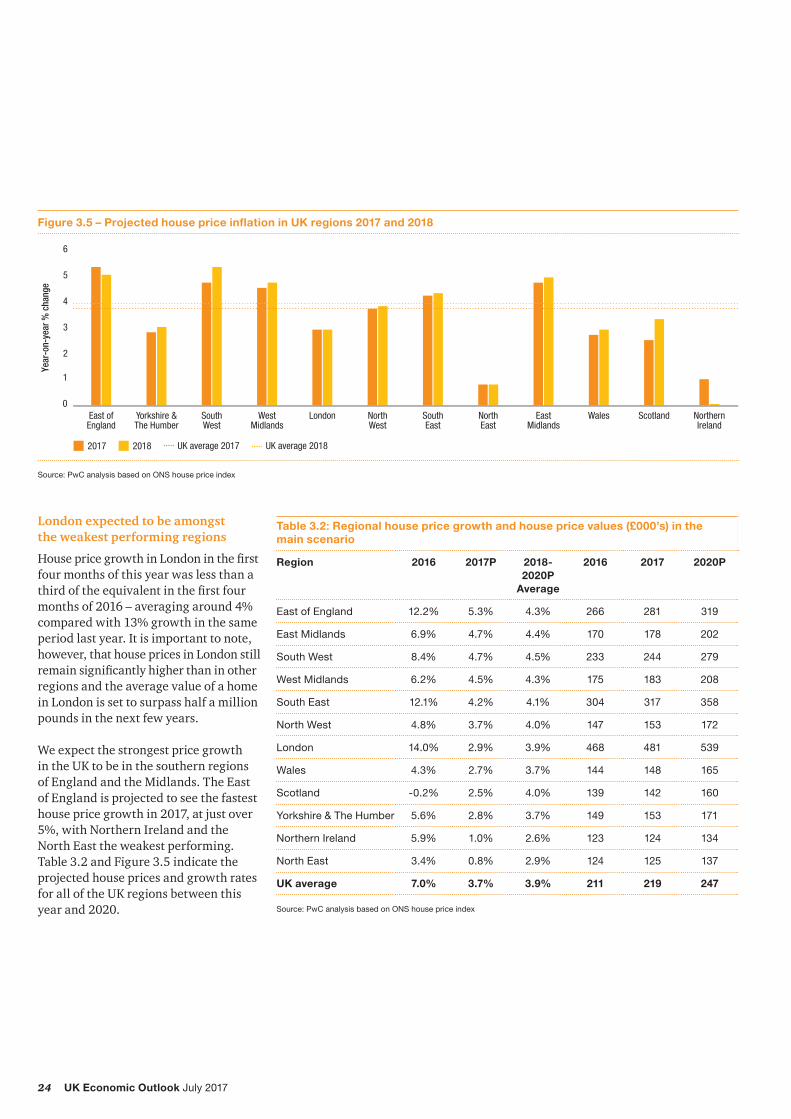
London expected to be amongst the weakest performing regions
HousepricegrowthinLondoninthefirstfour months of this year was less than a thirdoftheequivalentinthefirstfourmonths of 2016 – averaging around 4% compared with 13% growth in the same period last year. It is important to note, however, that house prices in London still remainsignificantlyhigherthaninotherregions and the average value of a home in London is set to surpass half a million pounds in the next few years.
We expect the strongest price growth in the UK to be in the southern regions of England and the Midlands. The East of England is projected to see the fastest house price growth in 2017, at just over 5%, with Northern Ireland and the North East the weakest performing. Table 3.2 and Figure 3.5 indicate the projected house prices and growth rates for all of the UK regions between this year and 2020.
Figure 3.5 – Projected house price inflation in UK regions 2017 and 2018
0
1
2
3
4
5
6
NorthernIreland
ScotlandWalesEastMidlands
NorthEast
SouthEast
NorthWest
LondonWestMidlands
SouthWest
Yorkshire &The Humber
East ofEngland
Year
-on-
year
% c
hang
e
2017 2018 UK average 2017 UK average 2018
Source: PwC analysis based on ONS house price index
Table 3.2: Regional house price growth and house price values (£000’s) in the main scenario
Region 2016 2017P 2018-2020P
Average
2016 2017 2020P
East of England 12.2% 5.3% 4.3% 266 281 319
East Midlands 6.9% 4.7% 4.4% 170 178 202
South West 8.4% 4.7% 4.5% 233 244 279
West Midlands 6.2% 4.5% 4.3% 175 183 208
South East 12.1% 4.2% 4.1% 304 317 358
North West 4.8% 3.7% 4.0% 147 153 172
London 14.0% 2.9% 3.9% 468 481 539
Wales 4.3% 2.7% 3.7% 144 148 165
Scotland -0.2% 2.5% 4.0% 139 142 160
Yorkshire & The Humber 5.6% 2.8% 3.7% 149 153 171
Northern Ireland 5.9% 1.0% 2.6% 123 124 134
North East 3.4% 0.8% 2.9% 124 125 137
UK average 7.0% 3.7% 3.9% 211 219 247
Source: PwC analysis based on ONS house price index
25UK Economic Outlook July 2017
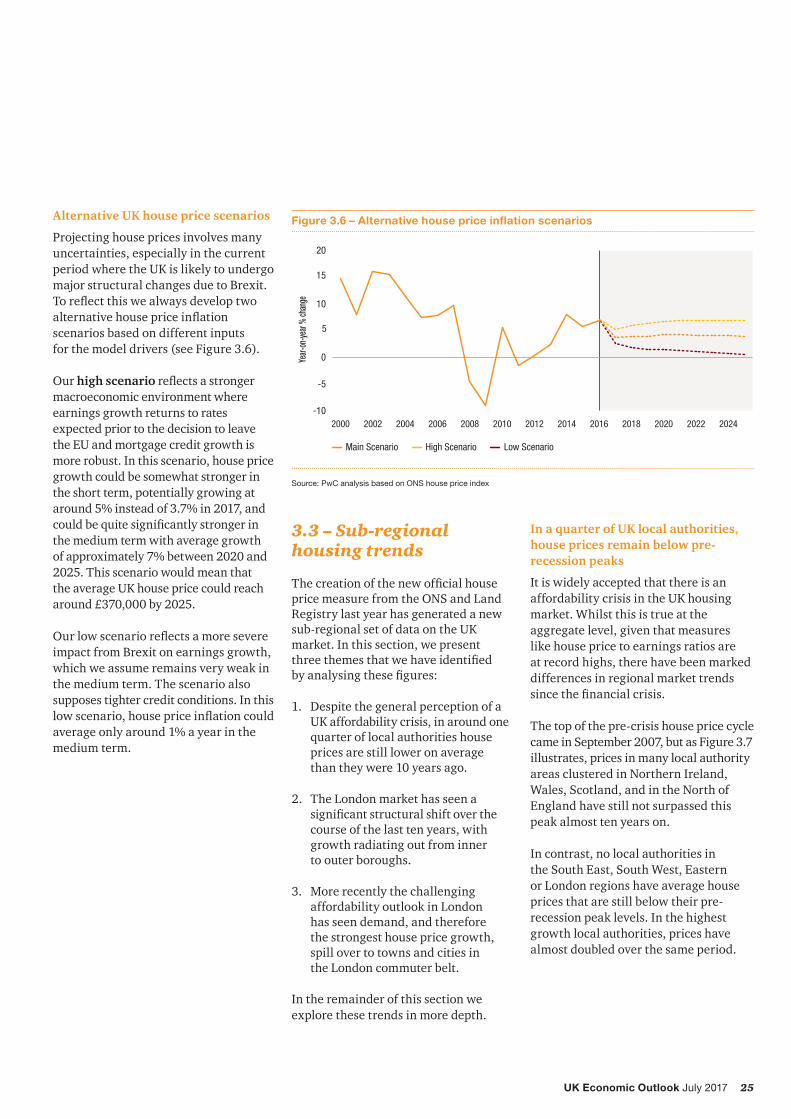
Alternative UK house price scenarios
Projecting house prices involves many uncertainties, especially in the current period where the UK is likely to undergo major structural changes due to Brexit. Toreflectthiswealwaysdeveloptwoalternativehousepriceinflationscenarios based on different inputs for the model drivers (see Figure 3.6).
Our high scenarioreflectsastrongermacroeconomic environment where earnings growth returns to rates expected prior to the decision to leave the EU and mortgage credit growth is more robust. In this scenario, house price growth could be somewhat stronger in the short term, potentially growing at around 5% instead of 3.7% in 2017, and couldbequitesignificantlystrongerinthe medium term with average growth of approximately 7% between 2020 and 2025. This scenario would mean that the average UK house price could reach around £370,000 by 2025.
Ourlowscenarioreflectsamoresevereimpact from Brexit on earnings growth, which we assume remains very weak in the medium term. The scenario also supposes tighter credit conditions. In this lowscenario,housepriceinflationcouldaverage only around 1% a year in the medium term.
Figure 3.6 – Alternative house price inflation scenarios
Source: PwC analysis based on ONS house price index
-10
-5
0
5
10
15
20
2024202220202018201620142012201020082006200420022000
High ScenarioMain Scenario Low Scenario
Year-
on-ye
ar %
chan
ge
3.3 – Sub-regional housing trends
Thecreationofthenewofficialhouseprice measure from the ONS and Land Registry last year has generated a new sub-regional set of data on the UK market. In this section, we present threethemesthatwehaveidentified byanalysingthesefigures:
1. Despite the general perception of a UK affordability crisis, in around one quarter of local authorities house prices are still lower on average than they were 10 years ago.
2. The London market has seen a significantstructuralshiftoverthecourse of the last ten years, with growth radiating out from inner to outer boroughs.
3. More recently the challenging affordability outlook in London has seen demand, and therefore the strongest house price growth, spill over to towns and cities in the London commuter belt.
In the remainder of this section we explore these trends in more depth.
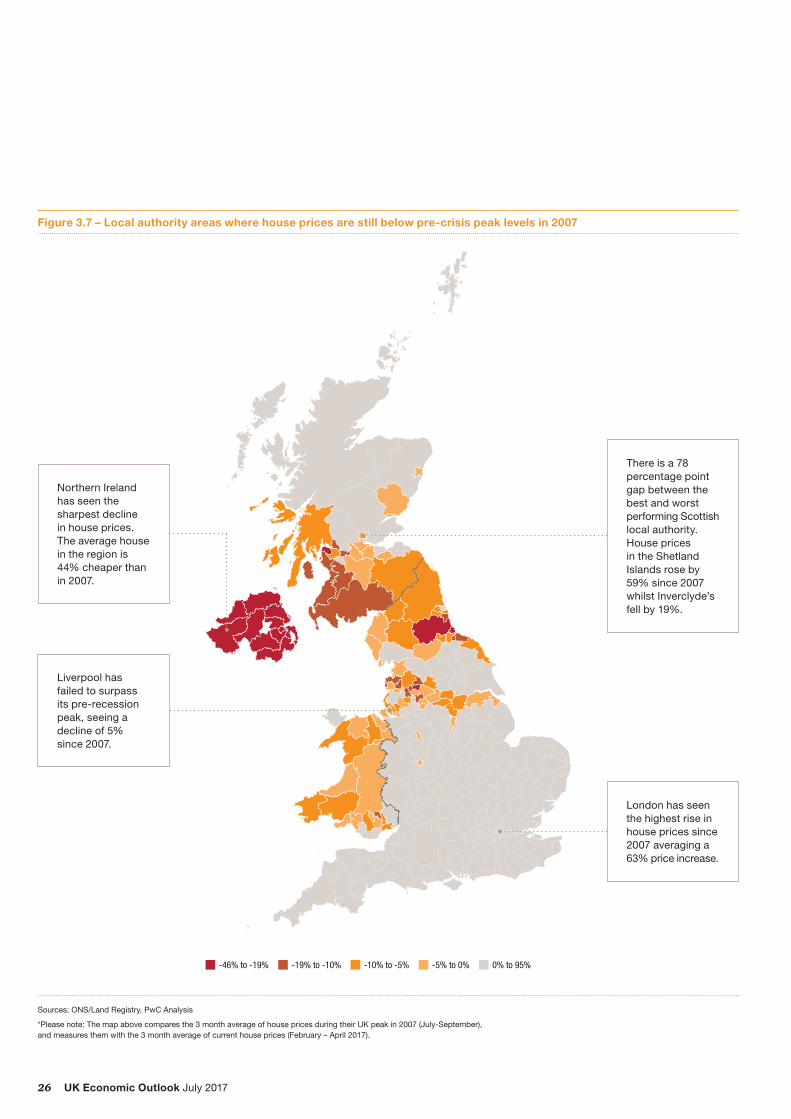
In a quarter of UK local authorities, house prices remain below pre-recession peaks
It is widely accepted that there is an affordability crisis in the UK housing market. Whilst this is true at the aggregate level, given that measures like house price to earnings ratios are at record highs, there have been marked differences in regional market trends sincethefinancialcrisis.
The top of the pre-crisis house price cycle came in September 2007, but as Figure 3.7 illustrates, prices in many local authority areas clustered in Northern Ireland, Wales, Scotland, and in the North of England have still not surpassed this peak almost ten years on.
In contrast, no local authorities in the South East, South West, Eastern or London regions have average house prices that are still below their pre-recession peak levels. In the highest growth local authorities, prices have almost doubled over the same period.
26 UK Economic Outlook July 2017
Figure 3.7 – Local authority areas where house prices are still below pre-crisis peak levels in 2007
Sources: ONS/Land Registry, PwC Analysis
*Please note: The map above compares the 3 month average of house prices during their UK peak in 2007 (July-September), and measures them with the 3 month average of current house prices (February – April 2017).
-46% to -19% -19% to -10% -10% to -5% -5% to 0% 0% to 95%
There is a 78 percentage point gap between the best and worst performing Scottish local authority. House prices in the Shetland Islands rose by 59% since 2007 whilst Inverclyde’s fell by 19%.
Northern Ireland has seen the sharpest decline in house prices. The average house in the region is 44% cheaper than in 2007.
Liverpool has failed to surpass its pre-recession peak, seeing a decline of 5% since 2007.
London has seen the highest rise in house prices since 2007 averaging a 63% price increase.
27UK Economic Outlook July 2017
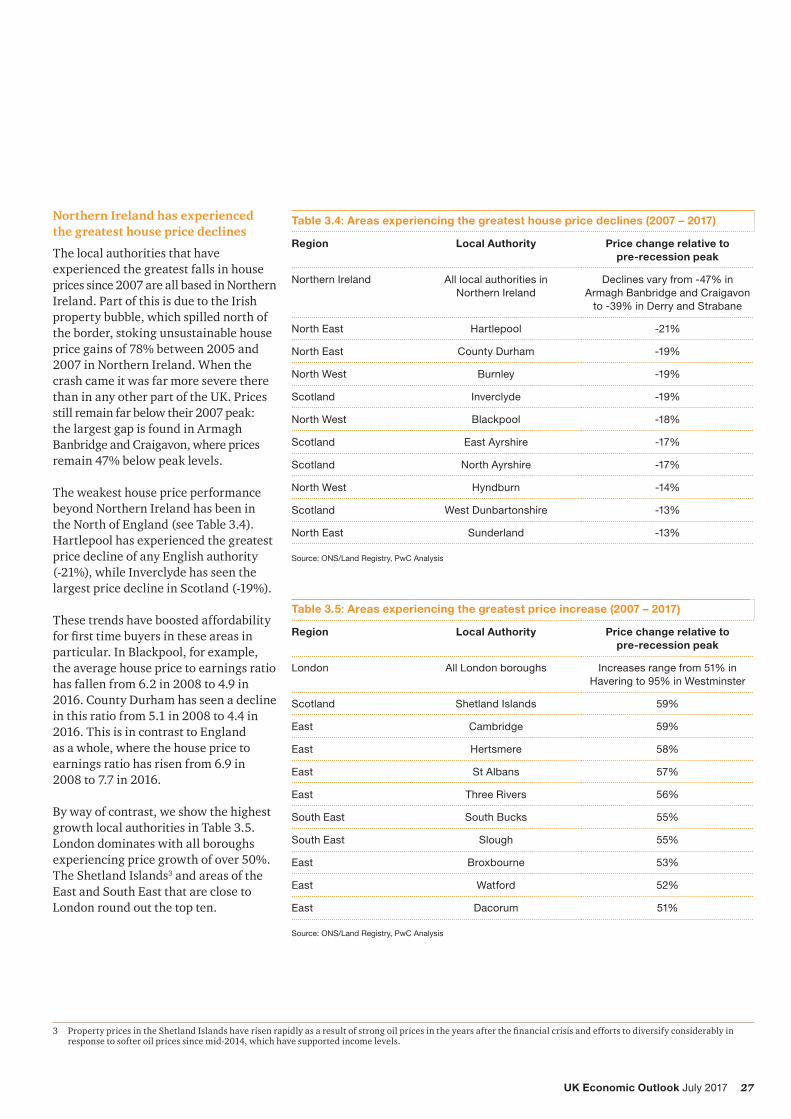
Northern Ireland has experienced the greatest house price declines
The local authorities that have experienced the greatest falls in house prices since 2007 are all based in Northern Ireland. Part of this is due to the Irish property bubble, which spilled north of the border, stoking unsustainable house price gains of 78% between 2005 and 2007 in Northern Ireland. When the crash came it was far more severe there than in any other part of the UK. Prices still remain far below their 2007 peak: the largest gap is found in Armagh Banbridge and Craigavon, where prices remain 47% below peak levels.
The weakest house price performance beyond Northern Ireland has been in the North of England (see Table 3.4). Hartlepool has experienced the greatest price decline of any English authority (-21%), while Inverclyde has seen the largest price decline in Scotland (-19%).
These trends have boosted affordability forfirsttimebuyersintheseareasinparticular. In Blackpool, for example, the average house price to earnings ratio has fallen from 6.2 in 2008 to 4.9 in 2016. County Durham has seen a decline in this ratio from 5.1 in 2008 to 4.4 in 2016. This is in contrast to England as a whole, where the house price to earnings ratio has risen from 6.9 in 2008 to 7.7 in 2016.
By way of contrast, we show the highest growth local authorities in Table 3.5. London dominates with all boroughs experiencing price growth of over 50%. The Shetland Islands3 and areas of the East and South East that are close to London round out the top ten.
Table 3.4: Areas experiencing the greatest house price declines (2007 – 2017)
Region Local Authority Price change relative to pre-recession peak
Northern Ireland All local authorities in Northern Ireland
Declines vary from -47% in Armagh Banbridge and Craigavon
to -39% in Derry and Strabane
North East Hartlepool -21%
North East County Durham -19%
North West Burnley -19%
Scotland Inverclyde -19%
North West Blackpool -18%
Scotland East Ayrshire -17%
Scotland North Ayrshire -17%
North West Hyndburn -14%
Scotland West Dunbartonshire -13%
North East Sunderland -13%
Source: ONS/Land Registry, PwC Analysis
Table 3.5: Areas experiencing the greatest price increase (2007 – 2017)
Region Local Authority Price change relative to pre-recession peak
London All London boroughs Increases range from 51% in Havering to 95% in Westminster
Scotland Shetland Islands 59%
East Cambridge 59%
East Hertsmere 58%
East St Albans 57%
East Three Rivers 56%
South East South Bucks 55%
South East Slough 55%
East Broxbourne 53%
East Watford 52%
East Dacorum 51%
Source: ONS/Land Registry, PwC Analysis
3 PropertypricesintheShetlandIslandshaverisenrapidlyasaresultofstrongoilpricesintheyearsafterthefinancialcrisisandeffortstodiversifyconsiderablyinresponse to softer oil prices since mid-2014, which have supported income levels.
28 UK Economic Outlook July 2017
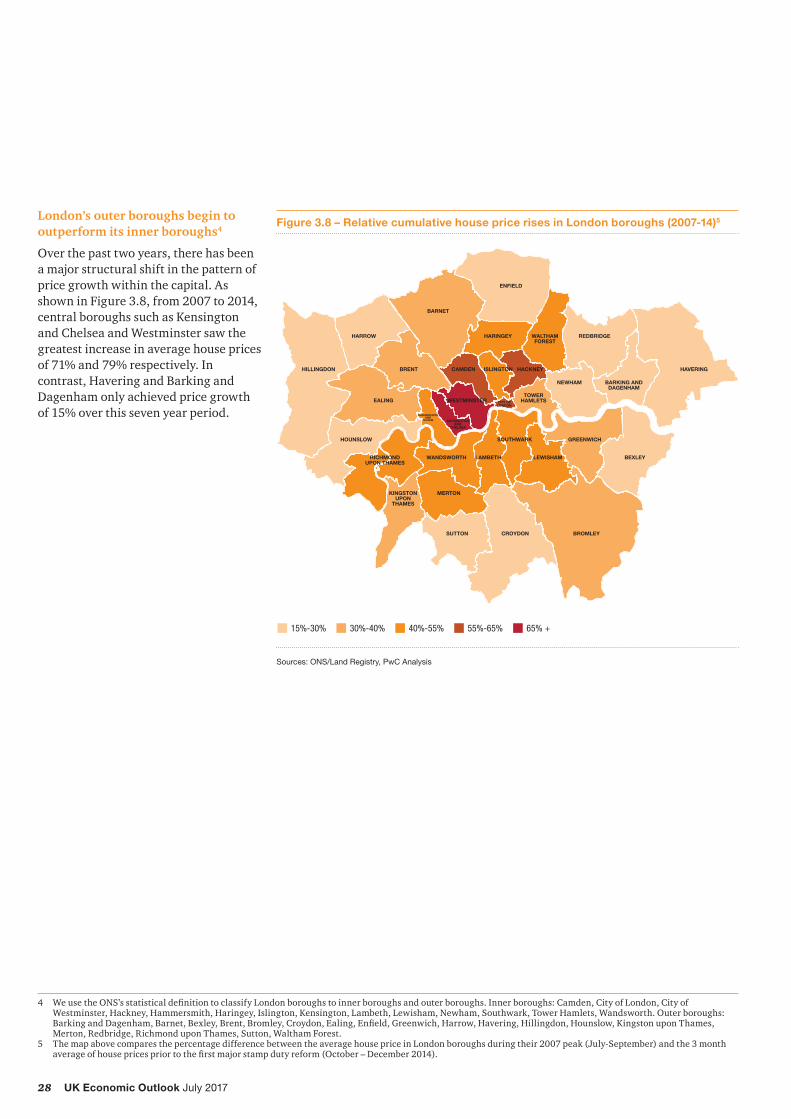
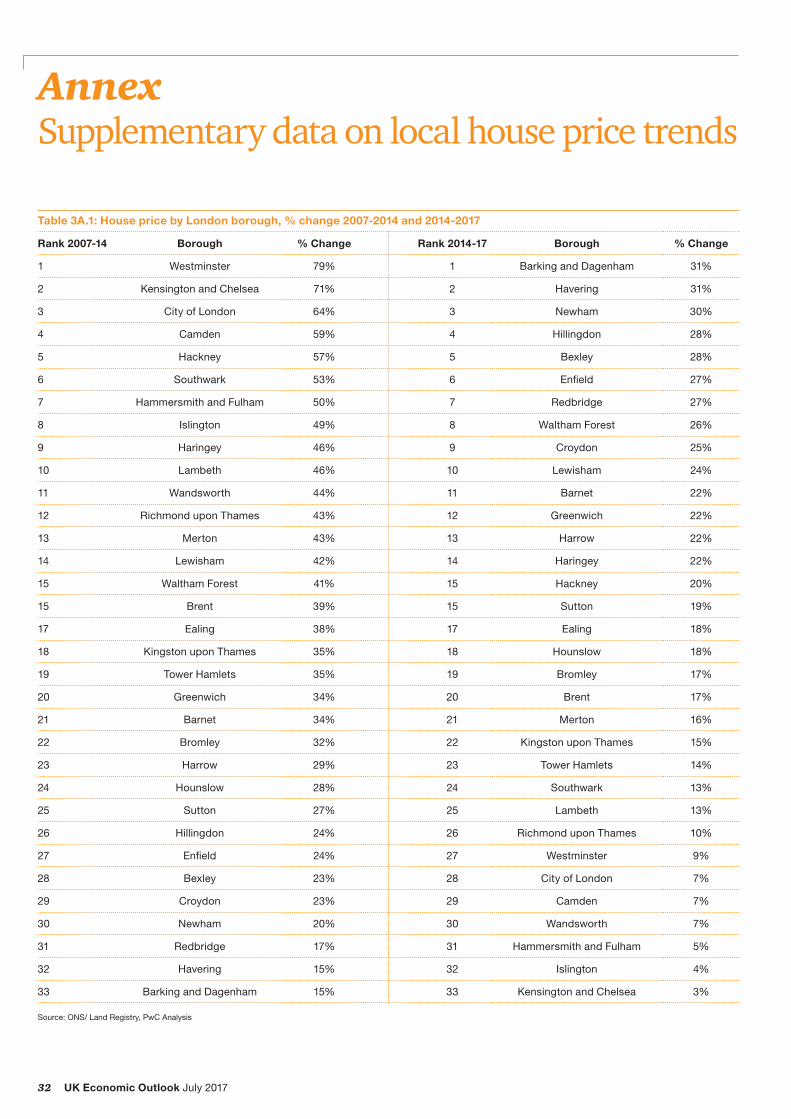
London’s outer boroughs begin to outperform its inner boroughs4
Over the past two years, there has been a major structural shift in the pattern of price growth within the capital. As shown in Figure 3.8, from 2007 to 2014, central boroughs such as Kensington and Chelsea and Westminster saw the greatest increase in average house prices of 71% and 79% respectively. In contrast, Havering and Barking and Dagenham only achieved price growth of 15% over this seven year period.
Figure 3.8 – Relative cumulative house price rises in London boroughs (2007-14)5
15%-30% 30%-40% 40%-55% 55%-65% 65% +
BROMLEYCROYDONSUTTON
KINGSTONUPON
THAMES
MERTON
RICHMONDUPON THAMES
WANDSWORTH LAMBETH LEWISHAM BEXLEY
GREENWICHSOUTHWARKHOUNSLOW
BRENT
HARROW
HILLINGDON
EALING WESTMINSTERTOWER
HAMLETS
NEWHAM BARKING ANDDAGENHAM
HAVERINGCAMDEN ISLINGTON HACKNEY
BARNET
ENFIELD
HARINGEY REDBRIDGEWALTHAMFOREST
CITY OFLONDON
KENSINGTON AND
CHELSEA
Sources: ONS/Land Registry, PwC Analysis
4 WeusetheONS’sstatisticaldefinitiontoclassifyLondonboroughstoinnerboroughsandouterboroughs.Innerboroughs:Camden,CityofLondon,CityofWestminster, Hackney, Hammersmith, Haringey, Islington, Kensington, Lambeth, Lewisham, Newham, Southwark, Tower Hamlets, Wandsworth. Outer boroughs: BarkingandDagenham,Barnet,Bexley,Brent,Bromley,Croydon,Ealing,Enfield,Greenwich,Harrow,Havering,Hillingdon,Hounslow,KingstonuponThames,Merton, Redbridge, Richmond upon Thames, Sutton, Waltham Forest.
5 The map above compares the percentage difference between the average house price in London boroughs during their 2007 peak (July-September) and the 3 month averageofhousepricespriortothefirstmajorstampdutyreform(October–December2014).
29UK Economic Outlook July 2017
Figure 3.9 – Relative cumulative house price rises in London boroughs (2014-17)6
1%-7% 7%-12% 12%-18% 18%-24% 24% +
BROMLEYCROYDONSUTTON
KINGSTONUPON
THAMES
MERTON
RICHMONDUPON THAMES
WANDSWORTH LAMBETH LEWISHAM BEXLEY
GREENWICHSOUTHWARKHOUNSLOW
BRENT
HARROW
HILLINGDON
EALING WESTMINSTERTOWER
HAMLETS
NEWHAM BARKING ANDDAGENHAM
HAVERINGCAMDEN ISLINGTON HACKNEY
BARNET
ENFIELD
HARINGEY REDBRIDGEWALTHAMFOREST
CITY OFLONDON
KENSINGTON AND
CHELSEA
Sources: ONS/Land Registry, PwC Analysis
Stamp duty reforms and affordability have dampened the inner London market
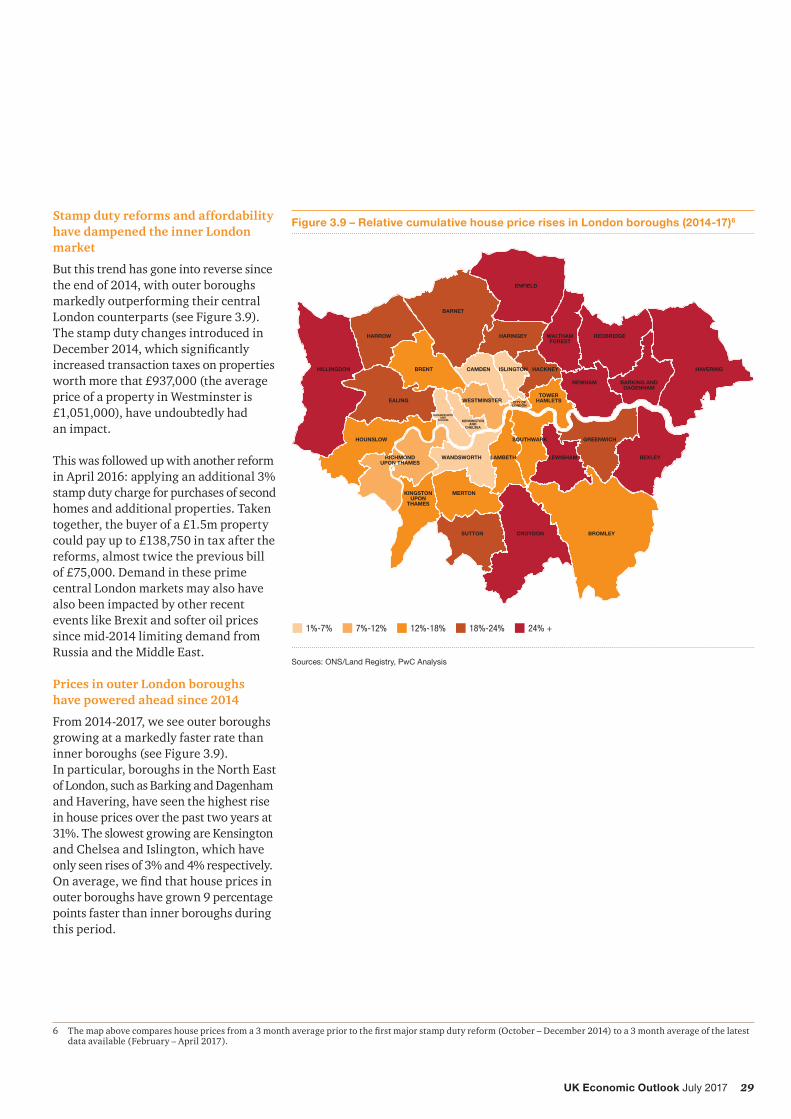
But this trend has gone into reverse since the end of 2014, with outer boroughs markedly outperforming their central London counterparts (see Figure 3.9). The stamp duty changes introduced in December2014,whichsignificantlyincreased transaction taxes on properties worth more that £937,000 (the average price of a property in Westminster is £1,051,000), have undoubtedly had an impact.
This was followed up with another reform in April 2016: applying an additional 3% stamp duty charge for purchases of second homes and additional properties. Taken together, the buyer of a £1.5m property could pay up to £138,750 in tax after the reforms, almost twice the previous bill of £75,000. Demand in these prime central London markets may also have also been impacted by other recent events like Brexit and softer oil prices since mid-2014 limiting demand from Russia and the Middle East.
Prices in outer London boroughs have powered ahead since 2014
From 2014-2017, we see outer boroughs growing at a markedly faster rate than inner boroughs (see Figure 3.9). In particular, boroughs in the North East of London, such as Barking and Dagenham and Havering, have seen the highest rise in house prices over the past two years at 31%. The slowest growing are Kensington and Chelsea and Islington, which have only seen rises of 3% and 4% respectively. Onaverage,wefindthathousepricesinouter boroughs have grown 9 percentage points faster than inner boroughs during this period.
6 Themapabovecompareshousepricesfroma3monthaveragepriortothefirstmajorstampdutyreform(October–December2014)toa3monthaverageofthelatestdata available (February – April 2017).
30 UK Economic Outlook July 2017
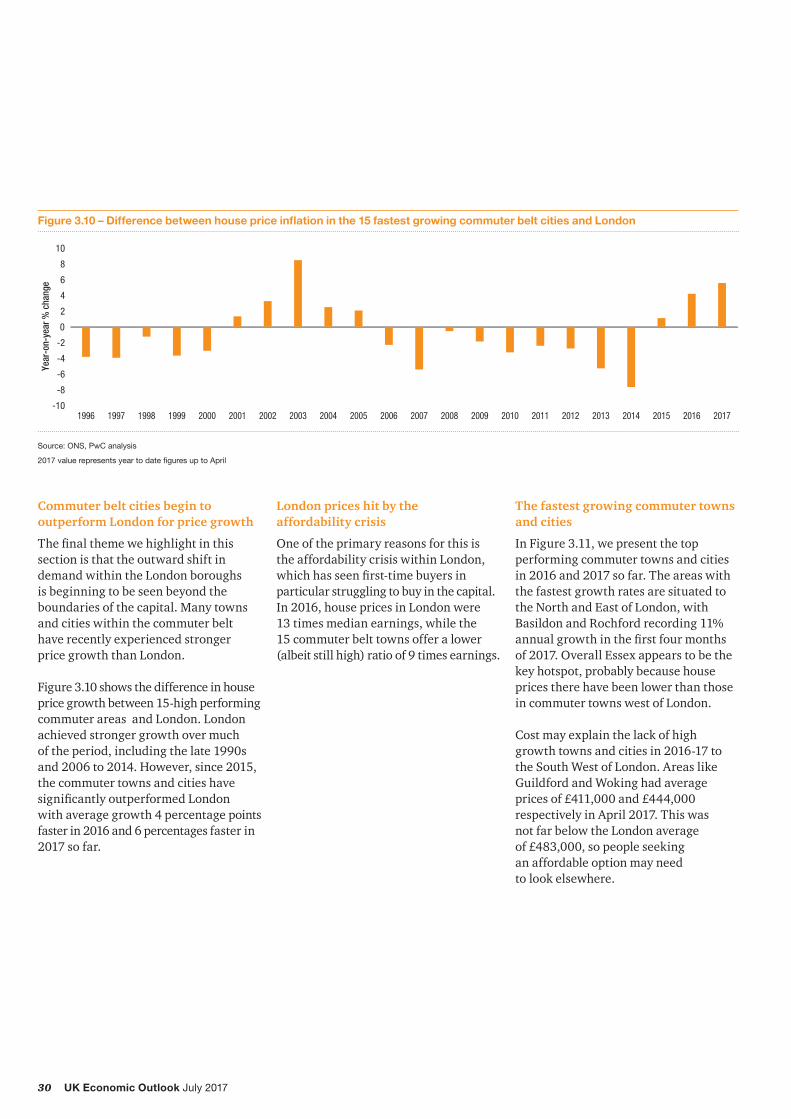
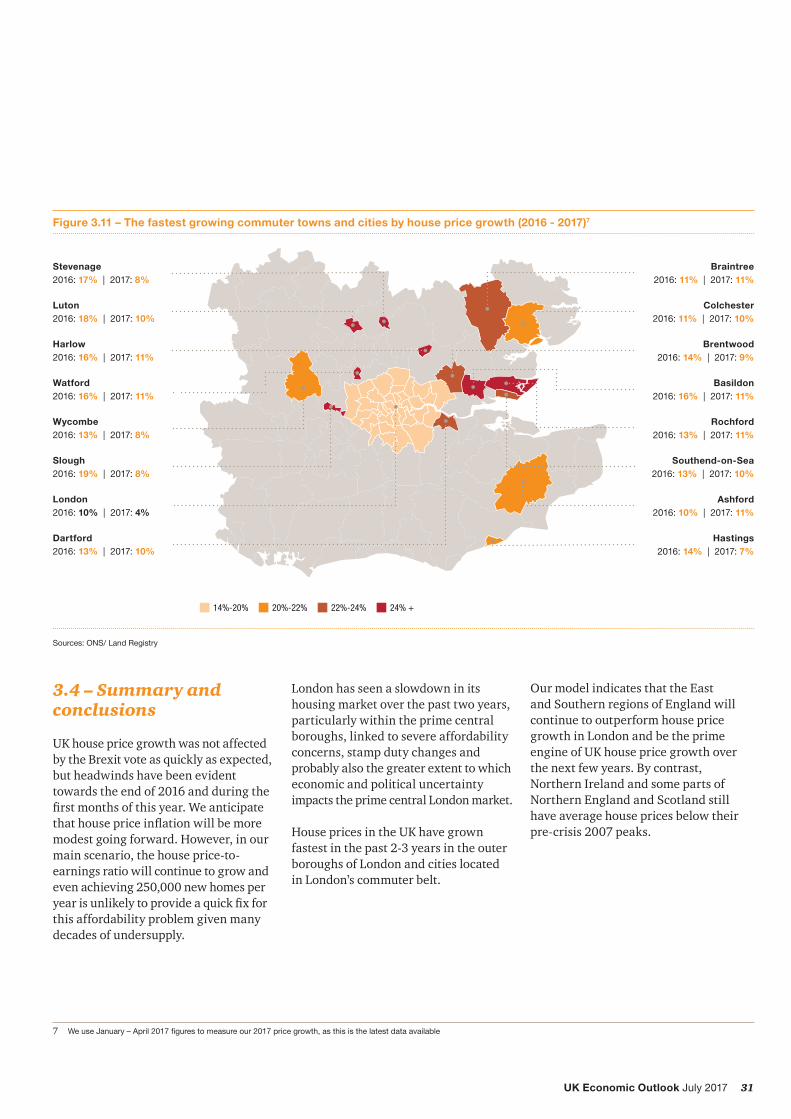
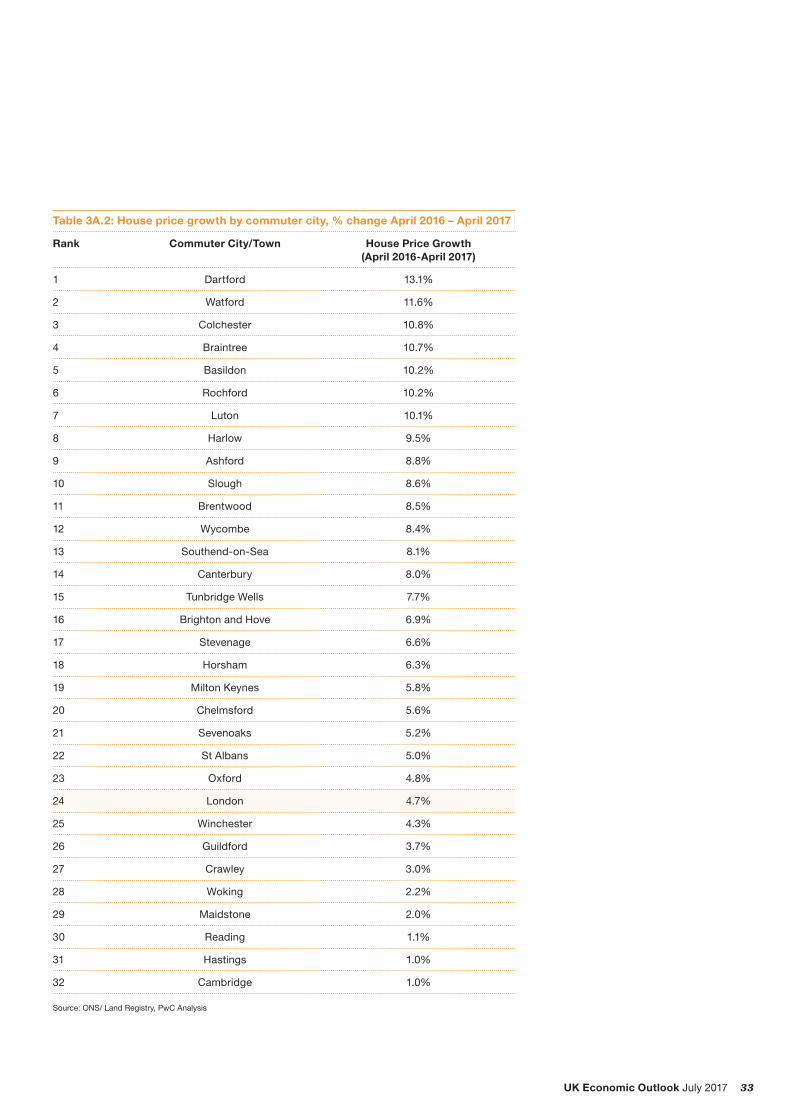
Commuter belt cities begin to outperform London for price growth
Thefinalthemewehighlightinthissection is that the outward shift in demand within the London boroughs is beginning to be seen beyond the boundaries of the capital. Many towns and cities within the commuter belt have recently experienced stronger price growth than London.
Figure 3.10 shows the difference in house price growth between 15-high performing commuter areas and London. London achieved stronger growth over much of the period, including the late 1990s and 2006 to 2014. However, since 2015, the commuter towns and cities have significantlyoutperformedLondon with average growth 4 percentage points faster in 2016 and 6 percentages faster in 2017 so far.
Figure 3.10 – Difference between house price inflation in the 15 fastest growing commuter belt cities and London
Source: ONS, PwC analysis
2017 value represents year to date figures up to April
-10
-8
-6
-4
-2
0
2
4
6
8
10
2017201620152014201320122011201020092008200720062005200420032002200120001999199819971996
Year
-on-
year
% c
hang
e
London prices hit by the affordability crisis
One of the primary reasons for this is the affordability crisis within London, whichhasseenfirst-timebuyersinparticular struggling to buy in the capital. In 2016, house prices in London were 13 times median earnings, while the 15 commuter belt towns offer a lower (albeit still high) ratio of 9 times earnings.
The fastest growing commuter towns and cities
In Figure 3.11, we present the top performing commuter towns and cities in 2016 and 2017 so far. The areas with the fastest growth rates are situated to the North and East of London, with Basildon and Rochford recording 11% annualgrowthinthefirstfourmonthsof 2017. Overall Essex appears to be the key hotspot, probably because house prices there have been lower than those in commuter towns west of London.
Cost may explain the lack of high growth towns and cities in 2016-17 to the South West of London. Areas like Guildford and Woking had average prices of £411,000 and £444,000 respectively in April 2017. This was not far below the London average of £483,000, so people seeking an affordable option may need to look elsewhere.
31UK Economic Outlook July 2017
Figure 3.11 – The fastest growing commuter towns and cities by house price growth (2016 - 2017)7
Sources: ONS/ Land Registry
London2016: 10% | 2017: 4%
Wycombe2016: 13% | 2017: 8%
Slough2016: 19% | 2017: 8%
Watford2016: 16% | 2017: 11%
Luton2016: 18% | 2017: 10%
Stevenage2016: 17% | 2017: 8%
Harlow2016: 16% | 2017: 11%
Dartford2016: 13% | 2017: 10%
Braintree2016: 11% | 2017: 11%
Colchester2016: 11% | 2017: 10%
Brentwood2016: 14% | 2017: 9%
Basildon2016: 16% | 2017: 11%
Rochford2016: 13% | 2017: 11%
Southend-on-Sea2016: 13% | 2017: 10%
Ashford2016: 10% | 2017: 11%
Hastings2016: 14% | 2017: 7%
14%-20% 20%-22% 22%-24% 24% +
3.4 – Summary and conclusions
UK house price growth was not affected by the Brexit vote as quickly as expected, but headwinds have been evident towards the end of 2016 and during the firstmonthsofthisyear.Weanticipatethathousepriceinflationwillbemoremodest going forward. However, in our main scenario, the house price-to-earnings ratio will continue to grow and even achieving 250,000 new homes per yearisunlikelytoprovideaquickfixforthis affordability problem given many decades of undersupply.
London has seen a slowdown in its housing market over the past two years, particularly within the prime central boroughs, linked to severe affordability concerns, stamp duty changes and probably also the greater extent to which economic and political uncertainty impacts the prime central London market.
House prices in the UK have grown fastest in the past 2-3 years in the outer boroughs of London and cities located in London’s commuter belt.
7 We use January – April 2017 figures to measure our 2017 price growth, as this is the latest data available
Our model indicates that the East and Southern regions of England will continue to outperform house price growth in London and be the prime engine of UK house price growth over the next few years. By contrast, Northern Ireland and some parts of Northern England and Scotland still have average house prices below their pre-crisis 2007 peaks.
32 UK Economic Outlook July 2017
Annex Supplementary data on local house price trends
Table 3A.1: House price by London borough, % change 2007-2014 and 2014-2017
Rank 2007-14 Borough % Change Rank 2014-17 Borough % Change
1 Westminster 79% 1 Barking and Dagenham 31%
2 Kensington and Chelsea 71% 2 Havering 31%
3 City of London 64% 3 Newham 30%
4 Camden 59% 4 Hillingdon 28%
5 Hackney 57% 5 Bexley 28%
6 Southwark 53% 6 Enfield 27%
7 Hammersmith and Fulham 50% 7 Redbridge 27%
8 Islington 49% 8 Waltham Forest 26%
9 Haringey 46% 9 Croydon 25%
10 Lambeth 46% 10 Lewisham 24%
11 Wandsworth 44% 11 Barnet 22%
12 Richmond upon Thames 43% 12 Greenwich 22%
13 Merton 43% 13 Harrow 22%
14 Lewisham 42% 14 Haringey 22%
15 Waltham Forest 41% 15 Hackney 20%
15 Brent 39% 15 Sutton 19%
17 Ealing 38% 17 Ealing 18%
18 Kingston upon Thames 35% 18 Hounslow 18%
19 Tower Hamlets 35% 19 Bromley 17%
20 Greenwich 34% 20 Brent 17%
21 Barnet 34% 21 Merton 16%
22 Bromley 32% 22 Kingston upon Thames 15%
23 Harrow 29% 23 Tower Hamlets 14%
24 Hounslow 28% 24 Southwark 13%
25 Sutton 27% 25 Lambeth 13%
26 Hillingdon 24% 26 Richmond upon Thames 10%
27 Enfield 24% 27 Westminster 9%
28 Bexley 23% 28 City of London 7%
29 Croydon 23% 29 Camden 7%
30 Newham 20% 30 Wandsworth 7%
31 Redbridge 17% 31 Hammersmith and Fulham 5%
32 Havering 15% 32 Islington 4%
33 Barking and Dagenham 15% 33 Kensington and Chelsea 3%
Source: ONS/ Land Registry, PwC Analysis
33UK Economic Outlook July 2017
Table 3A.2: House price growth by commuter city, % change April 2016 – April 2017
Rank Commuter City/Town House Price Growth (April 2016-April 2017)
1 Dartford 13.1%
2 Watford 11.6%
3 Colchester 10.8%
4 Braintree 10.7%
5 Basildon 10.2%
6 Rochford 10.2%
7 Luton 10.1%
8 Harlow 9.5%
9 Ashford 8.8%
10 Slough 8.6%
11 Brentwood 8.5%
12 Wycombe 8.4%
13 Southend-on-Sea 8.1%
14 Canterbury 8.0%
15 Tunbridge Wells 7.7%
16 Brighton and Hove 6.9%
17 Stevenage 6.6%
18 Horsham 6.3%
19 Milton Keynes 5.8%
20 Chelmsford 5.6%
21 Sevenoaks 5.2%
22 St Albans 5.0%
23 Oxford 4.8%
24 London 4.7%
25 Winchester 4.3%
26 Guildford 3.7%
27 Crawley 3.0%
28 Woking 2.2%
29 Maidstone 2.0%
30 Reading 1.1%
31 Hastings 1.0%
32 Cambridge 1.0%
Source: ONS/ Land Registry, PwC Analysis
34 UK Economic Outlook July 2017
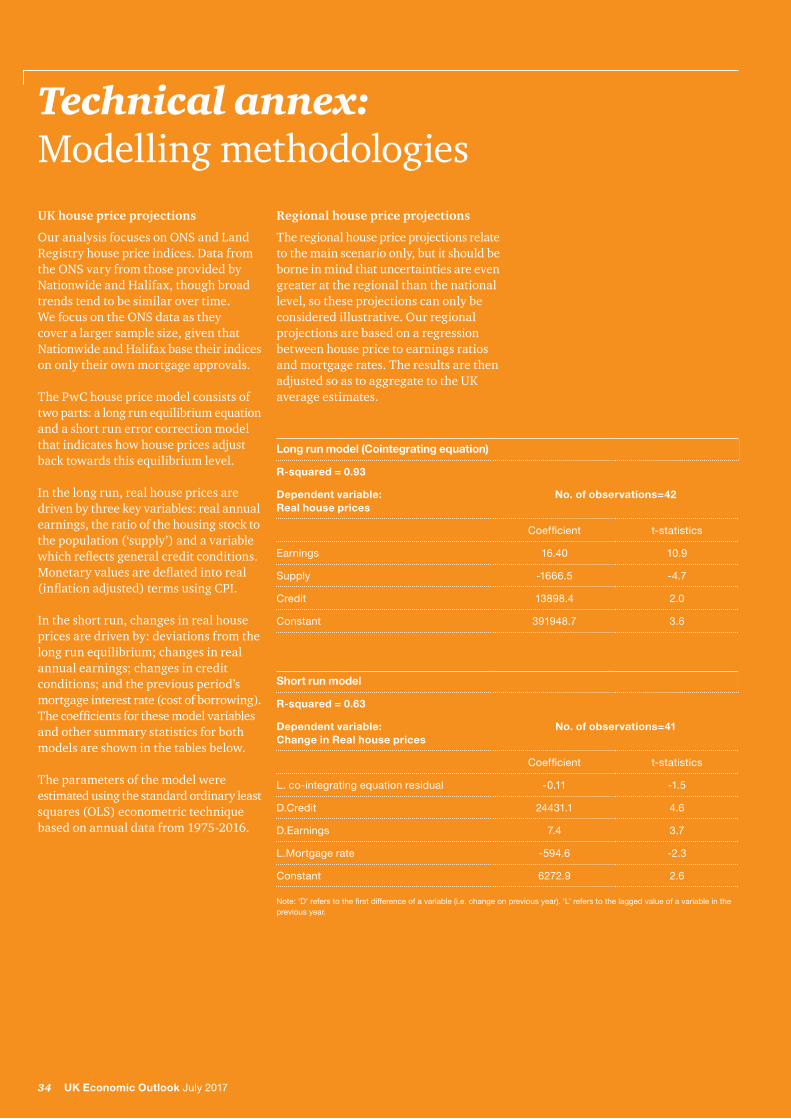
Technical annex: Modelling methodologiesUK house price projections
Our analysis focuses on ONS and Land Registry house price indices. Data from the ONS vary from those provided by Nationwide and Halifax, though broad trends tend to be similar over time. We focus on the ONS data as they cover a larger sample size, given that Nationwide and Halifax base their indices on only their own mortgage approvals.
The PwC house price model consists of two parts: a long run equilibrium equation and a short run error correction model that indicates how house prices adjust back towards this equilibrium level.
In the long run, real house prices are driven by three key variables: real annual earnings, the ratio of the housing stock to the population (‘supply’) and a variable whichreflectsgeneralcreditconditions.Monetaryvaluesaredeflatedintoreal(inflationadjusted)termsusingCPI.
In the short run, changes in real house prices are driven by: deviations from the long run equilibrium; changes in real annual earnings; changes in credit conditions; and the previous period’s mortgage interest rate (cost of borrowing). Thecoefficientsforthesemodelvariablesand other summary statistics for both models are shown in the tables below.
The parameters of the model were estimated using the standard ordinary least squares (OLS) econometric technique based on annual data from 1975-2016.
Long run model (Cointegrating equation)
R-squared = 0.93
Dependent variable: Real house prices
No. of observations=42
Coefficient t-statistics
Earnings 16.40 10.9
Supply -1666.5 -4.7
Credit 13898.4 2.0
Constant 391948.7 3.6
Short run model
R-squared = 0.63
Dependent variable: Change in Real house prices
No. of observations=41
Coefficient t-statistics
L. co-integrating equation residual -0.11 -1.5
D.Credit 24431.1 4.6
D.Earnings 7.4 3.7
L.Mortgage rate -594.6 -2.3
Constant 6272.9 2.6
Note: ‘D’ refers to the first difference of a variable (i.e. change on previous year). ‘L’ refers to the lagged value of a variable in the previous year.
Regional house price projections
The regional house price projections relate to the main scenario only, but it should be borne in mind that uncertainties are even greater at the regional than the national level, so these projections can only be considered illustrative. Our regional projections are based on a regression between house price to earnings ratios and mortgage rates. The results are then adjusted so as to aggregate to the UK average estimates.
34 UK Economic Outlook July 2017

www.pwc.co.uk/economics
At PwC, our purpose is to build trust in society and solve important problems. PwC is a network of firms in 157 countries with more than 223,000 people who are committed to delivering quality in assurance, advisory and tax services. Find out more and tell us what matters to you by visiting us at www.pwc.com/UK.
This publication has been prepared for general guidance on matters of interest only, and does not constitute professional advice. You should not act upon the information contained in this publication without obtaining specific professional advice. No representation or warranty (express or implied) is given as to the accuracy or completeness of the information contained in this publication, and, to the extent permitted by law, PricewaterhouseCoopers LLP, its members, employees and agents do not accept or assume any liability, responsibility or duty of care for any consequences of you or anyone else acting, or refraining to act, in reliance on the information contained in this publication or for any decision based on it.
© 2017 PricewaterhouseCoopers LLP. All rights reserved. In this document, "PwC" refers to the UK member firm, and may sometimes refer to the PwC network. Each member firm is a separate legal entity. Please see www.pwc.com/structure for further details.
The Design Group 31955 (07/17)
Related Documents