3 III March 2015

Welcome message from author
This document is posted to help you gain knowledge. Please leave a comment to let me know what you think about it! Share it to your friends and learn new things together.
Transcript

3 III March 2015

www.ijraset.com Volume 3 Issue III, March 2015 IC Value: 13.98 ISSN: 2321-9653
International Journal for Research in Applied Science & Engineering Technology (IJRASET)
©IJRASET 2015: All Rights are Reserved 550
Sweat Based Blood Glucose Analysis A.Velmurugan1, Sanjanaa Jeevandass2, Fina Jeena Simon3, Libya Bhojan4
1,2,3,4Department of Biomedical Engineering, Sri Ramakrishna Engineering College, Coimbatore
Abstract—Painless and reliable glucose monitoring for diabetes is the battle of the next generation. As technology advances, both diagnostic techniques and equipment are designed to work non-invasively. Glucose monitoring becomes an inevitable part of a diabetic’s life and hence a technology which could reduce the number of times the patients would have to puncture themselves for the blood testing would be greatly appreciated. Till date different technologies have been applied to quantify blood glucose non-invasively such as spectroscopy, fluoroscopy, bio-impedance principle, etc., however these methods are not fallible as the accuracy fluctuates [5]. Every human being perspires and it has been proven that the glucose content in sweat varies proportionally with the blood glucose. Hence quantifying the glucose in sweat can deliver the correct blood glucose level based on which further diagnoses could be made by the doctors. In this paper the difficulties involved in the analysis of blood glucose using sweat and the constraints will be discussed. The sweat can be induced either by the transdermal delivery of pilocarpine (sweat gland activating drug) by iontophoresis or by the use of sweat inducer fabric (localized heating). Sweat collected; on reaction with the glucose oxidase biosensor will produce amperometric change from which blood glucose can be quantified. Keywords—Perspiration, Blood Glucose, Iontophoresis, Pilocarpine, Localized heating, Glucose oxidase enzyme
I. INTRODUCTION
A recent study has forecasted that, approximately 285 million people worldwide in the age group of 20–79 years will have diabetes by 2030. The global hike in the incidence of diabetes is due to urbanization, population explosion, aging, obesity and physical inactivity. The independent associations of the following factors influence the onset of Diabetes: age, body mass index (BMI), waist-to-hip ratio, a family history of diabetes, monthly income and sedentary physical activity. Diabetes mellitus is a chronic condition that affects the body’s ability to consume the energy found in food. It refers to a group of metabolic diseases, characterized by high blood glucose (blood sugar), either due to insulin insufficiency or due to the inability of the body’s cells to respond to insulin, or both. Patients with high blood sugar will experience symptoms such as polyuria (frequent urination), polydipsia (increase in thirst) and polyphagia (increase in hunger).
A. Types of Diabetes Type I Diabetes Type II Diabetes Gestational Diabetes
Type 1 diabetes or insulin-dependent diabetes is an autoimmune condition which often begins in childhood. In this condition, the body attacks its own pancreas with antibodies and hence the damaged pancreas fails to secrete insulin. This type of diabetes may be caused by a genetic predisposition or faulty beta cells in the pancreas. Type 2 diabetes or non-insulin-dependent diabetes is often a milder form of diabetes than type 1. With Type 2 diabetes, the pancreas usually produces some insulin which either is not enough for the body’s needs, or is resisted by the body’s cells. Pregnancy triggered diabetes is known gestational diabetes. As high blood sugar levels in a mother are circulated through the placenta to the baby, gestational diabetes must be controlled to protect the baby’s growth and development. In all the above cases, Insulin can be administered as one form major treatment.
II. STUDY OF HUMAN PERSPIRATION (SWEAT)
Fluid given off by the skin is a hypotonic solution of the blood plasma defined as sweat and is classified as insensible and sensible perspiration, depending on volume. Under normal conditions about 600 to 700 cc is evaporated from the skin in 24 hours [7]. The skin loses water by two means: by evaporation from the epidermal surface and by secretion through the sweat-glands. Insensible perspiration happens when water is evaporated so quickly that it is not visible. When water collects on the skin more rapidly than it is given off, then it is known as sensible perspiration. The sweat-glands under normal conditions only regulate the composition of the blood-plasma to a minor extent compared to the kidneys and lungs yet, the loss of constituents of the blood-plasma by continued sweating can aid in the diagnosis of disorders.
www.ijraset.com Volume 3 Issue III, March 2015 IC Value: 13.98 ISSN: 2321-9653
International Journal for Research in Applied Science & Engineering Technology (IJRASET)
©IJRASET 2015: All Rights are Reserved 551
A. Composition of Sweat Perspiration can be described as a slightly turbid, nearly colourless fluid, salty in taste, and having a rancid smell. Investigators have found that perspiration consists of water, inorganic salts, uric acid, ammonia, amino-acids, lactic acid, urea, and sugar or glucose [8]. The major proportion of the sweat consists of cations (Na+, K, Mg2+, etc.) and anions (Cl-, HCO3-, etc.) that maintain the pH between 5.2 and 7.3. Glucose is present in trace amount [8]. Urea content is 4-6 times that of plasma in sweat [8]. Proteins and lipids are found in traces. There are significant amounts of amino acids. Lactic acid concentration is higher than that in blood or urine. Theoretically glucose content present in the sweat is 20 mg/100 c.c. in an average female and 12.6 mg/100 c.c. in an average male under normal condition [8]. These values vary under stress and exercise. The amount of glucose in sweat also depends on factors such as regional weather, food habits, etc. therefore the average sweat glucose content would be different for people in North America and Asia.
B. Types of Sweat Glands Eccrine glands. Apocrine glands.
There are two main types of sweat gland in the human: the eccrine and apocrine glands. The eccrine sweat glands are majorly involved in thermoregulation. The eccrine glands secrete a hypotonic solution to plasma, with variable amounts of electrolytes, mainly sodium, chloride and potassium together with other compounds in very small amounts, namely: lactate, urea, ammonia, proteins and peptides. Apocrine glands in contrast, generally produce secretions which are richer in fats, proteins and salts, and which evaporate at a slower rate than eccrine secretions, and thus reduce the rate of heat loss. In humans, apocrine glands are located in the mammary, axillary, anal and genital areas, whereas eccrine glands are distributed widely over the body surface. The thermal sweat is produced by eccrine sweat glands and are two to three million in number. They are distributed over the skin surface secretions of which cover the whole body, and relatively lack body hair. It also lacks lipids and hence is suitable for testing. Practically less than 5mg/dl of sweat was found in all the samples collected naturally from non-diabetic patients (Indians). Human sweat can be used to identify mainly hyperglycemic conditions as in hypoglycemic condition glucose would either be absent or negligible. To ensure that the sweat is not excessively hypertonic approximately 1L of water should be consumed prior to testing.
III. INDUCTION OF SWEAT
For analysis of sweat a standard volume must be induced steadily. Human perspiration can be induced by the following methods. The temperature and the humidity of the surrounding must be taken into consideration with the help of a thermistor and a humidity sensor
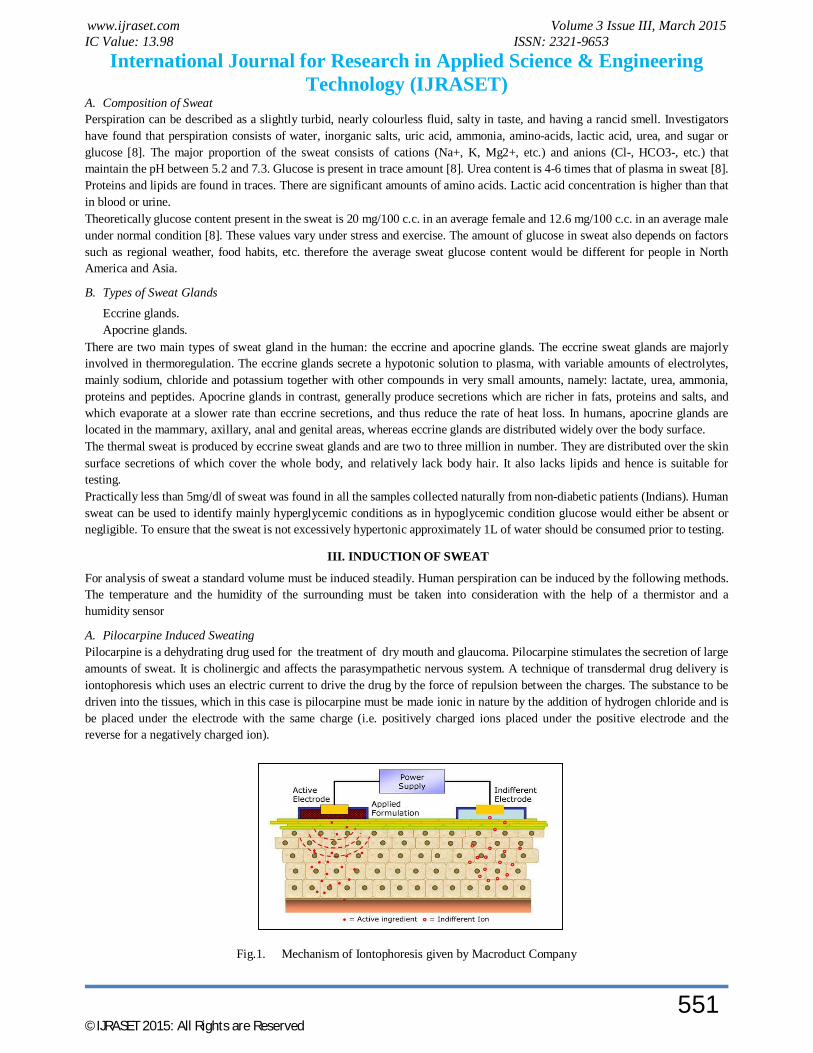
A. Pilocarpine Induced Sweating Pilocarpine is a dehydrating drug used for the treatment of dry mouth and glaucoma. Pilocarpine stimulates the secretion of large amounts of sweat. It is cholinergic and affects the parasympathetic nervous system. A technique of transdermal drug delivery is iontophoresis which uses an electric current to drive the drug by the force of repulsion between the charges. The substance to be driven into the tissues, which in this case is pilocarpine must be made ionic in nature by the addition of hydrogen chloride and is be placed under the electrode with the same charge (i.e. positively charged ions placed under the positive electrode and the reverse for a negatively charged ion).
Fig.1. Mechanism of Iontophoresis given by Macroduct Company
www.ijraset.com Volume 3 Issue III, March 2015 IC Value: 13.98 ISSN: 2321-9653
International Journal for Research in Applied Science & Engineering Technology (IJRASET)
©IJRASET 2015: All Rights are Reserved 552
The administration of the drug takes a time period of 10 to 20 minutes. Pilocarpine directly activates the sweat glands and forces the hypotonic solution up the tubular coil and is secreted through the sweat pore.
B. Localized Heating (Localized Increase in Temperature) A sudden temperature shift between the core and surface of the body induces sweating. Other methods of stimulation of the sweat glands include the cholinergic activation path, drugs, etc. Hyperthermia cause instantaneous sweating, in order to bring the core temperature back to normal [15]. Increasing the temperature of a localized region with reference to the atmospheric temperature causes sweating only in that region which is required for sweat glucose monitoring. Localized heating can be accomplished by the use of ordinary heating coils, ultrasound, or material. Heating coils consume a large amount of power, which would make the heating unit extremely large and difficult to handle. Ultrasound of high frequency (8Hz-10Hz) has low penetration and agitates the surface molecules increasing the temperature at the surface. Ultrasound apparatus would require greater than 50W of power to produce ultrasound waves of such high frequencies. The use of sweat inducing material would be the most economical and handy method. Materials such as leather, rubber, and pore free fabric prevent the heat radiated from the body from being dissipated, hence increasing the local temperature at the surface of the skin. Neotex fiber is a product significant for its heat inducing effect. It is a neoprene-coated fiber liner and is basically a synthetic rubber. It is also called neoprene rubber, neoprene rubber sheet and neoprene sheet. It possesses lower tensile strength, elongation, tear strength, and is resistant to temperature making them adaptable for athletic and medical product production.
IV. ANALYSIS OF GLUCOSE IN SWEAT
The analysis of glucose in sweat requires a glucose specific biosensor, a circuit for the conditioning and amplification of the signal, a controller for applying an algorithm through software on the signal in order to display the glucose value directly.
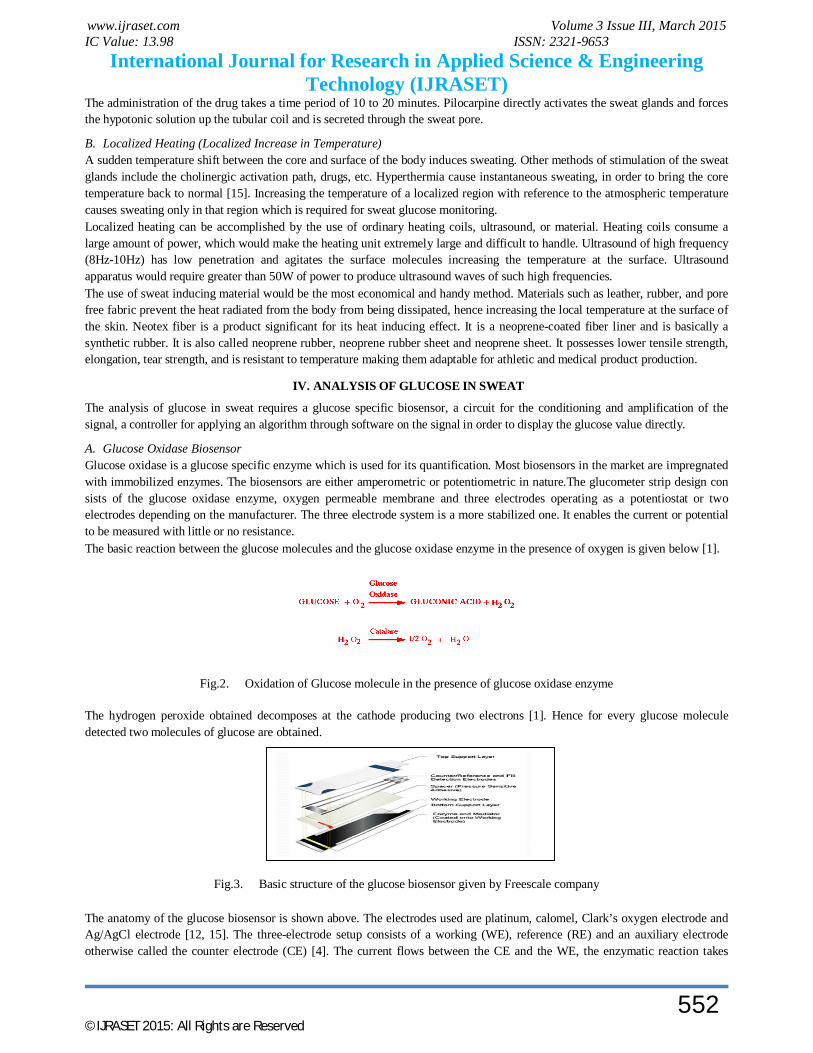
A. Glucose Oxidase Biosensor Glucose oxidase is a glucose specific enzyme which is used for its quantification. Most biosensors in the market are impregnated with immobilized enzymes. The biosensors are either amperometric or potentiometric in nature.The glucometer strip design con sists of the glucose oxidase enzyme, oxygen permeable membrane and three electrodes operating as a potentiostat or two electrodes depending on the manufacturer. The three electrode system is a more stabilized one. It enables the current or potential to be measured with little or no resistance. The basic reaction between the glucose molecules and the glucose oxidase enzyme in the presence of oxygen is given below [1].
Fig.2. Oxidation of Glucose molecule in the presence of glucose oxidase enzyme
The hydrogen peroxide obtained decomposes at the cathode producing two electrons [1]. Hence for every glucose molecule detected two molecules of glucose are obtained.
Fig.3. Basic structure of the glucose biosensor given by Freescale company The anatomy of the glucose biosensor is shown above. The electrodes used are platinum, calomel, Clark’s oxygen electrode and Ag/AgCl electrode [12, 15]. The three-electrode setup consists of a working (WE), reference (RE) and an auxiliary electrode otherwise called the counter electrode (CE) [4]. The current flows between the CE and the WE, the enzymatic reaction takes

www.ijraset.com Volume 3 Issue III, March 2015 IC Value: 13.98 ISSN: 2321-9653
International Journal for Research in Applied Science & Engineering Technology (IJRASET)
©IJRASET 2015: All Rights are Reserved 553
place at the working electrode as a result of which electrons are produced. The output of this electrode is in the form of current which is then converted to voltage using current-to-voltage amplifier. The reference electrode is held at a constant negative voltage with respect to the working electrode to drive the electrons and so that the current measured is positive with reference to this. The auxiliary supplies current to the working electrode or in other words triggers the reaction. A potential is maintained between the reference and the working electrode in the strip and a potential between the counter and reference. The former is lower than the latter to ensure proper directional flow of the electrons. The reference electrode is maintained at a negative potential using the 79L05 negative voltage regulator. All the initial setups are already provided by the manufacturers of biosensors. The proper functioning of the strips depends on maintaining the electrodes at the correct potential.
B. Circuitry for Signal Conditioning and Amplification The current obtained from the biosensor is in the range of few microamperes [9, 10]. Hence the circuitry must offer nearly zero impedance which is possible only in the ideal case. Due to the resistance of the material used in the wires and electron devices the task of tapping the signal becomes difficult. The rudimentary circuit design involves a current to voltage converter, an amplifier and a low pass filter [5]. The reference electrode in the strip is maintained at a negative potential in order provide a driving force for the electrons and so that the tapped signal is positive in amplitude with respect to the reference. The frequency of the low pass filter is between 8-13Hz which eliminates all the other noise interferences.
Fig.4. Block diagram of the biosensor reading circuit The first stage is the transimpedance amplifier setup consisting the IC741 with a resistive feedback. For better noise performance the OP07 can be used. The output of the first stage is given by the following.
Vout = Vin - IinRf The second stage is the amplification stage also includes the IC741, operating in inverting mode. The input signal is inverted, in other words a phase shift of 180º is applied on the signal. The amplification factor or gain is calculated using the following formula.
The final stage is a simple low pass filter which consists of a resistor and capacitor. The cut-off frequency is calculated using the formula given below.
Here a resistor of 200kΩ and a capacitor of 100nF are used which attenuate signals above 8Hz approximately. The signal obtained from the biosensor is due to a static current and is momentary, the frequency of which is low. The circuit was tested with both capacitive and resistive feedback for the amplifiers. Simulations proved that the capacitive feedback provided a lower noise level but practically due to stray capacitance issues the performance of resistive and capacitive feedback networks was comparable [14].
Fig.5. Signal conditioning and amplification circuit The entire circuit described above can be replace by the LMP91000 series of Texas Instruments which is a Configurable Analog Front End Potentiostat for electrochemical sensors with an input range of 5µA to 750µA and low voltage drift. Alternatively
Glucose Biosensor
Voltage to current
Converter
OP-AMP
Low Pass Filter Controller Display
www.ijraset.com Volume 3 Issue III, March 2015 IC Value: 13.98 ISSN: 2321-9653
International Journal for Research in Applied Science & Engineering Technology (IJRASET)
©IJRASET 2015: All Rights are Reserved 554
LMC6001 can be used before the voltage to current converter which is a low current amplification device of Texas Instruments with an input level of 25pA.
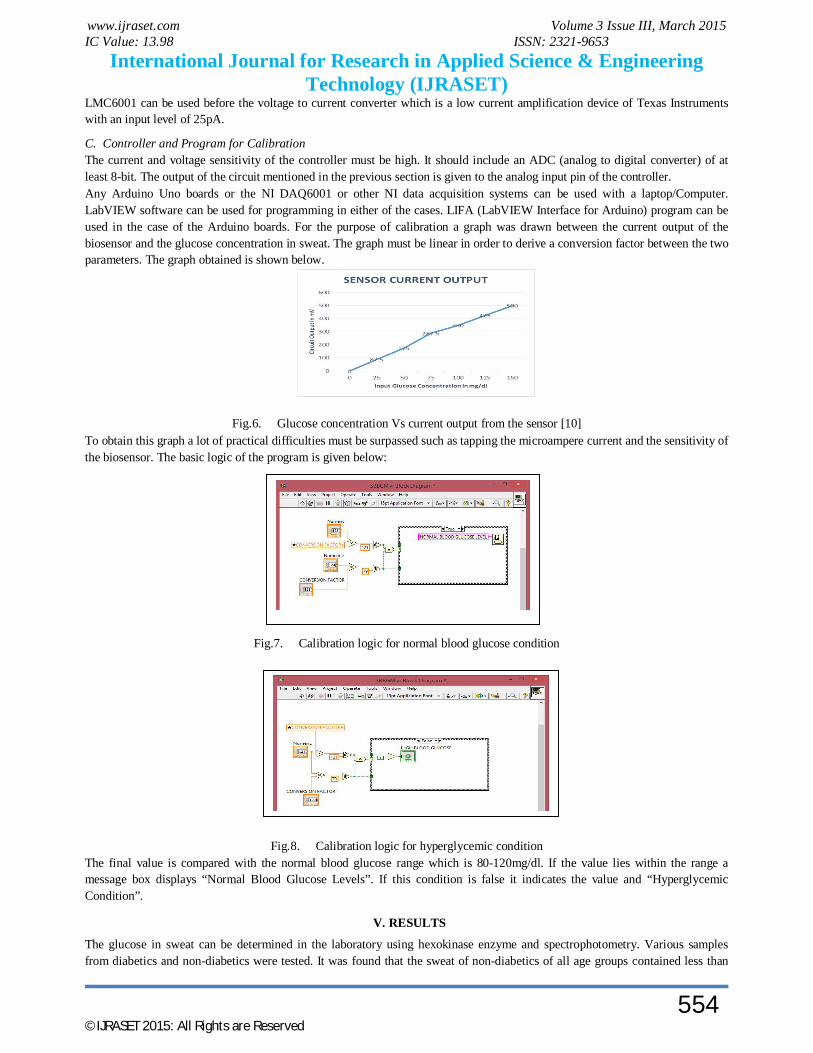
C. Controller and Program for Calibration The current and voltage sensitivity of the controller must be high. It should include an ADC (analog to digital converter) of at least 8-bit. The output of the circuit mentioned in the previous section is given to the analog input pin of the controller. Any Arduino Uno boards or the NI DAQ6001 or other NI data acquisition systems can be used with a laptop/Computer. LabVIEW software can be used for programming in either of the cases. LIFA (LabVIEW Interface for Arduino) program can be used in the case of the Arduino boards. For the purpose of calibration a graph was drawn between the current output of the biosensor and the glucose concentration in sweat. The graph must be linear in order to derive a conversion factor between the two parameters. The graph obtained is shown below.
Fig.6. Glucose concentration Vs current output from the sensor [10] To obtain this graph a lot of practical difficulties must be surpassed such as tapping the microampere current and the sensitivity of the biosensor. The basic logic of the program is given below:
Fig.7. Calibration logic for normal blood glucose condition
Fig.8. Calibration logic for hyperglycemic condition
The final value is compared with the normal blood glucose range which is 80-120mg/dl. If the value lies within the range a message box displays “Normal Blood Glucose Levels”. If this condition is false it indicates the value and “Hyperglycemic Condition”.
V. RESULTS
The glucose in sweat can be determined in the laboratory using hexokinase enzyme and spectrophotometry. Various samples from diabetics and non-diabetics were tested. It was found that the sweat of non-diabetics of all age groups contained less than
www.ijraset.com Volume 3 Issue III, March 2015 IC Value: 13.98 ISSN: 2321-9653
International Journal for Research in Applied Science & Engineering Technology (IJRASET)
©IJRASET 2015: All Rights are Reserved 555
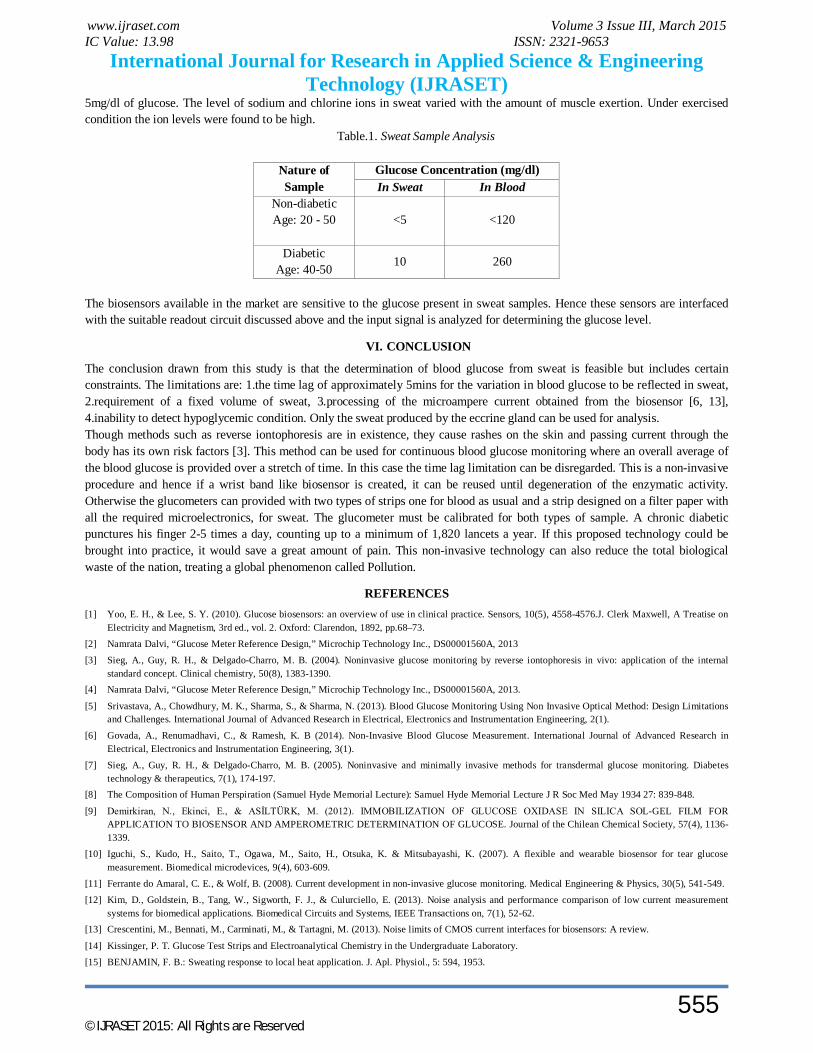
5mg/dl of glucose. The level of sodium and chlorine ions in sweat varied with the amount of muscle exertion. Under exercised condition the ion levels were found to be high.
Table.1. Sweat Sample Analysis
Nature of Sample
Glucose Concentration (mg/dl) In Sweat In Blood
Non-diabetic Age: 20 - 50
<5 <120
Diabetic Age: 40-50 10 260
The biosensors available in the market are sensitive to the glucose present in sweat samples. Hence these sensors are interfaced with the suitable readout circuit discussed above and the input signal is analyzed for determining the glucose level.
VI. CONCLUSION
The conclusion drawn from this study is that the determination of blood glucose from sweat is feasible but includes certain constraints. The limitations are: 1.the time lag of approximately 5mins for the variation in blood glucose to be reflected in sweat, 2.requirement of a fixed volume of sweat, 3.processing of the microampere current obtained from the biosensor [6, 13], 4.inability to detect hypoglycemic condition. Only the sweat produced by the eccrine gland can be used for analysis. Though methods such as reverse iontophoresis are in existence, they cause rashes on the skin and passing current through the body has its own risk factors [3]. This method can be used for continuous blood glucose monitoring where an overall average of the blood glucose is provided over a stretch of time. In this case the time lag limitation can be disregarded. This is a non-invasive procedure and hence if a wrist band like biosensor is created, it can be reused until degeneration of the enzymatic activity. Otherwise the glucometers can provided with two types of strips one for blood as usual and a strip designed on a filter paper with all the required microelectronics, for sweat. The glucometer must be calibrated for both types of sample. A chronic diabetic punctures his finger 2-5 times a day, counting up to a minimum of 1,820 lancets a year. If this proposed technology could be brought into practice, it would save a great amount of pain. This non-invasive technology can also reduce the total biological waste of the nation, treating a global phenomenon called Pollution.
REFERENCES [1] Yoo, E. H., & Lee, S. Y. (2010). Glucose biosensors: an overview of use in clinical practice. Sensors, 10(5), 4558-4576.J. Clerk Maxwell, A Treatise on
Electricity and Magnetism, 3rd ed., vol. 2. Oxford: Clarendon, 1892, pp.68–73.
[2] Namrata Dalvi, “Glucose Meter Reference Design,” Microchip Technology Inc., DS00001560A, 2013
[3] Sieg, A., Guy, R. H., & Delgado-Charro, M. B. (2004). Noninvasive glucose monitoring by reverse iontophoresis in vivo: application of the internal standard concept. Clinical chemistry, 50(8), 1383-1390.
[4] Namrata Dalvi, “Glucose Meter Reference Design,” Microchip Technology Inc., DS00001560A, 2013.
[5] Srivastava, A., Chowdhury, M. K., Sharma, S., & Sharma, N. (2013). Blood Glucose Monitoring Using Non Invasive Optical Method: Design Limitations and Challenges. International Journal of Advanced Research in Electrical, Electronics and Instrumentation Engineering, 2(1).
[6] Govada, A., Renumadhavi, C., & Ramesh, K. B (2014). Non-Invasive Blood Glucose Measurement. International Journal of Advanced Research in Electrical, Electronics and Instrumentation Engineering, 3(1).
[7] Sieg, A., Guy, R. H., & Delgado-Charro, M. B. (2005). Noninvasive and minimally invasive methods for transdermal glucose monitoring. Diabetes technology & therapeutics, 7(1), 174-197.
[8] The Composition of Human Perspiration (Samuel Hyde Memorial Lecture): Samuel Hyde Memorial Lecture J R Soc Med May 1934 27: 839-848.
[9] Demirkiran, N., Ekinci, E., & ASİLTÜRK, M. (2012). IMMOBILIZATION OF GLUCOSE OXIDASE IN SILICA SOL-GEL FILM FOR APPLICATION TO BIOSENSOR AND AMPEROMETRIC DETERMINATION OF GLUCOSE. Journal of the Chilean Chemical Society, 57(4), 1136-1339.
[10] Iguchi, S., Kudo, H., Saito, T., Ogawa, M., Saito, H., Otsuka, K. & Mitsubayashi, K. (2007). A flexible and wearable biosensor for tear glucose measurement. Biomedical microdevices, 9(4), 603-609.
[11] Ferrante do Amaral, C. E., & Wolf, B. (2008). Current development in non-invasive glucose monitoring. Medical Engineering & Physics, 30(5), 541-549.
[12] Kim, D., Goldstein, B., Tang, W., Sigworth, F. J., & Culurciello, E. (2013). Noise analysis and performance comparison of low current measurement systems for biomedical applications. Biomedical Circuits and Systems, IEEE Transactions on, 7(1), 52-62.
[13] Crescentini, M., Bennati, M., Carminati, M., & Tartagni, M. (2013). Noise limits of CMOS current interfaces for biosensors: A review.
[14] Kissinger, P. T. Glucose Test Strips and Electroanalytical Chemistry in the Undergraduate Laboratory.
[15] BENJAMIN, F. B.: Sweating response to local heat application. J. Apl. Physiol., 5: 594, 1953.

Related Documents