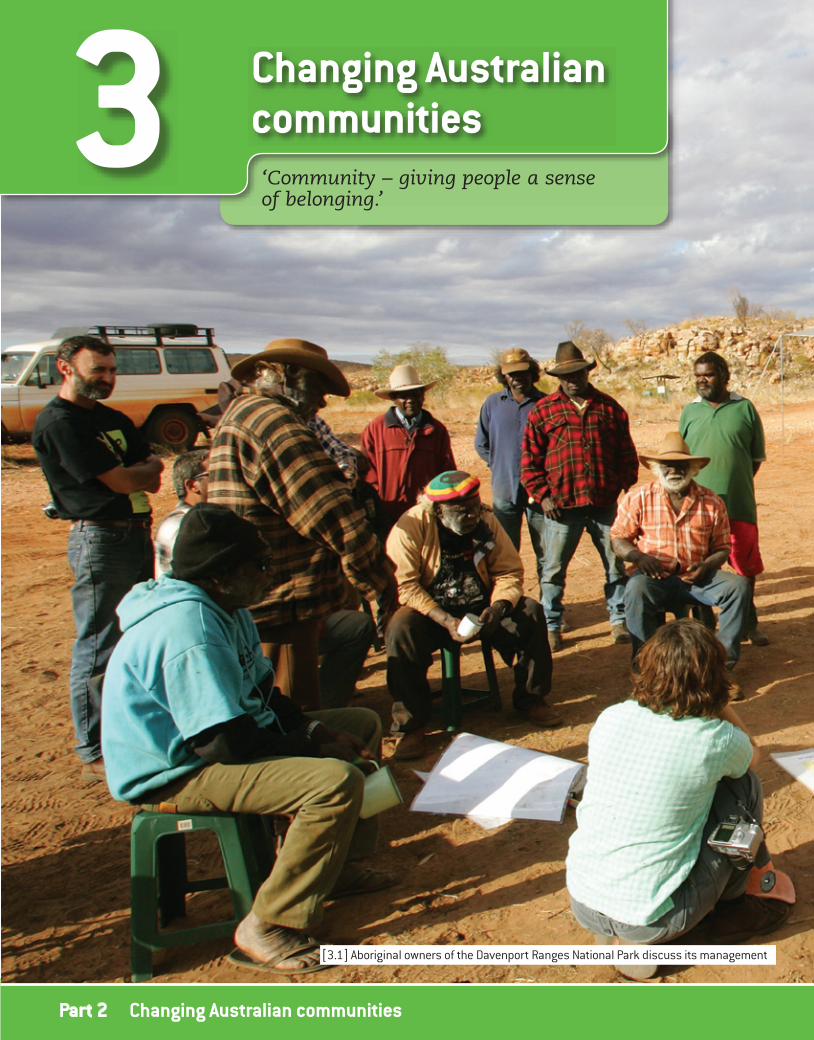
3 ‘Community – giving people a sense of belonging.’ Changing Australian communities [3.1] Aboriginal owners of the Davenport Ranges National Park discuss its management Part 2 Changing Australian communities

Welcome message from author
This document is posted to help you gain knowledge. Please leave a comment to let me know what you think about it! Share it to your friends and learn new things together.
Transcript
3‘Community – giving people a sense of belonging.’
Changing Australian communities
[3.1] Aboriginal owners of the Davenport Ranges National Park discuss its management
Part 2 Changing Australian communities
In this chapter you will…
74 Geography for Australian Citizens
learn about: human characteristics that make Australia
unique types of communities factors causing change in Australian
communities.
learn to: describe trends in Australia’s demographic characteristics,
incorporating the use of graphs and statistics explain how Australia’s changing demographic characteristics are
influencing the nature and identity of Australian society identify a range of communities based on shared space and/or
shared social organisation describe the factors causing change in Australian communities construct and interpret population pyramids construct and interpret graphs recognise and account for change using statistical data.
Changing Australian communitiesAll Australians belong to a community, whether it be the Australian community as a whole or smaller communities based on shared space or shared social organisation. In fact, we all belong to several communities of different sizes and scales. In this chapter we examine the demographic characteristics of the Australian community. We will:
review past and current population patterns in Australia describe current trends using graphs and statistics
investigate how these changing demographic characteristics are influencing the nature and identity of Australian society. The chapter also explores the types of communities that exist in Australia and
the differences within and between them, as well as how they are changing and the factors that are causing change.
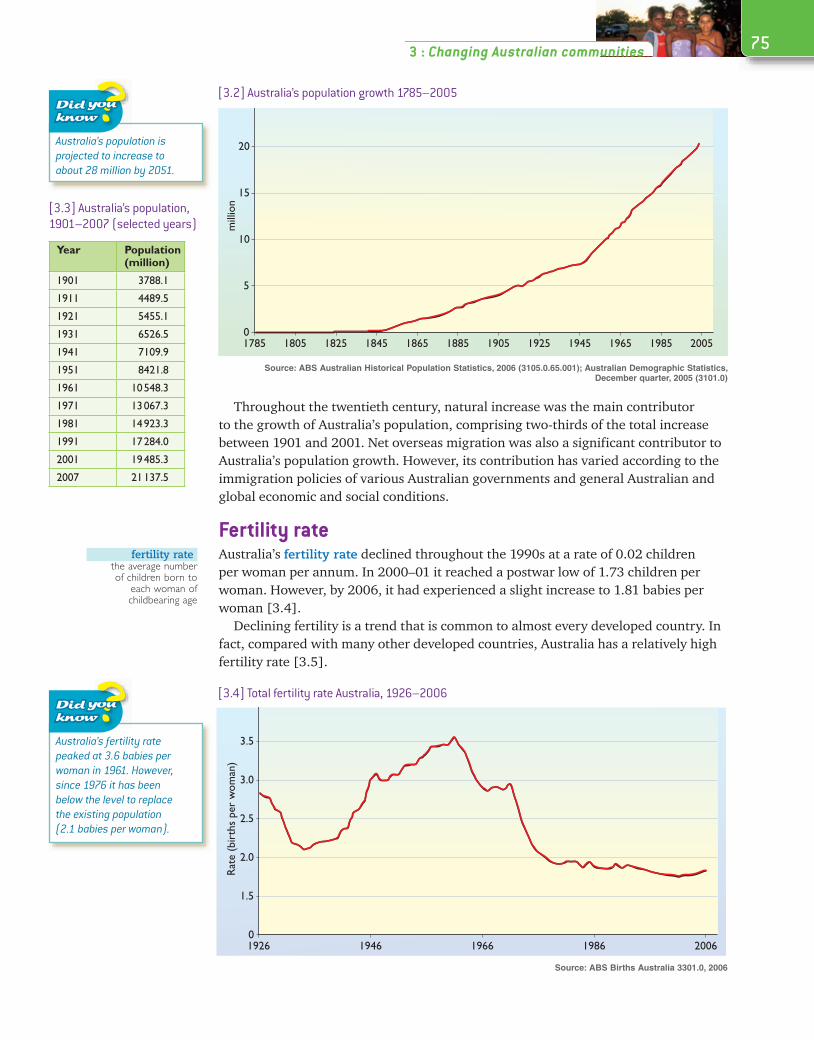
Australia’s demographic characteristicsPopulation growth By 2007, Australia’s population had reached 21 million. [3.2] depicts the growth of Australia’s population over time, starting with the population in 1785, just prior to European settlement, up to 2005. Most of the growth in the population has been experienced since the beginning of the twentieth century.
Australia’s population growth has resulted from two factors: natural increase and net overseas migration. [3.3] shows that the rate of Australia’s population growth has fluctuated significantly over time. For example, during the 1930s Depression, Australia experienced relatively low growth (0.9 per cent), while during the postwar period of the 1950s, Australia experienced consistently high rates of growth with an average annual increase of 2.3 per cent from 1950 to 1959.
Demographic characteristicsPopulation: 21 millionMedian age: 36.6 yearsPopulation density: 2.7 per km2
Fertility rate: 1.81Life expectancy: females – 83.5, males – 78.7
demographicpopulation characteristics
such as age structure, distribution, ethnic
composition, gender, growth rates and size
natural increasethe difference between
births and deaths in a population in a given
time period
net overseasmigration
net permanent long-term arrivals and departures
0
5
10
15
20
mill
ion
1785 1805 1825 1845 1865 1885 1905 1925 1965 1985 20051945
0
1.5
2.0
2.5
3.0
4.0
3.5
Rate
(bir
ths
per
wom
an)
1926 1966 1986 20061946
753 : Changing Australian communities
Throughout the twentieth century, natural increase was the main contributor to the growth of Australia’s population, comprising two-thirds of the total increase between 1901 and 2001. Net overseas migration was also a significant contributor to Australia’s population growth. However, its contribution has varied according to the immigration policies of various Australian governments and general Australian and global economic and social conditions.
Fertility rateAustralia’s fertility rate declined throughout the 1990s at a rate of 0.02 children per woman per annum. In 2000–01 it reached a postwar low of 1.73 children per woman. However, by 2006, it had experienced a slight increase to 1.81 babies per woman [3.4].
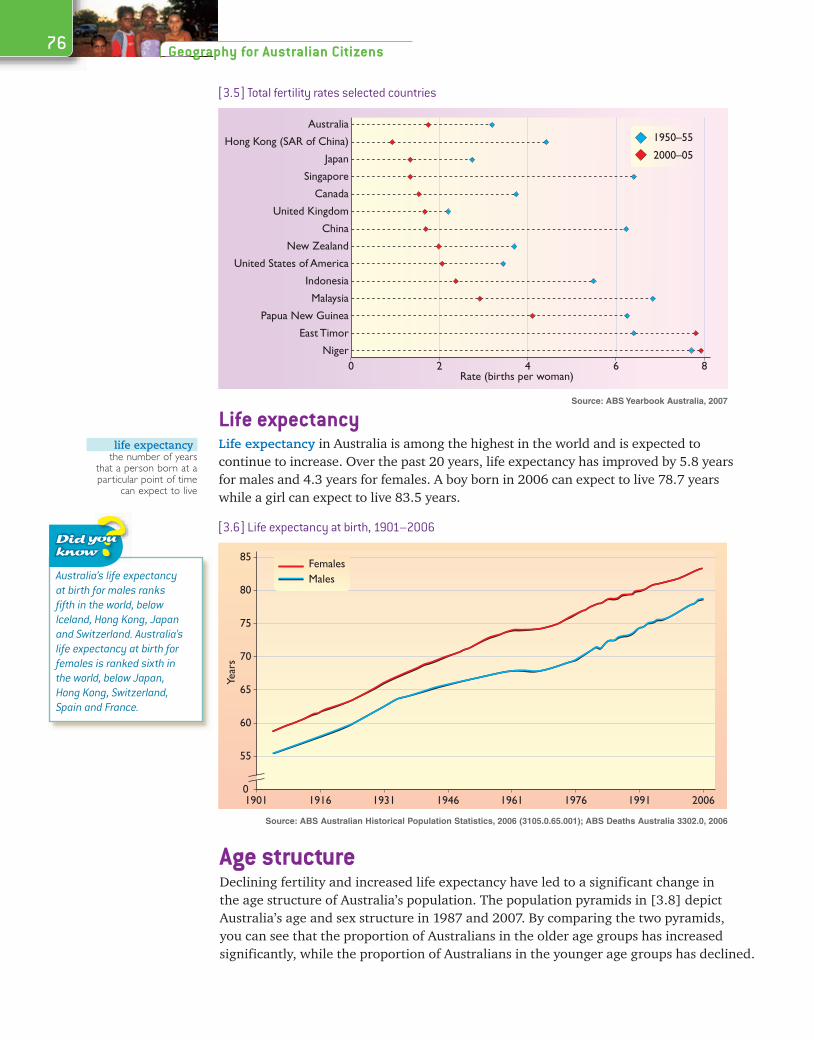
Declining fertility is a trend that is common to almost every developed country. In fact, compared with many other developed countries, Australia has a relatively high fertility rate [3.5].
[3.3] Australia’s population, 1901–2007 (selected years)
Year Population (million)
1901 3788.1
1911 4489.5
1921 5455.1
1931 6526.5
1941 7109.9
1951 8421.8
1961 10 548.3
1971 13 067.3
1981 14 923.3
1991 17 284.0
2001 19 485.3
2007 21 137.5
Australia’s population is projected to increase to about 28 million by 2051.
[3.2] Australia’s population growth 1785–2005
Source: ABS Australian Historical Population Statistics, 2006 (3105.0.65.001); Australian Demographic Statistics, December quarter, 2005 (3101.0)
fertility ratethe average number of children born to
each woman of childbearing age
Australia’s fertility rate peaked at 3.6 babies per woman in 1961. However, since 1976 it has been below the level to replace the existing population (2.1 babies per woman).
Source: ABS Births Australia 3301.0, 2006
[3.4] Total fertility rate Australia, 1926–2006
Rate (births per woman)0 2 4 6 8
Australia
Hong Kong (SAR of China)
Japan
Singapore
Canada
United Kingdom
China
New Zealand
United States of America
Indonesia
Malaysia
Papua New Guinea
East Timor
Niger
1950–55
2000–05
0
55
60
65
70
85
75
80
Year
s
1901 1931 1946 1961 1976 1991 20061916
MalesFemales
76 Geography for Australian Citizens
Life expectancyLife expectancy in Australia is among the highest in the world and is expected to continue to increase. Over the past 20 years, life expectancy has improved by 5.8 years for males and 4.3 years for females. A boy born in 2006 can expect to live 78.7 years while a girl can expect to live 83.5 years.
[3.5] Total fertility rates selected countries
Source: ABS Yearbook Australia, 2007
life expectancythe number of years
that a person born at a particular point of time
can expect to live
[3.6] Life expectancy at birth, 1901–2006
Source: ABS Australian Historical Population Statistics, 2006 (3105.0.65.001); ABS Deaths Australia 3302.0, 2006
Australia’s life expectancy at birth for males ranks fifth in the world, below Iceland, Hong Kong, Japan and Switzerland. Australia’s life expectancy at birth for females is ranked sixth in the world, below Japan, Hong Kong, Switzerland, Spain and France.
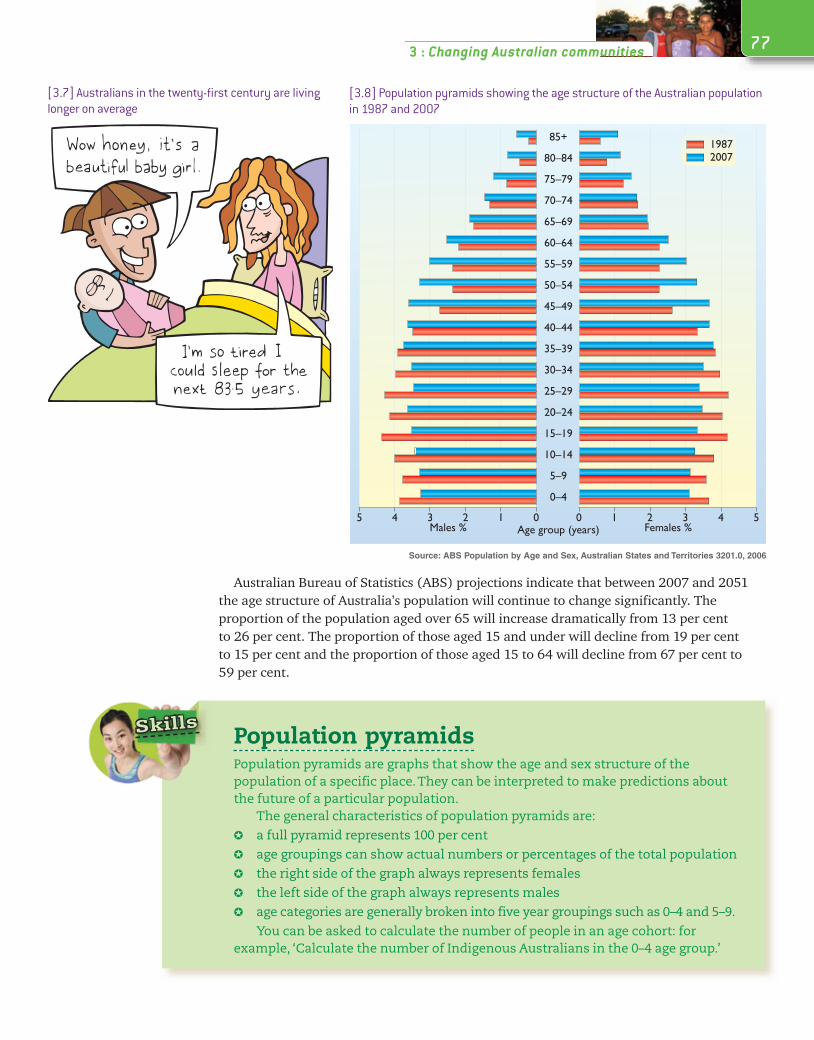
Age structureDeclining fertility and increased life expectancy have led to a significant change in the age structure of Australia’s population. The population pyramids in [3.8] depict Australia’s age and sex structure in 1987 and 2007. By comparing the two pyramids, you can see that the proportion of Australians in the older age groups has increased significantly, while the proportion of Australians in the younger age groups has declined.
Males % Age group (years) Females %012345 543210
0–4
5–9
10–14
15–19
20–24
25–29
30–34
35–39
40–44
45–49
50–54
55–59
60–64
65–69
70–74
75–79
80–84
85+19872007
Skills
773 : Changing Australian communities
Australian Bureau of Statistics (ABS) projections indicate that between 2007 and 2051 the age structure of Australia’s population will continue to change significantly. The proportion of the population aged over 65 will increase dramatically from 13 per cent to 26 per cent. The proportion of those aged 15 and under will decline from 19 per cent to 15 per cent and the proportion of those aged 15 to 64 will decline from 67 per cent to 59 per cent.
Population pyramidsPopulation pyramids are graphs that show the age and sex structure of the population of a specific place. They can be interpreted to make predictions about the future of a particular population.
The general characteristics of population pyramids are: a full pyramid represents 100 per cent age groupings can show actual numbers or percentages of the total population the right side of the graph always represents females the left side of the graph always represents males age categories are generally broken into five year groupings such as 0–4 and 5–9.
You can be asked to calculate the number of people in an age cohort: for example, ‘Calculate the number of Indigenous Australians in the 0–4 age group.’
[3.7] Australians in the twenty-first century are living longer on average
Source: ABS Population by Age and Sex, Australian States and Territories 3201.0, 2006
[3.8] Population pyramids showing the age structure of the Australian population in 1987 and 2007
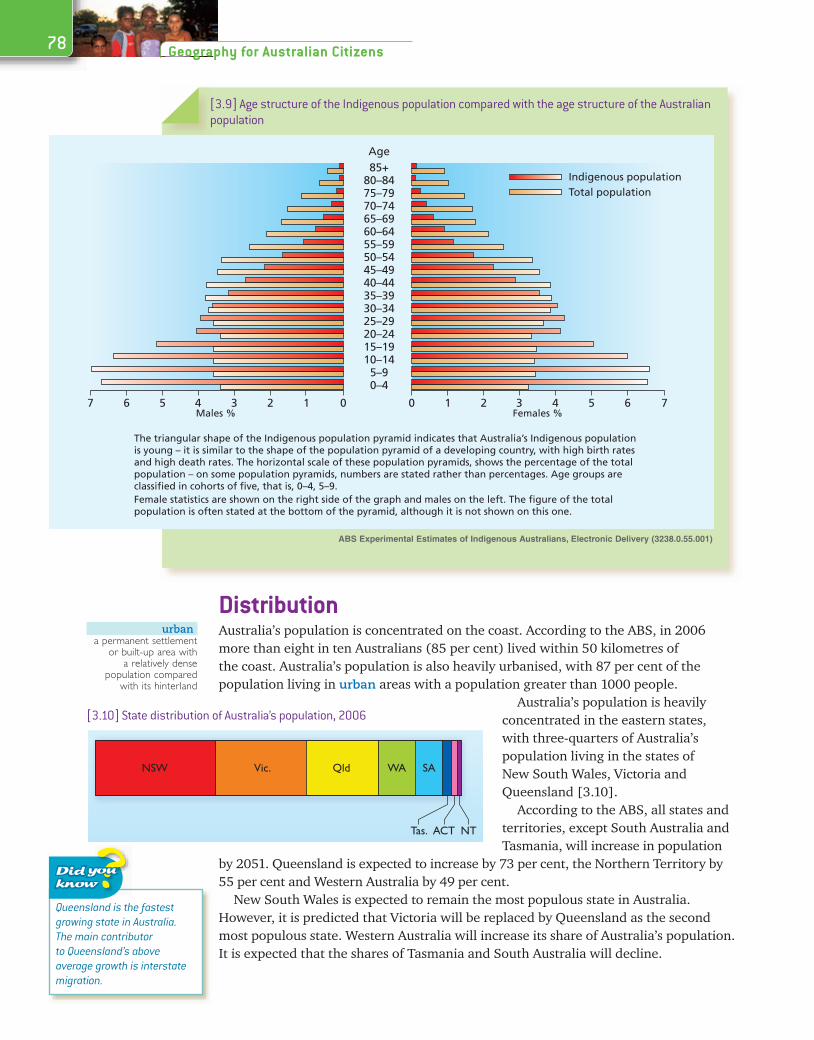
The triangular shape of the Indigenous population pyramid indicates that Australia’s Indigenous population is young – it is similar to the shape of the population pyramid of a developing country, with high birth rates and high death rates. The horizontal scale of these population pyramids, shows the percentage of the total population – on some population pyramids, numbers are stated rather than percentages. Age groups are classified in cohorts of five, that is, 0–4, 5–9.Female statistics are shown on the right side of the graph and males on the left. The figure of the total population is often stated at the bottom of the pyramid, although it is not shown on this one.
Indigenous population
Age85+
80–8475–7970–7465–6960–6455–5950–5445–4940–4435–3930–3425–2920–2415–1910–145–90–4
01234Males % Females %
567 76543210
Total population
NSW WA
ACT NT
SA
Tas.
Vic. Qld
78 Geography for Australian Citizens
Distribution Australia’s population is concentrated on the coast. According to the ABS, in 2006 more than eight in ten Australians (85 per cent) lived within 50 kilometres of the coast. Australia’s population is also heavily urbanised, with 87 per cent of the population living in urban areas with a population greater than 1000 people.
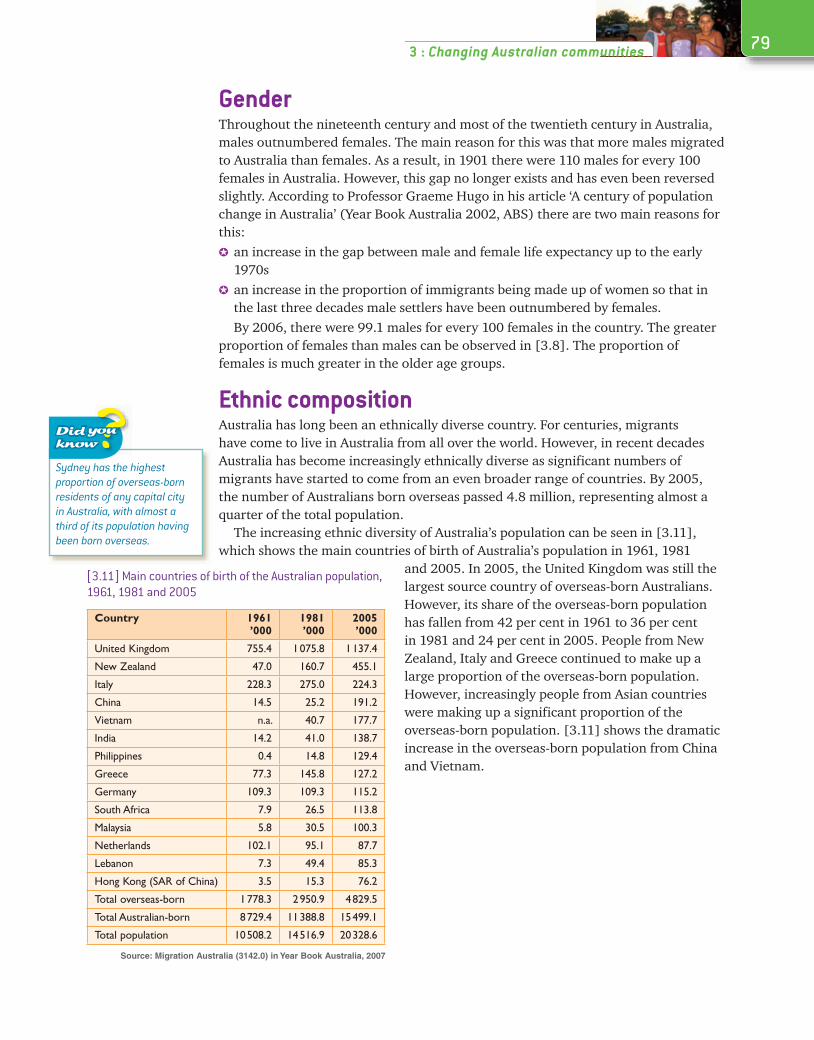
Australia’s population is heavily concentrated in the eastern states, with three-quarters of Australia’s population living in the states of New South Wales, Victoria and Queensland [3.10].
According to the ABS, all states and territories, except South Australia and Tasmania, will increase in population
by 2051. Queensland is expected to increase by 73 per cent, the Northern Territory by 55 per cent and Western Australia by 49 per cent.
New South Wales is expected to remain the most populous state in Australia. However, it is predicted that Victoria will be replaced by Queensland as the second most populous state. Western Australia will increase its share of Australia’s population. It is expected that the shares of Tasmania and South Australia will decline.
[3.9] Age structure of the Indigenous population compared with the age structure of the Australian population
ABS Experimental Estimates of Indigenous Australians, Electronic Delivery (3238.0.55.001)
urbana permanent settlement
or built-up area with a relatively dense
population compared with its hinterland
[3.10] State distribution of Australia’s population, 2006
Queensland is the fastest growing state in Australia. The main contributor to Queensland’s above average growth is interstate migration.
793 : Changing Australian communities
GenderThroughout the nineteenth century and most of the twentieth century in Australia, males outnumbered females. The main reason for this was that more males migrated to Australia than females. As a result, in 1901 there were 110 males for every 100 females in Australia. However, this gap no longer exists and has even been reversed slightly. According to Professor Graeme Hugo in his article ‘A century of population change in Australia’ (Year Book Australia 2002, ABS) there are two main reasons for this:
an increase in the gap between male and female life expectancy up to the early 1970s
an increase in the proportion of immigrants being made up of women so that in the last three decades male settlers have been outnumbered by females.By 2006, there were 99.1 males for every 100 females in the country. The greater
proportion of females than males can be observed in [3.8]. The proportion of females is much greater in the older age groups.
Ethnic compositionAustralia has long been an ethnically diverse country. For centuries, migrants have come to live in Australia from all over the world. However, in recent decades Australia has become increasingly ethnically diverse as significant numbers of migrants have started to come from an even broader range of countries. By 2005, the number of Australians born overseas passed 4.8 million, representing almost a quarter of the total population.
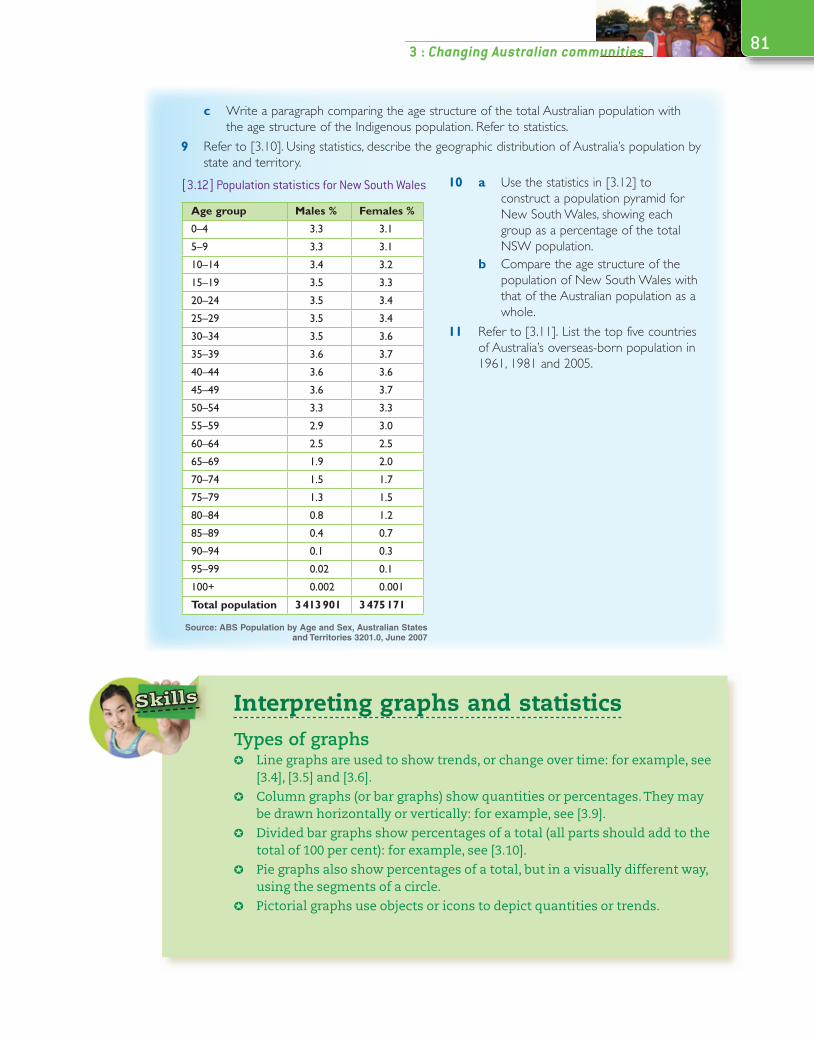
The increasing ethnic diversity of Australia’s population can be seen in [3.11], which shows the main countries of birth of Australia’s population in 1961, 1981
and 2005. In 2005, the United Kingdom was still the largest source country of overseas-born Australians. However, its share of the overseas-born population has fallen from 42 per cent in 1961 to 36 per cent in 1981 and 24 per cent in 2005. People from New Zealand, Italy and Greece continued to make up a large proportion of the overseas-born population. However, increasingly people from Asian countries were making up a significant proportion of the overseas-born population. [3.11] shows the dramatic increase in the overseas-born population from China and Vietnam.
[3.11] Main countries of birth of the Australian population, 1961, 1981 and 2005
Country 1961’000
1981’000
2005’000
United Kingdom 755.4 1 075.8 1 137.4
New Zealand 47.0 160.7 455.1
Italy 228.3 275.0 224.3
China 14.5 25.2 191.2
Vietnam n.a. 40.7 177.7
India 14.2 41.0 138.7
Philippines 0.4 14.8 129.4
Greece 77.3 145.8 127.2
Germany 109.3 109.3 115.2
South Africa 7.9 26.5 113.8
Malaysia 5.8 30.5 100.3
Netherlands 102.1 95.1 87.7
Lebanon 7.3 49.4 85.3
Hong Kong (SAR of China) 3.5 15.3 76.2
Total overseas-born 1 778.3 2 950.9 4 829.5
Total Australian-born 8 729.4 11 388.8 15 499.1
Total population 10 508.2 14 516.9 20 328.6
Source: Migration Australia (3142.0) in Year Book Australia, 2007
Sydney has the highest proportion of overseas-born residents of any capital city in Australia, with almost a third of its population having been born overseas.
80 Geography for Australian Citizens
Learning about …1 Outline the two main factors that have been responsible for population growth in Australia
and the contribution of each.2 Describe the decline in Australia’s fertility rate in the 1990s and up to 2001. Suggest possible
reasons for this decline.3 Describe the increase in life expectancy in Australia between 1986 and 2006. Suggest possible
reasons for this increase.4 Examine the population pyramids for Australia in 1987 and 2007. Describe how Australia’s
population age structure has changed and suggest reasons for the changes.5 Outline the changes to Australia’s population structure expected by the ABS in the future.6 Describe the geographical distribution of Australia’s population. Suggest reasons for this
distribution.7 Explain why historically males have outnumbered females in Australia. Explain why this is now
changing.8 Describe the changing ethnic composition of Australia’s population since the 1960s.
Learning to …1 Refer to [3.2]. Describe the pattern of growth of Australia’s population since 1785.2 Refer to [3.3].
a Calculate the increase in Australia’s population between:i 1901 and 1951ii 1951 and 2007.
b Calculate the percentage increase in Australia’s population between:i 1901 and 1951ii 1951 and 2007.
3 Use the statistics in [3.3] to construct a line graph to show the increase in Australia’s population from 1901 to 2006.
4 Refer to [3.4].a Describe how Australia’s fertility rate has changed over time.b Suggest possible reasons for the changes in Australia’s fertility rate.
5 Refer to [3.5]. Working in pairs:a categorise the countries in the graph as either developed or developingb discuss with your partner whether there is a correlation between a country being
developed or developing and its fertility ratec determine whether there are any countries in the graph that are an exceptiond suggest reasons why they might be an exceptione identify the three countries that experienced the largest decrease in fertility rate between
1950–55 and 2000–05.f suggest reasons for the decrease in fertility rate in these countries.
6 Refer to [3.6]. Calculate the increase in life expectancy at birth between 1976 and 2006 fora malesb females.
7 Refer to [3.8].a Calculate the proportion of Australia’s population under 15 years in 1987 and in 2007.b Calculate the proportion of Australia’s population over 65 years in 1987 and in 2007.
8 Refer to [3.9].a Calculate the percentage of the total Australian population and the percentage of the
Indigenous population under the age of 15 years.b Calculate the percentage of the total Australian population and the percentage of the
Indigenous population over 65 years.
Skills
813 : Changing Australian communities
c Write a paragraph comparing the age structure of the total Australian population with the age structure of the Indigenous population. Refer to statistics.
9 Refer to [3.10]. Using statistics, describe the geographic distribution of Australia’s population by state and territory.
[3.12] Population statistics for New South Wales
Age group Males % Females %
0–4 3.3 3.1
5–9 3.3 3.1
10–14 3.4 3.2
15–19 3.5 3.3
20–24 3.5 3.4
25–29 3.5 3.4
30–34 3.5 3.6
35–39 3.6 3.7
40–44 3.6 3.6
45–49 3.6 3.7
50–54 3.3 3.3
55–59 2.9 3.0
60–64 2.5 2.5
65–69 1.9 2.0
70–74 1.5 1.7
75–79 1.3 1.5
80–84 0.8 1.2
85–89 0.4 0.7
90–94 0.1 0.3
95–99 0.02 0.1
100+ 0.002 0.001
Total population 3 413 901 3 475 171
Source: ABS Population by Age and Sex, Australian States and Territories 3201.0, June 2007
Interpreting graphs and statisticsTypes of graphs
Line graphs are used to show trends, or change over time: for example, see [3.4], [3.5] and [3.6].
Column graphs (or bar graphs) show quantities or percentages. They may be drawn horizontally or vertically: for example, see [3.9].
Divided bar graphs show percentages of a total (all parts should add to the total of 100 per cent): for example, see [3.10].
Pie graphs also show percentages of a total, but in a visually different way, using the segments of a circle.
Pictorial graphs use objects or icons to depict quantities or trends.
10 a Use the statistics in [3.12] to construct a population pyramid for New South Wales, showing each group as a percentage of the total NSW population.
b Compare the age structure of the population of New South Wales with that of the Australian population as a whole.
11 Refer to [3.11]. List the top five countries of Australia’s overseas-born population in 1961, 1981 and 2005.
82 Geography for Australian Citizens
Interpreting statisticsStatistics are useful geographic tools. Data can be used to highlight specific trends, to emphasise or prove a point or to settle an argument.
Statistics are generally displayed in the form of a table, such as [3.3] and [3. 11]. Data may be expressed as quantities or numbers, or it may be expressed as percentages. For example, the data in [3.11] is expressed as numbers (main countries of birth of Australian population), while the data in [3.12] involves percentages (male and female population as a percentage of the total NSW population).
[3.13] Interpreting statistics
Types of communitiesA community is an identifiable group of people who interact on the basis of shared space and/or social organisation. A community could be people who belong to the same tennis club, people who live in the same street or the Indigenous community in Australia. Belonging to a community is what helps to give an individual a sense of identity.
Factors that contribute to communityThere are many factors that contribute to a sense of community:
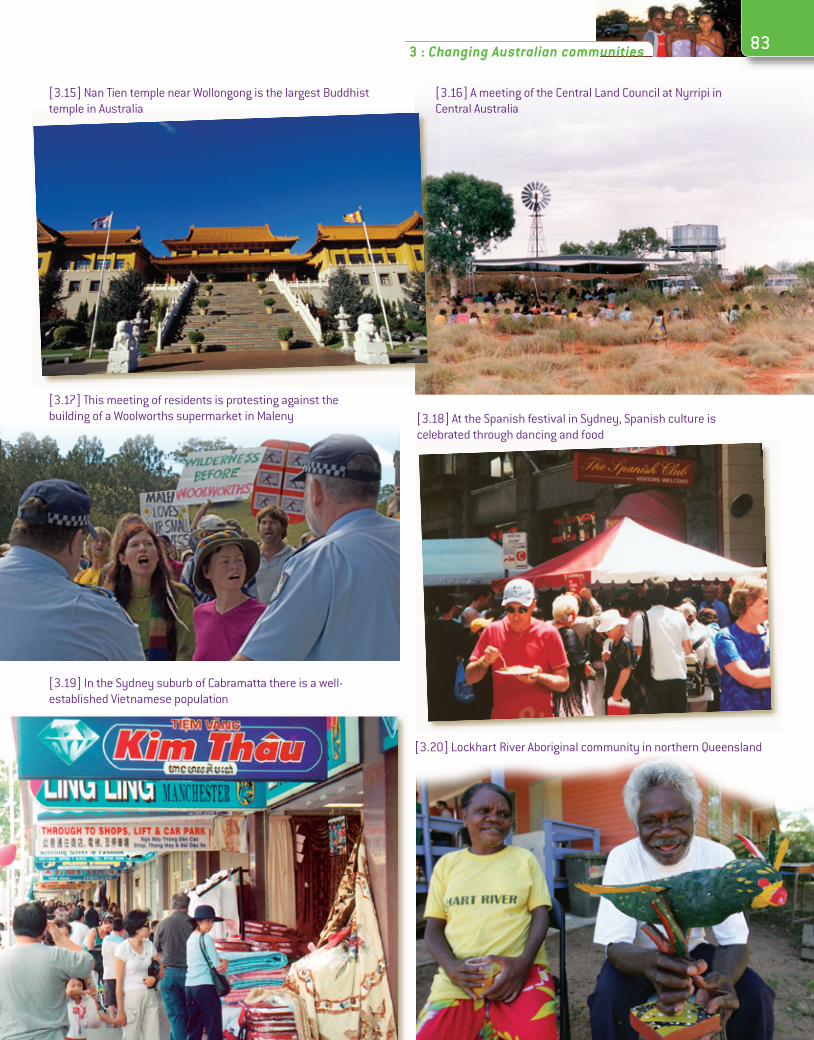
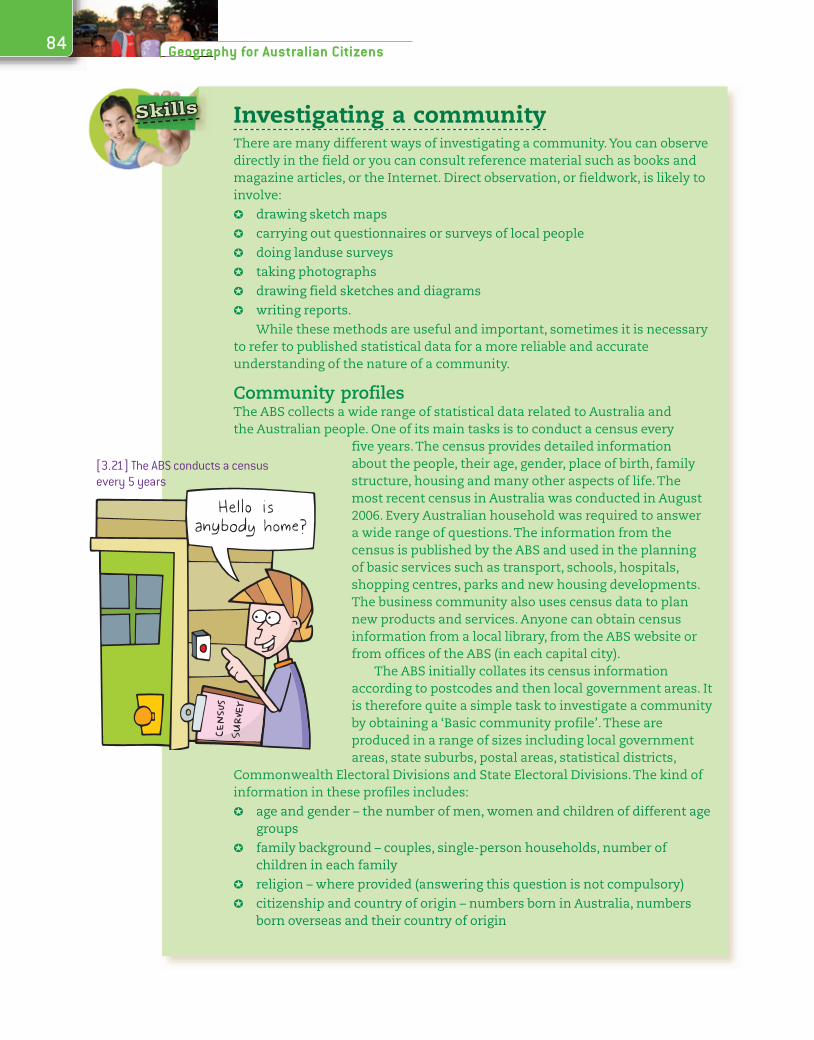
sport helps to provide a sense of community [3.14] religion creates a sense of community [3.15]
meetings such as councils of various types contribute to community – the one shown here [3.16] is the Central Land Council at Nyrripi in Central Australia; it represents Aboriginal communities in the southern half of the Northern Territory, a region of 771 747 square kilometres of rugged and remote country within which there are fifteen language groups
a common purpose often contributes to a sense of community [3.17]
the preservation of culture helps to ensure a sense of community [3.18, 3.19]
isolation can create a community spirit – the community shown here [3.20] is an isolated Aboriginal community of approximately 450 people in northern Queensland; the nearest city is Cairns, 800 kilometres away.
[3.14] Soccer is a popular sport among many Australians
833 : Changing Australian communities
[3.15] Nan Tien temple near Wollongong is the largest Buddhist temple in Australia
[3.16] A meeting of the Central Land Council at Nyrripi in Central Australia
[3.17] This meeting of residents is protesting against the building of a Woolworths supermarket in Maleny [3.18] At the Spanish festival in Sydney, Spanish culture is
celebrated through dancing and food
[3.19] In the Sydney suburb of Cabramatta there is a well-established Vietnamese population
[3.20] Lockhart River Aboriginal community in northern Queensland
Skills
84 Geography for Australian Citizens
Investigating a communityThere are many different ways of investigating a community. You can observe directly in the field or you can consult reference material such as books and magazine articles, or the Internet. Direct observation, or fieldwork, is likely to involve:
drawing sketch maps carrying out questionnaires or surveys of local people doing landuse surveys taking photographs drawing field sketches and diagrams writing reports.
While these methods are useful and important, sometimes it is necessary to refer to published statistical data for a more reliable and accurate understanding of the nature of a community.
Community profilesThe ABS collects a wide range of statistical data related to Australia and the Australian people. One of its main tasks is to conduct a census every
five years. The census provides detailed information about the people, their age, gender, place of birth, family structure, housing and many other aspects of life. The most recent census in Australia was conducted in August 2006. Every Australian household was required to answer a wide range of questions. The information from the census is published by the ABS and used in the planning of basic services such as transport, schools, hospitals, shopping centres, parks and new housing developments. The business community also uses census data to plan new products and services. Anyone can obtain census information from a local library, from the ABS website or from offices of the ABS (in each capital city).
The ABS initially collates its census information according to postcodes and then local government areas. It is therefore quite a simple task to investigate a community by obtaining a ‘Basic community profile’. These are produced in a range of sizes including local government areas, state suburbs, postal areas, statistical districts,
Commonwealth Electoral Divisions and State Electoral Divisions. The kind of information in these profiles includes:
age and gender – the number of men, women and children of different age groups
family background – couples, single-person households, number of children in each family
religion – where provided (answering this question is not compulsory) citizenship and country of origin – numbers born in Australia, numbers
born overseas and their country of origin
[3.21] The ABS conducts a census every 5 years
853 : Changing Australian communities
language – languages other than English spoken at home education – level reached; number of university degrees, trades, skills and
other qualifications income – income brackets, such as between $30 000 and $40 000 workplace – number of people with or without jobs, different types of jobs travel to work – how many people travel by car, by public transport (bus,
train, etc.) or walk housing – types of dwellings, type of building materials, number of
bedrooms.Basic community profiles have been used in the community studies of
Darwin and Dubbo in chapters 4 and 5. In addition to census information, the ABS collects data based on surveys to keep some statistics up to date. It would not be useful to wait for five years before updating the population of Australia so the ABS makes estimates of the population every quarter (three months).
Australia’s Indigenous communitiesIn June 2006 the Indigenous population of Australia was 517 200 people, comprising 2.5 per cent of Australia’s total population. Of the total Indigenous community, 90 per cent identified themselves as being of Aboriginal origin, 6 per cent of Torres Strait Islander origin and 4 per cent as being of both Aboriginal and Torres Strait Islander origin.
Geographic distribution As can be seen in [3.22], viewed on a state and territory basis, the largest concentrations of Indigenous Australians are found in NSW and Queensland. However, as a proportion of the total population, the Indigenous population is particularly significant in the Northern Territory, where Indigenous peoples comprise 32 per cent of the population. Indigenous peoples make up a large proportion of the populations of the remote areas of the Northern Territory and Queensland. However, there are also large urban communities in Sydney, Brisbane and Perth in particular.
Age structure Australia’s Indigenous communities have a much younger age structure than the total Australian population [3.9], with 39 per cent of the population under the age of 15 compared to 21 per cent for the total population. In 2006, the median age for the Indigenous population was 20 years compared with 37 years for the total Australian population.
The age structure of Australia’s Indigenous population is due to both high fertility and high mortality rates. The fertility rate for Indigenous women fell from six babies per woman in 1961 to 2.12 babies per woman in 2006. However, Indigenous women still have a significantly higher fertility rate than that of Australian women as a whole, which was 1.81 babies per woman in 2006.
Evidence of the high mortality rates for Indigenous Australians can be seen in their low life expectancy, which in 2006 was 59 years for males and 65 years for females.
[3.22] Distribution of Australia’s Indigenous population, 2006
’000
NSW 148.2
Vic. 30.8
Qld 146.4
SA 26.0
WA 77.9
Tas. 16.9
NT 66.6
ACT 4.0
Australia 517.2*
*Includes other territories
Source: ABS Population Distribution, Aboriginal and
Torres Strait Islander Australians 4705.0, 2006
mortality ratesthe frequency of deaths
within a given population
86 Geography for Australian Citizens
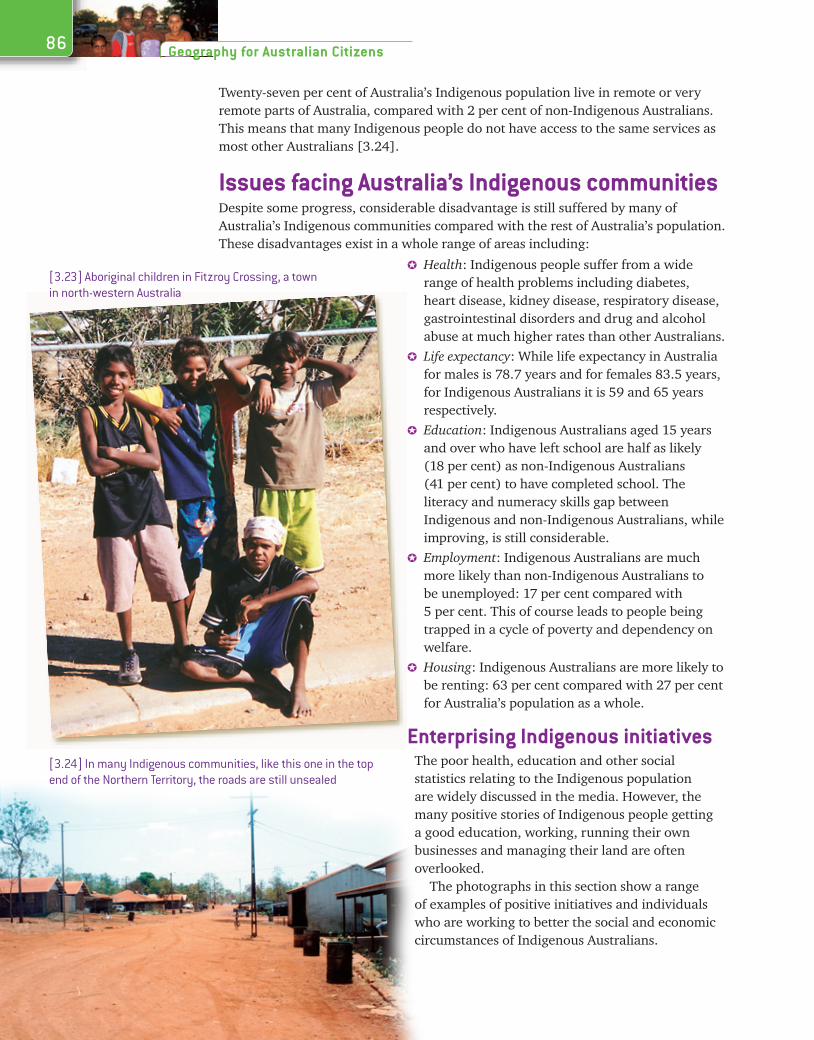
Twenty-seven per cent of Australia’s Indigenous population live in remote or very remote parts of Australia, compared with 2 per cent of non-Indigenous Australians. This means that many Indigenous people do not have access to the same services as most other Australians [3.24].
Issues facing Australia’s Indigenous communitiesDespite some progress, considerable disadvantage is still suffered by many of Australia’s Indigenous communities compared with the rest of Australia’s population. These disadvantages exist in a whole range of areas including:
[3.23] Aboriginal children in Fitzroy Crossing, a town in north-western Australia
[3.24] In many Indigenous communities, like this one in the top end of the Northern Territory, the roads are still unsealed
Health: Indigenous people suffer from a wide range of health problems including diabetes, heart disease, kidney disease, respiratory disease, gastrointestinal disorders and drug and alcohol abuse at much higher rates than other Australians.
Life expectancy: While life expectancy in Australia for males is 78.7 years and for females 83.5 years, for Indigenous Australians it is 59 and 65 years respectively.
Education: Indigenous Australians aged 15 years and over who have left school are half as likely (18 per cent) as non-Indigenous Australians (41 per cent) to have completed school. The literacy and numeracy skills gap between Indigenous and non-Indigenous Australians, while improving, is still considerable.
Employment: Indigenous Australians are much more likely than non-Indigenous Australians to be unemployed: 17 per cent compared with 5 per cent. This of course leads to people being trapped in a cycle of poverty and dependency on welfare.
Housing: Indigenous Australians are more likely to be renting: 63 per cent compared with 27 per cent for Australia’s population as a whole.
Enterprising Indigenous initiativesThe poor health, education and other social statistics relating to the Indigenous population are widely discussed in the media. However, the many positive stories of Indigenous people getting a good education, working, running their own businesses and managing their land are often overlooked.
The photographs in this section show a range of examples of positive initiatives and individuals who are working to better the social and economic circumstances of Indigenous Australians.
873 : Changing Australian communities
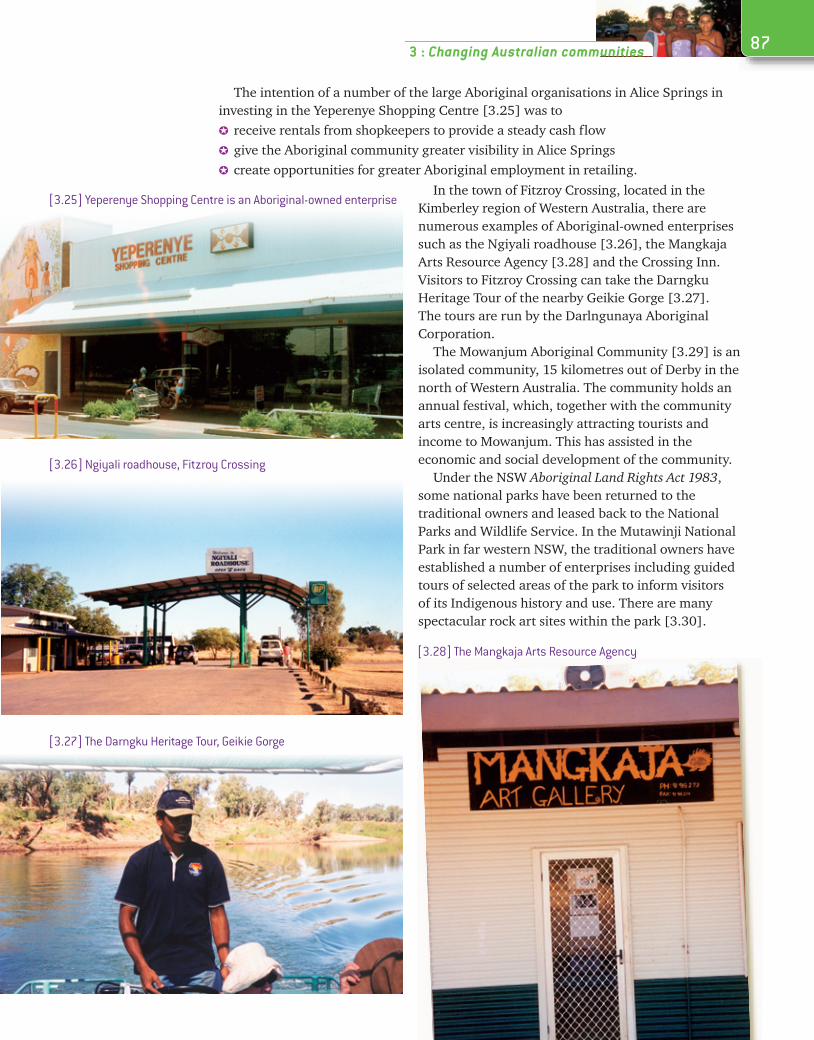
The intention of a number of the large Aboriginal organisations in Alice Springs in investing in the Yeperenye Shopping Centre [3.25] was to
receive rentals from shopkeepers to provide a steady cash flow give the Aboriginal community greater visibility in Alice Springs create opportunities for greater Aboriginal employment in retailing.
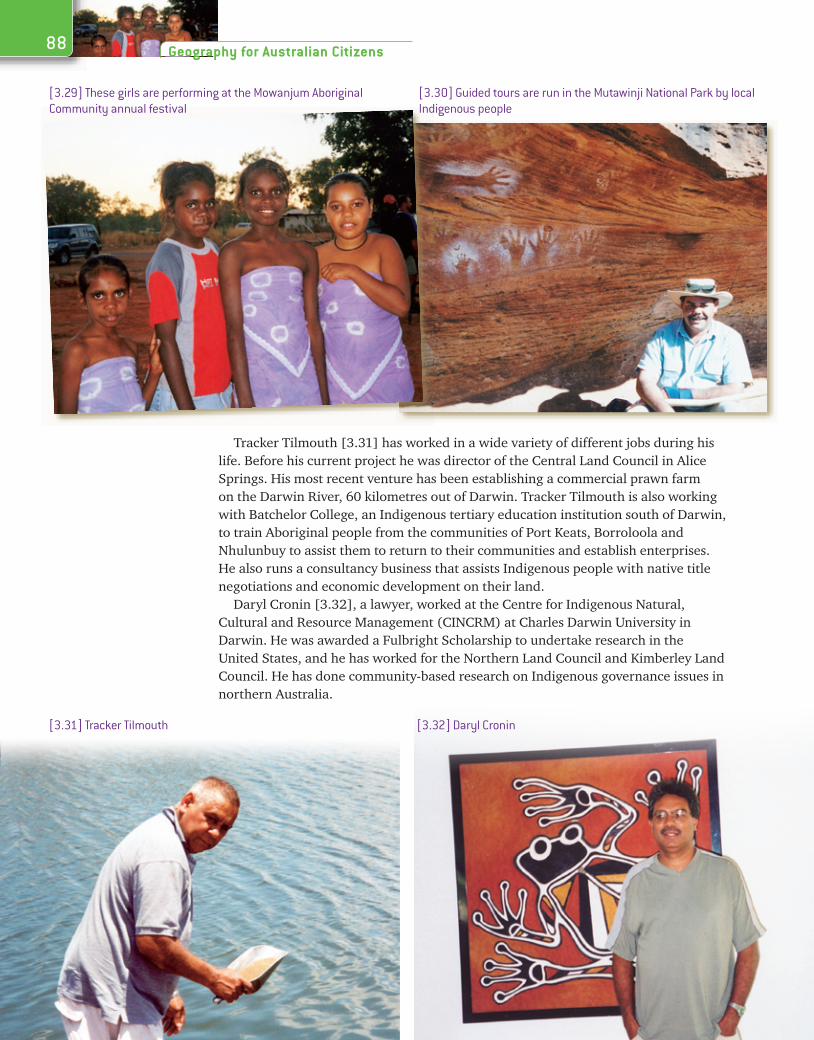
In the town of Fitzroy Crossing, located in the Kimberley region of Western Australia, there are numerous examples of Aboriginal-owned enterprises such as the Ngiyali roadhouse [3.26], the Mangkaja Arts Resource Agency [3.28] and the Crossing Inn. Visitors to Fitzroy Crossing can take the Darngku Heritage Tour of the nearby Geikie Gorge [3.27]. The tours are run by the Darlngunaya Aboriginal Corporation.
The Mowanjum Aboriginal Community [3.29] is an isolated community, 15 kilometres out of Derby in the north of Western Australia. The community holds an annual festival, which, together with the community arts centre, is increasingly attracting tourists and income to Mowanjum. This has assisted in the economic and social development of the community.
Under the NSW Aboriginal Land Rights Act 1983, some national parks have been returned to the traditional owners and leased back to the National Parks and Wildlife Service. In the Mutawinji National Park in far western NSW, the traditional owners have established a number of enterprises including guided tours of selected areas of the park to inform visitors of its Indigenous history and use. There are many spectacular rock art sites within the park [3.30].
[3.25] Yeperenye Shopping Centre is an Aboriginal-owned enterprise
[3.26] Ngiyali roadhouse, Fitzroy Crossing
[3.27] The Darngku Heritage Tour, Geikie Gorge
[3.28] The Mangkaja Arts Resource Agency
88 Geography for Australian Citizens
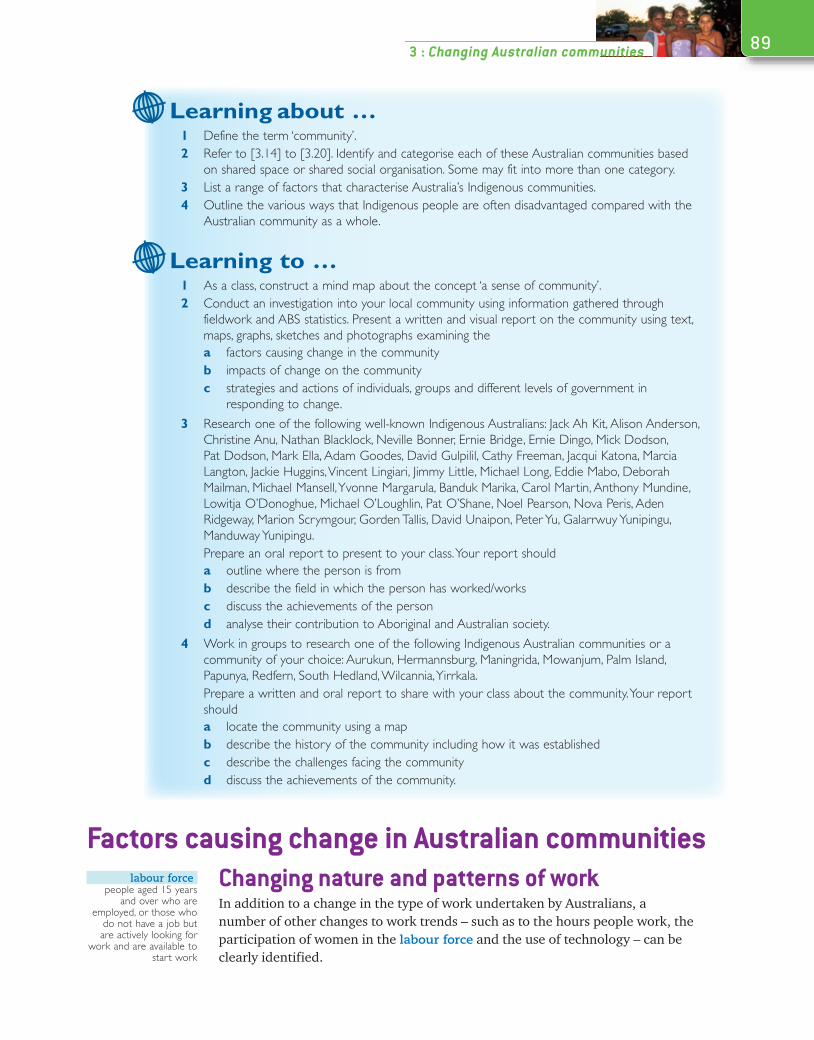
Tracker Tilmouth [3.31] has worked in a wide variety of different jobs during his life. Before his current project he was director of the Central Land Council in Alice Springs. His most recent venture has been establishing a commercial prawn farm on the Darwin River, 60 kilometres out of Darwin. Tracker Tilmouth is also working with Batchelor College, an Indigenous tertiary education institution south of Darwin, to train Aboriginal people from the communities of Port Keats, Borroloola and Nhulunbuy to assist them to return to their communities and establish enterprises. He also runs a consultancy business that assists Indigenous people with native title negotiations and economic development on their land.
Daryl Cronin [3.32], a lawyer, worked at the Centre for Indigenous Natural, Cultural and Resource Management (CINCRM) at Charles Darwin University in Darwin. He was awarded a Fulbright Scholarship to undertake research in the United States, and he has worked for the Northern Land Council and Kimberley Land Council. He has done community-based research on Indigenous governance issues in northern Australia.
[3.29] These girls are performing at the Mowanjum Aboriginal Community annual festival
[3.30] Guided tours are run in the Mutawinji National Park by local Indigenous people
[3.31] Tracker Tilmouth [3.32] Daryl Cronin
893 : Changing Australian communities
Learning about …1 Define the term ‘community’.2 Refer to [3.14] to [3.20]. Identify and categorise each of these Australian communities based
on shared space or shared social organisation. Some may fit into more than one category.3 List a range of factors that characterise Australia’s Indigenous communities.4 Outline the various ways that Indigenous people are often disadvantaged compared with the
Australian community as a whole.
Learning to …1 As a class, construct a mind map about the concept ‘a sense of community’.2 Conduct an investigation into your local community using information gathered through
fieldwork and ABS statistics. Present a written and visual report on the community using text, maps, graphs, sketches and photographs examining thea factors causing change in the communityb impacts of change on the communityc strategies and actions of individuals, groups and different levels of government in
responding to change.3 Research one of the following well-known Indigenous Australians: Jack Ah Kit, Alison Anderson,
Christine Anu, Nathan Blacklock, Neville Bonner, Ernie Bridge, Ernie Dingo, Mick Dodson, Pat Dodson, Mark Ella, Adam Goodes, David Gulpilil, Cathy Freeman, Jacqui Katona, Marcia Langton, Jackie Huggins, Vincent Lingiari, Jimmy Little, Michael Long, Eddie Mabo, Deborah Mailman, Michael Mansell, Yvonne Margarula, Banduk Marika, Carol Martin, Anthony Mundine, Lowitja O’Donoghue, Michael O’Loughlin, Pat O’Shane, Noel Pearson, Nova Peris, Aden Ridgeway, Marion Scrymgour, Gorden Tallis, David Unaipon, Peter Yu, Galarrwuy Yunipingu, Manduway Yunipingu.
Prepare an oral report to present to your class. Your report shoulda outline where the person is fromb describe the field in which the person has worked/worksc discuss the achievements of the persond analyse their contribution to Aboriginal and Australian society.
4 Work in groups to research one of the following Indigenous Australian communities or a community of your choice: Aurukun, Hermannsburg, Maningrida, Mowanjum, Palm Island, Papunya, Redfern, South Hedland, Wilcannia, Yirrkala.
Prepare a written and oral report to share with your class about the community. Your report shoulda locate the community using a mapb describe the history of the community including how it was establishedc describe the challenges facing the communityd discuss the achievements of the community.
Factors causing change in Australian communitiesChanging nature and patterns of workIn addition to a change in the type of work undertaken by Australians, a number of other changes to work trends – such as to the hours people work, the participation of women in the labour force and the use of technology – can be clearly identified.
labour forcepeople aged 15 years
and over who are employed, or those who
do not have a job but are actively looking for
work and are available to start work
% of all employed0 3 6 9 1512
1990–912005–06
Agriculture, forestry and fishingMining
ManufacturingElectricity, gas and water supply
ConstructionWholesale trade
Retail tradeAccommodation, cafes and restaurants
Transport and storageCommunication services
Finance and insuranceProperty and business services
Government administration and defenceEducation
Health and community servicesCultural and recreational services
Personal and other services
90 Geography for Australian Citizens
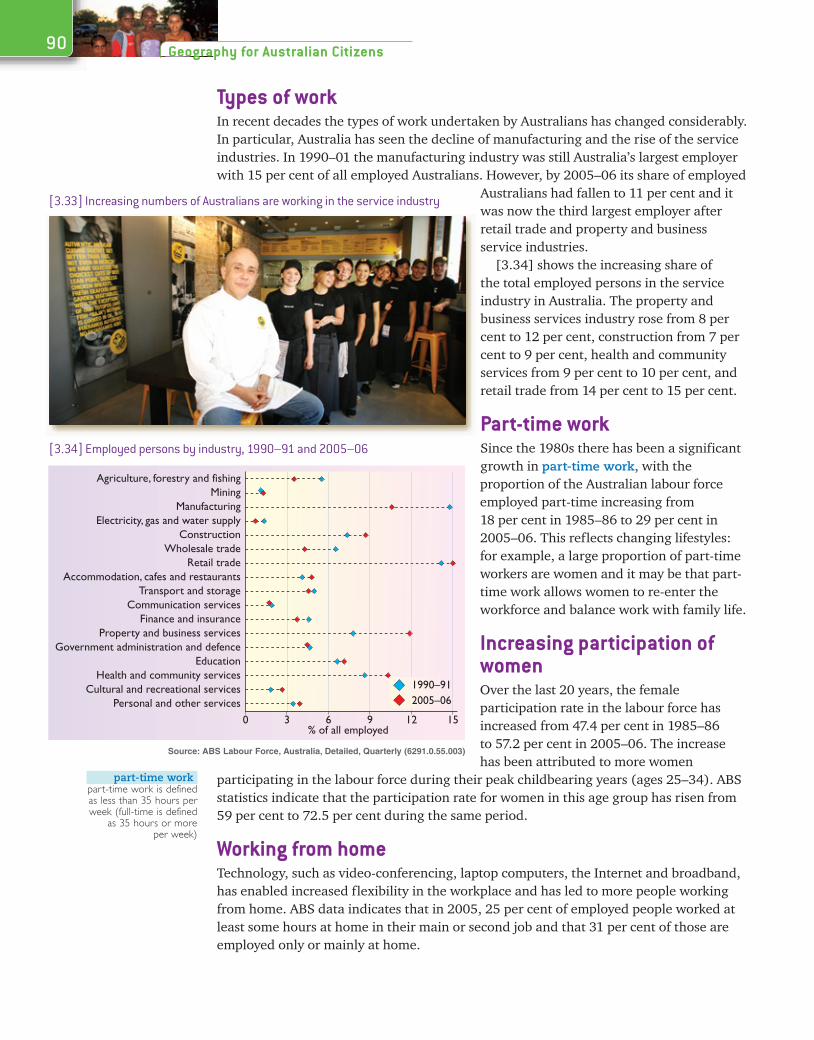
Types of workIn recent decades the types of work undertaken by Australians has changed considerably. In particular, Australia has seen the decline of manufacturing and the rise of the service industries. In 1990–01 the manufacturing industry was still Australia’s largest employer with 15 per cent of all employed Australians. However, by 2005–06 its share of employed
Australians had fallen to 11 per cent and it was now the third largest employer after retail trade and property and business service industries.
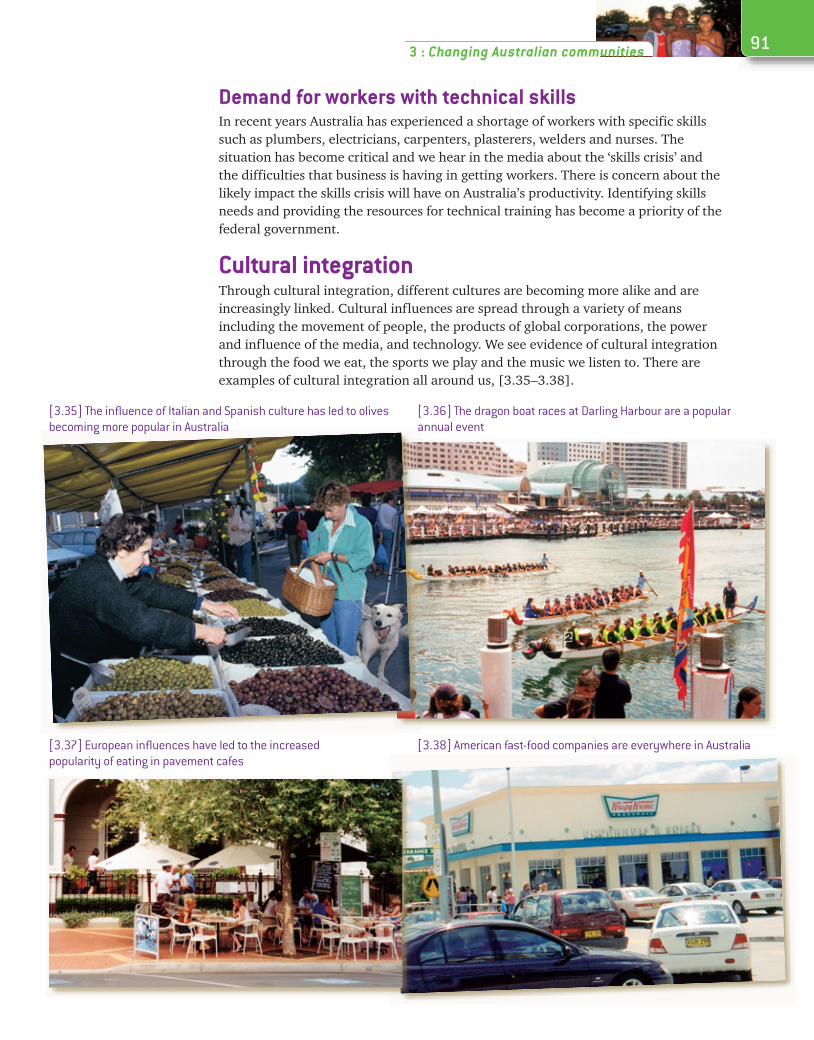
[3.34] shows the increasing share of the total employed persons in the service industry in Australia. The property and business services industry rose from 8 per cent to 12 per cent, construction from 7 per cent to 9 per cent, health and community services from 9 per cent to 10 per cent, and retail trade from 14 per cent to 15 per cent.
Part-time workSince the 1980s there has been a significant growth in part-time work, with the proportion of the Australian labour force employed part-time increasing from 18 per cent in 1985–86 to 29 per cent in 2005–06. This reflects changing lifestyles: for example, a large proportion of part-time workers are women and it may be that part-time work allows women to re-enter the workforce and balance work with family life.
Increasing participation of women Over the last 20 years, the female participation rate in the labour force has increased from 47.4 per cent in 1985–86 to 57.2 per cent in 2005–06. The increase has been attributed to more women
participating in the labour force during their peak childbearing years (ages 25–34). ABS statistics indicate that the participation rate for women in this age group has risen from 59 per cent to 72.5 per cent during the same period.
Working from homeTechnology, such as video-conferencing, laptop computers, the Internet and broadband, has enabled increased flexibility in the workplace and has led to more people working from home. ABS data indicates that in 2005, 25 per cent of employed people worked at least some hours at home in their main or second job and that 31 per cent of those are employed only or mainly at home.
part-time workpart-time work is defined as less than 35 hours per week (full-time is defined
as 35 hours or more per week)
[3.33] Increasing numbers of Australians are working in the service industry
[3.34] Employed persons by industry, 1990–91 and 2005–06
Source: ABS Labour Force, Australia, Detailed, Quarterly (6291.0.55.003)
913 : Changing Australian communities
Demand for workers with technical skillsIn recent years Australia has experienced a shortage of workers with specific skills such as plumbers, electricians, carpenters, plasterers, welders and nurses. The situation has become critical and we hear in the media about the ‘skills crisis’ and the difficulties that business is having in getting workers. There is concern about the likely impact the skills crisis will have on Australia’s productivity. Identifying skills needs and providing the resources for technical training has become a priority of the federal government.
Cultural integrationThrough cultural integration, different cultures are becoming more alike and are increasingly linked. Cultural influences are spread through a variety of means including the movement of people, the products of global corporations, the power and influence of the media, and technology. We see evidence of cultural integration through the food we eat, the sports we play and the music we listen to. There are examples of cultural integration all around us, [3.35–3.38].
[3.35] The influence of Italian and Spanish culture has led to olives becoming more popular in Australia
[3.36] The dragon boat races at Darling Harbour are a popular annual event
[3.37] European influences have led to the increased popularity of eating in pavement cafes
[3.38] American fast-food companies are everywhere in Australia
Mekong
R
R
ARABIANSEA
SOUTHCHINASEA
ARAFURASEA
EASTCHINASEA
PACIFICOCEAN
JAVA SEAINDIAN OCEAN
AUSTRALIA
Hokkaido
Northern Marianas
Mindanao
Luzon
KyushuShikoku
Honshu
Micronesia
New Guinea
PHILIPPINES
INDONESIA
SRI LANKA
MALDIVES
JAPAN
0 500 1000Kilometres
Tropic
of Ca
ncer
Equator
20˚N
10˚N
0˚
10˚S
20˚N
30˚N
40˚N
10˚N
0˚
10˚S 20˚S
150˚E
150˚E 160˚E 170˚E
140˚E
140˚E
130˚E
130˚E
120˚E
120˚E
110˚E
110˚E
100˚E
100˚E
90˚E
90˚E
80˚E
80˚E
70˚E
70˚E60˚E50˚E
INDIA
AFGHANISTAN
MONGOLIANORTHKOREA
SOUTHKOREA
CHINA
TAIWAN
VIETNAM
CAMBODIA
LAOS
THAILAND
MALAYSIABRUNEI
EAST TIMOR
BANGLADESH
NEPALBHUTAN
PAKISTAN
SINGAPORE
BURMA
IRAN
KAZAKHSTAN
RUSSIA
North-East Asia
South-East Asia
Southern Asia
92 Geography for Australian Citizens
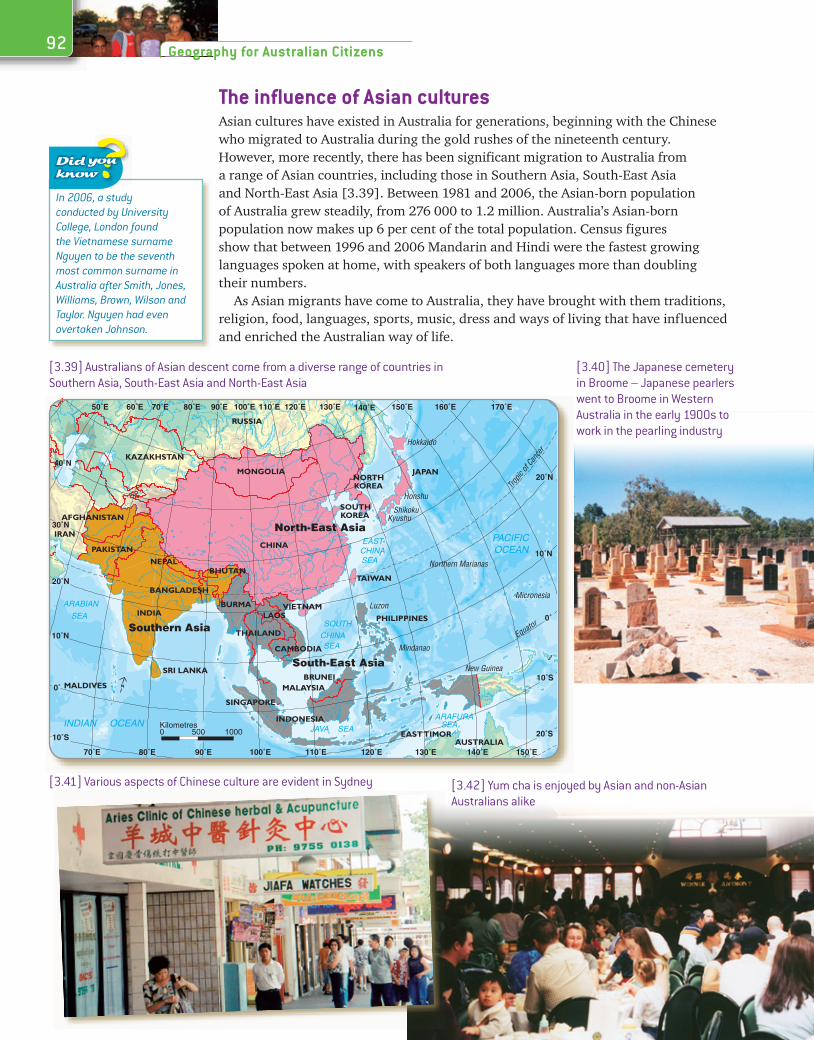
The influence of Asian culturesAsian cultures have existed in Australia for generations, beginning with the Chinese who migrated to Australia during the gold rushes of the nineteenth century. However, more recently, there has been significant migration to Australia from a range of Asian countries, including those in Southern Asia, South-East Asia and North-East Asia [3.39]. Between 1981 and 2006, the Asian-born population of Australia grew steadily, from 276 000 to 1.2 million. Australia’s Asian-born population now makes up 6 per cent of the total population. Census figures show that between 1996 and 2006 Mandarin and Hindi were the fastest growing languages spoken at home, with speakers of both languages more than doubling their numbers.
As Asian migrants have come to Australia, they have brought with them traditions, religion, food, languages, sports, music, dress and ways of living that have influenced and enriched the Australian way of life.
In 2006, a study conducted by University College, London found the Vietnamese surname Nguyen to be the seventh most common surname in Australia after Smith, Jones, Williams, Brown, Wilson and Taylor. Nguyen had even overtaken Johnson.
[3.39] Australians of Asian descent come from a diverse range of countries in Southern Asia, South-East Asia and North-East Asia
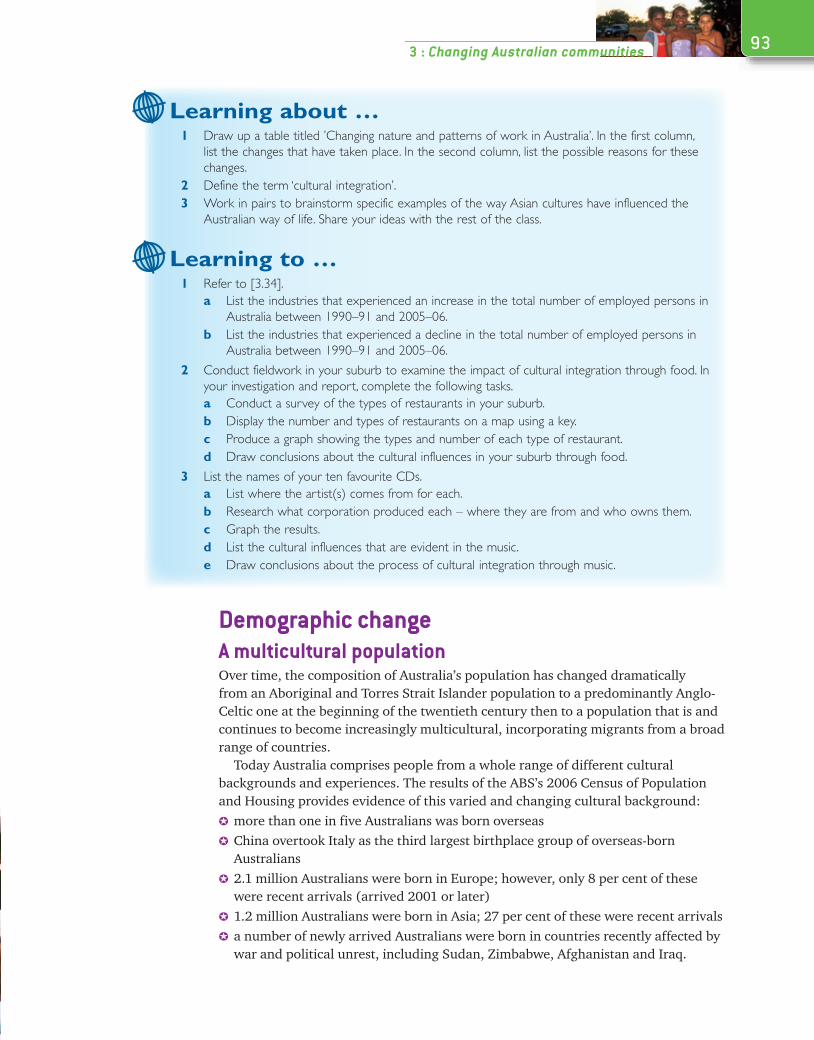
[3.40] The Japanese cemetery in Broome – Japanese pearlers went to Broome in Western Australia in the early 1900s to work in the pearling industry
[3.41] Various aspects of Chinese culture are evident in Sydney [3.42] Yum cha is enjoyed by Asian and non-Asian Australians alike
933 : Changing Australian communities
Learning about …1 Draw up a table titled ’Changing nature and patterns of work in Australia’. In the first column,
list the changes that have taken place. In the second column, list the possible reasons for these changes.
2 Define the term ‘cultural integration’.3 Work in pairs to brainstorm specific examples of the way Asian cultures have influenced the
Australian way of life. Share your ideas with the rest of the class.
Learning to …1 Refer to [3.34].
a List the industries that experienced an increase in the total number of employed persons in Australia between 1990–91 and 2005–06.
b List the industries that experienced a decline in the total number of employed persons in Australia between 1990–91 and 2005–06.
2 Conduct fieldwork in your suburb to examine the impact of cultural integration through food. In your investigation and report, complete the following tasks.a Conduct a survey of the types of restaurants in your suburb.b Display the number and types of restaurants on a map using a key.c Produce a graph showing the types and number of each type of restaurant.d Draw conclusions about the cultural influences in your suburb through food.
3 List the names of your ten favourite CDs.a List where the artist(s) comes from for each.b Research what corporation produced each – where they are from and who owns them.c Graph the results.d List the cultural influences that are evident in the music.e Draw conclusions about the process of cultural integration through music.
Demographic changeA multicultural populationOver time, the composition of Australia’s population has changed dramatically from an Aboriginal and Torres Strait Islander population to a predominantly Anglo-Celtic one at the beginning of the twentieth century then to a population that is and continues to become increasingly multicultural, incorporating migrants from a broad range of countries.
Today Australia comprises people from a whole range of different cultural backgrounds and experiences. The results of the ABS’s 2006 Census of Population and Housing provides evidence of this varied and changing cultural background:
more than one in five Australians was born overseas China overtook Italy as the third largest birthplace group of overseas-born Australians
2.1 million Australians were born in Europe; however, only 8 per cent of these were recent arrivals (arrived 2001 or later)
1.2 million Australians were born in Asia; 27 per cent of these were recent arrivals a number of newly arrived Australians were born in countries recently affected by war and political unrest, including Sudan, Zimbabwe, Afghanistan and Iraq.
94 Geography for Australian Citizens
Australia’s multiculturalism exposed all Australians to a greater variety of food, languages, dress, religion, traditions and life experiences and ways of life. It has also brought challenges as we learn to live together in a tolerant and respectful way.
An ageing populationDue to increased life expectancy and a drop in fertility rates, Australia’s population is ageing. This ageing of the population is having and will continue to have considerable economic and social impacts on Australian communities.
People are now, on average, spending much longer in retirement than they did in the past. With a shrinking ratio of working age population to retired population, governments have worked to encourage people to save for their own retirement through superannuation.
Governments at all levels are focusing on providing better health and medical care, aged care, including residential services, and nursing services. Strategies being considered include financial incentives for nurses to enter the aged care industry.
The ageing of the Australian population is also having considerable social impacts, including increasing pressure on people acting as carers for elderly parents.
Geographic distribution of the populationIn recent decades, rural areas, particularly small country towns, have experienced population decline while the capital cities and coastal areas have continued to experience significant growth.
What has been particularly interesting is the pattern of growth that has taken place in Australia’s capital cities. No longer is it just the suburbs of these cities that are growing but large numbers of people are moving into the CBD and inner-city areas. This trend has been identified by the demographer Bernard Salt, who attributes the growth pattern to generation X, generation Y and ‘empty nesters’ reinventing the Australian dream (to own a quarter acre block in the suburbs). According to Salt:
In the funkiest, hippest and most central parts of Melbourne, Sydney and Brisbane the number of new residents moving in each year now tops 7000, 6800 and 6300 respectively and exceeds the numbers added to the city’s fast-growing suburbs.
Coastal areas continue to experience huge growth as large numbers of people continue to opt for a sea change.
The federal government elected in 2007 plans to appoint an Ambassador for Ageing to positively promote respect for the value of older Australians.
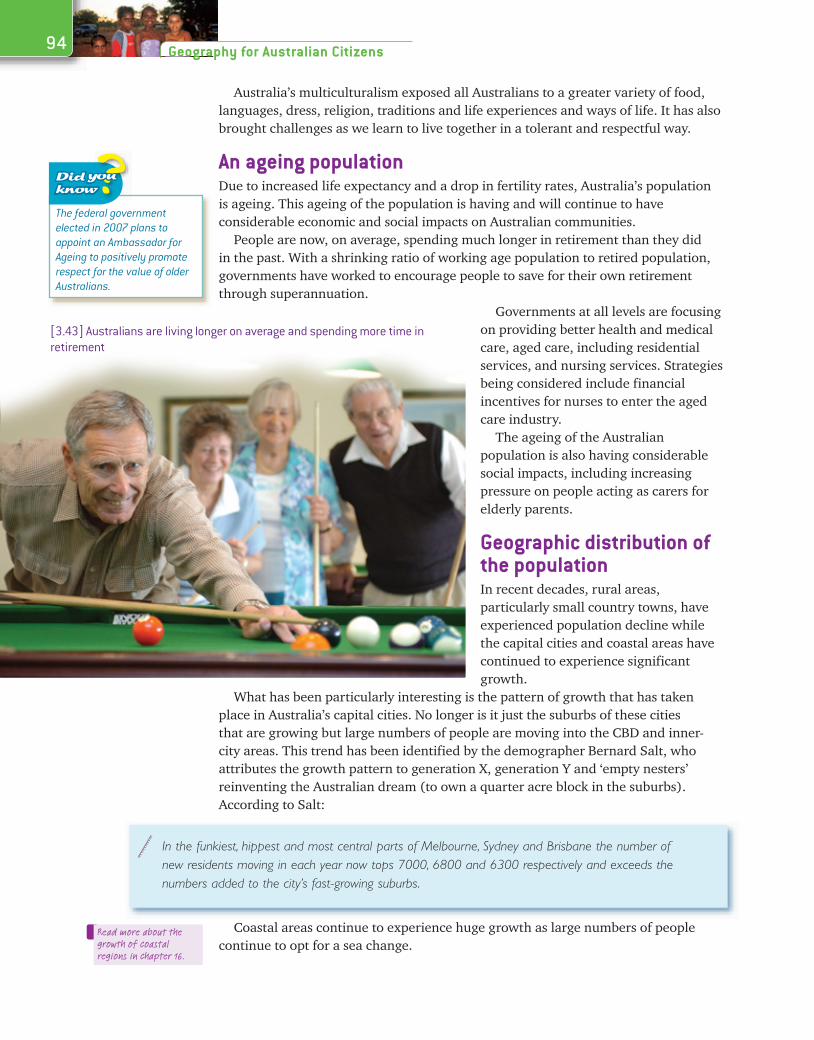
[3.43] Australians are living longer on average and spending more time in retirement
Read more about the growth of coastal regions in chapter 16.
953 : Changing Australian communities
Learning about …1 List 2006 census statistics that provide evidence of Australia’s varied and changing cultural
background.2 Outline the economic and social implications of the ageing of Australia’s population.3 Identify the various ways that the geographic distribution of Australia’s population is changing.
Learning to …Develop a mind map with the central theme ‘The implications of an ageing population for Australia’s future’.
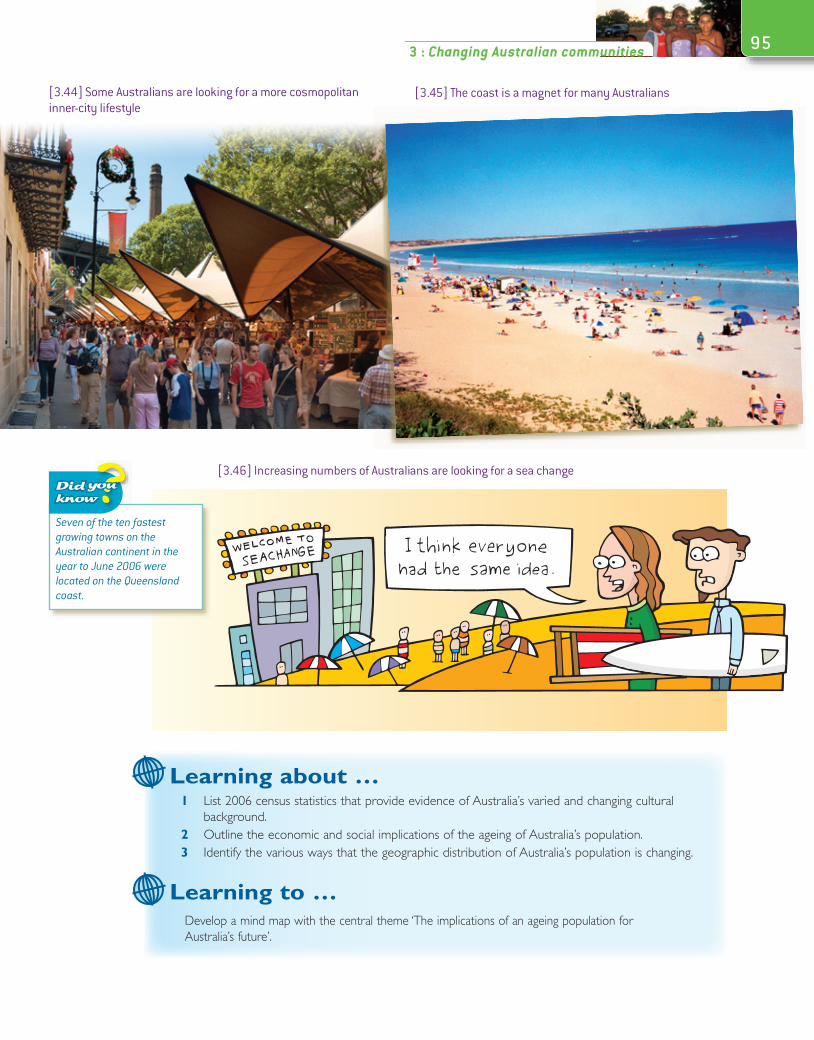
[3.44] Some Australians are looking for a more cosmopolitan inner-city lifestyle
Seven of the ten fastest growing towns on the Australian continent in the year to June 2006 were located on the Queensland coast.
[3.45] The coast is a magnet for many Australians
[3.46] Increasing numbers of Australians are looking for a sea change
96 Geography for Australian Citizens
Globalisation of economic activity
Globalisation involves the increasing integration of the economies of different countries. It has been driven by the:
rise of transnational corporations (TNCs) reduction in trade barriers and resultant increased trade flows
growth of international finance development of technology.The process has resulted in:
increased trade flows movement of labour restructuring of industries movement of production and (increasingly) services to developing countries where wage rates are generally lower.Some examples of how Australia is now part of the global economy include the:
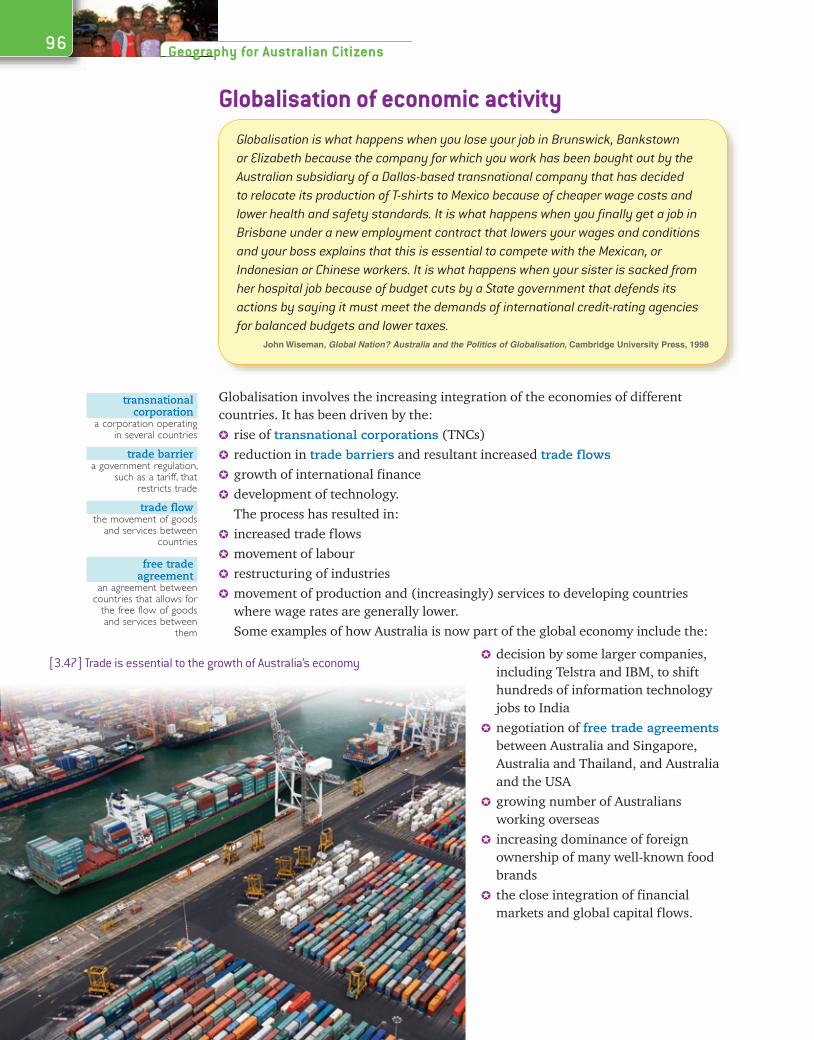
Globalisation is what happens when you lose your job in Brunswick, Bankstown or Elizabeth because the company for which you work has been bought out by the Australian subsidiary of a Dallas-based transnational company that has decided to relocate its production of T-shirts to Mexico because of cheaper wage costs and lower health and safety standards. It is what happens when you finally get a job in Brisbane under a new employment contract that lowers your wages and conditions and your boss explains that this is essential to compete with the Mexican, or Indonesian or Chinese workers. It is what happens when your sister is sacked from her hospital job because of budget cuts by a State government that defends its actions by saying it must meet the demands of international credit-rating agencies for balanced budgets and lower taxes.
John Wiseman, Global Nation? Australia and the Politics of Globalisation, Cambridge University Press, 1998
transnationalcorporation
a corporation operating in several countries
trade barriera government regulation,
such as a tariff, that restricts trade
trade flowthe movement of goods
and services between countries
free tradeagreement
an agreement between countries that allows for
the free flow of goods and services between
them
[3.47] Trade is essential to the growth of Australia’s economy decision by some larger companies, including Telstra and IBM, to shift hundreds of information technology jobs to India
negotiation of free trade agreements between Australia and Singapore, Australia and Thailand, and Australia and the USA
growing number of Australians working overseas
increasing dominance of foreign ownership of many well-known food brands
the close integration of financial markets and global capital flows.
973 : Changing Australian communities
Learning about …1 Explain the causes of globalisation.2 Outline the impacts of globalisation on Australia.3 List the negative impacts of globalisation listed in the quote from John Wiseman.4 Are the impacts of globalisation all negative? List some possible benefits of globalisation for Australia.
Learning to …Work in groups to develop a mind map with the central theme ‘Globalisation – its impact on Australia’.
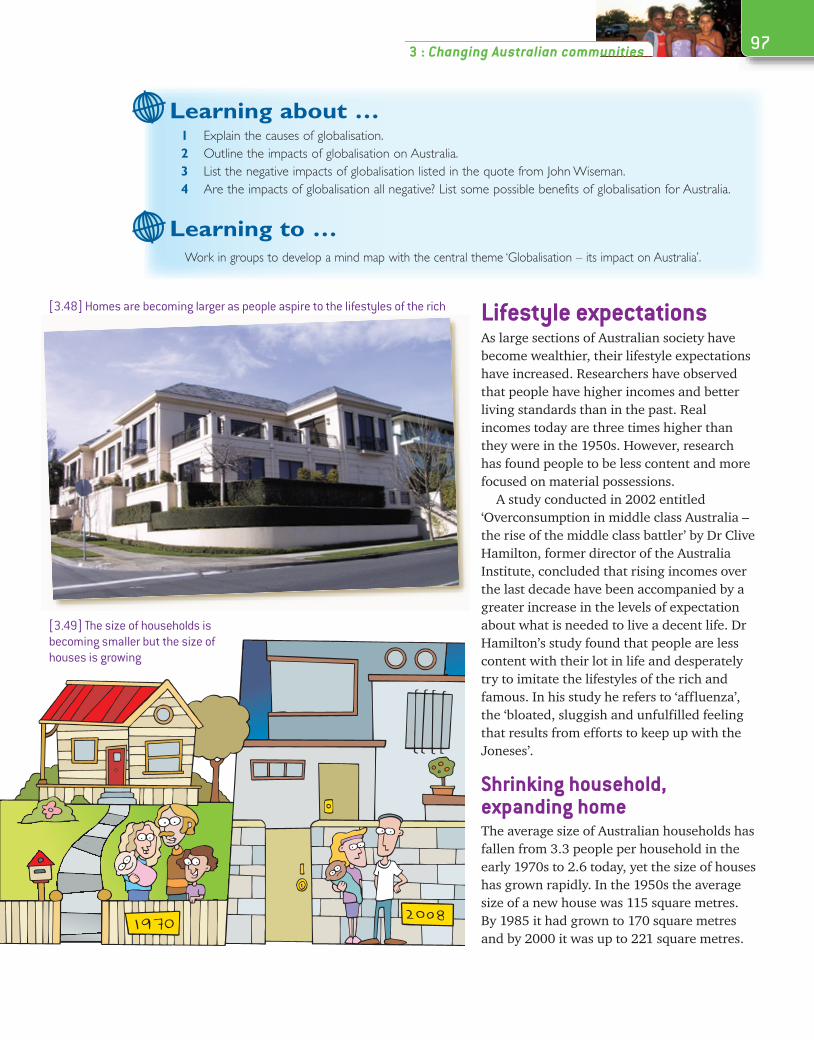
[3.48] Homes are becoming larger as people aspire to the lifestyles of the rich Lifestyle expectationsAs large sections of Australian society have become wealthier, their lifestyle expectations have increased. Researchers have observed that people have higher incomes and better living standards than in the past. Real incomes today are three times higher than they were in the 1950s. However, research has found people to be less content and more focused on material possessions.
A study conducted in 2002 entitled ‘Overconsumption in middle class Australia – the rise of the middle class battler’ by Dr Clive Hamilton, former director of the Australia Institute, concluded that rising incomes over the last decade have been accompanied by a greater increase in the levels of expectation about what is needed to live a decent life. Dr Hamilton’s study found that people are less content with their lot in life and desperately try to imitate the lifestyles of the rich and famous. In his study he refers to ‘affluenza’, the ‘bloated, sluggish and unfulfilled feeling that results from efforts to keep up with the Joneses’.
Shrinking household, expanding homeThe average size of Australian households has fallen from 3.3 people per household in the early 1970s to 2.6 today, yet the size of houses has grown rapidly. In the 1950s the average size of a new house was 115 square metres. By 1985 it had grown to 170 square metres and by 2000 it was up to 221 square metres.
[3.49] The size of households is becoming smaller but the size of houses is growing
98 Geography for Australian Citizens
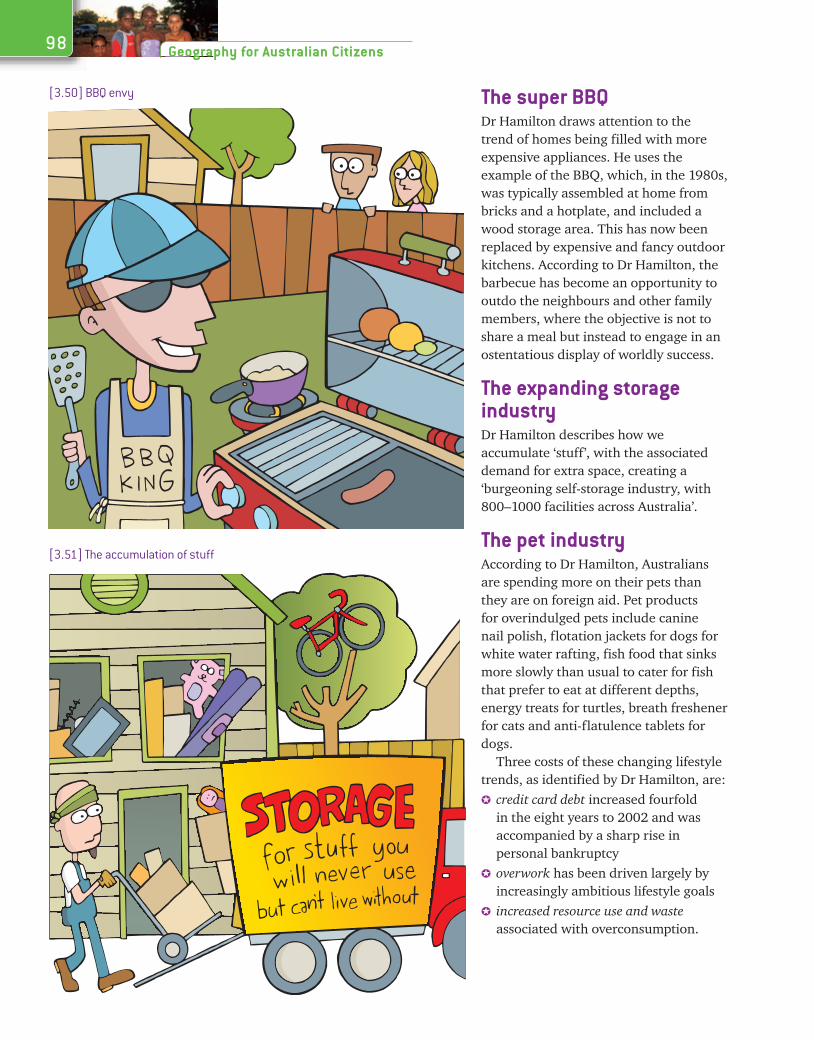
The super BBQDr Hamilton draws attention to the trend of homes being filled with more expensive appliances. He uses the example of the BBQ, which, in the 1980s, was typically assembled at home from bricks and a hotplate, and included a wood storage area. This has now been replaced by expensive and fancy outdoor kitchens. According to Dr Hamilton, the barbecue has become an opportunity to outdo the neighbours and other family members, where the objective is not to share a meal but instead to engage in an ostentatious display of worldly success.
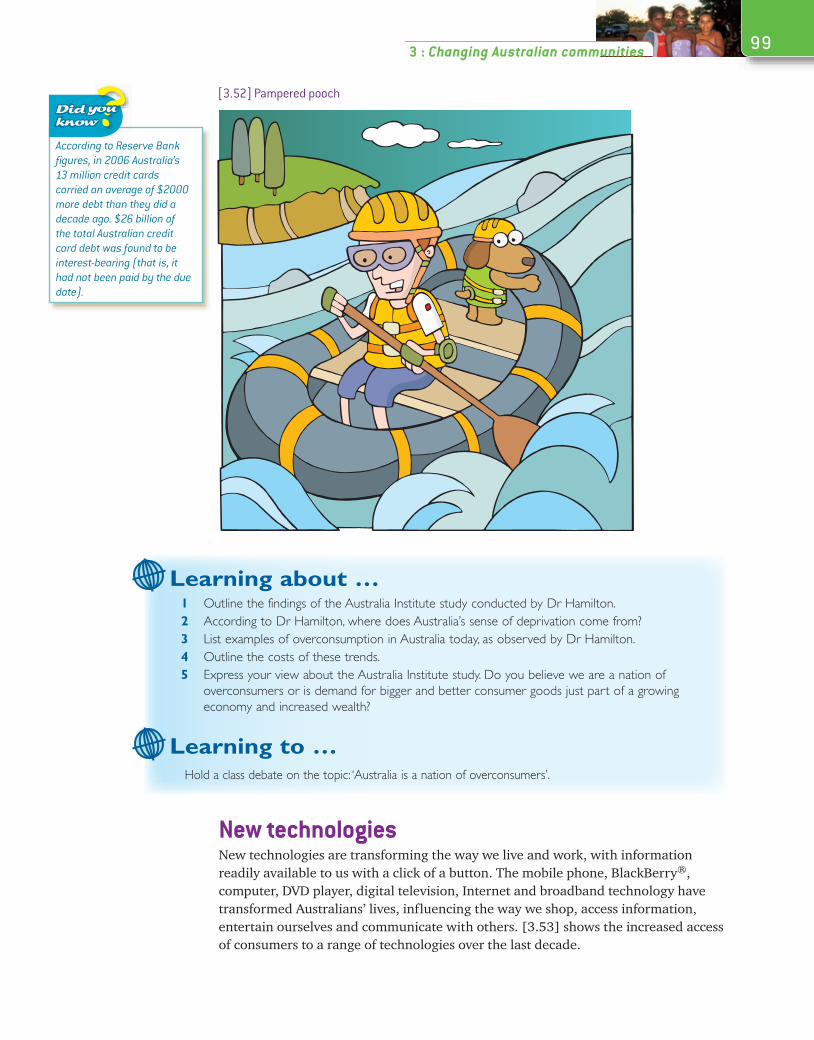
The expanding storage industryDr Hamilton describes how we accumulate ‘stuff’, with the associated demand for extra space, creating a ‘burgeoning self-storage industry, with 800–1000 facilities across Australia’.
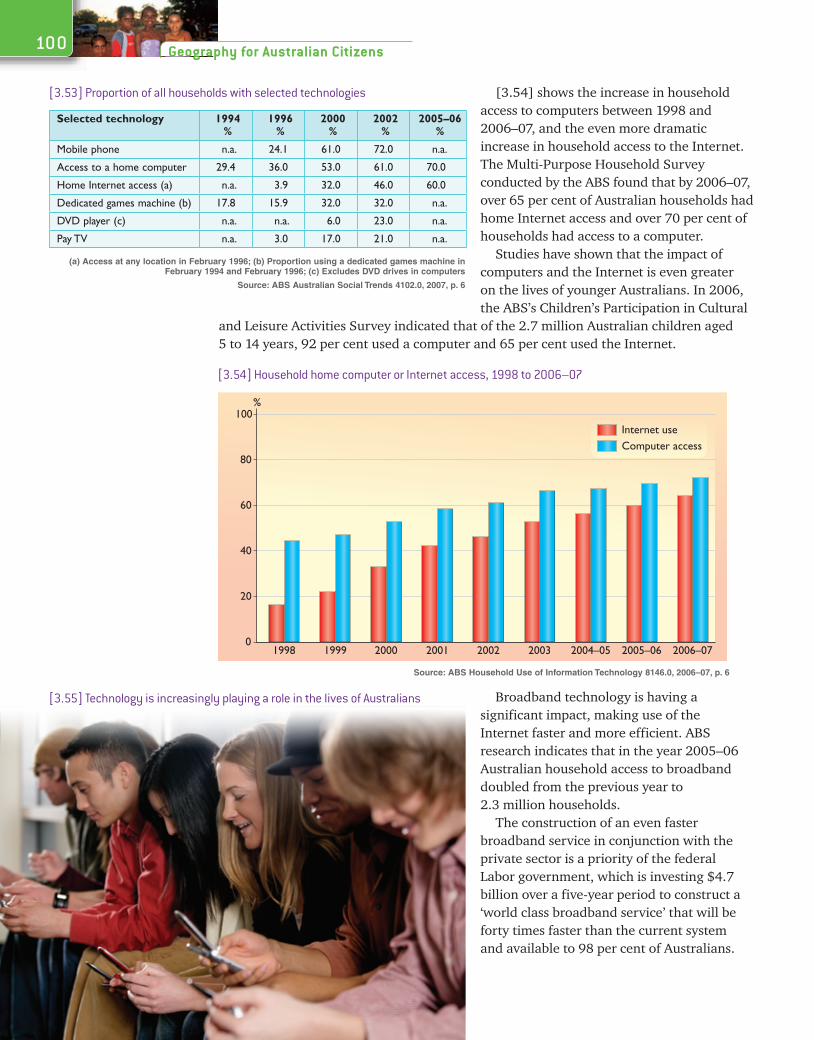
The pet industryAccording to Dr Hamilton, Australians are spending more on their pets than they are on foreign aid. Pet products for overindulged pets include canine nail polish, flotation jackets for dogs for white water rafting, fish food that sinks more slowly than usual to cater for fish that prefer to eat at different depths, energy treats for turtles, breath freshener for cats and anti-flatulence tablets for dogs.
Three costs of these changing lifestyle trends, as identified by Dr Hamilton, are:
credit card debt increased fourfold in the eight years to 2002 and was accompanied by a sharp rise in personal bankruptcy
overwork has been driven largely by increasingly ambitious lifestyle goals
increased resource use and waste associated with overconsumption.
[3.50] BBQ envy
[3.51] The accumulation of stuff
993 : Changing Australian communities
Learning about …1 Outline the findings of the Australia Institute study conducted by Dr Hamilton.2 According to Dr Hamilton, where does Australia’s sense of deprivation come from?3 List examples of overconsumption in Australia today, as observed by Dr Hamilton.4 Outline the costs of these trends.5 Express your view about the Australia Institute study. Do you believe we are a nation of
overconsumers or is demand for bigger and better consumer goods just part of a growing economy and increased wealth?
Learning to …Hold a class debate on the topic: ‘Australia is a nation of overconsumers’.
New technologiesNew technologies are transforming the way we live and work, with information readily available to us with a click of a button. The mobile phone, BlackBerry®, computer, DVD player, digital television, Internet and broadband technology have transformed Australians’ lives, influencing the way we shop, access information, entertain ourselves and communicate with others. [3.53] shows the increased access of consumers to a range of technologies over the last decade.
According to Reserve Bank figures, in 2006 Australia’s 13 million credit cards carried an average of $2000 more debt than they did a decade ago. $26 billion of the total Australian credit card debt was found to be interest-bearing (that is, it had not been paid by the due date).
[3.52] Pampered pooch
1998 1999 2000 2001 2002 2003 2004–05 2006–072005–060
20
40
60
80
100%
Internet useComputer access
100 Geography for Australian Citizens
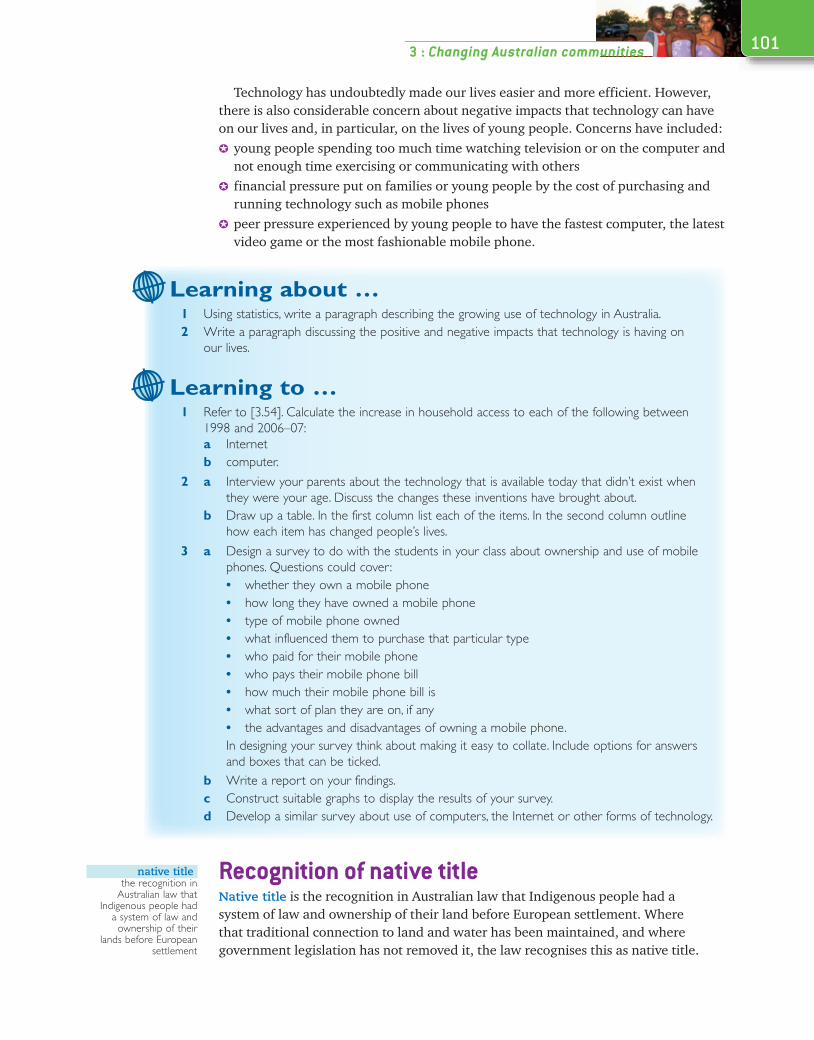
[3.54] shows the increase in household access to computers between 1998 and 2006–07, and the even more dramatic increase in household access to the Internet. The Multi-Purpose Household Survey conducted by the ABS found that by 2006–07, over 65 per cent of Australian households had home Internet access and over 70 per cent of households had access to a computer.
Studies have shown that the impact of computers and the Internet is even greater on the lives of younger Australians. In 2006, the ABS’s Children’s Participation in Cultural
and Leisure Activities Survey indicated that of the 2.7 million Australian children aged 5 to 14 years, 92 per cent used a computer and 65 per cent used the Internet.
[3.53] Proportion of all households with selected technologies
Selected technology 1994 %
1996 %
2000 %
2002 %
2005–06 %
Mobile phone n.a. 24.1 61.0 72.0 n.a.
Access to a home computer 29.4 36.0 53.0 61.0 70.0
Home Internet access (a) n.a. 3.9 32.0 46.0 60.0
Dedicated games machine (b) 17.8 15.9 32.0 32.0 n.a.
DVD player (c) n.a. n.a. 6.0 23.0 n.a.
Pay TV n.a. 3.0 17.0 21.0 n.a.
(a) Access at any location in February 1996; (b) Proportion using a dedicated games machine in February 1994 and February 1996; (c) Excludes DVD drives in computers
Source: ABS Australian Social Trends 4102.0, 2007, p. 6
Broadband technology is having a significant impact, making use of the Internet faster and more efficient. ABS research indicates that in the year 2005–06 Australian household access to broadband doubled from the previous year to 2.3 million households.
The construction of an even faster broadband service in conjunction with the private sector is a priority of the federal Labor government, which is investing $4.7 billion over a five-year period to construct a ‘world class broadband service’ that will be forty times faster than the current system and available to 98 per cent of Australians.
[3.54] Household home computer or Internet access, 1998 to 2006–07
Source: ABS Household Use of Information Technology 8146.0, 2006–07, p. 6
[3.55] Technology is increasingly playing a role in the lives of Australians
1013 : Changing Australian communities
Technology has undoubtedly made our lives easier and more efficient. However, there is also considerable concern about negative impacts that technology can have on our lives and, in particular, on the lives of young people. Concerns have included:
young people spending too much time watching television or on the computer and not enough time exercising or communicating with others
financial pressure put on families or young people by the cost of purchasing and running technology such as mobile phones
peer pressure experienced by young people to have the fastest computer, the latest video game or the most fashionable mobile phone.
Learning about …1 Using statistics, write a paragraph describing the growing use of technology in Australia.2 Write a paragraph discussing the positive and negative impacts that technology is having on
our lives.
Learning to …1 Refer to [3.54]. Calculate the increase in household access to each of the following between
1998 and 2006–07:a Internet b computer.
2 a Interview your parents about the technology that is available today that didn’t exist when they were your age. Discuss the changes these inventions have brought about.
b Draw up a table. In the first column list each of the items. In the second column outline how each item has changed people’s lives.
3 a Design a survey to do with the students in your class about ownership and use of mobile phones. Questions could cover:• whether they own a mobile phone• how long they have owned a mobile phone• type of mobile phone owned• what influenced them to purchase that particular type • who paid for their mobile phone• who pays their mobile phone bill• how much their mobile phone bill is• what sort of plan they are on, if any• the advantages and disadvantages of owning a mobile phone.
In designing your survey think about making it easy to collate. Include options for answers and boxes that can be ticked.
b Write a report on your findings.c Construct suitable graphs to display the results of your survey.d Develop a similar survey about use of computers, the Internet or other forms of technology.
Recognition of native titleNative title is the recognition in Australian law that Indigenous people had a system of law and ownership of their land before European settlement. Where that traditional connection to land and water has been maintained, and where government legislation has not removed it, the law recognises this as native title.
native titlethe recognition in
Australian law that Indigenous people had
a system of law and ownership of their
lands before European settlement
102 Geography for Australian Citizens
Native title was first recognised in Australia in 1992, when the High Court of Australia recognised that the Meriam people of the Torres Strait had native title over their traditional lands. Prior to this decision, Aboriginal land rights had been recognised in New South Wales and South Australia under state legislation, and the Northern Territory under the Commonwealth’s Aboriginal Land Rights Act.
The High Court’s native title decision overturned the concept of terra nullius – the idea that the Australian continent belonged to no one at the time of European arrival. For the first time it was recognised that Indigenous Australians may continue to hold native title. Indigenous people can now apply to the courts to have their native title recognised under Australian law.
In 1993 the Commonwealth parliament passed the Native Title Act. The Act has subsequently been amended a number of times. The act established the National Native Title Tribunal, which assists communities across Australia to resolve native title applications through mediation (negotiation to resolve any differences) under the direction of the Federal Court of Australia.
In 2006 the Federal Court brought down a judgment in favour of native title for the Nyoongar people over the Perth metropolitan area. This was significant as it was the first in favour of native title over a capital city and its surrounds. An appeal is going ahead in relation to this claim; however, if the appeal is not successful, the claim will be an important precedent for other native title claims in Australia.
Also in 2006 the federal government introduced technical amendments to the Native Title Act so as so make the process more efficient. Currently there are 580 native title claims that have been registered but still not determined.
Native title can only be claimed in areas where it hasn’t been extinguished (refused recognition). These areas include:
vacant crown land
some national parks, forest and public reserves some types of pastoral leases
some land held for Aboriginal communities beaches, oceans, seas, reefs, lakes, rivers,
creeks, swamps and other waters that are not privately owned – public rights of access to these areas are not affected.Areas where native title has been extinguished
include: privately owned land (including family homes
and some freehold land) land covered by residential, commercial and
certain other leases some crown reserves vested in bodies such as
local government or statutory authorities areas where governments have built roads,
schools and undertaken other public works.
terra nulliusthe idea that the
Australian continent belonged to no one
at the time of European arrival
crown landland belonging to the
government
pastoral leaseland leased from a state or territory government
for the purpose of pastoral activity
freeholdoutright land ownership
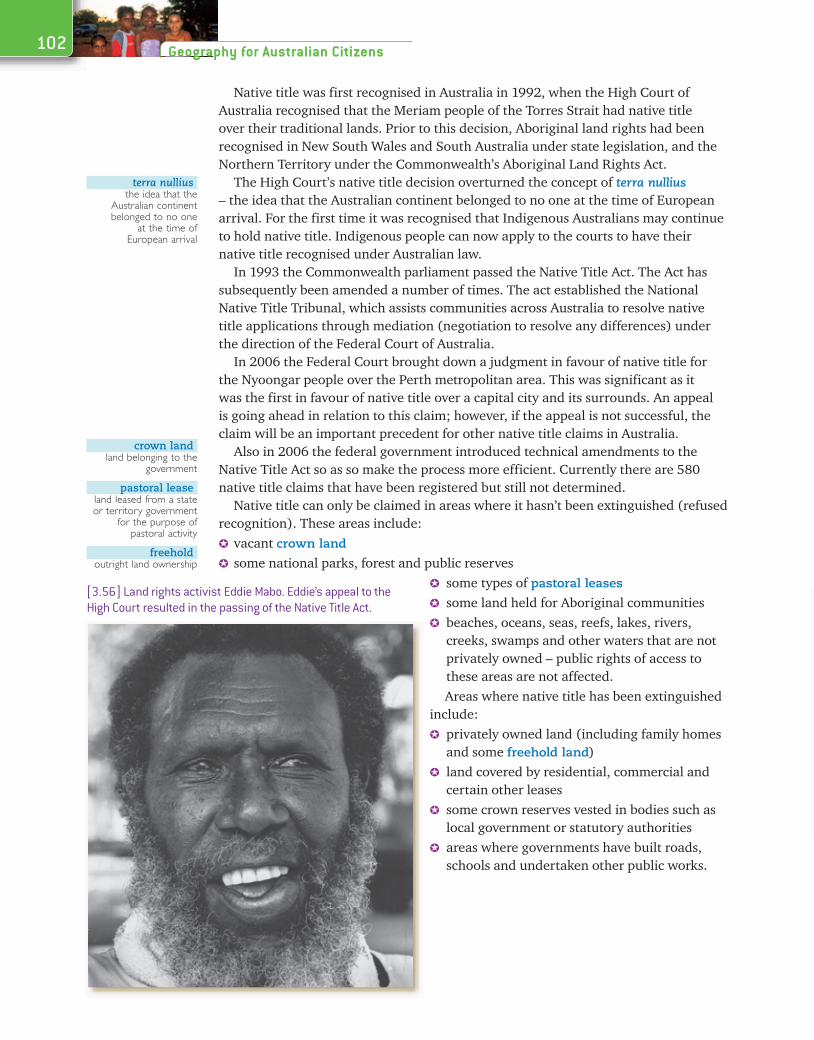
[3.56] Land rights activist Eddie Mabo. Eddie’s appeal to the High Court resulted in the passing of the Native Title Act.
1033 : Changing Australian communities
Learning about …1 Define the term ‘native title’.2 Explain how and when the recognition of native title came about in Australia.3 Define terra nullius and explain why the High Court determined that terra nullius no longer
applied in Australian law.4 Outline the areas that Indigenous Australians can and can’t claim under native title in Australia.
Learning to …Imagine you are an Indigenous Australian representing your community who wishes to apply for recognition of native title over their land. Visit the websites of the Federal Court of Australia at www.fedcourt.gov.au and the National Native Title Tribunal at www.nntt.gov.au. Find out about:
1 how to apply for native title2 the role of the Native Title Tribunal and the assistance that they can provide3 the role of and procedures in the Federal Court.
Resource depletionWith the increase in the size of Australia’s population and the growth in wealth of the Australian people, increasing demands have been put on Australia’s natural resources. Australia’s forest, fisheries, land and water resources are being rapidly consumed and have been significantly degraded or reduced.
Forest resources have been depleted through clearing land for agriculture and mining as well as timber harvesting.
Fisheries resources have declined due to factors such as overfishing, the use of non-selective fishing gear and pollution.
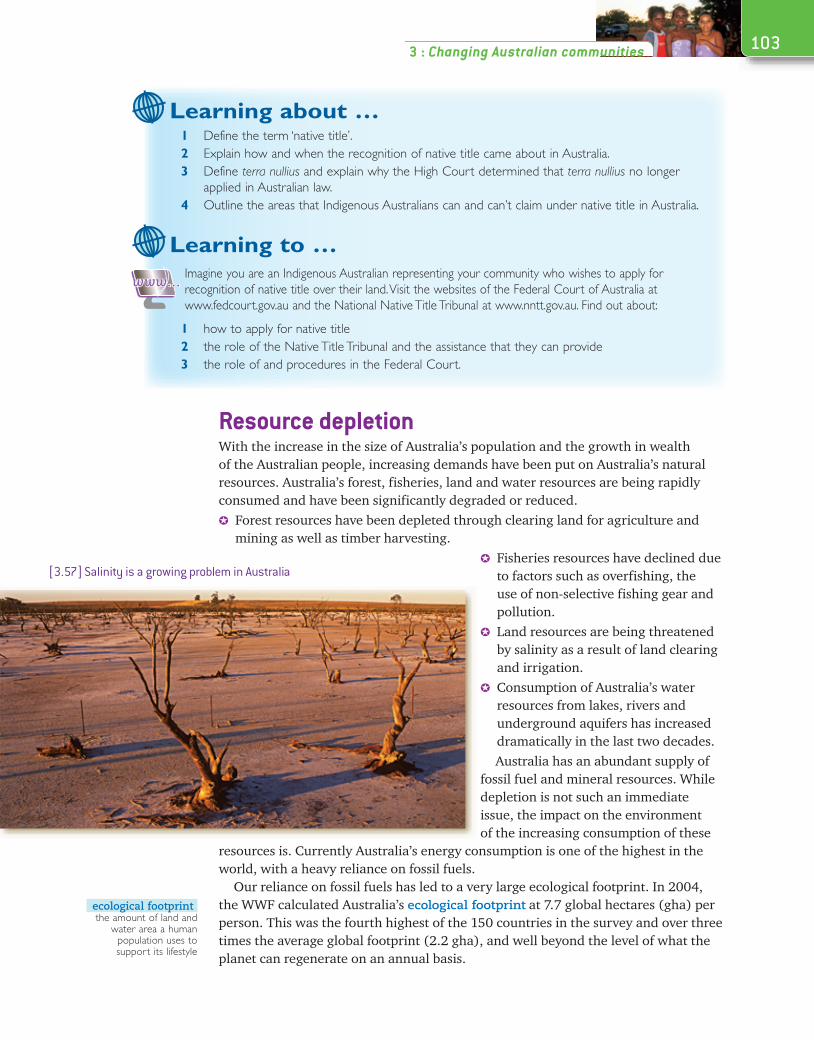
Land resources are being threatened by salinity as a result of land clearing and irrigation.
Consumption of Australia’s water resources from lakes, rivers and underground aquifers has increased dramatically in the last two decades.Australia has an abundant supply of
fossil fuel and mineral resources. While depletion is not such an immediate issue, the impact on the environment of the increasing consumption of these
resources is. Currently Australia’s energy consumption is one of the highest in the world, with a heavy reliance on fossil fuels.
Our reliance on fossil fuels has led to a very large ecological footprint. In 2004, the WWF calculated Australia’s ecological footprint at 7.7 global hectares (gha) per person. This was the fourth highest of the 150 countries in the survey and over three times the average global footprint (2.2 gha), and well beyond the level of what the planet can regenerate on an annual basis.
ecological footprintthe amount of land and
water area a human population uses to support its lifestyle
[3.57] Salinity is a growing problem in Australia
104 Geography for Australian Citizens
Greenhouse gas emissions and the impact on climate change have become pressing issues. The federal government has made addressing climate change a national priority. Therefore, despite our abundant supply of fossil fuel resources, there is a push for the development of renewable energy resources, with the government giving considerable funding to develop and commercialise renewable energy resources such as solar, geothermal and biomass power.
Learning about …1 List the main resources that are being depleted in Australia and outline how they are being
depleted.2 Explain why, despite the fact that Australia has a good supply of fossil fuel resources, the use of
fossil fuels is still a major problem.
Learning to …1 Working in groups, research one of the following natural resources in Australia:
a fishb forestsc soild watere coalf uranium.
You should investigatei the availability of the resource in Australiaii the extent to which the resource has been depletediii how the resource is usediv problems associated with the use of this resourcev initiatives that have been taken to better manage the resource.
Prepare a PowerPoint presentation or a poster to share your information with the class. The Australian Conservation Foundation website at www.acfonline.org.au may be helpful in your investigation.
2 Visit the Australian government’s website at www.australia.gov.au to find out what the government is currently doing to develop and implement the use of renewable energy in Australia. Prepare a report on your findings.
geothermal powerenergy obtained from
the hot areas under the Earth’s surface
biomass powerenergy produced from the burning of biofuels such as plant material
and animal waste
Related Documents