2ICI AU9817304 M SECOND INTERNATIONAL CONFERENCE ON ISOTOPES" MILLENNIUM SYDNEY 12 -16 OCTOBER 1997 CONFERENCE PROCEEDINGS FOREWORD, TECHNICAL PROGRAM AND PAPERS 1 - 60 HOSTED BY THE AUSTRALIAN NUCLEAR ASSOCIATION INC. 29-45

Welcome message from author
This document is posted to help you gain knowledge. Please leave a comment to let me know what you think about it! Share it to your friends and learn new things together.
Transcript
2ICI AU9817304
MSECOND INTERNATIONAL CONFERENCEON ISOTOPES"
MILLENNIUM SYDNEY12 -16 OCTOBER 1997
CONFERENCE PROCEEDINGS
FOREWORD, TECHNICAL PROGRAMAND PAPERS 1 - 60
HOSTED BY THEAUSTRALIAN NUCLEAR ASSOCIATION INC.
2 9 - 4 5

FOREWORD
The First International Conference on Isotopes was hosted by the Chinese Nuclear Society and theIsotope Society of China and was held in Beijing in May 1995. The conference was attended byover 300 persons from universities, companies and national and international nuclear energyresearch organisations. A total of 221 technical papers were presented over four days and atechnical exhibition was also held.
The Second International Conference on Isotopes (2ICI) is hosted by the Australian NuclearAssociation Inc. at the Millennium Sydney, NSW, Australia. The Theme of the Second Conference:
"Isotopes for Industry, Health and a Better Environment"
recognises that isotopes have been used in these fields successfully for many years and offerprospects for increasing use in the future. The worldwide interest in the use of research reactorsand accelerators and in applications of stable and radioactive isotopes, isotopic techniques andradiation in industry, agriculture, medicine, environmental studies and research in general, isconsidered. Other radiation issues including radiation protection and safety are also addressed.
International and national overviews and subject reviews invited from leading experts are includedto introduce the program of technical sessions. The invited papers are supported by contributionsaccepted from participants for oral and poster presentation. A Technical Exhibition is being held inassociation with the Conference. A Final Program with a list of the topic areas is presented later inthis Conference Handbook.
The extended abstracts of the papers presented orally and as posters are included in this HandbookThe titles and authors' names and contact addresses are also included for papers which wererecommended for acceptance by the International Technical Advisory Committee but could not bepresented by the authors in person. These are included to enable persons interested in the researchdescribed to obtain further information by contacting the authors directly.
The Australian Nuclear Association is pleased that the early registrations received for thisconference as this Handbook went to the printers have confirmed its expectations that a broadspectrum of persons would attend from government, industry, and universities in many countries.
The assistance of the members of the Conference Committee is gratefully acknowledged as also isthe work of Mrs Margaret Lanigan as Conference Manager.
Dr Clarence J. HardyExecutive Chairman and Editor
(iii)
3
TECHNICAL PROGRAM
2ICI"SECOND INTERNATIONAL CONFERENCE ON ISOTOPES"
SYDNEY, NSW, 12-16 OCTOBER 1997
Hosted by the Australian Nuclear Association Inc.
International Nuclear Societies as Technical Co-Sponsors
Atomic Energy Society of JapanBritish Nuclear Energy Society
Canadian Nuclear SocietyChinese Nuclear SocietyGerman Nuclear Society
Indian National Association for Applications of Isotopes and RadiationInternational Isotope Society
Isotope Society of ChinaIsotopes & Radiation Division of ANS
Japan Radioisotope SocietyMalaysian Nuclear SocietyNuclear Society of Russiaand in cooperation with
the American Nuclear Societythe European Nuclear Society
and the International Atomic Energy Agency (IAEA).
Australian Organisations as Technical Co-Sponsors
Australian Nuclear Science & Technology Organisation (ANSTO)Australian Institute of Nuclear Science & Engineering (AINSE)
Nuclear Engineering Panel, The Institution of Engineers, AustraliaThe Australia and New Zealand Society of Nuclear Medicine (ANZSNM)
The Australasian Radiation Protection Society (ARPS)CSIRO Division of Minerals
(vii)
TECHNICAL PROGRAM
***AH meetings are in the Millennium Sydney in the rooms stated***
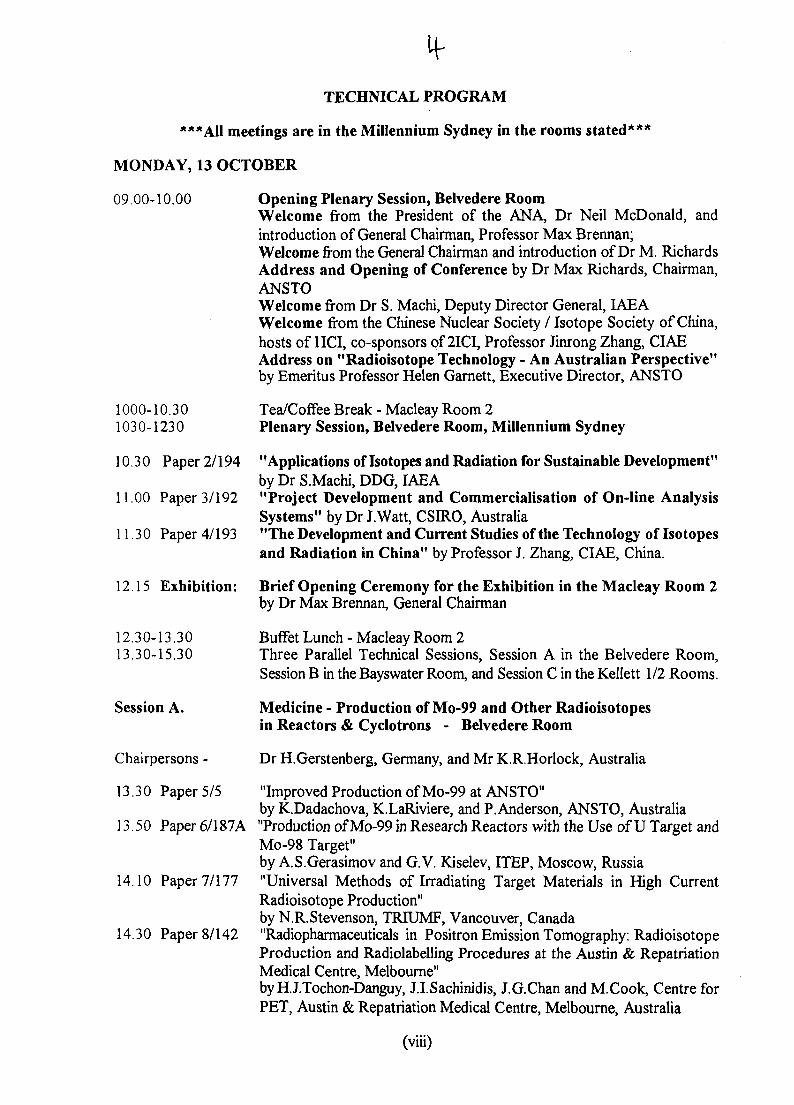
MONDAY, 13 OCTOBER
09 00-10.00 Opening Plenary Session, Belvedere RoomWelcome from the President of the ANA, Dr Neil McDonald, andintroduction of General Chairman, Professor Max Brennan;Welcome from the General Chairman and introduction of Dr M. RichardsAddress and Opening of Conference by Dr Max Richards, Chairman,ANSTOWelcome from Dr S. Machi, Deputy Director General, IAEAWelcome from the Chinese Nuclear Society / Isotope Society of China,hosts of 1ICI, co-sponsors of 2ICI, Professor Jinrong Zhang, CIAEAddress on "Radioisotope Technology - An Australian Perspective"by Emeritus Professor Helen Garnett, Executive Director, ANSTO
1000-10.30 Tea/Coffee Break - Macleay Room 21030-1230 Plenary Session, Belvedere Room, Millennium Sydney
10.30 Paper 2/194 "Applications of Isotopes and Radiation for Sustainable Development"by Dr S.Machi, DDG, IAEA
11.00 Paper 3/192 "Project Development and Commercialisation of On-line AnalysisSystems" by Dr J.Watt, CSIRO, Australia
1130 Paper 4/193 "The Development and Current Studies of the Technology of Isotopesand Radiation in China" by Professor J. Zhang, CIAE, China.
12 15 Exhibition: Brief Opening Ceremony for the Exhibition in the Macleay Room 2by Dr Max Brennan, General Chairman
12.30-13.30 Buffet Lunch - Macleay Room 213.30-15.30 Three Parallel Technical Sessions, Session A in the Belvedere Room,
Session B in the Bayswater Room, and Session C in the Kellett 1/2 Rooms.
Session A. Medicine - Production of Mo-99 and Other Radioisotopesin Reactors & Cyclotrons - Belvedere Room
Chairpersons - Dr H.Gerstenberg, Germany, and Mr K.R.Horlock, Australia
13.30 Paper 5/5 "Improved Production of Mo-99 at ANSTO"by K.Dadachova, K.LaRiviere, and P.Anderson, ANSTO, Australia
13.50 Paper 6/187A "Production of Mo-99 in Research Reactors with the Use of U Target andMo-98 Target"by A.S.Gerasimov and G.V. Kiselev, ITEP, Moscow, Russia
14.10 Paper 7/177 "Universal Methods of Irradiating Target Materials in High CurrentRadioisotope Production"by N.R. Stevenson, TRIUMF, Vancouver, Canada
14.30 Paper 8/142 "Radiopharmaceuticals in Positron Emission Tomography: RadioisotopeProduction and Radiolabelling Procedures at the Austin & RepatriationMedical Centre, Melbourne"by H.J.Tochon-Danguy, J.I.Sachinidis, J.G.Chan and M.Cook, Centre forPET, Austin & Repatriation Medical Centre, Melbourne, Australia
(viii)
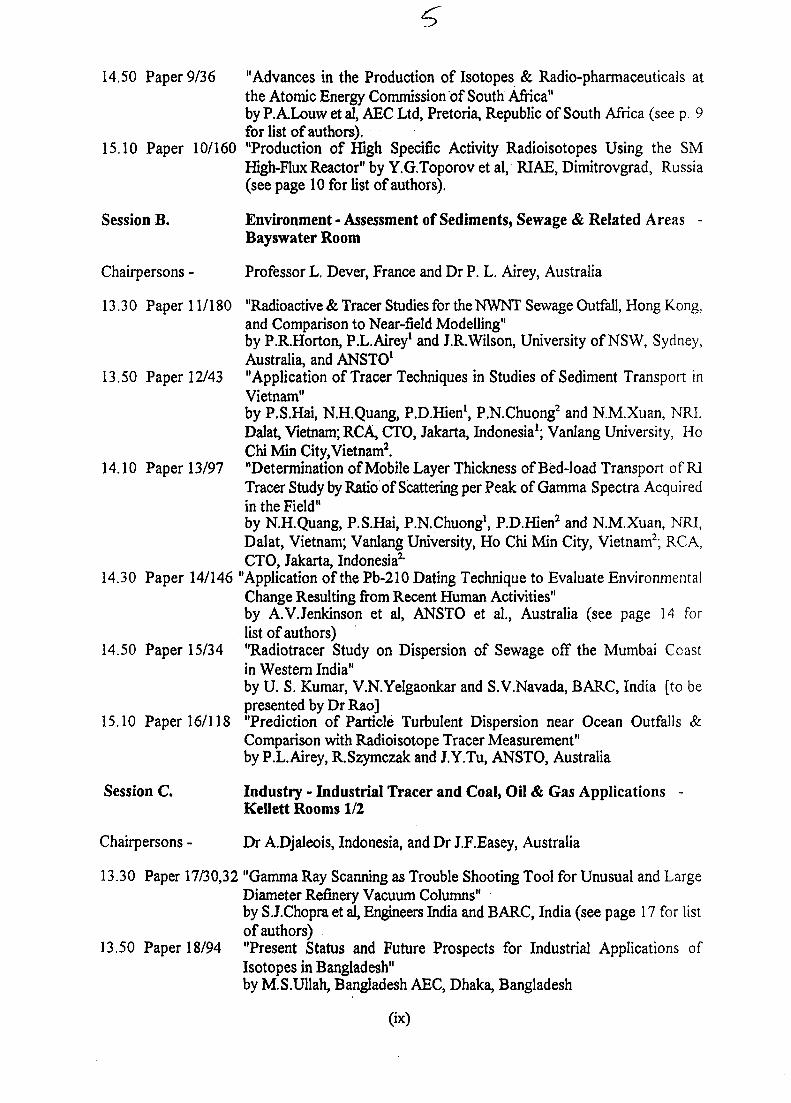
14.50 Paper 9/36 "Advances in the Production of Isotopes & Radio-pharmaceuticals atthe Atomic Energy Commission of South Africa"by P.ALouw et al, AEC Ltd, Pretoria, Republic of South Africa (see p. 9for list of authors).
15.10 Paper 10/160 "Production of High Specific Activity Radioisotopes Using the SMHigh-Flux Reactor" by Y.G.Toporov et al, RIAE, Dimitrovgrad, Russia(see page 10 for list of authors).
Session B. Environment - Assessment of Sediments, Sewage & Related Areas -
Bayswater Room
Chairpersons - Professor L. Dever, France and Dr P. L. Airey, Australia
13.30 Paper 11/180 "Radioactive & Tracer Studies for the NWNT Sewage Outfall, Hong Kong,and Comparison to Near-field Modelling"by P.R.Horton, P.L.Airey1 and J.R.Wilson, University of NSW, Sydney,Australia, and ANSTO1
13.50 Paper 12/43 "Application of Tracer Techniques in Studies of Sediment Transport inVietnam"by P.S.Hai, N.H.Quang, P.D.Hien1, P.N.Chuong2 and N.M.Xuan, NRI,Dalat, Vietnam; RCA, CTO, Jakarta, Indonesia1; Vanlang University, HoChi Min City, Vietnam2.
14.10 Paper 13/97 "Determination of Mobile Layer Thickness of Bed-load Transport of RITracer Study by Ratio of Scattering per Peak of Gamma Spectra Acquiredin the Field"by N.H.Quang, P.S.Hai, P.N.Chuong1, P.D.Hien2 and N.M.Xuan, NRI,Dalat, Vietnam; Vanlang University, Ho Chi Min City, Vietnam2; RCA,CTO, Jakarta, Indonesia2-
14.30 Paper 14/146 "Application of the Pb-210 Dating Technique to Evaluate EnvironmentalChange Resulting from Recent Human Activities"by A.V.Jenkinson et al, ANSTO et al., Australia (see page 14 forlist of authors)
14.50 Paper 15/34 "Radiotracer Study on Dispersion of Sewage off the Mumbai Coastin Western India"by U. S. Kumar, V.N.Yelgaonkar and S.V.Navada, BARC, India [to bepresented by Dr Rao]
15.10 Paper 16/118 "Prediction of Particle Turbulent Dispersion near Ocean Outfalls &Comparison with Radioisotope Tracer Measurement"by P.L. Airey, R. Szymczak and J. Y.Tu, ANSTO, Australia
Session C. Industry - Industrial Tracer and Coal, Oil & Gas Applications -
Kellett Rooms 1/2
Chairpersons - Dr A.Djaleois, Indonesia, and Dr J.F.Easey, Australia
13.30 Paper 17/30,32 "Gamma Ray Scanning as Trouble Shooting Tool for Unusual and LargeDiameter Refinery Vacuum Columns"by S.J.Chopra et al, Engineers India and BARC, India (see page 17 for listof authors)
13.50 Paper 18/94 "Present Status and Future Prospects for Industrial Applications ofIsotopes in Bangladesh"by M.S.Ullah, Bangladesh AEC, Dhaka, Bangladesh
(ix)
14.10 Paper 19/91 "A Multi-phase Flowmeter for the On-line Determination of the Flowratesof Oil, Water and Gas"by G.J. Roach and J.S.Watt, CSIRO, Menai, Australia
14.30 Paper 20/128 "Application of Isotope Tracers in Well-to-Well Tracing Studies ofChina Oil Fields - State of the Art"by Zhang Peixin, CIAE, Beijing, China
14.50 Paper 21/90 "On Conveyor Belt Determination of Ash in Coal"by B.D. Sowerby, C.S.Lim, D.A.Abemathy, Y.Liu and P.A.Maguire,CSIRO, Menai, Australia
15.10 Paper 22/119 "Radioisotope Applications on Fluidised Catalytic Cracking Units"by J. S. Charlton, Tracerco, Menai, Australia
1530-1600 Tea/Coffee Break - Macleay Room 2
1600-1740 Three Parallel Technical Sessions
Session A. Medicine - Preparation of Radiopharmaceuticals - Belvedere Room
Chairpersons - Professor J. Zhang, China, and Mr E.McKay, Australia16.00 Paper 23/16 "Australian Manufacture of Quadramet ™(Samarium-153 EDTMP)"
by N.RWood and J.Whitwell, ANSTO, Menai, Australia16.20 Paper 24/88 "Microspheres Labelled with Short-living Isotopes: Development and
Application for Tumors Treatment (Experimental Study)"by R.A.Rosiev et al, Medical Radiological Research Centre, Obninsk,Russia (see page 24 for list of authors).
16.40 Paper 25/29 "Labelling of Aminomethylenephosphonate Derivatives with GeneratorProduced Re-188 & their Stability"by K.Hashimoto, JAERI, Tokyo
17.00 Paper 26/2 "The Study on Preparation of Re-188 Rhenium Hepatasulphide"Poster by B.T. Hsieh et al, INER, Taiwan (see page 26 for list of authors).
17.10 Paper 27/79 "Direct Re-188 Labelling of Anti-cervical Carcinoma MonoclonalPoster Antibody MAb Cx99"
by T-W.Lee et al, INER, Taiwan, China (see page 27 for list of authors).
Session B. Environment-Assessment of Pollution of Air, Water & Soil -
Bayswater Room
Chairpersons - Professor A. Chatt, Canada, and Dr S.M.Rao, India
16.00 Paper 28/110 "Application of X-ray Emission Technique for Monitoring EnvironmentalPollution"by P.R.Danesi et al., IAEA, Seibersdorf, Austria (see p. 28 for listedauthors)
16.20 Paper 29/115 "Environmental Trace Analysis by Means of Supersensitive GC-IMS"by Dr J.Leonhardt, IUT, Berlin, Germany
16.40 Paper 30/174 "An Isotopic Study of Nitrate Pollution of Groundwater in Victoria,Australia"by A.Changkakoti et al., Univ. of Melbourne, Australia (see p. 30 for listof authors)
17.00 Paper 31/113 "Radioecological Behaviour of Elementary Tritium, especially DryDeposition and its Dependence on Soil Porosity"by H.Forstel, Forschungszentrum Julich, Germany
17.20 Paper 32/136 "Elemental Concentration of the Suspended Particulate Matter in the Airof Tehran"1
by MSohrabpour et al., Gamma Irradiation Centre, Tehran, Iran (see p. 32for list of authors).
Session C. Industry - Applications in Borehole Logging - Kellett Rooms 1/2
Chairpersons - Dr S.J.Chopra, India, and Dr P.L.Airey, Australia
16.00 Paper 33/109 "Nuclear Borehole Logging Techniques Developed by CSIRO -Evaluation and Mining for In-situ Evaluation of Coal & MineralDeposits"by M. Borsaru and J. Charbucinski, CSIRO, Kenmore, Australia
16.20 Paper 34/134 "A New Chlorine Logging Tool: Applications in Oilfield Development"by Mr He Qing-Yuan et al., Jianghan Well Logging Institute, China (seep. 34 for list of authors).
16.40 Paper 35/152 "A Radioactive Water Hold-up Densitometer for Oil Well ProductionLogging"by Zheng Hua, China National Petroleum Corp., Daqing, China
TUESDAY, 14 OCTOBER
0900-1030 Plenary Session - Belvedere Room
Chairman: Dr N.R.McDonald, President ANA, Australia
09.00 Paper 36/178 Introducing General Applications"Development & Application of Isotopes and Radiation Technology inIndonesia"by A.Djaloeis, BATAN, Indonesia
09.30 Paper 37/33 Introducing Environmental Applications"Environmental Isotope Studies on Groundwater Problems in the TharDesert, India"by A.R.Nair, S.V.Navada and S.M.Rao, BARC, Trombay, India
10.00 Paper 38/166 Introducing Industrial Applications"Nuclide Products Manufacture in Russia and Prospects of itsDevelopment"by S.B. Makarovsky et al., TENEX, Moscow, Russia(for list of authors see page 38).
1030-11.00 Tea/Coffee Break - Macleay Room 211.00-1240 Three Parallel Technical Sessions
Session A. Medicine/Industry - Reactors & Other Facilities for IsotopeProduction - Belvedere Room
Chairpersons - Mr S.B.Makarovsky, Russia, and Mr N.Wood, Australia
11.00 Paper 39/173 "Spallation Production of Neutron Deficient Radioisotopes in NorthAmerica"by D.J.Jamriska, E.RJPatterson anf ICarty1, LANL, Los Alamos, USAand USDOE, Germantown, USA1.
11.20 Paper 40/181,182 "REVISS/MAYAK: A New Partnership in Radioisotope Supply"byN. Bennett, REVISS Services, UK, and AJ.Chiksov and Y.A.Malykh,MAYAK Production Association, Ozyorsk, Russia.
(xi)
11.40 Paper 41/188 "Russian ElectroKhirnPribor Integrated Plant - Producer and Supplier ofPage 41 Enriched Stable Isotopes"
by A.N.Tatarinov and LAXesnoy, EKPIP, Lesnoy, Russia12.00 Paper 42/187B "New Design Targets & Automated Technology for the Production
Page 42 of Radionuclides with High Specific Radioactivity in Nuclear ResearchReactors" ••'•'•'•by A.S.Gerasimov and G.V.Kiselev, ITEP, Moscow, Russia
12.20 Paper 43/162 "GloveboxProcessihg Techniques for Ci Quantities of Reactor-ProducedPage 43 Beta-Emitters", v-
by M.S.Evaris-Blumer, L.M.Ayers, G.J.Ehrhardt and A.R.Ketring,University of Missouri; Columbia, USA
Session B. Environment - Groundwater and Catchment Studies (I) -Bayswater Room
Chairpersons - Dr H.Forstel, Germany, and Dr C. Tuniz, Australia
11.00 Paper 44/6 "Groundwater Origin & Evolution from Dissolved Helium Isotopes" byPage 44 Y. Mahara et al., CRJJEPI and Kyoto Univ., Japan (for list of authors see
p.44)11.20 Paper 45/58 "The Investigation of Cs-137 Migration by Groundwater at Chernobyl"
Page 45 by A.L.Kononovich et al.,' Russia/Ukraine (for list of authors andorganisations see p. 45).•<•• !
11.40 Paper 46/156 "Historical Changes of the Anthropomorphic Impact in a CoastalPage 46 Catchment: Geochemical & Lead Isotope Constraints"
byM.Labonne, D.Ben Othman and J-M. Luck, Univ. Montpellier, France12.00 Paper 47/155,157 "Geochemistry, Water Dynamics and Metals: Major, Trace elements,
Page 47 Pb and Sr Isotope constraints on their Origins and Movements in a smallAnthropized Catchment over a Flood"by J-M. Luck and D.Ben Othman, Univ. Montpellier, France
12.20 Paper 48/77 "Isotope Studies on Mechanism of Groundwater Recharge to an AlluvialPage 48 Aquifer in Gatton, Queensland"
by J.K.Dharmasiri, L.Morawska and J.Hillier1, QUT, Queensland, andQldDept. of Natural Resources, Indooroopilly, Qld1..
12.30 Paper 49/28 "Comparison of Groundwater Residence Time Using Isotopes TechniquesPoster & Numerical Groundwater Flow Model in Gneissic Terrain, Korea"Page 49 by D.S.Bae et al., Korea (for list of authors and organisations see p.49).
Session C. Research - Analytical, QC and Other Applications - Kellett Rooms 1/2
Chairpersons - Dr P.RDanesi, IAEA, and Mr R.J. Alsop, Australia
11.00 Paper 5 0/46 "Determination of Radon in Groundwater Using Water Soluble ScintillationPage 50 Cocktail"
by K.Hasegawa and A.Ohno, Shizuoka Univ, Japan11.20 Paper 51/172 "Determination of Iodine in Biological Materials Using Instrumental
Page 51 Neutron Activation and Anti-Coincidence Gamma Ray Spectroscopy"by W.HiZhang and A. Chatt, Dalhousie Univ, Canada
11.40 Paper 52/114 "Improved Quality Control of Carbon-14 Labelled Compounds"Page 52 by J.W.Leonhardt, IUT, Berlin, Germany
12.00 Paper 53/125 "Proposal of a l^pyel Method of Continuous Monitoring of Possible FuelPage 53 Failure of a Pool Type Reactor"
by K.Sasaki, SAHayashi and T.Matsuura, Rikkyo University, Japan
(xii)
12.20 Paper 54/52 "Speciation of Aquatic Mercury Hg 2+ in Humic Substances by TimePage 54 Differential Perturbed Angular Correlation"
by K.Franke, H.Kupsch, W.Troeger and T.Butz, University of Leipzig,Germany
1240-13 3 0 Buffet Lunch - Macleay Room 21330-1530 Three Parallel Technical Sessions
Session A. Medicine/Industry - Reactors & Other Facilities for Isotope
Production - Belvedere Room
Chairpersons - Dr G. V.Kiselev, Russia, and Dr P.Louw, South Africa
13.30 Paper 55/21 "FRMH: A New Reactor also for Isotope Production"Page 55 byHGerstenberg and W.Waschkowski, ZBE FRM-II, Garching, Germany
13.50 Paper 56/168 "Extractive Y-90 Generator"Page 56 by G.E.Kodina1, G.V.Korpusov and A.T.Filyanin, Instituteof Biophysics1
and Institute of Physical Chemistry, Moscow, Russia14.10 Paper 57/41 "A New Radioisotope Facility for Thailand"
Page 57 by K.R.Horlock, ANSTO, Menai, Australia14.30 Paper 58/111 "Highly Enriched Stable & Actinide Isotopes for Scientific Investigation
Page 58 in the Russian Federal Nuclear Centre, Arzamas-16"by S.P.Vesnovskii andP.F.Shulzenko, Arzamas-16, Russia
14.50 Paper 59/161 "Reactor-Produced Radionuclides at the University of Missouri ResearchPage 59 Reactor"
by A. R. Ketring, M.S.Evans-Blumer and G.J.Ehrhardt, University ofMissouri, Columbia, USA
15.10 Paper 60/159 "Ir-192 Production Using Consecutive Irradiation in MER and SMPage 60 Reactors"
by V.ATarasov and Y.G.Toporov, Research Institute of Atomic Reactors,Dimitrovgrad, Russia
Session B. Environment - Groundwater Studies (II) including Applications ofRadium, Radon and Other Studies - Bayswater Room
Chairpersons - Dr J-M.Luck, France, and Dr J.Leonhardt, Germany
13.30 Paper 61/176 "Ra-226 Measurements by Thermal Ionisation Mass Spectrometry:Page 61 Use of Ra-226 and C-14 for Groundwater Dating"
by L.Dever, Univ. Paris-Sud, France, and C.Hillaire-Marcel, Univ.Quebec,Montreal, Canada
13.50 Paper 62/10 "Determination of Rn-222 in Water Samples from Well and Springs inPage 62 Tokyo by a Modified Integral Counting Method"
by Y.Homma et al., Kyoritsu College of Pharmacy, Japan (for authors seepage 62)
14.10 Paper 63/87 "Determination of Rn-222 in Groundwater"Page 63 by K.Freyer et al, UFZ, Leipzig, Germany (for list of authors see page 63)
14.30 Paper 64/68 "The Peculiarity of the Contamination's Behaviour in Water in thePage 64 Chernobyl Region"
by A.L.Kononovich et al., Russia/Ukraine (for list of authors andorganisations see page 64).
(xiii)
10
14.50 Paper 65/145 "Effect of Duration of Exposure to RaCl2 and a Radium Apatite fromPage 65 Freshwater Mussels on Intestinal Transport and Bone Deposition of
Radium"by ILU.Domel and A.M.Beal1, ANSTO, Menai, Australia, and UniversityNSW, Sydney, Australia1.
Session C. Radiation - Safety, Processing and Modelling - Kellett Rooms 1/2
Chairpersons - Dr C.Mori, Japan, and Mr RJ.Alsop, Australia
13.30 Paper 66/31 "Radiation Safety Aspects of Applications of Isotopes for IndustrialPage 66 Radiography in Bangladesh"
by D. Bakht, Titas Gas Co., Dhaka, Bangladesh13.50 Paper 67/124 "Towards Radiation Literacy - A Criticism of ICRP Recommendations"
Page 61 by T. Matsuura, Radiation Education Forum, Tokyo, Japan14.10 Paper 68/140 "Important Radiation Protection Aspects ofthe Operation of a Commercial
Page 68 Medical Cyclotron"by B. Mukherjee, ANSTO, Menai, Australia
14.30 Paper 69/35 "Radiation Processing for Environmentally Friendly IndustrialPage 69 Applications"
by A.B.Magali and S. Sabharwal., BARC, Trombay, India(presented by S.M.Rao, BARC, India)
14.50 Paper 70/184 "The Design and Application of a Radiological Consequence Model forPage 70 Tropical & Subtropical Regions"
by R.U. Domel, F.F.Harris and J.Crawford, ANSTO, Menai, Australia15.10 Paper 71/95 "Secondary UV Radiation from Biota as a Proof of Radiation Hormesis
Paper 71 and Gurwitsch Phenomena"by W. Goraczko, Technical University, Poznan, Poland
1530-1600 Tea/Coffee Break - MacleayRoom 2
1600-1720 Three Parallel Technical Sessions
Session A. Industry - Other Industrial Applications - Belvedere Room
Chairpersons - Professor Lin Quiangfong, China, and Dr J.S.Charlton, Australia
16.00 Paper 72/89 "On-line Bulk Analysis of Hot Reduced Iron Ore"Page 72 by C.S.Lim, B.D.Sowerby and S.Rainey, CSIRO, Menai, Australia
16.20 Paper 73/116 "Combining Computational Modelling with Radioisotope TechnologyPage 73 for a More Cost-effective and Time-efficient Method of Solving Industrial
and Medical Diagnostic Problems "by J.Y.Tu, J.F.Easey, ANSTO, Menai, Australia, and W.M.Burch,Australian National University, Canberra, Australia
16.40 Paper 74/121 "The Co-60 Container Scanner"Page 75 by A. Jigang et al., INET, Tsinghua Univ, China
(for list of authors see p. 75).17.00 Paper 75/108 "Investigations ofthe Influence of HJOJ and NaF on the Corrosion
Page 76 of Valve Metals and Steel in Systems of Practical Importance byUse of Radioisotopes"by G.Marx, C.Nehm, M.Laske and AKupfer, Free Univ., Berlin, Germany
(xiv)
(I
Session B. Environment - Accelerator Mass Spectrometry and a NewAccelerator Facility - Bayswater Room
Chairpersons - Dr N. Stevenson, Canada, and Dr R.B.Gammon, Australia
16.00 Paper 76/151 "The ANTARES Accelerator: A Facility for Environmental MonitoringPage 77 and Materials Characterisation"
by C.Tuniz, ANSTO, Menai, Australia16.20 Paper 77/195 "Biomedical Applications of AMS at ANU"
Page 78 M. L. di Tada et al., ANU, Australia, and University of Manchester, UK(for list of authors see p. 78).
16.40 Paper 78/190 "Applications of Cosmogenic Radioisotopes, Be-10, Al-26 and Cl-36 in thePage 79 Earth Sciences Using AMS at ANSTO"
by D. Fink and G. Elliot, ANSTO, Menai, Australia17.00 Paper 79/187D "ITEP ElectroNuclear Neutron & Proton Facility"
Page 80 by O.V.Shvedov et al, ITEP, Moscow, Russia (for list of authors see p.80; presented by G.V. Kiselev)
Session C. Research - Seminar on Isotopic Labelling with Tritium and HandlingTritium Waste - Kellett Rooms 1/2
Leader - Dr P. G. Williams, Lawrence Berkeley National Laboratory, Berkeley, USACo-chairman - Professor M. Long, University of NSW, Australia
16.00 Paper 80/135 "Exploration of New Tritium Labelling Methods"Page 81 by P.G.Williams, Lawrence Berkeley National Laboratory, Berkeley, USA
16.40 Paper 81/175 "Sodium Acetoxyborotritide: Its Preparation & Use"Page 82 by H. Morimoto et al, Lawrence Berkeley National Laboratory, Berkeley,
USA, and University of Kentucky, Lexington, USA (for authors see p. 82)16.20 Paper 82/196 "Tritium Nuclear Magnetic Resonance - An Update"
Page 83 by P.G.Williams, Lawrence Berkeley National Laboratory, Berkeley, USA16.40 Paper 83/197 "Tritiated Mixed Waste: How can we deal with it?"
Page 84 by C.Than et al., Lawrence Berkeley National Laboratory, Berkeley, USA(presented by P.G.Williams)
17.00- 17.20 Discussion
WEDNESDAY, 15 OCTOBER
09.00-10.30 Plenary Session - Belvedere Room
Chairman: Dr N.R.McDonald, President, ANA
09.00 Paper 84/98 Introducing Nuclear MedicinePage 85 "Radiopharmaceuticals to Monitor the Expression of Transferred Genes
in Gene Transfer Therapy"by L.LWiebe, University of Alberta, Canada
09.30 Paper 85/187 Introducing Industrial ApplicationsPage 86 "New Heavy Water Research Reactors with Capacities of 25 and lOOMWt
for Production of Radionuclides with High Specific Activity"by G. V. Kiselev et al, ITEP, Moscow, Russia (for list of authors see p. 86)
10.00 Paper 86/198 Introducing General ApplicationsPage 87 "Current Status and Trends of Cooperation on Radiotracer and NCS
Technologies"by J.Thereska, IAEA, Vienna, Austria
(xv)
10.30-11.0011.00-12.40
Session A.
Chairpersons -
11.00 Paper 87/38Page 88
11.20 Paper 88/42Page 89
11.40 Paper 89/51Page 90
12.00 Paper 90/153Page 91
Session B.
Chairpersons -
11.00 Paper 91/8Page 92
11.20 Paper 92/9Page 93
11.40 Paper 93/14Page 94
12.00 Paper 94/93Page 95
12.20 Paper 95/92PosterPage 96
Session C.
Chairpersons -
11.00 Paper 96/70Page 97
Tea/Coffee Break - Macleay Room 2Three Parallel Technical Sessions
Medicine-Applications of Radiopharmaceuticals - Belvedere Room
Professor L.I.Weibe, Canada, and Mr E.Hetherington, Australia
"Uptake and Retention of Pt-191 in Patients Undergoing Therapy with cis-Platin"by J. Areberg et al, Department of Radiation Physics, Uppsala, Sweden(for list of authors and organisations see p. 88)"Development of New Target Materials for Production of Tc-99mGenerators by Column Chromatography"by M.A.Rouf et al., INS&T, Dhaka, Bangladesh (for list of authors andorganisations see p. 89)"TDPAC - Studies of Macrocyclic Ag-Thio Crown Ethers: MolecularStability of Radiopharmaceuticals"by B.Ctortecka et al., University Leipzig, Germany (for list of authors andorganisations see p. 90)"Radiotracers for In-vivo PET Imaging of Acetylcholinesterase in
the Brain"by M.R.Kilbourn et al., University of Michigan, Ann Arbor, USA (for listofauthorsseep. 91)
Radiation - Development & Application of TechniquesBayswater Room
Mr D. Bahkt, Bangladesh, and Mr J.C.E.Button, Australia
"A New Optical Fibre Method for Neutron & Gamma Ray Flux DistributionMeasurements in Narrow Spaces"by C. Mori et al., Nagoya University, Japan (for list of authors andorganisations, see p. 92)"Highly Accurate Determination of Relative Gamma Ray DetectionEfficiency for Ge Detector and its Application"by H.Miyahara et al., Nagoya University, Japan (for list of authors andorganisations, see p. 93)"New Pulse Shape Analysis Method with Multi-shaping Amplifiers"by H. Sakai et al, Nagoya University, Japan (for list of authors andorganisations, see p. 94)"Computer Aided Design of Tunnel Diode Multivibrator Systems andGamma-Irradiation Effects"by FAS.Soliman et al., Nuclear Materials Authority, Cairo, Egypt (for listof authors and organisations, see p. 95)"Computer Aided Design Analysis & Operation of Schmitt TriggerRadiation Systems in Radiation Environment"
by F.A.S.Soliman, Nuclear Materials Authority, Cairo, Egypt
Research - Soil Science & Agriculture - Kellett Rooms 1/2
Dr M.S.Ullah, Bangladesh, and Dr C.J. Hardy, Australia"Research Achievements in Bangladesh Agriculture Using NuclearTechniques" by M.A.Sattar, Institute of Nuclear Agriculture, Bangladesh
(xvi)
11.20 Paper 97/19 "Studies on Competitive Sorption of Divalent Metal Ions to Natural SoilPage 98 Samples Using a Multi-Tracer Technique"
byRFujiyoshi, HLHirashima and S.Sawamura, Hokkaido University, Japan11.40 Paper 98/186 "Application of Oxygen & Carbon Isotopes as Evidence for Alteration in
Page 99 Carbonates"by M.A.Adabi and J. van Moort, Univ. Tasmania, Hobart, Australia
12.00 Paper 99/P4 "Application of Radioisotope Au-198 to Radiometrical Field Investigation(Poster, lOmin) of Spraying Machine"Page 101 by W. Goraczko, Technical University, Poznan, Poland
1230-1330 Buffet Lunch - Macleay Room 21330-1530 Two Parallel Technical Sessions
Session A. Medicine - Applications of Radiopharmaceuticals, etc (continued) -Belvedere Room
Chairpersons - Dr K.Hashimoto, Japan, and Professor B. Allen, Australia
13.30 Paper 100/99 "Imaging Tissue Hypoxia: Clinical and Pre-Clinical Experience withPage 102 123-IAZA"
by L.I.Wiebe, University of Alberta, Canada13.50 Paper 101/47 "QC Methods for Strontium Chloride, 89-SrCl2, Radiopharmaceutical for
Page 103 Palliative Treatment of Bone Metastases"by RMikolajczak et al, Radioisotope Centre POLATOM, Poland (for listof authors see page 103)
14.10 Paper 102/122 "Terbium-149, A Novel Alpha Emitter for Targetted Therapy ofPage 104 Melanoma and Leukaemia"
by S.Imam et al., St George Cancer Care Centre, Kogarah, Australia (forlist of authors and organisations, see page 104).
14.30 Paper 103/123 "Production & Separation of Terbium-149 for Targetted Cancer Therapy"Page 105 by S. Sarkar et al., The University of Sydney, Australia (for list of authors
and organisations, see page 105).14.50 Paper 104/196 "Applications of Radioisotopes in Industry and Healthcare in Vietnam"
Page 106 by N.HDien and N.H.Quang, NRI, Dalat, Vietnam15.10 Paper 105/81 "New Therapeutic Agent for Radiation Synovectomy - Preparation of
Page 107 Ho-166-EDTMP-HA Particle"by Hongsheng Bai et al., CIAE, China (for list of authors see page 107)
Session B. Other Industrial and Research Applications - Bayswater Room
Chairpersons - Dr J. Thereska, IAEA, and Dr B.D.Sowerby, Australia
B2. Industry
13.30 Paper 106/39 "Separation ofRare Earths and Transuranium Elements from Spent NuclearPage 108 Fuel Solution by High Performance Liquid Chromatography"
by S. Sarkar, University of Sydney, Australia, and A.Ohuchi, NipponNuclear Fuel Development Co., Oarai, Japan
13.50 Paper 107/139 "A Computerised Radioactive Effluent Monitoring System for a MedicalPage 109 Cyclotron Complex"
by B. Mukherjee, ANSTO, Menai, Australia14.10 Paper 108/61 "Development of Hydrogen Gauges with Small Neutron Source"
Page 110 by N. Tachikawa, I.Ishikawa and H.Tominaga, JAERI, Oarai, Japan
(xvii)
14.30 Paper 109/P6 "Radioisotopic Determination Methods of Sulphur Dispersion andPoster (10 min) Sulphur Blooming in Rubber Compounds"Page 111 by W. Goraczko, Technical University, Poznan, Poland
B3. Research
14.40 Paper 110/148 "C-13 Isotopic Studies of the Surface Catalysed Reactions of Methane"Page 112 by M. A.Long, S.J.X.He and M. Adebajo, University of NSW, Australia
15.00 Paper 111/103 "Excitation Functions of Deuteron Induced Nuclear Reactions onPage 113 Natural Mo up to 21 MeV: An Alternative Route for the Production of
Tc-94m, 99m and Mo-99"by M.Sonck et al., Free University of Brussels, Brussels, Belgium (for listof authors and organisations see page 113)
15.20 Paper 112/20 "Isotope Anomalies in Oxygen Isotope Exchange Equilibrium Systems"Poster by M.Kotaka, Tokyo Institute of Technology, Tokyo, Japan(10 min)Page 114
15.30 Paper 113/P5 "Application of l-(3,4-dimethylphenyl)-dodecanedione-l,2-dioximePoster (MFDDO) to Substoichiometric Extraction and Determination of(10 min) Nickel (JJ) by the Isotope Dilution Method"Page 115 by W. Goraczko, Technical University, Poznan, Poland
*****
16.00-16.10 CLOSE OF CONFERENCE by Dr Neil McDonald, President, ANA
*****
(xviii)
IS"
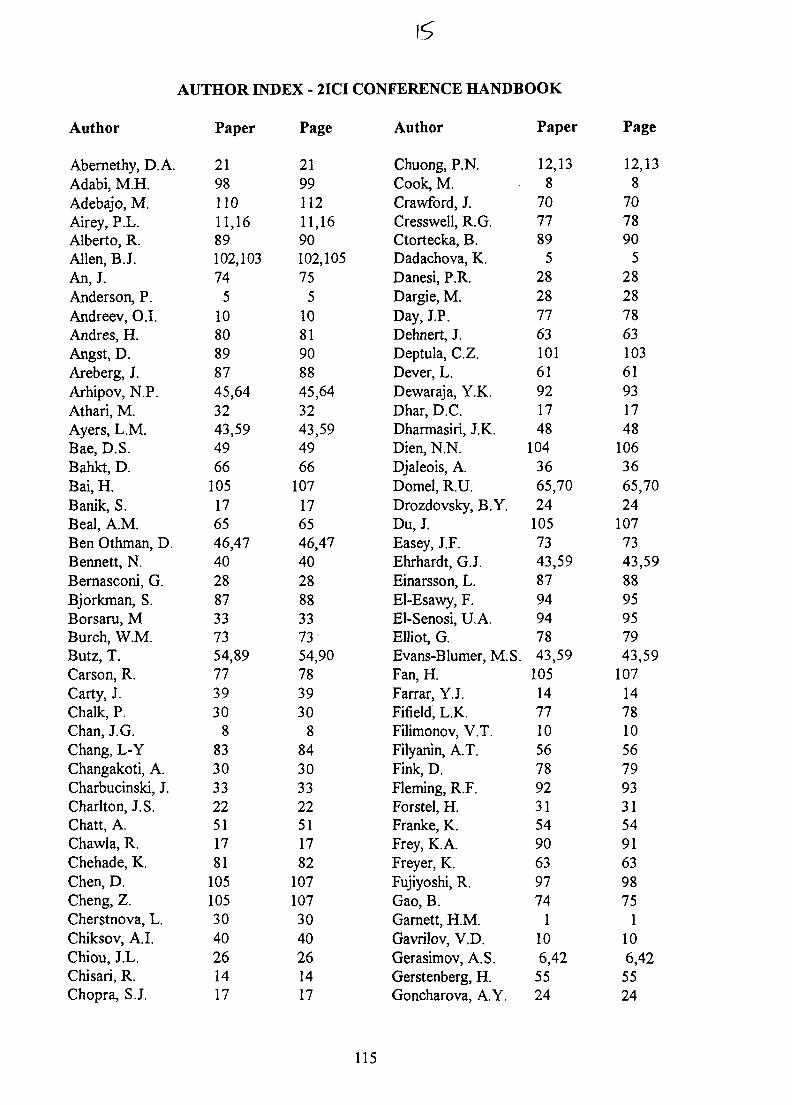
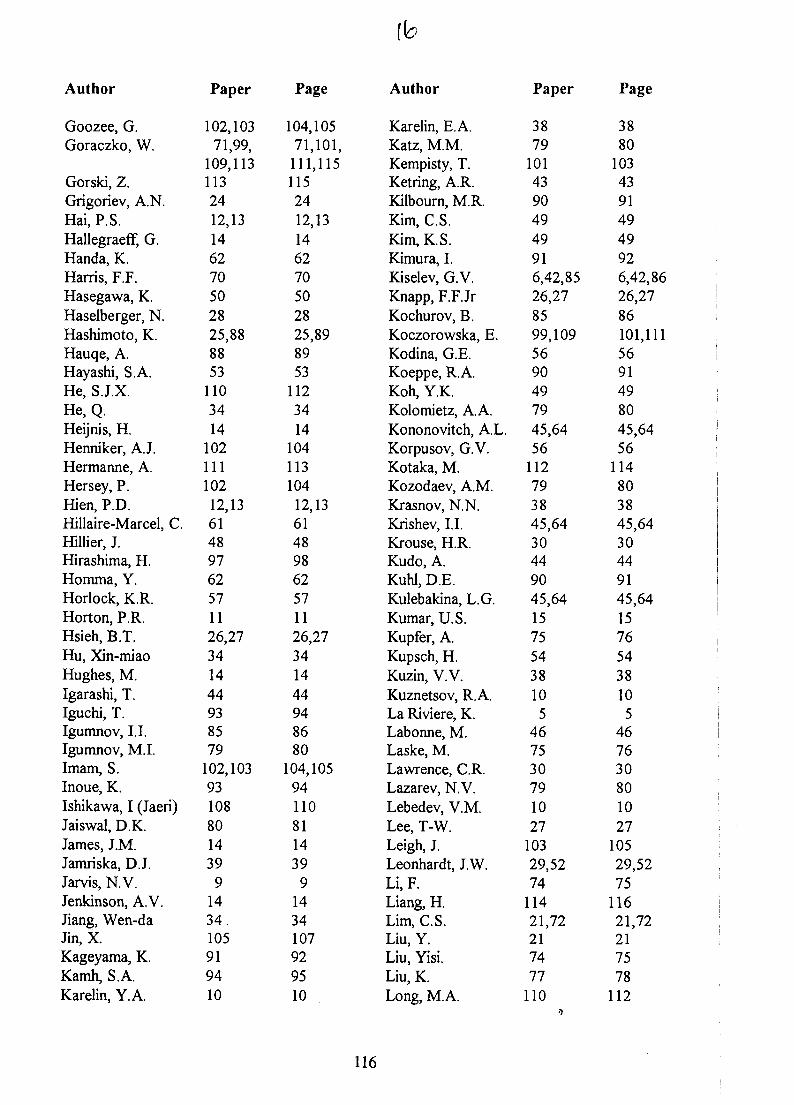
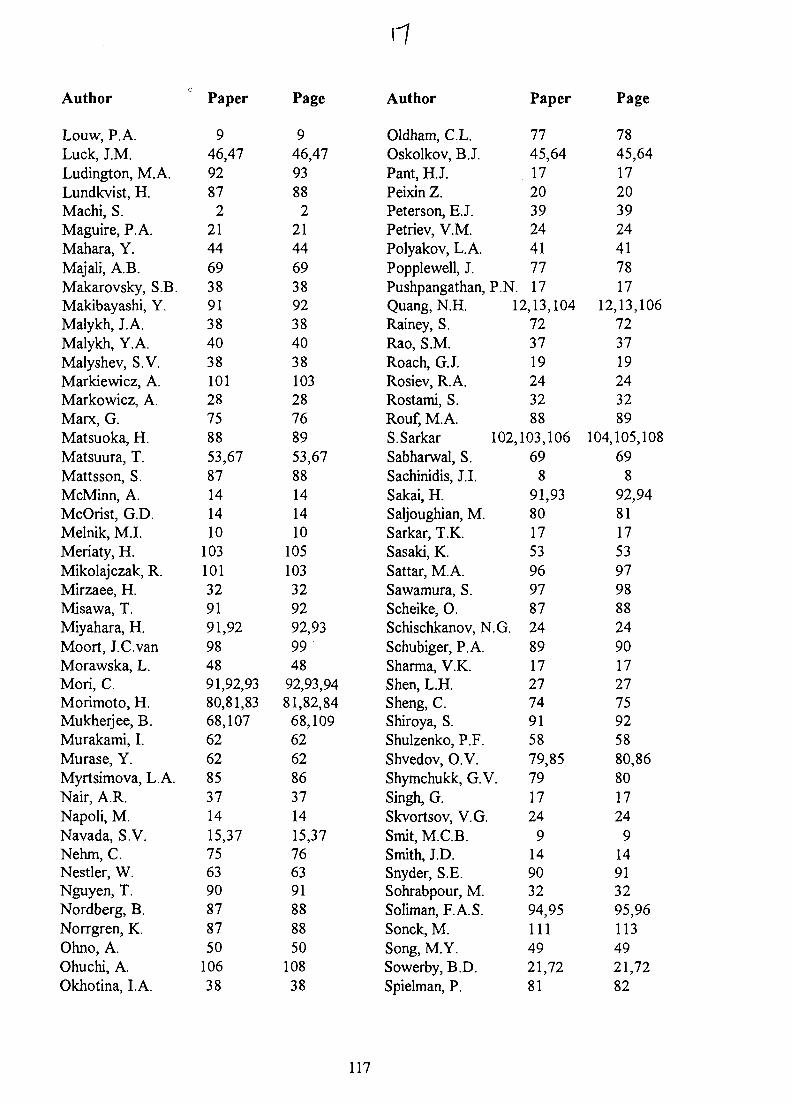
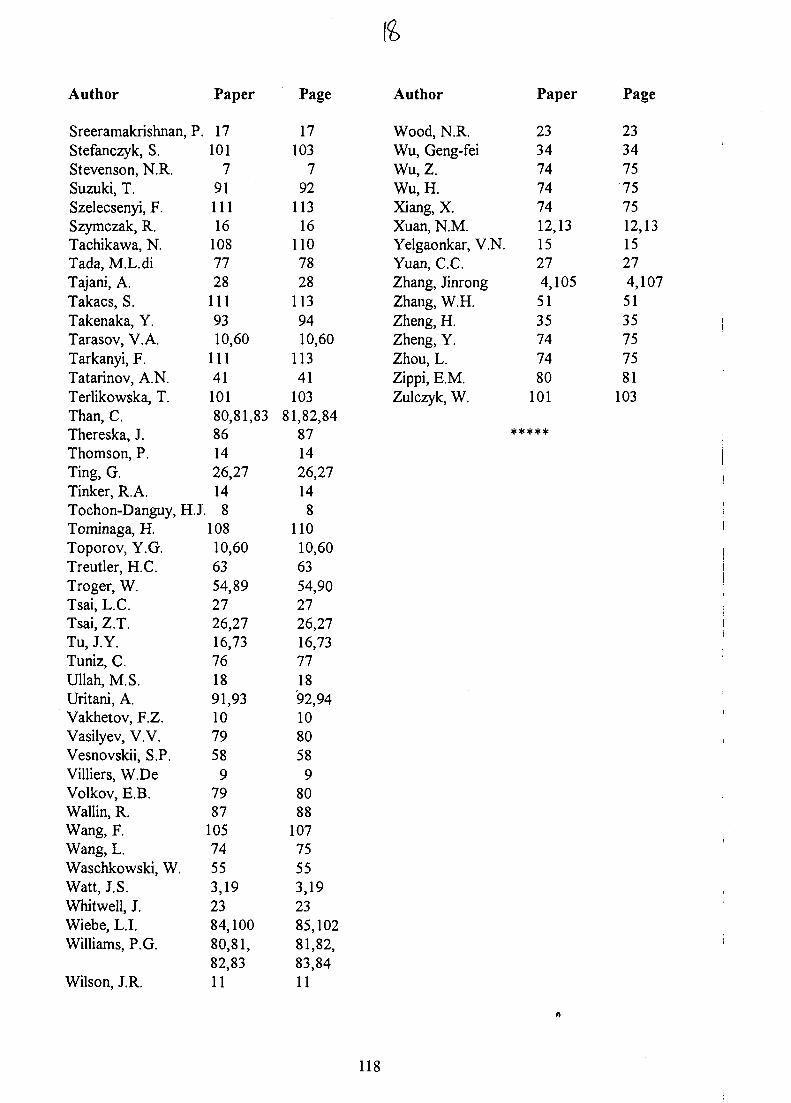
AUTHOR INDEX - 2ICI CONFERENCE HANDBOOK
Author Paper Page Author Paper Page
Abernethy, D.A.Adabi, M.H.Adebajo, M.Airey, P.L.Alberto, R.Allen, B.J.An,J.Anderson, P.Andreev, O.I.Andres, H.Angst, D.Areberg, J.Arhipov, N.P.Athari, M.Ayers, L.M.Bae, D.S.Bahkt, D.Bai, H.Banik, S.Beal, A.M.Ben Othman, D.Bennett, N.Bernasconi, G.Bjorkman, S.Borsaru, MBurch, W.M.Butz, T.Carson, R.Carty, J.Chalk, P.Chan, J.G.Chang, L-YChangakoti, A.Charbucinski, J.Charlton, J.S.Chatt, A.Chawla, R.Chehade, K.Chen, D.Cheng, Z.Cherstnova, L.Chiksov, A.I.Chiou, J.L.Chisari, R.Chopra, S.J.
219811011,1689102,10374
51080898745,643243,594966
105176546,47402887337354,89773930
883303322511781
1051053040261417
219911211,1690102,10575
51081908845,643243,594966
107176546,47402888337354,90783930
884303322511782
1071073040261417
Chuong, P.N.Cook, M.Crawford, J.Cresswell, R.G.Ctortecka, B.Dadachova, K.Danesi, P.R.Dargie, M.Day, I P .Dehnert, J.Deptula, C.Z.Dever, L.Dewaraja, Y.K.Dhar, D.C.Dharmasiri, J.K.Dien, N.N.Djaleois, A.Domel, R.U.Drozdovsky, B.Y.Du,J.Easey, J.F.Ehrhardt, G.J.Einarsson, L.El-Esawy, F.El-Senosi, U.A.Elliot, G.Evans-Blumer, M.S.Fan, H.Farrar, Y.J.Fifield, L.K.Filimonov, V.T.Filyanin, A.T.Fink, D.Fleming, R.F.Forstel, H.Franke, K.Frey, K.A.Freyer, K.Fujiyoshi, R.Gao, B.Garnett, H.M.Gavrilov, V.D.Gerasimov, A.S.Gerstenberg, H.Goncharova, A.Y.
12,138
707789
52828776310161921748
1043665,7024
1057343,598794947843,59
105147710567892315490639774
1106,425524
12,138
707890
52828786310361931748
1063665,7024
1077343,598895957943,59
107147810567993315491639875
1106,425524
115
Author Paper Page Author Paper Page
Goozee, G.Goraczko, W.
Gorski, Z.Grigoriev, A.N.Hai, P.S.Hallegraeff, G.Handa, K.Harris, F.F.Hasegawa, K.Haselberger, N.Hashimoto, K.Hauqe, A.Hayashi, S.A.He, SJ.X.He,Q.Heijnis, H.Henniker, A.J.Hermanne, A.Hersey, P.Hien, P.D.Hillaire-Marcel, C.Hillier, J.Hirashima, H.Homma, Y.Horlock, K.R.Horton, P.R.Hsieh, B.T.Hu, Xin-miaoHughes, M.Igarashi, T.Iguchi, T.Igumnov, I.I.Igumnov, M.I.Imam, S.Inoue, K.Ishikawa, I (Jaeri)Jaiswal, D.K.James, J.M.Jamriska, D.J.Jarvis, N.V.Jenkinson, A.V.Jiang, Wen-daJin, X.Kageyama, K.Kamh, S.A.Karelin, Y.A.
102,10371,99,
109,1131132412,13146270502825,888853
1103414
10211110212,1361489762571126,27341444938579
102,10393108801439
91434105919410
104,10571,101,
111,1151152412,13146270502825,898953
1123414
10411310412,1361489862571126,27341444948680
104,10594110811439
91434107929510
Karelin, E.A.Katz, M.M.Kempisty, T.Ketring, A.R.Kilbourn, M.R.Kim, C.S.Kim, K.S.Kimura, I.Kiselev, G.V.Knapp, F.F.JrKochurov, B.Koczorowska, E.Kodina, G.E.Koeppe, R.A.Koh, Y.K.Kolomietz, A. A.Kononovitch, A.L.Korpusov, G.V.Kotaka, M.Kozodaev, A.M.Krasnov, N.N.Krishev, I.I.Krouse, H.R.Kudo, A.Kuhl, D.E.Kulebakina, L.G.Kumar, U.S.Kupfer, A.Kupsch, H.Kuzin, V.V.Kuznetsov, R.A.La Riviere, K.Labonne, M.Laske, M.Lawrence, C.R.Lazarev, N.V.Lebedev, V.M.Lee, T-W.Leigh, J.Leonhardt, J.W.Li,F.Liang, H.Lim, C.S.Liu, Y.Liu, Yisi.Liu, K.Long, M.A.
3879
10143904949916,42,8526,278599,1095690497945,6456
112793845,6430449045,6415755438105
467530791027
10329,5274
11421,72217477
110
3880
10343914949926,42,86 ;26,2786101,1115691498045,6456
114803845,6430449145,6415765438105
467630801027
10529,5275
11621,72217578
112
116
Author Paper Page Author Paper Page
Louw, P.A.Luck, J.M.Ludington, M.A.Lundkvist, H.Machi, S.Maguire, P. A.Mahara, Y.Majali, A.B.Makarovsky, S.B.Makibayashi, Y.Malykh, J.A.Malykh, Y.A.Malyshev, S.V.Markiewicz, A.Markowicz, A.Marx, G.Matsuoka, H.Matsuura, T.Mattsson, S.McMinn, A.McOrist, G.D.Melnik, M.I.Meriaty, H.Mikolajczak, R.Mirzaee, H.Misawa, T.Miyahara, H.Moort, J.C.vanMorawska, L.Mori, C.Morimoto, H.Mukherjee, B.Murakami, I.Murase, Y.Myrtsimova, L.A.Nair, A.R.Napoli, M.Navada, S.V.Nehm, C.Nestler, W.Nguyen, T.Nordberg, B.Norrgren, K.Ohno, A.Ohuchi, A.Okhotina, LA.
946,479287
2214469389138403810128758853,6787141410
103101329191,92984891,92,9380,81,8368,107626285371415,37756390878750
10638
946,4793882
214469389238403810328768953,6788141410
105103329292,939948
92,93,9481,82,8468,109626286371415,37766391888850
10838
Oldham, C.L.Oskolkov, B.J.Pant, H.J.Peixin Z.Peterson, EJ.Petriev, V.M.Polyakov, L.A.Popplewell, J.Pushpangathan, P.ISQuang, N.H.Rainey, S.Rao, S.M.Roach, G.J.Rosiev, R.A.Rostami, S.Rouf, M.A.S.Sarkar 102Sabharwal, S.Sachinidis, J.I.Sakai, H.Saljoughian, M.Sarkar, T.K.Sasaki, K.Sattar, M.A.Sawamura, S.Scheike, O.Schischkanov, N.G.Schubiger, P. A.Sharma, V.K.Shen, L.H.Sheng, C.Shiroya, S.Shulzenko, P.F.Shvedov, O.V.Shymchukk, G.V.Singh, G.Skvortsov, V.G.Smit, M.C.B.Smith, J.D.Snyder, S.E.Sohrabpour, M.Soliman, F.A.S.Sonck, M.Song, M.Y.Sowerby, B.D.Spielman, P.
7745,64172039244177
r. n12,13,104
723719243288
1,103,10669
891,938017539697872489172774915879,85791724
914903294,951114921,7281
7845,6417203924417817
12,13,106723719243289
104,105,10869
892,948117539798882490172775925880,86801724
914913295,961134921,7282
117
Author
Sreeramakri shnan, PStefanczyk, S.Stevenson, N.R.Suzuki, T.Szelecsenyi, F.Szymczak, R.Tachikawa, N.Tada, M.L.diTajani, A.Takacs, S.Takenaka, Y.Tarasov, V.A.Tarkanyi, F.Tatarinov, A.N.Terlikowska, T.Than, C.Thereska, J.Thomson, P.Ting, G.Tinker, R.A.Tochon-Danguy, H.JTominaga, H.Toporov, Y.G.Treutler, H.C.Troger, W.Tsai, L.C.Tsai, Z.T.Tu, J.Y.Tuniz, C.Ullah, M.S.Uritani, A.Vakhetov, F.Z.Vasilyev, V.V.Vesnovskii, S.P.Villiers, W.DeVolkov, E.B.Wallin, R.Wang, F.Wang, L.Waschkowski, W.Watt, J.S.Whitwell, J.Wiebe, L.I.Williams, P.G.
Wilson. J.R.
Paper
17101
79111116
1087728
1119310,60
1114110180,81,83861426,2714
. 810810,606354,892726,2716,73761891,931079589
7987
10574553,192384,10080,81,82,8311
Page
17103
792
11316
1107828
1139410,60
11341
10381,82,84
871426,27148
11010,606354,902726,2716,73771892,94108058
98088
10775553,192385,10281,82,83,8411
Author
Wood, N.R.Wu, Geng-feiWu,Z.Wu,H.Xiang, X.Xuan, N.M.Yelgaonkar, V.N.Yuan, C.C.Zhang, JinrongZhang, W.H.Zheng, H.Zheng, Y.Zhou, L.Zippi, E.M.Zulczyk, W.
*
Paper
233474747412,1315274,1055135747480
101
****
Page
233475757512,1315274,1075135757581
103
118
AU9817305
OPENING ADDRESS - 2ICI
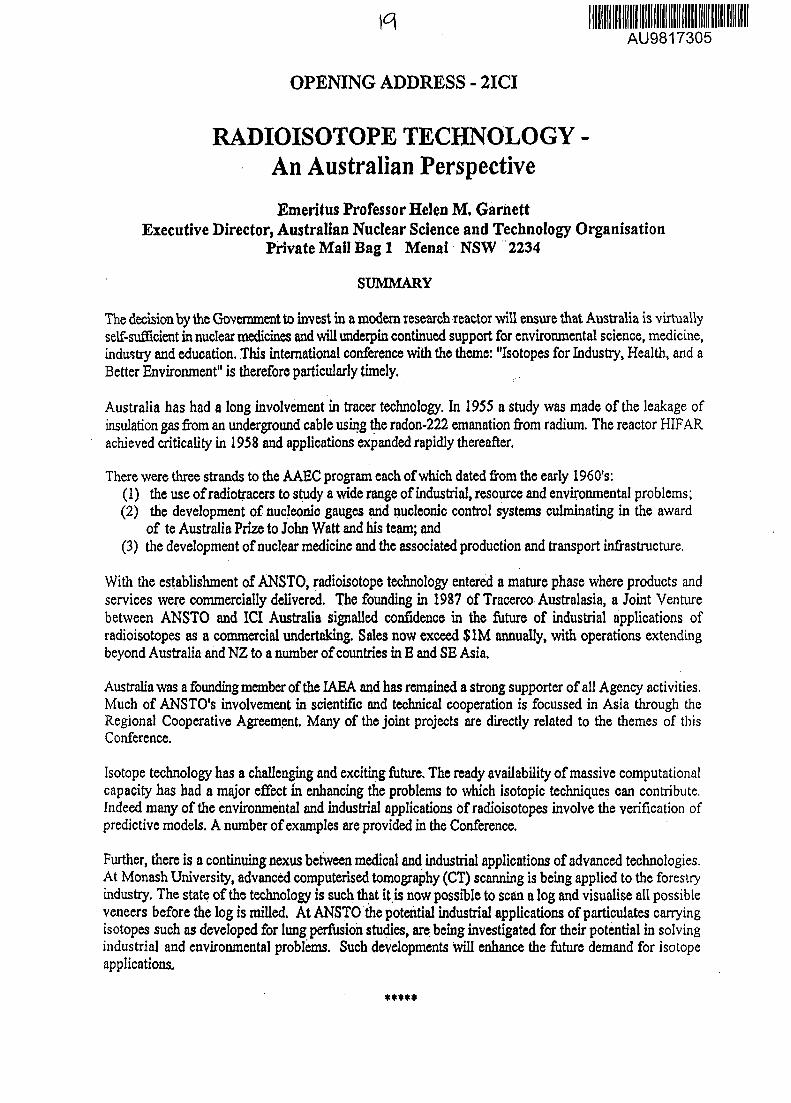
RADIOISOTOPE TECHNOLOGY -An Australian Perspective
Emeritus Professor Helen M. GarnettExecutive Director, Australian Nuclear Science and Technology Organisation
Private Mail Bag 1 Menai NSW 2234
SUMMARY
The decision by the Government to invest in a modern research reactor will ensure that Australia is virtuallyself-sufficient in nuclear medicines and will underpin continued support for environmental science, medicine,industry and education. This international conference with the theme: "Isotopes for Industry, Health, and aBetter Environment" is therefore particularly timely.
Australia has had a long involvement in tracer technology. In 1955 a study was made of the leakage ofinsulation gas from an underground cable using the radon-222 emanation from radium. The reactor HIFARachieved criticality in 1958 and applications expanded rapidly thereafter.
There were three strands to the AAEC program each of which dated from the early 1960's:(1) the use of radiotracers to study a wide range of industrial, resource and environmental problems;(2) the development of nucleonic gauges and nucleonic control systems culminating in the award
of te Australia Prize to John Watt and his team; and(3) the development of nuclear medicine and the associated production and transport infrastructure.
With the establishment of ANSTO, radioisotope technology entered a mature phase where products andservices were commercially delivered. The founding in 1987 of Tracerco Australasia, a Joint Venturebetween ANSTO and ICI Australia signalled confidence in the future of industrial applications ofradioisotopes as a commercial undertaking. Sales now exceed $1M annually, with operations extendingbeyond Australia and NZ to a number of countries in E and SE Asia.
Australia was a founding member of the IAEA and has remained a strong supporter of all Agency activities.Much of ANSTO's involvement in scientific and technical cooperation is focussed in Asia through theRegional Cooperative Agreement. Many of the joint projects are directly related to the themes of thisConference.
Isotope technology has a challenging and exciting future. The ready availability of massive computationalcapacity has had a major effect in enhancing the problems to which isotopic techniques can contribute.Indeed many of the environmental and industrial applications of radioisotopes involve the verification ofpredictive models. A number of examples are provided in the Conference.
Further, there is a continuing nexus between medical and industrial applications of advanced technologies.At Monash University, advanced computerised tomography (CT) scanning is being applied to the forestryindustry. The state of the technology is such that it.is now possible to scan a log and visualise all possibleveneers before the log is milled. At ANSTO the potential industrial applications of particulates carryingisotopes such as developed for lung perfusion studies, are being investigated for their potential in solvingindustrial and environmental problems. Such developments will enhance the future demand for isotopeapplications.
*****

AU9817306
Paper 2/194
Radiation and Isotope Technology for SustainableDevelopment and the Role of the IAEA
S MACHIDeputy Director General, International Atomic Energy Agency, Vienna
This paper illustrates developments in and prospects for the application of nuclear science andtechnology in the fields of food and agriculture, industry and environmental protection, inconnection with the IAEA's activities.
Food and Agriculture
Plant mutation and breeding for better productionOver the past 60 years, 1800 new mutant plant varieties induced by radiation have been releasedand are being grown on millions of hectares of land for their better yield, disease resistance andother desirable characteristics. Recently, the FAO/IAEA Joint Division, in collaboration withmember States, has developed a new variety of banana with better quality and yield in Malaysiaand a high yield variety of barley with resistance to climate stress in the high Andean plateaux ofPeru and Bolivia.
Food irradiation for reduction of losses and food-borne diseasesIrradiated foods are being sold increasingly on the commercial market in 30 countries, includingvarieties of commodities such as herbs, spices, potatoes, onions, garlic, frozen shrimp, etc.
Insect and pest control to reduce food lossesThe sterile insect technique (SIT) developed by using radiation has been successfully used againstmajor insect and pest hazards. In Chile the medfly has recently been eradicated by means of theSIT with the IAEA's technical support, yielding substantial economic and environmental benefits(of about US$400 million per year). The New World Screwworm fly was eradicated from Libyaunder an IAEA/FAO project in 1992. Eradiation of the Tsetse fly from the island of Zanzibar inTanzania is about to be achieved through an IAEA Technical Co-operation (TC) project.
Industry
Radiation processing for product improvementRadiation processing technology has been used for upgrading polymeric products, curing ofsurface coatings and sterilization of medical products. Through the RCA/UNDP projects of theIAEA, this technology has been introduced into developing Member States in South East Asia andon the Pacific rim. Electron accelerators as well as large Co-60 irradiators have increasingly beenused for industrial purpose.
Environmental protection
Cleaning of flue gases, sewage sludge and waste waterUnique technologies to simultaneously remove SO2 and NOX from flue gases by irradiation arebeing transferred to the Member States. The first industrial scale plants to clean flue gases emittedfrom coal burning power stations are presently being built in Poland under an IAEA project and inChina with IAEA technical support. With this technology, more than 90% of SO2 and 80% ofNOX can be removed from flue gases and agricultural fertilizer can be produced as a by-product.
AU9817307
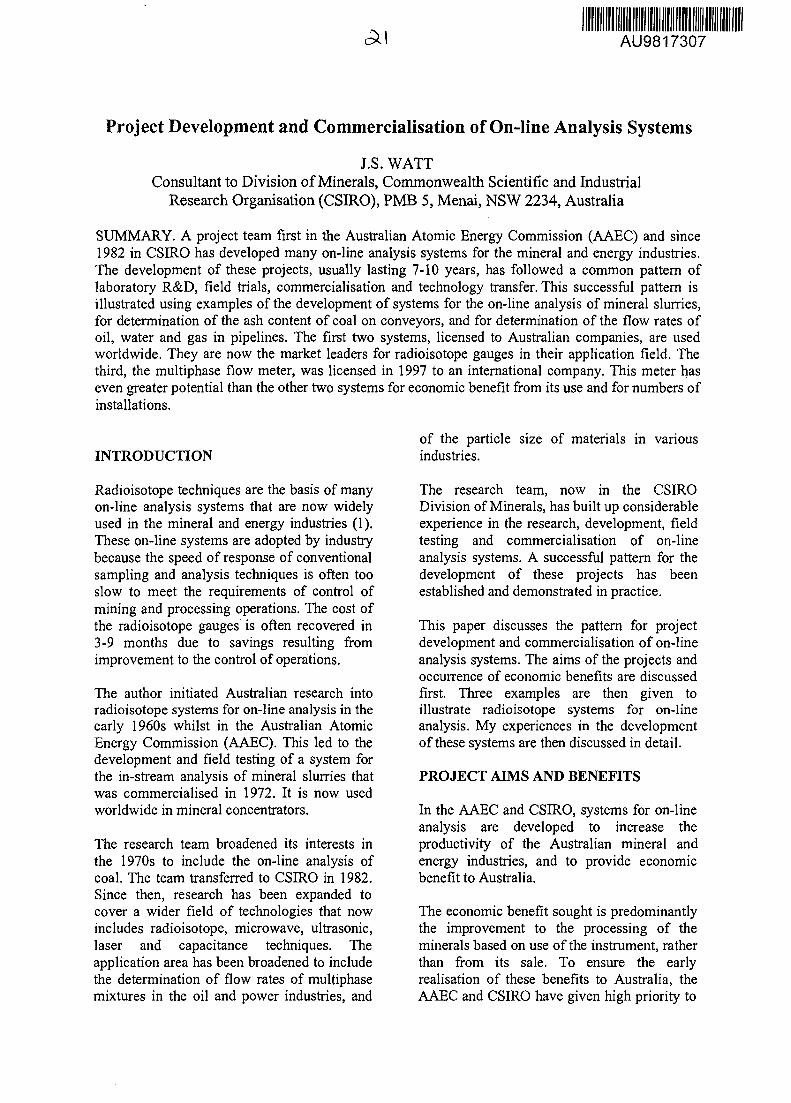
Project Development and Commercialisation of On-line Analysis Systems
J.S. WATTConsultant to Division of Minerals, Commonwealth Scientific and Industrial
Research Organisation (CSIRO), PMB 5, Menai, NSW 2234, Australia
SUMMARY. A project team first in the Australian Atomic Energy Commission (AAEC) and since1982 in CSIRO has developed many on-line analysis systems for the mineral and energy industries.The development of these projects, usually lasting 7-10 years, has followed a common pattern oflaboratory R&D, field trials, commercialisation and technology transfer. This successful pattern isillustrated using examples of the development of systems for the on-line analysis of mineral slurries,for determination of the ash content of coal on conveyors, and for determination of the flow rates ofoil, water and gas in pipelines. The first two systems, licensed to Australian companies, are usedworldwide. They are now the market leaders for radioisotope gauges in their application field. Thethird, the multiphase flow meter, was licensed in 1997 to an international company. This meter haseven greater potential than the other two systems for economic benefit from its use and for numbers ofinstallations.
INTRODUCTION
Radioisotope techniques are the basis of manyon-line analysis systems that are now widelyused in the mineral and energy industries (1).These on-line systems are adopted by industrybecause the speed of response of conventionalsampling and analysis techniques is often tooslow to meet the requirements of control ofmining and processing operations. The cost ofthe radioisotope gauges is often recovered in3-9 months due to savings resulting fromimprovement to the control of operations.
The author initiated Australian research intoradioisotope systems for on-line analysis in theearly 1960s whilst in the Australian AtomicEnergy Commission (AAEC). This led to thedevelopment and field testing of a system forthe in-stream analysis of mineral slurries thatwas commercialised in 1972. It is now usedworldwide in mineral concentrators.
The research team broadened its interests inthe 1970s to include the on-line analysis ofcoal. The team transferred to CSIRO in 1982.Since then, research has been expanded tocover a wider field of technologies that nowincludes radioisotope, microwave, ultrasonic,laser and capacitance techniques. Theapplication area has been broadened to includethe determination of flow rates of multiphasemixtures in the oil and power industries, and
of the particle size of materials in variousindustries.
The research team, now in the CSIRODivision of Minerals, has built up considerableexperience in the research, development, fieldtesting and commercialisation of on-lineanalysis systems. A successful pattern for thedevelopment of these projects has beenestablished and demonstrated in practice.
This paper discusses the pattern for projectdevelopment and commercialisation of on-lineanalysis systems. The aims of the projects andoccurrence of economic benefits are discussedfirst. Three examples are then given toillustrate radioisotope systems for on-lineanalysis. My experiences in the developmentof these systems are then discussed in detail.
PROJECT AIMS AND BENEFITS
In the AAEC and CSIRO, systems for on-lineanalysis are developed to increase theproductivity of the Australian mineral andenergy industries, and to provide economicbenefit to Australia.
The economic benefit sought is predominantlythe improvement to the processing of theminerals based on use of the instrument, ratherthan from its sale. To ensure the earlyrealisation of these benefits to Australia, theAAEC and CSIRO have given high priority to
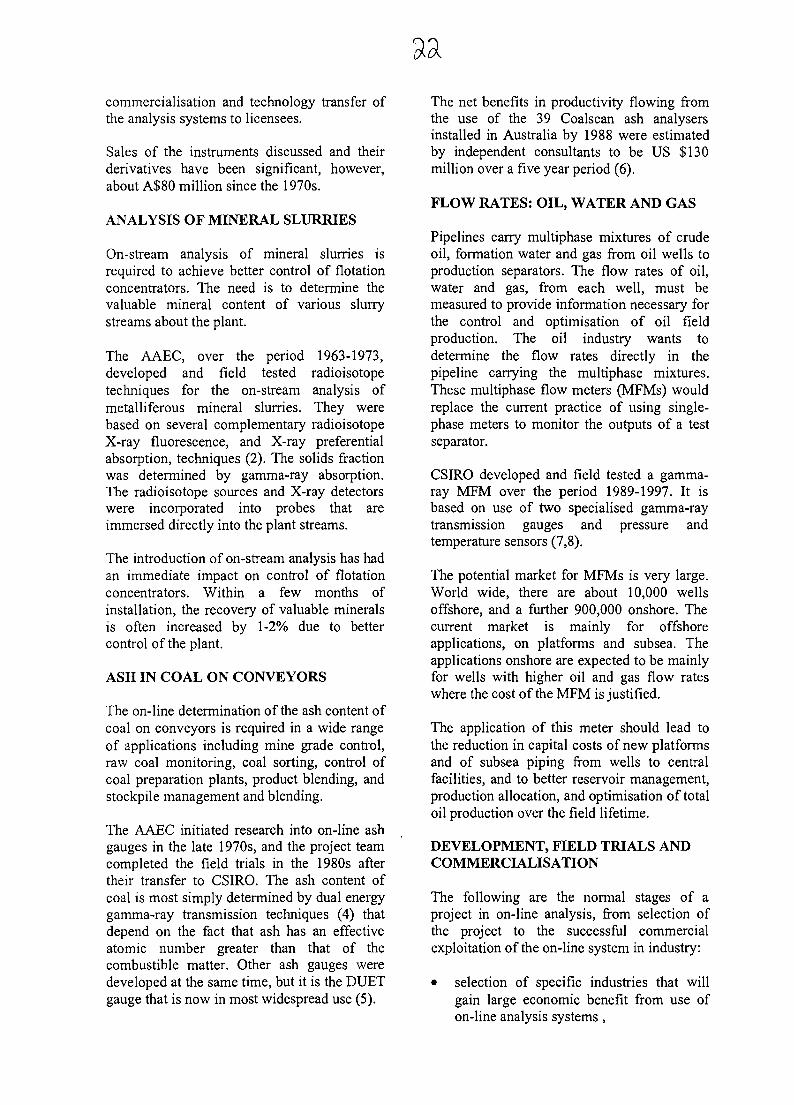
commercialisation and technology transfer ofthe analysis systems to licensees.
Sales of the instruments discussed and theirderivatives have been significant, however,about A$80 million since the 1970s.
ANALYSIS OF MINERAL SLURRIES
On-stream analysis of mineral slurries isrequired to achieve better control of flotationconcentrators. The need is to determine thevaluable mineral content of various slurrystreams about the plant.
The AAEC, over the period 1963-1973,developed and field tested radioisotopetechniques for the on-stream analysis ofmetalliferous mineral slurries. They werebased on several complementary radioisotopeX-ray fluorescence, and X-ray preferentialabsorption, techniques (2). The solids fractionwas determined by gamma-ray absorption.The radioisotope sources and X-ray detectorswere incorporated into probes that areimmersed directly into the plant streams.
The introduction of on-stream analysis has hadan immediate impact on control of flotationconcentrators. Within a few months ofinstallation, the recovery of valuable mineralsis often increased by 1-2% due to bettercontrol of the plant.
ASH IN COAL ON CONVEYORS
The on-line determination of the ash content ofcoal on conveyors is required in a wide rangeof applications including mine grade control,raw coal monitoring, coal sorting, control ofcoal preparation plants, product blending, andstockpile management and blending.
The AAEC initiated research into on-line ashgauges in the late 1970s, and the project teamcompleted the field trials in the 1980s aftertheir transfer to CSIRO. The ash content ofcoal is most simply determined by dual energygamma-ray transmission techniques (4) thatdepend on the fact that ash has an effectiveatomic number greater than that of thecombustible matter. Other ash gauges weredeveloped at the same time, but it is the DUETgauge that is now in most widespread use (5).
The net benefits in productivity flowing fromthe use of the 39 Coalscan ash analysersinstalled in Australia by 1988 were estimatedby independent consultants to be US $130million over a five year period (6).
FLOW RATES: OIL, WATER AND GAS
Pipelines carry multiphase mixtures of crudeoil, formation water and gas from oil wells toproduction separators. The flow rates of oil,water and gas, from each well, must bemeasured to provide information necessary forthe control and optimisation of oil fieldproduction. The oil industry wants todetermine the flow rates directly in thepipeline carrying the multiphase mixtures.These multiphase flow meters (MFMs) wouldreplace the current practice of using single-phase meters to monitor the outputs of a testseparator.
CSIRO developed and field tested a gamma-ray MFM over the period 1989-1997. It isbased on use of two specialised gamma-raytransmission gauges and pressure andtemperature sensors (7,8).
The potential market for MFMs is very large.World wide, there are about 10,000 wellsoffshore, and a further 900,000 onshore. Thecurrent market is mainly for offshoreapplications, on platforms and subsea. Theapplications onshore are expected to be mainlyfor wells with higher oil and gas flow rateswhere the cost of the MFM is justified.
The application of this meter should lead tothe reduction in capital costs of new platformsand of subsea piping from wells to centralfacilities, and to better reservoir management,production allocation, and optimisation of totaloil production over the field lifetime.
DEVELOPMENT, FIELD TRIALS ANDCOMMERCIALISATION
The following are the normal stages of aproject in on-line analysis, from selection ofthe project to the successful commercialexploitation of the on-line system in industry:
• selection of specific industries that willgain large economic benefit from use ofon-line analysis systems,
33-assessment of the key requirements foranalysis in the industry,a rough assessment of various techniqueswhich may be used for this application,assessment of on-line analysis instrumentscurrently being developed elsewhere or inroutine use, including their shortcomings,preliminary laboratory research anddevelopment to gain some experience withthe various techniques,more detailed discussion with industry oftheir requirements, best done on-the-spotat their operations,soliciting financial support for the project,undertaking the sponsored project whichinvolves laboratory R&D and field trials,final reporting of the sponsored project,selecting a licensee and negotiation of thecommercial Agreement, andtransfer of the technology to the licensee.
The projects often take 7-10 years to completebecause they involve not only the R&D, butalso field trials, commercialisation andtechnology transfer. For example, the MFMproject was conceived in 1988 and began in1989. The MFM was licensed in 1997.
Some of these stages of development of aproject are now discussed in more detail.
Selection of specific industry
This selection is not particularly difficult inAustralia. The mineral and energy industriesworldwide have great need for on-lineanalysis. These industries in Australia are verylarge, with annual production of coal,metalliferous minerals and oil beingrespectively valued at A$ 8 (export only), 3.5,and 5 billion. The metalliferous mineralproduction quoted relates only to thoseminerals for which on-stream analysis hasbeen proved effective. For example, gold isexcluded because it occurs at very lowconcentrations in ore and analysis is beyondthe reach of radioisotope technology.
On-stream analysis leads to the more efficientprocessing and recovery of minerals. Eventhough the increase in recovery will be fairlysmall, a 1% increase applied industry wide inthese three industries would lead to savings toAustralia of $160 million a year. The
realisation of this magnitude of savings is thechallenge for the Australian developers of on-stream analysis systems and for Australianindustry.
Targeting key analysis requirements
The most critical stage of the whole project isthe targeting of the key requirements for on-line analysis in the particular industry area.The researcher must understand why these keyareas are important, how the analysis systemcan be used to increase or improve production,and what economic benefit can be gained byindustry from their use. Frequent contact witha wide range of people in industry is essential,both by direct contact and by attendingindustry conferences.
I have found that there may be one, or a few atbest, persons in industry who clearly see thekey analysis needs of their industry and areprepared to be the industry champion of theproject. It takes time and perseverance to findthis person. Whilst in the AAEC, I had beenworking in the field of on-stream analysis ofmineral slurries for nearly three years beforefinding this champion. He understood the realneeds for on-line analysis, and I knew theemerging radioisotope technologies that couldbe further developed for use in on-line analysisof mineral slurries. The project soon becamemore focussed, and developed more quickly.
Who initiates the project?
Conventional wisdom is that industry shouldinitiate projects because only they understandtheir priorities. However, research groups havea better grasp of emerging technologies, andhave a better understanding of what istechnically feasible. Who initiates the projectdoes not matter. It is critically important thatthe industry requirements, the emergingtechnologies and the understanding oftechnical feasibility, are all incorporated.
In most of my projects, I have made the firstapproach to industry because I have sensed theimportance of newly developing technologies.Industry followed up my approach with inputof their critical needs, their enthusiasm for thedeveloping project, and their ideas for, andsupport during, field trials.
Planning the project
Once the key analysis problem is identified,preliminary R&D are often required before themain directions of the project can be defined.This work may take 3-6 months, and isnormally funded by the research organisation.
The research organisation then prepares amore detailed plan of the project, includingboth laboratory R&D and field trials. There isfrequent interaction with industry during thisplanning stage. The detailed plan is thensubmitted to potential industry sponsors,especially to those who would have a strongvested interest in the successful developmentof the analysis system.
During planning, I estimated that the MFMproject would take six years to complete. Theproject was set up in three two-year stages.The first involved only laboratory research,and included gaining more experience with theoil industry. The second and third stagesinvolved both laboratory R&D and field trials.
Funding the project
Funding sources for the three analysis systems
The source of the funds to support projects haschanged greatly during the period covered bythe development of the three analysis systemsdiscussed in this paper. In the 1960s, theAAEC directly funded the R&D of the mineralslurry analyser. Industry part funded the costsof the field trials, the AAEC covering thescientists' salaries and overheads. In the late1970s/early 1980s, the AAEC and CSIROfunded most of the R&D of the ash gauge,with significant additional funding beingsupplied by NERDDC, a Government body forfunding energy research based on competitivebidding. In the 1990s, CSIRO directly fundedabout 50% of the $4M total cost of the MFMproject. Oil companies and ERDC (a successorof NERDDC) funded the other 50%. Theydirectly funded part of the CSIRO R&D, andessentially all of their and CSIRO's costs infield trials.
The royalties later gained from commercialsales of the analysis systems have not beenincluded in the above sources of funds. Theroyalties from ash gauge sales, shared between
the AAEC, CSIRO and NERDDC, were about$1.3 million. Based on MFM sales predictions,CSIRO could receive about $2M over the firstfive years. This would cover the total CSIROcost of development of the MFM, and furtherroyalties after 2002 would provide a positivereturn on the investment. Under internalfinancial policies, the project team has had noaccess to such royalty streams in the past, andapparently will have no access to it in thefuture.
Funding for the MFM project
I had had no previous contact with the oilindustry and hence funding the MFM projectwas a challenge. I approached the AustralianMineral Industries Research Association Ltd.(AMIRA). This company, set up by themineral industry, provides links betweenindustry requiring research to be undertakenand research organisations that couldundertake it. It does not itself undertake R&D.It has an excellent record of achievement withthe metalliferous mineral industry, and werethen expanding their efforts, and had contactswith, the petroleum industry. Together, wesought finance from the oil industry. AMIRAcoordinated the research project.
To enhance the chances for gaining financialsupport, the project was deliberately set up inthree two-year stages. After the successfulcompletion of one stage we sought financialsupport for the next. This reduced the financialrisk to sponsors and provided better directionfor subsequent stages. From the beginning, theoil companies were told that it would take sixyears to develop the MFM. The total supportrequested for the first stage was only$120,000. This covered some laboratory R&D.We gained experience with the oil industry,and felt we gained the confidence of oursponsors. The bulk of the funding wasrequired for the second and third stages thatincluded the field trials.
Ownership of intellectual property
Intellectual property (IP) in these projectsusually consists of patents and know-how.There was limited patent cover for the threeanalysis systems described above: for one ofthe XRF techniques used in the mineral slurryanalyser, none for the ash gauge, and for a
specific part of the MFM. However, know-how was extremely important for the mineralslurry analyser, sufficiently important for theash gauge to give the licensee a five-year leadon the world market, and is very important forthe MFM.
The ownership of the intellectual property isnegotiated at the beginning of the project whenits value is uncertain. Some of the technologywill have been developed by the researchorganisation prior to the commencement of theproject, but more will be developed during it.Ownership is usually a contentious issue. Iconsider that the research organisation shouldretain the IP rights because• to ensure success in commercialisation,
rights usually must be exclusivelylicensed,
• usually only the research organisation hassufficient knowledge of the product totransfer the technology to the licensee, and
• the loss of the IP rights may limit thecontribution the research organisation canmake to applying the technology to otherfields of application and other industries.
The issue of ownership of intellectual propertyis often resolved by advising the company whowants it that they can have it but must pay thetotal cost of the background knowledge, theproject itself, and technology transfer. Thecompany then takes on the whole risk of theproject. My experience with on-line analysisprojects is that companies will not take on thisrisk. The AAEC or CSIRO retained ownershipof all the intellectual property developedduring the three on-line analysis projectsdescribed above.
Field trials
Field trials are essential to all on-line analysisprojects. They contribute vital information onthe state of development of the system, andmay indicate where improvements arenecessary. They determine the accuracy ofanalysis achievable in industrial conditions.This is of particular value to the projectsponsors, as they can then plan withconfidence the installation of the futurecommercial on-line system. The researcherslearn much about the industry during a fieldtrial, and may find new application areas for
the system and bring to light new analysisareas for future research.
There were six field trials of the system for thein-stream analysis of mineral slurries. Thislarge number was essential because of therange of elements to be analysed (iron, nickel,copper, zinc, tin and lead) and the range ofdifferent XRF and XRA techniques that had tobe developed and proved. These radioisotopeX-ray techniques were new to the mineralindustry, and an important part of the fieldtrials was proving that the systems werepractical.
CSIRO proved the ash gauge in trials at onepilot plant and two coal washeries. Thesedemonstrated to the coal industry that on-lineash gauges were sufficiently accurate andreliable for their routine use.
CSIRO tested and demonstrated theperformance of the MFM in three field trials,two on offshore oil platforms and the third onan island fed from oil platforms offshore. Eachtrial led to further laboratory R&D, improvingthe technology between each trial. The lasttrial was on the West Kingfish platform in theBass Strait. The MFM has been in routine usethere since completion of the trial in 1995. TheMFM was further tested in 1996 at Texaco'smultiphase flow loop near Houston (8) to gainexperience with a wider range of flowconditions. Further loop trials will beundertaken to improve the calibrations forliquids and gas flows.
Commercialisation
This Section covers the areas of when shouldthe prospective licensee be introduced into theproject, the selection of the licensee, checkingthe intent of the applicant for the license, andnegotiating the commercial agreement. Thewhole process of selection of the licensee tocompletion of commercial agreement is slow.In my experience, it has never been achievedin less than one year, and often takesconsiderably longer.
When to bring in the potential licensee?
Conventional wisdom is to bring the licenseeinto the project soon after its commencement.This should add value to the project by having
the licensee influence the course of itsdevelopment, and allow the licensee to gainexperience in manufacture of the instrument tobe used in field trials. I have not known apotential licensee prepared to commit theirown funds to a significant extent in the earlystages of projects. The risk for them is toogreat. In my experience, they have committedfunds to the research organisation only afterthe analyser has been proved in field trials.
The best I have achieved in this regard is tokeep potential Australian licensees informedabout the setting up of new projects andprogress in their development. This has giventhem time to make an early assessment of themarket.
Selection of licensee
The key requirement in selection of thelicensee is establishing its capability todevelop and exploit the market for the on-lineanalysis system. The licensee should haveestablished good contact with the industrywhere it is to be used, and preferably haveexperience with the technology beingexploited.
Amdel and Philips Industries were chosen in1971 as joint licensees for the mineral slurryanalysis system. Both had good contact withthe metalliferous mineral industry in Australia,and Philips had considerable experience withX-ray techniques and with the development ofinstrumentation. The basis was that Philipswould manufacture the system, and Amdelwould be responsible for installation andcalibration. The potential sales to theAustralian market were high because of thelarge number of mineral concentrators here. Itwas intended that the experience gained inAustralia would be used later to develop theworld market.
Mineral Control Instrumentation Ltd. (MCI)was chosen as licensee for the ash gauge.Since three MCI staff had previously workedat Amdel, MCI had considerable experience inradioisotope and nucleonic instrumentationtechnology. They had no experience with thecoal industry, but formed links with a firm ofengineering consultants to the coal industry.The Australian coal industry is large and the
experience gained first in Australia again waslater used to develop the world market.
The licensing of the MFM was considerablymore difficult than for the other systems. Atleast part of the problem was the need toaddress both international and Australianmarkets at the same time. Unlike the other twosystems, the local market was insufficient touse as a base for subsequent world sales. Inaddition, the nature of the oil industry makes ita global business, not a regional one. A limitednumber of major companies dominate the oilindustry.
CSIRO policy is to give preference wherepossible to licensing Australian companies.Two attempts were made to do this with theMFM, both involving the linking of anAustralian company (one had no previousexperience in the oil industry) with a largeinternational instrumentation company alreadyservicing the oil industry. This linkage wasessential to exploit the international market.Both attempts failed. I believe that the firstprobably failed because the overseas companyfelt uncertain about tying up with a technologyand manufacturing operation based inAustralia. The second failed because of atakeover bid and subsequent policy changes inthe overseas company at a critical stage ofdiscussions with them.
Learning from the above experience, CSIROMinerals accepted that the MFM should bedirectly licensed to an international companythat services the oil industry. With the benefitof hindsight, this is a more appropriate route toexploitation of the MFM. Two international oilservices companies, both potentially very goodlicensees, expressed immediate interest. It waslicensed to one of them, Kvaerner FSSL ofAberdeen, in 1997. Kvaerner service the oilindustry worldwide, have experience in thedevelopment of instrumentation for the oilindustry, and are one of the few companiesworldwide who have expertise in subseaengineering.
Is the licensee applicant serious?
Companies express interest in taking up thelicense for various reasons, including seriousintent, the desire to gain information in an areaof their interest, and in rare cases, I suspect to
gain the license to keep the analysis system offthe market. The applicants are entitled to someinformation on the system to enable them tomake a better assessment of its viability forsuccessful commercial exploitation. Thecompanies must decide whether the productfits in with their immediate objectives, if thetiming is right for their company, and are thedecision-makers in the company enthusiastic.
Once the research organisation has decided toproceed further with a specific applicant, it issensible to test the seriousness of their intent.One way to do this is to offer them priorityright to negotiate for a set period of time inexchange for a sum of money that is refundedon successful conclusion of the licenseagreement.
Negotiations
The developer and potential licensee havemany interests in common. Both want to seethe technology transferred rapidly to thelicensee, to see the gauge developed quicklyinto a commercial product, and to see it gainwidespread use in industry. These commoninterests drive negotiations towards success.
I think that the best approach to commercialnegotiations of on-line analysis systems issimilar to the best practice of negotiations inmany other areas. Find out what are importantneeds for both parties. Discuss these in detailto see if agreement is possible. Make sure thatthese are jointly acceptable before detailednegotiations of terms take place. Do not putforward conditions that the other party cannotaccept, but be prepared to have to seek anotherlicensee if agreement on fundamental issuescannot be resolved.
Contentious issues are often financial, both inthe immediate funding of technology transferand further system development, and inroyalties. At this stage, the researchorganisation may no longer have access tofunding from industry sponsors, and requiresfinance to cover the costs of technologytransfer and further development of theanalysis system. The licensee has a negativecash flow whilst taking on the technology,modifying it to ensure a marketable product,and marketing it. The licensee usually prefersto fund the research organisation from
royalties on sales. This limits its risk, buttransfers some of the risk to the researchorganisation if future sales are overestimated.Both parties must be prepared to take on someof the future risk.
In my experience, the costs of the transfer oftechnology are considerable and are mainlycovered by the licensee. After licensing, theresearch organisation usually undertakesfurther R&D to simplify the analysis systemand to extend the range of its applicability.This may be covered, at least partly, by havingthe licensee fund the research organisationfrom an extra margin on the sales price for theinitial sales of the system (if the system issuccessful).
Royalties are a complex issue and depend onmany factors including patent cover, the valueof the know-how, the availability on themarket of competitive systems, the extent towhich industry needs the product, and thesavings resulting from its use. Royalties areusually decided on a specific case basis.
Comments on negotiations with licensees
The negotiations for a license for the mineralslurry analyser were complex because fourparties were involved in the Agreement. Thenegotiations would have been much simpler ifonly the AAEC and one negotiator,representing both Amdel and Phillips, hadbeen involved.
The negotiation with MCI of the agreement forthe ash gauge was much simpler because onlyCSIRO and MCI were involved.
The negotiations with potential licensees forthe MFM took place over a three-year period,and were successful only after CSIRO decidedto negotiate directly with an overseascompany. The negotiations with KvaernerFSSL Ltd. of Aberdeen were made somewhatmore complex because of distance.Considerable telephone and written discussiontook place before it was possible to schedulethe first meeting that was held in Houston.However, the communications then becamerapid because of use of email. Even so, thefirst meeting was held 14 months before thesigning of the contract. A greater number offace to face meetings may have speeded this
up, but again the cost and complexity ofarranging such meetings increase withdistance.
Technology transfer
The time and resources needed for technologytransfer depend on the complexity of theanalysis system, its stage of development, andthe licensee's experience with the technology.Licensees usually underestimate the time andresources required to transfer the technology.In my experience, it has been achieved bestwhen technical staff of the licensee work withresearch organisation staff on the project for afew months, and jointly undertake either aplant trial or the first commercial installation.The following summarises experiences intechnology transfer with the above three on-line systems.
Amdel
The mineral slurry analyser was AmdePs firstinvolvement with radioisotope techniques andwith the development of instrumentation. AnAmdel physicist spent one year at the AAEClaboratories, undertaking both laboratory workand field trials with AAEC staff. This wascritical to the success of the technologytransfer. The AAEC had proved the on-streamanalysis technology in field trials usinglaboratory equipment. Amdel and co-partnerPhilips Industries Ltd. designed the industrialsystem. The AAEC had to supply backupsupport on technology for about five yearsafter the first commercial sale to industry. Theexperience Amdel gained with the on-streamanalysis system led to Amdel becoming theworld market leader in radioisotope on-streamanalysis of mineral slurries. Amdel haveintroduced solid state detectors into theradioisotope X-ray system, and broadened theapplication area to include analysis of drypowders, solutions, and coal slurries. Totalsales exceed A$ 50 million. Amdel undertaketheir own R&D into new analysis systems.
Mineral Control Instrumentation (MCI)
MCI obtained the license for two on-line ashgauges in 1982. They had considerableexpertise in on-line analysis and radioisotopetechniques. CSIRO had used laboratoryelectronics in the field trials. MCI had to
design electronics and mechanical equipmentsuitable for long-term industrial use. Althoughthe license agreement was signed in 1982,CSERO continued R&D and proving of the ashgauges until 1986. The technology wastransferred over a three-year period. MCI nowmarket two models of the ash gauge as theCoalscan 2500 and 3500 ash monitors. Theyhave installed over 210 monitors worldwide,with total sales exceeding A$ 30 million. Themonitor is the world market leader in on-lineash gauges based on gamma-ray techniques.MCI now successfully undertake their ownR&D into new coal analysis systems.
KvaernerFSSL
CSIRO commenced transfer of the multiphaseflow meter technology to Kvaerner FSSL Ltd.in December 1996. A Kvaerner staff membervisited CSIRO at Lucas Heights in twoseparate visits for a total time of about 6weeks. Otherwise, contact has been by emailand by telephone.
The transfer of the technology was greatlysimplified compared with the previous casesbecause, in the period 1985-1995, CSIROMinerals had developed considerable expertisein the electronic and mechanical design ofindustrial gauges. The CSIRO MFM was at afar greater stage of industrial developmentthan the previous instruments because, forfield trials, the MFM had had to meet theunusually high standards of safety mandatoryon offshore platforms. The transfer ofmechanical and electronics design was in theform of engineering drawings.
A CSIRO scientist took part with Kvaerner inthe setting up of the first MFM theymanufactured and in the first loop trial at theNational Engineering Laboratory, Scotland.CSIRO is continuing to transfer technology toKFSSL and to undertake R&D into the MFMcalibration for liquids and gas flows.
CONCLUSION
The AAEC and CSIRO have over the last 35years very successfully developed on-lineanalysis systems for use in the mineral andenergy industries. The development of thesesystems has led to the establishment of
Australian technology in the forefront of on-line analysis systems for the world market.The successful pattern of laboratory R&D,field trials, licensing, and technology transferdeveloped has been discussed in relation tothree analysis systems developed.
ACKNOWLEDGMENTS
The author thanks staff of the CSIRO Mineralsproject teams for their support in thedevelopment of the on-line analysis systemsdiscussed. The author thanks Ian Reddoch,CSIRO Minerals, who led the negotiations onlicensing the MFM, and from whom he haslearnt much about the licensing process.
REFERENCES
1. Cutmore N.G., Howarth W.J., SowerbyB.D. and Watt J.S. (1993). On-line analysis forthe mineral industry, Proc. AusIMMCentenary Conference, AusIMM, Melbourne,pp. 189-197.
2. Watt J.S. (1983). On-stream analysis ofmetalliferous ore slurries. Int. J. Appl. Radiat.Isotopes 34(1), 309-331.
3. Amdel Ltd., PO Box 338, Torrensville Plaza5031, S.A., Australia.
4. Gravitis V.L., Watt J.S., Muldoon L.J. andCochrane E.M. (1987). Long-term trial of adual energy gamma-ray transmission gaugedetermining the ash content of washed cokingcoal on a conveyor belt. Nucl.Geophys. 1 (2),111-124.
5. Mineral Control Instrumentation (MCI) Ltd,PO Box 64, Unley, S.A. 5061, Australia.
6. Sowerby B.D. (1991) Nuclear techniques inthe coal industry, Nuclear Techniques in theExploration and Exploitation of Energy andMineral Resources, IAEA Vienna 1991, pp. 3-31.
7. Hartley P.E., Roach G.J., Stewart, D., WattJ.S., Zastawny H.W. and Ellis W.K. (1995).Trial of a gamma-ray multiphase flow meteron the West Kingfish oil platform, NuclGeophys. 9 (6) 533-552.
8. Roach G.J. and Watt J.S. (1997) Amultiphase flow meter for the on-linedetermination of the flow rates of oil, waterand gas, Second International IsotopeConference, Sydney, 12-15 October 1997.
9. Kvaerner FSSL Ltd., Howe Moss Ave.,Kirkhill, Dyce, Aberdeen AB21 ONA,Scotland.
AU9817308
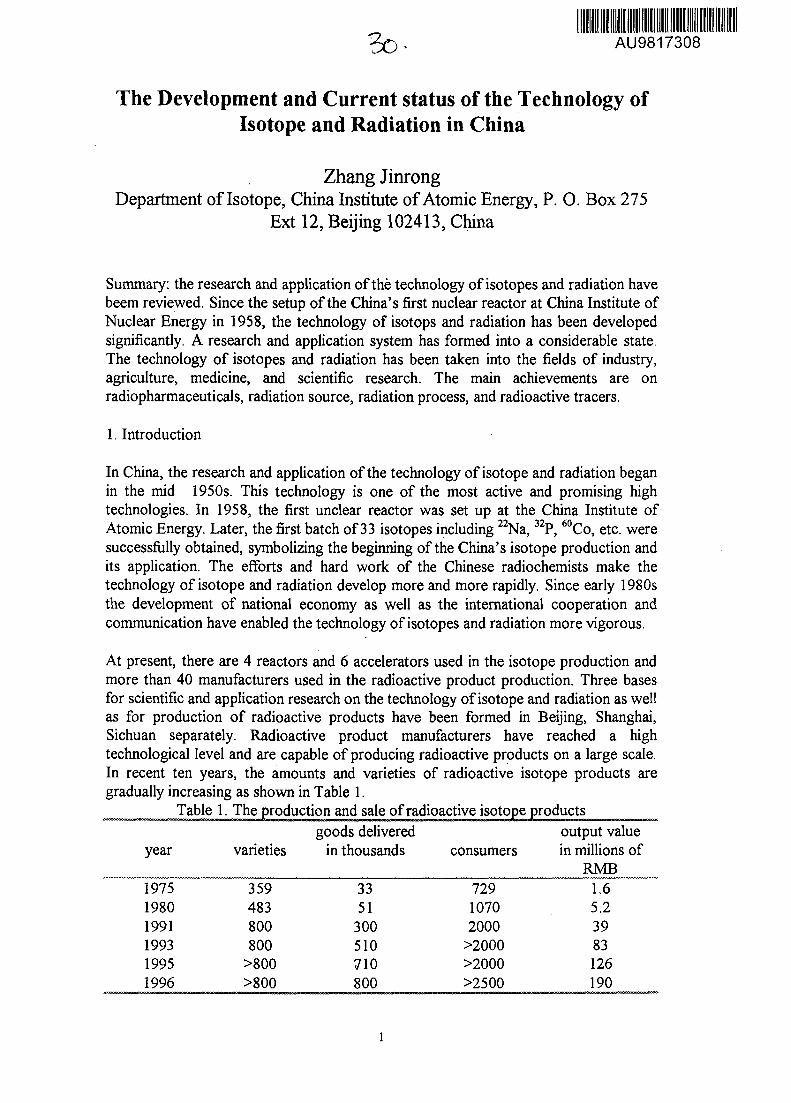
The Development and Current status of the Technology ofIsotope and Radiation in China
Zhang JinrongDepartment of Isotope, China Institute of Atomic Energy, P. O. Box 275
Ext 12, Beijing 102413, China
Summary: the research and application of the technology of isotopes and radiation havebeem reviewed. Since the setup of the China's first nuclear reactor at China Institute ofNuclear Energy in 1958, the technology of isotops and radiation has been developedsignificantly. A research and application system has formed into a considerable state.The technology of isotopes and radiation has been taken into the fields of industry,agriculture, medicine, and scientific research. The main achievements are onradiopharmaceuticals, radiation source, radiation process, and radioactive tracers.
1. Introduction
In China, the research and application of the technology of isotope and radiation beganin the mid 1950s. This technology is one of the most active and promising hightechnologies. In 1958, the first unclear reactor was set up at the China Institute ofAtomic Energy. Later, the first batch of 33 isotopes including 22Na, 32P, 60Co, etc. weresuccessfully obtained, symbolizing the beginning of the China's isotope production andits application. The efforts and hard work of the Chinese radiochemists make thetechnology of isotope and radiation develop more and more rapidly. Since early 1980sthe development of national economy as well as the international cooperation andcommunication have enabled the technology of isotopes and radiation more vigorous.
At present, there are 4 reactors and 6 accelerators used in the isotope production andmore than 40 manufacturers used in the radioactive product production. Three basesfor scientific and application research on the technology of isotope and radiation as wellas for production of radioactive products have been formed in Beijing, Shanghai,Sichuan separately. Radioactive product manufacturers have reached a hightechnological level and are capable of producing radioactive products on a large scale.In recent ten years, the amounts and varieties of radioactive isotope products aregradually increasing as shown in Table 1.
Table 1. The production and sale of radioactive isotope products
year
197519801991199319951996
varieties
359483800800
>800>800
goods deliveredin thousands
3351
300510710800
consumers
72910702000
>2000>2000>2500
output valuein millions of
RMB1.65.23983126190
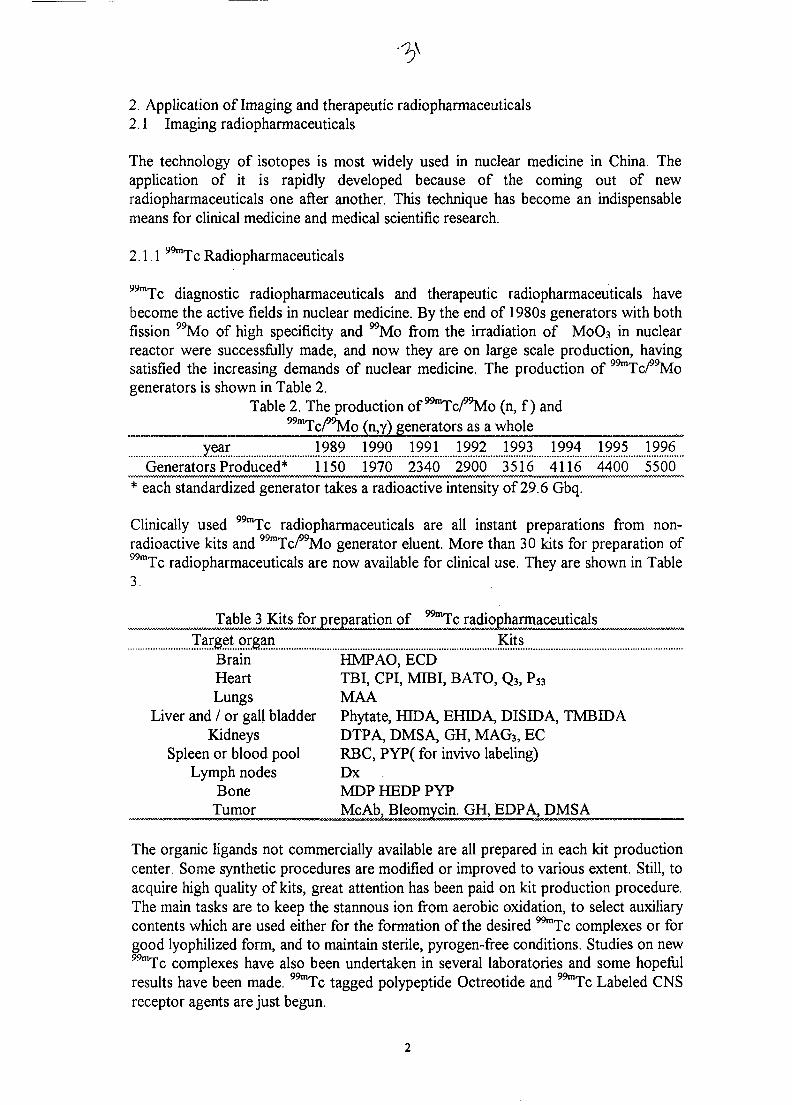
2. Application of Imaging and therapeutic radiopharmaceuticals2.1 Imaging radiopharmaceuticals
The technology of isotopes is most widely used in nuclear medicine in China. Theapplication of it is rapidly developed because of the coming out of newradiopharmaceuticals one after another. This technique has become an indispensablemeans for clinical medicine and medical scientific research.
2.1.199mTc Radiopharmaceuticals
99mTc diagnostic radiopharmaceuticals and therapeutic radiopharmaceuticals havebecome the active fields in nuclear medicine. By the end of 1980s generators with bothfission 99Mo of high specificity and "Mo from the irradiation of MOO3 in nuclearreactor were successfully made, and now they are on large scale production, havingsatisfied the increasing demands of nuclear medicine. The production of 99mTc/"Mogenerators is shown in Table 2.
Table 2. The production of 99mTc/99Mo (n, f) and99mTc/"Mo (n,y) generators as a whole
yearGenerators Produced*
19891150
19901970
19912340
19922900
19933516
19944116
19954400
19965500
* each standardized generator takes a radioactive intensity of 29.6 Gbq.
Clinically used 99mTc radiopharmaceuticals are all instant preparations from non-radioactive kits and 99mTc/"Mo generator eluent. More than 30 kits for preparation of99mTc radiopharmaceuticals are now available for clinical use. They are shown in Table3.
Table 3 Kits for £ ^
Target organ Kit?....Brain HMPAO^ ECDHeart TBI, CPI, MIBI, BATO, Q3, P53Lungs MAA
Liver and / or gall bladder Phytate, HID A, EHIDA, DISEDA, TMBIDAKidneys DTP A, DMSA, GH, MAG3, EC
Spleen or blood pool RBC, PYP( for invivo labeling)Lymph nodes Dx
Bone MDP HEDP PYPTumor McAb, Bleomycin. GH, EDPA, DMSA
The organic ligands not commercially available are all prepared in each kit productioncenter. Some synthetic procedures are modified or improved to various extent. Still, toacquire high quality of kits, great attention has been paid on kit production procedure.The main tasks are to keep the stannous ion from aerobic oxidation, to select auxiliarycontents which are used either for the formation of the desired 99mTc complexes or forgood lyophilized form, and to maintain sterile, pyrogen-free conditions. Studies on new99mTc complexes have also been undertaken in several laboratories and some hopefulresults have been made. 99mTc tagged polypeptide Octreotide and 99mTc Labeled CNSreceptor agents are just begun.
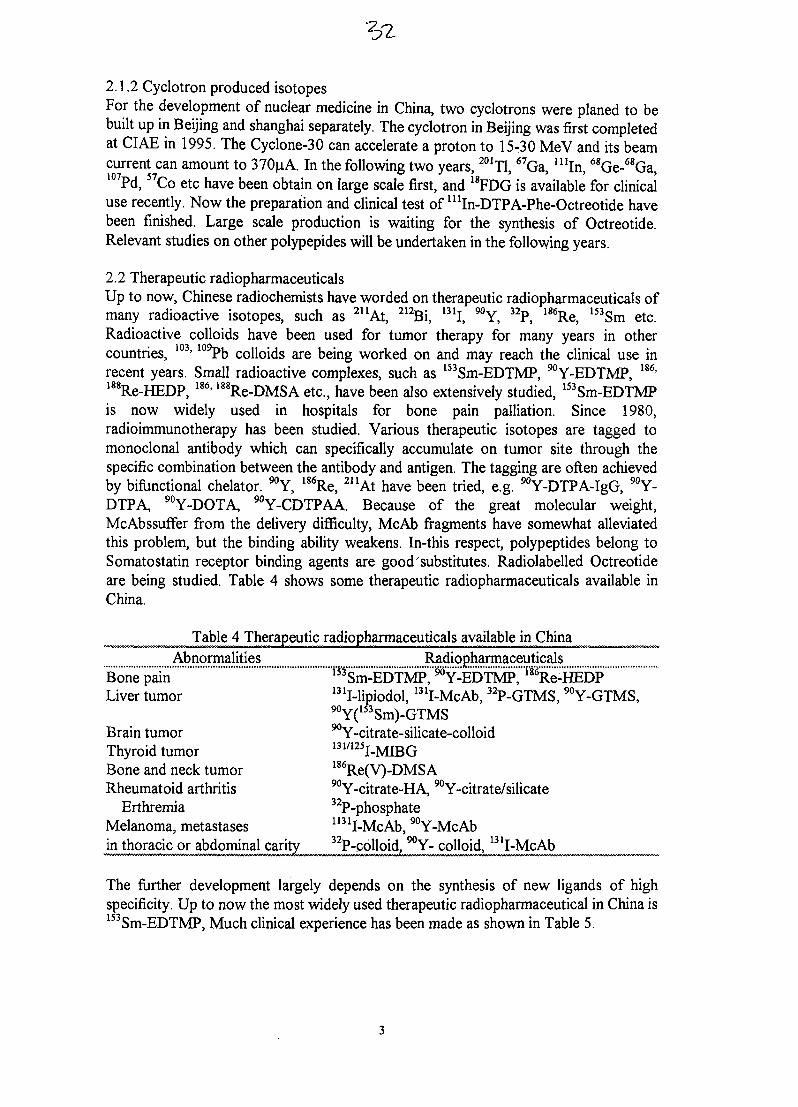
2.1.2 Cyclotron produced isotopesFor the development of nuclear medicine in China, two cyclotrons were planed to bebuilt up in Beijing and shanghai separately. The cyclotron in Beijing was first completedat CIAE in 1995. The Cyclone-30 can accelerate a proton to 15-30 MeV and its beamcurrent can amount to 370uA. In the following two years, 2O1T1,67Ga, H1In, 68Ge-68Ga,107Pd, 57Co etc have been obtain on large scale first, and 18FDG is available for clinicaluse recently. Now the preparation and clinical test of mIn-DTPA-Phe-Octreotide havebeen finished. Large scale production is waiting for the synthesis of Octreotide.Relevant studies on other polypepides will be undertaken in the following years.
2.2 Therapeutic radiopharmaceuticalsUp to now, Chinese radiochemists have worded on therapeutic radiopharmaceuticals ofmany radioactive isotopes, such as 211At, 212Bi, 131I, 90Y, 32P, 186Re, 153Sm etc.Radioactive colloids have been used for tumor therapy for many years in othercountries, 103> 109Pb colloids are being worked on and may reach the clinical use inrecent years. Small radioactive complexes, such as 153Sm-EDTMP, 90Y-EDTMP, 186'188Re-HEDP, 186> 188Re-DMSA etc., have been also extensively studied, 153Sm-EDTMPis now widely used in hospitals for bone pain palliation. Since 1980,radioimmunotherapy has been studied. Various therapeutic isotopes are tagged tomonoclonal antibody which can specifically accumulate on tumor site through thespecific combination between the antibody and antigen. The tagging are often achievedby bifunctional chelator. 90Y, 186Re, 211At have been tried, e.g. ^Y-DTPA-IgG, 90Y-DTPA, 90Y-DOTA, 90Y-CDTPAA. Because of the great molecular weight,McAbssuffer from the delivery difficulty, McAb fragments have somewhat alleviatedthis problem, but the binding ability weakens. In-this respect, polypeptides belong toSomatostatin receptor binding agents are good substitutes. Radiolabelled Octreotideare being studied. Table 4 shows some therapeutic radiopharmaceuticals available inChina.
Table 4 Therapeutic radiopharmaceuticals available in ChinaAbnormalities P^diophamaceuticals
"Bone pain ' ^^^nl^Wwnis^^^^^Liver tumor I31I-Iipiodol, 131I-McAb, 32P-GTMS, 90Y-GTMS,
90Y(mSm)-GTMSBrain tumor ^Y-citrate-silicate-colloidThyroid tumor 131/125I-MIBGBone and neck tumor 186Re(V)-DMSARheumatoid arthritis 90Y-citrate-HA, 90Y-citrate/silicate
Erthremia 32P-phosphateMelanoma, metastases 1131I-McAb, 90Y-McAbin thoracic or abdo^
The further development largely depends on the synthesis of new ligands of highspecificity. Up to now the most widely used therapeutic radiopharmaceutical in China isI53Sm-EDTMP, Much clinical experience has been made as shown in Table 5.
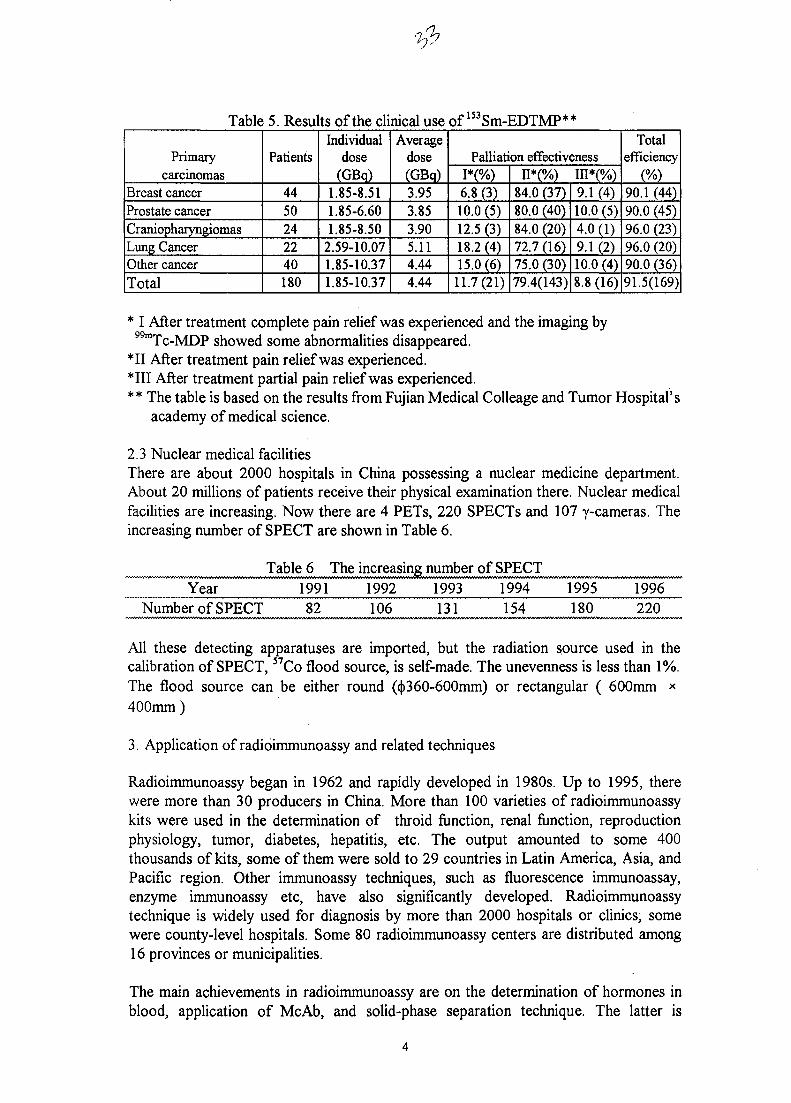
Table
Primarycarcinomas
Breast cancerProstate cancerCraniopharyngiomasLung CancerOther cancerTotal
5. Results of the clinical use
Patients
4450242240180
Individualdose
(GBq)1.85-8.511.85-6.601.85-8.50
2.59-10.071.85-10.371.85-10.37
Averagedose(GBq)3.953.853.905.114.444.44
of153Srn-EDTMP**
Palliation effectivenessI*(%)6.8 (3)10.0 (5)12.5 (3)18.2 (4)15.0 (6)11.7(21)
II*(%) III*(%)84.0 (37)80.0 (40)84.0 (20)72.7 (16)75.0 (30)79.4(143)
9.1 (4)10.0 (5)4.0(1)9.1 (2)10.0 (4)8.8 (16)
Totalefficiency
(%)90.1 (44)90.0 (45)96.0 (23)96.0 (20)90.0 (36)91.5(169)
* I After treatment complete pain relief was experienced and the imaging by99mTc-MDP showed some abnormalities disappeared.
*II After treatment pain relief was experienced.*III After treatment partial pain relief was experienced.** The table is based on the results from Fujian Medical Colleage and Tumor Hospital's
academy of medical science.
2.3 Nuclear medical facilitiesThere are about 2000 hospitals in China possessing a nuclear medicine department.About 20 millions of patients receive their physical examination there. Nuclear medicalfacilities are increasing. Now there are 4 PETs, 220 SPECTs and 107 y-cameras. Theincreasing number of SPECT are shown in Table 6.
YearNumber of SPECT
Table 6 The199182
increasing1992106
number1993131
of SPECT1994154
1995180
1996220
All these detecting apparatuses are imported, but the radiation source used in thecalibration of SPECT, 57Co flood source, is self-made. The unevenness is less than 1%.The flood source can be either round (<j>360-600mm) or rectangular ( 600mm x400mm)
3. Application of radioimmunoassy and related techniques
Radioimmunoassy began in 1962 and rapidly developed in 1980s. Up to 1995, therewere more than 30 producers in China. More than 100 varieties of radioimmunoassykits were used in the determination of throid function, renal function, reproductionphysiology, tumor, diabetes, hepatitis, etc. The output amounted to some 400thousands of kits, some of them were sold to 29 countries in Latin America, Asia, andPacific region. Other immunoassy techniques, such as fluorescence immunoassay,enzyme immunoassy etc, have also significantly developed. Radioimmunoassytechnique is widely used for diagnosis by more than 2000 hospitals or clinics, somewere county-level hospitals. Some 80 radioimmunoassy centers are distributed among16 provinces or municipalities.
The main achievements in radioimmunoassy are on the determination of hormones inblood, application of McAb, and solid-phase separation technique. The latter is
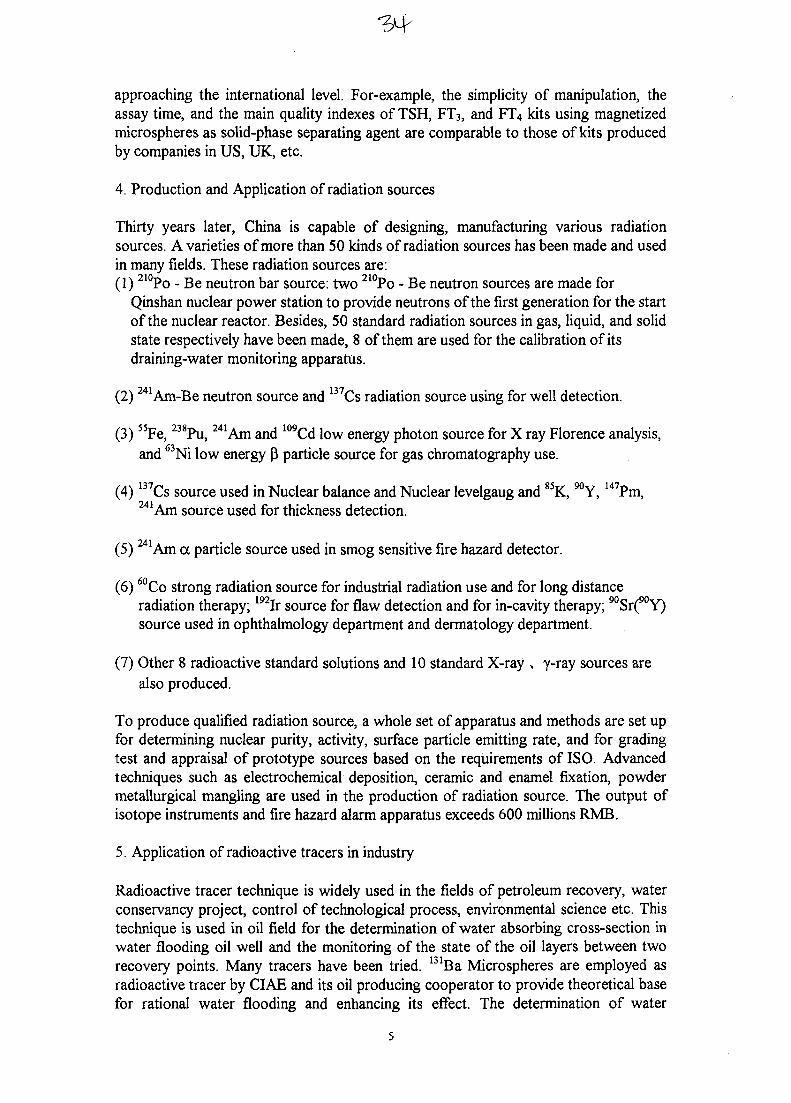
approaching the international level. For-example, the simplicity of manipulation, theassay time, and the main quality indexes of TSH, FT3, and FT4 kits using magnetizedmicrospheres as solid-phase separating agent are comparable to those of kits producedby companies in US, UK, etc.
4. Production and Application of radiation sources
Thirty years later, China is capable of designing, manufacturing various radiationsources. A varieties of more than 50 kinds of radiation sources has been made and usedin many fields. These radiation sources are:(1) 210Po - Be neutron bar source: two 210Po - Be neutron sources are made for
Qinshan nuclear power station to provide neutrons of the first generation for the startof the nuclear reactor. Besides, 50 standard radiation sources in gas, liquid, and solidstate respectively have been made, 8 of them are used for the calibration of itsdraining-water monitoring apparatus.
(2) 241Am-Be neutron source and 137Cs radiation source using for well detection.
(3) 55Fe, 238Pu, 241Am and 109Cd low energy photon source for X ray Florence analysis,and 63Ni low energy P particle source for gas chromatography use.
(4) Cs source used in Nuclear balance and Nuclear levelgaug and K, Y, Pm,241 Am source used for thickness detection.
(5) 241Am a particle source used in smog sensitive fire hazard detector.
(6) 60Co strong radiation source for industrial radiation use and for long distanceradiation therapy; 192Ir source for flaw detection and for in-cavity therapy; 90Sr(90Y)source used in ophthalmology department and dermatology department.
(7) Other 8 radioactive standard solutions and 10 standard X-ray , y-ray sources arealso produced.
To produce qualified radiation source, a whole set of apparatus and methods are set upfor determining nuclear purity, activity, surface particle emitting rate, and for gradingtest and appraisal of prototype sources based on the requirements of ISO. Advancedtechniques such as electrochemical deposition, ceramic and enamel fixation, powdermetallurgical mangling are used in the production of radiation source. The output ofisotope instruments and fire hazard alarm apparatus exceeds 600 millions RMB.
5. Application of radioactive tracers in industry
Radioactive tracer technique is widely used in the fields of petroleum recovery, waterconservancy project, control of technological process, environmental science etc. Thistechnique is used in oil field for the determination of water absorbing cross-section inwater flooding oil well and the monitoring of the state of the oil layers between tworecovery points. Many tracers have been tried. 131Ba Microspheres are employed asradioactive tracer by CIAE and its oil producing cooperator to provide theoretical basefor rational water flooding and enhancing its effect. The determination of water
131Tabsorbing cross-section using Ba has become a routine method in oil production asshown in Table 7. .
Table 7Year
Annual Number
The increase of determined19851273
1990 19916746 7402
water19927918
flooding19938192
wells with19949122
tracer199510537
199610253
In 1990s a large scale sand tracer experiment was carried out under the cooperationbetween China and IAEA in the north channel of Yangzi river mouth. The migration ofdeposited silt was quantitatively observed by the sand tracer in this channel. Themigrating direction, course, and rate of base sand and sand transporting rate were alsoquantitatively observed. In the field of environmental science and technology, isotopetracer technique has been applied to study the pollutant transition in soil, surface water,ground water, and biological chain, and to study the mechanism of waste waterprocessing. For examples, 45Ca tracer has been used to study the transition of Ca in soil,13'i tracer has been used to determine the parameters of ground water, 14C labeledtoluene and dichlorethane have been used to study their behaviors in soil. Thesemethods are sensitive, simple, and quick.
6. Application of radiation technology
Radiation processing technology has only a history of 20 years in China, but greatdevelopments have ben made in many fields during the past ten years. Now more than50 60Co radiation processing apparatuses are distributed in Beijing, Tianjin, Guanghou,Qingdao, Shanghai, etc. Besides, there are more than 30 accelerators of kilowatt outputwhich may be used for radiation process.
Radiation process is forming into an industrial branch. A variety of chemical radiationproducts have been put into production. High quality chemical products can beobtained through radiation induced linkage, polymerization, and branching. Medicalnecessities can be sterilized in the radiation process. Plant seeds may be bettered underradiation. Foods can be kept for longer duration after radiation processing. Somechemical process induced by ionizing radiation can be used for the processing ofindustrial wastes. Much work in China has been made on the design and applicationstudy of radiation apparatus, the production of thermoplastic materials throughradiation induced linkage, Production of electric cable or wire, and the foodpreservation. So IAEA and RCA have sponsored several seminars and training classesin China. The greatest achievements may be in the field of agriculture (Table 8). 408plant seeds have been made through the combination of radiation induced variation withother techniques. The seeds number made by radiation breeding and acres sown tothese seeds rank first in the world. Great advances have also been made in utilizingradiation technique in the studies of fertilization, soil improvement, metabolism ofnutritious substances in plants, livestock husbandry.

Table 8 Radiation technology in agricultureApplication
Radiation breeding
Radiation sterile of insects
Improvement of farmingmethods based on theradioactive tracer studiesIncreased out put inducedby low dose irradiation onseedsFood preservation afterradiation process
Social and economic effect408 new varieties of crops, output increase of 4 billionRMBused in prevention of a destructive insect in Guizhouprovince, the harm dropped from 5-8% to 0.005%609 hectares fields used this technique, economic effect of1.7 billions RMB.
y-ray processed peanut seeds in Hunan province, anincrease of output 11.2-30%
Annual processed goods 50 million kg, an output of 100million RMB.
7. Concluding remarksIt can be concluded from the above discussion that the technology of isotopes andradiation has largely contributed to and affect the Chinese economy. In future, morepreferential conditions will be made and the latent potentialities of the applications ofradiation and isotope technology will be brought in to full play. Attentions will bemainly paid on the following aspects:1. The diagnostic and therapeutic radiopharmaceuticals, especially new 99mTc
radiopharmaceuticals, tumor therapeutic radioactive agents, and positive electronisotope radiopharmaceuticals.
2. Radioimmunoassy and its related techniques, preparation of labeled compound usedin biological engineering, related subjects in the development of life science.
3. Combination of radiation source with electric instruments, computerized isotopeapparatus.
4. The technique of radiation breeding, radiation sterilization of insects, the setup offood irradiating health standards, radiation process of food.
5. New radiation processed polymer materials and its industrialization.6. The application of tracer techniques to old oil well, environment science, water
projects, and the control of rivers.7. Enhancing the study of basic science and applied science, approaching the front of
morden science and new scientific fields, forming new cross linked applied science.8. Enhancing international communication and cooperation.
In recent ten years, international communication and cooperative relationships havebeen built, international academic conferences and training classes have been hold inChina for many times. The technology of isotope application has attracted the attentionabroad. Some universities and institutes have accepted foreign students and receivedthe visits of foreign scientists.
CIAE has set up a " National Isotope Engineering and Technology Center " which isopen to scientists both home and abroad. CIAE are looking forward to cooperativestudies with the specialists or scholars of isotope technology.
References
1. Wang Yishan, Lu Yukai. Isotopes in China in past fourty years. Isotopes(Tong wei su) 1995, 8c4: (in Chinese)
2. Xiao Lun. Production and application of isotopes in China. International conferenceon isotopes (Abstracts). Beijing 1995.
3. Jin Xiaohai. Development of the intervention tumor therapeuticradiopharmaceuticals
in China, international conference on isotope (Abstracts). Beijing 1995
4. Liu Zhonglin, Luo Shunzhong. The preparation and biological evaluation of apotential tumor therapeutic 103> 109Pd radiocolloid. Isotopes (Tong wei su) 1995,8(2): 65-70 (in Chinese)
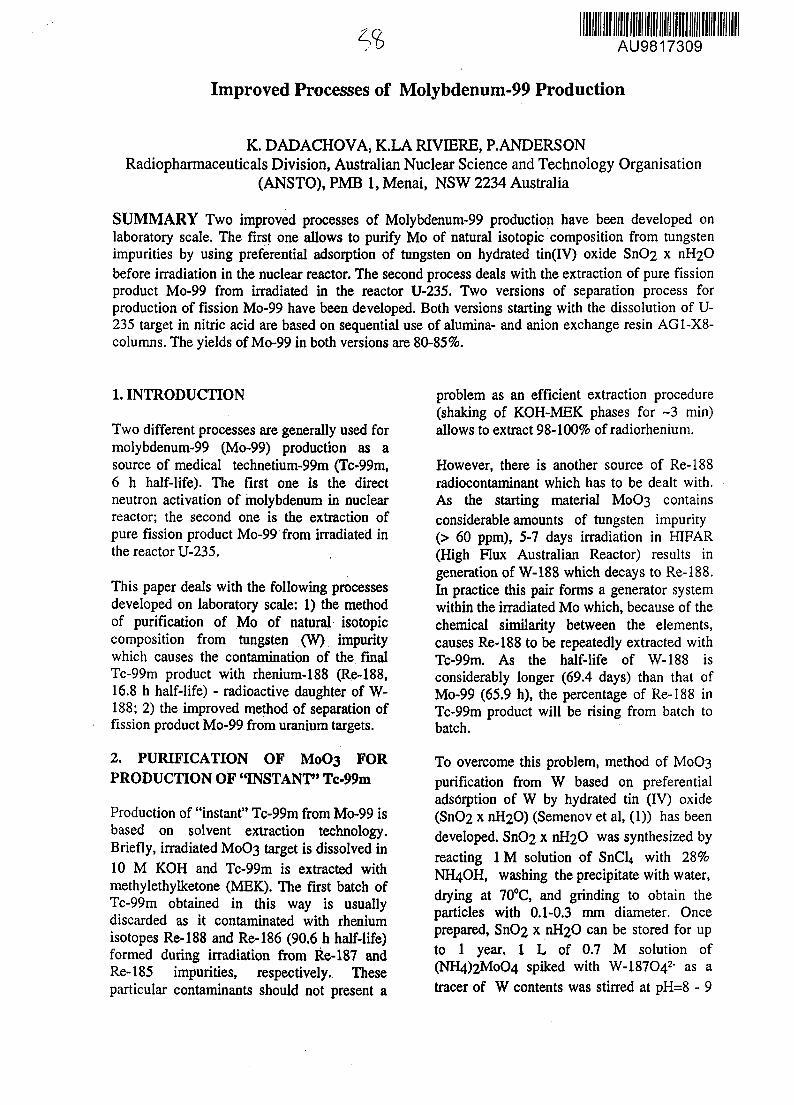
AU9817309
Improved Processes of Molybdenum-99 Production
K. DADACHOVA, K.LA RIVIERE, P.ANDERSONRadiopharmaceuticals Division, Australian Nuclear Science and Technology Organisation
(ANSTO), PMB 1, Menai, NSW 2234 Australia
SUMMARY Two improved processes of Molybdenum-99 production have been developed onlaboratory scale. The first one allows to purify Mo of natural isotopic composition from tungstenimpurities by using preferential adsorption of tungsten on hydrated tin(IV) oxide SnO2 x nH2Obefore irradiation in the nuclear reactor. The second process deals with the extraction of pure fissionproduct Mo-99 from irradiated in the reactor U-235. Two versions of separation process forproduction of fission Mo-99 have been developed. Both versions starting with the dissolution of U-235 target in nitric acid are based on sequential use of alumina- and anion exchange resin AG1-X8-columns. The yields of Mo-99 in both versions are 80-85%.
1. INTRODUCTION
Two different processes are generally used formolybdenum-99 (Mo-99) production as asource of medical technetium-99m (Tc-99m,6 h half-life). The first one is the directneutron activation of molybdenum in nuclearreactor; the second one is the extraction ofpure fission product Mo-99 from irradiated inthe reactor U-235.
This paper deals with the following processesdeveloped on laboratory scale: 1) the methodof purification of Mo of natural isotopiccomposition from tungsten (W) impuritywhich causes the contamination of the finalTc-99m product with rhenium-188 (Re-188,16.8 h half-life) - radioactive daughter of W-188; 2) the improved method of separation offission product Mo-99 from uranium targets.
2. PURIFICATION OF MoO3 FORPRODUCTION OF "INSTANT" Tc-99m
Production of "instant" Tc-99m from Mo-99 isbased on solvent extraction technology.Briefly, irradiated M003 target is dissolved in10 M KOH and Tc-99m is extracted withmethylethylketone (MEK). The first batch ofTc-99m obtained in this way is usuallydiscarded as it contaminated with rheniumisotopes Re-188 and Re-186 (90.6 h half-life)formed during irradiation from Re-187 andRe-185 impurities, respectively. Theseparticular contaminants should not present a
problem as an efficient extraction procedure(shaking of KOH-MEK phases for ~3 min)allows to extract 98-100% of radiorhenium.
However, there is another source of Re-188radiocontaminant which has to be dealt with.As the starting material M003 containsconsiderable amounts of tungsten impurity(> 60 ppm), 5-7 days irradiation in HIFAR(High Flux Australian Reactor) results ingeneration of W-188 which decays to Re-188.In practice this pair forms a generator systemwithin the irradiated Mo which, because of thechemical similarity between the elements,causes Re-188 to be repeatedly extracted withTc-99m. As the half-life of W-188 isconsiderably longer (69.4 days) than that ofMo-99 (65.9 h), the percentage of Re-188 inTc-99m product will be rising from batch tobatch.
To overcome this problem, method of M0O3purification from W based on preferentialadsorption of W by hydrated tin (IV) oxide(SnO2 x nH2O) (Semenov et al, (1)) has beendeveloped. SnO2 x nH2O was synthesized byreacting 1M solution of SnCl4 with 28%NH4OH, washing the precipitate with water,drying at 70°C, and grinding to obtain theparticles with 0.1-0.3 mm diameter. Onceprepared, SnO2 x 11H2O can be stored for upto 1 year. 1 L of 0.7 M solution of(NH4)2MoO4 spiked with W-I87O42- as a
tracer of W contents was stirred at pH=8 - 9
with 8 g of SnO2 x 11H2O. In 2 h 20% of Wwas removed from solution, in 4 h - 34%, in7 h - 41%, and 24 h - 90-95%. The solution of(NH4)2MoO4 was filtered from SnO2 xnH2O through the sequence of Whatman N 1filter and 0.22 \i filter under suction, followedby precipitation of MOO3 by careful additionof cone. HNO3. The precipitate was washedwith water, dried at 100°C and calcinated at400°C for 6 hours. The contents of W inMoO3 purified by this technique became< 10 ppm according to ICP-MS and neutronactivation measurements.
3. SEPARATION OF FISSION PRODUCTMo-99
In a second process Mo-99 is obtained asa product of the neutron-induced fission ofuranium-235 (U-235) and has to be separatedfrom other fission products through multi-stepprocedure.Two versions of separation process forproduction of fission Mo-99 have beendeveloped on laboratory scale. Both versionsare based on sequential use of alumina- andanion exchange resin AG1-X8- filled columnsfor purification of Mo-99; they start with thesame steps of: U-235 target dissolution in hot8 M HNO3, its dilution to 0.5 M HN03 andretaining of Mo-99 on a large alumina column.The column is washed with water and dilutedNH4OH. Mo-99 is stripped off the columnwith 200 mL 1 M NH4OH followed by loadingthis solution onto the AG 1X8 column. 5-7 mgof NH4I spiked with 1-123 was added to Mo-99-containing solution before loading onto theAG 1X8 column in order to monitor thebehaviour of radioiodine contaminants. Thenext steps are different for each version ofseparation process.
Version 1. The AG 1X8 column is washedwith water and Mo-99 is eluted with 200 mLof 1 M HNO3. 94% of Mo-99 is recoveredfrom the column during this stage (65% isrecovered in the first 40 mL of HNO3). 25% ofinitial iodine amount is found as I2 in theeluted fraction, while 75% remains fixed onAG 1X8 column. Further purification steprequires adjusting the acid concentration ofthe eluate to 0.1 M by addition 7.6 g of NaOH
pellets before charging small alumina column(Fluka, 4 g, 1x6 cm) using gravitational flow.Mo-99 is almost quantitatively retained onalumina column (2% loss). The column iswashed with sequence of water, 15 mL 0.1 MKI, water, 0.01 M ammonia followed by finalelution of Mo-99 with 20 mL of 1 M NaOH.Overall recovery of Mo-99 is 80% and iodinebreakthrough is 0.2% of initial 1-123 activity.Sometimes the process was shortened byevaporating to dryness Mo-99-containing 200mL 1M HNO3 and final digestion of Mo-99 in20 mL of 1M NaOH. This permits to decreasethe required handling of Mo-99 and increaseMo-99 recovery by additional 5%.
Version 2. The AG 1X8 column is washedwith water and Mo-99 is eluted with 200 mLof 1 M NH4 carbonate. Recovery of Mo-99 is99% (81% comes off the column in first 20mL of NH4 carbonate). Only 0.5% of initialamount of iodine is found in the elutedfraction. Subsequently, the pH of the NH4
carbonate is adjusted to ~2 by careful additionof 26 mL cone. HNO3, solution is degassedunder vacuum, loaded at gravitational flow onsmall alumina column followed by the stepsdescribed in Version 2.Overall recovery of Mo-99 is 78%, iodinebreakthrough - 0.02% of initial 1-123 activity.The shortened process - evaporation todryness of NH4 carbonate with final digestionof Mo-99 in 20 mL of 1M NaOH allows toincrease Mo-99 yield till 89%.
We have to emphasise that the describedprocesses were carried out on laboratory scaleonly. Considerable variations in Mo-99 yieldsand levels of radioimpurities may be observedin high radiation fields at production level.
1. Semenov, M.I., Blokhin, A.A. andTaushkanov, V.P. Use of hydrated oxides ofmultivalent metals for effective removal oftungsten form molybdenum compoundsZh.Prikl.Khimii USSR., 57(7), 1984, p. 1501-1506
X..
ijO AU9817310
Production of Mo-99 in Research Reactors with the Use of UraniumTargets and Mo-98 Targets.
Report for Second International Conference on Isotopes,Sydney, Australia, October 12-16, 1997
A.S.Gerasimov, G.V.KiselevState Scientific Center of the Russian FederationInstitute of Theoretical and Experimental Physics
117259 Moscow, Russia, B.Cheremushkinskaya, 25phone/fax:(095)9306130
e-mail:[email protected][email protected]
Abstract
Modes of short-lived Tc-99 production for isotopic generators by irradiation ofmolyb-denum targets and from fission products of a special uranium targets are analysedin the report. Specific activity of the Tc-99 in various irradiation modes is calculated. Atneutron flux density 1014 cm^s-1 , 100 % enrichment of a target with Mo-98, and averagechord of a target of 5 mm, the specific activity 5.5 Curie/gram is reached. This value isquite acceptable to work isotopic generator. Thus, it is possible to produce Tc-99 fromthe molybdenum target if there is the reactor with thermal spectrum and rather highneutron flux. It is necessary to use highly enriched Mo-98 and target ensuring lowblocking for resonant neutrons. It is important that in Tc-99 production from Mo-98 inthermal reactor, the high-active impurity is not produced. The activity of impurity can bereduced by application of highly enriched Mo-98.
In production of Tc-99 from fission products, the specific activity varies over awide range with change of enrichment of an uranium targets. This permits to ensurerequired total activity of Tc-99 in target by choice a weight of a target and enrichment ofuranium depending on neutron flux density. With irradiation during 6 days, the specificactivity of Tc-99 is equal to 71 kilocurie per 1 gram of all molybdenum isotopes. This isseveral orders higher than in production from molybdenum target. Thus, Tc-99 fromfission products can be produced in reactor with low neutron flux, however this processrequires more complex radiochemical processing and is possible if there is radiochemicalproductions.
1.Introduction.
Among short-lived radionuclides of medical-diagnostic assignment, an importantrole plays Tc-99m with T1/2 = 6.02 hr and gamma-radiation with energy 140 keVconvenient for registration. The application such short-lived Tc-99m is based onprinciple of the isotopic generator. A necessary requirement for normal work of theisotopic generator is rather high concentration (or specific activity) of mother nuclide.Otherwise the activity of a daughter radionuclide in a solution extracted from thegenerator will be inadmissible low, or service life of the generator up to next recharge willbe too short.
In the isotopic generator Tc-99m a mother nuclide is Mo-99 (T1/2 = 66 hr). Therequired specific activity (in account on 1 gram of all molibdenium isotopes) is severalCuri/gram.
There are two methods of Mo-99 production for isotopic generators - frommolibdenium targets and from fission products of specially irradiated uranium targets.
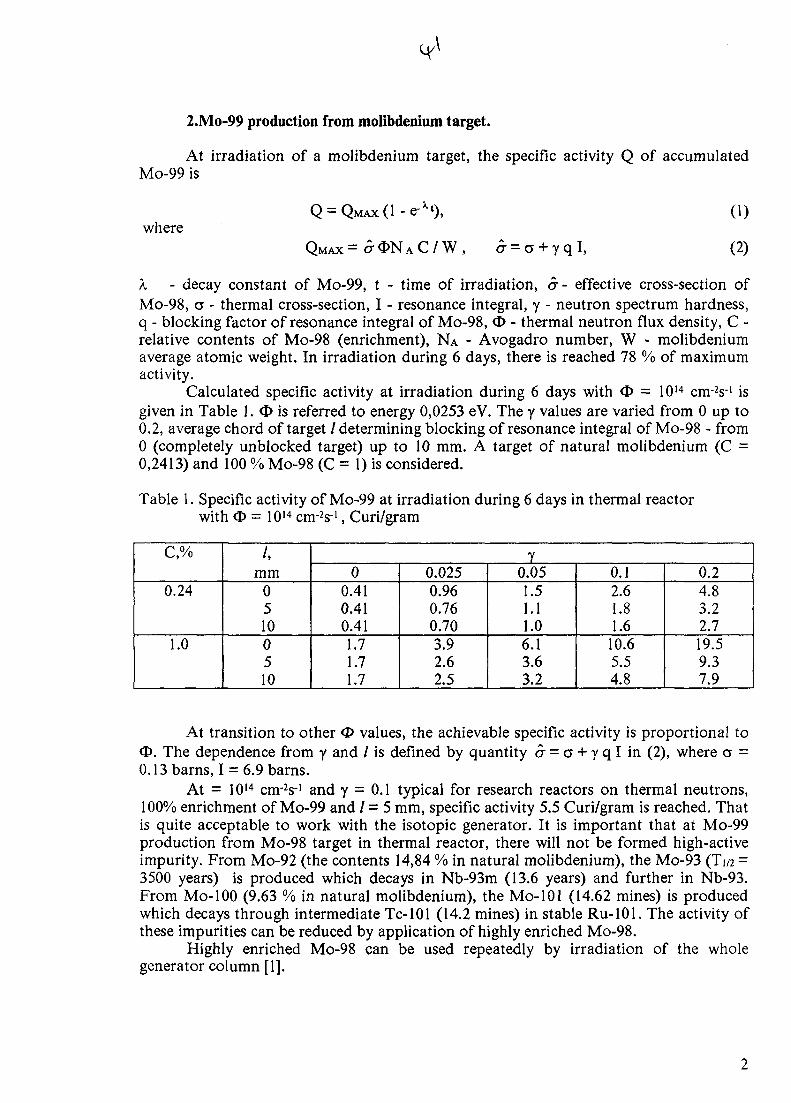
2.Mo-99 production from molibdenium target.
At irradiation of a molibdenium target, the specific activity Q of accumulatedMo-99 is
whereQ M A X = £ O N A C / W ,
(1)
(2)
A. - decay constant of Mo-99, t - time of irradiation, a- effective cross-section ofMo-98, a - thermal cross-section, I - resonance integral, y - neutron spectrum hardness,q - blocking factor of resonance integral of Mo-98, O - thermal neutron flux density, C -relative contents of Mo-98 (enrichment), NA - Avogadro number, W - molibdeniumaverage atomic weight. In irradiation during 6 days, there is reached 78 % of maximumactivity.
Calculated specific activity at irradiation during 6 days with O = 1014 cm^s-1 isgiven in Table 1. <t> is referred to energy 0,0253 eV. The y values are varied from 0 up to0.2, average chord of target / determining blocking of resonance integral of Mo-98 - from0 (completely unblocked target) up to 10 mm. A target of natural molibdenium (C =0,2413) and 100 % Mo-98 (C = 1) is considered.
Table 1. Specific activity of Mo-99 at irradiation during 6 days in thermal reactorwith <E> = 1014 cm^s-1, Curi/gram
c,%0.24
1.0
/,mm
05100510
Y0
0.410.410.411.71.71.7
0.0250.960.760.703.92.62.5
0.051.51.11.06.13.63.2
0.12.61.81.6
10.65.54.8
0.24.83.22.719.59.37.9
At transition to other <I> values, the achievable specific activity is proportional toO. The dependence from y and / is defined by quantity cr = a + y q I in (2), where o =0.13 barns, I = 6.9 barns.
At = 1014 cnr2s-' and y = 0.1 typical for research reactors on thermal neutrons,100% enrichment of Mo-99 and / = 5 mm, specific activity 5.5 Curi/gram is reached. Thatis quite acceptable to work with the isotopic generator. It is important that at Mo-99production from Mo-98 target in thermal reactor, there will not be formed high-activeimpurity. From Mo-92 (the contents 14,84 % in natural molibdenium), the Mo-93 (T1/2 =3500 years) is produced which decays in Nb-93m (13.6 years) and further in Nb-93.From Mo-100 (9.63 % in natural molibdenium), the Mo-101 (14.62 mines) is producedwhich decays through intermediate Tc-101 (14.2 mines) in stable Ru-101. The activity ofthese impurities can be reduced by application of highly enriched Mo-98.
Highly enriched Mo-98 can be used repeatedly by irradiation of the wholegenerator column [1].
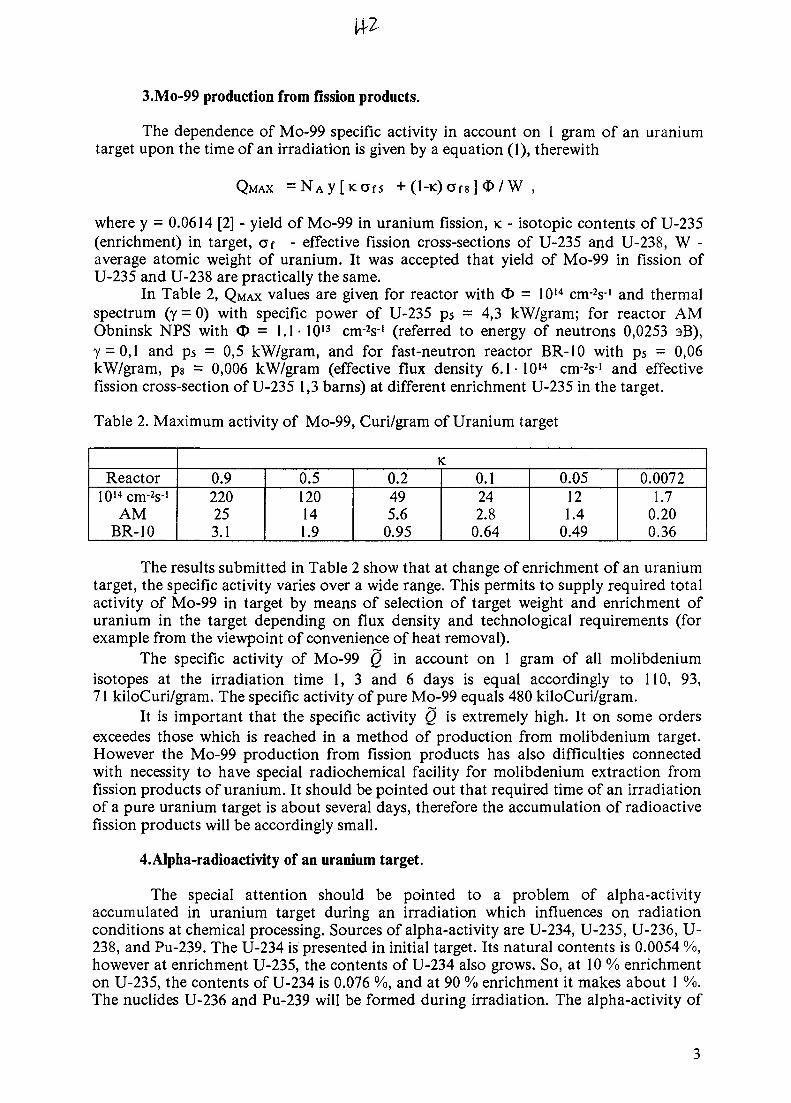
3.Mo-99 production from fission products.
The dependence of Mo-99 specific activity in account on 1 gram of an uraniumtarget upon the time of an irradiation is given by a equation (1), therewith
MAX = +(l-K)af8]<E>/W ,
where y = 0.0614 [2] - yield of Mo-99 in uranium fission, K - isotopic contents of U-235(enrichment) in target, Cf - effective fission cross-sections of U-235 and U-238, W -average atomic weight of uranium. It was accepted that yield of Mo-99 in fission ofU-235 and U-238 are practically the same.
In Table 2, QMAX values are given for reactor with O = 1014 cirr2s-' and thermalspectrum (y = 0) with specific power of U-235 ps = 4,3 kW/gram; for reactor AMObninsk NPS with <D = 1.1- 1013 cn rV (referred to energy of neutrons 0,0253 aB),Y = 0,l and ps = 0,5 kW/gram, and for fast-neutron reactor BR-10 with p5 = 0,06kW/gram, ps = 0,006 kW/gram (effective flux density 6.1 • 1014 cnr2s-' and effectivefission cross-section of U-235 1,3 barns) at different enrichment U-235 in the target.
Table 2. Maximum activity of Mo-99, Curi/gram of Uranium target
Reactor1014cm-2s-'
AMBR-10
K
0.9220253.1
0.5120141.9
0.2495.6
0.95
0.1242.8
0.64
0.05121.4
0.49
0.00721.7
0.200.36
The results submitted in Table 2 show that at change of enrichment of an uraniumtarget, the specific activity varies over a wide range. This permits to supply required totalactivity of Mo-99 in target by means of selection of target weight and enrichment ofuranium in the target depending on flux density and technological requirements (forexample from the viewpoint of convenience of heat removal).
The specific activity of Mo-99 Q in account on 1 gram of all molibdeniumisotopes at the irradiation time 1, 3 and 6 days is equal accordingly to 110, 93,71 kiloCuri/gram. The specific activity of pure Mo-99 equals 480 kiloCuri/gram.
It is important that the specific activity Q is extremely high. It on some ordersexceedes those which is reached in a method of production from molibdenium target.However the Mo-99 production from fission products has also difficulties connectedwith necessity to have special radiochemical facility for molibdenium extraction fromfission products of uranium. It should be pointed out that required time of an irradiationof a pure uranium target is about several days, therefore the accumulation of radioactivefission products will be accordingly small.
4.Alpha-radioactivity of an uranium target.
The special attention should be pointed to a problem of alpha-activityaccumulated in uranium target during an irradiation which influences on radiationconditions at chemical processing. Sources of alpha-activity are U-234, U-235, U-236, U-238, and Pu-239. The U-234 is presented in initial target. Its natural contents is 0.0054 %,however at enrichment U-235, the contents of U-234 also grows. So, at 10 % enrichmenton U-235, the contents of U-234 is 0.076 %, and at 90 % enrichment it makes about 1 %.The nuclides U-236 and Pu-239 will be formed during irradiation. The alpha-activity of
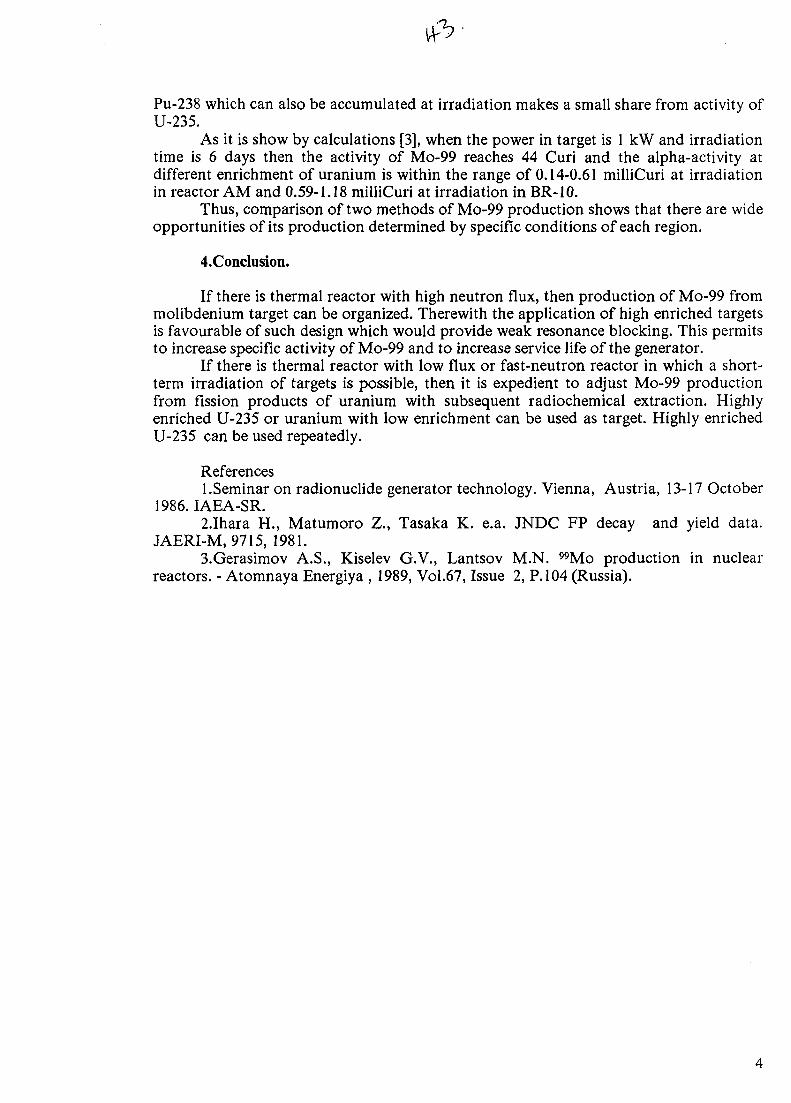
u-v
Pu-238 which can also be accumulated at irradiation makes a small share from activity ofU-235.
As it is show by calculations [3], when the power in target is 1 kW and irradiationtime is 6 days then the activity of Mo-99 reaches 44 Curi and the alpha-activity atdifferent enrichment of uranium is within the range of 0.14-0.61 milliCuri at irradiationin reactor AM and 0.59-1.18 milliCuri at irradiation in BR-10.
Thus, comparison of two methods of Mo-99 production shows that there are wideopportunities of its production determined by specific conditions of each region.
4.Conclusion.
If there is thermal reactor with high neutron flux, then production of Mo-99 frommolibdenium target can be organized. Therewith the application of high enriched targetsis favourable of such design which would provide weak resonance blocking. This permitsto increase specific activity of Mo-99 and to increase service life of the generator.
If there is thermal reactor with low flux or fast-neutron reactor in which a short-term irradiation of targets is possible, then it is expedient to adjust Mo-99 productionfrom fission products of uranium with subsequent radiochemical extraction. Highlyenriched U-235 or uranium with low enrichment can be used as target. Highly enrichedU-235 can be used repeatedly.
References1.Seminar on radionuclide generator technology. Vienna, Austria, 13-17 October
1986. IAEA-SR.2.1hara H., Matumoro Z., Tasaka K. e.a. JNDC FP decay and yield data.
JAERI-M, 9715, 1981.3.Gerasimov A.S., Kiselev G.V., Lantsov M.N. "Mo production in nuclear
reactors. - Atomnaya Energiya , 1989, Vol.67, Issue 2, P. 104 (Russia).
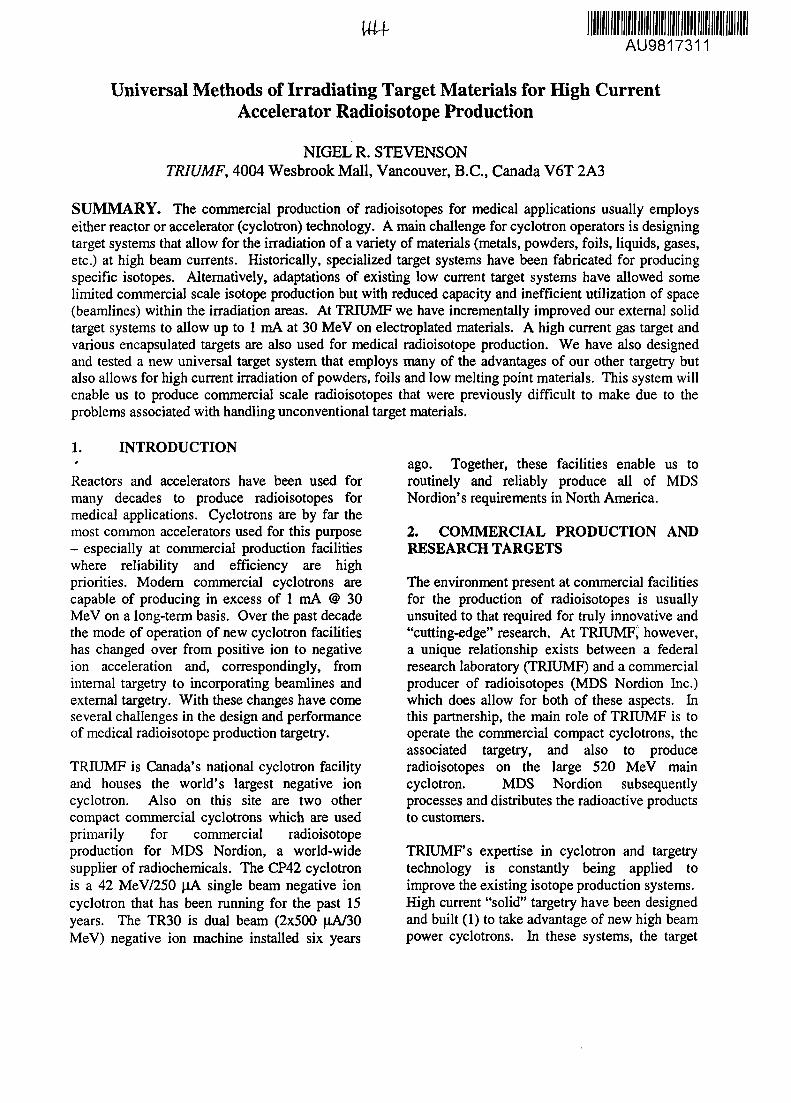
AU9817311
Universal Methods of Irradiating Target Materials for High CurrentAccelerator Radioisotope Production
NIGEL R. STEVENSONTRIUMF, 4004 Wesbrook Mall, Vancouver, B.C., Canada V6T 2A3
SUMMARY. The commercial production of radioisotopes for medical applications usually employseither reactor or accelerator (cyclotron) technology. A main challenge for cyclotron operators is designingtarget systems that allow for the irradiation of a variety of materials (metals, powders, foils, liquids, gases,etc.) at high beam currents. Historically, specialized target systems have been fabricated for producingspecific isotopes. Alternatively, adaptations of existing low current target systems have allowed somelimited commercial scale isotope production but with reduced capacity and inefficient utilization of space(beamlines) within the irradiation areas. At TRIUMF we have incrementally improved our external solidtarget systems to allow up to 1 mA at 30 MeV on electroplated materials. A high current gas target andvarious encapsulated targets are also used for medical radioisotope production. We have also designedand tested a new universal target system that employs many of the advantages of our other targetry butalso allows for high current irradiation of powders, foils and low melting point materials. This system willenable us to produce commercial scale radioisotopes that were previously difficult to make due to theproblems associated with handling unconventional target materials.
1. INTRODUCTION
Reactors and accelerators have been used formany decades to produce radioisotopes formedical applications. Cyclotrons are by far themost common accelerators used for this purpose- especially at commercial production facilitieswhere reliability and efficiency are highpriorities. Modern commercial cyclotrons arecapable of producing in excess of 1 mA @ 30MeV on a long-term basis. Over the past decadethe mode of operation of new cyclotron facilitieshas changed over from positive ion to negativeion acceleration and, correspondingly, frominternal targetry to incorporating beamlines andexternal targetry. With these changes have comeseveral challenges in the design and performanceof medical radioisotope production targetry.
TRIUMF is Canada's national cyclotron facilityand houses the world's largest negative ioncyclotron. Also on this site are two othercompact commercial cyclotrons which are usedprimarily for commercial radioisotopeproduction for MDS Nordion, a world-widesupplier of radiochemicals. The CP42 cyclotronis a 42 MeV/250 |iA single beam negative ioncyclotron that has been running for the past 15years. The TR30 is dual beam (2x500 jiA/30MeV) negative ion machine installed six years
ago. Together, these facilities enable us toroutinely and reliably produce all of MDSNordion's requirements in North America.
2. COMMERCIAL PRODUCTION ANDRESEARCH TARGETS
The environment present at commercial facilitiesfor the production of radioisotopes is usuallyunsuited to that required for truly innovative and"cutting-edge" research. At TRIUMF, however,a unique relationship exists between a federalresearch laboratory (TRIUMF) and a commercialproducer of radioisotopes (MDS Nordion Inc.)which does allow for both of these aspects. Inthis partnership, the main role of TRIUMF is tooperate the commercial compact cyclotrons, theassociated targetry, and also to produceradioisotopes on the large 520 MeV maincyclotron. MDS Nordion subsequentlyprocesses and distributes the radioactive productsto customers.
TRIUMF's expertise in cyclotron and targetrytechnology is constantly being applied toimprove the existing isotope production systems.High current "solid" targetry have been designedand built (1) to take advantage of new high beampower cyclotrons. In these systems, the target
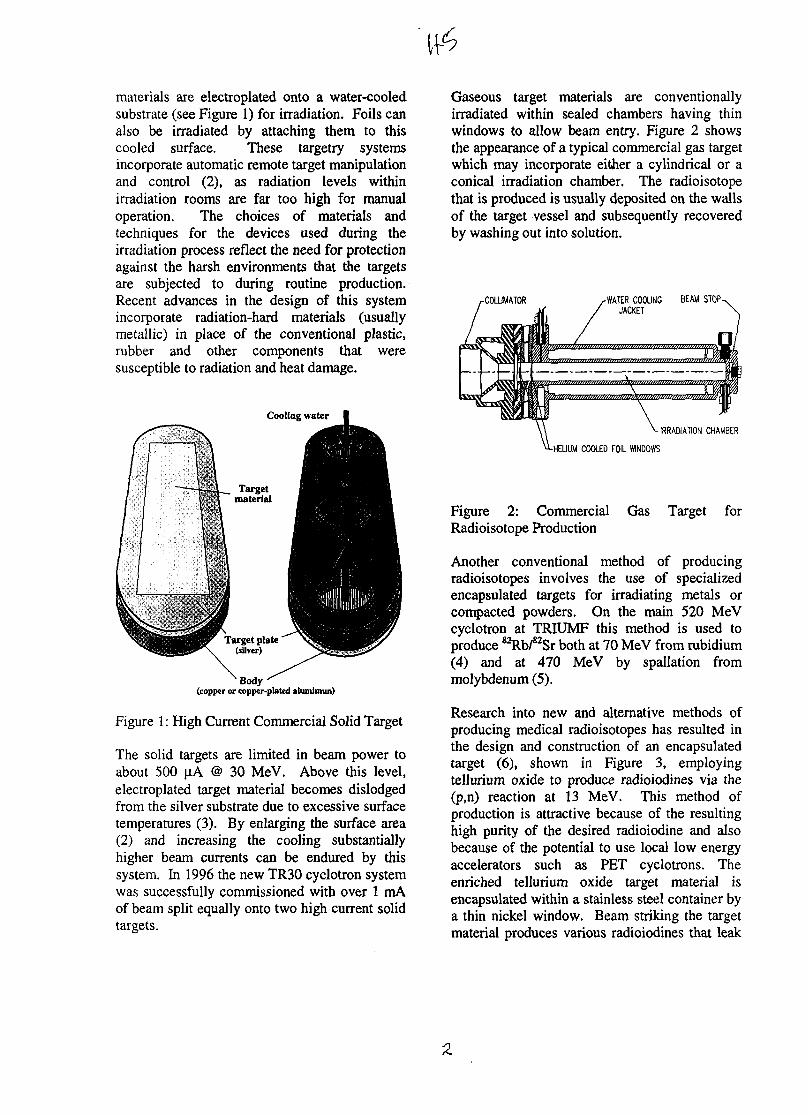
materials are electroplated onto a water-cooledsubstrate (see Figure 1) for irradiation. Foils canalso be irradiated by attaching them to thiscooled surface. These targetry systemsincorporate automatic remote target manipulationand control (2), as radiation levels withinirradiation rooms are far too high for manualoperation. The choices of materials andtechniques for the devices used during theirradiation process reflect the need for protectionagainst the harsh environments that the targetsare subjected to during routine production.Recent advances in the design of this systemincorporate radiation-hard materials (usuallymetallic) in place of the conventional plastic,rubber and other components that weresusceptible to radiation and heat damage.
Cooling water
Targetmaterial
Target plate(silver)
Body(copper or copper-plated aluminum)
Figure 1: High Current Commercial Solid Target
The solid targets are limited in beam power toabout 500 |aA @ 30 MeV. Above this level,electroplated target material becomes dislodgedfrom the silver substrate due to excessive surfacetemperatures (3). By enlarging the surface area(2) and increasing the cooling substantiallyhigher beam currents can be endured by thissystem. In 1996 the new TR30 cyclotron systemwas successfully commissioned with over 1 mAof beam split equally onto two high current solidtargets.
Gaseous target materials are conventionallyirradiated within sealed chambers having thinwindows to allow beam entry. Figure 2 showsthe appearance of a typical commercial gas targetwhich may incorporate either a cylindrical or aconical irradiation chamber. The radioisotopethat is produced is usually deposited on the wallsof the target vessel and subsequently recoveredby washing out into solution.
rCOLUMATOR WATER COOLING BEAM STOP-JACKET
IRRADIATION CHAMBER
HELIUM COOLED FOIL WINDOWS
Figure 2: Commercial Gas Target forRadioisotope Production
Another conventional method of producingradioisotopes involves the use of specializedencapsulated targets for irradiating metals orcompacted powders. On the main 520 MeVcyclotron at TRIUMF this method is used toproduce 82Rb/82Sr both at 70 MeV from rubidium(4) and at 470 MeV by spallation frommolybdenum (5).
Research into new and alternative methods ofproducing medical radioisotopes has resulted inthe design and construction of an encapsulatedtarget (6), shown in Figure 3, employingtellurium oxide to produce radioiodines via the(p,n) reaction at 13 MeV. This method ofproduction is attractive because of the resultinghigh purity of the desired radioiodine and alsobecause of the potential to use local low energyaccelerators such as PET cyclotrons. Theenriched tellurium oxide target material isencapsulated within a stainless steel container bya thin nickel window. Beam striking the targetmaterial produces various radioiodines that leak
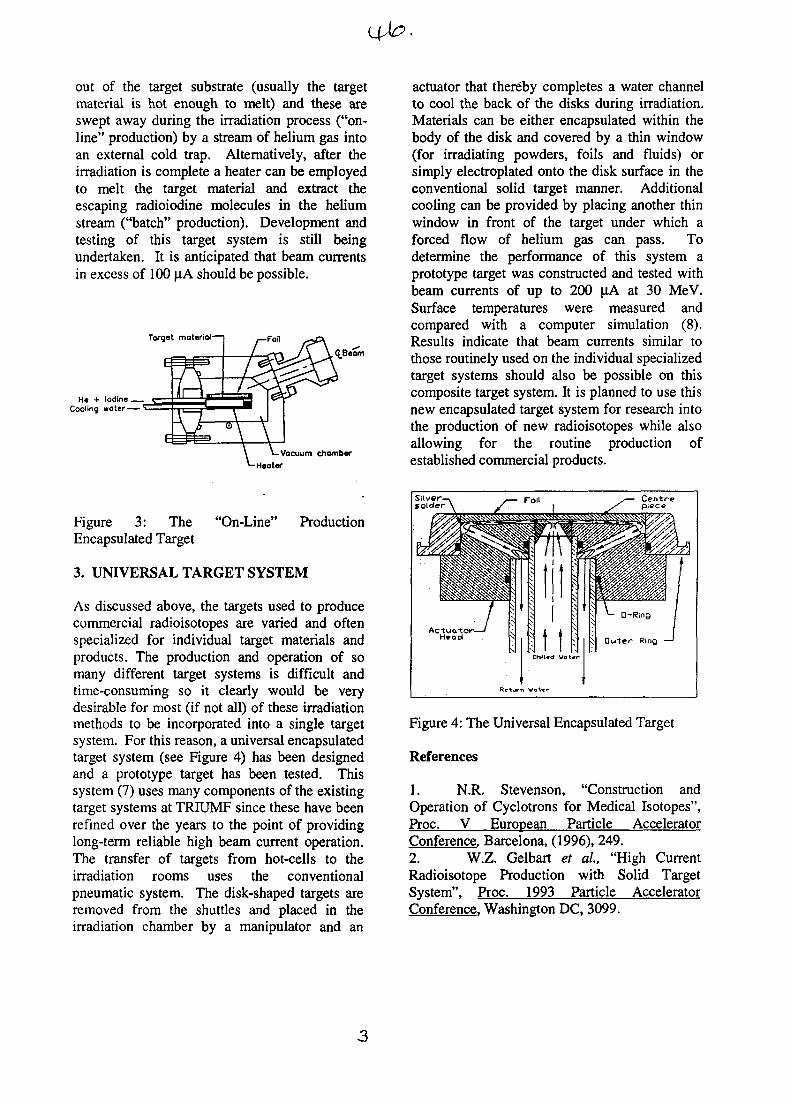
out of the target substrate (usually the targetmaterial is hot enough to melt) and these areswept away during the irradiation process ("on-line" production) by a stream of helium gas intoan external cold trap. Alternatively, after theirradiation is complete a heater can be employedto melt the target material and extract theescaping radioiodine molecules in the heliumstream ("batch" production). Development andtesting of this target system is still beingundertaken. It is anticipated that beam currentsin excess of 100 \iA should be possible.
Torget moteriol—
He + Iodine _Cooling *oter——
QJJeom
Vacuum chamberHeoter
actuator that thereby completes a water channelto cool the back of the disks during irradiation.Materials can be either encapsulated within thebody of the disk and covered by a thin window(for irradiating powders, foils and fluids) orsimply electroplated onto the disk surface in theconventional solid target manner. Additionalcooling can be provided by placing another thinwindow in front of the target under which aforced flow of helium gas can pass. Todetermine the performance of this system aprototype target was constructed and tested withbeam currents of up to 200 | A at 30 MeV.Surface temperatures were measured andcompared with a computer simulation (8).Results indicate that beam currents similar tothose routinely used on the individual specializedtarget systems should also be possible on thiscomposite target system. It is planned to use thisnew encapsulated target system for research intothe production of new radioisotopes while alsoallowing for the routine production ofestablished commercial products.
Figure 3: TheEncapsulated Target
"On-Line" Production
3. UNIVERSAL TARGET SYSTEM
As discussed above, the targets used to producecommercial radioisotopes are varied and oftenspecialized for individual target materials andproducts. The production and operation of somany different target systems is difficult andtime-consuming so it clearly would be verydesirable for most (if not all) of these irradiationmethods to be incorporated into a single targetsystem. For this reason, a universal encapsulatedtarget system (see Figure 4) has been designedand a prototype target has been tested. Thissystem (7) uses many components of the existingtarget systems at TRIUMF since these have beenrefined over the years to the point of providinglong-term reliable high beam current operation.The transfer of targets from hot-cells to theirradiation rooms uses the conventionalpneumatic system. The disk-shaped targets areremoved from the shuttles and placed in theirradiation chamber by a manipulator and an
ChtHvd Votvr-
Figure 4: The Universal Encapsulated Target
References
1. N.R. Stevenson, "Construction andOperation of Cyclotrons for Medical Isotopes",Proc. V European Particle AcceleratorConference. Barcelona, (1996), 249.2. W.Z. Gelbart et al, "High CurrentRadioisotope Production with Solid TargetSystem", Proc. 1993 Particle AcceleratorConference. Washington DC, 3099.
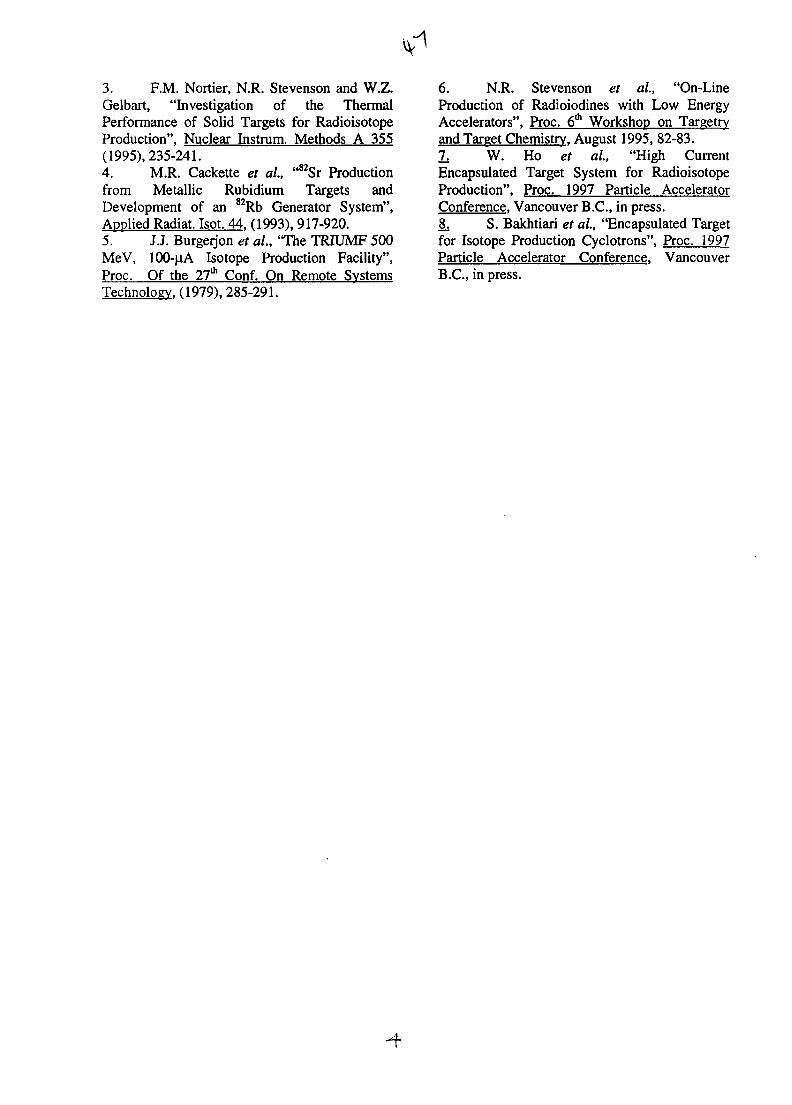
3. F.M. Nortier, N.R. Stevenson and W.Z.Gelbart, "Investigation of the ThermalPerformance of Solid Targets for RadioisotopeProduction", Nuclear Instrum. Methods A 355(1995), 235-241.4. M.R. Cackette et al, "82Sr Productionfrom Metallic Rubidium Targets andDevelopment of an 82Rb Generator System",Applied Radiat. Isot. 44. (1993), 917-920.5. J.J. Burgerjon et al., "The TRIUMF 500MeV, 100-}iA Isotope Production Facility",Proc. Of the 27th Conf. On Remote SystemsTechnology. (1979), 285-291.
6. N.R. Stevenson et al., "On-LineProduction of Radioiodines with Low EnergyAccelerators", Proc. 6th Workshop on Targetryand Target Chemistry. August 1995, 82-83.2, W. Ho et al., "High CurrentEncapsulated Target System for RadioisotopeProduction", Proc. 1997 Particle AcceleratorConference. Vancouver B.C., in press.8. S. Bakhtiari et al., "Encapsulated Targetfor Isotope Production Cyclotrons", Proc. 1997Particle Accelerator Conference. VancouverB.C., in press.
AU9817312
Radiopharmaceuticals in Positron Emission Tomography:Radioisotope Production and Radiolabelling Procedures
at the Austin & Repatriation Medical Centre
H.J. TOCHON-DANGUY, J.I. SACHINIDIS, J.G. CHAN & A.M. SCOTT. Centre For PETand Ludwig Institute for Cancer Research, Austin & Repatriation Medical Centre,
Melbourne Victoria 3084, Australia
SUMMARY. Positron Emission Tomography (PET) is an imaging technique to study physiological processesin vivo using compounds labelled with short-lived positron-emitting radioisotopes. The Austin & RepatriationMedical Centre (A&RMC) Centre for PET is equipped with a facility consisting of radioisotope production(cyclotron), radiolabelling production (automated synthesis) and quality control laboratory as an integratedunit. The Centre for PET has been in operation for six year and produces a range of radiotracers labelled with15O, 13N, "C and 18F for clinical and research studies in the fields of oncology, cardiology, neurology,psychiatry and brain activation.
1. INTRODUCTION
Positron emission tomography (PET) is a relativelynew technique for imaging the distribution ofradiolabelled Pharmaceuticals and biochemicaltracers within the body. PET offers the uniquepossibility of studying metabolic and physiologicalprocesses in living human subjects withoutdisturbing the system under investigation (1). Thetechnique uses short-lived radioisotopes to labelsubstances which occur naturally in the body.One of the attractive aspects of PET is that theradioactive tracer can be labelled with short-livedradioisotopes of the natural elements of thebiochemical constituents of the body. For example,natural atoms of carbon, nitrogen and oxygen arereplaced with the short-lived positron-emittingradioisotopes carbon-11 (^=20.4 min), nitrogen-13(tij=10 min) and oxygen-15 (t^=2 min). In addition,fluorine-18 (V=109.6 min) can be exchanged forhydrogen in the molecule.This article describes the basic principles of the PETtechnique and reviews the cyclotron-producedradioisotopes and radiolabelling procedures of theARMC PET Centre.
2. BASIC PRINCIPLES OF PET
In a typical PET experiment, a very small amount oflabelled compound (called radiopharmaceutical orradiotracer) is introduced into the patient usually byintravenous injection. During its decay process, the
radionuclide emits a positron which, after travellinga short distance (3-5 mm), encounters an electronfrom the surrounding environment. The twoparticles combine and "annihilate" each other,resulting in the emission in opposite directions oftwo gamma rays of 511 KeV each. The imageacquisition is based on the external detection, incoincidence, of these /-rays. Therefore thelocalisation of the positron-emitting radionuclidesinside the patient and the concentration of the tracerin the tissue can be measured with the PET scanner.
The commercial PET scanner (Siemens/CTI951/3R) installed at the Austin & RepatriationMedical Centre in Melbourne comprises of 16 ringsof bismuth germanate (BGO) detectors, covering anaxial length of 10.8 cm with a ring aperture of 56.7cm in diameter. The cyclotron in operation at thePET Centre (2) is a negative ion design (Cyclone10/5 from ION BEAM APPLICATIONS, Belgium)which accelerates protons (FT ion) to 10 MeV anddeuterons (D' ion) to 5 MeV.
3. CYCLOTRON PRODUCEDRADIONUCLIDES
The energy of the particle and the beam current, aswell as the cross section of the nuclear reactionitself, determine the quantity of radionuclide thatcan be produced in any time period. Appropriateamounts of the four positron emitters commonlyused in PET can be obtained with 10 MeV protons
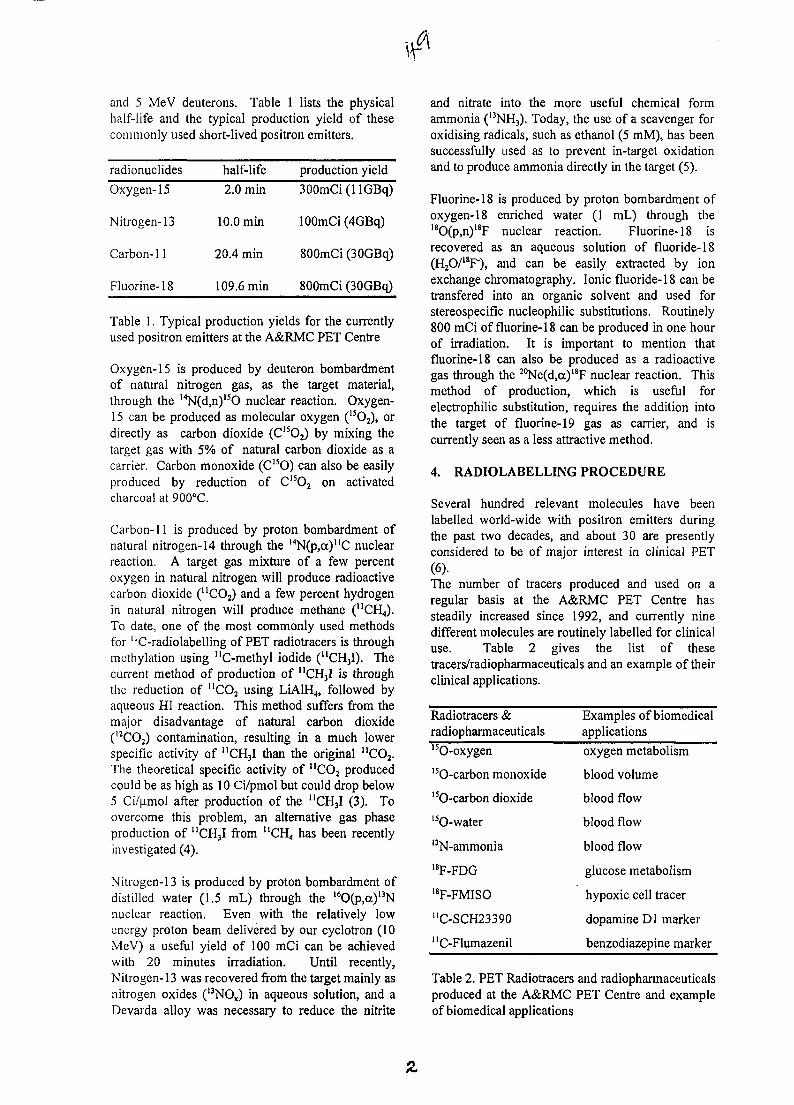
and 5 MeV deuterons. Table 1 lists the physicalhalf-life and the typical production yield of thesecommonly used short-lived positron emitters.
radionuclides
Oxygen-15
Nitrogen-13
Carbon-11
Fluorine-18
half-life
2.0 min
10.0 min
20.4 min
109.6 min
production yield
300mCi(llGBq)
lOOmCi (4GBq)
800mCi (30GBq)
800mCi (30GBq)
Table 1. Typical production yields for the currentlyused positron emitters at the A&RMC PET Centre
Oxygen-15 is produced by deuteron bombardmentof natural nitrogen gas, as the target material,through the 14N(d,n)15O nuclear reaction. Oxygen-15 can be produced as molecular oxygen (15O2), ordirectly as carbon dioxide (CI5O2) by mixing thetarget gas with 5% of natural carbon dioxide as acarrier. Carbon monoxide (C1SO) can also be easilyproduced by reduction of C15O2 on activatedcharcoal at 900°C.
Carbon-11 is produced by proton bombardment ofnatural nitrogen-14 through the 14N(p,a)"C nuclearreaction. A target gas mixture of a few percentoxygen in natural nitrogen will produce radioactivecarbon dioxide (llCO2) and a few percent hydrogenin natural nitrogen will produce methane ("CH4).To date, one of the most commonly used methodsfor "C-radiolabelling of PET radiotracers is throughmethylation using uC-methyl iodide (UCH3I). Thecurrent method of production of "CH3I is throughthe reduction of "CO2 using LiAlH4, followed byaqueous HI reaction. This method suffers from themajor disadvantage of natural carbon dioxide(12CO2) contamination, resulting in a much lowerspecific activity of nCH3I than the original "CO2.The theoretical specific activity of "CO2 producedcould be as high as 10 Ci/pmol but could drop below5 Ci/umol after production of the nCH3I (3). Toovercome this problem, an alternative gas phaseproduction of "CH3I from "CH4 has been recentlyinvestigated (4).
Nitrogen-13 is produced by proton bombardment ofdistilled water (1.5 mL) through the 16O(p,cc)l3Nnuclear reaction. Even with the relatively lowenergy proton beam delivered by our cyclotron (10MeV) a useful yield of 100 mCi can be achievedwith 20 minutes irradiation. Until recently,Nitrogen-13 was recovered from the target mainly asnitrogen oxides (13NOX) in aqueous solution, and aDevarda alloy was necessary to reduce the nitrite
and nitrate into the more useful chemical formammonia (13NH3). Today, the use of a scavenger foroxidising radicals, such as ethanol (5 mM), has beensuccessfully used as to prevent in-target oxidationand to produce ammonia directly in the target (5).
Fluorine-18 is produced by proton bombardment ofoxygen-18 enriched water (1 mL) through the18O(p,n)18F nuclear reaction. Fluorine-18 isrecovered as an aqueous solution of fluoride-18(H2O/18F'), and can be easily extracted by ionexchange chromatography. Ionic fluoride-18 can betransfered into an organic solvent and used forstereospecific nucleophilic substitutions. Routinely800 mCi of fluorine-18 can be produced in one hourof irradiation. It is important to mention thatfluorine-18 can also be produced as a radioactivegas through the 20Ne(d,a)18F nuclear reaction. Thismethod of production, which is useful forelectrophilic substitution, requires the addition intothe target of fluorine-19 gas as carrier, and iscurrently seen as a less attractive method.
4. RADIOLABELLING PROCEDURE
Several hundred relevant molecules have beenlabelled world-wide with positron emitters duringthe past two decades, and about 30 are presentlyconsidered to be of major interest in clinical PET(6).The number of tracers produced and used on aregular basis at the A&RMC PET Centre hassteadily increased since 1992, and currently ninedifferent molecules are routinely labelled for clinicaluse. Table 2 gives the list of thesetracers/radiopharmaceuticals and an example of theirclinical applications.
Radiotracers &radiopharmaceuticals
Examples of biomedicalapplications
l5O-oxygenI5O-carbon monoxide15O-carbon dioxide15O-water13N-ammonia18F-FDG18F-FMISO
"C-SCH23390
"C-Flumazenil
oxygen metabolism
blood volume
blood flow
blood flow
blood flow
glucose metabolism
hypoxic cell tracer
dopamine D1 marker
benzodiazepine marker
Table 2. PET Radiotracers and radiopharmaceuticalsproduced at the A&RMC PET Centre and exampleof biomedical applications
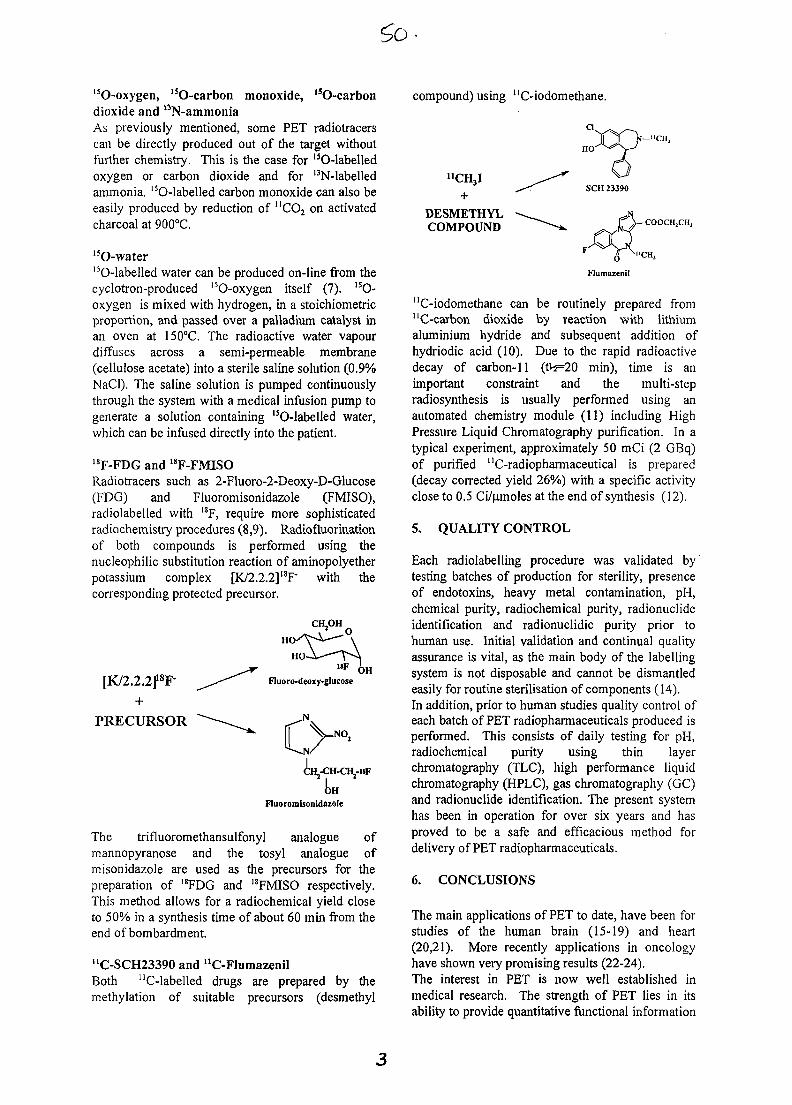
5b-
15O-oxygen, lsO-carbon monoxide, l50-carbon compound) using "C-iodomethane.dioxide and lJN-ammoniaAs previously mentioned, some PET radiotracerscan be directly produced out of the target withoutfurther chemistry. This is the case for 15O-labelledoxygen or carbon dioxide and for 13N-labelled nCH3Iammonia. '5O-labelled carbon monoxide can also be +easily produced by reduction of nCO2 on activatedcharcoal at 900°C.
DESMETHYLCOMPOUND
15O-water15O-labelled water can be produced on-line from thecyclotron-produced lsO-oxygen itself (7). 15O-oxygen is mixed with hydrogen, in a stoichiometricproportion, and passed over a palladium catalyst inan oven at 150°C. The radioactive water vapourdiffuses across a semi-permeable membrane(cellulose acetate) into a sterile saline solution (0.9%NaCl). The saline solution is pumped continuouslythrough the system with a medical infusion pump togenerate a solution containing 15O-labelled water,which can be infused directly into the patient.
18F-FDG and 18F-FMISORadiotracers such as 2-Fluoro-2-Deoxy-D-Glucose(FDG) and Fluoromisonidazole (FMISO),radiolabelled with I8F, require more sophisticatedradiochemistry procedures (8,9). Radiofluorinationof both compounds is performed using thenucleophilic substitution reaction of aminopolyetherpotassium complex [K/2.2.2]18F" with thecorresponding protected precursor.
CHjOH
HO
Fluoro-deoxy-glucose
NO,
OH[K/2.2.2]18F
PRECURSOR
OHFluoromisonidazole
The trifluoromethansulfonyl analogue ofmannopyranose and the tosyl analogue ofmisonidazole are used as the precursors for thepreparation of 18FDG and 18FMISO respectively.This method allows for a radiochemical yield closeto 50% in a synthesis time of about 60 min from theend of bombardment.
"C-SCH23390 and "C-FlumazenilBoth "C-labelled drugs are prepared by themethylation of suitable precursors (desmethyl
— "CH,
COOCHXH,
"C-iodomethane can be routinely prepared from"C-carbon dioxide by reaction with lithiumaluminium hydride and subsequent addition ofhydriodic acid (10). Due to the rapid radioactivedecay of carbon-11 (fo=20 min), time is animportant constraint and the multi-stepradiosynthesis is usually performed using anautomated chemistry module (11) including HighPressure Liquid Chromatography purification. In atypical experiment, approximately 50 mCi (2 GBq)of purified "C-radiopharmaceutical is prepared(decay corrected yield 26%) with a specific activityclose to 0.5 Ci/umoles at the end of synthesis (12).
5. QUALITY CONTROL
Each radiolabelling procedure was validated bytesting batches of production for sterility, presenceof endotoxins, heavy metal contamination, pH,chemical purity, radiochemical purity, radionuclideidentification and radionuclidic purity prior tohuman use. Initial validation and continual qualityassurance is vital, as the main body of the labellingsystem is not disposable and cannot be dismantledeasily for routine sterilisation of components (14).In addition, prior to human studies quality control ofeach batch of PET radiopharmaceuticals produced isperformed. This consists of daily testing for pH,radiochemical purity using thin layerchromatography (TLC), high performance liquidchromatography (HPLC), gas chromatography (GC)and radionuclide identification. The present systemhas been in operation for over six years and hasproved to be a safe and efficacious method fordelivery of PET radiopharmaceuticals.
6. CONCLUSIONS
The main applications of PET to date, have been forstudies of the human brain (15-19) and heart(20,21). More recently applications in oncologyhave shown very promising results (22-24).The interest in PET is now well established inmedical research. The strength of PET lies in itsability to provide quantitative functional information
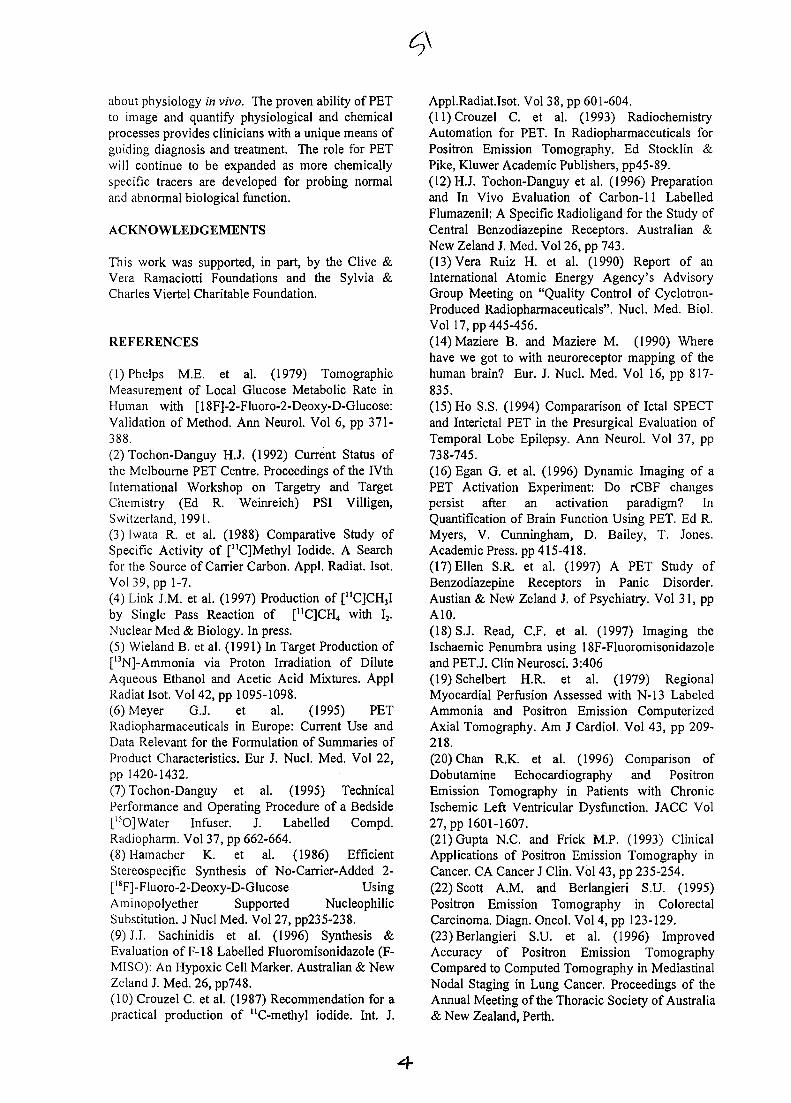
about physiology in vivo. The proven ability of PETto image and quantify physiological and chemicalprocesses provides clinicians with a unique means ofguiding diagnosis and treatment. The role for PETwill continue to be expanded as more chemicallyspecific tracers are developed for probing normaland abnormal biological function.
ACKNOWLEDGEMENTS
This work was supported, in part, by the Clive &Vera Ramaciotti Foundations and the Sylvia &Charles Viertel Charitable Foundation.
REFERENCES
(l)Phelps M.E. et al. (1979) TomographicMeasurement of Local Glucose Metabolic Rate inHuman with [18F]-2-Fluoro-2-Deoxy-D-Glucose:Validation of Method. Ann Neurol. Vol 6, pp 371-388.(2) Tochon-Danguy HJ. (1992) Current Status ofthe Melbourne PET Centre. Proceedings of the IVthInternational Workshop on Targetry and TargetChemistry (Ed R. Weinreich) PSI Villigen,Switzerland, 1991.(3) Iwata R. et al. (1988) Comparative Study ofSpecific Activity of [uC]MethyI Iodide. A Searchfor the Source of Carrier Carbon. Appl. Radiat. Isot.Vol39,pp 1-7.(4) Link J.M. et al. (1997) Production of ["C]CH3Iby Single Pass Reaction of [nC]CH4 with I2.Nuclear Med & Biology. In press.(5) Wieland B. et al. (1991) In Target Production of[I3N]-Ammonia via Proton Irradiation of DiluteAqueous Ethanol and Acetic Acid Mixtures. ApplRadiat Isot. Vol 42, pp 1095-1098.(6) Meyer G.J. et al. (1995) PETRadiopharmaceuticals in Europe: Current Use andData Relevant for the Formulation of Summaries ofProduct Characteristics. Eur J. Nucl. Med. Vol 22,pp 1420-1432.(7) Tochon-Danguy et al. (1995) TechnicalPerformance and Operating Procedure of a Bedside['5O]Water Infuser. J. Labelled Compd.Radiopharm. Vol 37, pp 662-664.(8)Hamacher K. et al. (1986) EfficientStereospecific Synthesis of No-Carrier-Added 2-[' 8F] -Fluoro-2-Deoxy-D-Glucose UsingAminopolyether Supported NucleophilicSubstitution. J Nucl Med. Vol 27, pp235-238.(9) J.I. Sachinidis et al. (1996) Synthesis &Evaluation of F-18 Labelled Fluoromisonidazole (F-MISO): An Hypoxic Cell Marker. Australian & NewZeland J. Med. 26, pp748.(10) Crouzel C. et al. (1987) Recommendation for apractical production of "C-methyl iodide. Int. J.
Appl.Radiat.Isot. Vol 38, pp 601-604.(11) Crouzel C. et al. (1993) RadiochemistryAutomation for PET. In Radiopharmaceuticals forPositron Emission Tomography. Ed Stocklin &Pike, Kluwer Academic Publishers, pp45-89.(12)H.J. Tochon-Danguy et al. (1996) Preparationand In Vivo Evaluation of Carbon-11 LabelledFlumazenil: A Specific Radioligand for the Study ofCentral Benzodiazepine Receptors. Australian &New Zeland J. Med. Vol 26, pp 743.(13) Vera Ruiz H. et al. (1990) Report of anInternational Atomic Energy Agency's AdvisoryGroup Meeting on "Quality Control of Cyclotron-Produced Radiopharmaceuticals". Nucl. Med. Biol.Vol 17, pp 445-456.(14)Maziere B. and Maziere M. (1990) Wherehave we got to with neuroreceptor mapping of thehuman brain? Eur. J. Nucl. Med. Vol 16, pp 817-835.(15) Ho S.S. (1994) Compararison of Ictal SPECTand Interictal PET in the Presurgical Evaluation ofTemporal Lobe Epilepsy. Ann Neurol. Vol 37, pp738-745.(16)Egan G. et al. (1996) Dynamic Imaging of aPET Activation Experiment: Do rCBF changespersist after an activation paradigm? InQuantification of Brain Function Using PET. Ed R.Myers, V. Cunningham, D. Bailey, T. Jones.Academic Press, pp 415-418.(17) Ellen S.R. et al. (1997) A PET Study ofBenzodiazepine Receptors in Panic Disorder.Austian & New Zeland J. of Psychiatry. Vol 31, ppA10.(18)S.J. Read, C.F. et al. (1997) Imaging theIschaemic Penumbra using 18F-Fluoromisonidazoleand PETJ. Clin Neurosci. 3:406(19) Schelbert H.R. et al. (1979) RegionalMyocardial Perfusion Assessed with N-13 LabeledAmmonia and Positron Emission ComputerizedAxial Tomography. Am J Cardiol. Vol 43, pp 209-218.(20) Chan R.K. et al. (1996) Comparison ofDobutamine Echocardiography and PositronEmission Tomography in Patients with ChronicIschemic Left Ventricular Dysfunction. JACC Vol27, pp 1601-1607.(21) Gupta N.C. and Frick M.P. (1993) ClinicalApplications of Positron Emission Tomography inCancer. CA Cancer J Clin. Vol 43, pp 235-254.(22) Scott A.M. and Berlangieri S.U. (1995)Positron Emission Tomography in ColorectalCarcinoma. Diagn. Oncol. Vol 4, pp 123-129.(23) Berlangieri S.U. et al. (1996) ImprovedAccuracy of Positron Emission TomographyCompared to Computed Tomography in MediastinalNodal Staging in Lung Cancer. Proceedings of theAnnual Meeting of the Thoracic Society of Australia& New Zealand, Perth.
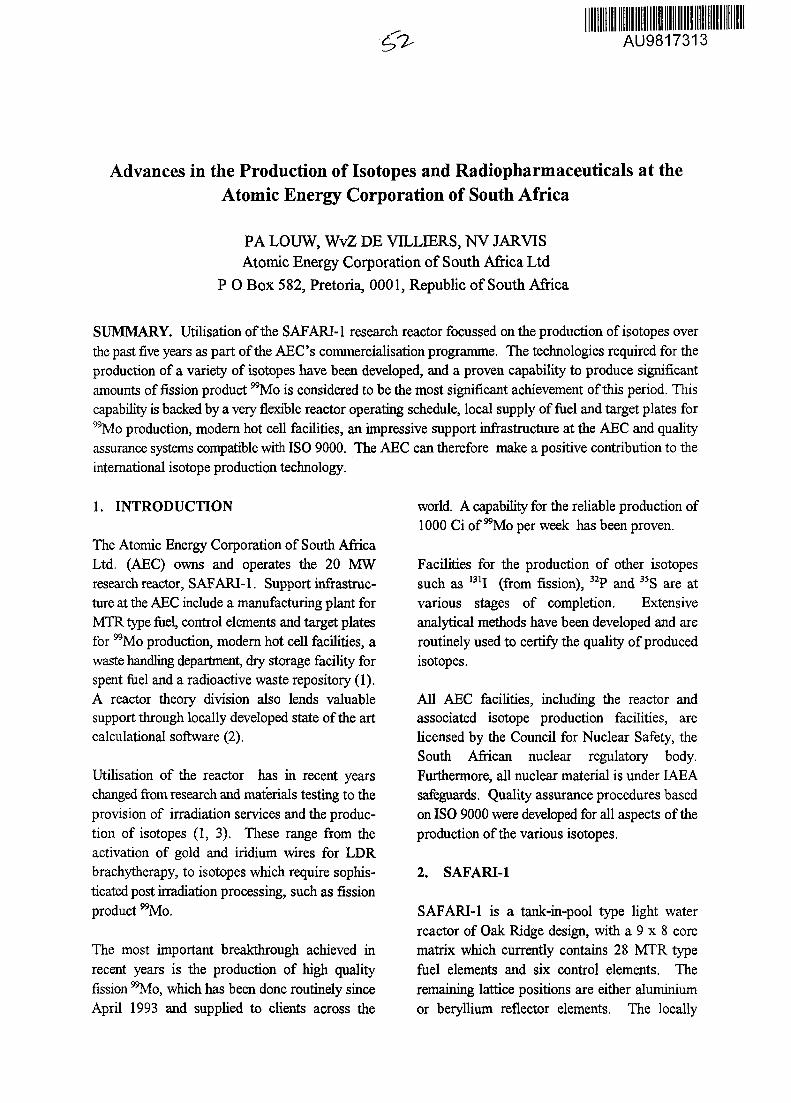
AU9817313
Advances in the Production of Isotopes and Radiopharmaceuticals at theAtomic Energy Corporation of South Africa
PA LOUW, WvZ DE VILLIERS, NV JARVISAtomic Energy Corporation of South Africa Ltd
P O Box 582, Pretoria, 0001, Republic of South Africa
SUMMARY. Utilisation of the SAFARI-1 research reactor focussed on the production of isotopes overthe past five years as part of the AEC's commercialisation programme. The technologies required for theproduction of a variety of isotopes have been developed, and a proven capability to produce significantamounts of fission product "Mo is considered to be the most significant achievement of this period. Thiscapability is backed by a very flexible reactor operating schedule, local supply of fuel and target plates for"Mo production, modern hot cell facilities, an impressive support infrastructure at the AEC and qualityassurance systems compatible with ISO 9000. The AEC can therefore make a positive contribution to theinternational isotope production technology.
1. INTRODUCTION
The Atomic Energy Corporation of South AfricaLtd. (AEC) owns and operates the 20 MWresearch reactor, SAFARI-1. Support infrastruc-ture at the AEC include a manufacturing plant forMTRtype fuel, control elements and target platesfor "Mo production, modern hot cell facilities, awaste handling department, dry storage facility forspent fuel and a radioactive waste repository (1).A reactor theory division also lends valuablesupport through locally developed state of the artcalculation^ software (2).
Utilisation of the reactor has in recent yearschanged from research and materials testing to theprovision of irradiation services and the produc-tion of isotopes (1, 3). These range from theactivation of gold and iridium wires for LDRbrachytherapy, to isotopes which require sophis-ticated post irradiation processing, such as fissionproduct "Mo.
The most important breakthrough achieved inrecent years is the production of high qualityfission "Mo, which has been done routinely sinceApril 1993 and supplied to clients across the
world. A capability for the reliable production of1000 Ci of "Mo per week has been proven.
Facilities for the production of other isotopessuch as 131I (from fission), 32P and 35S are atvarious stages of completion. Extensiveanalytical methods have been developed and areroutinely used to certify the quality of producedisotopes.
All AEC facilities, including the reactor andassociated isotope production facilities, arelicensed by the Council for Nuclear Safety, theSouth African nuclear regulatory body.Furthermore, all nuclear material is under IAEAsafeguards. Quality assurance procedures basedon ISO 9000 were developed for all aspects of theproduction of the various isotopes.
2. SAFARI-1
SAFARI-1 is a tank-in-pool type light waterreactor of Oak Ridge design, with a 9 x 8 corematrix which currently contains 28 MTR typefuel elements and six control elements. Theremaining lattice positions are either aluminiumor beryllium reflector elements. The locally
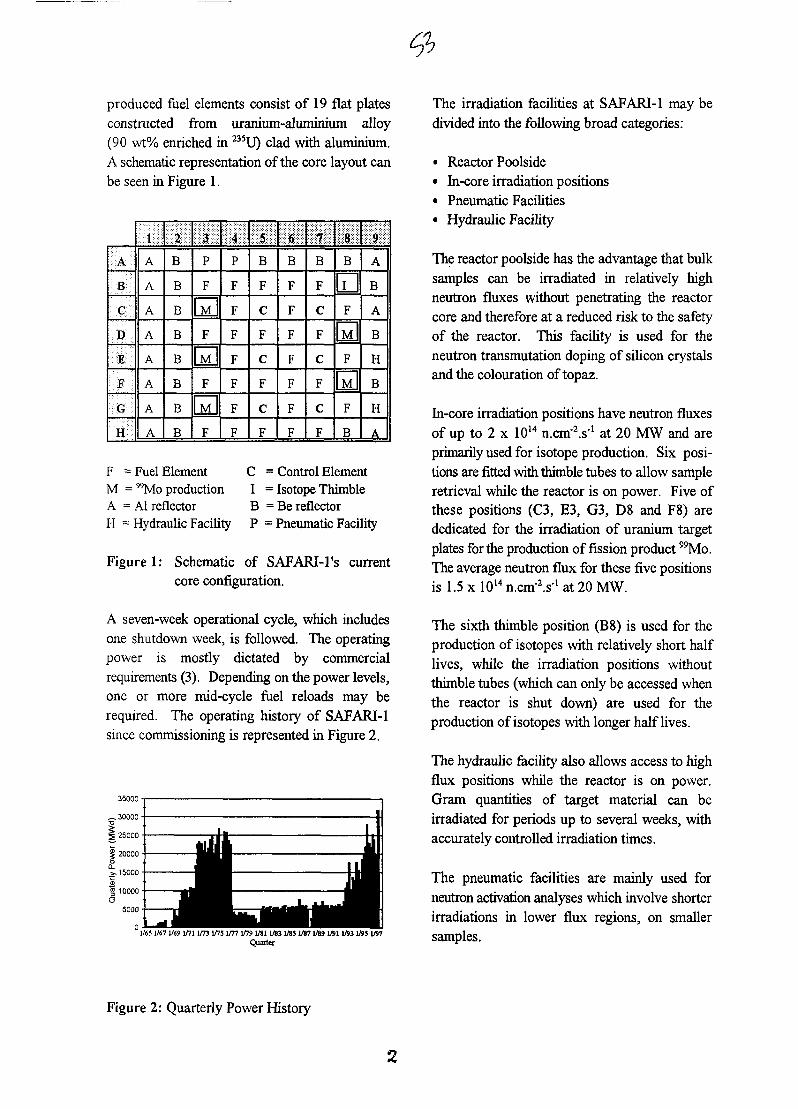
produced fuel elements consist of 19 flat platesconstructed from uranium-aluminium alloy(90 wt% enriched in 235U) clad with aluminium.A schematic representation of the core layout canbe seen in Figure 1.
A
B
C
D
E
F
G
H
1
A
A
A
A
A
A
A
A
2
B
B
B
B
B
B
B
B
3
P
F
[~M~F
M
F
F
4
P
F
F
F
F
F
F
F
5
B
F
C
F
C
F
C
F
6
B
F
F
F
F
F
F
F
7
B
F
C
F
C
F
C
F
8
B
J_F
F
_M_
F
B
9
1 AB
A
B
H
B1
H
A
F = Fuel Element C = Control ElementM = "Mo production I = Isotope ThimbleA = Al reflector B = Be reflectorH = Hydraulic Facility P = Pneumatic Facility
Figure 1: Schematic of SAFARI-1's currentcore configuration.
A seven-week operational cycle, which includesone shutdown week, is followed. The operatingpower is mostly dictated by commercialrequirements (3). Depending on the power levels,one or more mid-cycle fuel reloads may berequired. The operating history of SAFARI-1since commissioning is represented in Figure 2.
35000
1/65 1/67 1/69 1/71 1/73 WS 1/77 1/79 1/81 1/83 1/S5 1/871/89 1/S11/S3 WS 1/97Quarter
The irradiation facilities at SAFARI-1 may bedivided into the following broad categories:
• Reactor Poolside• In-core irradiation positions• Pneumatic Facilities• Hydraulic Facility
The reactor poolside has the advantage that bulksamples can be irradiated in relatively highneutron fluxes without penetrating the reactorcore and therefore at a reduced risk to the safetyof the reactor. This facility is used for theneutron transmutation doping of silicon crystalsand the colouration of topaz.
In-core irradiation positions have neutron fluxesof up to 2 x 10¹⁴ n.cnrls-1 at 20 MW and areprimarily used for isotope production. Six posi-tions are fitted with thimble tubes to allow sampleretrieval while the reactor is on power. Five ofthese positions (C3, E3, G3, D8 and F8) arededicated for the irradiation of uranium targetplates for the production of fission product "Mo.The average neutron flux for these five positionsis 1.5 x 10¹⁴ nxnvls-1 at 20 MW.
The sixth thimble position (B8) is used for theproduction of isotopes with relatively short halflives, while the irradiation positions withoutthimble tubes (which can only be accessed whenthe reactor is shut down) are used for theproduction of isotopes with longer half lives.
The hydraulic facility also allows access to highflux positions while the reactor is on power.Gram quantities of target material can beirradiated for periods up to several weeks, withaccurately controlled irradiation times.
The pneumatic facilities are mainly used forneutron activation analyses which involve shorterirradiations in lower flux regions, on smallersamples.
Figure 2: Quarterly Power History
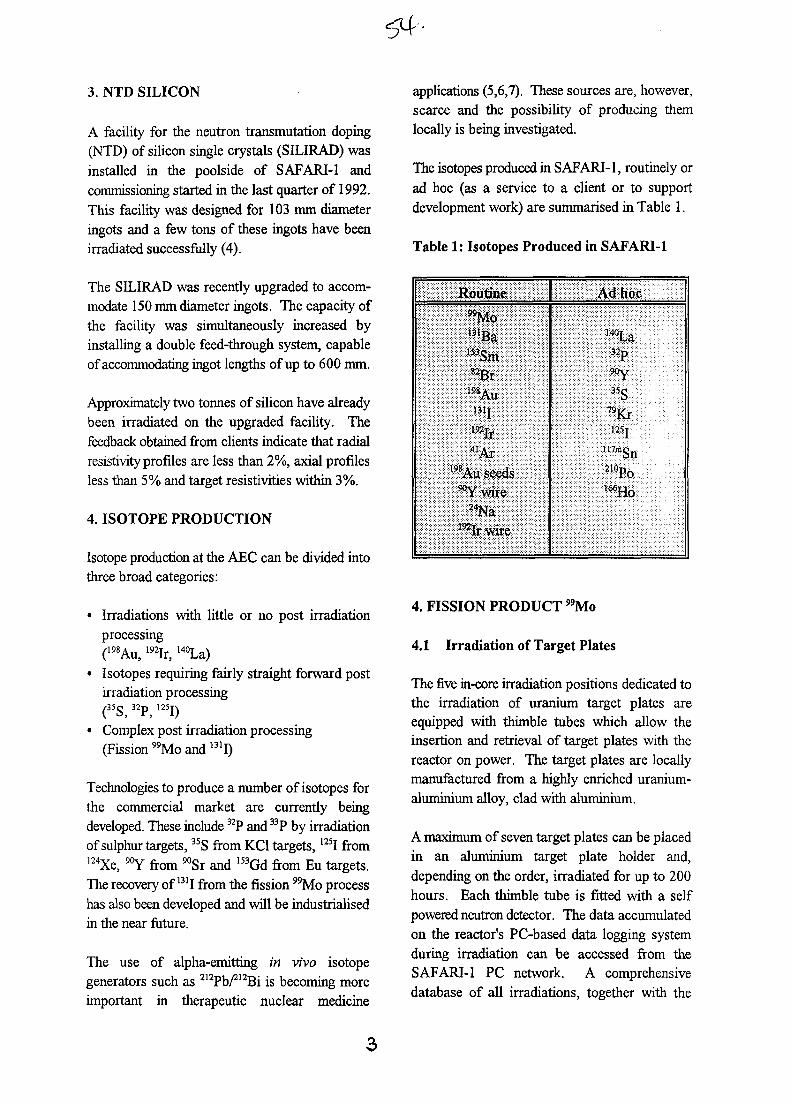
3. NTD SILICON
A facility for the neutron transmutation doping(NTD) of silicon single crystals (SILIRAD) wasinstalled in the poolside of SAFARI-1 andcommissioning started in the last quarter of 1992.This facility was designed for 103 mm diameteringots and a few tons of these ingots have beenirradiated successfully (4).
The SILIRAD was recently upgraded to accom-modate 150 mm diameter ingots. The capacity ofthe facility was simultaneously increased byinstalling a double feed-through system, capableof accommodating ingot lengths of up to 600 mm.
Approximately two tonnes of silicon have alreadybeen irradiated on the upgraded facility. Thefeedback obtained from clients indicate that radialresistivity profiles are less than 2%, axial profilesless than 5% and target resistivities within 3%.
4. ISOTOPE PRODUCTION
Isotope production at the AEC can be divided intothree broad categories:
• Irradiations with little or no post irradiationprocessing(198Au, 192Ir, 140La)
• Isotopes requiring fairly straight forward postirradiation processing(35S, 32P, 125I)
• Complex post irradiation processing(Fission "Mo and 131I)
Technologies to produce a number of isotopes forthe commercial market are currently beingdeveloped. These include 32P and 33P by irradiationof sulphur targets, 35S from KC1 targets, 125I fromI24Xe, 90Y from 90Sr and 153Gd from Eu targets.The recovery of 131I from the fission "Mo processhas also been developed and will be industrialisedin the near future.
The use of alpha-emitting in vivo isotopegenerators such as 212Pb/212Bi is becoming moreimportant in therapeutic nuclear medicine
applications (5,6,7). These sources are, however,scarce and the possibility of producing themlocally is being investigated.
The isotopes produced in SAFARI-1, routinely orad hoc (as a service to a client or to supportdevelopment work) are summarised in Table 1.
Table 1: Isotopes Produced in SAFARI-1
Routine _
t31Ba
192Ir4 jAr
l9SAu seeds
2 4Na
Ad hoc
140La
35g
79Kr12ST
H7mSn
»«p0
4. FISSION PRODUCT "Mo
4.1 Irradiation of Target Plates
The five in-core irradiation positions dedicated tothe irradiation of uranium target plates areequipped with thimble tubes which allow theinsertion and retrieval of target plates with thereactor on power. The target plates are locallymanufactured from a highly enriched uranium-aluminium alloy, clad with aluminium.
A maximum of seven target plates can be placedin an aluminium target plate holder and,depending on the order, irradiated for up to 200hours. Each thimble tube is fitted with a selfpowered neutron detector. The data accumulatedon the reactor's PC-based data logging systemduring irradiation can be accessed from theSAFARI-1 PC network. A comprehensivedatabase of all irradiations, together with the
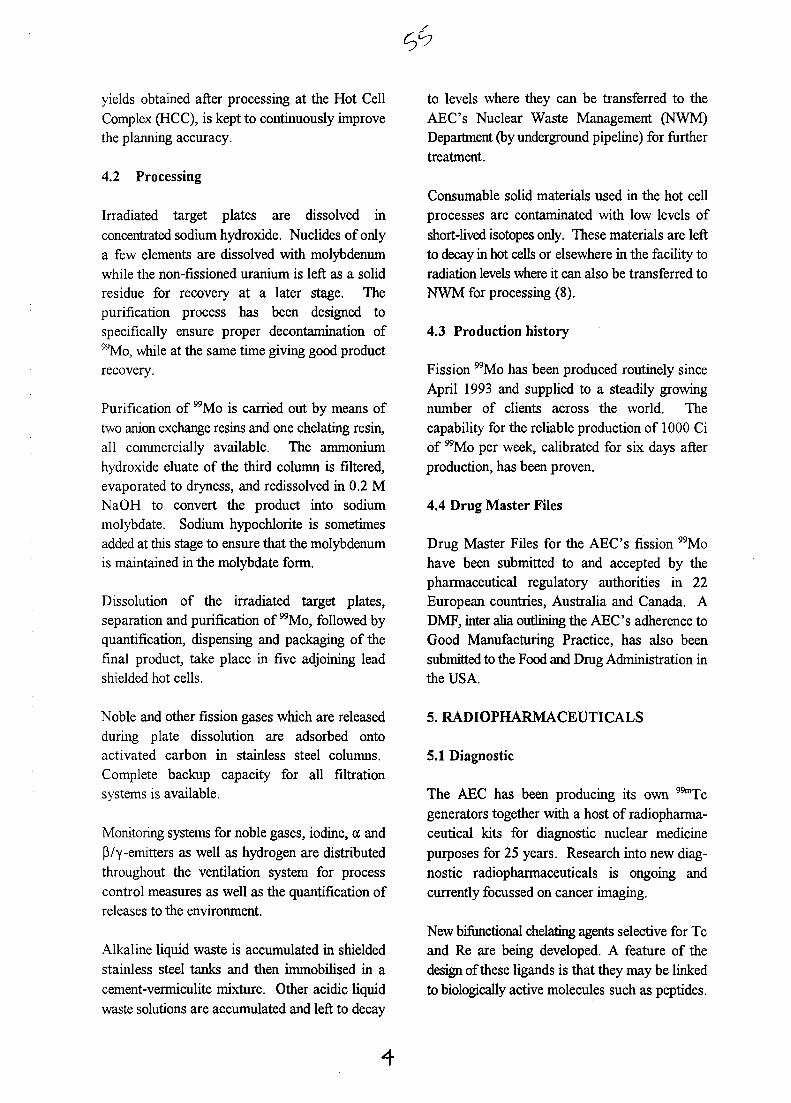
yields obtained after processing at the Hot CellComplex (HCC), is kept to continuously improvethe planning accuracy.
4.2 Processing
Irradiated target plates are dissolved inconcentrated sodium hydroxide. Nuclides of onlya few elements are dissolved with molybdenumwhile the non-fissioned uranium is left as a solidresidue for recovery at a later stage. Thepurification process has been designed tospecifically ensure proper decontamination of"Mo, while at the same time giving good productrecovery.
Purification of "Mo is carried out by means oftwo anion exchange resins and one chelating resin,all commercially available. The ammoniumhydroxide eluate of the third column is filtered,evaporated to dryness, and redissolved in 0.2 MNaOH to convert the product into sodiummolybdate. Sodium hypochlorite is sometimesadded at this stage to ensure that the molybdenumis maintained in the molybdate form.
Dissolution of the irradiated target plates,separation and purification of "Mo, followed byquantification, dispensing and packaging of thefinal product, take place in five adjoining leadshielded hot cells.
Noble and other fission gases which are releasedduring plate dissolution are adsorbed ontoactivated carbon in stainless steel columns.Complete backup capacity for all filtrationsystems is available.
Monitoring systems for noble gases, iodine, a andp/y-emitters as well as hydrogen are distributedthroughout the ventilation system for processcontrol measures as well as the quantification ofreleases to the environment.
Alkaline liquid waste is accumulated in shieldedstainless steel tanks and then immobilised in acement-vermiculite mixture. Other acidic liquidwaste solutions are accumulated and left to decay
to levels where they can be transferred to theAEC's Nuclear Waste Management (NWM)Department (by underground pipeline) for furthertreatment.
Consumable solid materials used in the hot cellprocesses are contaminated with low levels ofshort-lived isotopes only. These materials are leftto decay in hot cells or elsewhere in the facility toradiation levels where it can also be transferred toNWM for processing (8).
4.3 Production history
Fission "Mo has been produced routinely sinceApril 1993 and supplied to a steadily growingnumber of clients across the world. Thecapability for the reliable production of 1000 Ciof "Mo per week, calibrated for six days afterproduction, has been proven.
4.4 Drug Master Files
Drug Master Files for the AEC's fission "Mohave been submitted to and accepted by thepharmaceutical regulatory authorities in 22European countries, Australia and Canada. ADMF, inter alia outlining the AEC's adherence toGood Manufacturing Practice, has also beensubmitted to the Food and Drug Administration inthe USA.
5. RADIOPHARMACEUTICALS
5.1 Diagnostic
The AEC has been producing its own 99mTcgenerators together with a host of radiopharma-ceutical kits for diagnostic nuclear medicinepurposes for 25 years. Research into new diag-nostic radiopharmaceuticals is ongoing andcurrently focussed on cancer imaging.
New bifunctional chelating agents selective for Tcand Re are being developed. A feature of thedesign of these ligands is that they may be linkedto biologically active molecules such as peptides.
5.2 Therapeutic
The production of 153Sm and 131I (tellurium oxideroute) has been operational for many years.Applications include 153Srn-EDTMP for bonecancer pain palliation, 131I-Lipiodol for livercancer and 131I capsules for thyroid treatment. Todate, more than four hundred patients haveparticipated in clinical trials involving 153Sm-EDTMP (9-12). This has resulted in the AECbeing granted a licence to market this drug knownas Quadramet™. Much work has also gone intothe understanding of the in vivo behaviour oflanthanide-containing bone-seeking radiopharma-ceuticals (13-15).
The AEC also supports research into '^Re-containing therapeutic agents at South Africanuniversities by supplying the isotope. Researchinto the use of m Re is also being carried out inconjunction with the Biomedical Research Centrein Pretoria.
Southern Africa, along with regions in South-EastAsia, is a liver cancer "hot-spot". Ruralpopulations are usually effected and prognosis isgenerally poor. Planning is under way to set up amultidisciplinary team to perform trials with thetherapeutic radiopharmaceutical, 131I-Lipiodol.
6. REGULATORY REQUIREMENTS
6.1 Council for Nuclear Safety
The safety of the reactor and personnel (atSAFARI-1 and the HCC) is carefully monitoredby the local Council for Nuclear Safety (CNS).The Council's involvement spans normal operationof the reactor, production activities, routinemaintenance and the licensing of new projects andfacilities. A representative of the CNS visitsfacilities at the AEC at least weekly.
Safety analysis reports are submitted to the CNSbefore new facilities in the reactor or HCC arecommissioned. These reports are substantiatedwith extensive risk assessments which includefault tree analyses according to international
standards. The safety reports also address main-tenance of the facilities, work instructions foroperation of the facilities and personnel training.
6.2 IAEA
SAFARI-1 has been under IAEA safeguardssince its commissioning in 1965. The AECfurthermore signed the nuclear nonproliferationtreaty in 1991 and as such all its facilities andmaterial are currently under IAEA safeguards.This also involves monthly inspections from theAgency, when a full audit of all material isperformed, including fresh and spent fuel fromSAFARI-1, target plates and waste.
Favourable reports have been received from theIAEA, indicating an acceptable state of the AEC'snuclear material and the systems to control it.
7. QUALITY ASSURANCE
Quality Management Systems (QMS) form anintegral part of most operations at the AEC. Thefuel manufacturing facility received ISO 9002accreditatioa The QMS at SAFARI-1 adheres toASME NQA-1, but the system is currently beingupgraded to adhere to ISO 9001. Accreditationwill be requested towards the second half of1998. The QMS for "Mo production at the HCCis being updated to conform to ISO 9002requirements but accreditation has not yet beenrequested. The laboratory where the certificationof product purity is performed, operates underISO Guide 25.
8. ENVIRONMENT
The AEC's environmental managementprogramme is aimed at adherence to theISO 14000 system, which will be incorporatedwith the ISO 9000 system. The Corporationsupports the principles of the Charter forSustainable Business Development of theInternational Chamber of Commerce.
7. CONCLUSION
The Atomic Energy Corporation of South Africahas the unique capability to independently produceisotopes such as (most importantly) "Mo in areliable high power research reactor with a provensafety record, operating on locally produced fuel.The reactor is supported by extensive localcapabilities and infrastructure which include amodern hot cell complex and nuclear wastetreatment facilities. The AEC can thereforecontribute significantly to international isotopeproduction technology.
8. REFERENCES
1. P.A. Louw, W.J. Strydom, A. Faanhof, G.Ball, A.M. Venter and F.C. de Beer. TheUtilisation of the SAFARI-1 Research ReactorIAEA-SR-052, 1995
2. E.Z. Muller, G. Ball, W.R. Joubert, H.C.Schutte, C.C. Stoker and F. Reitsma.Development of a Core Follow CalculationalSystem for Research Reactors. 9th PacificBasin Nuclear Conference, 1994
3. D.W. Mingay. Commercialisation of theSAFARI-1 Research Reactor.IAEA/SR-183/44, 1993.
4 PA. Louw, D.G. Robertson, W.J. Strydom.Neutron Transmutation Doping of Silicon inthe SAFARI-1 Research Reactor. 9th PacificBasin Nuclear Conference, 1994.
5. C. Wu, S. Mirzadeh, K. Kumar, D. Parker andO.A. Gansow. The Chemical Fate of 212BiChelates Formed bv fl- Decay of 212Pb ChelatesRadioactivity andRadiochemistry 3, 1992, 18.
6. S.P. Hassfjell and P. Hoff. A Generator forProduction of 212Pb and 212B .Appl. Radiat. hot. 45, 1994, 1021.
7. S.P. Hassfjell, P. Hoff, 0.S. Bruland and J.Alstad. ^Pb/^Bi-EDTMP Synthesis andBiodistribution of a Novel Bone SeekingAlpha-emitting Radiopharmaceutical.J.Labelled Compounds and Radiopharma-ceuticals 34, 1994, 717.
8. W. van Z. de Villiers. The management ofradioactive waste from fission molybdenum-99 production. Spectrum '94 Nuclear and
Hazardous Waste Management InternationalTopical Meeting, Atlanta, 14-18 Aug. 1994.
9. A.S. Alberts, S.W. Brighton, P. Kempff,W.K.A. Louw, A. van Beek, V. Kritzinger,H.P. Westerink and A.J. van Rensburg.Samarium-153-EDTMP for Palliation ofAnkylosing Spondylitis. Paget's Disease andRheumatoid Arthritis. J. Nucl. Med. 36, 1995,1417.
10. W.K.A. Louw, I.C. Dormehl, A.J. vanRensburg, N. Hugo, A.S. Alberts, O.E.Forsyth, G. Beverley, M.A. Sweetlove,J. Marais, M.G. Lotter and A. van Aswegen.Evaluation of Samarium-153 and Holmium-166-EDTMP in the Normal Baboon Model.Nucl. Med. Biol. 23, 1996, 935.
11.A.S. Alberts, BJ. Smit, W.K.A. Louw,A J van Rensburg, A. van Beek, V.Kritzinger and J. S. Nel. Dose response andmultiple dose efficacy and toxicity ofSamarium-153-EDTMP in Metastatic Cancerto Bone. Radiotherapy and Oncology 43,1997, 175.
12. I.C. Dormehl, W.K.A. Louw, F.H.A.Schneeweiss, U.M. Carl, G. Schmitt andS.A. Croft. Uptake of Ethvlenediamine-tetramethylene Phosphonic Acid in NormalBone After Multiple Applictions - A PrimateStudy, Accepted for publication:Arzneimittel-Forschung/Drug Research '97.
13. J.M. Wagener andN.V. Jarvis. Complexationof Trivalent Lanthanides by Ethylenediamine-tetramethvlenephosphonate fEDTMPI S. Afr.J. Chem. 48, 1995, 85.
14. N.V. Jarvis, J.M. Wagener and G.E.Jackson. Metal-ion Speciation in BloodPlasma as a Tool for Elucidating the in vivoBehaviour of Radiopharmaceuticalscontaining 153Sm and 166Ho. J. Chem. Soc.DaltonTrans.,1995, 1411.
15. J.R. Zeevaart, N.V. Jarvis and G.E. Jackson.Blood Plasma Modelling of the in vivoBehaviour of Bisphosphonate-Metal-ionComplexes as Radiopharmaceuticals.Accepted for publication in S. Afr. J. Chem.,1997.
AU9817314
Production of High-Specific Activity Radionuclides Using the SM-High-FluxReactor
Y. A. KARELIN, YU.G. TOPOROV,V.T. FBLIMONOV, V.A.TARASOV,F.Z. VAHETOV, R.A. KUZNETSOV, V.M. LEBEDEV, M.I.MELNIK, V.D.GAVRILOV
State Scientific Center of Russian FederationResearch Institute of Atomic Reactors (SSC RF RIAR)
433510 Dimitrovgrad-10, Russia
SUMMARY. The development of HSA radionuclides production technologies is one of thedirections of SSC RIAR activity, and the high flux research reactor SM, having neutron flux density upto 2.1015 cm"V in a wide range of neutron spectra hardness, plays the principal role in thisdevelopment. Using of high-flux reactor for radionuclide production provides the following advantages:
• production of radionuclides with extremly high specific activity,• decreasing of impurities content in iradiated targets (both, radioactive and non-radioactive),• cost-effective using of expensive isotopically enriched target materials.The production technologies of 33P, 153Gd, 188W, 63Ni, 55'59Fe, ll3-1I7l*ll9m Sn, 89Sr, applied in industry,
nuclear medicine, research, etc., were developed by RIAR during last 5-10 years. The research workincludes the development of calculation procedures for radionuclide reactor accumulation forecast,experimental measuring of neutron cross-sections, the development of irradiated materials reprocessing,isolation and purification of radionuclides. The principal results are reviewed in the report
1. INTRODUCTION
One of the important characteristics ofradionuclide preparations is their specificactivity (SA) i.e. the amount of radionuclideper volume or mass unit of a preparation. Anincrease of specific activity allows for theimplementation of the following advantages:
1. Decrease of the amount ofstarting material used for production ofactivity unit that is important for theusage of isotope-enriched (i.e. veryexpensive) materials.
2. Decrease of the relative amountof radionuclide impurities.
3. Decrease of the dimensions of asource that is important for theproduction of ionization sourcesapplied for medicine and radiationflaw-detection.
4. Reduction of self-absorption of«useful» radiation in the sourcematerial that is essential for p-particlesand low-energy gamma-radiation.
5.New fields of application ofradionuclides, particularly in medicine.
There are also other advantages of high-specific activity preparations that should beindicated.
A natural way of production of high-specificactivity preparations is accumulation of«carrier-free» radionuclides using accelerators.This method allows for the production ofradionuclides with the specific activity close tothe theoretical value. At the same time thismethod is characterized by a relatively lowproductivity (usually, up to several Ci). Anessentially higher productivity can be achievedthrough the production of radionuclides usingneutron irradiation in nuclear reactors. In thiscase high-flux research reactors play the mainrole. However, in this case an increase ofspecific activity requires investigation ofparameters of the accumulation process for thisor that radionuclide taking account of theincrease of the rate of all nuclear reactionsincluding buraup rate of the useful radionuclideas well as the formation rate of impurityradionuclides. In other words, the development
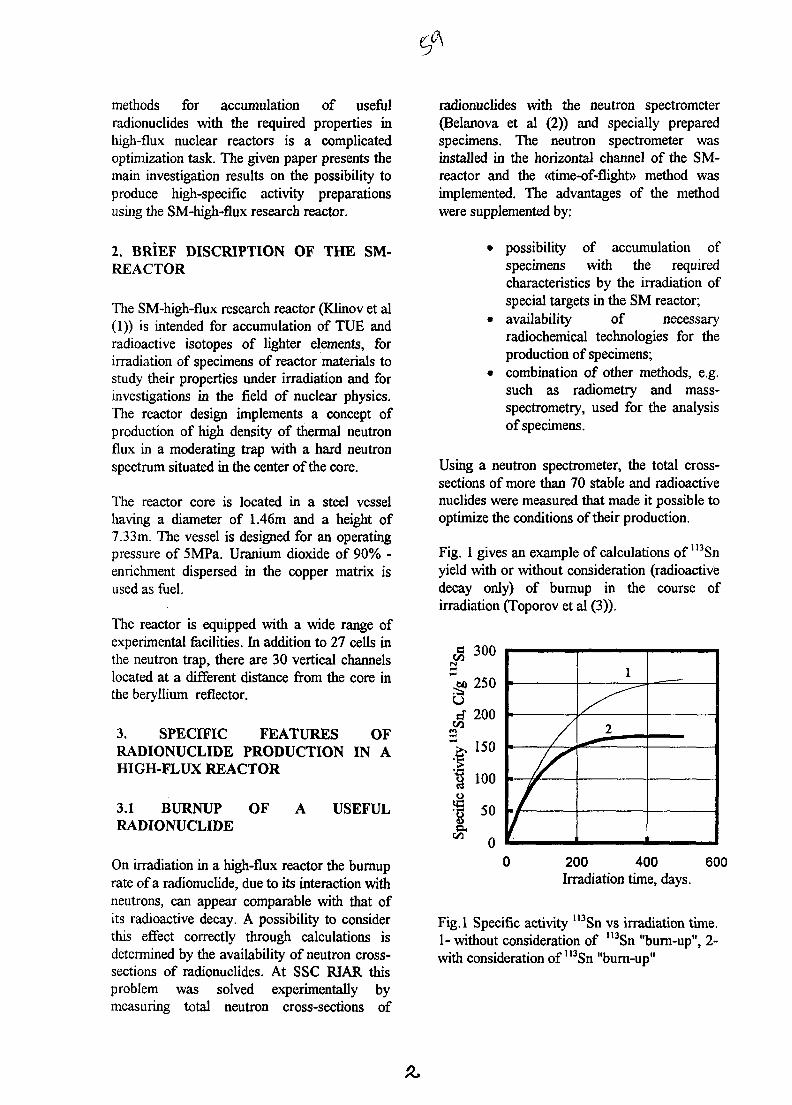
cf\
methods for accumulation of usefulradionuclides with the required properties inhigh-flux nuclear reactors is a complicatedoptimization task. The given paper presents themain investigation results on the possibility toproduce high-specific activity preparationsusing the SM-high-flux research reactor.
2. BRiEF DISCRIPTION OF THE SM-REACTOR
The SM-high-flux research reactor (Klinov et al(1)) is intended for accumulation of TUE andradioactive isotopes of lighter elements, forirradiation of specimens of reactor materials tostudy their properties under irradiation and forinvestigations in the field of nuclear physics.The reactor design implements a concept ofproduction of high density of thermal neutronflux in a moderating trap with a hard neutronspectrum situated in the center of the core.
The reactor core is located in a steel vesselhaving a diameter of 1.46m and a height of7.33m. The vessel is designed for an operatingpressure of 5MPa. Uranium dioxide of 90% -enrichment dispersed in the copper matrix isused as fuel.
The reactor is equipped with a wide range ofexperimental facilities. In addition to 27 cells inthe neutron trap, there are 30 vertical channelslocated at a different distance from the core inthe beryllium reflector.
3. SPECIFIC FEATURES OFRADIONUCLIDE PRODUCTION IN AHIGH-FLUX REACTOR
3.1 BURNUP OF A USEFULRADIONUCLIDE
On irradiation in a high-flux reactor the burnuprate of a radionuclide, due to its interaction withneutrons, can appear comparable with that ofits radioactive decay. A possibility to considerthis effect correctly through calculations isdetermined by the availability of neutron cross-sections of radionuclides. At SSC RIAR thisproblem was solved experimentally bymeasuring total neutron cross-sections of
radionuclides with the neutron spectrometer(Belanova et al (2)) and specially preparedspecimens. The neutron spectrometer wasinstalled in the horizontal channel of the SM-reactor and the «time-of-flight» method wasimplemented. The advantages of the methodwere supplemented by:
• possibility of accumulation ofspecimens with the requiredcharacteristics by the irradiation ofspecial targets in the SM reactor;
• availability of necessaryradiochemical technologies for theproduction of specimens;
• combination of other methods, e.g.such as radiometry and mass-spectrometry, used for the analysisof specimens.
Using a neutron spectrometer, the total cross-sections of more than 70 stable and radioactivenuclides were measured that made it possible tooptimize the conditions of their production.
Fig. 1 gives an example of calculations of m Snyield with or without consideration (radioactivedecay only) of burnup in the course ofirradiation (Toporov et al (3)).
. /
/
V
1
2
i
0 200 400 600Irradiation time, days.
Fig.l Specific activity "3Sn vs irradiation time.1- without consideration of U3Sn "burn-up", 2-with consideration of m Sn "bum-up"
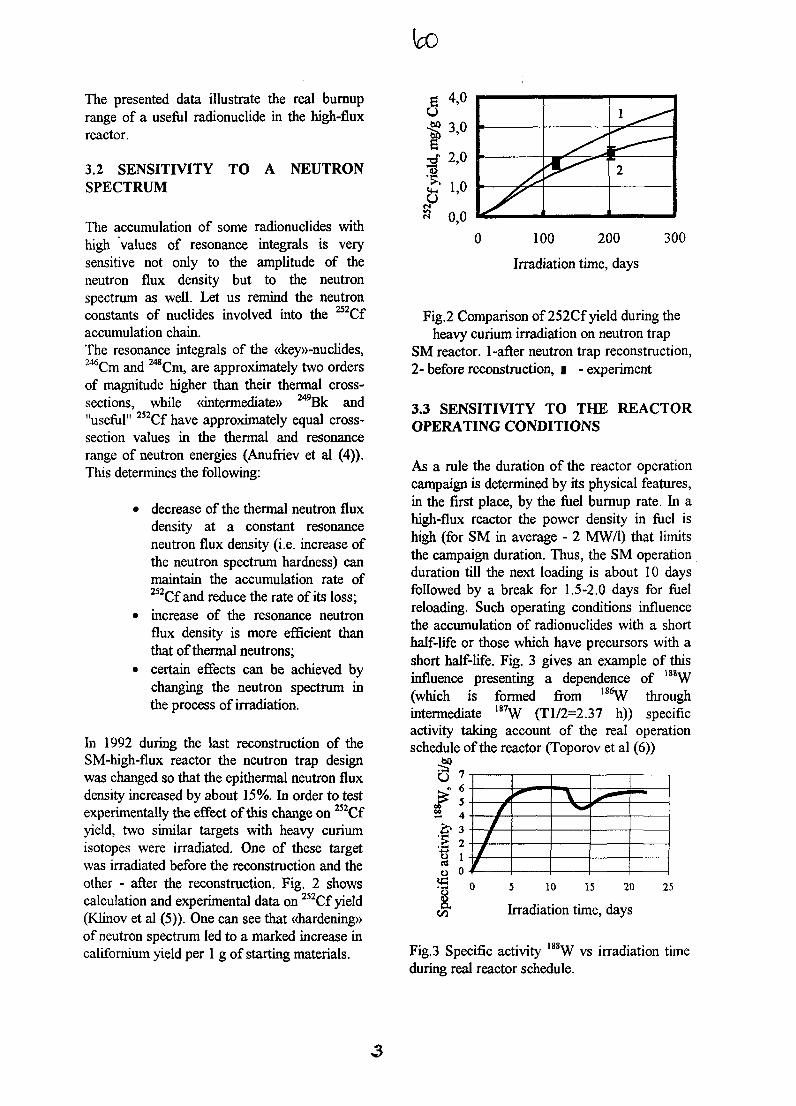
to
The presented data illustrate the real burnuprange of a useful radionuclide in the high-fluxreactor.
3.2 SENSITIVITY TO ASPECTRUM
NEUTRON
The accumulation of some radionuclides withhigh values of resonance integrals is verysensitive not only to the amplitude of theneutron flux density but to the neutronspectrum as well. Let us remind the neutronconstants of nuclides involved into the 252Cfaccumulation chain.The resonance integrals of the «key»-nuclides,246Cm and MCm, are approximately two ordersof magnitude higher than their thermal cross-sections, while «intermediate» M9Bk and"useful" 252Cf have approximately equal cross-section values in the thermal and resonancerange of neutron energies (Anufriev et al (4)).This determines the following:
• decrease of the thermal neutron fluxdensity at a constant resonanceneutron flux density (i.e. increase ofthe neutron spectrum hardness) canmaintain the accumulation rate of252Cf and reduce the rate of its loss;
• increase of the resonance neutronflux density is more efficient thanthat of thermal neutrons;
• certain effects can be achieved bychanging the neutron spectrum inthe process of irradiation.
In 1992 during the last reconstruction of theSM-high-flux reactor the neutron trap designwas changed so that the epithermal neutron fluxdensity increased by about 15%. In order to testexperimentally the effect of this change on ^ C fyield, two similar targets with heavy curiumisotopes were irradiated. One of these targetwas irradiated before the reconstruction and theother - after the reconstruction. Fig. 2 showscalculation and experimental data on 252Cf yield(Klinov et al (5)). One can see that «hardening»of neutron spectrum led to a marked increase incalifornium yield per 1 g of starting materials.
I 3 ' 0
^ 2'°3 0,0
2
0 100 200 300
Irradiation time, days
Fig.2 Comparison of 252Cf yield during theheavy curium irradiation on neutron trap
SM reactor. 1-after neutron trap reconstruction,2-before reconstruction, I -experiment
3.3 SENSITIVITY TO THE REACTOROPERATING CONDITIONS
As a rule the duration of the reactor operationcampaign is determined by its physical features,in the first place, by the fuel burnup rate, hi ahigh-flux reactor the power density in fuel ishigh (for SM in average - 2 MW/1) that limitsthe campaign duration. Thus, the SM operationduration till the next loading is about 10 daysfollowed by a break for 1.5-2.0 days for fuelreloading. Such operating conditions influencethe accumulation of radionuclides with a shorthalf-life or those which have precursors with ashort half-life. Fig. 3 gives an example of thisinfluence presenting a dependence of 188W(which is formed from 186W throughintermediate 187W (Tl/2=2.37 h)) specificactivity taking account of the real operationschedule of the reactor (Toporov et al (6))
5 10 15 20
Irradiation time, days
25
Fig,3 Specific activity 188W vs irradiation timeduring real reactor schedule.
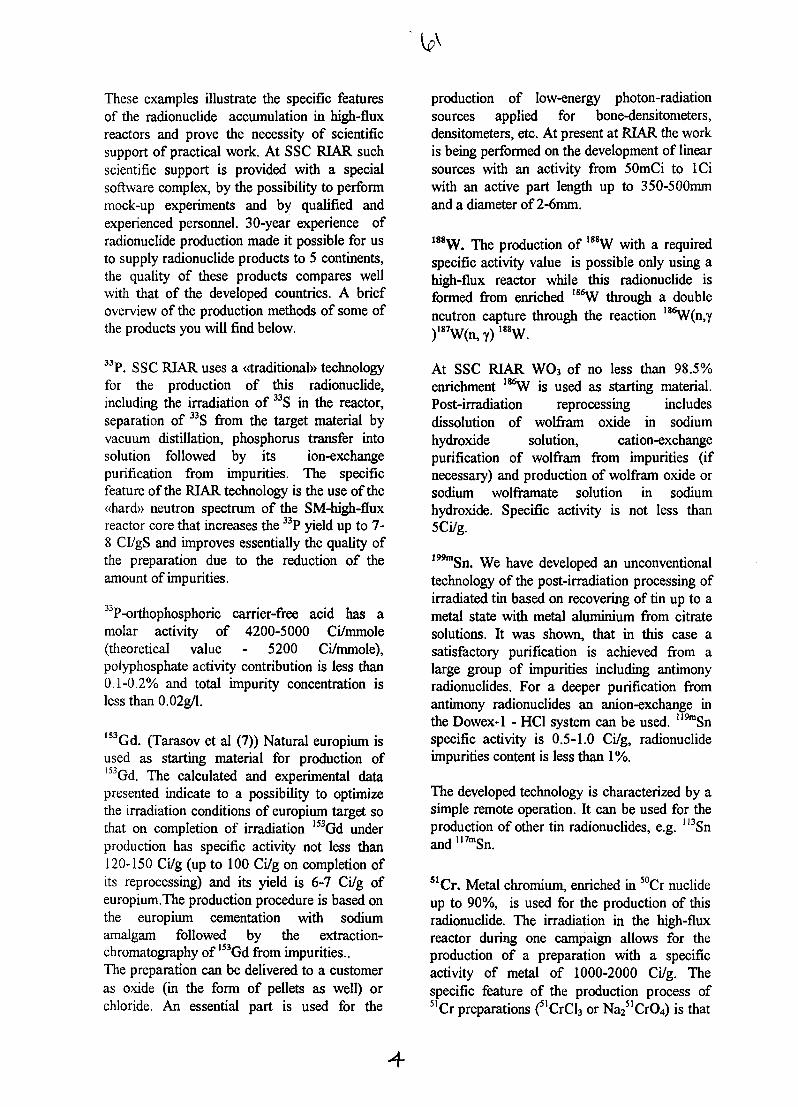
These examples illustrate the specific featuresof the radionuclide accumulation in high-fluxreactors and prove the necessity of scientificsupport of practical work. At SSC RIAR suchscientific support is provided with a specialsoftware complex, by the possibility to performmock-up experiments and by qualified andexperienced personnel. 30-year experience ofradionuclide production made it possible for usto supply radionuclide products to 5 continents,the quality of these products compares wellwith that of the developed countries. A briefoverview of the production methods of some ofthe products you will find below.
33P. SSC RIAR uses a «traditional» technologyfor the production of this radionuclide,including the irradiation of 33S in the reactor,separation of 33S from the target material byvacuum distillation, phosphorus transfer intosolution followed by its ion-exchangepurification from impurities. The specificfeature of the RIAR technology is the use of the«hard» neutron spectrum of the SM-high-fluxreactor core that increases the 33P yield up to 7-8 Cl/gS and improves essentially the quality ofthe preparation due to the reduction of theamount of impurities.
33P-orthophosphoric carrier-free acid has amolar activity of 4200-5000 Ci/mmole(theoretical value - 5200 Ci/mmole),polyphosphate activity contribution is less than0.1-0.2% and total impurity concentration isless than 0.02g/l.
153Gd. (Tarasov et al (7)) Natural europium isused as starting material for production of153Gd. The calculated and experimental datapresented indicate to a possibility to optimizethe irradiation conditions of europium target sothat on completion of irradiation 153Gd underproduction has specific activity not less than120-150 Ci/g (up to 100 Ci/g on completion ofits reprocessing) and its yield is 6-7 Ci/g ofeuropium.The production procedure is based onthe europium cementation with sodiumamalgam followed by the extraction-chromatography of 153Gd from impurities..The preparation can be delivered to a customeras oxide (in the form of pellets as well) orchloride. An essential part is used for the
production of low-energy photon-radiationsources applied for bone-densitometers,densitometers, etc. At present at RIAR the workis being performed on the development of linearsources with an activity from 50mCi to ICiwith an active part length up to 350-500mmand a diameter of 2-6mm.
I88W. The production of I88W with a requiredspecific activity value is possible only using ahigh-flux reactor while this radionuclide isformed from enriched 186W through a doubleneutron capture through the reaction 186W(n,y)I87W(n, y) 188W.
At SSC RIAR WO3 of no less than 98.5%enrichment 186W is used as starting material.Post-irradiation reprocessing includesdissolution of wolfram oxide in sodiumhydroxide solution, cation-exchangepurification of wolfram from impurities (ifnecessary) and production of wolfram oxide orsodium wolframate solution in sodiumhydroxide. Specific activity is not less than5Ci/g.
199mSn. We have developed an unconventionaltechnology of the post-irradiation processing ofirradiated tin based on recovering of tin up to ametal state with metal aluminium from citratesolutions. It was shown, that in this case asatisfactory purification is achieved from alarge group of impurities including antimonyradionuclides. For a deeper purification fromantimony radionuclides an anion-exchange inthe Dowex-1 - HC1 system can be used. 119mSnspecific activity is 0.5-1.0 Ci/g, radionuclideimpurities content is less than 1%.
The developed technology is characterized by asimple remote operation. It can be used for theproduction of other tin radionuclides, e.g. 113Snand ll7mSn.
51 Cr. Metal chromium, enriched in 50Cr nuclideup to 90%, is used for the production of thisradionuclide. The irradiation in the high-fluxreactor during one campaign allows for theproduction of a preparation with a specificactivity of metal of 1000-2000 Ci/g. Thespecific feature of the production process of5ICr preparations (5ICrCl3 or Na2
51CrO4) is that
in the course of irradiation an essential part ofmetal transforms into a hard-dissoluble form(probably, chromium nitride) and, therefore,dissolution of the irradiated material isperformed in concentrated chlorohydric acidwith phosphoric acid additions. The nextpurification of chromium (in the form ofchromate-ions) from phosphate-ions isconducted by the anion-exchange method. Theradionuclide purity of 5ICr preparations underproduction is higher than 99.99%, content ofnon-radioactive impurities in the preparationsolution corresponds to the usual level ofimpurities in highly-pure acids of the analyticalgrade.
5SFe, 54Mn (Filimonov et al (8)) In order toproduce these radionuclides, highly-enriched54Fe is used as starting material. 55Fe specificactivity is not less than 60Ci/g after irradiationin the SM-reactor trap during 200 days of itsefficient operation. Simultaneously, a markedamount of carrier-free MMn (0.8-lCi/g of iron)is formed through (n,p) reaction. Thereprocessing of irradiated targets, after theirdissolution in 4-6 mole/1 chlorohydric acid,includes a selective separation of 55Fe fromimpurities (MN, Cr and Co) by the extraction-chromatography method in «three-n-butylphosphate-HCl» or «three-n-octylamin-HCl»systems or by co-precipitation of manganesewith iron-hydroxide (after chromium
REFERENCES
stabilization in 6-valent state) followed by theseparation of 55Fe, ^Co and ^Fe using theextraction-chromatography method.
"Ni. The production of this radionuclide withpractically acceptable specific activity(>10Ci/g) is possible only using highly-enriched62Ni as starting material, the irradiationduration being not less than 200-250 efficientoperation days in the position with the highestthermal neutron flux density (>1. lO^cm'V1).
The radiochemical reprocessing of an irradiatedtarget involves 63Ni purification fromradionuclides of 59Fe and ^Co by theextraction-chromatography method andpurification from 5ICr impurity by theelectrochemical precipitation method.
OTHER RADIONUCLIDES WITH HIGHSPECIFIC ACTIVITY. In addition to theabove- mentioned radionuclides, SCC WARcan produce other radionuclide preparationsand sources with the required high specificactivity that is possible only using high-fluxreactors.
ACKNOWLEDGMENTS
This work was supported by Minatom ofRussia
1) Klinov A.V. et al. "Redisign of SM-2 Reactor Facility", Nov. 16-20,1992, Vienna. TechnicalCommitee Meeting on Management of Research Reactor Ageing.2) Belanova T.S. et al. 1976, Dimitrovgrad, "Time of flight neutron spectrometer on a reactor SM-2".Preprint RIAR, 11-6 (272).3) Yu.G.Toporov, F.Z.Vakhetov, O.I.Andreyev, R.A.Kuznetsbv.. Radionuclides I13Sn and 119mSn:reactor production and chemical reprocessing of irradiated targets. //, Proc. of 3rd Topical Meeting onIndustrial Radiation and Radioisotopes Measurements and Application (IRRMA'96), October 6-9,1996, Raleigh, NC, p. 196.4) Anufriev V.A. et al.. Total neutron cross-section 249Bk on energy range 0.02-0.46 eV//Atomnajaenergija, V.55, 1983 r., p.3205) A.V.Klinov, Yu.G.Toporov. Optimization of ^ C f accumulation in SM reactor.// Proc. of 3rd TopicalMeeting on Industrial Radiation and Radioisotopes Measurements and Application (IRRMA'96),October 6-9, 1996, Raleigh, NC, p. 1826) Yu.G.Toporov, V.A.Tarasov, R.A.Kuznetsov, G.V.Goncharova. Production of tungsten-188preparation // Ibid., p. 195

7) V.A.Tarasov, Yu.G.Toporov, V.T.Filimonov, A.A.Yadovin, V.M.Lebedev, R.A.Kuznetsov,M.I.Melnik, Ya.N.Gordeev, Ye.A.Karelin. High-specific activity gadolinium-153 productiontechnology.//Ibid., p. 1938) V.T.Filimonov, R.A.Kuznetsov, A.N.Pakhomov, O.I.Andreyev. Application of extractionchromatography in HSA 55>59Fe, MMn, 63Ni, 58Co production technology. // Ibid, p. 186.
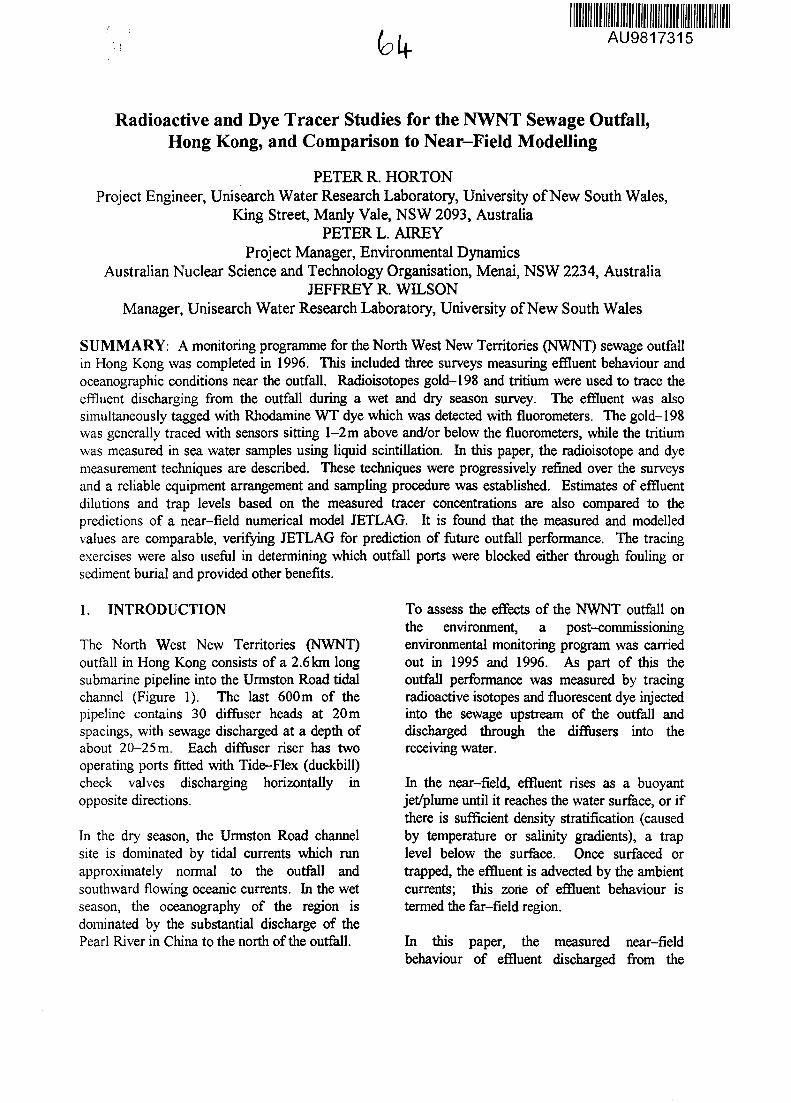
(ok AU9817315
Radioactive and Dye Tracer Studies for the NWNT Sewage Outfall,Hong Kong, and Comparison to Near-Field Modelling
PETER R.HORTONProject Engineer, Unisearch Water Research Laboratory, University of New South Wales,
King Street, Manly Vale, NSW 2093, AustraliaPETER L.AIREY
Project Manager, Environmental DynamicsAustralian Nuclear Science and Technology Organisation, Menai, NSW 2234, Australia
JEFFREY R. WILSONManager, Unisearch Water Research Laboratory, University of New South Wales
SUMMARY: A monitoring programme for the North West New Territories (NWNT) sewage outfallin Hong Kong was completed in 1996. This included three surveys measuring effluent behaviour andoceanographic conditions near the outfall. Radioisotopes gold-198 and tritium were used to trace theeffluent discharging from the outfall during a wet and dry season survey. The effluent was alsosimultaneously tagged with Rhodamine WT dye which was detected with fluorometers. The gold-198was generally traced with sensors sitting 1-2 m above and/or below the fluorometers, while the tritiumwas measured in sea water samples using liquid scintillation. In this paper, the radioisotope and dyemeasurement techniques are described. These techniques were progressively refined over the surveysand a reliable equipment arrangement and sampling procedure was established. Estimates of effluentdilutions and trap levels based on the measured tracer concentrations are also compared to thepredictions of a near-field numerical model JETLAG. It is found that the measured and modelledvalues are comparable, verifying JETLAG for prediction of future outfall performance. The tracingexercises were also useful in determining which outfall ports were blocked either through fouling orsediment burial and provided other benefits.
1. INTRODUCTION
The North West New Territories (NWNT)outfall in Hong Kong consists of a 2.6km longsubmarine pipeline into the Urmston Road tidalchannel (Figure 1). The last 600m of thepipeline contains 30 diffuser heads at 20mspacings, with sewage discharged at a depth ofabout 20-25 m. Each diffuser riser has twooperating ports fitted with Tide-Flex (duckbill)check valves discharging horizontally inopposite directions.
In the dry season, the Urmston Road channelsite is dominated by tidal currents which runapproximately normal to the outfall andsouthward flowing oceanic currents. In the wetseason, the oceanography of the region isdominated by the substantial discharge of thePearl River in China to the north of the outfall.
To assess the effects of the NWNT outfall onthe environment, a post-commissioningenvironmental monitoring program was carriedout in 1995 and 1996. As part of this theoutfall performance was measured by tracingradioactive isotopes and fluorescent dye injectedinto the sewage upstream of the outfall anddischarged through the diffusers into thereceiving water.
In the near-field, effluent rises as a buoyantjet/plume until it reaches the water surface, or ifthere is sufficient density stratification (causedby temperature or salinity gradients), a traplevel below the surface. Once surfaced ortrapped, the effluent is advected by the ambientcurrents; this zone of effluent behaviour istermed the far-field region.
In this paper, the measured near-fieldbehaviour of effluent discharged from the
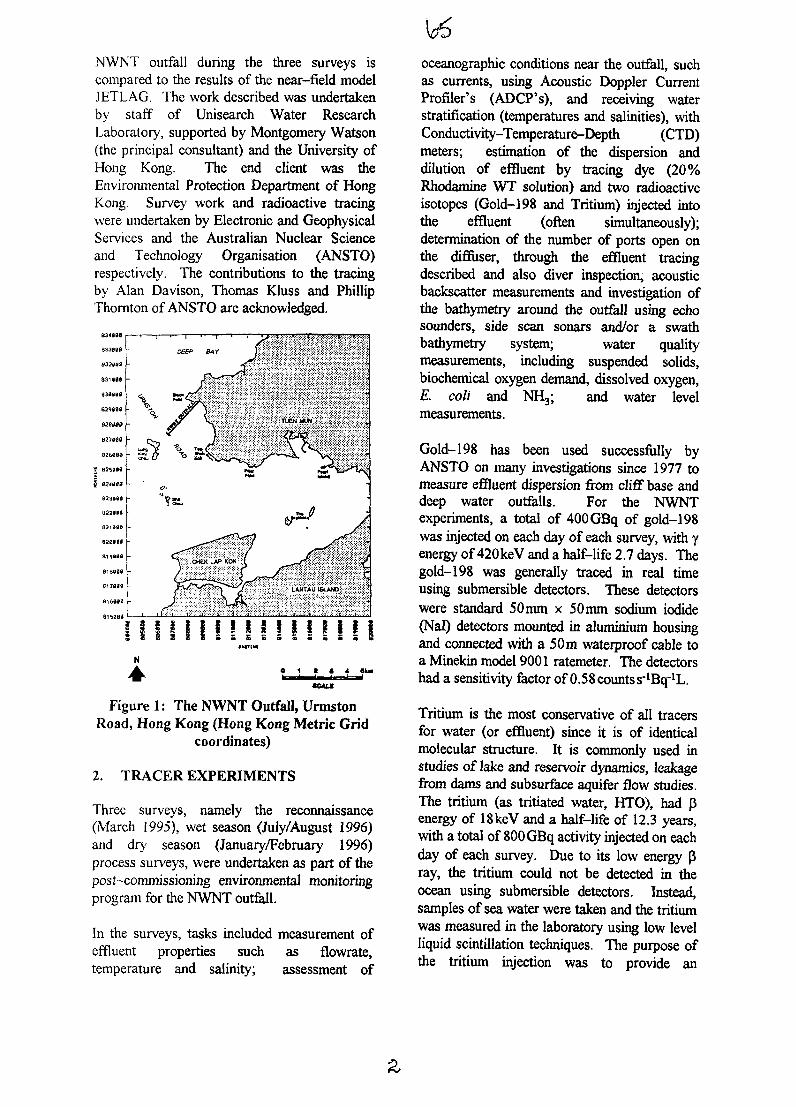
NWNT outfall during the three surveys iscompared to the results of the near-field modelJETLAG. The work described was undertakenby staff of Unisearch Water ResearchLaboratory, supported by Montgomery Watson(the principal consultant) and the University ofHong Kong. The end client was theEnvironmental Protection Department of HongKong. Survey work and radioactive tracingwere undertaken by Electronic and GeophysicalServices and the Australian Nuclear Scienceand Technology Organisation (ANSTO)respectively. The contributions to the tracingby Alan Davison, Thomas Kluss and PhillipThornton of ANSTO are acknowledged.
1 \ I I I ! \\ II ! I i Is s s i s s s s s s s s s :
N
4-Figure 1: The NWNT Outfall, Urmston
Road, Hong Kong (Hong Kong Metric Gridcoordinates)
2. TRACER EXPERIMENTS
Three surveys, namely the reconnaissance(March 1995), wet season (July/August 1996)and dry season (January/February 1996)process surveys, were undertaken as part of thepost-commissioning environmental monitoringprogram for the NWNT outfall.
In the surveys, tasks included measurement ofeffluent properties such as flowrate,temperature and salinity; assessment of
oceanographic conditions near the outfall, suchas currents, using Acoustic Doppler CurrentProfiler's (ADCP's), and receiving waterstratification (temperatures and salinities), withConductivity-Temperature-Depth (CTD)meters; estimation of the dispersion anddilution of effluent by tracing dye (20%Rhodamine WT solution) and two radioactiveisotopes (Gold-198 and Tritium) injected intothe effluent (often simultaneously);determination of the number of ports open onthe diffuser, through the effluent tracingdescribed and also diver inspection, acousticbackscatter measurements and investigation ofthe bathymetry around the outfall using echosounders, side scan sonars and/or a swathbathymetry system; water quality
measurements, including suspended solids,biochemical oxygen demand, dissolved oxygen,E. coli and NH3; and water levelmeasurements.
Gold-198 has been used successfully byANSTO on many investigations since 1977 tomeasure effluent dispersion from cliff base anddeep water outfalls. For the NWNTexperiments, a total of 400GBq of gold-198was injected on each day of each survey, with yenergy of 420keV and a half-life 2.7 days. Thegold-198 was generally traced in real timeusing submersible detectors. These detectorswere standard 50mm x 50mm sodium iodide(Nal) detectors mounted in aluminium housingand connected with a 50m waterproof cable toa Minekin model 9001 ratemeter. The detectorshad a sensitivity factor of 0.58 counts s^
Tritium is the most conservative of all tracersfor water (or effluent) since it is of identicalmolecular structure. It is commonly used instudies of lake and reservoir dynamics, leakagefrom dams and subsurface aquifer flow studies.The tritium (as tritiated water, HTO), had penergy of 18keV and a half-life of 12.3 years,with a total of 800 GBq activity injected on eachday of each survey. Due to its low energy pray, the tritium could not be detected in theocean using submersible detectors. Instead,samples of sea water were taken and the tritiumwas measured in the laboratory using low levelliquid scintillation techniques. The purpose ofthe tritium injection was to provide an
Z
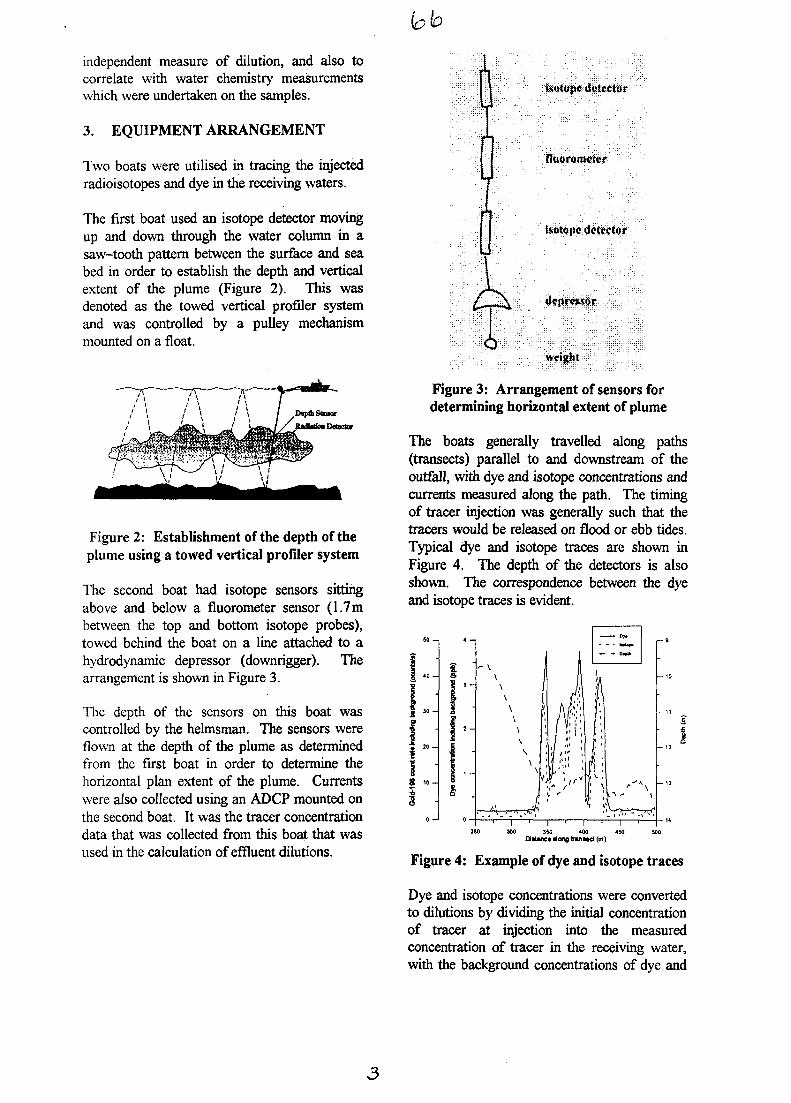
lob
independent measure of dilution, and also tocorrelate with water chemistry measurementswhich were undertaken on the samples.
3. EQUIPMENT ARRANGEMENT
Two boats were utilised in tracing the injectedradioisotopes and dye in the receiving waters.
The first boat used an isotope detector movingup and down through the water column in asaw-tooth pattern between the surface and seabed in order to establish the depth and verticalextent of the plume (Figure 2). This wasdenoted as the towed vertical profiler systemand was controlled by a pulley mechanismmounted on a float.
isotope detector
Figure 2: Establishment of the depth of theplume using a towed vertical profiler system
The second boat had isotope sensors sittingabove and below a fluorometer sensor (1.7mbetween the top and bottom isotope probes),towed behind the boat on a line attached to ahydrodynamic depressor (downrigger). Thearrangement is shown in Figure 3.
The depth of the sensors on this boat wascontrolled by the helmsman. The sensors wereflown at the depth of the plume as determinedfrom the first boat in order to determine thehorizontal plan extent of the plume. Currentswere also collected using an ADCP mounted onthe second boat. It was the tracer concentrationdata that was collected from this boat that wasused in the calculation of effluent dilutions.
(sotoiK" detector
depressor
weight
Figure 3: Arrangement of sensors fordetermining horizontal extent of plume
The boats generally travelled along paths(transects) parallel to and downstream of theoutfall, with dye and isotope concentrations andcurrents measured along the path. The timingof tracer injection was generally such that thetracers would be released on flood or ebb tides.Typical dye and isotope traces are shown inFigure 4. The depth of the detectors is alsoshown. The correspondence between the dyeand isotope traces is evident.
250 300 350 4O0 450 500Dittanca dong kanttct (m)
Figure 4: Example of dye and isotope traces
Dye and isotope concentrations were convertedto dilutions by dividing the initial concentrationof tracer at injection into the measuredconcentration of tracer in the receiving water,with the background concentrations of dye and
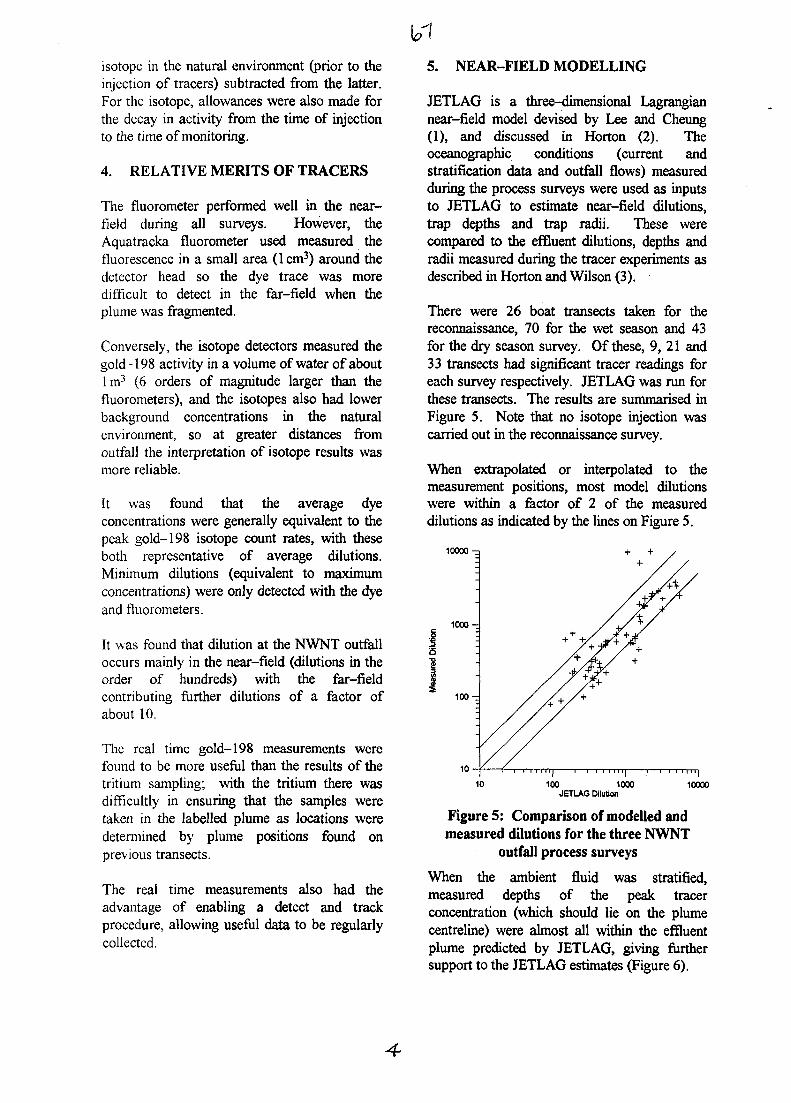
1*1isotope in the natural environment (prior to theinjection of tracers) subtracted from the latter.For the isotope, allowances were also made forthe decay in activity from the time of injectionto the time of monitoring.
4. RELATIVE MERITS OF TRACERS
The fluorometer performed well in the near-field during all surveys. However, theAquatracka fluorometer used measured thefluorescence in a small area (lcm3) around thedetector head so the dye trace was moredifficult to detect in the far-field when theplume was fragmented.
Conversely, the isotope detectors measured thegold-198 activity in a volume of water of about1 m3 (6 orders of magnitude larger than thefluorometers), and the isotopes also had lowerbackground concentrations in the naturalenvironment, so at greater distances fromoutfall the interpretation of isotope results wasmore reliable.
It was found that the average dyeconcentrations were generally equivalent to thepeak gold-198 isotope count rates, with theseboth representative of average dilutions.Minimum dilutions (equivalent to maximumconcentrations) were only detected with the dyeand fluorometers.
It was found that dilution at the NWNT outfalloccurs mainly in the near-field (dilutions in theorder of hundreds) with the far-fieldcontributing further dilutions of a factor ofabout 10.
The real time gold-198 measurements werefound to be more useful than the results of thetritium sampling; with the tritium there wasdifficultly in ensuring that the samples weretaken in the labelled plume as locations weredetermined by plume positions found onprevious transects.
The real time measurements also had theadvantage of enabling a detect and trackprocedure, allowing useful data to be regularlycollected.
5. NEAR-FIELD MODELLING
JETLAG is a three-dimensional Lagrangiannear-field model devised by Lee and Cheung(1), and discussed in Horton (2). Theoceanographic conditions (current andstratification data and outfall flows) measuredduring the process surveys were used as inputsto JETLAG to estimate near-field dilutions,trap depths and trap radii. These werecompared to the effluent dilutions, depths andradii measured during the tracer experiments asdescribed in Horton and Wilson (3).
There were 26 boat transects taken for thereconnaissance, 70 for the wet season and 43for the dry season survey. Of these, 9, 21 and33 transects had significant tracer readings foreach survey respectively. JETLAG was run forthese transects. The results are summarised inFigure 5. Note that no isotope injection wascarried out in the reconnaissance survey.
When extrapolated or interpolated to themeasurement positions, most model dilutionswere within a factor of 2 of the measureddilutions as indicated by the lines on Figure 5.
10000 -q
1 0 0 0 -
1 0 0 -
10-
10" ' I ' ' ^ " ^ 1 ^ I100 1000 10000
JETLAG Dilution
Figure 5: Comparison of modelled andmeasured dilutions for the three NWNT
outfall process surveys
When the ambient fluid was stratified,measured depths of the peak tracerconcentration (which should lie on the plumecentreline) were almost all within the effluentplume predicted by JETLAG, giving furthersupport to the JETLAG estimates (Figure 6).
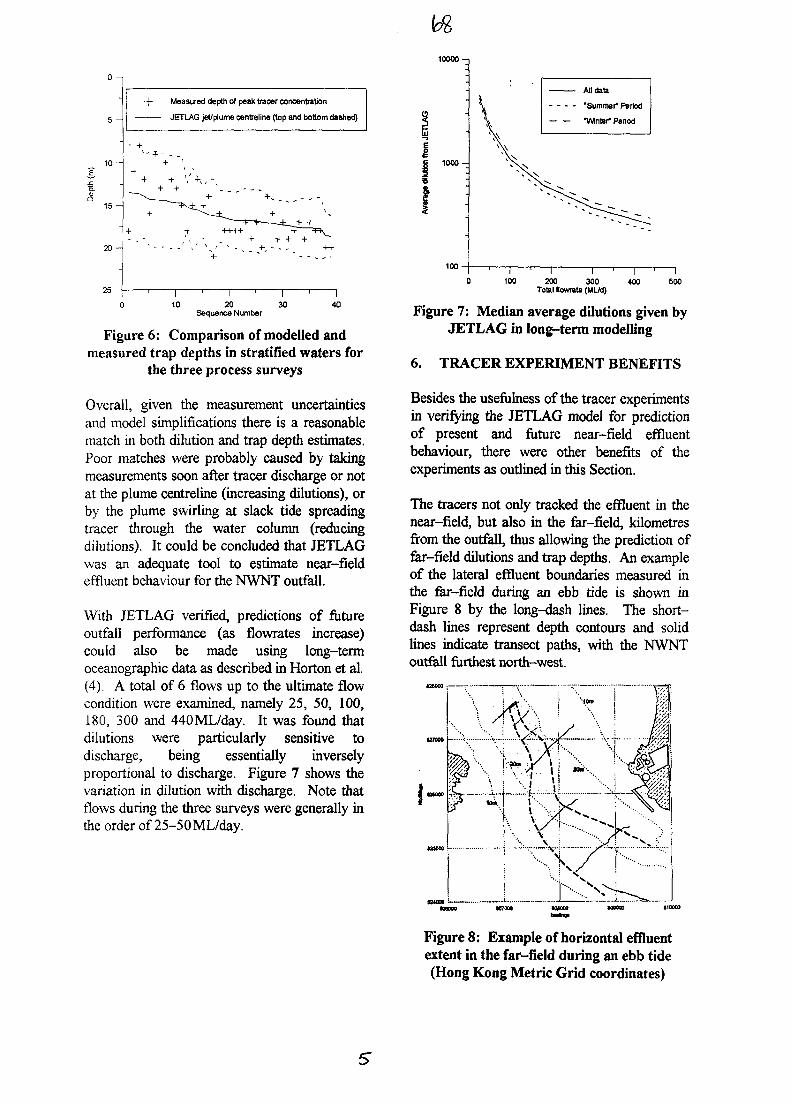
10000-1
0 - i
5 -
1 0 -
15 -
20 -
25-
-+- Measured depth of peak tracer concentration
JETLAG jet/plume centreline (top and bottom dashed)
10 20Sequence Number
30 40
Figure 6: Comparison of modelled andmeasured trap depths in stratified waters for
the three process surveys
Overall, given the measurement uncertaintiesand model simplifications there is a reasonablematch in both dilution and trap depth estimates.Poor matches were probably caused by takingmeasurements soon after tracer discharge or notat the plume centreline (increasing dilutions), orby the plume swirling at slack tide spreadingtracer through the water column (reducingdilutions). It could be concluded that JETLAGwas an adequate tool to estimate near-fieldeffluent behaviour for the NWNT outfall.
With JETLAG verified, predictions of futureoutfall performance (as flowrates increase)could also be made using long-termoceanographic data as described in Horton et al.(4). A total of 6 flows up to the ultimate flowcondition were examined, namely 25, 50, 100,180, 300 and 440ML/day. It was found thatdilutions were particularly sensitive todischarge, being essentially inverselyproportional to discharge. Figure 7 shows thevariation in dilution with discharge. Note thatflows during the three surveys were generally inthe order of 25-50ML/day.
1000 -
100-
All data
"Summer" Period
"Winter Period
—r~100
—I—'—I—200 300
Total flowrate (MUd)400 500
Figure 7: Median average dilutions given byJETLAG in long-term modelling
6. TRACER EXPERIMENT BENEFITS
Besides the usefulness of the tracer experimentsin verifying the JETLAG model for predictionof present and future near-field effluentbehaviour, there were other benefits of theexperiments as outlined in this Section.
The tracers not only tracked the effluent in thenear-field, but also in the far-field, kilometresfrom the outfall, thus allowing the prediction offar-field dilutions and trap depths. An exampleof the lateral effluent boundaries measured inthe far-field during an ebb tide is shown inFigure 8 by the long-dash lines. The short-dash lines represent depth contours and solidlines indicate transect paths, with the NWNToutfall furthest north-west.
Figure 8: Example of horizontal effluentextent in the far-field during an ebb tide(Hong Kong Metric Grid coordinates)
The tracers also revealed the extent to which theplumes from adjacent diffiisers merged. Theplumes generally remained distinct in the near-field.
The time for the injected tracers to travel alongthe outfall pipe was measured. This could beused to check the hydraulic conditions in thepipe and determine if the outfall was purged ofseawater.
The tracer measurements also revealed whichdiffusers were discharging effluent and whichwere blocked due to fouling or sediment burial.During all the surveys only about 5 of the 30diffusers appeared to be discharging sewage.
A particularly useful experiment was carriedout during the dry season survey in which thesewage upstream of the outfall was collectedand released as a short duration high discharge.During the release of this high flow detection ofthe tracers in the receiving water revealed that itwas likely 5 more diffiisers (a total of 10) weredischarging effluent. It appeared that the higherflow was forcing sewage out through previouslyblocked check valves, most likely formerlycovered in sediment.
The radioisotope and dye measurementtechniques were progressively refined over thesurveys and a reliable equipment arrangementand sampling procedure was established.Initially, there were difficulties in employing thetowed vertical profiler system (Section 3).
For example, it was initially found that the firstboat had significant momentum whichprohibited rapid stops and starts and thusprevented the detector reaching the requireddepth in the saw tooth pattern. An attempt tosolve the problem by moving the isotopedetector on to a water sampling rosette attachedto a winch gave poor results due to radiofrequency pickup from the winch and shieldingof the detector by the metal of the watersampler. The problem was overcome by usinga smaller and more manoeuvrable boat.
7. CONCLUSIONS
Three tracer experiments have been carried outon the NWNT outfall in Hong Kong. UsingRhodamine WT dye and gold-198 isotopetracer was found to be immensely useful in thecharacterisation and quantification of thebehaviour of the outfall. It allowed theverification of the near-field model JETLAGwhich was then used to predict outfallbehaviour into the future as flowrates increase.
The measurement and analysis techniquesdeveloped in these experiments can be appliedsuccessfully to other outfall studies.
8. REFERENCES
1. Lee, J.H.W. and V. Cheung (1990)."Generalized Lagrangian Model for BuoyantJets in Current", Journal of EnvironmentalEngineering, American Society of CivilEngineers, Volume 116, Number 6,November/December, pp. 1085-1106
2. Horton, Peter (1995). "Comparison ofNumerical Models that Simulate the Near-Field Region of Jet/Plume Behaviour",Master of Engineering Science Thesis,University of New South Wales, June
3. Horton, P.R. and J.R. Wilson (1996)."NWNT Sewage Outfall, Urmston Road,Hong Kong, Comparison of Near-FieldJETLAG Modelling with TracerExperiments", Australian Water andCoastal Studies Report 96/29, July
4. Horton, P.R., Wilson J.R. and D.R. Cox(1996). "NWNT Sewage Outfall, UrmstonRoad, Hong Kong, Long TermOceanographic Analysis, TransformDevelopment and Near-Field JETLAGModelling", Australian Water and CoastalStudies Report 96/30, July
•nbAU9817316
Application of Tracer Techniquesin Studies of Sediment Transport in Vietnam
P.S. HAI*, N.H. QUANG*, P.D. HIEN***, P. N. CHUONG**, N.M. XUAN** Nuclear Physics Department, Nuclear Research Institute, Dalat, Vietnam
Vanlang University, Ho Chi Minh City, Vietnam** RCA., CTO., Jakarta, Indonesia
SUMMARY. The tracer techniques which have been applied since 1991 in Vietnam have providedmaritime managers for a very efficient tool to obtain idea on the dynamic of sediment transport inestuarine and coastal environments where hydrological conditions are very complicated. Thequalitative and quantitative information on suspended sediment movement and bedload transport inHaiphong harbour area under the effect of northeast monsoon and southeast monsoon was obtained byusing Sc-46 and Ir-192 labelled glasses as radioactive tracers. The influence of dredging materials onsedimentation rate in Haiphong access channel at two dumping sites was estimated by radioactivetracer technique. Successful application of such an advanced technology in a developing country ispresented. In bedload transport studies, apart from conventional methods for assessment of transportthickness, a new method using the ratio of photoelectric peak to Compton region in spectra acquireddirectly on the sea bed was put forward and applied.
I. INTRODUCTION
Vietnam is a country with tropical-monsoonclimate and with high annual rainfall whichcondenses in rainy season. The network ofrivers which are oriented in the NW-SEdirection has rather high slope. As a result ofintensive weathering and erosion processesunder the humid tropical climate condition aswell as of human activities destroying forests,grasslands and protective mangrove swampsmost navigable estuaries in Vietnam suffergreatly from sedimentation. Though a largeamount of money is spent annually ondredging, 10.000 draught weight vessels cannot enter or leave the ports. For these vesselsor heavier ones a part of their cargo must betransferred at the open sea before they canenter the port.
Efforts have been made by both national andforeign organisations to improve this situation(1, 2). However, owing to the complexity ofsedimentation processes in estuarine areasunder hydrometeorological conditions,information given by mathematical models isnot good enough, especially in the case of lackof a reliable database that would result from asystematic hydraulic and sedimentary survey.
In order to obtain an idea on the dynamic ofsediment transport and to verify the modellingapproach in the areas with such a complicatedhydraulic conditions, the isotope tracertechniques have been developed and employedsince 1991.
Using the case of the Haiphong port, this workdescribes technical aspects in the use of tracertechniques to study sediment transport, bothsuspension and bedload, in the coastal andestuarine environment. Some results are thenbriefly presented.
H. MATERIALS AND METHODS
2.1. Study of Bed Load Transport
In sediment transport studies using tracertechnology, sedimentation dynamics can beinvestigated by observing the movement oftracer materials. Therefore, the tracer materialshould behave in the same way with respect tohydrodynamic effects as natural sedimentswhen both are exposed to the samesedimentary or hydraulic transport conditions(3, 4). Scandium and Iridium-labelled glasseshave been used as tracers in the studies of bedload transport. For easier interpretation of the
"11
measurement data, the granulometricdistribution of the tracer was selected so that itcould lie in the range of 30% either side of themedian mass of the natural sediment. In tracerexperiments carried out at Haiphong area, theselected size fraction in average is from 10 \xmto 100 um with the median mass (D50) of 30
The mass and activity of the tracer werecalculated relying on the equation put forwardby Sauzay and Courtois (4) and on data ofhydrodynamics in the region of interest.Generally, for the Haiphong harbour area, anamount of at least 80g tracer, which containsabout 2.5 x 10⁸ particles with grain-sizedistribution the same as natural sediment, withthe activity of 2 Ci is required by most ofbedload transport studies.
After irradiation, quartz ampoules containingradioactive tracer were put in injection deviceswith 5 cm thickness of lead. The injectors thenwere placed into the transport container with10 cm thickness of lead. By rotating a stainlesssteel disk mounted in the injector, quartzampoules were pressed and broken. Thisoperation took place on the boat deck while theinjection device was in the transport container.To release the tracer material onto the sea bed,the injection device was winched off thetransport container, immersed in water andthen the bottom of the injector was openedpneumatically at the distance of 1 m above seabed. The detection was carried out by dragginga sledge mounted the detector Nal(Tl) 2" x 2".The boat was positioned by Global PositioningSystem 5000 DX. The detection frequency isabout once a week.
The bed load discharge q across a sectionperpendicular to the result direction wasestimated by the following equation (5):
q = p L Vm Em, (1)
where q is given in t/d,p is the specific gravity of sediment in situ,L is the transport width,Vm is the mean transport velocity,Em is the transport thickness.
The parameters to be determined are Vm andEm. The mean velocity Vm of the bed materialwas determined by the ratio of the distancebetween centroids of the spatial tracerdistribution to the time interval between thedetections.
The mean transport thickness En, was estimatedin two ways: the direct technique is to takecores and subsequent counting of the slicesobtained. The second method put forward bythe Dalat Tracer Group is to use the ratio ofthe photoelectric peak to the Compton regionin the gamma spectrum recorded in the field.The transport depth could then be determinedafter a previous calibration at laboratory. Withthis method, the mean transport thicknesscould be assessed by acquisition of a gammaspectrum while dragging the detector acrossthe radioactive cloud.
2.2. Study of Suspended SedimentMovement
The study of the movement of suspendedsediment was carried out at the Haiphong areain 1996 for the definition of dumping sites.The tracer material used was Ir-192 labelledglass with grain size selected in the same wayas described above. Due to some reasons, itwas not possible to label the full load of asuction hopper dredger, instead an amount of80g Ir-192 glass was injected into a bucketcontaining 60 litters of mud at a concentrationof 200 g/1 which is the average density ofspoils. After tracer material had been wellmixed pneumatically with mud, the mixturewas released at a distance of 1 m below seawater surface.
The detection procedure was in two ways: Thefirst one was the same as that for bedloadstudies with the attention that the trackingshould be performed after about 3 to 4 hoursfrom the injection. The spatial tracerdistribution could give the followinginformation: (i) the path and drift caused bycurrents; (ii) the dilution of the sediment; (iii)the amount of sediment settled on a given areaat a given distance from the injection point;(iv) the area over which the sediment wasdeposited. The second method was that twodetectors were mounted on a wooden pillar,which was attached to the boat, at different
depths. The detection was carried outimmediately after the injection. The behaviourof suspended sediment under hydrauliccondition could be known by employing amathematical model for dispersion andsedimentation of fine particles (6, 7, 8).However, owing to the use of only one boat,the information obtained on suspendedsediment was limited. Moreover, the weathercondition was not good in the day of injection,at two dumping sites only the informationrecorded at 2 injection points among four wasgood enough. Thus, most of qualitative andquantitative information on suspendedsediment transport for all injection points wasderived from the spatial distribution of tracersettled onto the sea bed right after theinjection.
III. A CASE STUDY ON HAIPHONGHARBOUR
3.1. Some Sediment Transport Problems inthe Haiphong Harbour Area
Located 100 km east of Hanoi, on the coastand with a number of nearby navigableestuaries and waterways, Haiphong is a majorport and important industrial harbour in thenorthern part of the country (Fig. 1). Thehydraulic and sedimentary regimes of thewater courses in the Haiphong area areinfluenced by two river systems. The firstsystem, the Red River, flowing in the south ofHaiphong, discharges a large amount ofalluvium into the sea in the form of red mud(about 200 million tones a year). Under theinfluence of the south-east monsoon prevailingin summer and autumn, the river-transportedred mud continues moving along the coasttowards the Haiphong area. The second riversystem, with its estuaries located north ofHaiphong, is not much muddy in its upstreamand middle sections as the first one. However,owing to the interconnection between the twosystems in the delta region, a huge amount ofalluvium from the Red River is alsotransported to the nearby Haiphong estuariesof Cam and Namtrieu. As a result of thesesediment transport processes, a 38 km longaccess channel through the Namtrieu estuary issuffering from heavy silting. The port authorityand Vietnam Maritime Safety Agency (VMS)
wanted to know reliable and full informationon sedimentary processes in the region in orderto make a decision either they should continuemaintaining the navigation channel orconstruct a new one.
A number of engineering schemes wereproposed to reduce the sedimentation ratealong the access channel. Unfortunately, theywere not supported by detailed and reliablesediment transport studies. Hydraulic andsedimentary surveys carried out in the past bydifferent groups of researchers resulted inquite contradictory conclusions about thepathway of the sediment being deposited alongthe channel.
3.2. Determination of Silting Rate in theAccess Channel
In order to verify the accuracy of data given bymathematical models and to estimate thebedload discharge in a navigation channelsection where the sedimentation was thoughtto be the most serious, some investigationsusing Sc-46 glass were carried out on bothsides of the channel between buoys number 10and 12 (Fig. 1).
The first experiment was performed fromDec. 17, 1992 to March 7, 1993 on thesouthern side of the channel. About 4 Ci ofSc-46 were injected at point DTI (Fig. 1)which is 800m far from the alignment of buoy10 with buoy 12. The detections were carriedout on Dec. 19, 23 and 30, 1992 and then onJan. 6 and March 7, 1993. The results ofbedload discharge and the azimuth of thesediment transport axis were given in Table 1.
To verify the results obtained from the firstexperiment and to get the information in alarger area as well as to redress someunexpected mistakes that may happen in thefirst use of tracer technique, next investigationwas undertaken on Oct. 10, 1993 and lastednearly two months. An amount of 4 Ci Sc-46radioactive tracer was released at point DT2(Fig. 1) on the alignment of buoy 9 with buoy10 and 900m distant from buoy 10. Theresults of bedload transport under the effect ofnortheast monsoon were given in Table 1.
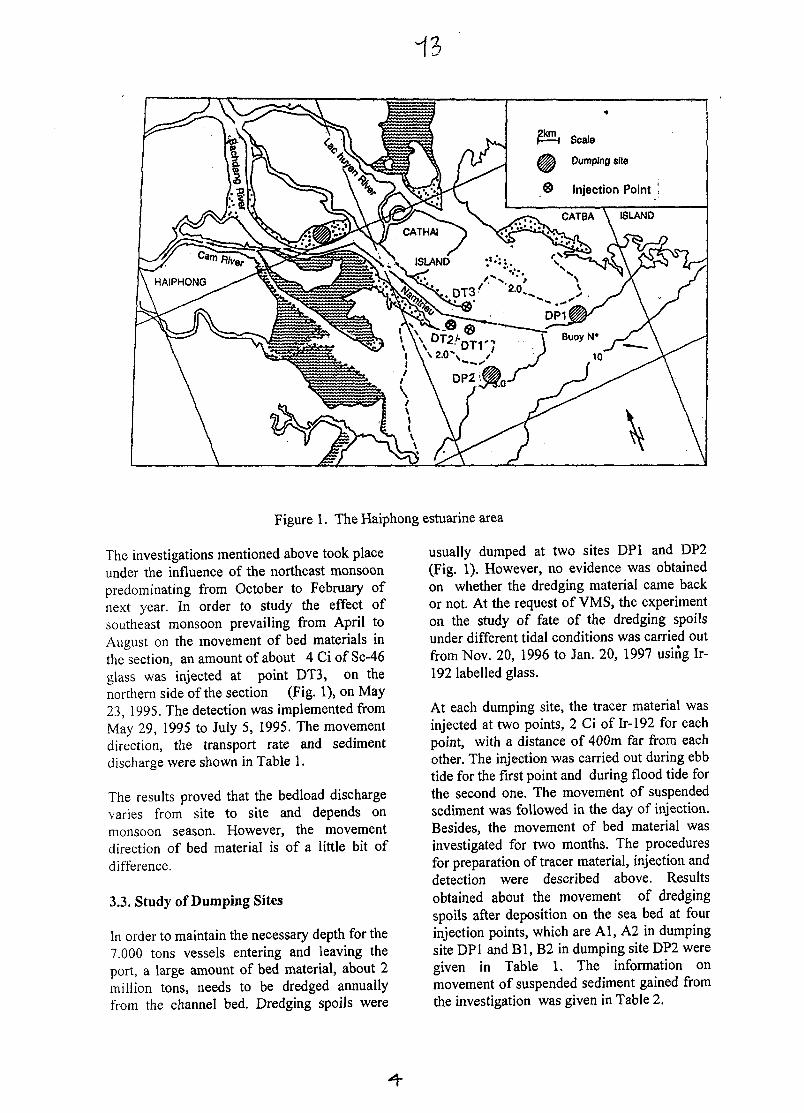
wfa Dumping site
® Injection Point ;
Figure 1. The Haiphong estuarine area
The investigations mentioned above took placeunder the influence of the northeast monsoonpredominating from October to February ofnext year. In order to study the effect ofsoutheast monsoon prevailing from April toAugust on the movement of bed materials inthe section, an amount of about 4 Ci of Sc-46glass was injected at point DT3, on thenorthern side of the section (Fig. 1), on May23, 1995. The detection was implemented fromMay 29, 1995 to July 5, 1995. The movementdirection, the transport rate and sedimentdischarge were shown in Table 1.
The results proved that the bedload dischargevaries from site to site and depends onmonsoon season. However, the movementdirection of bed material is of a little bit ofdifference.
3.3. Study of Dumping Sites
In order to maintain the necessary depth for the7.000 tons vessels entering and leaving theport, a large amount of bed material, about 2million tons, needs to be dredged annuallyfrom the channel bed. Dredging spoils were
usually dumped at two sites DPI and DP2(Fig. 1). However, no evidence was obtainedon whether the dredging material came backor not. At the request of VMS, the experimenton the study of fate of the dredging spoilsunder different tidal conditions was carried outfrom Nov. 20, 1996 to Jan. 20, 1997 using Ir-192 labelled glass.
At each dumping site, the tracer material wasinjected at two points, 2 Ci of Ir-192 for eachpoint, with a distance of 400m far from eachother. The injection was carried out during ebbtide for the first point and during flood tide forthe second one. The movement of suspendedsediment was followed in the day of injection.Besides, the movement of bed material wasinvestigated for two months. The proceduresfor preparation of tracer material, injection anddetection were described above. Resultsobtained about the movement of dredgingspoils after deposition on the sea bed at fourinjection points, which are Al, A2 in dumpingsite DPI and Bl, B2 in dumping site DP2 weregiven in Table 1. The information onmovement of suspended sediment gained fromthe investigation was given in Table 2.
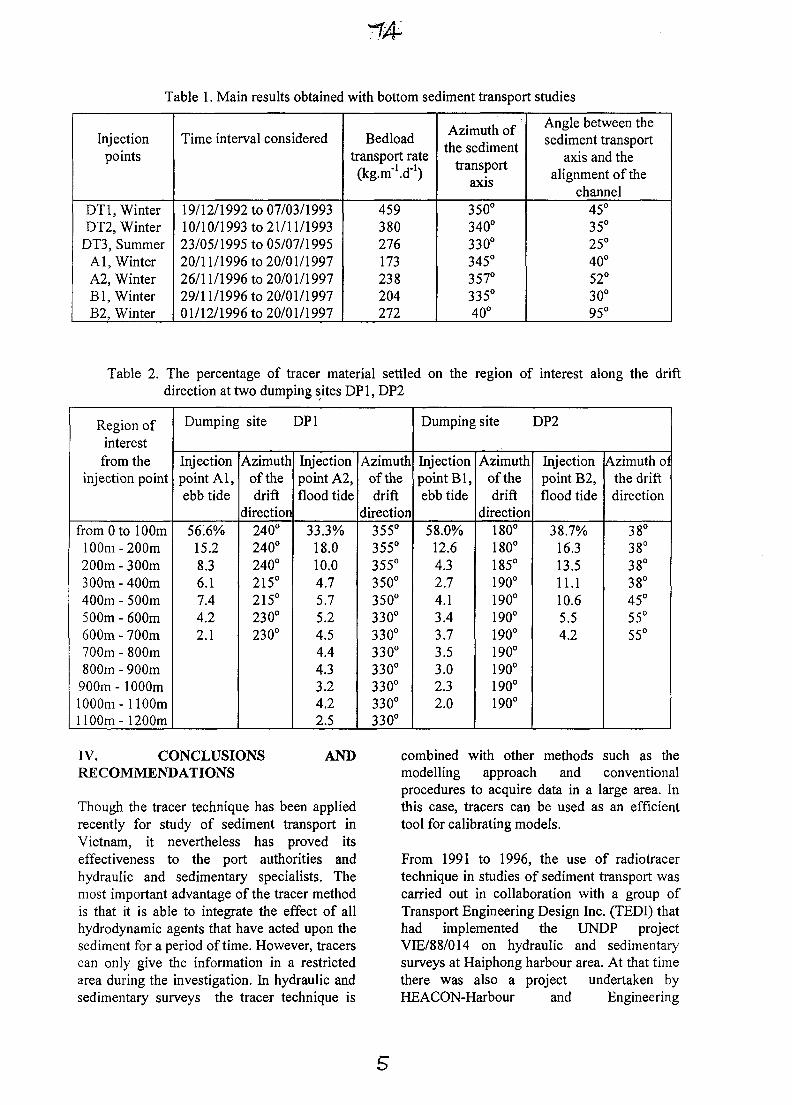
Table 1. Main results obtained with bottom sediment transport studies
Injectionpoints
DTI, WinterDT2, Winter
DT3, SummerAl, WinterA2, WinterBl, WinterB2, Winter
Time interval considered
19/12/1992 to 07/03/199310/10/1993 to 21/11/199323/05/1995 to 05/07/199520/11/1996 to 20/01/199726/11/1996 to 20/01/199729/11/1996 to 20/01/199701/12/1996 to 20/01/1997
Bedloadtransport rate(kg-m-'.d-1)
459380276173238204272
Azimuth ofthe sedimentlilv JvUllllvllV
transportaxis350°340°330°345°357°335°40°
Angle between thesediment transport
axis and thealignment of the
channel45°35°25°40°52°30°95°
Table 2. The percentage of tracer material settled on the region of interest along the driftdirection at two dumping sites DPI, DP2
Region ofinterestfrom the
injection point
from 0 to 100m100m-200m200m - 300m300m - 400m400m - 500m500m - 600m600m - 700m700m - 800m800m - 900m
900m- 1000m1000m- 1100m1100m- 1200m
Dumping
Injectionpoint Al,ebb tide
56.6%15.28.36.17.44.22.1
site
Azimuthof thedrift
direction240°240°240°215°215°230°230°
DPI
Injectionpoint A2,flood tide
33.3%18.010.04.75.75.24.54.44.33.24.22.5
Azimuthof thedrift
direction355°355°355°350°350°330°330°330°330°330°330°330°
Dumping
Injectionpoint Bl,ebb tide
58.0%12.64.32.74.13.43.73.53.02.32.0
site
Azimuthof thedrift
direction180°180°185°190°190°190°190°190°190°190°190°
DP2
Injectionpoint B2,flood tide
38.7%16.313.511.110.65.54.2
Azimuth ofthe driftdirection
38°38°38°38°45°55°55°
IV. CONCLUSIONSRECOMMENDATIONS
AND
Though the tracer technique has been appliedrecently for study of sediment transport inVietnam, it nevertheless has proved itseffectiveness to the port authorities andhydraulic and sedimentary specialists. Themost important advantage of the tracer methodis that it is able to integrate the effect of allhydrodynamic agents that have acted upon thesediment for a period of time. However, tracerscan only give the information in a restrictedarea during the investigation. In hydraulic andsedimentary surveys the tracer technique is
combined with other methods such as themodelling approach and conventionalprocedures to acquire data in a large area. Inthis case, tracers can be used as an efficienttool for calibrating models.
From 1991 to 1996, the use of radiotracertechnique in studies of sediment transport wascarried out in collaboration with a group ofTransport Engineering Design Inc. (TEDI) thathad implemented the UNDP projectVIE/88/014 on hydraulic and sedimentarysurveys at Haiphong harbour area. At that timethere was also a project undertaken byHEACON-Harbour and Engineering
«D
Consultants, Belgium to solve thesedimentation problem in that area. The tracertechnique provided the experimental data onsuspended sediment movement and bedloadtransport in some pivotal regions in Haiphongharbour area for maritime managers andspecialists.
Although the radioactive tracer technology forinvestigating sediment transport has now beensuccessfully applied in a wide range of coastalengineering, the quantitative estimate of ratesof bed-load transport, particularly the thicknessof mobile layer, need to be studied further forimprovement. We had some difficulties inusing the "count rate balance method" for
V. ACKNOWLEDGEMENTS
determination of transport depth. The loss oftracer material near the boundary area owing tothe dilution of tracer as well as the loss in thehottest area of radioactive cloud due to theomission during detection are the mainobstacle in the use of that method. Moreover,knowing the exact radioactivity of tracer is noteasy for us in that period of time. Beside theradioactive tracers, identifying the elementwhich can serve as the activable tracers seemsrather attractive. This work has been done inHaiphong harbour area. However as thenumber of sediment samples collected andanalyzed are still insufficient, the conclusion isnot presented in this paper.
The authors would like to express their thanks to Dr. Tran Ha Anh, the director of NRI,Dr. Nguyen Nhi Dien, the deputy director, and Dr. Vuong Huu Tan, Head of Nuclear PhysicsDepartment for their active support in pushing up the use of tracer technique in the country. We alsowould like to thank Dr. J. Aslam, Head of Asia Pacific Section, Dr. E. G. Agudo, technical officer,projects VIE/8/007 and VIE/0/011 for their effective assistance and to Prof. G. S. Tazioli, theUniversity of Ancona, Italy, Mr. Alan Davison, ANSTO, Australia for valuable recommendations.Haiphong port authorities, VMS authorities and their staff, who have always supported the field work,are acknowledged. Many thanks are given to Mr. Bui Quang Tri, Mr. Pham Ngoc Son, NRI for theircontribution to the investigations.
REFERENCES
1. P.D.HIEN et ah, Elemental compositions of sediments in the Haiphong harbour area as determinedby nuclear analytical techniques - Proceeding of Int. Symp. on application of isotopes andradiation in conservation of the environment, IAEA, Karlsruhe,9-13 March,1992, 599-608
2. Sediment transport problem of estuarine areas, Internal Rep., Vietnam Institute of TransportEngineering Design, Hanoi, 1989
3. SAUZAY, G., Tracer techniques in sediment transport and principles of tracer methods, in TracerTechniques in Sediment Transport, IAEA, Vienna, 1973, p. 3
4. CAILLOT, A., Bedload transport, in Guidebook on Nuclear Techniques in Hydrology, IAEA,Vienna, 1983, p. 103
5. AUN, P. E., BANDEIRA, J. V., The role of nuclear techniques in sedimentological studies andsome applications in Latin America, in Use of Nuclear Techniques in Studying Soil Erosion andSiltation, Proc. of an Advisory Group Meeting, IAEA, Vienna, 1993, p. 29
6. AUN, P. E., MENDES, V. L., Radioactive tracers in the study of movement of sediments, RegionalTraining Course on the Use of Isotope Techniques in Environmental studies of the Hydrosphereand the Atmosphere, Piracicaba & Belo Horizonte, Brazil, IAEA, 1992
7. TOLA, F., The use of radioactive tracers in dynamic sedimentology, methodology and analysis ofresults, CEA-N-2261, 1982
8. CAILLOT, A. et al., Approche theorique du transport en suspension, mode de depouillement desmesures de traceurs radioactifs, Centre National d'Exploitation des Oceans, 1985
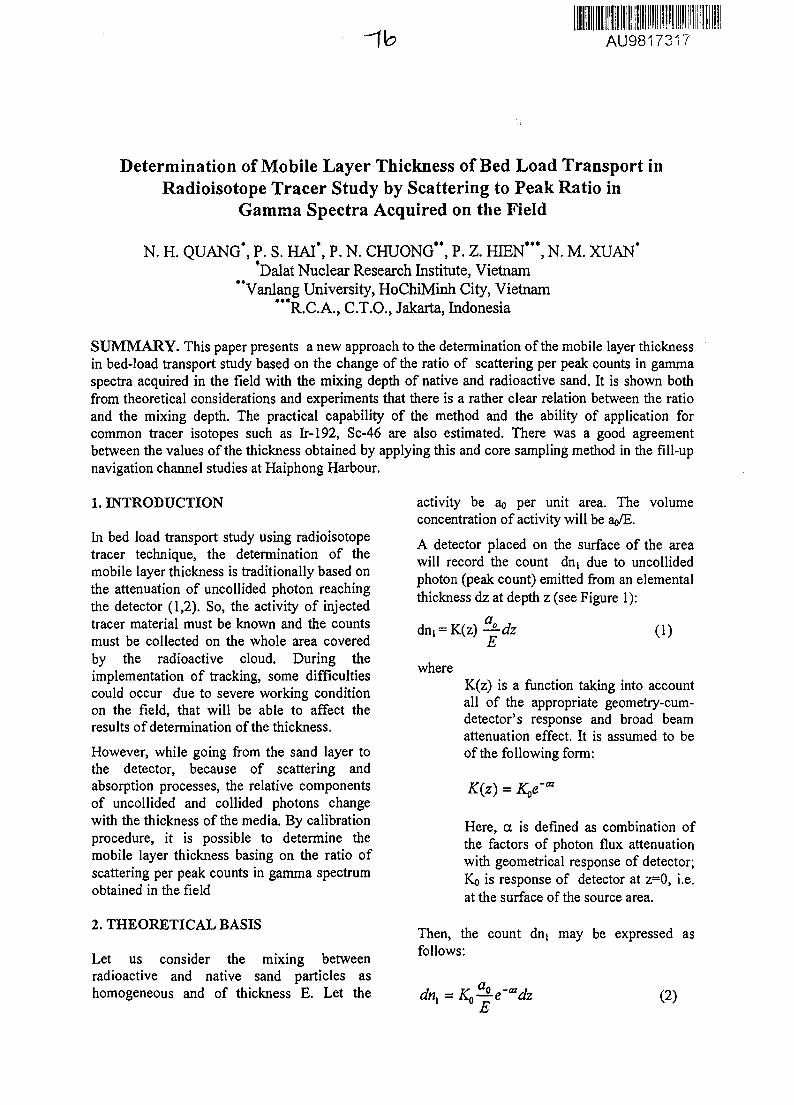
-fb AU9817317Ill
Determination of Mobile Layer Thickness of Bed Load Transport inRadioisotope Tracer Study by Scattering to Peak Ratio in
Gamma Spectra Acquired on the Field
N. H. QUANG\ P. S. HAl\ P. N. CHUONG**, P. Z. HIEN**\ N. M. XUAN**Dalat Nuclear Research Institute, Vietnam
"Vanlang University, HoChiMinh City, Vietnam***R.C.A., C.T.O., Jakarta, Indonesia
SUMMARY. This paper presents a new approach to the determination of the mobile layer thicknessin bed-load transport study based on the change of the ratio of scattering per peak counts in gammaspectra acquired in the field with the mixing depth of native and radioactive sand. It is shown bothfrom theoretical considerations and experiments that there is a rather clear relation between the ratioand the mixing depth. The practical capability of the method and the ability of application forcommon tracer isotopes such as Ir-192, Sc-46 are also estimated. There was a good agreementbetween the values of the thickness obtained by applying this and core sampling method in the fill-upnavigation channel studies at Haiphong Harbour.
1. INTRODUCTION
In bed load transport study using radioisotopetracer technique, the determination of themobile layer thickness is traditionally based onthe attenuation of uncollided photon reachingthe detector (1,2). So, the activity of injectedtracer material must be known and the countsmust be collected on the whole area coveredby the radioactive cloud. During theimplementation of tracking, some difficultiescould occur due to severe working conditionon the field, that will be able to affect theresults of determination of the thickness.
However, while going from the sand layer tothe detector, because of scattering andabsorption processes, the relative componentsof uncollided and collided photons changewith the thickness of the media. By calibrationprocedure, it is possible to determine themobile layer thickness basing on the ratio ofscattering per peak counts in gamma spectrumobtained in the field
2. THEORETICAL BASIS
Let us consider the mixing betweenradioactive and native sand particles ashomogeneous and of thickness E. Let the
activity be ao per unit area. The volumeconcentration of activity will be ao/E.
A detector placed on the surface of the areawill record the count dnt due to uncollidedphoton (peak count) emitted from an elementalthickness dz at depth z (see Figure 1):
where
(1)
K(z) is a function taking into accountall of the appropriate geometry-cum-detector's response and broad beamattenuation effect. It is assumed to beof the following form:
K(z) = K#m
Here, a is defined as combination ofthe factors of photon flux attenuationwith geometrical response of detector;Ko is response of detector at z=0, i.e.at the surface of the source area.
Then, the countfollows:
may be expressed as
(2)
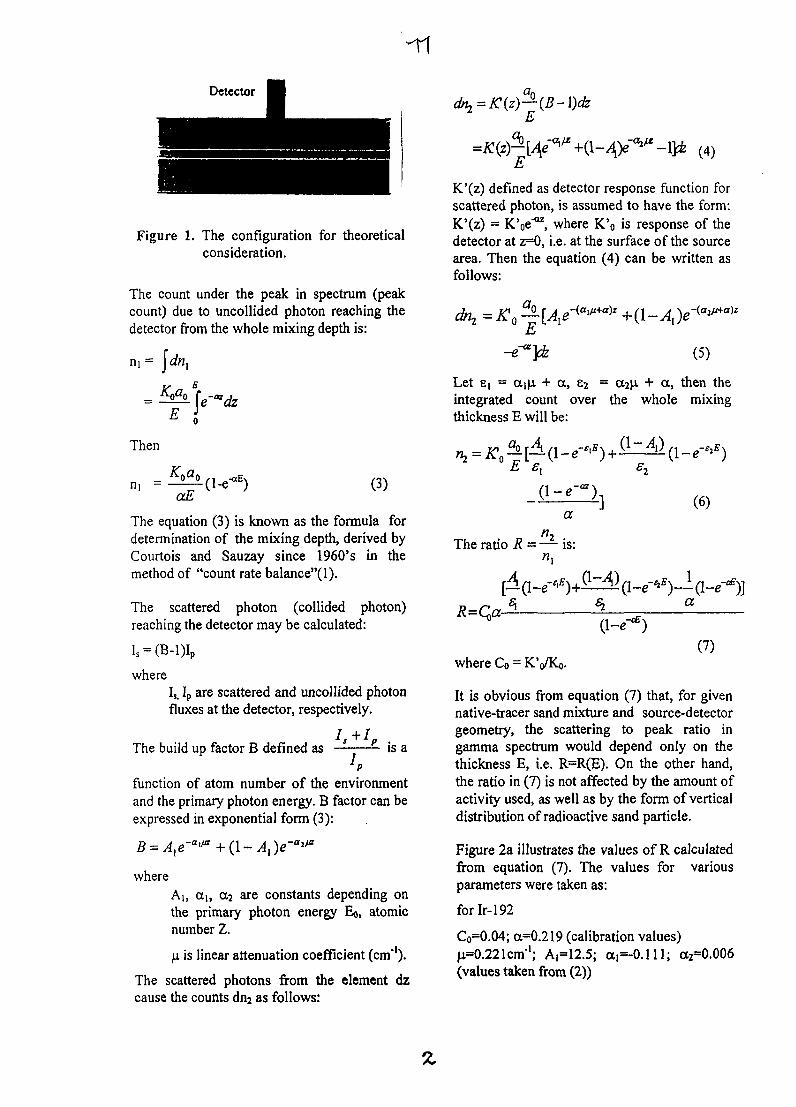
Detector
Figure 1. The configuration for theoreticalconsideration.
The count under the peak in spectrum (peakcount) due to uncollided photon reaching thedetector from the whole mixing depth is:
n, = Jefo,v E
w J
Then
n, = (3)
The equation (3) is known as the formula fordetermination of the mixing depth, derived byCourtois and Sauzay since 1960's in themethod of "count rate balance"(l).
The scattered photon (collided photon)reaching the detector may be calculated:
whereIs, Ip are scattered and uncollided photonfluxes at the detector, respectively.
The build up factor B defined as is a
function of atom number of the environmentand the primary photon energy. B factor can beexpressed in exponential form (3):
whereAi, cti, CC2 are constants depending onthe primary photon energy Eo, atomicnumber Z.
u. is linear attenuation coefficient (cm"1).
The scattered photons from the element dzcause the counts dn2 as follows:
)—(B-\)dzE
(4)
K'(z) defined as detector response function forscattered photon, is assumed to have the form:K'(z) = K'oe"*2, where K'o is response of thedetector at z=0, i.e. at the surface of the sourcearea. Then the equation (4) can be written asfollows:
IC0 ^.E
Let e( = ctiji + a, 62 =integrated count over thethickness E will be:
(5)
+ a, then thewhole mixing
[E sx
(l-«'")n
a
The ratio R = — is:
(6)
where Co = K'(7)
It is obvious from equation (7) that, for givennative-tracer sand mixture and source-detectorgeometry, the scattering to peak ratio ingamma spectrum would depend only on thethickness E, i.e. R=R(E). On the other hand,the ratio in (7) is not affected by the amount ofactivity used, as well as by the form of verticaldistribution of radioactive sand particle.
Figure 2a illustrates the values of R calculatedfrom equation (7). The values for variousparameters were taken as:
for Ir-192
C0=0.04; a=0.219 (calibration values)H=0.221cm-'; A,=12.5; cti=-0.111; cc2
(values taken from (2))0.006
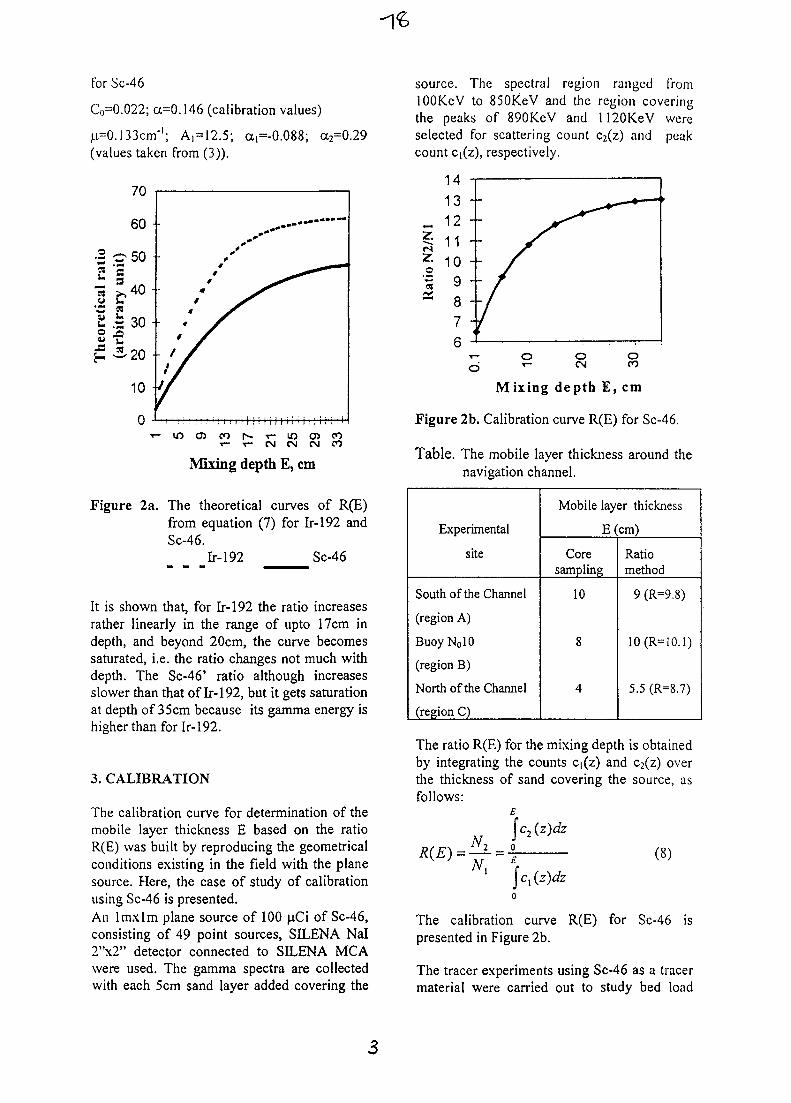
for Sc-46
C,,=0.022; a=0.146 (calibration values)
jx=O. 133cm'1; A,=12.5; a,=-0.088; a2=0.29(values taken from (3)).
cal r
ai
£oVH
ry u
ni
«
'2
6 0 •
50
4 0 •
30
20 •
10 -
0 -
f X
1 /i M
• : : : : ; ; ; ; i i i i i 1 i • i i !1 i ! 1 i l ! i l i . )
T - t - CNJ CM CM CO
Mixing depth E, cm
Figure 2a. The theoretical curves of R(E)from equation (7) for Ir-192 andSc-46.
Ir-192 Sc-46
It is shown that, for Ir-192 the ratio increasesrather linearly in the range of upto 17cm indepth, and beyond 20cm, the curve becomessaturated, i.e. the ratio changes not much withdepth. The Sc-46' ratio although increasesslower than that of Ir-192, but it gets saturationat depth of 35cm because its gamma energy ishigher than for Ir-192.
3. CALIBRATION
The calibration curve for determination of themobile layer thickness E based on the ratioR(E) was built by reproducing the geometricalconditions existing in the field with the planesource. Here, the case of study of calibrationusing Sc-46 is presented.An lmxlm plane source of 100 p.Ci of Sc-46,consisting of 49 point sources, SILENA Nal2"x2" detector connected to SILENA MCAwere used. The gamma spectra are collectedwith each 5cm sand layer added covering the
source. The spectral region ranged fromlOOKeV to 850KeV and the region coveringthe peaks of 890KeV and 1120KeV wereselected for scattering count C2(z) and peakcount Ci(z), respectively.
2/N
Zo
ati
as
14 -13 -12 -11 -10 -
9 -8 -7 -6 ^
T "
- /
- /
/
OJ T—
oCN
*—»
oCO
Mixing depth E, cm
Figure 2b. Calibration curve R(E) for Sc-46.
Table. The mobile layer thickness around thenavigation channel.
Experimental
site
South of the Channel
(region A)
BuoyNo 10
(region B)
North of the Channel
(region C)
Mobile layer thickness
E(cm)
Coresampling
10
8
4
Ratiomethod
9 (R=9.8)
10(R=10.1)
5.5 (R=8.7)
The ratio R(E) for the mixing depth is obtainedby integrating the counts Ci(z) and c2(z) overthe thickness of sand covering the source, asfollows:
N Sc*{z)dz: — = 4 (3)
The calibration curve R(E) for Sc-46 ispresented in Figure 2b.
The tracer experiments using Sc-46 as a tracermaterial were carried out to study bed load
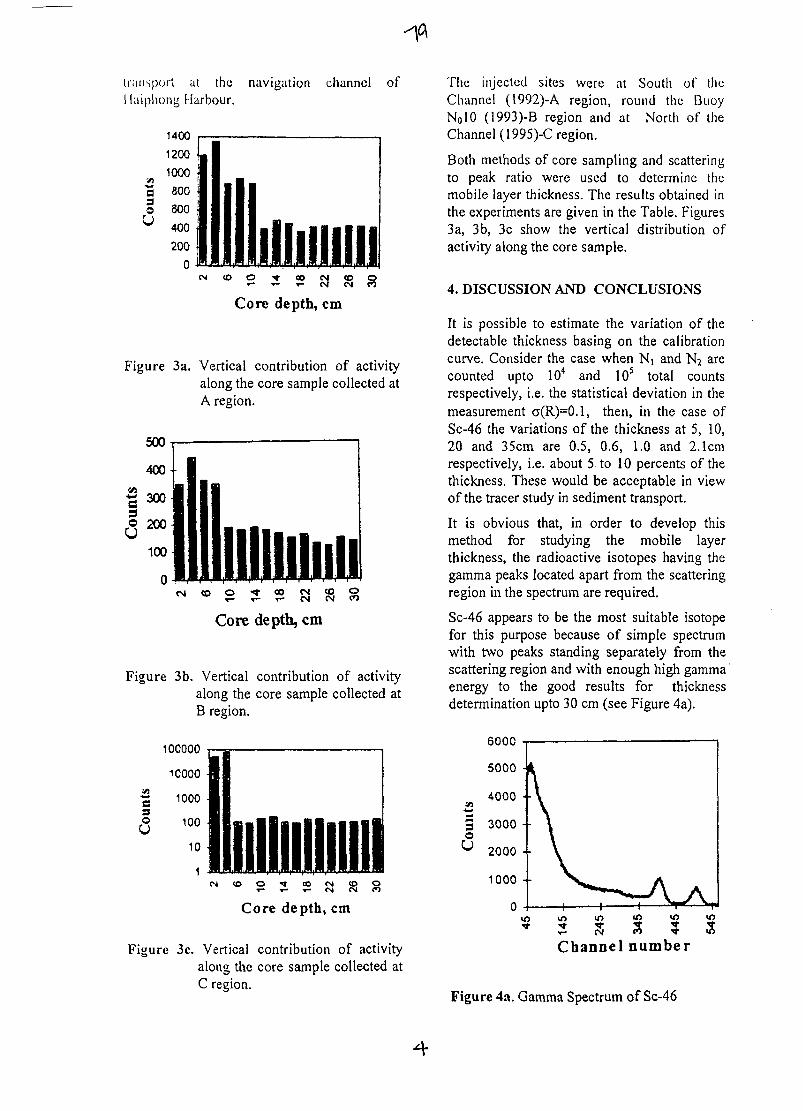
transport at the navigation channel ofI laiphong Harbour.
Core depth, cm
Figure 3a. Vertical contribution of activityalong the core sample collected atA region.
<o o •* oo c>» to o
Core depth, cm
Figure 3b. Vertical contribution of activityalong the core sample collected atB region.
100000
e3oU
Core depth, cm
Figure 3c. Vertical contribution of activityalong the core sample collected atC region.
The injected sites were at South of theChannel (I992)-A region, round the BuoyNo 10 (1993)-B region and at North of theChannel (1995)-C region.
Both methods of core sampling and scatteringto peak ratio were used to determine themobile layer thickness. The results obtained inthe experiments are given in the Table. Figures3a, 3b, 3c show the vertical distribution ofactivity along the core sample.
4. DISCUSSION AND CONCLUSIONS
It is possible to estimate the variation of thedetectable thickness basing on the calibrationcurve. Consider the case when Ni and N2 arecounted upto 104 and 105 total countsrespectively, i.e. the statistical deviation in themeasurement a(R)=0.1, then, in the case ofSc-46 the variations of the thickness at 5, 10,20 and 35cm are 0.5, 0.6, 1.0 and 2.1cmrespectively, i.e. about 5 to 10 percents of thethickness. These would be acceptable in viewof the tracer study in sediment transport.
It is obvious that, in order to develop thismethod for studying the mobile layerthickness, the radioactive isotopes having thegamma peaks located apart from the scatteringregion in the spectrum are required.
Sc-46 appears to be the most suitable isotopefor this purpose because of simple spectrumwith two peaks standing separately from thescattering region and with enough high gammaenergy to the good results for thicknessdetermination upto 30 cm (see Figure 4a).
o
Channel number
Figure 4a. Gamma Spectrum of Sc-46
4
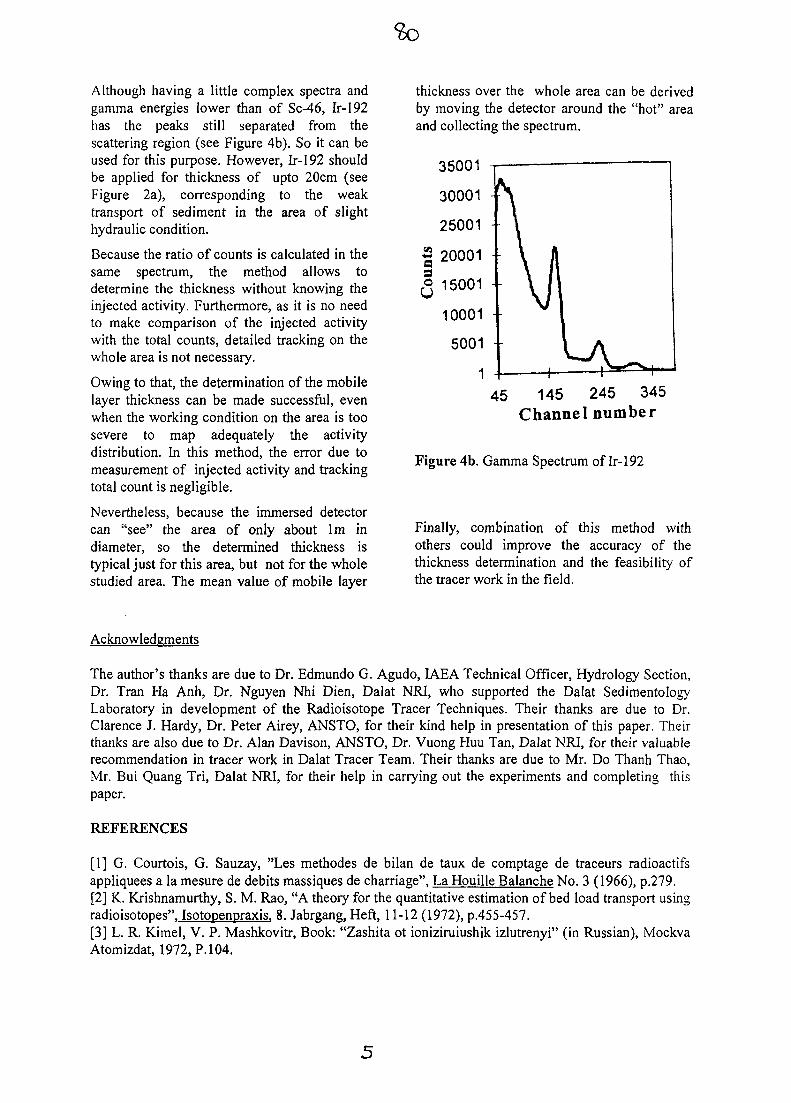
Although having a little complex spectra andgamma energies lower than of Sc-46, Ir-192has the peaks still separated from thescattering region (see Figure 4b). So it can beused for this purpose. However, Ir-192 shouldbe applied for thickness of upto 20cm (seeFigure 2a), corresponding to the weaktransport of sediment in the area of slighthydraulic condition.
Because the ratio of counts is calculated in thesame spectrum, the method allows todetermine the thickness without knowing theinjected activity. Furthermore, as it is no needto make comparison of the injected activitywith the total counts, detailed tracking on thewhole area is not necessary.
Owing to that, the determination of the mobilelayer thickness can be made successful, evenwhen the working condition on the area is toosevere to map adequately the activitydistribution. In this method, the error due tomeasurement of injected activity and trackingtotal count is negligible.
Nevertheless, because the immersed detectorcan "see" the area of only about lm indiameter, so the determined thickness istypical just for this area, but not for the wholestudied area. The mean value of mobile layer
thickness over the whole area can be derivedby moving the detector around the "hot" areaand collecting the spectrum.
35001
45 145 245 345Channel number
Figure 4b. Gamma Spectrum of Ir-192
Finally, combination of this method withothers could improve the accuracy of thethickness determination and the feasibility ofthe tracer work in the field.
Acknowledgments
The author's thanks are due to Dr. Edmundo G. Agudo, IAEA Technical Officer, Hydrology Section,Dr. Tran Ha Anh, Dr. Nguyen Nhi Dien, Dalat NRI, who supported the Dalat SedimentologyLaboratory in development of the Radioisotope Tracer Techniques. Their thanks are due to Dr.Clarence J. Hardy, Dr. Peter Airey, ANSTO, for their kind help in presentation of this paper. Theirthanks are also due to Dr. Alan Davison, ANSTO, Dr. Vuong Huu Tan, Dalat NRI, for their valuablerecommendation in tracer work in Dalat Tracer Team. Their thanks are due to Mr. Do Thanh Thao,Mr. Bui Quang Tri, Dalat NRI, for their help in carrying out the experiments and completing thispaper.
REFERENCES
[1] G. Courtois, G. Sauzay, "Les methodes de bilan de taux de comptage de traceurs radioactifsappliquees a la mesure de debits massiques de charriage", La Houille Balanche No. 3 (1966), p.279.[2] K. Krishnamurthy, S. M. Rao, "A theory for the quantitative estimation of bed load transport usingradioisotopes". Isotopenpraxis. 8. Jabrgang, Heft, 11-12 (1972), p.455-457.[3] L. R. Kimel, V. P. Mashkovitr, Book: "Zashita ot ioniziruiushik izlutrenyi" (in Russian), MockvaAtomizdat, 1972, P. 104.
AU9817318
Application of the 210Pb-dating technique to evaluateenvironmental changes resulting from recent human activities.
Case Study (1) Impact of European settlement on an estuarine systemCase Study (2) Timing of the initiation of an historic toxic dinoflagellate bloom.
A. V. Jenkinson*1, R. Chisari1, Y. J. Farrar1, G. Hallegraeff2, H. Heijnis1, M. Hughes3,J. M. James4, A. McMinn5, G. D. McOrist1, M. Napoli3, J. D. Smith6, P. Thomson5, &R. A.Tinker6
' Australian Nuclear Science & Technology Organisation, PMB I Menai, NSW 2234, Australia.2Department of Plant Science, University of Tasmania, Tasmania 7001, Australia.3 Department of Geology and Geophysics, University of Sydney, NSW 2006, Australia.4 School of Chemistry, University of Sydney, NSW 2006, Australia.1'Institute of Antarctic and Southern Ocean Studies, University of Tasmania, Tasmania 7001, Australia.6 Marine Chemistry Laboratory, School of Chemistry, University of Melbourne, Parkville, Victoria 3052, Australia.
SUMMARY. The 210Pb - dating technique has shown particular promise for the study ofrecent environmental change by enabling the establishment of chronologies for contemporaryenvironmental processes. In this paper two case studies are discussed. Case Study (1) looksat trace element and heavy metal levels in the estuaries of the Georges River and the HackingRiver which are partly located in suburban Sydney and Case Study (2) looks at blooms of thetoxic dinoflagellate Gymnodinium catenation which were first observed in Tasmanian watersin 1980. In both cases the 210Pb-dating technique has been applied to establish the sequenceof sediment deposition in order to associate an age to the sediment layer which contains theentity under investigation. In the Sydney study we were able to show the impact in terms ofpollutant levels that European settlement had on the two river systems, and in the Tasmanianstudy we were able to show that the dinoflagellate is a non-native of Australia and has beenintroduced to Tasmanian waters in only very recent times.
1. INTRODUCTION
One of the problems in studyingenvironmental changes is to identify theexact time frame in which the change ispresumed to occur. In studying the impactof European activities on the Australiancontinent we are fortunate in having a welldocumented time frame which effectivelybegan with the arrival of the first fleetfrom England in 1788. The major periodof impact however is confined roughly tothe last 100 years. The most significantfeature of which was the period of postwar industrialisation following the end ofWorld War II (1945). This phase of rapidindustrialisation led to the prolongedperiod of economic growth anddevelopment during what came to beknown as the boom years of the 1950s and1960s. The environmental effects of someof these activities is fortunately wellpreserved in the sedimentary records of
surrounding rivers and lakes and can thusbe studied.
In studying this time period it is oftennecessary to be able to determine dateswith a high degree of resolution in order tobe able to distinguish between particularevents. In our study we applied thetechnique of 210Pb dating (210Pb half-life:22.26 year) which, under optimumconditions, enables age determinationsback to around 120 to 150 years ago. Inthis paper we describe two applications ofthe 210Pb dating technique. In the firstcase study, which involved investigatingpollutant levels in two Sydney estuaries,we sought to correlate historical changesin surrounding land-use with changes insediment contaminants. As an extensionof this work we then looked atcontemporary changes in sedimentchemistry as a function of distance fromthe likely pollution source. In the second
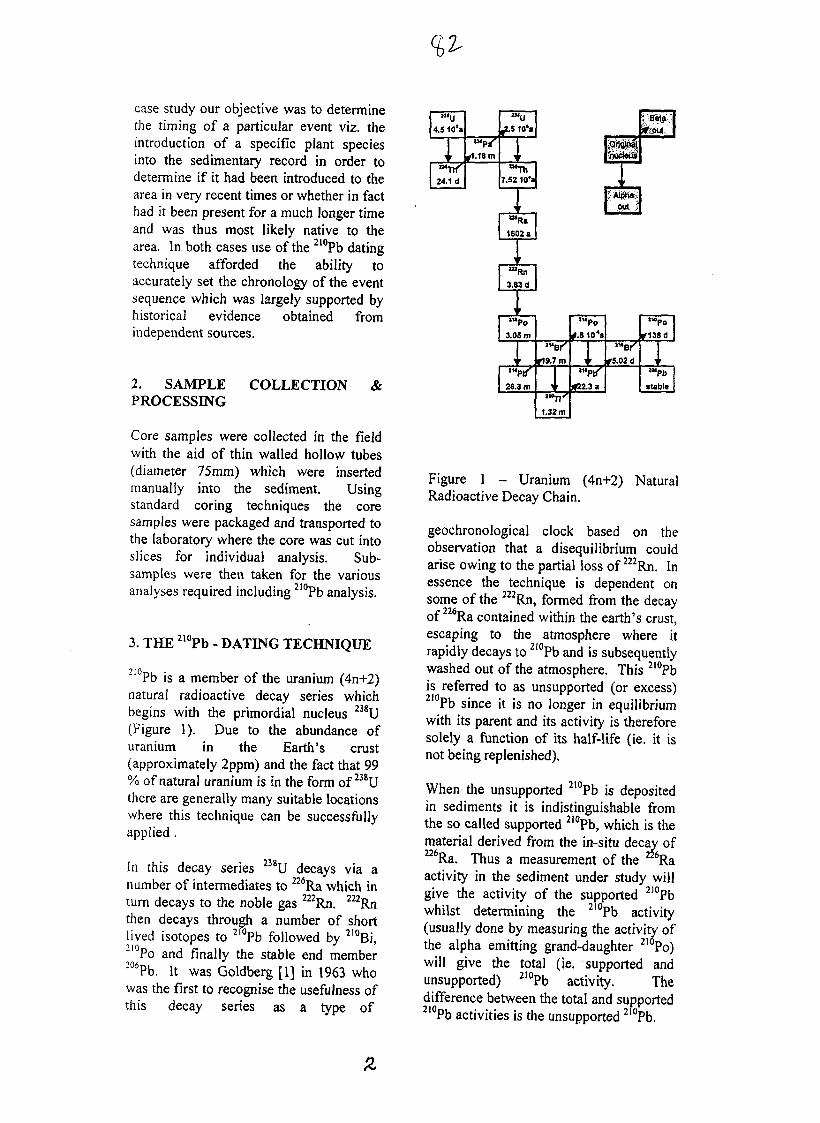
case study our objective was to determinethe timing of a particular event viz. theintroduction of a specific plant speciesinto the sedimentary record in order todetermine if it had been introduced to thearea in very recent times or whether in facthad it been present for a much longer timeand was thus most likely native to thearea. In both cases use of the 210Pb datingtechnique afforded the ability toaccurately set the chronology of the eventsequence which was largely supported byhistorical evidence obtained fromindependent sources.
2. SAMPLE COLLECTION &PROCESSING
Core samples were collected in the fieldwith the aid of thin walled hollow tubes(diameter 75mm) which were insertedmanually into the sediment. Usingstandard coring techniques the coresamples were packaged and transported tothe laboratory where the core was cut intoslices for individual analysis. Sub-samples were then taken for the variousanalyses required including 210Pb analysis.
3. THE 210Pb - DATING TECHNIQUE
210Pb is a member of the uranium (4n+2)natural radioactive decay series whichbegins with the primordial nucleus 238U(Figure 1). Due to the abundance ofuranium in the Earth's crust(approximately 2ppm) and the fact that 99% of natural uranium is in the form of 238Uthere are generally many suitable locationswhere this technique can be successfullyapplied .
In this decay series 238U decays via anumber of intermediates to 226Ra which inturn decays to the noble gas 222Rn. 222Rnthen decays through a number of shortlived isotopes to 210Pb followed by 210Bi,
Po and finally the stable end member206Pb. It was Goldberg [1] in 1963 whowas the first to recognise the usefulness ofthis decay series as a type of
4.5 10'a
24.1 d
f1.18m
^.5 10'»
r
7.S2 104a
• Beta
*;out
\" R a
1602 a
•
mHn
3.83 d
3.05 m
>
28.8 m
f19.7m
1
1.32 m
4.6 10J»
f
I.QMI .1
f5.02 d
2MPo
f138d
I
""Pb
stable
Figure 1 - Uranium (4n+2) NaturalRadioactive Decay Chain.
geochronological clock based on theobservation that a disequilibrium couldarise owing to the partial loss of 222Rn. Inessence the technique is dependent onsome of the 222Rn, formed from the decayof 226Ra contained within the earth's crust,escaping to the atmosphere where itrapidly decays to 210Pb and is subsequentlywashed out of the atmosphere. This 210Pbis referred to as unsupported (or excess)2I0Pb since it is no longer in equilibriumwith its parent and its activity is thereforesolely a function of its half-life (ie. it isnot being replenished).
When the unsupported 210Pb is depositedin sediments it is indistinguishable fromthe so called supported 210Pb, which is thematerial derived from the in-situ decay of226Ra. Thus a measurement of the 226Raactivity in the sediment under study willgive the activity of the supported 2I0Pbwhilst determining the 2l0Pb activity(usually done by measuring the activity ofthe alpha emitting grand-daughter 210Po)will give the total (ie. supported andunsupported) 210Pb activity. Thedifference between the total and supported210Pb activities is the unsupported 210Pb.
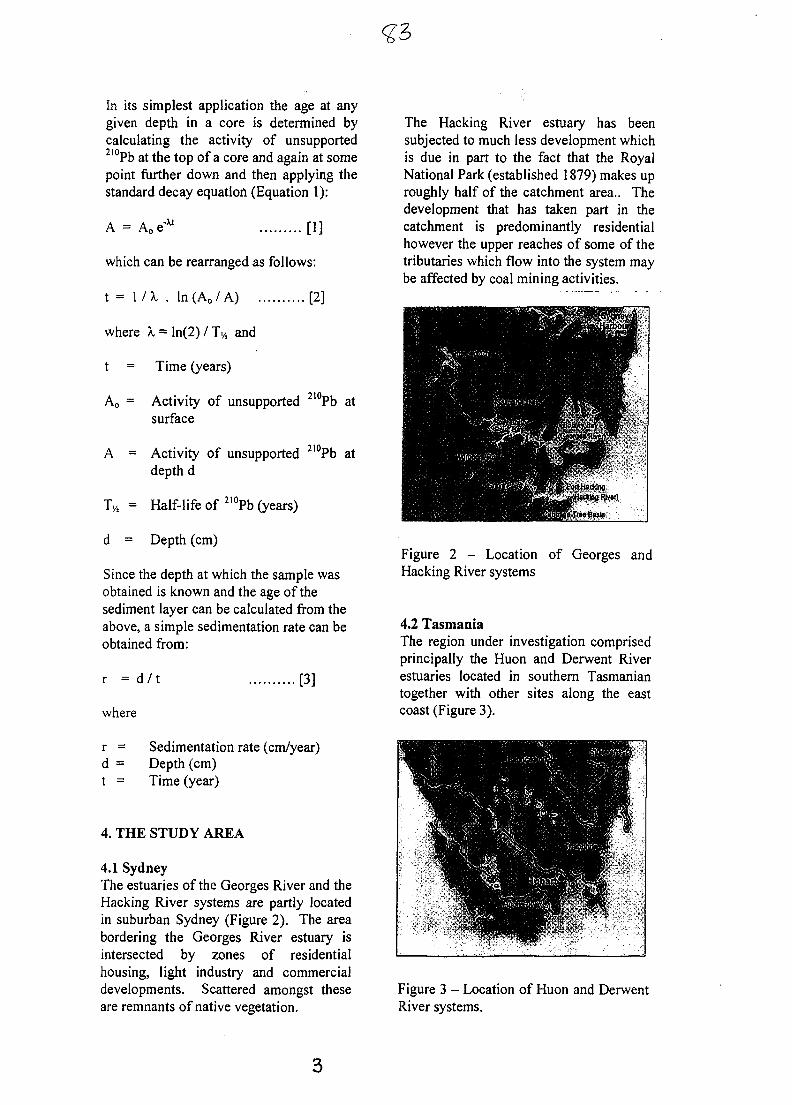
In its simplest application the age at anygiven depth in a core is determined bycalculating the activity of unsupported210Pb at the top of a core and again at somepoint further down and then applying thestandard decay equation (Equation 1):
[1]
which can be rearranged as follows:
t = I/A. . ln(A0 /A) [2]
where X = ln(2) / Ty, and
t = Time (years)
Ao = Activity of unsupported 2l0Pb atsurface
A = Activity of unsupported 2l0Pb atdepth d
Ti4 = Half-life of 210Pb (years)
d = Depth (cm)
Since the depth at which the sample wasobtained is known and the age of thesediment layer can be calculated from theabove, a simple sedimentation rate can beobtained from:
r = d / t
where
[3]
r = Sedimentation rate (cm/year)d = Depth (cm)t = Time (year)
4. THE STUDY AREA
4.1 SydneyThe estuaries of the Georges River and theHacking River systems are partly locatedin suburban Sydney (Figure 2). The areabordering the Georges River estuary isintersected by zones of residentialhousing, light industry and commercialdevelopments. Scattered amongst theseare remnants of native vegetation.
The Hacking River estuary has beensubjected to much less development whichis due in part to the fact that the RoyalNational Park (established 1879) makes uproughly half of the catchment area.. Thedevelopment that has taken part in thecatchment is predominantly residentialhowever the upper reaches of some of thetributaries which flow into the system maybe affected by coal mining activities.
Figure 2 - Location of Georges andHacking River systems
4.2 TasmaniaThe region under investigation comprisedprincipally the Huon and Derwent Riverestuaries located in southern Tasmaniantogether with other sites along the eastcoast (Figure 3).
Figure 3 - Location of Huon and DerwentRiver systems.
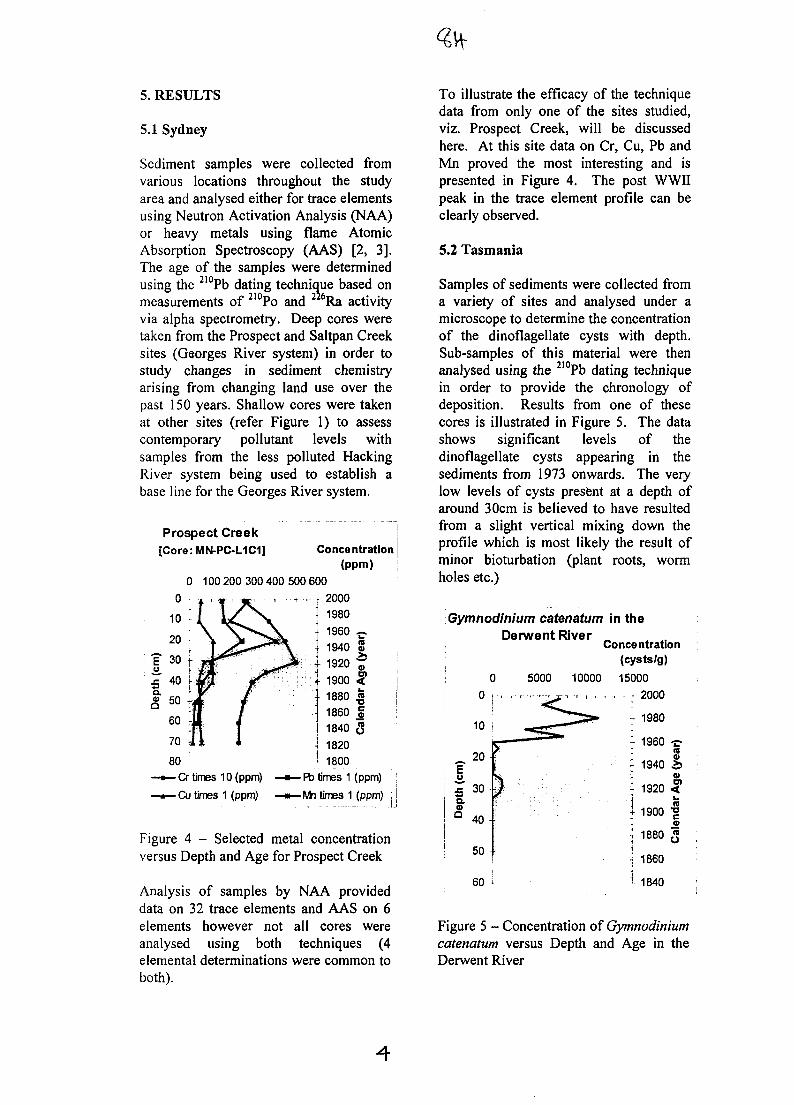
5. RESULTS
5.1 Sydney
Sediment samples were collected fromvarious locations throughout the studyarea and analysed either for trace elementsusing Neutron Activation Analysis (NAA)or heavy metals using flame AtomicAbsorption Spectroscopy (AAS) [2, 3].The age of the samples were determinedusing the 210Pb dating technique based onmeasurements of 210Po and Ra activityvia alpha spectrometry. Deep cores weretaken from the Prospect and Saltpan Creeksites (Georges River system) in order tostudy changes in sediment chemistryarising from changing land use over thepast 150 years. Shallow cores were takenat other sites (refer Figure 1) to assesscontemporary pollutant levels withsamples from the less polluted HackingRiver system being used to establish abase line for the Georges River system.
Prospect Creek[Core:MN-PC-L1C1] Concentration j
(ppm) ;0 100 200 300 400 500 600
; 2000- 1980] 1960 ~1940 S :1920 "£ !
|ra
4
1900 <1880
1860
1840 31820
1 1800Pb times 1 (ppm)
Mn times 1 (ppm)
Figure 4 - Selected metal concentrationversus Depth and Age for Prospect Creek
Analysis of samples by NAA provideddata on 32 trace elements and AAS on 6elements however not all cores wereanalysed using both techniques (4elemental determinations were common toboth).
To illustrate the efficacy of the techniquedata from only one of the sites studied,viz. Prospect Creek, will be discussedhere. At this site data on Cr, Cu, Pb andMn proved the most interesting and ispresented in Figure 4. The post WWIIpeak in the trace element profile can beclearly observed.
5.2 Tasmania
Samples of sediments were collected froma variety of sites and analysed under amicroscope to determine the concentrationof the dinoflagellate cysts with depth.Sub-samples of this material were thenanalysed using the 2l0Pb dating techniquein order to provide the chronology ofdeposition. Results from one of thesecores is illustrated in Figure 5. The datashows significant levels of thedinoflagellate cysts appearing in thesediments from 1973 onwards. The verylow levels of cysts present at a depth ofaround 30cm is believed to have resultedfrom a slight vertical mixing down theprofile which is most likely the result ofminor bioturbation (plant roots, wormholes etc.)
Gymnodinium catenatum in theDerwent River
5Q.0
0
0 p
10 i
20
30
40
50
60
>
Concentration(cysts/g)
5000 10000 15000,_r..,.., , ., r..., .,..,.„.,. 2000
i 1980
I 1960 -C-
i 1940 5s
1920 <
1900 fC
1880 §
1860
i 1840
Figure 5 - Concentration of Gymnodiniumcatenatum versus Depth and Age in theDerwent River
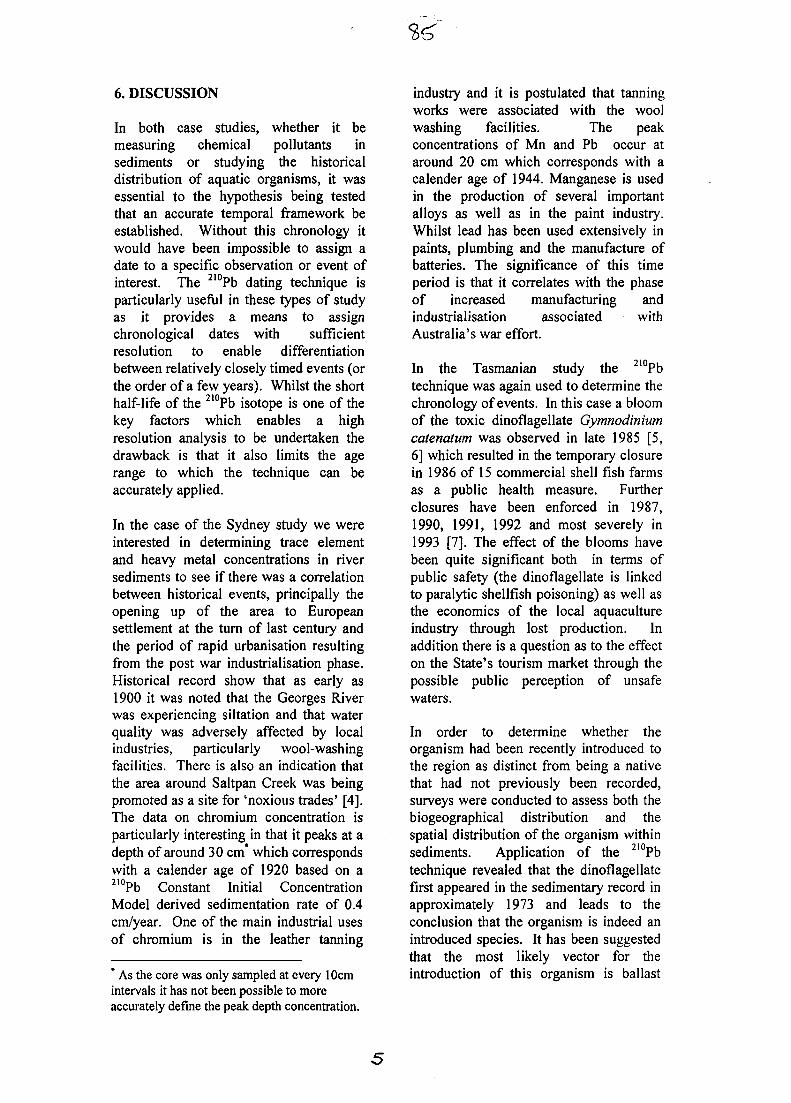
6. DISCUSSION
In both case studies, whether it bemeasuring chemical pollutants insediments or studying the historicaldistribution of aquatic organisms, it wasessential to the hypothesis being testedthat an accurate temporal framework beestablished. Without this chronology itwould have been impossible to assign adate to a specific observation or event ofinterest. The 210Pb dating technique isparticularly useful in these types of studyas it provides a means to assignchronological dates with sufficientresolution to enable differentiationbetween relatively closely timed events (orthe order of a few years). Whilst the shorthalf-life of the 210Pb isotope is one of thekey factors which enables a highresolution analysis to be undertaken thedrawback is that it also limits the agerange to which the technique can beaccurately applied.
In the case of the Sydney study we wereinterested in determining trace elementand heavy metal concentrations in riversediments to see if there was a correlationbetween historical events, principally theopening up of the area to Europeansettlement at the turn of last century andthe period of rapid urbanisation resultingfrom the post war industrialisation phase.Historical record show that as early as1900 it was noted that the Georges Riverwas experiencing siltation and that waterquality was adversely affected by localindustries, particularly wool-washingfacilities. There is also an indication thatthe area around Saltpan Creek was beingpromoted as a site for 'noxious trades' [4].The data on chromium concentration isparticularly interesting in that it peaks at adepth of around 30 cm* which correspondswith a calender age of 1920 based on a2l0Pb Constant Initial ConcentrationModel derived sedimentation rate of 0.4cm/year. One of the main industrial usesof chromium is in the leather tanning
* As the core was only sampled at every 10cmintervals it has not been possible to moreaccurately define the peak depth concentration.
industry and it is postulated that tanningworks were associated with the woolwashing facilities. The peakconcentrations of Mn and Pb occur ataround 20 cm which corresponds with acalender age of 1944. Manganese is usedin the production of several importantalloys as well as in the paint industry.Whilst lead has been used extensively inpaints, plumbing and the manufacture ofbatteries. The significance of this timeperiod is that it correlates with the phaseof increased manufacturing andindustrialisation associated withAustralia's war effort.
In the Tasmanian study the 210Pbtechnique was again used to determine thechronology of events. In this case a bloomof the toxic dinoflagellate Gymnodiniumcatenatum was observed in late 1985 [5,6] which resulted in the temporary closurein 1986 of 15 commercial shell fish farmsas a public health measure. Furtherclosures have been enforced in 1987,1990, 1991, 1992 and most severely in1993 [7]. The effect of the blooms havebeen quite significant both in terms ofpublic safety (the dinoflagellate is linkedto paralytic shellfish poisoning) as well asthe economics of the local aquacultureindustry through lost production. Inaddition there is a question as to the effecton the State's tourism market through thepossible public perception of unsafewaters.
In order to determine whether theorganism had been recently introduced tothe region as distinct from being a nativethat had not previously been recorded,surveys were conducted to assess both thebiogeographical distribution and thespatial distribution of the organism withinsediments. Application of the 210Pbtechnique revealed that the dinoflagellatefirst appeared in the sedimentary record inapproximately 1973 and leads to theconclusion that the organism is indeed anintroduced species. It has been suggestedthat the most likely vector for theintroduction of this organism is ballast
water discharges from woodchip shipswhich is the subject of another paper[7].
7. CONCLUSION
The 2I0Pb - dating technique provides anefficient and useful tool for determiningthe chronological sequence ofcontemporary events and has applicationin a wide range of environmental studieswhere high resolution sedimentationprofiles are required.
8. ACKNOWLEDGEMENTS
The authors which to acknowledge thefinancial assistance provided by thefollowing organisations:
AINSE Post-graduate ResearchSupplement 1995 (R. Tinker)
AINSE Grant 96/069 (A. McMinn)
9. REFERENCES
[1] Goldberg , E. D., Geochronology with2I0Pb. In Radioactive Dating. 1963, 121-131, International Atomic Energy Agency,Vienna.
[2] Jenkinson, A.V., Chisari, R., Farrar,Y.J., Heijnis, H., McOrist, G.D., Tinker,R.A., Smith, J.D., Napoli, M., Hughes, M.and James, J. (1997). Application of the210-Pb dating technique to establish achronological framework of trace elementand heavy metal contamination resultingfrom the impact of European settlement inestuarine systems of the Sydney Basin,
Australia Sixth Australasian Archeometryconference, Sydney 1997. Paper No. 42.
[3] Napoli, M. The contaminantchronologies of Prospect Creek andSaltpan Creek as recorded in theirsediments. Unpublished B.Sc. (Horn.)Thesis, University of Sydney.
[4] Anon, PSCPW, op. Cit., pi 1. In:Rosen, S. (1996) Bankstown - A Sense ofidentity, pp75-76. Hale and Iremonger,Sydney
[5] Hallegraeff, G. M. and Sumner, C. E.Toxic plankton blooms affect shellfishfarms. Aust. Fish. 1986,45:15-18.
[6] Hallegraeff, G. M., Stanley, S. O.,Bolch, C. J. and Blackburn, S. I.Gymnodinium catenatum blooms and shellfish toxicity in Southern Tasmania,Australia. In T. Okaichi, D. M. Andersonand T. Nemoto (eds), Red Tides: Biology.Environmental Science Toxicology 1989.pp75-78. Elsevier.
[7] McMinn, A., Hallegraeff, G.M.,Thomson, P., Jenkinson, A. V. andHeijnis, H. (1997). Microfossil evidencefor the recent introduction of the toxicdinoflagellate Gymnodinium catenatuminto Tasmanian waters. Submitted forpublication to Marine Ecology ProgressSeries.
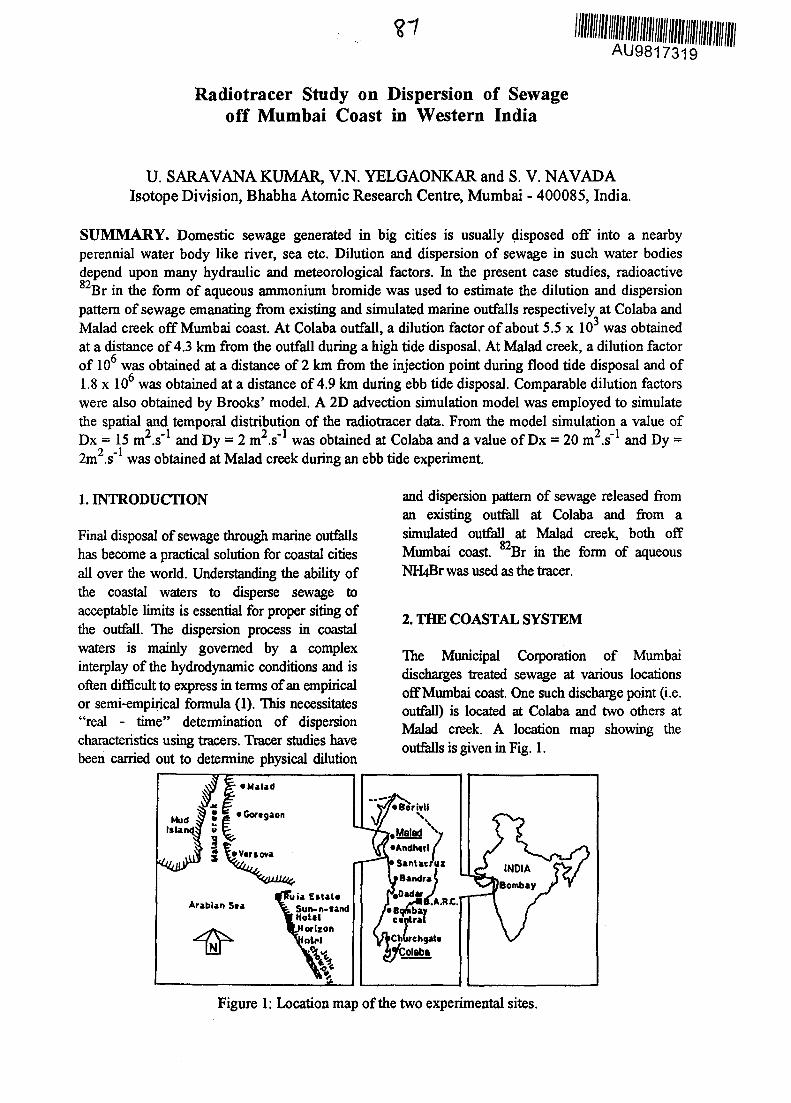
AU9817319
Radiotracer Study on Dispersion of Sewageoff Mumbai Coast in Western India
U. SARAVANA KUMAR, V.N. YELGAONKAR and S. V. NAVADAIsotope Division, Bhabha Atomic Research Centre, Mumbai - 400085, India.
SUMMARY. Domestic sewage generated in big cities is usually disposed off into a nearbyperennial water body like river, sea etc. Dilution and dispersion of sewage in such water bodiesdepend upon many hydraulic and meteorological factors. In the present case studies, radioactive82Br in the form of aqueous ammonium bromide was used to estimate the dilution and dispersionpattern of sewage emanating from existing and simulated marine outfalls respectively at Colaba andMalad creek off Mumbai coast. At Colaba outfall, a dilution factor of about 5.5 x 10 was obtainedat a distance of 4.3 km from the outfall during a high tide disposal. At Malad creek, a dilution factorof 10 was obtained at a distance of 2 km from the injection point during flood tide disposal and of1.8 x 106 was obtained at a distance of 4.9 km during ebb tide disposal. Comparable dilution factorswere also obtained by Brooks' model. A 2D advection simulation model was employed to simulatethe spatial and temporal distribution of the radiotracer data. From the model simulation a value ofDx = 15 m2^"1 and Dy = 2 m2.s"! was obtained at Colaba and a value of Dx = 20 m .s"1 and Dy =
2 12m .s" was obtained at Malad creek during an ebb tide experiment.
1. INTRODUCTION
Final disposal of sewage through marine outfallshas become a practical solution for coastal citiesall over the world. Understanding the ability ofthe coastal waters to disperse sewage toacceptable limits is essential for proper siting ofthe outfall. The dispersion process in coastalwaters is mainly governed by a complexinterplay of the hydrodynamic conditions and isoften difficult to express in terms of an empiricalor semi-empirical formula (1). This necessitates"real - time" determination of dispersioncharacteristics using tracers. Tracer studies havebeen carried out to determine physical dilution
and dispersion pattern of sewage released froman existing outfall at Colaba and from asimulated outfall at Malad creek, both off
82Mumbai coast. Br in the form of aqueousNBtBr was used as the tracer.
2. THE COASTAL SYSTEM
The Municipal Corporation of Mumbaidischarges treated sewage at various locationsoff Mumbai coast. One such discharge point (i.e.outfall) is located at Colaba and two others atMalad creek. A location map showing theoutfalls is given in Fig. 1.
• Malad
Arabian SeaRuia Eitat*
Suit-n-f andI Hotel
horizondnlrl
\•Andlwti/
SantacruzBandras,Dada/
r ^ t f .• edhbay
cantrai
CMirchgata
Figure 1: Location map of the two experimental sites.
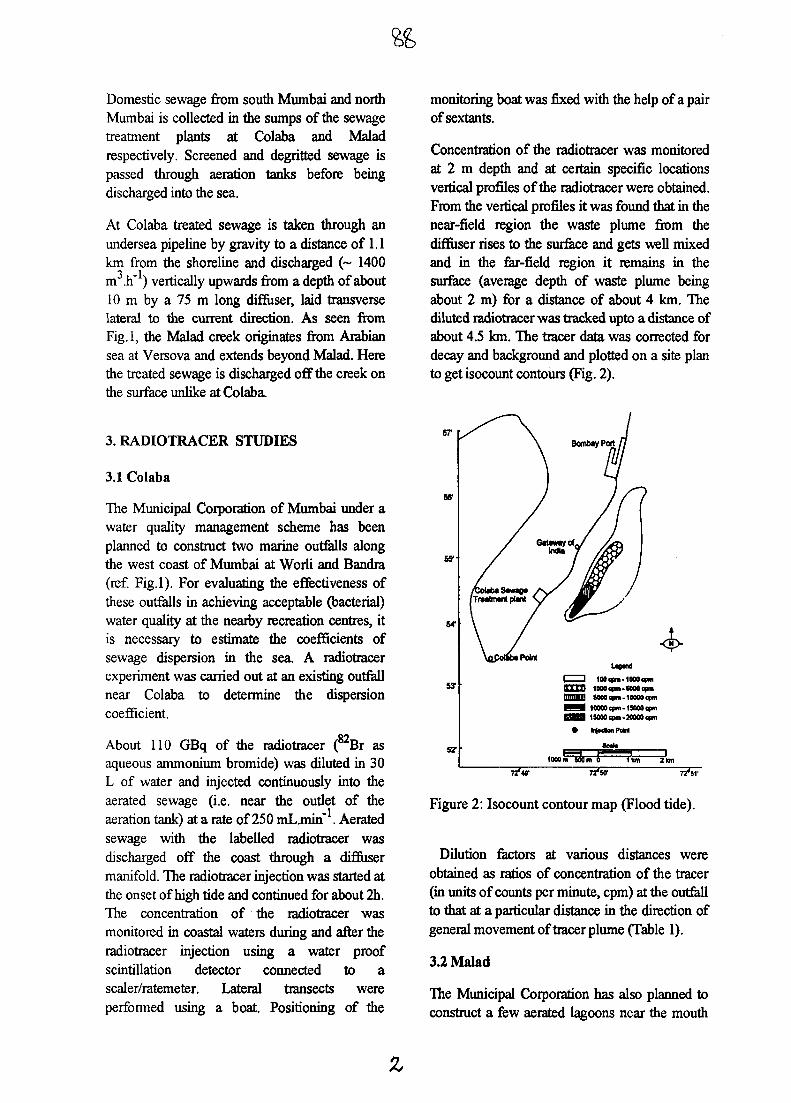
Domestic sewage from south Mumbai and northMumbai is collected in the sumps of the sewagetreatment plants at Colaba and Maladrespectively. Screened and degritted sewage ispassed through aeration tanks before beingdischarged into the sea.
At Colaba treated sewage is taken through anundersea pipeline by gravity to a distance of 1.1km from the shoreline and discharged (~ 1400m .h") vertically upwards from a depth of about10 m by a 75 m long diffuser, laid transverselateral to the current direction. As seen fromFig.l, the Malad creek originates from Arabiansea at Versova and extends beyond Malad. Herethe treated sewage is discharged off the creek onthe surface unlike at Colaba.
3. RADIOTRACER STUDIES
3.1 Colaba
The Municipal Corporation of Mumbai under awater quality management scheme has beenplanned to construct two marine outfalls alongthe west coast of Mumbai at Worli and Bandra(ref. Fig.l). For evaluating the effectiveness ofthese outfalls in achieving acceptable (bacterial)water quality at the nearby recreation centres, itis necessary to estimate the coefficients ofsewage dispersion in the sea. A radiotracerexperiment was carried out at an existing outfallnear Colaba to determine the dispersioncoefficient.
About 110 GBq of the radiotracer ( Br asaqueous ammonium bromide) was diluted in 30L of water and injected continuously into theaerated sewage (i.e. near the outlet of theaeration tank) at a rate of 250 mL.min" . Aeratedsewage with the labelled radiotracer wasdischarged off the coast through a diffusermanifold. The radiotracer injection was started atthe onset of high tide and continued for about 2h.The concentration of the radiotracer wasmonitored in coastal waters during and after theradiotracer injection using a water proofscintillation detector connected to ascaler/ratemeter. Lateral transects wereperformed using a boat. Positioning of the
monitoring boat was fixed with the help of a pairof sextants.
Concentration of the radiotracer was monitoredat 2 m depth and at certain specific locationsvertical profiles of the radiotracer were obtained.From the vertical profiles it was found that in thenear-field region the waste plume from thediffuser rises to the surface and gets well mixedand in the far-field region it remains in thesurface (average depth of waste plume beingabout 2 m) for a distance of about 4 km. Thediluted radiotracer was tracked upto a distance ofabout 4.5 km. The tracer data was corrected fordecay and background and plotted on a site planto get isocount contours (Fig. 2).
67'
Sff
651
531 100cp*-1000cpna r m 10Mcpm-KMtf>mnnnaB soooqm-iooooqmH H I 10000 cpn-HOOOqm
1M00qxn-2OMOcpni
lOOOn «Som 4
7 / W
Figure 2: Isocount contour map (Flood tide).
Dilution factors at various distances wereobtained as ratios of concentration of the tracer(in units of counts per minute, cpm) at the outfallto that at a particular distance in the direction ofgeneral movement of tracer plume (Table 1).
3.2 Malad
The Municipal Corporation has also planned toconstruct a few aerated lagoons near the mouth
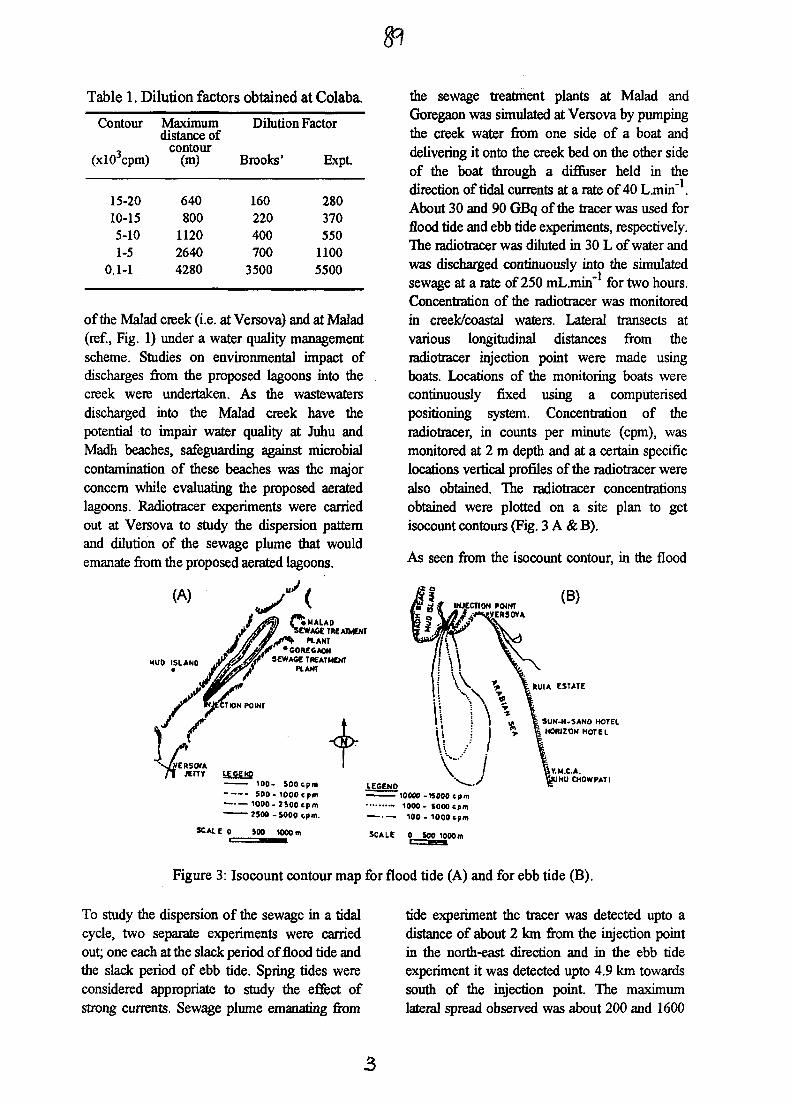
Table 1. Dilution factors obtained at Colaba.
Contour
(xl03cpm)
15-2010-155-101-5
0.1-1
Maximumdistance of
contour(m)
640800
112026404280
Dilution Factor
Brooks' Expt.
160220400700
3500
280370550
11005500
of the Malad creek (i.e. at Versova) and at Malad(ref, Fig. 1) under a water quality managementscheme. Studies on environmental impact ofdischarges from the proposed lagoons into thecreek were undertaken. As the wastewatersdischarged into the Malad creek have thepotential to impair water quality at Juhu andMadh beaches, safeguarding against microbialcontamination of these beaches was the majorconcern while evaluating the proposed aeratedlagoons. Radiotracer experiments were carriedout at Versova to study the dispersion patternand dilution of the sewage plume that wouldemanate from the proposed aerated lagoons.
Ci MALAD»VAGE TREATMENT
•GOREGAONSEWAGE TREATMENT
PLANT
JETTY LEOENp1 0 0 - SOOcpm500- 1000ipm
1000 -JSOOepm1 Z5OO-5OOO epm.
SCALE 0 SCO 1000m
the sewage treatment plants at Malad andGoregaon was simulated at Versova by pumpingthe creek water from one side of a boat anddelivering it onto the creek bed on the other sideof the boat through a difluser held in thedirection of tidal currents at a rate of 40 Ljnin"1.About 30 and 90 GBq of the tracer was used forflood tide and ebb tide experiments, respectively.The radiotracer was diluted in 30 L of water andwas discharged continuously into the simulatedsewage at a rate of 250 mLmin for two hours.Concentration of Ihe radiotracer was monitoredin creek/coastal waters. Lateral transects atvarious longitudinal distances from theradiotracer injection point were made usingboats. Locations of the monitoring boats werecontinuously fixed using a computerisedpositioning system. Concentration of theradiotracer, in counts per minute (cpm), wasmonitored at 2 m depth and at a certain specificlocations vertical profiles of the radiotracer werealso obtained. The radiotracer concentrationsobtained were plotted on a site plan to getisocount contours (Fig. 3 A & B).
As seen from the isocount contour, in the flood
LEGEND- 10000 -15000 tpm
- 1000- 5000 Cpm1 0 0 - 1 0 0 0 cpm
SCALE 0 S00 1000m
SUN-M-SANO HOTELHORIZON HOTEL
Y.M.C.A.HU CH0WPATI
Figure 3: Isocount contour map for flood tide (A) and for ebb tide (B).
To study the dispersion of the sewage in a tidalcycle, two separate experiments were carriedout; one each at the slack period of flood tide andthe slack period of ebb tide. Spring tides wereconsidered appropriate to study the effect ofstrong currents. Sewage plume emanating from
tide experiment the tracer was detected upto adistance of about 2 km from the injection pointin the north-east direction and in the ebb tideexperiment it was detected upto 4.9 km towardssouth of the injection point. The maximumlateral spread observed was about 200 and 1600
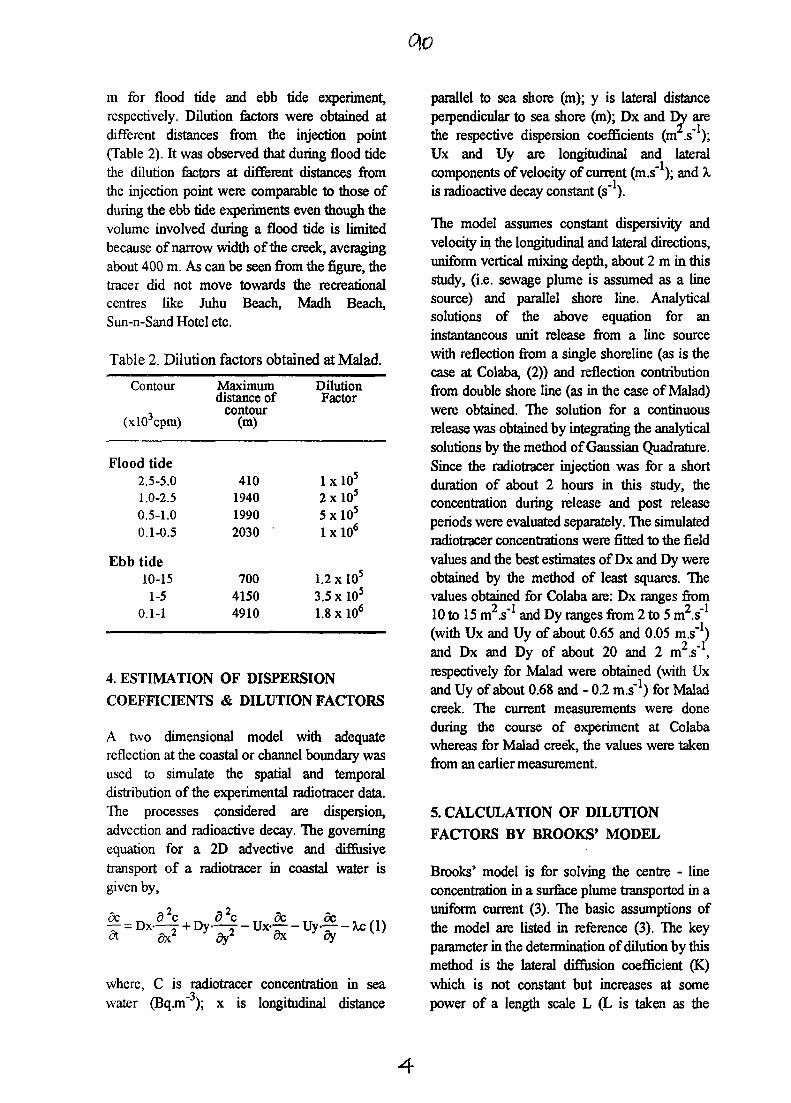
0\0
m for flood tide and ebb tide experiment,respectively. Dilution factors were obtained atdifferent distances from the injection point(Table 2). It was observed that during flood tidethe dilution factors at different distances fromthe injection point were comparable to those ofduring the ebb tide experiments even though thevolume involved during a flood tide is limitedbecause of narrow width of the creek, averagingabout 400 m. As can be seen from the figure, ihetracer did not move towards the recreationalcentres like Juhu Beach, Madh Beach,Sun-n-Sand Hotel etc.
Table 2. Dilution factors obtained at Mated.
Contour
(xl03cpm)
Flood tide2.5-5.01.0-2.50.5-1.00.1-0.5
Ebb tide10-15
1-50.1-1
Maximumdistance of
contour(m)
410194019902030
70041504910
DilutionFactor
lx lO 5
2xlO5
5x l0 5
lxlO6
1.2 x 10s
3.5 x 10⁵
1.8 x 10⁶
4. ESTIMATION OF DISPERSION
COEFFICIENTS & DILUTION FACTORS
A two dimensional model with adequatereflection at the coastal or channel boundary wasused to simulate the spatial and temporaldistribution of the experimental radiotracer data.The processes considered are dispersion,advection and radioactive decay. The governingequation for a 2D advective and diffusivetransport of a radiotracer in coastal water isgiven by,
5c d c d c 9c TT dc « ,1X— = Dx-— + Dy-—y - Ux — - Uy— - Xc (1)91 dx dyl
OK dy
where, C is radiotracer concentration in seawater (Bq.m" ); x is longitudinal distance
parallel to sea shore (m); y is lateral distanceperpendicular to sea shore (m); Dx and Dy arethe respective dispersion coefficients (m .s");Ux and Uy are longitudinal and lateral
.-Ucomponents of velocity of current (m.s ); and Xis radioactive decay constant (s~).
The model assumes constant dispersivity andvelocity in the longitudinal and lateral directions,uniform vertical mixing depth, about 2 m in thisstudy, (i.e. sewage plume is assumed as a linesource) and parallel shore line. Analyticalsolutions of the above equation for aninstantaneous unit release from a line sourcewith reflection from a single shoreline (as is thecase at Colaba, (2)) and reflection contributionfrom double shore line (as in the case of Malad)were obtained. The solution for a continuousrelease was obtained by integrating the analyticalsolutions by the method of Gaussian Quadrature.Since the radiotracer injection was for a shortduration of about 2 hours in this study, theconcentration during release and post releaseperiods were evaluated separately. The simulatedradiotracer concentrations were fitted to the fieldvalues and the best estimates of Dx and Dy wereobtained by the method of least squares. Thevalues obtained for Colaba are: Dx ranges from10 to 15 m .s" and Dy ranges from 2 to 5 m .s"
1(with Ux and Uy of about 0.65 and 0.05 )and Dx and Dy of about 20 and 2 m .s" ,respectively for Malad were obtained (with Uxand Uy of about 0.68 and - 0.2 m.s'1) for Maladcreek. The current measurements were doneduring the course of experiment at Colabawhereas for Malad creek, the values were takenfrom an earlier measurement.
5. CALCULATION OF DILUTION
FACTORS BY BROOKS' MODEL
Brooks' model is for solving the centre - lineconcentration in a surface plume transported in auniform current (3). The basic assumptions ofthe model are listed in reference (3). The keyparameter in the determination of dilution by thismethod is the lateral diffusion coefficient (K)which is not constant but increases at somepower of a length scale L (L is taken as the
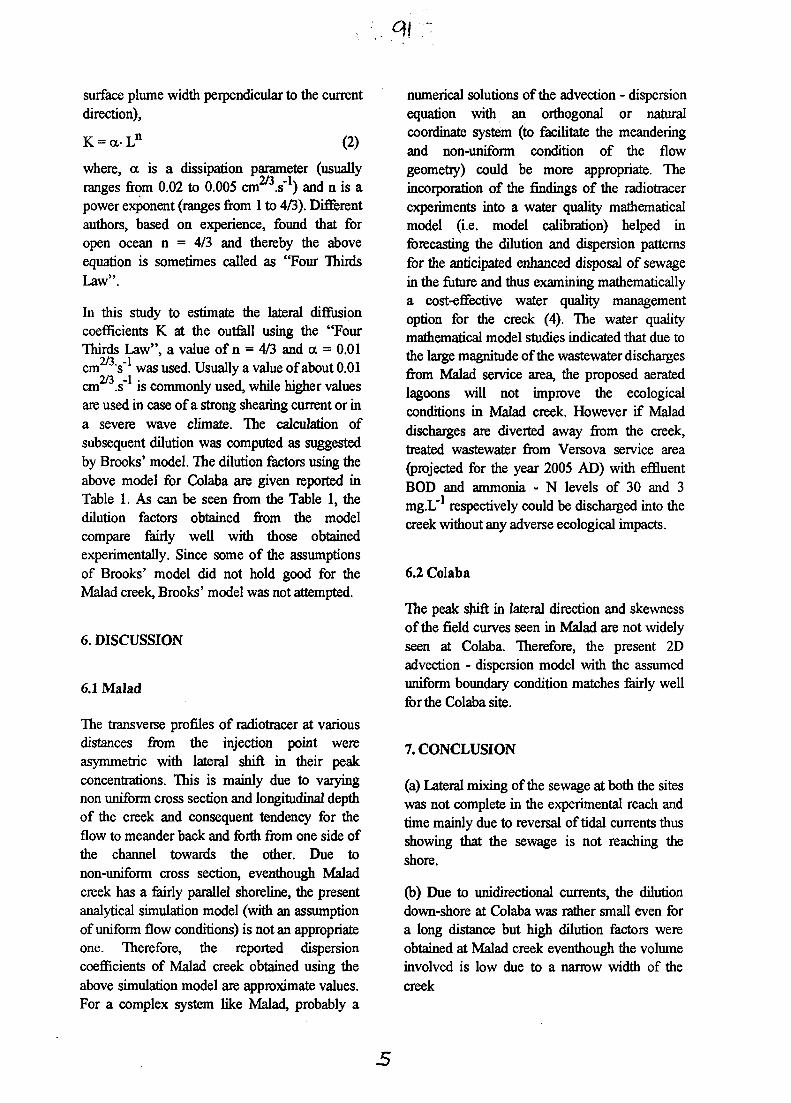
q\
surface plume width perpendicular to the current
direction),
- a- L (2)
where, a is a dissipation parameter (usuallyranges from 0.02 to 0.005 cm .s ) and n is apower exponent (ranges from 1 to 4/3). Differentauthors, based on experience, found that foropen ocean n = 4/3 and thereby the aboveequation is sometimes called as "Four ThirdsLaw".
hi this study to estimate the lateral diffusioncoefficients K at the outfall using the "FourThirds Law", a value of n = 4/3 and a = 0.01cm s" was used. Usually a value of about 0.01cm 3.s'1 is commonly used, while higher valuesare used in case of a strong shearing current or ina severe wave climate. The calculation ofsubsequent dilution was computed as suggestedby Brooks' model. The dilution factors using theabove model for Colaba are given reported inTable 1. As can be seen from the Table 1, thedilution factors obtained from the modelcompare fairly well with those obtainedexperimentally. Since some of the assumptionsof Brooks' model did not hold good for theMalad creek, Brooks' model was not attempted.
6. DISCUSSION
6.1 Malad
The transverse profiles of radiotracer at variousdistances from the injection point wereasymmetric with lateral shift in their peakconcentrations. This is mainly due to varyingnon uniform cross section and longitudinal depthof the creek and consequent tendency for theflow to meander back and forth from one side ofthe channel towards the other. Due tonon-uniform cross section, eventhough Maladcreek has a fairly parallel shoreline, the presentanalytical simulation model (with an assumptionof uniform flow conditions) is not an appropriateone. Therefore, the reported dispersioncoefficients of Malad creek obtained using theabove simulation model are approximate values.For a complex system like Malad, probably a
numerical solutions of the advection - dispersionequation with an orthogonal or naturalcoordinate system (to facilitate the meanderingand non-uniform condition of the flowgeometry) could be more appropriate. Theincorporation of the findings of the radiotracerexperiments into a water quality mathematicalmodel (i.e. model calibration) helped inforecasting the dilution and dispersion patternsfor the anticipated enhanced disposal of sewagein the future and thus examining mathematicallya cost-effective water quality managementoption for the creek (4). The water qualitymathematical model studies indicated that due tothe large magnitude of the wastewater dischargesfrom Malad service area, the proposed aeratedlagoons will not improve the ecologicalconditions in Malad creek. However if Maladdischarges are diverted away from the creek,treated wastewater from Versova service area(projected for the year 2005 AD) with effluentBOD and ammonia - N levels of 30 and 3mg.L" respectively could be discharged into thecreek without any adverse ecological impacts.
6.2 Colaba
The peak shift in lateral direction and skewnessof the field curves seen in Malad are not widelyseen at Colaba. Therefore, the present 2Dadvection - dispersion model with the assumeduniform boundary condition matches fairly wellfor the Colaba site.
7. CONCLUSION
(a) Lateral mixing of the sewage at both the siteswas not complete in the experimental reach andtime mainly due to reversal of tidal currents thusshowing that the sewage is not reaching theshore.
(b) Due to unidirectional currents, the dilutiondown-shore at Colaba was rather small even fora long distance but high dilution factors wereobtained at Malad creek eventhough the volumeinvolved is low due to a narrow width of thecreek
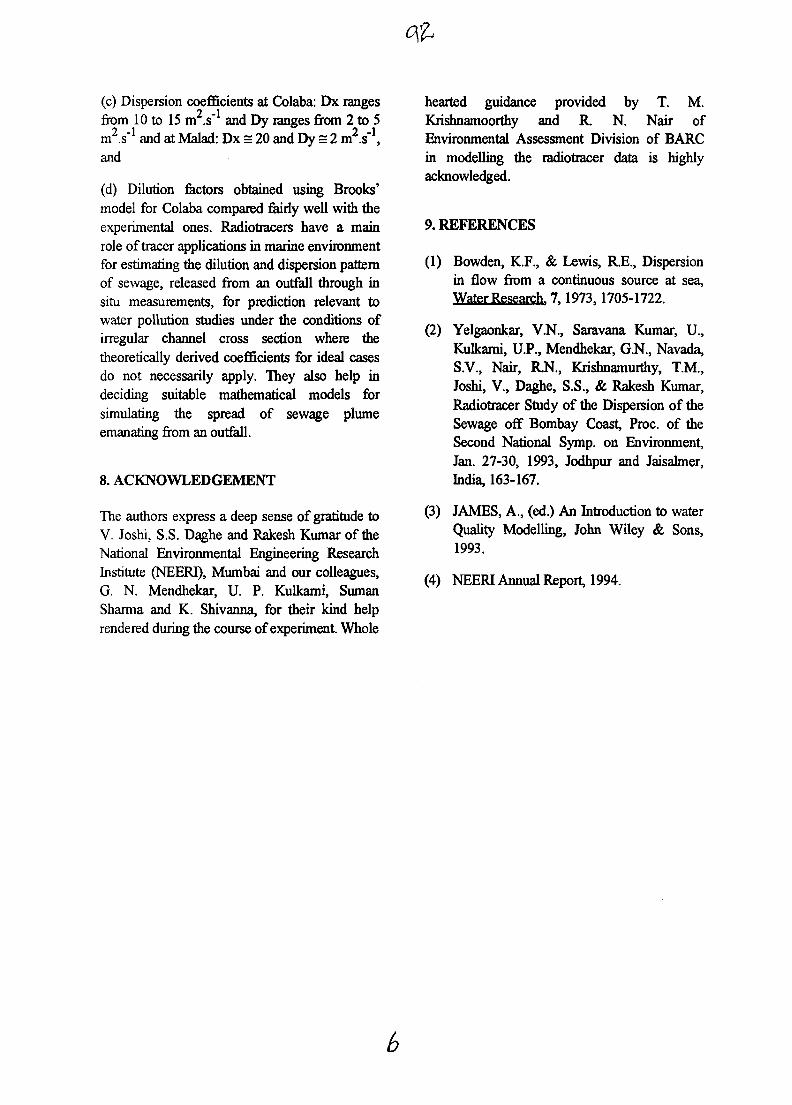
(c) Dispersion coefficients at Colaba: Dx rangesfrom 10 to 15 m .s" and Dy ranges from 2 to 5m2^"1 and at Malad: Dx = 20 and Dy = 2 m2 .s ' \and
(d) Dilution factors obtained using Brooks'model for Colaba compared fairly well with theexperimental ones. Radiotracers have a mainrole of tracer applications in marine environmentfor estimating the dilution and dispersion patternof sewage, released from an outfall through insitu measurements, for prediction relevant towater pollution studies under the conditions ofirregular channel cross section where thetheoretically derived coefficients for ideal casesdo not necessarily apply. They also help indeciding suitable mathematical models forsimulating the spread of sewage plumeemanating from an outfall.
8. ACKNOWLEDGEMENT
The authors express a deep sense of gratitude toV. Joshi, S.S. Daghe and Rakesh Kumar of theNational Environmental Engineering ResearchInstitute (NEERI), Mumbai and our colleagues,G. N. Mendhekar, U. P. Kulkarni, SumanSharma and K. Shivanna, for their kind helprendered during the course of experiment. Whole
hearted guidance provided by T. M.Krishnamoorthy and R. N. Nair ofEnvironmental Assessment Division of BARCin modelling the radiotracer data is highlyacknowledged.
9. REFERENCES
(1) Bowden, K.F., & Lewis, R.E., Dispersionin flow from a continuous source at sea,Water Research. 7, 1973,1705-1722.
(2) Yelgaonkar, V.N., Saravana Kumar, U.,Kulkami, U.P., Mendhekar, G.N., Navada,S.V., Nair, R.N., Krishnamurthy, T.M.,Joshi, V., Daghe, S.S., & Rakesh Kumar,Radiotracer Study of the Dispersion of theSewage off Bombay Coast, Proc. of theSecond National Symp. on Environment,Jan. 27-30, 1993, Jodhpur and Jaisalmer,India, 163-167.
(3) JAMES, A., (ed.) An Introduction to waterQuality Modelling, John Wiley & Sons,1993.
(4) NEERI Annual Report, 1994.
r -. IliWinilllllllllllllllllllllllllllllllllllllllAU9817320
Paper 16/118
Application of Radioisotope Tracer Technology to the Developmentand Validation of Computational Models for Sediment
and Contaminant Transport in the Coastal Zone
P AIREY, R SZYMCZAK and J Y TUAustralian Nuclear Science & Technology Organisation (ANSTO)
Private Mail Bag 1, Menai, NSW 2234, Australia
The role of radioisotope tracer techniques in support of coastal engineering has changed over theyears. In the past tracers were one of the important sources of basic information in theinvestigation phase. Now, the primary tool in such investigations is the numerical or physicalmodel and tracer techniques are used for model validation has grown with the ever-increasingreliance on model predictions for engineering and environmental decisions.
As the demands on the models grown, it is becoming increasingly important to understand thefundamental bases on which they are based. Indeed, the need for enhanced understanding ofsediment and contaminant transport under extreme sea conditions and over extended scales ofspace and time is the major driving force behind the technology because only with radiotracertechnology can actual observations be made on sediment movement over the long periods (up toone year). This is necessary if there is to be a reasonable prospect of capturing the impact ofextreme storm events etc. Such observations are essential for model validation.
However, predicting sediment and contaminant transport in the coastal zone is difficult because ofthe complexity of hydrodynamics and water-particle interactions. It is also because wastes usuallyare not homogeneous, instead, they usually are composed of a variety of particles with differentdensities and are not uniformly diluted; A discharge frequently takes die form if the turbulence ismodified by ambient flows (such as coastal or estuarine currents) < the presence of boundaries(such as the sea bed or surface), or density stratification, which may occur in estuaries and coastalwaters. Further difficulties occur when municipal and industrial managers using multiple jets frommultiport diffusers try to estimate mixing zone dilution.
Although some mathematical models are available for predicting hydrodynamics in the ocean,their reliability sometimes, particularly when particles are to be introduced, is questionablebecause of the lack of fundamental knowledge about the mechanism of fluid-particle interactionsand of particle turbulent dispersion itself. Some scale-model studies of specific cases wereconducted in the laboratory. However, the laboratory studies cannot simulate all flow features.Thus, field studies using radioisotope tracer technology are necessary to provide verification ofcomputational models for sediment and contaminant transport in the coastal zone.
In this study, a number of important questions associated with the fate of the contaminanttransport from the ocean outfalls will be addressed through a systematic work of radioisotopetracer measurements. The tracer study will provide unique data for the validation of computationalmodels developed in parallel by the research. Detailed results of this study will be reported in afull paper.
AU9817321
Gamma Ray Scanning As Troubleshooting Tool For Unusual And LargeDiameter Refinery Vacuum Columns
T.K. SARKAR, R. CHAWLA, S. BANIK, S.J. CHOPRAEngineer's India Limited, 1, Bhikaji Cama place, New Delhi -110 066, India
GURSHARAN SINGH, H.J. PANT, P. SREERAMAKRISHNAN, D.C. DHAR,P.N. PUSHPANGATHAN, V.K. SHARMA
Isotope Division, Bhabha Atomic Research Centre, Mumbai - 400 085, India
SUMMARY
Gamma scanning of trayed and packed columns is widely used to obtain density profiles andidentify on-line problems such as; damaged tray or packing, foaming, flooding, maldistribution, weepingand entrainment etc. However, scanning of large diameter tray or packed columns requires expertise inhandling high intensity gamma sources along with thorough understanding of distillation engineering.Engineers India Limited., and the Bhabha Atomic Research Centre undertook scanning of two suchlarge diameter (8.4 m and 7.4 m) trayed and packed refinery vacuum distillation columns andsuccessfully diagnosed the problems and suggested remedial actions. Radiography testing of smalldiameter columns can be used to confirm gamma scanning results. One such example for ammoniaseparation column is given.
INTRODUCTION
Gamma scanning technique is an invaluable toolfor better understanding of dynamic processestaking place in industrial columns. Thetechnique can be applied for troubleshooting,debottlenecking, predictive maintenance andprocess optimisation. The advantage is thattroubleshooting exercises can be undertakenunder actual operating conditions by using lowactivity radioactive sources. However, thesource selection, equipment for handlingradioactive source and strategy to be adopted forinspection, vary from situation to situation.Knowledge of column internals, the processtaking place inside and expertise in handlingradioactive sources are essential for undertakinggamma scanning and analysis of scan data.Case studies of a few unusual situations arepresented in this paper wherein large activity110 GBq of Ir-192 source has also been usedwith advantage over the conventionally usedlow activity (MBq) Co-60 sources fortroubleshooting of large diameter refineryvacuum distillation columns. In another case,the integrity of ammonia separation columninternals was first detected by
scanning and then confirmed by radiographytesting.
PRINCIPLE
The on-line problems of trayed or packed bedcolumns such as damaged tray or packing,foaming, flooding, maldistribution, weeping andentrainment etc. can be accurately determinedby gamma scanning technique. Thetransmission of a narrow beam of radiationthrough any material is governed by thefollowing equation:
: = I n e " l i - p - x
I transmitted radiation intensitythrough the column
Io = initial radiation intensity\i = mass attenuation coefficient
p average density of material in radiationpath.
x =• thickness of material in radiationpath.
Since x is essentially constant in a column offixed diameter and JJ. is constant for gammaenergies between 0.3 to 3 MeV, the transmittedradiation intensity is proportional to processmaterial density. The measured intensity isplotted against the column elevation andcarefully interpreted by considering internalloading, hardware configuration of the columnand discounting for the external obstructions inthe radiation path.
Typical scan data for a trayed column shows aset of peaks and valleys indicating vapour space,tray position, liquid level on trays, flooding,dense froth etc. For packed beds, set of scansresulting from equilength chords, taken fromdifferent directions should overlap for uniformdistribution and a lack of matching would notonly indicate non-uniformity but also wouldshow which scan line has vapour/liquid bias.
CASE - 1GAMMA SCANNING OF TRAY TYPEVACUUM COLUMN
The distillation of heavier fractions of crude oilsis carried out in vacuum columns to avoid use ofhigh temperatures needed for distillation inatmospheric columns. The lower operatingpressure of vacuum column (10-25 mm Hg)significantly increases the volume of vapourload per barrel vapourised. As a result, thevacuum distillation columns are much larger indiameters than the atmospheric towers. Thevacuum distillation column of a refineryscanned, was designed to produce vacuum gasoil, spindle oil, light oil, inter oil (10), heavy oiland short residue. Inter oil and heavy oil wereused for lube base stock production directly.Figure 1 shows the configuration of the column.In order to maximise lube base stockproduction, a revamp of the vacuum columnwas taken up. The existing ballast trays werereplaced by lower pressure drop venturi valvetrays.
However, after the revamp when the columnwas started up, there was problem withcompliance of product viscosity and productrate were less than desired. As a remedialaction, the column was opened and 30% of thevalves on trays were intentionally blocked withmetal strips and welding rods to increase vapourvelocities. In spite of this, performance of the
column remained inadequate at the inter oildraw off, heavy neutral (HN) draw off, furnacerecycle and mid pump around zones.
Gamma scanning of the above zones wasundertaken to identify causes formalfunctioning as well as to find out the :
i) effect of increased mid pump around rateon 10 draw off rate,
ii) effect of steam rate in the stripper in the HNdraw off rate.
iii) effect of overflash rate on thefurnace recycle rate.
The internal diameter of the columns was 5.6 mat the top, 8.4 ni in the middle and 3.4 m at thebottom with shell thickness of 30 mm. Gammascanning of such large diameter columns wouldusually require a Co-60 source of about 10 GBq.However, deviating from the usual procedure,the authors used a 110 GBq of Ir-192 in aremotely operated radiography camera. Thecamera body was placed on the platform of thecolumn and the source was driven with aremotely operated cable into a directionalcollimator with 15° half solid angle. As shownin figure 2, by using such a collimator, theradiation intensity remains practically constantover 1 meter segment at a distance of about 8meters.
This gives advantage of many detector positionsfor a single source position. Moreover, use ofIr-192 instead of Co-60, gives better contrast fordetection of liquid & vapour phases.
INTER OIL DRAW OFF ZONE AND TRAY12
Scan was taken in two stages at normaloperating condition of 60m /hr. of mid pumparound and in upset condition of 90m /hr ofpump around liquid, from the inter oil draw offpan to vapor space of tray 12. Results areshown in Figure 3.No clear vapour space was observed upto 400mm above tray 12 at normal operatingcondition. As this was not expected in normal
Since x is essentially constant in a column offixed diameter and (i is constant for gammaenergies between 0.3 to 3 MeV, the transmittedradiation intensity is proportional to processmaterial density. The measured intensity isplotted against the column elevation andcarefully interpreted by considering internalloading, hardware configuration of the columnand discounting for the external obstructions inthe radiation path.
Typical scan data for a trayed column shows aset of peaks and valleys indicating vapour space,tray position, liquid level on trays, flooding,dense froth etc. For packed beds, set of scansresulting from equilength chords, taken fromdifferent directions should overlap for uniformdistribution and a lack of matching would notonly indicate non-uniformity but also wouldshow which scan line has vapour/liquid bias.
CASE - 1GAMMA SCANNING OF TRAY TYPEVACUUM COLUMN
The distillation of heavier fractions of crude oilsis carried out in vacuum columns to avoid use ofhigh temperatures needed for distillation inatmospheric columns. The lower operatingpressure of vacuum column (10-25 mm Hg)significantly increases the volume of vapourload per barrel vapourised. As a result, thevacuum distillation columns are much larger indiameters than the atmospheric towers. Thevacuum distillation column of a refineryscanned, was designed to produce vacuum gasoil, spindle oil, light oil, inter oil (10), heavy oiland short residue. Inter oil and heavy oil wereused for lube base stock production directly.Figure 1 shows the configuration of the column.In order to maximise lube base stockproduction, a revamp of the vacuum columnwas taken up. The existing ballast trays werereplaced by lower pressure drop venturi valvetrays.
However, after the revamp when the columnwas started up, there was problem withcompliance of product viscosity and productrate were less than desired. As a remedialaction, the column was opened and 30% of thevalves on trays were intentionally blocked withmetal strips and welding rods to increase vapourvelocities. In spite of this, performance of the
column remained inadequate at the inter oildraw off, heavy neutral (HN) draw off, furnacerecycle and mid pump around zones.
Gamma scanning of the above zones wasundertaken to identify causes formalfunctioning as well as to find out the :
i) effect of increased mid pump around rateon 10 draw off rate,
ii) effect of steam rate in the stripper in the HNdraw off rate,
iii) effect of overflash rate on thefurnace recycle rate.
The internal diameter of the columns was 5.6 mat the top, 8.4 m in the middle and 3.4 m at thebottom with shell thickness of 30 mm. Gammascanning of such large diameter columns wouldusually require a Co-60 source of about 10 GBq.However, deviating from the usual procedure,the authors used a 110 GBq of Ir-192 in aremotely operated radiography camera. Thecamera body was placed on the platform of thecolumn and the source was driven with aremotely operated cable into a directionalcollimator with 15° half solid angle. As shownin figure 2, by using such a collimator, theradiation intensity remains practically constantover 1 meter segment at a distance of about 8meters.
This gives advantage of many detector positionsfor a single source position. Moreover, use ofIr-192 instead of Co-60, gives better contrast fordetection of liquid & vapour phases.
INTER OIL DRAW OFF ZONE AND TRAY12
Scan was taken in two stages at normaloperating condition of 60m3/hr. of mid pumparound and in upset condition of 90m /hr ofpump around liquid, from the inter oil draw offpan to vapor space of tray 12. Results areshown in Figure 3.No clear vapour space was observed upto 400mm above tray 12 at normal operatingcondition. As this was not expected in normal
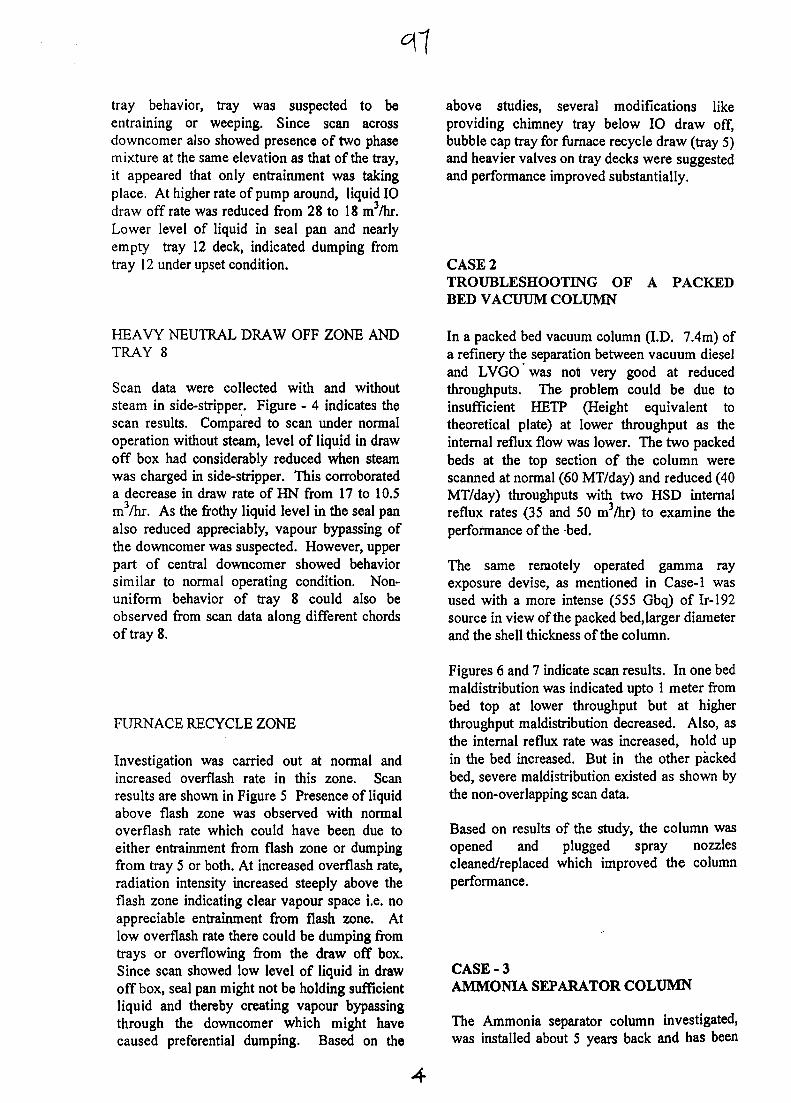
tray behavior, tray was suspected to beentraining or weeping. Since scan acrossdowncomer also showed presence of two phasemixture at the same elevation as that of the tray,it appeared that only entrainment was takingplace. At higher rate of pump around, liquid 10draw off rate was reduced from 28 to 18 m3/hr.Lower level of liquid in seal pan and nearlyempty tray 12 deck, indicated dumping fromtray 12 under upset condition.
above studies, several modifications likeproviding chimney tray below 10 draw off,bubble cap tray for furnace recycle draw (tray 5)and heavier valves on tray decks were suggestedand performance improved substantially.
CASE 2TROUBLESHOOTING OFBED VACUUM COLUMN
A PACKED
HEAVY NEUTRAL DRAW OFF ZONE ANDTRAY 8
Scan data were collected with and withoutsteam in side-stripper. Figure - 4 indicates thescan results. Compared to scan under normaloperation without steam, level of liquid in drawoff box had considerably reduced when steamwas charged in side-stripper. This corroborateda decrease in draw rate of HN from 17 to 10.5m3/hr. As the frothy liquid level in the seal panalso reduced appreciably, vapour bypassing ofthe downcomer was suspected. However, upperpart of central downcomer showed behaviorsimilar to normal operating condition. Non-uniform behavior of tray 8 could also beobserved from scan data along different chordsof tray 8.
FURNACE RECYCLE ZONE
Investigation was carried out at normal andincreased overflash rate in this zone. Scanresults are shown in Figure 5 Presence of liquidabove flash zone was observed with normaloverflash rate which could have been due toeither entrainment from flash zone or dumpingfrom tray 5 or both. At increased overflash rate,radiation intensity increased steeply above theflash zone indicating clear vapour space i.e. noappreciable entrainment from flash zone. Atlow overflash rate there could be dumping fromtrays or overflowing from the draw off box.Since scan showed low level of liquid in drawoff box, seal pan might not be holding sufficientliquid and thereby creating vapour bypassingthrough the downcomer which might havecaused preferential dumping. Based on the
In a packed bed vacuum column (I.D. 7.4m) ofa refinery the separation between vacuum dieseland LVGO was not very good at reducedthroughputs. The problem could be due toinsufficient HETP (Height equivalent totheoretical plate) at lower throughput as theinternal reflux flow was lower. The two packedbeds at the top section of the column werescanned at normal (60 MT/day) and reduced (40MT/day) throughputs with two HSD internalreflux rates (35 and 50 m3/hr) to examine theperformance of the -bed.
The same remotely operated gamma rayexposure devise, as mentioned in Case-1 wasused with a more intense (555 Gbq) of Ir-192source in view of the packed bed.larger diameterand the shell thickness of the column.
Figures 6 and 7 indicate scan results. In one bedmaldistribution was indicated upto 1 meter frombed top at lower throughput but at higherthroughput maldistribution decreased. Also, asthe internal reflux rate was increased, hold upin the bed increased. But in the other packedbed, severe maldistribution existed as shown bythe non-overlapping scan data.
Based on results of the study, the column wasopened and plugged spray nozzlescleaned/replaced which improved the columnperformance.
CASE-3AMMONIA SEPARATOR COLUMN
The Ammonia separator column investigated,was installed about 5 years back and has been
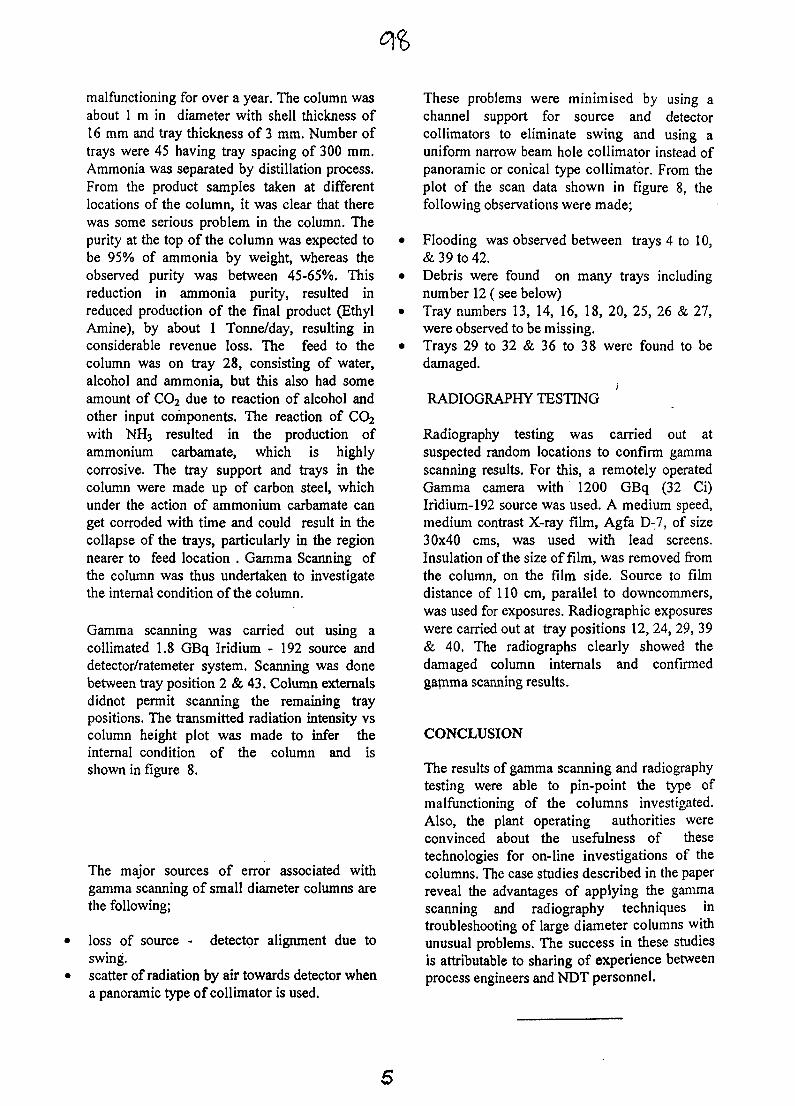
malfunctioning for over a year. The column wasabout 1 m in diameter with shell thickness of16 mm and tray thickness of 3 mm. Number oftrays were 45 having tray spacing of 300 mm.Ammonia was separated by distillation process.From the product samples taken at differentlocations of the column, it was clear that therewas some serious problem in the column. Thepurity at the top of the column was expected tobe 95% of ammonia by weight, whereas theobserved purity was between 45-65%. Thisreduction in ammonia purity, resulted inreduced production of the final product (EthylAmine), by about 1 Tonne/day, resulting inconsiderable revenue loss. The feed to thecolumn was on tray 28, consisting of water,alcohol and ammonia, but this also had someamount of CO2 due to reaction of alcohol andother input components. The reaction of CO2with NH3 resulted in the production ofammonium carbamate, which is highlycorrosive. The tray support and trays in thecolumn were made up of carbon steel, whichunder the action of ammonium carbamate canget corroded with time and could result in thecollapse of the trays, particularly in the regionnearer to feed location . Gamma Scanning ofthe column was thus undertaken to investigatethe internal condition of the column.
Gamma scanning was carried out using acollimated 1.8 GBq Iridium - 192 source anddetector/ratemeter system. Scanning was donebetween tray position 2 & 43. Column externalsdidnot permit scanning the remaining traypositions. The transmitted radiation intensity vscolumn height plot was made to infer theinternal condition of the column and isshown in figure 8.
The major sources of error associated withgamma scanning of small diameter columns arethe following;
loss of source - detector alignment due toswing.scatter of radiation by air towards detector whena panoramic type of collimator is used.
These problems were minimised by using achannel support for source and detectorcollimators to eliminate swing and using auniform narrow beam hole collimator instead ofpanoramic or conical type collimator. From theplot of the scan data shown in figure 8, thefollowing observations were made;
• Flooding was observed between trays 4 to 10,& 39 to 42.
• Debris were found on many trays includingnumber 12 (see below)
• Tray numbers 13, 14, 16, 18, 20, 25, 26 & 27,were observed to be missing.
• Trays 29 to 32 & 36 to 38 were found to bedamaged.
RADIOGRAPHY TESTING
Radiography testing was carried out atsuspected random locations to confirm gammascanning results. For this, a remotely operatedGamma camera with 1200 GBq (32 Ci)Iridium-192 source was used. A medium speed,medium contrast X-ray film, Agfa D-7, of size30x40 cms, was used with lead screens.Insulation of the size of film, was removed fromthe column, on the film side. Source to filmdistance of 110 cm, parallel to downcommers,was used for exposures. Radiographic exposureswere carried out at tray positions 12, 24, 29, 39& 40. The radiographs clearly showed thedamaged column internals and confirmedgamma scanning results.
CONCLUSION
The results of gamma scanning and radiographytesting were able to pin-point the type ofmalfunctioning of the columns investigated.Also, the plant operating authorities wereconvinced about the usefulness of thesetechnologies for on-line investigations of thecolumns. The case studies described in the paperreveal the advantages of applying the gammascanning and radiography techniques introubleshooting of large diameter columns withunusual problems. The success in these studiesis attributable to sharing of experience betweenprocess engineers and NDT personnel.
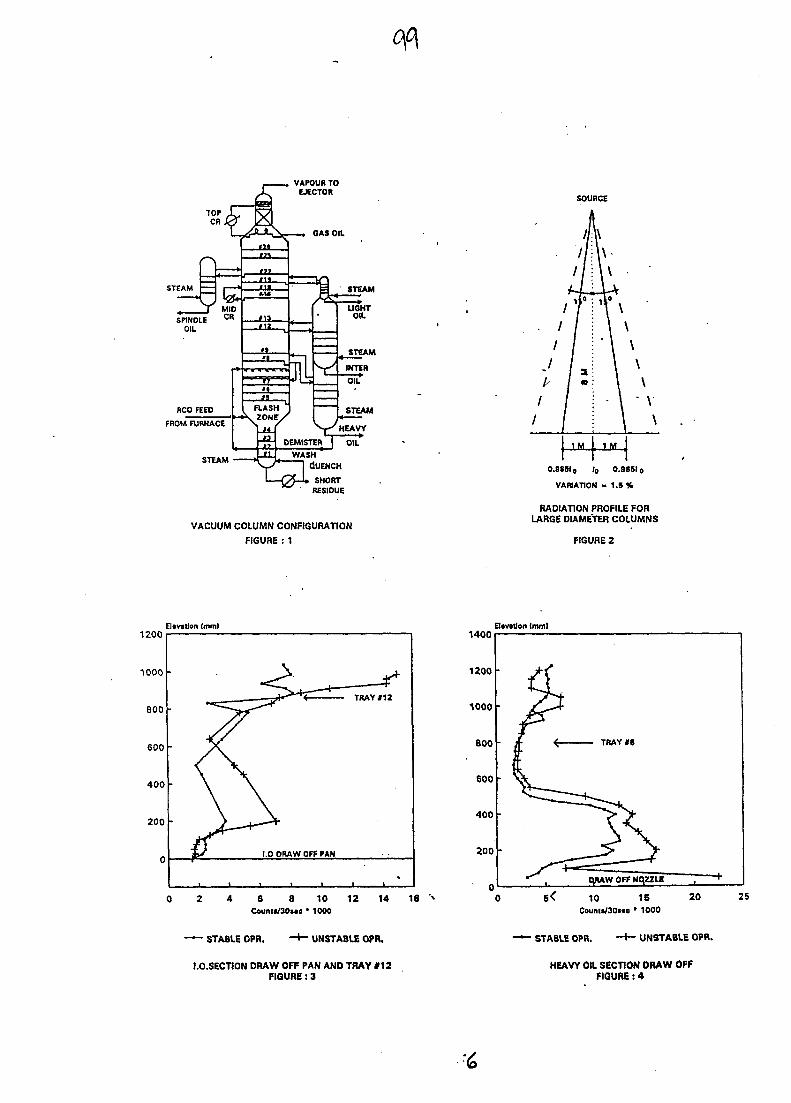
Of\
STEAM
SOURCE
RCO FEED
FROM FURNACE
STEAMWASH
\S* | dUENCH
SHORTRESIDUE
VACUUM COLUMN CONFIGURATION
FIGURE : 1
IM 1 111
0.9851 o Io 0.9SSI0
VARIATION - 1.5 %
RADIATION PROFILE FORURGE DIAMETER COLUMNS
FIGURE 2
1200
1000
800
600
400
200
EUwUon (mm)
1.0 DRAW OFT PAN
1400
1200
1000
BOO
600
400
200
Ettvitlon (mm)
TRAY #8
2 4 8 8 10 12 14 16Count«/30».c • 1O0O
10 15C«inu/30t«e • 1000
20 25
STABLE OPR. ' UNSTABLE OPR.
I.O.SECTION DRAW OFF PAN AND TRAY #12FIGURE: 3
' STABLE OPR. ' UNSTABLE OPR.
HEAVY OIL SECTION DRAW OFFFIGURE: 4
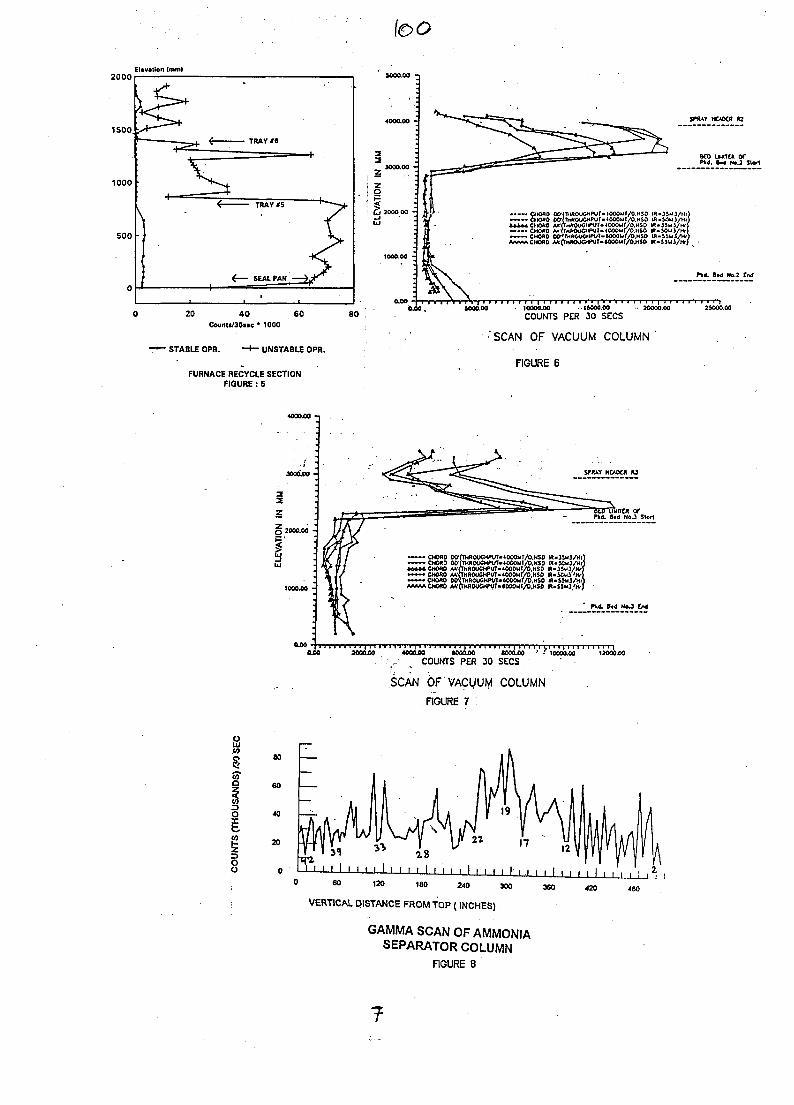
2000
1500
1000
500
Eltwation (mm)
20 40 60Counti/30»c * 1000
• STABLE OPR. • UNSTABLE OPR.
FURNACE RECYCLE SECTIONFIGURE : 5
2
? -• Cl )OOO 00 -
80
0C0 IMTER WPM. ft*4 NoJ Start
• • • - . CHORD po;{piRoucHPyr-toooMr/o.Hso IR .JSMJ/MI
r u n a IOXO— « CHORO
- CHORr*CHORI
> —I I I I 1 > I I *l I I I I I I I I I I I I I I I J 1 I I I I I I I I I I I I I I I I I I I I I I I >0.60. tOOOOO • 10000.00 . IMOO.00 •• 30000.00 36O0O.00
COUNTS PER 30 SECS
SCAN OF VACUUM COLUMN
FIGURE 6
§ 2000.00 -
• — CHORO OC(THROOSHPUr-tOCOur/O.HSOCHORD 00IMHROUCHPUTs4O0OMi/D,HSD A * 5 C M 3 / H I
AAA&£ CHOffO J&fktaROUCJ^P^ffc4G0QMT^D KSD fl'J&4il^^^— • CHORO M'(IHR0U<:HPUT-40O0UI/D!HSD R.SOuy'Hr~ — CHORO D0i1HROUCHI>UT>MOOut/D.HS0 Ut-UMl/Hi
* CHORD M'CTMROuCBWI-eCOOUl/DjlSO tfiiui 'Hi
Pk<. 0.0 NaJ CM
2000X0 4000.00 JOOO.OO WOOJO ' • 10000.00,- v COUNTS PER 30 SECS
SCAN OF VACUUM COLUMN
FIGURE 7
oUJ
8u
80
4 0
2 0
i i i i I i i i i I i i i i I i i i , i , , , , ! •
GO 120 1 8 0 2 4 0 »0 360 420 480
VERTICAL DISTANCE FROM TOP (INCHES)
GAMMA SCAN OF AMMONIA
SEPARATOR COLUMN
FIGURE 8
\0[ AU9817322
Present Status and Future Prospects ofIndustrial Applications of Isotopes in Bangladesh
MD. SANAULLAHBangladesh Atomic Energy Commission
4, Kazi Nazrul Islam Avenue, RamnaDhaka-1000, Bangladesh
SUMMARY: Bangladesh is mainly concerned with the industrial applications of isotopes in thefields of Nuclear Analytical Technique, Radiation Technology, Tracer Technology, NucleonicControl System and Non-Destructive Testing. Bangladesh is also persuing these activities underUNDP/IAEA/RCA Industrial Project through R&D, Service and Training. In the present paper thepast, present and future of industrial application of isotopes in Bangladesh have been described.Chemical analysis of different elements at trace and ultra trace levels, organic and inorganiccompounds of industrial, agricultural, environmental and biological materials using nuclear methodssuch as PKE, XRF, TXRF, PIGE, AAS, GC; column scanning in petroleum industry, effluentdispersion studies related to environment; modification of polymer, RVNRL, sterilization, foodpreservation, Non-Destructive Testing for QA&QC for industries are being extensively carried out.Industrial applications of isotopes are growing faster with industrial growth.
1. INTRODUCTION
Radioisotopes are being used, now-a-days,in a number ways for the benefit of peoplethroughout the world. These include the useof ionizing radiation for quality control andquality assurance of many industrialproducts. The application of radioisotopesand radiation in industry are numerous.Among these are non-destructive testings ofmaterials, radiation technology, nuclearanalytical technique, tracer technique,nucleonic control system. Bangladesh hasbeen working on these fields through theparticipation in the UNDP/IAEA/RCAProject for Asia and the Pacific on theindustrial application of Isotopes andRadiation Technology.
2. NON-DESTRUCTIVE TESTING OFMATERIALS
Bangladesh is mainly concerned with thedevelopment and implementation of Non-Destructive Testing (NDT) technology in herindustrial sector with the followingobjectives:
• to fulfil the demand of NDT services inthe industrial sector for quality controland quality assurance
• to build up a strong and effectiveinfrastructure of local NDT practitionersat international standard through NDTtraining, qualification and certificationscheme
• to initiate Research & Developmentworks on NDT technology and topromote technology transfer of new oradvanced NDT techniques
• to harmonize the National NDT Trainingand Certification Scheme with theRegional Scheme.
INDUSTRIES IN BANGLADESH
In Bangladesh there are many old and newindustries like oil refinery, powergenerating stations, oil and gas pipe lines,paper mills, steel mills, aircrafts, railways,ship buildings, fertilizer factories,pharmaceutical industries, tubemanufacturing plants and other chemicalindustries which need NDT services. Due toa good degree of awareness for testing,inspection, quality control and qualityassurance the NDT techniques are beingapplied in these industries, and itsapplications are growing faster.
NDT FACILITIES IN BANGLADESH
Bangladesh Atomic Energy Commission(BAEC) is the pioneer and leadingorganization in Bangladesh for application,cultivation, development of NDTtechnology. BAEC coordinates NDTactivity on behalf of the Government and abroad range of NDT techniques is available.Besides BAEC some industrialorganizations and private companies havesome NDT facilities of their own.
ACHIEVEMENT
i) RESEARCH &DEVELOPMENT WORK
Limited activities on R&D havebeen initiated in the NDTLaboratory of Atomic EnergyCentre, Dhaka and Institute ofNuclear Science & Technology(INST) at Atomic Energy ResearchEstablishment (AERE). Someuniversity teachers and students areassociated with the R&Dprogramme.
ii) NDT SERVICES TO LOCALINDUSTRIES
All the leading industries inBangladesh have been receivingnecessary NDT services of variouskinds from locally available NDTcompanies/organizations.Comparative cost of NDT services inBangladesh is less than 1% of totalproject cost as compared to othercountries.
Hi) QUALIFICATION ANDCERTIFICATION OF NDTPERSONNEL
To build up a strong and effectiveinfrastructure of local NDTpractitioners at international standardand to attain self reliance in the fieldof NDT technology and to harmonizethe national NDT training andcertification scheme with theRegional scheme, BAEC in activecollaboration with NDT PersonnelCertification Committee and otherorganizations has been organizingNational Training Courses ondifferent NDT methods at differentlevels regularly since 1986. Thesetraining courses have been organizedin accordance with standard IAEASyllabi as specified in IAEATECDOC 407, 628, "TrainingGuideline in Non-Destructive TestingTechnique" and InternationalStandard - ISO 9712, "NonDestructive Testing - Qualificationand Certification of Personnel".
Bangladesh has the following NDTpersonnel:
UT-I: 29, UT-H: 25, UT-EI: 2;RT-I: 35, RT-H: 31, RT-DI:5;ET-I:13,ET-n:12;MT-I: 10, MT-H: 12, MT-DI: 2;PT-1:10, PT-H: 12, PT-ffl : 2
Total NDT Personnel: 200
BANGLADESH SOCIETY FOR NON-DESTRUCTIVE TESTING (BSNDT)
BSNDT was formally formed in May 1991.Since then BSNDT has been regularlyorganizing NDT training courses, seminars,conferences and also publishes Newsletters,Seminar Proceedings for the Society and sofar made bilateral agreements for mutualbenefits and cooperation in the field of NDTwith Japanese Society for Non-DestructiveInspection in May 1993 and AustralianInstitute for Non-Destructive Testing,Indonesian Society for Non-DestructiveTesting, Sri Lankan Society for Non-Destructive Testing in September 1993,Malaysian Society for NDT in March 1995,Canadian Society for Non-DestructiveTesting in May 1995, Indian Society forNDT in 1996. Bangladesh became theMember of International Committee of Non-Destructive Testing in 1996.
Bangladesh is developing NDT techniques tosuch an extend and standard that the countryis attaining self-reliance in the field of NDTtechnology for service and human resourcedevelopment and the foreign dependence inthis field is becoming greatly reduced.
3. NUCLEAR ANALYTICALTECHNIQUE
Under this programme the group has beenable to establish Nuclear and Nuclear-related
Analytical Techniques like PIXE, XRF,TXRF, PIGE, NAA, AAS (Flame andFlameless), GC which are being applied inthe areas of research and developmentprogrammes; Analytical Services andIntercomparison Studies of IAEA SecondaryReference Specimen of various origins.
The main objectives of the R&Dprogrammes are to maintain the WaterResources Problems, Air and MarinePollution and Health related ClinicalChemistry to improve the quality of life anddevelopment of skilled human resources.
The group has measured the levels of lead inthe size fractionated aerosol whichconfirmed the levels of lead in Dhaka,Bangladesh are among the world's highestduring dry season with levels falling duringperiods of medium and heavy rainfall (1).Table 1 shows the concentration of lead indifferent cities. This situation calls forrestriction on lead content in gasoline.
Table 1: Concentration ofdifferent cities
City
Dhaka LRFMRFHRF
Mexico CityBombaySydneySantiagoLos AngelesKyoto
lead in
Pb(ng/m-
4632531603833603332307040
The NAT group also actively participates inthe intercomparison study of different typesof IAEA Secondary Reference Materials(Sediment, coal, fly ash, air particulate,algae and hair) for minor and trace elementanalysis in order to develop the laboratory
\ow
compatibility with other laboratories of theWorld.
Analytical services are being provided todifferent organizations by analysing variouselements of trace and ultra trace levels andalso some organic and inorganic compoundsof the industrial, agricultural, biological,clinical and environmental samples usingdifferent nuclear and non-nuclear analyticaltechniques.
4. TRACER TECHNOLOGY ANDNUCLEONIC CONTROL SYSTEM
The introduction of Tracer Technology andNucleonic Control System in Bangladesh isstill in the nascent stage. The reasons forrelatively slower progress include, amongothers, the lack of users' awareness, absenceof sufficient number of skilled manpower,difficulties to mobilize all the neededequipment, instruments and above all, theresource constraints. BAEC has decided todevelop Tracer Technology in some selectedcases only. So far Three ExecutiveManagement Seminars on Tracer Technologyand Demonstration Experiments on
1)
11)
111)
IV)
have
Mercury Inventory in a Caustic SodaPlant.Gas Flow-Meter Calibration of a
Gas Company.Distillation Column Scanning in aPetroleum Refinery andInstallation of Closed Circuit Water-Flow Rig
been carried out.
5. RADIATION TECHNOLOGY
Bangladesh has been involved in the areasof modification of polymer, RVNRL,sterilization and preservation of food and isanticipating to participate in future to theprojects of sewage sludges, municipal wastes
and printing and packaging, modification ofnatural polymers, improvement of agro-waste by implementing radiation technology.Bangladesh has already attained excellencein the R&D activities in the fields ofpolymer modification, rubber goods,sterilization and preservation.
Polymer modification: Different types offormulations and polymers have alreadybeen developed using UV radiation. Thesepolymers have been successfully used inenhancing the physical - mechanicalproperties of some substrates like jutefibres, jute products, leather surface andwood products. Some novel additives(identified in the BAEC laboratory) helpacquire this excellence. Jute plasticcomposite, prepared with polymericformulation containing these novel additivesby UV radiation is found to be quite durableand sustainable in normal environmentalconditions. These novel formulations havealso helped prepare wood plastic compositewith high tensile properties.
Rubber goods: Rubber latex has beenimproved by vulcanizing the latex withradiation in the presence of variousadditives. The improved latex has been verysuccessful to make improved rubber goods(hand gloves, teats, jute-rubber composites)with highly enhanced rheologicalparameters.
Some private industrial companies haveshown keen interest to adopt this technologyto commercialize the products.
Sterilization: Medical products likesyringes, plastic bottles, gauges, surgicalappliances, eye ointment containers, etc. areroutinely sterilized in AERE gamma facilityfor the partial local supply.
Preservation: Food products e.g. pulses, dryfish, onion, potatoes, etc. are also routinelyradiated in AERE facility for longer shelflife and preservation.
Both food preservation and sterilization ofmedical products are commercially carriedout in the GammaTech Facility, a jointventure company of BAEC and BEXMCO(a private enterpreneur). This GammaTechfacility is, at present, the only CommercialIrradiation Facility in Bangladesh.Bangladesh participated in the jointFAO/IAEARPFI (Phase-HT) project (2). Theimportant purpose of the project was to seekeffective food irradiation technology transferthrough proper process control as envisagedin the Codex Alimentarius Commission'srelevant 'Standards of Irradiation of Foods'and associated 'Code of practice forOperation of Radiation Facilities forTreatment of Foods' with adoption of "GoodManufacturing Practice (GMP) and GoodIrradiation Practice (GD?)". Special emphasiswas laid on detailed dosimetry in theirradiation process and enhanced markettesting of irradiated products.
6. RADIATION PROTECTIONINFRASTRUCTURE
BAEC is responsible for developing andstrengthening the radiation protectioninfrastructure in Bangladesh in order to beable to carry out the responsibilities given toit under the different provisions of theNuclear Safety and Radiation Control(NSRC) Act No.21 of 1993. Suchresponsibilities involve radiation dosimetry,radiation survey, environmental monitoring,personnel monitoring, radiation survey anddosimetry of different diagnostic, deeptherapy X-ray machines and teletherapy unitsin different clinics and hospitals and otherradiation sources in laboratories andindustries, calibration and standardization ofradiation measuring instruments, food and
other testing services and training ofdifferent categories of personnel,dissemination of information and promotionof awareness, issuance of licences/permitsfor import/transportation and storage ofradioactive sources/materials/radiationemitting machines, management, processing,storage and final disposal of radioactivewastes.
7. CONCLUSION
The potential of NDT technology, NAT,Tracer, Radiation Technology in the field ofResearch & Development, service andtraining is great in Bangladesh and itsrequirement is increasing with industrialgrowth. Due to increasing awareness, theindustrial organizations are becoming moreand more interested to utilize these nucleartechniques for QA & QC of their industrialproducts and thus a great economic benefitis being envisaged.
8. ACKNOWLEDGEMENT
The author gratefully acknowledges thereceipt of the financial grant fromInternational Seminar Support Scheme ofAustralian Agency for InternationalDevelopment (AusAid) and AustralianNuclear Association Inc. for theircooperation and assistance.
9. REFERENCE
(l)Khaliquzzaman, M., Biswas, S.K.,Tarafdar, S.A, Islam, A., Khan,AH., Tracer element composition ofAir borne particulate matter inUrban and Rural Areas ofBangaldesh, AECD/AFD-CH/3-44.November. 1995.
(2)Miah, M A W . Country Statement:Bangaldesh, 18th RCA WorkingGroup Meeting, Beijing, China, 20-24 May, 1996.
tpb AU9817323
A Multiphase Flow Meter for the On-line Determinationof the Flow Rates of Oil, Water and Gas
G. J. ROACH and J. S. WATTCSIRO Minerals, Private Mail Bag 5, Menai, NSW 2232, Australia
SUMMARY. The CSIRO multiphase flow meter (MFM) determines the flow rates of oil, waterand gas in pipelines from oil wells. It is based on two specialised gamma-ray transmissiongauges, and pressure and temperature sensors, mounted on the pipeline carrying the full flow ofthe heterogeneous multiphase mixture. The flow rates of oil, water and gas are determined bycombining separate measurements of liquid and gas flow rates, and the ratio of water and liquids(water cut). In three trials at offshore production facilities in Australia, the MFM determined theflow rates of each phase to relative errors in the range of 4-10% (la). In a recent trial at a Texacoflow facility, water cut was determined to 2% rms absolute, and flow rates of oil, water and gasdetermined to between 6 and 8% relative. The MFM is licensed to Kvaerner FSSL whocompleted the manufacture of their first MFM in August 1997.
1. INTRODUCTION
Pipelines carry multiphase mixtures of crudeoil, formation water and gas from oil wellsto production facilities where the mixture isseparated into single phase streams. Theflow rates of each phase of these mixtures,from each oil well, must be measured toprovide information necessary for thecontrol and optimisation of the oil field.Currently, each well stream is sequentiallyfed via a manifold to a common testseparator that separates the multiphasemixture into its three phases. Conventionalmeters, such as turbine meters and orificeplates, then measure the flow rate of eachsingle phase.
The oil industry wants to replace testseparators by multiphase flow meters(MFMs). MFMs mount directly onto thewell pipelines. They have advantages overthe test separators and their associatedfacilities of being considerably lessexpensive, are much smaller and lighter, areless labour intensive in their operation, andthey can be used subsea. MFMs mounted onsubsea pipelines near the well headovercome the need for test pipelinesbetween the subsea completion and the hostplatform. For oil fields in deep water, this
could lead to capital savings of tens ofmillions of dollars.
Various organisations (1) have developedand, with varying success, field testedMFMs. The aim is to determine the single-phase flow rates to about 5-10% relative,which meets the needs for control andoptimisation of oil production.
This paper describes the gamma-ray MFMdeveloped by CSIRO, summarises the fieldtrials undertaken in Australia, and describesmore fully the results of the trial at amultiphase flow loop in the USA.
2. THE MULTIPHASE FLOW METER
2.1 Principles
The MFM (1) consists of two gamma-raytransmission gauges, and pressure andtemperature sensors, mounted about apipeline carrying the full flow of theproduction stream (Fig. 1). The first gauge, adensity gauge, measures the intensity of 662keV gamma-rays transmitted through thefluids in the pipeline. The second, a dualenergy gamma-ray transmission (DUET)gauge, measures the transmitted intensitiesof 59.5 and 662 keV gamma-rays.
All flow rates are calculated from separatedeterminations of water cut (WC) and flowrates of liquids (oil + water) and gas. Watercut, the mass or volume ratio of water toliquids, is determined by DUET techniques.The flow rates of liquids and gas aredetermined by combining measurements of• mass per unit area of liquids across a
diameter of the vertical pipe,• flow velocity by cross-correlation of the
masses per unit area determined by thetwo gauges, and distance between them,
• line pressure and temperature, and• water cut.In the calculation of liquids and gas flowrates from these measurements, a correctionis applied to make an allowance for the slipin velocity between the liquid and gasphases. The mass flow rates of oil and waterare respectively determined by multiplyingliquids flow by (1-WC) and by WC.
The DUET gauge determines the massfractions of oil and water in the liquidsbased on the difference in atomic number ofthe oil and the formation water. Theintensity of the transmitted 59.5 keVgamma-rays depends both on the atomicnumbers of the fluid constituents and themass per unit area of the fluids in thegamma-ray beam. The intensity of thetransmitted 662 keV gamma-rays dependsonly on the mass per unit area of fluids.Water cut is determined by combining thesetwo measurements. It is independent of theform of the mixture, water or oil continuous,or an emulsion. It is also independent ofconcentrations of corrosion inhibitor andsand at levels normally found in oil wellpipelines.
2.2 Hardware
The two gauges, and pressure andtemperature sensors, are mounted on a 150mm pipe (Fig. 1). The DUET gauge ismounted onto a "ring" which is a squat steelcylindrical shell through which the mainlinemultiphase flow passes. The ring containstwo carbon fibre/epoxy windows that isolate
the radioisotope sources and detector fromthe flowing stream. The ring is boltedbetween two flanges of the mainline pipe.The density gauge is mounted on a C-frameclamped onto the mainline pipe.
The narrow beam of gamma-rays emergingfrom the radioisotope source containertraverses a diameter of the pipeline. Thetransmitted gamma-rays are absorbed in theNal crystal of the scintillation detector. Theelectrical signals from the preamplifier arecarried via armoured cables to theprocessing electronics that are housed in thecontrol room on the platform. A fast nuclearcounter processes the signals, and its outputsare further processed by an 80486 personalcomputer. The MFM outputs of flow rates,water cut, and various other parameters thatare all displayed in computer graphics.
3. FIELD TRIALS
The MFM has been proved in three fieldtrials at production facilities in Australia, at:• WMC's Vicksburg off-shore oil
platform, North West Shelf (1992),• WAPET's processing facilities on
Thevenard Island, North West Shelf(1993), and
• Esso Australia/BHP's West Kingfish(WKF) platform, Bass Strait (1994-95).
In each trial, the MFM outputs werecompared, using least squares regression,with flow rates determined by a testseparator. The relative errors (rms differenceto mean component flow rate) ranged from 4to 10% (la). These trials are described indetail in previous publications (2-4).
The advanced prototype MFM has been incontinuous use on the WKF platform sinceNovember 1994, under terms of a CSIRO/Esso Australia Ltd. Agreement.
4. TRIAL AT TEXACO'S FLOW LOOP
CSIRO Minerals tested the MFM atTexaco's multiphase flow loop facility atHumble, Texas, in May-June 1996. The
advantages of testing at a multiphase flowfacility are that the flow rates of oil, waterand gas can be varied over a very widerange, and the conventional metering ofthese flow rates is superior to that normallyobtained at production facilities.
4.1 General comments
The MFM was tested over a wide range offlows including streams with 0-100% watercut, 6-98.4% gas volume fraction (at theoperating pressure and temperature in thepipe), and 480-2800 kPa line pressure.
The MFM measures the detected gamma-rays intensities every five milliseconds. Itprocesses the results of 25 seconds of thisdata at the end of the 25 s period. The wellstream is usually monitored for 10 to 15minutes, and the 25 s flow rates averagedover this longer period for comparison withthe test separator data of flow rates.
Figure 2 shows the variation of mass perunit area of liquids with time for one verygaseous stream with a low volume flow ofliquids. It is probably "churn flow",characterised by a fairly uniform mass perunit area with time and having more gastravelling up the centre of the pipe (4).
Figure 3 shows plots of the mass per unitarea determined simultaneously by the twogamma-ray gauges. The traces for eachgauge are very similar, but the trace for thedownstream gauge is delayed in timecompared with that of the upstream gauge.Cross-correlation of the mass per unit areaoutputs determines the time delay betweenthe two gauge determinations. The velocityis determined from this time delay and thedistance between the two gamma-ray beams.In the Humble trial, cross-correlation wassuccessful for all the GVF range of 5-98.4%.
4.2 Water cut
The DUET gauge was calibrated for watercut by measuring the intensity of 59.5 and662 keV gamma-rays with, sequentially, the
pipe full of oil, (salt) water, and gas. Thesestatic sample measurements are all that isnecessary to provide the on-line calibrationfor the fast moving fluid mixtures.
Water cut, based on the above calibrationtechnique undertaken prior to the trial, wasdetermined to a rms error of 2.0% absolute.This is the average of the errors in water cutdetermined for all streams measured duringthe trial. It includes both the offset in thecalibration, and the 1.6% scatter of resultsabout the line of best fit.
Since the trial, the basic equations forcalculation of water cut have beenimproved, reducing the absolute error to1.7% and the scatter to 1.4% (Fig. 4). This isan excellent result considering the range ofgas volume fractions (GVFs) was 5-98.4%.
The rms errors in water cut are least at lowGVFs because this corresponds to high massper unit area of liquids in the gamma-raybeam. For example, least squares regressionshows that the scatter (about the line of bestfit between the MFM and separator results)to be 1.4% when all streams were included(GVFs: 6-98.4%) and 0.8% when onlystreams with GVF < 60% were included.
4.3 Flow rates of liquids and gases
The MFM measurements are incorporatedinto models of the fluid flowing in the pipe.The models are necessary because thedeterminations of mass per unit area andcross-correlation velocity average over adiameter, and not the total cross-section, ofthe pipe. The gas travels faster than theliquid phases, requiring interpretation of thecross-correlation velocity in terms of fluidflow models. This slip in velocity betweenthe phases is greater at higher GVFs.
The MFM and Texaco flow measurementswere compared by least squares regression.From this comparison, slip correlations weredeveloped for flows with 10%<GVF<90%.Figures 5 and 6 show the results for liquidsand gas flows. The relative errors in these
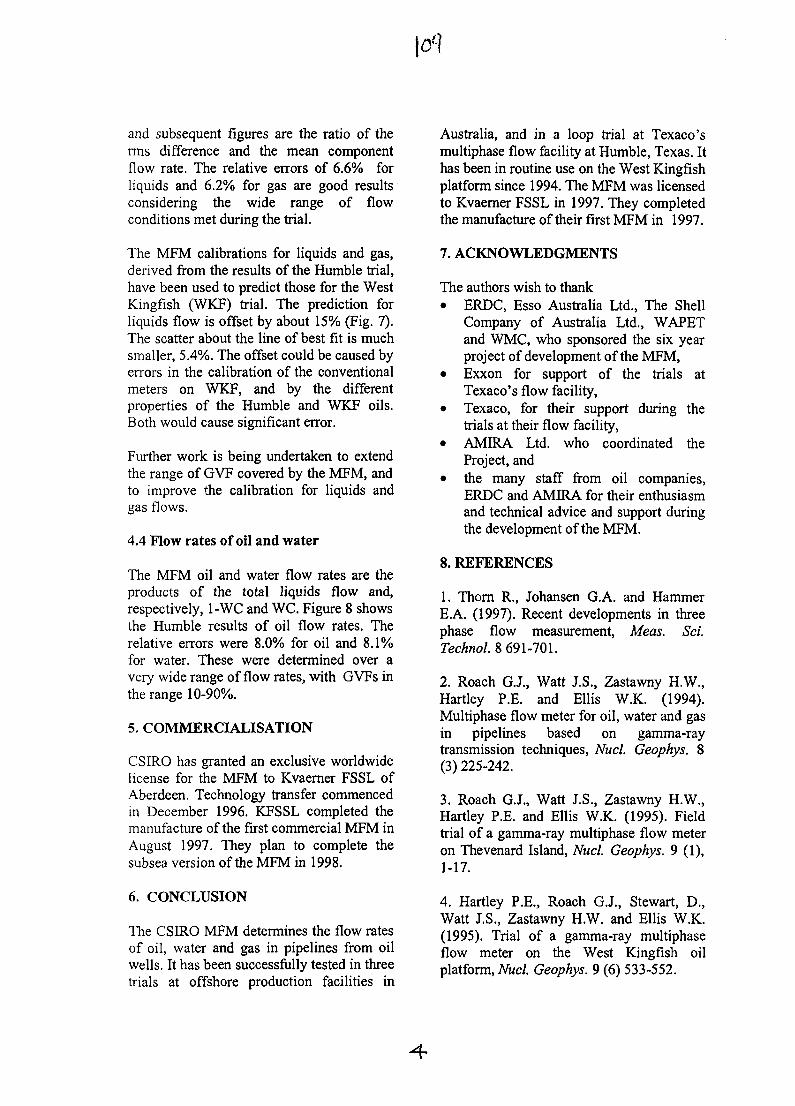
and subsequent figures are the ratio of therms difference and the mean componentflow rate. The relative errors of 6.6% forliquids and 6.2% for gas are good resultsconsidering the wide range of flowconditions met during the trial.
The MFM calibrations for liquids and gas,derived from the results of the Humble trial,have been used to predict those for the WestKingfish (WKF) trial. The prediction forliquids flow is offset by about 15% (Fig. 7).The scatter about the line of best fit is muchsmaller, 5.4%. The offset could be caused byerrors in the calibration of the conventionalmeters on WKF, and by the differentproperties of the Humble and WKF oils.Both would cause significant error.
Further work is being undertaken to extendthe range of GVF covered by the MFM, andto improve the calibration for liquids andgas flows.
4.4 Flow rates of oil and water
The MFM oil and water flow rates are theproducts of the total liquids flow and,respectively, 1-WC and WC. Figure 8 showsthe Humble results of oil flow rates. Therelative errors were 8.0% for oil and 8.1%for water. These were determined over avery wide range of flow rates, with GVFs inthe range 10-90%.
5. COMMERCIALISATION
CSIRO has granted an exclusive worldwidelicense for the MFM to Kvaerner FSSL ofAberdeen. Technology transfer commencedin December 1996. KFSSL completed themanufacture of the first commercial MFM inAugust 1997. They plan to complete thesubsea version of the MFM in 1998.
6. CONCLUSION
The CSIRO MFM determines the flow ratesof oil, water and gas in pipelines from oilwells. It has been successfully tested in threetrials at offshore production facilities in
Australia, and in a loop trial at Texaco'smultiphase flow facility at Humble, Texas. Ithas been in routine use on the West Kingfishplatform since 1994. The MFM was licensedto Kvaerner FSSL in 1997. They completedthe manufacture of their first MFM in 1997.
7. ACKNOWLEDGMENTS
The authors wish to thank• ERDC, Esso Australia Ltd., The Shell
Company of Australia Ltd., WAPETand WMC, who sponsored the six yearproject of development of the MFM,
• Exxon for support of the trials atTexaco's flow facility,
• Texaco, for their support during thetrials at their flow facility,
• AMIRA Ltd. who coordinated theProject, and
• the many staff from oil companies,ERDC and AMIRA for their enthusiasmand technical advice and support duringthe development of the MFM.
8. REFERENCES
1. Thorn R., Johansen G.A. and HammerE.A. (1997). Recent developments in threephase flow measurement, Meas. Sci.Technol. 8 691-701.
2. Roach G.J., Watt J.S., Zastawny H.W.,Hartley P.E. and Ellis W.K. (1994).Multiphase flow meter for oil, water and gasin pipelines based on gamma-raytransmission techniques, Nucl. Geophys. 8(3) 225-242.
3. Roach G.J., Watt J.S., Zastawny H.W.,Hartley P.E. and Ellis W.K. (1995). Fieldtrial of a gamma-ray multiphase flow meteron Thevenard Island, Nucl. Geophys. 9 (1),1-17.
4. Hartley P.E., Roach G.J., Stewart, D.,Watt J.S., Zastawny H.W. and Ellis W.K.(1995). Trial of a gamma-ray multiphaseflow meter on the West Kingfish oilplatform, Nucl. Geophys. 9 (6) 533-552.
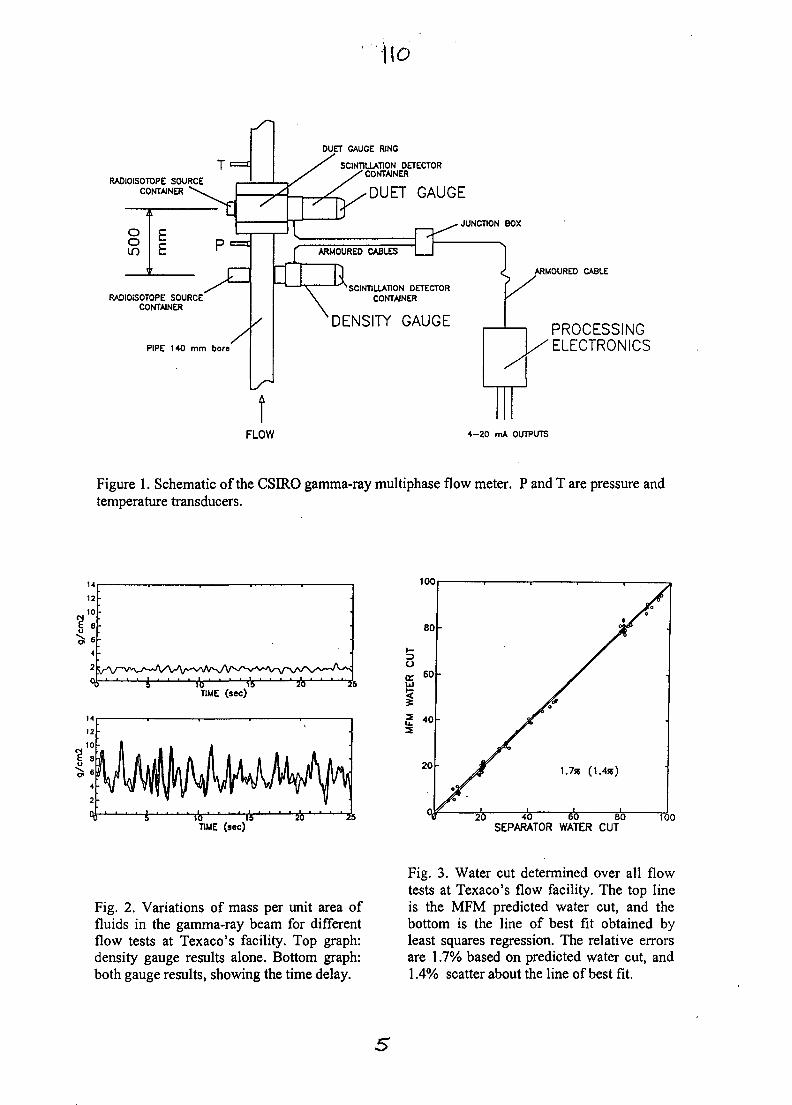
TRADIOISOTOPE SOURCE
CONTAINER
Oom
DUET GAUGE RING
SCINTILLATION DETECTOR' CONTAINER
RADIOISOTOPE SOURCECONTAINER
PIPE 140 mm bore
DUET GAUGE
ARMOURED CABLES
JUNCTION BOX
1SCINTILLATION DETECTORCONTAINER
'DENSITY GAUGE
1 ARMOURED CABLE
PROCESSING'ELECTRONICS
FLOW 4-20 mA OUTPUTS
Figure 1. Schematic of the CSIRO gamma-ray multiphase flow meter. P and T are pressure andtemperature transducers.
100
TIME (sec)20 25 2 0 4 0 60 80
SEPARATOR WATER CUT100
Fig. 2. Variations of mass per unit area offluids in the gamma-ray beam for differentflow tests at Texaco's facility. Top graph:density gauge results alone. Bottom graph:both gauge results, showing the time delay.
Fig. 3. Water cut determined over all flowtests at Texaco's flow facility. The top lineis the MFM predicted water cut, and thebottom is the line of best fit obtained byleast squares regression. The relative errorsare 1.7% based on predicted water cut, and1.4% scatter about the line of best fit.
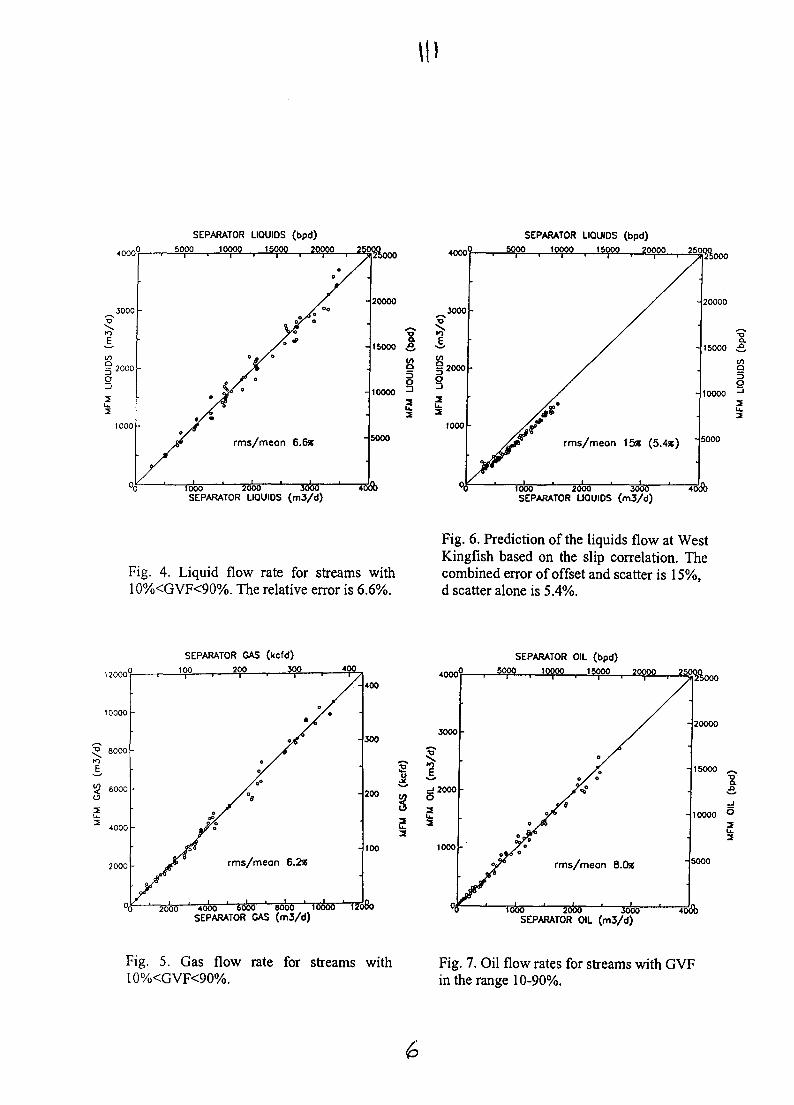
••000
3000•D
(/§2000O
33
SEPARATOR LIOUIDS (bpd)5000 10000 15000 20000 25000
1 ' T~^—•— I —i— 1"—i—~j»25O0O
rms/meon 6.6s
4000
20000
15000
10000
5000
1000 2000 3000SEPARATOR LIQUIDS ( m 3 / d )
000
SEPARATOR LIQUIDS (bpd)5000 10000 15000 20000 250QQ
-^25000
TOOO 2000 3000SEPARATOR UOUIDS (m3/d)
Fig. 4. Liquid flow rate for streams with10%<GVF<90%. The relative error is 6.6%.
Fig. 6. Prediction of the liquids flow at WestKingfish based on the slip correlation. Thecombined error of offset and scatter is 15%,d scatter alone is 5.4%.
12000
SEPARATOR GAS (kcfd)
SEPARATOR GAS (m3/d)
SEPARATOR OIL (bpd)50p0 , ipOOO , Igyip , 2Q000 , KOto
4000—' 6000 8000 10000 12000 1000 2000 3000SEPARATOR OIL ( m 3 / d )
5000
Toob
Fig. 5. Gas flow rate for streams with10%<GVF<90%.
Fig. 7. Oil flow rates for streams with GVFin the range 10-90%.
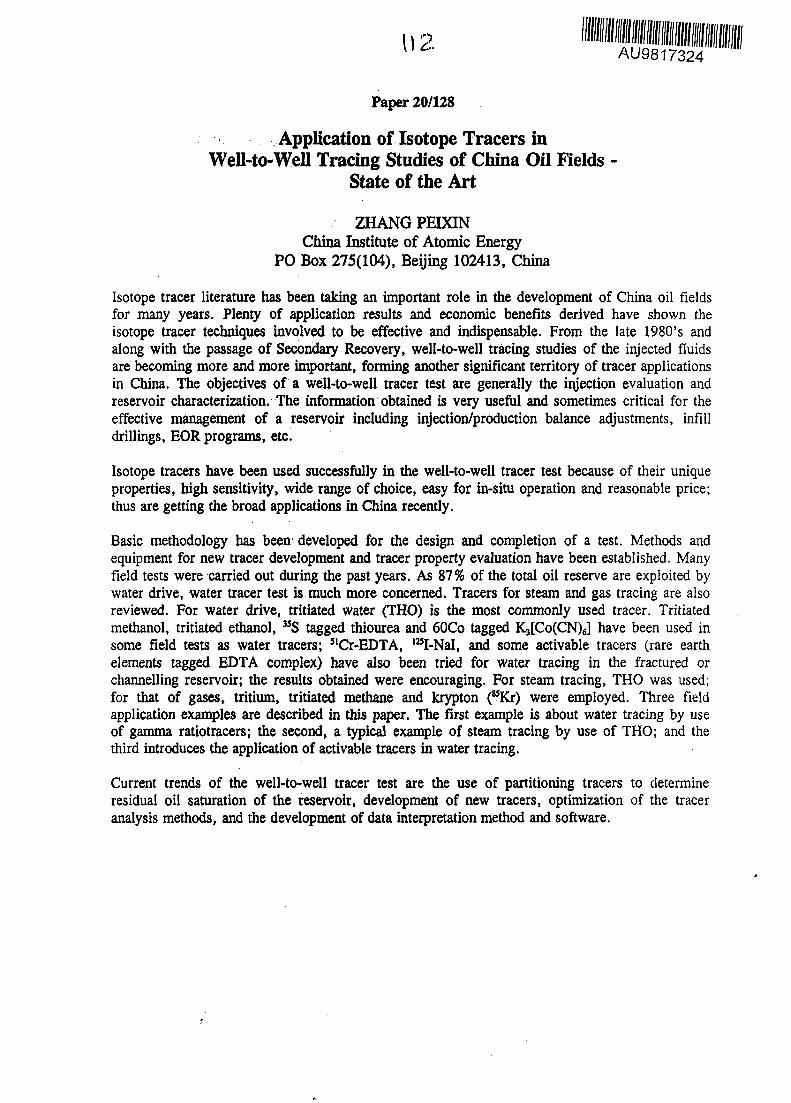
AU9817324
Paper 20/128
Application of Isotope Tracers inWell-to-Well Tracing Studies of China Oil Fields -
State of the Art
ZHANG PEIXINChina Institute of Atomic Energy
PO Box 275(104), Beijing 102413, China
Isotope tracer literature has been taking an important role in the development of China oil fieldsfor many years. Plenty of application results and economic benefits derived have shown theisotope tracer techniques involved to be effective and indispensable. From the late 1980's andalong with the passage of Secondary Recovery, well-to-well tracing studies of the injected fluidsare becoming more and more important, forming another significant territory of tracer applicationsin China. The objectives of a well-to-well tracer test are generally the injection evaluation andreservoir characterization. The information obtained is very useful and sometimes critical for theeffective management of a reservoir including injection/production balance adjustments, infilldrillings, EOR programs, etc.
Isotope tracers have been used successfully in the well-to-well tracer test because of their uniqueproperties, high sensitivity, wide range of choice, easy for in-situ operation and reasonable price;thus are getting the broad applications in China recently.
Basic methodology has been developed for the design and completion of a test. Methods andequipment for new tracer development and tracer property evaluation have been established. Manyfield tests were carried out during the past years. As 87% of the total oil reserve are exploited bywater drive, water tracer test is much more concerned. Tracers for steam and gas tracing are alsoreviewed. For water drive, tritiated water (THO) is the most commonly used tracer. Tritiatedmethanol, tritiated ethanol, ^S tagged thiourea and 60Co tagged ^[CoCCN)^ have been used insome field tests as water tracers; slCr-EDTA, l25I-NaI, and some activable tracers (rare earthelements tagged EDTA complex) have also been tried for water tracing in the fractured orchannelling reservoir; the results obtained were encouraging. For steam tracing, THO was used;for that of gases, tritium, tritiated methane and krypton (wKr) were employed. Three fieldapplication examples are described in this paper. The first example is about water tracing by useof gamma ratiotracers; the second, a typical example of steam tracing by use of THO; and thethird introduces the application of activable tracers in water tracing.
Current trends of the well-to-well tracer test are the use of partitioning tracers to determineresidual oil saturation of the reservoir, development of new tracers, optimization of the traceranalysis methods, and the development of data interpretation method and software.
13
On-Conveyor Belt Determination of Ash in Coal
AU9817325
B.D. SOWERBY, C.S. LIM, D.A. ABERNETHY, Y. LIU ANDP.A. MAGUIRE
Division of MineralsCommonwealth Scientific and Industrial Research Organisation (CSIRO)
Private Mail Bag 5, Menai NSW 2234, Australia
SUMMARY. A laboratory feasibility study has been carried out on new and advanced neutron andgamma-ray analysis systems for the direct on-conveyor belt analysis of ash in coal. Such an analysissystem could deliver the combined advantages of a direct on-conveyor configuration with new andaccurate analysis techniques. An industry survey of 18 coal companies carried out in early 1996indicated that accurate on-belt ash analysis is of the highest priority. Subsequent laboratory work hasfocussed on the investigation of methods with the potential for improving the accuracy of ash contentmeasurement relative to existing on-belt systems.
A laboratory prototype gauge has been developed comprising an 241Am-Be neutron source andmultiple detectors to measure simultaneously neutron inelastic scatter and thermal neutron capturegamma-rays from bulk coal samples. Measurements have been made on 24 bulk (about 70 kg) coalsamples of ash from 7 to 31 wt.%. comprising 12 samples of run-of mine (ROM) coal from MtThorley and 12 samples of product and ROM coal from Camberwell Coal. For a thickness range of100 to 300 mm, we have been able to achieve calibration and cross-validation r.m.s. errors of between0.46 and 0.54 wt.% ash using spectral window count rates with either multiple linear regression orartificial neural network techniques. However, the standard deviation of the chemically measured ashvalues has been estimated to be 0.5 wt.%. The present results suggest that these techniques arecapable of significant improvement in accuracy but are currently limited by the sampling andchemical laboratory error. For comparison, the calculated accuracy of the dual energy gamma-raytransmission (DUET) technique for these samples is 1.8 wt.% ash.
1. INTRODUCTION
The application of on-line analysis techniquesin the mineral and energy industries opens upnew possibilities for the improved control ofprocesses. Instead of manual samplingfollowed by laboratory analysis, rapid andaccurate analyses can be provided in real timefor improved control. This has led to a rapidincrease in the industrial application of on-lineanalysis instrumentation over the last 15 years,particularly in the coal industry [1,2].
The coal industry has an expanding need foraccurate on-line analysis, particularly forimproved control of product quality. This needcan potentially be met by the development andapplication of new direct on-belt analysistechniques which interrogate most of the coal.
Coal consists of coal (combustible) matter(mainly carbon with some hydrogen, oxygenand nitrogen) and mineral matter (mainlyaluminium and other silicates with some iron).Coal ash is the oxidised incombustible residue
from the combustion of coal and is closelycorrelated with the mineral matter content;thus the ash content of coal can be determinedapproximately by measuring the mineralmatter content.
CSIRO Minerals surveyed the Australian coalindustry in 1996 to determine its priorities fornew on-line analysers. Evaluation of the 18responses showed that:• All respondents considered accurate on-belt
ash measurement to be of top priority.• Moisture, sulphur and, to a lesser extent,
specific energy are also important to asignificant proportion of respondents. Afew respondents indicated interest in otherelements such as calcium, iron, phosphorusand silicon.
• Most respondents indicated that ash shouldbe determined to better than 0.2-0.6 wt.%with analysis times of about 5 to 10minutes being acceptable.
• Typical coal thicknesses are 100 - 300 mm.
In this paper, the limitations of current ashanalysers are first discussed followed by theintroduction of possible new neutron/gammatechniques. Several techniques for analysingcomplex gamma-ray spectra are then discussedfollowed by experimental results on a range ofbulk samples.
2. COMMERCIAL ASH ANALYSERS
Commercial gauges for on-line ashdetermination depend on either gamma-raytechniques (DUET, natural gamma radiation orpair production) or the thermal neutron capture(TNC) technique (often referred to as PromptGamma-Ray Neutron Activation Analysis(PGNAA)) [1-3]. All of these techniques havedisadvantages. Only two (DUET and naturalgamma) are used directly on-belt; the othersrequire use of a sample by-line.
The DUET gauge depends on thedetermination of intensities of narrow beamtransmission of low- and high-energy gamma-rays through coal on the conveyor. The maindisadvantage of the technique is that itsaccuracy is affected by changes in ashcomposition; for example, a 1 wt.% change inFe2O3 in the ash will cause a 1.2 wt.% asherror at 20 wt.% ash. Furthermore, the gaugeinterrogates a narrow strip of coal and istherefore sensitive to horizontal segregation ofcoal on the belt; however, this problem can bereadily overcome by, for example, measuringseveral beams across the belt.
The TNC technique determines ash indirectlyby measuring the concentration of most of theindividual elements that constitute ash. TheTNC technique involves bombarding a coalsample with neutrons from a radio-isotopesource, usually 252Cf, and measuring theprompt thermal capture gamma-ray spectrum.However, commercial TNC coal analysersoperate in a sample by-line or chuteconfiguration. Any bias in sampling for the by-line will translate to inaccuracies in the gaugereading.
3. POSSIBLE NEW METHODS FOR ON-BELT ASH DETERMINATION
Ideally, a new on-belt ash analyser wouldhave:
• improved accuracy of ash analysiscompared to DUET gauges;
• reduced sampling errors compared toDUET gauges by analysing a larger samplevolume;
• ash determination independent of beltloading;
• lower cost and greater availabilitycompared to the by-line PGNAA gauges,primarily by deletion of the by-linesampling equipment to supply coal to theanalyser.
One possible approach to the development of anew on-belt ash analyser would be to combineDUET with another technique to compensatefor composition changes. Possible methodswhich have been considered in the past havebeen: combined DUET and pair production;combined DUET and scatter/transmission oflow energy gamma-rays; three energy gamma-ray transmission; and combined DUET andTNC. Unfortunately, previous work on thesecombined techniques has shown only marginalimprovement compared to DUET alone [4,5].
The approach used in the present work is toinvestigate neutron inelastic scatter (NIS) andTNC techniques for application to a direct on-belt geometry. The main challenge here is todevelop techniques which are capable ofaccurately measuring ash independent ofchanges in belt loading and which areinsensitive to both horizontal and verticalsegregation.
In the NIS technique fast neutrons are notcaptured (as in TNC), but undergo inelasticscatter reactions with the nuclei of elements ina sample [6]. During this process promptgamma-rays are produced which arecharacteristic of the elements present. NIS iswell suited to the analysis of carbon, oxygen,aluminium, silicon and iron.
The use of a high energy neutron source suchas 24IAm-Be permits the simultaneousmeasurement of NIS and TNC. In principle,ash can be determined independently ofsample geometry by measuring the ratio of ashelements (Si, Al, Fe) to coal elements such asC and H with appropriate correction formoisture variations.
4. SPECTRAL ANALYSIS TECHNIQUES
One of the key problems in the applicationof NIS and TNC techniques is the analysis ofcomplex gamma-ray spectra. In the presentwork four alternative methods of spectralanalysis have been investigated, namely• spectral windows / multiple linear
regression (SW/MLR);• spectral windows / artificial neural
networks (SW/ANN);• partial least squares (PLS); and• principal components analysis / artificial
neural networks (PCA/ANN).
The first of these involves the determination ofcount rates in selected regions or windowswithin a gamma-ray spectrum. Generallywindows are chosen corresponding tocharacteristic gamma-rays from the elementspresent. These window count rates are thenused in standard multiple linear regressionequations of the form:
y = a0 + a}x} + a2x2 + ... <*„*„ (1)
where y is the parameter of interest, ao....an areconstants and x,....xn are window count rates.This method can provide highly accurateresults for relatively simple spectra, providedthat excellent gain stability is maintained.
The second technique involves using spectralwindow count rates together with ANNtechniques. ANN provides a means formodelling calibration relationships relatingderived coal parameters such as ash tomeasured gauge data. Given sufficient trainingdata and a properly chosen architecture, anANN can progressively "memorise" complexcalibration relationships by means of alearning process which adjusts the weights ofthe links and the biases of the nodes [7].
The third technique investigated was based onPartial Least Squares (PLS) [8] which attemptsto find factors or latent variables, which aremost correlated with the coal variables whiledescribing a large amount of the variation inthe spectrum data. A closely related techniqueto PLS is Principal Components Analysis(PCA) [9]. PCA involves finding combinationsof variables (known as principal components)that describe major trends in the spectral data.The first principal component describes thedirection of the greatest variation in the
spectrum data, the second the next mostdominant variation direction, etc. The fourthtechnique involved correlating these principalcomponents against coal variables using ANNtechniques.
An important difference between linear andnon-linear calibration methods is the need withthe latter for a much larger amount of data toallow cross-validation or testing of the derivedcalibration equation on a new set of data.
5. PRELIMINARY MEASUREMENTS ONSIMULATED COAL SAMPLES
Preliminary tests were first carried out on 18simulated coal samples, each of mass 30 kg,and comprising mixtures of polypropylene (tosimulate coal) with pure samples of SiO2)
A12O3 and Fe2O3 (to simulate ash). Thesematerials were mixed to produce samples withash content from 5-30 wt.% comprising 50-70wt.% SiO2) 25-35 wt.% A12O3 and 5-15 wt.%Fe2O3, simulating the composition variationstypically found in coal plants.
These preliminary measurements were carriedout in the simple backscatter geometry shownin Figure 1. A 238Pu-Be source (which hassimilar characteristics to the 241Am-Be sourcesrecommended for industrial use) was used toirradiate the samples while backscatteredgamma-rays were detected using a bismuthgermanate (BGO) detector. A typical spectrumis shown in Figure 2. Each synthetic samplewas packed into an open polyethylenecontainer of dimensions 545 x 495 x 410 mm.Sample depths spanned the range 68 to 242mm. A counting time of 20 live minutes wasused. In addition, a standard paraffin samplewas measured at regular intervals to monitorgain stability.
Measurements of the simulated coal samplestaken at depths 65 to 242 mm (54 data pointscomprising 18 samples each at threethicknesses) show that ash can be determinedto within 0.84 wt.% over this wide range ofconditions. Restricting the thickness range forthese samples to 130-242 mm reduces ther.m.s. error to 0.70 wt.% ash. These resultswere obtained using simple spectral windowtechniques and conventional multiple linearregression analysis. By comparison, thecalculated accuracy of the DUET gauge [4]
was 2.9 wt.% ash for the same samples. Themeasurements on the paraffin standardindicated that most of the measured 0.7 wt.%ash error is due to temperature-dependentspectral changes in the experimental data. Theresults were therefore regarded as promisingand warranting further investigation.
6. MEASUREMENTS ON COALSAMPLES
6.1 Samples
Twenty-four bulk (-150 kg) coal samples wereobtained comprising 12 run-of-mine (ROM)samples from Mt Thorley and 10 product and 2ROM samples from Camberwell Coal. Thesesamples were mixed and crushed to -10 mmand two 1 -kg (approx.) subsamples taken fromeach sample. During the crushing procedure,two of the Mt Thorley samples wereinadvertently separated into three parts,resulting in a total of 25 samples. Thesubsamples were riffle-split into quarters andone (or in some cases, two) quarter from eachsubsample was sent for chemical laboratoryanalysis to three different laboratories. Thelaboratory analyses indicated that theCamberwell coal samples contained from 6.9to 24.1 wt.% ash and the Mt. Thorley samplescontained from 17.0 to 30.8 wt.% ash.Analysis of data on repeat chemical laboratoryassays and assays of different sub-samplesshowed that the smallest standard deviationdue to preparation and chemical laboratoryanalysis for any one laboratory was 0.5 wt.%ash. The results reported here are based on themean ash values for each sample provided bythat laboratory with one exception where awrong assay for one subsample was discarded.
6.2 Experimental Method
On the basis of results obtained with theanalyser in Figure 1, a new laboratoryprototype analyser was constructed whichconsisted of a loading station and aneutron/gamma gauge using multiple detectorsin an improved geometry and with improvedtemperature control. Three identical open brassboxes, dimensions 500 x 500 x 500 mm, wereused as sample containers. Neutron-inducedgamma-ray spectra were collectedsimultaneously for 20 live minutes on eachdetector. Each of the coal samples supplied by
Camberwell and Mt Thorley was mixed, thenconed and divided into two halves. The firstbrass box was filled with 60+10 kg coal fromthe first half to a depth of -300 mm andneutron/gamma-ray spectra collected. Thiscoal was then transferred to another brass boxand neutron/gamma-ray spectra recorded oncemore; care was taken to ensure that the coalwas well-mixed during the transfer process.The coal was then re-mixed, coned and thendivided into thirds; these were successivelyplaced in the last brass box to providemeasurements for sample depths of 100, 200and 300 mm respectively. Thus a total of fivedata sets were collected for each sample, viz.(1) -60 kg (300mm) in Box 1; (2) contents ofBox 1 in Box 2; (3) -20 kg (100mm) in Box 3;(4) -20 kg x 2 (200mm) in Box 3; and (5) -20kg x 3 (300mm) in Box 3. The data sets weregrouped for analysis as follows:
• Group A: 124 data sets comprising 5 datasets for each of the 25 samples (except forone ROM sample for which only -70 kg ofcoal was provided thus only 4 data setswere obtained for this sample);
• Group B: 74 data sets comprising all the300 mm data from Group A.
• Group C: comprising all the product coalsamples from Group A
• Group D: comprising all the ROM coalsamples from Group A.
6.3 Results
(a) Calibration
MLR has been used to correlate the measuredwindow count rate data with chemicallaboratory ash content. Results show that ashcan be determined to within 0.53 wt.% for coalof thickness 100-300 mm (Table 1) using alldata in group A. Restricting the thickness to300 mm reduces the r.m.s. error to 0.43 wt.%ash (Table 1). If the group were divided into 2subgroups, one containing product coal and theother containing run-of mine samples, ther.m.s. error was 0.50 wt.% for the product coaland 0.47 wt.% for the ROM coal. As acomparison, the calculated accuracy of theDUET technique for all the samples in GroupA is 1.8 wt.% ash.
An analysis of errors shows that countingstatistics are the main source of experimentalerror and that errors due to sample
iF7
inhomogeneity are negligible. The countingstatistical error was estimated to be 0.34 wt.%in ash for the calibration equation determinedby SW/MLR. To determine the error due tosample inhomogeneity, the calibrationequation was used to calculate ash values forthe 300mm data sets (i.e. Group B above). Thestandard deviation was calculated for the pairsof measurements on the first half of eachsample (i.e. the first and second data setsreferred to in section 6.2) to be 0.31 wt.%.Similarly, using pairs of measurements ondifferent halves of each sample (i.e. the firstand fifth data sets as pairs, and the second andfifth data sets as pairs) resulted in values of0.30 and 0.33 wt.% respectively.
PLS was performed separately for data setsfrom two of the detectors used. The first 169channels were removed from each 4096-channel spectrum and each set of spectra wastransformed into a single matrix with 124 rowsand 3927 columns. PLS models wereimplemented using these 2 sets of 124 spectrain conjunction with the correspondingchemical laboratory analysis data for the ash.An r.m.s. error of less than 0.5 wt.% can beachieved by the PLS method using only 6 or 7latent variables. In addition, PLS models wereimplemented for the 300mm thickness data(group B of section 6.2) and an r.m.s. error ofless than 0.5 wt.% was achieved with 4-5latent variables.
A decision was taken not to use ANN forcalibration alone because of the well-knownpossibility of reaching a spurious calibrationresult with this method when no cross-validation data is used to determine a properANN structure.
(b) Calibration with Cross-Validation
The accuracy of a calibration has beenconsidered traditionally to be the r.m.s. errorcalculated for the data from which thecalibration equation was determined. A morerigorous method for estimating the accuracy ofa calibration equation, known as cross-validation, is to calculate the r.m.s. error usingthat equation for a new set of data. Inclusion ofthe cross-validation step is essential to achievea calibration equation with the smallestprediction errors for new data. Ideally, oneshould have a large set of representative data
for calibration and a completely separate set ofrepresentative data for cross validation.
To compare the performance of the fourspectral analysis techniques examined (Section4), group A was divided into two subgroups,the smaller of which contains six samples (twoproduct and four ROM coal) with chemically-determined ash values evenly spread over thefull range of values available. Each techniquewas used to obtain a calibration equation forash from the subgroup containing data fromthe remaining nineteen samples. The resultingcalibration equations were then applied to thedata in the smaller subgroup for cross-validation. The calibration and cross-validationr.m.s. errors calculated for these samples areshown in Table 2.
Of all the methods trialed, the SW/ANNmethod has given the best results. It isimportant to note that SW/ANN, as well as thePLS and PCA/ANN methods, use significantlyless fitting variables than SW/MLR whichcurrently gives results almost as good asSW/ANN. However, the measured accuracy ofany experimental technique will be limited bythe accuracy of the chemical laboratorymeasurements on which the calibration isbased. In the present case, we have been ableto achieve calibration and cross-validationr.m.s. errors of between 0.46 and 0.54 wt.%ash using either SW/MLR or SW/ANN on asuite of coal samples for which the standarddeviation of the chemically measured ashvalues has been estimated to be 0.5 wt.%. Inaddition, increasing the training time for theANN methods or increasing the number oflatent variables for the PLS method reducesthe calibration errors substantially whilstincreasing the cross-validation errors. Theseobservations suggest that both the ANN andPLS techniques are capable of significantimprovement in accuracy but are currentlylimited by the sampling and chemicallaboratory error. All the techniques trialedachieved much better accuracy than thatcalculated for the DUET technique (1.8 wt.%).
7. CONCLUSION
Neutron/gamma-ray techniques combined withadvanced spectral analysis techniques showpromise for the on-conveyor beltdetermination of ash in coal. Laboratory

\\lmeasurements on bulk coal samples showedthat ash can be determined to within about 0.5wt.% ash (about the same as the chemicallaboratory errors) compared to about 1.8 wt.%ash for the DUET gauge on the same samples.
8. ACKNOWLEDGMENTS
The authors would like to thank the AustralianCoal Association Research Program for partialfunding of this work; Camberwell Coal and MtThorley Operations for provision of the bulkcoal samples; and Mineral ControlInstrumentation Ltd for assistance with theindustry survey.
9. REFERENCES
9. Jackson, J.E., Principal Components andFactor Analysis: Part 1 - PrincipalComponents, J. Qual. Tech., 13 (1), 1981.
Table 1. Summary of r.m.s. ash errors formeasurements on bulk coal samples usingmultiple linear regression on window countrates.Data sets(Section
5.2)Group AGroup BGroup CGroup D
Thicknessrange(mm)
100-300300
100-300100-300
Rms.error
(wt.%)0.530.430.500.47
Correl.coeff.
0.9960.9980.98
0.993
1. Krishna, A.T., "On-line analysis of coal",IEA Coal Research Report IEACR/40(Sept. 1991) 79 pp.
2. Sowerby, B.D., Nuclear techniques in thecoal industry, IAEA Symposium onNuclear Techniques in the Exploration andExploitation of Energy and MineralResources, Vienna, Austria, 5-8 June, 1990,pp.3-32.
3. Watt, J.S. and Sowerby, B.D., On-lineDetermination of Ash in Coal UsingSIROASH Gauges, The Coal Journal,March 1984,29-42.
4. Fookes, R.A., Gravitis, V., Watt, J.S.,Campbell, C.E. and Steffner, E., Feasibilitystudies of low energy gamma-raytechniques for on-line determination of ashcontent of coal on conveyors, Int. J. Appl.Radiat. Isot. 34 (1983) 37-44.
5. Millen, M.J. and Sowerby, B.D., Correctionof Pair Production Gauge Assays forChanges in Coal Ash Composition, Int. J.Appl. Radiat. Isotopes, 36 (1985) 627-633.
6. Sowerby, B.D., Elemental Analysis byNeutron Inelastic Scattering Gamma Rayswith a Radioisotope Source, Nucl. Instrum.Methods 166 (1979) 571-579.
7. Diamantaras, K.I. and S.Y. Kung, PrincipalComponent Neural Networks: Theory andApplications, John Wiley & Sons, Inc.,New York, 1996.
8. Lorber, A., L.E. Wangen and B.R.Kowalski, A Theoretical Foundation forPLS Algorithm, J. Chemometrics, 1 (19),1987.
Table 2. Comparison of r.m.s. calibration andcross-validation errors for MLR, PLS andANN analysis of a selected 19:6 (calibration:cross-validation) split in the 25 bulk coalsamples data.
MethodSW/MLRSW/ANN
PLSPCA/ANN
Calibration0.540.460.500.42
Cross-Validation0.540.541.481.02
Schematic of First Prototype Gauge
-Sample
238Pu-Besource
(2xl07n/s)
75x75mmBGO detector
W shield
Figure 1. Schematic of backscatter geometryused to measure simulated coal samples.
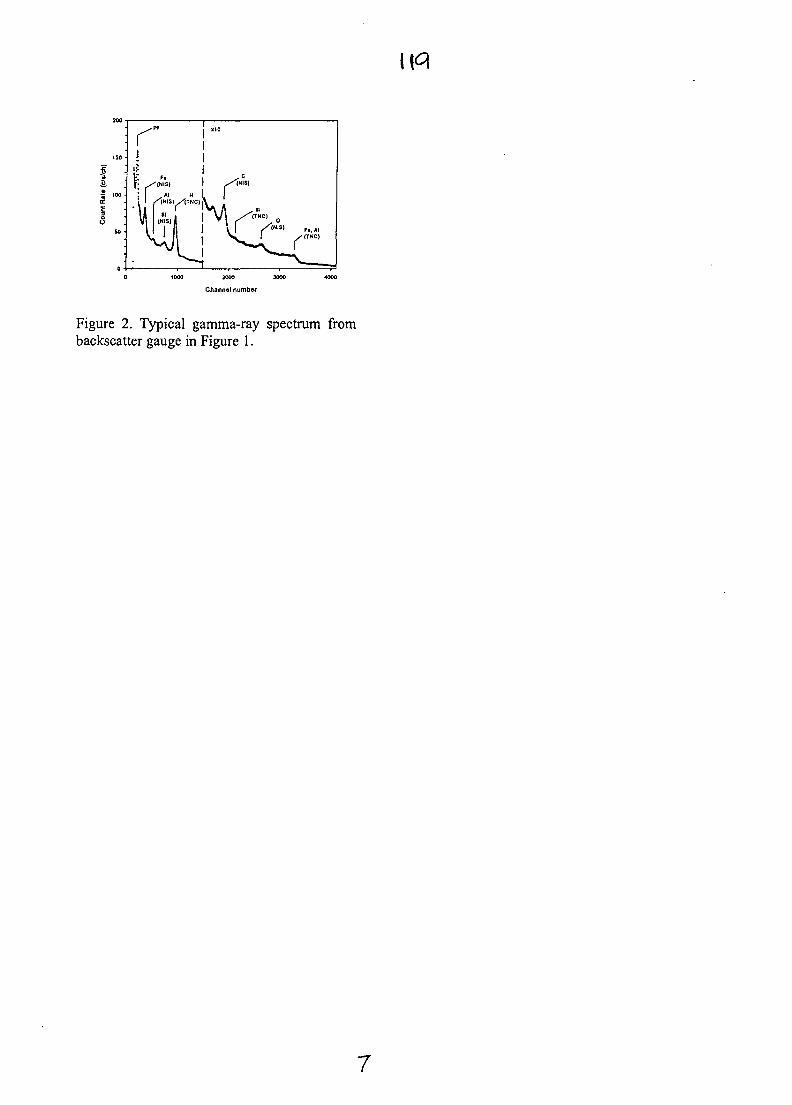
Figure 2. Typical gamma-ray spectrum frombackscatter gauge in Figure 1.
7
AU9817326
RADIOISOTOPE APPLICATIONS ONFLUIDIZED CATALYTIC CRACKING UNITS
J S CHARLTONTracerco Australasia, Lucas Heights Science & Technology Centre,
Lucas Heights, NSW 2234, Australasia
SUMMARY.
Radioisotope techniques utilizing both radioactive tracers and sealed sources of radiation are being usedincreasingly as diagnostic tools for process optimization and trouble-shooting on Fluidized CatalyticCracking Units in oil refineries. These studies are among the most challenging in the field of industrialradioisotope applications. Case studies are presented to illustrate the usefulness of the technology inobtaining information about the fluid dynamics, mass transfer properties and material distribution insidefull scale operating units. This information is difficult or impossible to obtain by any other means andis of great relevance to the refinery operator because of the economic importance of the units.Technological trends and potential developments are also discussed.
1. INTRODUCTION
The Fluid Catalytic Cracking Unit (FCC) isarguably the economic heart of an oil refineryand is used widely to upgrade relatively lowvalue heavy oils to gasoline and other lighthydrocarbons. The optimal performance of theFCC is vitally important to successful refineryoperations since relatively small improvementsin unit efficiency can lead to substantialincreases in revenue, resulting from increasedgasoline yield.
From an operational point of view, FCCs arenotoriously difficult. Even though thetechnology has been in use for many years andin spite of the fact that hundreds of units areinstalled world-wide, inefficiencies andmalfunctions are, nevertheless, commonlyencountered. This results directly from theinherent complexity of the process. Thereaction section of an FCC is a dynamic systemin which vaporised high-molecular weighthydrocarbon chains are fractured in thepresence of a solid catalyst, carried in a high-velocity flow of steam (1). The vapourresidence time in the reaction section of theunit is usually significantly less than 10seconds. Because of the arduous processconditions, the units are of heavy constructionand this, together with the abrasive properties
of the fast-moving catalyst makes it verydifficult to study mass transfer and fluiddynamics using invasive instrumentation.
The most effective way to obtain informationabout the operation of the FCC is to utilizeradioisotope technology. Radioisotope methodsare particularly suitable because of theirsensitivity, which allows flow patterns withinthe large-scale units to be traced successfully,and because of their unique ability toeffectively visualise the distribution of materialswithin the operating plant.
This was first recognised over 40 years agowhen radioactive tracers were used to studycatalyst flows inside fluid catalytic systems(2,3).
Since then, the technology has beencontinuously refined (4,5,6) so that, at thepresent time, radioisotopes are used extensivelyto trace catalyst, vapour and steam flows.
Radioisotopes as sealed sources of gamma-radiation have long been used to locate catalystlevels inside the process vessels and to measurecatalyst density distributions 7,8). Thesemethods, and variants of them are still in usetoday (6).
This paper presents a number of case studies asexamples of the many ways in whichradioisotope techniques are used to studyFCCUs and identifies developments in thetechnology which hold promise for the future.
2. RADIOACTIVE TRACER STUDIES
2.1 Principles
The movement and distribution of all of theprocess streams in the unit - catalyst, vapourand steam - can be traced individually usingradioisotope labelling. Radioactive material inan appropriate form is injected as a sharp pulseinto the process stream of interest. In this way,a representative portion of the flowing streamis "tagged" with radioactivity and itssubsequent movement through the unit can thenbe followed using radiation detectorsstrategically located on the vessels andpipework.
The volume of the injected material is small sothat the process is not perturbed. Additionally,because of the high detection sensitivity theactivities injected are relatively small so thatthere is no measurable hazard to plantpersonnel. Access to the unit need only berestricted for the duration of the injection sothat operations are not disrupted to anysignificant extent.
2.2 Methodology
2.2.1 Scope
Radioisotope technology has been appliedsuccessfully to study all parts of the FCC. Sowide has been the range of applications that acomprehensive survey is impossible in thespace allotted to this paper. Instead, attentionis focused on studies of the reactor/riser andstripper sections as being illustrative of therange of possible applications.
2.2.2 Radio tracers
The vaporised feed and steam flows are almostalways traced using one of the gaseousradioisotope 4IAr, g3Kr or 79Kr.
The catalyst is reliably traced by taking a
sample of catalyst from the unit and irradiatingit in a nuclear reactor to produce theradioisotopes 140La and/or 24Na. The attractionof this approach is that the catalyst is its owntracer and this facilitates detailed study of itsbehaviour in the FCC environment. Forexample, the dynamics of different particle sizefractions can be investigated.
An alternative to catalyst irradiation which maybe useful in certain applications is thetechnique of "in-situ labelling". This involvesthe injection into the catalyst stream of anaqueous solution of a radioactive salt (forexample 24Na2CO3). Once inside the unit, thereis a rapid evaporation of the water and the24Na+ ion attaches itself to the catalyst therebyproducing a pulse of labelled material.
2.2.3 Field Measurements: EquipmentArrangement
To follow the movement of the radiotracerthrough the FCC, sensitive radiation detectorsare positioned at appropriate locations on theunit. The precise deployment obviously variesfrom one application to another but a typicalarrangement for studies on the reactor, riser andstripper is shown in Figure 1.
Tracer is injected into the system using backingpressure from a nitrogen cylinder. Theresponse of the detectors to the passage of thetracer pulse is recorded as a function of time ona data-logging system.
The general principles of measurement may beillustrated with reference to a simple example.Suppose that it is desired to study themovement of catalyst up the riser. The radiolabelled catalyst is injected as a pulse at thebase of the riser (Figure 1). By studying theresponses and time-sequencing of detectors D r
D4 (Figure 2) the velocity of the catalystthrough different sections of the riser can bemeasured and from this information the catalystacceleration can be calculated.
By carrying out similar measurements using apulse injection of gaseous radiotracer it ispossible to measure the vapour velocity.Comparison of the results of the twomeasurements permits the vapour/catalyst slipvelocity to be calculated. This is an important
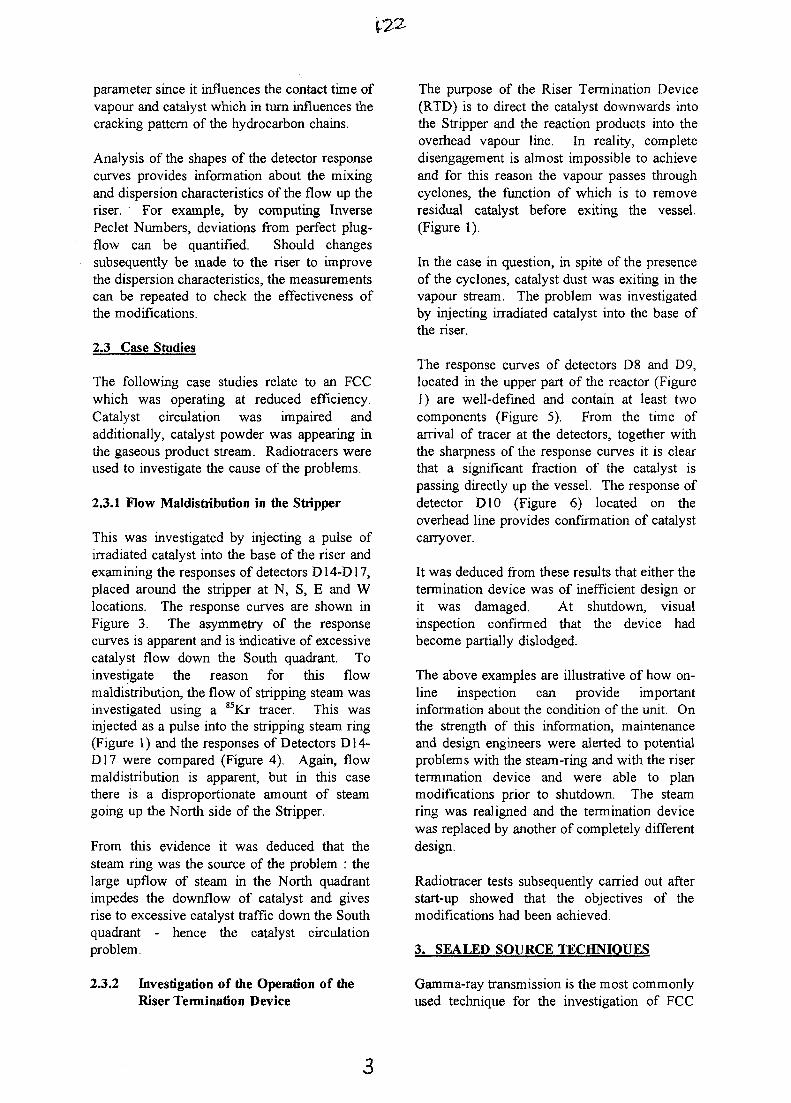
parameter since it influences the contact time ofvapour and catalyst which in turn influences thecracking pattern of the hydrocarbon chains.
Analysis of the shapes of the detector responsecurves provides information about the mixingand dispersion characteristics of the flow up theriser. For example, by computing InversePeclet Numbers, deviations from perfect plug-flow can be quantified. Should changessubsequently be made to the riser to improvethe dispersion characteristics, the measurementscan be repeated to check the effectiveness ofthe modifications.
2.3 Case Studies
The following case studies relate to an FCCwhich was operating at reduced efficiency.Catalyst circulation was impaired andadditionally, catalyst powder was appearing inthe gaseous product stream. Radiotracers wereused to investigate the cause of the problems.
2.3.1 Flow Maldistribution in the Stripper
This was investigated by injecting a pulse ofirradiated catalyst into the base of the riser andexamining the responses of detectors D14-D17,placed around the stripper at N, S, E and Wlocations. The response curves are shown inFigure 3. The asymmetry of the responsecurves is apparent and is indicative of excessivecatalyst flow down the South quadrant. Toinvestigate the reason for this flowmaldistribution, the flow of stripping steam wasinvestigated using a 8iKr tracer. This wasinjected as a pulse into the stripping steam ring(Figure 1) and the responses of Detectors D14-D17 were compared (Figure 4). Again, flowmaldistribution is apparent, but in this casethere is a disproportionate amount of steamgoing up the North side of the Stripper.
From this evidence it was deduced that thesteam ring was the source of the problem : thelarge upflow of steam in the North quadrantimpedes the downflow of catalyst and givesrise to excessive catalyst traffic down the Southquadrant - hence the catalyst circulationproblem.
2.3.2 Investigation of the Operation of theRiser Termination Device
The purpose of the Riser Termination Device(RTD) is to direct the catalyst downwards intothe Stripper and the reaction products into theoverhead vapour line. In reality, completedisengagement is almost impossible to achieveand for this reason the vapour passes throughcyclones, the function of which is to removeresidual catalyst before exiting the vessel.(Figure 1).
In the case in question, in spite of the presenceof the cyclones, catalyst dust was exiting in thevapour stream. The problem was investigatedby injecting irradiated catalyst into the base ofthe riser.
The response curves of detectors D8 and D9,located in the upper part of the reactor (Figure1) are well-defined and contain at least twocomponents (Figure 5). From the time ofarrival of tracer at the detectors, together withthe sharpness of the response curves it is clearthat a significant fraction of the catalyst ispassing directly up the vessel. The response ofdetector D10 (Figure 6) located on theoverhead line provides confirmation of catalystcarryover.
It was deduced from these results that either thetermination device was of inefficient design orit was damaged. At shutdown, visualinspection confirmed that the device hadbecome partially dislodged.
The above examples are illustrative of how on-line inspection can provide importantinformation about the condition of the unit. Onthe strength of this information, maintenanceand design engineers were alerted to potentialproblems with the steam-ring and with the risertermination device and were able to planmodifications prior to shutdown. The steamring was realigned and the termination devicewas replaced by another of completely differentdesign.
Radiotracer tests subsequently carried out afterstart-up showed that the objectives of themodifications had been achieved.
3. SEALED SOURCE TECHNIQUES
Gamma-ray transmission is the most commonlyused technique for the investigation of FCC
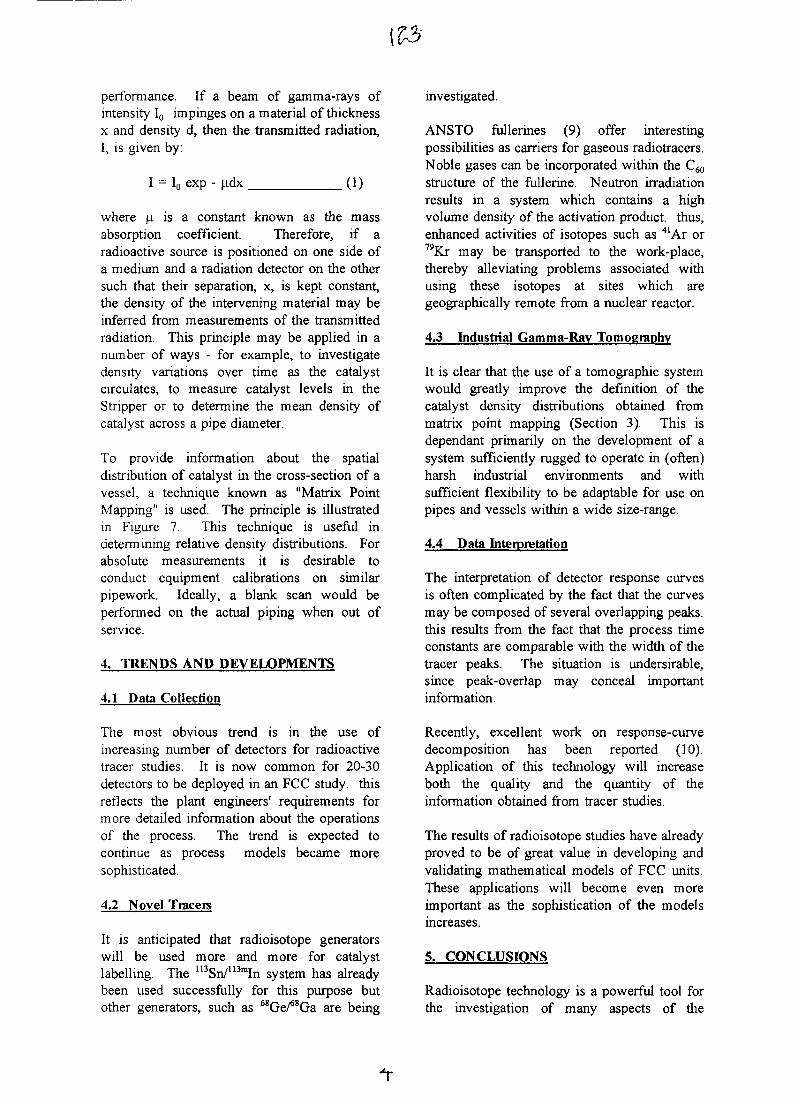
performance. If a beam of gamma-rays ofintensity Io impinges on a material of thicknessx and density d, then the transmitted radiation,I, is given by:
I = Io exp - udx (1)
where |i is a constant known as the massabsorption coefficient. Therefore, if aradioactive source is positioned on one side ofa medium and a radiation detector on the othersuch that their separation, x, is kept constant,the density of the intervening material may beinferred from measurements of the transmittedradiation. This principle may be applied in anumber of ways - for example, to investigatedensity variations over time as the catalystcirculates, to measure catalyst levels in theStripper or to determine the mean density ofcatalyst across a pipe diameter.
To provide information about the spatialdistribution of catalyst in the cross-section of avessel, a technique known as "Matrix PointMapping" is used. The principle is illustratedin Figure 7. This technique is useful indetermining relative density distributions. Forabsolute measurements it is desirable toconduct equipment calibrations on similarpipework. Ideally, a blank scan would beperformed on the actual piping when out ofservice.
4. TRENDS AND DEVELOPMENTS
4.1 Data Collection
The most obvious trend is in the use ofincreasing number of detectors for radioactivetracer studies. It is now common for 20-30detectors to be deployed in an FCC study, thisreflects the plant engineers' requirements formore detailed information about the operationsof the process. The trend is expected tocontinue as process models became moresophisticated.
4.2 Novel Tracers
It is anticipated that radioisotope generatorswill be used more and more for catalystlabelling. The mSn/u3mIn system has alreadybeen used successfully for this purpose butother generators, such as 68Ge/68Ga are being
investigated.
ANSTO fullerines (9) offer interestingpossibilities as carriers for gaseous radiotracers.Noble gases can be incorporated within the C60
structure of the fullerine. Neutron irradiationresults in a system which contains a highvolume density of the activation product, thus,enhanced activities of isotopes such as 41Ar or79Kr may be transported to the work-place,thereby alleviating problems associated withusing these isotopes at sites which aregeographically remote from a nuclear reactor.
4.3 Industrial Gamma-Ray Tomography
It is clear that the use of a tomographic systemwould greatly improve the definition of thecatalyst density distributions obtained frommatrix point mapping (Section 3). This isdependant primarily on the development of asystem sufficiently rugged to operate in (often)harsh industrial environments and withsufficient flexibility to be adaptable for use onpipes and vessels within a wide size-range.
4.4 Data Interpretation
The interpretation of detector response curvesis often complicated by the fact that the curvesmay be composed of several overlapping peaks,this results from the fact that the process timeconstants are comparable with the width of thetracer peaks. The situation is undersirable,since peak-overlap may conceal importantinformation.
Recently, excellent work on response-curvedecomposition has been reported (10).Application of this technology will increaseboth the quality and the quantity of theinformation obtained from tracer studies.
The results of radioisotope studies have alreadyproved to be of great value in developing andvalidating mathematical models of FCC units.These applications will become even moreimportant as the sophistication of the modelsincreases.
5. CONCLUSIONS
Radioisotope technology is a powerful tool forthe investigation of many aspects of the
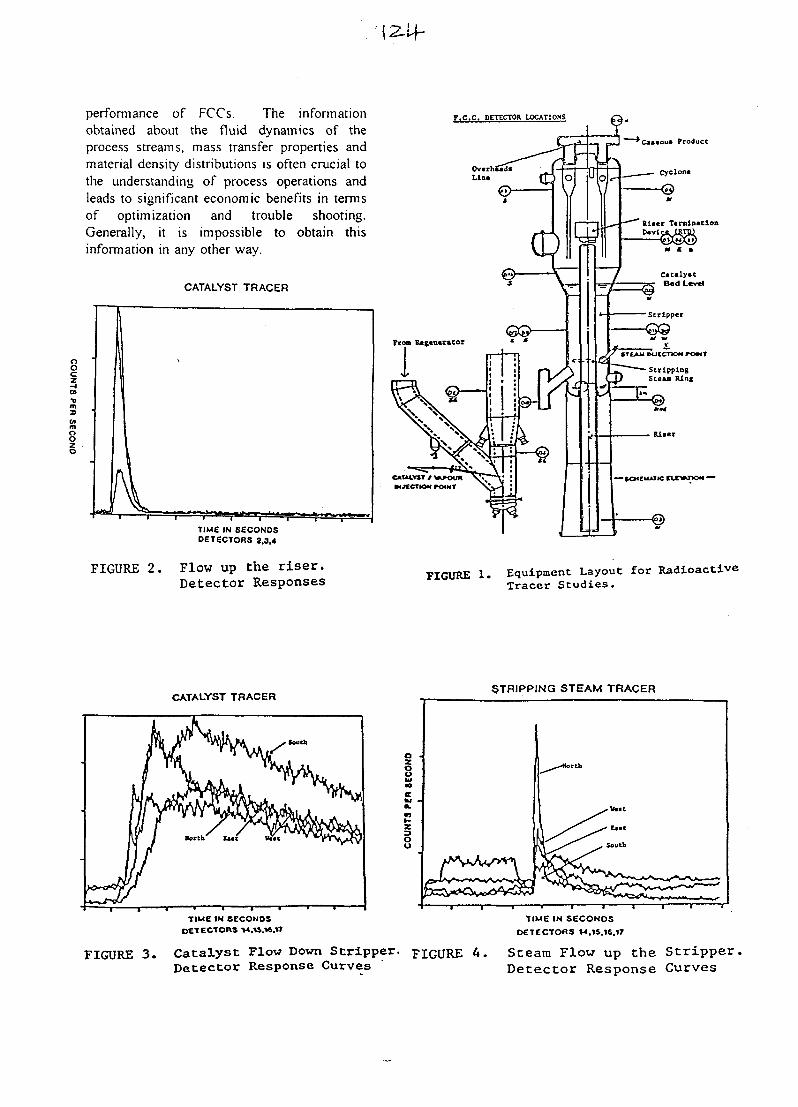
•I2-M-
performance of FCCs. The informationobtained about the fluid dynamics of theprocess streams, mass transfer properties andmaterial density distributions is often crucial tothe understanding of process operations andleads to significant economic benefits in termsof optimization and trouble shooting.Generally, it is impossible to obtain thisinformation in any other way.
CATALYST TRACER
P . C . C . DETECTOR LOCATIONS
O
oz- ICD•em3
OOzo
Rl«er TerminationD«vlc
TIME IN SECONDSDETECTORS 2,3,4
FIGURE 2 . Flow up the riser.Detector Responses
FIGURE 1. Equipment Layout for RadioactiveTracer Studies.
CATALYST TRACERSTRIPPING STEAM TRACER
- j 1 1 1 r-TIME IN SECONDS
DETECTORS V«.1S.»e.t7TIME IN SECONDS
OETECTOfiS M.15.16.17
FIGURE 3 . Catalyst Flow Down Stripper. FIGURE 4 . Steam Flow up the S t r i p p e ryDetector Response Curves
pDetector Response Curves
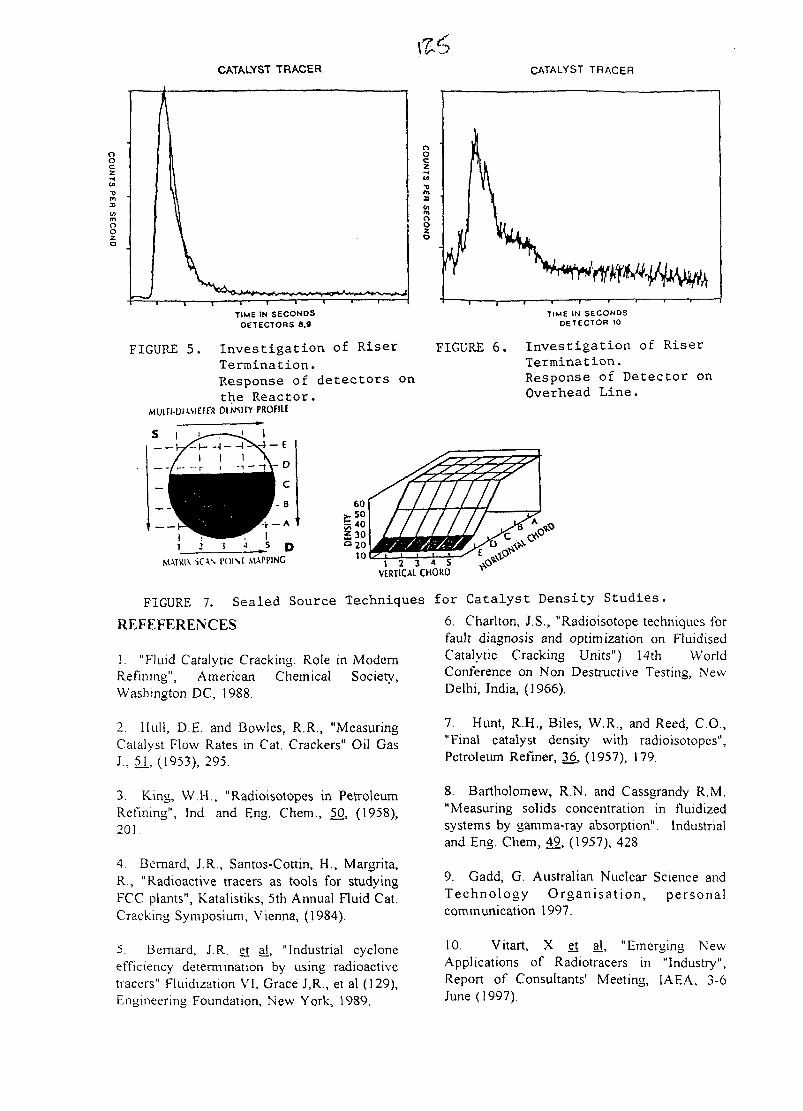
CATALYST TRACER CATALYST TRACER
ooc2
Oo
oOcz
•ofn
a
FIGURE 5.
TIME IN SECONDSOETECTORS 8.9
Investigation of RiserTermination.Response of detectors onthe Reac to r .
PROHIE
TIME IN SECONOSDETECTOR 10
FIGURE 6 Investigation of RiserTermination.Response of Detector onOverhead Line.
MAIRIXSCVS I'OISt MAPPING V 2 3 4 SVERTICAL CHORD
FIGURE 7. Sealed Source Techniques for Catalyst Density Studies.
REFEFERENCES
1. "Fluid Catalytic Cracking: Role in ModernRefining", AmericanWashington DC, 1988.
Chemical Society,
2. Hull, D.E. and Bowles, R.R., "MeasuringCatalyst Flow Rates in Cat. Crackers" Oil GasJ., 51, (1953), 295.
3. King, W.H., "Radioisotopes in PetroleumRefining", Ind and Eng. Chem., 50, (1958),201.
4. Bernard, J.R., Santos-Cortin, H., Margrita,R., "Radioactive tracers as tools for studyingFCC plants", Katalistiks, 5th Annual Fluid Cat.Cracking Symposium, Vienna, (1984).
5. Bernard, JR. et a[, "Industrial cycloneefficiency determination by using radioactivetracers" Fluidization VI. Grace J,R., et al (129),Engineering Foundation, New York, 1989.
6. Charlton, J.S., "Radioisotope techniques forfault diagnosis and optimization on FluidisedCatalytic Cracking Units") 14th WorldConference on Non Destructive Testing, NewDelhi, India, (1966).
7. Hunt, R.H., Biles, W.R., and Reed, CO.,"Final catalyst density with radioisotopes",Petroleum Refiner, 36, (1957), 179.
8. Bartholomew, R.N. and Cassgrandy R.M."Measuring solids concentration in fluidizedsystems by gamma-ray absorption". Industrialand Eng. Chem, 49, (1957), 428
9. Gadd, G. Australian Nuclear Science andTechnology Organisat ion, personalcommunication 1997.
10. Vitart, X et al, "Emerging NewApplications of Radiotracers in "Industry",Report of Consultants' Meeting, IAEA, 3-6June (1997).
AU9817327
Australian Manufacture of Quadramet™(Samarium-153 EDTMP)
N R WOOD and J WHITWELLAustralian Radioisotopes, ANSTO
PMB 1, Menai, New South Wales 2234, Australia
SUMMARY. Quadramet™ (Samarium-153 EDTMP) has been shown overseas to be useful in thepalliative treatment of painful osteoblastic skeletal metastases and is now being manufactured under(licence from Dow Chemical) in Australia. Due to neutron flux limitations of the ANSTO nuclearreactor, HIFAR, the Australian formulation contains up to 200ug of Samarium per mL whereas theinternational version contains 20-46ug per mL. A dedicated facility hes been constructed at thelaboratories of Australian Radioisotopes to manufacture this material and a small clinical trial was heldto verify that the pharmacokinetic behaviour of the local material does not differ from the internationalversion. The results of the trial were used to support an application for general marketing ofQuadramet™ in Australia.
1. INTRODUCTION
In Australia, at least 500 people each yeardevelop painful metastases in the skeleton froma variety of primary tumours, most notably ofthe prostate, breast or lung which cannot betreated or have ceased to respond to treatmentusing drugs or external radiotherapy. The useof opiates in such cases is common but oftenresults in relatively poor quality of life.
Several therapeutic bone-seekingradiopharmaceuticals have been advanced aspalliative agents in these cases and a summaryis presented in Table 1.
Table 1 Radionuclides/CompoundsDeveloped
Agent
Sr-89Sm-153 EDTMP
Re-186HEDP
Sn-117mDTPA
P-32
to Palliate Painful BonyMetastases
T*i
50.5d46.3h
89.3h
13.6d
14.3d
P(keV)1400640-8101070
127152(ce)
1710
T(keV)none103
(28%)137
/no/\(9/o)159
(86%)none
The agent produced by complexing Samarium-153 with ethylene diamine tetramethylenephosphonate (EDTMP) is particularly ofinterest for several reasons. It is known to berapidly absorbed or excreted and to be rapid inaction. Due to the radiation emitted bySamarium-153, doses can be easily measured ina nuclear medicine department and patientuptake distribution can always be confirmed bywhole body scanning. Retreatment is alsopossible within a relatively short time.
2. DEVELOPMENT HISTORY
This material was developed by Dr W.Goeckeler in 1984 and widely patented by DowChemical subsequently. The first humanpatients were treated in 1987 and all majorclinical work in the US and Europe completedin 1995. The US FDA approved generalmarketing of Quadramet™ in the US in March1997.
Australian Radioisotopes began negotiations tomanufacture Quadramet™ in 1989. AnAustralian product would, due to HIFARneutron flux limitations, contain increasedlevels of Samarium element. In 1995 Dowrequested that some evidence be producedshowing bioequivalence between theinternational and Australian product and a
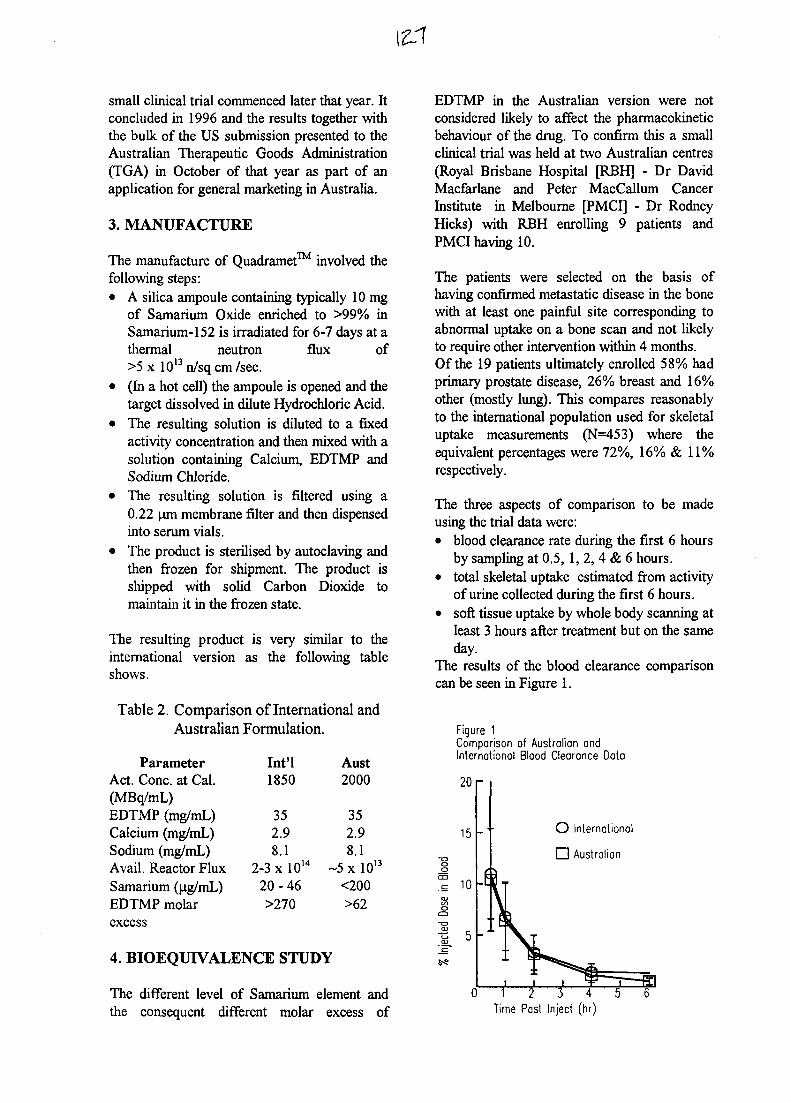
tzrr
small clinical trial commenced later that year. Itconcluded in 1996 and the results together withthe bulk of the US submission presented to theAustralian Therapeutic Goods Administration(TGA) in October of that year as part of anapplication for general marketing in Australia.
3. MANUFACTURE
The manufacture of Quadramet™ involved thefollowing steps:• A silica ampoule containing typically 10 mg
of Samarium Oxide enriched to >99% inSamarium-152 is irradiated for 6-7 days at athermal neutron flux of>5 x l0 l3n/sqcm/sec.
• (In a hot cell) the ampoule is opened and thetarget dissolved in dilute Hydrochloric Acid.
• The resulting solution is diluted to a fixedactivity concentration and then mixed with asolution containing Calcium, EDTMP andSodium Chloride.
• The resulting solution is filtered using a0.22 urn membrane filter and then dispensedinto serum vials.
• The product is sterilised by autoclaving andthen frozen for shipment. The product isshipped with solid Carbon Dioxide tomaintain it in the frozen state.
The resulting product is very similar to theinternational version as the following tableshows.
Table 2. Comparison of International andAustralian Formulation.
ParameterAct. Cone, at Cal.(MBq/mL)EDTMP (mg/mL)Calcium (mg/mL)Sodium (mg/mL)Avail. Reactor FluxSamarium (jag/mL)EDTMP molar
Int'l1850
352.98.1
2-3 x 10¹⁴
20-46>270
Aust2000
352.98.1
- 5 x 1 0<200>62
13
excess
4. BIOEQUIVALENCE STUDY
The different level of Samarium element andthe consequent different molar excess of
EDTMP in the Australian version were notconsidered likely to affect the pharmacokineticbehaviour of the drug. To confirm this a smallclinical trial was held at two Australian centres(Royal Brisbane Hospital [RBH] - Dr DavidMacfarlane and Peter MacCallum CancerInstitute in Melbourne [PMCI] - Dr RodneyHicks) with RBH enrolling 9 patients andPMCI having 10.
The patients were selected on the basis ofhaving confirmed metastatic disease in the bonewith at least one painful site corresponding toabnormal uptake on a bone scan and not likelyto require other intervention within 4 months.Of the 19 patients ultimately enrolled 58% hadprimary prostate disease, 26% breast and 16%other (mostly lung). This compares reasonablyto the international population used for skeletaluptake measurements (N=453) where theequivalent percentages were 72%, 16% & 11%respectively.
The three aspects of comparison to be madeusing the trial data were:• blood clearance rate during the first 6 hours
by sampling at 0.5, 1, 2, 4 & 6 hours.• total skeletal uptake estimated from activity
of urine collected during the first 6 hours.• soft tissue uptake by whole body scanning at
least 3 hours after treatment but on the sameday.
The results of the blood clearance comparisoncan be seen in Figure 1.
Figure 1Comparison of Australian ondInternational Blood Clearonce Data
20 r
O International
Australian
CO
O
3 5 -
0 1 2 3 4 5"
Time Post Inject (hr)
The skeletal uptake for the 19 patients at 6hours was found to be 62.7 ± 20.2 % which isnot significantly different from the internationalresult at 24 hours of 65.5 ± 15.5%.
No soft tissue uptake was observed and theQuadramet™ scans were essentially identical tothe Technetium-99m MDP scans in all cases.
The trial results support the assertion that thepharmacokinetic behaviour of the Australianformulation is the same as that of theinternational version.
5. CONCLUSION
Quadramet™ is one of a new class of palliativetreatments for painful skeletal metastases withthe advantage that it considered effective in thepalliation of pain from metastases from avariety of primary tumours. The limitationsimposed by the flux of the Australian reactorHIFAR still permit the manufacture of aproduct equivalent in pharmacokineticbehaviour to the international version. Thisfact, coupled with the installation at thelaboratories of Australian Radioisotopes offacilities dedicated to the manufacture of thisproduct now enables Australians and people inthe near geographic region to have reliableaccess to Quadramet™.
AU9817328
MLCROSPHERES LABELLED WITH SHORT-LIVING ISOTOPES: DEVELOPMENTAND APPLICATION FOR TUMORS TREATMENT (EXPERIMENTAL STUDY).
BY. DROZDOVSKY, R.A ROSffiV, AY. GONCHAROVA, V.G. SKVORTSOV,V.M. PETRIEV, AN. GRIGORffiV,N.G. SCfflSCHKANOV
Medical Radiological Research Center RAMS, Korolev Str.4, Obninsk, Kaluga region,249020, Russia
SUMMARY. Analysis of the conducted studies strongly suggests the possibility of usage ofthe domestic protein microspheres as a vehicle for radionuclide.
Good treatment results were obtained in case of the experimentally induced rheumatoidarthritis in rats after intraarticular loading of 165Dy-hMSA. Mathematical calculations show thathomogeneous distribution of RPP in human articulation cavity with the square of 100 cm2 can beachieved when the quantity of administered particles exceeds 3000. Analysis of dosimetric data incase of intratumoral loading of 165Dy-hMSA also point out the necessity of the absorbed dosecalculation methods taking into account the distance from the source and possible heterogeneity ofRPP distribution inside the tumor to be employed The prolonged RPP detention in the target causingno essential morphological and functional changes was achieved by embolization on the level ofseptal and interlobular arteries and of efferent arterioles in the animal's renal.
1. INTRODUCTION
Usage of microspheres as a carrier ofcurative radionuclides is expedient whenisotopes possessing no ability for theselective accumulation in damaged focusesare being administrated. The specificity ofeffect of microsphere bound radionuclidesis achieved by respective loading methodsand particle size enabling to hold them on intarget organ for a long time. For example, incase of the intraarticular injection of colloidsolutions of 198Au, 186Re, "V, I53Sm, 168Ersized 0.04 - 0.4 mem in spite of good localeffect the authors observed up to 20 % andmore isotope leakage from articular cavity(1-3,7). Under this circumstances theabsorbed dose for unguinal lymph nodesvaried from 50 to 150 Gy, for liver from 0.4to 45 Gy (2,4-6,23). Advantage of using ofradionuclides bound to microspheres hasbeen demonstrated for a number ofoncological diseases whenradiopharmaceutical preparation (RPP) wasadministered intratumorally and selectivelyintraarterially (9-15, 20). Mostdemonstrative are the results of radionuclidecorpuscular therapy of inoperable livertumors when patients' mean survivalduration was 24 months and more (11,15,16, 22). It should be noted that most of
authors applied microspheres sized 15-40mem (15,16, 19, 21) whereas N. Ackermanpoints out that arteriovenous bypasses indog liver average 50 mem (17).
TWT Leung et al. have revealed thedevelopment of the radiation inducedpneumonitis in 5 of 80 patients withinoperable liver tumors after the selectiveintraarterial administration of '"Y -microspheres (18). Average accumulationof RPP in lungs was 6 % and radiationinduced pneumonitis were observed whenthe mean leakage of radioactivemicrospheres into lungs exceeded 13%. Wehaven't seen valid substantiation of themicrospheres' size administered, hi generalthe size varied broadly being within 15 -3000 mem range. Large variation also existsin total radioactivity burden, the absorbeddose during the course of treatment forvarious tumors has been estimated to befrom 60 to 100 Gy.
We haven't met publications focusingon the quantity of microspheresadministered.
The aim of our investigation was todefine the optimal size of loadingmicrospheres under different ways ofadministrations and studying thepeculiarities of the absorbed dose formingas a function of the microsphere quantity
and radionuclides'characteristics.
nuclear-physical
2. MATERIALS AND METHODS
Materials.The work was carried out on 180
Shinshilla rabbits both males and femalesweighting 1.5 - 2.0 kg and 230 whitenonlinear female rats weighting 150 - 200 g.
Microspheres of human serumalbumin (hMSA) produced in MRRC wereused as a radionuclide carrier. We applied0.5 - 9.0 mg of 5-10, 10-15, 15-30, 45-60,75-100 mem sized hMSA. The radioactivelabel was a 125I-hMSA radiopreparation withthe specific activity of 0.15-0.2 MBq per 1mg of albumin. I65Dy - MSA was used as acurative radiopreparation with 10, 30, 50MBq and more activity. 165Dy has 140minlong half-life, mean p-emitting energy of445 keV and y-rays of 94.7 keV allowing tovisualize RPP distribution.
Roentgenoangiographical investigationswere performed on the apparatus TUR-60.For radiometry "in vivo" and "in vitro" thedetectors from "Gamma" radioisotopelaboratory were used.
Intravenous anesthesia inexperimental animals was induced byinjection of 3 % solution of gexenal orsodium thiopental, 17 mg/kg for rabbits and45 mg/kg for rats. Animals were sacrificedby excessive overdosing of drugs.
Methods.The neutron-activation method of
radionuclide bound microsphere based onthe inclusion of stable isotope into albuminparticles and consequent irradiation of themwith neutrons. It allows to obtain RPP withhigh specific activity, certain size ofmicrospheres and makes it possible to use anumber of short-living isotopes fortreatment of oncological and heavy somaticdiseases.
Catheterization of rabbits' renal arteryfor the selective administration of RPP wasconducted according to the standard methodby intrafemoral access. For liver arterycatheterization the opening of abdomencavity and introduction of the catheter topinto the coeliac trunk was performed undervisual control and to prevent the RPPleakage into left ventricular and spleenarteries the latter ones were ligated.
The selective loading of RPP into theliver artery of rats was carried out with finecatheter via gastro-duodenum fixed byligation. After the injection the artery wassutured.
50 % colloid of barium sulfete in 2 %gelatin solution was used as a contrast. Thecontrast substance temperature wasmaintained about 40°C in waterbath.
The intraarticular administration ofRPP was carried out by punctioning of thearticular above the patella. The experimentalmodel of rheumatoid arthritis was inducedby intraarticular administration of 1.5%zimozan suspension.
Brown-Pears epithelioma was used asan experimental liver tumor in rabbits. Theprimary tumor tissue was minced, teasedtrough a nylon mesh and transferred intorecipient's liver. In rats we used M-lsarcoma cells injected into the liver.
To induce hepatoma in rats acarcinogenic N-nitrozodiethylamin wasadministered per os in the amount of 100meg/kg of bodyweight during 3 monthsaccording to the method described earlier(24). M-l cells injected into footpad servedas a model of intratissue tumor.
Morphological investigations wereconducted by means of light microscopy ofhematoxylin-eosin stained samples.Densitometrical studies were carried out ondigital decoder UAR-2.
Statistical processing of data obtainedwas accomplished using standard Student'stest.
3. RESULTS
Intraarticular administrationIntraarticular loading of hMSA
labeled with I25I (5 - 10 mem size) into ratknee cavity and consequent radiometryduring 10 days demonstrated thatmicrospheres were completely detained inthe articular. In case of the colloid solution198 Au administration 96 % of RPP loadedquantity stayed in the cavity, 1.4 %accumulated in unguinal lymph nodes and2.6 % in liver.
Rats with the induced rheumatoidarthritis were divided into four groups: firstone comprised the control animals, and threeother groups were subjected to 10, 30 and 50
MBq of the 163Dy-hMSA administrationrespectively.
Results of the treatment wereassessed roentgeno-angiographically,pathomorphologically anddensitometrically.
Successful results were obtained afteradministration of 30 and 50 MBq of 163Dy-hMSA, mean absorbed dose was 130 and220 Gy respectively.
X-ray imaging of rats' articulationsshowed the picture close to normal by 14thday, oedema of articulation soft tissues wasdiminishing and the size of articulationfissure was restored. Along with that weobserved morphological changes inperiosteum and osteo-cartilage areas ofarticulation, their density was 18-20 % lessthan normal in case of administration of 50MBq. Perhaps it is due to small dimensionsof rat articulation and thus the tissues werewithin the area of effective radiationinfluence of 163Dy.
In order to effectively utilize RPP inclinical practice and to create an optimalabsorbed dose in the site of lesion withminimal irradiation of surrounding normaltissues we were interested to study nuclear-physical characteristics of 163Dy, define thenumber of microspheres providingrelatively homogeneous distribution ofparticles within the volume as well as theabsorbed dose for articulation cavity inman.
To obtain quantitative characteristicsof radiation effect of RPP the dosecharacteristics of 165Dy point source intissue-equivalent media were calculated.Data about track-energy dependence forelectrons in tissue and radionuclide P-emission spectrum were used for theestimation. The surrounding volume wassplit into 0.1 lmm thick spherical layers andthe energy loss and absorbed dose werecalculated for each layer),
Study of the emitted P-particlesenergy distribution along the distance fromthe source showed that 50 % of energyspreads for 1.15 mm and up to 90 % for 3.1mm depth.
Comparing the values of the absorbeddose at a certain distance with the meanabsorbed dose in spherical volume with thediameter equal to the distance from point163Dy source (specific activity lBq) one can
see a significant difference between them,particularly at the end of electron track (upto 4 orders of magnitude) (Fig. 1).
Thus accepted in clinical practiceway of calculation of mean absorbed dosedoes not yield correct data about the doseabsorbed by the target cells localizing at thedifferent distance from the source.
The absorbed dose inside the tissueequals to that obtained from a plane sourceat the distance of 1-5 mm the source ofradiation.
Using these results the doses fromintraarticularly administered RPP werecalculated.
Calculation of the dose absorbed froma plane source demonstrates that afterloading of 18500 MBq of 163Dy-hMSA theabsorbed dose at 2 mm depth (tentativeboundary of damaged synovial membrane)will score 70 Gy and one order of magnitudeless at 4 mm.
These calculations are correct ifmicrospheres are in close proximity to eachother along the surface (the plane sourcemodel). For discrete hMSA distribution overthe articular cavity surface the minimalquantity of microspheres required for therelatively homogeneous absorbed dosedistribution was calculated. Result ofmathematical analysis demonstrated that thenumber of 1S5Dy microspheres should be notless than 3000 per articulation surface areaof 100 cm2.
Intratumoral loading of165Dy- MCA.On the 20th day after the transfer of
M-l sarcoma cells into rats' footpad whenthe tumor volume reached 0.5 cm3 theanimals were given 5.2mCi of 163Dy-hMSAresuspended in 0.3 ml 0.9% NaCl.
As one can see in Fig 2. thesignificant delay of tumor growth wasobserved comparing to the control group.
It should be also noted that after thetumor growth resumption the increasing rate(0,022 Lg V/day) was substantially lower(0,045 Lg V/day) than in the group receivedfractionated distant radiotherapy (3 fractionsof 10 Gy each) and in the control group(0,048 Lg V/day). We did not observeradiation-induced epidermitis and oedema ofthe surrounding normal tissues after RPPadministration. Calculation of meanabsorbed dose inside 0.5 cm3 tumor afterloading of 5.2mCi of 163Dy-hMSAdemonstrates that it was averagely 330 Gy.At the same time the absorbed dose at thetumor periphery, especially around thefrontier (1mm) was 10 times less, about 33Gy what possibly reflects the irregularity ofthe particles' distribution inside the tumor.Apparently this might explain theincomplete positive effect of treatment.Work aimed to optimize the conditions ofintratumoral administration of RPP areunderway.
Selective intraarterial administrationof125l-hMSA.
hi series of the selective intraarterialadministration of U5I-hMSA in renal arteryof rabbits best results were obtained whenparticle size was 15-30 mem. The prolongeddetention of microspheres in renal efferentarterioles was achieved (92 % of theadministered quantity on 10th day, 79 % onthe 20th day) and 123I-hMSA concentration inliver and lung did not exceed 1 %, in thyroidgland - 2.7 % (Fig 3).
HMSA of this size caused transientminor morphological changes in renal tissue.The selective loading of microspheres inlobule renal artery and surgical removal ofanother one was endured well by animalswith no essential difference in behavior incomparison with control rabbits during theobservation period of 6 months. On the other
hand the administration of largermicrospheres (40-75 and 75-100 mem) ledto the occurrence of extensive necrotic areasand the particles were localized to the levelof lobule and segmental arteries.
After intraarterial loading of I23I-hMSA in rabbit liver artery best results wereobtained when the size of microspheres was45-60 mem what corresponds the diametersof rabbit interlobular and septal arteries (Fig.4).
45-60 mem hMSA depositionsclearance rate from liver tissue was twotimes lower then in case of 15-30 memhMSA and quantitatively was as following:first day - 96 %; fifth day - 79 %; tenth day- 50 % and to twentieth day - 16% ofadministered quantity. Accumulation of RPPin lungs did not exceed 2 % on twentiethday, in thyroid gland it was up to 5%.Roentgenangiographycal imaging performedone day after the microspheres loadingrevealed the pronounced parenchymatousphase suggestive of the "opening" of themajority of capillaries not functioningbefore. On the 20th day thehepatoangiogramms were nearly normalalthough the leak of contrast substance intoportal vessels of liver took place.Morphological changes in liver tissue weretemporary, we noted dilation of sinuses andvenous bloodfilling of lobules which had atendency to normalize by 20th day.
The distribution of microspheres intumor and normal tissue of animal's liverwas studied. Mean accumulation of 45-60mem hMSA was averagely 3.9 times higherin case of Brown-Pears tumor transfer intorabbits' liver tissue. 15-30 mem hMSAaccumulation was 6.3 times more intensivein induced rat hepatoma than in normal livertissue.
To our opinion in order to createoptimal absorbed dose within the tumor andminimize the lesions of surrounding tissuesit is necessary to calculate the quantity ofparticles providing relatively homogeneous
distribution of RPP in normal tissue and itsspecific activity depending on the isotopebeing used. First of all, the number ofvessels with the diameter corresponding tomicrosphere size was defined. After the datawere entered into the computer programmodeling the arterial stream of organsstructure (25) we found that there wereaveragely 10,000 vessels with the diameterof 45-60 mem in rabbit liver. Theadministration of 5000 to 30000 particlesprovided relatively homogenous distributionof RPP in liver. To compute the optimalabsorbed dose we suggest to consider anorgan as a sphere inside of which a greatnumber of small spheres with the radiuscorresponding to energy characteristics ofradionuclide are distributed homogeneouslyall over the volume. Provided the organ andtumor volume are known this approachallows to reasonably accurately determinethe required quantity of microspheres andthe specific activity of RPP to beadministered in order to create the desiredabsorbed dose in e.g. hepatoma andsurrounding healthy tissues.
4. DISCUSSION
Analysis of the conducted studiesstrongly suggests the possibility of usage ofthe domestic protein microspheres as avehicle for radionuclide. The neutron-activating method of RPP productionenables to utilize a broad spectrum of short-living isotopes that can be delivered into thetarget organ and anchored there for a longtime.
Depending on the way of the hMSAadministration and characteristics of theorgan a number of important points shouldtaken into consideration to provide aneffective radionuclide therapy. Goodtreatment results were obtained in case ofthe experimentally induced rheumatoidarthritis in rats after intraarticular loading of165Dy-hMSA. Unlike the colloid solutions of169Er, mAu, "6Re, " Y usage when theirleakage from articular cavity reaches 20 %and more the microspheres are almostcompletely detended in the damagedarticulation.
Mathematical calculations show thathomogeneous distribution of RPP in humanarticulation cavity with the square of 100
cm2 can be achieved when the quantity ofadministered particles exceeds 3000. Thecomputation of the absorbed dose isexpediently to conduct as a function of thedose within the distance equivalent to thethickness of damaged synovial membrane.
On the example of 165Dy-hMSAenergy characteristic distribution wedemonstrated that the absorbed dose fordamaged cells at 2mm distance from theradioactive source is 7 times less than theone for a sphere of 2mm diameter. Thusaccepted in clinical practice way of theestimation of mean absorbed dose inspherical volume does not yield true dataabout real dose received by target organcells locating to different distances from thesource.
For the physician creation of optimalabsorbed dose on the boundary of damagedarea is a problem of great importance. It iseven admittable to overirradiate some of thetarget organ cells situating close enough tothe radioactive source. Analysis ofdosimetric data in case of intratumoralloading of M3Dy-hMSA also point out thenecessity of the absorbed dose calculationmethods taking into account the distancefrom the source and possible heterogeneityof RPP distribution inside the tumor to beemployed. When 0.5cm3 tumor was treatedwith mean absorbed dose of 330 Gy and thedistance between particles and the tumoredge reached lmm the absorbed dose fordistal cells was ten time less, 33Gy. Thesefeatures of the absorbed dose forming aremore or less typical for any radionuclide.Therefore the energy characteristics of p-emitters applied should be taken intoconsideration and the respective correctionsshould be made to neatly estimate theamount of therapeutic radioactivity to beadministered.
In case of selective intraarterialadministration of microspheres thesubstantiation of hMSA size and quantity isof high importance besides of thepeculiarities mentioned. The prolonged RPPdetention in the target causing no essentialmorphological and functional changes wasachieved by embolization on the level ofseptal and interlobular arteries and ofefferent arterioles in the animal's renal. Inman the analogous vessels have the diameterapproximately 80-100 mem and 40-50 mem
respectively. The uniformity of microspheredistribution in the organ and the theiraccumulation in tumors depends on thenumber of particles being administered. Inour earlier investigations we noted that incase of the insufficient or excessive loadingof microspheres we could not reach theprominent accumulation of RPP in the tumortissue. Apparently in the first case there wasinsufficient accumulation of particles intumor vessels and in the second one after the"saturation" had been achieved themicrospheres continued to penetrate intonormal liver tissue of animals.
Mathematical model of organ arteriallake structure supposes there is thedependence between the diameters ofprimary vessel and its lower branches. Onemay assume that organ artery of certaindiameter supplies a corresponding volume oftissue with blood. According to ourmathematical calculations after themeasurement of rabbit liver artery diameterthe number of septal and interlobular arterieswas found to be approximately 10000.Experimental results of the third/fourthdegree vessel branches number and theirdiameter determination performed under
light microscope were identical to thoseobtained by means of calculations.
The introduction of 5000 to 30000microspheres led to their relativelyhomogeneous distribution in liver. Choice ofoptimal microsphere number in anyparticular case depends on the energycharacteristics of radionuclide used. In otherwords, each microsphere bound withradionuclide may be considered as a smallsphere with a radius equivalent to effectiveelectron track length of RPP. The organ maybe presented as a large sphere inside ofwhich smaller spheres are distributed. Whenthe number of particles providinghomogenous distribution inside the organ isknown it becomes possible to compute thespecific activity of RPP in order to set up thedesired absorbed dose in tumor.
Investigations carried out suggest theefficacy of radionuclide therapy applicationfor treatment of oncological and heavysomatic diseases. They also indicate thenecessity of further investigations aimed tooptimize the usage of microspheres as aradionuclide carrier usage and to detailywork out the criteria of dosimetric planning.
5. REFERENCES
1. Chappele A., Oka M., Rekonen A. et. al. Chromosome damage after intra-articular injection ofradioactive yttrium. Ann. Rheum. Dis.,1972. v.32, p.5082. Topp J.R., Cross E.G., Fain A.G. Treatment of persistent knee joint effusions with intra-articular radioactive gold. Can, Med. Assoc.. 1975, v.12, p.1085-10893. Mences C.J., Go A.L., Verrier P. et. al. Double-bind study of erbium-169 injection(synoviortresis) in rheumatoid digital joints. Ann. Rheum, Pis.. 1977, v.36, p.254-2564. Deckart H., Tamaschke J., Ertl. S. et. al. Radiosinovectomy of the knee joint 198Au-colloid,ferric hydrate colloid and l86Re-sulfige colloid. Radiobiol. Radiother,. 1979, v.3, p. 3635. Onetty CM., Gutierrez E., Heba E. et. al. Synoviorthesis with 3ZP-colloidal chromic phosphatein rheumatoid arthritis, J. Rheumatol.. 1982,v.9,p.229-238.6. Wang S.J., Lin W.Y., Hsieh B.T. et. al. Rhenium-188 sulphur colloid as a radiationsynovectomy agent. Eur. J. Nucl. Med.. 1995, v.22, JY° 6, p, 505-507.7. Williams E.D., Caughey P.E., Hurley P.J. et. al. Pistribution of yttrium-90 ferric hydroxidecolloid and gold-198 after injection into the knee. Ann. Rheum. Pis.. 1976, v.35, p.516-520.8. Chinol M., Vallabhajosula S., Goldsmith S.J. et. al. Chemistry and biological behavior ofsamarium-153 and Rhenium-186-labeled hydroxyapatite particles: potential radiopharmaceuticalsfor radiation synovectomy. J. Nucl. Med.. 1993 Sep., v.34, N° 9, p. 1536-1542,9. Lang E.K. Advanced renal cell carcinoma: treatment by transcatheter embolization with inertmaterials and radioactive particles. Prog. Clin, Cancer.. 1982, v. 8, p. 299-310.10. Gliger L., Rosier H., Triller J. et. al. Selective sequentille intraarteriell radioembohsierung mit90-Y biorex-particeln. Schweiz. Mel. Wochenschr.. 1992, v.122, Jfe 17, p.24.11. Robertson P.L., Ten H.R.K., McKeever P,E. et. al. Three-dimensional tumor dosimetry forhepatic yttrium-90-microsphere therapy. J. Nucl. Med.. 1992, v.33, J6 5, p.735-738.
12. Turner J.N., Klemp P.F., Cameron P.J. JY°, 166-Ho-microsphere liver radiotherapy: a preclinicalSPECT dosimetry study in the pig. Nuc. Med. Communic. 1994, v. 15, fla 7.13. Samaratunga R.C., Thomas S.R., Hinnefeld J.D. et. al. A Monte Carlo simulation model forradiation dose to metastatic skeletal tumor from rhenium-186. J. Nuc. Med.. 1995, v.36, JVa 2, p.336-350.14. Tomberlin J.K., Halperin E.C., Kusin P. Endobronchial interstitial Au-198 implantation in thetreatment of recurrent bronchagenic carcinoma. J. Surg. Oncol.. 1992, v. 49, JVs 4, p. 213-219.15. Ariel J.M., Padula G. Treatment of asymptomatic metastatic cancer to the liver from primarycolon and rectal cancer by the intrarterial administration of chemotherapy and radioactive isotopes^J. Sure. Oncol., v.2. p. 151-156.16. Blanchard R.J. Treatment of liver tumors with yttrium-90 microspheres. Canad. J. Surg.. v. 26,J6 5, p. 442-443.17. Ackerman N.B., Hechmer P.A. The blood supply of experimental liver metastases. V. Increasedtumor perfusion with epinephrine. Amer. J. Surg.. v.140, p. 625-631.18. Leung T.W.T., Lau W.Y., Ho S.K.W. et. al. Radiation pneumonitis after selective internalradiation treatment with intrarterial (90) Yttrium-microspheres for inoperable hepatic tumors. Int. J.Rad. One. Biol. Phvs.. 1995,v.33, JVa4,p. 919-924.19. Zimmerman A., Shcubiger P.A., Mettler D. et. al. Renal pathology after yttrium-90 microsphereadministration in pig: A model for superselective radioembolization therapy. Invest. Rad.. 1995,v.30,Jfel2,p.716-723.20. Gray B.N., Anderson J.E., Burton M.A. et.al. Regression of liver metastases following treatmentwith yttrium-90 microspheres. Austral. N. Zeal. J. Surg.. 1992, v.62, JVs 2, p. 105-110.21. Yan Z.P., Lin G., Zhao H.Y. et.al. An experimental study and clinical pilot on yttrium-90 glassmicrospheres through the hepatic artery for treatment of primary liver cancer. Cancer. 1993, v.72, N°11, p. 3210-3215.22. Andrews J.C., Walker S.C, Ackerman R.J. et.al. Hepatic radioembolization with yttrium-90containing glass microspheres: preliminary results and clinical follow-up. J. Nucl. Med.. 1994, v.35,JVs 10, p. 1637-1644.23. Goncharova A.Ja., Drosdovsky B.J., Rosiev R.A., Skvorzov V.G. Comparative assessment ofradiopharmaceutic agents used in the treatment of rheumatoid arthritis. Med. Radiol. (Russia). 1993,Jfe 11, p. 16-18.24. Bykorez A.I., Pinchuk V.G. In the book(in russian): Experimental tumors of liver. Kiev, 1976,p. 131-168.25. Shoshenko K.A., Golub A.S., Broad V.I. In the book: Architerthonic of the vessels.Novosibirsk, 1982, p. 19-87.
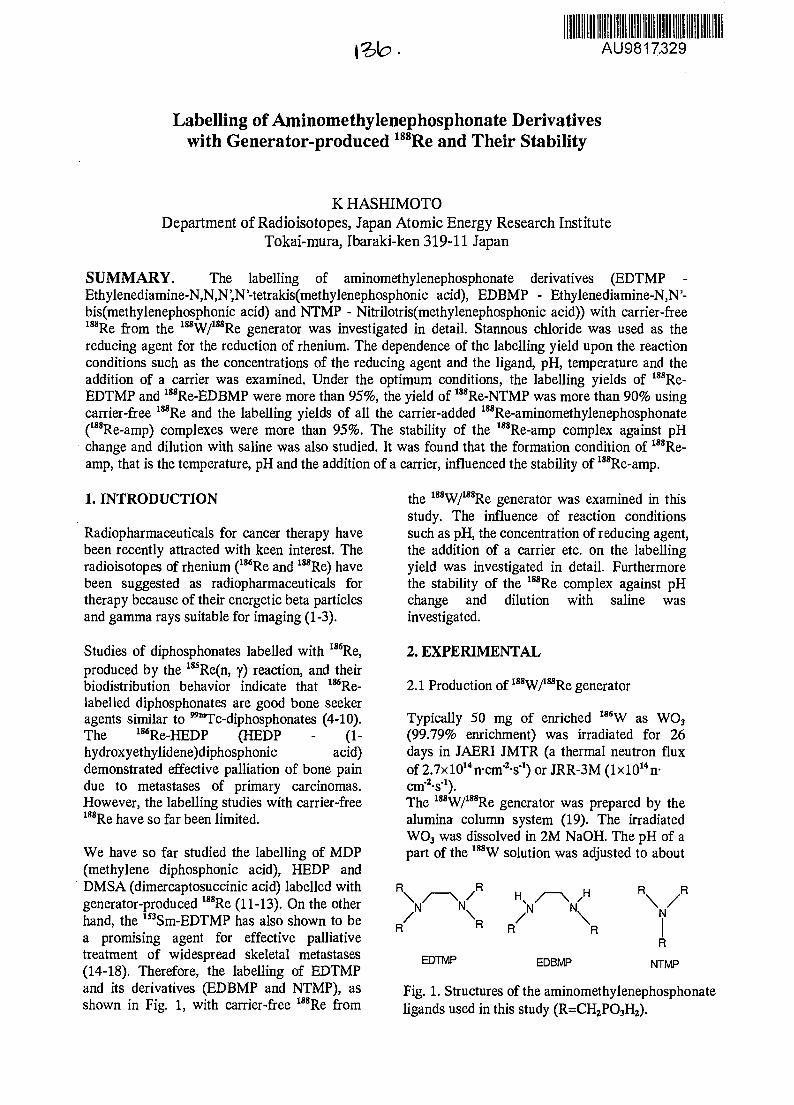
AU9817329
Labelling of Aminomethylenephosphonate Derivativeswith Generator-produced 188Re and Their Stability
K HASHIMOTODepartment of Radioisotopes, Japan Atomic Energy Research Institute
Tokai-mura, Ibaraki-ken 319-11 Japan
SUMMARY. The labelling of aminomethylenephosphonate derivatives (EDTMP -Ethylenediamine-N,N,N',N'-tetrakis(methylenephosphonic acid), EDBMP - Ethylenediamine-N,N'-bis(methylenephosphonic acid) and NTMP - Nitrilotris(methylenephosphonic acid)) with carrier-free188Re from the 18SW/18SRe generator was investigated in detail. Stannous chloride was used as thereducing agent for the reduction of rhenium. The dependence of the labelling yield upon the reactionconditions such as the concentrations of the reducing agent and the ligand, pH, temperature and theaddition of a carrier was examined. Under the optimum conditions, the labelling yields of 188Re-EDTMP and 188Re-EDBMP were more than 95%, the yield of 188Re-NTMP was more than 90% usingcarrier-free 188Re and the labelling yields of all the carrier-added 188Re-aminomethylenephosphonate(188Re-amp) complexes were more than 95%. The stability of the 188Re-amp complex against pHchange and dilution with saline was also studied. It was found that the formation condition of 188Re-amp, that is the temperature, pH and the addition of a carrier, influenced the stability of I88Re-amp.
1. INTRODUCTION
Radiopharmaceuticals for cancer therapy havebeen recently attracted with keen interest. Theradioisotopes of rhenium (18dRe and 188Re) havebeen suggested as radiopharmaceuticals fortherapy because of their energetic beta particlesand gamma rays suitable for imaging (1-3).
Studies of diphosphonates labelled with 186Re,produced by the 18sRe(n, y) reaction, and theirbiodistribution behavior indicate that 186Re-labelled diphosphonates are good bone seekeragents similar to "Tc-diphosphonates (4-10).The 186Re-HEDP (BED? - (1-hydroxyethylidene)diphosphonic acid)demonstrated effective palliation of bone paindue to metastases of primary carcinomas.However, the labelling studies with carrier-free1S8Re have so far been limited.
We have so far studied the labelling of MDP(methylene diphosphonic acid), HEDP andDMSA (dimercaptosuccinic acid) labelled withgenerator-produced 188Re (11-13). On the otherhand, the 153Sm-EDTMP has also shown to bea promising agent for effective palliativetreatment of widespread skeletal metastases(14-18). Therefore, the labelling of EDTMPand its derivatives (EDBMP and NTMP), asshown in Fig. 1, with carrier-free 188Re from
the 188W/I88Re generator was examined in thisstudy. The influence of reaction conditionssuch as pH, the concentration of reducing agent,the addition of a carrier etc. on the labellingyield was investigated in detail. Furthermorethe stability of the 188Re complex against pHchange and dilution with saline wasinvestigated.
2. EXPERIMENTAL
2.1 Production of 18SW/188Re generator
Typically 50 mg of enriched 186W as WO3
(99.79% enrichment) was irradiated for 26days in JAERI JMTR (a thermal neutron fluxof 2.7x10"nemos'1) or JRR-3M (lxl014n-cm^-s"1).The 188W/188Re generator was prepared by thealumina column system (19). The irradiatedWO3 was dissolved in 2M NaOH. The pH of apart of the 188W solution was adjusted to about
N
R
NTMPEDTMP EDBMP
Fig. 1. Structures of the aminomethylenephosphonateligands used in this study (R=CH2PO3H2).
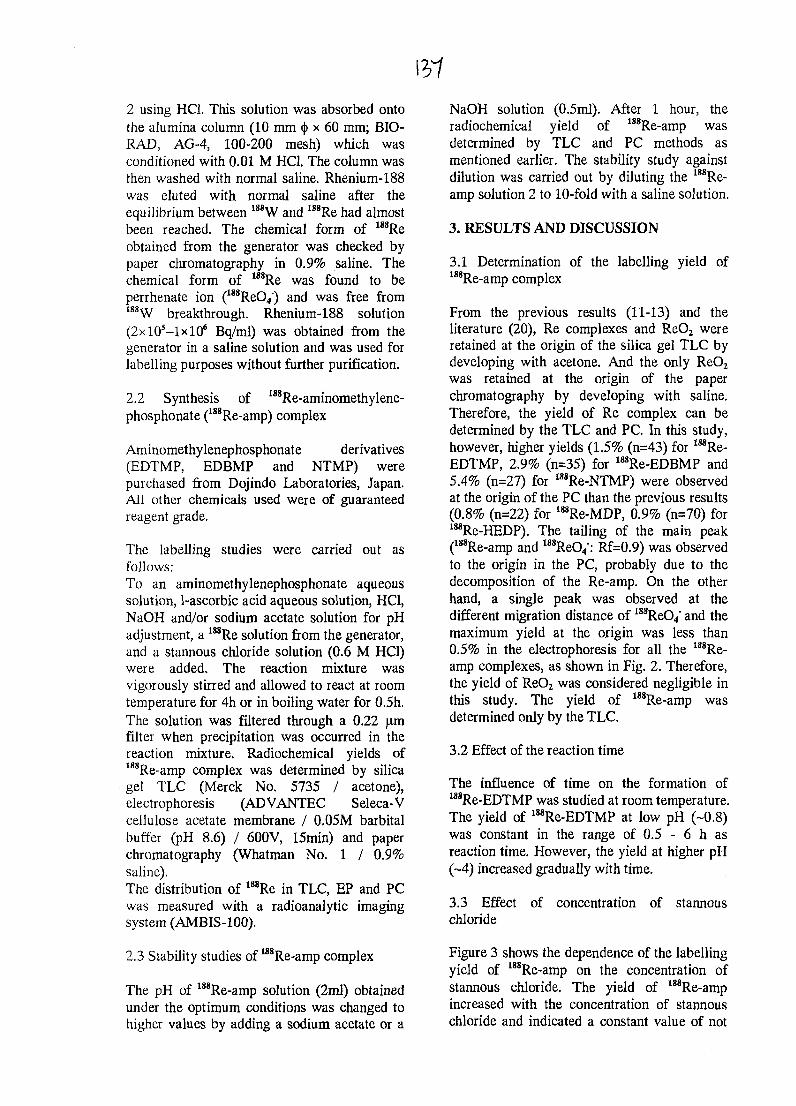
2 using HC1. This solution was absorbed ontothe alumina column (10 mm <J> x 60 mm; BIO-RAD, AG-4, 100-200 mesh) which wasconditioned with 0.01 M HC1. The column wasthen washed with normal saline. Rhenium-188was eluted with normal saline after theequilibrium between 188W and 188Re had almostbeen reached. The chemical form of 188Reobtained from the generator was checked bypaper chromatography in 0.9% saline. Thechemical form of 188Re was found to beperrhenate ion (18SRe04) and was free from188W breakthrough. Rhenium-188 solution(2xl05-lxl06 Bq/ml) was obtained from thegenerator in a saline solution and was used forlabelling purposes without further purification.
2.2 Synthesis of 188Re-aminomethylene-phosphonate (I88Re-amp) complex
Aminomethylenephosphonate derivatives(EDTMP, EDBMP and NTMP) werepurchased from Dojindo Laboratories, Japan.All other chemicals used were of guaranteedreagent grade.
The labelling studies were carried out asfollows:To an aminomethylenephosphonate aqueoussolution, 1-ascorbic acid aqueous solution, HC1,NaOH and/or sodium acetate solution for pHadjustment, a 188Re solution from the generator,and a stannous chloride solution (0.6 M HC1)were added. The reaction mixture wasvigorously stirred and allowed to react at roomtemperature for 4h or in boiling water for 0.5h.The solution was filtered through a 0.22 jxmfilter when precipitation was occurred in thereaction mixture. Radiochemical yields ofI88Re-amp complex was determined by silicagel TLC (Merck No. 5735 / acetone),electrophoresis (ADVANTEC Seleca-Vcellulose acetate membrane / 0.05M barbitalbuffer (pH 8.6) / 600V, 15min) and paperchromatography (Whatman No. 1 / 0.9%saline).The distribution of 188Re in TLC, EP and PCwas measured with a radioanalytic imagingsystem (AMBIS-100).
2.3 Stability studies of 188Re-amp complex
The pH of 188Re-amp solution (2ml) obtainedunder the optimum conditions was changed tohigher values by adding a sodium acetate or a
NaOH solution (0.5ml). After 1 hour, theradiochemical yield of 188Re-amp wasdetermined by TLC and PC methods asmentioned earlier. The stability study againstdilution was carried out by diluting the 188Re-amp solution 2 to 10-fold with a saline solution.
3. RESULTS AND DISCUSSION
3.1 Determination of the labelling yield of188Re-amp complex
From the previous results (11-13) and theliterature (20), Re complexes and ReO2 wereretained at the origin of the silica gel TLC bydeveloping with acetone. And the only ReO2
was retained at the origin of the paperchromatography by developing with saline.Therefore, the yield of Re complex can bedetermined by the TLC and PC. In this study,however, higher yields (1.5% (n=43) for I8SRe-EDTMP, 2.9% (n=35) for I8SRe-EDBMP and5.4% (n=27) for 18SRe-NTMP) were observedat the origin of the PC than the previous results(0.8% (n=22) for 188Re-MDP, 0.9% (n=70) for188Re-HEDP). The tailing of the main peak(188Re-amp and ""ReO/: Rf=0.9) was observedto the origin in the PC, probably due to thedecomposition of the Re-amp. On the otherhand, a single peak was observed at thedifferent migration distance of 188ReO4' and themaximum yield at the origin was less than0.5% in the electrophoresis for all the 188Re-amp complexes, as shown in Fig. 2. Therefore,the yield of ReO2 was considered negligible inthis study. The yield of 188Re-amp wasdetermined only by the TLC.
3.2 Effect of the reaction time
The influence of time on the formation oflssRe-EDTMP was studied at room temperature.The yield of 18sRe-EDTMP at low pH (-0.8)was constant in the range of 0.5 - 6 h asreaction time. However, the yield at higher pH(~4) increased gradually with time.
3.3 Effect of concentration of stannouschloride
Figure 3 shows the dependence of the labellingyield of 188Re-amp on the concentration ofstannous chloride. The yield of 188Re-ampincreased with the concentration of stannouschloride and indicated a constant value of not
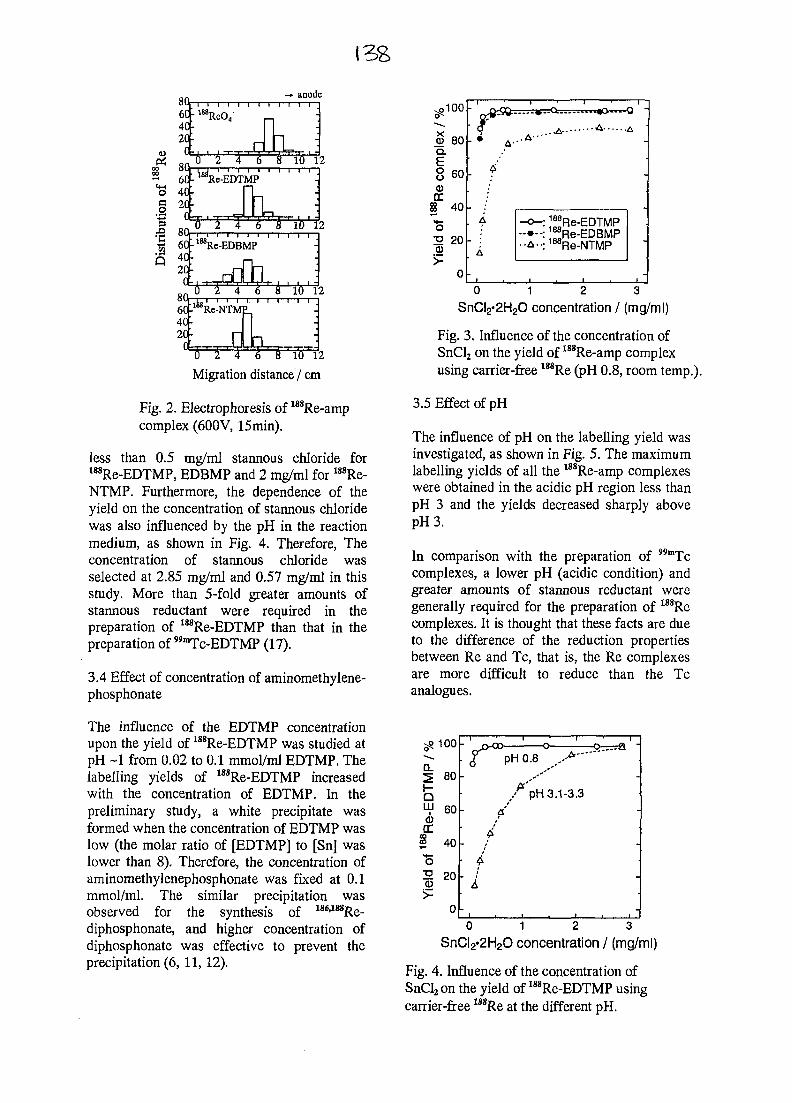
Pi
I
80,604020
0
80,6C40-20-
- • anode
'. 188.ReO.
(T 2 ""7 6 6 10 12aRe-EDTMP
8ft604020
0i
80r604C-2C
0 2 4 6 8 10 12SRc-EDBMP
6 2 4 6 8 10 12
_
0 2 4 6 8 10 12
Migration distance / cm
Fig. 2. Electrophoresis of 188Re-ampcomplex (600V, 15min).
less than 0.5 mg/ml stannous chloride for188Re-EDTMP, EDBMP and 2 mg/ml for 188Re-NTMP. Furthermore, the dependence of theyield on the concentration of stannous chloridewas also influenced by the pH in the reactionmedium, as shown in Fig. 4. Therefore, Theconcentration of stannous chloride wasselected at 2.85 mg/ml and 0.57 mg/ml in thisstudy. More than 5-fold greater amounts ofstannous reductant were required in thepreparation of X88Re-EDTMP than that in thepreparation of 99raTc-EDTMP (17).
3.4 Effect of concentration of aminomethylene-phosphonate
The influence of the EDTMP concentrationupon the yield of 18SRe-EDTMP was studied atpH ~1 from 0.02 to 0.1 mmol/ml EDTMP. Thelabelling yields of mRe-EDTMP increasedwith the concentration of EDTMP. In thepreliminary study, a white precipitate wasformed when the concentration of EDTMP waslow (the molar ratio of [EDTMP] to [Sn] waslower than 8). Therefore, the concentration ofaminomethylenephosphonate was fixed at 0.1mmol/ml. The similar precipitation wasobserved for the synthesis of 18W88Re-diphosphonate, and higher concentration ofdiphosphonate was effective to prevent theprecipitation (6, 11, 12).
O100
Q) 60Q.E8 60<DDC§ 40
2 200)
0
9- • A-
A
A
-
- o - : 188Re-EDTMP--•--: sfRe-EDBMP••^••:188Re-NTMP
• . I .
o •
-
-
0 1 2 3SnCI2'2H2O concentration / (mg/ml)
Fig. 3. Influence of the concentration ofSnCl2 on the yield of 188Re-amp complexusing carrier-free 188Re (pH 0.8, room temp.).
3.5 Effect of pH
The influence of pH on the labelling yield wasinvestigated, as shown in Fig. 5. The maximumlabelling yields of all the 188Re-amp complexeswere obtained in the acidic pH region less thanpH 3 and the yields decreased sharply abovepH3.
In comparison with the preparation of 99mTccomplexes, a lower pH (acidic condition) andgreater amounts of stannous reductant weregenerally required for the preparation of 188Recomplexes. It is thought that these facts are dueto the difference of the reduction propertiesbetween Re and Tc, that is, the Re complexesare more difficult to reduce than the Tcanalogues.
——Q.
QLLJ0)OC
COx>
T3
100
80
60
40
20
0
I pH 0.8 ,--*
/ A p H 3.1-3.3d/
j
-
• i•
A
-
0 1 2 3SnCI2«2H2O concentration / (mg/ml)
Fig. 4. Influence of the concentration ofSnCl2 on the yield of 188Re-EDTMP usingcarrier-free MSRe at the different pH.
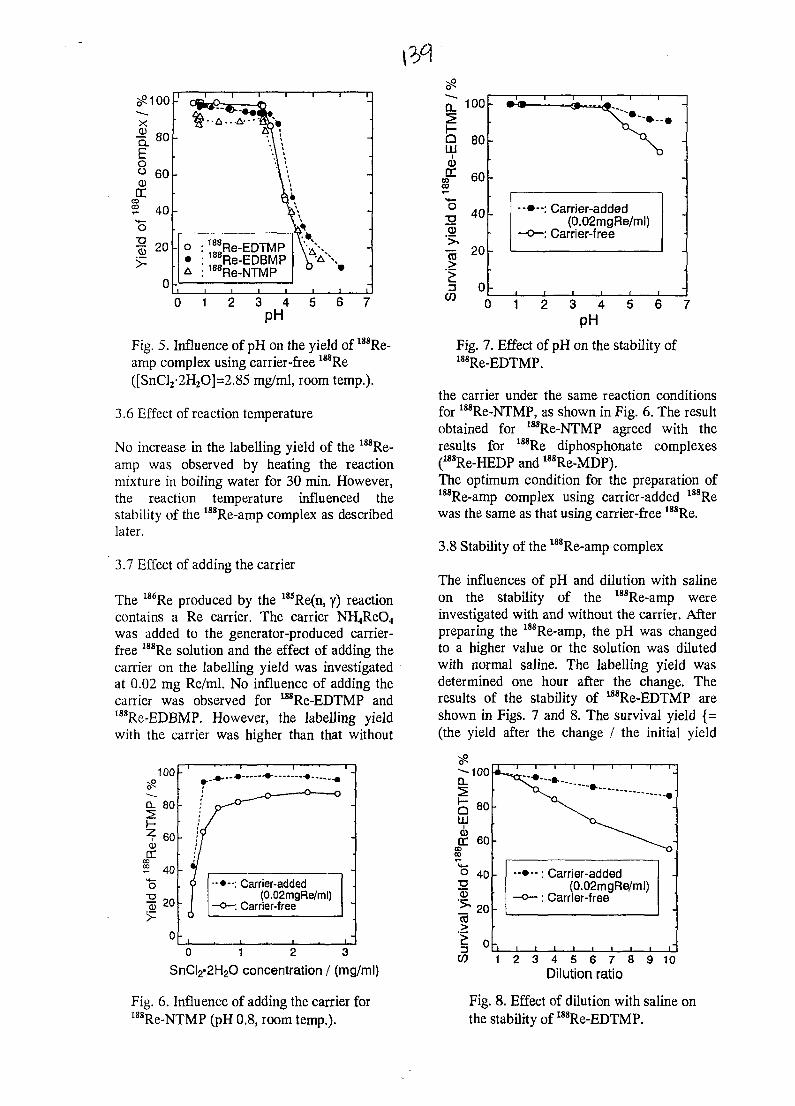
5^100
Fig. 5. Influence of pH on the yield of 188Re-amp complex using carrier-free 188Re([SnCl2-2H2O]=2.85 mg/ml, room temp.).
3.6 Effect of reaction temperature
No increase in the labelling yield of the 188Re-amp was observed by heating the reactionmixture in boiling water for 30 min. However,the reaction temperature influenced thestability of the 188Re-amp complex as describedlater.
3.7 Effect of adding the carrier
The 186Re produced by the 185Re(n, y) reactioncontains a Re carrier. The carrier NH(ReO4was added to the generator-produced carrier-free 188Re solution and the effect of adding thecarrier on the labelling yield was investigatedat 0.02 mg Re/ml. No influence of adding thecarrier was observed for 188Re-EDTMP and1S8Re-EDBMP. However, the labelling yieldwith the carrier was higher than that without
100
a. ao
^ 20
•-•--: Carrier-added(0.02mgRe/ml)
—o—: Carrier-free
0 1 2 3
SnCI2«2H2O concentration / (mg/ml)
Fig. 6. Influence of adding the carrier for188Re-NTMP (pH 0.8, room temp.).
O.
Si
(D
o32
CD
100
80
60
40
E
•-•--; Carrier-added(0.02mgRe/ml)
—o—; Carrier-free
0 1 3 4
PH
Fig. 7. Effect of pH on the stability of188Re-EDTMP.
the carrier under the same reaction conditionsfor 188Re-NTMP, as shown in Fig. 6. The resultobtained for 18SRe-NTMP agreed with theresults for 188Re diphosphonate complexes(188Re-HEDP and 188Re-MDP).The optimum condition for the preparation of188Re-amp complex using carrier-added 188Rewas the same as that using carrier-free X88Re.
3.8 Stability of the 188Re-amp complex
The influences of pH and dilution with salineon the stability of the 188Re-amp wereinvestigated with and without the carrier. Afterpreparing the 188Re-amp, the pH was changedto a higher value or the solution was dilutedwith normal saline. The labelling yield wasdetermined one hour after the change. Theresults of the stability of I88Re-EDTMP areshown in Figs. 7 and 8. The survival yield {=(the yield after the change / the initial yield
Carrier-added(0.02mgRe/ml)
Carrier-free
I | | I I I
W 1 2 3 4 5 6 7 8 9 10Dilution ratio
Fig. 8. Effect of dilution with saline onthe stability of 188Re-EDTMP.
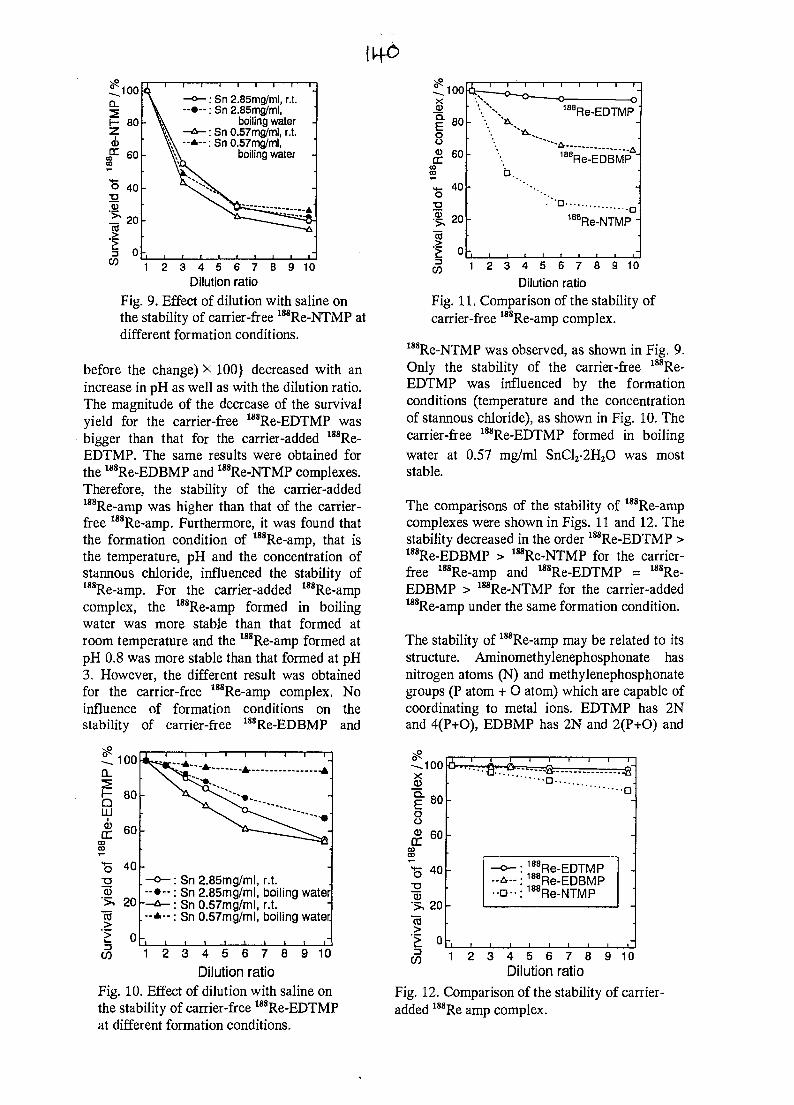
^ 1 0 0Q_
H 80
<£>IF 6 0
O 40
.92JT 20
3CO
- ° — : Sn 2.85mg/ml, r.t.- • - - : Sn 2.85mg?ml,
boiling water- A - : Sn 0.57mg/ml, r.t.-*--: Sn 0.57rng/ml,
boiling water
1 2 3 4 5 6 7Dilution ratio
8 9 10
Fig. 9. Effect of dilution with saline onthe stability of carrier-free 1MRe-NTMP atdifferent formation conditions.
before the change) x 100} decreased with anincrease in pH as well as with the dilution ratio.The magnitude of the decrease of the survivalyield for the carrier-free 18SRe-EDTMP wasbigger than that for the carrier-added 188Re-EDTMP. The same results were obtained forthe 18SRe-EDBMP and 188Re-NTMP complexes.Therefore, the stability of the carrier-added188Re-amp was higher than that of the carrier-free 18SRe-amp. Furthermore, it was found thatthe formation condition of 188Re-amp, that isthe temperature, pH and the concentration ofstannous chloride, influenced the stability of18SRe-amp. For the carrier-added 188Re-ampcomplex, the 188Re-amp formed in boilingwater was more stable than that formed atroom temperature and the 18SRe-amp formed atpH 0.8 was more stable than that formed at pH3. However, the different result was obtainedfor the carrier-free 188Re-amp complex. Noinfluence of formation conditions on thestability of carrier-free 188Re-EDBMP and
^ 1 0 0x.32| 80o
rr 6 0
DODO
1- 40
•§.20
BRe-EDTMP
-A ^188Re-EDBMP
b.
188Re-NTMP -
1 2 9 103 4 5 6 7 8Dilution ratio
Fig. 11. Comparison of the stability ofcarrier-free 188Re-amp complex.
188Re-NTMP was observed, as shown in Fig. 9.Only the stability of the carrier-free 188Re-EDTMP was influenced by the formationconditions (temperature and the concentrationof stannous chloride), as shown in Fig. 10. Thecarrier-free I88Re-EDTMP formed in boilingwater at 0.57 mg/ml SnClr2H2O was moststable.
The comparisons of the stability of 188Re-ampcomplexes were shown in Figs. 11 and 12. Thestability decreased in the order 188Re-EDTMP >188Re-EDBMP > 188Re-NTMP for the carrier-free 188Re-amp and 188Re-EDTMP = 188Re-EDBMP > 188Re-NTMP for the carrier-added188Re-amp under the same formation condition.
The stability of 188Re-amp may be related to itsstructure. Aminomethylenephosphonate hasnitrogen atoms (N) and methylenephosphonategroups (P atom + O atom) which are capable ofcoordinating to metal ions. EDTMP has 2Nand 4(P+O), EDBMP has 2N and 2(P+O) and
100
UJcb
DC
CD> ,
I
8 0
60
B 40
20
Sn 2.85mg/ml, r.t.Sn 2.85mg/ml, boiling waterSn 0.57mg/ml, r.t.Sn 0.57mg/ml, boiling water.
1 2 3 4 5 6 7 8 9 10Dilution ratio
Fig. 10. Effect of dilution with saline onthe stability of carrier-free 188Re-EDTMPat different formation conditions.
-.100xQ. 80 -
0? 60COCO
*T=; 40 | -
2(D>,20
0-,
1 1 1 1 1 1 1 1 1 1
_
-
J I
D
-o- i^Re-EDTMP•-&•-: 188Re-EDBMP•a-:ia8Re-NTMP
• i i i i i i
D
-
<£ 1 2 3 4 5 6 7 8 9 10Dilution ratio
Fig. 12. Comparison of the stability of carrier-added I88Re amp complex.
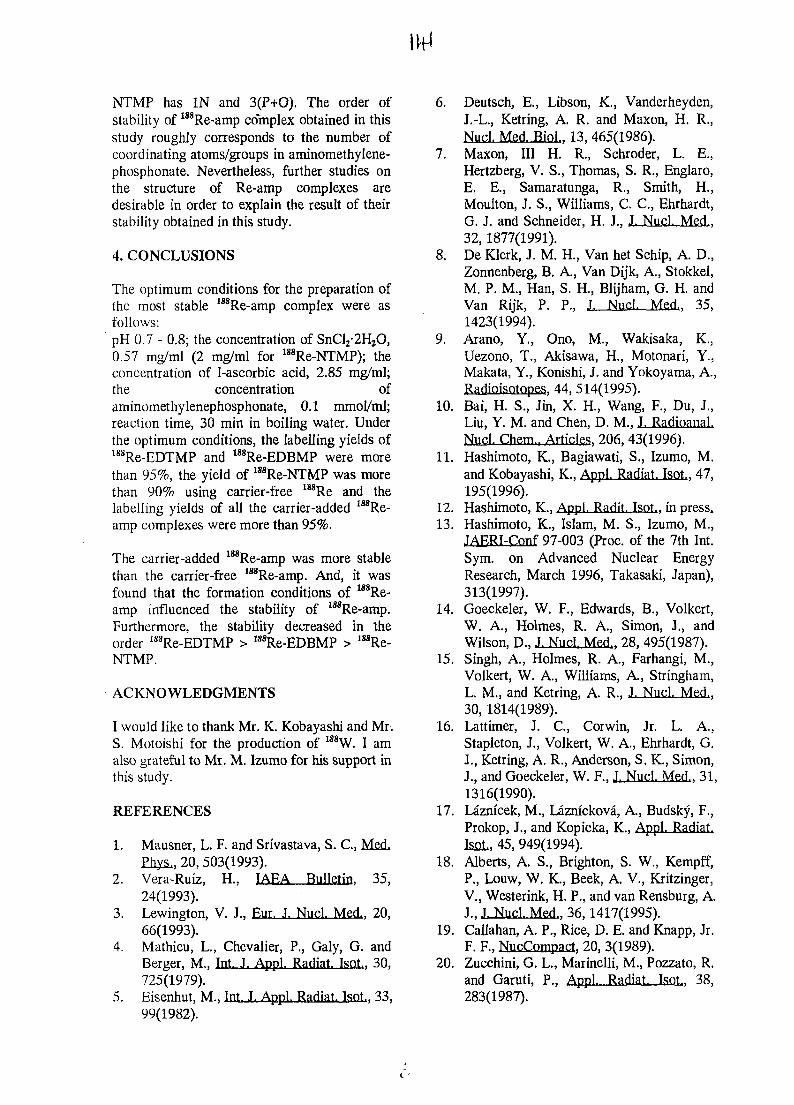
NTMP has IN and 3(P+0). The order ofstability of I88Re-amp co'mplex obtained in thisstudy roughly corresponds to the number ofcoordinating atoms/groups in aminomethylene-phosphonate. Nevertheless, further studies onthe structure of Re-amp complexes aredesirable in order to explain the result of theirstability obtained in this study.
4. CONCLUSIONS
The optimum conditions for the preparation ofthe most stable 188Re-amp complex were asfollows:pH 0.7 - 0.8; the concentration of SnCl2-2H2O,0.57 mg/ml (2 mg/ml for 18SRe-NTMP); theconcentration of 1-ascorbic acid, 2.85 mg/ml;the concentration ofaminomethylenephosphonate, 0.1 mmol/ml;reaction time, 30 min in boiling water. Underthe optimum conditions, the labelling yields ofmRe-EDTMP and 188Re-EDBMP were morethan 95%, the yield of ISSRe-NTMP was morethan 90% using carrier-free 188Re and thelabelling yields of all the carrier-added IS8Re-amp complexes were more than 95%.
The carrier-added 18SRe-amp was more stablethan the carrier-free 1S8Re-amp. And, it wasfound that the formation conditions of ^Re-amp influenced the stability of 18SRe-amp.Furthermore, the stability decreased in theorder mRe-EDTMP > lssRe-EDBMP > lssRe-NTMP.
ACKNOWLEDGMENTS
I would like to thank Mr. K. Kobayashi and Mr.5. Motoishi for the production of 188W. I amalso grateful to Mr. M. Izumo for his support inthis study.
REFERENCES
1. Mausner, L. F. and Srivastava, S. C, Med,Phys., 20, 503(1993).
2. Vera-Ruiz, H., IAEA Bulletin. 35,24(1993).
3. Lewington, V. J., Eur. I. Nnd. Med.. 20,66(1993).
4. Mathieu, L., Chevalier, P., Galy, G. andBerger, M., Int. J. Appl. Radiat. Isot., 30,725(1979).
5. Eisenhut, M., Int. J. Appl. Radiat. Isot., 33,99(1982).
6. Deutsch, E., Libson, K., Vanderheyden,J.-L., Ketring, A. R. and Maxon, H. R.,Nucl. Med. BioL 13, 465(1986).
7. Maxon, III H. R., Schroder, L. E.,Hertzberg, V. S., Thomas, S. R., Englaro,E. E., Samaratunga, R., Smith, H.,Moulton, J. S., Williams, C. C, Ehrhardt,G. J. and Schneider, H. J., J. Nucl. Med.,32, 1877(1991).
8. De Klerk, J. M. H., Van het Schip, A. D.,Zonnenberg, B. A., Van Dijk, A., Stokkel,M. P. M., Han, S. H., Blijham, G. H. andVan Rijk, P. P., J. Nucl. Med.. 35,1423(1994).
9. Arano, Y., Ono, M., Wakisaka, K.,Uezono, T., Akisawa, H., Motonari, Y.,Makata, Y., Konishi, J. and Yokoyama, A.,Rariioisotopes, 44, 514(1995).
10. Bai, H. S., Jin, X. H., Wang, F., Du, J.,Liu, Y. M. and Chen, D. M., J. Radioanal.Nud. Chem.r Articles, 206, 43(1996).
11. Hashimoto, K., Bagiawati, S., Izumo, M.and Kobayashi, K., Appl. Radiat. Isot., 47,195(1996).
12. Hashimoto, K., Appl. Rariit. Isot.. in press.,13. Hashimoto, K., Islam, M. S., Izumo, M.,
JAERI-Cnnf 97-003 (Proc. of the 7th Int.Sym. on Advanced Nuclear EnergyResearch, March 1996, Takasaki, Japan),313(1997).
14. Goeckeler, W. F., Edwards, B., Volkert,W. A., Holmes, R. A., Simon, J., andWilson, D., J. Nucl. Med., 28, 495(1987).
15. Singh, A., Holmes, R. A., Farhangi, M.,Volkert, W. A., Williams, A., Stringham,L. M., and Ketring, A. R., J. Nucl. Med.,30, 1814(1989).
16. Lattimer, J. C, Corwin, Jr. L. A.,Stapleton, J., Volkert, W. A., Ehrhardt, G.J., Ketring, A. R., Anderson, S. K., Simon,J., and Goeckeler, W. F., J. Nucl. Med., 31,1316(1990).
17. Laznicek, M., Liznickova, A., Budsky, F.,Prokop, J., and Kopicka, K., Appl. Radiat.IsoL, 45, 949(1994).
18. Alberts, A. S., Brighton, S. W., Kempff,P., Louw, W. K., Beek, A. V., Kritzinger,V., Westerink, H. P., and van Rensburg, A.J., J. Nud. Mp.d., 36,1417(1995).
19. Callahan, A. P., Rice, D. E. and Knapp, Jr.F. F., NucCompact, 20, 3(1989).
20. Zucchini, G. L., Marinelli, M., Pozzato, R.and Garuti, P., Appl. Radiat. Isot., 38,283(1987).
AU9817330
APPLICATION OF X-RAY EMISSION TECHNIQUES FORMONITORING ENVIRONMENTAL POLLUTION
G. BERNASCONI, P.R. DANESI, M. DARGIE,N. HASELBERGER, A. MARKOWICZ, A. TAJANIIAEA Laboratories, A-2444 Seibersdorf, AUSTRIA
SUMMARY. The paper reviews recent progress at the IAEA's Laboratories in Seibersdorf in selectedaspects of applications of XRF and PIXE techniques to the analysis of environmental, geological andbiological samples. The application of these techniques to test the homogeneity of candidate referencematerial and recently developed sample preparation procedures for total reflection XRF and X-raymicrofluorescence analysis of environmental materials, are presented. Simple and rapid procedures areillustrated for transferring many solid materials into a liquid phase, making TXRF a versatile andpowerful analytical method with very good precision and accuracy. The performance of portable XRFunits based on liquid-nitrogen cooled semiconductor detectors and thermoelectrically cooledphotodiodes, as well as their preliminary applications for in-situ analysis of soil and sediments, are alsodiscussed.
1. INTRODUCTION
X-ray emission techniques are versatile andpowerful methods used for multielement non-destructive analysis. They include X-rayfluorescence (XRF), particle induced X-rayemission (PIXE), scanning electron microscopycombined with X-ray spectrometry and electronprobe microanalysis (EPMA). Since manyyears the IAEA has utilised and promoted thesetechniques for the analysis of environmental,biological and geological samples. In this paperrecent progress at our laboratory in selectedaspects related to the application of X-rayemission techniques is reviewed.
2. HOMOGENEITY TEST OFCANDIDATE REFERENCEMATERIALS FOR THE ANALYSIS OFAIRBORNE PARTICLES
The examination of environmental samplesrepresents an important field of activity inanalytical chemistry. One type of samples ofmajor interest in this area is air particulate (oraerosols) collected on filter substrates. Airparticulate deposited on a filter forms an idealtarget for X-ray spectroscopies (both PIXE andXRF). Usually, X-ray analytical methods arecalibrated against external standards, such as
thin evaporated metal or salt layers on plasticfilms (1), metal foils or pellets of knowncomposition (2). During the validation of ananalytical system/procedure a referencematerial similar to the real samples to beanalysed, in terms of analytes, matrix andphysical form, has to be used. For the analysisof the filters which have collected air particulateor aerosols a number of reference materials isavailable in the form of bulk dust in bottles,blank filters spiked with a metal-containingsolution and thin surface layers deposited onfilter substrates. All these reference materialsare however different from the real materialcollected on filters and inadequate for verifyingthe accuracy of the analytical method.Therefore, some efforts to produce referencematerial for XRF analysis of real samples havebeen made (1, 3). In this paper the experienceof the IAEA related to the production ofstandard filters loaded with air particles ispresented. The first attempt has been made inthe frame of a Co-ordinated ResearchProgramme (CRP) on the determination of toxicelements in air (4). The candidate referencematerial was prepared by suspending a certifiedreference material (NIES Vehicle ExhaustParticulates) onto a suitable Teflon® filter.The vehicle dust was collected inside asuspension chamber using an automatic
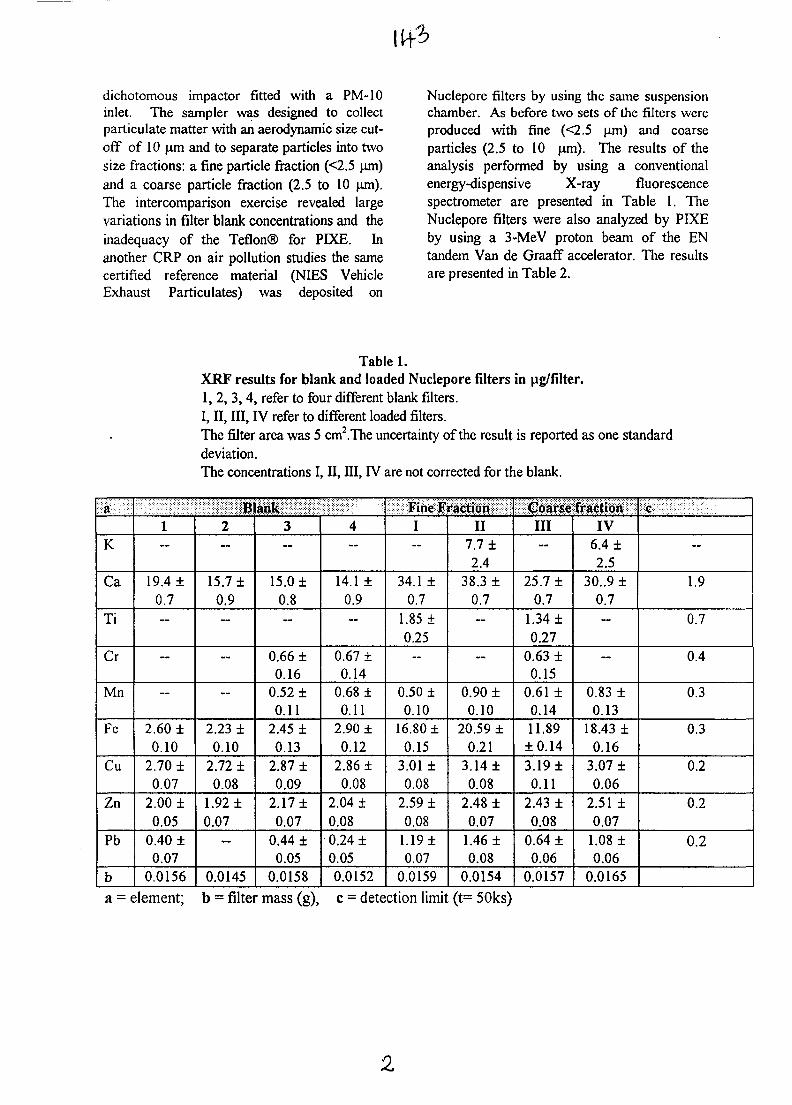
dichotomous impactor fitted with a PM-10inlet. The sampler was designed to collectparticipate matter with an aerodynamic size cut-off of 10 urn and to separate particles into twosize fractions: a fine particle fraction (<2.5 um)and a coarse particle fraction (2.5 to 10 um).The intercomparison exercise revealed largevariations in filter blank concentrations and theinadequacy of the Teflon® for PIXE. Inanother CRP on air pollution studies the samecertified reference material (NIES VehicleExhaust Particulates) was deposited on
Nuclepore filters by using the same suspensionchamber. As before two sets of the filters wereproduced with fine (<2.5 um) and coarseparticles (2.5 to 10 um). The results of theanalysis performed by using a conventionalenergy-dispensive X-ray fluorescencespectrometer are presented in Table 1. TheNuclepore filters were also analyzed by PIXEby using a 3-MeV proton beam of the ENtandem Van de Graaff accelerator. The resultsare presented in Table 2.
Table 1.XRF results for blank and loaded Nuclepore filters in pg/filter.1, 2, 3,4, refer to four different blank filters.I, II, III, IV refer to different loaded filters.The filter area was 5 cm2.The uncertainty of the result is reported as one standarddeviation.The concentrations I, II, III, IV are not corrected for the blank.
a
K
Ca
Ti
Cr
Mn
Fe
Cu
Zn
Pb
b
Blank1—
19.4 ±0.7—
—
—
2.60 ±0.10
2.70 ±0.07
2.00 ±0.05
0.40 ±0.07
0.0156
2—
15.7 ±0.9—
—
2.23 ±0.10
2.72 ±0.08
1.92 ±0.07
—
0.0145
3—
15.0 ±0.8—
0.66 ±0.16
0.52 ±0.11
2.45 ±0.13
2.87 ±0.09
2.17 ±0.07
0.44 ±0.05
0.0158
4—
14.1 ±0.9—
0.67 ±0.14
0.68 ±0.11
2.90 ±0.12
2.86 ±0.08
2.04 +0.080.24 ±0.050.0152
Fine FractionI~
34.1 ±0.7
1.85 ±0.25
—
0.50 ±0.10
16.80 ±0.15
3.01 ±0.08
2.59 ±0.08
1.19 ±0.07
0.0159
II7.7 ±2.4
38.3 ±0.7—
—
0.90 ±0.10
20.59 ±0.21
3.14 ±0.08
2.48 ±0.07
1.46 ±0.08
0.0154
Coarse fractionIII—
25.7 ±0.7
1.34 ±0.27
0.63 ±0.15
0.61 ±0.1411.89
±0.143.19 ±0.11
2.43 ±0.08
0.64 ±0.06
0.0157
IV6.4 ±2.5
30..9 ±0.7—
—
0.83 ±0.13
18.43 ±0.16
3.07 ±0.06
2.51 ±0.07
1.08 ±0.06
0.0165
c
—
1.9
0.7
0.4
0.3
0.3
0.2
0.2
0.2
a = element; b = filter mass (g), c = detection limit (t= 50ks)
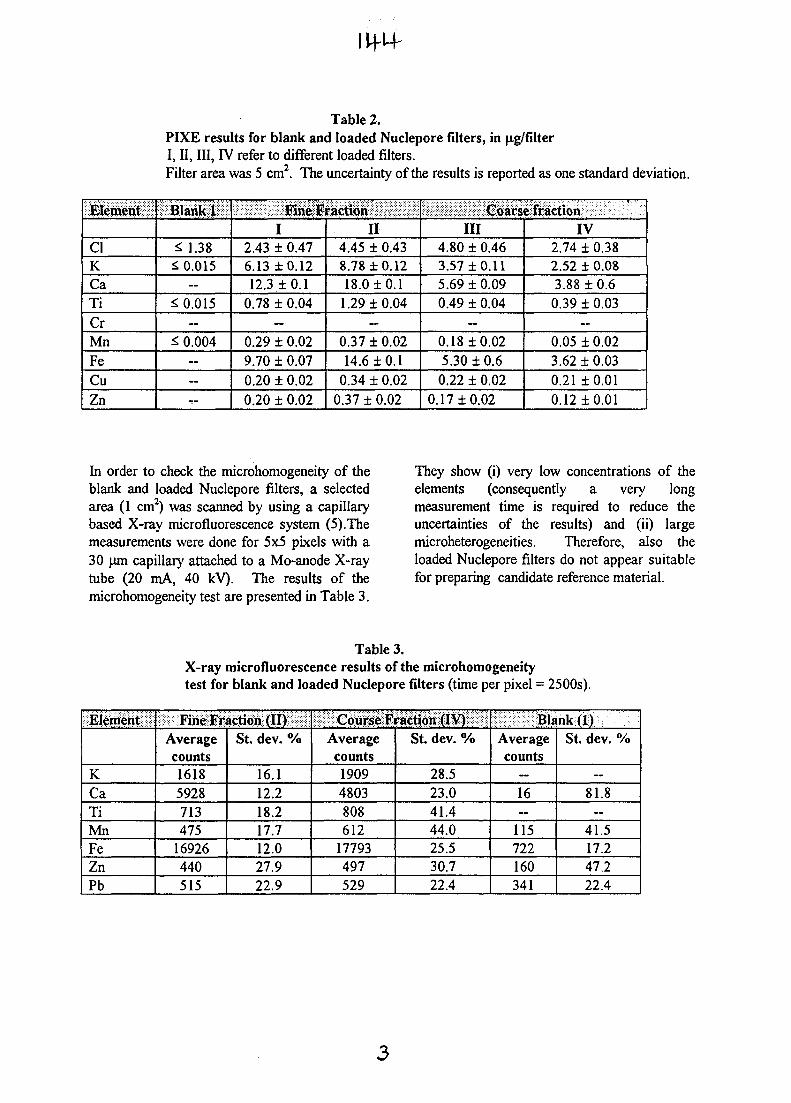
Table 2.PIXE results for blank and loaded Nuclepore filters, in jig/filterI, II, III, IV refer to different loaded filters.Filter area was 5 cm2. The uncertainty of the results is reported as one standard deviation.
Element
ClKCaTiCrMnFeCuZn
Blank 1
* 1.38£ 0.015
—£0.015
—£ 0.004
—~r -
Fine FractionI
2.43 ± 0.476.13 ±0.1212.3 ±0.1
0.78 ± 0.04—
0.29 ± 0.029.70 ± 0.070.20 ± 0.020.20 ± 0.02
II4.45 ± 0.438.78 ±0.1218.0 ±0.1
1.29 ±0.04—
0.37 ± 0.0214.6 ±0.1
0.34 ± 0.020.37 ± 0.02
Coarse fractionIII
4.80 ± 0.463.57 ±0.115.69 ± 0.090.49 ± 0.04
—0.18 ±0.025.30 ± 0.60.22 ± 0.02
0.17 ±0.02
IV2.74 ±0.382.52 ± 0.083.88 ±0.60.39 ± 0.03
„
0.05 ± 0.023.62 ±0.030.21 ±0.010.12 ±0.01
In order to check the microhomogeneity of theblank and loaded Nuclepore filters, a selectedarea (1 cm2) was scanned by using a capillarybased X-ray microfluorescence system (5).Themeasurements were done for 5x5 pixels with a30 um capillary attached to a Mo-anode X-raytube (20 mA, 40 kV). The results of themicrohomogeneity test are presented in Table 3.
They show (i) very low concentrations of theelements (consequently a very longmeasurement time is required to reduce theuncertainties of the results) and (ii) largemicroheterogeneities. Therefore, also theloaded Nuclepore filters do not appear suitablefor preparing candidate reference material.
Table 3.X-ray microfluorescence results of the microhomogeneitytest for blank and loaded Nuclepore filters (time per pixel = 2500s).
Element
KCaTiMnFeZnPb
Fine Fraction (II)Averagecounts16185928713475
16926440515
St. dev. %
16.112.218.217.712.027.922.9
Course Fraction (IV)Averagecounts19094803808612
17793497529
St. dev. %
28.523.041.444.025.530.722.4
Blank (1)Averagecounts
—16—
,_ 115722160341
St. dev. %
—81.8
—41.517.2
^_ 47.222.4
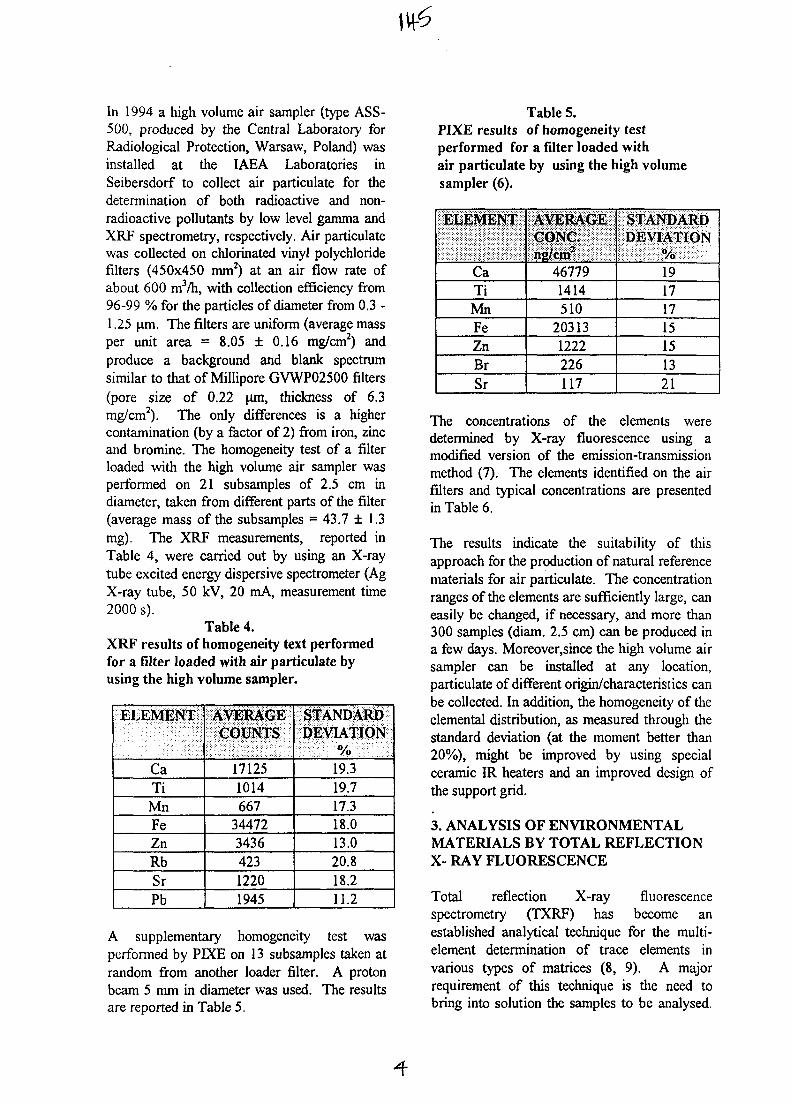
In 1994 a high volume air sampler (type ASS-500, produced by the Central Laboratory forRadiological Protection, Warsaw, Poland) wasinstalled at the IAEA Laboratories inSeibersdorf to collect air particulate for thedetermination of both radioactive and non-radioactive pollutants by low level gamma andXRF spectrometry, respectively. Air particulatewas collected on chlorinated vinyl polychloridefilters (450x450 mm2) at an air flow rate ofabout 600 nrVh, with collection efficiency from96-99 % for the particles of diameter from 0.3 -1.25 |j.m. The filters are uniform (average massper unit area = 8.05 ± 0.16 mg/cm2) andproduce a background and blank spectrumsimilar to that of Millipore GVWP02500 filters(pore size of 0.22 um, thickness of 6.3mg/cm2). The only differences is a highercontamination (by a factor of 2) from iron, zincand bromine. The homogeneity test of a filterloaded with the high volume air sampler wasperformed on 21 subsamples of 2.5 cm indiameter, taken from different parts of the filter(average mass of the subsamples = 43.7 ± 1.3mg). The XRF measurements, reported inTable 4, were carried out by using an X-raytube excited energy dispersive spectrometer (AgX-ray tube, 50 kV, 20 mA, measurement time2000 s).
Table 4.XRF results of homogeneity text performedfor a filter loaded with air particulate byusing the high volume sampler.
ELEMENT
CaTiMnFeZnRbSrPb
AVERAGECOUNTS
171251014667
34472343642312201945
STANDARDDEVIATION
%19.319.717.318.013.020.818.211.2
A supplementary homogeneity test wasperformed by PIXE on 13 subsamples taken atrandom from another loader filter. A protonbeam 5 mm in diameter was used. The resultsare reported in Table 5.
Table 5.PIXE results of homogeneity testperformed for a filter loaded withair particulate by using the high volumesampler (6).
ELEMENT
CaTiMnFeZnBrSr
AVERAGECONC.ng/cro3
467791414510
203131222226117
STANDARDDEVIATION
%19171715151321
The concentrations of the elements weredetermined by X-ray fluorescence using amodified version of the emission-transmissionmethod (7). The elements identified on the airfilters and typical concentrations are presentedin Table 6.
The results indicate the suitability of thisapproach for the production of natural referencematerials for air particulate. The concentrationranges of the elements are sufficiently large, caneasily be changed, if necessary, and more than300 samples (diam. 2.5 cm) can be produced ina few days. Moreover,since the high volume airsampler can be installed at any location,particulate of different origin/characteristics canbe collected. In addition, the homogeneity of theelemental distribution, as measured through thestandard deviation (at the moment better than20%), might be improved by using specialceramic IR heaters and an improved design ofthe support grid.
3. ANALYSIS OF ENVIRONMENTALMATERIALS BY TOTAL REFLECTIONX- RAY FLUORESCENCE
Total reflection X-ray fluorescencespectrometry (TXRF) has become anestablished analytical technique for the multi-element determination of trace elements invarious types of matrices (8, 9). A majorrequirement of this technique is the need tobring into solution the samples to be analysed.
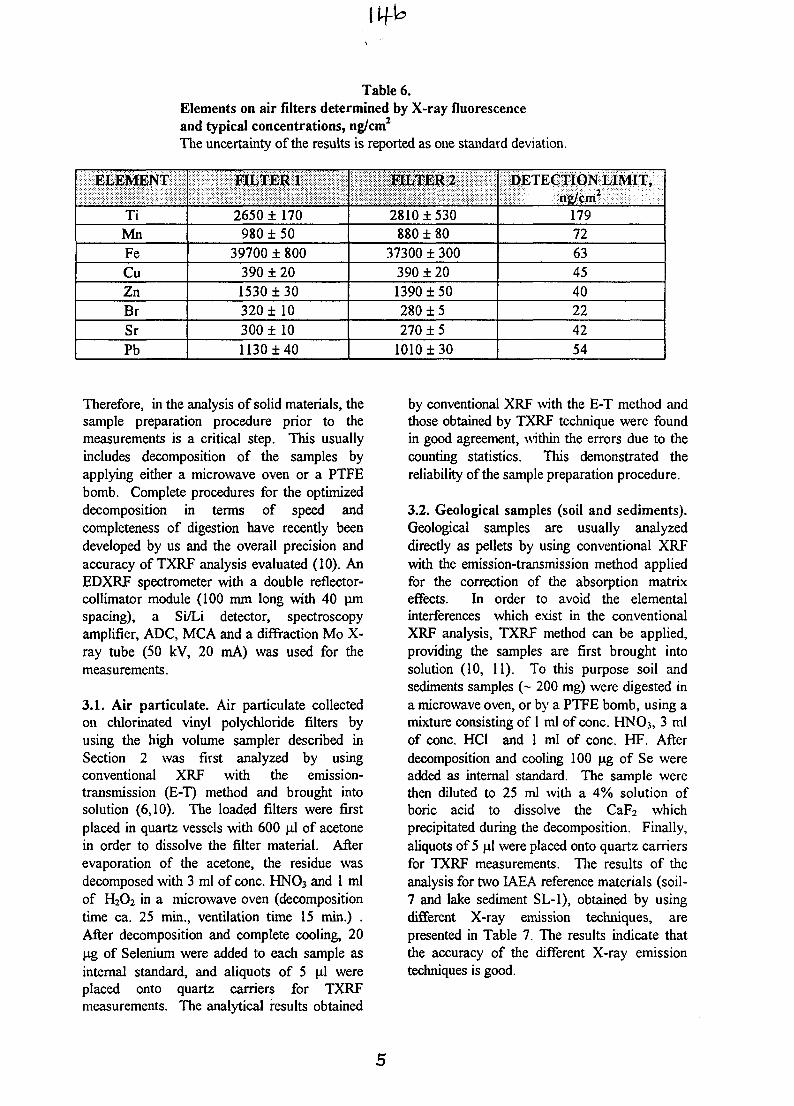
Table 6.Elements on air filters determined by X-ray fluorescenceand typical concentrations, ng/cm2
The uncertainty of the results is reported as one standard deviation.
ELEMENT
TiMnFeCuZnBrSrPb
FILTER 1
2650 ± 170980 ± 50
39700 ±800390 ± 201530 ±30320 ± 10300 ± 101130 ±40
FILTER 2
2810 ±530880 ± 80
37300 ± 300390 ± 201390 ±50280 ±5270 ±5
1010 ±30
DETECTION LIMIT,ng/cm2
17972634540224254
Therefore, in the analysis of solid materials, thesample preparation procedure prior to themeasurements is a critical step. This usuallyincludes decomposition of the samples byapplying either a microwave oven or a PTFEbomb. Complete procedures for the optimizeddecomposition in terms of speed andcompleteness of digestion have recently beendeveloped by us and the overall precision andaccuracy of TXRF analysis evaluated (10). AnEDXRF spectrometer with a double reflector-collimator module (100 mm long with 40 pmspacing), a Si/Li detector, spectroscopyamplifier, ADC, MCA and a diffraction Mo X-ray tube (50 kV, 20 mA) was used for themeasurements.
3.1. Air particulate. Air particulate collectedon chlorinated vinyl polychloride filters byusing the high volume sampler described inSection 2 was first analyzed by usingconventional XRF with the emission-transmission (E-T) method and brought intosolution (6,10). The loaded filters were firstplaced in quartz vessels with 600 \i\ of acetonein order to dissolve the filter material. Afterevaporation of the acetone, the residue wasdecomposed with 3 ml of cone. HNO3 and 1 mlof H2O2 in a microwave oven (decompositiontime ca. 25 min., ventilation time 15 min.) .After decomposition and complete cooling, 20ug of Selenium were added to each sample asinternal standard, and aliquots of 5 ul wereplaced onto quartz carriers for TXRFmeasurements. The analytical results obtained
by conventional XRF with the E-T method andthose obtained by TXRF technique were foundin good agreement, within the errors due to thecounting statistics. This demonstrated thereliability of the sample preparation procedure.
3.2. Geological samples (soil and sediments).Geological samples are usually analyzeddirectly as pellets by using conventional XRFwith the emission-transmission method appliedfor the correction of the absorption matrixeffects. In order to avoid the elementalinterferences which exist in the conventionalXRF analysis, TXRF method can be applied,providing the samples are first brought intosolution (10, 11). To this purpose soil andsediments samples (~ 200 mg) were digested ina microwave oven, or by a PTFE bomb, using amixture consisting of 1 ml of cone. HNO3, 3 mlof cone. HC1 and 1 ml of cone. HF. Afterdecomposition and cooling 100 ug of Se wereadded as internal standard. The sample werethen diluted to 25 ml with a 4% solution ofboric acid to dissolve the CaF2 whichprecipitated during the decomposition. Finally,aliquots of 5 (4.1 were placed onto quartz carriersfor TXRF measurements. The results of theanalysis for two IAEA reference materials (soil-7 and lake sediment SL-1), obtained by usingdifferent X-ray emission techniques, arepresented in Table 7. The results indicate thatthe accuracy of the different X-ray emissiontechniques is good.
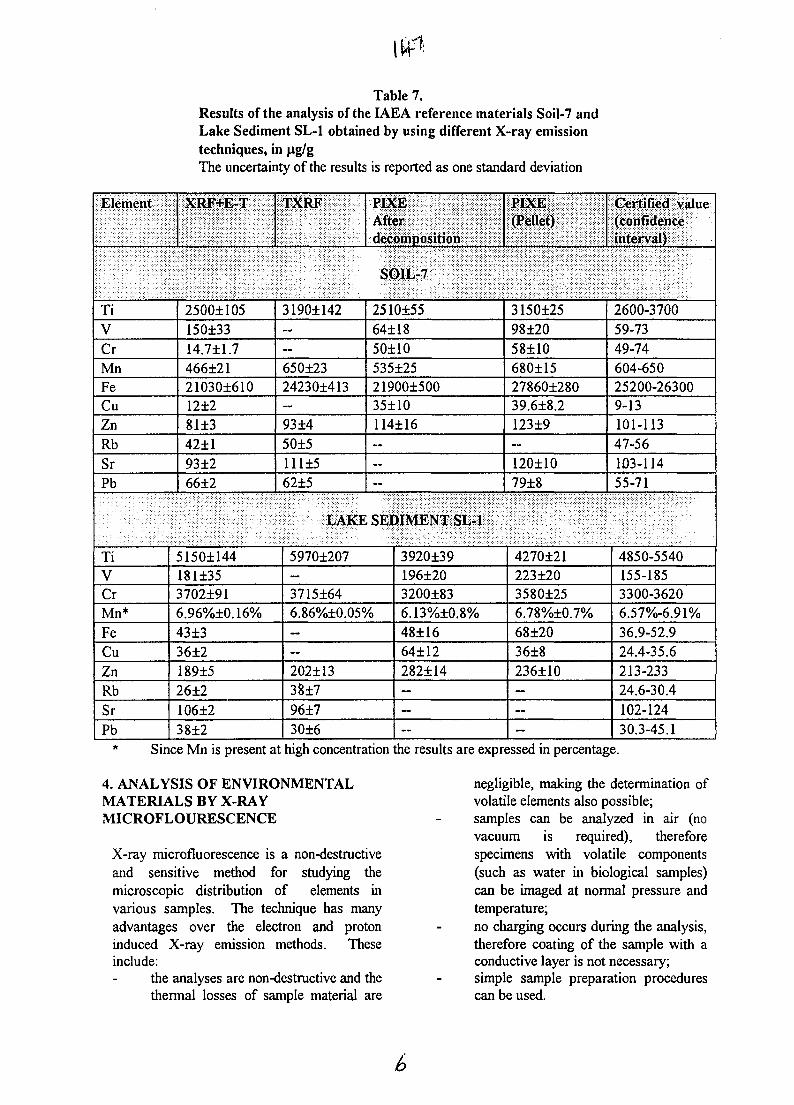
Table 7.Results of the analysis of the IAEA reference materials Soil-7 andLake Sediment SL-1 obtained by using different X-ray emissiontechniques, in ug/gThe uncertainty of the results is reported as one standard deviation
Element XRF+E-T TXRF PIXEAfterdecomposition
PIXE(Pellet)
Certified value(confidenceinterval)
SOIL-7
TiVCrMnFeCuZnRbSrPb
2500±105150±3314.7±1.7466±2121030±61012±281±342±193±266±2
3190±142——650±2324230±413—93±450±5111±562±5
2510±5564±1850±10535±2521900±50035±10114116———
3150±2598±2058±10680±1527860±28039.6±8.2123±9—120±1079±8
2600-370059-7349-74604-65025200-263009-13101-11347-56103-11455-71
TiVCrMn*FeCuZnRbSrPb
5150±144181±353702±916.96%±0.16%43±336±2189±526±2106±238±2
5970±207—3715±646.86%±0.05%——202±1338±796±730±6
3920±39196±203200±836.13%±0.8%48±1664±12282±14———
4270±21223±203580±256.78%±0.7%68±2036±8236±10———
4850-5540155-1853300-36206.57%-6.91%36.9-52.924.4-35.6213-23324.6-30.4102-12430.3-45.1
Since Mn is present at high concentration the results are expressed in percentage.
4. ANALYSIS OF ENVIRONMENTALMATERIALS BY X-RAYMICROFLOURESCENCE
X-ray microfluorescence is a non-destructiveand sensitive method for studying themicroscopic distribution of elements invarious samples. The technique has manyadvantages over the electron and protoninduced X-ray emission methods. Theseinclude:
the analyses are non-destructive and thethermal losses of sample material are
negligible, making the determination ofvolatile elements also possible;samples can be analyzed in air (novacuum is required), thereforespecimens with volatile components(such as water in biological samples)can be imaged at normal pressure andtemperature;
no charging occurs during the analysis,therefore coating of the sample with aconductive layer is not necessary;simple sample preparation procedurescan be used.
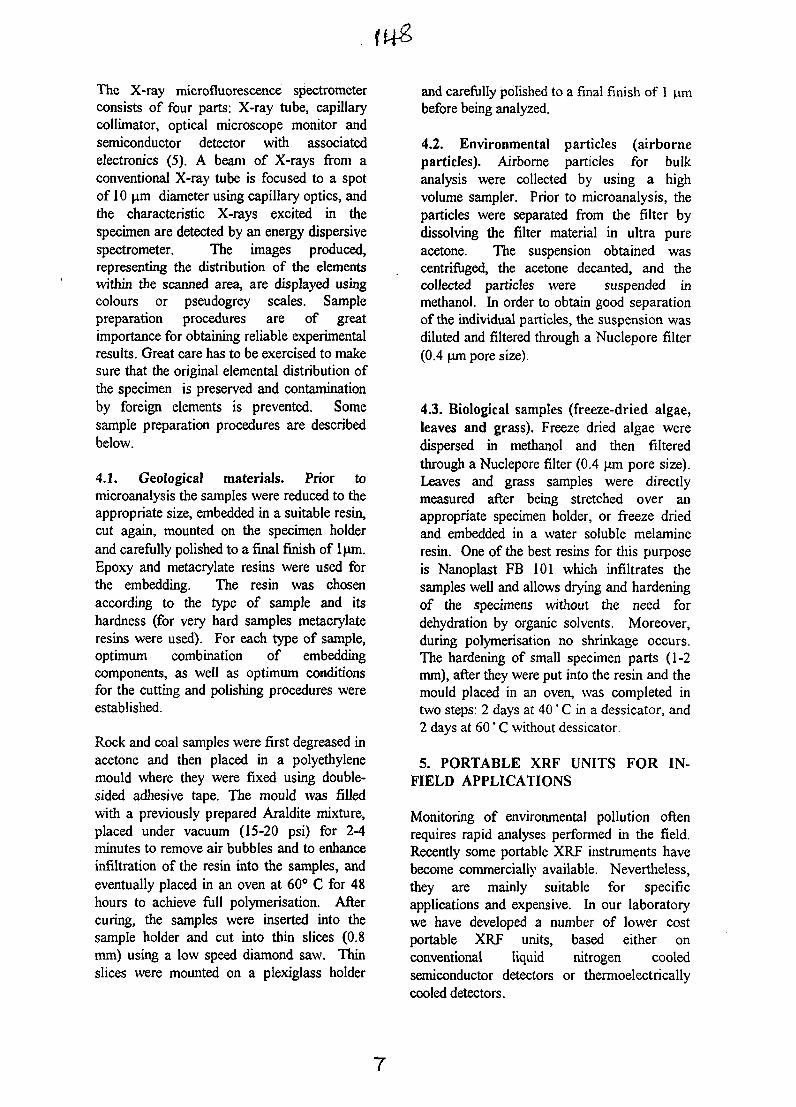
The X-ray microfluorescence spectrometerconsists of four parts: X-ray tube, capillarycollimator, optical microscope monitor andsemiconductor detector with associatedelectronics (5). A beam of X-rays from aconventional X-ray tube is focused to a spotof 10 \xm diameter using capillary optics, andthe characteristic X-rays excited in thespecimen are detected by an energy dispersivespectrometer. The images produced,representing the distribution of the elementswithin the scanned area, are displayed usingcolours or pseudogrey scales. Samplepreparation procedures are of greatimportance for obtaining reliable experimentalresults. Great care has to be exercised to makesure that the original elemental distribution ofthe specimen is preserved and contaminationby foreign elements is prevented. Somesample preparation procedures are describedbelow.
4.1. Geological materials. Prior tomicroanalysis the samples were reduced to theappropriate size, embedded in a suitable resin,cut again, mounted on the specimen holderand carefully polished to a final finish of lpm.Epoxy and metacrylate resins were used forthe embedding. The resin was chosenaccording to the type of sample and itshardness (for very hard samples metacrylateresins were used). For each type of sample,optimum combination of embeddingcomponents, as well as optimum conditionsfor the cutting and polishing procedures wereestablished.
Rock and coal samples were first degreased inacetone and then placed in a polyethylenemould where they were fixed using double-sided adhesive tape. The mould was filledwith a previously prepared Araldite mixture,placed under vacuum (15-20 psi) for 2-4minutes to remove air bubbles and to enhanceinfiltration of the resin into the samples, andeventually placed in an oven at 60° C for 48hours to achieve full polymerisation. Aftercuring, the samples were inserted into thesample holder and cut into thin slices (0.8mm) using a low speed diamond saw. Thinslices were mounted on a plexiglass holder
and carefully polished to a final finish of 1 \xmbefore being analyzed.
4.2. Environmental particles (airborneparticles). Airborne particles for bulkanalysis were collected by using a highvolume sampler. Prior to microanalysis, theparticles were separated from the filter bydissolving the filter material in ultra pureacetone. The suspension obtained wascentrifuged, the acetone decanted, and thecollected particles were suspended inmethanol. In order to obtain good separationof the individual particles, the suspension wasdiluted and filtered through a Nuclepore filter(0.4 um pore size).
4.3. Biological samples (freeze-dried algae,leaves and grass). Freeze dried algae weredispersed in methanol and then filteredthrough a Nuclepore filter (0.4 jxm pore size).Leaves and grass samples were directlymeasured after being stretched over anappropriate specimen holder, or freeze driedand embedded in a water soluble melamineresin. One of the best resins for this purposeis Nanoplast FB 101 which infiltrates thesamples well and allows drying and hardeningof the specimens without the need fordehydration by organic solvents. Moreover,during polymerisation no shrinkage occurs.The hardening of small specimen parts (1-2mm), after they were put into the resin and themould placed in an oven, was completed intwo steps: 2 days at 40' C in a dessicator, and2 days at 60' C without dessicator.
5. PORTABLE XRF UNITS FOR IN-FIELD APPLICATIONS
Monitoring of environmental pollution oftenrequires rapid analyses performed in the field.Recently some portable XRF instruments havebecome commercially available. Nevertheless,they are mainly suitable for specificapplications and expensive. In our laboratorywe have developed a number of lower costportable XRF units, based either onconventional liquid nitrogen cooledsemiconductor detectors or thermoelectricallycooled detectors.
7
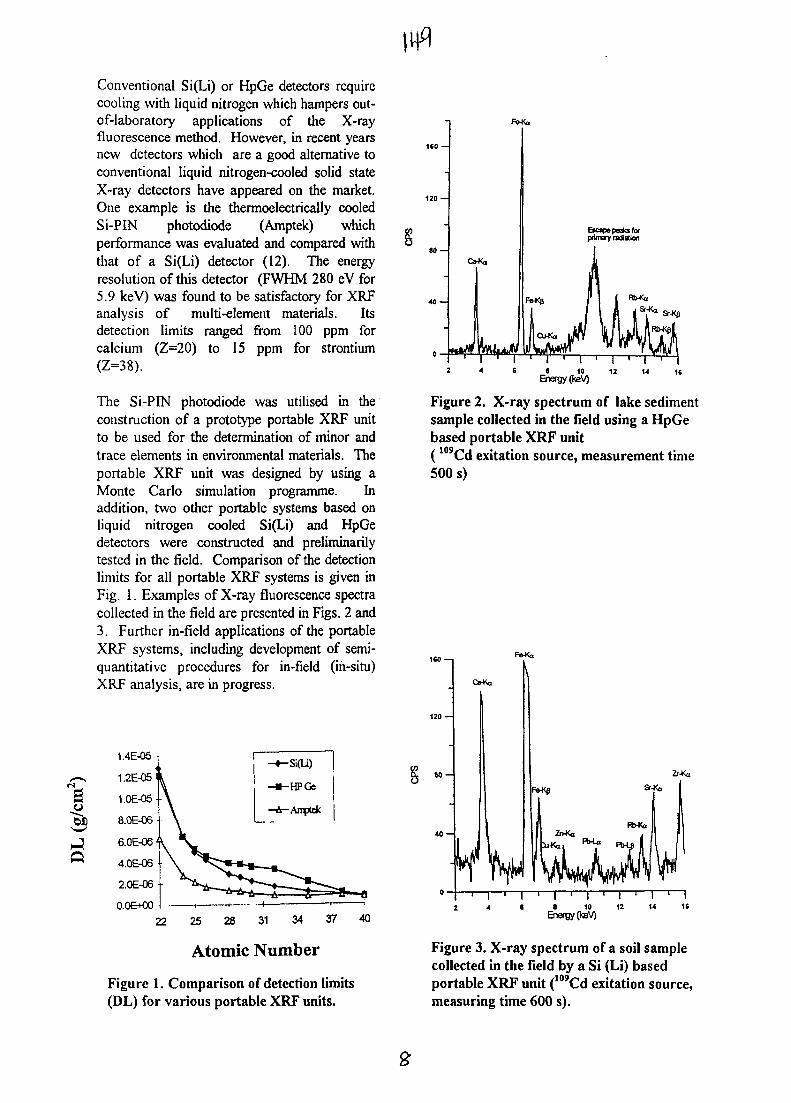
Conventional Si(Li) or HpGe detectors requirecooling with liquid nitrogen which hampers out-of-laboratory applications of the X-rayfluorescence method. However, in recent yearsnew detectors which are a good alternative toconventional liquid nitrogen-cooled solid stateX-ray detectors have appeared on the market.One example is the thermoelectrically cooledSi-PIN photodiode (Amptek) whichperformance was evaluated and compared withthat of a Si(Li) detector (12). The energyresolution of this detector (FWHM 280 eV for5.9 keV) was found to be satisfactory for XRFanalysis of multi-element materials. Itsdetection limits ranged from 100 ppm forcalcium (Z=20) to 15 ppm for strontium(Z=38).
The Si-PIN photodiode was utilised in theconstruction of a prototype portable XRF unitto be used for the determination of minor andtrace elements in environmental materials. Theportable XRF unit was designed by using aMonte Carlo simulation programme. Inaddition, two other portable systems based onliquid nitrogen cooled Si(Li) and HpGedetectors were constructed and preliminarilytested in the field. Comparison of the detectionlimits for all portable XRF systems is given inFig. 1. Examples of X-ray fluorescence spectracollected in the field are presented in Figs. 2 and3. Further in-field applications of the portableXRF systems, including development of semi-quantitative procedures for in-field (in-situ)XRF analysis, are in progress.
22 25 28 31 34 37
Atomic Number
Figure 1. Comparison of detection limits(DL) for various portable XRF units.
FoKo.
1 2 0 -
Escape peaks forprimary radiation
Figure 2. X-ray spectrum of lake sedimentsample collected in the field using a HpGebased portable XRF unit( 109Cd exitation source, measurement time500 s)
Zt-Ks
I8 10 12
Energy (teV)
I14
116
Figure 3. X-ray spectrum of a soil samplecollected in the field by a Si (Li) basedportable XRF unit (109Cd exitation source,measuring time 600 s).
I5b.
REFERENCES
1. Watjen U., Kriews M., Dannecker W.,Status report: preparing an ambient aerosolfilter reference material for elemental analysis,Fresenius J. Anal. Chem. 1993, 261-2642. Markowicz A., Haselberger N.,Mulenga P., Accuracy of calibrationprocedure for energy-dispersive X-rayfluorescence spectrometry, X-RavSpectrometrv 1992, 21, 271-2763. Haupt O., Klaue B., Schaefer C ,Dannecker W., Preparation of quartz fibrefilter standards for X-ray fluorescenceanalysis of aerosol samples, X-RavSpectrometrv 1995, 267-2754. Vermette S.J., Landsberger S.,Williams A.L., Vermette V.G., Developmentof a particulate filter standard and its use inan International Atomic Energy Agencyinterlaboratory evaluation, Final Report,August 1991, IAEA, Vienna, Austria5. Bernasconi G., Haselberger. N.,Markowicz A., Valkovic V., Applications of acapillary based X-ray microfluorescencesystem, Nucl. Instrum.Methods in Phys. Res.B86, 1994, 333-3386. Valkovic V., Dargie M., Jaksic M.,Markowicz A., Tajani A., Valkovic O., X-rayemission spectroscopy applied for bulk andindividual analysis of airborne particles, Nucl.
Instrum. Methods in Phvs. Res. Bl 13, 1996,363-3677. Markowicz A., Haselberger N., DargieM., Tajani A., Tchantchane A., Valkovic V.,Danesi P.R., Application of X-rayfluorescence spectrometry in assessment ofenvironmental pollution, J. Radioanal. Nucl.Chemistry 1996, 206 (2): 269-2778. Schwenke M., Knoth J., Totalreflection XRF, in: Van Grieken R.E.,Markowicz A.A. (eds.) Handbook of X-rayspectrometry - methods and techniques,Dekker, New York Basel Hong Kong, 1993,pp. 453-4899. Klockenkamper R., Total reflection X-ray fluorescence analysis, John Wiley & Sons,Inc., New York, 199710. Dargie M., Markowicz A., Tajani A.,Valkovic V., Optimized sample preparationprocedures for the analysis of solid materialsby total reflection XRE\ Fresenius J. Anal.Chem.. 1997, 357, 589-59311. Prange A., Schwenke H., Traceelements analysis using total reflection X-rayfluorescence spectrometrv. Adv. X-ray Anal..1997, 357, 589-59312. Haselberger N., Markowicz A.,Valkovic V., Comparison ofthermoelectrically cooled and conventionalSi(Li) X-ray detectors, Appl. Radiat. Isot.,1996,47(4), 455-456
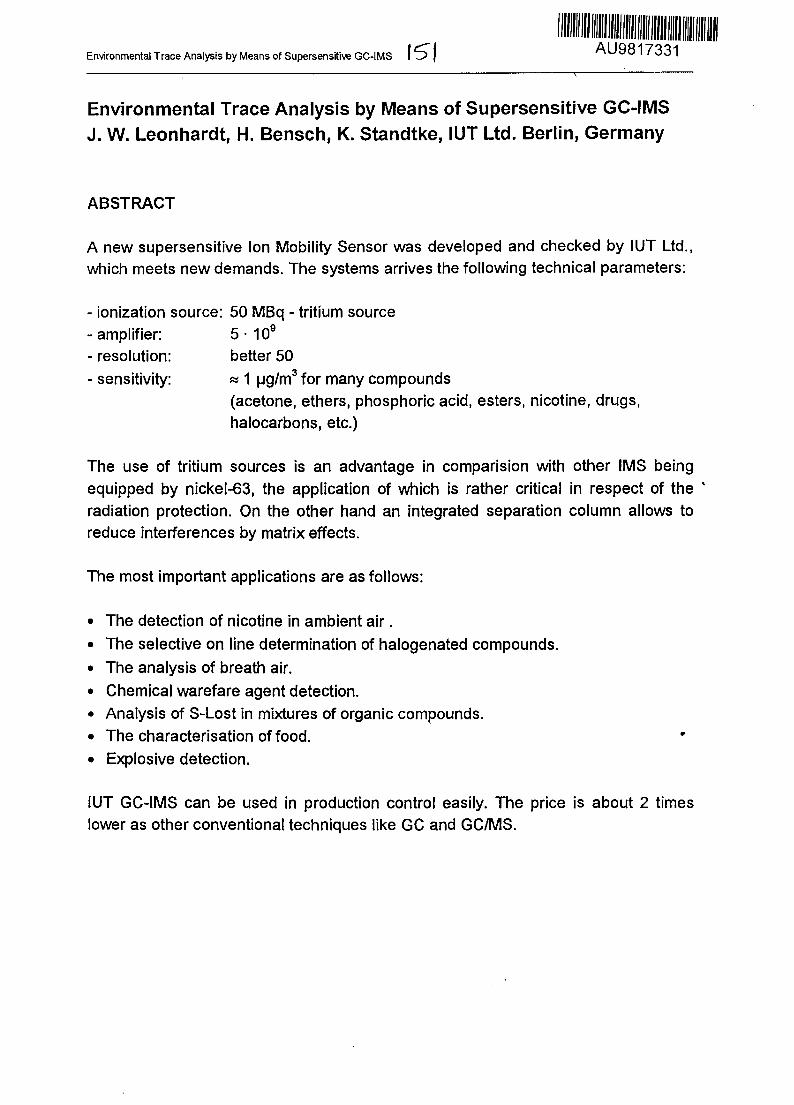
Environmental Trace Analysis by Means of Supersensitive GC-IMS »~~> • AU»d 17331
Environmental Trace Analysis by Means of Supersensitive GC-IMSJ. W. Leonhardt, H. Bensch, K. Standtke, IUT Ltd. Berlin, Germany
ABSTRACT
A new supersensitive Ion Mobility Sensor was developed and checked by IUT Ltd.,which meets new demands. The systems arrives the following technical parameters:
- ionization source: 50 MBq - tritium source- amplifier: 5 • 109
- resolution: better 50- sensitivity: » 1 ug/m3 for many compounds
(acetone, ethers, phosphoric acid, esters, nicotine, drugs,halocarbons, etc.)
The use of tritium sources is an advantage in comparision with other IMS beingequipped by nickel-63, the application of which is rather critical in respect of theradiation protection. On the other hand an integrated separation column allows toreduce interferences by matrix effects.
The most important applications are as follows:
• The detection of nicotine in ambient air.
• The selective on line determination of halogenated compounds.
• The analysis of breath air.
• Chemical warefare agent detection.• Analysis of S-Lost in mixtures of organic compounds.• The characterisation of food.• Explosive detection.
IUT GC-IMS can be used in production control easily. The price is about 2 timeslower as other conventional techniques like GC and GC/MS.
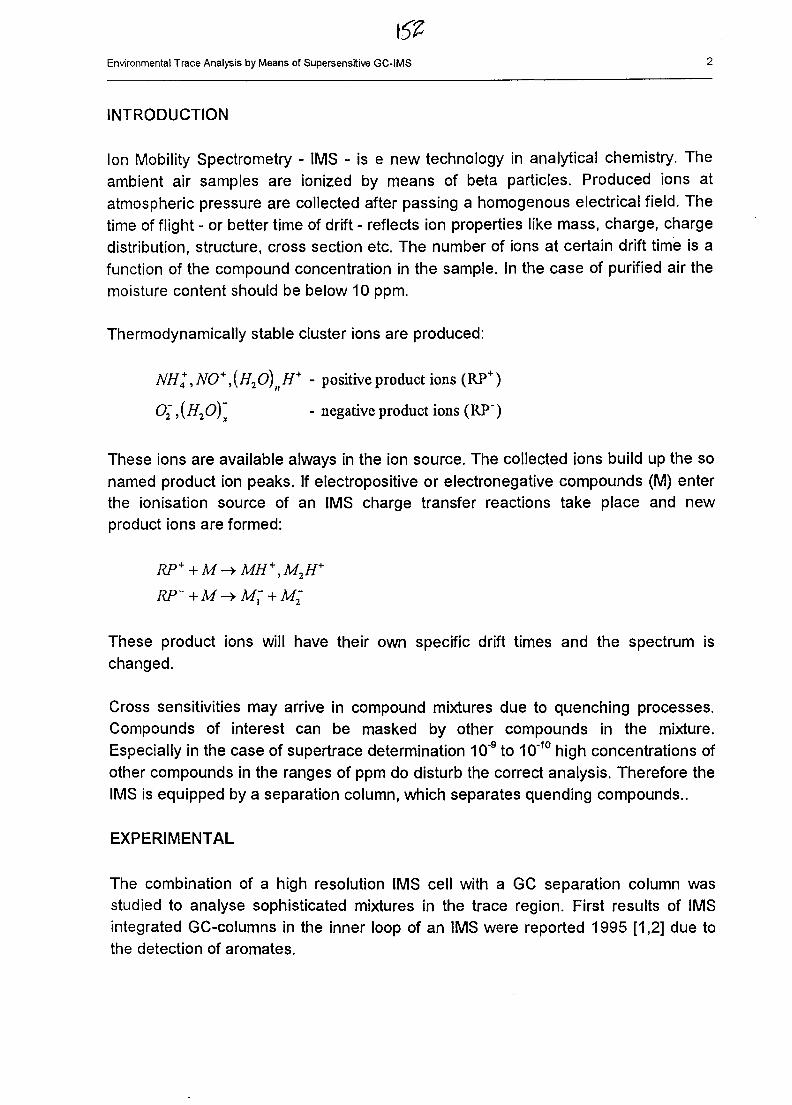
Environmental Trace Analysis by Means of Supersensitive GC-IMS
INTRODUCTION
Ion Mobility Spectrometry - IMS - is e new technology in analytical chemistry. Theambient air samples are ionized by means of beta particles. Produced ions atatmospheric pressure are collected after passing a homogenous electrical field. Thetime of flight - or better time of drift - reflects ion properties like mass, charge, chargedistribution, structure, cross section etc. The number of ions at certain drift time is afunction of the compound concentration in the sample. In the case of purified air themoisture content should be below 10 ppm.
Thermodynamically stable cluster ions are produced:
NH*,N0+,{H20)nH+ - positive product ions (RP+)
O2,{H2O)~x - negative product ions (RP')
These ions are available always in the ion source. The collected ions build up the sonamed product ion peaks. If electropositive or electronegative compounds (M) enterthe ionisation source of an IMS charge transfer reactions take place and newproduct ions are formed:
RP~ + M -> M; + M-
These product ions will have their own specific drift times and the spectrum ischanged.
Cross sensitivities may arrive in compound mixtures due to quenching processes.Compounds of interest can be masked by other compounds in the mixture.Especially in the case of supertrace determination 10'9 to 10'10 high concentrations ofother compounds in the ranges of ppm do disturb the correct analysis. Therefore theIMS is equipped by a separation column, which separates quending compounds..
EXPERIMENTAL
The combination of a high resolution IMS cell with a GC separation column wasstudied to analyse sophisticated mixtures in the trace region. First results of IMSintegrated GC-columns in the inner loop of an IMS were reported 1995 [1,2] due tothe detection of aromates.
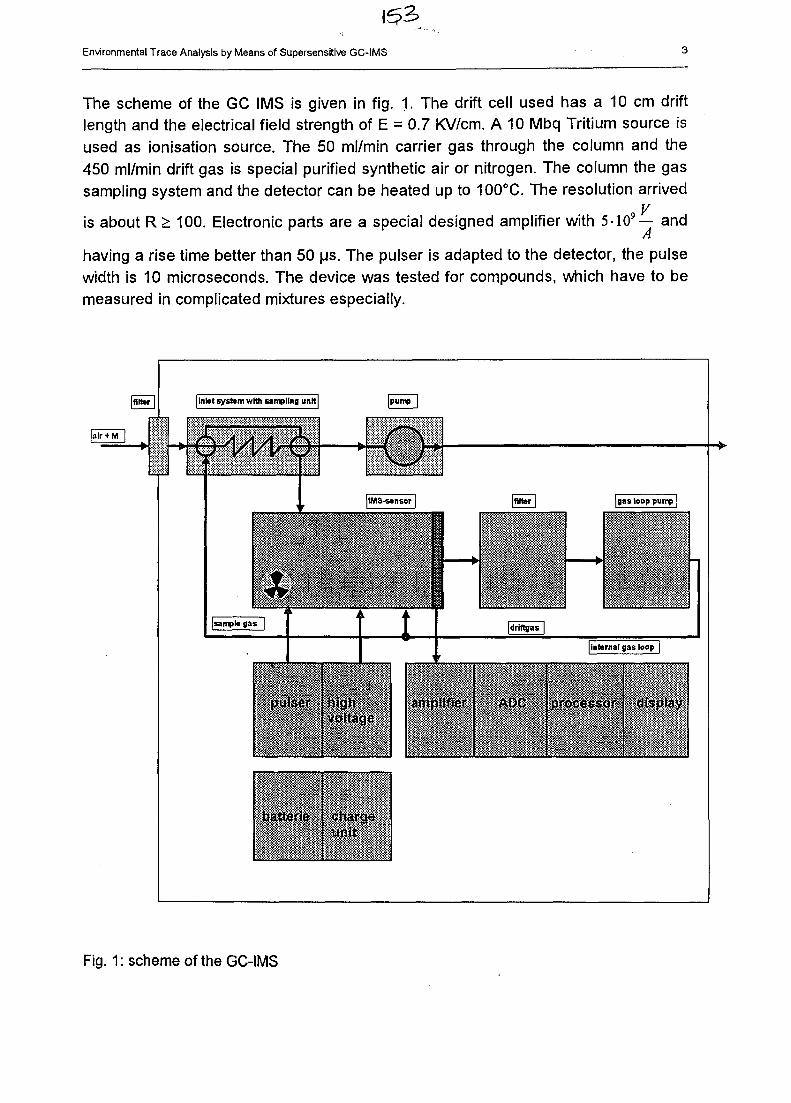
Environmental Trace Analysis by Means of Supersensitive GC-IMS
The scheme of the GC IMS is given in fig. 1. The drift cell used has a 10 cm driftlength and the electrical field strength of E = 0.7 KV/cm. A 10 Mbq Tritium source isused as ionisation source. The 50 ml/min carrier gas through the column and the450 ml/min drift gas is special purified synthetic air or nitrogen. The column the gassampling system and the detector can be heated up to 100°C. The resolution arrived
yis about R > 100. Electronic parts are a special designed amplifier with 5-109— and
Ahaving a rise time better than 50 us. The pulser is adapted to the detector, the pulsewidth is 10 microseconds. The device was tested for compounds, which have to bemeasured in complicated mixtures especially.
I InM system with sampling unit
BMAr
voltage4mpftffef ADC processor dJspfey
chargeunit
Fig. 1: scheme of the GC-IMS
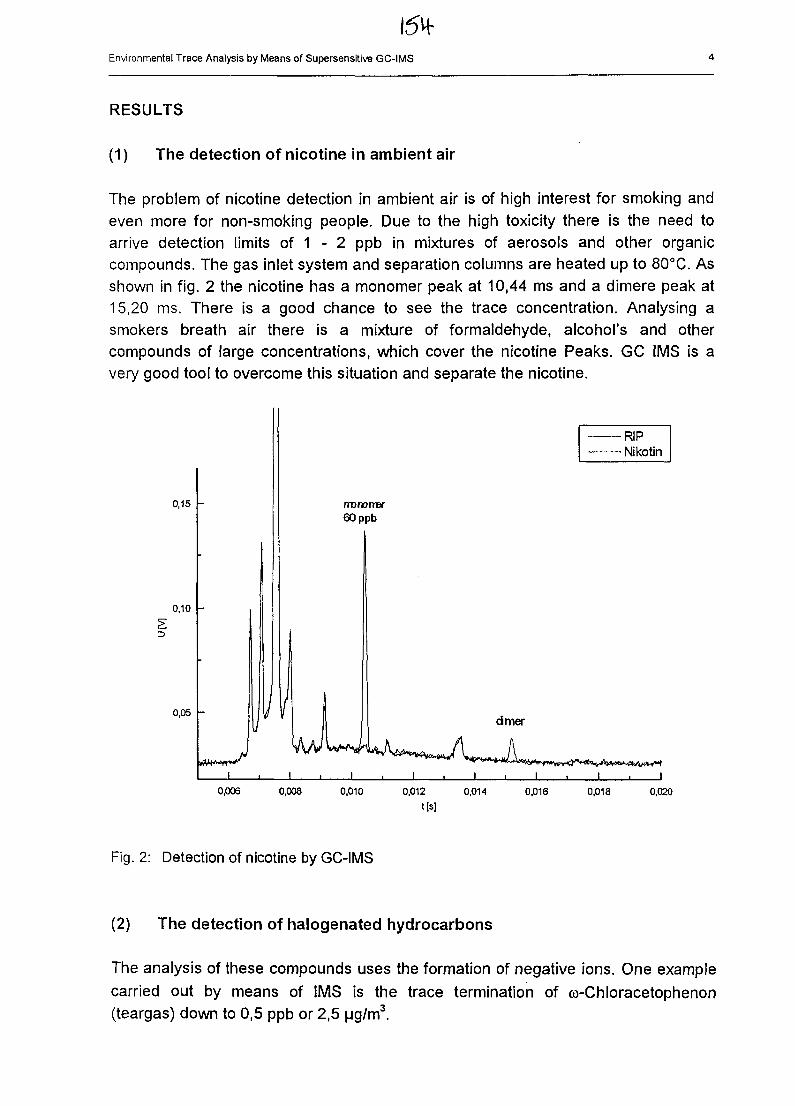
Environmental Trace Analysis by Means of Supersensitive GC-IMS
RESULTS
(1) The detection of nicotine in ambient air
The problem of nicotine detection in ambient air is of high interest for smoking andeven more for non-smoking people. Due to the high toxicity there is the need toarrive detection limits of 1 - 2 ppb in mixtures of aerosols and other organiccompounds. The gas inlet system and separation columns are heated up to 80°C. Asshown in fig. 2 the nicotine has a monomer peak at 10,44 ms and a dimere peak at15,20 ms. There is a good chance to see the trace concentration. Analysing asmokers breath air there is a mixture of formaldehyde, alcohol's and othercompounds of large concentrations, which cover the nicotine Peaks. GC IMS is avery good tool to overcome this situation and separate the nicotine.
0,15
0,10
0,05
•*h**tr>*
•RIP
• Nikotin
nrDnorrer60 ppb
dmer
" ^ " • " " ^j _ j _
0,006 0,008 0,010 0,012 0,014
Us]0,016 0,018 0,020
Fig. 2: Detection of nicotine by GC-IMS
(2) The detection of halogenated hydrocarbons
The analysis of these compounds uses the formation of negative ions. One examplecarried out by means of IMS is the trace termination of co-Chloracetophenon(teargas) down to 0,5 ppb or 2,5 ug/m3.
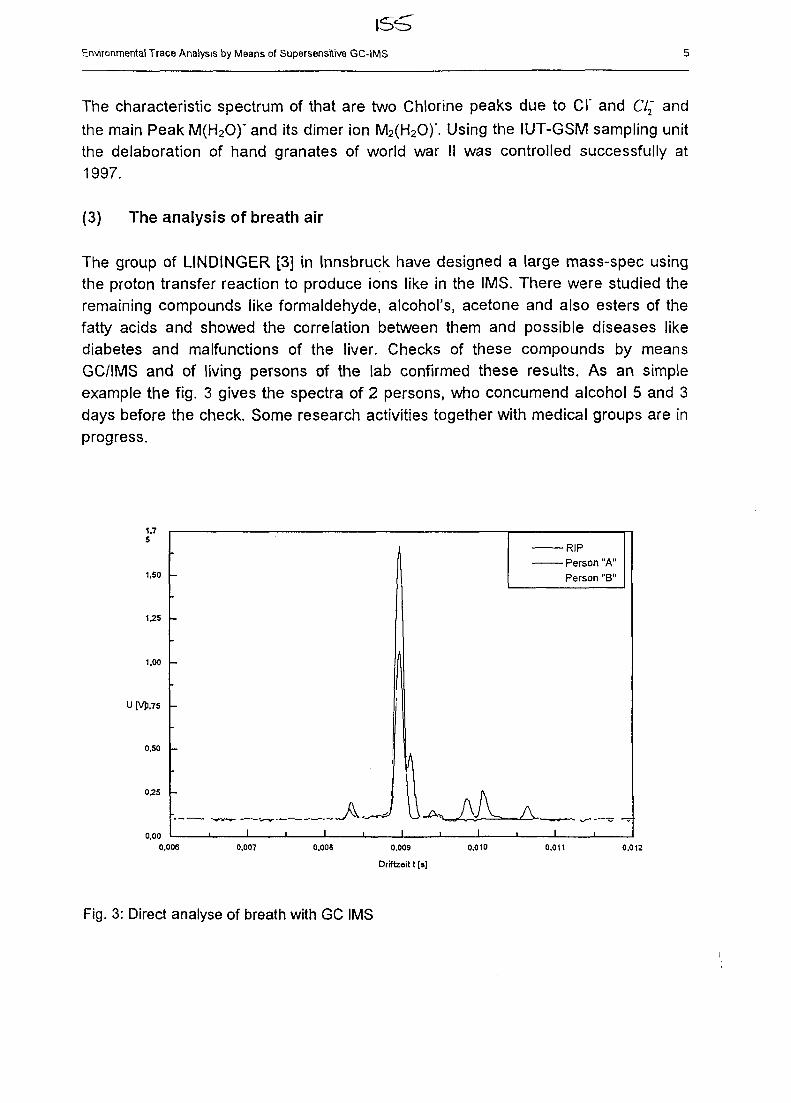
Environmental Trace Analysis by Means of Supersensitive GC-IMS
The characteristic spectrum of that are two Chlorine peaks due to CI' and C/2" andthe main Peak M(H2O)" and its dimer ion M2(H2O)\ Using the IUT-GSM sampling unitthe delaboration of hand granates of world war II was controlled successfully at1997.
(3) The analysis of breath air
The group of LINDINGER [3] in Innsbruck have designed a large mass-spec usingthe proton transfer reaction to produce ions like in the IMS. There were studied theremaining compounds like formaldehyde, alcohol's, acetone and also esters of thefatty acids and showed the correlation between them and possible diseases likediabetes and malfunctions of the liver. Checks of these compounds by meansGC/IMS and of living persons of the lab confirmed these results. As an simpleexample the fig. 3 gives the spectra of 2 persons, who concumend alcohol 5 and 3days before the check. Some research activities together with medical groups are inprogress.
1.75
1,50 -
1.25 -
1,00 -
U [V]).75 -
0.S0 -
0,25 -
0,00
-
1 1 1 1 1
1 RIPPerson "A"Person "B"
1 1 1 1 1 1
0,006 0.007 0.008 0,009
Driftzeit t [s]
0,010 0,011 0.012
Fig. 3: Direct analyse of breath with GC IMS
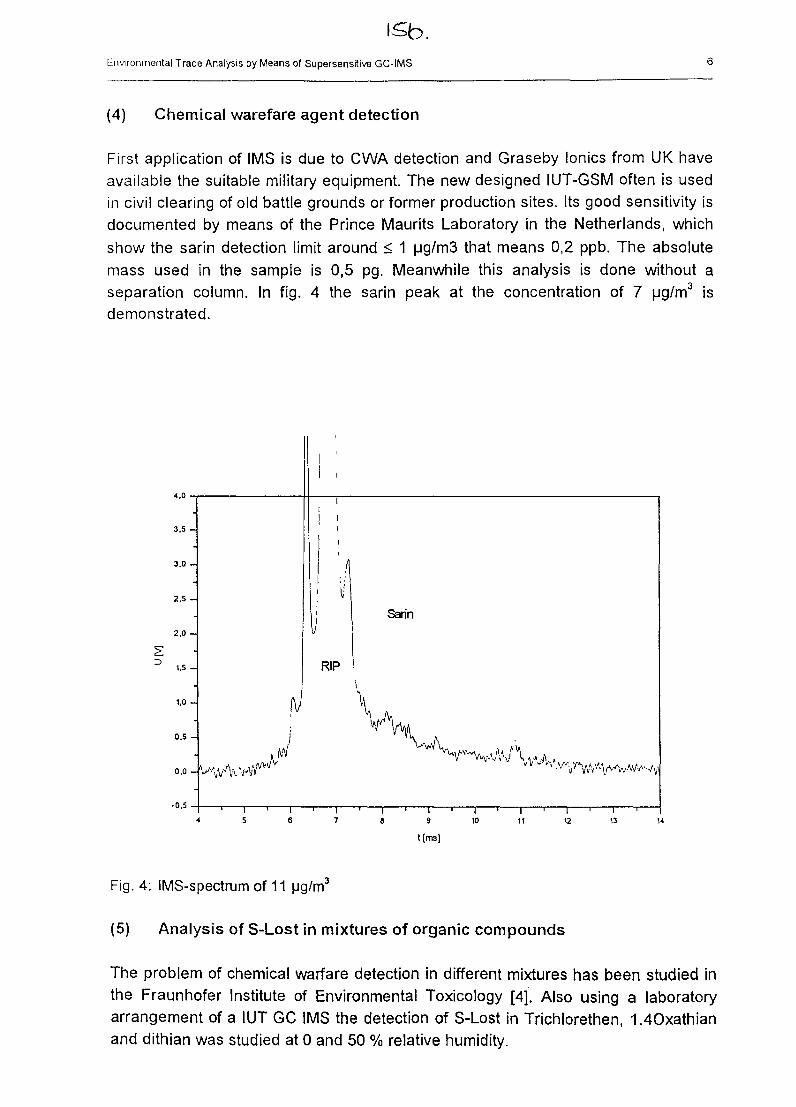
Environmental Trace Analysis by Means of Supersensitive GC-IMS
(4) Chemical warefare agent detection
First application of IMS is due to CWA detection and Graseby Ionics from UK haveavailable the suitable military equipment. The new designed lUT-GSM often is usedin civil clearing of old battle grounds or former production sites. Its good sensitivity isdocumented by means of the Prince Maurits Laboratory in the Netherlands, whichshow the sarin detection limit around < 1 ug/m3 that means 0,2 ppb. The absolutemass used in the sample is 0,5 pg. Meanwhile this analysis is done without aseparation column. In fig. 4 the sarin peak at the concentration of 7 ug/m3 isdemonstrated.
3.5 -
3,0 -
2.5 -
2.0 -
1.5 -
1,0 -
0.5 -
0,0 -
-0 5' 1
1 5
IVj
1 16
1
1
i
i
ii
i
i!
uRIP
Sarin
i7 8 9
1 i10
• i11 12
1 '13 1
t Cms]
Fig. 4: IMS-spectrum of 11 ug/m3
(5) Analysis of S-Lost in mixtures of organic compounds
The problem of chemical warfare detection in different mixtures has been studied inthe Fraunhofer Institute of Environmental Toxicology [4]. Also using a laboratoryarrangement of a IUT GC IMS the detection of S-Lost in Trichlorethen, 1.4Oxathianand dithian was studied at 0 and 50 % relative humidity.
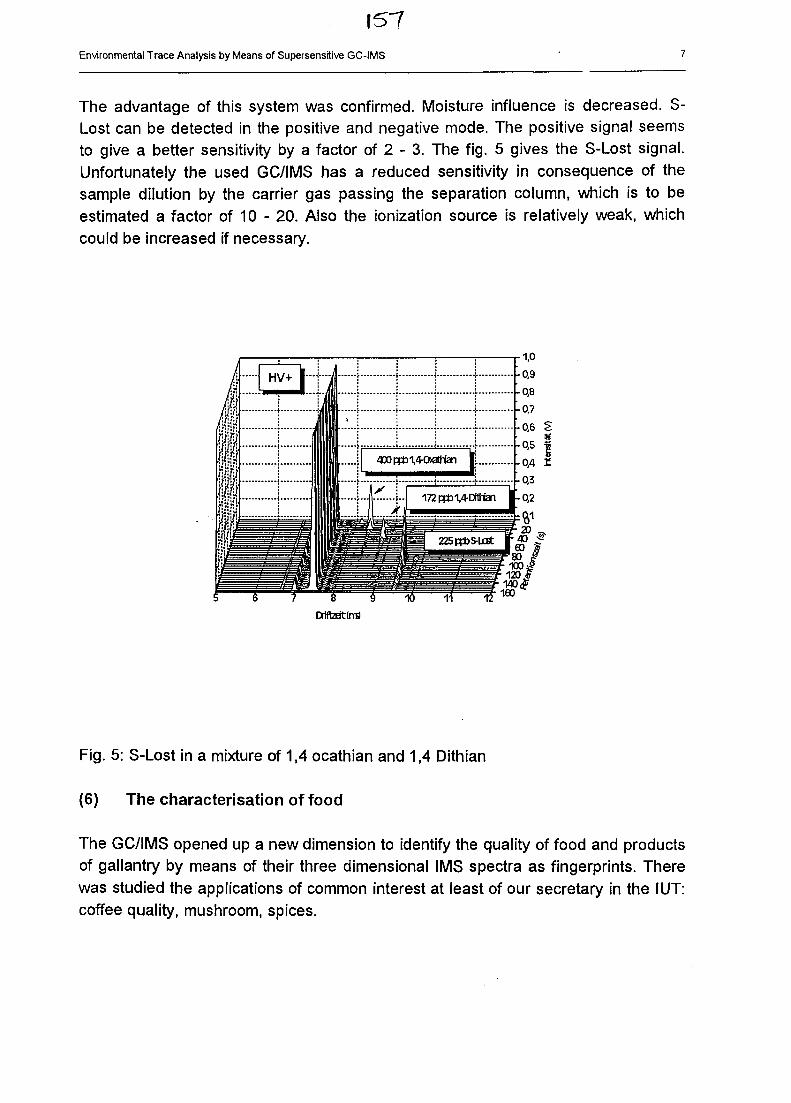
(57Environmental Trace Analysis by Means of Supersensitive GC-IMS
The advantage of this system was confirmed. Moisture influence is decreased. S-Lost can be detected in the positive and negative mode. The positive signal seemsto give a better sensitivity by a factor of 2 - 3. The fig. 5 gives the S-Lost signal.Unfortunately the used GC/IMS has a reduced sensitivity in consequence of thesample dilution by the carrier gas passing the separation column, which is to beestimated a factor of 10 - 20. Also the ionization source is relatively weak, whichcould be increased if necessary.
Crtftzatltrfi
Fig. 5: S-Lost in a mixture of 1,4 ocathian and 1,4 Dithian
(6) The characterisation of food
The GC/IMS opened up a new dimension to identify the quality of food and productsof gallantry by means of their three dimensional IMS spectra as fingerprints. Therewas studied the applications of common interest at least of our secretary in the IUT:coffee quality, mushroom, spices.
Environmental Trace Analysis by Means of Supersensitive GC-IMS
(7) Explosive detection
Many questions we had due to the sniffling techniques for fast explosive identificalmonitoring. Not only the costumes control and airport security are interested - mainlypeople from the pioneers and similar service is concerned to find landmines nothaving any metal. By the way we did some studies by labelled compounds todetermine the TNT vapour pressure about a personal land mine covered by some 5cm of earth. The was to find them directly besides dogs noses, which may besensitive enough to sense some thousand molecules. We think that one other way isthe application of neutron gauges, which we developed successfully [5].
The best result we had was to sense a little bit from the TNT from a German missileV2, which was deiaborated by our help [6].
CONCLUSIONS
The IMS application in Analytical Chemistry is slowly growing. IMS does completeother analytical techniques in industry and in the consumption sphere. The largepotential of IMS is not really touched yet. But IMS is the best portabel analyticalinstrument today, which provide us with specific analytical information aboutchemical compounds in ambient air, which concentrations are in the range ofmicrogram/m3. In table I relative drift times and minimal detectable concentrationsare listed for selected organic compounds.
References
[1] J.W. Leonhardt, W. Rohrbeck, H. Bensch: A High Resolution IMS ForEnvironmental Studies, Proc. Int. Spec. Workshop, August 95, Cambridge[2] DP[3] Lindinger[4] H. Sohn, J. Steinhansens: Internal Report on Huse of the IMS forWorkersprotection, IUCT, Mai 1997[5] W.Katzung, G. Harfst: ECSTASY Informationsschrift WIRD, Verlag DeutschePolizeiliteratur GmbH, 2. Aufl. 1994[6] J.W. Leonhardt: Landmine By Means of Gas Sensors, Proc.lnt.Conf. RRAI 1996,Berlin, in preparation
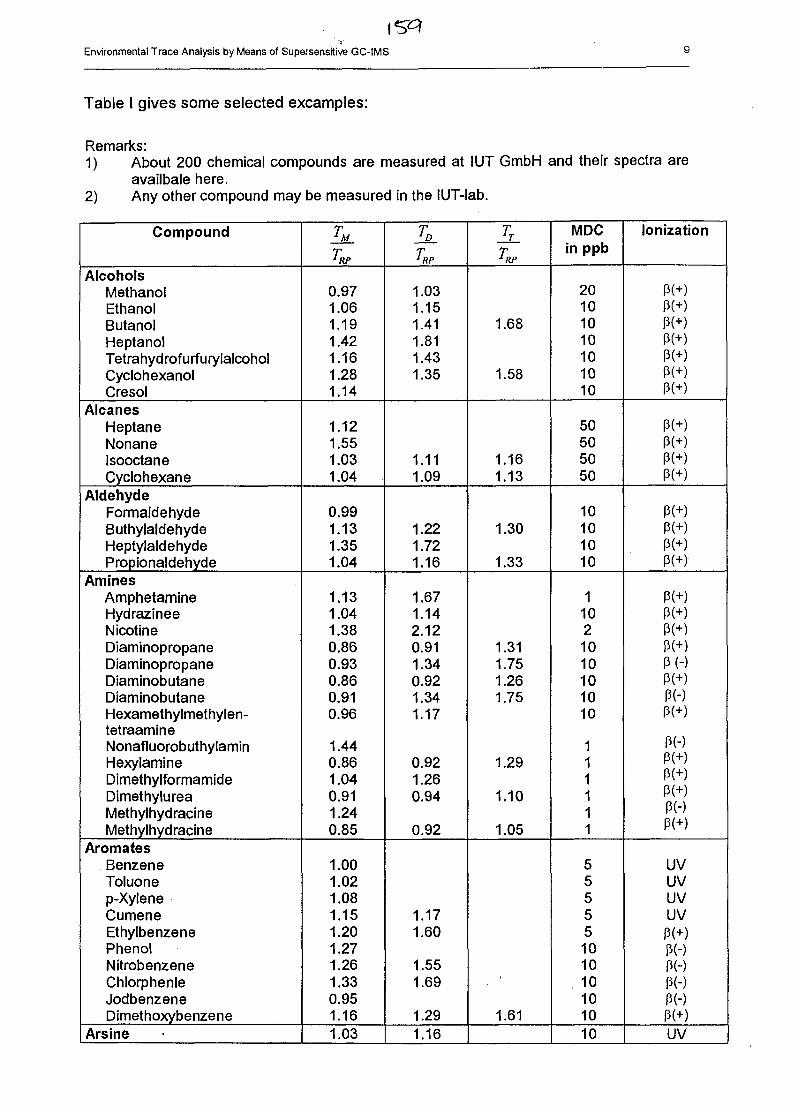
Environmental Trace Analysis by Means of Supersensitive GC-IMS
Table I gives some selected excamples:
Remarks:1) About 200 chemical compounds are measured at IUT GmbH and their spectra are
availbale here.2) Any other compound may be measured in the lUT-lab.
Compound
AlcoholsMethanolEthanolButanolHeptanolTetrahydrofurfurylalcoholCyclohexanolCresol
AlcanesHeptaneNonaneIsooctaneCyclohexane
AldehydeFormaldehydeButhylaldehydeHeptylaldehydePropionaldehyde
AminesAmphetamineHydrazineeNicotineDiaminopropaneDiaminopropaneDiaminobutaneDiaminobutaneHexamethylmethylen-tetraamineNonafluorobuthylaminHexylamineDimethylformamideDimethylureaMethylhydracineMethylhydracine
AromatesBenzeneToluonep-XyleneCumeneEthylbenzenePhenolNitrobenzeneChlorphenleJodbenzeneDimethoxybenzene
Arsine
T
TiRP
0.971.061.191.421.161.281.14
1.121.551.031.04
0.991.131.351.04
1.131.041.380.860.930.860.910.96
1.440.861.040.911.240.85
1.001.021.081.151.201.271.261.330.951.161.03
TlDT
1.031.151.411.811.431.35
1.111.09
1.221.721.16
1.671.142.120.911.340.921.341.17
0.921.260.94
0.92
1.171.60
1.551.69
1.291.16
TT
T
1.68
1.58
1.161.13
1.30
1.33
1.311.751.261.75
1.29
1.10
1.05
1.61
MDCin ppb
20101010101010
50505050
10101010
11021010101010
111111
55555101010101010
lonization
P(+)P(+)P(+)P(+)P(+)P(+)P(+)
P(+)P(+)P(+)P(+)
P(+)P(+)P(+)P(+)
P(+)P(+)P(+)P(+)P(-)P(+)P(-)P(+)
P(-)P(+)P(+)P<+)P(-)P(+)
UVUVuvuvp(+)p(-)P(-)P(-)P(-)p(+)
uv
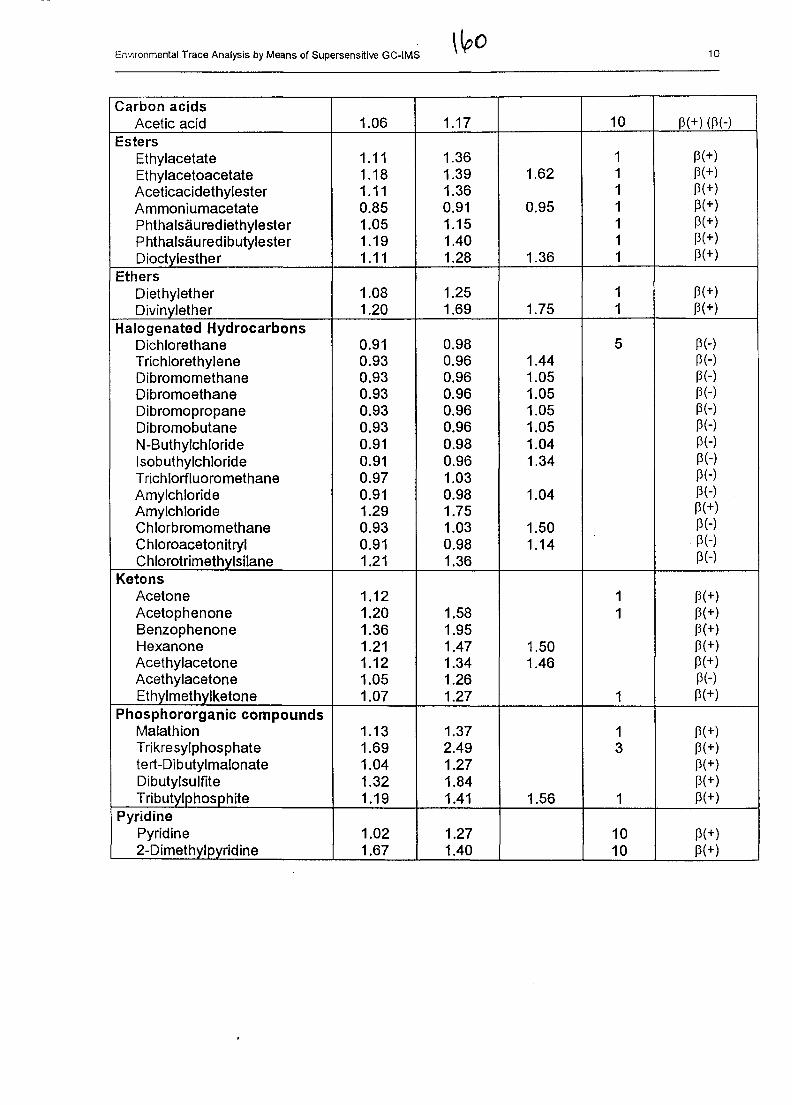
Environmental Trace Analysis by Means of Supersensitive GC-IMS 10
Carbon acidsAcetic acid
EstersEthylacetateEthylacetoacetateAceticacidethylesterAmmoniumacetatePhthalsaurediethylesterPhthalsauredibutylesterDioctylesther
EthersDiethyletherDivinylether
Halogenated HydrocarbonsDichlorethaneTrichlorethyleneDibromomethaneDibromoethaneDibromopropaneDibromobutaneN-ButhylchlorideIsobuthylchlorideTrichlorfluoromethaneAmylchlorideAmylchlorideChlorbromomethaneChloroacetonitrylChlorotrimethylsilane
KetonsAcetoneAcetophenoneBenzophenoneHexanoneAcethylacetoneAcethylacetoneEthylmethylketone
Phosphororganic compoundsMalathionTrikresylphosphatetert-DibutylmalonateDibutylsulfiteTributylphosphite
PyridinePyridine2-Dimethylpyridine
1.06
1.111.181.110.851.051.191.11
1.081.20
0.910.930.930.930.930.930.910.910.970.911.290.930.911.21
1.121.201.361.211.121.051.07
1.131.691.041.321.19
1.021.67
1.17
1.361.391.360.911.151.401.28
1.251.69
0.980.960.960.960.960.960.980.961.030.981.751.030.981.36
1.581.951.471.341.261.27
1.372.491.271.841.41
1.271.40
1.62
0.95
1.36
1.75
1.441.051.051.051.051.041.34
1.04
1.501.14
1.501.46
1.56
10
1111111
11
5
11
1
13
1
1010
P(+) (P(-)
P(+)P(+)P(+)P(+)P(+)P(+)P(+)
P(+)P(+)
P(-)P(-)P(-)P(-)P(-)P(-)P(-)P(-)P(-)P(-)P(+)P(-)P(-)P(-)
P(+)P(+)P(+)P(+)P(+)P(-)P(+)
P(+)P(+)P(+)P(+)P(+)
P(+)P(+)
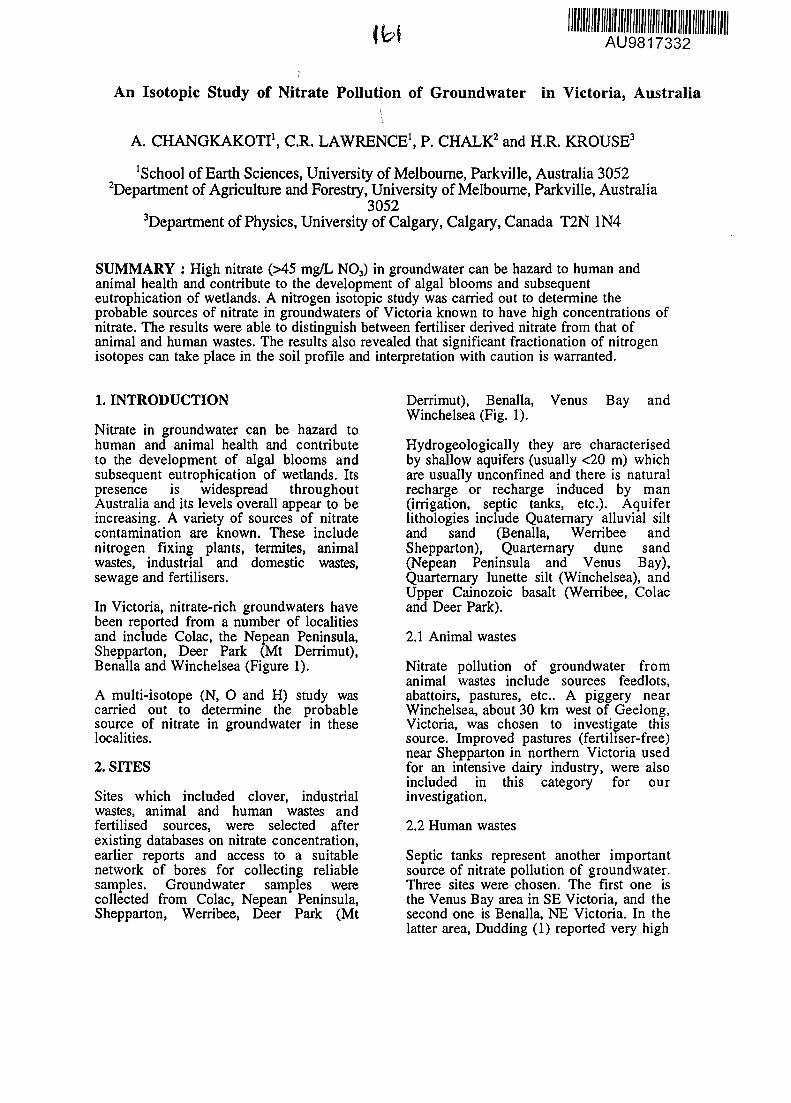
AU9817332
An Isotopic Study of Nitrate Pollution of Groundwater in Victoria, Australia\
A. CHANGKAKOTI1, C.R. LAWRENCE1, P. CHALK2 and H.R. KROUSE3
'School of Earth Sciences, University of Melbourne, Parkville, Australia 3052department of Agriculture and Forestry, University of Melbourne, Parkville, Australia
3052department of Physics, University of Calgary, Calgary, Canada T2N 1N4
SUMMARY : High nitrate (>45 mg/L NO3) in groundwater can be hazard to human andanimal health and contribute to the development of algal blooms and subsequenteutrophication of wetlands. A nitrogen isotopic study was carried out to determine theprobable sources of nitrate in groundwaters of Victoria known to have high concentrations ofnitrate. The results were able to distinguish between fertiliser derived nitrate from that ofanimal and human wastes. The results also revealed that significant fractionation of nitrogenisotopes can take place in the soil profile and interpretation with caution is warranted.
1. INTRODUCTION
Nitrate in groundwater can be hazard tohuman and animal health and contributeto the development of algal blooms andsubsequent eutrophication of wetlands. Itspresence is widespread throughoutAustralia and its levels overall appear to beincreasing. A variety of sources of nitratecontamination are known. These includenitrogen fixing plants, termites, animalwastes, industrial and domestic wastes,sewage and fertilisers.
In Victoria, nitrate-rich groundwaters havebeen reported from a number of localitiesand include Colac, the Nepean Peninsula,Shepparton, Deer Park (Mt Derrimut),Benalla and Winchelsea (Figure 1).
A multi-isotope (N, O and H) study wascarried out to determine the probablesource of nitrate in groundwater in theselocalities.
2. SITES
Sites which included clover, industrialwastes, animal and human wastes andfertilised sources, were selected afterexisting databases on nitrate concentration,earlier reports and access to a suitablenetwork of bores for collecting reliablesamples. Groundwater samples werecollected from Colac, Nepean Peninsula,Shepparton, Werribee, Deer Park (Mt
Derrimut), Benalla, Venus Bay andWinchelsea (Fig. 1).
Hydrogeologically they are characterisedby shallow aquifers (usually <20 m) whichare usually unconfined and there is naturalrecharge or recharge induced by man(irrigation, septic tanks, etc.). Aquiferlithologies include Quaternary alluvial siltand sand (Benalla, Werribee andShepparton), Quarternary dune sand(Nepean Peninsula and Venus Bay),Quarternary lunette silt (Winchelsea), andUpper Cainozoic basalt (Werribee, Colacand Deer Park).
2.1 Animal wastes
Nitrate pollution of groundwater fromanimal wastes include sources feedlots,abattoirs, pastures, etc.. A piggery nearWinchelsea, about 30 km west of Geelong,Victoria, was chosen to investigate thissource. Improved pastures (fertiliser-free)near Shepparton in northern Victoria usedfor an intensive dairy industry, were alsoincluded in this category for ourinvestigation.
2.2 Human wastes
Septic tanks represent another importantsource of nitrate pollution of groundwater.Three sites were chosen. The first one isthe Venus Bay area in SE Victoria, and thesecond one is Benalla, NE Victoria. In thelatter area, Dudding (1) reported very high
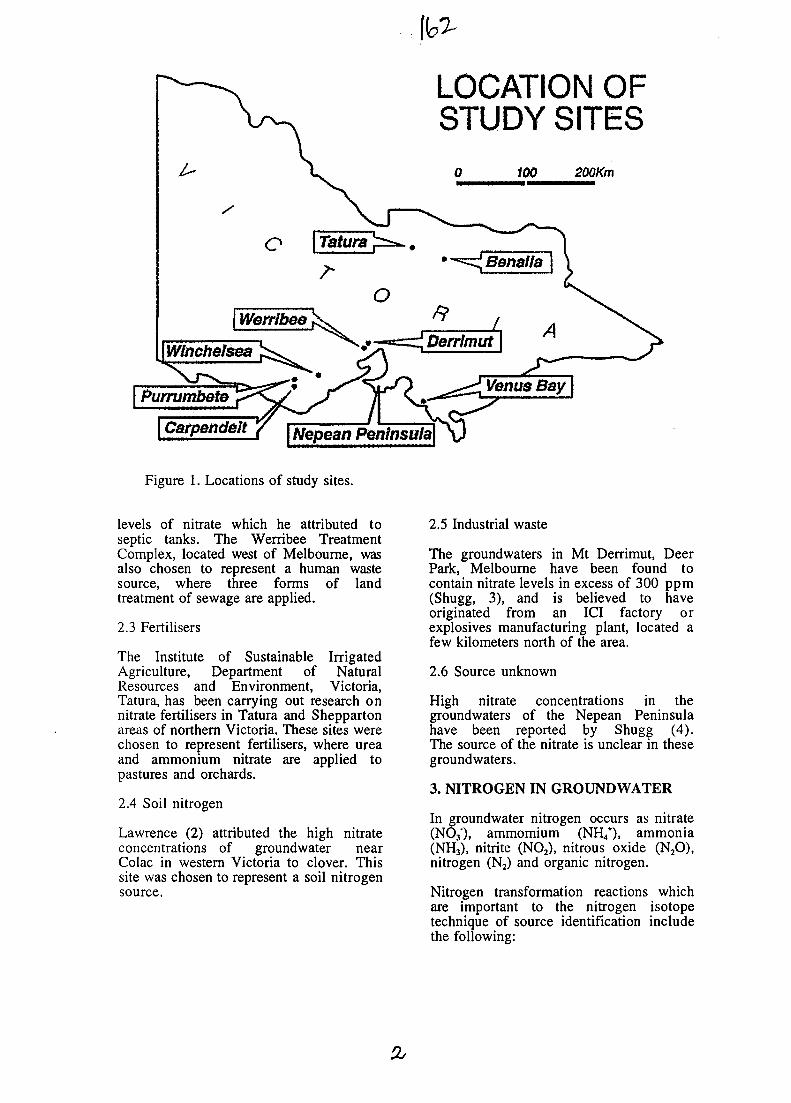
LOCATION OFSTUDY SITES
100 200Km
Carpendeit / \Nepean Peninsula\
Figure 1. Locations of study sites.
levels of nitrate which he attributed toseptic tanks. The Werribee TreatmentComplex, located west of Melbourne, wasalso chosen to represent a human wastesource, where three forms of landtreatment of sewage are applied.
2.3 Fertilisers
The Institute of Sustainable IrrigatedAgriculture, Department of NaturalResources and Environment, Victoria,Tatura, has been carrying out research onnitrate fertilisers in Tatura and Sheppartonareas of northern Victoria. These sites werechosen to represent fertilisers, where ureaand ammonium nitrate are applied topastures and orchards.
2.4 Soil nitrogen
Lawrence (2) attributed the high nitrateconcentrations of groundwater nearColac in western Victoria to clover. Thissite was chosen to represent a soil nitrogensource.
2.5 Industrial waste
The groundwaters in Mt Derrimut, DeerPark, Melbourne have been found tocontain nitrate levels in excess of 300 ppm(Shugg, 3), and is believed to haveoriginated from an ICI factory orexplosives manufacturing plant, located afew kilometers north of the area.
2.6 Source unknown
High nitrate concentrations in thegroundwaters of the Nepean Peninsulahave been reported by Shugg (4).The source of the nitrate is unclear in thesegroundwaters.
3. NITROGEN IN GROUNDWATER
In groundwater nitrogen occurs as nitrate(NO3), ammomium (NH/)> ammonia(NH3), nitrite (NO2), nitrous oxide (N2O),nitrogen (N2) and organic nitrogen.
Nitrogen transformation reactions whichare important to the nitrogen isotopetechnique of source identification includethe following:
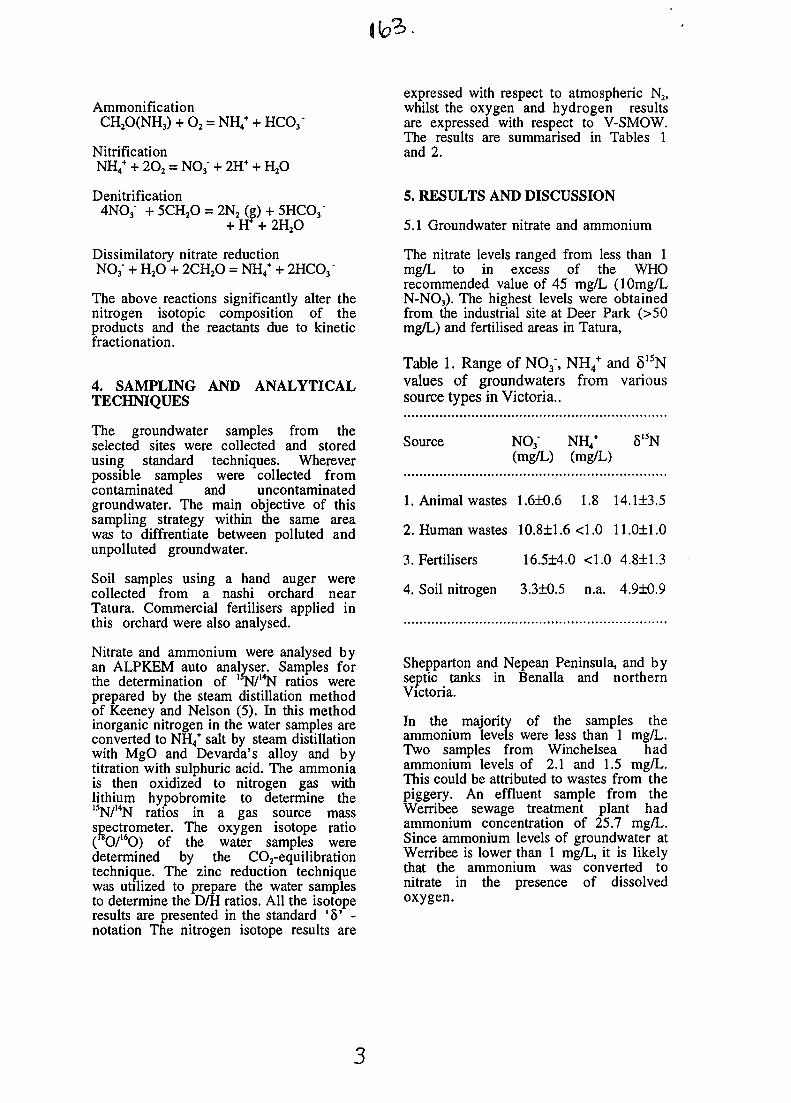
AmmonificationCH2O(NH3) + O2 = NH4
+ + HCCV
NitrificationNH4
+ + 2O2 = NO3- + 2H+ + H2O
Denitrification4NO3- + 5CH2O = 2N2 (g) + 5HCO3"
+ W + 2H2O
Dissimilatory nitrate reductionNO3- + H2O + 2CH2O = NH4
+ + 2HCO3"
The above reactions significantly alter thenitrogen isotopic composition of theproducts and the reactants due to kineticfractionation.
4. SAMPLING AND ANALYTICALTECHNIQUES
The groundwater samples from theselected sites were collected and storedusing standard techniques. Whereverpossible samples were collected fromcontaminated and uncontaminatedgroundwater. The main objective of thissampling strategy within die same areawas to diffrentiate between polluted andunpolluted groundwater.
Soil samples using a hand auger werecollected from a nashi orchard nearTatura. Commercial fertilisers applied inthis orchard were also analysed.
Nitrate and ammonium were analysed byan ALPKEM auto analyser. Samples forthe determination of ' N/14N ratios wereprepared by the steam distillation methodof Keeney and Nelson (5). In this methodinorganic nitrogen in the water samples areconverted to NH4
+ salt by steam distillationwith MgO and Devarda's alloy and bytitration with sulphuric acid. The ammoniais then oxidized to nitrogen gas withlithium hypobromite to determine the15N/MN ratios in a gas source massspectrometer. The oxygen isotope ratio( O/I6O) of the water samples weredetermined by the C02-equilibrationtechnique. The zinc reduction techniquewas utilized to prepare the water samplesto determine the D/H ratios. All the isotoperesults are presented in the standard ' 8 ' -notation The nitrogen isotope results are
expressed with respect to atmospheric N2,whilst the oxygen and hydrogen resultsare expressed with respect to V-SMOW.The results are summarised in Tables 1and 2.
5. RESULTS AND DISCUSSION
5.1 Groundwater nitrate and ammonium
The nitrate levels ranged from less than 1mg/L to in excess of the WHOrecommended value of 45 mg/L (lOmg/LN-NO3). The highest levels were obtainedfrom the industrial site at Deer Park (>50mg/L) and fertilised areas in Tatura,
Table 1. Range of NO;, NH4+ and 515N
values of groundwaters from varioussource types in Victoria..
Source NO/ NH4+ 81SN
(mg/L) (mg/L)
1. Animal wastes 1.6±0.6 1.8 14.1±3.5
2. Human wastes 10.8±1.6 <1.0 11.0+1.0
3. Fertilisers 16.5±4.0 <1.0 4.8+1.3
4. Soil nitrogen 3.3±0.5 n.a. 4.9±0.9
Shepparton and Nepean Peninsula, and byseptic tanks in Benalla and northernVictoria.
In the majority of the samples theammonium levels were less than 1 mg/L.Two samples from Winchelsea hadammonium levels of 2.1 and 1.5 mg/L.This could be attributed to wastes from thepiggery. An effluent sample from theWerribee sewage treatment plant hadammonium concentration of 25.7 mg/L.Since ammonium levels of groundwater atWerribee is lower than 1 mg/L, it is likelythat the ammonium was converted tonitrate in the presence of dissolvedoxygen.
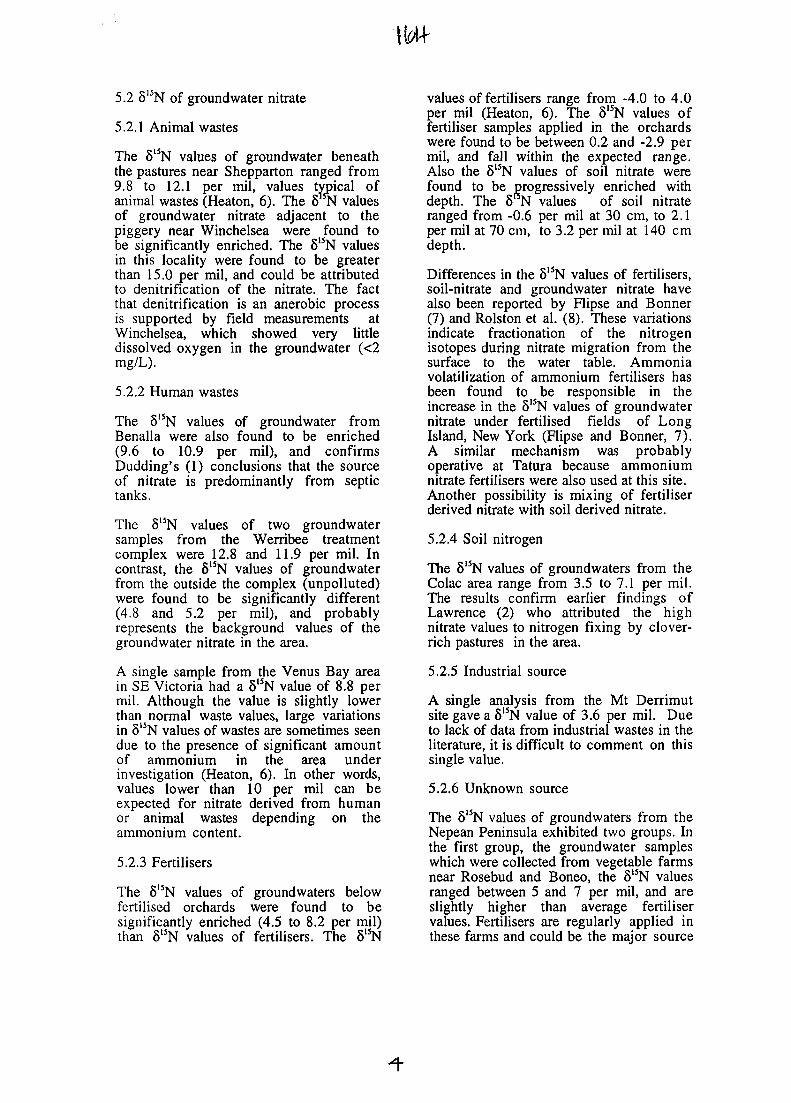
5.2 8'5N of groundwater nitrate
5.2.1 Animal wastes
The 8l5N values of groundwater beneaththe pastures near Shepparton ranged from9.8 to 12.1 per mil, values typical ofanimal wastes (Heaton, 6). The 8 *N valuesof groundwater nitrate adjacent to thepiggery near Winchelsea were found tobe significantly enriched. The 8'5N valuesin this locality were found to be greaterthan 15.0 per mil, and could be attributedto denitrification of the nitrate. The factthat denitrification is an anerobic processis supported by field measurements atWinchelsea, which showed very littledissolved oxygen in the groundwater (<2mg/L).
5.2.2 Human wastes
The 8I5N values of groundwater fromBenalla were also found to be enriched(9.6 to 10.9 per mil), and confirmsDudding's (1) conclusions that the sourceof nitrate is predominantly from septictanks.
The 815N values of two groundwatersamples from the Werribee treatmentcomplex were 12.8 and 11.9 per mil. Incontrast, the 815N values of groundwaterfrom the outside the complex (unpolluted)were found to be significantly different(4.8 and 5.2 per mil), and probablyrepresents the background values of thegroundwater nitrate in the area.
A single sample from the Venus Bay areain SE Victoria had a 815N value of 8.8 permil. Although the value is slightly lowerthan normal waste values, large variationsin 815N values of wastes are sometimes seendue to the presence of significant amountof ammonium in the area underinvestigation (Heaton, 6). In other words,values lower than 10 per mil can beexpected for nitrate derived from humanor animal wastes depending on theammonium content.
5.2.3 Fertilisers
The 8I5N values of groundwaters belowfertilised orchards were found to besignificantly enriched (4.5 to 8.2 per mil)than 815N values of fertilisers. The 8l5N
values of fertilisers range from -4.0 to 4.0per mil (Heaton, 6). The S15N values offertiliser samples applied in the orchardswere found to be between 0.2 and -2.9 permil, and fall within the expected range.Also the 815N values of soil nitrate werefound to be progressively enriched withdepth. The 8 N values of soil nitrateranged from -0.6 per mil at 30 cm, to 2.1per mil at 70 cm, to 3.2 per mil at 140 cmdepth.
Differences in the 815N values of fertilisers,soil-nitrate and groundwater nitrate havealso been reported by Flipse and Bonner(7) and Rolston et al. (8). These variationsindicate fractionation of the nitrogenisotopes during nitrate migration from thesurface to the water table. Ammoniavolatilization of ammonium fertilisers hasbeen found to be responsible in theincrease in the 815N values of groundwaternitrate under fertilised fields of LongIsland, New York (Flipse and Bonner, 7).A similar mechanism was probablyoperative at Tatura because ammoniumnitrate fertilisers were also used at this site.Another possibility is mixing of fertiliserderived nitrate with soil derived nitrate.
5.2.4 Soil nitrogen
The 815N values of groundwaters from theColac area range from 3.5 to 7.1 per mil.The results confirm earlier findings ofLawrence (2) who attributed the highnitrate values to nitrogen fixing by clover-rich pastures in the area.
5.2.5 Industrial source
A single analysis from the Mt Derrimutsite gave a 815N value of 3.6 per mil. Dueto lack of data from industrial wastes in theliterature, it is difficult to comment on thissingle value.
5.2.6 Unknown source
The 8I5N values of groundwaters from theNepean Peninsula exhibited two groups. Inthe first group, the groundwater sampleswhich were collected from vegetable farmsnear Rosebud and Boneo, the 815N valuesranged between 5 and 7 per mil, and areslightly higher than average fertiliservalues. Fertilisers are regularly applied inthese farms and could be the major source
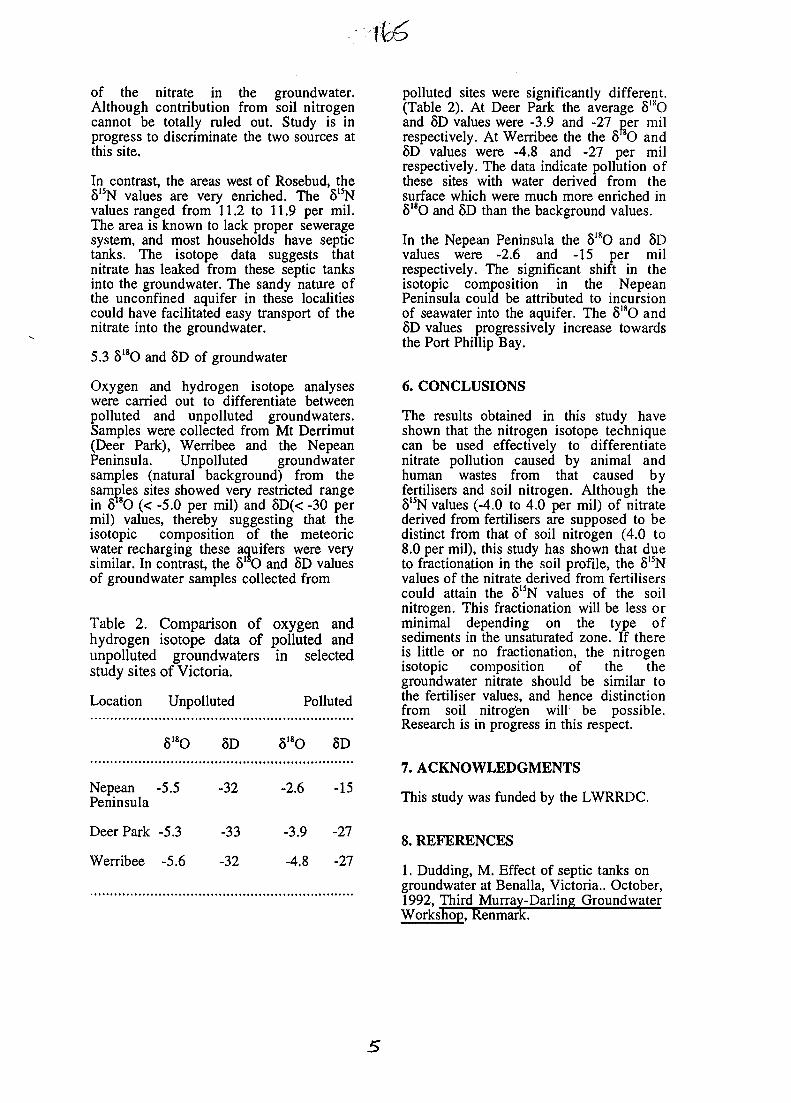
of the nitrate in the groundwater.Although contribution from soil nitrogencannot be totally ruled out. Study is inprogress to discriminate the two sources atthis site.
In contrast, the areas west of Rosebud, the8'5N values are very enriched. The 6l5Nvalues ranged from 11.2 to 11.9 per mil.The area is known to lack proper seweragesystem, and most households have septictanks. The isotope data suggests thatnitrate has leaked from these septic tanksinto the groundwater. The sandy nature ofthe unconfined aquifer in these localitiescould have facilitated easy transport of thenitrate into the groundwater.
5.3 818O and 8D of groundwater
Oxygen and hydrogen isotope analyseswere carried out to differentiate betweenpolluted and unpolluted ground waters.Samples were collected from Mt Derrimut(Deer Park), Werribee and the NepeanPeninsula. Unpolluted groundwatersamples (natural background) from thesamples sites showed very restricted rangein 8™O (< -5.0 per mil) and SD(< -30 permil) values, thereby suggesting that theisotopic composition of the meteoricwater recharging these aquifers were verysimilar. In contrast, the 8 0 and 8D valuesof groundwater samples collected from
Table 2. Comparison of oxygen andhydrogen isotope data of polluted andunpolluted groundwaters in selectedstudy sites of Victoria.
Location Unpolluted Polluted
818O 8D S18O 8D
Nepean -5.5 -32Peninsula
Deer Park -5.3 -33
Werribee -5.6 -32
-2.6 -15
-3.9 -27
-4.8 -27
polluted sites were significantly different.(Table 2). At Deer Park the average 81I(Oand 8D values were -3.9 and -27 per milrespectively. At Werribee the the 8 0 and8D values were -4.8 and -27 per milrespectively. The data indicate pollution ofthese sites with water derived from thesurface which were much more enriched in818O and 8D than the background values.
In the Nepean Peninsula the 818O and 8Dvalues were -2.6 and -15 per milrespectively. The significant shift in theisotopic composition in the NepeanPeninsula could be attributed to incursionof seawater into the aquifer. The S180 and8D values progressively increase towardsthe Port Phillip Bay.
6. CONCLUSIONS
The results obtained in this study haveshown that the nitrogen isotope techniquecan be used effectively to differentiatenitrate pollution caused by animal andhuman wastes from that caused byfertilisers and soil nitrogen. Although the8l5N values (-4.0 to 4.0 per mil) of nitratederived from fertilisers are supposed to bedistinct from that of soil nitrogen (4.0 to8.0 per mil), this study has shown that dueto fractionation in the soil profile, the 815Nvalues of the nitrate derived from fertiliserscould attain the 815N values of the soilnitrogen. This fractionation will be less orminimal depending on the type ofsediments in the unsaturated zone. If thereis little or no fractionation, the nitrogenisotopic composition of the thegroundwater nitrate should be similar tothe fertiliser values, and hence distinctionfrom soil nitrogen will be possible.Research is in progress in this respect.
7. ACKNOWLEDGMENTS
This study was funded by the LWRRDC.
8. REFERENCES
1. Dudding, M. Effect of septic tanks ongroundwater at Benalla, Victoria.. October,1992, Third Murray-Darling GroundwaterWorkshop, RenmarE
2.Lawrence, C.R. Nitrate-richgroundwaters of Australia. 1983. AWRCTechnical Paper , No. 79, llOp.
3. Shugg, A. Data on the nitrate plumesemanating from the vicinity of the ICIdisposal points at Deer Park - MtDerrimut. 1996. Unpub. report,Department of Conservation and NaturalResources, Victoria.
4. Shugg, A. Evaluation of nitratecontamination of groundwater on theNepean Peninsula. 1985. Unpub. report.Department of Mines, Victoria, 20p.
5. Keeney, D.R. and Nelson, D.W.Nitrogen - Inorganic forms. In: Methodsof soil analysis, part 2. Chem. andMicrobio. Properties. 1982. Agro. Mon.,9.
6. Heaton, T.H.E. Isotopic studies ofnitrogen pollution in the hydrosphere andatmosphere. A review. 1986. Chem. Geol.(Iso. Geosci. Sec), 59, 87-102.
7. Flipse, WJ. Jr and Bonner, F.T.Nitrogen isotope ratios of nitrate ingroundwater under fertilised field, LongIsland, New York. 1985. Groundwater, 23,59-67.
8. Rolston, D.E., Fogg, G.E., Decker, D.L.and Louie, D.T. Nitrogen isotope ratios ofnatural and anthropogenic nitrate in thesubsurface. 1994. Water Down Under 94,451-457.
AU9817333
Radioecological Behaviour of Elementary Tritium, especially DryDeposition and its Dependance on Soil Porosity.
HFORSTELForschungszentrum Julich, Radioagronomy (ICG-5), D-52425 Julich, Germany
SUMMARY. Elementary tritium, released by a fusion facility e.g., will quickly be oxidized totritium water directly below the surface in the soil. The turnover can sufficiently described bythe deposition velocity which ranges between 10'5 and 10'3 m s"1. The tritiated water which hasa higher radiotoxocity is then re-emitted from the soil into the adjacent air. The depositionvelocity mainly depends on the soil porosity which is determined by the water content of thesoil.
1. INTRODUCTION
Elementary tritium HT is one of the mainfuels of future fusion technology. Onefusion reactor contains as much tritium asthe whole earth's inventory. HT itself has anegligble radiotoxicity, for organismsmainly consist of water and hydrogen ishardly soluable in water. Plants and animalshave no hydrogenases to oxidise HT totritiated water HTO. But living soilscollected at very different sites, quicklyoxidize HT to tritiated water, Forstel (1).This is important for the HTO is moreradiotoxic than HT and is taken up not onlywith liquids but from the air humidity too.The human lung has a large surface areawhere isotopic exchange takes place. Oncediluted within the total body water iscannot be washed out separately.Otherwise, the HTO formed in the uppersoil layers rapidly exchanges its tritium withthe air water vapour just above the soil,called re-emmission. Fortunately this rapidre-emmission prevents the tritium to beincorporated into the soil biomass, Forstelet al (2) Organic bound tritium OBT isradioecologically the most effective formfor it serves as a direct precursor forbiological synthesis.
Thus, radioecological studies of HT have toconcentrate on the turnover in soils.Fortunately two circumstances havesupported the work. Firstly, the depositionof HT can be described by a simple modelof transport from a well mixed gaseousmedium into a non-moving gas kept withina porous space. To be independent of theHT concentration applied, one uses theconcept of deposition velocity v<j which isjustified by the physical conditionsdescribed above. Simply spoken, thedeposition velocity va can be imaginated asthe velocity at which a column of air ispressed into the soil to contaminate itcompletely from tritium (or othercompounds with their specific va). Theadvantage is also that air and geo-chemistshave made many measurements of v<i.Secondly, the hydrogenase activity tooxidise HT is homogeneously distributedwithin the soil column up to even deeperlayers. Insofar, the turnover is limited bythe diffusion into the soil only and not bythe reaction sites.
The enzymatic activity itself has not yetbeen identified until today. It must be abiological principle as free enzymes ororganisms. But strange enough is the fact
that it works under very low partialpressures, far away from any biochemicalimportance by the order of magnitudes. Acorrelation to nitrogen fixation was oftenproposed but not confirmed by anyexperiment. The hydrogenase activity maybe a geochemical mechanism to keepearth's atmosphere in an oxidised status.
2. METHODS
2.1 TRITIUM HANDLING
One has to use carrierfree tritium only.Diluting the HT by hydrogen results in adecrease of va. Extrapolation to undilutedsamples was not possible for the isotopiceffect between tritium and hydrogenoxidation is not known, but may be distinct.Tritium was supplied in sealed glassampoules and diluted into a glass vesselfilled with nitrogen. HT was transferredthrough a seal by help of a syringe to theexposure circuit.
Tritium was determined by LSC. Theuptake of tritium by the soil from the airphase above was recorded by an ionisationchamber (aluminium housing, nickelelectrode, analog resistance recorder), seeForstel (1). Soil parameters were measuredby conventional techniques (e.g watercontent gravimetrically). The porous spacewas measured by gas dilution appliying thecommon gas law.
2.2 DEPOSITION VELOCITY
The deposition velocity was calculatedfrom the decrease curve of tritium in acircuit in contact with the soil surface. Thegas was circulated by a pump. Leaving theheadspace above soil, the water was frozenout completely to separate HTO. Then theair was fed into the ionisation chamberwhich properly functionates in dry air only.Then the air was humidified again by awater trap kept at the same temperature as
the soil sample to prevent the soil surfacefrom drying out.2.3 SOH. SAMPLES
Soil was collected directly in the field bypressing steel cylinders into the soil anddigging them out thereafter. Wet soil couldeasily be penetrated, but dry soil neededsome mechanical force to cut in. But soil isnot sensititive to this mechanical treatment.The most soil samples were collected atsites where descriptions from other test areavailable. Thus, the annual cycle wasfollowed at our observation site near Jiilichat Merzenhausen where a deep loess soil iscultivated since generations.
2.4 RELEASE EXPERIMENTS
To verify the laboratory results two testsunder natural conditions were done. InFrance at Bruyere-le-Chatel HT wasreleased from a stack of 40 m heightresulting in a Gaussian distribution plumeacross an area of some km downwind (256TBq, air temperature 14°, relative humidity60 - 70 %, wind speed 2-3 m s", point oftracer maximum: at 800 m distance). InChalk River / Canada the consideration ofmechanisms was favored, thus releasing thegas from 1 m hight under well definedconditions onto a sandy forest cut.
3. RESULTS
3.1 STUDIES OF THE MECHANISMS
3.1.1 HT OXIDATION BY ABIOLOGICAL PRINCIPLE
To demonstrate the mechanism of HTuptake Vd of soils was observed increasingtemperature from 0° up to 60° C. Up to40° C a reversible change of temperatureback to cooler conditions was possible, butincreasing the temperature the loss ofoxidation activity was irreversible and lostcompletely at about 50 - 55 ° C. Above thatthreshould no activity of oxidizing HT wasrecorded yet, and could be reactivated. This
is a strong argument for a biological natureof the oxidizing reagent. Chemicals wouldnot show such a distinct irreversible cut-off. Additionally, after ,,sterilisation" soilcould not be incubated easily. We neversucceeded to reactivate soil neither bydirect contact with fertile soil (not mixing)nor by irrigating with water extractionsfrom living soils.
3.1.2 ANNUAL CYCLE
In practice one has to take into account theannual variation (cycle) of Va. Thedeposition velocities ranges between about10'3 m s'1 at maximun and 10'5 m s"1 atminimum, while a soil covered by snow orfrozen shows no activity at all. A highcontent of organic material in the soilfavours the deposition, may-be bystimulating the biological activity or byloosing the soil and opening a sufficientlylarge porous space. According to thisobservation the forest floor and acontineously used meadow (pasture) showno (forest floor) or only a limited(meadow) annual fluctuation. Only thearable (field) soil shows a distinct variationwhich large deposition velocities duringsummer months and very low duringwinter. The annual cycles of meadow andfield are summarized in Figure 1.Corresponding to that result the watercontent of the soil shows an inverse course.During the winter at Central Europe(November - march) because of the amountof precipitation and the low evapotrans-piration rate the soil water contentincreases, and consequently only a small vjis measured. In summer (June - September)the upper layers of the soil dry out andoffer a large porous space for diffusion.
At a first glance one may contribute thisresult to a temperature dependence of thebiological activity, but this has beenommited before. Therefore, one has toconsider the diffusion modell. The adjacentair layer above the soil is mixed well
enough to be not the limiting step of HTsupply. The soil surface is a well-definedphase boundary. The concentration of HTat this boundary is known. Downwards thesoil is a sink, where the air is not moved,but supplied with the reaction gas bydiffusion only. If only diffusion is thelimiting step, one would expect a very smalleffect of the temperature.This is in goodagreement with the results that temperaturehas nearly no influence on va. But the spaceavailable for diffusion should be the limitingstep. Cutting the soil into pieces of about 1cm height, one will find the same oxidationcapacity within the whole soil column ofthe upper soil layers. That means, that thereaction sites are evenly distributed withinthe soil column, and do not limit theoxidation.
If the water content of a soil increases, itsporous spaces is consequently reduced inthe same way. Consequently va isnegatively correlated with the watercontent (see Figure 2). At about half of thesoil water content under saturationconditions vj diminishes completely. Thismay be due to a closure of the porousspace by water lenses between the singleparticles. Water layers are a very highresistance for a passive transport bydiffusion, for the gas-fluid eqilibrium ateach boundary is a very limiting step.Additionally the solubility of hydrogen(HT) in water is very low. This observationholds not only for the loess type soil ofJulich-Merzenhausen which was choosenfor most of the studies, but for all other soiltypes too, expect perhaps for soils very richin organic material. The soil studied for theannual cycle contained about 1 % C, a lowbut for arable land characteristic value.
The hydrogenase activity is distributedevenly in the loess soil column down to 4m. Nevertheless HT from air is convertedvery quickly even in the first centimeters.Assuming an exponential decrease oftritium activity from the soil surface
downwards, one may define a depth untilthat half of the HT is oxidized. Usually onedetermines half of the activity within thefirst and second centimeter below the soilsurface. Only at very dry conditions thesurface layer should have a diminishedtritium turnover, but is replaced by thefollowing centimeters.
3.1.3 RE-EMMISSION OF TRITIATEDWATER
Because of the distribution of the reactionproduct HTO close to the soil surface there-emmission is very effective, Forstel et al.(3). If one exposes soil samples to HAT,one produces a certain amount of HTO.Exposing the soil discs afterwards totritium-free air, the tritium contentdecreases contineously. Under open airconditions ( so-called ,,marvellousweather") the HTO activity dimishes, butremains constant during night. It is assumedthat the calm and/or the dew block the re-emmission at night. Otherwise exposingHTO-containing soils in a box withcontrolled conditions, i.e. streaming air andventillation by fans, the re-emmission wasvery effective too, even in a closed boxwith water at the bottom and 100 %relative humidity in the air above thesamples. This demonstrates the role ofisotopic exchange for HTO between thefluid and the gaseous phase above, andshould be kept in mind for the interpre-tation of the release experiments.
Under natural conditions at the Canadiansite, assuming an exponential decrease ofthe HTO in the soil sample, re-emmissionof about 2 - 6 (forest soil) % h'1 of theinitial activity has been observed. The re-emmission is the most critical step of theradioecological behaviour of tritium afterits release from the handling site. Itsquantification is not as easy as for v<j, forthe supply of HTO from the soil to theadjacent air depends on the distribution ofHTO in the soil layers
3.2 RELEASE EXPERIMENTS
3.2.1 FRENCH RELEASEEXPERIMENT
The advantage of the French releaseexperiment was the large number ofdifferent groups joining it. It was supportedby EU radioprotection programme. Thedisadvantage was that the orientation of theobservation area corresponded to the maindirection of precipitation, in this case SW,off from the stack. Additionaly the zerolevel of tritium at the observation site washigh enough to interfere with the experi-ment. It was one aim of the experiment todetect the limit of the HT/HTO turnover inthe air itself and in the detection devices.For water is simply frozen out to countHTO, and therefore the limit of differen-tiate HT from HTO is in the range of 10"4, avery low background of HTO is expected.
Vd was measured for soil samples taken inthe field at Julich before release and afterrelease, stored for some days while trans-porting them to Julich, Forstel et al. (4).That means, samples of known va wereexposed to the plume close to thetheoretical maximum point of exposure.The HT concentation was known from theresults of several other groups. Both sets ofdata and of re-emmission rates agree verywell (Table 1). The vd data were obtained aswell as with our laboratory system asduring the HT release, storage of soilssamples up to more than one year did notalter their va, preventing them from waterloss.
3.2.2 CANADIAN RELEASEEXPERIMENT
As in France it has been observed that thedistribution pattern of the reaction productHTO follewed very closely the modeldescription of the Gaussian plume.Scatterings of the air turbulence arelevelled off. Beside a confirmation of theconcepts of distribution in the air, of
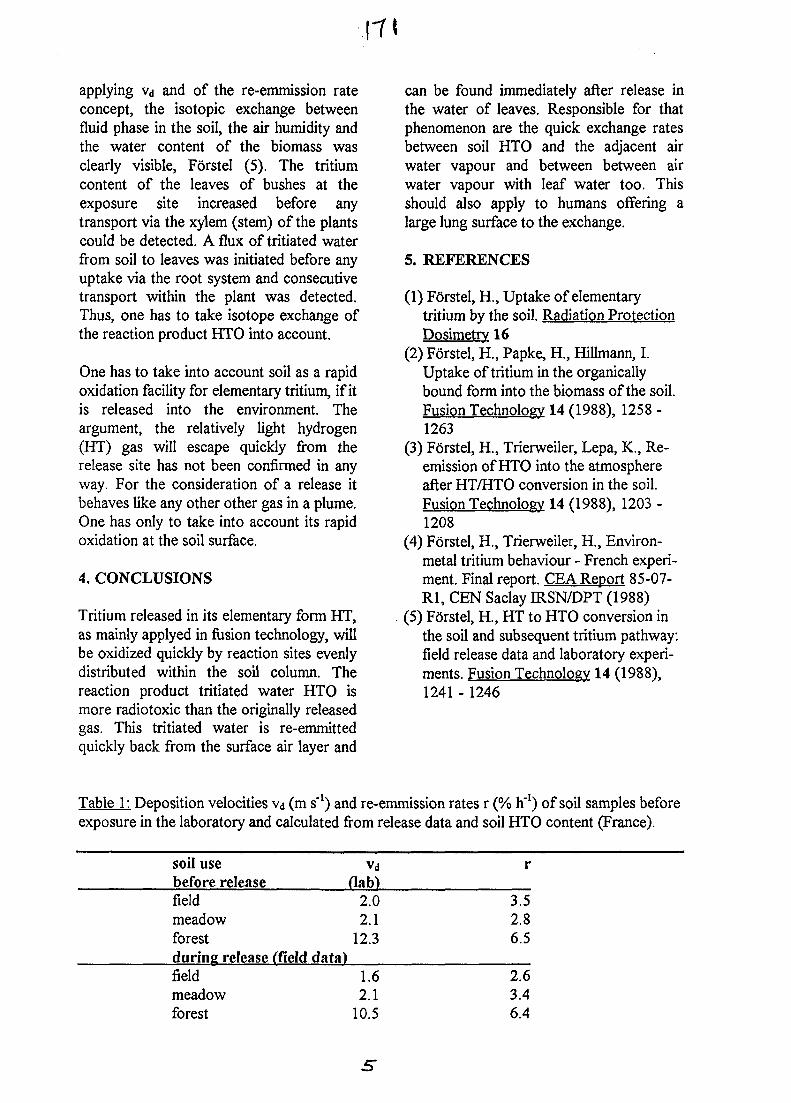
• I T '
applying va and of the re-emmission rateconcept, the isotopic exchange betweenfluid phase in the soil, the air humidity andthe water content of the biomass wasclearly visible, Forstel (5). The tritiumcontent of the leaves of bushes at theexposure site increased before anytransport via the xylem (stem) of the plantscould be detected. A flux of tritiated waterfrom soil to leaves was initiated before anyuptake via the root system and consecutivetransport within the plant was detected.Thus, one has to take isotope exchange ofthe reaction product HTO into account.
One has to take into account soil as a rapidoxidation facility for elementary tritium, if itis released into the environment. Theargument, the relatively light hydrogen(HT) gas will escape quickly from therelease site has not been confirmed in anyway. For the consideration of a release itbehaves like any other other gas in a plume.One has only to take into account its rapidoxidation at the soil surface.
4. CONCLUSIONS
Tritium released in its elementary form HT,as mainly applyed in fusion technology, willbe oxidized quickly by reaction sites evenlydistributed within the soil column. Thereaction product tritiated water HTO ismore radiotoxic than the originally releasedgas. This tritiated water is re-emmittedquickly back from the surface air layer and
can be found immediately after release inthe water of leaves. Responsible for thatphenomenon are the quick exchange ratesbetween soil HTO and the adjacent airwater vapour and between between airwater vapour with leaf water too. Thisshould also apply to humans offering alarge lung surface to the exchange.
5. REFERENCES
(1) FSrstel, H., Uptake of elementarytritium by the soil. Radiation ProtectionDosimetry 16
(2) Fo"rstel, H., Papke, H., Hillmann, I.Uptake of tritium in the organicallybound form into the biomass of the soil.Fusion Technology 14 (1988), 1258 -1263
(3) Forstel, H., Trierweiler, Lepa, K., Re-emission of HTO into the atmosphereafter HT/HTO conversion in the soil.Fusion Technology 14 (1988), 1203 -1208
(4) Forstel, H., Trierweiler, H., Environ-metal tritium behaviour - French experi-ment. Final report. CEA Report 85-07-Rl, CEN Saclay IRSN/DPT (1988)
(5) Forstel, H., HT to HTO conversion inthe soil and subsequent tritium pathway:field release data and laboratory experi-ments. Fusion Technology 14 (1988),1241 -1246
Table 1: Deposition velocities va (m s"1) and re-emmission rates r (% h'1) of soil samples beforeexposure in the laboratory and calculated from release data and soil HTO content (France).
soil usebefore releasefieldmeadowforestduring release (field
vd(lab)
2.02.1
12.3data)
r
3.52.86.5
fieldmeadowforest
1.62.1
10.5
2.63.46.4
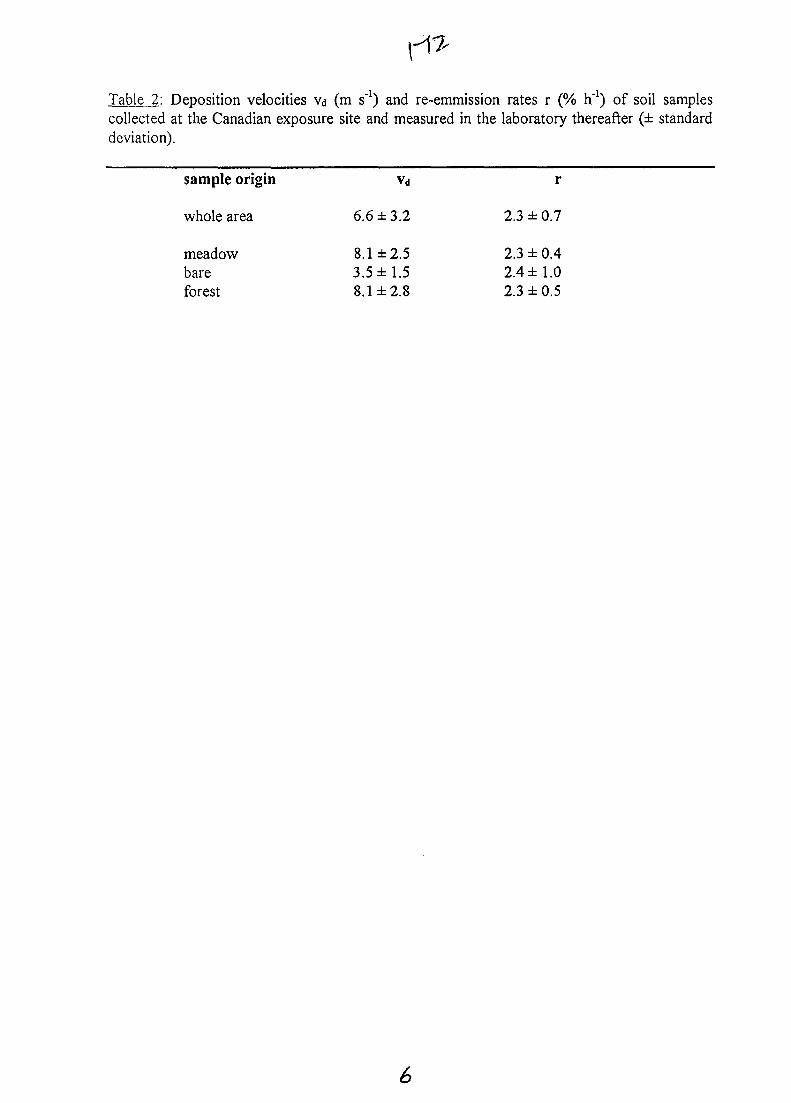
Table 2: Deposition velocities Vd (m s'1) and re-emmission rates r (% h'1) of soil samplescollected at the Canadian exposure site and measured in the laboratory thereafter (± standarddeviation).
sample origin
whole area
meadowbareforest
vd
6.6 ±3.2
8.1 ±2.53.5 ±1.58.1 ±2.8
r
2.3 ± 0.7
2.3 ±0.42.4 ±1.02.3 ±0.5
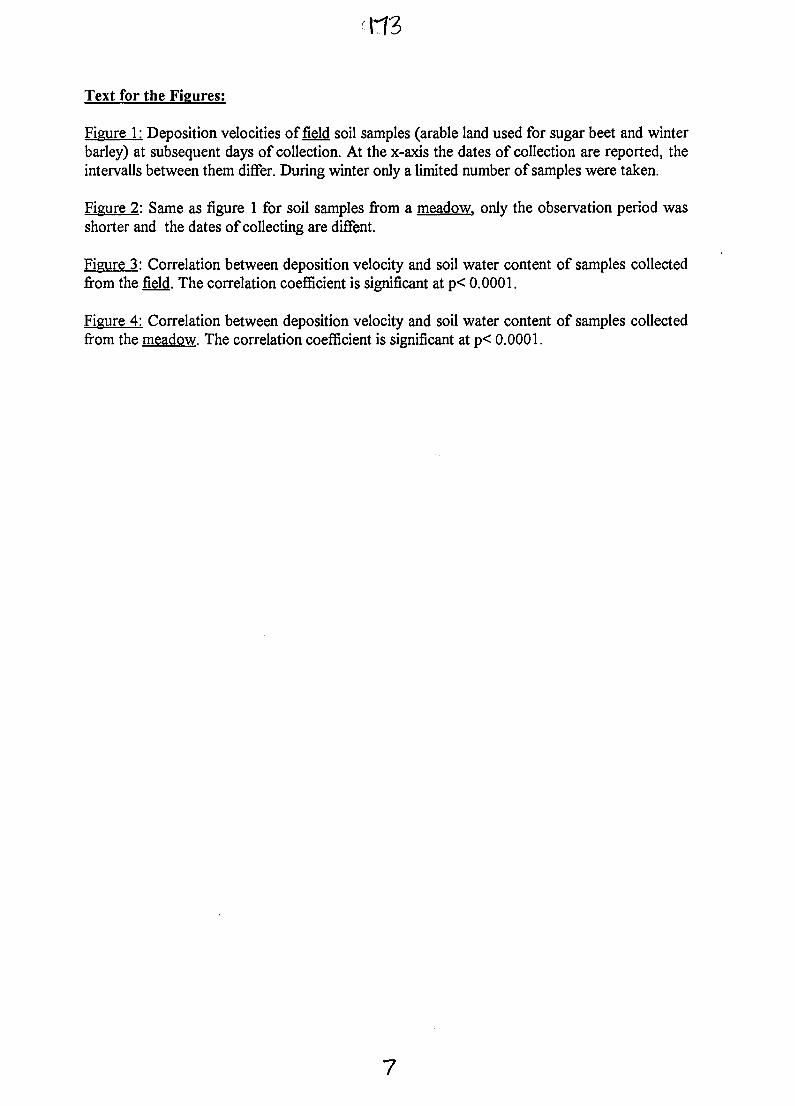
Text for the Fieures;
Figure 1: Deposition velocities of field soil samples (arable land used for sugar beet and winterbarley) at subsequent days of collection. At the x-axis the dates of collection are reported, theintervalls between them differ. During winter only a limited number of samples were taken.
Figure 2: Same as figure 1 for soil samples from a meadow, only the observation period wasshorter and the dates of collecting are diffent.
Figure 3: Correlation between deposition velocity and soil water content of samples collectedfrom the field. The correlation coefficient is significant at p< 0.0001.
Figure 4: Correlation between deposition velocity and soil water content of samples collectedfrom the meadow. The correlation coefficient is significant at p< 0.0001.
7
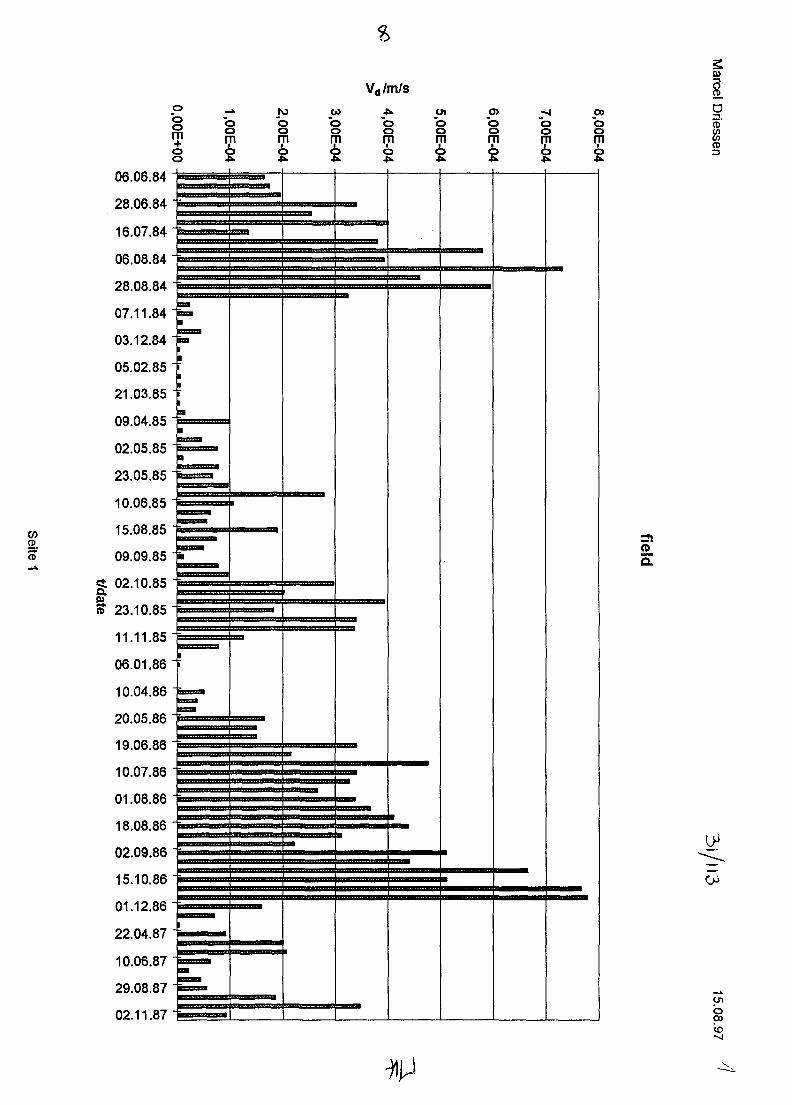
Vd/m/s
CO<D
CD
—*
'oo•71
2
rooom2
o>"oo712
" 00
m2
enO0
m2
o>gm0
OO
2
0000
m2
I
CD
2.a
on
gio
l
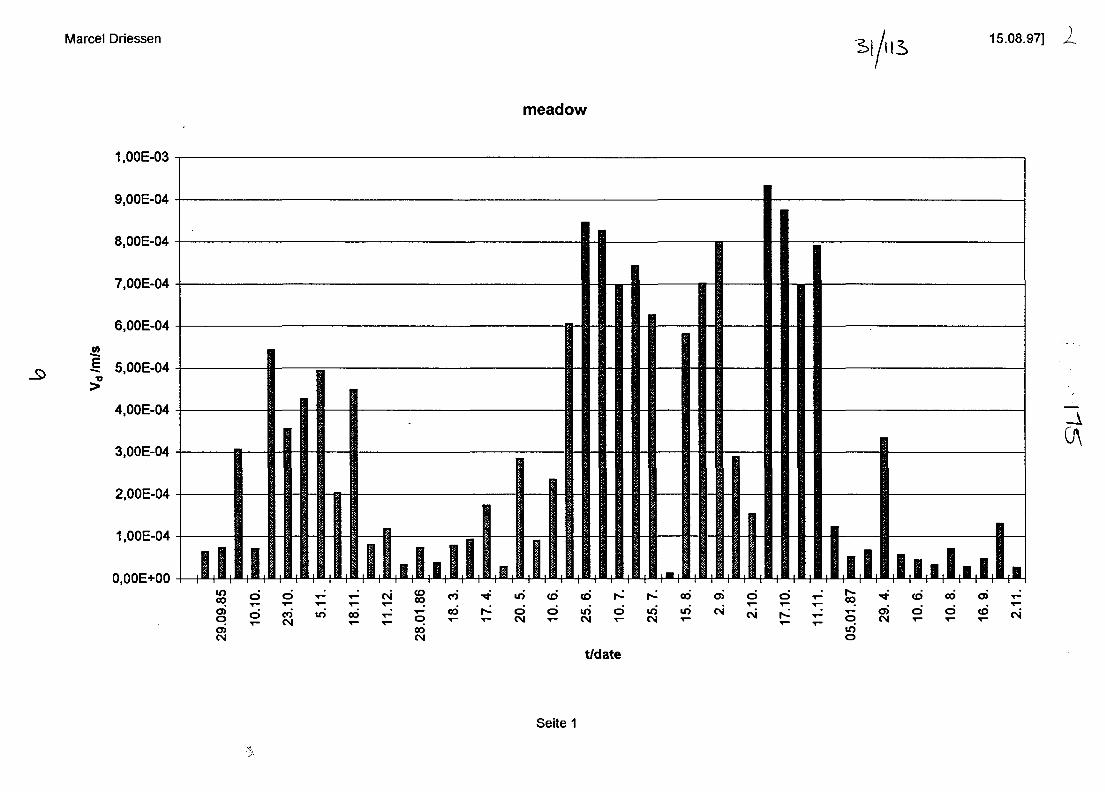
Marcel Driessen 15.08.97] 2
1.00E-03
9.00E-04
8.00E-04
7.00E-04
6.00E-04
5 5.00E-04
4.00E-04
3.00E-04
2.00E-04
1.00E-04
0.00E+00
•a
incqo>oo>CM
t H l H l H l
meadow
+*"+"-!• I"!*!"!"! alMlal»l
-A
l . l l l . l . l .
co
co ***
5 £06CM
r dT - CM
CO
10. CO
25. r-
10.
25. co
m*o>CM
oCMo o T- feq <O 00 O r-
T- O) O O <OO CM T - T - T -uio
t/date
Seite 1
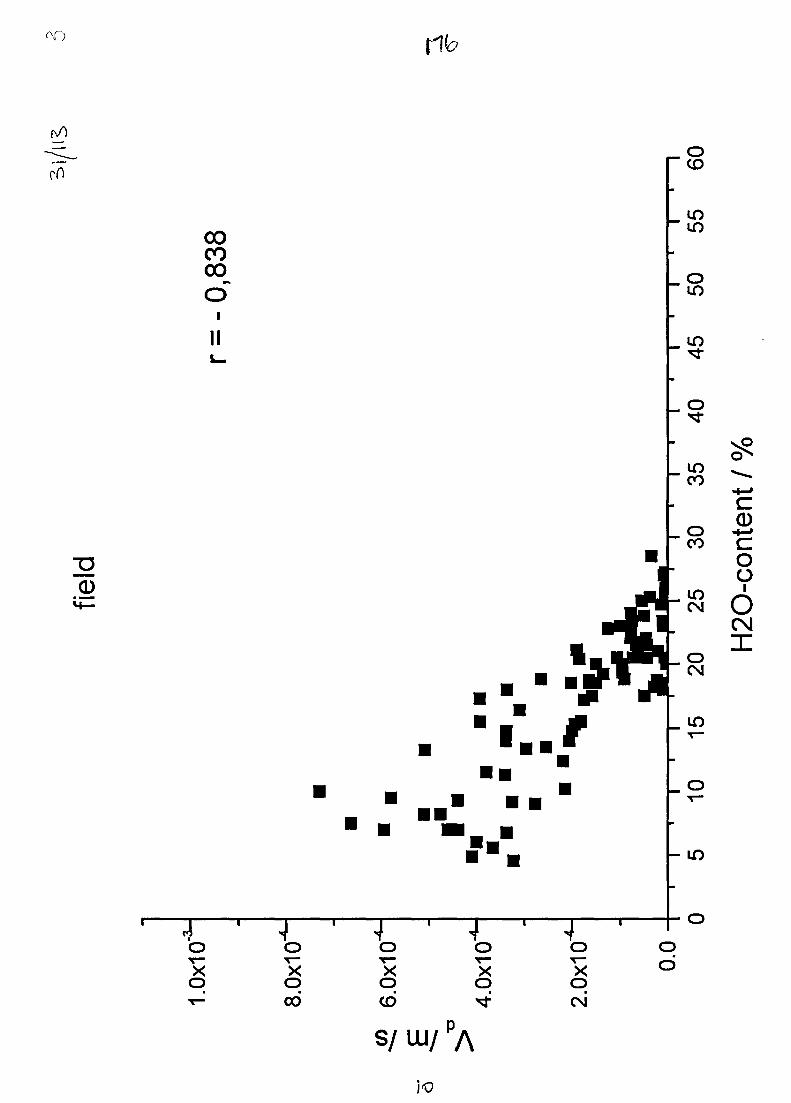
rib
COCOCO
I
II
350
oCD
oin
_ o
CO
_ oCO
0
I.
T
_ O
Xo
XpCO
XpCD
Xo
XpCN
O
d
s/ ui/
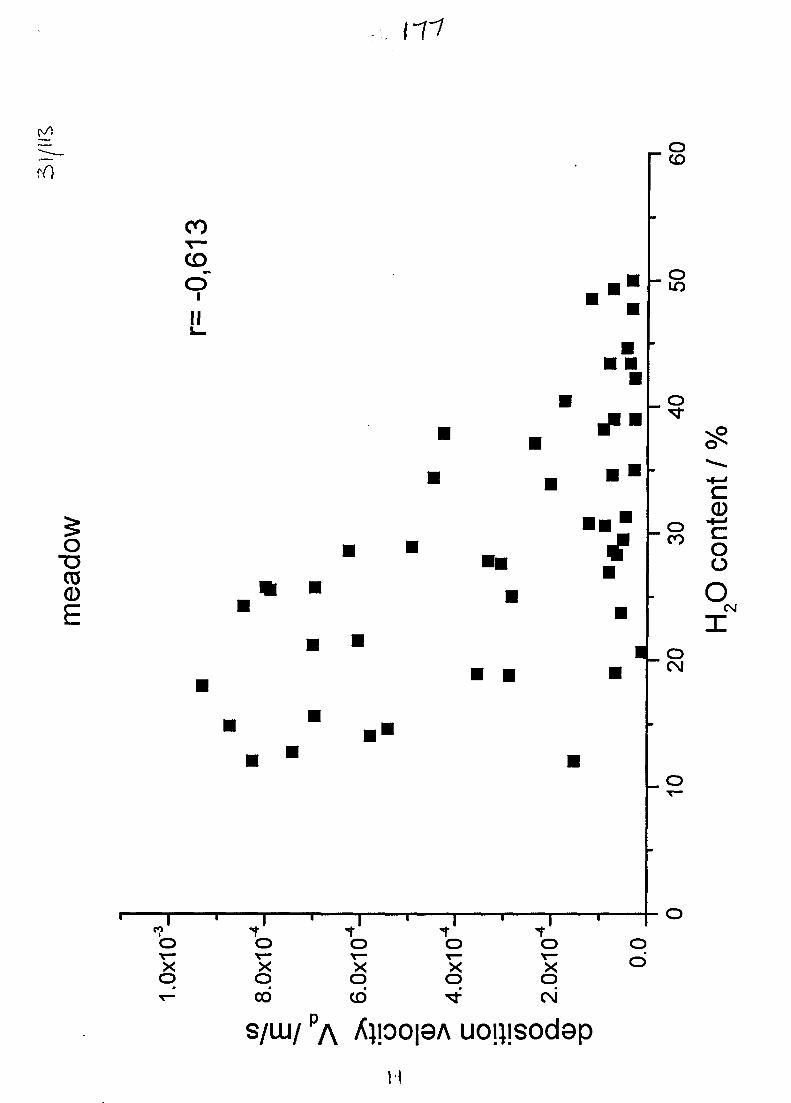
11-1
o~ co
CO
5O
II
05
E
_ o
_ o
oCO
0••-•
OO
O
. . oCNJ
_ o
1 1
oT—
Xq
o
,0x1
CO
• vo
0x1
CD
o
0x1 o
0x1
CM
i
oo
S/LU/
I!
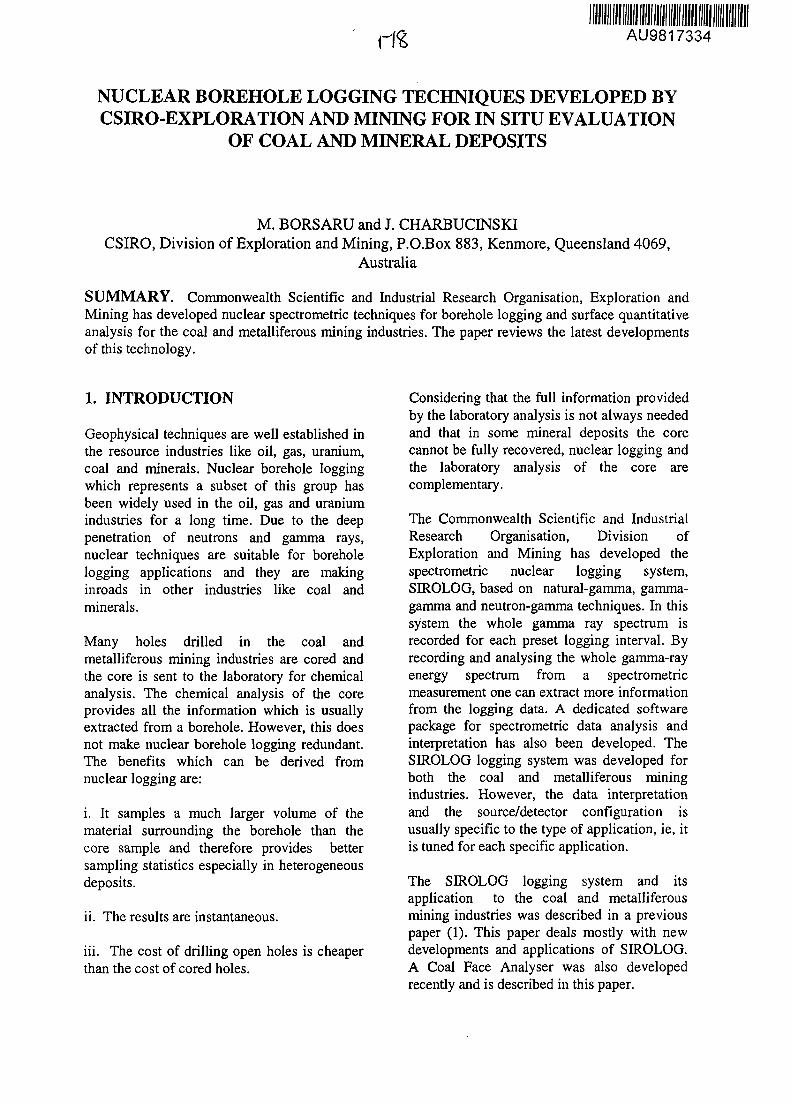
AU9817334
NUCLEAR BOREHOLE LOGGING TECHNIQUES DEVELOPED BYCSIRO-EXPLORATION AND MINING FOR IN SITU EVALUATION
OF COAL AND MINERAL DEPOSITS
M. BORSARU and J. CHARBUCINSKICSIRO, Division of Exploration and Mining, P.O.Box 883, Kenmore, Queensland 4069,
Australia
SUMMARY. Commonwealth Scientific and Industrial Research Organisation, Exploration andMining has developed nuclear spectrometric techniques for borehole logging and surface quantitativeanalysis for the coal and metalliferous mining industries. The paper reviews the latest developmentsof this technology.
1. INTRODUCTION
Geophysical techniques are well established inthe resource industries like oil, gas, uranium,coal and minerals. Nuclear borehole loggingwhich represents a subset of this group hasbeen widely used in the oil, gas and uraniumindustries for a long time. Due to the deeppenetration of neutrons and gamma rays,nuclear techniques are suitable for boreholelogging applications and they are makinginroads in other industries like coal andminerals.
Many holes drilled in the coal andmetalliferous mining industries are cored andthe core is sent to the laboratory for Chemicalanalysis. The chemical analysis of the coreprovides all the information which is usuallyextracted from a borehole. However, this doesnot make nuclear borehole logging redundant.The benefits which can be derived fromnuclear logging are:
i. It samples a much larger volume of thematerial surrounding the borehole than thecore sample and therefore provides bettersampling statistics especially in heterogeneousdeposits.
ii. The results are instantaneous.
iii. The cost of drilling open holes is cheaperthan the cost of cored holes.
Considering that the full information providedby the laboratory analysis is not always neededand that in some mineral deposits the corecannot be fully recovered, nuclear logging andthe laboratory analysis of the core arecomplementary.
The Commonwealth Scientific and IndustrialResearch Organisation, Division ofExploration and Mining has developed thespectrometric nuclear logging system,SIROLOG, based on natural-gamma, gamma-gamma and neutron-gamma techniques. In thissystem the whole gamma ray spectrum isrecorded for each preset logging interval. Byrecording and analysing the whole gamma-rayenergy spectrum from a spectrometricmeasurement one can extract more informationfrom the logging data. A dedicated softwarepackage for spectrometric data analysis andinterpretation has also been developed. TheSIROLOG logging system was developed forboth the coal and metalliferous miningindustries. However, the data interpretationand the source/detector configuration isusually specific to the type of application, ie, itis tuned for each specific application.
The SIROLOG logging system and itsapplication to the coal and metalliferousmining industries was described in a previouspaper (1). This paper deals mostly with newdevelopments and applications of SIROLOG.A Coal Face Analyser was also developedrecently and is described in this paper.
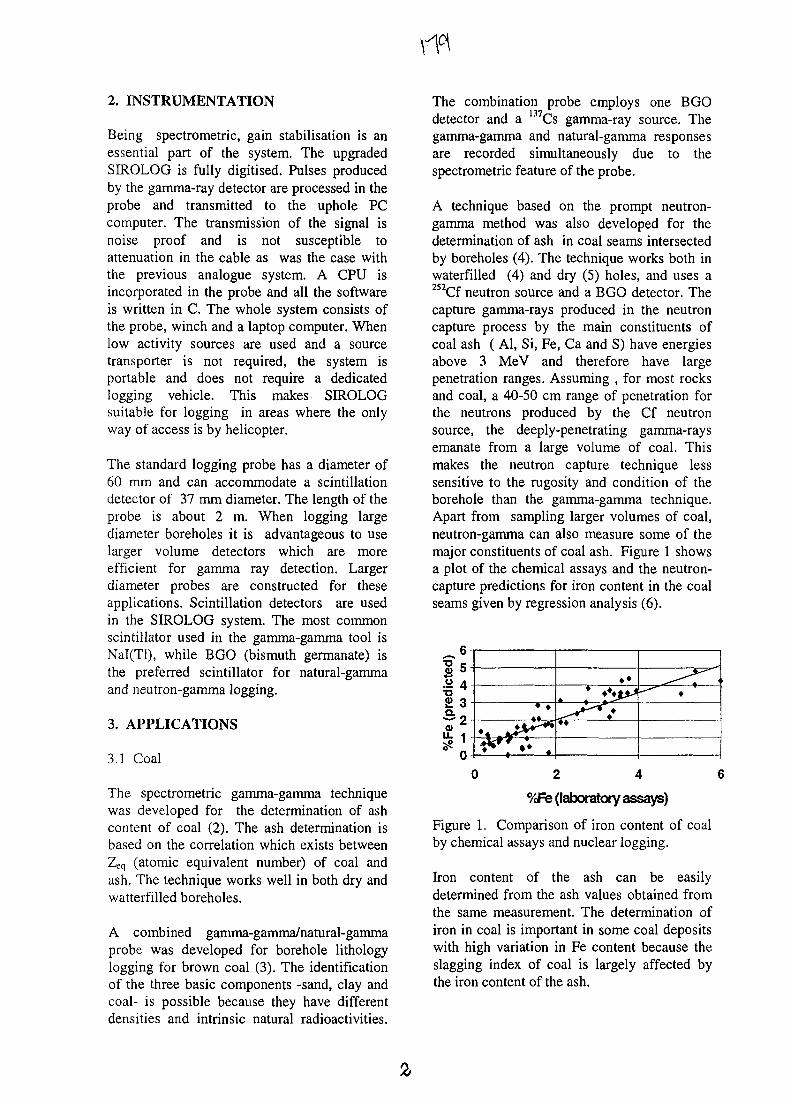
2. INSTRUMENTATION
Being spectrometric, gain stabilisation is anessential part of the system. The upgradedSIROLOG is fully digitised. Pulses producedby the gamma-ray detector are processed in theprobe and transmitted to the uphole PCcomputer. The transmission of the signal isnoise proof and is not susceptible toattenuation in the cable as was the case withthe previous analogue system. A CPU isincorporated in the probe and all the softwareis written in C. The whole system consists ofthe probe, winch and a laptop computer. Whenlow activity sources are used and a sourcetransporter is not required, the system isportable and does not require a dedicatedlogging vehicle. This makes SIROLOGsuitable for logging in areas where the onlyway of access is by helicopter.
The standard logging probe has a diameter of60 mm and can accommodate a scintillationdetector of 37 mm diameter. The length of theprobe is about 2 m. When logging largediameter boreholes it is advantageous to uselarger volume detectors which are moreefficient for gamma ray detection. Largerdiameter probes are constructed for theseapplications. Scintillation detectors are usedin the SIROLOG system. The most commonscintillator used in the gamma-gamma tool isNal(Tl), while BGO (bismuth germanate) isthe preferred scintillator for natural-gammaand neutron-gamma logging.
3. APPLICATIONS
3.1 Coal
The spectrometric gamma-gamma techniquewas developed for the determination of ashcontent of coal (2). The ash determination isbased on the correlation which exists betweenZeq (atomic equivalent number) of coal andash. The technique works well in both dry andwatterfilled boreholes.
A combined gamma-gamma/natural-gammaprobe was developed for borehole lithologylogging for brown coal (3). The identificationof the three basic components -sand, clay andcoal- is possible because they have differentdensities and intrinsic natural radioactivities.
The combination probe employs one BGOdetector and a 137Cs gamma-ray source. Thegamma-gamma and natural-gamma responsesare recorded simultaneously due to thespectrometric feature of the probe.
A technique based on the prompt neutron-gamma method was also developed for thedetermination of ash in coal seams intersectedby boreholes (4). The technique works both inwaterfilled (4) and dry (5) holes, and uses a252Cf neutron source and a BGO detector. Thecapture gamma-rays produced in the neutroncapture process by the main constituents ofcoal ash ( Al, Si, Fe, Ca and S) have energiesabove 3 MeV and therefore have largepenetration ranges. Assuming , for most rocksand coal, a 40-50 cm range of penetration forthe neutrons produced by the Cf neutronsource, the deeply-penetrating gamma-raysemanate from a large volume of coal. Thismakes the neutron capture technique lesssensitive to the rugosity and condition of theborehole than the gamma-gamma technique.Apart from sampling larger volumes of coal,neutron-gamma can also measure some of themajor constituents of coal ash. Figure 1 showsa plot of the chemical assays and the neutron-capture predictions for iron content in the coalseams given by regression analysis (6).
6§5I42» 3
S!0 2 4
%Fe (laboratory assays)
Figure 1. Comparison of iron content of coalby chemical assays and nuclear logging.
Iron content of the ash can be easilydetermined from the ash values obtained fromthe same measurement. The determination ofiron in coal is important in some coal depositswith high variation in Fe content because theslagging index of coal is largely affected bythe iron content of the ash.
• *
• •
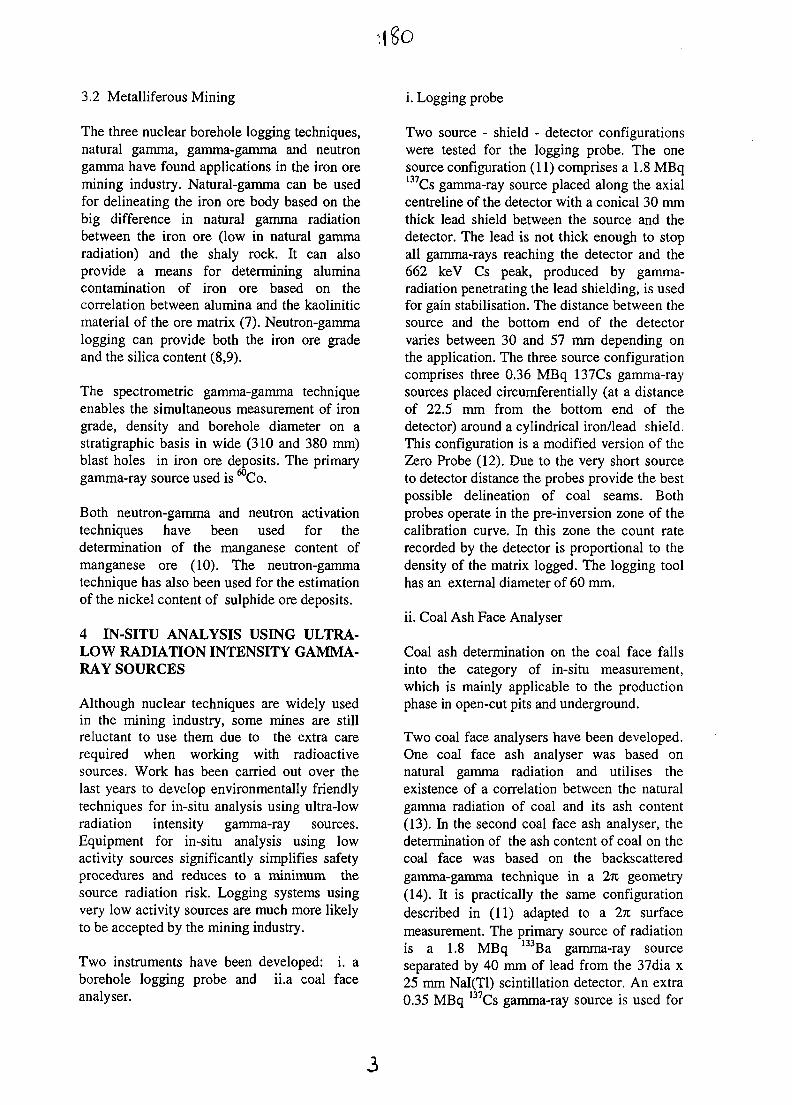
3.2 Metalliferous Mining
The three nuclear borehole logging techniques,natural gamma, gamma-gamma and neutrongamma have found applications in the iron oremining industry. Natural-gamma can be usedfor delineating the iron ore body based on thebig difference in natural gamma radiationbetween the iron ore (low in natural gammaradiation) and the shaly rock. It can alsoprovide a means for determining aluminacontamination of iron ore based on thecorrelation between alumina and the kaoliniticmaterial of the ore matrix (7). Neutron-gammalogging can provide both the iron ore gradeand the silica content (8,9).
The spectrometric gamma-gamma techniqueenables the simultaneous measurement of irongrade, density and borehole diameter on astratigraphic basis in wide (310 and 380 mm)blast holes in iron ore deposits. The primarygamma-ray source used is Co.
Both neutron-gamma and neutron activationtechniques have been used for thedetermination of the manganese content ofmanganese ore (10). The neutron-gammatechnique has also been used for the estimationof the nickel content of sulphide ore deposits.
4 IN-SITU ANALYSIS USING ULTRA-LOW RADIATION INTENSITY GAMMA-RAY SOURCES
Although nuclear techniques are widely usedin the mining industry, some mines are stillreluctant to use them due to the extra carerequired when working with radioactivesources. Work has been carried out over thelast years to develop environmentally friendlytechniques for in-situ analysis using ultra-lowradiation intensity gamma-ray sources.Equipment for in-situ analysis using lowactivity sources significantly simplifies safetyprocedures and reduces to a minimum thesource radiation risk. Logging systems usingvery low activity sources are much more likelyto be accepted by the mining industry.
Two instruments have been developed: i. aborehole logging probe and ii.a coal faceanalyser.
i. Logging probe
Two source - shield - detector configurationswere tested for the logging probe. The onesource configuration (11) comprises a 1.8 MBq137Cs gamma-ray source placed along the axialcentreline of the detector with a conical 30 mmthick lead shield between the source and thedetector. The lead is not thick enough to stopall gamma-rays reaching the detector and the662 keV Cs peak, produced by gamma-radiation penetrating the lead shielding, is usedfor gain stabilisation. The distance between thesource and the bottom end of the detectorvaries between 30 and 57 mm depending onthe application. The three source configurationcomprises three 0.36 MBq 137Cs gamma-raysources placed circumferentially (at a distanceof 22.5 mm from the bottom end of thedetector) around a cylindrical iron/lead shield.This configuration is a modified version of theZero Probe (12). Due to the very short sourceto detector distance the probes provide the bestpossible delineation of coal seams. Bothprobes operate in the pre-inversion zone of thecalibration curve. In this zone the count raterecorded by the detector is proportional to thedensity of the matrix logged. The logging toolhas an external diameter of 60 mm.
ii. Coal Ash Face Analyser
Coal ash determination on the coal face fallsinto the category of in-situ measurement,which is mainly applicable to the productionphase in open-cut pits and underground.
Two coal face analysers have been developed.One coal face ash analyser was based onnatural gamma radiation and utilises theexistence of a correlation between the naturalgamma radiation of coal and its ash content(13). In the second coal face ash analyser, thedetermination of the ash content of coal on thecoal face was based on the backscatteredgamma-gamma technique in a 2% geometry(14). It is practically the same configurationdescribed in (11) adapted to a 2n surfacemeasurement. The primary source of radiationis a 1.8 MBq 133Ba gamma-ray sourceseparated by 40 mm of lead from the 37dia x25 mm NaI(Tl) scintillation detector. An extra0.35 MBq 137Cs gamma-ray source is used for
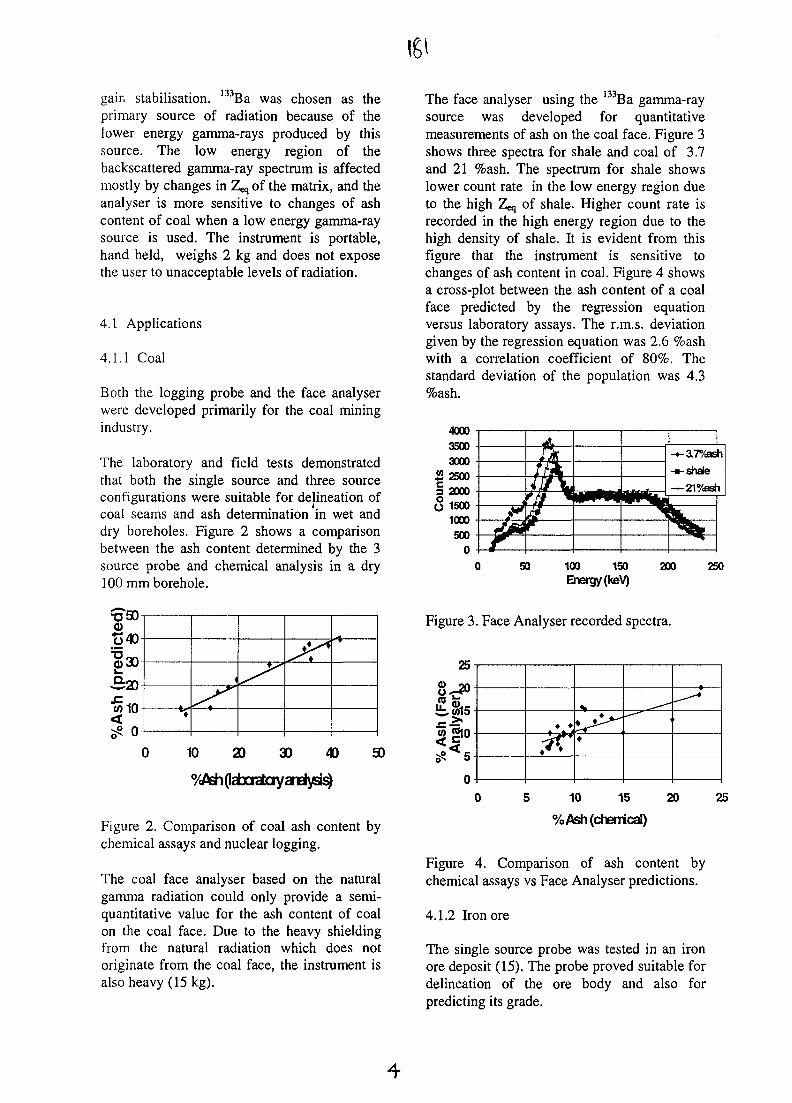
gain stabilisation. I33Ba was chosen as theprimary source of radiation because of thelower energy gamma-rays produced by thissource. The low energy region of thebackscattered gamma-ray spectrum is affectedmostly by changes in Zeq of the matrix, and theanalyser is more sensitive to changes of ashcontent of coal when a low energy gamma-raysource is used. The instrument is portable,hand held, weighs 2 kg and does not exposethe user to unacceptable levels of radiation.
4.1 Applications
4.1.1 Coal
Both the logging probe and the face analyserwere developed primarily for the coal miningindustry.
The laboratory and field tests demonstratedthat both the single source and three sourceconfigurations were suitable for delineation ofcoal seams and ash determination in wet anddry boreholes. Figure 2 shows a comparisonbetween the ash content determined by the 3source probe and chemical analysis in a dry100 mm borehole.
TJSOot""§30
"§10<
i
A"
10 20 30 40 so
Figure 2. Comparison of coal ash content bychemical assays and nuclear logging.
The coal face analyser based on the naturalgamma radiation could only provide a semi-quantitative value for the ash content of coalon the coal face. Due to the heavy shieldingfrom the natural radiation which does notoriginate from the coal face, the instrument isalso heavy (15 kg).
The face analyser using the 133Ba gamma-raysource was developed for quantitativemeasurements of ash on the coal face. Figure 3shows three spectra for shale and coal of 3.7and 21 %ash. The spectrum for shale showslower count rate in the low energy region dueto the high Zeq of shale. Higher count rate isrecorded in the high energy region due to thehigh density of shale. It is evident from thisfigure that the instrument is sensitive tochanges of ash content in coal. Figure 4 showsa cross-plot between the ash content of a coalface predicted by the regression equationversus laboratory assays. The r.m.s. deviationgiven by the regression equation was 2.6 %ashwith a correlation coefficient of 80%. Thestandard deviation of the population was 4.3%ash.
400035003000
£ 2500i 2000O 1500
1000500
0
A
F
- ^ shale
—21°/<as»
h
50 100 150 200 250Energy (keV)
Figure 3. Face Analyser recorded spectra.
25
*<
0 5 10 15 20 25
% Ash (cherried)
Figure 4. Comparison of ash content bychemical assays vs Face Analyser predictions.
4.1.2 Iron ore
The single source probe was tested in an ironore deposit (15). The probe proved suitable fordelineation of the ore body and also forpredicting its grade.
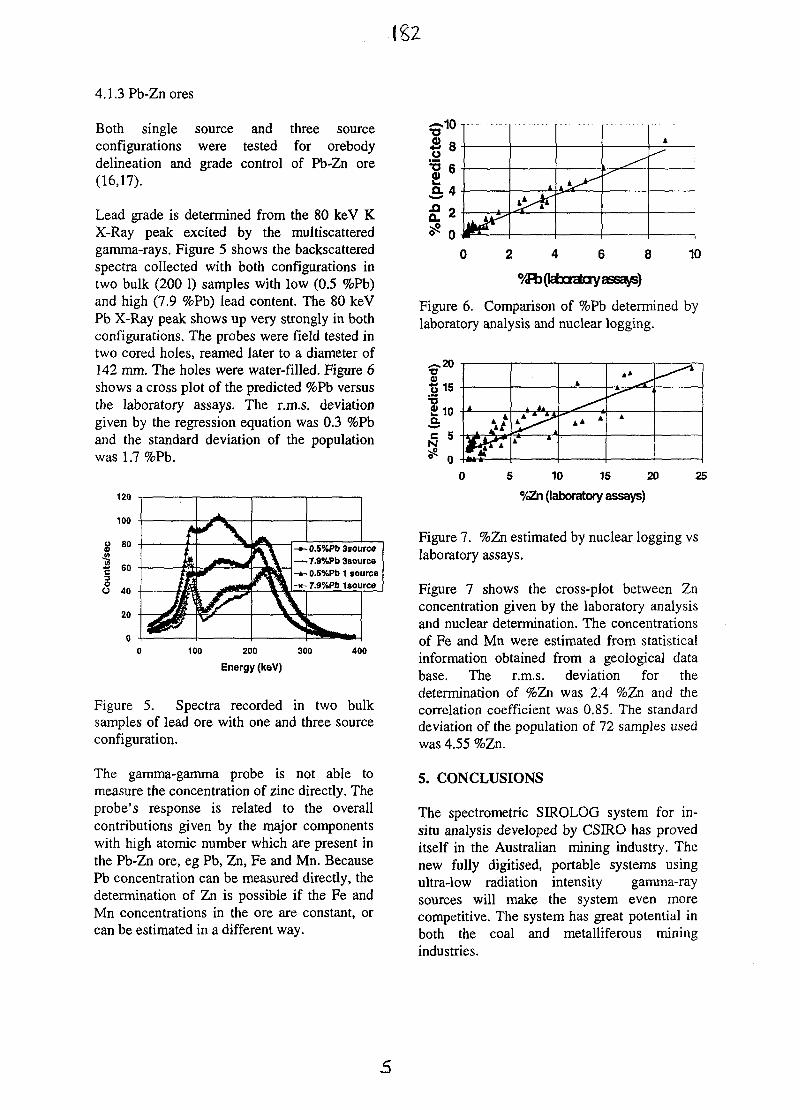
• 182
4.1.3 Pb-Zn ores
Both single source and three sourceconfigurations were tested for orebodydelineation and grade control of Pb-Zn ore(16,17).
Lead grade is determined from the 80 keV KX-Ray peak excited by the multiscatteredgamma-rays. Figure 5 shows the backscatteredspectra collected with both configurations intwo bulk (200 1) samples with low (0.5 %Pb)and high (7.9 %Pb) lead content. The 80 keVPb X-Ray peak shows up very strongly in bothconfigurations. The probes were field tested intwo cored holes, reamed later to a diameter of142 mm. The holes were water-filled. Figure 6shows a cross plot of the predicted %Pb versusthe laboratory assays. The r.m.s. deviationgiven by the regression equation was 0.3 %Pband the standard deviation of the populationwas 1.7 %Pb.
120
100
g 80
1 60§
O 40
20
0
fkJ-Ji
- . . . . • J
-»-0.5%Pb3sou—7.9%Pb3sot- * - 0.5%Pb 1 so-*-7.9%Pb1sou
* * —
rcerceurcerce
100 200 300
Energy (keV)400
Figure 5. Spectra recorded in two bulksamples of lead ore with one and three sourceconfiguration.
The gamma-gamma probe is not able tomeasure the concentration of zinc directly. Theprobe's response is related to the overallcontributions given by the major componentswith high atomic number which are present inthe Pb-Zn ore, eg Pb, Zn, Fe and Mn. BecausePb concentration can be measured directly, thedetermination of Zn is possible if the Fe andMn concentrations in the ore are constant, orcan be estimated in a different way.
34
£2k
k
]
2 4 6 8
°/^(labotafcry assays)
10
Figure 6. Comparison of %Pb determined bylaboratory analysis and nuclear logging.
.- .201
15
£10 k
£***k
k
k
k k ^
k
0 5 10 15 20 25
°/<Zn (laboratory assays)
Figure 7. %Zn estimated by nuclear logging vslaboratory assays.
Figure 7 shows the cross-plot between Znconcentration given by the laboratory analysisand nuclear determination. The concentrationsof Fe and Mn were estimated from statisticalinformation obtained from a geological database. The r.m.s. deviation for thedetermination of %Zn was 2.4 %Zn and thecorrelation coefficient was 0.85. The standarddeviation of the population of 72 samples usedwas 4.55 %Zn.
5. CONCLUSIONS
The spectrometric SIROLOG system for in-situ analysis developed by CSIRO has proveditself in the Australian mining industry. Thenew fully digitised, portable systems usingultra-low radiation intensity gamma-raysources will make the system even morecompetitive. The system has great potential inboth the coal and metalliferous miningindustries.
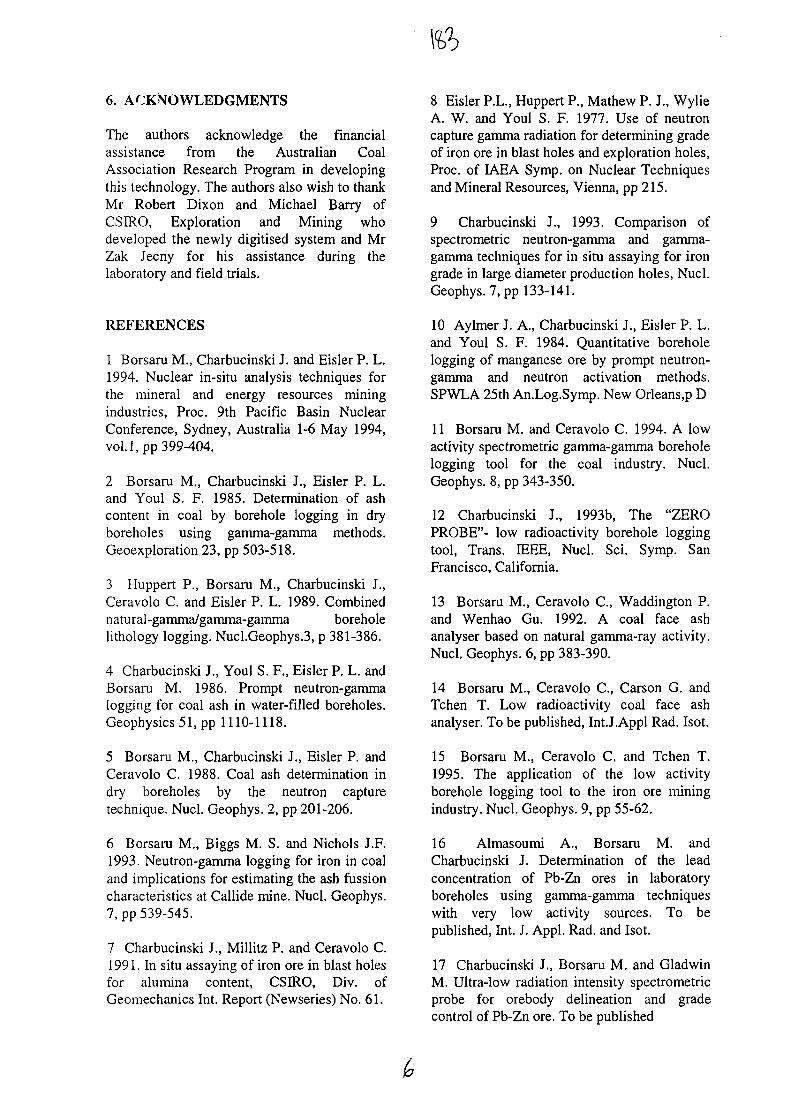
6. ACKNOWLEDGMENTS
The authors acknowledge the financialassistance from the Australian CoalAssociation Research Program in developingthis technology. The authors also wish to thankMr Robert Dixon and Michael Barry ofCSIRO, Exploration and Mining whodeveloped the newly digitised system and MrZak Jecny for his assistance during thelaboratory and field trials.
REFERENCES
1 Borsaru M., Charbucinski J. and Eisler P. L.1994. Nuclear in-situ analysis techniques forthe mineral and energy resources miningindustries, Proc. 9th Pacific Basin NuclearConference, Sydney, Australia 1-6 May 1994,vol.1, pp 399-404.
2 Borsaru M., Charbucinski J., Eisler P. L.and Youl S. F. 1985. Determination of ashcontent in coal by borehole logging in dryboreholes using gamma-gamma methods.Geoexploration 23, pp 503-518.
3 Huppert P., Borsaru M., Charbucinski J.,Ceravolo C. and Eisler P. L. 1989. Combinednatural-gamma/gamma-gamma boreholelithology logging. Nucl.Geophys.3, p 381-386.
4 Charbucinski J., Youl S. F., Eisler P. L. andBorsaru M. 1986. Prompt neutron-gammalogging for coal ash in water-filled boreholes.Geophysics 51, pp 1110-1118.
5 Borsaru M., Charbucinski J., Eisler P. andCeravolo C. 1988. Coal ash determination indry boreholes by the neutron capturetechnique. Nucl. Geophys. 2, pp 201-206.
6 Borsaru M., Biggs M. S. and Nichols J.F.1993. Neutron-gamma logging for iron in coaland implications for estimating the ash fussioncharacteristics at Callide mine. Nucl. Geophys.7, pp 539-545.
7 Charbucinski J., Millitz P. and Ceravolo C.1991. In situ assaying of iron ore in blast holesfor alumina content, CSIRO, Div. ofGeomechanics Int. Report (Newseries) No. 61.
8 Eisler P.L., Huppert P., Mathew P. J., WylieA. W. and Youl S. F. 1977. Use of neutroncapture gamma radiation for determining gradeof iron ore in blast holes and exploration holes,Proc. of IAEA Symp. on Nuclear Techniquesand Mineral Resources, Vienna, pp 215.
9 Charbucinski J., 1993. Comparison ofspectrometric neutron-gamma and gamma-gamma techniques for in situ assaying for irongrade in large diameter production holes, Nucl.Geophys. 7, pp 133-141.
10 Aylmer J. A., Charbucinski J., Eisler P. L.and Youl S. F. 1984. Quantitative boreholelogging of manganese ore by prompt neutron-gamma and neutron activation methods.SPWLA 25th An.Log.Symp. New Orleans,p D
11 Borsaru M. and Ceravolo C. 1994. A lowactivity spectrometric gamma-gamma boreholelogging tool for the coal industry. Nucl.Geophys. 8, pp 343-350.
12 Charbucinski J., 1993b, The "ZEROPROBE"- low radioactivity borehole loggingtool, Trans. IEEE, Nucl. Sci. Symp. SanFrancisco, California.
13 Borsaru M., Ceravolo C , Waddington P.and Wenhao Gu. 1992. A coal face ashanalyser based on natural gamma-ray activity.Nucl. Geophys. 6, pp 383-390.
14 Borsaru M., Ceravolo C , Carson G. andTchen T. Low radioactivity coal face ashanalyser. To be published, Int.J.Appl Rad. Isot.
15 Borsaru M., Ceravolo C. and Tchen T.1995. The application of the low activityborehole logging tool to the iron ore miningindustry. Nucl. Geophys, 9, pp 55-62.
16 Almasoumi A., Borsaru M. andCharbucinski J. Determination of the leadconcentration of Pb-Zn ores in laboratoryboreholes using gamma-gamma techniqueswith very low activity sources. To bepublished, Int. J. Appl. Rad. and Isot.
17 Charbucinski J., Borsaru M. and GladwinM. Ultra-low radiation intensity spectrometricprobe for orebody delineation and gradecontrol of Pb-Zn ore. To be published
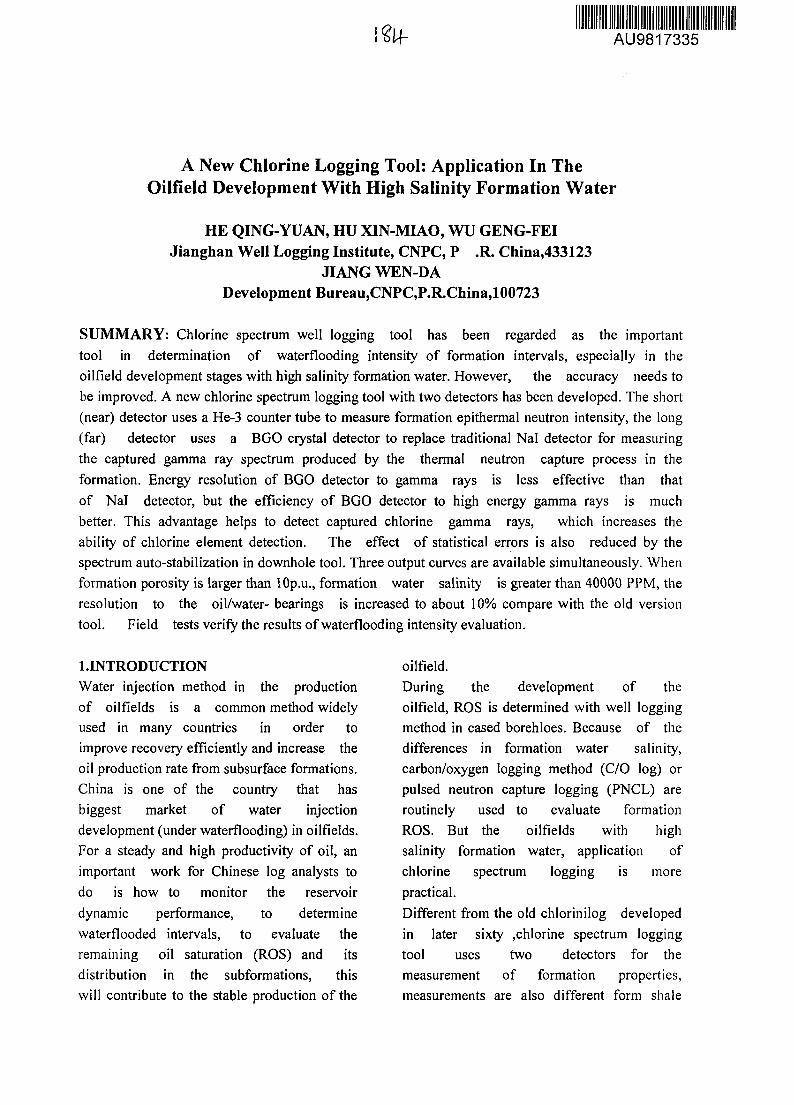
AU9817335
A New Chlorine Logging Tool: Application In TheOilfield Development With High Salinity Formation Water
HE QING-YUAN, HU XIN-MIAO, WU GENG-FEIJianghan Well Logging Institute, CNPC, P .R. China,433123
JIANG WEN-DADevelopment Bureau,CNPC,P.R.China,100723
SUMMARY: Chlorine spectrum well logging tool has been regarded as the important
tool in determination of waterflooding intensity of formation intervals, especially in the
oilfield development stages with high salinity formation water. However, the accuracy needs to
be improved. A new chlorine spectrum logging tool with two detectors has been developed. The short
(near) detector uses a He-3 counter tube to measure formation epithermal neutron intensity, the long
(far) detector uses a BGO crystal detector to replace traditional Nal detector for measuring
the captured gamma ray spectrum produced by the thermal neutron capture process in the
formation. Energy resolution of BGO detector to gamma rays is less effective than that
of Nal detector, but the efficiency of BGO detector to high energy gamma rays is much
better. This advantage helps to detect captured chlorine gamma rays, which increases the
ability of chlorine element detection. The effect of statistical errors is also reduced by the
spectrum auto-stabilization in downhole tool. Three output curves are available simultaneously. When
formation porosity is larger than lOp.u., formation water salinity is greater than 40000 PPM, the
resolution to the oil/water- bearings is increased to about 10% compare with the old version
tool. Field tests verify the results of waterflooding intensity evaluation.
1.INTRODUCTIONWater injection method in the production
of oilfields is a common method widely
used in many countries in order to
improve recovery efficiently and increase the
oil production rate from subsurface formations.
China is one of the country that has
biggest market of water injection
development (under waterflooding) in oilfields.
For a steady and high productivity of oil, an
important work for Chinese log analysts to
do is how to monitor the reservoir
dynamic performance, to determine
waterflooded intervals, to evaluate the
remaining oil saturation (ROS) and its
distribution in the subformations, this
will contribute to the stable production of the
oilfield.
During the development of the
oilfield, ROS is determined with well logging
method in cased borehloes. Because of the
differences in formation water salinity,
carbon/oxygen logging method (C/O log) or
pulsed neutron capture logging (PNCL) are
routinely used to evaluate formation
ROS. But the oilfields with high
salinity formation water, application of
chlorine spectrum logging is more
practical.
Different from the old chlorinilog developed
in later sixty .chlorine spectrum logging
tool uses two detectors for the
measurement of formation properties,
measurements are also different form shale
compensated chlorine logging routinely used
in the Gulf of Mexico ,Texas, U.S.. New
chlorine spectrum logging tool not only
detects distribution of thermal neutron, but
also analyze characteristics of captured
gamma rays of chlorine element in the
formations.
2.NEW CHLORINE SPECTRUMLOGGING TOOLBasic Structure
The logging tool is composed of four
parts, sensor assembly (source and detectors),
electronic control section, telemetry cartridge,
and surface computer software control
and interpretation system. In the sensor
assembly, there is a neutron source cell and
two detectors, the structure schematic is shown
in figure 1. neutron source used is a sealed
isotope Am-Be source. Short detector is a He-
3 counter tube, source to detector spacing is 45
cm. long detector consists of a BGO crystal,
size of O50xl00mm, and a photomultiplier.
Principle of Measurement
Fast neutrons with average energy of
4.5 MeV emitted from a neutron source
interact with the elements in the
formation. These neutrons are slowdown by
the elements contained in the formation
matrix and fluids in the pores, and are slowly
become to thermal neutrons . The thermal
neutrons are finally captured by atomic
nucleus of elements in the formation.
During the capture process, specific
energy gamma rays are emitted. When the fast
neutron are slowdown , some thermal
neutrons are scattered to the formation areas
near the sensors and detected by thermal
neutron detector. However, part of
captured gamma rays are also scattered to the
sensors and detected by scintillation detector.
If there are two formations of same lithology
and porosity, but different in the content of
chlorine element in pore fluids, i.e. the
salinity of formation water in the two
formations are different. When two formation
are logged, two significant different results
are obtained. First, the thermal neutron counts
in chlorine formation will less than that
of formation with no chlorine element,
this is because the chlorine element has
a bigger thermal neutron capture cross-section.
some of the thermal neutrons in the
formation are captured , so the flux of thermal
neutron decreases. Second, gamma rays
counts detected in the chlorine energy window
in the gamma ray spectrum are also
different. Gamma rays counts in
chlorine formation is greater than that of
the formation with no chlorine element
(figure.2). The reason is that when a thermal
neutron is captured by a chlorine atom , it
emits gamma rays with specific energy.
The gamma rays almost fall into a higher
energy window. In order to reduce the
influences of casing ,cement, and other
elements in the formation to the captured
gamma rays ,only those gamma rays fallen into
energy window of 3.5 to 6.5 MeV are
recorded.
Suppose in formation i , ( Nci)-X represents the
gamma rays counts of captured chlorine
element, (jYn)j is the thermal neutron counts ,
(Aci)\ is the chlorine element content, r] is the
tool's sensitivity to the detection of chlorine
element in the formation. There are three
ways to find out the value of 77,
(i)
(2)
(3)
Obviously, r\3 is the biggest value, this means
with the use of ratio of captured chlorine
gamma ray counts to thermal neutron counts,
the best sensitivity of the detection for
chlorine element is achieved. This is an unique
advantage of new chlorine spectrum logging
tool over other chlorine logging tools .
New Crystal detector
Because the main portion of captured chlorine
gamma rays are in high energy window, if
the detecting efficiency to the high
energy gamma rays could be improved, the
measuring accuracy of the tool can be
increased. A new crystal detector ,BGO, is
selected to replace traditional Nal crystal in the
downhole tool.The detail specification and
comparison of new and old detectors are
listed in table 1.
From table 1, one can see that the density and
effective atomic number of BGO crystal is
greater than that of Nal crystal .which means
the detecting efficiency to the gamma rays,
especially high energy gamma rays, is much
improved. Although the energy discrimination
of BGO crystal is less effective than that of
Nal detector, this has a little effect for the
detection of high energy chlorine captured
gamma rays. Many experiments have shown
that the chlorine captured gamma ray counts
with BGO detector is 1.5 or 2 times compare
to that of Nal detector. Using new detector
improves the measuring accuracy of logging
tool greatly.
However, there are some disadvantages with
the use of BGO detector. Because the
temperature feature of BGO crystal is not
stable, the whole detector system must be kept
in a dewar flask. Furthermore, an automatic
spectrum stabilizer is used to improve the
stabilization of the downhole tool. This is
accomplished in measuring the reference peak
of a standard gamma ray source in the
downhole. The data representing standard
gamma ray peak are transmitted upto the
surface computer and processed, then the
feedback control data are transmitted downto
the downhole tool to adjust the high voltage of
detector. By doing so, the shifting of gamma
ray peaks detected is minimized. This makes
tool high in detecting sensitivity, good in
performance.
Main Specifications
The main specification of new chlorine
spectrum logging tool is given as follows.
Downhole tool length : 3000 mm,
Tool diameter : 102 mm
Pressure rating : 80 Mpa.
Temperature rating : 150 C°
Logging speed : 200 m/h
Three logs are recorded simultaneously with a
single logging run, they are porosity(cP),
intensity of captured Chlorine gamma rays
(Ici), and ratio of (Ic/In).
3.GEOLOGICAL DATA RESPONSE OFNEW LOGGING TOOLTheory and experiment have shown that new
chlorine spectrum logging tool can be used for
the determination of formation porosity,
chlorine ion salinity in the formation fluid, and
remaining oil saturation in the cased borehole.
Lithology response
Many experiments have been conducted in the
model wells (test pits) filled with fresh water,
table 2 shows one of the results.
From the data in table 2, a crossplot about
correlation of/„ and /c/ is drawn in figure 3.
From figure 3, we find all experiment data of
different lithologies shows a linear response.
Using linear fitting algorithm, a linear
response is derived :
Ncl=ANn+B (4)
with correlation factor of 0.998.Coefficients A
and B can be obtained by the calibrations in
Itfthe model wells.
Downhole tool calibration
Down hole tool must be calibrated first before
logging. For the calibration of downhole tool,
there are three steps to follow:
(1).Response coefficiency to lithology:
Three model wells, namely M1.M2 and M3
as indicated in table 2, are used for calibration.
There is a borehole of diameter of 206 mm in
each well. Inside each borehole, there is a steel
casing with inner diameter 13.97 mm(5.5
inches) and thickness of 9.17mm. There is
a cement between the casing and borehole.
Downhole tool is put inside the casing for
calibration.
We can get three responses in these wells,
Ncl(M2)=aNn(M2)+b (6)
(7)
This is a set of over-estimated equations, with
least square regression, coefficients a, b can be
computed.
(2). Calibration factor
The chlorine counts measured in model well
M2 is defined as 100 units of the intensity of
chlorine gamma rays (C7), intensity of chlorine
gamma ray with this unit is labeled as /c/. i.e.,
(8)
so, coefficient C can be written as:
C=100(C7)/7VcV(M2) (9)
4, = CNd (10)
dimension of above calibration unit is still the
counts per second (CPS), it does not matter
whether gamma ray or neutron is measured.
For the convenience of log interpretation, we
use the intensity of thermal neutron (/„) as
above calibration unit. We have
(3).After transformation of unit for the
counts
of chlorine captured gamma rays and thermal
neutron, a correlation in fresh water or oil-
• bearing zone (no chlorine content) can be
expressed as
Id=I« (12)
3. Tool response to formation porosity
It has been proven from both theory and
experiment that "neutron-neutron" logging or
"neutron-gamma ray " logging has an
exponent response relations to porosity in
formation with fresh water.
In® = AId+B (13)
In® = A'Id+B' (14)
In the formation with high salinity water,
because of the effect of chlorine
element ,porosity computed with equation (13)
will give a lower value, but equation (14) will
give a higher value.
Add equation(13) with equation (14), we get
equation (14) can be rewritten to
(15)
I,,=C(aNll+b) (11)
(16)
many experiments show that value of e is near
to 1 when calculating porosity with equation
(16) in formation with high salinity formation
water. Porosity calculated is less effected by
formation salinity.
Tool response to chlorine ions in formation
fluidsA lot of experiments have been done and data
are plotted in figure 4.
The best fitting response is as follows
hSo, the formation water saturation Sw is given
byO I) / D
w — w
(18)
where Pw is formation water salinity . Pw can
be obtained form the water analysis data in
particular oilfield.
In log interpretation, the coefficients of A, k in
equation (16) and W in equation (17) can be
statistically determined from the tool
measurement in cored wells.
4.APPLICATIONSWater injection development in one of the
oilfield with high formation salinity water has
more than twenty years in south of China. Now
the oilfield has come to the second stage of
development, many formations have been
waterflooded with different water intensity.
Determination of remain oil saturation is a
critical problem to be solved. More than thirty
wells have been logged with new chlorine
spectrum logging tool. Good geological results
have shown that the tool has a high successful
operation rate. The tool is less effect by
formation lithology and shale content when
determining formation remaining oil saturation
in the waterflooded intervals. Evaluation of
remaining oil saturation has a high accuracy.
For the formations with porosity of 20% ,
when formation water salinity is greater than
110,000 ppm, the error of water saturation
estimation is less than 10%. The identification
of the tool to the oil and water-bearing zones
with the use of BGO detector is increased by
10% compared with the use of Nal detector .
Determination of waterflooded formations
Example 1: Well no. GXX 5-12 in JH
oilfield, as shown in figure 5.The depth of this
well is 3300 meter, chlorine spectrum log
interpretation shows that there are two oil
zones at depth of 3266-3267.5m and 3272-
3274m, and one medium waterflooded zone at
depth of 3287.5-3290m. First , above two oil
zones are perforated and tested, with oil
production of 1 ton/day. The interpretation
agrees with the well testing. Several month
later the two oil zones are hydraulic factured,
many water produced come out from these two
zones. After running a isotope trace log, it is
founded that there is channeling between oil
zones and waterflooded zone .
Example 2: Well no. WXX-5, as shown in
figure 6. There are four interest zones at depth
of 1422.2-1423.6m,1424.0-1426.4m, 1427.8-
1429.0m,1429.8-1430.8m. Routine log and
neutron lifetime log interpretation show these
four zones are pay zones, but chlorine
spectrum log shows that the first two are pay
zones, the third and last zones have been
highly waterflooded. After perforation to these
four zones, two days later, they produce oil
and water 5.7, 0.5 tons a day respectively ,
watercut is 8%, six days later, with oil 12.9
tons, water 2.8 tons, watercut 18%. One
month later, it becomes oil 5.3 tons, water 6.2
tons, watercut 54%. Chlorine log interpretation
agrees with well production data.
Determination of remain oil saturation
Example 3: Well no. 36 MXX 4-61, as shown
in figure 7. This is an infill well, the depth is
1480 meter, there are 11 thin oil-bearing
interbeded zones. Log interpretation is difficult.
Chlorine spectrum log interpretation in these
zones shows good agreement with integrated
log evaluation. ROS and porosity data
calculated are reliable as compare with core
data.
5.SUMMARYIt is a good tool for the evaluation of remainingoil saturation in the formation , new chlorine
spectrum logging tool must be used in the
oilfields with high salinity formation water. It
give good indications in the cased borehole
with formation porosity greater 10% and water
salinity greater 40000 PPM. The favorable
condition for the tool's application is the
formation porosity of 15%, formation water
salinity of 80000 (or more), good geological
results can be obtained as expected.
6.ACKNOWLEDGEMENTS
The authors wish to thank Mr. Peng Shiling,
Liu Chonghan for their contribution in
preparing this paper.
PREFERENCESWu Xuecao etc., Experimenting methods of
atomic nucleus physics, Atomic energy press,
Beijing, 1986, 120.
Huang Nongji , Principles of radioactivity well
logging , Petroleum industry press, Beijing,
1983,4.
Wu Gengfei, He Qingyuan, Hu Xinmiao,
Chlorine logging tool and its application, '94
Transaction of international symposium on
well logging, Xi'an, 1994.
Waddell etc. , Chlorine and porosity
determination in cased and open boreholes by
nuclear logs, SPE paper 1456.
Table 1: specification and comparison of new and old detectors
Detector Crystal
Material
BGO
Nal
Size
diameter,length
(mm)
50x100
50x100
Density
(g/cm3)
7.13
3.67
Effective
atomic number.
75
51
Energy
resolution*
9.3%
6.5%
* resolution of Ig/cm3 crystal to gamma ray of 622 MeV.
Table2: one of the results of lithology response in the calibration wells
lithology
well nubmer
porosity(%)
Nn
Ncl
limestone
Ml
35.7
236
68
M2
16.5
458
138
M6
1.0
112
318
M26
6.8
701
200
M31
25.2
346
102
dolomite
M15
15.2
446
122
M8
25.4
329
88
M5
8.8
570
157
M10
1.6
991
267
M34
32.8
268
73
sandstone
M12
18.0
465
135
Mil
39
239
69
M4
10.8
712
207
M7
25.0
385
108
M30
7.7
780
231
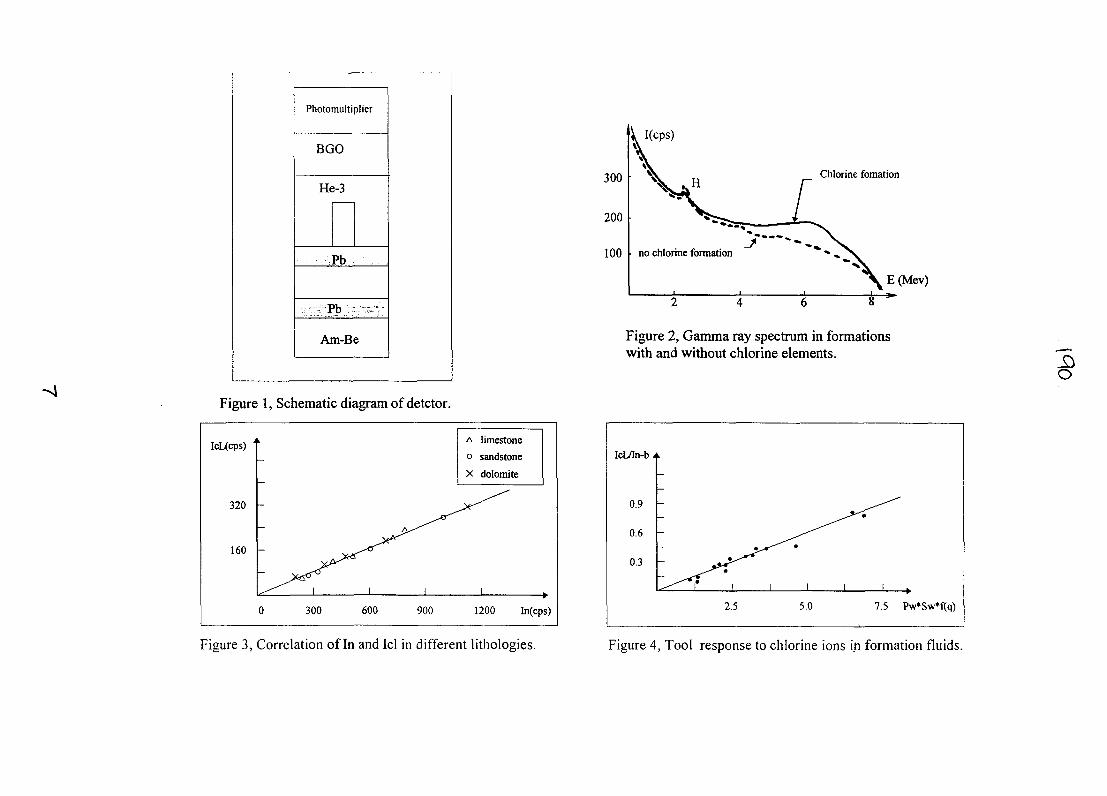
Photomultiplier
BGO
He-3
Pb
Am-Be
Figure 1, Schematic diagram of detctor.
IcL(cps) '
320
160
-
-
0
1
300
1
600
1
900
A limestone
o sandstone
X dolomite
1 ,
1200 In(cps)
Figure 3, Correlation of In and Icl in different lithologies.
300
200
100
I(cps)
Chlorine fomation
no chlorine formation
E (Mev)
Figure 2, Gamma ray spectrum in formationswith and without chlorine elements.
IcL/In-b -
0.9
0.6
0.3
—
2.5 5.0 7.5 Pw*Sw*f(q)
Figure 4, Tool response to chlorine ions in formation fluids.
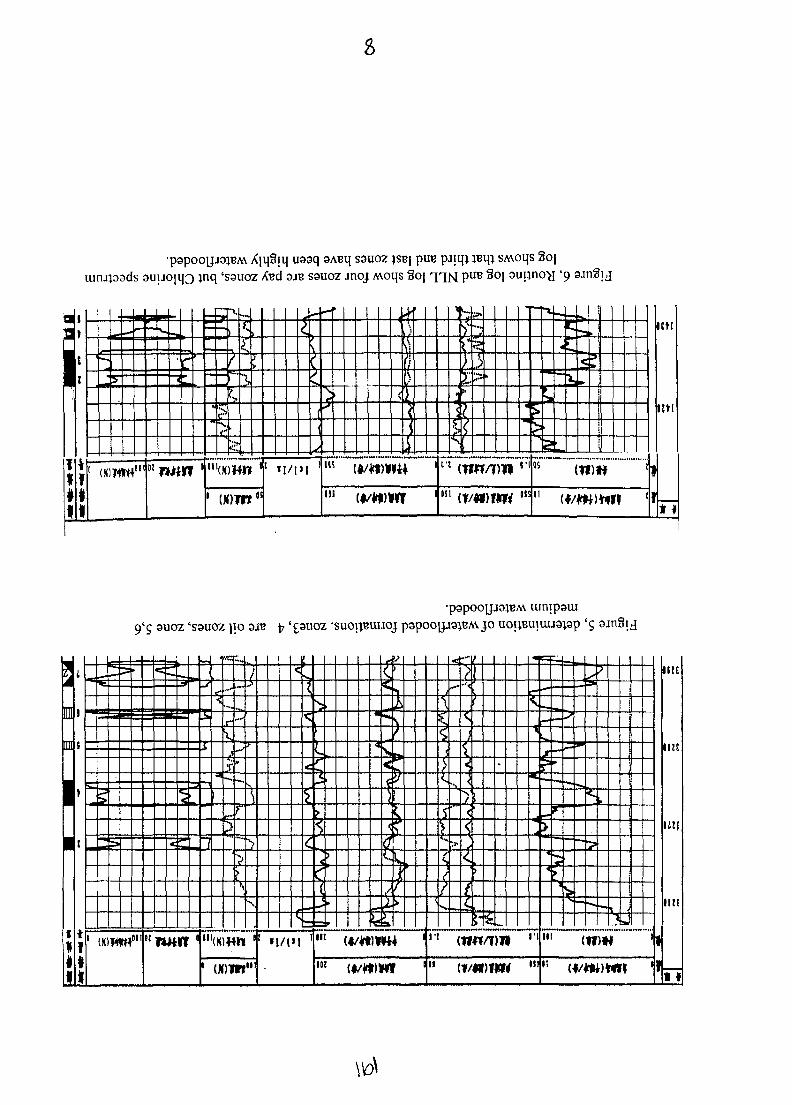
pp XjqSiq uaaq 3ABq sauoz JSBJ pire pjiqj }Bqj SMoqs 3o|uitupads suuojqo jnq 'sauoz /tod are SSUOZ jnoj Moqs 3oj qqN pire §oj auijno-y '9
f{1t1
*f4i
—1 *-*
IS
1 OOWM1"
E
"-
1
nWWI '
wm
_ _
1
^
_
f
pT
• I " "
<
\
>
!!I(X)HW '
1 mmn
f
I\\
(
! M/1M '
HI
<i)
"! wwcm
)
1a
1
»-n><
55
,)1
l<t (tm/?)Ti •''IS1 ( t / « )TW oi!
• ^
—i
1
- « .
•c
r
?
~
• • ^• ™ -
•
r*-*
i,
pi.
< 3m
Etl
lit!
» *
9'5 3U0Z 'S9UOZ
uinipatu
I
m
l
s
1
f
*1
t1#1
«**
• •
•m
ma
s
>
• M =•
1 (Kim*111
us
J
* • »
• • 1
a
am
* * •
• •
M M
<
• • • • •
9! I B
"Wil l •
_
sz
J••»•#
J*
f
?f
f
>
'"(K)Htt '
<
c M l
1 I I / P I '
5
• » *
?
k
p
<
\
1f}
<
)
s
;
\i.
<f
1
j
<j
•s ,
>
}-<
;
\
—.\\4
>|
<>
f l i
11 ivmim •"
M a
>
boa
»
»
"1
>
M M
PS
• • 1
•*•
<
— E_
111 (tf)« 1
IIU
IIU
li!f
IKE
11
il
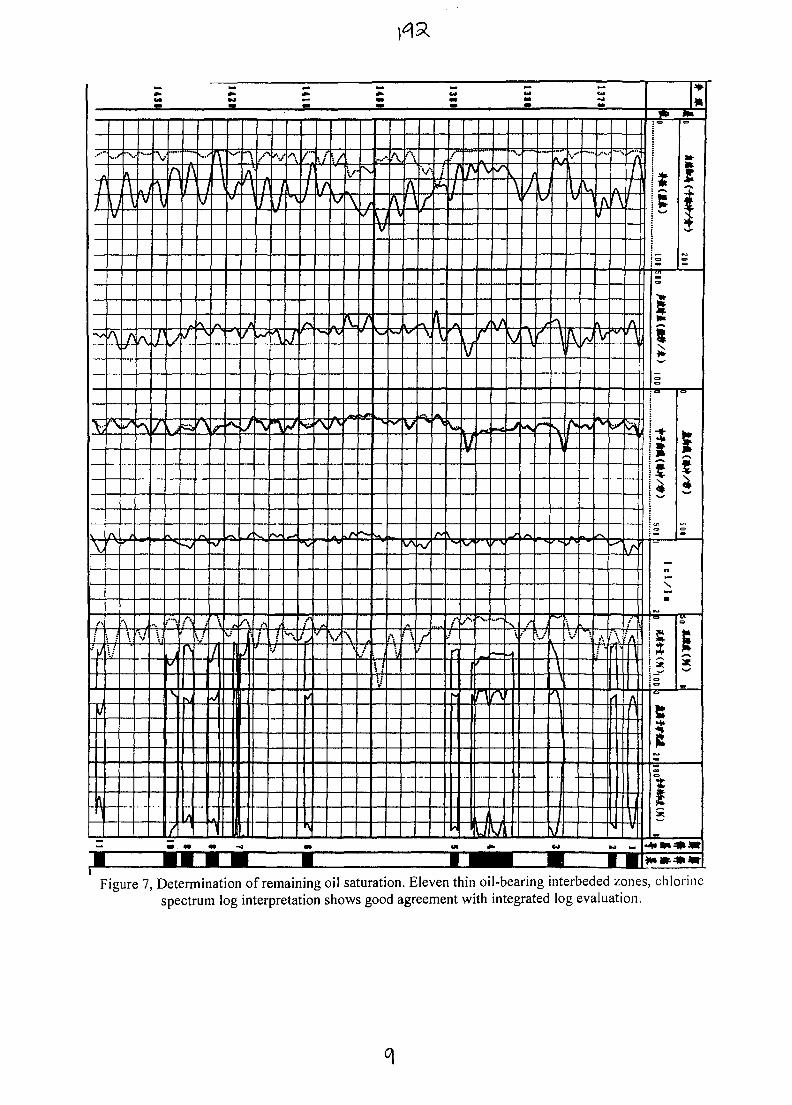
1431
1371
1311
1311
Mil
Mil
1421
s'" ^s
JfoV
-4
,-,II/
i
\
Ay
h
...
^
'V .
V
V
•-
A 7\
I LJ.\ W
v.
T""" ni z1A;
f\ ^ A
1 ,A A
7 j
• • II •
J
t
i
L i
_*\
1
Zl
/' r
*\
. \
•
/ I
/
V
/ V
v
\/
V
\
•s,
/
</>
\jV
iv
A,
\V
"\
v
A
A
\
V
\
r-iZtil
r
XA\A
iZ
/" \ ^
ZEI^H
y \
/ A .
V''
1
Ilil\
\/\f v
\rVj
\\
J
\v
j
•
J
A/
1A\ /
A
' V
T
/ \. ;'A
' I V1| J
AlM
j
I
11y1
ll• 1 5iit c .
j>
I
i•w
n
!
i ^
I
II
Figure 7, Determination of remaining oil saturation. Eleven thin oil-bearing interbeded zones, chlorinespectrum log interpretation shows good agreement with integrated log evaluation.
°l
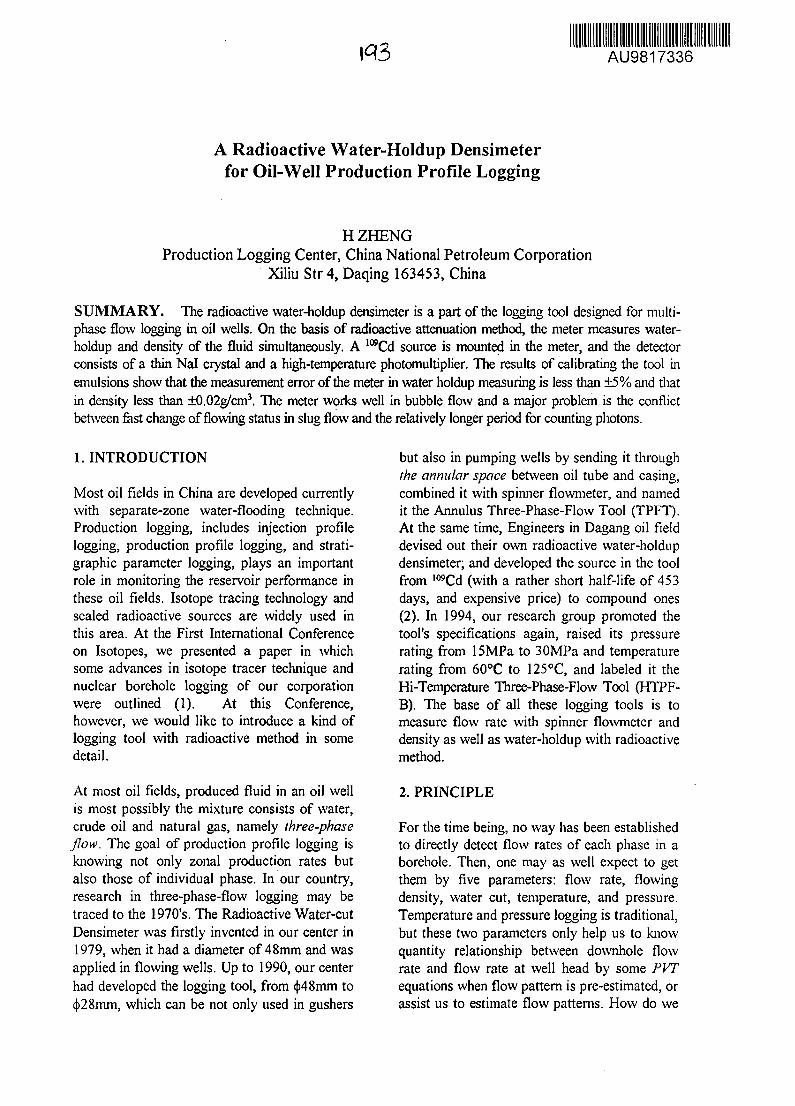
AU9817336
A Radioactive Water-Holdup Densimeterfor Oil-Well Production Profile Logging
H ZHENGProduction Logging Center, China National Petroleum Corporation
Xiliu Str4, Daqing 163453, China
SUMMARY. The radioactive water-holdup densimeter is a part of the logging tool designed for multi-phase flow logging in oil wells. On the basis of radioactive attenuation method, the meter measures water-holdup and density of the fluid simultaneously. A 109Cd source is mounted in the meter, and the detectorconsists of a thin Nal crystal and a high-temperature photomultiplier. The results of calibrating the tool inemulsions show that the measurement error of the meter in water holdup measuring is less than ±5% and thatin density less than ±0.02g/cm3. The meter works well in bubble flow and a major problem is the conflictbetween fast change of flowing status in slug flow and the relatively longer period for counting photons.
1. INTRODUCTION
Most oil fields in China are developed currentlywith separate-zone water-flooding technique.Production logging, includes injection profilelogging, production profile logging, and strati-graphic parameter logging, plays an importantrole in monitoring the reservoir performance inthese oil fields. Isotope tracing technology andsealed radioactive sources are widely used inthis area. At the First International Conferenceon Isotopes, we presented a paper in whichsome advances in isotope tracer technique andnuclear borehole logging of our corporationwere outlined (1). At this Conference,however, we would like to introduce a kind oflogging tool with radioactive method in somedetail.
At most oil fields, produced fluid in an oil wellis most possibly the mixture consists of water,crude oil and natural gas, namely three-phaseflow. The goal of production profile logging isknowing not only zonal production rates butalso those of individual phase. In our country,research in three-phase-flow logging may betraced to the 1970's. The Radioactive Water-cutDensimeter was firstly invented in our center in1979, when it had a diameter of 48mm and wasapplied in flowing wells. Up to 1990, our centerhad developed the logging tool, from <|>48mm tocj)28mm, which can be not only used in gushers
but also in pumping wells by sending it throughthe annular space between oil tube and casing,combined it with spinner flowmeter, and namedit the Annulus Three-Phase-Flow Tool (TPFT).At the same time, Engineers in Dagang oil fielddevised out their own radioactive water-holdupdensimeter; and developed the source in the toolfrom 109Cd (with a rather short half-life of 453days, and expensive price) to compound ones(2). In 1994, our research group promoted thetool's specifications again, raised its pressurerating from 15MPa to 30MPa and temperaturerating from 60°C to 125°C, and labeled it theHi-Temperature Three-Phase-Flow Tool (HTPF-B). The base of all these logging tools is tomeasure flow rate with spinner flowmeter anddensity as well as water-holdup with radioactivemethod.
2. PRINCIPLE
For the time being, no way has been establishedto directly detect flow rates of each phase in aborehole. Then, one may as well expect to getthem by five parameters: flow rate, flowingdensity, water cut, temperature, and pressure.Temperature and pressure logging is traditional,but these two parameters only help us to knowquantity relationship between downhole flowrate and flow rate at well head by some PVTequations when flow pattern is pre-estimated, orassist us to estimate flow patterns. How do we
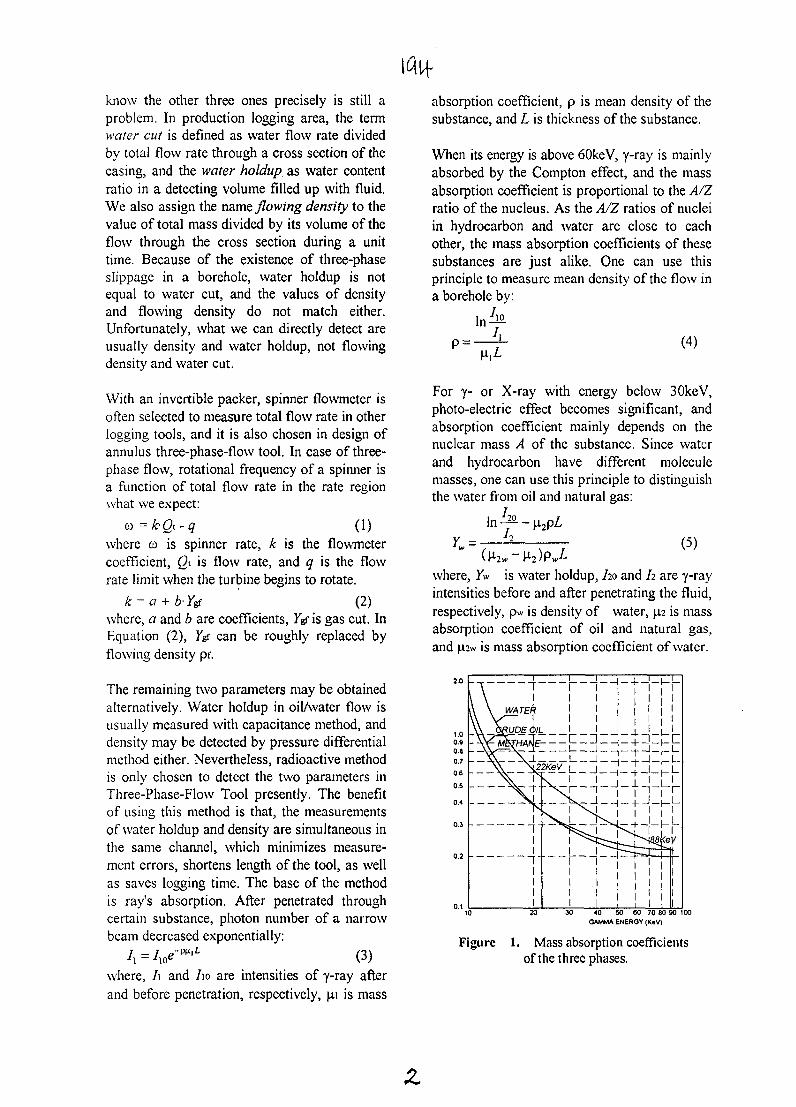
know the other three ones precisely is still aproblem. In production logging area, the termwater cut is defined as water flow rate dividedby total flow rate through a cross section of thecasing, and the water holdup as water contentratio in a detecting volume filled up with fluid.We also assign the name flowing density to thevalue of total mass divided by its volume of theflow through the cross section during a unittime. Because of the existence of three-phaseslippage in a borehole, water holdup is notequal to water cut, and the values of densityand flowing density do not match either.Unfortunately, what we can directly detect areusually density and water holdup, not flowingdensity and water cut.
With an invertible packer, spinner flowmeter isoften selected to measure total flow rate in otherlogging tools, and it is also chosen in design ofannulus three-phase-flow tool. In case of three-phase flow, rotational frequency of a spinner isa function of total flow rate in the rate regionwhat we expect:
a>=kQi-q (1)where co is spinner rate, k is the flowmetercoefficient, Qi is flow rate, and q is the flowrate limit when the turbine begins to rotate.
k = a + b-Y$ (2)where, a and b are coefficients, Jgf is gas cut. InEquation (2), 7gf can be roughly replaced byflowing density pf.
The remaining two parameters may be obtainedalternatively. Water holdup in oil/water flow isusually measured with capacitance method, anddensity may be detected by pressure differentialmethod either. Nevertheless, radioactive methodis only chosen to detect the two parameters inThree-Phase-Flow Tool presently. The benefitof using this method is that, the measurementsof water holdup and density are simultaneous inthe same channel, which minimizes measure-ment errors, shortens length of the tool, as wellas saves logging time. The base of the methodis ray's absorption. After penetrated throughcertain substance, photon number of a narrowbeam decreased exponentially:
A = V-PH,L (3)
absorption coefficient, p is mean density of thesubstance, and L is thickness of the substance.
When its energy is above 60keV, y-ray is mainlyabsorbed by the Compton effect, and the massabsorption coefficient is proportional to the A/Zratio of the nucleus. As the A/Z ratios of nucleiin hydrocarbon and water are close to eachother, the mass absorption coefficients of thesesubstances are just alike. One can use thisprinciple to measure mean density of the flow ina borehole by:
p = - (4)
For y- or X-ray with energy below 30keV,photo-electric effect becomes significant, andabsorption coefficient mainly depends on thenuclear mass A of the substance. Since waterand hydrocarbon have different moleculemasses, one can use this principle to distinguishthe water from oil and natural gas:
(5)
where, 7w is water holdup, ho and h are y-rayintensities before and after penetrating the fluid,respectively, pw is density of water, p is massabsorption coefficient of oil and natural gas,and p.2w is mass absorption coefficient of water.
j.o - _ L
0.5 -
30 40 50 60 70 $0 90 100GAMMA ENEROY (KeV)
Figure 1. Mass absorption coefficientsof the three phases.
where, I\ and 7io are intensities of y-ray afterand before penetration, respectively, u.i is mass
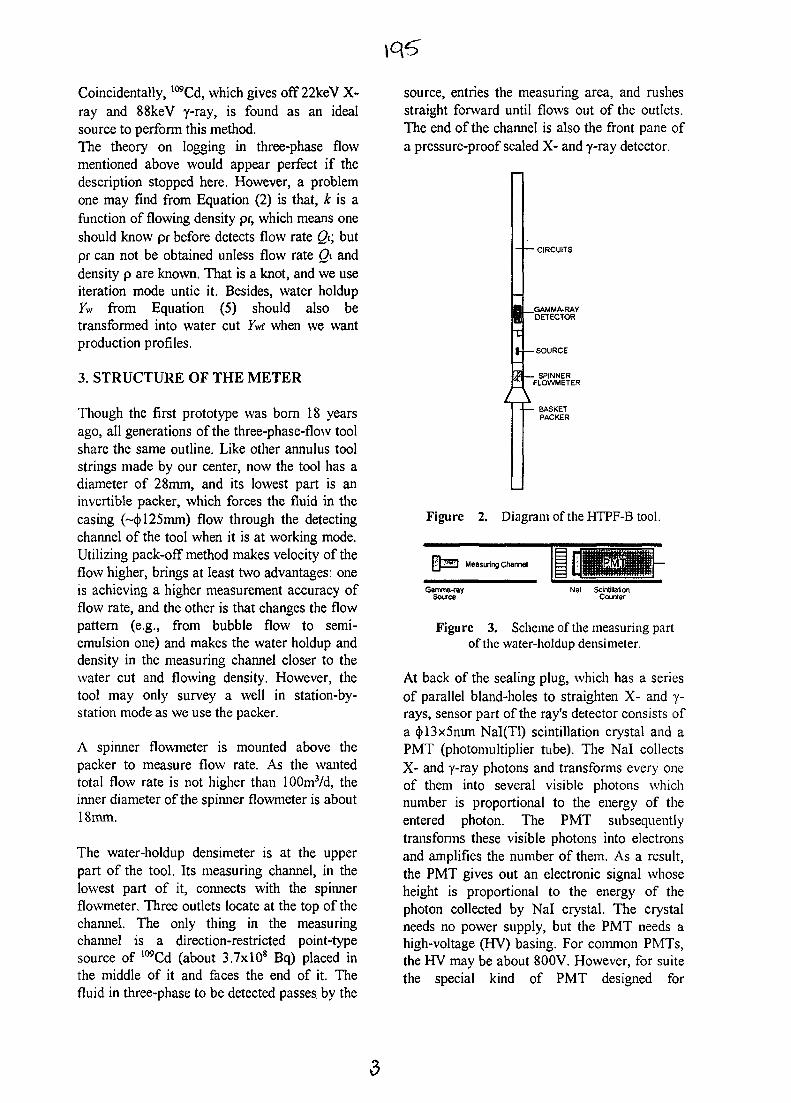
Coincidentally, l09Cd, which gives off 22keV X-ray and 88keV y-ray, is found as an idealsource to perform this method.The theory on logging in three-phase flowmentioned above would appear perfect if thedescription stopped here. However, a problemone may find from Equation (2) is that, A: is afunction of flowing density pr, which means oneshould know pr before detects flow rate Q\; butpf can not be obtained unless flow rate Qt anddensity p are known. That is a knot, and we useiteration mode untie it. Besides, water holdup7w from Equation (5) should also betransformed into water cut JW when we wantproduction profiles.
3. STRUCTURE OF THE METER
Though the first prototype was born 18 yearsago, all generations of the three-phase-flow toolshare the same outline. Like other annulus toolstrings made by our center, now the tool has adiameter of 28mm, and its lowest part is aninvertible packer, which forces the fluid in thecasing (~(j) 125mm) flow through the detectingchannel of the tool when it is at working mode.Utilizing pack-off method makes velocity of theflow higher, brings at least two advantages: oneis achieving a higher measurement accuracy offlow rate, and the other is that changes the flowpattern (e.g., from bubble flow to semi-emulsion one) and makes the water holdup anddensity in the measuring channel closer to thewater cut and flowing density. However, thetool may only survey a well in station-by-station mode as we use the packer.
A spinner flowmeter is mounted above thepacker to measure flow rate. As the wantedtotal flow rate is not higher than lOOmVd, theinner diameter of the spinner flowmeter is about18mm.
The water-holdup densimeter is at the upperpart of the tool. Its measuring channel, in thelowest part of it, connects with the spinnerflowmeter. Three outlets locate at the top of thechannel. The only thing in the measuringchannel is a direction-restricted point-typesource of !09Cd (about 3.7xlO8 Bq) placed inthe middle of it and faces the end of it. Thefluid in three-phase to be detected passes, by the
source, entries the measuring area, and rushesstraight forward until flows out of the outlets.The end of the channel is also the front pane ofa pressure-proof sealed X- and y-ray detector.
- CIRCUITS
_GAMMA-RAYDETECTOR
-SOURCE
. SPINNERFLOWMETER
BASKETPACKER
Figure 2. Diagram of the HTPF-B tool.
Measuring Channel iGamma-ray
SourceNal Scintillation
Counter
Figure 3. Scheme of the measuring partof the water-holdup densimeter.
At back of the sealing plug, which has a seriesof parallel bland-holes to straighten X- and y-rays, sensor part of the ray's detector consists ofa <|>13x5nim Nal(Tl) scintillation crystal and aPMT (photomultiplier tube). The Nal collectsX- and y-ray photons and transforms every oneof them into several visible photons whichnumber is proportional to the energy of theentered photon. The PMT subsequentlytransforms these visible photons into electronsand amplifies the number of them. As a result,the PMT gives out an electronic signal whoseheight is proportional to the energy of thephoton collected by Nal crystal. The crystalneeds no power supply, but the PMT needs ahigh-voltage (HV) basing. For common PMTs,the HV may be about 800V. However, for suitethe special kind of PMT designed for
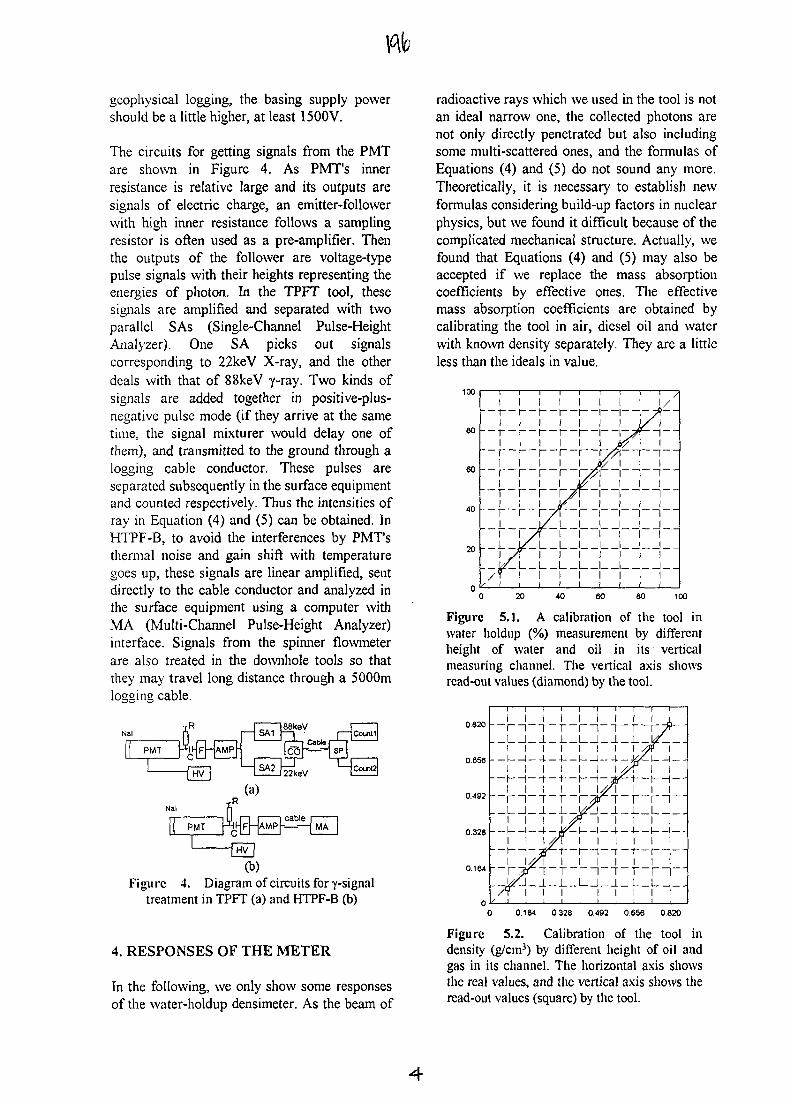
flfc
geophysical logging, the basing supply powershould be a little higher, at least 1500V.
The circuits for getting signals from the PMTare shown in Figure 4. As PMT's innerresistance is relative large and its outputs aresignals of electric charge, an emitter-followerwith high inner resistance follows a samplingresistor is often used as a pre-amplifier. Thenthe outputs of the follower are voltage-typepulse signals with their heights representing theenergies of photon. In the TPFT tool, thesesignals are amplified and separated with twoparallel SAs (Single-Channel Pulse-HeightAnalyzer). One SA picks out signalscorresponding to 22keV X-ray, and the otherdeals with that of 88keV y-ray. Two kinds ofsignals are added together in positive-plus-negative pulse mode (if they arrive at the sametime, the signal mixturer would delay one ofthem), and transmitted to the ground through alogging cable conductor. These pulses areseparated subsequently in the surface equipmentand counted respectively. Thus the intensities ofray in Equation (4) and (5) can be obtained. InHTPF-B, to avoid the interferences by PMT'sthermal noise and gain shift with temperaturegoes up, these signals are linear amplified, sentdirectly to the cable conductor and analyzed inthe surface equipment using a computer withMA (Multi-Channel Pulse-Height Analyzer)interface. Signals from the spinner flowmeterare also treated in the downhole tools so thatthey may travel long distance through a 5000mlogging cable.
Figure 4. Diagram of circuits for 7-signaltreatment in TPFT (a) and HTPF-B (b)
4. RESPONSES OF THE METER
In the following, we only show some responsesof the water-holdup densimeter. As the beam of
radioactive rays which we used in the tool is notan ideal narrow one, the collected photons arenot only directly penetrated but also includingsome multi-scattered ones, and the formulas ofEquations (4) and (5) do not sound any more.Theoretically, it is necessary to establish newformulas considering build-up factors in nuclearphysics, but we found it difficult because of thecomplicated mechanical structure. Actually, wefound that Equations (4) and (5) may also beaccepted if we replace the mass absorptioncoefficients by effective ones. The effectivemass absorption coefficients are obtained bycalibrating the tool in air, diesel oil and waterwith known density separately. They are a littleless than the ideals in value.
100
80 - —i i i I
60 - — i
1— 1 ~
I— T
IVITITIIII]_I\A
I— |
I~r~-
i~ i
I~r~
i
~r~iiii /
yv~I
it—iri
ri
ririr\/fi_ii_ii
i— ( —
i- r
i
- ri~ r
i— p
kTVI
_ LI[_II
I_ l — | —
I~ l 1 —
I—I
I <
iiiiii_i
— —
_ _
— 1 ~\/
--\~i
i~~\~
iiii
\ /
\— i —
i~i
i—i
i _ _
iiii
_J_J_Ji
_ji
i_i
i
40 - - f - r - -
20 - - * - - *=• -h -h - -~ - - -
20 80 100
Figure 5.1. A calibration of the tool inwater holdup (%) measurement by differentheight of water and oil in its verticalmeasuring channel. The vertical axis showsread-out values (diamond) by the tool.
0.820
0.658 - -
0.492 - —
0.328 - -
0.164 - —
0 0.164 0.328 0.492 0.656 0.820
Figure 5.2. Calibration of the tool indensity (g/cm3) by different height of oil andgas in its channel. The horizontal axis showsthe real values, and the vertical axis shows theread-out values (square) by the tool.
I I
I II I
-_LJ_i I
. _ k - _ l _I I
1~~\A-I
4 -1
— I—I—i- —I II I
__l l_I II 1
1 I—1—1~~
1 \6
/T 1
17 ~_ L _
11
"\
7_L1
1TL14-1
+-1ri.
-f-1y
1
1 11 i
_LJ_1 1
_ l _ | _1 1
— |— —\ —
- ' - ^
~^?~-\--A-
1 1— f-—| —
1 1T l "
| |1 11 1
1 17 ~ r-L_L1 l
4 - ^\ /A
~\ 11~T
| 11 1
4-4-1 1
7 - 1 "I I
7 ~ r
I I
/$ i/L\—1_.
I I- I — 1 - -
I II I
_l l_ .
- I — 1 - -I |
_l l _ .
_L_J__L_J_JI I 1 I
1 I
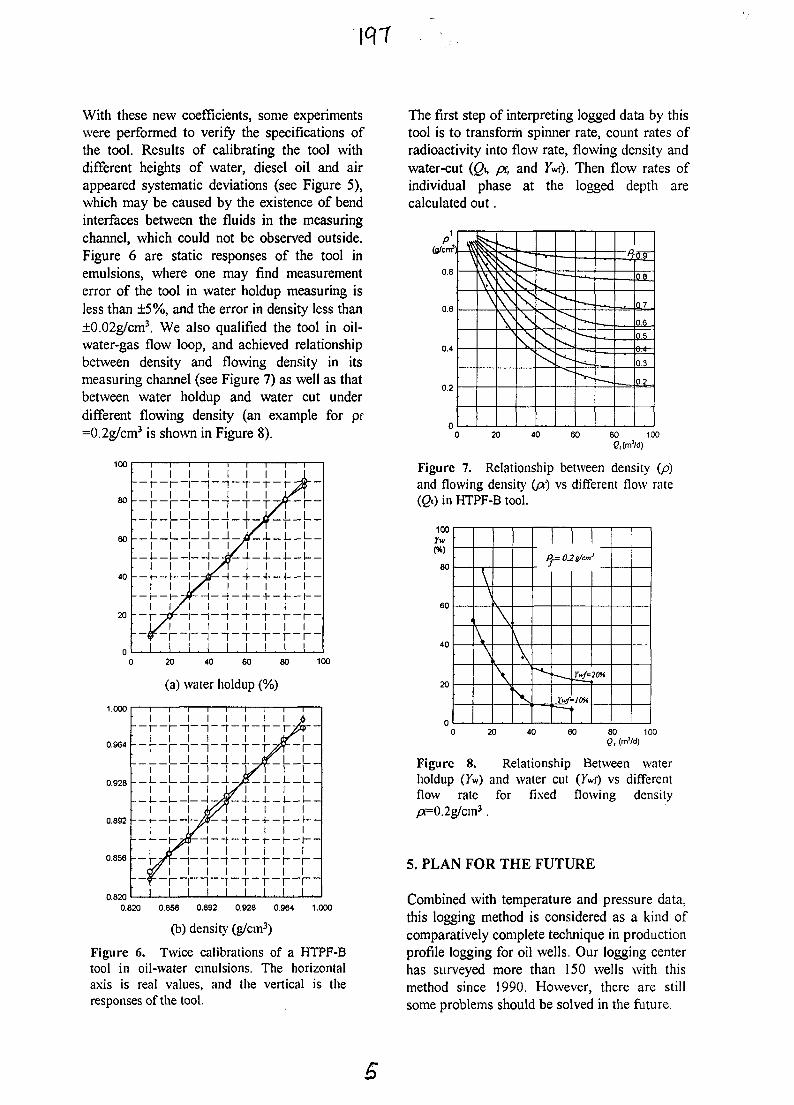
With these new coefficients, some experimentswere performed to verify the specifications ofthe tool. Results of calibrating the tool withdifferent heights of water, diesel oil and airappeared systematic deviations (see Figure 5),which may be caused by the existence of bendinterfaces between the fluids in the measuringchannel, which could not be observed outside.Figure 6 are static responses of the tool inemulsions, where one may find measurementerror of the tool in water holdup measuring isless than ±5%, and the error in density less than±0.02g/cm3. We also qualified the tool in oil-water-gas flow loop, and achieved relationshipbetween density and flowing density in itsmeasuring channel (see Figure 7) as well as thatbetween water holdup and water cut underdifferent flowing density (an example for pf=0.2g/cm3 is shown in Figure 8).
100
80
60
40
20
—r-i—i—i —r —i—i— 11
j _i j
•f-H.J i i,i i i
-I—U-lI I I
- - 4 - - I I
i I
I I I
-\-l-i-ryr-r-L-!H-i#f-hi i L_y.±_j L.
i \ / \ i i iI 1_^.4--4—4--U--
\S\ I I I Ii— y - -t — i — i — - i— t--
i i i i i iH-4--|-- + --t--t--
I I I I I I—I 1 1 1 — 1 1 - -
I I I I I Ii ~ i ~ T - T - r - r"
i l l i i .20 60 80
(a) water holdup (%)
1.000
0.964 - - • < - - -
0.928
0.892
0.856 - —
0.820
i
ipiiL1
--i-1
1
1
~ l11
1
i i
i i1 _ _ ri ii i
1
1" j
11
J 1 L_1 1
—1—1—1-1 i y
1—t~
1—t~~
w.. 1
1
itfr~' i
\y 1tf--\-1 1
1 1~i—i—r. i . 1 , 1
7\~- 4 -1
- - t -1
~ T ~1
~ T ~, 1 ,
1
1
1
17M
1 ~4 - -1+ -1• t -1
T -1
"I| ,
1
1T
kTj _
I4-1¥I
•t-
1riI
i
-K' i
i_ L
I-V-
1-V-
1
\~\—
ii
_ L _1
-111
1_l 1
1- r_ i
. i
1— |
1_ (
I0.820 0.856 0.892 0.928 0.964 1.000
(b) density (g/cm3)
Figure 6. Twice calibrations of a HTPF-Btool in oil-water emulsions. The horizontalaxis is real values, and the vertical is theresponses of the tool.
The first step of interpreting logged data by thistool is to transform spinner rate, count rates ofradioactivity into flow rate, flowing density andwater-cut {Qx, pi, and 1W). Then flow rates ofindividual phase at the logged depth arecalculated out.
0.8
0.6
0.4
0.2
\ \ s
\
—•••a
\ \
s.
—*-,
• ~ —
^ ^ —
• — .
— • * —
jiit-
0.7
0.6
0 5
03
0.2
20 40 60 80 100
Figure 7. Relationship between density (p)and flowing density (jx) vs different flow rate(GO in HTPF-B tool.
100
(*)
80
60
20
\
\
\
\
\\
\
P,= OJg/cm
——
Ywf-
i
Ywf=20H
'10%
20 40 60 80Q, <
100
Figure 8. Relationship Between waterholdup (Yvi) and water cut (Xwf) vs differentflow rate for fixed flowing densitypr=0.2g/cm3.
5. PLAN FOR THE FUTURE
Combined with temperature and pressure data,this logging method is considered as a kind ofcomparatively complete technique in productionprofile logging for oil wells. Our logging centerhas surveyed more than 150 wells with thismethod since 1990. However, there are stillsome problems should be solved in the future.
\a%
The primary problem in the radioactive water-holdup densimeter originates from the principle.Any measurement with radioactive methodrequires a period of time to collect photons.Given fixed average counting rate, the longerperiod a measurement takes, the more counts ofphoton accumulate, and the smaller the relativeerror of count rate will be. Actually, averagecount rate of 22keV ray is fairly low in thecurrent meter when the measuring channel isoccupied mainly by water, and a longermeasurement period is appreciated under thiscondition. However, longer period is not alwayssuitable. In case of bubble or emulsion flow,flowing status in the measuring channelchanges barely along with time elapsing; butthe status changes radically in slug flow — 6 to8 gas clusters pass through during one minute.Therefore, a conflict between fast change offlowing status and long period for countingappears.
This problem may be solved in two ways. Onthe one hand, a source with higher intensity canbe mounted in the meter, or a nearer distancebetween the source and detector can be chosen.On the other hand, an adjustable time windowcan be set in the acquisition software to suit thechanges of flow pattern, and data regress
technique may also be employed to minimizethe relative errors in count rate.
Our logging center has enlisted a projection ofdeveloping this logging tool into our next five-years plan. It is expected to merge the presenttool with temperature and pressure sondes,digitize the downhole tool, and fulfill it withtelemetry mode in order to obtain the fiveparameters simultaneously. It is also wanted toraise technical specifications of the tool, suchas its temperature and pressure ratings, and itsmeasurement accuracy of individual flow rates.
REFERENCES
(1) Jiang W D and H Zheng, Some Applicationsand Developments of Isotope Tracer andRadiation Technology in Chinese Oil FieldMonitoring, International Conference onIsotopes, May 7-12, 1995, Beijing, China.Abstracts pp. 145-146
(2) Sun F X , The Water-Cut Analyzer with an241Arn-Ag source, InternationalConference on Isotopes, May 7-12, 1995,Beijing, China. Abstracts pp.451-452
AU9817337A Djaloeisj. BATAN: Development and Application od Isotopes and Radiation Technology in Indonesia
Development and Application ofIsotope and Radiation Technology in Indonesia
ADJALOEISNational Atomic Energy Agency BATAN
Jalan Abdul Rbhim, Kuningan Barat, Mampang Prapatan,Jakarta 12043, Indonesia
SUMMARY. This paper presents a brief review of tile development and application of isotope andradiation te^nnology in Indonesia. The role of the National Atomic Energy Agency BATAN and theoverall strategy for the development and application of nuclear science and technology in Indonesiais first described, followed by the description of activities in three important areas, namelyAgriculture, livestock and Industry.
1. INTRODUCTION
On behalf jdf the National Atomic EnergyAgency (BATAN) of the Republic ofIndonesia ll\yish first all to extend my sincereappreciation t and thanks for the honourbestowed upjon me to give an invited talk atthisjfprestjgjious meeting 'The SecondInternational Conference on Isotopes" heldhere : l i - jl£ October 1997 in this beautifulcity of Sydjn^y, where I did my undergraduateistudyrin PJivkics and Mathematics over thirty
As a scientist and as a manager of a nuclearscience anjj technology agency in adevelopingl country, I am convinced that thismeeting woiuld give the participants lot ofbenefits. Njoj only shall We be informed on thelatest projg|ess of the technology andapplication! pf isotopes worldwide, but thismeetirig will also give excellent opportunity torenew old ifikendships and start new ones.
This; paper gives a brief overview on thedevelopment and application isotopetechnology in Indonesia, in particular in meNational Atiomic Energy Agency (BATAN).Due to thjei wide spectrum of the research,development and application areas of thistechnology, [this paper concentrates only threeareas, nainiBly Agriculture, Livestock andIndustry.
2. ISOTOPES AND RADIATION
In accordance with the Indonesian AtomicEnergy Law No. 31/1964 and the Nuclear ActNo. 10/1997, BATAN as the highest nationalauthority is charged among others with thetasks to apply, develop and disseminateatomic and nuclear science and technology forpeaceful purposes in order to bring benefitsfor the safety, health and welfare of theIndonesian people.
The main emphasis of BATAN's scientific-technical activities is concentrated on theapplying nuclear techniques as an additionaltool in an effort to solve various nationalproblems, such as in the fields of Agricultureand Food, Livestock, Human Health* Industry,Energy and Environment. In order to beeffective and efficient, these applicationoriented activities are supported byappropriate scientific research and technologydevelopment (R&D). At the same time,Indonesia as a developing countrycontinuously improves the scientific-technicalfacilities and infrastructures as well as thecapability of the human resources incollaboration with or with the assistance ofpartners from technologically advancedcountries.
Presently with the total number of employeesover 4000 people, BATAN's activities inscientific Research and technologicalDevelopment and Aplication (R-D<$A) of
page: 1
A Djaloeis. BATAN: Development and Application od Isotopes and Radiation Technology in Indonesia
isotopes ana radiations may be classified intothe following major target areas:
O Agriculture
Activities in jthe field of agriculture may bedevided inty three broad areas, namelycreation of'new and specific plant varieties,eradication: cjf harmful insects and seekingways to optirhize plant growth and the use offertilizers t() Suit the soil characteristics; withrespect to food, the activities are concentratedon the development and application of nucleartechniques jtoi achieve food security and foodsafety,and .to! promote food trade.
© Livestock
Activities concerning livestock may bedevided hito three broad areas, namelylivestock growth. - optimization throughappropriate feed supplementation strategies,eradication of livestock deseases, andoptimization of livestock reproduction.
With the total population reaching alreadyover 200 million people, the problem of foodsecurity and food safety are of fundamentalimportance to Indonesia. Efforts arecontinuosly intensified to achieve the stageself sufficiency in the production of basicfood. To support the government programmein the field' of Agriculture and Livestock,SATAN hag developed strong collaborationswith the Universities, with the Directorate ofLivestock Services of the Department ofAgriculture and with the government agenciesat the province level to set up and implementendkiser omented activities with optimalsacioreconotnic impacts.
0 Industry
Activities may be categorized into three broadareas, namely process monitoring and control,preservation, and sterilization, and materialscharaterizatipn and modification. BATAN hassuccessfully introduced various techniques tothe, industries; however, there is still room forimprovement in public information andeducation on the benefits of nucleartechniques.
©Human Health
Activities in this field are still mainlyconcentrated on the development of nuclear
medicine facilities, and use those facilities inthe study and diagnosis of the functions ofvarious human organs, while brachitherapy isstill in its infancy.
O Environment
This area of activities is still relatively new.Activities are so far still concentrated on thedevelopment of the appropriate techniques,development of capabilities and expertise inthe experimental design, sampling techniquesand sample analysis, in order to determine thetype, amount, source, dispersion anddeposition of harmful contaminants in air,water Mid soil samples.
The required radioisotopes are mainlyproduced using the 30 MW "RSG-GASiwabesy" multi-purpose research reactorlocated at BATAN's new research complex inSerpong (West Java) and using the 1 MWTriga Mark II research reactor located atBATAN's Research Center for. NuclearTechniques (PPTN) in Bandung (West Java).Electron beam irradiation is accomplished bymeans of the existing 300 KeV and 2 MeVelectron accelerators located at BATAN'sCenter for the Application of Isotopes andRadiation (PAIR). In addition, BAIR alsoposesses several gamma irradiators.Experimental activities using neutron beamsare carried out by BATAN's Research Centerfor Materials Science located in Serpong,whereas ion beam irradiation works areconducted at BATAN's Nuclear ResearchCenter located in Yogayakarta (Central Java).The first commercial gamma irradiator wasinstalled and operated by a private companycalled "PT Indogamma", whose activities areso far concentrated mainly on the irradiationfor the sterilization and pasteurizationpurposes.
Let me now describe the first three areasmentioned above, namely Agriculture andFood, Livestock and Industry in somewhatmore details.
3. AGRICULTURE
Some highlights of activities in the field ofagriculture are as follows:
page:
A D/aloeb BAT AN: Development and Application od Isotopes and Radiation Technology in Indonesia
U New plant varieties through radiationinduced mutation
The objectijv£ here is to obtain agriculturalcrop varieties with special characteristicsthrough thfe : process of radiation inducedmutation. Jd date BATAN in collaborationwith; the JDfcpartment of Agriculture hasreleased majhy new varieties of foodcrops suchas rice variety Atomita I (1982),- Atomita II(1983), Atjojnita ffl (1990), Atomita IV(1991), Sitjjgintung (1992), Cilosari (1996),green bean flUTuria (1990), Tengger (1991) andmungbeart (1991) which specialcharactfiristitjs, such as high yield, earlymaturity ajid resistant to certain types ofdeseases. Tpjise new crop varieties have beensuccjessfulfy [•and increasingly introduced toand used by Ismail scale farrners in the ruralareas. Asi reportedv by ; the IndonesianDepajtmem of Agricultures in 1995, thedissejninat^bn of these new crop; varieties havebeervv widely^ spread to- many provinces inIndonesia. ] |i.tomita IV, jlor example, iscurrently cultivated covering: pver SOQjOQO haof land, in iciest Java, CentraiV Java, EasJ Java,North Suroa^era,. South Sulawesi arid WestNusa Tenggaia (eastern, part ;pf Indonesia).
To support the application ^orientedactivities,BATAN in collaboration with other nationalR&P agencies and the universities alsoconducts fundamental research to identify atmolecular 'evel the genetic changesresponsibly for the new features.
O Optimisation of fertilizer efficiency
The objecjiyes of the activities are twofold,namely to [obtain optimal ahiount of fertilizerto be used 'for different plants/crops and toobtain opjiiinal positioning of the fertilizerrelative to it&e plant roots as a function of soilcondition. For this purpose suitableradioisotopes are used, thus making it possibleto study theidynamics of nutrients intake fromthe soil/fertilizer, and their movement anddepositiopi iat various parts of the plant.Information! on the plant-soil interaction andplant-atmosphere interaction is obtained,thereby enabling optimal use of fertilizer. Incollaboratjon with the Gambling ResearchCenter for tea plantation, BATAN scientistshave succeeded to obtain quantitativeinformati0ni on optimal positioning and the
proper time for the introduction of thefertilizer to the tea plants. This technique hasbeen in used on o routine basis at theGambung Tea Plantation Company, WestJava.
Q Development and application of SIT(Sterile Insect Technique)
Eradication of harmful insects as an importantproblem to be solved in an effort to obtaingood food crop products in Indonesia. Thecontrol technique using insectisides not onlycause health problems to the humanbeings, butalso generates increasing inscet resistance tothe applied insecticides. The development andapplication of Sterile Insect Technique (SIT)is currently being investigated for severalinsect species in Indonesia, such as sugar caneborer Chilo auricilus Dudgeon and cabbagepests Plutella xylostella (L) and Croeidolomiabinotalia Zell.
This type activity is relatively new, and ispresently concentrated in developing optimalmass rearing techniques. So.far field testshave been conducted on limited scale.
4. LIVESTOCK
Q Development and application of feedsupplementation strategies
Livestock production has been facing difficultproblems in Indonesia, primariliy due to thelow nutrient quality of feeds. Traditionallivestcok farming is conducted in generalusing low quality grass and/or low nutrientagricultural wastes for feeding. In order toachieve optimal livestock production, BATANwith the asistance of the International AtomicEnergy Agency (IAEA) has developedtechniques to produce appropriate feedsupplementation strategies for different typesof animals. The optimization procedure wasobtained by monitoring the disgestiveactivities within the animal disgentive systemthrough the use of radioisotopes, such as 32Pand S as tracers.
The development and application of theUMMB (Urea Molasses Multinutrient Block)technology has been successfully carried outby BATAN. In order to achieve higher end-user and socio-economic impacts,collaboration between BATAN with the
page:
A Djaloeis, BATAN: Development and Application od Isotopes and Radiation Technology in Inaonesia
Directorate General of Livestock Services andwith the provicial governments in Indonesiahas been intensified. Introduction of thetechnology to the farmers, assistance inacquiring/producing the required UMMB andtraining of the farmers to utilize thetechnology and in farm management havebeen conducted in many parts of Java,Sumatera, Sulawesi and Nusa Tenggara. Theresults have, been very quite spectacular.Through the application of this technology theincome of the! farmers has improved severalfolds.
R&D activities; are conducted to find suitablesubstitutes for pome of the ingredients of theUMMB using | those which are availablelocally.
O Development and application ofradiovnoines
Various types ;0f animal deseases pose one ofthe the major problems in livestock productionin Indonesia. jFpwls, for example, are ofteninfected by coccjdiosis. Until recently most ofthe drugs and! vaccines for fowls had to beimported: Thej lability to produce vaccinesagainst those qojnmon deseases constitutes abasic need for otftimal animal production.
BATAN's actiyijty to produce radiovaccineshas been carried lout in collaboration with theCenter for Pharmaceutical Veterinary inSurabaya (EastiJ^va), and with the Faculty ofVeterinary Medicine, Bogor (West Java). Inthe course or 'the research activities, amonovalem coccidiosis radiovaccine("koksivet") wjfs[ developed in 1988 and apolyvalent coccijdjosis radiovaccine ("koksivetsupra 95") was produced in 1995. These twotypes of radiovacpines have been introducedfor use by the plublic in a limited area in theprovince of East'Java.
Q Improvement of livestock reproductionefficiency
Radioimmunoassay (RIA) plays an importantrole in the improvement of the livestockreproduction efficiency. The techniqueinvolves the prec^si determination of the onsetof oestrus, at yjuch time point artificialinsemination mayi be conducted with thehighest probability:of success. The technique
uses radioisotopcs, such as U5I labelledprogesterone antibody.
The activities have been conducted on cattlereproduction in collaboration with theDirectorate General of Livestock Services,with the Faculty of Animal Husbandry ofseveral Universities, and with the LivestockExtension Services in several provinces ofIndonesia.
5. INDUSTRY
Q Process characterization and control
a. Tracer technique
Tracer technique has been applied in severaltypes of industries in Indonesia. Dependingupon the problems to be solved, physicalquantities such as those given below aremeasured, analyzed and used as input forprocess control:
Mixture Homogeneity in a mixing proses maybe determined through the injection ofappropriate radiotracers, such as 14OLaCl3 and51Cr. Such method has been succesfullydeveloped and applied in several indutries inIndonesia, such as fertilizer industry (e.g PTPetrokimia Gresik) and Aluminium smelter.
Measurement of Mean Residence Time bymeans tracers such as 140La and 19iAu has beenapplied for process optimization in cementindustry and gold mines in Indonesia.
Process optimization in soda factory isachieved through approriate response to the"mercury inventory", reflecting quantity ofmercury in the electrolytic cells, of which theinformation is obtained through the injectedtracers, intensity and direction fluid flow
The physical characteristics of oil wells, suchas those belonging the State Oil CompanyPertamina, are determined by injectingradioactive tracers during water floodingprojects. The distribution of the radioactivetracers give quantitative on physicalquantities, such as inside the oil wells, etc.
Measurement of the ditribution and intensityof natural as well as articificial isotopes, suchas deuterium, 3H, 18O,l3C,l2C and I33Xeprovides information on the fluid dynamics in
page: 4
A Djaloeii R4TAN: Development and Application od Isotopes and Radiation Technology in Indonesia
geothermal fields. In collaboration with theState Oil Company Pertamina BATAN hasperformed investigation of the characteristicsof geothermal sources in several areas in WestJava.
Detection of She location and measuring theintensity of' radiation signals from theradibisotopes, Wch as 198Au, after theirinjection into jtne system under investigationgive informatibiion the location and severityof pipe leaks - underground and above ground,such as thosej Activities conducted by thecommercial company "PT Pusri" is obtained
Direction and inighsity. of sediment movementand deposition by means of tracer techniqueusing radioisoptofies, such as 1MIr, J1Cr and19!Au, have beiiri; used to solve problemsconnected with baVbour shallowing, planningand mapagement^ such as those encountered atthe harbours of 'Sjmda Kelapa and Cirebon(West Java); Paleinjjang (Sumatera), Surabaya(East Java) and Boritang (Kalimantan).
b. Photon and particle beams
Photon, charged a{i| neutral particles beamslave been used for various purposes:
Golbumn scanning,.technology using photonradiation (*°do sour.c|) has been widely usedin industries in Indohesia.
, Gauging technique, |u|ing for electron source•for instance, : has ^b^en widely used for• thickness and' density |measurements, such aslinthe process control'rifnaper or foil factory.
Static radiography -tiding radiation sourcessuch as l92Ir, ^Co and |?7Cs, has been widelyiised in indii$trjes as ^ $on-destructive testingmethod. Gajnri}&-ray!
( lkdiography has beenused, for instance, in dr^er to get informationop the characteristics •<$ steel enforcement ofconcrete blocks; investigation of welding andcasting characteristics I <sf components (e.g.aircraft, ship and oar components),information on pipe blockings, information onmaterials structural defects, etc.
Dynamic radiograhy, lf<wr instance using•neutron beams, has, |b|en used to giveinformation on specific I on-going processes,juch as ninning: engines. •' ; •
c. Activation analysis
Neutron activation analysis using BATANresearch reactors has been widely used toinvestigate the type and intensity of minutecontaminants in various samples. Suchinvestigations have been conducted in the fieldof environment (air, water and soil samples),human health (e.g. urine, blood, tissue andhair samples) and industry.
Q Preservation and Sterilization
Preservation and sterilization activities havebeen promoted" by BATAN in collaborationwith the local industries. A commercialcompany "PT Indogamma has been activelydoing irradiation activities since several years.
Highlights of the activities may besummarized as follows:
Systematic experiments are conducted toobtain optimal dosis for prolonging shelf lifeand improving hygenic quality of varioustypes of food and food ingredients, such asseeds, spices and frozen or dried foodstuffs.
Irradiation technique has been developed andused for the production of synthetics andbiqmaterials and for sterilizing purposes, suchas medical, cosmetic,, herbal andpharmaceutical products, bones, amnions andother biological tissues for direct uses and fortissue banks.
The irradiation activities works are extendedto include production of radiation sterilizedfood for hospital uses.
O Transformation and modification ofmaterials
Activities on the transformation, modificationand characterization of materials have beenwidely conducted by BATAN, examples ofwhich are described briefly below::
Radiation vulcanization of natural rubber latexhas been widely developed and used, such asfor the production of condoms, gloves, etc.
Cross linking techniques have been developedto obtain among others wire insulations whichare resistant to heat and high tension.
Curing of surface coatings is achieved throughirradition by electron beams.
page:
1 Djaloeis, BATAN.- Development and Application od Isotopes and Radiation Technology in Indonesia
Modification of physical (e.g. electrical,mechanical) ! and chemical properties ofmaterials wiith the objective to develop newmaterials w|t$ specific characteristics, such ascorrosion resjstant coatings, semi conductorswith specific jfeatures for electronic industries,are achieved through the implantation ofdifferent typels and dosis of ions acceleratedby means >fi low energy ion accelerator atBATAN Getter of Nuclear Research inYogyakartaj Techniques to study the surfacearid bulk jinaracteristics of materials aredeveloped in parallel.Experiments I'on the treatment of gaseouswastes sucji i as SOX and NO, have beenconducted {losing the 2 MeV electronaccelerator^Ihe BATAN Center for the
6. C O N C I S I O N S
From the above description of the activitiesconducted mi Indonesia with respect to thedevelopment £nd application of isotopes andirradiation i technology in Indonesia thefollowing conclusions may be drawn:
Isotopes ah<?^irradiation technology has beensuccessfully.: .developed and applied inIndonesia. Irjirastrusture and capability ofhuman' r esoiujces have generally reached thestage of selfi sustaining.
The technology has been widely applied in thefields of agriculture, animal science andproduction and in the industrial sector.
Public inlbrrnation campaign on the benefitsof the isotopes and irradiation technology isstill inadeq^te, and therefore needs to beintensified to jiddress various target groups, inparticular thp public and the industrial sector.
<AD-August 1997>
page:
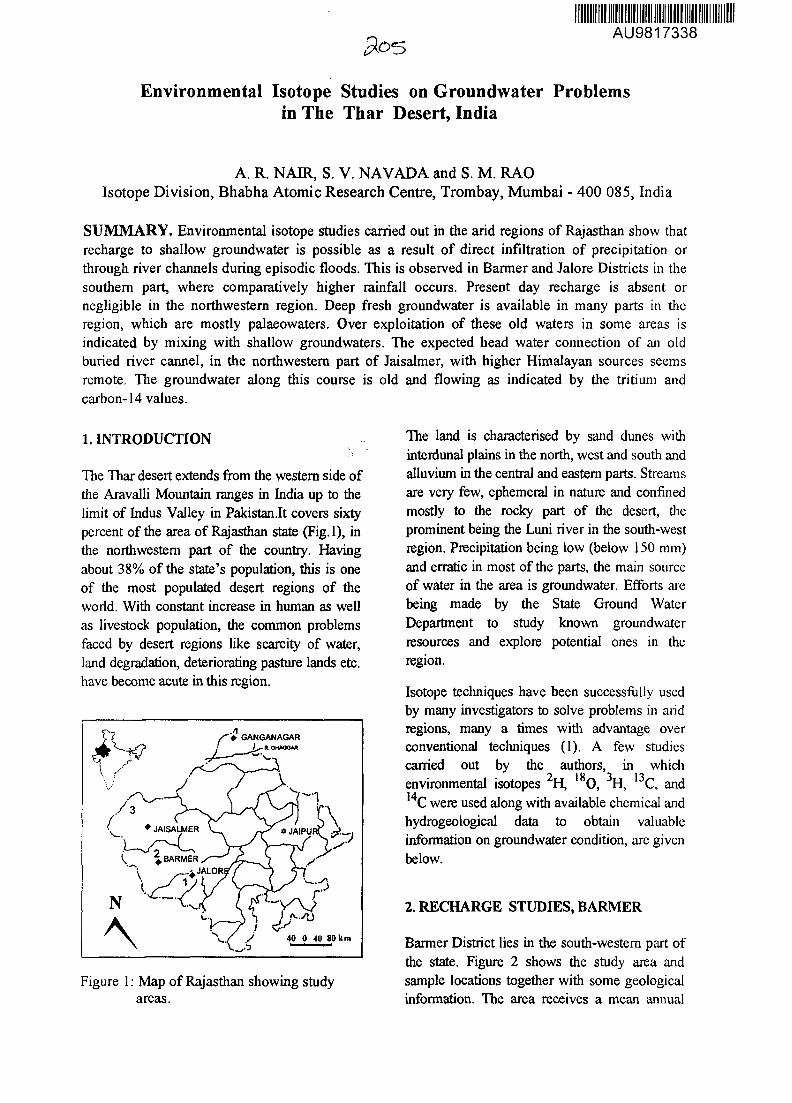
AU9817338
Environmental Isotope Studies on Groundwater Problemsin The Thar Desert, India
A. R. NAIR, S. V. NAVADA and S. M. RAOIsotope Division, Bhabha Atomic Research Centre, Trombay, Mumbai - 400 085, India
SUMMARY. Environmental isotope studies carried out in the arid regions of Rajasthan show thatrecharge to shallow groundwater is possible as a result of direct infiltration of precipitation orthrough river channels during episodic floods. This is observed in Banner and Jalore Districts in thesouthern part, where comparatively higher rainfall occurs. Present day recharge is absent ornegligible in the northwestern region. Deep fresh groundwater is available in many parts in theregion, which are mostly palaeowaters. Over exploitation of these old waters in some areas isindicated by mixing with shallow groundwaters. The expected head water connection of an oldburied river cannel, in the northwestern part of Jaisalmer, with higher Himalayan sources seemsremote. The groundwater along this course is old and flowing as indicated by the tritium andcarbon-14 values.
1. INTRODUCTION
The Thar desert extends from the western side ofdie Aravalli Mountain ranges in India up to thelimit of Indus Valley in Pakistan.lt covers sixtypercent of the area of Rajasthan state (Fig.l), inthe northwestern part of the country. Havingabout 38% of the state's population, this is oneof the most populated desert regions of theworld. With constant increase in human as wellas livestock population, the common problemsfaced by desert regions like scarcity of water,land degradation, deteriorating pasture lands etc.have become acute in this region.
The land is characterised by sand dunes withinterdunal plains in the north, west and south andalluvium in the central and eastern parts. Streamsare very few, ephemeral in nature and confinedmostly to the rocky part of the desert, theprominent being the Luni river in die south-westregion. Precipitation being low (below 150 mm)and erratic in most of the parts, the main sourceof water in the area is groundwater. Efforts arebeing made by the State Ground WaterDepartment to study known groundwaterresources and explore potential ones in theregion.
Isotope techniques have been successfully usedby many investigators to solve problems in aridregions, many a times with advantage overconventional techniques (1). A few studiescarried out by the authors, in whichenvironmental isotopes H,14,
18O, 3H, 13C, and
Figure 1: Map of Rajasthan showing studyareas.
C were used along with available chemical andhydrogeological data to obtain valuableinformation on groundwater condition, are givenbelow.
2. RECHARGE STUDIES, BARMER
Banner District lies in the south-western part ofthe state. Figure 2 shows the study area andsample locations together with some geologicalinformation. The area receives a mean annual
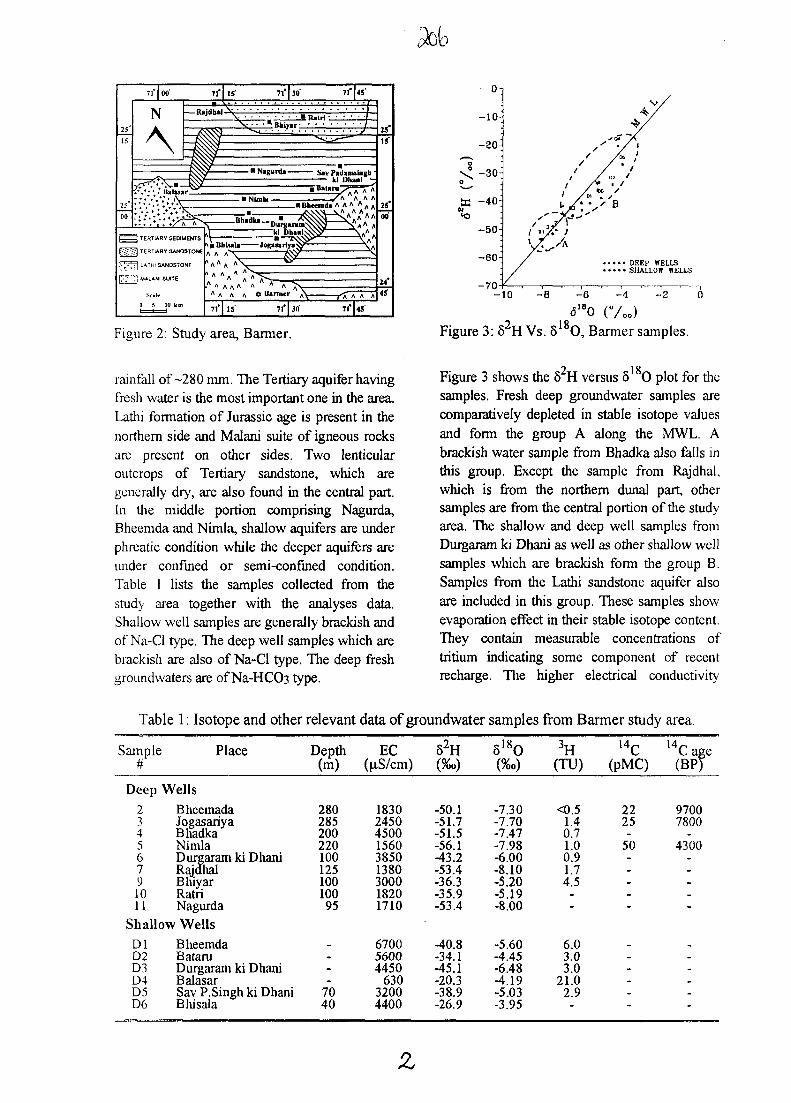
• 0 :
- 2 0 :
5-30a -40-
-50^
- 6 0 :
-70
DEEP WELLSSHALLOW
-10 -8 -6
<5'8O
- 4 - 2
Figure 2: Study area, Banner.
rainfall of-280 mm. The Tertiary aquifer havingfresh water is the most important one in the area.Lathi formation of Jurassic age is present in thenorthern side and Malani suite of igneous rocksare present on other sides. Two lenticularoutcrops of Tertiary sandstone, which aregenerally dry, are also found in the central part.In the middle portion comprising Nagurda,Bheemda and Nimla, shallow aquifers are underphreatic condition while the deeper aquifers areunder confined or semi-confined condition.Table 1 lists the samples collected from thestudy area together with the analyses data.Shallow well samples are generally brackish andof Na-Cl type. The deep well samples which arebrackish are also of Na-Cl type. The deep freshgroundwaters are of Na-HCO3 type.
2 18Figure 3: 8 H Vs. 8 O, Banner samples.
1 18Figure 3 shows the 8 H versus 5 O plot for thesamples. Fresh deep groundwater samples arecomparatively depleted in stable isotope valuesand form the group A along the MWL. Abrackish water sample from Bhadka also falls inthis group. Except the sample from Rajdhal,which is from the northern dunal part, othersamples are from the central portion of the studyarea. The shallow and deep well samples fromDurgaram ki Dhani as well as other shallow wellsamples which are brackish form the group B.Samples from the Lathi sandstone aquifer alsoare included in this group. These samples showevaporation effect in their stable isotope content.They contain measurable concentrations oftritium indicating some component of recentrecharge. The higher electrical conductivity
Table 1: Isotope and other relevant data of groundwater samples from Banner study area.
Sample#
Deep23456791011
Place
WellsBheemadaJogasariyaBhadkaNimlaDurgaram ki DhaniRajdhalBhiyarRatriNagurda
Shallow WellsDlD2D3D4D5D6
BheemdaBataruDurgaram ki DhaniBalasarSav P.Singh ki DhaniBhisala
Depth(m)
28028520022010012510010095
_
-_
7040
EC(uS/cm)
183024504500156038501380300018201710
670056004450
63032004400
82H(%o)
-50.1-51.7-51.5-56.1-43.2-53.4-36.3-35.9-53.4
-40.8-34.1-45.1-20.3-38.9-26.9
818O(%o)
-7.30-7.70-7.47-7.98-6.00-8.10-5.20-5.19-8.00
-5.60-4.45-6.48-4.19-5.03-3.95
3H(TU)
<0.51.40.71.00.91.74.5
-
6.03.03.0
21.02.9
14C(pMC)
2225.
50
__-
_
-
14C age(BP)
97007800
4300
_
_-
_-
_-
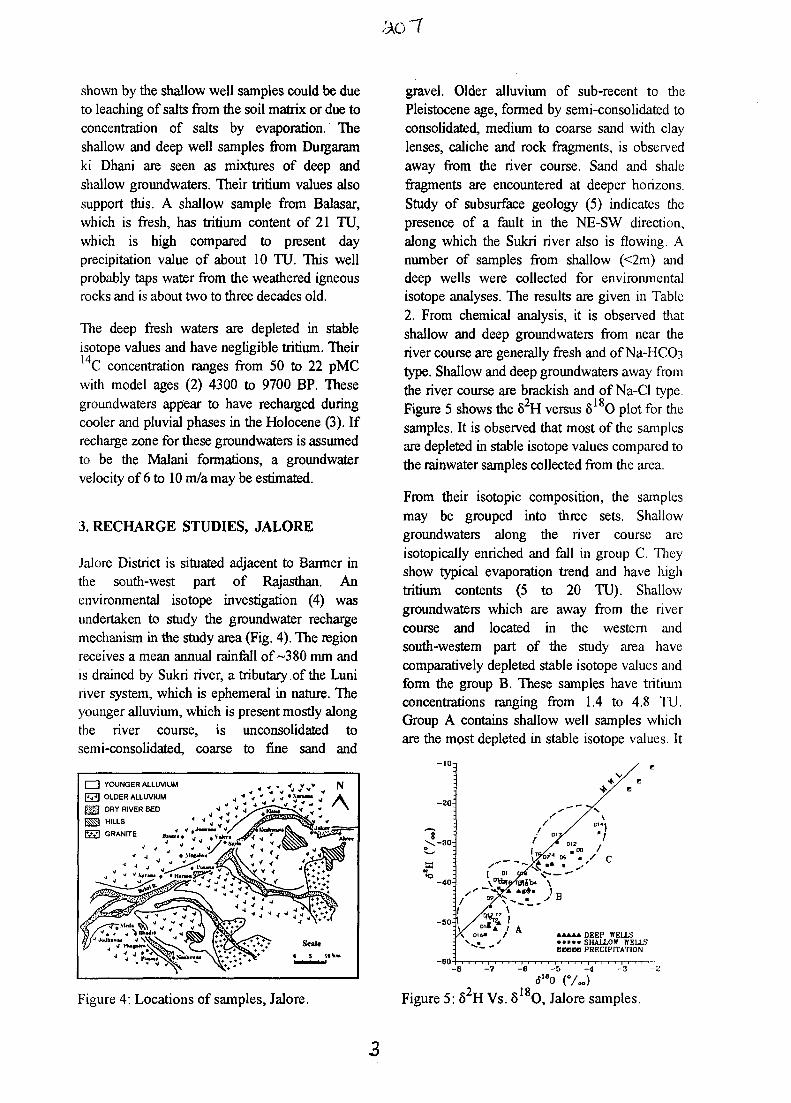
shown by the shallow well samples could be dueto leaching of salts from the soil matrix or due toconcentration of salts by evaporation. Theshallow and deep well samples from Durgaramki Dhani are seen as mixtures of deep andshallow groundwaters. Their tritium values alsosupport this. A shallow sample from Balasar,which is fresh, has tritium content of 21 TU,which is high compared to present dayprecipitation value of about 10 TU. This wellprobably taps water from the weathered igneousrocks and is about two to three decades old.
The deep fresh waters are depleted in stableisotope values and have negligible tritium. Their
C concentration ranges from 50 to 22 pMCwith model ages (2) 4300 to 9700 BP. Thesegroundwaters appear to have recharged duringcooler and pluvial phases in the Holocene (3). Ifrecharge zone for these groundwaters is assumedto be the Malani formations, a groundwatervelocity of 6 to 10 m/a may be estimated.
3. RECHARGE STUDIES, JALORE
Jalore District is situated adjacent to Banner inthe south-west part of Rajasthan. Anenvironmental isotope investigation (4) wasundertaken to study the groundwater rechargemechanism in the study area (Fig. 4). The regionreceives a mean annual rainfall of ~38O mm andis drained by Sukri river, a tributary of the Luninver system, which is ephemeral in nature. Theyounger alluvium, which is present mostly alongthe river course, is unconsolidated tosemi-consolidated, coarse to fine sand and
I I YOUNGER ALLUVIUM
P71 OLDER ALLUVIUM
gg§ DRY RIVER BED
I § 3 HILLS
E l GRANITE J
gravel. Older alluvium of sub-recent to thePleistocene age, formed by semi-consolidated toconsolidated, medium to coarse sand with claylenses, caliche and rock fragments, is observedaway from the river course. Sand and shalefragments are encountered at deeper horizons.Study of subsurface geology (5) indicates thepresence of a fault in the NE-SW direction,along which the Sukri river also is flowing. Anumber of samples from shallow (<2m) anddeep wells were collected for environmentalisotope analyses. The results are given in Table2. From chemical analysis, it is observed thatshallow and deep groundwaters from near theriver course are generally fresh and of Na-HCCbtype. Shallow and deep groundwaters away fromthe river course are brackish and of Na-CI type.
2 18Figure 5 shows the 6 H versus 5 O plot for thesamples. It is observed that most of the samplesare depleted in stable isotope values compared tothe rainwater samples collected from the area.
From their isotopic composition, the samplesmay be grouped into three sets. Shallowgroundwaters along the river course areisotopically enriched and fall in group C. Theyshow typical evaporation trend and have hightritium contents (5 to 20 TU). Shallowgroundwaters which are away from the rivercourse and located in the western andsouth-western part of the study area havecomparatively depleted stable isotope values andform the group B. These samples have tritiumconcentrations ranging from 1.4 to 4.8 TU.Group A contains shallow well samples whichare the most depleted in stable isotope values. It
WM
- 40
-80-
DEEP WELLS• ••••SHALLOW WELLSOtBOO PRECIPITATION
Figure 4: Locations of samples, Jalore.
- 7 - 6 - 5 -4 - 3
«5I8O ( V » )
Figure 5: 52H Vs. 818O, Jalore samples.
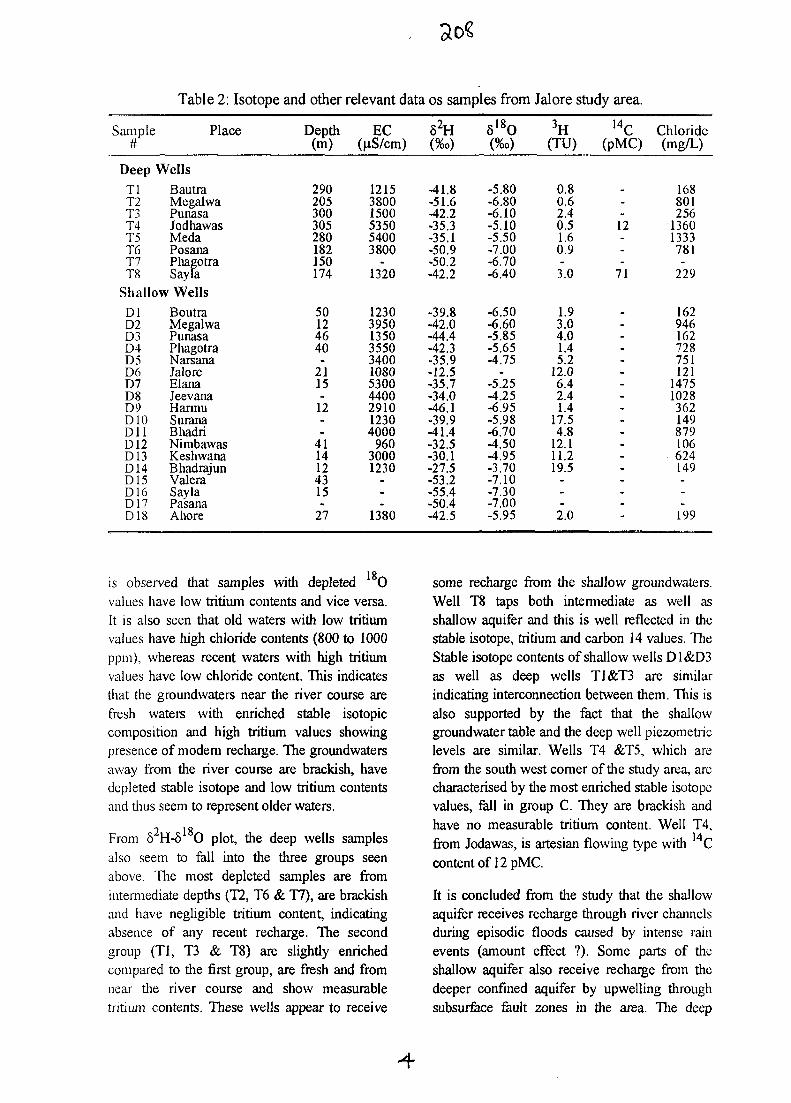
Table 2: Isotope and other relevant data os samples from Jalore study area.
Sample#
Place Depth(m)
EC(uS/cm)
82H 518O H(TU)
14C(pMC)
Chloride(mg/L)
Deep Wells
TlT2T3T4T5T6T7T8
ShallowDlD2D3D4D5D6D7D8D9D10Dl lD12D13D14DI5D16D17D18
BautraMegalwaPunasaJodhawasMedaPosanaPhagotraSaylaWells
BoutraMegalwaPunasaPhagotraNarsanaJaloreElanaJeevanaHannuSuranaBhadriNimbawasKeshwanaBhadrajunValeraSaylaPasanaAhore
290205300305280182150174
50124640.
2115.
12
•4114124315.
27
121538001500535054003800
1320
12303950135035503400108053004400291012304000
96030001230
_
1380
-41.8-51.6-42.2-35.3-35.1-50.9-50.2-42.2
-39.8-42.0-44.4-42.3-35.9-12.5-35.7-34.0-46.1-39.9-41.4-32.5-30.1-27.5-53.2-55.4-50.4-42.5
-5.80-6.80-6.10-5.10-5.50-7.00-6.70-6.40
-6.50-6.60-5.85-5.65-4.75
_-5.25-4.25-6.95-5.98-6.70-4.50-4.95-3.70-7.10-7.30-7.00-5.95
0.80.62.40.51.60.9.3.0
1.93.04.01.45.2
12.06.42.41.4
17.54.8
12.111.219.5
-_
2.0
_12
71
_
168801256
13601333781-
229
162946162728751121
14751028362149879106624149._
199
IS
is observed that samples with depleted 0values have low tritium contents and vice versa.It is also seen that old waters with low tritiumvalues have high chloride contents (800 to 1000ppm), whereas recent waters with high tritiumvalues have low chloride content. This indicatesthat the groundwaters near the river course arefresh waters with enriched stable isotopiccomposition and high tritium values showingpresence of modem recharge. The groundwatersaway from the river course are brackish, havedepleted stable isotope and low tritium contentsand thus seem to represent older waters.
From 5 H-5 O plot, the deep wells samplesalso seem to fell into the three groups seenabove. The most depleted samples are fromintermediate depths (T2, T6 & T7), are brackishand have negligible tritium content, indicatingabsence of any recent recharge. The secondgroup (Tl, T3 & T8) are slightly enrichedcompared to the first group, are fresh and fromnear the river course and show measurabletritium contents. These wells appear to receive
some recharge from the shallow groundwaters.Well T8 taps both intermediate as well asshallow aquifer and this is well reflected in thestable isotope, tritium and carbon 14 values. TheStable isotope contents of shallow wells D1&D3as well as deep wells T1&T3 are similarindicating interconnection between them. This isalso supported by the fact that the shallowgroundwater table and the deep well piezometriclevels are similar. Wells T4 &T5, which arefrom the south west comer of the study area, arccharacterised by the most enriched stable isotopevalues, fall in group C. They are brackish andhave no measurable tritium content. Well T4,from Jodawas, is artesian flowing type withcontent of 12 pMC.
14,
It is concluded from the study that the shallowaquifer receives recharge through river channelsduring episodic floods caused by intense rainevents (amount effect ?). Some parts of theshallow aquifer also receive recharge from thedeeper confined aquifer by upwelling throughsubsurface fault zones in the area. The deep
•4
aquifers are thought to be recharged during thecool pluvial periods in the Holocene.
4. ISOTOPE STUDIES ALONG A
BURIED RIVER COURSE, JAISALMER
Interpretation of satellite imagery of the of thewestern parts of Jaisalmer District, revealed theburied course of a river in the NE-SW direction.In spite of the highly arid condition of the region,comparatively fresh groundwater is availablealong the course at 30 to 70 m depth. The aquiferconsists of medium to fine sand with very littleclay. A few dugwells in the study area do not dryup even in summer and tube wells do not showreduction in water table, even after extensiveutilisation for human as well as livestockconsumption. This course is seen to have linkwith the dry bed of Ghaggar river in thenortheast, while in the southwest it is met with oreven cut across the surviving courses of Hakra orNara rivers in Pakistan. The above course isthought to belong to the legendary RiverSarawati of Himalayan origin, mentioned inmany early literary works and known to haveexisted before 3000 BP (6,7). This mighty river,originally flowing in a south-westerly direction,is supposed to have changed its course severaltimes ending up in the present course of the riverGhaggar. The river built up a wide alluvial plainwith considerable thickness. It is thought that thecourses of the river in the area are still
PAKISTAN
fj
//) ©
/ . ,
©Ghotaru
N
K ^•' y® Kishengarh
T.^t ^ >-©Kuria Beri Tanot© 0 . N a t h u r a K u a \,-''©GhantlyalJI .
© © RanauSadewala
Longewala ©©Gamnewala
5
INDIA
— Sampling point
- Palaeo channel
0 5 10 15 km
Figure 6: Locations of samples, Jaisalmer area.
maintaining their head water connection with theHimalayan sources and could form potentialsources of groundwater for exploitation.
To confirm the above scenario, an environmentalisotope study was initiated. Figure 6 shows thestudy area with sample locations and Table 3gives the results of analyses and other details forthe samples.
From the results it is seen mat both shallow and
deep groundwaters are enriched in stable isotope
values compared to that of present day
Himalayan rivers (S18O : -11 to -10 %0)
indicating that their head water connection with
higher Himalayan sources is remote.
Table 3: Isotope and other relevant data of samples from Jaisalmer study area.
Typeof well
TWDWDWTWDWTWDWTWDWTWTWDWTW
-
Place
KishengarhKuriaberiNatliurakuaGhantiyaliGhantiyaliRanauRanauLoungewalaLoungewalaGainnewalaGhotaruGhotaruAsutarRain (Jaisalmer)
Depth*(m)
3935-
3874-147(62)
55.
4587-147(65)91-157(40)
4273-95(68)
-
EC(uS/cm)
3460210030403660282018902060274093704060227036502560
-
52H(%o)
-41.7-42.6-38.4-45.6-41.2-45.3-46.1-44.0-39.9-30.0-48.7-41.1-47.0-22.0
61 8O(%»)
-5.6-5.7-6.3-6.6-6.0-6.2-6.0-6.2-5.9-6.1-6.9-6.4-6.3-4.3
3H(TU
(±0.5)
0.20.50.30.50.60.61.30.31.00.60.21.10.47.0
14C(pMC)
47.369.3>58.332.254.949.5
.10.9
-
21.162.735.8
-
8nC(%oPDB))
-5.7--
-4.0-
-7.4-
-5.6--
-7.3
-7.5-
DW/TW = Dug well/Tubewell; *= screen position for TW with static water level in brackets.
5
Shallow groundwaters generally have negligibletritium content and low C values (54 to 70pMC) indicating that they are old waters.However, dug well samples from Ranau andGotaru show measurable tritium contentsindicating small components of modemrecharge.
Tube well samples also show negligible tritiumand low C values (10 to 49 pMC) indicatingthat they are old waters. Higher carbon-14 valuesat Ranau, Gotaru and Asutar could be due tomixing with some younger waters as seen fromtheir lower chloride levels. Possibility ofrecharge from eastern side at these areas isindicated by existing dry stream channels. Thereis a trend of increase in the apparent C age forgroundwaters from Kishengarh to Loungewalealong the suspected course of the river channel.From their relative ages, a groundwater velocityof about 5 m/a may be inferred.
5. CONCLUSIONS
The above studies indicate that in the southernpart of the Thar desert, where precipitationreceived is higher compared to the north-westernregion, shallow aquifers could receive recentrecharge. The mechanism could be directinfiltration after intense episodic rain eventsfollowed by floods or through river channels. Inthe north-western part, present day recharge israre or negligible. In many parts of the desertdeep fresh groundwater is available, which wererecharged in the past (as indicated by the lowcarbon-14 values), when the climatic conditionprevalent were more favorable than present.Reconstruction of the past climate in the regionfrom palaeoclimatological and palaeontologicalstudies (8,9), indicate that cooler and pluvialconditions in the Holocene were present in thisregion during which recharge to these aquiferscould have taken place. However, the absence ofmodem recharge and evidence of overexploitation observed in the above studies stressthe need for the proper management of suchscarce groundwater resources. Isotopetechniques can play a very important role in suchefforts.
6. REFERENCES
(1) Fontes, J. Ch. and Edmonds, W. M., Theuse of Environmental Isotope Techniquesin arid Zone Hydrology - A critical Review,1989,75p., UNESCO, Paris.
(2) Guidebook on Nuclear Techniques inHydrology, International Atomic EnergyAgency, Vienna, 1983,285-317.
(3) Navada, S. V., Nair, A. R., Rao, S. M.,Kulkarni, U. P. and Joseph, T. B.,Groundwater recharge studies in aridregions of western Rajasthan using isotopetechniques, Isotopes in Water ResourcesManagement, vol.1, International AtomicEnergy Agency, Vienna, 1996,451-453.
(4) Navada, S. V., Nair, A. R., Rao, S. M.,Paliwall, B. L. and Doshi, C.S.,Groundwater recharge studies in aridregions of Jalore, Rajasthan using isotopetechniques, J. Arid Environ., 24, 1993,125-133.
(5) Henry, A., Saktawat, U. S. and Paliwall, B.L., Groundwater Resources of JaloreDistrict, Rajasthan, Pt. I - Hydrogeology,Groundwater Department Report,Government of Rajasthan, Jaipur, 1985.
(6) Ghose, B., Kar, A and Husain, Z., The lostcourses of the Saraswati river in the GreatIndian Desert: New evidence fromLANDSAT imagery, Geog. J.. 145, 1979,446-451.
(7) Valdiya, K.S., River Piracy - Saraswati thatdisappeared. Resonance. May 1996, 19-28.
(8) Bryson, R. A. and Baerries, D. A.,Possibilities of major climatic modificationand their implications : northwest India, acase study, Bull. Am. Met. Soc. 48 ,1967,136.
(9) Singh, G., Joshi, R. D., Chopra, S. K. andSingh, A. B., Late Quaternary history ofvegetation and climate of Rajasthan Desert,India, Phil. Trans. R. Soc. London. B. Biol.SeL,267, 1974,467-501.

AU9817339
ISOTOPE PRODUCTS MANUFACTURE IN RUSSIA
AND ITS PROSPECTS.
S.V.Malyshev, I.A.Okhotina, EAKarelin, N.N.Krasnov,V.V.Kuzin, J.A.Malykh, S.B.Makarovsky.
At an up-to-date stage of the world economy development, stable and radioactiveisotopes, preparations and products on their base accompany the mankind inmany aspects of its activity.
Various nuclide products are widely used in many areas of developed countries'economy , such as health protection ( diagnostics and therapy, sterilization ofmedical Pharmaceuticals and instruments), agriculture (mutational selection,studying of biogenic processes of the "plant-animal -man" system, food productssterilization), municipal economy and fuel power engineering (signal lights,sanitation of sewages, gaseous discharges and solid wastes), autonomous naval,earth and space "small" energetics, manufacturing industry (technological andprocess quality control), enviroment protection ( monitoring, control of pollutionflows in biological and ecological systems. And it is not surprising, that the level ofmanufacture and application of isotopes in research, economical and social fields ofeconomy of the particular country is now one of the most important factors featuringits scientific, technical and industrial development.
The Russian Federation is one of the first and largest world-wide producer of avariety of nuclide products on the base of 350 isotopes. There are following typesof nuclide products manufacturing in Russia:
radioactive isotopes,stable isotopes,radionuclide radiation and heat sourcesradionuclide light sources and luminous paints,organic and inorganic compounds labelled with radioactive and stable isotopes,
radionuclide generators of short -lived isotopes,radiopharmaceuticals
The development of isotope production in Russia, which is now a separateindustry, made its start from the fifties. Initiators in creating radioactive isotopesand isotopes based products manufacture were Radium Institute of the USSRAcademy of Science, at present "Khlopin Radium Institute" - Research ProductionAssociation of Ministry for Atomic Energy of Russian Federation (Minatom), and"Mayak"-Production Association of Minatom, a leader of radioisotope productsmanufacturers in Russia, supplying now over 50% of the total volume.
Manufacturing of stable isotopes began in Kurchatov Institute of Atomic Energy,where the basis of future large-scale production with electro-magnetic method wasfound. Later this method was applied under the guidance of the specialists from theKurchatov Institute in the "Electrochimpribor" Plant, Ekaterinburg. Nowadays, about50 research and production groups from various branches and departments ofRussia participate in development of nuclide products manufacture and assist inimprovement of the quality of the products.
The isotope production developed actively in the former USSR within periodfrom 1970 to 1990. At that time the sales of isotope products effected by theenterprises of Minatom, Ministry for Chemical Industry, Ministry for Public Health,Academies of Science of the USSR, Belorussia, Ukraine and Uzbekistan increasedin more than 3 times and reached 68,7 million roubles in 1990, including exportsales exceeding 10 million dollars. In this volume, the share of Minatomenterprises, located in Russia, amounted to approximately 68%. Afterdisintegration of the USSR about 90% of all production capacities for nuclideproducts manufacturing remained in the Russian Federation. At present theproduction of radioisotopes in Russia is in progress, unlike the majority of otherindustries. A growth of the export sales of the isotope products, shown on Figure1, proves it visually.
Russian Ministry for Atomic Energy coordinates activity for technicaldevelopment and structuring of production and supply of isotope products for theeconomy of the country. During the years of isotope industry development,several production centers appeared in Russia, specializing in manufacture andsupply of certain products. Structure of the main Russian producers of theradioisotope products is shown at Figure 2.
Chelyabinsk regionProduction Association "Mayak", the largest Russian manufacturer of the
radioisotope products, has a great scientific and technical potential. Over 50% ofthe total volume of the radioisotope products are produced at this enterprise."Mayak" is specialized in manufacturing of reactor and fission isotopes, such asCarbon-14, Cobalt-60, lridium-192, Krypton-85, Strontium-90, Caesium-137,Americium-241, Promethium-147, etc. Fission isotopes are isolated from aqueoussolutions of tailings from the NPP Irradiated Fuel Regeneration Plant. "Mayak" isalso the main producer of radiation sources on the base of Cobalt-60, lridium-192,Caesium-137, Americium-241, Selenium-75 and other alpha-, beta,-gamma- andneutron-emitting radioisotopes. Besides, the enterprise supplies radionuclide heatsources on base of Strontium-90 and Plutonium-238, used in thermoelectricalgenerators for energy power supply in meteorological equipment and devices fornavigation or space purposes.
Kaluga regionAnother largest center of radioisotope products manufacture is situated in
Obninsk, 100 km from Moscow. The center has reliable transport links with thebiggest Russian airports (Sheremetjevo, Domodedovo and Vnukovo) as well asMoscow railway stations. It ensures effective supply of products, and short-livedisotopes in particular, to customers both within and outside Russia.1 The largest production of cyclotron radioisotopes was created in Obninsk (JointStock Company "Cyclotron" established on base of Russian Institute of Physicsand Energetics).
The cyclotron was put into operation in 1963. Since that time there were severalreconstructions purposed to achieve more favorable conditions for production ofradioisotopes and to improve reliability and stability of the cyclotron operation.
At present, the cyclotron allows to use either protons with energy up to 28 Mev ordeiteriums with the same energy for radioisotope production. The highly intensiveinternal beam is used. Special target devices enable to irradiate iqitial material by
2
SU5
the internal beam with intensity up to 750 microamperes. As a rule, the enrichedstable isotopes in metal form are used as the materials to be irradiated.
About 20 radioisotopes are currently produced at "Cyclotron". Among themSodium-22, Cobalt-57, Gallium-67, Cadmium-109 , lndium-111 and Thallium-201are of the biggest demand. Manufacturing of these isotopes takes about 90% ofthe cyclotron operation time. Besides them, Beryllium-7, Titanium-44, lron-55,Germanium-68, Strontium-85, Cerium-139, Tungsten 181, Biswuth-207 and otherisotopes are produced and regularly supplied as well.
"Cyclotron" in Obninsk supplies radioactive isotopes in form of radiochemicalpreparations, moessbauer sources (Cobalt-57), sources for roentgen-radioluminiscent analysis (Cobalt-57 and Cadmium-109) and for medical gammacell calibration (Cobalt-57). At present this cyclotron completely meets the Russianneeds for the above stated radioactive isotopes. A significant quantity of thecyclotron produced radioisotopes is supplied abroad (especially Cobalt-57).
The second cyclotron is planned to be put into operation in the same building in1997, which will ensure further growth of production and application of cyclotronradioisotopes, including industrial production in Russia of lodine-123 for medicalpurposes.
2.At the State Scientific Center of Russian Institute for Physics and Energetics,which is one of the largest nuclear research center in Russia with a number ofResearch Thermal and Fast Neutron reactors and significant radiochemicalresources, the reactor production of short-lived and fission isotopes was arrangedfor manufacturing of medical and biological preparations, such as Molibden-99,Xenon-133, Phosphorous-32, Phosphorous-33. Besides, Technetium-99mgenerators and Xenon-133 radiophapmaceuticals as well as wide range ofPhosphorous-32, Phosphorous-33, Sulphur-35 labeled compounds ( nucleotides)for application in molecular biology and genetic engineering are produced there too.At present, the production of lndium-113m generators and radiopharmaceuticalswith Gallium-67, Strontium-89, Phosphorous-32 , Gold-198 and Thallium-201 isclose to its start.
3.The Branch of Karpov Physics and Chemistry Research Institute has WR-tapereactor with the flux 1.2 x 10¹⁴ n/sm2 sec and radiochemical resources formanufacturing of radioisotope products. To provide regular production ofTechnetium-99m generators in cooperation with the Institute for Physics andEnergetics, the Branch of Karpov Physics and Chemistry Research Institutearranged the manufacture of Molybdenium-99 and Technetium-99m generators onthe base of its own reactor complex. Simultaneously, along with Molybdenum-99,the Branch of Karpov Institute produces Xenon-133 and supplies it to the Institutefor Physics and Energetics, which in its turn makes radiopharmaceuticalpreparations with Xenon-133. But first of all, this Institute is the main Russianproducer of lodine-131 and radiopharmaceutical preparations on its base for theneeds of medical institutions in Russia.
Ulivanovsk Region.State Scientific Center of Russian Federation of Research Institute for Nuclear
Reactors (RINR) is the leading Russian research nuclear center with up-to-date
J
reactor base, including CM-3 reactor with the density of neutron flux up to 25 x 1014
n/sm2sec.Besides the high-flow reactor CM-3, this nuclear center has a loop channel
reactor MIR, 3 pool-reactors RBT and a fast-neutron reactor BOR-60. All thesereactors are used in one way or another for radioisotopes production. There is acomplex of radiochemical and technological equipment in the Institute, includingthe hot chambers patterns for radioisotopes manufacturing too. RINR, possessinga unique research reactor base, is specialized first of all on production of the widerange of transplutonium elements beginning from Plutonium to Fermium, whichmay be accumulated in practically considerable quantities only in high-fluxreactors.
Over the last 10-12 years the Center has been carrying out the work on makingsome radioisotopes with high specific activity : Phosphorous-32 and 33, Cobalt-60,lron-55 and 59, Nickel-63, Tin-112 and 119m, Strontium-80, Gadolinium-153,lridium-192, etc.
Apart from the preparations of high activity, the Center stock-produces uniquesources on base of Californium-252, Curium-244, Cobalt-60, Gadolinium-153,lridium-192, Selenium-75 and others. These sources are used industrialradiography, technological control devices, medicine, etc.
Leningrad Region.1 ."Technochim" Pilot Plant of the State Institute for Applied Chemistry (SIAP) is thelargest producer of labelled compounds. It is specialized in production ofpreparations, containing radioisotopes, organic and inorganic compounds,including biological active ones, labelled with Tritium, lodine-125, Phosphorous-32,Phosphorous-33, Carbon-14, Deuterium and also radioactive sources with Cobalt-57, Cadmium-109, lron-55, Tin-119 m, Nickel-63, Gadolinium-153 and otherisotopes for radiography fluorescent analysis and nuclear gamma resonance.Radioactive isotopes for manufacturing of SIAP's production are supplied fromMinatom's enterprises.2."Khlopin Radium Institute", Research Production Association of Minatom alsoproduces a number of complex organic Tritium labelled compounds, such asnucleotides and sugar nucleosides, used in molecular biology and experimentalmedical researches. The Institute also supplies radiopharmaceutical preparationswith lodine-123 and Technecium-99m for St.-Petersburg region.
Nizhnv Novgorod Region.Electromechanical Plant "Avangard" is specialized in production of preparations
and sources of ionized irradiation with Polonium-210. Besides, a unique base fortesting of heat sources on base of Polonium-210 and Plutonium-238 for space andnavigation, is created here.
MoscowThere is a number of Institutes and enterprises involved in manufacture of
radioisotope products in this region as well.1.ln the former Soviet Union "Medradiopreparat" Plant of the Russian Ministry forPublic Health was the only producer of radiophatmaceuticals, such as: Technetium-99m and lndium-113m generators, preparations on the base of lodine-131, lodine-125, Gallium-67, lndium-111, Gold-198, Mercury-197 and other isotopes. However,
4
since 1986 taking into account the ecologically unfavourable location of the plant inthe populous area of Moscow, Minatom of Russia started the planned transferenceof the radiopharmaceuticals production to Obninsk enterprises, which have high-capacity resources for manufacturing of cyclotron and reactor short-lived isotopes.The systematic actions of Minatom to this purpose allowed yet in 1990 to transfercompletely the production of Molybdenium-99, Technetium-99m generators, andlater of rediopharmaceutical preparations with Xenon-133 and lodine-131 to theInstitute of Physics and Energetics and to the Branch of Karpov Institute. At presentthis work is going on, and it is planned in 1997-1998 to run in the wide range ofradiopreparations with lodine-131 in the Branch of Karpov Institute, and Indium-113 m generators as well as radiopharmaceutical preparations with Gold-198,Mercury-197, Gallium-67 and lndium-111 - in the Institute for Physics andEnergetics. Realization of these projects will enable to move radiochemicalproduction from Moscow with a 9 million population to the enterprises, which havetheir own reactors, cyclotrons and radiochemical resources.2. At the Institute for Molecular Genetics of Russian Academy of Science, morethan 200 most complex Tritium labelled biological active substances, includingnucleotides, nucleosides, amino-acids, peptides and others, are produced. Theseproducts are supplied to Russian research centers.
Additionally to the above stated enterprises of some regions of Russia, someshort-lived medical radioisotopes (radiopharmaceutical preparations with Thallium-199, Sodium Pertechnetate, Technetium-99m and lodine-123) are produced inTomsk and St. Petersburg.
Russia parallel with the USA is the world's largest producer and supplier ofstable isotopes. The ancestor of stable isotope production in the USSR wasKurchatov Institute for Atomic Energy, where in the fifties the first experimentalinstallations were created, technological principals and method of moleculardivision were developed. Later in city of Ekaterinburg in "Electrochimpribor" Plantthe industrial production of stable isotopes by means of electrochemical methodwas created.
At the present time, there are four main producers of stable isotopes in Russia :"Electrochimpribor" in Ekaterinburg, Electrochemical Plant in Krasnoyarsk,Kurchatov Institute for Atomic Energy in Moscow and Centrotech in St. Petersburg,which produce in total more than 200 stable isotopes. Considerable part of them isexported.
On the basis of SSC RF of Physics and Energetics Institute in Obninsk,Scientific Technical Center of Stable Isotopes (STC SI) was established. Itpossesses a Fund of 49 isotope elements, which was created within last 30years. The Fund is widely used by scientific and research centers of the countryfor various researches in nuclear physics with employment of targets withenriched stable isotopes, granted by STC SI on lease. A certain part of the Fund isused for deliveries of the enriched stable isotopes to the enterprises both in Russiaand abroad.
Thus the established structure of radioisotope production allows completely tomeet the needs for radioisotopes and products on their base within Russia and toexport these products as well.
In accordance with "The Federal Low on the Nuclear Energy Employment", thegovernment of the Russian Federation sanctioned a procedure for export andimport of radioactive materials and products, based on them. According to theserules, import and export of radioisotopes is carried out under the licences ofMinistry for Foreign Economic Relations and Trade of Russia ( MFERT). In its turnthe MFERT issues these licenses only on the ground of applications of thecompanies, agreed with Ministry for Atomic Energy of RF (Minatom) and in somecases with Committee for Export Control of RF and Federal Supervision ofRussia for Nuclear and Radiation Safety (Gosatomnadzor).
To obtain a licence for import of radioisotope products for medical purposes, it isnecessary to apply to Ministry for Public Health of Russia as well, providing all thedocuments and licenses of the above stated responsible bodies, and besides, thestatement of Minatom of Russia about impossiibility to manufacture the similarproducts by Russian enterprises.
No licences are required for export and import of radioisotope products withhalf-life period less than 10 days as well as of the products with small content ofradioactive materials, which not subject to the State Safety Rules forTransportation of Radioactive Materials, except import of products for medicalpurposes.
It is necessary to note, that any radioactive isotopes, materials and dependedproducts, either exported from the Russian Federation, or imported to it, subject tocustoms control and official registration in accordance with the Russian legislation.
Ministry for Foreign Economic Relations and Trade issues both general andindividual licences for enterprises. At present time, Production Association"Mayak" has general licences for export of the products, manufactured in its ownfacilities, and the Foreign Trade Company "Techsnabexport" has generallicences for export of the most of radioactive products, manufactured bydifferent producers in Russia.
"Techsnabexport" , now the main exporter of isotope production , is one of theoldest foreign trade companies in Russia with more than 30-year experience ofactive work on the world market. "Techsnabexport" is a joint-stock company andamong its main shareholders are the largest production enterprises of nuclearfuel power cycle of Minatom. Ministry of Finance and Ministry for ForeignEconomic Relations of Russia are the main founders and shareholders of"Techsnabexport" too.
The annual turnover of "Techsnabexport" exceeds 1 billion US Dollars.Thus "Techsnabexport" is the leading foreign trade company working in close
contact with Minatom and other main state ministries and presenting interests ofMunatom's production enterprises on the world market.
"Techsnabexport" has long-term firm business relations with all manufacturersof isotope production, listed above.
The cooperation forms are constantly in process of changing and reflect quickalterations in the economy of Russia and international practice of foreign trade.
Thus for example in 1992 "Mayak" and "Techsnabexport" together with Britishcompany "Amersham" organized Russian-British joint-stock company "Reviss",which is specialized in export of radioisotope production of "Mayak". The annualvolume of trade transactions through this company has increased from 6,0 millionUSDollars in 1992 to 13,0 US Dollars in1994.
With other enterprises "Techsnabexport" works as foreign-trade intermediary-commissioner. In that way the production enterprises enjoy the possibility of usingthe many years experience and knowledge of foreign trade activity, brancheddistribution and agency network of "Techsnabexport" all over the world. Besides,Techsnabexport" as the company, specializing in export of isotope production, hasgeneral licences of state bodies that speed up considerably the process ofconcluding contracts and fulfilling of physical deliveries to end-users of suchspecific products as isotopes.
The dynamic of export volume increase under direct contracts of"Techsnabexport" with foreign consumers, looks as follows:1992 1993 1994
10,0 millions 10,5 millions 12,1 millions
The nomenclature of export production consists of the whole range of abovementioned radioactive and stable isotopes, the main of which are: Cobalt 57 and60, Phosphorous-33, Nickel-63, Germanium-68, lridium-192, Cesium-137,Thallium-203, Zinc-68, Cadmium-112 and 114, Krypton-82 and 85, and also"Depleted zinc".
In 197-1998 we expect considerable growth of isotope products' export fromRussia, connected with broadening of traditional spheres of application andindustrial use of isotopes in new high-technological branches.
Russian manufacturers of isotope production are, as they were before, on theleading positions among the same enterprises of the world. High production qualityand authority of reliable business partners attract foreign consumers and allow toestablish strong and close connections.
From this point of view strengthening and development of partnership, exchangeof scientific and technological knowledge,, cooperation in different forms - are maintasks and purposes of all Russian Minatom's enterprises. We welcome suchcooperation and are open for it.
Thus, as you can see, Russia has large realistic technical potential forproduction of stable and radioactive isotopes, and also of various products on theirbase. Export of these products is in dynamic progress, as it is shown at Figure 1.The scientific and technical potential of the country allows to increase their exportsome times as large. We are open for discussing of concrete orders for deliveriesof all the types of isotope products, manufactured by Russian enterprises.
7
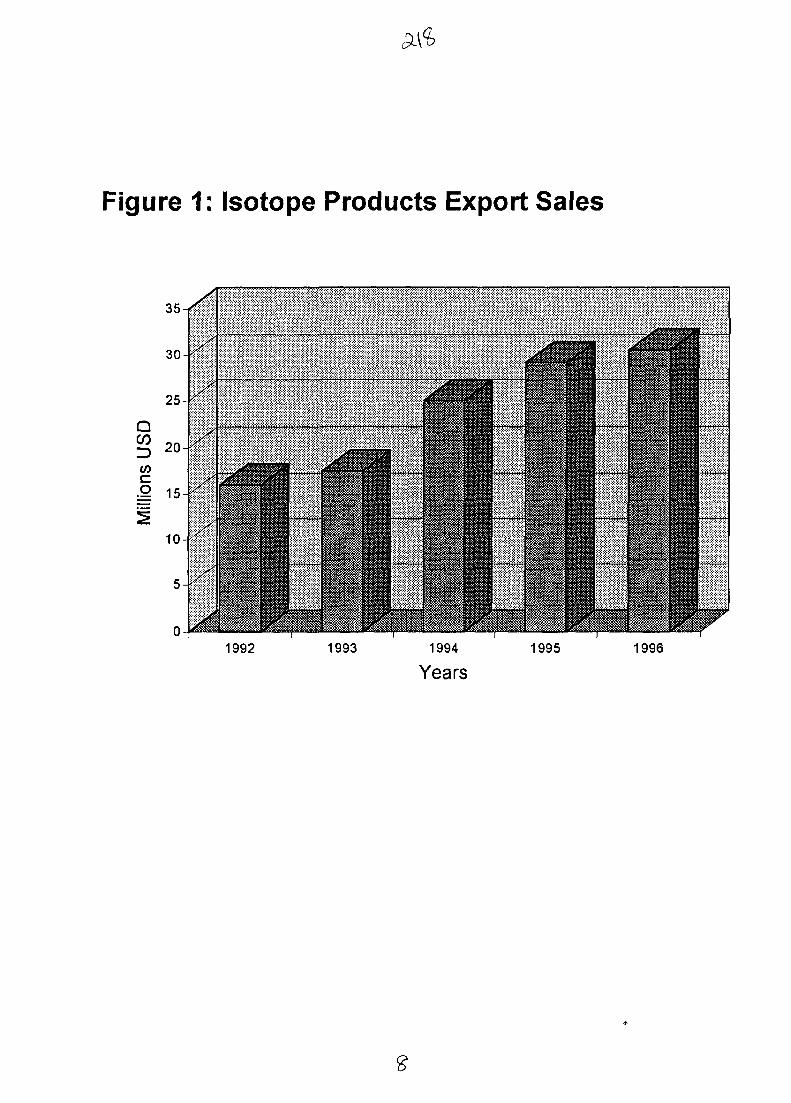
Figure 1: Isotope Products Export Sales
35-1
1992 1996
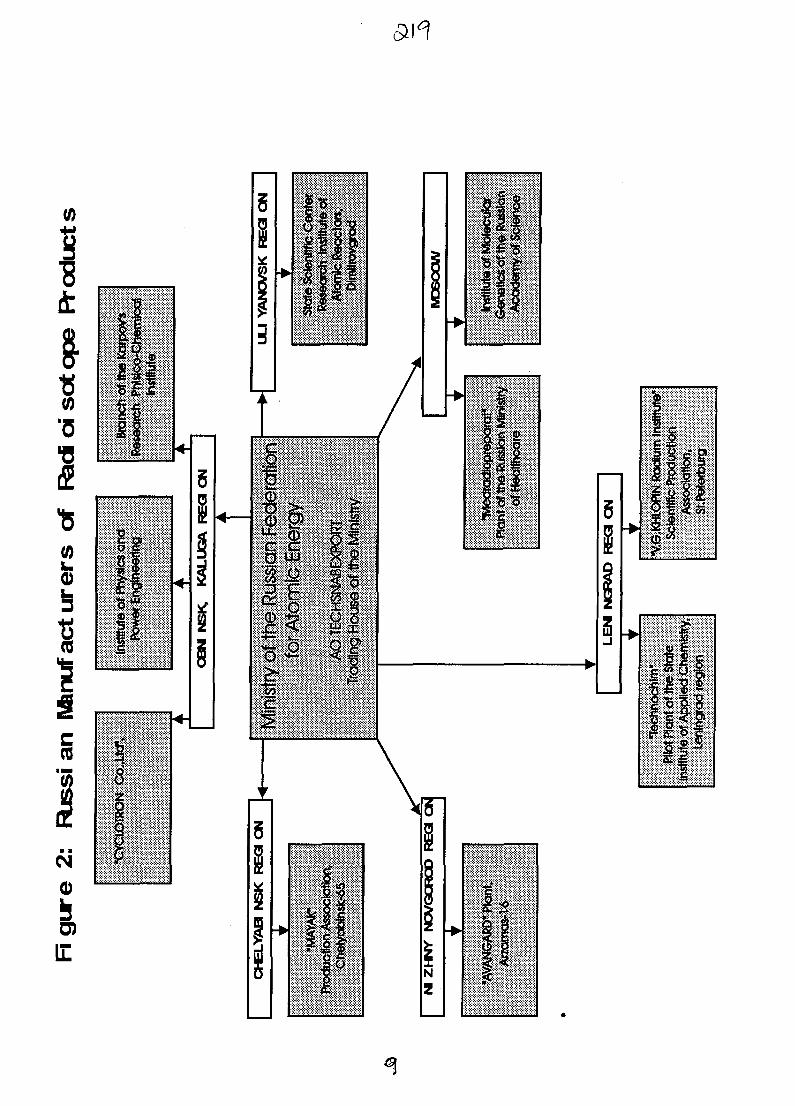
W'5•8
"8(0
0)
AU9817340
Spallation Production of Neutron Deficient Radioisotopes in North America
D. J. JAMRISKA1, E. J. PETERSON1, J. CARTY2
1) Los Alamos National Laboratory, P.O. BOX 1663, MSJ514, Los Alamos, NM 87545USA
U. S. Department of Energy, Office of Isotope Production and Distribution, NE-70, RM432, 19901 Germantown R d , Germantown, MD 20874, USA
SUMMARY. The United States Department of Energy produces a number of neutron deficientradioisotopes by high energy proton induced spallation reactions in accelerators at Los AlamosNational Laboratory in New Mexico and Brookhaven National Laboratory in New York. Researchisotopes are also recovered from targets irradiated at TRIUMF in British Columbia, Canada. Theradioisotopes recovered are distributed for use in nuclear medicine, environmental research, physicsresearch, and industry worldwide. In addition to the main product line of Sr-82 from either Mo orRb targets, Cu-67 from ZnO targets, and Ge-68 from RbBr targets, these irradiation facilities alsoproduce some unique isotopes in quantities not available from any other source such as Al-26, Mg-28, Si-32, Ti-44, Fe-52, Gd-148, and Hg-194. We will describe the accelerator irradiation facilities atthe Los Alamos and Brookhaven National Laboratories. The high level radiochemical processingfacilities at Los Alamos and brief chemical processes will be described.
1. INTRODUCTION
The United States Department of Energyproduces a number of neutron deficientradioisotopes by high energy proton inducedspallation reactions in accelerators at LosAlamos National Laboratory in New Mexicoand Brookhaven National Laboratory in NewYork. Spallation reactions generally resultfrom interaction of >100MeV particles with anucleus.
This paper will describe the acceleratorirradiation facilities at the Los Alamos andBrookhaven National Laboratories. The highlevel radiochemical processing facilities andbrief chemical processes will be discussed.
International cooperation contributed to theyear round supply of "Cu with targetirradiation performed at all three facilities.
A number of rare and exotic radioisotopes notavailable anywhere else in the world areproduced and distributed to researchers aroundthe world. These radioisotopes range from10Be and 26A1 to 194Hg and most are recoveredfrom targets many mass numbers above.
2. THE ACCELERATORS
The US DOE operates two medium energyparticle accelerators that have radioisotopeproduction missions. One is located in NewMexico at the Los Alamos NationalLaboratory and the other is located in NewYork at the Brookhaven National Laboratory.Research isotope targets are also irradiated atTRIUMF in Vancouver, British Columbia andprocessed at one of the National Laboratories.
Isotope production is supplemental to theprimary physics research at all three facilitiesand isotope production capabilities at each ofthe facilities are different.
Los Alamos National Laboratory1 uses theLANSCE (Los Alamos Neutron ScienceCenter) Facility. This accelerator generates800 MeV H+ protons at nearly 1 mA ofcurrent. This accelerator is nearly 1 km longand the isotope production facility is locatedin front of the beam stop. A total of ninetarget stations permit irradiation of ninetargets at once with the beam traversingthrough each target in succession. A speciallydesigned target holder can hold threeexperimental targets, although normally there
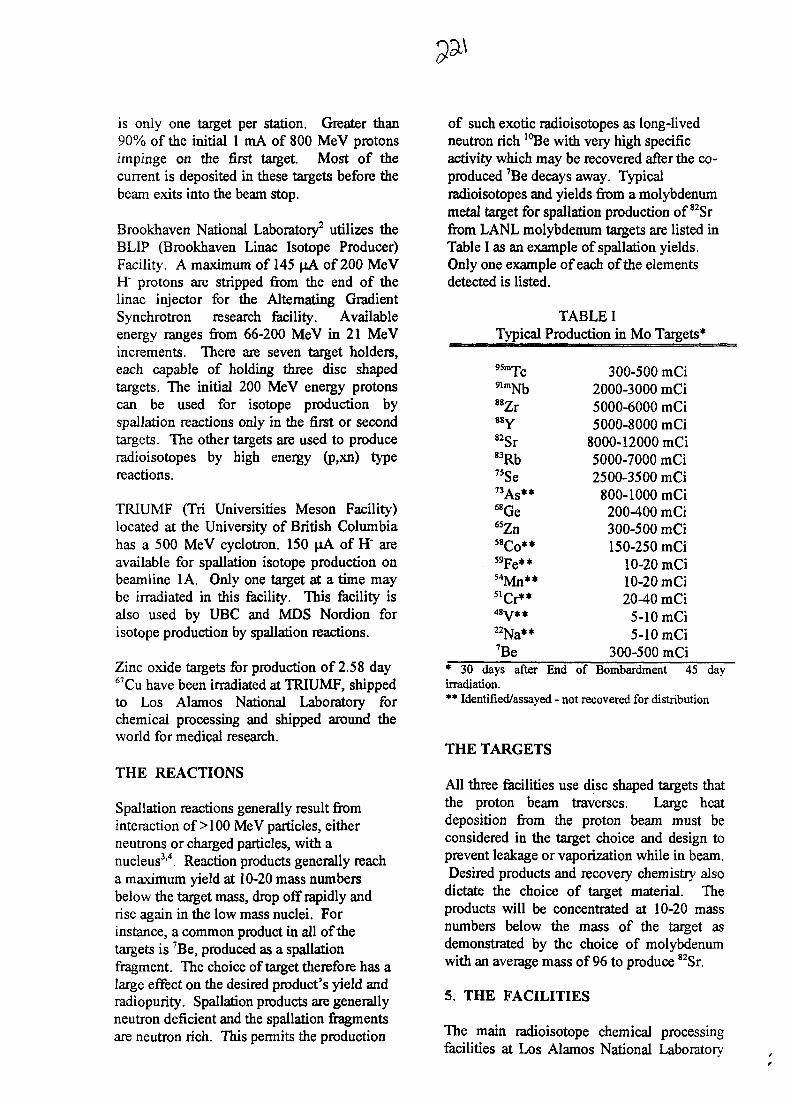
is only one target per station. Greater than90% of the initial 1 mA of 800 MeV protonsimpinge on the first target. Most of thecurrent is deposited in these targets before thebeam exits into the beam stop.
Brookhaven National Laboratory2 utilizes theBLIP (Brookhaven Linac Isotope Producer)Facility. A maximum of 145 |iA of 200 MeVH" protons are stripped from the end of thelinac injector for the Alternating GradientSynchrotron research facility. Availableenergy ranges from 66-200 MeV in 21 MeVincrements. There are seven target holders,each capable of holding three disc shapedtargets. The initial 200 MeV energy protonscan be used for isotope production byspallation reactions only in the first or secondtargets. The other targets are used to produceradioisotopes by high energy (p,xn) typereactions.
TRIUMF (Tri Universities Meson Facility)located at the University of British Columbiahas a 500 MeV cyclotron. 150 pA of H' areavailable for spallation isotope production onbeamline 1A. Only one target at a time maybe irradiated in this facility. This facility isalso used by UBC and MDS Nordion forisotope production by spallation reactions.
Zinc oxide targets for production of 2.58 day67Cu have been irradiated at TRIUMF, shippedto Los Alamos National Laboratory forchemical processing and shipped around theworld for medical research.
THE REACTIONS
Spallation reactions generally result frominteraction of > 100 MeV particles, eitherneutrons or charged particles, with anucleus3'4. Reaction products generally reacha maximum yield at 10-20 mass numbersbelow the target mass, drop off rapidly andrise again in the low mass nuclei. Forinstance, a common product in all of thetargets is Be, produced as a spallationfragment. The choice of target therefore has alarge effect on the desired product's yield andradiopurity. Spallation products are generallyneutron deficient and the spallation fragmentsare neutron rich. This permits the production
of such exotic radioisotopes as long-livedneutron rich 10Be with very high specificactivity which may be recovered after the co-produced 7Be decays away. Typicalradioisotopes and yields from a molybdenummetal target for spallation production of 82Srfrom LANL molybdenum targets are listed inTable I as an example of spallation yields.Only one example of each of the elementsdetected is listed.
TABLE ITypical Production in Mo Targets*
95mT c
91mNb88Zr88y
82Sr83Rb"Se73As**^Ge65Zn58Co**59Fe**54Mn**5ICr**
22Na**7Be
300-500 mCi2000-3000 mCi5000-6000 mCi5000-8000 mCi
8000-12000 mCi5000-7000 mCi2500-3500 mCi
800-1000 mCi200-400 mCi300-500 mCi150-250 mCi
10-20 mCi10-20 mCi20-40 mCi
5-10 mCi5-10 mCi
300-500 mCi* 30 days after End of Bombardment 45 dayirradiation.** Identified/assayed - not recovered for distribution
THE TARGETS
All three facilities use disc shaped targets thatthe proton beam traverses. Large heatdeposition from the proton beam must beconsidered in the target choice and design toprevent leakage or vaporization while in beam.Desired products and recovery chemistry also
dictate the choice of target material. Theproducts will be concentrated at 10-20 massnumbers below the mass of the target asdemonstrated by the choice of molybdenumwith an average mass of 96 to produce 82Sr.
5. THE FACILITIES
The main radioisotope chemical processingfacilities at Los Alamos National Laboratory
consist of twelve inter-connected hot cells plusa universal dispensary cell. All targets andwaste enter and exit the facility from thisdispensary cell. A large electric train runningunder the cells permits easy transfer ofmaterials between cells. An additional facilitywith sixteen hot cells in two separate banks ofeight is also available for chemical processingif needed.
Additional facilities in the mainradiochemistry laboratories consist of sixchemical fume hoods that are used forrecovery of small quantities of radioisotopesand for chemistry procedure development.Analysis of stable metal elements content ispossible on all radioactive products usingeither computer controlled DCP-AES or ICP-AES instruments located within the facility.
Radiochemical analysis for gamma emittingradioisotopes produced at Los Alamos isperformed with three high purity germaniumdetector systems connected to a Micro VAXcomputer system.
These detector systems are located throughoutthe chemical processing facility and arecalibrated for activity levels ranging fromnanocuries to curies. Analysis for low energyx-ray, beta and alpha emitting radioisotopes isdone using capabilities of the RadiochemistryCounting Room. This facility has nearlyseventy different state of the art computercontrolled detector systems available for use.
Recent major upgrades at the BrookhavenNational Laboratory2 include the addition oftwo new hot cells for a total of seven availablefor radiochemical processing. An upgradedventilation system and liquid waste handlingdisposal system were also installed to bringBNL into compliance with currentenvironmental regulations.
As with the sister laboratory at Los Alamos,Brookhaven National Laboratory also hasavailable a number of radiochemistry hoods.A recently installed ICP-AES permits stablemetal element analysis of isotope products.
Radiochemical analysis for gamma emittingradioisotopes produced at Brookhaven
National Laboratory is performed with highpurity germanium detector systems. Thesedetector systems are located within thechemical processing facility.
Both BNL and LANL chemistry facilities areapproved by the U.S. Food and DrugAdministration for production of BulkPharmaceutical Components.
6. THE CHEMISTRY
Spallation reactions are not selective andelements ranging from the next element abovethe target down to hydrogen are produced invarying quantities. Chemical separationtechniques have been developed to recover theradioisotopes of interest in both highradiochemical purity and yield. Thesechemical processes have also been required toreduce or eliminate the generation of mixedwaste.
The only isotope common to all three facilitiesis 67Cu produced in natural abundance ZnOtargets. The actual production reactionmechanism is complex with other high energyreactions such as (p,2p) and (p,a) on 67Zn and70Zn contributing significant quantities ofproduct. This radioisotope has beenchemically processed only at LANL and BNL.Each facility uses a different method of
chemical recovery of the 67Cu.
Los Alamos National Laboratory uses anelectrochemical method of recovery of the67Cu from sulfate solutions after dissolution ofthe zinc target in dilute H2SO4. This isfollowed by simple anion and cation exchangefor final purification.
Brookhaven National Laboratory hasdeveloped a recovery method based on use ofChelex 100. After target dissolution in HC1the material is evaporated to dryness andredissolved in buffer solution. The zinc targetmaterial is not sorbed on the Chelex and afterwashing the resin the 67Cu and otherradioisotopes are desorbed and purified usingconventional anion and cation exchangemethods.
The separated zinc solutions can be further
3
processed to recover "*V, 49V, 7Be andisotopes of scandium. These solutions haverecently been found to contain significantquantities of **Ti and investigations areunderway to recover and distribute this rareisotope to the research community.
Large quantities of ^Ge have been producedby spallation reactions on RbBr targets*'6.After dissolution in HC1 the ^Ge is recoveredby distillation from 6 M HC1 followed byextraction in CCL4 to separate spallationproduced selenium and arsenic radioisotopes.Very high specific activity 73As has beenproduced as a byproduct of this ^Geproduction.
Microcurie quantities of 2SA1 and 32Si havebeen separated from KC1 targets irradiated for4-6 months7. The irradiated KC1 target isdissolved in H2O and filtered. The filtratecontaining the 32Si is acidified, converted to aheteromolybdate complex and sorbed onSephadex. After washing away the KC1 targetmaterial the pure 32Si is stripped from thecolumn with dilute base. The water insolublefraction is dissolved in HC1 and the 26A1 isrecovered by ion exchange.
Brookhaven National Laboratory uses 192MeV protons on KCL targets to produce a M gby spallation. The targets is dissolved in H2Oand the Mg recovered by precipitation andsolvent extraction.
Tantalum targets have provided largequantitiesof 148Gd in addition to microgram quantities ofn8m2Hf produced by spallation reactions.Dissolution of the tantalum in HNO3-HF wasfollowed by precipitation on CaF2.Dissolution of the CaF2 in HC1-HBO3 wasfollowed by ion exchange for purification.
In the past silicon targets have been used toproduce 10Be, and l94Hg has been recoveredfrom bismuth targets. The l0Be wasrecovered after distillation of the silicon targetmaterial as the fluoride. No carrier addedI94Hg was recovered by extraction into ethylacetate after the bismuth target was dissolvedin dilute HNO3.
Molybdenum targets irradiated for S2Srproduction are dissolved in H2O2 and theisotopes of Zr, Y, Sr, Rb, Zn, Fe, Mn, Cr, Na,and Be sorbed on a cation exchange resin8'9.These cations are stripped from the resin withHC1, evaporated and resorbed on a new cationexchange column. Washing the resin withdilute H2SO4 removes all of the isotopespresent except 82Sr and 88Y. The !2Sr isremoved from the resin with dilute HCI andthe 88Y is not removed from the resin. Therecovery of ^Zr, 83Rb, 65Zn and 7Be from thesulfate solution is accomplished by ionexchange.
The molybdate eluate from the first column isused to recover ^Ge and 95mTc using Sephadexion exchanger and Reillex HPQ resins.
192 MeV protons on 58Ni targets have beenused at Brookhaven National Laboratory toproduce 52Fe. Recovery and purification ofthe 52Fe was accomplished by anion exchange.
CONCLUSIONS
The high currents available at the threeaccelerators combined with spallationreactions are an effective method to producequantities of unique radioisotopes not possibleat any other accelerator in the world. Theseradioisotopes have found use in nuclearmedicine, environmental research, physics andindustry worldwide.
The US DOE has successfully irradiated ZnOtargets in three facilities throughout NorthAmerica, chemically processed and distributedthe recovered spallation produced £7Cu toresearch facilities throughout the world.Irradiation at all three facilities was needed tocontinually produce 67Cu year round in spiteof the maintenance shutdown requirements ofthe various facilities.
Specific chemical techniques have beendeveloped for the recovery of the spallationproduced radioisotopes.
REFERENCES
G. E. BENTLEY, J. W. BARNES, T. P.DEBUSK and M .A. OTT, Proceedings of
26th Conference on Remote SystemsTechnology. 1978
2) L. F. MAUSNER, p.c. 1997
3) G. FRJJBDLANDER, J. W. KENNEDY, E.S. MACIAS, and J. M. MILLER, Nuclear andRadiochemistry, 3rd edition, J. Wiley & Sons,New York
R. MICHEL, B. DITTRICH, U. HERPERS,F. PEIFFER, T. SCfflFFMANN, P. CLOTH,P. DRAGOVTTSCH and D. FELGES, Analyst,March 1989, vol. 114
S. MIRZADEH, M. KAHN, P.M. GRANTand H.A. O'BRIEN, Radiochimca Acta 28,47-49(1981)
6) D. R. PHILLIPS, D. J. JAMRISKA, V. T.HAMILTON, U. S. Patent # 5,190,7353/20/93
7) D. R. PHILLIPS, V. T.HAMILTON, D. J. JAMRISKA,M.A. BRZEZINSKI, Journal ofRadioanalytical and NuclearChemistry, Articles, Vol. 195, No. 2(1995) pp 251-261
8) R. C. HEATON, D. J. JAMRISKA, W. A.TAYLOR, U.S. Patent#5,167,938 12/1/92
9) R. C. HEATON, D. J. JAMRISKA, W. A.TAYLOR, U.S. Patent # 5,330,731 7/19/94
5
AU9817341
REVISS/MAYAK: A NEW PARTNERSHIP IN RADIOISOTOPE SUPPLY
NEIL BENNETTREVISS Services (UK) Limited, 6 Chiltern Court, Asheridge Road, Chesham,
Bucks, HP5 2PX, UK
A.I. CHIKSHOV, Y.A. MALYKHMA YAK Production Association, 31 Lenin St, Ozyorsk, 456780, RUSSIA
SUMMARY. This paper describes how REVISS Services (UK) Ltd, the joint venture companyformed between Amersham International pic, Production Association MA YAK and Techsnabexport,is able to provide an extensive range of radioisotope and radiation source products and services,including Cobalt-60 sources and services for the irradiation processing industry supplied under thePURIDEC Irradiation Technologies brand. The paper discusses the history, facilities and capabilitiesof Mayak and describes how REVISS's special expertise enables it to also effectively procureproducts and services from other suppliers in Russia.
1. INRODUCTION
MAYAK Production Association, which is themain manufacturing supplier to, and a keyshareholder in REVISS services, is situated inthe Urals region of Russia about 100 milesfrom Ekaterinburg. It was formerly a closedand secret city not open to Western visitors,and not even shown on maps. Its developmentinto a world supplier of radioisotope productsis one of the brightest examples of the re-orientation of the world's nuclear industry,particularly in Russia.The history of the company dates back to thelate 1940's when the first nuclear reactordesigned for Pu-239 production wascommissioned on the Chelyabinsk-65 site onJune 19, 1948. Over the next 40 yearsMAYAK grew rapidly to become the mostpowerful defence nuclear complex of theformer Soviet Union, whose main functionwas to support the national military program.In this respect, MAYAK'S developmentmirrors DoE Hanford in the U.S and AWRE inthe UK. Advanced technology and equipment,and experienced, well trained and highlyprofessional personnel were all focused on
achieving the goals of the defence programand all production-related and even socialactivities were covered by a dense curtain ofsecrecy.Following political changes in the late 1980'sand the early 1990's, the Russian economychanged dramatically with the result thatmilitary spending was cut, causing problemsfor financing and managing the MAYAKindustrial complex. Conversion of militaryproduction into development and manufactureof products and processes for peacefulapplications was the only viable way for thecompany to develop and maintain its technicaland R&D potential. A positive aspect ofpolitical and economic reform was the abilityof MAYAK to participate in a joint venturecompany with Amersham International-REVISS Services Ltd - see Figure 1. REVISSbetter enabled MAYAK products to accessexport markets and gradually MAYAKdeveloped from an industrial military complexto a center of Nuclear Fuel Reprocessing andRadioisotope Manufacturing.Today MAYAK'S activities cover the wholerange of nuclear cycle operations relating toreprocessing and handling of radioactive
materials, including reactor irradiation oftargets, reprocessing of targets and spent fuelfrom nuclear power stations, extraction andpurification of radioisotopes, fabrication ofradiation and heat sources and recycling andsolidification of radioactive waste using anadvanced vitrification technology.
2. PRODUCTION FACILITIES ANDCAPABILITIES
Based on its continuing developments in theReactor, Reprocessing and RadioisotopeProduct divisions, and as a result of successfulimplementation of the conversion program andclose co-operation with its joint venturepartner Amersham International pic to formREVISS Services, MA YAK is now known as aworld class supplier of Cobalt-60, particularlyfor Gamma Processing Plants, and Caesium-137 sources, as well as a major internationalsupplier of other radioisotopes, including Pu-238 which is purchased by the US DoE forfabrication of the radioisotope thermoelectricgenerators for NASA's long term deep spacemissions.Two highly efficient reactors used forradioisotope production are now in operation.A wide range of radioisotopes is produced byirradiation including Co-60 (both LSA andHSA), C-14 and Ir-192. The neutronspecification of the reactors is sufficient toachieve a specific activity as high as 300 Ci/gfor Co-60.Most reactor produced radioisotopes, exceptCo-60 and Ir-192, require physio-chemicalreprocessing of either irradiated targets orspent fuel assemblies. MA YAK successfullyoperates multi-stage separation processeswhich enable extraction from the spent fuel,and the subsequent purification, of a variety ofhigh quality radioisotopes, in particular Cs-137.Both primary and secondary encapsulation ofthe raw material is carried out in hot cellsequipped with manipulators. MAYAK'sfacilities for fabrication of Cs-137 and Co-60sources are arranged to minimize thepossibility of contaminating the finishedproducts and to ensure that they are fabricated,quality tested and loaded into containers inclean hot cell conditions. This is achieved byphysical segregation of the production lines for
primary and secondary encapsulation. Allsource fabrication cells are lined inside withstainless steel and have sufficient radiation andbiological shielding to allow for holdingsignificant activities of Co-60 with completesafety for personnel. Wide lead glasswindows, easy to use manipulators and allnecessary auxiliary equipment provide safeand effective production operations includingsource encapsulation, measurement andtesting. The tested and Quality Assurancecertified sources are finally loaded intotransport containers directly in the hot cell andthen shipped to PURIDEC/REVISS in the UK.Alternatively, when immediate shipment is notrequired, the finished sources can betemporarily stored in a pond connected to theproduction line by means of conveyor system.The storage pond is a 6 meter deep stainlesssteel encased tank with a licensed capacity ofmany MCi. The pond is filled with water asvapour condensate which is replaced on aregular basis. The water conditions areconstantly monitored for chloride ion content,general hardness, pH and radionuclide content.After storage in the pond, before loading intocontainers and subsequent shipment, sourcesare rigorously re-inspected to verify that theymeet customer and quality assurancerequirements.Additionally, when there is a need forprototype testing to meet requirements for ISOClassification and IAEA Special Formcertification of sources, MA YAK has thenecessary facilities and equipment, as well asqualified and authorised personnel, to performall the required testing and to provide resultswithin the required time-scales.
3. PRODUCT RANGE
The REVISS range of radioisotope/radiationsource products is now the most extensiveavailable world-wide. It includes, fromMAYAK:Radiation sources:-• Cobalt-60 SourcesCobalt-60 sources and services, includingirradiation plant are supplied by REVISSunder its PURIDEC Irradiation Technologiesbrand.Over the last few years MAYAK's productionoutput has increased manyfold from a few
MCi per year, due largely to the success ofPURIDEC Irradiation Technologies in themarket. The increased volume includesCobalt-60 sources manufactured for:- Sterilization of medical disposable
products, food preservation and otherirradiation applications (MAYAK designedGIK-A3 sources and REVISS designedRSL2089 sources- equivalent to AmershamInternational's type X2089), plus rawmaterials for REVISS's RSL1800 drystorage source design.
- Gamma teletherapy for medicalradiotherapy
Neutron irradiated and nickel plated metalCobalt-59 discs (dia. 7.0-20.0mm) and slugs(dia. 0.8 and 1.4mm) are used as the activecore for fabrication of Co-60 sterilization andtherapy sources. These are doublyencapsulated into 316L stainless steel capsulesin hot cells by using Tungsten Inert Gas(Argon) welding.MAYAK is able to make standard sourceswith capsule designs and curie contentsranging from 170 mCi (therapy) to over 15,000Ci (sterilization). These are produced tocustomer specifications so that dimensions andactivities of sources for almost any design ofwet storage irradiator can be supplied whilstsources for dry storage irradiators are alsoprovided.All Co-60 sources undergo rigorous qualitycontrol including weld section examination,radiation measurement, helium leak, bubble,immersion and wipe tests. They can also betested for ISO Integrity Classification, and ifnecessary, IAEA Special Form certified fortransportation purposes. Based on the highmanufacturing and quality standards achievedby MAYAK, and PURIDEC's ongoingsurveillance programme, a source working lifeof up to 20 years is offered.• Caesium-137
In the last few years MAYAK's Cs-137 production output has increaseddue to the successful marketing effortsof REVISS Services Limited.MAYAK's production capacity ofmany hundreds of kCi of Cs-137sources per year can be made availablefor various applications including:- Research and calibration- Therapy
- Blood irradiation- Sterilization- Process controlCaesium Chloride with Cs-134 content< 1% and <3% and specific activity22-23 Ci/g is used as active materialfor the manufacture of finishedsources. The sources are doublyencapsulated, sealed by TIG weldingand subsequently quality tested bybubble, helium leak and wipe tests.Their individual activity range is from1 Ci to 4,000 Ci.
• Strontium-90For power/heat sources
• Americium-241For smoke detectors and in neutronsources
• Iridium-192For industrial radiography
Bulk radioisotopes:-• Carbon-14• Krypton-85
(Low and high enrichments)• Tritium gas• Neptunium-237• Strontium-90
Additionally stable isotopes, cyclotronproducts and other nuclides can be providedvia REVISS's contacts with organisations suchas:RIAR, Dimitrovgrad (P-33, Cf-252 )"Cyclotron", Obninsk (Co-57, Cd-109 )"Avangard", Arzamas (Po-210 )Khlopin Radium Institute, St Petersburg, (Fe-55 )
4. PURIDEC IRRADIATIONTECHNOLOGIES
PURIDEC Irradiation Technologies, asmentioned above, is the brand name of thebusiness group providing Cobalt-60 sourcesand services for the irradiation industry. It wasinitially set up by Amersham International Picbut is now fully integrated into REVISSServices (UK) Ltd. PURIDEC has over 35years of experience in the design andmanufacture of Cobalt-60 sources and nowexclusively markets the NUKEM range ofindustrial irradiation plants. NUKEM's
experience goes back to 1962 when H.S.Marsh Ltd, now part of the NUKEMorganisation, built the world's first commercialirradiator for Johnson & Johnson in the UK.This partnership enables PURIDEC tocombine its own skills in manufacturing,handling and transporting radiation sourceswith NUKEMS's vast experience in designing,manufacturing and building nuclear, chemicaland other processing plants. Thus PURIDEC'sproduct range now includes:- RSL2089 source design for wet storage
irradiators - transported in smalllightweight containers
- RSL1800 source design for dry storageirradiators
- Special source designs for research andother small irradiators
- Installation of sources into all types ofirradiator
- Calculation of source loading patterns toachieve optimum plant performance in linewith customers' objectives.
- Irradiation plants, including tote and pallettypes, for all applications
- Engineering services including design andmanufacture of source racks and modules
- Installation of PURIDEC's leading PCbased control system, including automateddosimetry and product tracking,intoexisting plants
- Source surveillance programmes to supportsafety of plant operation
- Training programmes covering safety, plantoperation, dosimetry, etc.
5. QUALITY ASSURANCE
MA YAK would never be able to access exportmarkets without achieving and maintaininginternationally recognised quality standards,based on its old traditions of militaryproduction when quality was a decisive factor.MAYAK's production capabilities have beenupgraded to supply products within a ISO9001compliant quality system.All technological processes are documentedand approved. Goods-in inspection isperformed for all materials in process(components and raw materials). Qualitymonitoring and traceability throughout theproduction process is maintained via routecards. Positive product release ensures that
products meet the customer specification andis compulsory, with the results being recordedin Quality Records supplied with the sources.All MA YAK's Quality Assurance proceduresare based on ISO standards and techniques.Weld sections are routinely prepared fromwelded inactive process control samples toverify the required penetration. Containmentof the finished sources is checked during theprocess of fabrication by using wipe, bubbleand immersion tests, and also heliumpressurization or helium pre-filled leak tests.The finished products have a very lowcontamination level as required by customersand this is confirmed by a wipe test. Radiationmeasurements of sources can be made to thecustomer's requirements including ExposureDose Rate and Air Kerma Rate measurementin low scatter conditions or by comparisonwith a certified standard. Activity distributionscanning etc. is also available. In addition,there are other measurement facilitiesavailable which enable MA YAK to performmore accurate activity measurements usingcalorimetry and also alpha/beta/gammaspectrometry and precise elemental analysisusing an Inductive Coupled Plasmaspectrometer.Finally all REVISS/PURIDEC major sourcedespatches and other services follow writtenprocedures and are made within a fullycomprehensive ISO9001 compliant QualityAssurance system.
6. CONCLUSIONS
Using the skills and facilities developed as aresult of its earlier defence activities MA YAKhas reorientated to manufacture peacefulproducts and become, via its joint venturecompany REVISS Services (UK) Ltd, not justa major supplier of radioisotopes and otherassociated products, but the supplier with thelargest product range. Products aremanufactured to the highest possible standardsof quality assurance enabling REVISS to offerits customers CHOICE, QUALITY andSERVICE.
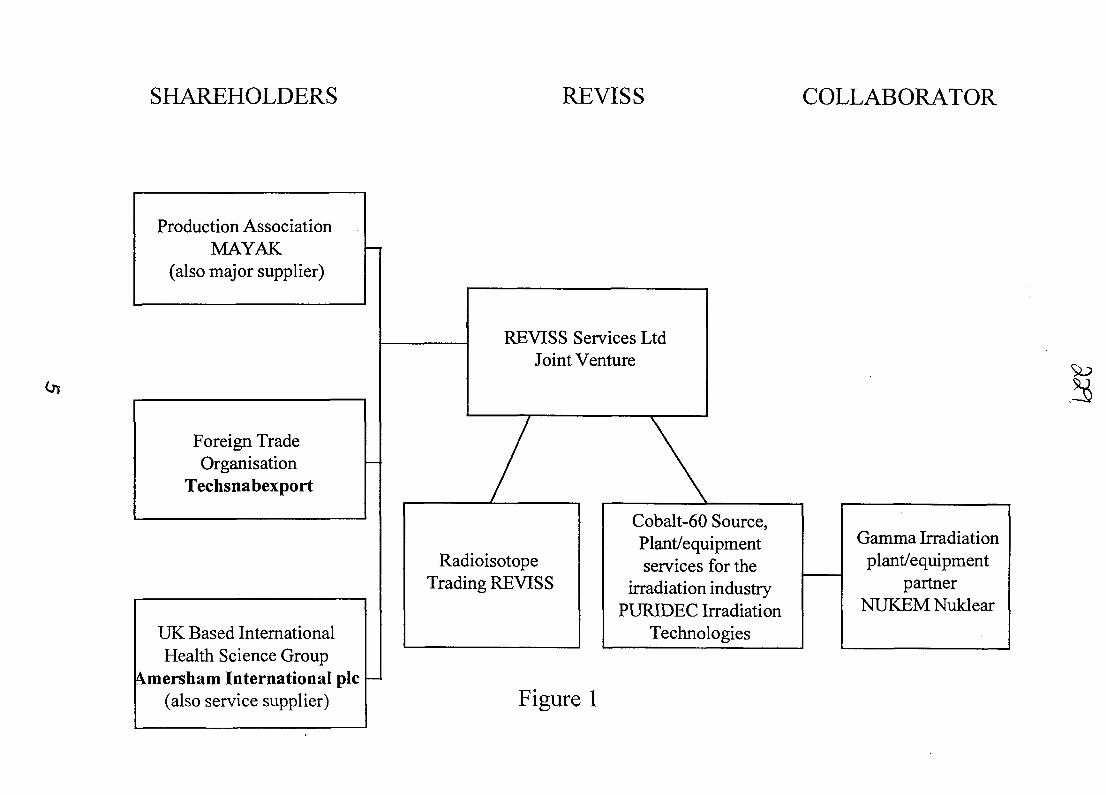
SHAREHOLDERS REVISS COLLABORATOR
Production AssociationMAYAK
(also major supplier)
Foreign TradeOrganisation
Techsnabexport
UK Based InternationalHealth Science Group
\mersham International pic(also service supplier)
REVISS Services LtdJoint Venture
RadioisotopeTrading REVISS
Cobalt-60 Source,Plant/equipmentservices for the
irradiation industryPURIDEC Irradiation
Technologies
Gamma Irradiationplant/equipment
partnerNUKEMNuklear
Figure 1
AU9817342
Russian ElectroKhimPribor Integrated Plant - Producer and Supplierof Enriched Stable Isotopes
A. N. Tatarinov, L. A. Polyakov"ElectroKhimPribor" Integrated Plant, Lesnoy, 624200 Russia
The report represents a short review of status of Russian ElectrokhimpriborIntegrated Plant in production and distribution of enriched stable isotopes.
1. Introduction
Russian ElectroKhimPribor Integrated Plant, as well as ORNL, is a leadingproduction which manufacture and supply to the world market such specific products asstable isotopes. More than 200 isotopes of 44 elements can be obtained at itselectromagnetic separator.
Changes being underway for a few last years in Russia affected production anddistribution of stable isotopes. There arose a necessity in a new approach to handlingwork in this field so as to create favourable conditions for both producers andcustomers. In this connection at EKP a whole complex of organizing and technical stepshave been implemented aimed at enhancing efficiency of its activity in this field.
2. Separation facilitiesr
SU-20, powerful electromagnetic separator started in 1951 as a part of Sovietnuclear arms program is now used in industrial stable isotope separation atElectroKhimPribor Integrated Plant. Initially it was intended to be used for obtaininglarge quantities of U-235, but due to successful application of gas-diffusion techniqueto this end this idea was abandoned. Separation of Li isotopes had been earned out atthe separator up to 1955, and after the middle of 1955 it has been used on a regularbasis in enriched stable isotope production of various elements except for radioactive,gases and precious metals. Today the production has technologies for separation of 44elements from lithium to lead.
Su-20 is the only industrial stable isotope electromagnetic separator in the formerSoviet Union and, apparently the world's largest together with ORNL electromagneticfacility. One can estimate the dimensions of the construction when he knows the weight
of electromagnet only, and it is several thousand tons. Electromagnet incorporatestwenty separation chambers, each can accommodate up to three ion sources and thesame number of ion receivers. Due to equal magnetic field intensity in all chambers it ispossible to separate some two-three various elements simultaneously given their massesdo not differ very much. Separator structure and performances were shown earlier in [ 1,2]-
All twenty chambers, power, vacuum and control equipment are ready for use,however, a smaller number of chambers are in operation simultaneously. This number isdetermined by separation program and by need to keep some reserve which wouldallow to maintain productivity in case of some chambers being urgently put out ofaction.
E-7, separator of small productivity, was put into operation in 1996 forexperimenting and obtaining small quantities (0.1-10 g) of various isotopes of improvedquality. Small separator E-7 allow to work through a design of ion sources andreceivers, components of charge materials and separation technology without interferingwith the SU-20 operation, which allow to reduce significantly transition time betweenseparation campaigns of different elements. A minimal duration of separation campaignon the big separator SU-20 is 2-3.months.
Development and use of automation control system allow to rule out subjectivefactor and improve reliability and operational efficiency of separation process. That isparticularly effective when obtaining isotopes with low natural abundance.
Engineers and specialists working on SU-20 not only control separation process,but also carry our researches aimed at improving separator performance.
As a result of their work, SU-20 output of Sr-88, Tl-203, Yb-168 was increasedby 40-50% without fall in enrichment and enrichment of some other isotopes wassignificantly higher keeping the output constant. Enrichment of isotopes obtained duringthe last campaigns is higher (sometimes - substantially) than that of the previous ones.
3. Chemical facilities
Facilities for chemical processing of various materials are an inseparable part ofisotope production. Natural materials, as a rule, should undergo processing in order toacquire a chemical form acceptable for their use in ion sources, while enriched isotopesafter extraction from receiver pockets should be chemically cleaned and transfened intoa more stable form before dispatching to the stock. Besides certain reagents used forprocessing isotopes undergo additional purification.
Chemical part of the production is provided with necessary equipment, employshighly skilled personnel enabling to carry out simultaneously processing of isotopes ofseveral elements and obtain products possessing high chemical purity.
Next year will see reconstruction of production premises and placing of modernequipment for various kinds of chemical treatment of materials; it will essentiallyimprove labour conditions and production efficiency. Following the reconstruction themajor part of chemical production will be moved into the new premises. Arranging ofchemical departments, facilities for packaging of products and their storage in the samebuilding will positively influence the terms of shipment.
4. Isotope stock
It so happened that there were a little more then 30 various stable isotopes in theinventory at Electrokhimpribor plant in the beginning of the 90'ties, while most of themwere not in demand with the customers. The Russia's State stock of stable isotopes wasabolished and in fact they put an end to the State control over the production anddeliveries of this specific product . A great number of trading intermediary firms havecome to existence, and all of them were offering the customers products of doubtfulpedigree and quality; the "black market" became active, causing much concern of thecustomers.
Having faced the situation, Electrokhimpribor Plant authorities made a decision tocreate a separate inventory of stable isotopes, which availability would enable tomaximally meet buyers' requests. For solving the task the separation of isotopes of 17chemical elements have been carried out. As a result, 104 various isotopes have becomeavailable from EKP inventory. Thus the stock of basic isotopes for radiopharmaceuticalproduction has been raised up to a level guaranteeing their deliveries for a period of 3-4years without renewal of separation campaigns.
The products stored have different state of preparedness ranging from ready-madeforms to semifinished products as solutions. It enables within the shortest time to makedeliveries in the form needed by the customer. Using the technique of differentialisotope extraction from the receiver pockets helps keeping in stock batches of the verysame isotope with different enrichment level. This is particularity attractive forcustomers conducting research works.
When creating the inventory separation campaigns were being planned andoriented to meet perspective scientific developments in the field of stable isotopesapplications. It helped within a year and a half enlarge the list of products on sale up to27 isotopes instead of 3-4 products usually sold until 1996. It supposed to increase the
number of isotopes kept in stock at EKP to 150 (one hundred fifty) within the period oi1998-1999.
5. Quality control
The question of providing for high quality of isotopically enriched products has enjoyeda highest priority for the previous four years. The reason for this may be explained b>the following circumstances:
- ever-encreasing requirements placed by customers with regard to quality oiisotopes (especially for radiopharmaceutical production);
- the necessity of receiving products surpassing by their qualitative characteristics(enrichment and chemical purity) products manufactured earlier.
For tackling the problem a quality management system has been reorganized tccover all stages of obtaining product - from input check-ups of raw materials ancreagents used to quality certification of finished products.
Special importance is attached to technological checking of products qualit>throughout different stages of their preparation thus making possible timely correctionsto separating procedure and processing of isotopes.
Five analytical laboratories, not belonging to isotope production shop, provide foicarrying out of the procedure mentioned. These laboratories are responsible for finishecproduct quality verification against Russian standards as well.
At customers request detailed analyses are made at an independent regionalaboratory. Such analyses are aimed at defining the contents of several dozens o;chemical elements which may be present in products. The laboratory is equipped witlISP spectrometers and awarded with international certificate. For many years o.operation of isotope production at EKP there were no customers' claims with regard tcproduct quality.
6. Busineces issues
Till the middle of 1993 EKP practically had not been selling its isotope product'independently. Though due to certain changes that took place in Russia early in th«decade EKP has to tackle on his own all questions of business-activity relating tcdistribution of enriched stable isotopes. Much has been done to analyze isotope markesituation, a great number of meetings and talks held with major customers purchasingisotope products either for own use or for resale to the end users. Also pricingconception has been revised and business philosophy has been adopted to maximallymeet customer requests. In addition to creation of inventory, which qualitative anc
quantitative status should be attractive for the customer, a conception of long termcontract has been worked out providing for considerable (substantial) price discountdepending upon volume and duration of obligations. Besides, long-term contracts allowto low product price and also to plan effectively the producer's operation schedule andto guarantee reliability of deliveries and thus are attractive for the parties concerned.
Upon signing such contracts, on customer's wish, a batch of a product isaccumulated which volume enables to cover all deliveries without changing of thebatch.
Obviously it helps save time and material expenses of the customers to makecontrol checking of product received.
Rather often the buyer of isotopically enriched product wishes to have it not in theform of a chemical compound, but as products having given parameters (say wire, foil,ingots etc.). EKP has implemented certain measures to meet such requests. As a resultin 1966 for the first time the buyer obtained not simply an isotopically enrichedsubstance but an article made out it having a definite geometrical form and precisedimensions. Measures are underway to further enlarge the possibilities of fulfilling suchorders.
It is rather significant that having implemented a number of practical steps EKPfrom 1996 began making shipments of products within 7-10 days after receivingcustomers purchase order (the procedure of contract preparation is included here).Further reduction of shipment terms is limited by the time necessary for preparingcustom and bank documents, envisaged by legislation of Russia.
In order to provide for a more wider distribution of enriched stable isotopes andraise volume of sales EKP in 1996 concluded a long-term agreement on partnershipwith Canadian Company "TRACE SCIENCES" within the framework of the agreementa successful joint work is being carried out.
As a result, within eighteen months period several dozen of contracts have beenstruck for supplying isotopically enriched products practically to all world majorconsumers. So it is once more confirmed the expediency of multilateral interest of thealliance between of a producer, possessing a large production and material potential,and an experienced, dependable distributor.
The understanding of the obvious truth acquires a special significance in conditionsof ill-disposed competition, coming first all from certain Russian suppliers.
EKP guarantees reliable deliveries and for the last 5 years has had no claim fromcustomers as to implementing contracts.
7. Summary
Due to changes being underway for a few years in Russia it is necessary forsuccessful activity of the producer to work out a new approach to organizing productionand distribution of enriched stable isotopes.
In order to solve the task at the Russian EKP within the last four years they haveenhanced efficiency of Calutron operation, improved the work of large capacities forchemical processing of materials, reviewed the quality management system covering allstages of production process, created an inventory having a fairly large and ever-growing stock of various isotopes, introduced a new pricing policy, adopted a businessphilosophy oriented to meet maximum of customer needs.
All mentioned above plus consolidation of activity in production and distribution ofisotopically enriched products on one place have currently enabled EKP to be in aperfect position to meet needs of stable isotope customers in industry, medicine andscience all over the world.
References[1] N. A. Kashchejev and V. A. Dergachev, Electromagnetic IsotopeSeparation and Isotope Analysis (Energoizdat, Moscow, 1989)
[2] N. A. Kascheyev, L. A. Polyakov and V. V. Tunin, Nuclear Instrumentsand Methods in Physics Research A 334, North Holland, 1993, pp. 27-32
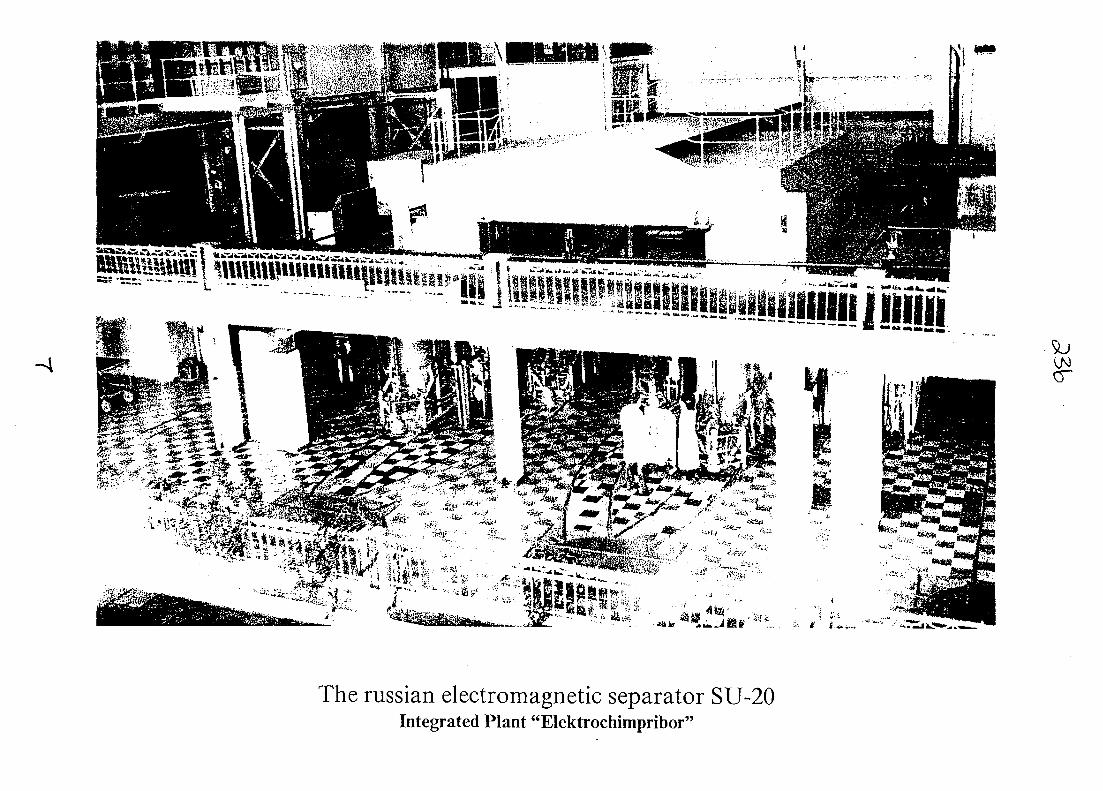
cr
The russian electromagnetic separator SU-20Integrated Plant "Elektrochimpribor"
AU9817343
New Design Targets and New Automated Technology for theProduction of Radionuclides with High Specific Activity in
Nuclear Research Reactors
Report for Second International Conference on Isotopes,Sydney, Australia, October 12-16, 1997
AS.Gerasimov, G.V.KiselevState Scientific Center of the Russian FederationInstitute of Theoretical and Experimental Physics
117261 Moscow, Russia, B.Cheremushkinskaya, 25phone/fax:(095)9306130
e-mail:[email protected][email protected]
AbstractCurrent demands of industry require the application of radionuclides with high specific
radioactivity under low consumption of started nuclides and neutrons during their irradiation inreactor. To provide this aims staff of ITEP Reactor Department was investigated the differenttypes of started targets for the production of the main radionuclides: Co-60, Ir-192 and other. Infirst turn the targets of Co and Ir without the block-effect of neutron flux (with low absorptionof neutrons) were investigated. The following principal results were received for example for Ir-192: block-effect is equal 0,086 for diameter of Ir target 6 mm and is equal 0,615 for diameter Irtarget 0,5 mm. It means average neutron flux for Ir target diameter 0,5 mm and therefore theproduction of Ir-192 will be at 10 times more then for diameter 6,0 mm. To provide theautomated technology of the manufacture of radioactive sources with radionuclides with highspecific radioactivity it was proposed the compound targets for the irradiation of ones and forthe management with the irradiated targets. Different types of compound targets were analyzed.Proposals for the development of new automated technology for the production of radionuclidesare considered.
Content
1. Introduction.1.1. Types of the nuclear reactors in Russia for the production of a radionuclides.1.2. Terms.2. Traditional started targets.3. Promising started targets.3.1. Unblocked started targets.3.2. Compound started targets.3.3. Regenerated started targets.4.Proposals for the development of new technology of the radionuclides production.4.1. Existing technology.4.2. Promising technology.5. Conclusion.References.
•&>
1. Introduction.
1.1. The types of the nuclear reactors in Russia for the production of aradionuclides.
Current demands of industry require the application of radionuclides with high specificradioactivity under low consumption of started nuclides and neutrons during their irradiation inreactor. To provide this aims staff of ITEP Reactor Department was investigated the differenttypes of started targets for the production of the main radionuclides: Co-60, Tc, Ir-192 and otherwhich have used in Russian nuclear reactors for the production of the radionuclides. There are anumber of the Russian nuclear reactors for the production of the radionuclides. List of thisreactors is indicated in the Table 1 [1,2].
Table 1. Research nuclear reactors of the Russian Federation.
Reactor
IR-8
HWRWWR-C
AMBR-10
WWR-M
SM-2
RBT-6RBT-10/1RBT-10/2
IWW-2
IRT-T
Capacity ofreactor, MWt
8
2,510
301016
100
6101010
6
Maximal densityof neutron flux,
cm'V1
2,47+14
5,0+131,0+14
1,1+138,6+14 (fast)
4,0+14
5,4+15
1,4+141,5+141,5+144,5+14
1,0+14
Nuclear ResearchCenters
KurchatovInstitute, Moscow
ITEP, MoscowBranch of
Institute namedKarpov, Obninsk
PPI, Obninsku
Institute ofNuclear Physics
namedB.Konstantinov,Gatchina, nearS.PeterburghInstitute of
Nuclear Reactors,Dimitrovgrad
c
u
tc
Branch ofNDOETTomsk
PolytechnicalInstitute
State of theoperation
in operation
decommissioningin operation
«u
ct
cc
u
cc
u
Besides there are 2 industrial reactors which placed at nuclear defense plant "Mayak" atSouth Ural: light water reactor of pool type and heavy-water reactor of channel-vessel type.Table 1 shows that research reactor SM-2 has the maximal level of thermal neutron density fluxreached 5,4.1015 cm^s'1 in central part of the core. It allows to produce a lot differentradionuclides with high specific activity and also a lot of transplutonium nuclides. It is noted that
reactor HWR of ITEP is not working and is decommissioning now . Information about the stateof this reactor is given in [2,3].
1.2. Terms.
It is expedient to use the identical terms for the best understanding of presentedinformation.Irradiation volume - the space of irradiation facility with the beams of the neutral or chargeparticles.Required nuclide - the useful nuclide for different application iwhich is produced by theirradiation of the started target in the irradiation volume.Fission required nuclide - the required nuclide which is formed in results of fission of a fissionablematerials in an irradiation volume.Main started nuclide - the initial nuclide of certain element for the production of the requirednuclide.Side started nuclide - the one of isotopes of started element which is differed by mass from themain started nuclide and which can form the isotope's impurity.Started target - the device of definite geometrical form consisting of the certain mass of matterwith the given concentration of the started nuclide which is used for production of the requirednuclide in the irradiation volume.Irradiated started target - the started target which have irradiated in the irradiation volume duringcertain time for the achieving of given specific activity of the required nuclide.Compound started target - the target divided at some independent parts contained each the startednuclide which can irradiated in the irradiation volume independently.Regenerated started target -the started target contained the started nuclide after repeated cycles ofreprocessing of irradiated started target.Solid started target -the started target with started nuclide in solid form, for example, as metal oroxide metal.Fluid started target -the started target with the started nuclide as solution.Powder started target - the started target with the started nuclide as powder form contained incontainer of certain geometrical sizes.Unblocked started target -the started target with small blocking of neutron flux whichcharacterized by small concentration of started nuclide with high absorption of neutrons or smallsize of started target.Ampoule -the device of certain geometrical form, for example, as glass or aluminum capsule, forallocation of the started targets which is placed in the irradiation volume.Container - the device for the allocation of one or some ampoules with started targets which isplaced into isotope channels for irradiation into the irradiation volume.Isotope channel - the special channel of nuclear reactor for the allocation of one or somecontainers with the started targets.Radioisotope source of radiation - the device contained a certain radionuclide with the definitivetype of radiation.Active part of radioisotope source of radiation or radiator - the part of radioisotope source ofradiation contained the required radionuclide with the definitive type of radiation and specificactivity.
2. Traditional started targets.
The started targets are characterized in the following parameters: 1. by chemical structure;2. by modular state; 3. by the geometrical sizes and form of a target; 4 by the isotope contents ofmain and side started nuclides; 5). in weights. All these parameters are interconnected. Theirchoice is carried out in for dependence from conditions irradiation and further technological
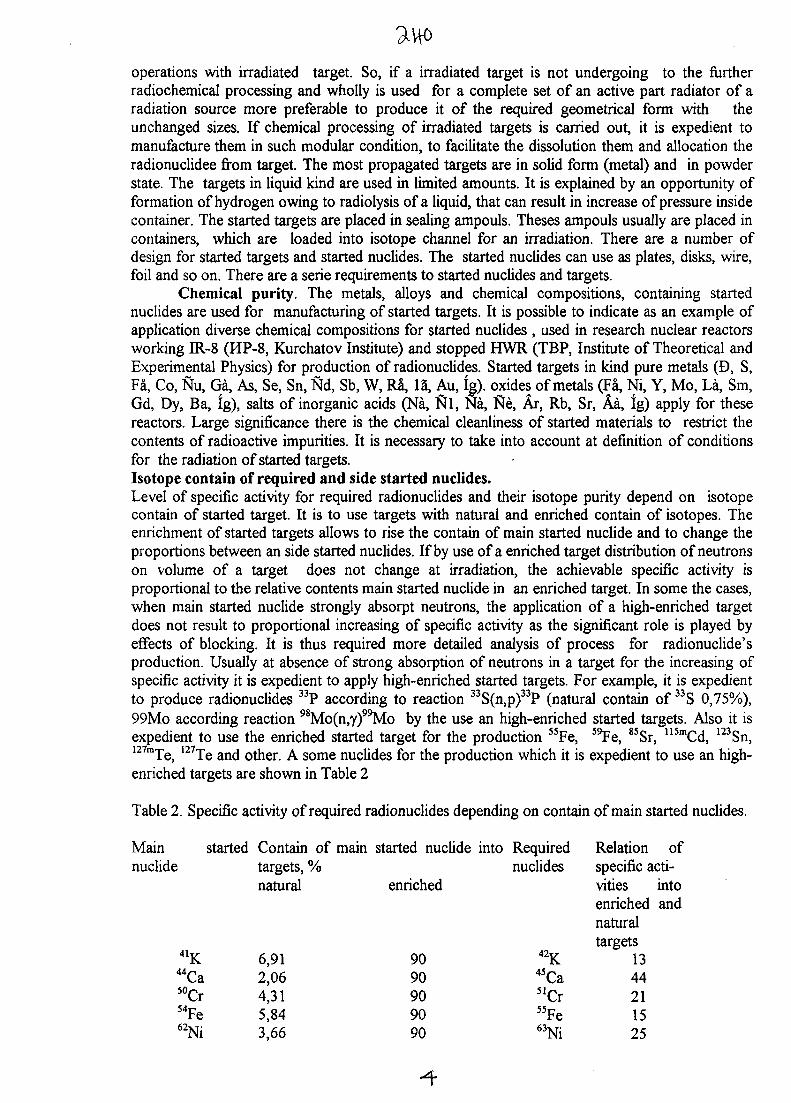
operations with irradiated target. So, if a irradiated target is not undergoing to the furtherradiochemical processing and wholly is used for a complete set of an active part radiator of aradiation source more preferable to produce it of the required geometrical form with theunchanged sizes. If chemical processing of irradiated targets is carried out, it is expedient tomanufacture them in such modular condition, to facilitate the dissolution them and allocation theradionuclidee from target. The most propagated targets are in solid form (metal) and in powderstate. The targets in liquid kind are used in limited amounts. It is explained by an opportunity offormation of hydrogen owing to radiolysis of a liquid, that can result in increase of pressure insidecontainer. The started targets are placed in sealing ampouls. Theses ampouls usually are placed incontainers, which are loaded into isotope channel for an irradiation. There are a number ofdesign for started targets and started nuclides. The started nuclides can use as plates, disks, wire,foil and so on. There are a serie requirements to started nuclides and targets.
Chemical purity. The metals, alloys and chemical compositions, containing startednuclides are used for manufacturing of started targets. It is possible to indicate as an example ofapplication diverse chemical compositions for started nuclides , used in research nuclear reactorsworking IR-8 (HP-8, Kurchatov Institute) and stopped HWR (TBP, Institute of Theoretical andExperimental Physics) for production of radionuclides. Started targets in kind pure metals (D, S,Fa, Co, ftu, Ga, As, Se, Sn, ftd, Sb, W, Rfi, la, Au, Ig). oxides of metals (Fa, Ni, Y, Mo, La, Sm,Gd, Dy, Ba, Ig), salts of inorganic acids (Na, ftl, Na, Ne, Ar, Rb, Sr, Aa, Ig) apply for thesereactors. Large significance there is the chemical cleanliness of started materials to restrict thecontents of radioactive impurities. It is necessary to take into account at definition of conditionsfor the radiation of started targets.Isotope contain of required and side started nuclides.
Level of specific activity for required radionuclides and their isotope purity depend on isotopecontain of started target. It is to use targets with natural and enriched contain of isotopes. Theenrichment of started targets allows to rise the contain of main started nuclide and to change theproportions between an side started nuclides. If by use of a enriched target distribution of neutronson volume of a target does not change at irradiation, the achievable specific activity isproportional to the relative contents main started nuclide in an enriched target. In some the cases,when main started nuclide strongly absorpt neutrons, the application of a high-enriched targetdoes not result to proportional increasing of specific activity as the significant role is played byeffects of blocking. It is thus required more detailed analysis of process for radionuclide'sproduction. Usually at absence of strong absorption of neutrons in a target for the increasing ofspecific activity it is expedient to apply high-enriched started targets. For example, it is expedientto produce radionuclides 33P according to reaction 33S(n,p)33P (natural contain of 33S 0,75%),99Mo according reaction 98Mo(n,y)99Mo by the use an high-enriched started targets. Also it isexpedient to use the enriched started target for the production 55Fe, 5 S te, 85Sr, 115mCd, 123Sn,127mTe, 127Te and other. A some nuclides for the production which it is expedient to use an high-enriched targets are shown in Table 2
Table 2. Specific activity of required radionuclides depending on contain of main started nuclides.
Main started Contain of main started nuclide into Required Relation ofnuclide
4 1 K
"Ca50Cr54Fe62Ni
targets, %natural
6,912,064,315,843,66
enriched
9090909090
nuclides
4 2 K
45Ca51Cr55Fe63Ni
specific acti-vities intoenriched andnaturaltargets
1344211525
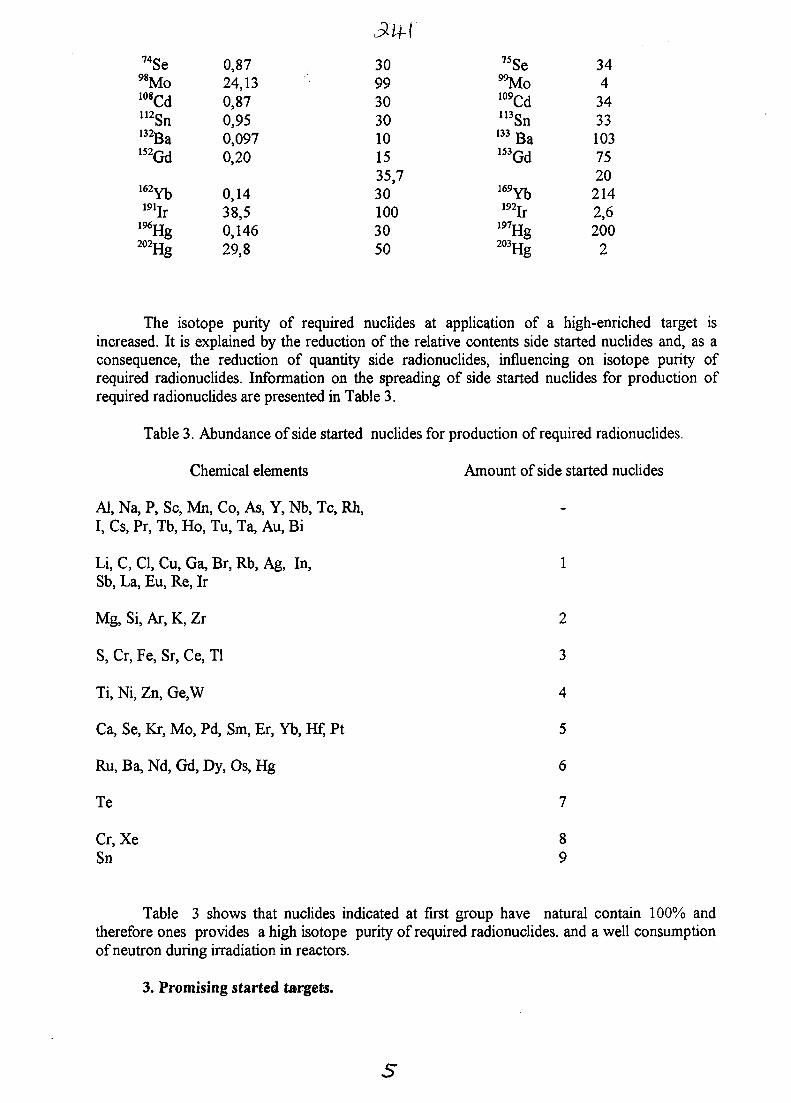
7 4Se9 8Mo108CdU 2 Sn132Ba152Gd
162Yb191jr
196Hg202Hg
0,8724,130,870,950,0970,20
0,1438,50,14629,8
30993030101535,7301003050
75Se" M o109CdU3Sn
133 Ba153Gd
169Yb,92jr
197Hg203Hg
344343310375202142,62002
The isotope purity of required nuclides at application of a high-enriched target isincreased. It is explained by the reduction of the relative contents side started nuclides and, as aconsequence, the reduction of quantity side radionuclides, influencing on isotope purity ofrequired radionuclides. Information on the spreading of side started nuclides for production ofrequired radionuclides are presented in Table 3.
Table 3. Abundance of side started nuclides for production of required radionuclides.
Chemical elements Amount of side started nuclides
Al, Na, P, Sc, Mn, Co, As, Y, Nb, Tc, Rh,I, Cs, Pr, Tb, Ho, Tu, Ta, Au, Bi
Li, C, Cl, Cu, Ga, Br, Rb, Ag, In, 1
Sb, La, Eu, Re, Ir
Mg,Si,Ar,K,Zr 2
S, Cr, Fe, Sr, Ce, Tl 3
Ti, Ni, Zn, Ge,W 4
Ca, Se, Kr, Mo, Pd, Sm, Er, Yb, Hf, Pt 5
Ru, Ba, Nd, Gd, Dy, Os, Hg 6
Te 7
Cr, Xe 8Sn 9
Table 3 shows that nuclides indicated at first group have natural contain 100% andtherefore ones provides a high isotope purity of required radionuclides. and a well consumptionof neutron during irradiation in reactors.
3. Promising started targets.
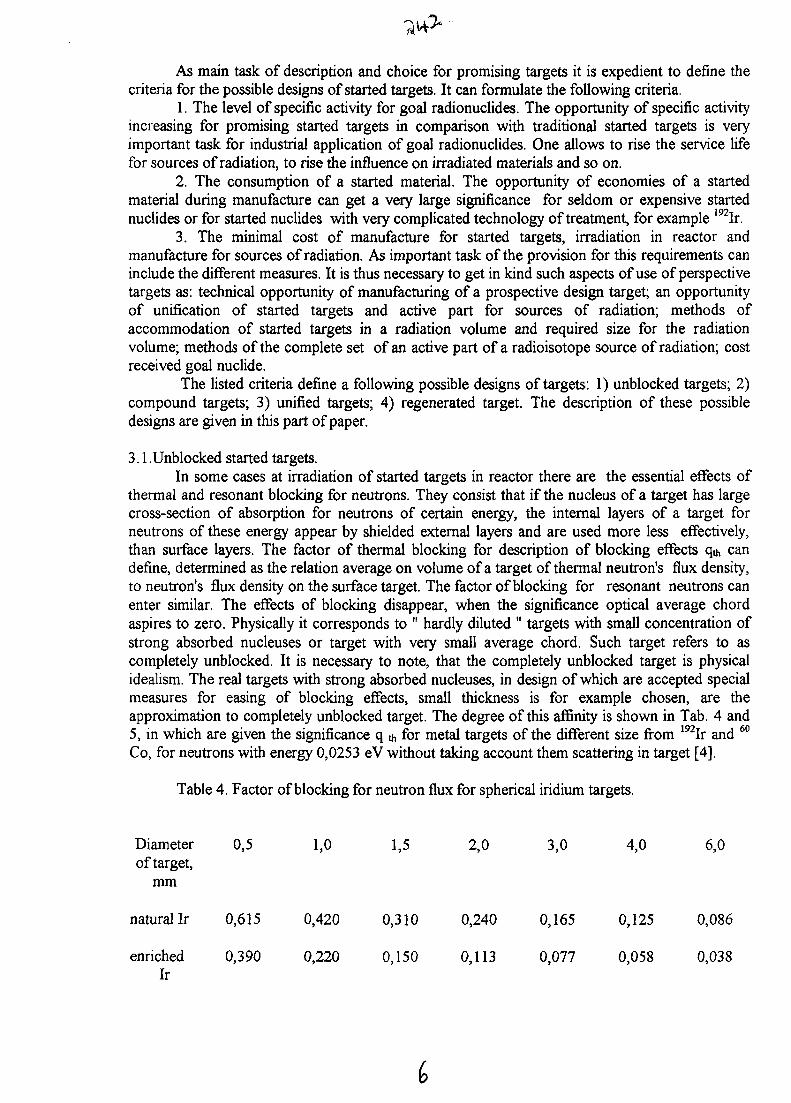
As main task of description and choice for promising targets it is expedient to define thecriteria for the possible designs of started targets. It can formulate the following criteria.
1. The level of specific activity for goal radionuclides. The opportunity of specific activityincreasing for promising started targets in comparison with traditional started targets is veryimportant task for industrial application of goal radionuclides. One allows to rise the service lifefor sources of radiation, to rise the influence on irradiated materials and so on.
2. The consumption of a started material. The opportunity of economies of a startedmaterial during manufacture can get a very large significance for seldom or expensive startednuclides or for started nuclides with very complicated technology of treatment, for example 192Ir.
3. The minimal cost of manufacture for started targets, irradiation in reactor andmanufacture for sources of radiation. As important task of the provision for this requirements caninclude the different measures. It is thus necessary to get in kind such aspects of use of perspectivetargets as: technical opportunity of manufacturing of a prospective design target; an opportunityof unification of started targets and active part for sources of radiation; methods ofaccommodation of started targets in a radiation volume and required size for the radiationvolume; methods of the complete set of an active part of a radioisotope source of radiation; costreceived goal nuclide.
The listed criteria define a following possible designs of targets: 1) unblocked targets; 2)compound targets; 3) unified targets; 4) regenerated target. The description of these possibledesigns are given in this part of paper.
3.1 .Unblocked started targets.In some cases at irradiation of started targets in reactor there are the essential effects of
thermal and resonant blocking for neutrons. They consist that if the nucleus of a target has largecross-section of absorption for neutrons of certain energy, the internal layers of a target forneutrons of these energy appear by shielded external layers and are used more less effectively,than surface layers. The factor of thermal blocking for description of blocking effects qth candefine, determined as the relation average on volume of a target of thermal neutron's flux density,to neutron's flux density on the surface target. The factor of blocking for resonant neutrons canenter similar. The effects of blocking disappear, when the significance optical average chordaspires to zero. Physically it corresponds to " hardly diluted " targets with small concentration ofstrong absorbed nucleuses or target with very small average chord. Such target refers to ascompletely unblocked. It is necessary to note, that the completely unblocked target is physicalidealism. The real targets with strong absorbed nucleuses, in design of which are accepted specialmeasures for easing of blocking effects, small thickness is for example chosen, are theapproximation to completely unblocked target. The degree of this affinity is shown in Tab. 4 and5, in which are given the significance q & for metal targets of the different size from 192Ir and 60
Co, for neutrons with energy 0,0253 eV without taking account them scattering in target [4].
Table 4. Factor of blocking for neutron flux for spherical iridium targets.
Diameter 0,5 1,0 1,5 2,0 3,0 4,0 6,0of target,
mm
natural Ir 0,615 0,420 0,310 0,240 0,165 0,125 0,086
enriched 0,390 0,220 0,150 0,113 0,077 0,058 0,038Ir
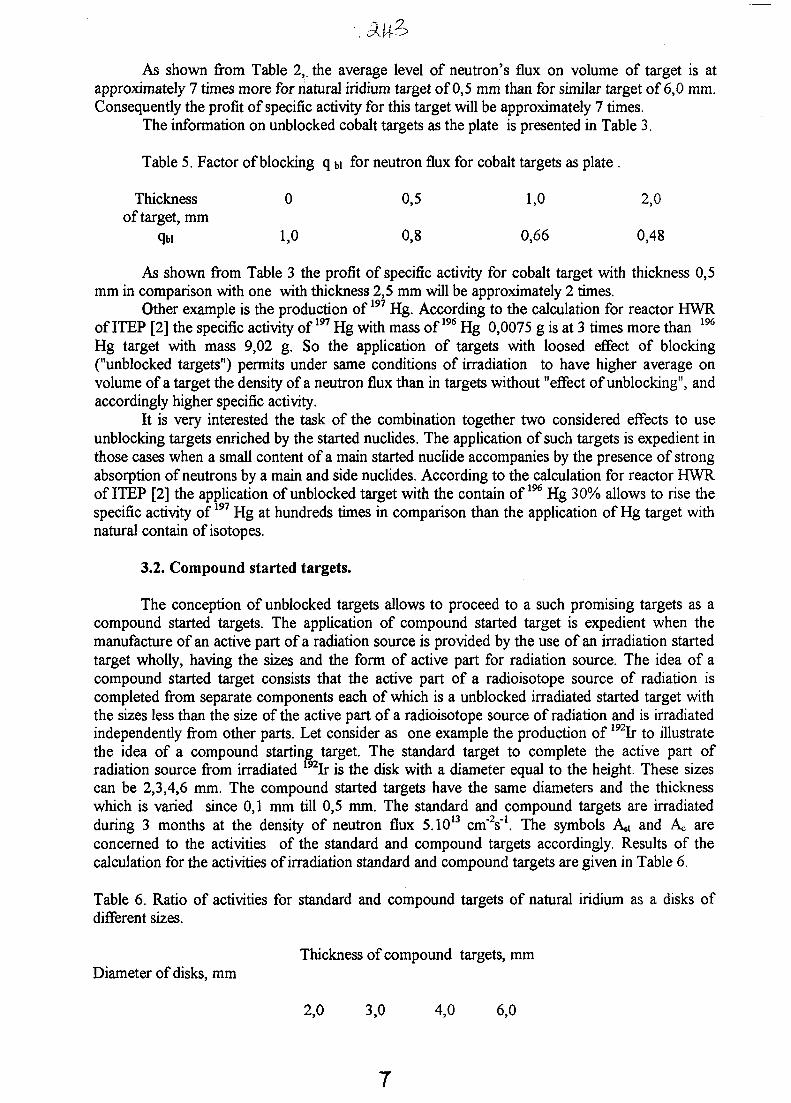
As shown from Table 2, the average level of neutron's flux on volume of target is atapproximately 7 times more for natural indium target of 0,5 mm than for similar target of 6,0 mm.Consequently the profit of specific activity for this target will be approximately 7 times.
The information on unblocked cobalt targets as the plate is presented in Table 3.
Table 5. Factor of blocking q bi for neutron flux for cobalt targets as plate .
Thicknessof target, mm
qu
0
1,0
0,5
0,8
1,0
0,66
2,0
0,48
As shown from Table 3 the profit of specific activity for cobalt target with thickness 0,5mm in comparison with one with thickness 2,5 mm will be approximately 2 times.
Other example is the production of197 Hg. According to the calculation for reactor HWRof ITEP [2] the specific activity of197 Hg with mass of196 Hg 0,0075 g is at 3 times more than 1%
Hg target with mass 9,02 g. So the application of targets with loosed effect of blocking("unblocked targets") permits under same conditions of irradiation to have higher average onvolume of a target the density of a neutron flux than in targets without "effect of unblocking", andaccordingly higher specific activity.
It is very interested the task of the combination together two considered effects to useunblocking targets enriched by the started nuclides. The application of such targets is expedient inthose cases when a small content of a main started nuclide accompanies by the presence of strongabsorption of neutrons by a main and side nuclides. According to the calculation for reactor HWRof ITEP [2] the application of unblocked target with the contain of196 Hg 30% allows to rise thespecific activity of197 Hg at hundreds times in comparison than the application of Hg target withnatural contain of isotopes.
3.2. Compound started targets.
The conception of unblocked targets allows to proceed to a such promising targets as acompound started targets. The application of compound started target is expedient when themanufacture of an active part of a radiation source is provided by the use of an irradiation startedtarget wholly, having the sizes and the form of active part for radiation source. The idea of acompound started target consists that the active part of a radioisotope source of radiation iscompleted from separate components each of which is a unblocked irradiated started target withthe sizes less than the size of the active part of a radioisotope source of radiation and is irradiatedindependently from other parts. Let consider as one example the production of 192Ir to illustratethe idea of a compound starting target. The standard target to complete the active part ofradiation source from irradiated 192Ir is the disk with a diameter equal to the height. These sizescan be 2,3,4,6 mm. The compound started targets have the same diameters and the thicknesswhich is varied since 0,1 mm till 0,5 mm. The standard and compound targets are irradiatedduring 3 months at the density of neutron flux 5.1013 cm'V. The symbols Ast and Ac areconcerned to the activities of the standard and compound targets accordingly. Results of thecalculation for the activities of irradiation standard and compound targets are given in Table 6.
Table 6. Ratio of activities for standard and compound targets of natural iridium as a disks ofdifferent sizes.
Thickness of compound targets, mmDiameter of disks, mm
2,0 3,0 4,0 6,0
7
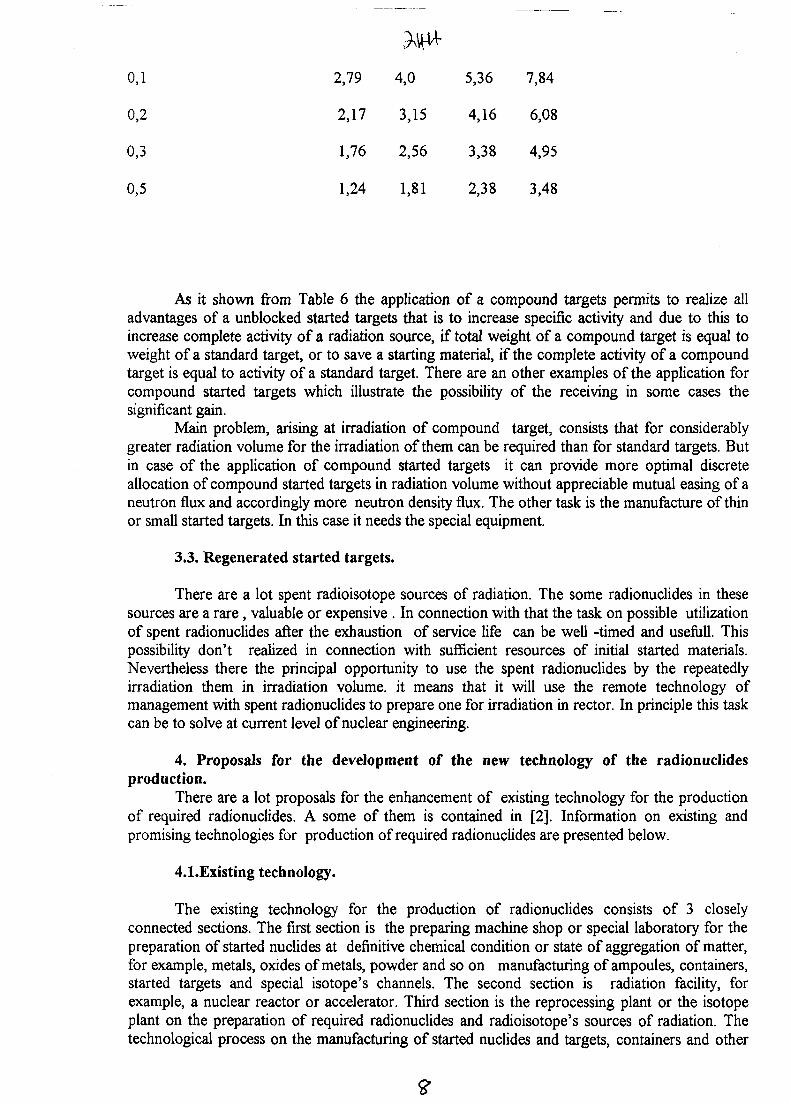
0,1 2,79 4,0 5,36 7,84
0,2 2,17 3,15 4,16 6,08
0,3 1,76 2,56 3,38 4,95
0,5 1,24 1,81 2,38 3,48
As it shown from Table 6 the application of a compound targets permits to realize alladvantages of a unblocked started targets that is to increase specific activity and due to this toincrease complete activity of a radiation source, if total weight of a compound target is equal toweight of a standard target, or to save a starting material, if the complete activity of a compoundtarget is equal to activity of a standard target. There are an other examples of the application forcompound started targets which illustrate the possibility of the receiving in some cases thesignificant gain.
Main problem, arising at irradiation of compound target, consists that for considerablygreater radiation volume for the irradiation of them can be required than for standard targets. Butin case of the application of compound started targets it can provide more optimal discreteallocation of compound started targets in radiation volume without appreciable mutual easing of aneutron flux and accordingly more neutron density flux. The other task is the manufacture of thinor small started targets. In this case it needs the special equipment.
3.3. Regenerated started targets.
There are a lot spent radioisotope sources of radiation. The some radionuclides in thesesources are a rare, valuable or expensive . In connection with that the task on possible utilizationof spent radionuclides after the exhaustion of service life can be well -timed and usefull. Thispossibility don't realized in connection with sufficient resources of initial started materials.Nevertheless there the principal opportunity to use the spent radionuclides by the repeatedlyirradiation them in irradiation volume, it means that it will use the remote technology ofmanagement with spent radionuclides to prepare one for irradiation in rector. In principle this taskcan be to solve at current level of nuclear engineering.
4. Proposals for the development of the new technology of the radionuclidesproduction.
There are a lot proposals for the enhancement of existing technology for the productionof required radionuclides. A some of them is contained in [2]. Information on existing andpromising technologies for production of required radionuclides are presented below.
4.1.Existing technology.
The existing technology for the production of radionuclides consists of 3 closelyconnected sections. The first section is the preparing machine shop or special laboratory for thepreparation of started nuclides at definitive chemical condition or state of aggregation of matter,for example, metals, oxides of metals, powder and so on manufacturing of ampoules, containers,started targets and special isotope's channels. The second section is radiation facility, forexample, a nuclear reactor or accelerator. Third section is the reprocessing plant or the isotopeplant on the preparation of required radionuclides and radioisotope's sources of radiation. Thetechnological process on the manufacturing of started nuclides and targets, containers and other
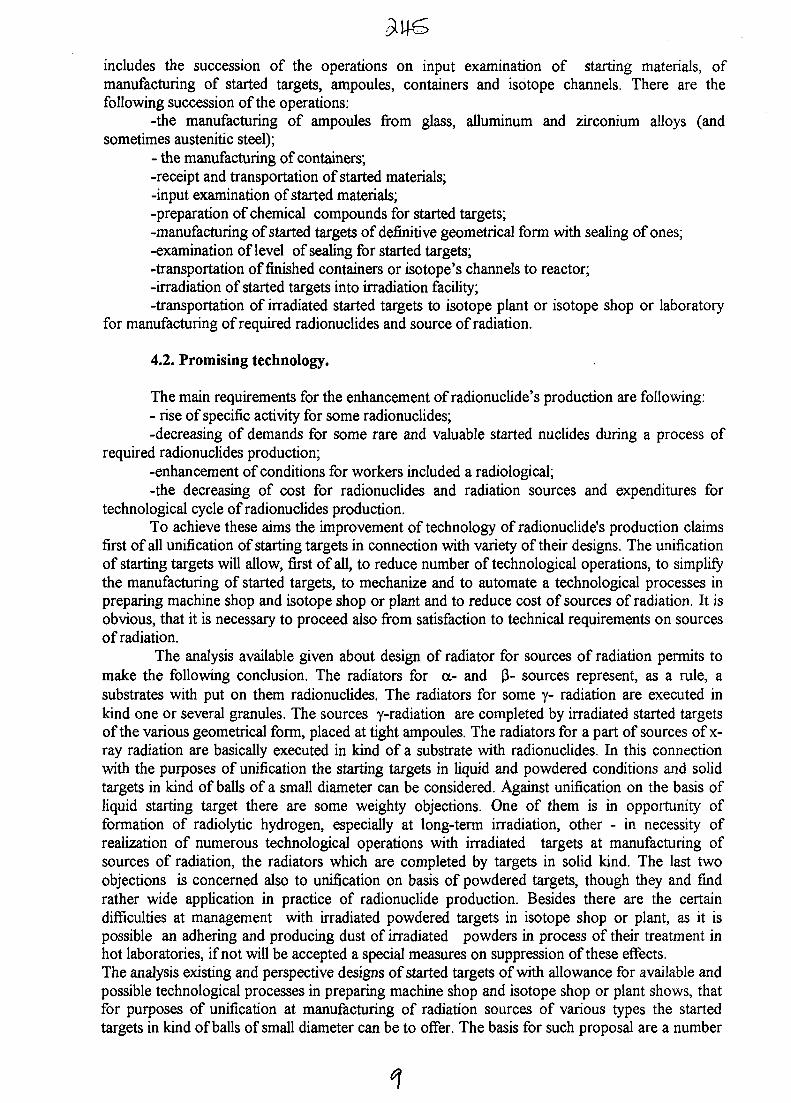
includes the succession of the operations on input examination of starting materials, ofmanufacturing of started targets, ampoules, containers and isotope channels. There are thefollowing succession of the operations:
-the manufacturing of ampoules from glass, alluminum and zirconium alloys (andsometimes austenitic steel);
- the manufacturing of containers;-receipt and transportation of started materials;-input examination of started materials;-preparation of chemical compounds for started targets;-manufacturing of started targets of definitive geometrical form with sealing of ones;-examination of level of sealing for started targets;-transportation of finished containers or isotope's channels to reactor;-irradiation of started targets into irradiation facility;-transportation of irradiated started targets to isotope plant or isotope shop or laboratory
for manufacturing of required radionuclides and source of radiation.
4.2. Promising technology.
The main requirements for the enhancement of radionuclide's production are following:- rise of specific activity for some radionuclides;-decreasing of demands for some rare and valuable started nuclides during a process of
required radionuclides production;-enhancement of conditions for workers included a radiological;-the decreasing of cost for radionuclides and radiation sources and expenditures for
technological cycle of radionuclides production.To achieve these aims the improvement of technology of radionuclide's production claims
first of all unification of starting targets in connection with variety of their designs. The unificationof starting targets will allow, first of all, to reduce number of technological operations, to simplifythe manufacturing of started targets, to mechanize and to automate a technological processes inpreparing machine shop and isotope shop or plant and to reduce cost of sources of radiation. It isobvious, that it is necessary to proceed also from satisfaction to technical requirements on sourcesof radiation.
The analysis available given about design of radiator for sources of radiation permits tomake the following conclusion. The radiators for a- and (3- sources represent, as a rule, asubstrates with put on them radionuclides. The radiators for some y- radiation are executed inkind one or several granules. The sources y-radiation are completed by irradiated started targetsof the various geometrical form, placed at tight ampoules. The radiators for a part of sources of x-ray radiation are basically executed in kind of a substrate with radionuclides. In this connectionwith the purposes of unification the starting targets in liquid and powdered conditions and solidtargets in kind of balls of a small diameter can be considered. Against unification on the basis ofliquid starting target there are some weighty objections. One of them is in opportunity offormation of radiolytic hydrogen, especially at long-term irradiation, other - in necessity ofrealization of numerous technological operations with irradiated targets at manufacturing ofsources of radiation, the radiators which are completed by targets in solid kind. The last twoobjections is concerned also to unification on basis of powdered targets, though they and findrather wide application in practice of radionuclide production. Besides there are the certaindifficulties at management with irradiated powdered targets in isotope shop or plant, as it ispossible an adhering and producing dust of irradiated powders in process of their treatment inhot laboratories, if not will be accepted a special measures on suppression of these effects.The analysis existing and perspective designs of started targets of with allowance for available andpossible technological processes in preparing machine shop and isotope shop or plant shows, thatfor purposes of unification at manufacturing of radiation sources of various types the startedtargets in kind of balls of small diameter can be to offer. The basis for such proposal are a number
of physical and technological reasons. Universal targets in a kind of small-sized balls, as appear,are the most suitable from the point of view of a opportunity for automated manufacturing ofcontainers and hereinafter active parts (radiators) of radiation sources. The certain difficulties canhas arisen in connection with very small required by sizes of balls and necessity of a arrangementthem at irradiation by a thin layer for fulfillment of unblocking conditions. The small reduction ofa radiator's weight for sources of radiation, connected with of ball's application , is easilycompensated by increased specific activity. The universal targets in a kind of small-sized balls canbe a convenience to repeated use after exhaustion of radiation source the given service life, whenit expediently on technological reasons. The conducted consideration testifies that the applicationof started targets of the spherical form can appear useful in a technological cycle of manufactureof radionuclides. However the obstacle for unification design of started targets on the basis oftargets of the spherical form are for a today's day absence of developed technologies for theirmanufacturing.
S.Conclusion.
Information about the production of different radionuclides in Russian research reactorpresentedhere on the opportunity to enhance the existing technology for the production ofradionuclides. There are the principal possibilities to rise a specific activity of some requiredradionuclides in connection with an use of unblocked started targets and also to decrease theconsumption of started nuclides. In connection with that it is expedient to carry out R&Dinvestigations.
References.
1.Research nuclear reactors in world. IAEA, Vienna, 1989.2 Kiselev G.V. Technology of the production for the radioactive nuclides in nuclear
eactors. Moscow, Energoatomizdatm 1990.3. Shvedov O.V., Igumnov Mi. , Katz M.M. et al. ITEP ElectroNuclear Neutron and
Proton Facility. Report for 2ICI.4.Gerasimov A.S., Zaritskaya T.S., Rudik A.P.. Guide on the formation of radionuclides
in nuclear reactors. Moscow, Energoizdat,1989.
10
AU9817344
GLOVEBOX-PROCESSING TECHNIQUES FOR CI QUANTITIES OF REACTOR-PRODUCED BETA EMITTERS
M.S. EVANS-BLUMER, L.M. AYERS, G.J. EHRHARDT AND A.R. KETRINGUniversity of Missouri Research Reactor
Columbia, Missouri 65211 USA
SUMMARY. Our group has extensive experience producing beta emitting radioisotopes,including curie quantities of Re-186, Sm-153, Ho-166, and Lu-177. Using finger and wristdosimeters dedicated for single-isotope use, we have evaluated the effectiveness of new techniquesand shielding. Simple 1/2" acrylic shields made by our machine shop attached to pipets andforceps have essentially eliminated measurable beta exposure, even from glovebox processing.Changes in target form and processing techniques have reduced the average extremity exposurefor glovebox-processing. Isotopically enriched targets (72-100%) minimize radioisotopicimpurities, but some impurities originate from alternate activation reactions of the primary targetisotope (Ho-166m, Lu-177m) or from activation of daughter isotopes as the desired speciesdecays during irradiation (Sm-153 (beta) Eu-153 (n,gamma) Eu-154).
INTRODUCTION
Our group has been working with betaemitting radioisotopes in gloveboxes for thepast 16 years in ever-increasing amounts.Naturally this poses great challenges formaintaining radiation safety and theALARA (As Low As ReasonablyAchievable) concept required by the U.S.Nuclear Regulatory Commission (NRC).This is further complicated by the need forup to curie quantities of isotope for clinicaltrials of the new radiopharmaceutical. Untilthe trials are successful, the resources tobuild remote handling facilities are unlikelyto be forthcoming. Using just simpletechniques can cut your dose by 50 to 80%(percentages from badge reports). Theisotopes we work with are produced byneutron capture, creating neutron-richnuclides that decay by beta emission. Theseisotopes produced in theRadiopharmaceutical Group are used fornuclear medicine radiotherapy diseases asdisparate as arthritis to various types ofcancer. Beta emissions range from about0.4 to 2.2MeV, with half-lives between 1day to 1 week.
SAMPLE TARGETS
Targets used by us range from 72-100%enrichment in specific stable isotopes toeliminate undesirable impurities produced
during irradiation, which can cause problemsfor disposal. Fortunately the amounts ofthese long-lived impurities produced are low.We have also changed from using oxidetargets to nitrate targets. Oxide targets areloose powders and are easily scattered duringbreaking of the quartz vial. This leads tocontamination of the glovebox, poor samplerecovery and high dose exposures. Oxidetargets also take from 1 to 3 hours to process,as they dissolve rather slowly. Nitrate targetsare pipetted into the quartz vials and thenplaced into a Savant rotary vacuumevaporator for drying. This leaves a driedfilm on the rounded bottom of the quartz vial.Nitrate targets dissolve within 15 to 30minutes in HC1, which eliminates high doseexposures. This process also eliminatespowder puffing out of the quartz vial duringbreaking.
PREPARINGIRRADIATION
TARGETS FOR
Samples prepared for irradiation in the reactorare only solid materials and are sealed in4mm ID X 6mm OD - High Purity T-21Quartz Vials. The vials are 1 or 1 1/2 inchesin length when sealed and turned into theIrradiations Department.. The sample ischecked for leaks under 7 lbs. of pressure usinga pressure cooker and helium gas, then weldedinto individual cans for irradiation.
PREPARING SAMPLES FORPROCESSING
MURR employees have designed a remotewash station for cleaning quartz vials. Thisbox is made of lead with acrylic and leadshielding for ALARA reasons. Our samplesare returned in 1" bored-out lead pigs fromthe Shipping Department. We place the piginto the wash station and prepare to washthe quartz vial. The vial is washed by usinga sonicated water bath and wash solutions.The vial is then placed into a Mallinckrodt#2 white lead pig and transferred to our lab.We take dose readings on the outside of the#2 white pig and if they are high we thenplace the #2 white pig into a 2" bored-outlead pig for extra shielding during thetransfer.
GLOVEBOX PROCESSING
Glovebox processing is easy and cost-effective. Our machine shop has added lead(for ALARA reasons) to the table which theglovebox sits on and also around theopenings of the glovebox ports. This addedlead shields the lower portion and the chestlevel of our bodies. Double airlock doorscontain any contamination if the target islost during processing. We have theglovebox attached to the facility airflowwhich is monitored for radioactivity. Whenwe process we maintain about 1 inch (water)negative pressure in the glovebox and neverhave both airlock doors opensimultaneously.
TOOLS USED DURING PROCESSING
Glovebox processing is easy with just little1/2" thick acrylic shields for ALARAreasons. The MURR machine shop hasdesigned rounded disks with a flat side (4" indiameter and 1/2" thick), quartz vial holder,breaker and a carousel. We use the diskitems for pipets and forceps used forprocessing the target and transferring thetargets in and out of the glovebox. Ourquartz vial holder is designed using a leadbrick (2"x4"x8"), acrylic block (samedimensions as lead brick) and a cylindevicalacrylic quartz vial holder (with an ejectoron the bottom of it). The lead brick andacrylic are sealed together with a 1"cylinder hole drilled in the center to holdthe acrylic quartz vial holder. The carouselis made out of acrylic also with six holes
drilled into it to hold sample vials. Thecarousel rotates to allow shielding at all times.We also have little acrylic caps of differentsizes to cover the quartz vial holder, breakerand other items.
PROCESSING THE QUARTZ VIAL
The target is placed into the glovebox airlockin the #2 white pig. At this time both airlockdoors are closed. We open the inner door ofthe airlock and transfer the target into theglovebox and place it into the quartz vialholder. The vial is then scored, broken anddissolved. We then pass the sample vials backinto the airlock and remove them for dosecalibrator readings for shipping.
HEALTH PHYSICS
We are required by the NRC to be monitoredfor radiation exposure. TheRadiopharmaceutical Group wears a filmbadge, two finger badges and a pocket chamberat all times. We also have isotope-specificring and wrist badges for processing and areable to see what amount of exposure we aregetting for each isotope and if needed makechanges in procedures for ALARA reasons.The facility badges are sent off monthly forreading and the exposure reports are sent backto MURR. Health Physics provides coveragefor all processing and adds a great deal ofsupport when working on procedures.
DISPOSAL OF WASTE
Impurities are most noticeable at wastedisposal time, when it is evident that decayedsamples have not reached background. TheNRC does set limits on activity which cansafely be released. Of course, radioactivematerial disposal is very difficult and costly tothe user. The Reactor has just recentlypurchased a glassbead blaster to removeradioactivity from large equipment and otheritems of waste. This has saved thousands ofdollars for the MURR.
ACKNOWLEDGMENTS
I would like to thank the following people,groups and companies for there support.
My two great bosses: Dr. Gary J. Ehrhardtand Dr. Alan R. Ketring for all their supportand trust in me.

MURR Machine Shop for their supportdesigning and building equipment, HealthPhysics, Irradiations and ShippingDepartments for their support.
I would like to especially thank thefollowing companies for their financialsupport: The Dow Chemical Company,Mallinckrodt Medical, Incorporated andNeoRx Corporation.
AU9817345
Groundwater Origin and Evolution from Dissolved Helium Isotopes inthe Kumamoto Plain
Y. MAHARA, T. IGARASHI
Abiko Research Laboratory, Central Research Institute of Electric Power Industry,
1646 Abiko, Abiko-shi, Chiba, 270-11, Japan
and
A. KUDO
Environmental Radionuclide Science, Research Reactor Institute, Kyoto University,
Kumatori, Osaka-fu, 590-04, Japan
SUMMARY. Groundwater usually contains more dissolved helium than is found indistilledwater equilibrated with an atmospheric air. The excess helium is supplied as a crustalhelium during groundwater movement in the geoenvironment. The crustal helium recharged ingroundwater is characterized by the geological formation, history and activities. Since ourresearch basin is located at the fringe of the active volcano Mt. Aso, helium with a high ratio of3He/4He has been released through faults from the deep magma. In the basin, groundwater onthe south flow path is strongly affected by the high helium isotopic ratio of 4~5xlO'6, whilegroundwater on the north path is characterized by the low ratio of O.8~1.9xlO*6. Dissolvedhelium isotopic data can be used to estimating groundwater origins and evolution trends, andfor dating groundwater.
1. INTRODUCTION
Groundwater surveys are most important whenselecting a site for waste disposal. Especially,the success of the selection depends onprecisely determining the regionalgroundwater flow in the area including thecandidate site. A natural tracer technique isuseful for investigating the regionalgroundwater flow. Noble gases dissolved ingroundwater are considered to be superiortracers, because we can easily detect them ingroundwater by using a mass-spectrometer,and sometimes noble gas isotopes providesignificant information about the deep geology.For example, the variation of helium isotopicratio 3He/4He indicates differences ingeological formations and/or geological
activities and histories.
The dissolved helium in groundwater consistsof three different components: atmospherichelium, mantle and radiogenic, which arecharacterized by the ratios of ^ e ^ H e andNe/He. These ratios for atmospheric helium,mantle and radiogenic are 1.4X10"6 and 4-5,1.15X10"5 and 0.001, and 1.5xlO8 and 0,001,respectively. In a past study, volcanic aquiferswere characterized by mixing the dissolvedhelium with a relatively high ratio of 3He/4Hewhich is released from the deep magma (1).Dissolved helium as a natural tracer, therefore,will be a very useful tool for groundwatersurveys.
In this study, we used the natural tracer
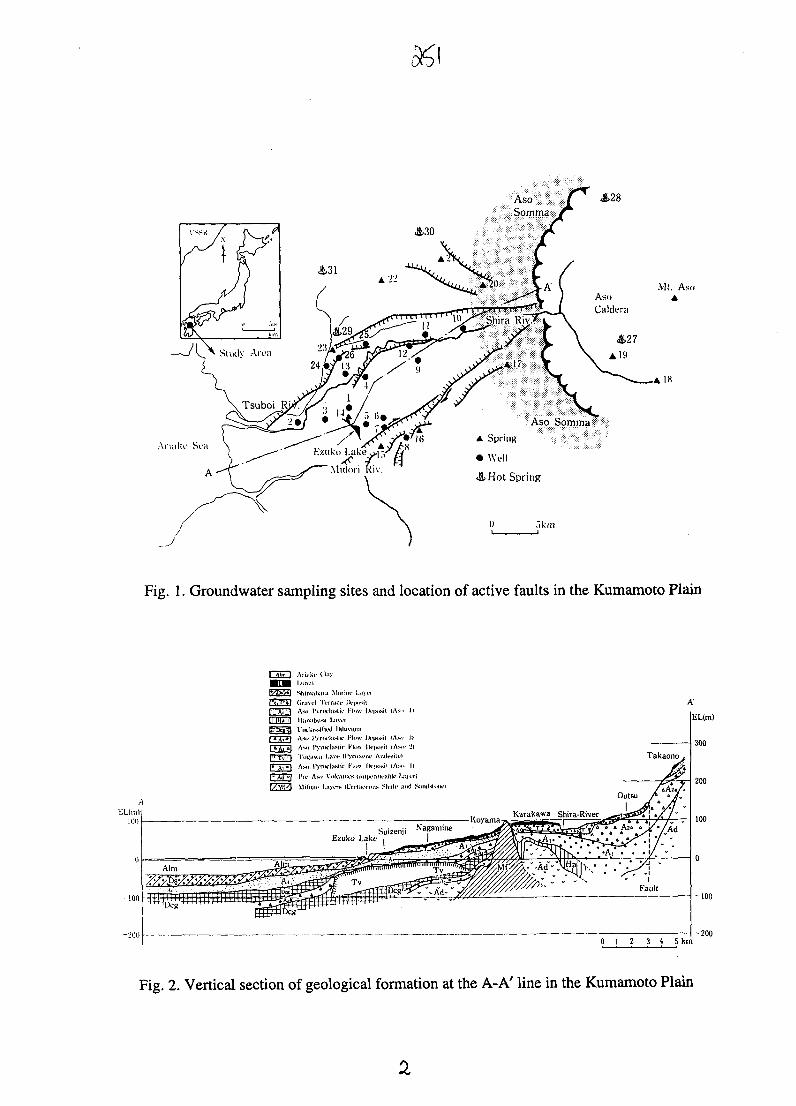
<&28
Aso Somma* *
A Spring
• Well
A Hot Spring
Armkc Si
I) :>km
IK
Fig. 1. Groundwater sampling sites and location of active faults in the Kumamoto Plain
1 Aim 1
lyV/fir<.T'ti1 A i . i
lllll.ll'l
1" tv'l
ES3I-Aii'lf/MI/J
Ariaki- tliiy
Shimiibara Miir
(iravil IViraii-AMI I'yniclnstk'lliin:il)ii»i Uiyi-
Uuolassiluil 1MASH J'vrm'liislii-AMI I'yviKlastii
Tinciwii l-ivi- 1ASII I'yrndaslic
1'rt' Awi \'<ilcjn
Milll.ll- Uv,TS
iiu- l.avt
IXi»»ill-'|..» 1
ruyiuni
Him- 1H.AY |
I'yn.wn
Him 1
ICri'lmv
k.|».sit {As.. II
X-lxisil |A~. .11
M»»il lA"" Hi- Amliviti'l
V|».sit {As,, li
XTHIl'itlllt* L'lJtTj
IIILS Shall- and ^
A'
EL(m)
300
Takaonoduuu L
-100
-200
Fig. 2. Vertical section of geological formation at the A-A' line in the Kumamoto Plain
technique using dissolved helium that hasproven to be useful in groundwaterinvestigations in the Kumamoto Plain.Consequently, we can deduce the origin ofgroundwater, separate groundwater basins anddate the residence time of groundwater.
2. STUDY AREA
The Kumamoto Plain is on the west side of Mt.Aso and outside the caldera. The bedrocks,which are impermeable, consist of Mifunelayers, which are metamorphic rocks of theCretaceous, Pre-Aso volcanic rock andunclassified Diluvium. Four pyroclastic flowdeposits, called Aso-1, Aso-2, Aso-3 and Aso-4 in chronological order from the bottom toground, and a cracked lava layer, calledTogawa lava, cover the bedrock. Thepyroclastic flow deposits and cracked lavalayers act as a major reservoir of groundwater.
The Kumamoto Plain has three major rivers,the Shira, the Tsuboi and the Midori. TheShira river plays a major role in discharge andrecharge of groundwater in the Plain. TheTsuboi river strongly affects groundwater flowin the northern part of the Plain. On the otherhand, the Midori river has no great effects onthe groundwater flow except the southernfringe of the Plain.
The Shira river flows across the KumamotoPlain from east to west along faults and is onesource of groundwater under the Plain. Thereare many springs, ponds and lakes. All thewater in Lake Ezuko is supplied fromgroundwater of about 4xlO5 to 9xlO5 • /day.There are probably some groundwater flowpaths under the Plain; two major paths arealong the old Kase river valley, which is buriedby Aso pyroclastic flow deposits, from thegroundwater reservoir located to the north ofthe Shira river outside the Aso caldera, andalong the Tsuboi river. Groundwater cannotflow along the Shira river from thegroundwater reservoir, because residual hillsand small mountains consisting ofimpermeable bedrock in the plain act asbarriers and prevent groundwater fromflowing.
We collected 16 groundwater samples from
wells and 10 samples from springs. Wecollected a further 11 groundwater samplesto estimate the origin of dissolved helium,from hot springs at Uchinomaki and Tarutamain the Aso caldera and at Kikuchi, Ueki andKikunann out of the caldera. The locations ofsampling sites are shown in Fig. 1. The verticalsection of geological formations is illustratedin Fig. 2.
3. ORIGIN OF DISSOLVED HELIUM INGROUNDWATER
Table 1 shows the measured content of heliumdissolved in groundwater. Hot spring samplescontain more helium than groundwater andtheir helium isotopic ratio of 3He/4He varieswidely from 0.8 ~ 5.06xl0"6 compared to thatof groundwater 1.38 ~ 4.4xlO'6. The lowesthelium isotopic ratio found in this study of theorder of 10"7, which is lower than 1.38xlO'6 ofdistilled water equilibrated with atmospherichelium, was found in samples collected at theKikuchi hot-spa and the Ueki hot-spa whichare located on the north fringe of thegroundwater reservoir in the Kumamoto Plainout of the Aso caldera. This suggests that thewaters of the Kikuchi and Ueki hot-springscontain less mantle helium component.Consequently, the release of the mantle heliumcomponent in the Kikuchi and Ueki areas issmaller than that in other areas in this study,because the Kikuchi and Ueki areas arefarthest from the crater of Mt. Aso.Furthermore, the heat sources of the Kikuchiand Ueki hot-springs are possibly estimated tooriginate from deep geothermal convectionbased on non-volcanic activity.
The helium isotopic ratios of samples collectedinside the caldera were relatively high of 4 ~ 5xlO'5. This high ratio is caused by intrusion ofthe mantle helium component with 1.15 xlO"5(2) released from a magma in the crater of Mt.Aso several kilometers deep. On the contrary,a groundwater sample collected at ShirakawaSuigenn inside the caldera has a heliumisotopic ratio of only 1.64 x 10"6, whichsuggests that the mantle helium intrusion haslittle effect. The groundwater residence time atShirakawa Suigenn was estimated to be 17years by the 3H+3He dating method (3), which
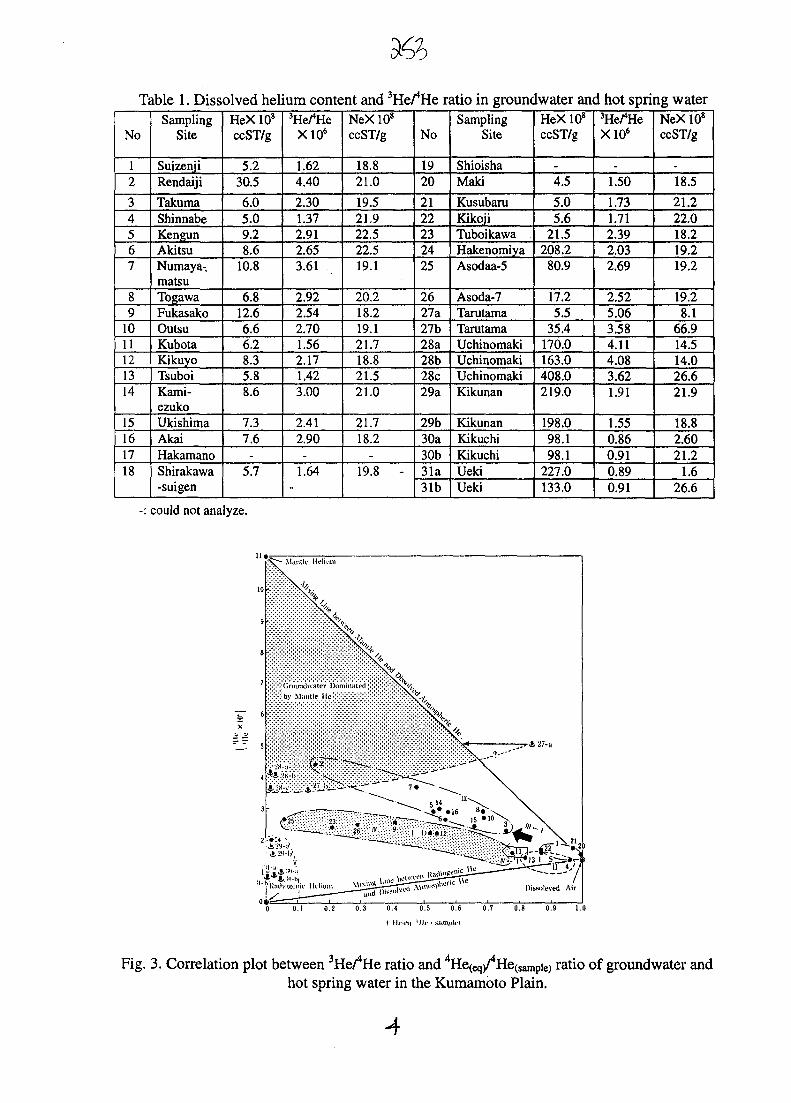
Table 1. Dissolved helium content and ratio in groundwater and hot spring water
No
12
34567
89
1011121314
15161718
SamplingSite
SuizenjiRendaiji
TakumaShinnabeKengunAkitsuNumaya-.matsuTogawaFukasakoOutsuKubotaKikuyoTsuboiKami-ezukoUkishimaAkaiHakamanoShirakawa-suigen
HeX 108
ccST/g
5.230.5
6.05.09.28.6
10.8
6.812.66.66.28.35.88.6
7.37.6
-5.7
3He/"HeX106
1.624.40
2.301.372.912.653.61
2.922.542.701.562.171.423.00
2.412.90-
1.64
NeX 108
ccST/g
18.821.0
19.521.922.522.519.1
20.218.219.121.718.821.521.0
21.718.2
-19.8 -
No
1920
2122232425
2627a27b28a28b28c29a
29b30a30b31a31b
SamplingSite
ShioishaMaki
KusubaruKikojiTuboikawaHakenomiyaAsodaa-5
Asoda-7TarutamaTarutamaUchinomakiUchinomakiUchinomakiKikunan
KikunanKikuchiKikuchiUekiUeki
HeX 10s
ccST/g
-4.5
5.05.6
21.5208.2
80.9
17.25.5
35.4170.0163.0408.0219.0
198.098.198.1
227.0133.0
W H eX106
-1.50
1.731.712.392.032.69
2.525.063.584.114.083.621.91
1.550.860.910.890.91
NeX 108
ccST/g
-18.5
21.222.018.219.219.2
19.28.1
66.914.514.026.621.9
18.82.6021.2
1.626.6
-: could not analyze.
0 0.1 0.2 0.3 0.4 0.5 0.6 0.7 0.8 0.9 1.0
•ri- 27-a
Fig. 3. Correlation plot between 3He/4He ratio and 4He(eq/4He(Sampie) ratio of groundwater andhot spring water in the Kumamoto Plain.
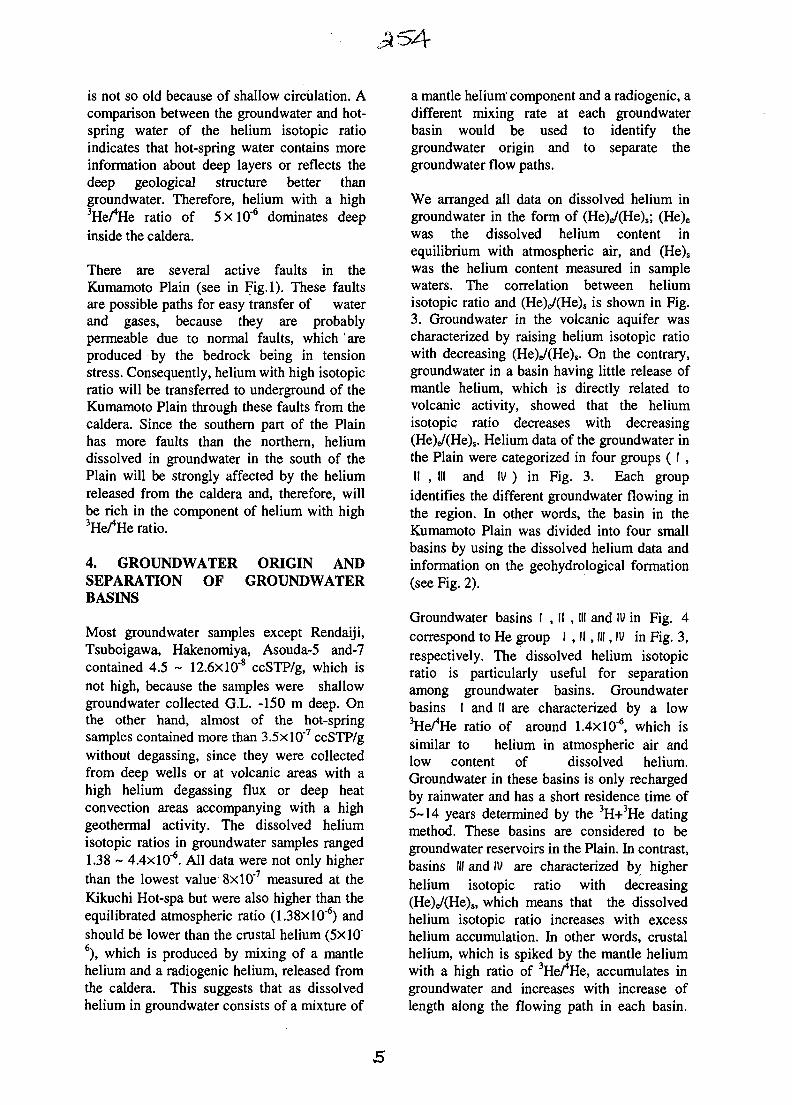
is not so old because of shallow circulation. Acomparison between the groundwater and hot-spring water of the helium isotopic ratioindicates that hot-spring water contains moreinformation about deep layers or reflects thedeep geological structure better thangroundwater. Therefore, helium with a high3He/*He ratio of 5xlO"6 dominates deepinside the caldera.
There are several active faults in theKumamoto Plain (see in Fig.l). These faultsare possible paths for easy transfer of waterand gases, because they are probablypermeable due to normal faults, which areproduced by the bedrock being in tensionstress. Consequently, helium with high isotopicratio will be transferred to underground of theKumamoto Plain through these faults from thecaldera. Since the southern part of the Plainhas more faults than the northern, heliumdissolved in groundwater in the south of thePlain will be strongly affected by the heliumreleased from the caldera and, therefore, willbe rich in the component of helium with high^ ^ ratio.
4. GROUNDWATER ORIGIN ANDSEPARATION OF GROUNDWATERBASINS
Most groundwater samples except Rendaiji,Tsuboigawa, Hakenomiya, Asouda-5 and-7contained 4.5 ~ 12.6xlO'8 ccSTP/g, which isnot high, because the samples were shallowgroundwater collected G.L. -150 m deep. Onthe other hand, almost of the hot-springsamples contained more than 3.5xlO"7 ccSTP/gwithout degassing, since they were collectedfrom deep wells or at volcanic areas with ahigh helium degassing flux or deep heatconvection areas accompanying with a highgeothermal activity. The dissolved heliumisotopic ratios in groundwater samples ranged1.38 ~ 4.4xlO'6. All data were not only higherthan the lowest value 8xl0'7 measured at theKikuchi Hot-spa but were also higher than theequilibrated atmospheric ratio (1.38X10'6) andshould be lower than the crustal helium (5x10'6), which is produced by mixing of a mantlehelium and a radiogenic helium, released fromthe caldera. This suggests that as dissolvedhelium in groundwater consists of a mixture of
a mantle helium component and a radiogenic, adifferent mixing rate at each groundwaterbasin would be used to identify thegroundwater origin and to separate thegroundwater flow paths.
We arranged all data on dissolved helium ingroundwater in the form of (He)e/(He)s; (He)e
was the dissolved helium content inequilibrium with atmospheric air, and (He)s
was the helium content measured in samplewaters. The correlation between heliumisotopic ratio and (He)e/(He)s is shown in Fig.3. Groundwater in the volcanic aquifer wascharacterized by raising helium isotopic ratiowith decreasing (He)e/(He)s. On the contrary,groundwater in a basin having little release ofmantle helium, which is directly related tovolcanic activity, showed that the heliumisotopic ratio decreases with decreasing(He)e/(He)s. Helium data of the groundwater inthe Plain were categorized in four groups ( I ,II , III and IV ) in Fig. 3. Each group
identifies the different groundwater flowing inthe region. In other words, the basin in theKumamoto Plain was divided into four smallbasins by using the dissolved helium data andinformation on the geohydrological formation(see Fig. 2).
Groundwater basins I , II , III and IV in Fig. 4correspond to He group I , II, III, IV in Fig. 3,respectively. The dissolved helium isotopicratio is particularly useful for separationamong groundwater basins. Groundwaterbasins I and II are characterized by a low^ e / H e ratio of around 1.4X10"6, which issimilar to helium in atmospheric air andlow content of dissolved helium.Groundwater in these basins is only rechargedby rainwater and has a short residence time of5-14 years determined by the 3H+3He datingmethod. These basins are considered to begroundwater reservoirs in the Plain. In contrast,basins III and IV are characterized by higherhelium isotopic ratio with decreasing(He)e/(He)s, which means that the dissolvedhelium isotopic ratio increases with excesshelium accumulation. In other words, crustalhelium, which is spiked by the mantle heliumwith a high ratio of 3He/^He, accumulates ingroundwater and increases with increase oflength along the flowing path in each basin.
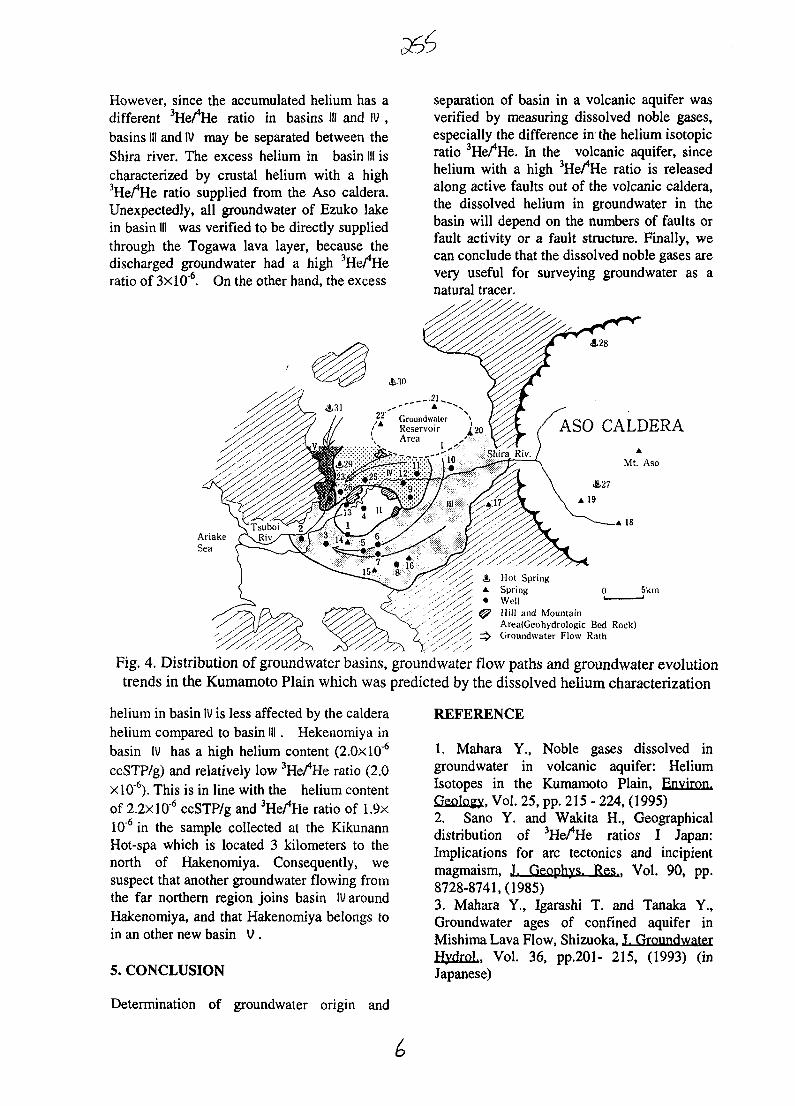
However, since the accumulated helium has adifferent 'He^He ratio in basins III and IV ,basins III and IV may be separated between theShira river. The excess helium in basin III ischaracterized by crustal helium with a high^ e ^ H e ratio supplied from the Aso caldera.Unexpectedly, all groundwater of Ezuko lakein basin III was verified to be directly suppliedthrough the Togawa lava layer, because thedischarged groundwater had a high 3He/*Heratio of 3xlO'6. On the other hand, the excess
separation of basin in a volcanic aquifer wasverified by measuring dissolved noble gases,especially the difference in the helium isotopicratio 3He/4He. In the volcanic aquifer, sincehelium with a high 'He^He ratio is releasedalong active faults out of the volcanic caldera,the dissolved helium in groundwater in thebasin will depend on the numbers of faults orfault activity or a fault structure. Finally, wecan conclude that the dissolved noble gases arevery useful for surveying groundwater as anatural tracer.
CALDERA
5km
Area(GeohydrologicGroundwater 1
Bed Rock)Rath
Fig. 4. Distribution of groundwater basins, groundwater flow paths and groundwater evolutiontrends in the Kumamoto Plain which was predicted by the dissolved helium characterization
helium in basin IV is less affected by the calderahelium compared to basin III. Hekenomiya inbasin IV has a high helium content (2.0xl06
ccSTP/g) and relatively low 'He/He ratio (2.0xlO"6). This is in line with the helium contentof 2.2X10"6 ccSTP/g and 3He/*He ratio of 1.9x10"6 in the sample collected at the KikunannHot-spa which is located 3 kilometers to thenorth of Hakenomiya. Consequently, wesuspect that another groundwater flowing fromthe far northern region joins basin IV aroundHakenomiya, and that Hakenomiya belongs toin an other new basin V .
5. CONCLUSION
REFERENCE
1. Mahara Y., Noble gases dissolved ingroundwater in volcanic aquifer: HeliumIsotopes in the Kumamoto Plain, Environ.Geology, Vol. 25, pp. 215 - 224, (1995)2. Sano Y. and Wakita H., Geographicaldistribution of 3He/4He ratios I Japan:Implications for arc tectonics and incipientmagmaism, J. Qeophys. Res,r Vol. 90, pp.8728-8741,(1985)3. Mahara Y., Igarashi T. and Tanaka Y.,Groundwater ages of confined aquifer inMishima Lava Flow, Shizuoka, J. GroundwaterHyikol, Vol. 36, pp.201- 215, (1993) (inJapanese)
Determination of groundwater origin and
AU9817346
The peculiarity of the contamination's behaviour in water in the Chernobylregion.
A. L.KONONOVICH*, I.I.KRISHEV**,BJa.OSKOLKOV***,L.G.KULEBAKINA+,N.P.ARHIPOV^
*A11-Russian Research Institute for Nuclear Power Plant Operation (VNIIAES).Russia, Moscow,
**Scientific-Industry union "Taifun"Russia, Obninsk,
***Chernobyl NPSUkraine, Chernobyl
+Institute of biology of South SeasUkraine, Sevastopol.
^ Scientific-Industry union "PripjatUkraine, Chernobyl.
SUMMARY. The new factors become significant for Chernobyl's contamination's evolutionafter 8- 10 years. Those factors was hidden in the early 3-r5 years. It describes the mathemati-cal model of the radionuclides's migration in the Chernobyl cooling pond, which takes intoaccount the destruction of the fuel particles. There is, also, some results about the migrationof the 137Cs by groundwater. It was observed the component of the 137Cs contamination withlow sorption's coefficient.
1 MODEL OF THE COOLING POND
Majority of the mathematical models forthe radionuclide's migration in lakes andponds, are based on the main principles,which are common for the many models. Itis need the average annual concentrationsfor practice. Thus, we can use simplifiedmodels. The principles for those kinds ofmodels described next.
It considered 4 forms of radioac-tive contamination:1. Solution forms in water; 2. Solutionforms, sorpted on the surface of the solidparticles; 3. Insoluble (solid) forms in thebottom sediment; 4. Insoluble particles,suspended in volume of the water. There ischange between radioactive forms. Sorp-tion and desorption are describes byHenry's law,- q=Kp, where K is constantcoefficient, q is the concentration in water,
p is the concentration in bottom sediment.The sedimentation and wind-wave's resus-pention are describes by the similar way.In this case, the coefficient K dependsfrom the wind velocity and from the sea-son of the year. But its annual value is ap-proximately constant.
Our model for radionuclide'smigration in the Chernobyl cooling ponddiffers from other mathematical models,that it takes into account the destruction ofthe fuel's particles during the time. Wemade the special mathematical model forthe particle's destruction. The principlesfor model are:
1. There are some clefts in the par-ticles. The relative area of the clefts de-pends from the time and from the place inthe particle.
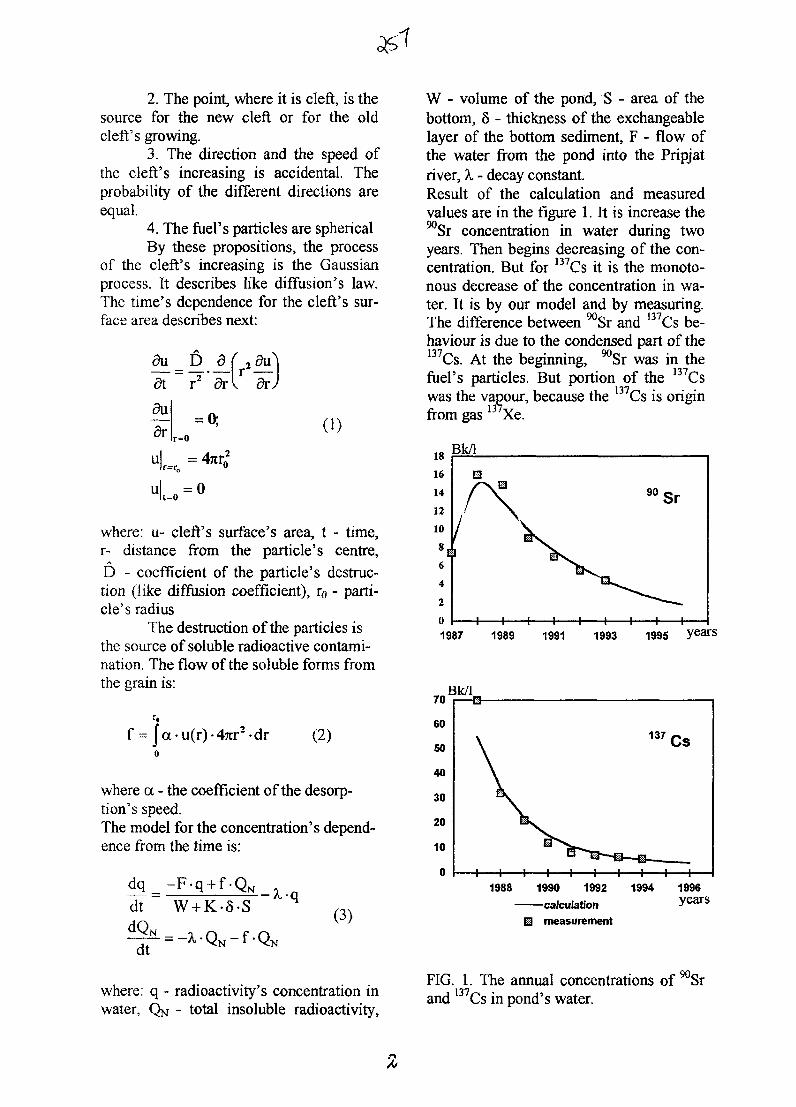
2. The point, where it is cleft, is thesource for the new cleft or for the oldcleft's growing.
3. The direction and the speed ofthe cleft's increasing is accidental. Theprobability of the different directions areequal.
4. The fuel's particles are sphericalBy these propositions, the process
of the cleft's increasing is the Gaussianprocess. It describes like diffusion's law.The time's dependence for the cleft's sur-face area describes next:
du E>
dv
= 0;lr=0
0)
t=0= 0
where: u- cleft's surface's area, t - time,r- distance from the particle's centre,D - coefficient of the particle's destruc-tion (like diffusion coefficient), r0 - parti-cle's radius
The destruction of the particles isthe source of soluble radioactive contami-nation. The flow of the soluble forms fromthe grain is:
f = Ja-u(r)-47rr2-dr (2)
where a - the coefficient of the desorp-tion's speed.The model for the concentration's depend-ence from the time is:
dq
dt
dt
- F - q + f-QN
W + K-5-S
= - ^ Q N - f - Q N
(3)
where: q - radioactivity's concentration inwater, QN - total insoluble radioactivity,
W - volume of the pond, S - area of thebottom, 5 - thickness of the exchangeablelayer of the bottom sediment, F - flow ofthe water from the pond into the Pripjatriver, X - decay constant.Result of the calculation and measuredvalues are in the figure 1. It is increase the
Sr concentration in water during twoyears. Then begins decreasing of the con-centration. But for 137Cs it is the monoto-nous decrease of the concentration in wa-ter. It is by our model and by measuring.The difference between ^Sr and 137Cs be-haviour is due to the condensed part of the137Cs. At the beginning, ^Sr was in thefuel's particles. But portion of the I37Cswas the vapour, because the l37Cs is originfrom gas L Xe.
Bk/1
1987 1989 1991 1993 1995
1988 1990 1992
—calculation
I measurement
1994 1996years
FIG. 1. The annual concentrations ofand 137Cs in pond's water.
onSr
The results of model's calculationof the annual concentration of the 137Csand 90Sr in water coincide with measure-ment's results in less then 20 %. Result ofthis work shows, that the main process,which determine the time dependence ofthe annual concentration of the radionu-clides in Chernobyl cooling pond, is thedestruction of the fuel's particles.
2. MIGRATION OF THE 137Cs INGROUNDWATER.
In the second part of the paperthere is result of the investigation B Csmigration in groundwater. The investiga-tion was made with the physical model ofthe filtration's section of the water layer.Mock-up is the 7 successive filter sectionswith sample ground (sand). Thus, we couldsee the change of the 137Cs distribution in 6points.
The similarity of the physical-chemical simulation and real process wassecured with the next. The water for ex-periments was taken from water layer near"Red Forest" (in Chernobyl region). Thecleanly and contaminated sands was takennear "Red Forest" from 6.5m. and from1.5m. depth. Thus, it was the real Cherno-byl's ground's contamination. The speed ofthe filtrated water in our experiments wasless then 5 10"3 sm./s.
The investigation was made withmathematical's modelling. The nitration'sprocess was described with Nutzman'smodel.
D V - (4)
where Vf - speed of the filtrated water, D -the diffusion's coefficient in the groundwater.
The parameters was obtained fromexperiment's results with non-linearmethod of "minimum square".
As result it was obtained. There aretwo fraction of the 137Cs contamination inthe "Red Forest's" groundwater. One frac-
tion has a big sorption coefficient, like ininvestigations in many other publications.Thus, this fraction moves very slow. Theother fraction moves quickly. But it's con-centration was very small. Results are inthe table 1.
TABLE 1. MIGRATION'S PARAME-TERS FOR 137Cs IN GROUNDWATER.
K" of thedistribution
K of the slowdown (ml/g)D(gz/sm4)
slow0.036+0.015
540±50
970+.100
speed6.4" 10"5 *1.110"4
3.0-^7.0
Comment: K is the ratio of the concentra-tion of the mobile fraction at the co-ordinate's beginning to the full contami-nation at the co-ordinate's beginning.
3. CONCLUSION
Results of this work shows, that the mainprocess, which determines the radiationstate of the surface water is the slow de-struction of the insoluble particles. Themost of the particles are in the bottomsediment. That explains the failures of theattempt's of the decontamination of thelittle lakes and ponds near Chernobyl.
There is not clearly about the influ-ence of the speed fraction of the 137Cs ingroundwater on the radiation state of theChernobyl region. The part of the speedcomponent is about 10 . But the compo-nents of 137Cs contamination, which hasthe big sorption's coefficient, convertsslowly into the "speed form" during thetime. It is unknown, is it possible the op-posite process. May be, the "speed frac-tion" is the factor of the additional "self-cleaning" of the groundwater. But may be,it is a factor of the additional risk.
AU9817347
Historical Changes of the Anthropogenic Impact in a coastal Lagoon:Pb isotopes and trace metals on Mussel's fleshes and shells
M. LABONNE, D. BEN OTHMAN, J.M. LUCKUniversity Montpellier II, Laboratoire Geofluides, Bassins, Eaux
34095 Montpellier cedex 5, France
SUMMARY. The mussels are good recorders of the metal level variations in the environmentby their ability to concentrate and accumulate metals from seawater. We have analysed the leadconcentrations in five locations in a coastal lagoon surrounded by natural and anthropogenicsources. Moreover to determine the lead inputs sources we have analysed the Pb isotopiccompositions during two seasons and compare them to different sources present in thewatershed. As the shells can also be used as a recorder of environmental changes, we comparethe isotopic compositions in recent and ancient shells (1-6 th centuries), showing ananthropogenic impact since the Roman Empire.
1. INTRODUCTION
Mollusks are known to concentrate metals in avery strong manner and equilibrate rapidly withtheir environment since Goldberg (1) has triedto use them as global indicators. They filterwaters and accumulate metals 103 to 104 timesabove water levels. So they are used in manyprograms of coastal survey (NOAA, FrenchMussel Watch,...) as bioindicators.The lead concentrations in the fleshes allow usto determine spatial and temporal variations inthe environment but they are influenced bybiological factors such as weight. In order tounderstand the becoming of the pollutantsubstances inputs, we have also analysed the Pbisotopic compositions of the mussel fleshes,tracing by their intermediary the watermovements in the lagoon.
But the trace metal metals assimilated by theanimal are also accumulated in the shell toconsiderable extent. According to severalauthors (Sturesson (2); Bourgoin, et al. (3)), thechemical composition of shells then could be arecord of its environmental metal levels, andmoreover could be used to compare presentenvironment with those of the past (Pitts andWallace (4)). The shell, instead of flesheswould be a medium-term record. The secondaim of the study is to compare the leadconcentrations in ancient and recent shells inorder to evaluate the antropogenic impact and
to compare their isotopic compositions todifferent sources identified on the watershed.
2. LOCATION OF THE STUDY ANDMETHOD
The Thau coastal lagoon (70 Km2) is located inthe South of France near Montpellier. Thislagoon was chosen because of the varioussources of both natural and anthropogenicinputs. The surrounding rocks are principallyJurassic limestones and Miocene marls. TheSete industrial harbour presents a high densityof industries: cement and fertilizer factories, carand boat workshops, and so forth.. Animportant highway crosses the Thau watershed.Several water treatment plants are located inthe watershed and their outputs reach thelagoon.
Mussel spat from the sea, was introduced injune 95 in five locations of the lagoon: in theSete harbour, at the Vene exutory draining themain water treatment plants, in the lagooncenter, near the city Marseillan and in the sea(Figure 1). Ten animals (Mytilusgalloprovincialis) were sampled in May 96and Oct 96 to minimize the intra-populationvariability. The ancient shells (1st century to6th century ad) came from a rubbish tip of aRoman villa in Loupian. Lead castings (1*6cm) dated of the sames ages as the shells werealso analysed.
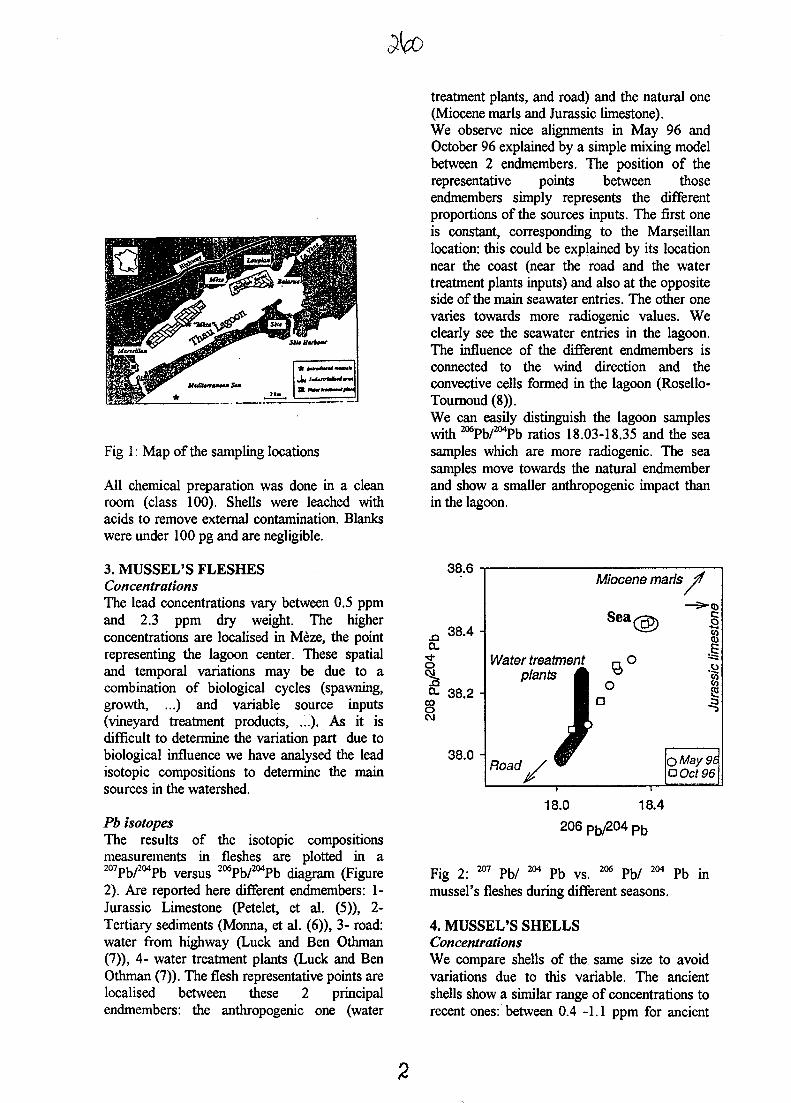
Fig 1: Map of the sampling locations
All chemical preparation was done in a cleanroom (class 100). Shells were leached withacids to remove external contamination. Blankswere under 100 pg and are negligible.
3. MUSSEL'S FLESHESConcentrationsThe lead concentrations vary between 0.5 ppmand 2.3 ppm dry weight. The higherconcentrations are localised in Meze, the pointrepresenting the lagoon center. These spatialand temporal variations may be due to acombination of biological cycles (spawning,growth, ...) and variable source inputs(vineyard treatment products, ...). As it isdifficult to determine the variation part due tobiological influence we have analysed the leadisotopic compositions to determine the mainsources in the watershed.
Pb isotopesThe results of the isotopic compositionsmeasurements in fleshes are plotted in a2 0 7 2 0 4 2 0 6 2 0 4
2). Are reported here different endmembers: 1-Jurassic Limestone (Petelet, et al. (5)), 2-Tertiary sediments (Monna, et al. (6)), 3- road:water from highway (Luck and Ben Othman(7)), 4- water treatment plants (Luck and BenOthman (7)). The flesh representative points arelocalised between these 2 principalendmembers: the anthropogenic one (water
treatment plants, and road) and the natural one(Miocene marls and Jurassic limestone).We observe nice alignments in May 96 andOctober 96 explained by a simple mixing modelbetween 2 endmembers. The position of therepresentative points between thoseendmembers simply represents the differentproportions of the sources inputs. The first oneis constant, corresponding to the Marseillanlocation: this could be explained by its locationnear the coast (near the road and the watertreatment plants inputs) and also at the oppositeside of the main seawater entries. The other onevaries towards more radiogenic values. Weclearly see the seawater entries in the lagoon.The influence of the different endmembers isconnected to the wind direction and theconvective cells formed in the lagoon (Rosello-Tournoud (8)).
We can easily distinguish the lagoon sampleswith 206Pb/204Pb ratios 18.03-18.35 and the seasamples which are more radiogenic. The seasamples move towards the natural endmemberand show a smaller anthropogenic impact thanin the lagoon.
CL
1Q.
CO
OO.D "
38.4 -
38.2 -
38.0 -
Water treatmentplants £
1/
Road / ~
Miocene man's rf
— \p
o ^
O §1- 3
>
O /Way 96OOct96
18.0 18.4
206 p b /204 P b
Fig 2: 207 Pb/ 204 Pb vs. 206 Pb/ 204 Pb inmussel's fleshes during different seasons.
4. MUSSEL'S SHELLSConcentrationsWe compare shells of the same size to avoidvariations due to this variable. The ancientshells show a similar range of concentrations torecent ones: between 0.4 -1.1 ppm for ancient
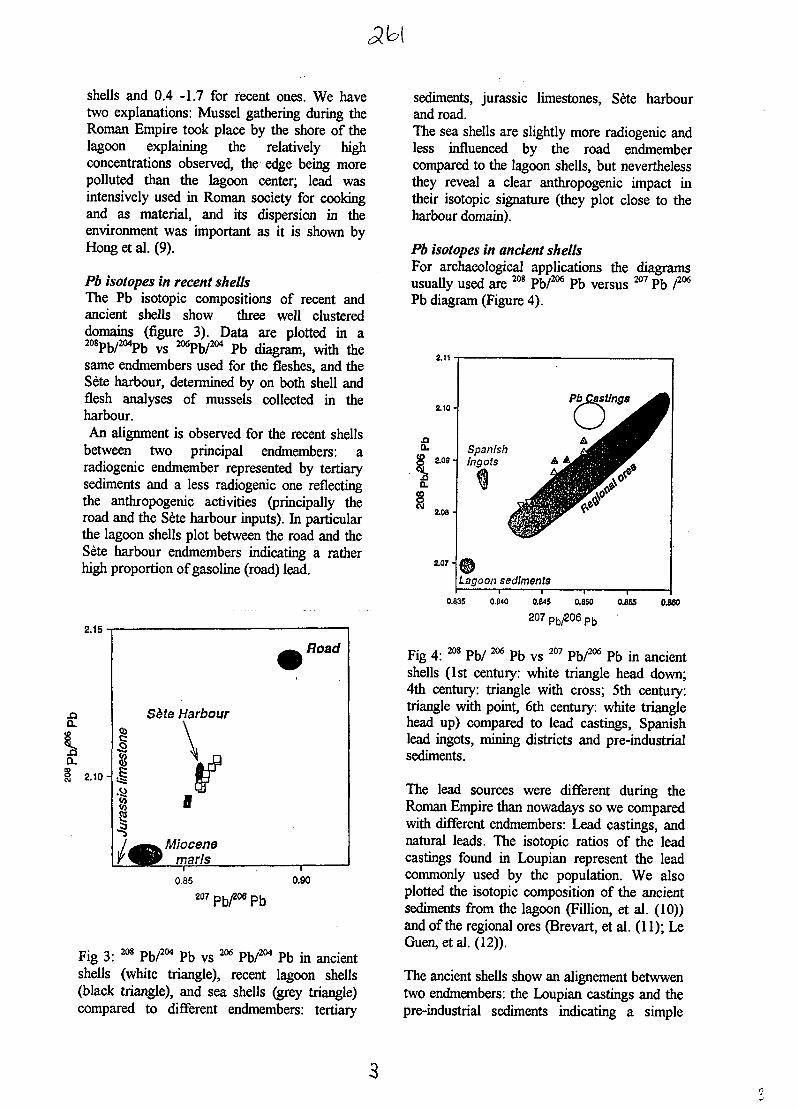
shells and 0.4 -1.7 for recent ones. We havetwo explanations: Mussel gathering during theRoman Empire took place by the shore of thelagoon explaining the relatively highconcentrations observed, the edge being morepolluted than the lagoon center; lead wasintensively used in Roman society for cookingand as material, and its dispersion in theenvironment was important as it is shown byHong et al. (9).
Pb isotopes in recent shellsThe Pb isotopic compositions of recent andancient shells show three well clustereddomains (figure 3). Data are plotted in a208pb/204pb y s 206pb/204 p b fa^Wl, With thesame endmembers used for the fleshes, and theSete harbour, determined by on both shell andflesh analyses of mussels collected in theharbour.An alignment is observed for the recent shells
between two principal endmembers: aradiogenic endmember represented by tertiarysediments and a less radiogenic one reflectingthe anthropogenic activities (principally theroad and the Sete harbour inputs). In particularthe lagoon shells plot between the road and theSete harbour endmembers indicating a ratherhigh proportion of gasoline (road) lead.
2.15
2.10-
Road
Sete Harbour
1Miocene
marls0.85 0.90
207pb/206pb
Fig 3: 208 Pb/204 Pb vs 206 Pb/204 Pb in ancientshells (white triangle), recent lagoon shells(black triangle), and sea shells (grey triangle)compared to different endmembers: tertiary
sediments, Jurassic limestones, Sete harbourand road.The sea shells are slightly more radiogenic andless influenced by the road endmembercompared to the lagoon shells, but neverthelessthey reveal a clear anthropogenic impact intheir isotopic signature (they plot close to theharbour domain).
Pb isotopes in ancient shellsFor archaeological applications the diagramsusually used are 208 Pb/206 Pb versus 207 Pb I206
Pb diagram (Figure 4).
2.11
2.10-
2.09-
2.08-
2.07-
0.835 0.010 0.845 0.850 0.855 0.860
207pb/206pb
Fig 4: 208 Pb/ 206 Pb vs 207 Pb/206 Pb in ancientshells (1st century: white triangle head down;4th century: triangle with cross; 5th century:triangle with point, 6th century: white trianglehead up) compared to lead castings, Spanishlead ingots, mining districts and pre-industrialsediments.
The lead sources were different during theRoman Empire than nowadays so we comparedwith different endmembers: Lead castings, andnatural leads. The isotopic ratios of the leadcastings found in Loupian represent the leadcommonly used by the population. We alsoplotted the isotopic composition of the ancientsediments from the lagoon (Fillion, et al. (10))and of the regional ores (Brevart, et al. (11); LeGuen, etal. (12)).
The ancient shells show an alignement betwwentwo endmembers: the Loupian castings and thepre-industrial sediments indicating a simple
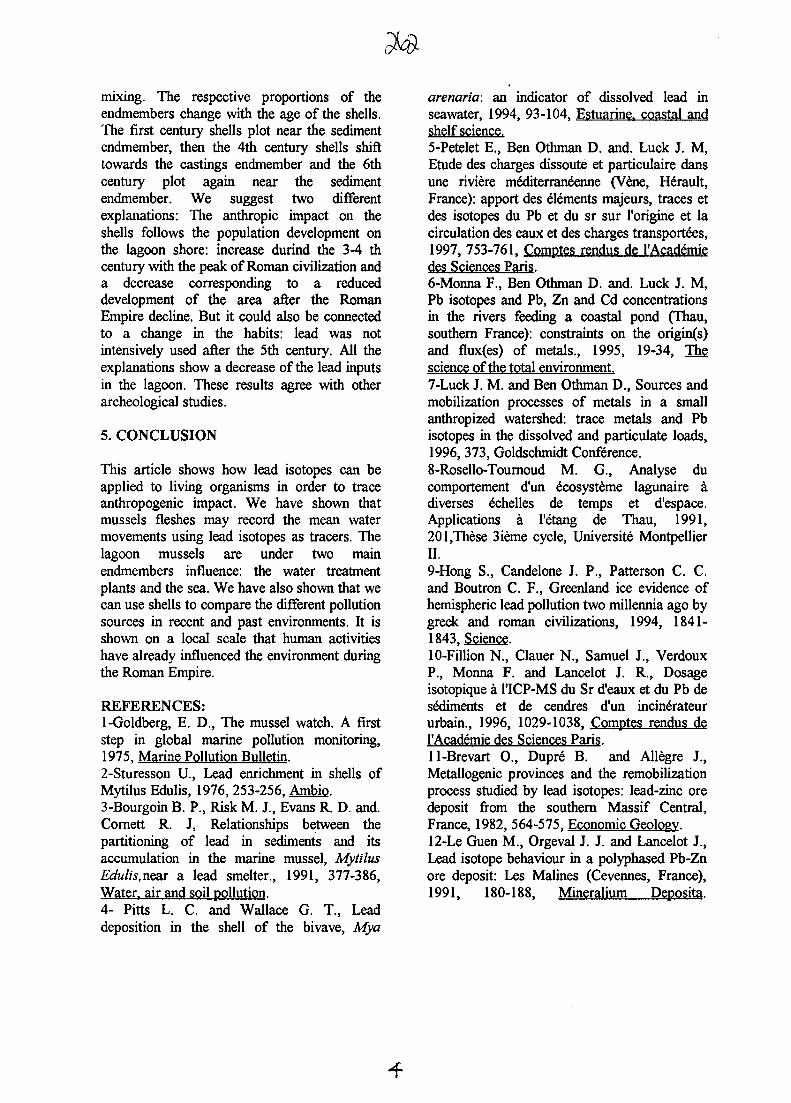
mixing. The respective proportions of theendmembers change with the age of the shells.The first century shells plot near the sedimentendmember, then the 4th century shells shifttowards the castings endmember and the 6thcentury plot again near the sedimentendmember. We suggest two differentexplanations: The anthropic impact on theshells follows the population development onthe lagoon shore: increase durind the 3-4 thcentury with the peak of Roman civilization anda decrease corresponding to a reduceddevelopment of the area after the RomanEmpire decline. But it could also be connectedto a change in the habits: lead was notintensively used after the 5th century. All theexplanations show a decrease of the lead inputsin the lagoon. These results agree with otherarcheological studies.
5. CONCLUSION
This article shows how lead isotopes can beapplied to living organisms in order to traceanthropogenic impact. We have shown thatmussels fleshes may record the mean watermovements using lead isotopes as tracers. Thelagoon mussels are under two mainendmembers influence: the water treatmentplants and the sea. We have also shown that wecan use shells to compare the different pollutionsources in recent and past environments. It isshown on a local scale that human activitieshave already influenced the environment duringthe Roman Empire.
REFERENCES:1-Goldberg, E. D., The mussel watch. A firststep in global marine pollution monitoring,1975, Marine Pollution Bulletin.2-Sturesson U., Lead enrichment in shells ofMytilus Edulis, 1976, 253-256, Ambio.3-Bourgoin B. P., Risk M. J., Evans R. D. and.Cornett R. J, Relationships between thepartitioning of lead in sediments and itsaccumulation in the marine mussel, MytilusEdulis,near a lead smelter., 1991, 377-386,Water, air and soil pollution.4- Pitts L. C. and Wallace G. T., Leaddeposition in the shell of the bivave, Mya
arenaria: an indicator of dissolved lead inseawater, 1994, 93-104, EstuarineT coastal andshelf science.5-Petelet E., Ben Othman D. and. Luck J. M,Etude des charges dissoute et particulaire dansune riviere mediterraneenne (Vene, Herault,France): apport des elements majeurs, traces etdes isotopes du Pb et du sr sur l'origine et lacirculation des eaux et des charges transporters,1997, 753-761, Comptes rendus de l'Academiedes Sciences Paris.6-Monna F., Ben Othman D. and. Luck J. M,Pb isotopes and Pb, Zn and Cd concentrationsin the rivers feeding a coastal pond (Thau,southern France): constraints on the origin(s)and flux(es) of metals., 1995, 19-34, Thescience of the total environment.7-Luck J. M. and Ben Othman D., Sources andmobilization processes of metals in a smallanthropized watershed: trace metals and Pbisotopes in the dissolved and particulate loads,1996, 373, Goldschmidt Conference.8-Rosello-Tournoud M. G., Analyse ducomportement d'un ecosysteme lagunaire adiverses echelles de temps et d'espace.Applications a l'etang de Thau, 1991,201,These 3ieme cycle, Universite MontpellierII.9-Hong S., Candelone J. P., Patterson C. C.and Boutron C. F., Greenland ice evidence ofhemispheric lead pollution two millennia ago bygreek and roman civilizations, 1994, 1841-1843T Science.10-Fillion N., Clauer N., Samuel J., VerdouxP., Monna F. and Lancelot J. R., Dosageisotopique a 1'ICP-MS du Sr d'eaux et du Pb desediments et de cendres d'un incinerateururbain., 1996, 1029-1038, Comptes rendus del'Academie des Sciences Paris.11-Brevart O., Dupre B. and Allegre J.,Metallogenic provinces and the remobilizationprocess studied by lead isotopes: lead-zinc oredeposit from the southern Massif Central,France, 1982, 564-575, Economic Geology.12-Le Guen M., Orgeval J. J. and Lancelot J.,Lead isotope behaviour in a polyphased Pb-Znore deposit: Les Malines (Cevennes, France),1991, 180-188, Mineralium Deposita.
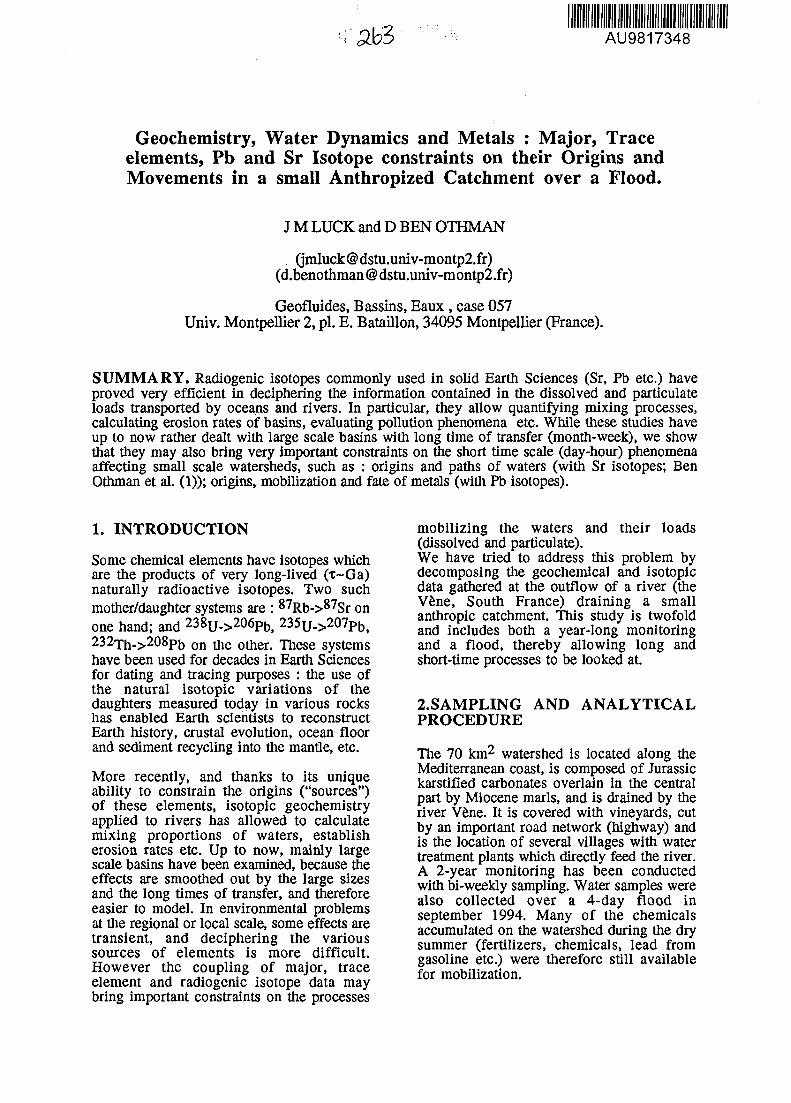
AU9817348
Geochemistry, Water Dynamics and Metals : Major, Traceelements, Pb and Sr Isotope constraints on their Origins andMovements in a small Anthropized Catchment over a Flood.
J M LUCK and D BEN OTHMAN
([email protected])(d.benothman® dstu.univ-montp2.fr)
Geofluides, Bassins, Eaux, case 057Univ. Montpellier 2, pi. E. Bataillon, 34095 Montpellier (France).
SUMMARY. Radiogenic isotopes commonly used in solid Earth Sciences (Sr, Pb etc.) haveproved very efficient in deciphering the information contained in the dissolved and particulateloads transported by oceans and rivers. In particular, they allow quantifying mixing processes,calculating erosion rates of basins, evaluating pollution phenomena etc. While these studies haveup to now rather dealt with large scale basins with long time of transfer (month-week), we showthat they may also bring very important constraints on the short time scale (day-hour) phenomenaaffecting small scale watersheds, such as : origins and paths of waters (with Sr isotopes; BenOthman et al. (1)); origins, mobilization and fate of metals (with Pb isotopes).
1. INTRODUCTION
Some chemical elements have isotopes whichare the products of very long-lived (x~Ga)naturally radioactive isotopes. Two suchmother/daughter systems are : 87Rb.>87gr Onone hand; and 238U->206Pb, 235U->207Pb,232Th->208Pb on the other. These systemshave been used for decades in Earth Sciencesfor dating and tracing purposes : the use ofthe natural isotopic variations of thedaughters measured today in various rockshas enabled Earth scientists to reconstructEarth history, crustal evolution, ocean floorand sediment recycling into the mantle, etc.
More recently, and thanks to its uniqueability to constrain the origins ("sources")of these elements, isotopic geochemistryapplied to rivers has allowed to calculatemixing proportions of waters, establisherosion rates etc. Up to now, mainly largescale basins have been examined, because theeffects are smoothed out by the large sizesand the long times of transfer, and thereforeeasier to model. In environmental problemsat the regional or local scale, some effects aretransient, and deciphering the varioussources of elements is more difficult.However the coupling of major, traceelement and radiogenic isotope data maybring important constraints on the processes
mobilizing the waters and their loads(dissolved and particulate).We have tried to address this problem bydecomposing the geochemical and isotopicdata gathered at the outflow of a river (theVene, South France) draining a smallanthropic catchment. This study is twofoldand includes both a year-long monitoringand a flood, thereby allowing long andshort-time processes to be looked at.
2.SAMPLING AND ANALYTICALPROCEDURE
The 70 km2 watershed is located along theMediterranean coast, is composed of Jurassickarstified carbonates overlain in the centralpart by Miocene marls, and is drained by theriver Vene. It is covered with vineyards, cutby an important road network (highway) andis the location of several villages with watertreatment plants which directly feed the river.A 2-year monitoring has been conductedwith bi-weekly sampling. Water samples werealso collected over a 4-day flood inSeptember 1994. Many of the chemicalsaccumulated on the watershed during the drysummer (fertilizers, chemicals, lead fromgasoline etc.) were therefore still availablefor mobilization.
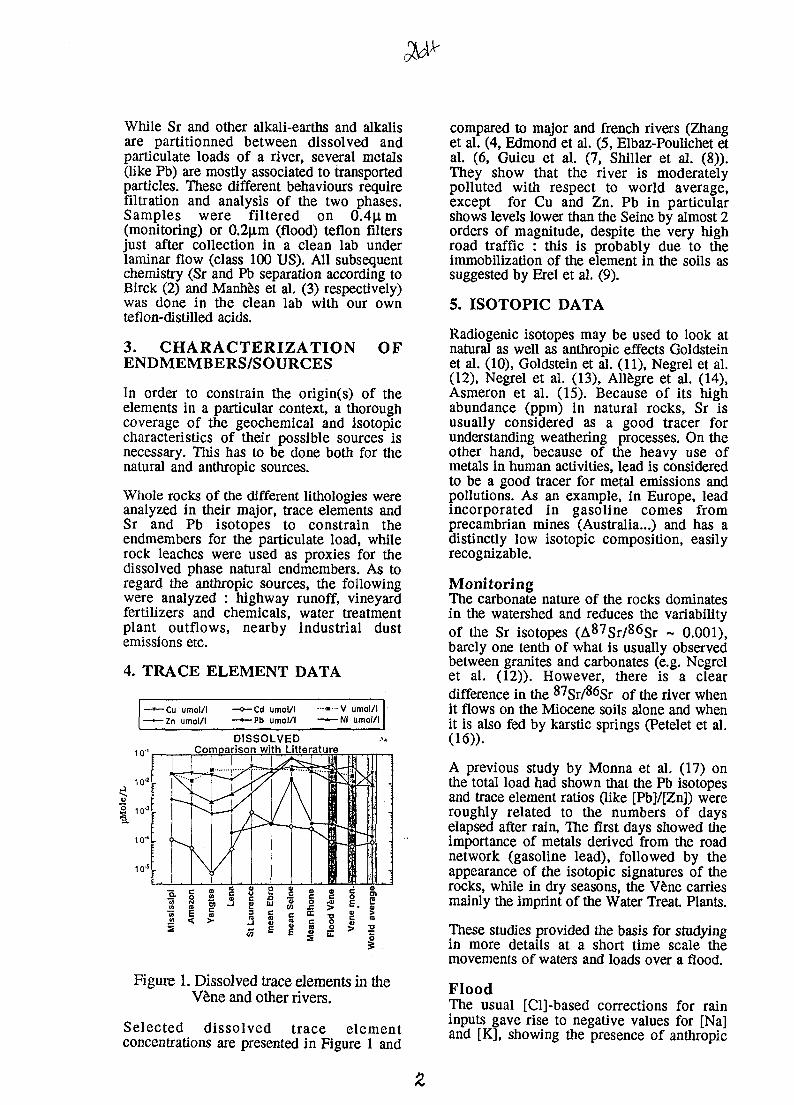
While Sr and other alkali-earths and alkalisare partitionned between dissolved andparticipate loads of a river, several metals(like Pb) are mostly associated to transportedparticles. These different behaviours requirefiltration and analysis of the two phases.Samples were filtered on 0.4|i.m(monitoring) or 0.2nm (flood) teflon filtersjust after collection in a clean lab underlaminar flow (class 100 US). All subsequentchemistry (Sr and Pb separation according toBirck (2) and Manhes et al. (3) respectively)was done in the clean lab with our ownteflon-distilled acids.
3. CHARACTERIZATIONENDMEMBERS/SOURCES
OF
In order to constrain the origin(s) of theelements in a particular context, a thoroughcoverage of the geochemical and isotopiccharacteristics of their possible sources isnecessary. This has to be done both for thenatural and anthropic sources.
Whole rocks of the different lithologies wereanalyzed in their major, trace elements andSr and Pb isotopes to constrain theendmembers for the paniculate load, whilerock leaches were used as proxies for thedissolved phase natural endmembers. As toregard the anthropic sources, the followingwere analyzed : highway runoff, vineyardfertilizers and chemicals, water treatmentplant outflows, nearby industrial dustemissions etc.
4. TRACE ELEMENT DATA
-Cu umol/l-Zn umol/l
-Cd umol/l-Pb umol/l
........ V umol/l— ^ N l umol/l
u
10"2
10-
1 0 ' 5
J
•
DISSOLVEDComparison with Litterature
x'" '
/(
A.
i* < 4
'*: i
-
in cJ2 <
c -£ c<u o 01
G
•o
I
Figure 1. Dissolved trace elements in theVene and other rivers.
Selected dissolved trace elementconcentrations are presented in Figure 1 and
compared to major and french rivers (Zhanget al. (4, Edmond et al. (5, Elbaz-Poulichet etal. (6, Guieu et al. (7, Shiller et al. (8)).They show that the river is moderatelypolluted with respect to world average,except for Cu and Zn. Pb in particularshows levels lower than the Seine by almost 2orders of magnitude, despite the very highroad traffic : this is probably due to theimmobilization of the element in the soils assuggested by Erel et al. (9).
5. ISOTOPIC DATA
Radiogenic isotopes may be used to look atnatural as well as anthropic effects Goldsteinet al. (10), Goldstein et al. (11), Negrel et al.(12), Negrel et al. (13), Allegre et al. (14),Asmeron et al. (15). Because of its highabundance (ppm) in natural rocks, Sr isusually considered as a good tracer forunderstanding weathering processes. On theother hand, because of the heavy use ofmetals in human activities, lead is consideredto be a good tracer for metal emissions andpollutions. As an example, in Europe, leadincorporated in gasoline comes fromprecambrian mines (Australia...) and has adistinctly low isotopic composition, easilyrecognizable.
MonitoringThe carbonate nature of the rocks dominatesin the watershed and reduces the variabilityof the Sr isotopes (A87sr/86sr ~ 0.001),barely one tenth of what is usually observedbetween granites and carbonates (e.g. Negrelet al. (12)). However, there is a cleardifference in the 87Sr/86Sr of the river whenit flows on the Miocene soils alone and whenit is also fed by karstic springs (Petelet et al.(16)).
A previous study by Monna et al. (17) onthe total load had shown that the Pb isotopesand trace element ratios (like [Pb]/[Zn]) wereroughly related to the numbers of dayselapsed after rain, The first days showed theimportance of metals derived from the roadnetwork (gasoline lead), followed by theappearance of the isotopic signatures of therocks, while in dry seasons, the Vene carriesmainly the imprint of the Water Treat. Plants.
These studies provided the basis for studyingin more details at a short time scale themovements of waters and loads over a flood.
FloodThe usual [Cl]-based corrections for raininputs gave rise to negative values for [Na]and [K], showing the presence of anthropic
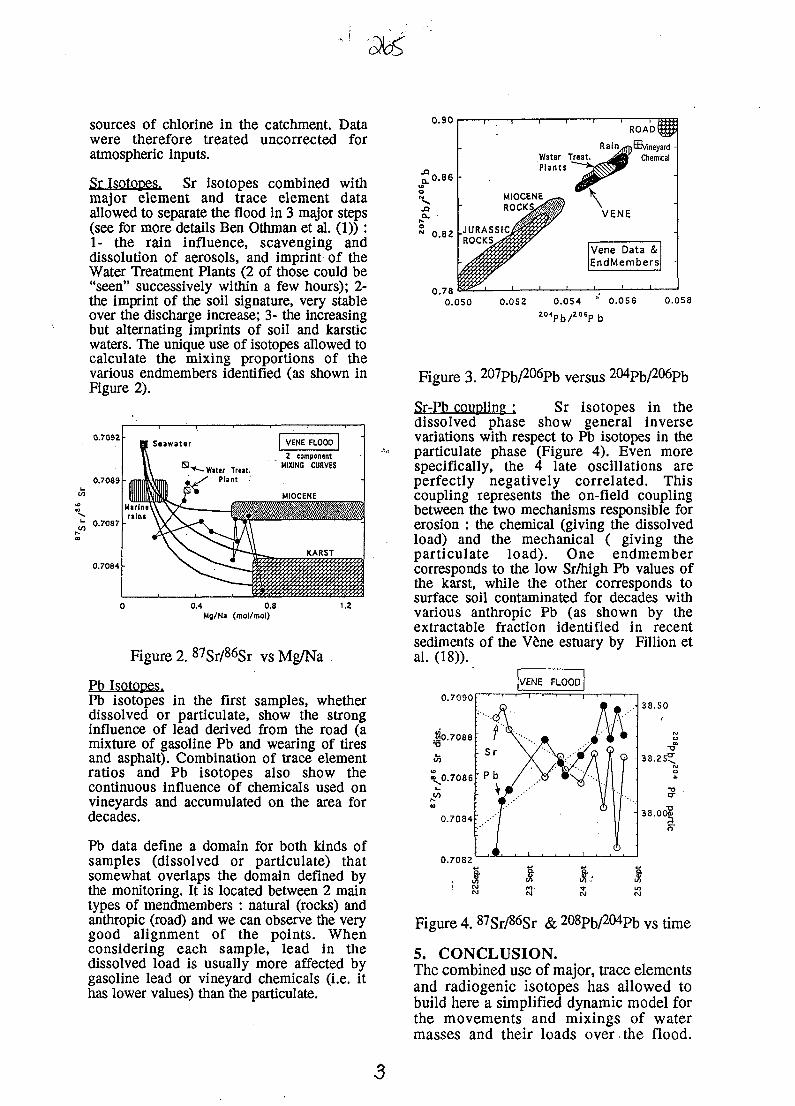
sources of chlorine in the catchment. Datawere therefore treated uncorrected foratmospheric inputs.
Sr Isotopes. Sr isotopes combined withmajor element and trace element dataallowed to separate the flood in 3 major steps(see for more details Ben Othman et al. (1)):1- the rain influence, scavenging anddissolution of aerosols, and imprint of theWater Treatment Plants (2 of those could be"seen" successively within a few hours); 2-the imprint of the soil signature, very stableover the discharge increase; 3- the increasingbut alternating imprints of soil and karsticwaters. The unique use of isotopes allowed tocalculate the mixing proportions of thevarious endmembers identified (as shown inFigure 2).
0.7092 •
0.7089 -
0.7087 •
0.7084
0.4 0.8Mg/Na (mol/mol)
Figure 2. 8?Sr/86Sr vs Mg/Na
Pb Isotopes.Pb isotopes in the first samples, whetherdissolved or particulate, show the stronginfluence of lead derived from the road (amixture of gasoline Pb and wearing of tiresand asphalt). Combination of trace elementratios and Pb isotopes also show thecontinuous influence of chemicals used onvineyards and accumulated on the area fordecades.
Pb data define a domain for both kinds ofsamples (dissolved or particulate) thatsomewhat overlaps the domain defined bythe monitoring. It is located between 2 maintypes of mendmembers : natural (rocks) andanthropic (road) and we can observe the verygood alignment of the points. Whenconsidering each sample, lead in thedissolved load is usually more affected bygasoline lead or vineyard chemicals (i.e. ithas lower values) than the particulate.
0.90
0.86
0.82
0.78
1—; 1 i
WaterPlants
M I O C E N E ^
.JURASSIC^ROCKS tftK?
wrwwcCCCCv*XP^ i 1 1 1
Rain,Treat. Jk
VEN
mfflvineyard -\ Chemical
E
Vene Data &EndMembers -
0.052 0.054 " 0.056 0.058204D
0.050
Figure 3. 207Pb/206pb v e r s u s 204pb/206pb
Sr-Pb coupling : Sr isotopes in thedissolved phase show general inversevariations with respect to Pb isotopes in theparticulate phase (Figure 4). Even morespecifically, the 4 late oscillations areperfectly negatively correlated. Thiscoupling represents the on-field couplingbetween the two mechanisms responsible forerosion : the chemical (giving the dissolvedload) and the mechanical ( giving theparticulate load). One endmembercorresponds to the low Sr/high Pb values ofthe karst, while the other corresponds tosurface soil contaminated for decades withvarious anthropic Pb (as shown by theextractable fraction identified in recentsediments of the V6ne estuary by Fillion etal. (18)).
0.7030- 38.50
Figure 4. 8?Sr/86Sr & 208pb/204Pb VS time
5. CONCLUSION.The combined use of major, trace elementsand radiogenic isotopes has allowed tobuild here a simplified dynamic model forthe movements and mixings of watermasses and their loads over.the flood.
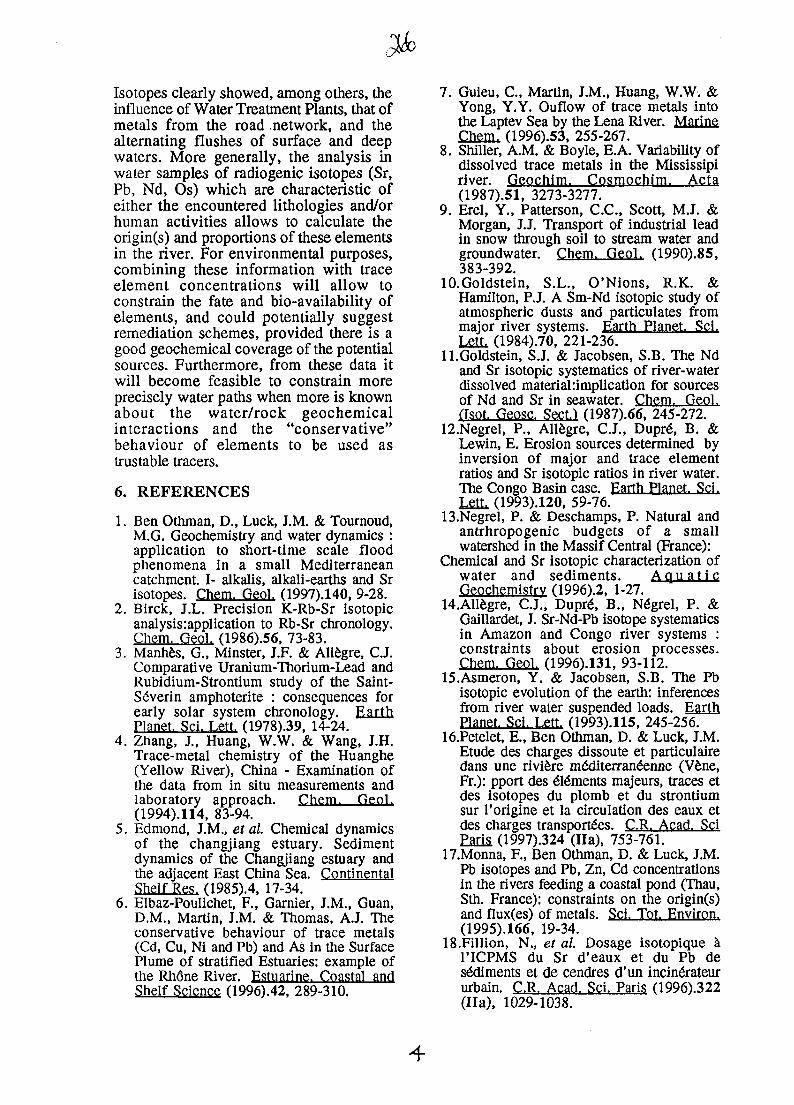
Isotopes clearly showed, among others, theinfluence of Water Treatment Plants, that ofmetals from the road network, and thealternating flushes of surface and deepwaters. More generally, the analysis inwater samples of radiogenic isotopes (Sr,Pb, Nd, Os) which are characteristic ofeither the encountered lithologies and/orhuman activities allows to calculate theorigin(s) and proportions of these elementsin the river. For environmental purposes,combining these information with traceelement concentrations will allow toconstrain the fate and bio-availability ofelements, and could potentially suggestremediation schemes, provided there is agood geochemical coverage of the potentialsources. Furthermore, from these data itwill become feasible to constrain moreprecisely water paths when more is knownabout the water/rock geochemicalinteractions and the "conservative"behaviour of elements to be used asunstable tracers.
6. REFERENCES
1. Ben Othman, D., Luck, J.M. & Tournoud,M.G. Geochemistry and water dynamics :application to short-time scale floodphenomena in a small Mediterraneancatchment. I- alkalis, alkali-earths and Srisotopes. Chem. Geol. (1997).14O, 9-28.
2. Birck, J.L. Precision K-Rb-Sr isotopicanalysis:application to Rb-Sr chronology.Chem. Geol. (1986).56, 73-83.
3. Manhes, G., Minster, J.F. & Allegre, CJ.Comparative Uranium-Thorium-Lead andRubidium-Strontium study of the Saint-S6verin amphoterite : consequences forearly solar system chronology. EarthPlanet. Sci. Lett. (1978).39, 14-24.
4. Zhang, J., Huang, W.W. & Wang, J.H.Trace-metal chemistry of the Huanghe(Yellow River), China - Examination ofthe data from in situ measurements andlaboratory approach. Chem. Geol.(1994).114, 83-94.
5. Edmond, J.M., et al. Chemical dynamicsof the changjiang estuary. Sedimentdynamics of the Changjiang estuary andthe adjacent East China Sea. ContinentalShelf Res. (1985).4, 17-34.
6. Elbaz-Poulichet, F., Gamier, J.M., Guan,D.M., Martin, J.M. & Thomas, AJ. Theconservative behaviour of trace metals(Cd, Cu, Ni and Pb) and As in the SurfacePlume of stratified Estuaries: example ofthe RhCne River. Estuarine. Coastal andShelf Science (1996).42, 289-310.
7. Guieu, C, Martin, J.M., Huang, W.W. &Yong, Y.Y. Ouflow of trace metals intothe Laptev Sea by the Lena River. MarineChem. (1996).53, 255-267.
8. Shiller, A.M. & Boyle, E.A. Variability ofdissolved trace metals in the Mississipiriver. Geochim. Cosmochim. Acta(1987).51, 3273-3277.
9. Erel, Y., Patterson, C.C., Scott, MJ. &Morgan, J.J. Transport of industrial leadin snow through soil to stream water andgroundwater. Chem. Geol. (1990).85,383-392.
lO.Goldstein, S.L., O'Nions, R.K. &Hamilton, PJ. A Sm-Nd isotopic study ofatmospheric dusts and particulates frommajor river systems. Earth Planet. Sci.Lett. (1984).7O, 221-236.
ll.Goldstein, SJ. & Jacobsen, S.B. The Ndand Sr isotopic systematics of river-waterdissolved material implication for sourcesof Nd and Sr in seawater. Chem. Geol.flsot. Geosc. Sect.) (1987).66, 245-272.
12.Negrel, P., Allegre, C.J., Dupre", B. &Lewin, E. Erosion sources determined byinversion of major and trace elementratios and Sr isotopic ratios in river water.The Congo Basin case. Earth Planet. Sci.Lett. (1993).12O, 59-76.
13.Negrel, P. & Deschamps, P. Natural andantrhropogenie budgets of a smallwatershed in the Massif Central (France):
Chemical and Sr isotopic characterization ofwater and sediments. A q u a t i cGeochemistry (1996).2, 1-27.
H.Allegre, C.J., Dupre", B.( Negrel, P. &Gaillardet, J. Sr-Nd-Pb isotope systematicsin Amazon and Congo river systems :constraints about erosion processes.Chem. Geol. (1996).131, 93-112.
15.Asmeron, Y. & Jacobsen, S.B. The Pbisotopic evolution of the earth: inferencesfrom river water suspended loads. EarthPlanet. Sci. Lett. (1993).115, 245-256.
16.Petelet, E., Ben Othman, D. & Luck, J.M.Etude des charges dissoute et particulairedans une riviere m6diterran6enne (Vene,Fr.): pport des elements majeurs, traces etdes isotopes du plomb et du strontiumsur l'origine et la circulation des eaux etdes charges transporters. C.R. Acad. SciParis (1997).324 (Ha), 753-761.
17.Monna, F., Ben Othman, D. & Luck, J.M.Pb isotopes and Pb, Zn, Cd concentrationsin the rivers feeding a coastal pond (Thau,Sth. France): constraints on the origin(s)and flux(es) of metals. Sci. Tot. Environ.(1995).166, 19-34.
18.Fillion, N., et al. Dosage isotopique al'ICPMS du Sr d'eaux et du Pb desediments et de cendres d'un incin6rateururbain. C.R. Acad. Sci. Paris (1996).322(Ila), 1029-1038.
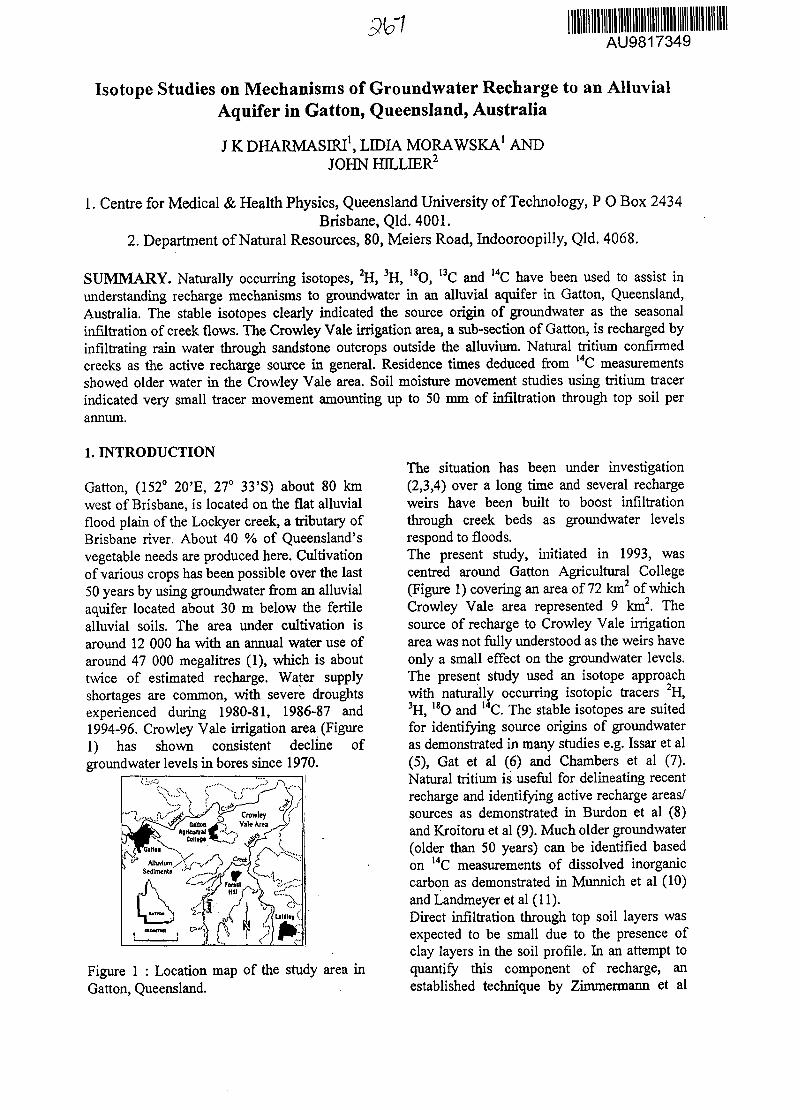
AU9817349
Isotope Studies on Mechanisms of Groundwater Recharge to an AlluvialAquifer in Gatton, Queensland, Australia
J K DHARMASIRI1, LEDIA MORAWSKA1 ANDJOHN HDLLffiR2
1. Centre for Medical & Health Physics, Queensland University of Technology, P O Box 2434Brisbane, Qld. 4001.
2. Department of Natural Resources, 80, Meiers Road, Indooroopilly, Qld. 4068.
SUMMARY. Naturally occurring isotopes, 2H, 3H, 18O, 13C and 14C have been used to assist inunderstanding recharge mechanisms to groundwater in an alluvial aquifer in Gatton, Queensland,Australia. The stable isotopes clearly indicated the source origin of groundwater as the seasonalinfiltration of creek flows. The Crowley Vale irrigation area, a sub-section of Gatton, is recharged byinfiltrating rain water through sandstone outcrops outside the alluvium. Natural tritium confirmedcreeks as the active recharge source in general. Residence times deduced from 14C measurementsshowed older water in the Crowley Vale area. Soil moisture movement studies using tritium tracerindicated very small tracer movement amounting up to 50 mm of infiltration through top soil perannum.
1. INTRODUCTION
Gatton, (152° 20'E, 27° 33'S) about 80 kmwest of Brisbane, is located on the flat alluvialflood plain of the Lockyer creek, a tributary ofBrisbane river. About 40 % of Queensland'svegetable needs are produced here. Cultivationof various crops has been possible over the last50 years by using groundwater from an alluvialaquifer located about 30 m below the fertilealluvial soils. The area under cultivation isaround 12 000 ha with an annual water use ofaround 47 000 megalitres (1), which is abouttwice of estimated recharge. Water supplyshortages are common, with severe droughtsexperienced during 1980-81, 1986-87 and1994-96. Crowley Vale irrigation area (Figure1) has shown consistent decline ofgroundwater levels in bores since 1970.
Figure 1 : Location map of the study area inGatton, Queensland.
The situation has been under investigation(2,3,4) over a long time and several rechargeweirs have been built to boost infiltrationthrough creek beds as groundwater levelsrespond to floods.The present study, initiated in 1993, wascentred around Gatton Agricultural College(Figure 1) covering an area of 72 km2 of whichCrowley Vale area represented 9 km2. Thesource of recharge to Crowley Vale irrigationarea was not fully understood as the weirs haveonly a small effect on the groundwater levels.The present study used an isotope approachwith naturally occurring isotopic tracers 2H,3H, 18O and 14C. The stable isotopes are suitedfor identifying source origins of groundwateras demonstrated in many studies e.g. Issar et al(5), Gat et al (6) and Chambers et al (7).Natural tritium is useful for delineating recentrecharge and identifying active recharge areas/sources as demonstrated in Burdon et al (8)and Kroitoru et al (9). Much older groundwater(older than 50 years) can be identified basedon UC measurements of dissolved inorganiccarbon as demonstrated in Munnich et al (10)and Landmeyer et al (11).Direct infiltration through top soil layers wasexpected to be small due to the presence ofclay layers in the soil profile. In an attempt toquantify this component of recharge, anestablished technique by Zimmermann et al
(12), Datta et al (13) and Dharmasiri et al (14),was used with tritium as a tracer to follow soilmoisture movement in the unsaturated soilzone for the first time in Australia.
2. EXPERIMENTAL METHODS
2.1 Stable Isotope Measurements
A total of 51 irrigating bores were sampledduring 1993-94 for stable isotopes within thestudy area. A submersible pump (5-cm-diameter) was used to pump out a minimum of3 times the volume of water in a bore and a 20ml water sample was collected from each borein a glass bottle with a good screw cap. Initial30 samples were analysed using massspectrometry at the Department of EarthScience of the University of Queensland. Thesubsequent measurements were carried out bythe Isotope Analytical Service of the Divisionof Water Resources, CSIRO, in Adelaide.A network of three rain water collectionstations was set up in 1993 at Brisbane, Gattonand Toowoomba. The first two stationsprovided rain water samples on a monthlybasis until 1996. The station at Toowoombahad to be discontinued in February 1995 due toinfrastructure changes. A total of 75 monthlystable isotope measurements were availablefrom this study. The Brisbane station was partof IAEA/WMO global network and a valuabledata base was available in Yurtsever et al (15)covering the period 1961-93. The present studyadded three more years to this data base.Since the initial collection of three surfacewater samples from Lockyer and Laidleycreeks in 1993, a long dry period prevailedwith no further stream flows until November1995. A total of 30 surface water samples havebeen measured for stable isotopes.To understand the stable isotope variation inthe short term, another set of 18 bores (fromthe initial 51) was sampled again .in 1994.A further 12 bores were sampled from outsidethe study area in sandstone outcrops to thenorth and south, Sandy creek area, sandstoneto the west of Gatton and a few basalt boresaround Toowoomba.
2.2 Natural Tritium
A total of 28 bores were sampled in November1993 for natural tritium measurements. One
litre of water was collected in a high densitypolyethylene bottle with a screw cap whichwas sealed in the field with paraffin wax.Groundwater samples were measured fornatural tritium at the Lucas Heights ResearchLaboratories (ANSTO) in Sydney usingelectrolytic enrichment followed by liquidscintillation analysis as explained in Calf et al(16). A second set of 17 bores was sampled inJuly-August 1994 to determine short termvariations. Nine out of the 12 groundwatersamples from outside the study area were alsomeasured for natural tritium.
2.3 UC Measurements
Those bores that did not contain measurablenatural tritium were sampled again for I4Cmeasurements at ANSTO by Accelerator MassSpectrometry. A total of 24 groundwatersamples were measured during 1994-95. Alitre of pumped groundwater in a high densitypolyethylene bottle from each bore was sent toANSTO for analysis.
2.4 Tritium Tracing Experiments
The technique of tritium tracing forunsaturated soil moisture studies has beenthoroughly covered' by Datta et al (13) andDharmasiri et al (14). Ten sites were selectedfor tritium tracer injection and two locationswere injected with tritium tracer at each site. Afive-point injection technique as explained inDharmasiri et al (14) was used and 0.74 MBqof tritium as tritiated water was injected ateach location hi April 1995. Once injected,tritiated water was distributed within ahorizontal soil layer of 0.5 m in diameter. Firstsoil sampling was carried out in April 1996.Soil samples were collected at 10-cm intervalsusing a mechanical auger. Two soil sampleswere sealed in bottles, one for soil moisturecontent and the other for tritium measurement.The soil moisture content was determined inthe laboratory gravimetrically.Soil moisture from soil samples were extractedby vacuum distillation at 120°C using anapparatus that can process 10 samples in onerun. Collected soil moisture (1 ml) was mixedwith a commercially available liquid scintillant(Ultima-Gold from Canberra-Packard, USA) ina glass bottle for analysis in Packard Tri-CarbMod. 2550 AB/TR Liquid Scintillation
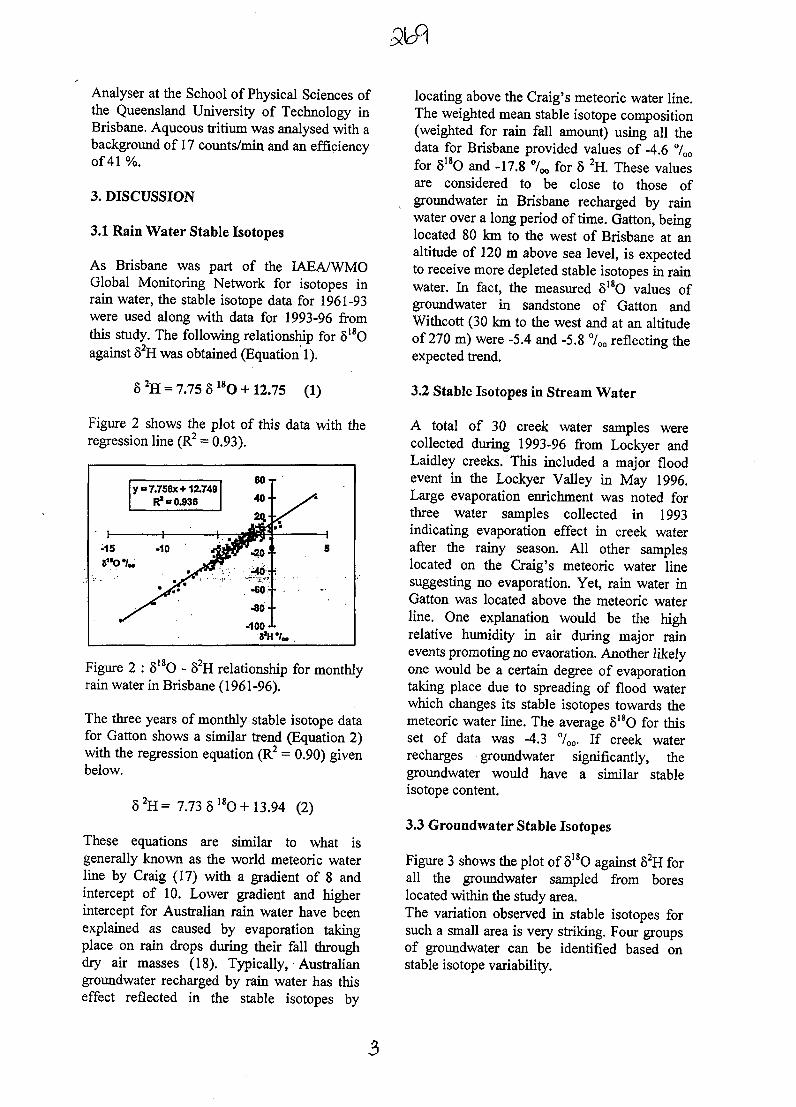
Analyser at the School of Physical Sciences ofthe Queensland University of Technology inBrisbane. Aqueous tritium was analysed with abackground of 17 counts/min and an efficiencyof 41 %.
3. DISCUSSION
3.1 Rain Water Stable Isotopes
As Brisbane was part of the IAEA/WMOGlobal Monitoring Network for isotopes inrain water, the stable isotope data for 1961-93were used along with data for 1993-96 fromthis study. The following relationship for 8l8Oagainst 82H was obtained (Equation 1).
8 2H = 7.75 S18O +12.75 (1)
Figure 2 shows the plot of this data with theregression line (R2 = 0.93).
Figure 2 : S18O - S H relationship for monthlyrain water in Brisbane (1961-96).
The three years of monthly stable isotope datafor Gatton shows a similar trend (Equation 2)with the regression equation (R2 = 0.90) givenbelow.
8 2H = 7.73 8 18O + 13.94 (2)
These equations are similar to what isgenerally known as the world meteoric waterline by Craig (17) with a gradient of 8 andintercept of 10. Lower gradient and higherintercept for Australian rain water have beenexplained as caused by evaporation takingplace on rain drops during their fall throughdry air masses (18). Typically, Australiangroundwater recharged by rain water has thiseffect reflected in the stable isotopes by
locating above the Craig's meteoric water line.The weighted mean stable isotope composition(weighted for rain fall amount) using all thedata for Brisbane provided values of -4.6 700
for S18O and -17.8 7 * for 8 2H. These valuesare considered to be close to those ofgroundwater in Brisbane recharged by rainwater over a long period of time. Gatton, beinglocated 80 km to the west of Brisbane at analtitude of 120 m above sea level, is expectedto receive more depleted stable isotopes in rainwater. In fact, the measured 818O values ofgroundwater in sandstone of Gatton andWithcott (30 km to the west and at an altitudeof 270 m) were -5.4 and -5.8 700 reflecting theexpected trend.
3.2 Stable Isotopes in Stream Water
A total of 30 creek water samples werecollected during 1993-96 from Lockyer andLaidley creeks. This included a major floodevent in the Lockyer Valley in May 1996.Large evaporation enrichment was noted forthree water samples collected in 1993indicating evaporation effect in creek waterafter the rainy season. All other sampleslocated on the Craig's meteoric water linesuggesting no evaporation. Yet, rain water inGatton was located above the meteoric waterline. One explanation would be the highrelative humidity in air during major rainevents promoting no evaoration. Another likelyone would be a certain degree of evaporationtaking place due to spreading of flood waterwhich changes its stable isotopes towards themeteoric water line. The average 818O for thisset of data was -4.3 700. If creek waterrecharges groundwater significantly, thegroundwater would have a similar stableisotope content.
3.3 Groundwater Stable Isotopes
Figure 3 shows the plot of 818O against 82H forall the groundwater sampled from boreslocated within the study area.The variation observed in stable isotopes forsuch a small area is very striking. Four groupsof groundwater can be identified based onstable isotope variability.
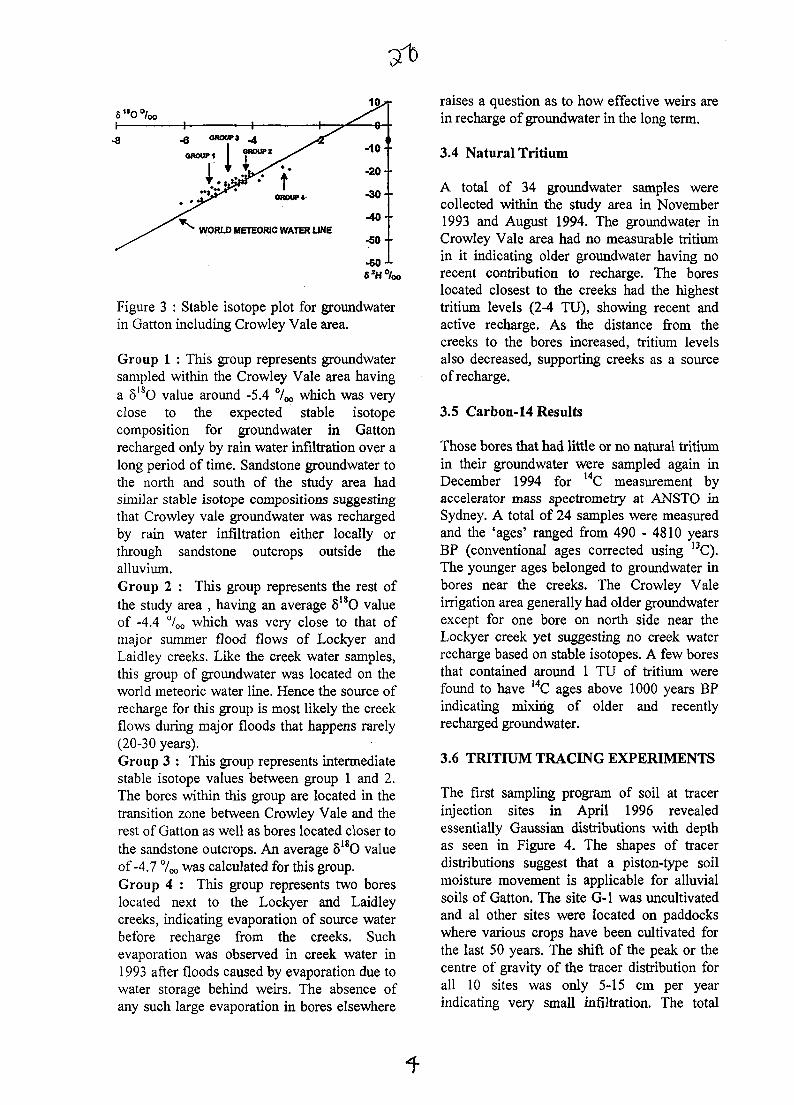
WORLD METEORIC WATER UNE
Figure 3 : Stable isotope plot for groundwaterin Gatton including Crowley Vale area.
Group 1 : This group represents groundwatersampled within the Crowley Vale area havinga 518O value around -5.4 °/oo which was veryclose to the expected stable isotopecomposition for groundwater in Gattonrecharged only by rain water infiltration over along period of time. Sandstone groundwater tothe north and south of the study area hadsimilar stable isotope compositions suggestingthat Crowley vale groundwater was rechargedby rain water infiltration either locally orthrough sandstone outcrops outside thealluvium.
Group 2 : This group represents the rest ofthe study area , having an average 8I8O valueof -4.4 700 which was very close to that ofmajor summer flood flows of Lockyer andLaidley creeks. Like the creek water samples,this group of groundwater was located on theworld meteoric water line. Hence the source ofrecharge for this group is most likely the creekflows during major floods that happens rarely(20-30 years).Group 3 : This group represents intermediatestable isotope values between group 1 and 2.The bores within this group are located in thetransition zone between Crowley Vale and therest of Gatton as well as bores located closer tothe sandstone outcrops. An average 818O valueof-4.7 700 was calculated for this group.Group 4 : This group represents two boreslocated next to the Lockyer and Laidleycreeks, indicating evaporation of source waterbefore recharge from the creeks. Suchevaporation was observed in creek water in1993 after floods caused by evaporation due towater storage behind weirs. The absence ofany such large evaporation in bores elsewhere
raises a question as to how effective weirs arein recharge of groundwater in the long term.
3.4 Natural Tritium
A total of 34 groundwater samples werecollected within the study area in November1993 and August 1994. The groundwater inCrowley Vale area had no measurable tritiumin it indicating older groundwater having norecent contribution to recharge. The boreslocated closest to the creeks had the highesttritium levels (2-4 TU), showing recent andactive recharge. As the distance from thecreeks to the bores increased, tritium levelsalso decreased, supporting creeks as a sourceof recharge.
3.5 Carbon-14 Results
Those bores that had little or no natural tritiumin their groundwater were sampled again inDecember 1994 for 14C measurement byaccelerator mass spectrometry at ANSTO inSydney. A total of 24 samples were measuredand the 'ages' ranged from 490 - 4810 yearsBP (conventional ages corrected using 13C).The younger ages belonged to groundwater inbores near the creeks. The Crowley Valeirrigation area generally had older groundwaterexcept for one bore on north side near theLockyer creek yet suggesting no creek waterrecharge based on stable isotopes. A few boresthat contained around 1 TU of tritium werefound to have MC ages above 1000 years BPindicating mixing of older and recentlyrecharged groundwater.
3.6 TRITIUM TRACING EXPERIMENTS
The first sampling program of soil at tracerinjection sites in April 1996 revealedessentially Gaussian distributions with depthas seen in Figure 4. The shapes of tracerdistributions suggest that a piston-type soilmoisture movement is applicable for alluvialsoils of Gatton. The site G-l was uncultivatedand al other sites were located on paddockswhere various crops have been cultivated forthe last 50 years. The shift of the peak or thecentre of gravity of the tracer distribution forall 10 sites was only 5-15 cm per yearindicating very small infiltration. The total
4. Zahawi, Z., 1975. Lockyer ValleyGroundwater Investigations - HydrogeologicalReport, Geological Survey of QueenslandRecord Series, 36.
5. Issar, A., Gat, J.R., Levin, M., 1980. The useof environmental isotopes for determining theregime of recharge, flow and discharge ofgroundwater in the arid regions of Sinai andIsrael, Arid Zone Hydrology, IAEA, Vienna, 3.
6. Gat, J.R., Tzur, Y., 1967. Modification ofthe isotopic composition of rain water byprocesses which occur before groundwaterrecharge, Isotopes in Hydrology, IAEA,Vienna, 49.
7. Chambers, L.A., Bartley, J.G., Herczeg,A.L., 1996. Hydrochemical evidence forsurface water recharge to a shallow regionalaquifer in northern Victoria, Australia, J.Hydrology, 181.63-83.
8. Burdon, D.J., Eriksson, E.,Papadimitropoulos, T., Papakis, N., Payne,B.R., 1963. The use of tritium in tracing karstgroundwater in Greece, Radioisotopes inHydrology, IAEA, Vienna, 309.
9. Kroitoru, L., Mazor, E., Issar, A., 1992.Flow regimes in Karstic systems : The JudeanAnticlinorium, Central Israel, InternationalContributions to Hvdrogeology. Vol. 13,Verlag Heinz Heise, Hannover, FRG, 339.
10. Munnich, K.O., Roether, W., Thilo, L.,1967. Dating of groundwater with tritium andC-14, Isotope Hydrology. IAEA. Vienna. 305-320.
11. Landmeyer, J.E., Stone, P.A., 1995.related to
mixing,Radiocarbon and 8 C valuesgroundwater recharge andGroundwater. 33, No. 2, 227-234.
12. Zimmermann, U., Kreutz, W., Schubach,K., Siegel, O., 1966. Tracers determinemovement of soil moisture andevapotranspiration, Science, 152, 346.
13. Datta, P.S., Goel, P.S., 1977. Groundwaterrecharge in Punjab State, India, using tritiumtracer, Nordic Hydrology, 8,225-236.
14. Dharmasiri, J.K., Dharmawardena, K.G.,Wijesinghe, M.W.P., Thiranagama, P., DEMel, I.D.T., Wickremarachchi, D.A., Goel,P.S., 1982. Infiltration rates of rainwaters inSri Lanka by using tritium tracer, NordicHydrology. 13,13-26.
15. Yurtsever, Y., Gat, J.R., 1981.Atmospheric waters, Chapter 6, Stable IsotopeHydrology. Technical Report Series No. 210,IAEA, Vienna, 103-142.
16. Calf, G.E., Seatonberry, B.W., Smith,L.W., 1976. The measurement of natural levelsof tritium in water, AAEC Report No. E373, 1-8.
17. Craig, H., 1961. Isotope variations inmeteoric waters. Science. 133,1702.
18. IAEA Technical Report Series No. 210,1981. Stable Isotope Hydrology, Chapter 6 -Meteoric Waters, IAEA, Vienna, 103-142.
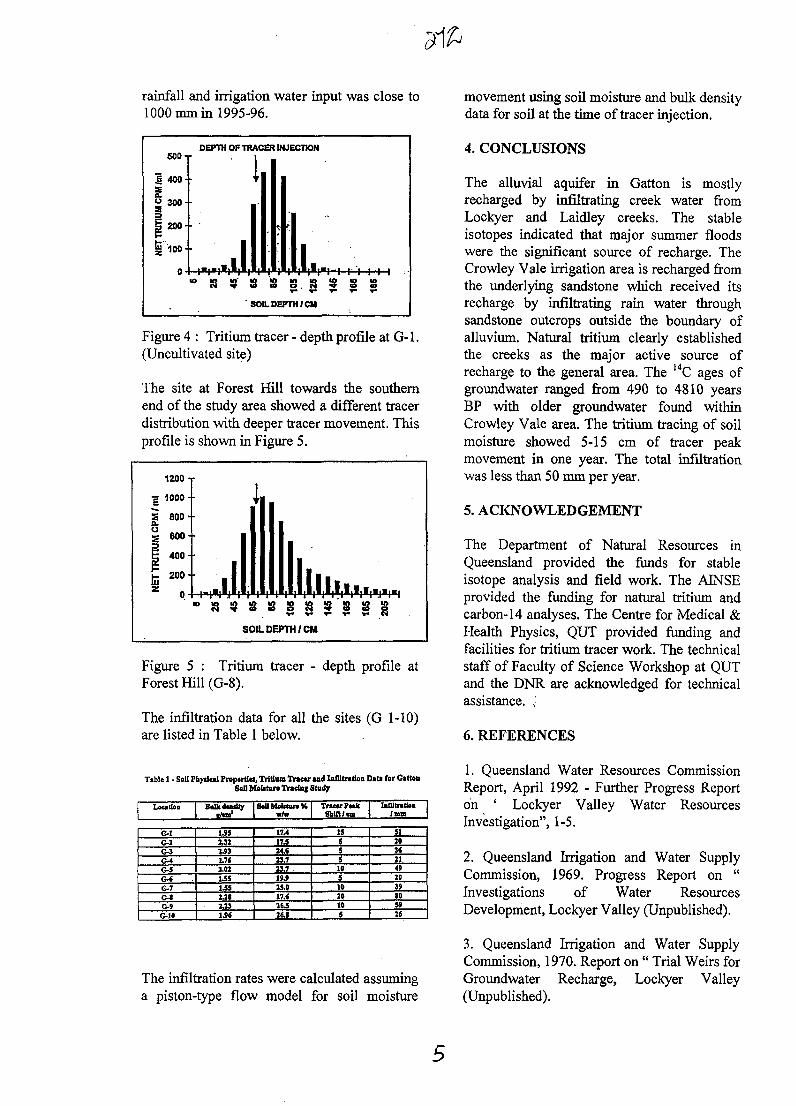
rainfall and irrigation water input was close to1000 mm in 1995-96.
5 0 0 - •
| 4 0 0 -
i0 300-
1 200 -
£> 1 0 0 - •
DEPTH OF TRACER INJECTION
l M l ' l " l - l I I I I I
SOIL DEPTH/CM
Figure 4 : Tritium tracer - depth profile at G-l.(Uncultivated site)
The site at Forest Hill towards the southernend of the study area showed a different tracerdistribution with deeper tracer movement. Thisprofile is shown in Figure 5.
1200 -
•g 1000-•
3 800 -
s 600 ••
| 400 ••
I- 200 - •
2 o4- ..•ll.l.l ' l
SOU.DEPTH/CM
Figure 5 : Tritium tracer - depth profile atForest Hill (G-8).
The infiltration data for all the sites (G 1-10)are listed in Table 1 below.
movement using soil moisture and bulk densitydata for soil at the time of tracer injection.
4. CONCLUSIONS
The alluvial aquifer in Gatton is mostlyrecharged by infiltrating creek water fromLockyer and Laidley creeks. The stableisotopes indicated that major summer floodswere the significant source of recharge. TheCrowley Vale irrigation area is recharged fromthe underlying sandstone which received itsrecharge by infiltrating rain water throughsandstone outcrops outside the boundary ofalluvium. Natural tritium clearly establishedthe creeks as the major active source ofrecharge to the general area. The 14C ages ofgroundwater ranged from 490 to 4810 yearsBP with older groundwater found withinCrowley Vale area. The tritium tracing of soilmoisture showed 5-15 cm of tracer peakmovement in one year. The total infiltrationwas less than 50 mm per year.
5. ACKNOWLEDGEMENT
The Department of Natural Resources inQueensland provided the funds for stableisotope analysis and field work. The AINSEprovided the funding for natural tritium andcarbon-14 analyses. The Centre for Medical &Health Physics, QUT provided funding andfacilities for tritium tracer work. The technicalstaff of Faculty of Science Workshop at QUTand the DNR are acknowledged for technicalassistance. <
6. REFERENCES
Tible 1 • SoU Phytical Properties, Tritium Tracer and Infiltration Data for GartenSoil Mofatnn Tracing Study
Location Balk deadlyl/em'
G-lG-IG-JG-4G-5G-«G-7G-SG-9G-10
U S131MJhit1.021.55USS« *M 31JK
SoUMobtureKwAr
17.417.5U.S13.713.7 .UJ>35.0J7.«lfcSl&l
Tracer Peak8Wft/«n
«$
s1051010105
IaSltretioa/mm
51103«"491039•05926
The infiltration rates were calculated assuminga piston-type flow model for soil moisture
1. Queensland Water Resources CommissionReport, April 1992 - Further Progress Reporton ' Lockyer Valley Water ResourcesInvestigation", 1-5.
2. Queensland Irrigation and Water SupplyCommission, 1969. Progress Report on "Investigations of Water ResourcesDevelopment, Lockyer Valley (Unpublished).
3. Queensland Irrigation and Water SupplyCommission, 1970. Report on " Trial Weirs forGroundwater Recharge, Lockyer Valley(Unpublished).
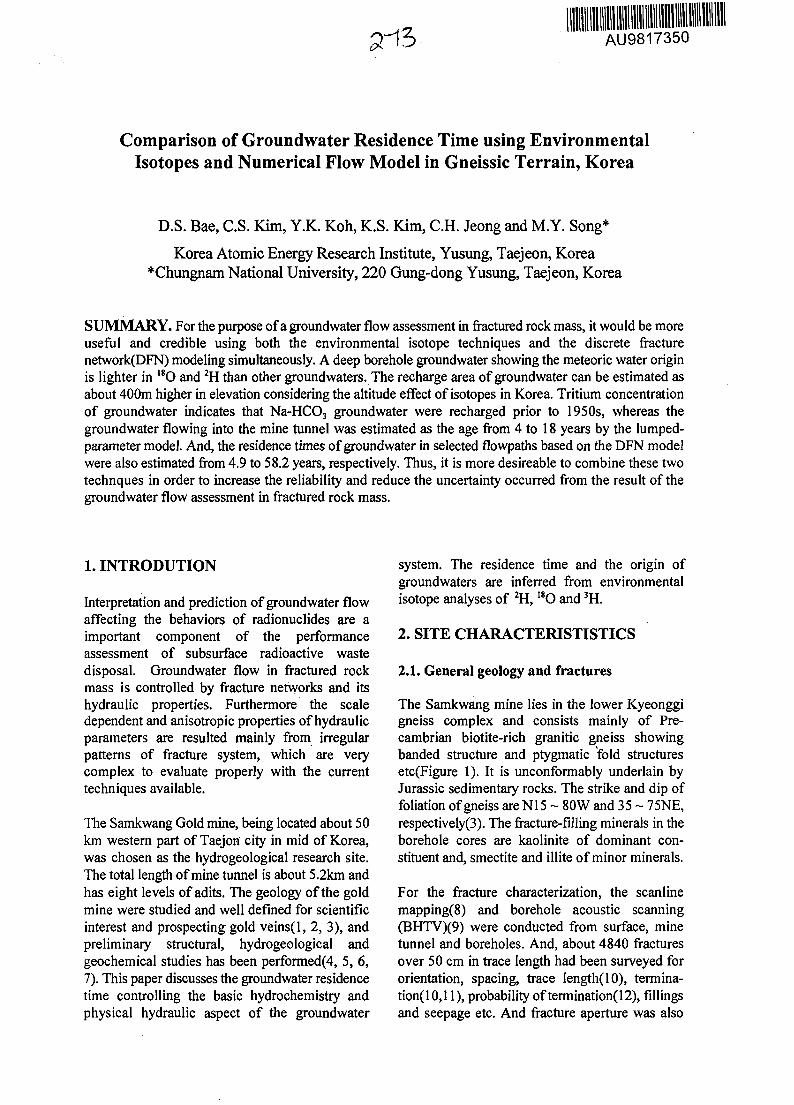
3-13- AU9817350
Comparison of Groundwater Residence Time using EnvironmentalIsotopes and Numerical Flow Model in Gneissic Terrain, Korea
D.S. Bae, C.S. Kim, Y.K. Koh, K.S. Kim, C.H. Jeong and M.Y. Song*
Korea Atomic Energy Research Institute, Yusung, Taejeon, Korea*Chungnam National University, 220 Gung-dong Yusung, Taejeon, Korea
SUMMARY. For the purpose of a groundwater flow assessment in fractured rock mass, it would be moreuseful and credible using both the environmental isotope techniques and the discrete fracturenetwork(DFN) modeling simultaneously. A deep borehole groundwater showing the meteoric water originis lighter in 18O and 2H than other groundwaters. The recharge area of groundwater can be estimated asabout 400m higher in elevation considering the altitude effect of isotopes in Korea. Tritium concentrationof groundwater indicates that Na-HCO3 groundwater were recharged prior to 1950s, whereas thegroundwater flowing into the mine tunnel was estimated as the age from 4 to 18 years by the lumped-parameter model. And, the residence times of groundwater in selected flowpaths based on the DFN modelwere also estimated from 4.9 to 58.2 years, respectively. Thus, it is more desireable to combine these twotechnques in order to increase the reliability and reduce the uncertainty occurred from the result of thegroundwater flow assessment in fractured rock mass.
1. INTRODUTION
Interpretation and prediction of groundwater flowaffecting the behaviors of radionuclides are aimportant component of the performanceassessment of subsurface radioactive wastedisposal. Groundwater flow in fractured rockmass is controlled by fracture networks and itshydraulic properties. Furthermore the scaledependent and anisotropic properties of hydraulicparameters are resulted mainly from irregularpatterns of fracture system, which are verycomplex to evaluate properly with the currenttechniques available.
The Samkwang Gold mine, being located about 50km western part of Taejofl city in mid of Korea,was chosen as the hydrogeological research site.The total length of mine tunnel is about 5.2km andhas eight levels of adits. The geology of the goldmine were studied and well defined for scientificinterest and prospecting gold veins(l, 2, 3), andpreliminary structural, hydrogeological andgeochemical studies has been performed(4, 5, 6,7). This paper discusses the groundwater residencetime controlling the basic hydrochemistry andphysical hydraulic aspect of the groundwater
system. The residence time and the origin ofgroundwaters are inferred from environmentalisotope analyses of 2H, 18O and 3H.
2. SITE CHARACTERISTISTICS
2.1. General geology and fractures
The Samkwang mine lies in the lower Kyeonggigneiss complex and consists mainly of Pre-cambrian biotite-rich granitic gneiss showingbanded structure and ptygmatic fold structuresetc(Figure 1). It is unconformably underlain byJurassic sedimentary rocks. The strike and dip offoliation of gneiss are N15 ~ 80W and 35 ~ 75NE,respectively(3). The fracture-filling minerals in theborehole cores are kaolinite of dominant con-stituent and, smectite and illite of minor minerals.
For the fracture characterization, the scanlinemapping(8) and borehole acoustic scanning(BHTV)(9) were conducted from surface, minetunnel and boreholes. And, about 4840 fracturesover 50 cm in trace length had been surveyed fororientation, spacing, trace length(10), termina-tion(10,l 1), probability of termination^ 2), fillingsand seepage etc. And fracture aperture was also
estimated by BHTV at boreholes(4,5,6). These allparameters had been processed according to thethree sets of fracture orientation defined as 130 ~200/40 ~ 90(set 1), 210-280/50~90(set 2) and010 ~ 060/60 ~ 90(set 3) in dip direction/dip(Figure 2; Table 1).
Table 1. Representative values of fracturedistribution characteristics by set.
orientation(mean)spacing(m)frequency
length(m)aperture(mm)
interconnectivity (Ii)terminationprobability(%)
164/600.82
1.222.97
5.52
6.82
21.22
IsewZsO!
044/66
0.89
1.122.16
4.495.44
26.3
283/082.960.34
3.194.79
2.22
9.88
2.2. Hydrogeology
The groundwater elevation measured from 8boreholes ranged from 4 to 5 m in below ground.And groundwater pressure was also confirmedfrom horizontal boreholes located portal in minetunnel level O(EL.2O8 m) through rainy and dryseasons. The boreholes had been installed 100 mlength perpendicular to the tunnel wall with singlepacker. The pressure head was stabilized within 10days and recorded as about 60 m in head.
The constant pressure injection test and flowdimensional analysis had been conducted(13, 14).The hydraulic conductivity estimated are ranged as1 x 10"8 ~ 3.6 x 10"6 m/s by transient flow analysismethod(13). It was characterized that the upperregime of 30 ~ 40 m from surface has thehydraulic conductivity ranging as 2x 10"6 ~ 3 x 10"6
m/s, significantly. In dimensional flow analysis, itwas analyzed nearly radial to spherical flow ingeneral. The sections of the assessed as sphericalflow regime could be characterized as the fracturesconsisted of high dip angle from BHTV.
3. ISOTOPE CHARCTERISTICS
3.1. Sampling and analytical techniques
Water sampling and in-situ measurement had beencarried out from 1990 to 1996. The samples of a
borehole groundwater and the inflowed waters intothe mine tunnel were collected(Figure 1). Ground-water samples from the borehole were sampled atdifferent levels of 145 and 175 m below surface.Determination of 518O and 6D in the watersamples was carried out using with the VG SIRAII mass spectrometer. The relative errors wewefound to be within ± 0.1 %o for I8O and 1.0 %o for2H. The tritium contents were measured by liquidscintillation counter from 600g to 20g and countedduring 500 minutes with the precision of ± ITU incommon after electrolytical enrichment.
3.2. Environmental Isotopes
The chemistry of the collected waters in the studyarea shows quite different type such as inflowedwaters of Ca-HCO3 type and Ca-SO4 type and aborehole groundwater of Na-HCO3 type(7). TheCa-SO4 type water are relatively higher in TDS(upto 760 mg It) than that of Ca-HCO3 type.
The isotopic composition of the waters in the studyarea have 518O and 6D values ranged from -9.5 to-8.7 %o and from -63.7 to -54.7 %o respectivel(Table 2), which are close to the Global MeteoricWater Line of Craig(15)(Figure 3). The 818Ovalues show that the groundwaters from boreholes-9.5 ~ -9.3 %o are lighter than the other waters.These light groundwater supposedly indicate thatthe groundwaters had been recharged from theupper zone about 400 m higher in elevation thanthat of the mine tunnel considering the altitudeeffect of isotope (0.19 %<, /100 m for 618O) inKorea(16). The isotopic composition of inflowedwater in deep leveljs of the mine(Ca-SO4 type)shows also the signature of recharged water fromhigher elevation than sampling points.
The tritium contents of inflowed water through thefracture zone of the horizontal mine tunnel hadbeen monitored in twelve times from 1990 to 1996at six sampling points(17). Tritium level indicatesthat the deep groundwater in the mine area can begrouped into older water recharged prior to 1950sand shallow groundwater recharged after 1950s.The tritium contents of mine tunnel show thetendency decreasing with time as 13.5 ~ 7.2 TU,17.6 ~ 9.1 TU and 10.7 ~ 8.4 TU at the samplingpoints of A, E and P-l, respectively(Table 3). Thevalues around point C analyzed 9.7 ~ 21.1 TU hadbeen ranged higher than any other places. How-ever, borehole groundwater and deep mine tunnellevel 6 show tritium free or low(l .0 ~ 2.4 TU) and
srts
predicted as the old water recharged prior 1950s.
Table 2. Stable isotopic data of water samplesfrom the Samkwang mine area (July, 1994).
imuniusS-l
S-2A
B
CDE
P-lG-1
G-2
pBHsurfacesurface
drift
driftdrift
driftdrift
driftborehole
borehole
HHi-8.9-8.8-8.7
-8.7
-8.7-8.8-8.7
-8.7-9.3
-9.5
HHKDwn
-55.9-54.2
-61.5
-55.8
-56.1-55.1-54.7
-55.3-61.7
-63.7
Wffrw180
180208
208
208
208208
20830
0
180180300
278
345
335375
385175
175
Table 3. Tritium contents(TU) of the groundwaterinflowing into the drift in the Samkwang minearea.
M90.6
91.5
7
92.4
7
g
94.7
9
10
95.8
9
96.2
8.8
13.5
13.0
11.2
12.8
11.3
7.5
7.7
8.7
7.2
8.3
9.1
10.2
11.9
11.4
12.4
10.6
-
8.3
8.7
8.8
8.5
7.4
8.1
19.6
21.1
19.3
19.1
17.1
19.2
15.1
14.5
14.1
9.7
11.9
12.7
MmHHHHlimMlilH
--
7.9
10.8
9.3
9.4
8.4
7.7
7.9
8.3
10.11 - 1 - 1 - 1 - 1 -13.6
15.1
17.6
12.4
13.8
-
10.2
9.7
9.5
9.2
9.1
-
-
-
-
-
-
-
-
10.7
8.4
-
-
-
-
-
2.4
-
-
-
-
-
-
-
-
-
2.0
-
-
-
-
-
-
-
-
-
1.0
-
-
-
-
-
-
-
-
-
1.0
-
-
-
-
3.2. Residence time using tritium
Direct age estimation of groundwater using tritiumis difficult due to the variable input of tritium andmixing behavior since the advent of thermonucleartesting in 1952. Supposed to match the tritiumcontent at sampling points with that of the re-charge at the inlet of a groundwater system, thedistribution of residence time of each contributioncan be estimated. The data of tritium contents areapplied by the lumped-parameter model(MULTIS)(18) combined with the piston flow(PM)(19), the exponential (EM)(20) and dis-persion concept (DM)(21). By this model, thetritium contents of the precipitation monitored
monthly in Korea (1963 to 1976, 1982 to 1995)and Japan (1977 to 1981) were used as inputparameter for dating of ground-water(22).Meanwhile, DM had not been considered due tothe lack of existing parameters or in-situ testresults.
The groundwater age estimated at point A is to 4years, while the water at the point C is dated to 18years(Table4; Figure 4b). Although the distancefrom surface to the point C is rather shorter thanothers, surface to point C shows the long pathwayof groundwater flow or hydrological mixing ofcurrently recharged water. The residence time ofpoints B, D and E is estimated in the range of 6.5to 8.5 years. The phenomenon of piston flowaround point A, D, E and P-l would be moredominant than mixing phenomenon (Table 4;Figure 5a and c).
Table 4. Results of dating modeling of thegroundwater inflowing into the drift in theSamkwang mine area(EL.2O8, tunnel).
Residence time(year)
Piston flow (%)
Mixing flow(%)
EL.(surface)
4.0
67
33
300
8.0
20
80
278
18.0
50
50
345
6.5
67
35
335
8.5
60
40
375
8.5
82
18
385
4. GROUNWATER FLOW BY DFNCONCEPT
The FracMari(Version 2.306) for fracture networkand MAFIC(12) were used for assessment ofgroundwater flow. The concept of this modeling isforward approach method for natural condition ofsite specific characteristics through iterativeexecution. This model has been qualified ascredible by the final assessment of validity onfracture flow modeling by the task force ofOECD/NEA[23]. DFN models provide a meansof explicitly representing flow path geometries insuch case. In DFN model, the processes of flowand transport are assumed to take place primarilyor entirely through networks of discretefractures[26]. Thus, groundwater flow and solutetransport in DFN are expected to occur mainlythrough networks of interconnected fractures. '
4.1. DFN modeling
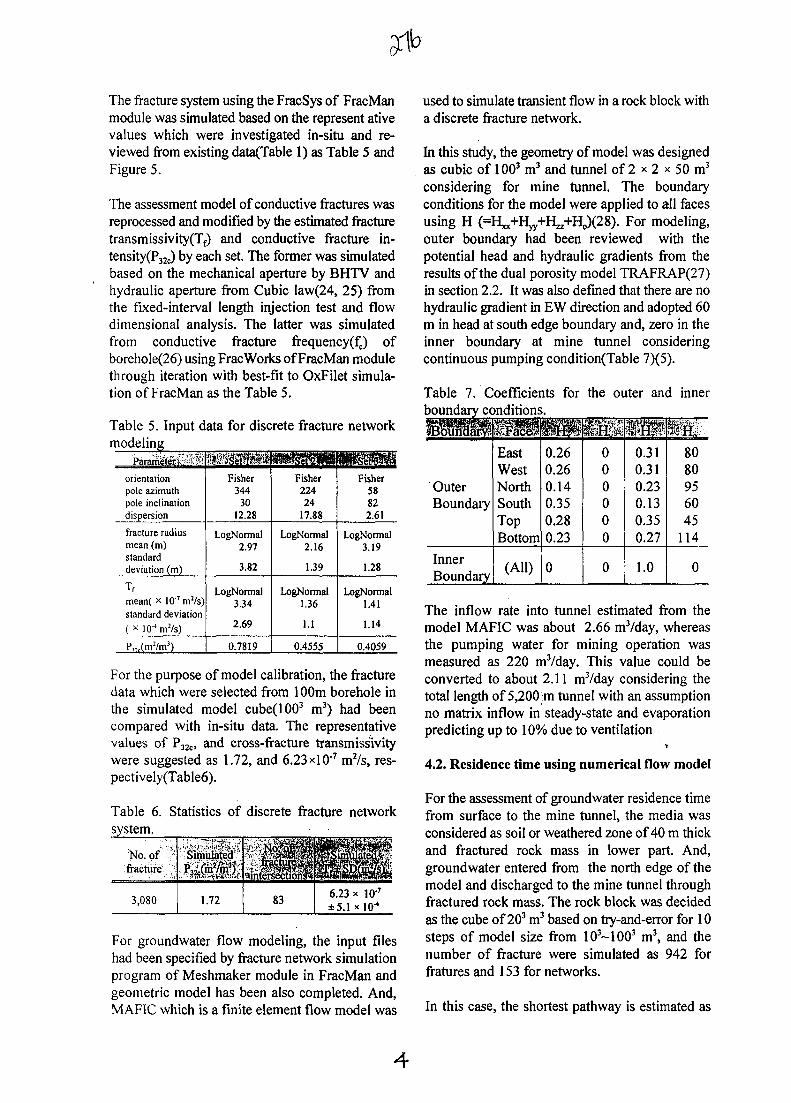
The fracture system using the FracSys of FracManmodule was simulated based on the represent ativevalues which were investigated in-situ and re-viewed from existing data(Table 1) as Table 5 andFigure 5.
The assessment model of conductive fractures wasreprocessed and modified by the estimated fracturetransmissivity(Tf) and conductive fracture in-tensity(P32c) by each set. The former was simulatedbased on the mechanical aperture by BHTV andhydraulic aperture from Cubic law(24, 25) fromthe fixed-interval length injection test and flowdimensional analysis. The latter was simulatedfrom conductive fracture frequency(fc) ofborehole(26) using Frac Works of FracMan modulethrough iteration with best-fit to OxFilet simula-tion of FracMan as the Table 5.
Table 5. Input data for discrete fracture networkmodeling
Paramietto*!8orientationpole azimuthpole inclinationdispersion
fracture radiusmean (m)standarddeviation (m)
Tf
mean( x 107mVs)standard deviation( x KT'mVs)
P,,r(m2/m3)
Fisher344
3012.28
LogNormal2.97
3.82
LogNormal3.34
2.69
0.7819
Fisher22424
17.88
LogNormal2.16
1.39
LogNormal1.36
1.1
0.4555
KIMFisher
58822.61
LogNormal3.19
1.28
LogNormal1.41
1.14
0.4059
For the purpose of model calibration, the fracturedata which were selected from 100m borehole inthe simulated model cube(1003 m3) had beencompared with in-situ data. The representativevalues of P32c, and cross-fracture transmissivitywere suggested as 1.72, and 6.23xlO'7 m2/s, res-pectively(Table6).
Table 6.system
No. offracture
3,080
Statistics of
Simulated
1.72
discrete
83
fracture network
111ii mm6.23 x 10-7
±5.1 xio-4
For groundwater flow modeling, the input fileshad been specified by fracture network simulationprogram of Meshmaker module in FracMan andgeometric model has been also completed. And,MAFIC which is a finite element flow model was
used to simulate transient flow in a rock block witha discrete fracture network.
In this study, the geometry of model was designedas cubic of 1003 m3 and tunnel of 2 * 2 x 50 m3
considering for mine tunnel. The boundaryconditions for the model were applied to all facesusing H (=HXX+Hyy+Hzz+Ho)(28). For modeling,outer boundary had been reviewed with thepotential head and hydraulic gradients from theresults of the dual porosity model TRAFRAP(27)in section 2.2. It was also defined that there are nohydraulic gradient in EW direction and adopted 60m in head at south edge boundary and, zero in theinner boundary at mine tunnel consideringcontinuous pumping condition(Table 7)(5).
Table 7. Coefficients for the outer and innerboundary conditions. _^__
OuterBoundary
InnerBoundary
EastWestNorthSouthTopBottom
(AH)
0.260.260.140.350.280.23
0
000000
0.310.310.230.130.350.27
1.0
8080956045
114
0
The inflow rate into tunnel estimated from themodel MAFIC was about 2.66 mVday, whereasthe pumping water for mining operation wasmeasured as 220 m3/day. This value could beconverted to about 2.11 mVday considering thetotal length of 5,200 m tunnel with an assumptionno matrix inflow in steady-state and evaporationpredicting up to 10% due to ventilation
4.2. Residence time using numerical flow model
For the assessment of groundwater residence timefrom surface to the mine tunnel, the media wasconsidered as soil or weathered zone of 40 m thickand fractured rock mass in lower part. And,groundwater entered from the north edge of themodel and discharged to the mine tunnel throughfractured rock mass. The rock block was decidedas the cube of 203 m3 based on try-and-error for 10steps of model size from 103~1003 m3, and thenumber of fracture were simulated as 942 forfratures and 153 for networks.
In this case, the shortest pathway is estimated as
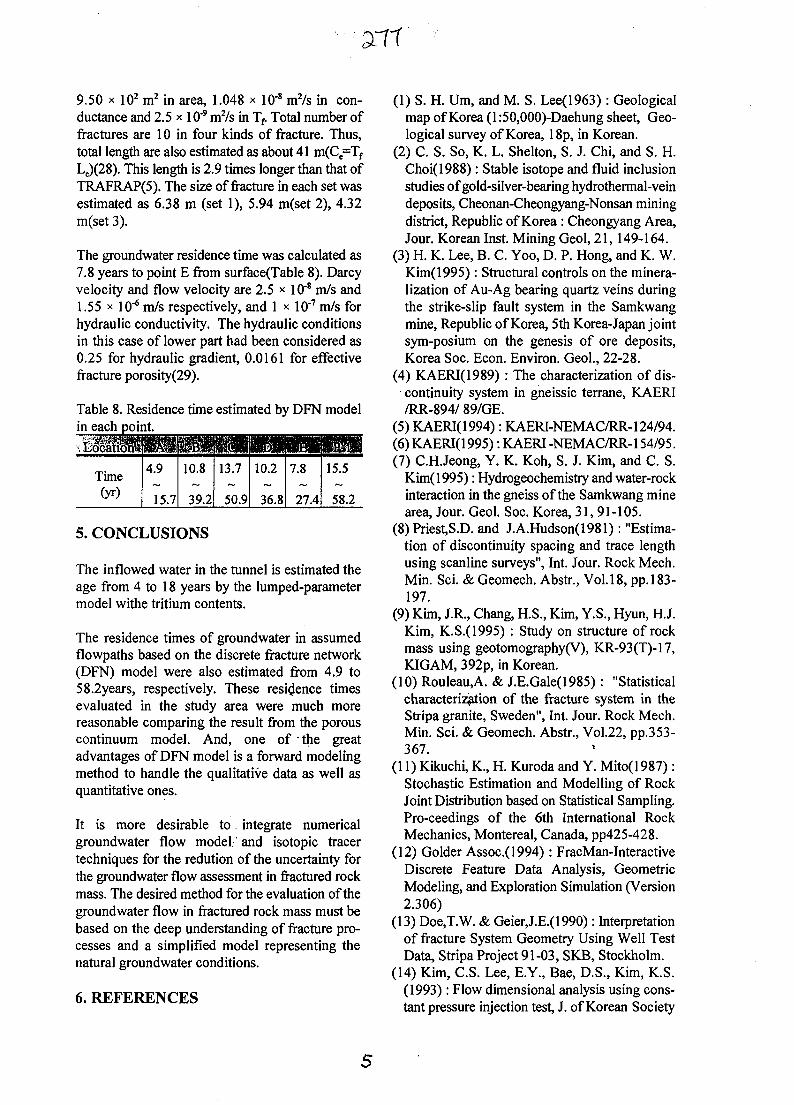
9.50 x 10² m2 in area, 1.048 * 108 m2/s in con-ductance and 2.5 x 10'9 m2/s in Tf Total number offractures are 10 in four kinds of fracture. Thus,total length are also estimated as about 41 m(Ce=Tf
Le)(28). This length is 2.9 times longer than that ofTRAFRAP(5). The size of fracture in each set wasestimated as 6.38 m (set 1), 5.94 m(set 2), 4.32m(set 3).
The groundwater residence time was calculated as7.8 years to point E from surface(Table 8). Darcyvelocity and flow velocity are 2.5 * 10"8 m/s and1.55 x 10"6 m/s respectively, and 1 x 10'7 m/s forhydraulic conductivity. The hydraulic conditionsin this case of lower part had been considered as0.25 for hydraulic gradient, 0.0161 for effectivefracture porosity(29).
Table 8. Residence timein each point.
•jgnmTime(yr)
ill4.9
15.7
in10.8
39.2
estimated by DFN
Wmwmm
50.9
.0.2
36.8
ml7.8
27.4
model
tup58.2
5. CONCLUSIONS
The inflowed water in the tunnel is estimated theage from 4 to 18 years by the lumped-parametermodel withe tritium contents.
The residence times of groundwater in assumedflowpaths based on the discrete fracture network(DFN) model were also estimated from 4.9 to58.2years, respectively. These residence timesevaluated in the study area were much morereasonable comparing the result from the porouscontinuum model. And, one of" the greatadvantages of DFN model is a forward modelingmethod to handle the qualitative data as well asquantitative ones.
It is more desirable to . integrate numericalgroundwater flow model and isotopic tracertechniques for the redution of the uncertainty forthe groundwater flow assessment in fractured rockmass. The desired method for the evaluation of thegroundwater flow in fractured rock mass must bebased on the deep understanding of fracture pro-cesses and a simplified model representing thenatural groundwater conditions.
6. REFERENCES
(1) S. H. Urn, and M. S. Lee(1963): Geologicalmap of Korea (1:50,000)-Daehung sheet, Geo-logical survey of Korea, 18p, in Korean.
(2) C. S. So, K. L. Shelton, S. J. Chi, and S. H.Choi(1988) : Stable isotope and fluid inclusionstudies of gold-silver-bearing hydrothermal-veindeposits, Cheonan-Cheongyang-Nonsan miningdistrict, Republic of Korea : Cheongyang Area,Jour. Korean Inst. Mining Geol, 21,149-164.
(3) H. K. Lee, B. C. Yoo, D. P. Hong, and K. W.Kim(1995) : Structural controls on the minera-lization of Au-Ag bearing quartz veins duringthe strike-slip fault system in the Samkwangmine, Republic of Korea, 5th Korea-Japan jointsym-posium on the genesis of ore deposits,Korea Soc. Econ. Environ. Geol., 22-28.
(4) KAERI(1989) : The characterization of dis-continuity system in gneissic terrane, KAERI/RR-894/ 89/GE.
(5) KAERI(1994): KAERI-NEMAC/RR-124/94.(6) KAERI(1995): KAERI -NEMAC/RR-154/95.(7) C.HJeong, Y. K. Koh, S. J. Kim, and C. S.
Kim(1995): Hydrogeochemistry and water-rockinteraction in the gneiss of the Samkwang minearea, Jour. Geol. Soc. Korea, 31, 91-105.
(8) Priest,S.D. and J.A.Hudson(1981): "Estima-tion of discontinuity spacing and trace lengthusing scanline surveys", Int. Jour. Rock Mech.Min. Sci. & Geomech. Abstr., Vol.18, pp. 183-197.
(9) Kim, J.R., Chang, H.S., Kim, Y.S., Hyun, H.J.Kim, K.S.(1995) : Study on structure of rockmass using geotomography(V), KR-93(T)-17,KIGAM, 392p, in Korean.
(10) Rouleau,A. & J.E.Gale(1985) : "Statisticalcharacterization of the fracture system in theStripa granite, Sweden", Int. Jour. Rock Mech.Min. Sci. & Geomech. Abstr., Vol.22, pp.353-367.
(11) Kikuchi, K., H. Kuroda and Y. Mito(1987):Stochastic Estimation and Modelling of RockJoint Distribution based on Statistical Sampling.Pro-ceedings of the 6th International RockMechanics, Montereal, Canada, pp425-428.
(12) Golder Assoc.(1994): FracMan-InteractiveDiscrete Feature Data Analysis, GeometricModeling, and Exploration Simulation (Version2.306)
(13) Doe,T.W. & Geier,J.E.(1990): Interpretationof fracture System Geometry Using Well TestData, Stripa Project 91-03, SKB, Stockholm.
(14) Kim, C.S. Lee, E.Y., Bae, D.S., Kim, K.S.(1993) : Flow dimensional analysis using cons-tant pressure injection test, J. of Korean Society
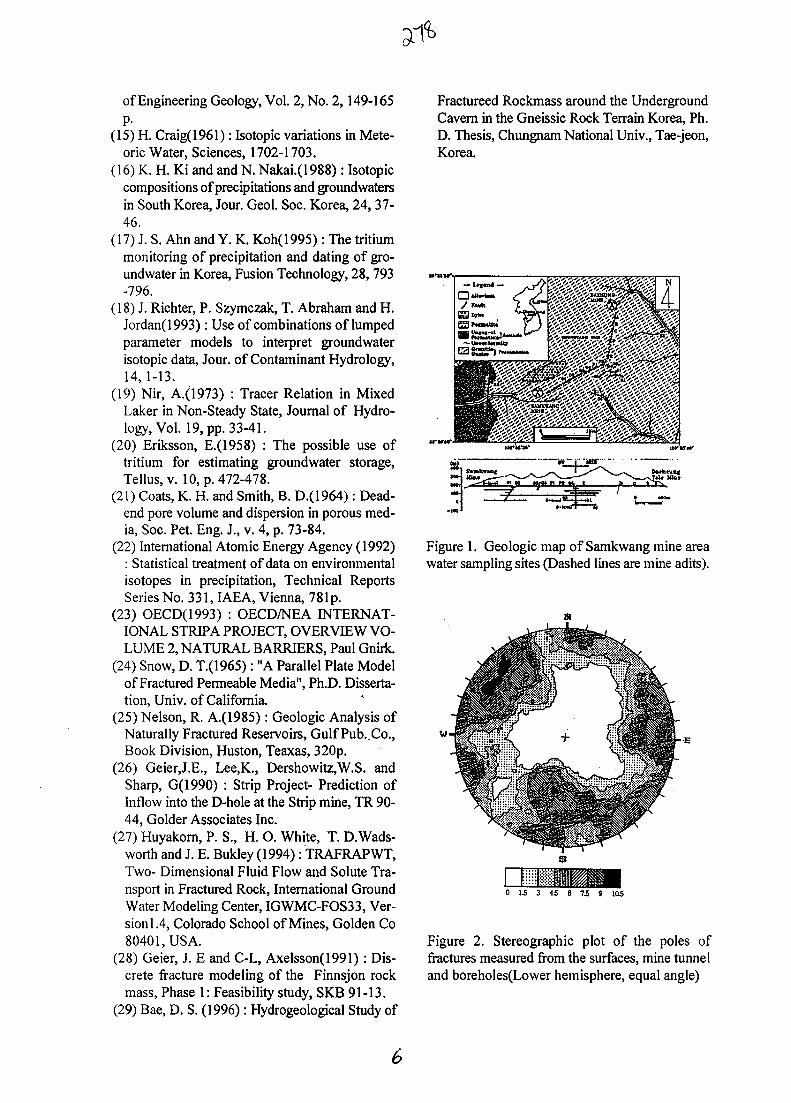
of Engineering Geology, Vol. 2, No. 2,149-165
P-(15) H. Craig(1961): Isotopic variations in Mete-
oric Water, Sciences, 1702-1703.(16) K. H. Ki and and N. Nakai.(1988): Isotopic
compositions of precipitations and groundwatersin South Korea, Jour. Geol. Soc. Korea, 24, 37-46.
(17) J. S. Ahn and Y. K. Koh(1995) : The tritiummonitoring of precipitation and dating of gro-undwater in Korea, Fusion Technology, 28, 793-796.
(18) J. Richter, P. Szymczak, T. Abraham and H.Jordan(1993) : Use of combinations of lumpedparameter models to interpret groundwaterisotopic data, Jour, of Contaminant Hydrology,14, 1-13.
(19) Nir, A.(1973) : Tracer Relation in MixedLaker in Non-Steady State, Journal of Hydro-logy, Vol. 19, pp. 33-41.
(20) Eriksson, E.(1958) : The possible use oftritium for estimating groundwater storage,Tellus,v. 10, p. 472-478.
(21) Coats, K. H. and Smith, B. D.(1964): Dead-end pore volume and dispersion in porous med-ia, Soc. Pet. Eng. J., v. 4, p. 73-84.
(22) International Atomic Energy Agency (1992): Statistical treatment of data on environmentalisotopes in precipitation, Technical ReportsSeries No. 331, IAEA, Vienna, 781p.
(23) OECD(1993) : OECD/NEA INTERNAT-IONAL STRIPA PROJECT, OVERVIEW VO-LUME 2, NATURAL BARRIERS, Paul Gnirk.
(24) Snow, D. T.(1965): "A Parallel Plate Modelof Fractured Permeable Media", Ph.D. Disserta-tion, Univ. of California.
(25) Nelson, R. A.(1985) : Geologic Analysis ofNaturally Fractured Reservoirs, Gulf Pub.. Co.,Book Division, Huston, Teaxas, 320p.
(26) Geier,J.E., Lee,K., Dershowitz,W.S. andSharp, G(1990) : Strip Project- Prediction ofInflow into the D-hole at the Strip mine, TR 90-44, Golder Associates Inc.
(27) Huyakorn, P. S., H. O. White, T. D.Wads-worth and J. E. Bukley (1994) : TRAFRAPWT,Two- Dimensional Fluid Flow and Solute Tra-nsport in Fractured Rock, International GroundWater Modeling Center, IGWMC-FOS33, Ver-sion 1.4, Colorado School of Mines, Golden Co80401, USA.
(28) Geier, J. E and C-L, Axelsson(1991): Dis-crete fracture modeling of the Finnsjon rockmass, Phase 1: Feasibility study, SKB 91-13.
(29) Bae, D. S. (1996): Hydrogeological Study of
Fractureed Rockmass around the UndergroundCavern in the Gneissic Rock Terrain Korea, Ph.D. Thesis, Chungnam National Univ., Tae-jeon,Korea.
Figure 1. Geologic map of Samkwang mine areawater sampling sites (Dashed lines are mine adits).
45 6 75 9 105
Figure 2. Stereographic plot of the poles offractures measured from the surfaces, mine tunneland boreholes(Lower hemisphere, equal angle)
6
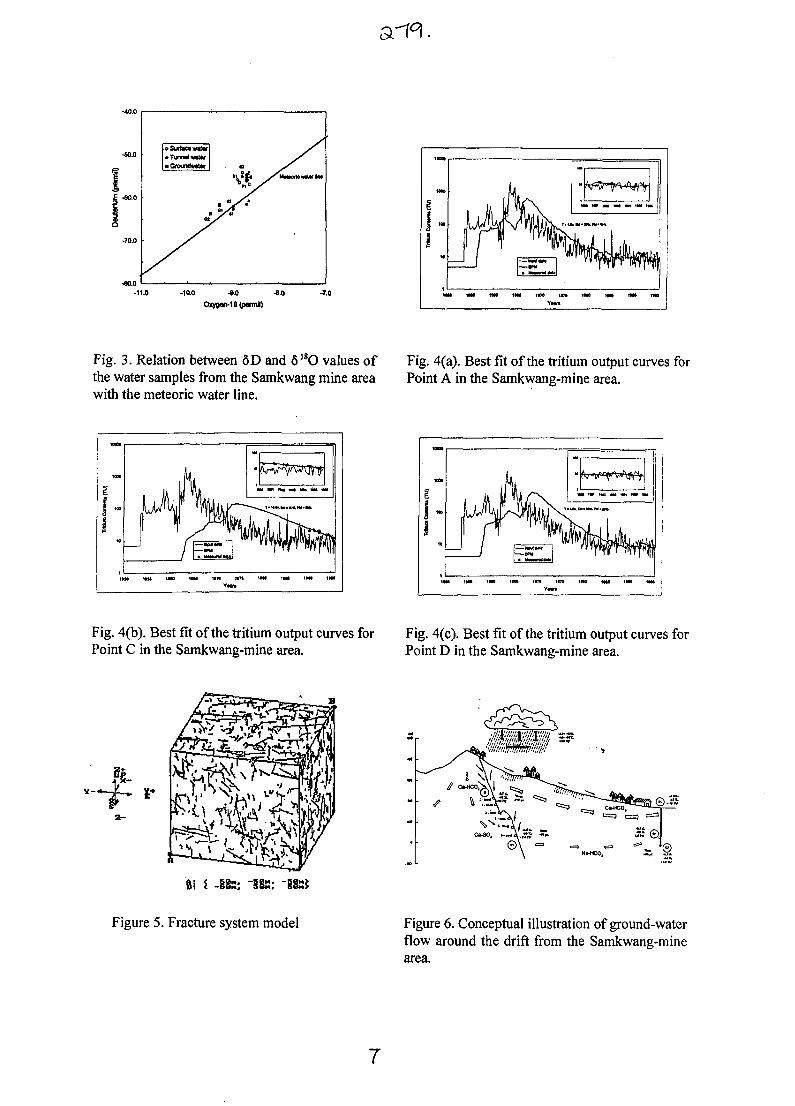
oSur fa»w* t *• TunrwIwatAr• GroundwsUr
M
y
-11.0 -100 «0 •*•» -7.0
Oxy9«v18(perml)
nIM
-
MlW MM (HI m* MM IM» l«M
1IM 1WS IM1 itTO
Fig. 3. Relation between 5D and 618O values ofthe water samples from the Samkwang mine areawith the meteoric water line.
Fig. 4(a). Best fit of the tritium output curves forPoint A in the Samkwang-mine area.
Fig. 4(b). Best fit of the tritium output curves forPoint C in the Samkwang-mine area.
Fig. 4(c). Best fit of the tritium output curves forPoint D in the Samkwang-mine area.
g-
l\ I -185: "385: -382J
Figure 5. Fracture system model Figure 6. Conceptual illustration of ground-waterflow around the drift from the Samkwang-minearea.
7
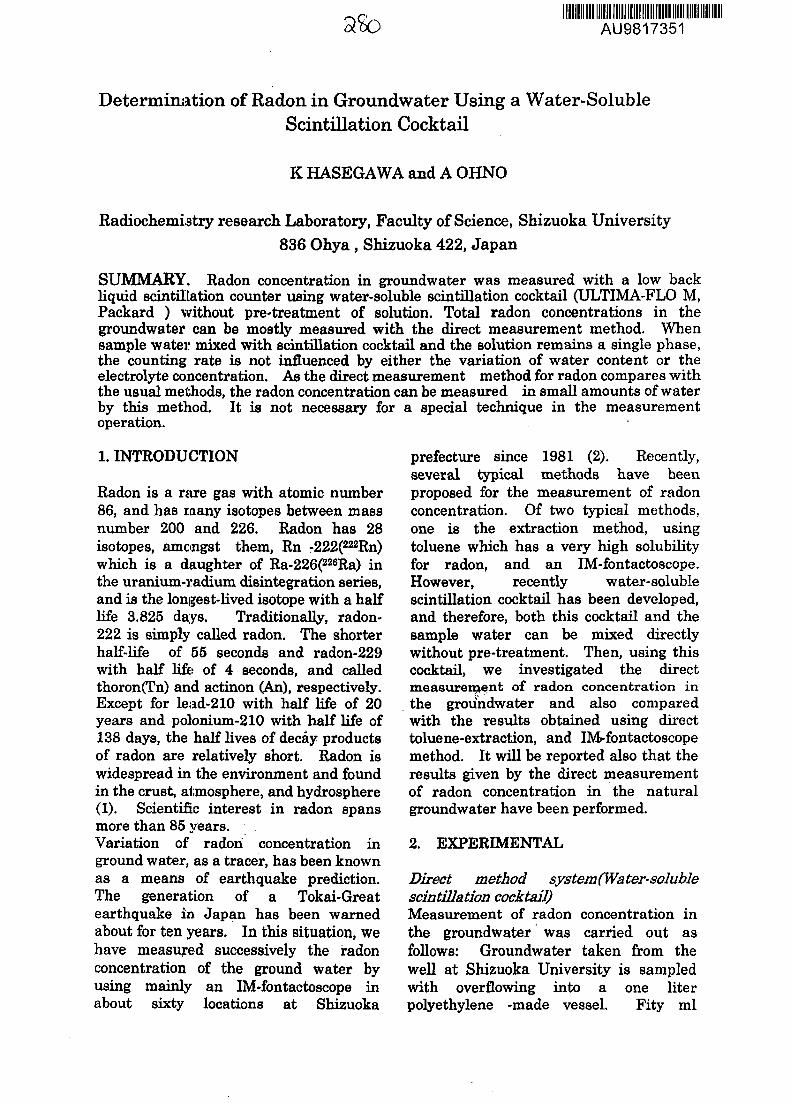
afc AU9817351
Determination of Radon in Groundwater Using a Water-SolubleScintillation Cocktail
K HASEGAWA and A OHNO
Radiochemistry research Laboratory, Faculty of Science, Shizuoka University836 Ohya, Shizuoka 422, Japan
SUMMARY. Radon concentration in groundwater was measured with a low backliquid scintillation counter using water-soluble scintillation cocktail (ULTIMA-FLO M,Packard ) without pre-treatment of solution. Total radon concentrations in thegroundwater can be mostly measured with the direct measurement method. Whensample water mixed with scintillation cocktail and the solution remains a single phase,the counting rate is not influenced by either the variation of water content or theelectrolyte concentration. As the direct measurement method for radon compares withthe usual methods, the radon concentration can be measured in small amounts of waterby this method. It is not necessary for a special technique in the measurementoperation.
1. INTRODUCTION
Radon is a rare gas with atomic number86, and has many isotopes between massnumber 200 and 226. Radon has 28isotopes, amongst them, Rn -222(222Rn)which is a daughter of Ra-226(226Ra) inthe uranium-radium disintegration series,and is the longest-lived isotope with a halflife 3.825 days. Traditionally, radon-222 is simply called radon. The shorterhalf-Ufe of 55 seconds and radon-229with half life; of 4 seconds, and calledthoron(Tn) and actinon (An), respectively.Except for lead-210 with hah' life of 20years and polonium-210 with half life of138 days, the half lives of decay productsof radon are relatively short. Radon iswidespread in the environment and foundin the crust, atmosphere, and hydrosphere(1). Scientific interest in radon spansmore than 85 years.Variation of radon concentration inground water, as a tracer, has been knownas a means of earthquake prediction.The generation of a Tokai-Greatearthquake in Japan has been warnedabout for ten years. In this situation, wehave measured successively the radonconcentration of the ground water byusing mainly an IM-fontactoscope inabout sixty locations at Shizuoka
prefecture since 1981 (2). Recently,several typical methods have beenproposed for the measurement of radonconcentration. Of two typical methods,one is the extraction method, usingtoluene which has a very high solubilityfor radon, and an IM-fontactoscope.However, recently water-solublescintillation cocktail has been developed,and therefore, both this cocktail and thesample water can be mixed directlywithout pre-treatment. Then, using thiscocktail, we investigated the directmeasurement of radon concentration inthe groundwater and also comparedwith the results obtained using directtoluene-extraction, and IM>-fontactoscopemethod. It will be reported also that theresults given by the direct measurementof radon concentration in the naturalgroundwater have been performed.
2. EXPERIMENTAL
Direct method system(Water-solublescintillation cocktail)Measurement of radon concentration inthe groundwater was carried out asfollows: Groundwater taken from thewell at Shizuoka University is sampledwith overflowing into a one literpolyethylene -made vessel. Fity ml
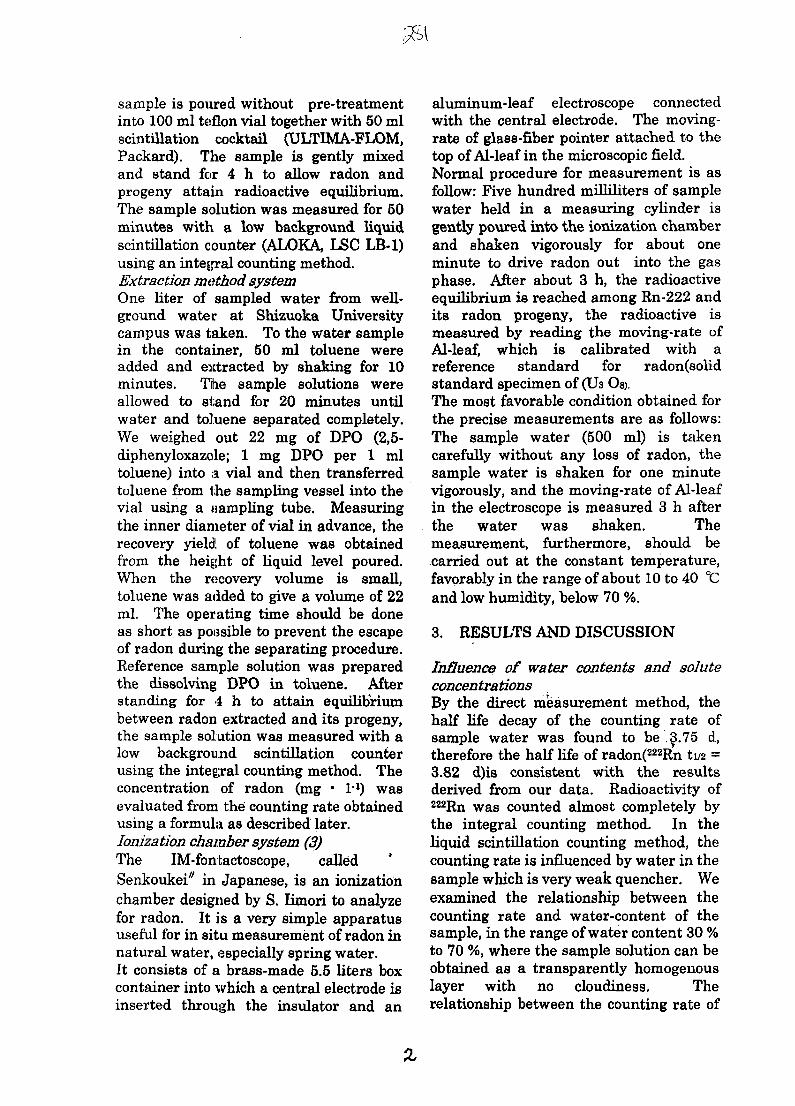
sample is poured without pre-treatmentinto 100 ml teflon vial together with 50 mlscintillation cocktail (ULTIMA-FLOM,Packard). The sample is gently mixedand stand for 4 h to allow radon andprogeny attain radioactive equilibrium.The sample solution was measured for 50minutes with a low background liquidscintillation counter (ALOKA, LSC LB-1)using an integral counting method.Extraction method systemOne liter of sampled water from well-ground water at Shizuoka Universitycampus was taken. To the water samplein the container, 50 ml toluene wereadded and extracted by shaking for 10minutes. The sample solutions wereallowed to stand for 20 minutes untilwater and toluene separated completely.We weighed out 22 mg of DPO (2,5-diphenyloxazole; 1 mg DPO per 1 mltoluene) into a vial and then transferredtoluene from the sampling vessel into thevial using a sampling tube. Measuringthe inner diameter of vial in advance, therecovery yield of toluene was obtainedfrom the height of liquid level poured.When the recovery volume is small,toluene was added to give a volume of 22ml. The operating time should be doneas short as possible to prevent the escapeof radon during the separating procedure.Reference sample solution was preparedthe dissolving DPO in toluene. Afterstanding for 4 h to attain equilibriumbetween radon extracted and its progeny,the sample solution was measured with alow background scintillation counterusing the integral counting method. Theconcentration of radon (mg • T1) wasevaluated from the counting rate obtainedusing a formula as described later.Ionization chamber system (3)The IM-fontactoscope, calledSenkoukei;/ in Japanese, is an ionizationchamber designed by S. Iimori to analyzefor radon. It is a very simple apparatususeful for in situ measurement of radon innatural water, especially spring water.It consists of a brass-made 5.5 liters boxcontainer into which a central electrode isinserted through the insulator and an
aluminum-leaf electroscope connectedwith the central electrode. The moving-rate of glass-fiber pointer attached to thetop of Al-leaf in the microscopic field.Normal procedure for measurement is asfollow: Five hundred milliliters of samplewater held in a measuring cylinder isgently poured into the ionization chamberand shaken vigorously for about oneminute to drive radon out into the gasphase. After about 3 h, the radioactiveequilibrium is reached among Rn-222 andits radon progeny, the radioactive ismeasured by reading the moving-rate ofAl-leaf, which is calibrated with areference standard for radon(solidstandard specimen of (U3 Os).The most favorable condition obtained forthe precise measurements are as follows:The sample water (500 ml) is takencarefully without any loss of radon, thesample water is shaken for one minutevigorously, and the moving-rate of Al-leafin the electroscope is measured 3 h afterthe water was shaken. Themeasurement, furthermore, should becarried out at the constant temperature,favorably in the range of about 10 to 40 °Cand low humidity, below 70 %.
3. RESULTS AND DISCUSSION
Influence of water contents and soluteconcentrations3y the direct measurement method, thehalf life decay of the counting rate ofsample water was found to be .£.75 d,therefore the half life of radon(222Rn ti/2 =3.82 d)is consistent with the resultsderived from our data. Radioactivity of222Rn was counted almost completely bythe integral counting method. In theliquid scintillation counting method, thecounting rate is influenced by water in thesample which is very weak quencher. Weexamined the relationship between thecounting rate and water-content of thesample, in the range of water content 30 %to 70 %, where the sample solution can beobtained as a transparently homogenouslayer with no cloudiness. Therelationship between the counting rate of
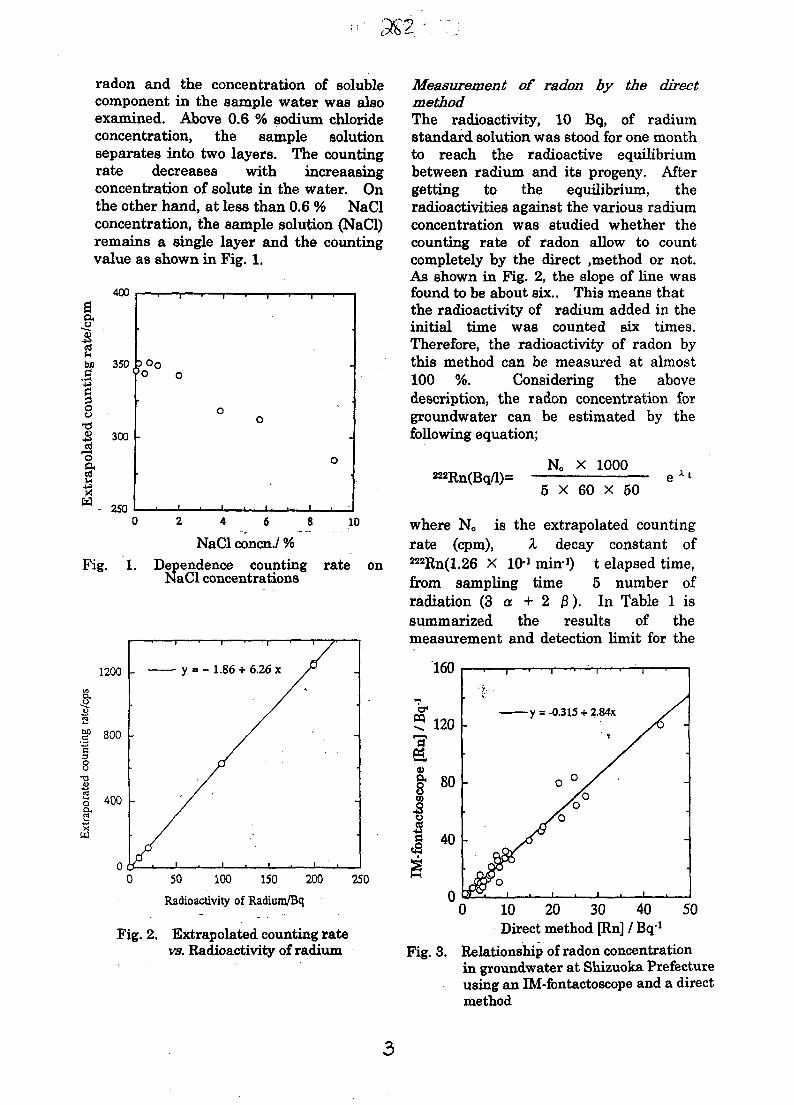
radon and the concentration of solublecomponent in the sample water was alsoexamined. Above 0.6 % sodium chlorideconcentration, the sample solutionseparates into two layers. The countingrate decreases with increaasingconcentration of solute in the water. Onthe other hand, at less than 0.6 % NaClconcentration, the sample solution (NaCl)remains a single layer and the countingvalue as shown in Fig. 1.
NaCl concn./ %Fig. 1. Dependence counting
NaCl concentrationsrate on
50 100 150 200
Radioactivity of Radium/Bq
250
Fig. 2. Extrapolated counting ratevs. Radioactivity of radium
Measurement of radon by the directmethodThe radioactivity, 10 Bq, of radiumstandard solution was stood for one monthto reach the radioactive equilibriumbetween radium and its progeny. Aftergetting to the equilibrium, theradioactivities against the various radiumconcentration was studied whether thecounting rate of radon allow to countcompletely by the direct .method or not.As shown in Fig. 2, the slope of line wasfound to be about six.. This means thatthe radioactivity of radium added in theinitial time was counted six times.Therefore, the radioactivity of radon bythis method can be measured at almost100 %. Considering the abovedescription, the radon concentration forgroundwater can be estimated by thefollowing equation;
222Rn(BqA)=No X 1000
5 X 60 X 50
where No is the extrapolated countingrate (cpm), X decay constant of222Rn(1.26 X l0-» min1) t elapsed time,from sampling time 5 number ofradiation (3 a + 2 jS). In Table 1 issummarized the results of themeasurement and detection limit for the
10 20 30 40Direct method [Rn] / Bq1
50
Fig. 3. Relationship of radon concentrationin groundwater at Shizuoka Prefectureusing an IM-fontactoscope and a directmethod
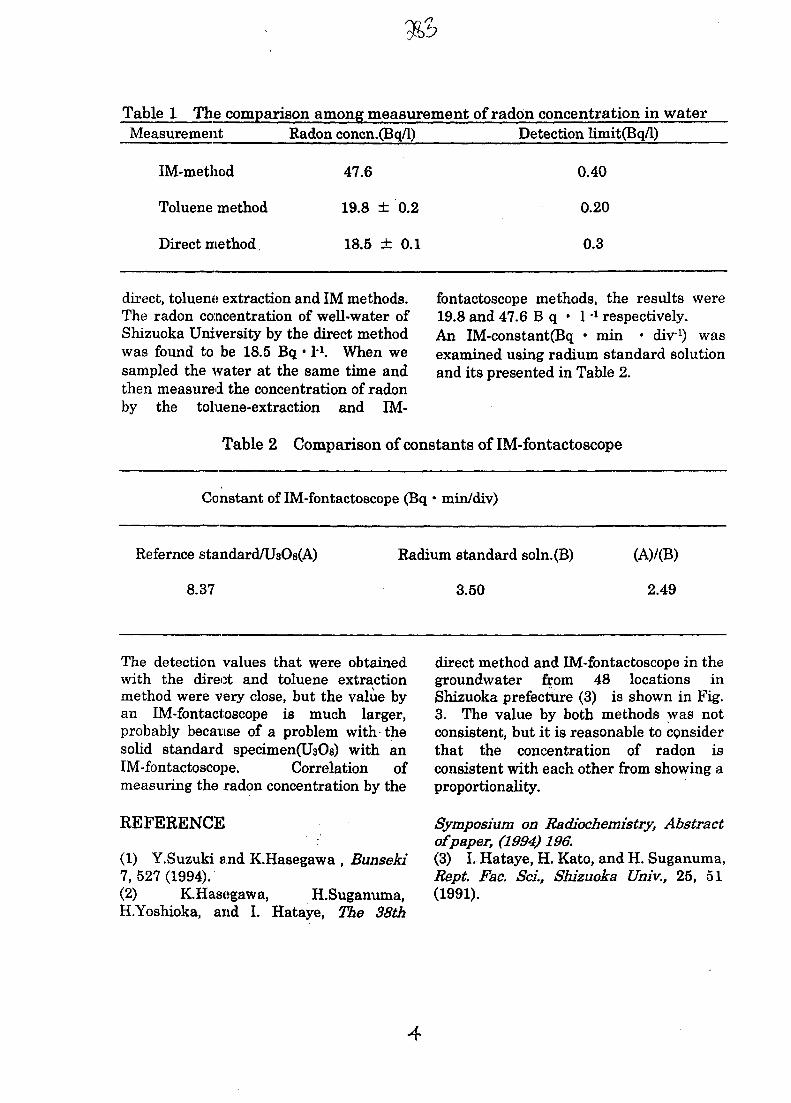
Table 1 The comparison among measurement of radon concentration in waterMeasurement Radon concn.(Bq/l) Detection limit(Bq/l)
0.40
0.20
0.3
IM-method
Toluene method
Direct method
47.6
19.8
18.5
±
±
0.2
0.1
direct, toluene extraction and IM methods.The radon concentration of well-water ofShizuoka University by the direct methodwas found to be 18.5 Bq • I1. When wesampled the water at the same time andthen measured the concentration of radonby the toluene-extraction and IM-
fontactoscope methods, the results were19.8 and 47.6 B q • 1 -1 respectively.An IM-constant(Bq • min • div1) wasexamined using radium standard solutionand its presented in Table 2.
Table 2 Comparison of constants of IM-fontactoscope
Constant of IM-fontactoscope (Bq • min/div)
Refernce standard/U3Os(A)
8.37
Radium standard soln.(B)
3.50 2.49
The detection values that were obtainedwith the direct and toluene extractionmethod were very close, but the value byan IM-fontactoscope is much larger,probably becavise of a problem with thesolid standard specimenCUaOs) with anIM-fontactoscope. Correlation ofmeasuring the radon concentration by the
REFERENCE
(1) Y.Suzuki and KHasegawa , Bunseki7,527(1994).(2) KHasegawa, H.Suganuma,H.Yoshioka, and I. Hataye, The 38th
direct method and IM-fontactoscope in thegroundwater from 48 locations inShizuoka prefecture (3) is shown in Fig.3. The value by both methods was notconsistent, but it is reasonable to considerthat the concentration of radon isconsistent with each other from showing aproportionality.
Symposium on Radiochemistry, Abstractof paper, (1994) 196.(3) I. Hataye, H. Kato, and H. Suganuma,Eept. Fac. ScL, Shizuoka Univ., 25, 51(1991).
AU9817352
Determination of Iodine in Biological Materials usingInstrumental Neutron Activation and Anti-coincidence
Gamma-ray Spectrometry
W ZHANG and A CHATTTrace Analysis Research Centre, Department of Chemistry
Dalhousie University, Halifax, Nova Scotia, B3H 4J3, Canada
SUMMARY. An epithermal instrumental neutron activation analysis (EINAA) method in conjunction withanticoincidence gamma-ray spectrometry has been developed for the determination of ppb levels of iodine inbiological materials, foods and diets in particular. Several reference materials have been analyzed to evaluate theprecision and accuracy of measurements. The detection limit for iodine can be improved by a factor of 2 to 5depending on the sample matrix, and other factors. The detection limit of 5 ppb can be achieved for low-saltfoods.
1. INTRODUCTION
Iodine is an element of much interest in nutritionalresearch. The dairy dietary safe and adequate intakerange of iodine for adults is reported to be 150-200ug. Iodine deficiency is considered to be a seriousproblem in many countries. Excessive iodine intakecan also contribute to certain thyroid disorders insusceptible individuals. In many countriesregulations require the control of the level of dailyiodine intake through diet. The accuratedetermination of iodine in materials such as dietsand individual food items is of considerable interest:The analytical techniques most commonly employedfor measuring iodine levels are colorimetry, ionselective electrode, isotope exchange, gaschromatography, and neutron activation analysis(NAA).
The NAA technique has excellent intrinsicsensitivity for the measurement of iodine. Iodinehas been determined by instrumental NAA (INAA)in many biological materials. Compared to someother medium-lived nuclides such as 52V, 27Mg and^ u , 128I has a slightly longer half-life of 25.0 min,and thus the stable isotope 127I needs a longerirradiation time to reach saturation activity.
However, the irradiation time is limited because ofinterferences from the high activities of thermalneutron activation products of the major elements inthe sample. Low levels of iodine cannot be easilymeasured by thermal INAA.
hi order to circumvent this problem, epithermalINAA (EINAA) has been used by a few researcherswith some success. The EINAA methods are basedon the fact that the resonance integral cross sectionfor iodine is much larger (147 b) than that for someof the interfering elements such as Na, Cl, Al, andMn (0.3lf 0.21, 0.17, 14 b, respectively).Background activities can be reduced to some extentby EINAA. The use of cadmium and/or boronshields to absorb thermal neutrons in EINAA allowsfor increased irradiation time. But the residualactivity produced in the cadmium shield, forexample, may cause a radiation safety and heatingproblem. These factors can limit the irradiationtime, the removal of the sample from the shieldwithin a reasonably short time, and the reuse of theshield for subsequent irradiations. Much of thisproblem can be eliminated by irradiating samples ina cadmium- or boron-lined pneumatic site.Although a cadmium-lined site is available at theDalhousie University SLOWPOKE-2 Reactor
(DUSR) facility, not many reactors are fitted withthis type of site. The EINAA detection limit foriodine can be as low as 200 ppb, depending on theneutron flux used. Detection limits can be furtherimproved by increasing the sample mass, irradiatingfor a longer period, and by counting the samples ina more sensitive detector. However, the backgroundin the region of the 443 keV photopeak of 128I isoften dominated by Compton scattering from thegamma-rays of 24Na, 56Mn, 82Br, and 38C1, so thedetection limits are often not that greatly improved.
Radiochemical NAA (RNAA) and preconcentrationNAA (PNAA) methods have been used to eliminateinterfering elements as well as to further suppressbackground and improve the sensitivity ofmeasurement. Both PNAA and RNAA aredestructive methods, involve complicatedoperations, and are time consuming compared to
INAA. Moreover, in PNAA precautions must betaken to ensure minimal contamination fromreagents and handling.
We have developed several NAA methods in ourlaboratory for the determination of iodine in anumber of materials for various purposes. Thesemethods include (1-4) epithermal instrumental NAA(EINAA) using cadmium and boron shields,preconcentration NAA (PNAA) using bismuthsulfide coprecipitation, PNAA using solventextraction, and radiochemical NAA (RNAA) usingpalladium chloride in conjunction with conventionalgamma-ray spectrometry.
A
Anticoincidence counting as a backgroundsuppression technique can be used in conjunctionwith EINAA to further reduce the background. Thisapproach can have the advantage of simplicity; itcan be less time consuming and free from reagentblanks, and can lower.the detection limit evenfurther. For this reason, an EINAA method usinganticoincidence counting has been developed in thepresent study for the determination of low levels ofiodine.
2. EXPERIMENTAL
The anticoincidence spectrometer used in this workconsists of a 25% relative efficiency HPGe detectorsurrounded by a 10" x 10" Nal(Tl) annulus and a 3"
x 3" NaI(Tl) plug as well as timing electronics. Thissystem has a peak-to-Compton ratio of about 650 to1 for the 661.6-keV photopeak of 137Cs. Animprovement factor of 7 can be achieved comparedto a single HPGe detector. Several factors that caninfluence efficiency of the methodology have beenevaluated. The distance of the sample from theHPGe detector surface and the relative position ofthe Nal(Tl) annulus with respect to the HPGedetector have been investigated to obtain the bestefficiency (5).
In the present study, an EINAA method inconjunction with anti-coincidence counting has beendeveloped for the determination of ppb levels ofiodine in individual food items. Typically 200-700mg of a sample are irradiated for 10 or 20 min at theDUSR facility in an epithermal flux of 1 x 10n n cnv2 s'1, followed by 1 min decay and then counting for30 min. The 442.9-keV gamma-ray of 128I is usedfor measuring iodine content by anticoincidencecounting. A sensitivity of 4536 counts per ug ofiodine was obtained using 20 min irradiations. Aninternal quality assessment chart was constructed byirradiating iodine comparator standards with everybatch of samples; all results were found to be within±2o.
In order to evaluate the applicability of the EINAAmethod in conjunction with anticoincidence gamma-ray spectrometry to a wide variety of biologicalmaterials, several reference materials containingvarious levels of iodine and background interferingelements were chosen. Materials such as NISTCorn Bran, Corn Starch, Wheat Gluten, Soft WheatFlour, Hard Wheat Flour, Durum Wheat Flour, RiceFlour, and Peach Leaves contained low levels ofinterfering elements such as CI and Na,* and gavelow induced activities on neutron irradiation. Theywere irradiated for 20 min, allowed to decay for 1min, and counted for 20 min. Reference materialssuch as NIST Whole Egg Powder, Non-Fat MilkPowder, Bovine Liver, Spinach, and Pine Needles,and IAEA Horse Kidney, Animal Muscle andAnimal Blood contained high levels of Cl and Na.These samples were originally irradiated for 20 minand allowed to decay for 1 min before counting.These conditions gave high activities and dead-timeof greater than 10% which could introduce errorsunless appropriate corrections are made. The dead-
time was reduced to about 5% to 8% employing 10-min irradiations and 1-min decays which were thenroutinely used for measuring iodine in the abovematerials.
3. RESULTS AND DISCUSSION
The reference materials used in this work cover awide range of iodine concentrations as shown inTable 1. Precision of the EINAA-anticoincidencemethod was checked by triplicate analysis. It wasfound that the RSD was about ±5% above 200 ppb,increasing to ±10% at 20 ppb and then to >±30% atabout 5 ppb iodine level. The results aresummarized in Table 1 along with the certifiedvalues and current literature data. The analyticaluncertainty reported with each value is ±lo.
Among the 17 reference materials analyzed here,only 6 have certified iodine values. The resultsobtained in this work for four of these materials arein good agreement with the certified values. Valuesfor the other two, namely NIST Whole Egg Powderand Non-Fat Milk Powder, agree better with theliterature values than with the certified values. Theiodine levels of NIST Hard Wheat Flour, DurumWheat Flour, Corn Bran, Wheat Gluten, Spinach,Whole Egg Powder, and Non-Fat Milk Powder wereearlier measured by a PNAA method (2), andgenerally agree well with the values obtained in thiswork. Three of these materials were also analyzedby RNAA. The certified iodine content of NISTPine Needles agrees with the values obtained hereby EINAA but without Compton suppression.There are no data available for the other materials.A comparison of the measured vs. literature and/orcertified values reveals that the EINAA method inconjunction with anticoincidence counting canproduce reliable values.
The peak efficiency reduction factor (PERF) of the442.9-keV peak of 128I is 0.92 ± 0.04 using theanticoincidence counting mode. This means thatbackground suppression should provide a lowerdetection limit In order to illustrate this point, threeNIST reference materials were selected. One ofthem (Non-Fat Milk Powder), had a high iodine leveland a high background, the second SRM (BovineLiver) had a low iodine content but a highbackground, and the third SRM (Rice Flour) had
both low iodine level and low background. Thesethree materials were analyzed for iodine using bothconventional and anticoincidence counting modes.Various limits of detection, as defined by Currie (6),were calculated. The values of Lc, LD, and LQ foriodine in the three SRMs are given in Table 2. It isevident that the detection limits for iodine in allcases have been lowered by anticoincidencecounting. Although Non-Fat Milk Powder had highbackground activities due to 38C1,56Mn and 24Na, itsiodine content of about 3100 ppb (Table 1) wasgreater than LQ by both conventional andanticoincidence spectrometry. The iodine content ofabout 180 ppb in Bovine Liver (Table 1) wasgreater than the LQ of 170 ppb by anticoincidencecounting. The 442.9-keV peak of !28I in Rice Flourwas undetectable using the conventional system butbecame detectable in the anticoincidence system asthe Lc was lowered (Table 1).
REFERENCES:
1. R.R. Rao, J. Holzbecher, A. Chatt,"Epithermal instrumental neutronactivation analysis of biological materialsfor iodine", Fresenius J. Anal. Chem.,352(1995)53.
2. R.R. Rao, A. Chatt, "Microwave aciddigestion and preconcentration neutronactivation analysis of biological and dietsamples for iodine", Anal. Chem.,63(1991)1298.
3. R.R. Rao, A. Chatt, "Determination ofnanogram amounts of iodine in foods byradiochemical neutron activation analysis",Analyst, 118(1993)1247.
4. R.R. Rao, A. Chatt, "Quality assuranceprogram for the determination of iodine inbiological materials by neutron activation",Trans. Am. Nucl. Soc., 71(1994)27.
5. W. Zhang, "Studies on anticoincidencegamma-ray spectrometry in neutronactivation analysis", Ph.D. Thesis,Dalhousie University, Halifax, NS, Canada(1997).
6. L.A. Currie, "Limits of qualitativedetection and quantitative determination -

application to radiochemical analysis",Anal. Chem., 40(1968)586.
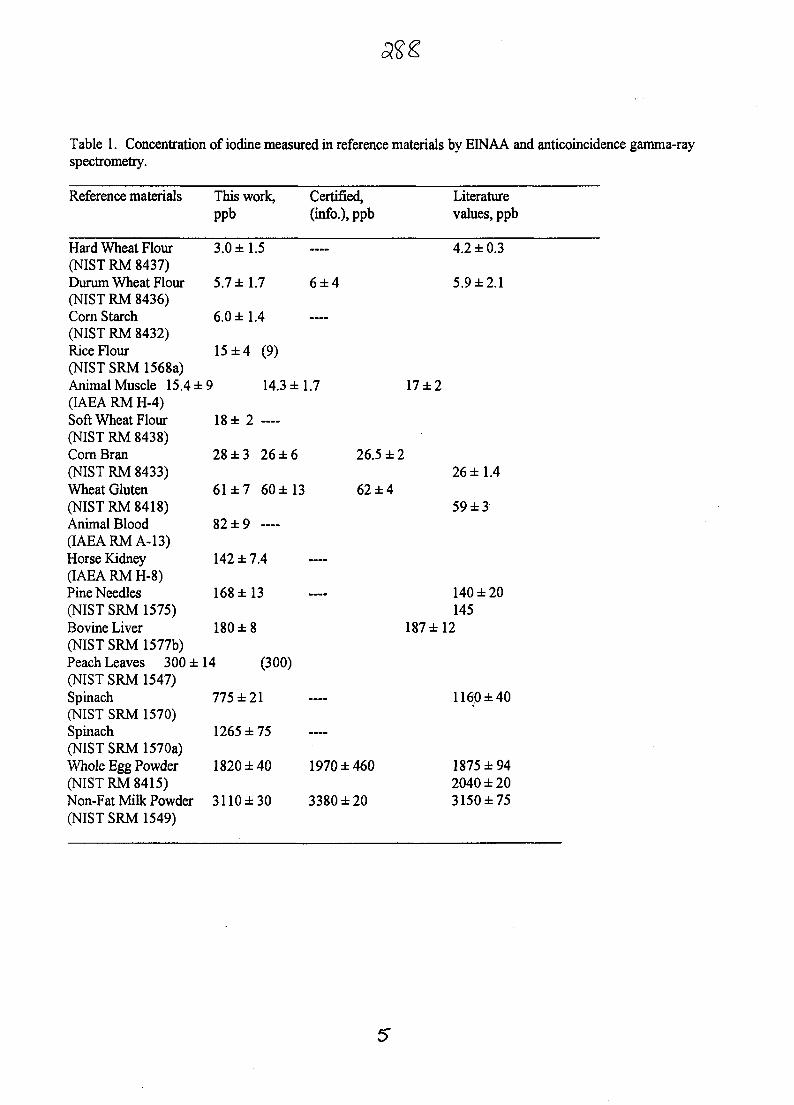
Table 1. Concentration of iodine measured in reference materials by EINAA and anticoincidence gamma-rayspectrometry.
Reference materials
Hard Wheat Flour(NIST RM 8437)Durum Wheat Flour(NIST RM 8436)Corn Starch(NIST RM 8432)Rice Flour(NIST SRM 1568a)Animal Muscle 15.4 ±(IAEA RM H-4)Soft Wheat Flour(NIST RM 8438)Corn Bran(NIST RM 8433)Wheat Gluten(NIST RM 8418)Animal Blood(IAEARMA-13)Horse Kidney(IAEA RM H-8)Pine Needles(NIST SRM 1575)Bovine Liver(NIST SRM 1577b)Peach Leaves 300 ±(NIST SRM 1547)Spinach(NIST SRM 1570)Spinach(NIST SRM 1570a)Whole Egg Powder(NIST RM 8415)Non-Fat Milk Powder(NIST SRM 1549)
This work, Certified,ppb (info.), ppb
3.0 ±1.5
5.7±1.7 6 ± 4
6.0 ±1.4
15 ±4 (9)
9 14.3 ±1.7
18 ± 2 —
28±3 26±6 26.5±
61±7 60± 13 62±4
82 ±9 —
142 ± 7.4
168 ± 13
180 ±8
14 (300)
775 ±21
1265 ± 75
1820 ±40 1970 ±460
3110±30 3380±20
Literaturevalues, ppb
4.2 ±0.3
5.9 ±2.1
17±2
226 ±1.4
59 ±3
140 ± 20145
187 ±12
1160 ±40
1875 ±942040 ±203150 ±75
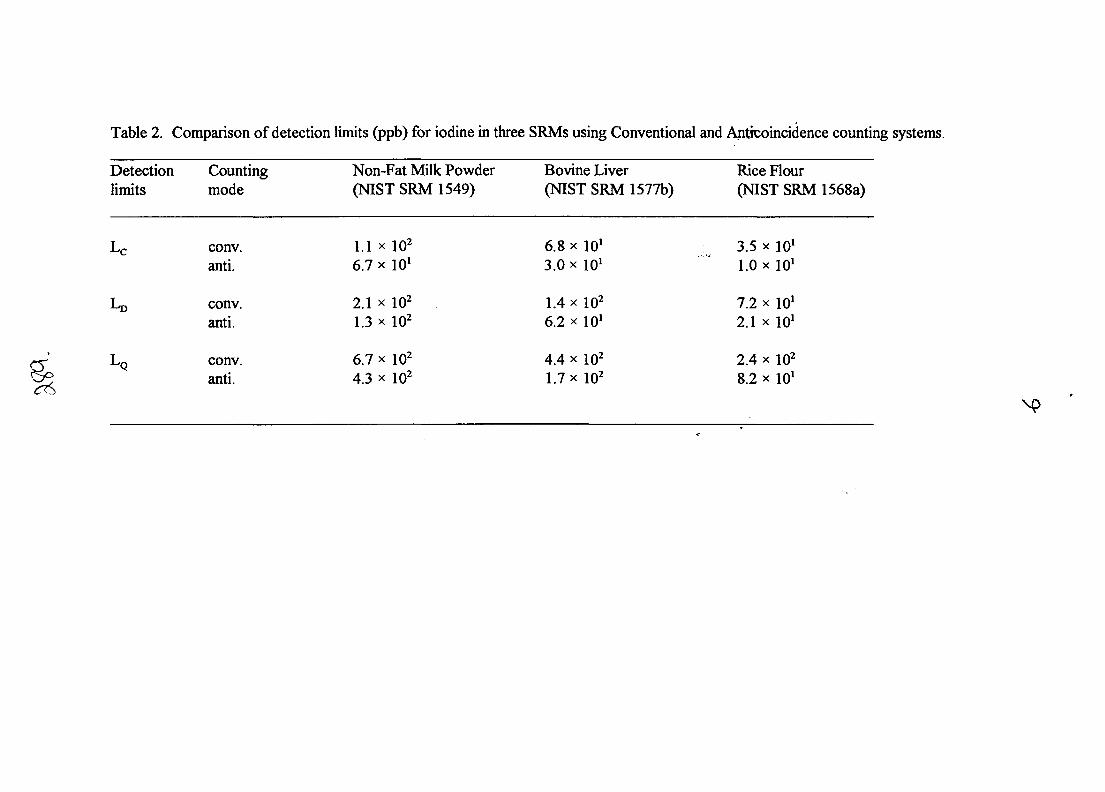
Table 2. Comparison of detection limits (ppb) for iodine in three SRMs using Conventional and Anticoincidence counting systems.
Detectionlimits
Lc
LD
LQ
Countingmode
conv.anti.
conv.anti.
conv.anti.
Non-Fat Milk Powder(NIST SRM 1549)
1.1 x 10²
6.7 x 10'
2.1 x 10²
1.3 x 10²
6.7 x 10²
4.3 x io2
Bovine Liver(NIST SRM 1577b)
6.8 x 10'3.0 x 10'
1.4 x io2
6.2 x 10'
4.4 x io2
1.7 x 10²
Rice Flour(NIST SRM 1568a)
3.5 x 10'1.0 x 10'
7.2 x 10'2.1 x 10'
2.4 x 10²
8.2 x 10'
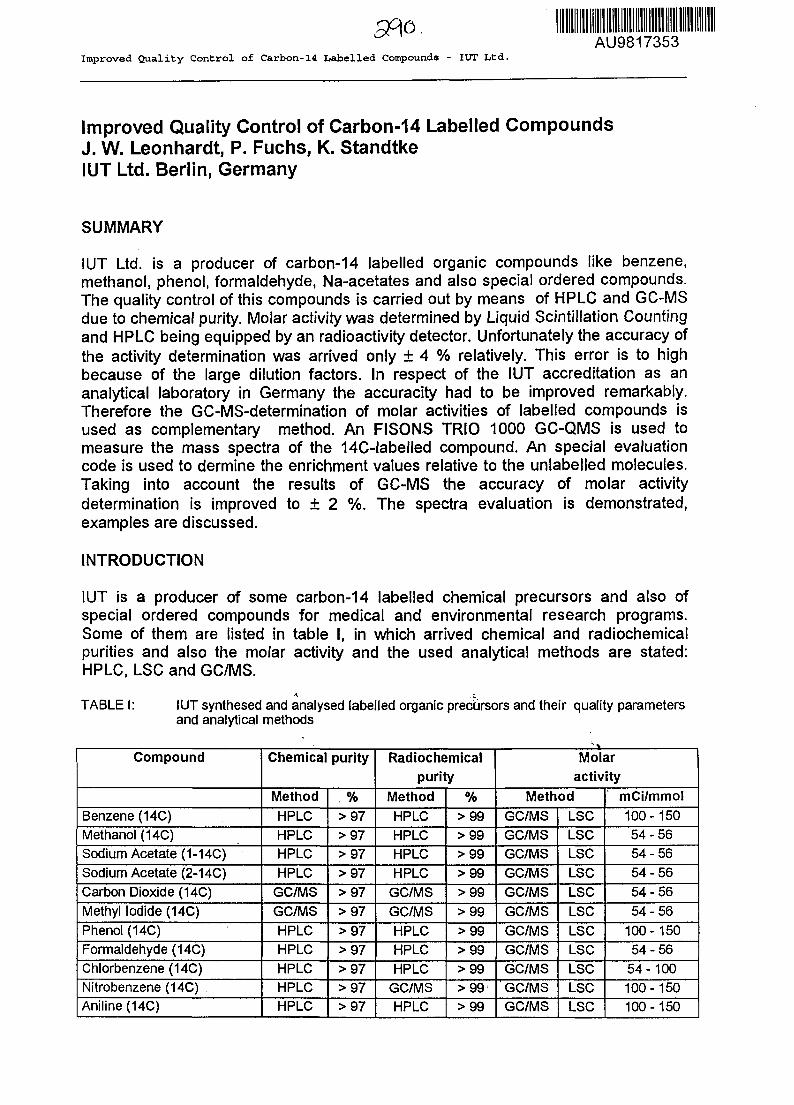
AU9817353Improved Quality Control of Carbon-14 Labelled Compounds - IUT Ltd.
Improved Quality Control of Carbon-14 Labelled CompoundsJ. W. Leonhardt, P. Fuchs, K. StandtkeIUT Ltd. Berlin, Germany
SUMMARY
IUT Ltd. is a producer of carbon-14 labelled organic compounds like benzene,methanol, phenol, formaldehyde, Na-acetates and also special ordered compounds.The quality control of this compounds is carried out by means of HPLC and GC-MSdue to chemical purity. Molar activity was determined by Liquid Scintillation Countingand HPLC being equipped by an radioactivity detector. Unfortunately the accuracy ofthe activity determination was arrived only ± 4 % relatively. This error is to highbecause of the large dilution factors. In respect of the IUT accreditation as ananalytical laboratory in Germany the accuracity had to be improved remarkably.Therefore the GC-MS-determination of molar activities of labelled compounds isused as complementary method. An FISONS TRIO 1000 GC-QMS is used tomeasure the mass spectra of the 14C-labelled compound. An special evaluationcode is used to dermine the enrichment values relative to the unlabelled molecules.Taking into account the results of GC-MS the accuracy of molar activitydetermination is improved to ± 2 %. The spectra evaluation is demonstrated,examples are discussed.
INTRODUCTION
IUT is a producer of some carbon-14 labelled chemical precursors and also ofspecial ordered compounds for medical and environmental research programs.Some of them are listed in table I, in which arrived chemical and radiochemicalpurities and also the molar activity and the used analytical methods are stated:HPLC, LSC and GC/MS.
TABLE I: IUT synthesed and analysed labelled organic precursors and their quality parametersand analytical methods
Compound
Benzene (14C)Methanol (14C)Sodium Acetate (1-14C)Sodium Acetate (2-14C)Carbon Dioxide (14C)Methyl Iodide (14C)Phenol (14C)Formaldehyde (14C)Chlorbenzene (14C)Nitrobenzene (14C)Aniline (14C)
Chemical purity
Method
HPLCHPLCHPLCHPLC
GC/MS
GC/MSHPLCHPLCHPLCHPLCHPLC
%>97>97>97
>97>97
>97>97>97>97>97>97
Radiochemicalpurity
Method
HPLCHPLCHPLCHPLC
GC/MS
GC/MS
HPLCHPLCHPLC
GC/MSHPLC
%>99>99>99
>99>99
>99
>99>99>99>99>99
Molaractivity
Method
GC/MSGC/MSGC/MSGC/MSGC/MS
GC/MSGC/MSGC/MSGC/MSGC/MSGC/MS
LSCLSCLSCLSCLSC
LSCLSCLSCLSCLSCLSC
mCi/mmol
100-15054-5654-56
54-5654-5654-56
100-15054-56
54-100100-150100-150
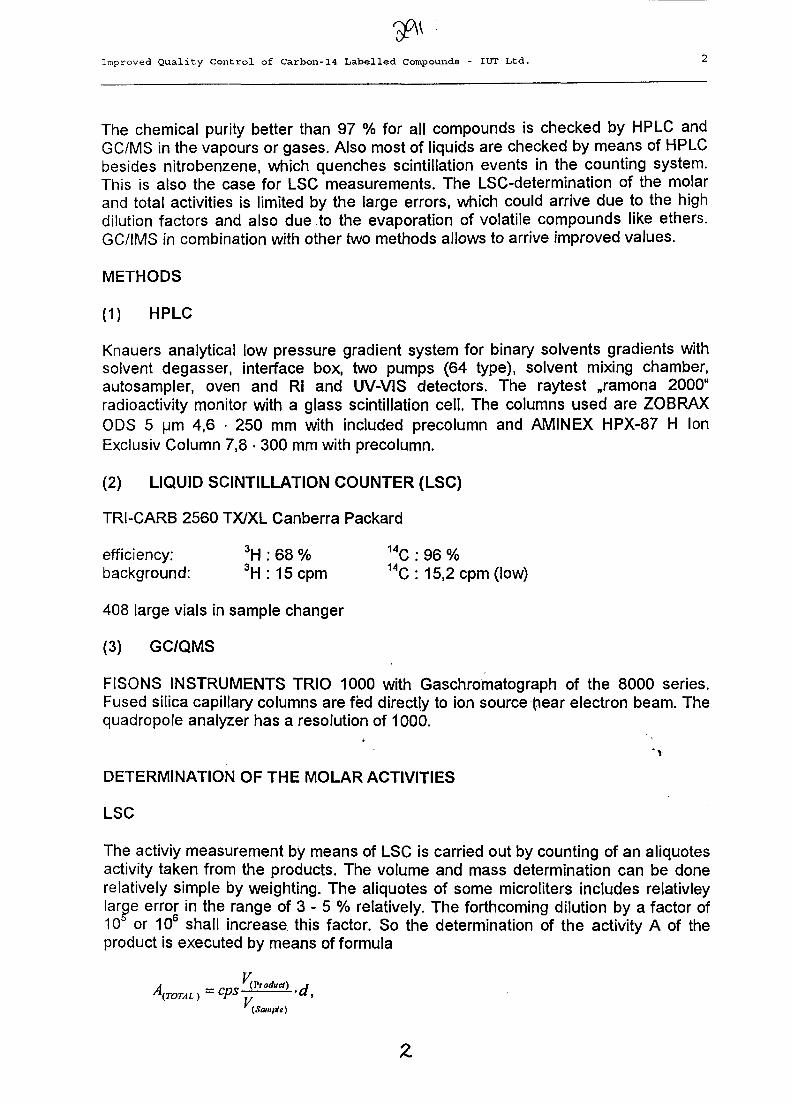
Improved Quality Control of Carbon-14 Labelled Compounds - IUT Ltd.
The chemical purity better than 97 % for all compounds is checked by HPLC andGC/MS in the vapours or gases. Also most of liquids are checked by means of HPLCbesides nitrobenzene, which quenches scintillation events in the counting system.This is also the case for LSC measurements. The LSC-determination of the molarand total activities is limited by the large errors, which could arrive due to the highdilution factors and also due to the evaporation of volatile compounds like ethers.GC/IMS in combination with other two methods allows to arrive improved values.
METHODS
(1) HPLC
Knauers analytical low pressure gradient system for binary solvents gradients withsolvent degasser, interface box, two pumps (64 type), solvent mixing chamber,autosampler, oven and Rl and UV-VIS detectors. The raytest Bramona 2000"radioactivity monitor with a glass scintillation cell. The columns used are ZOBRAXODS 5 urn 4,6 • 250 mm with included precolumn and AMINEX HPX-87 H IonExclusiv Column 7,8 • 300 mm with precolumn.
(2) LIQUID SCINTILLATION COUNTER (LSC)
TRI-CARB 2560 TX/XL Canberra Packard
efficiency: 3H : 68 % 14C : 96 %
background: 3H : 15 cpm 14C : 15,2 cpm (low)
408 large vials in sample changer
(3) GC/QMSFISONS INSTRUMENTS TRIO 1000 with Gaschromatograph of the 8000 series.Fused silica capillary columns are fed directly to ion source pear electron beam. Thequadropole analyzer has a resolution of 1000.
DETERMINATION OF THE MOLAR ACTIVITIES
LSC
The activiy measurement by means of LSC is carried out by counting of an aliquotesactivity taken from the products. The volume and mass determination can be donerelatively simple by weighting. The aliquotes of some microliters includes relativleylarge error in the range of 3 - 5 % relatively. The forthcoming dilution by a factor of10 or 106 shall increase, this factor. So the determination of the activity A of theproduct is executed by means of formula
vA(TOTAL ) ~ CPS ~ " •
" (Sample)
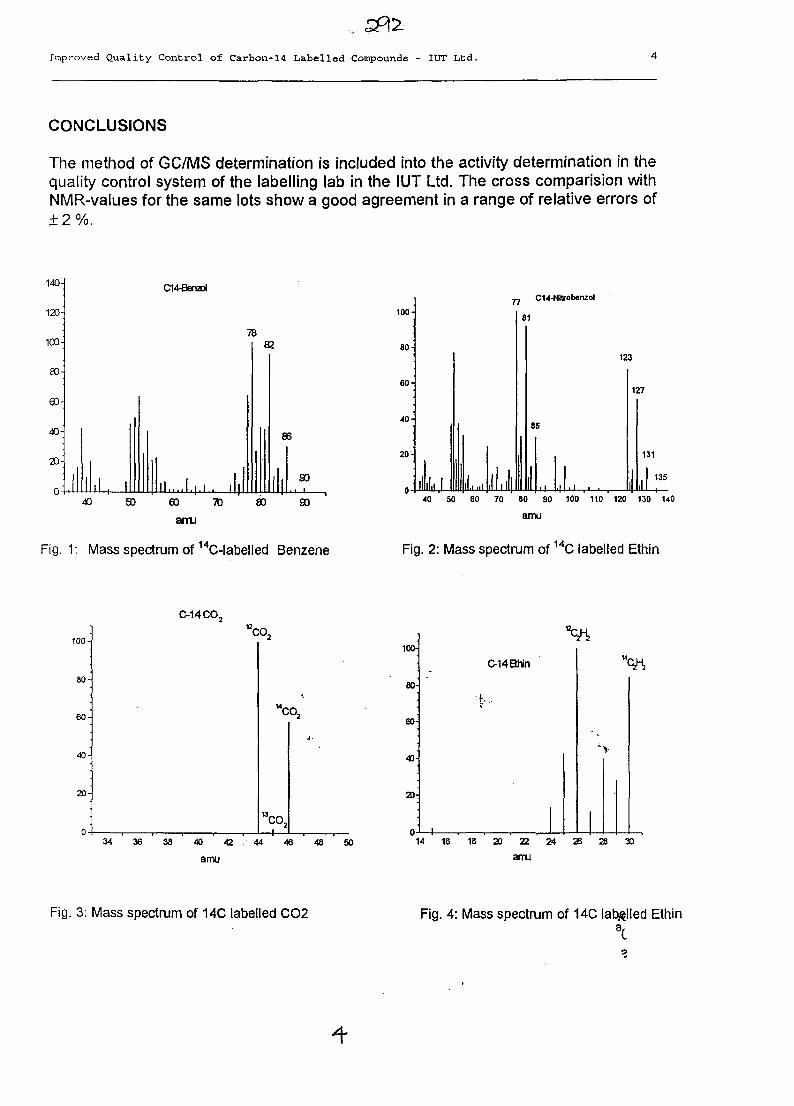
Improved Quality Control of Carbon-14 Labelled Compounds - IUT Ltd.
CONCLUSIONS
The method of GC/MS determination is included into the activity determination in thequality control system of the labelling lab in the IUT Ltd. The cross comparision withNMR-values for the same lots show a good agreement in a range of relative errors of± 2 %.
140-
120:
100-
80-
60-
40-
20-
0- ,ll I , , i
C14-Benzol
78
I I . . . . I | 1 . l l |
82
86
-i 90. • 1
40 30 60 70 80 90
arru
Fig. 1: Mass spectrum of 14C-labelled Benzene
100-
80-
60-
40-
20-
0 -
I
ilif,il I
77
ll.lll
81
CH-Nitrobenzol
123
85
1*±-± '1 ,• • ,
127
|[131
it40 50 60 70 80 90 100 110 120 130 140
amu
Fig. 2: Mass spectrum of 14C labelled Ethin
100-
80-
6 0 -
40-
2 0 -
0 -
C-14CO,
°2
"co,
4-
3 4 3 6 3 8 4 0 4 2 . 4 4 4 6 4 8 5 0
amu
100-
80-
60
40-
20
C-14Bhin
14 16 18 20 22 24 26 28 30
amu
Fig. 3: Mass spectrum of 14C labelled CO2 Fig. 4: Mass spectrum of 14C labelled Ethin
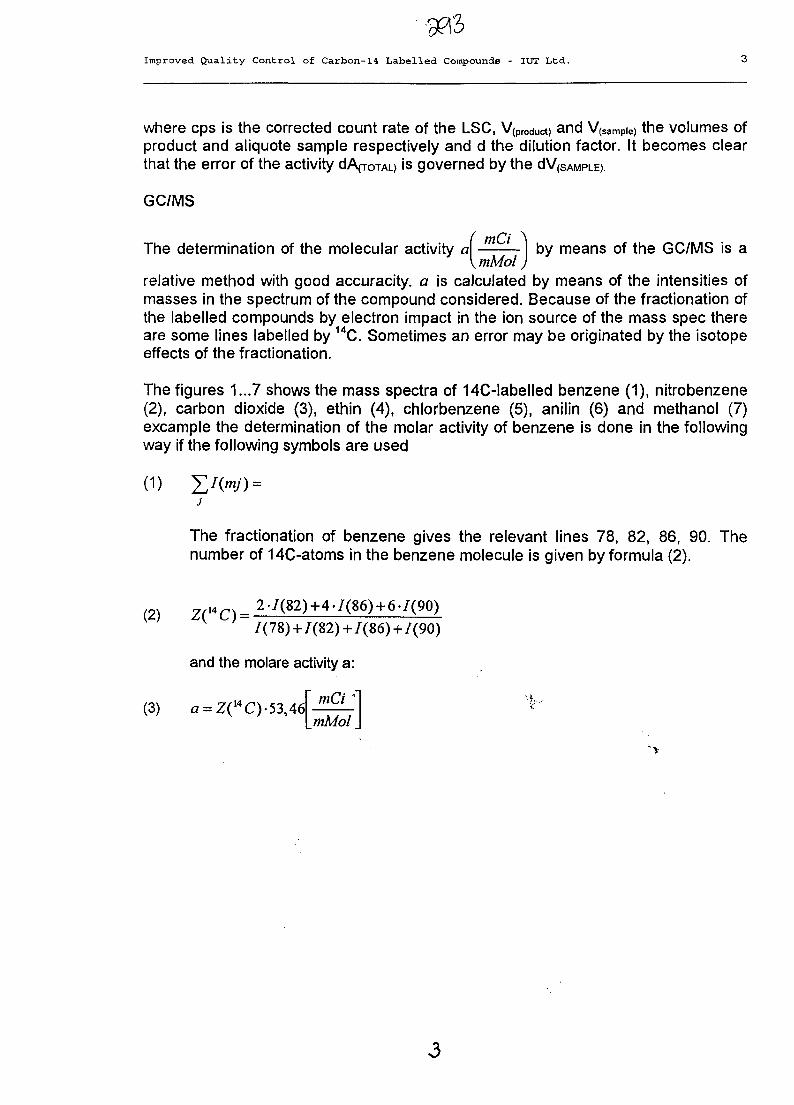
Improved Quality Control of Carbon-14 Labelled Compounds - IUT Ltd.
where cps is the corrected count rate of the LSC, V(product) and V(sampie) the volumes ofproduct and aliquote sample respectively and d the dilution factor. It becomes clearthat the error of the activity dAfroTAD is governed by the dV(SAMPLE).
GC/MS
The determination of the molecular activity a\ by means of the GC/MS is a[mMolJ
relative method with good accuracity. a is calculated by means of the intensities ofmasses in the spectrum of the compound considered. Because of the fractionation ofthe labelled compounds by electron impact in the ion source of the mass spec thereare some lines labelled by 14C. Sometimes an error may be originated by the isotopeeffects of the fractionation.
The figures 1...7 shows the mass spectra of 14C-labelled benzene (1), nitrobenzene(2), carbon dioxide (3), ethin (4), chlorbenzene (5), anilin (6) and methanol (7)excample the determination of the molar activity of benzene is done in the followingway if the following symbols are used
(1)
The fractionation of benzene gives the relevant lines 78, 82, 86, 90. Thenumber of 14C-atoms in the benzene molecule is given by formula (2).
(2) ZC4 C) = 2 /(8 2)+4-/(86)+6-7(90)7(78)+7(82)+7(86)+7(90)
and the molare activity a:
(3) fl = zrC).53,4<[-^]\_mMol J
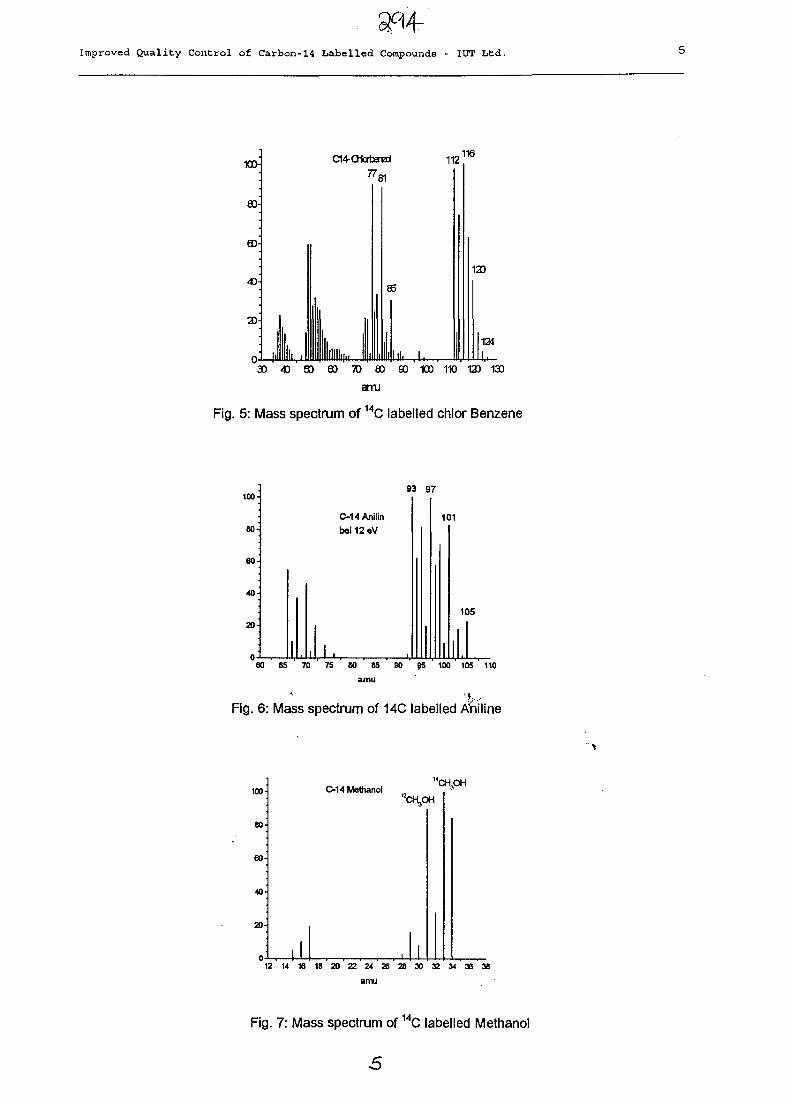
Improved Quality Control of Carbon-14 Labelled Compounds - IUT Ltd.
100-
80-
eo-
40-
23-
0- hl l l l l .
a+OtabereEl
I ii
Ilillll.., J
112
•
86
,1,il, I.
116
12)
124
|,
30 43 ED 60 70 80 SO 100 110 120 130
arru
Fig. 5: Mass spectrum of 14C labelled chlor Benzene
100-
80
60-
40-
20
93 97
C-14Anilin
bei 12 eV101
105
60 65 70 75 80 85 90 95 100 105 110
amu
Fig. 6: Mass spectrum of 14C labelled Aniline
100
80
60
20
C-14 MethanolCH,OH
CH,OH
• I I12 14 16 18 20 22 24 28 28 30 32 34 36 38
amu
Fig. 7: Mass spectrum of 14C labelled Methanol
AU9817354
Proposal of Novel Method of Continuous Monitoring of Possible FuelFailure of a Pool-Type Reactor
KEN-ICHISASAKI^ SHU A. HAYASHI^, and TATSUO MATSUURA(2)
College of Science, Rikkyo University, 3-34-1 Nishi-Ikebukuro, Toshima-ku, Tokyo 171,JAPAN(1),
Institute for Atomic Energy, Rikkyo University, 2-5-1, Nagasaka, Yokosuka 240-01, JAPAN2)
SUMMARY. We propose a simple and novel method for continuous monitoring of fuel failure in apool-type reactor. The monitoring is made on the basis of the continuous measurement of theradioactivity of daughter nuclides (89Rb and l38Cs) of rare gases (89Kr and I38Xe, respectively) leakedfrom fuel elements into the primary cooling water. Rare gases are purged by bubbling of nitrogen gas,lead into a large volume column with inert packing materials to increase the surface area of water, andwashed with water (containing trace amount of sodium ions) counter-currently, where rare gases decayand their daughter nuclides are transferred to a water phase, which is lead to a detection unit. Theproposed system is simple and almost maintenance free.
1. INTRODUCTION
A sensitive and simple continuous monitoringof fuel failure in a nuclear reactor must beestablished for safe operation and quickresponse for a reactor accident. Varioustechniques have been employed for suchpurposes (1, 2), but still the development ofsimpler and more reliable methods arerequired.
In our TRIGA reactor, we have beenrecommended by the manufacturer (GeneralAtomic Co.) to measure the gross radioactivityof aerosol in the air above cooling water. Theaerosol is collected with a commerciallyavailable "continuous air monitor (CAM)",which is composed of a small pump with afilter paper and a GM rate meter. The mainradioactivities found there are fission-originating radionuclides, 89Rb (half life 15.15min) and 138Cs (half life 33.41 min) (1,2).These nuclides are the daughters of FP raregases, 89Kr (half life 3.15 min) and 138Xe (halflife 14.08 min), respectively.
Recently our group developed a sensitivemonitoring system (3), where we directly
collected the fission-originating rare gases, 89Krand 138Xe, from the deep portion of the reactorcooling water into a bottle on the pool surfaceby purging with nitrogen gas bubble. After thecollected gas stood in the bottle for decay, thedaughter nuclides were extracted to water byshaking with water in the bottle. The units ofgas collection and transportation is semi-automated, but the system is still sophisticatedand costly.
Quite recently we have got an idea of a simpler,more economical, fully-automated continuousmonitoring system. The system consistsbasically of a large column with packingmaterials just as in a fractional distiller, wherethe collected rare gas and a washing water flowcounter-currently. In the column, the rare gasdecays and the daughter nuclides aretransferred to water continuously. The effluentwater is led through a tubing to the top of thedetector for the measurement of radioactivity.
This paper reports the idea for the constructionof the simple fully-automated continuousmonitoring system searching fuel failure in anuclear reactor.
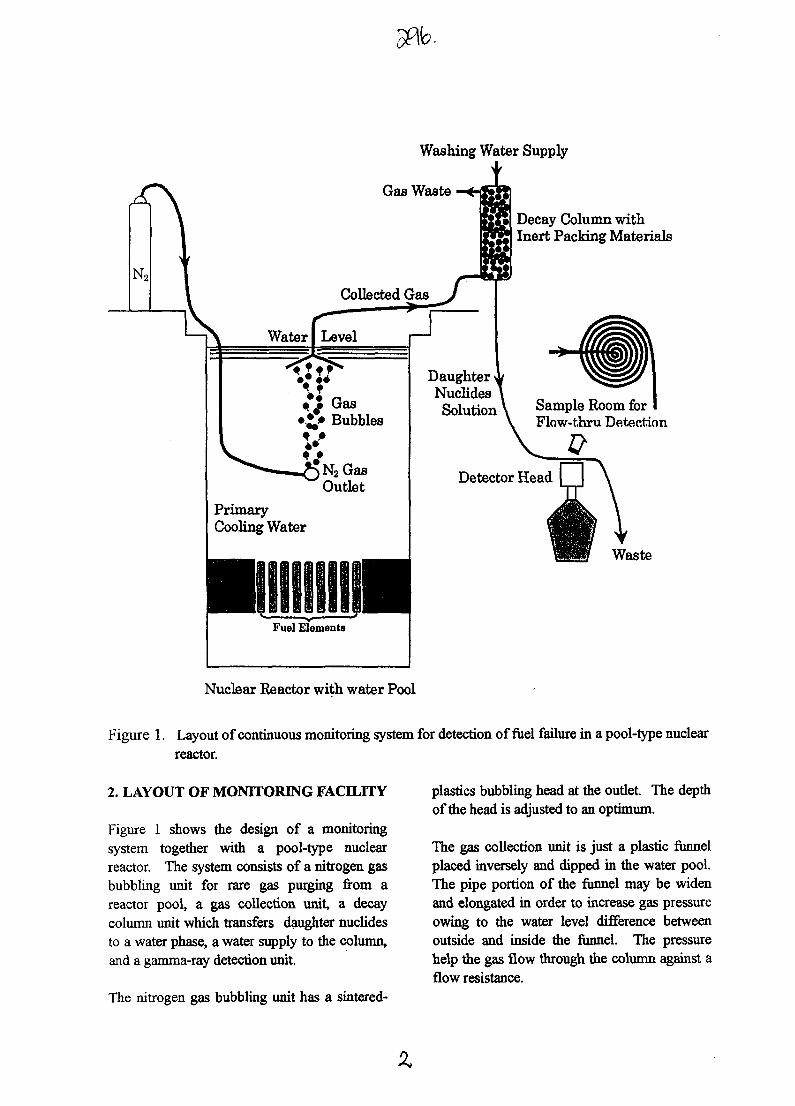
Washing Water Supply
Decay Column withInert Packing Materials
• j Gas• *f Bubbles
N2GasOutlet
PrimaryCooling Water
DaughterNuclidesSolution Sample Room for
Flow-thru Detection
Detector Head
Waste
Nuclear Reactor with water Pool
Figure 1. Layout of continuous monitoring system for detection of fuel failure in a pool-type nuclearreactor.
2. LAYOUT OF MONITORING FACILITY
Figure 1 shows the design of a monitoringsystem together with a pool-type nuclearreactor. The system consists of a nitrogen gasbubbling unit for rare gas purging from areactor pool, a gas collection unit, a decaycolumn unit which transfers daughter nuclidesto a water phase, a water supply to the column,and a gamma-ray detection unit.
The nitrogen gas bubbling unit has a sintered-
plastics bubbling head at the outlet. The depthof the head is adjusted to an optimum.
The gas collection unit is just a plastic funnelplaced inversely and dipped in the water pool.The pipe portion of the funnel may be widenand elongated in order to increase gas pressureowing to the water level difference betweenoutside and inside the funnel. The pressurehelp the gas flow through the column against aflow resistance.
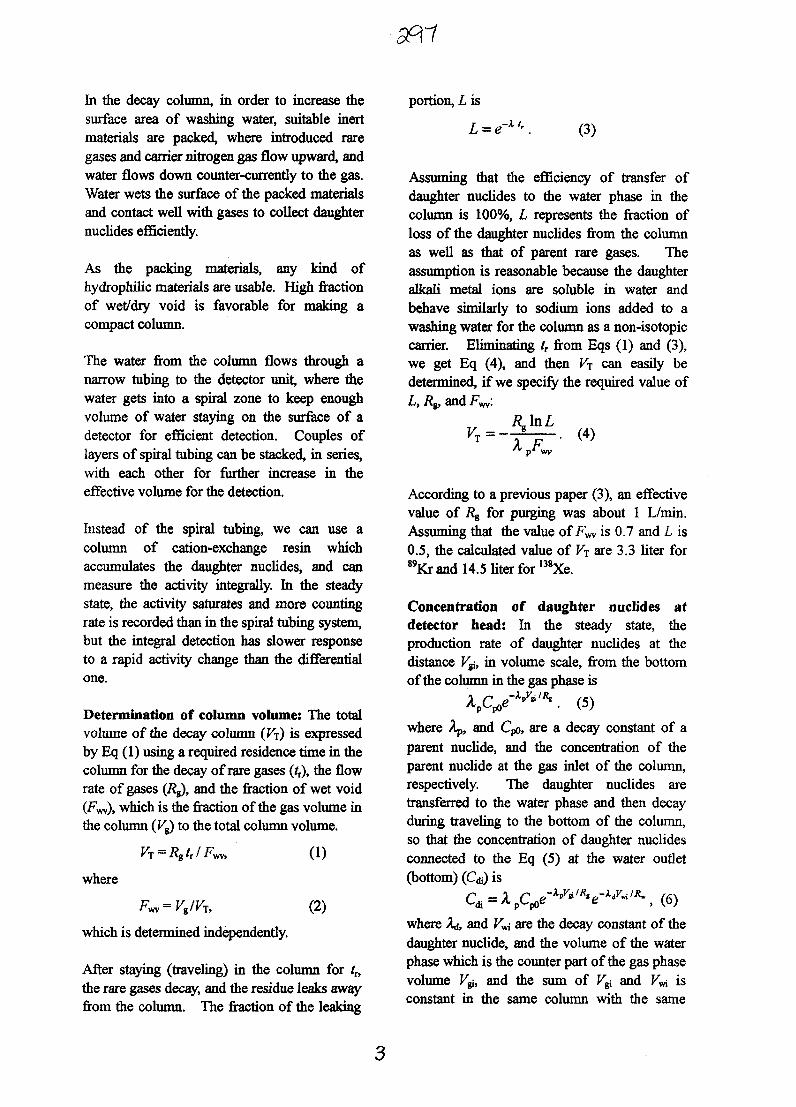
In the decay column, in order to increase thesurface area of washing water, suitable inertmaterials are packed, where introduced raregases and carrier nitrogen gas flow upward, andwater flows down counter-currently to the gas.Water wets the surface of the packed materialsand contact well with gases to collect daughternuclides efficiently.
As the packing materials, any kind ofhydrophilic materials are usable. High fractionof wet/dry void is favorable for making acompact column.
The water from the column flows through anarrow tubing to the detector unit, where thewater gets into a spiral zone to keep enoughvolume of water staying on the surface of adetector for efficient detection. Couples oflayers of spiral tubing can be stacked, in series,with each other for further increase in theeffective volume for the detection.
Instead of the spiral tubing, we can use acolumn of cation-exchange resin whichaccumulates the daughter nuclides, and canmeasure the activity integrally. In the steadystate, the activity saturates and more countingrate is recorded than in the spiral tubing system,but the integral detection has slower responseto a rapid activity change than the differentialone.
Determination of column volume: The totalvolume of the decay column (Vj) is expressedby Eq (1) using a required residence time in thecolumn for the decay of rare gases (fr), the flowrate of gases (i?g), and the fraction of wet void(Fwv), which is the fraction of the gas volume inthe column (Fg) to the total column volume.
portion, L is
(3)
where
which is determined independently.
(1)
(2)
After staying (traveling) in the column for tr,the rare gases decay, and the residue leaks awayfrom the column. The fraction of the leaking
Assuming that the efficiency of transfer ofdaughter nuclides to the water phase in thecolumn is 100%, L represents the fraction ofloss of the daughter nuclides from the columnas well as that of parent rare gases. Theassumption is reasonable because the daughteralkali metal ions are soluble in water andbehave similarly to sodium ions added to awashing water for the column as a non-isotopiccarrier. Eliminating t, from Eqs (1) and (3),we get Eq (4), and then V-x can easily bedetermined, if we specify the required value ofL, Re, and F w :
R^lnL(4)
According to a previous paper (3), an effectivevalue of R6 for purging was about 1 L/min.Assuming that the value of Fwv is 0.7 and L is0.5, the calculated value of V-x are 3.3 liter for89Kr and 14.5 liter for 138Xe.
Concentration of daughter nuclides atdetector head: In the steady state, theproduction rate of daughter nuclides at thedistance V#, in volume scale, from the bottomof the column in the gas phase is
where \ , and Cpo, are a decay constant of aparent nuclide, and the concentration of theparent nuclide at the gas inlet of the column,respectively. The daughter nuclides aretransferred to the water phase and then decayduring traveling to the bottom of the column,so that the concentration of daughter nuclidesconnected to the Eq (5) at the water outlet(bottom) (Cdi) is
Qi=A^e-WV^"\(6)
where X&, and V^ are the decay constant of thedaughter nuclide, and the volume of the waterphase which is the counter part of the gas phasevolume V&, and the sum of V$ and F^ isconstant in the same column with the same
packing materials. In the Eq (6), R^ is notindependent of Kw, which is not independent ofRw, so that it is not simple to integrate the Eq(6) over the entire volume of the column.
At the extremely low flow rate of washingwater (7?w), the slower the rate become, the lessthe daughter nuclides come to the detector. Onthe other hand, at the extremely high /?w, thefaster the rate, the less the activity comes to thedetector. Therefore, an optimum /?w carries themost activity to the detector. The optimum canbe determined by experiments more easily thanby theoretical calculations.
3. CONCLUSION
The proposed simple system seems to work
sensitively for the detection of a fuel failure ina nuclear reactor. The major part of the systemis a decay column, whose volume is easilydetermined. The other parameter such as Flowrate of water can be determined experimentally.
4. REFERENCES
1. Ando, T, Kaneko, and Y., Fujisawa, M.,FAPIG, No. 94, 21 (1980).
2. Dodd, B., and Johnson, A. G., TenthBiennial U. S. TRIGA Users& Conference,College Station , Texas, April 6-9, 1986,TOC-15,8-21.
3. Hayashi, S. A., Matsuura, T, Tomura, K.,and Harasawa, S., Proc. SERINA (Symp. onEnv. Rad. Nucl. Impact in Asia), Taipei, pp177-185 (1996)
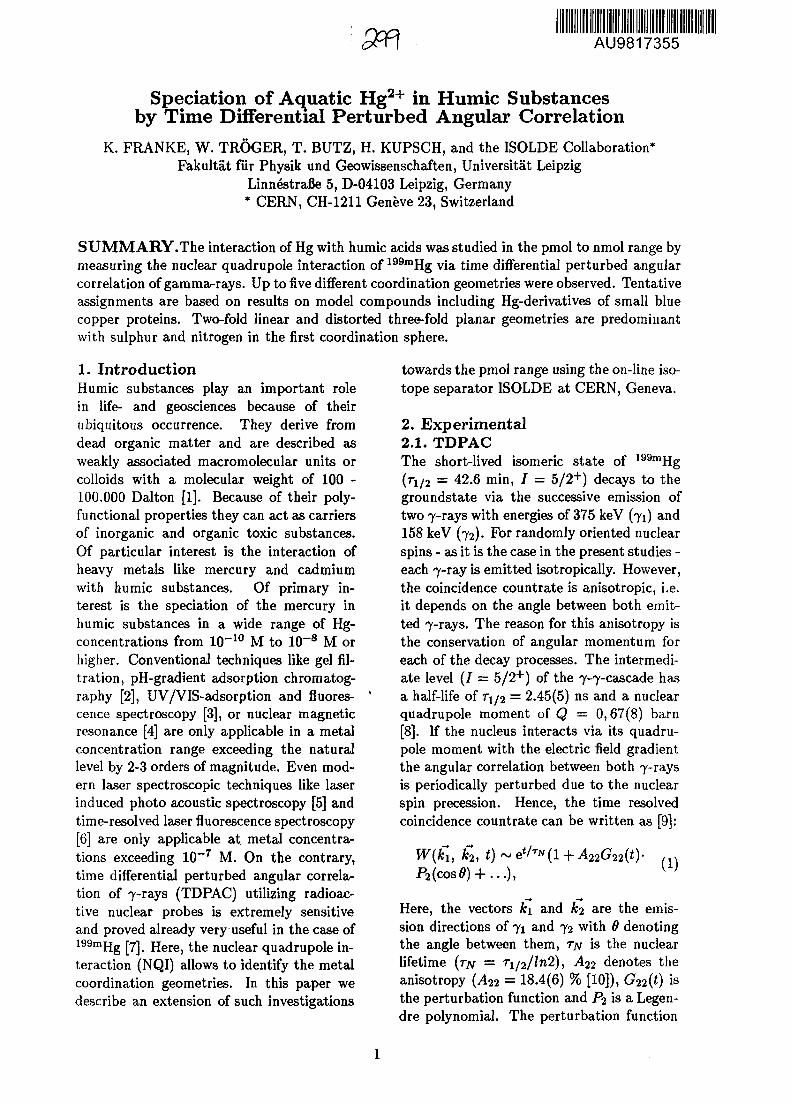
'3Pf\ AU9817355
Speciation of Aquatic Hg2+ in Humic Substancesby Time Differential Perturbed Angular Correlation
K. FRANKE, W. TROGER, T. BUTZ, H. KUPSCH, and the ISOLDE Collaboration*Fakultat fur Physik und Geowissenschaften, Universitat Leipzig
Linnestrafie 5, D-04103 Leipzig, Germany* CERN, CH-1211 Geneve 23, Switzerland
SUMMARY.The interaction of Hg with humic acids was studied in the pmol to nmol range bymeasuring the nuclear quadrupole interaction of 199mHg via time differential perturbed angularcorrelation of gamma-rays. Up to five different coordination geometries were observed. Tentativeassignments are based on results on model compounds including Hg-derivatives of small bluecopper proteins. Two-fold linear and distorted three-fold planar geometries are predominantwith sulphur and nitrogen in the first coordination sphere.
1. IntroductionHumic substances play an important rolein life- and geosciences because of theirubiquitous occurrence. They derive fromdead organic matter and are described asweakly associated macromolecular units orcolloids with a molecular weight of 100 -100.000 Dalton [1]. Because of their poly-functional properties they can act as carriersof inorganic and organic toxic substances.Of particular interest is the interaction ofheavy metals like mercury and cadmiumwith humic substances. Of primary in-terest is the speciation of the mercury inhumic substances in a wide range of Hg-concentrations from 10~10 M to 10~8 M orhigher. Conventional techniques like gel fil-tration, pH-gradient adsorption chromatog-raphy [2], UV/VIS-adsorption and fluores-cence spectroscopy [3], or nuclear magneticresonance [4] are only applicable in a metalconcentration range exceeding the naturallevel by 2-3 orders of magnitude. Even mod-ern laser spectroscopic techniques like laserinduced photo acoustic spectroscopy [5] andtime-resolved laser fluorescence spectroscopy[6] are only applicable at metal concentra-tions exceeding 10~7 M. On the contrary,time differential perturbed angular correla-tion of 7-rays (TDPAC) utilizing radioac-tive nuclear probes is extremely sensitiveand proved already very useful in the case of199mjjg p-j Here, the nuclear quadrupole in-teraction (NQI) allows to identify the metalcoordination geometries. In this paper wedescribe an extension of such investigations
towards the pmol range using the on-line iso-tope separator ISOLDE at CERN, Geneva.
2. Experimental2.1. TDPACThe short-lived isomeric state of 199mHg(71/2 = 42.6 min, / = 5/2+) decays to thegroundstate via the successive emission oftwo 7-rays with energies of 375 keV (71) and158 keV (72). For randomly oriented nuclearspins - as it is the case in the present studies -each 7-ray is emitted isotropically. However,the coincidence countrate is anisotropic, i.e.it depends on the angle between both emit-ted 7-rays. The reason for this anisotropy isthe conservation of angular momentum foreach of the decay processes. The intermedi-ate level (/ = 5/2+) of the 7-7-cascade hasa half-life of T^J2 = 2.45(5) ns and a nuclearquadrupole moment of Q = 0,67(8) barn[8]. If the nucleus interacts via its quadru-pole moment with the electric field gradientthe angular correlation between both 7-raysis periodically perturbed due to the nuclearspin precession. Hence, the time resolvedcoincidence countrate can be written as [9]:
4 t) ~P2 (cos 9) + . . . ) ,
A22G22(t)-(1)
Here, the vectors k\ and k2 are the emis-sion directions of 71 and 72 with 9 denotingthe angle between them, r/v is the nuclearlifetime (rjv = Ti/2/ln2), A22 denotes theanisotropy (A22 = 18.4(6) % [10]), G22(t) isthe perturbation function and P2 is a Legen-dre polynomial. The perturbation function
for pure NQI and / = 5/2 can be written as[11]:
3
G2 2(0 = £/»(»?) <*»(<*(»?)*)• (2)«'=0
Here, fi(rj) are intensities which depend onthe asymmetry parameter TJ of the electricfield gradient tensor (EFG) and which havewell-defined values for a given r). The asym-metry parameter is defined as:
(3)\vxx\ < \vyy\ < \vz
where Va denote the EFG-tensor compo-nents in the principal coordinate system.The frequencies w,(r/) are related to the en-ergy splittings between the sublevels withm = ±5/2, ±3/2, ±1/2. The connectionto VQ — eQVzz/h, the nuclear quadrupolecoupling constant, is given as follows [11]:
with a = yJf and /? = 52il^!i
(4)Note, thatw3 = wi-j-^2 by definition. Hence,there are two parameters {u>\,rj) to be ex-tracted for a unique probe geometry. Inthe case of a superposition of several probegeometries each site is characterized by itspair of (u>x, rj). In addition, the site popula-tions are treated as adjustable parameters.In practice, solid angle correction factorsreduce A22 (also treated as a free para-meter). Furthermore, the finite time res-olution of the spectrometer - we used the6-detector TDPAC-camera [12] - of about700 ps FWHM has to be taken into account.It reduces the intensity of high-frequencycomponents (> 2 . . .3 Grad/s).
2.1. Isotope preparationAt the on-line isotope separator ISOLDE atCERN, Geneva, an isotopically pure beam of199mHg is produced with the only significantcontamination being 199gHg. We implanted« 1010 atoms of 199mHg in ice at ~ 100 K.This activity was used either without addi-tion or with addition of inactive carrier inthe form of a Hg2+/5% HNO3 standard so-lution.
'American Society for Testing and Materials
2.3. Humic Acid PreparationThe starting material was water from the"Kleiner Kranichsee", a moor in the upperWesterzgebirge at the border between Ger-many and the Czech Republic. This site waschosen because it provides refractory humicsubstances with a low load of heavy metalsand other organic substances. In particular,it is low in Fe-content which is importantfor the present purpose. The characteris-tic geochemical parameters of this area arepH= 3.2...3.5, redox potential ~ 200 mV,conductivity 100 — 150 /iS/cm. In this areathe content of humic substances is 20 timeshigher than normal. For the isolation andpurification of humic acids we followed theprocedure of the International Humic Sub-stance Society (IHSS)[14j. We obtainedabout 2 mg humic acid per litre of water.
2.4. TDPAC Sample PreparationWe dissolved about 50 mg of lyophilized hu-mic acid in 10 ml of 1 M NaOH and adjustedthe pH to 4 by addition of 1 M HNO3. Insome cases we added 5 ml 0.1 M KC1 in or-der to adjust the ionic strength. We thenadded "type I" ultrapure water (A.S.T.M.)1
up to 100 ml volume. The mother liquidwas stored in ice and protected from light.We subsequently added carrier-free 199mHg(about 370 kBq) to 50 /il mother solution.In this way, a stoichiometry of about 107 :1for humic acids : metal was obtained. Allstoichiometries are related to the total acid-ity of humic acids of 5 mmol/g, as obtainedby pH-titration after Ba(OH)2 exchange ac-cording to Stevensen [15]. Incubation timeswere between 10 to 20 minutes. In order toavoid molecular tumbling motions or inter-molecular reorientational motions, the sam-ples were frozen to temperatures between-60 °C and -30 °C.Seven different experiments - denoted Hgl. . . Hg7 - were performed, the first threeunder identical conditions with the sampleage being the only difference. We then com-pared the results for no carrier added andcarrier added incubations. Since the addi-tion of KC1 could have led to the formation
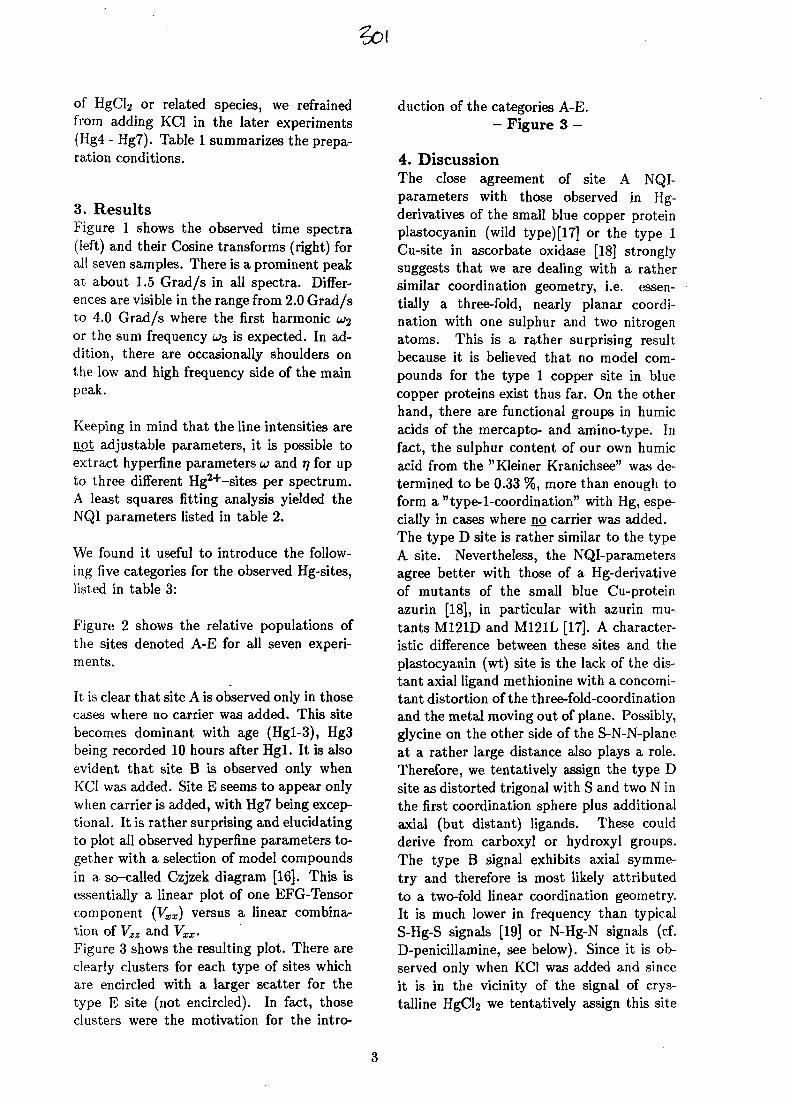
Soi
of HgCl2 or related species, we refrainedfrom adding KC1 in the later experiments(Hg4 - Hg7). Table 1 summarizes the prepa-ration conditions.
3. ResultsFigure 1 shows the observed time spectra(left) and their Cosine transforms (right) forall seven samples. There is a prominent peakat about 1.5 Grad/s in all spectra. Differ-ences are visible in the range from 2.0 Grad/sto 4.0 Grad/s where the first harmonic u>2or the sum frequency u>3 is expected. In ad-dition, there are occasionally shoulders onthe low and high frequency side of the mainpeak.
Keeping in mind that the line intensities arenot adjustable parameters, it is possible toextract hyperfine parameters u> and r\ for upto three different Hg2+-sites per spectrum.A least squares fitting analysis yielded theNQI parameters listed in table 2.
We found it useful to introduce the follow-ing five categories for the observed Hg-sites,listed in table 3:
Figure 2 shows the relative populations ofthe sites denoted A-E for all seven experi-ments.
It is clear that site A is observed only in thosecases where no carrier was added. This sitebecomes dominant with age (Hgl-3), Hg3being recorded 10 hours after Hgl. It is alsoevident that site B is observed only whenKC1 was added. Site E seems to appear onlywhen carrier is added, with Hg7 being excep-tional. It is rather surprising and elucidatingto plot all observed hyperfine parameters to-gether with a selection of model compoundsin a so-called Czjzek diagram [16]. This isessentially a linear plot of one EFG-Tensorcomponent (Vxx) versus a linear combina-tion of Vzz and Vxx.Figure 3 shows the resulting plot. There areclearly clusters for each type of sites whichare encircled with a larger scatter for thetype E site (not encircled). In fact, thoseclusters were the motivation for the intro-
duction of the categories A-E.- Figure 3 -
4. DiscussionThe close agreement of site A NQI-parameters with those observed in Hg-derivatives of the small blue copper proteinplastocyanin (wild type) [17] or the type 1Cu-site in ascorbate oxidase [18] stronglysuggests that we are dealing with a rathersimilar coordination geometry, i.e. essen-tially a three-fold, nearly planar coordi-nation with one sulphur and two nitrogenatoms. This is a rather surprising resultbecause it is believed that no model com-pounds for the type 1 copper site in bluecopper proteins exist thus far. On the otherhand, there are functional groups in humicacids of the mercapto- and amino-type. Infact, the sulphur content of our own humicacid from the "Kleiner Kranichsee" was de-termined to be 0.33 %, more than enough toform a "type-1-coordination" with Hg, espe-cially in cases where no carrier was added.The type D site is rather similar to the typeA site. Nevertheless, the NQI-parametersagree better with those of a Hg-derivativeof mutants of the small blue Cu-proteinazurin [18], in particular with azurin mu-tants M121D and M121L [17]. A character-istic difference between these sites and theplastocyanin (wt) site is the lack of the dis-tant axial ligand methionine with a concomi-tant distortion of the three-fold-coordinationand the metal moving out of plane. Possibly,glycine on the other side of the S-N-N-planeat a rather large distance also plays a role.Therefore, we tentatively assign the type Dsite as distorted trigonal with S and two N inthe first coordination sphere plus additionalaxial (but distant) ligands. These couldderive from carboxyl or hydroxyl groups.The type B signal exhibits axial symme-try and therefore is most likely attributedto a two-fold linear coordination geometry.It is much lower in frequency than typicalS-Hg-S signals [19] or N-Hg-N signals (cf.D-penicillamine, see below). Since it is ob-served only when KC1 was added and sinceit is in the vicinity of the signal of crys-talline HgCl2 we tentatively assign this site
to HgCb or related species. We do not con-sider it to be related to a specific bindingsite in humic acids.On the contrary, the type C signal is ob-served in all samples but Hg6. It certainlybelongs to an almost (or exactly) linear two-fold-coordinated Hg. The most likely Ugandaare two S atoms (cf. Hg(cysteine)2 [19]), twoN atoms (cf. type 2 site in ascorbate oxidase[18]), or are one S and one N atom (cf. D-penicillamine [20]).The type E signal is more difficult to assigndue to the lack of model compound data.One example, i.e. tert-buthyl-mercaptide,is shown in fig. 3. Here, Hg is four-fold co-ordinated by S in a distorted tetrahedralgeometry. We do not expect this to occur inhumic substances, too. However, the ratherlow EFG at the type E site strongly sug-gests a four-fold-coordination in a distortedtetrahedral geometry, possibly with N andO as atoms in the first coordination sphere.There is some indication of an ageing effect(compare Hg4 and Hg7, the only relevantdifference being the age of Hg7 which was70 hours).Our observations are in qualitative agree-ment with our previous data using muchhigher Hg-loads [7]. Higher coordinationsare found at higher Hg-loads whereas three-and two-fold coordinations are preferred atlower loads. A similar observation was re-ported for the interaction of Hg with theoligopeptide AACAA [21].Summing up, we presented strong evi-dence for two-, three- and four-fold-Hg-coordination geometries with the most im-portant ligands being S, N, and 0. The so-called type 1 Cu-geometry observed in bluecopper proteins seems to play an essentialrole in mercury binding to humic acids, too.
Acknowledgement. We are grateful toDr. D. Forkel-Wirth and Dr. S.G. Jahn fortheir help at ISOLDE/CERN.
References[1] G.R. Chioppin, Radiochim. Ada 44/45
(1988) 23[2] R. Grauer: Zur Koodinationschemie der
Huminstoffe, PSI-Bericht 89-08, 1989,Paul-Scherrer-Institut, Villigen, CH
[3] S.A. Visser: "Fluorescence Phenomena ofHumic Matter of Aquatic Origin and Mi-crobial Cultures" in "Aquatic and Terres-trial Humic Materials", R.F. Christmanand E.T. Gjessing (eds.), Ann Arbor Sci-ence, 1983
[4] A.H. Gillam and M.A. Wilson: "Ap-plication of 13C-NMR Spectroscopyof the Structural Elucidation of Dis-solved Marine Humic Substances" intheir Chemical Composition in Aquatic"Aquatic and Terrestrial Humic Materi-als", R.F. Christman and E.T. Gjessing(eds), Ann Arbor Science, 1983
[5] J.I. Kim, H. Wimmer, R. Klenze, Ra-diochim. Ada. 54 (1991) 35-41
[6] C. Moulin, P. Decombox, P. Mouch-ien, V. Moulin, M. Theyssier, Radiochim.Ada. 52/53 (1991) 119
[7] H. Kupsch, K. Franke, D. Degering,W. Troger, and T. Butz, Radiochim.Ada. 73 (1996) 145-147
[8] W. Troger, T. Butz, P. Blaha, andK. H. Schwarz, Hyp. Int. 80 (1993) 1109-1116 and references therein
[9] T. Butz, Z. Naturf. 51a (1996) 396-410and references therein.
[10] W.A. Edelstein and R.V. Pound, Phys.Rev. B II (1975) 985-989
[11] T. Butz,#yp. Int. 52 (1989) 189-228[12] T. Butz, S. Saibene, Th. Fraenzke,and
M. Weber, Nucl. Inst Meth. A284 (1989)417
[13] E. Kugler, Nucl. Inst. Meth. B79 (1993)322-325
[14] F.H. Frimmel and R.F. Christman (eds.)in " Humic Substance and their Role in En-vironment", Wiley, Chisters, 1988
[15] F.J. Stevenson: "Humus Chemistry -Genesis, Composition, Reaction", Wiley& Sons, New York, 1982
[16] T. Butz, M. Ceolin, P. Ganal, P. Schmidt,M.A. Taylor, and W. Troger, PysicaScripta 54 (1996) 234-239
[17] W. Troger, PhD-Thesis, 1994, Physik-Department, TU Miinchen
[18] T. Butz and W. Troger in "Multi-CopperOxidases", A. Messerschmidt (ed.), WorldScientific, 1997, p.431-453
[19] T. Butz, W. Troger, Th. Pohlmann, and0. Nuyken, Z. Naturf. 47a (1992) 85-88
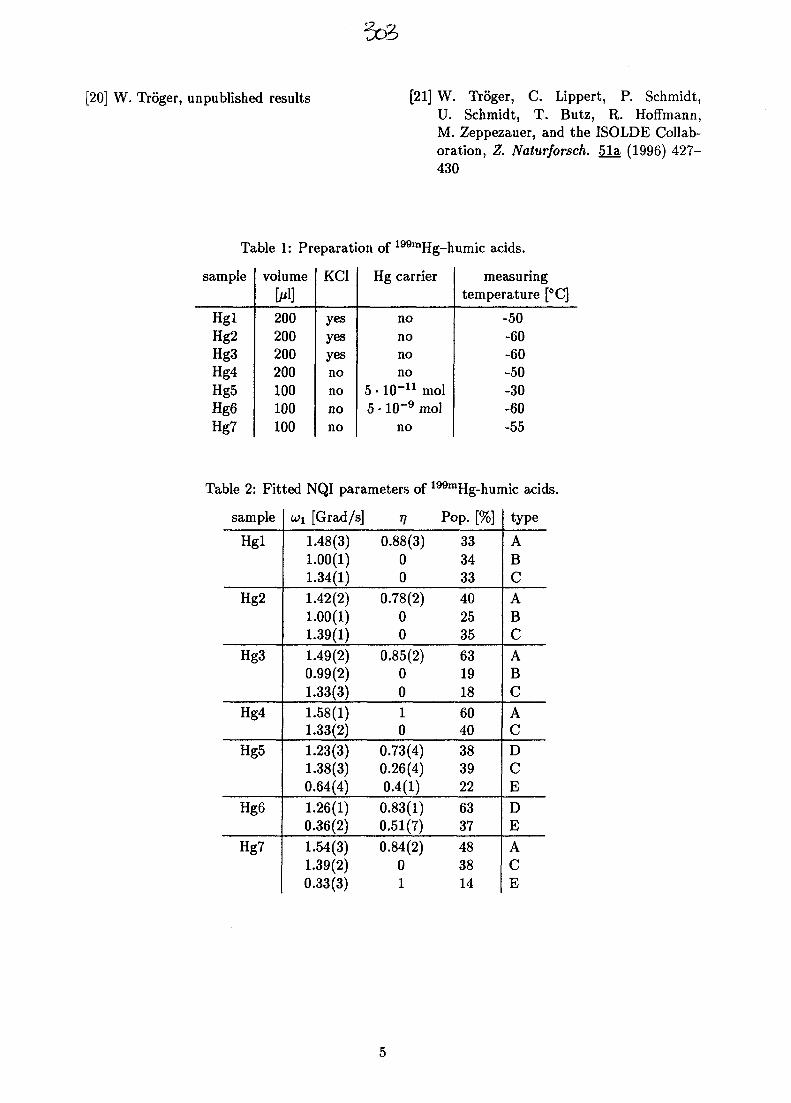
[20] W. Troger, unpublished results [21] W. Troger, C. Lippert, P. Schmidt,U. Schmidt, T. Butz, R. Hoffmann,M. Zeppezauer, and the ISOLDE Collab-oration, Z. Naturforsch. 51a (1996) 427-430
Table 1: Preparation of 199mHg-humic acids.
sample
HglHg2Hg3Hg4Hg5Hg6Hg7
volume
200200200200100100100
KC1
yesyesyesnononono
Hg carrier
nononono
5 • 10~u mol5 • 10~9 mol
no
measuringtemperature [°C]
-50-60-60-50-30-60-55
Table 2: Fitted NQI parameters of 199mHg-humic acids.
sample
Hgl
Hg2
Hg3
Hg4
Hg5
Hg6
Hg7
u>i [Grad/s]
1.48(3)1.00(1)1.34(1)1.42(2)1.00(1)1.39(1)1.49(2)0.99(2)1.33(3)1.58(1)1.33(2)1.23(3)1.38(3)0.64(4)1.26(1)0.36(2)1.54(3)1.39(2)0.33(3)
V
0.88(3)00
0.78(2)00
0.85(2)0010
0.73(4)0.26(4)0.4(1)0.83(1)0.51(7)0.84(2)
01
Pop. [%]
33343340253563191860403839226337483814
type
ABCABCABCACDCEDEACE
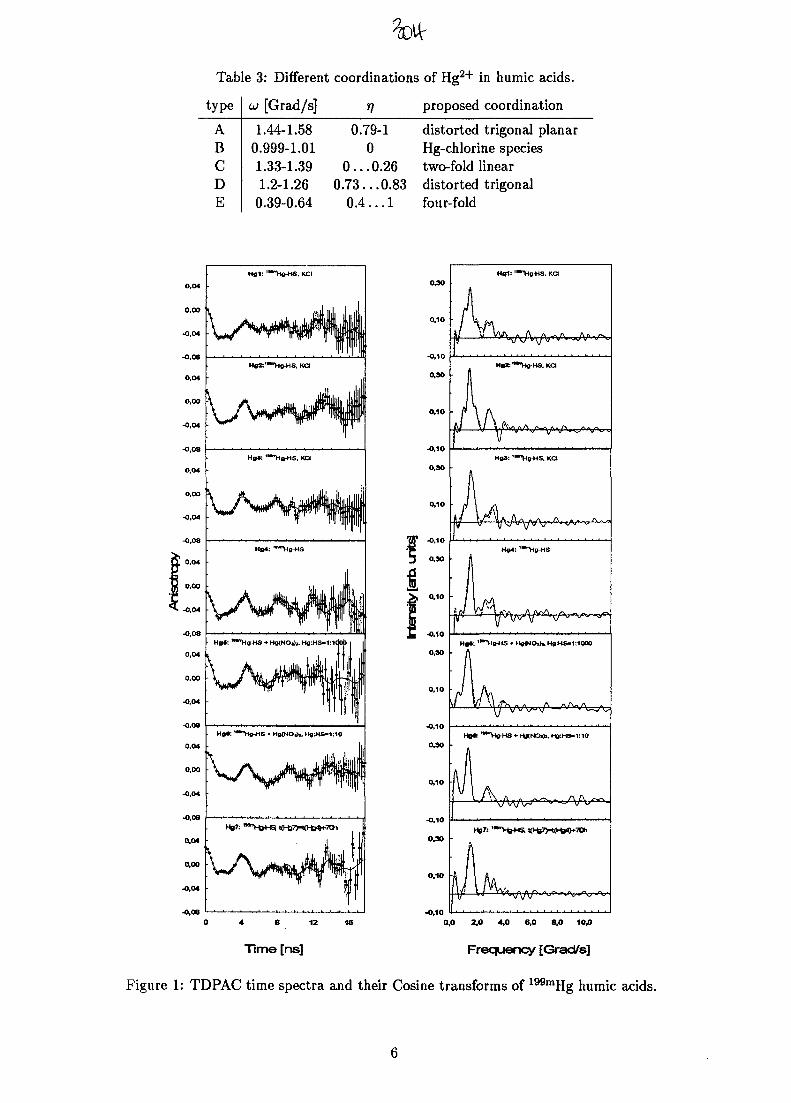
Table 3: Different coordinations of Hg2+ in humic acids.
type
ABCDE
w [Grad/s]
1.44-1.580.999-1.011.33-1.391.2-1.26
0.39-0.64
V0.79-1
00...0.26
0.73... 0.830.4... 1
proposed coordination
distorted trigonal planarHg-chlorine speciestwo-fold lineardistorted trigonalfour-fold
0,30
0,10
•0,10
0,30
0,10
-0,10
0,30
-0,10
0,30
'a.9i -0,10
0,30
0,10
-0,10
0,30
0,10
-O.10
O30
0,10
-0,10
Hy*"*"H>-HS. KO
0,0 2.0 4,0 6,0 8,0
Time [ns] Frequency [Grad/s]
Figure 1: TDPAC time spectra and their Cosine transforms of 199mHg humic acids.
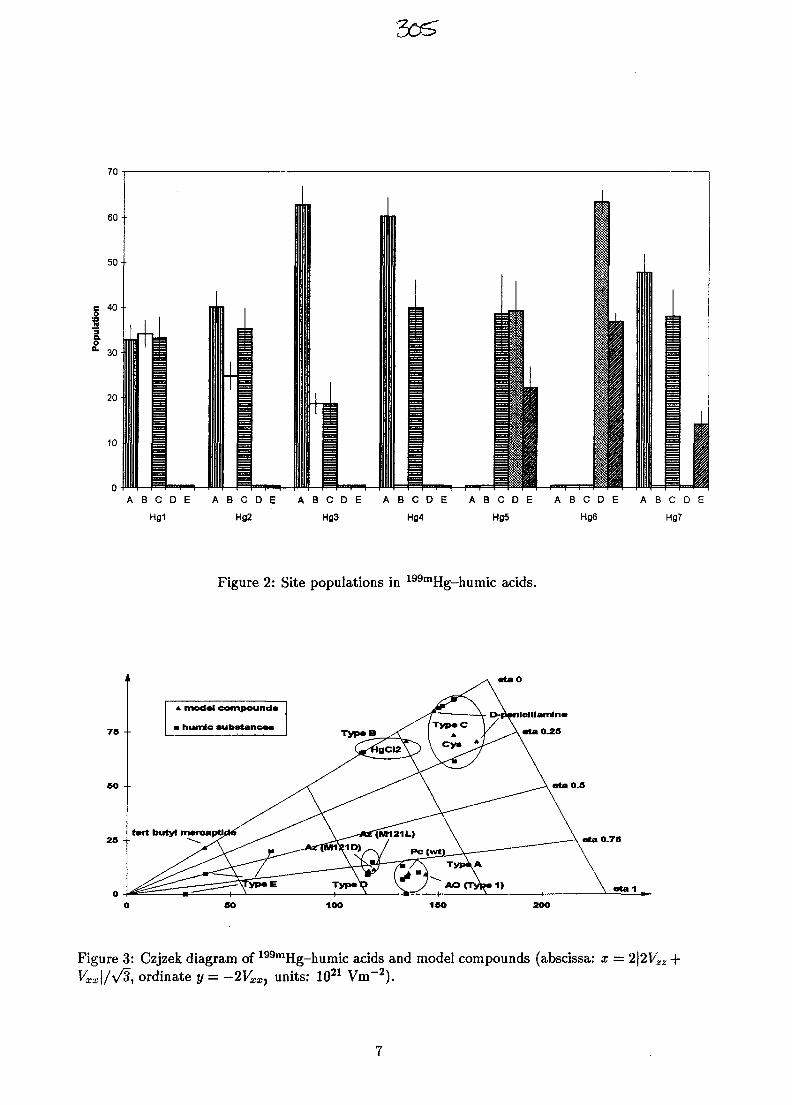
A B C D E A B C D E A B C D E A B O D E A B O D E A B O D E A B C D E
Figure 2: Site populations in 199mHg-humic acids.
75 -•
modal compounds
humlc subttanoM
tort butyl mareapU)
TypeB
•taO
D-ppnldllamlna
0.28
1 0 0 1 8 0 2O0
Figure 3: Czjzek diagram of 199mHg-humic acids and model compounds (abscissa: x = 2|2V^ -f-Vxx\/y/3, ordinate y = -2VXX} units: 1021 Vm~2).
AU9817356
FRM-II: A new Reactor also for Isotope Production
H. GERSTENBERG AND W.WASCHKOWSKIZBE FRM-II, Technische Universitat Munchen
Lichtenbergstrasse, D-85747 Garching, Germany
SUMMARY. The "Forschungsreaktor Munchen II" (FRM-II) is a multipurpose research reactorwhich is being built by the Technical University of Munich and which will be available in 2001. Itssingle fuel element reactor core being operated at 20 MW thermal power will be installed within a heavywater moderator tank. Besides the well thermalized neutron spectrum this design provides the particularadvantage that the maximum of the flux density ( O ^ « 8xlO14 cm'V 1 ) will be located outside of thecore volume and thus be available for experimental purposes. The FRM-II will mainly be used forbeamtube experiments; in addition, however, it will be equipped with various irradiation facilitiesamong these a pneumatic dispatch system and an automatically operated fast pneumatic dispatch setupfor the investigation of short-lived isotopes. A hydraulic dispatch system will offer the possibility ofhigh dose irradiations. Finally the FRM-II will be equipped with a silicon doping facility to be operatedon an industrial scale. Optionally the corresponding irradiation channels will also be available for theinsertion of a rotating sample holder or the irradiation of voluminous specimens.
1. INTRODUCTION
Since almost 40 years the TechnicalUniversity of Munich (TUM) is operating the"Forschungsreaktor Munchen" (FRM), a lightwater moderated 4 MW swimming poolreactor of the MTR-type. Among otherpurposes like the education of students orsystematic investigations in the field ofneutron scattering the conduction ofirradiation experiments for the benefit of basicresearch and industrial applications is animportant task of the FRM. This statement issupported by the number of more than 53,000irradiations which have been conducted at theFRM so far.
With respect to today's requirements regardingthe neutron flux density and the neutronspectrum, however, the FRM is under certainaspects not competitive any more. Thereforethe Technical University of Munich hasdesigned a new reactor - the "Forschungsreak-tor Munchen II" (FRM-II) - which is beingbuilt presently in close vicinity to the FRM.The main purpose of the FRM-II is the supplyof neutrons for beamtube experiments. On theother hand, however, it will be equipped with
various irradiation facilities which will cover abroad band of potential irradiationrequirements.
The FRM-II is under construction sincesummer 1996. According to the presentschedule it will be available for firstexperiments in 2001.
2. GENERAL DESIGN OF THE FRM-II
The central component of the FRM-II is avery compact single fuel element corecontaining approximately 8.1 kg of highdensity uranium silicide fuel contained in analuminum dispersion. The U-235 enrichmentis 93%. The reactor will generate a thermalpower of 20 MW.
Geometrically the core is designed in form oftwo concentric cylinders with inner and outerdiameters of 113 mm and 243 mm,respectively, and an active height of 700 mm.A total of 113 identical fuel plates beingcurved to involute shape are welded betweenthe concentric cylinders thus providing coolingchannels of a constant width of 2.2 mm. Inorder to limit the power density in the
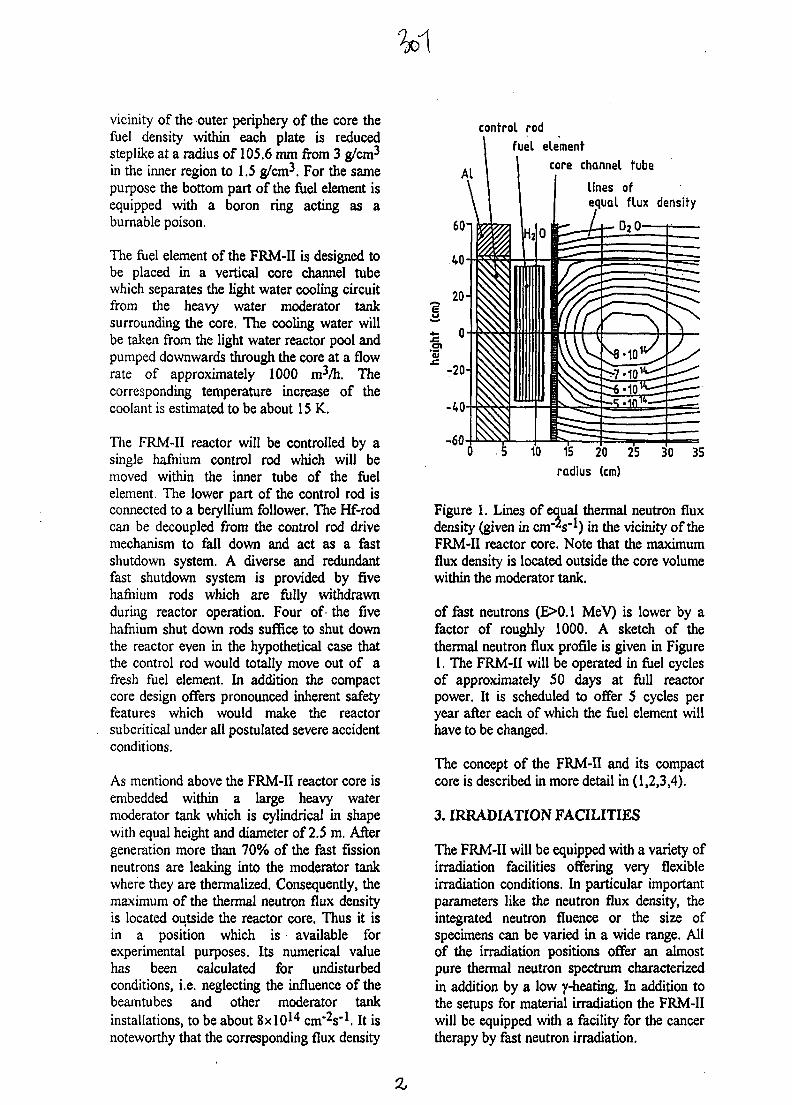
y\
vicinity of the outer periphery of the core thefuel density within each plate is reducedsteplike at a radius of 105.6 mm from 3 g/cm3
in the inner region to 1.5 g/cm3. For the samepurpose the bottom part of the fuel element isequipped with a boron ring acting as aburnable poison.
The fuel element of the FRM-II is designed tobe placed in a vertical core channel tubewhich separates the light water cooling circuitfrom the heavy water moderator tanksurrounding the core. The cooling water willbe taken from the light water reactor pool andpumped downwards through the core at a flowrate of approximately 1000 m3/h. Thecorresponding temperature increase of thecoolant is estimated to be about 15 K.
The FRM-II reactor will be controlled by asingle hafnium control rod which will bemoved within the inner tube of the fuelelement. The lower part of the control rod isconnected to a beryllium follower. The Hf-rodcan be decoupled from the control rod drivemechanism to fall down and act as a fastshutdown system. A diverse and redundantfast shutdown system is provided by fivehafnium rods which are fully withdrawnduring reactor operation. Four of- the fivehafnium shut down rods suffice to shut downthe reactor even in the hypothetical case thatthe control rod would totally move out of afresh fuel element. In addition the compactcore design offers pronounced inherent safetyfeatures which would make the reactorsubcritical under all postulated severe accidentconditions.
As mentiond above the FRM-II reactor core isembedded within a large heavy watermoderator tank which is cylindrical in shapewith equal height and diameter of 2.5 m. Aftergeneration more than 70% of the fast fissionneutrons are leaking into the moderator tankwhere they are thermalized. Consequently, themaximum of the thermal neutron flux densityis located outside the reactor core. Thus it isin a position which is available forexperimental purposes. Its numerical valuehas been calculated for undisturbedconditions, i.e. neglecting the influence of thebeamtubes and other moderator tankinstallations, to be about 8xlO14 ernes'1. It isnoteworthy that the corresponding flux density
Al
control rod
fuel elementcore channel tube
lines ofequal flux density
DjO-
10 15 20 25 30 35
radius (cm)
Figure 1. Lines of equal thermal neutron fluxdensity (given in ernes'*) in the vicinity of theFRM-II reactor core. Note that the maximumflux density is located outside the core volumewithin the moderator tank.
of fast neutrons (E>0.1 MeV) is lower by afactor of roughly 1000. A sketch of thethermal neutron flux profile is given in Figure1. The FRM-II will be operated in fuel cyclesof approximately 50 days at full reactorpower. It is scheduled to offer 5 cycles peryear after each of which the fuel element willhave to be changed.
The concept of the FRM-II and its compactcore is described in more detail in (1,2,3,4).
3. IRRADIATION FACILITIES
The FRM-II will be equipped with a variety ofirradiation facilities offering very flexibleirradiation conditions. In particular importantparameters like the neutron flux density, theintegrated neutron fluence or the size ofspecimens can be varied in a wide range. Allof the irradiation positions offer an almostpure thermal neutron spectrum characterizedin addition by a low y-heating. In addition tothe setups for material irradiation the FRM-IIwill be equipped with a facility for the cancertherapy by fast neutron irradiation.
The irradiation service of the FRM-II will beopen for interested parties from universities,research institutes and industry as well. Inparticular the silicon doping and eventuallythe isotope production for applications inmedicine and technique is scheduled to becarried out on a commercial base.
In the following sections some of the variousirradiation setups will be presented in moredetail.
3.1 Pneumatic dispatch facility
The pneumatic dispatch facility is assigned tothe short term irradiation of small specimens.One of its major tasks will be to providesamples for neutron activation analysis ortracer experiments. Since the neighbouringinstitute for radiochemistry of the TUM is oneof the most important users in these fields ofscience it will be connected to the unloadingstation of the irradiation facility by means ofan underground transportation tube allowingthe fast and easy delivery of specimens. Thecorresponding data will be sentsimultaneously via a computer network.
The facility will consist of six independentirradiation channels being arranged in twobundles. The corresponding irradiationpositions are located within the heavy watermoderator tank in a distance of 550 mm (1.bundle) and 700 mm (2. bundle) from thecentral axis of the cylindrical reactor core.According to their different height coordinatesthe six irradiation channels will offer thermalneutron flux densities between 5xlO*2
c n r V 1 and 2xlO14 cm 'V 1 . All of the nearcore installations will be manufactured fromAlMg3, a low activation and easy machinablematerial. The facility will be suited forspecimens with a maximum volume of 13 cnPwhich will be contained in polyimide capsules(diameter » 24 mm, length «110 mm) duringirradiation. This material offers the particularadvantage of negligible activitation andtemperature stability up to more than 100°Cwhereas according to finite elementcalculations even under saturation conditionsthe empty capsule is heated by about 5 K onlydue to B- and y-radiation. On the other handbecause of radiolysis the maximum applicable
dose is limited by the capsule material toapproximately 10*** cm'2.
A separate control and handling room for thepneumatic dispatch facility will be available inthe reactor building. It will contain the twocentral components of the facility, namely thecontrol computer and the pneumatic system.The latter will consist of the gas supply, ablowing, machine, the connecting tubesbetween the handling room and the irradiationpositions and two glove boxes containing thesetups for loading and unloading. High purityCO2 gas was choosen for the operation of theentire pneumatic system because of its lowactivation properties and its chemical inertia.In order to avoid to load the systemaccidentally with an unacceptable excesspresssure the necessary volume of gas foreach transportation process will be suppliedfrom two pressure vessels of 2 1 (insertion ofthe capsule) and 8 1 (extraction), respectively,both of which will be kept at 2.5 bars. Theexpansion of these pressure vessels willproduce a pressure peak which will acceleratethe capsule on its first meters to a velocity ofabout 10 m/s. For the remaining distance thecapsule will be slided with constant velocityby the gas stream produced by the blowingmachine. The loading and unloading devicesfor each irradiation channel will be arrangedin a lead shielded glove box which will be apart of the pneumatic system. According tothis design the entire handling of thespecimens will be done in a controlled CO2atmosphere. Consequently the danger of aparasitic Ar-41 production due to theunintended irradiation of air being containedin the capsules is minimized. In addition dueto the installation of the unloading devicewithin a glove box any possible contaminationby e.g. rupture of a capsule will be restrictedto the irradiation facility alone. Finally apermanent contamination control is foreseenby means of an aerosol monitoring systembeing installed within the off-gas of thepneumatic dispatch facility.
In order to guarantee a proper function of theentire pneumatic dispatch facility a permanentcomputer control will be available. Besidesthe detection of general malfunctions like e.g.a loss of pressure or the input of humiditity
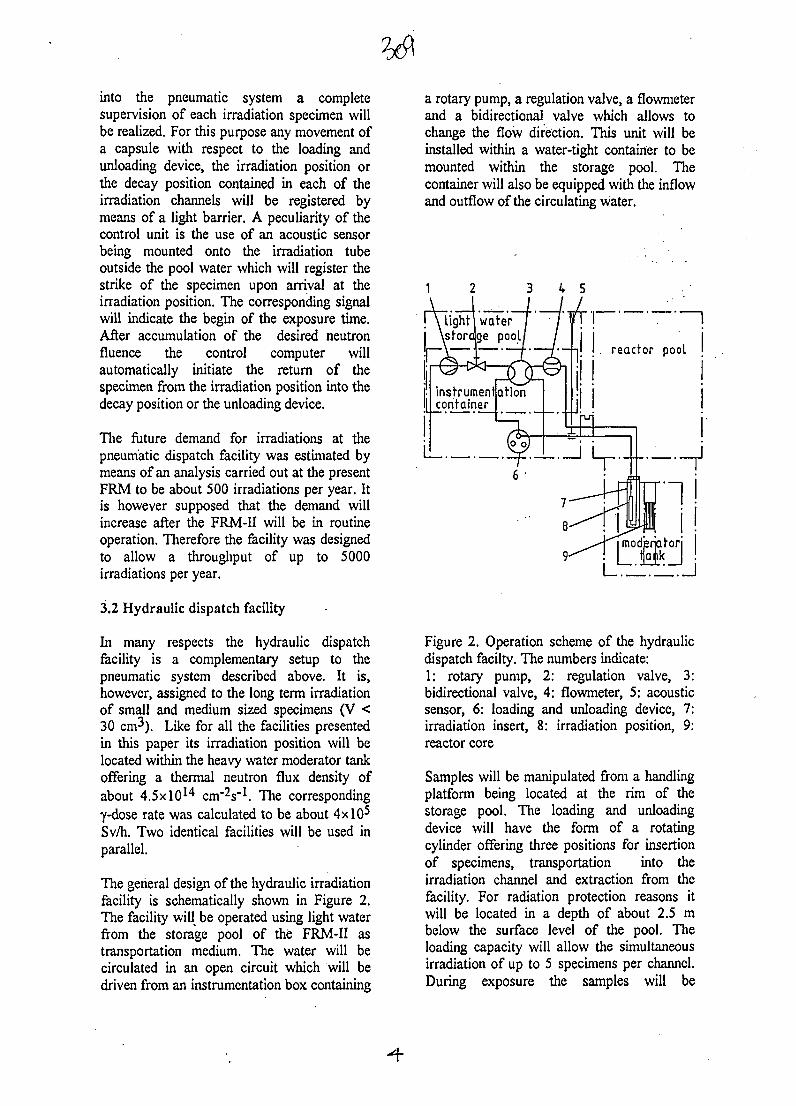
into the pneumatic system a completesupervision of each irradiation specimen willbe realized. For this purpose any movement ofa capsule with respect to the loading andunloading device, the irradiation position orthe decay position contained in each of theirradiation channels will be registered bymeans of a light barrier. A peculiarity of thecontrol unit is the use of an acoustic sensorbeing mounted onto the irradiation tubeoutside the pool water which will register thestrike of the specimen upon arrival at theirradiation position. The corresponding signalwill indicate the begin of the exposure time.After accumulation of the desired neutronfluence the control computer willautomatically initiate the return of thespecimen from the irradiation position into thedecay position or the unloading device.
The future demand for irradiations at thepneumatic dispatch facility was estimated bymeans of an analysis carried out at the presentFRM to be about 500 irradiations per year. Itis however supposed that the demand willincrease after the FRM-II will be in routineoperation. Therefore the facility was designedto allow a throughput of up to 5000irradiations per year.
3.2 Hydraulic dispatch facility
In many respects the hydraulic dispatchfacility is a complementary setup to thepneumatic system described above. It is,however, assigned to the long term irradiationof small and medium sized specimens (V <30 cm^). Like for all the facilities presentedin this paper its irradiation position will belocated within the heavy water moderator tankoffering a thermal neutron flux density ofabout 4.5x10*4 cm'^s'l. The correspondingy-dose rate was calculated to be about 4x10^Sv/h. Two identical facilities will be used inparallel.
The general design of the hydraulic irradiationfacility is schematically shown in Figure 2.The facility wiH be operated using light waterfrom the storage pool of the FRM-II astransportation medium. The water will becirculated in an open circuit which will bedriven from an instrumentation box containing
a rotary pump, a regulation valve, a flowmeterand a bidirectional valve which allows tochange the flow direction. This unit will beinstalled within a water-tight container to bemounted within the storage pool. Thecontainer will also be equipped with the inflowand outflow of the circulating water.
—-il I reactor pool
instrumennationcontainer
f i moderator
[JlMUj
Figure 2. Operation scheme of the hydraulicdispatch facilty. The numbers indicate:1: rotary pump, 2: regulation valve, 3:bidirectional valve, 4: flowmeter, 5: acousticsensor, 6: loading and unloading device, 7:irradiation insert, 8: irradiation position, 9:reactor core
Samples will be manipulated from a handlingplatform being located at the rim of thestorage pool. The loading and unloadingdevice will have the form of a rotatingcylinder offering three positions for insertionof specimens, transportation into theirradiation channel and extraction from thefacility. For radiation protection reasons itwill be located in a depth of about 2.5 mbelow the surface level of the pool. Theloading capacity will allow the simultaneousirradiation of up to 5 specimens per channel.During exposure the samples will be
contained in standard Al-capsules which aresuitable for multiple use. Outside of themoderator tank two separate tubes will beavailable for the transportation of thecapsules and the backflow of the circulatingwater. In contrast, within the heavy water tankboth of the above tubes are combined to asingle insert and the circulation is maintainedin form of a concentric arrangement.
The control instrumentation of the hydraulicdispatch facility will be similar to the one forthe pneumatic setup. Light barriers will beavailable in the loading and unlaoding devicein order to register outgoing and incomingirradiation capsules and an acoustic sensorwill be used for the proper registration of theirradiation start.
3.3 High flux pneumatic dispatch facility
The FRM-II will be equipped with a high fluxirradiation facility being designed as a"medium-fast" pneumatic dispatch system. Itwill primarily be used for the neutronactivation analysis of short-lived radioisotopesexhibiting decay times in the order of fewseconds. Under standard conditions theseisotopes will be activated up to saturation.Consequently the sensitivity of themeasurement is directly correlated- to theneutron flux density. Therefore the irradiationposition of the facility will provide the highestavailable flux density, namely O « 6x10^cm'^s'l. Alternatively the same setup will beused for the high sensitivity detection offission materials via delaied neutrons.
The main requirement for the facility is toguarantee a rapid delivery of the activatedspecimen to the measuring device.Consequently all handling will take place inthe reactor building thus keeping thetransportation lengths short and the deliverytimes below 2 s. In order to fulfil this requesta capsule design of an outer transport capsuleexhibiting a lateral slit and an inner sampleholder containing the specimen has beendeveloped. Upon arrival at the measuringposition the route of the transportation tubesis curved in a way that will lead to theautomatic separation of both capsules bymeans of the centrifugal force. Finally the
sample holder containing the specimen will beslowed down dynamically by transformationof transversal into rotational kinetic energy,and it will be stopped softly at the measuringposition which of course will be lead shieldedin order to minimize the background radiation.Simultaneously a light barrier will start themeasurement.
For the construction and operation of the highflux facility mostly the same materials will beused as for the standard setup, i.e. theirradiation insert will be manufactured fromAlMg3 and CO2 will be used for thetransportation. The irradiation insert withinthe moderator tank, however, will beconstructed in form of a thimble. Thus lightwater from the pool will be used as coolant.The transport capsules will be made frompolyimide. They will, however, be rectangularin shape in order to guarantee a fixedgeometry for the separation of the innersample holder. In addition this designguarantees the abrasion from the capsule to besmall even in case of high velocities.
3.4 Silicon doping facility
The neutron transmutation doping (NTD) ofsilicon [Si-30 (n,y) Si-31—B->P-31] is anapplication of the FRM-II which will becarried out on an industrial scale. The reactorwill offer two irradiation channels for theNTD of Si crystals with diameters of up to 4"and up to 8", respectively. All of the crystalsare supposed to be 500 mm in height. Thetotal doping capacity of both channels isscheduled to be approximately 10 t/year.
Each of the irradiation channels will beinstalled in a vertical tube. In order to achievethe required high homogeneity of the dopingprofile the crystals will be moved twicethrough the irradiation channel while they willbe rotated with respect to their central axis.The lead of the resulting helical motion will bematched to the vertical gradient of the neutronflux density. The desired doping concentrationcan be controlled in a wide range via thevelocity of the vertical motion: The minimumexposure time is about 3 minutescorresponding to a P-doping of 7x10^ cm"lOn the other hand there is no upper limit for
the exposure time from the engineering pointof view.
The axial distance of the irradiation channelsfrom the fuel element will be approximately1 m. In this distance even the introduction orextraction of large Si crystals is estimated tochange the reactivity of the reactor by 0.05%only. Moreover the change in reactivity will beslow enough that it can be compensated by thereactor control. In addition the crystals will besubject to a heat load the maximum value ofwhich will be approximately 6.7 kW for an 8"specimen contained in an AlMg3transportation cask. This heating power willbe dissipated to the light water from thereactor storage pool to be used as coolant. Thecorresponding power density at the crystalsurface is calculated to be about 1 W/cm^.Thus at a constant flow rate of 0.2 1/s thecooling water will be heated by 8 K only.
It is evident that the loading and unloading ofthe Si doping facility will be possible at fullreactor power. The entire handling of crystalsto be doped will be done remotely by means ofhandling tools which will be installed on amovable bridge spanning over the reactorpool.
Finally it has to be noted that the silicondoping facility can be used for other purposestoo. Alternatively a rotating sample holdersuitable for the irradiation of a large numberof small specimens under identical conditionscan be inserted into its irradiation channels. Afurther application will be to provide anirradiation position for large volumespecimens or in particular for liquids.
4. STATUS OF THE PROJECT
The project group FRM-II of the TechnicalUniversity of Munich is working since 1987.The application for a nuclear license wassubmitted in 1993 after the general concept ofthe reactor and the safety analysis report hadbeen worked out in collaboration with thecompany Sie'mens/KWU (the formerInteratom) which was appointed generalcontractor for the construction of the FRM-IIin 1994. In 1996 the first partial nuclear
license was granted covering the acceptance ofthe safety concept, site development andconstruction of the reactor building.
Right now the project group FRM-II andSiemens/KWU are working out the detaileddesign documents for the installation of allcomponents of the reactor facility. It isexpected that based on these documents thesecond step of nuclear licensing will beawarded by the German authorities still in1997.
The third and final partial nuclear license willcover the full reactor operation and isestimated to be obtained in 2001. The nuclearstart up will be followed by a 50 days test runat full power and finally by routine operation.
ACKNOWLEDGEMENTS
The authors are grateful to numerouscolleagues from the project group FRM-II, theFRM and the institute Faculty of Physics E21of the Technical University of Munich. Inparticular the support of K. B&ning, F.Gallmeier and J. Schmidt is acknowledged.
REFERENCES
1. K. Boning, U. Hennings, Proc. of the 4thMeeting of the Int. Group of ResearchReactors (IGORR-4), Gatlinburg, USA,May 24-25, 1995.
2. K. Boning, W. Glaser, U. Hennings, E.Steichele, atomwirtschaft 38, 61 (1993).
3. K. Boning, J. Blombach, The 14th Int.Meeting on Reduced Enrichment ofResearch and Test Reactors (RERTR),Jakarta, Indonesia Nov. 4-7, 1991.
4. A. Axmann, K. Boning, J. Blombach, 2ndInt. Conf. on Advanced Reactor Safety,Orlando, Florida, June 1-4, 1997.
312 AU9817357
Extractive 90Y-Generator
G.E. KODINA1, G.V. KORPUSOV2, A.T. FILYANIN2
1. State Scientific Center "Institute of Biophysics", 46 Zhivopisnaya St., 123182 Moscow,Russia, 2. Institute of Physical Chemistry of the Russian Academy of Sciences,31
Leninsky prosp., 117915 Moscow, Russia
SUMMARY. By now we have the 5-year experience of usage of the extractive centrifugalsemicountercurrent 90Y-generator for radiopharmaceutical purposes. The advantages of this method incompare with well known others are: in principal the productivity of the equipment is not practicallylimited - from tracer quantities to some tens of curies per one run; limits may be required by chemical orradiation damage of using materials and substances; the separation process would be realized during 30-60 min; the low 90Sr-contamination - about 10'9 % on the calibration date. The described method of90Y-separation is based on the semicountercurrent extraction process with phases inversion, that ismade on two consequently connected centrifugal contactors.
1. INTRODUCTION
Yttrium-90 was one of the first radionuclideused for open sources therapy. Nowadaysmore than 30 radionuclides are used for thispurpose, but the interest to the yttrium-90 doesnot decrease yet. This is due to its convenientnuclear physical properties: half-life is 64,2hours and maximum p-energy is 2,27 MeV.90Y is used for different therapeutic purposes,including radioimmunotheraphy with labeledantibodies, treatment of the liver tumors andrheumatic arthritis.
During last twenty years the Institute ofBiophysics produces and delivers according to aspecial order the colloidal radio-pharmaceuticals of 90Y for therapy of theinoperable and relapse craniopharyngiomas.
The radionuclide is obtained during the decay offission strontium-90. The main problem of thesafety clinical usage of 90Y is its completeseparation from 90Sr. 90Sr main cause the bonemarrow depression due to its accumulation inthe skeleton (1). Besides, as in the other casesof radionuclide production for medical usage,there are stringent requirements to the quantityof the chemical impurities which can terminatethe labeling. It is impossible to obtain the finalproduct with such stringent requirements in onestage. So the technology of 90Y separation from90Sr includes several stages of separation andpurification.
Wike et al, (1990) briefly describe theapplication of different multi-stages systems for90Y production of high quality for medicalusage (1). Each of these methods has its ownlimits. So the usage of organic ion-exchangersis limited by the low radiation stability of thesorbent. An application of the coprecipitationtechniques requires the carrier addition (non-radioactive yttrium). The authors describe thetechnology of 90Y production of high quantity(about 50 Ci per run), using the extraction90Y from 90Sr with the following additionalpurification of the final product on the ion-exchange sorbents. The extraction of 90Y iscarried out with 1,0 M solution of D2EHPA[di-(2-ethylhexyl)-phosphoric acid] in dodekanefrom 0,1 M solution of hydrochloric acid,containing 90Sr. Then the extract is washedthrice with equal volumes of 0,1 M solution ofhydrochloric acid for the removal of the 90Srtracers. 90Y is stripped with two portions of 6M HC1 at phase ratio 1:1. After stripping anaqueous phase is evaporated and the residue isdissolved in 0,1 M HC1. Then 90Y is extractedagain with 1,0 M solution of D2EHPA indodekane and is washed four times with 0,1 MHC1. 30 ml 9 M HC1 is used twice for secondstripping. The obtained aqueous solution of90Y is passed through anion-exchange sorbentfor impurities removal. The eluate isevaporated, dissolved in 0,1 M HC1 and passedthrough the column with cation-exchangesorbent for removal of the organic impurities
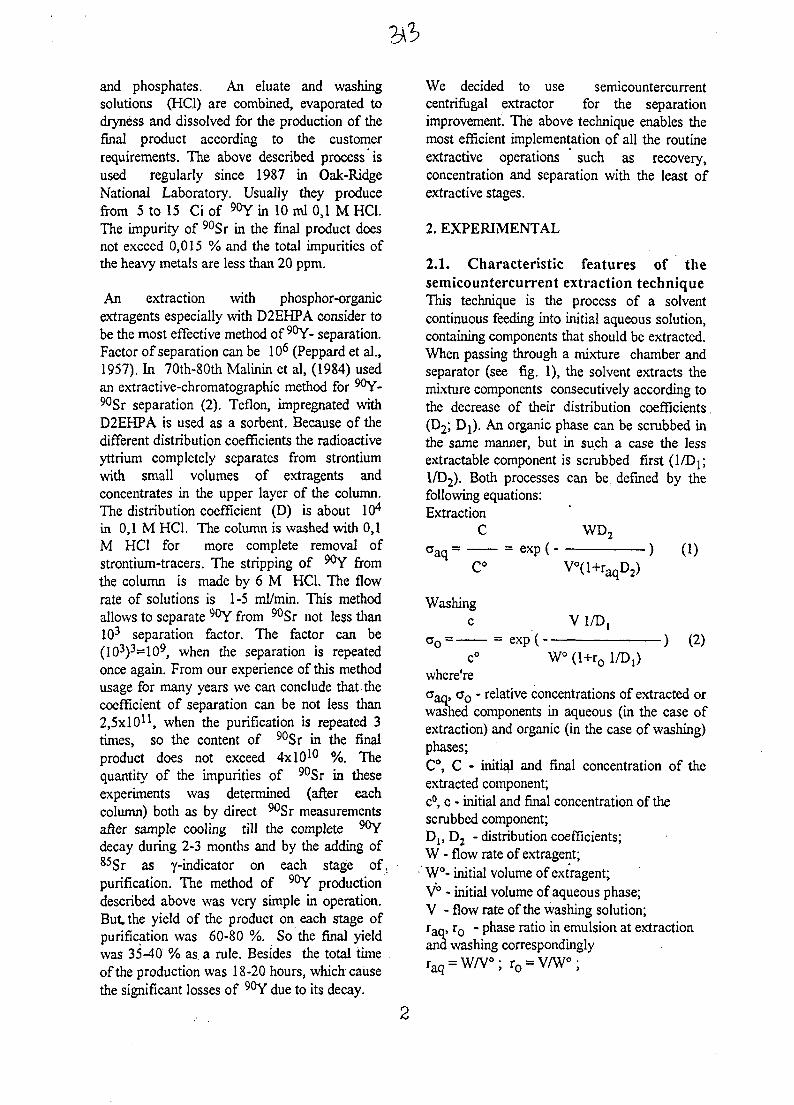
and phosphates. An eluate and washingsolutions (HC.1) are combined, evaporated todryness and dissolved for the production of thefinal product according to the customerrequirements. The above described process isused regularly since 1987 in Oak-RidgeNational Laboratory. Usually they producefrom 5 to 15 Ci of 90Y in 10 ml 0,1 M HC1.The impurity of 90Sr in the final product doesnot exceed 0,015 % and the total impurities ofthe heavy metals are less than 20 ppm.
An extraction with phosphor-organicextragents especially with D2EHPA consider tobe the most effective method of 90Y- separation.Factor of separation can be 106 (Peppard et al.,1957). In 70th~80th Malinin et al, (1984) usedan extractive-chromatographic method for 90Y-90Sr separation (2). Teflon, impregnated withD2EHPA is used as a sorbent. Because of thedifferent distribution coefficients the radioactiveyttrium completely separates from strontiumwith small volumes of extragents andconcentrates in the upper layer of the column.The distribution coefficient (D) is about 104
in O,1MHC1. The column is washed with 0,1M HC1 for more complete removal ofstrontium-tracers. The stripping of 90Y fromthe column is made by 6 M HCl. The flowrate of solutions is 1-5 ml/min. This methodallows to separate 90Y from 90Sr not less than103 separation factor. The factor can be(103)3=109, when the separation is repeatedonce again. From our experience of this methodusage for many years we can conclude that thecoefficient of separation can be not less than2,5x10* when the purification is repeated 3times, so the content of 90Sr in the finalproduct does not exceed 4xlO10 %. Thequantity of the impurities of 90Sr in theseexperiments was determined (after eachcolumn) both as by direct 90Sr measurementsafter sample cooling till the complete 90Ydecay during 2-3 months and by the adding of85Sr as y-indicator on each stage of,purification. The method of 90Y productiondescribed above was very simple in operation.But, the yield of the product on each stage ofpurification was 60-80 %. So the final yieldwas 35-40 % as. a rule. Besides the total timeof the production was 18-20 hours, which causethe significant losses of 90Y due to its decay.
We decided to use semicountercurrentcentrifugal extractor for the separationimprovement. The above technique enables themost efficient implementation of all the routineextractive operations such as recovery,concentration and separation with the least ofextractive stages.
2. EXPERIMENTAL
2.1. Characteristic features of thesemicountercurrent extraction techniqueThis technique is the process of a solventcontinuous feeding into initial aqueous solution,containing components that should be extracted.When passing through a mixture chamber andseparator (see fig. 1), the solvent extracts themixture components consecutively according tothe decrease of their distribution coefficients.(D2; D^ . An organic phase can be scrubbed inthe same manner, but in such a case the lessextractable component is scrubbed first (1/Dj;1/D2). Both processes can be defined by thefollowing equations:Extraction
C WD2
_ = e x p ( ) (i)a a q ~V°(l+raqD2)
Washingc V l / D ,
- = exp(--W° (l+r0
•) (2)a o =c°
where'reaaq, a 0 - relative concentrations of extracted orwashed components in aqueous (in the case ofextraction) and organic (in the case of washing)phases;C°, C - initial and final concentration of theextracted component;c°, c - initial and final concentration of thescrubbed component;D,, D2 - distribution coefficients;W - flow rate of extragent;W°- initial volume of extragent;V° - initial volume of aqueous phase;V - flow rate of the washing solution;raq, r0 - phase ratio in emulsion at extractionand washing correspondingly
ro = V/W°;
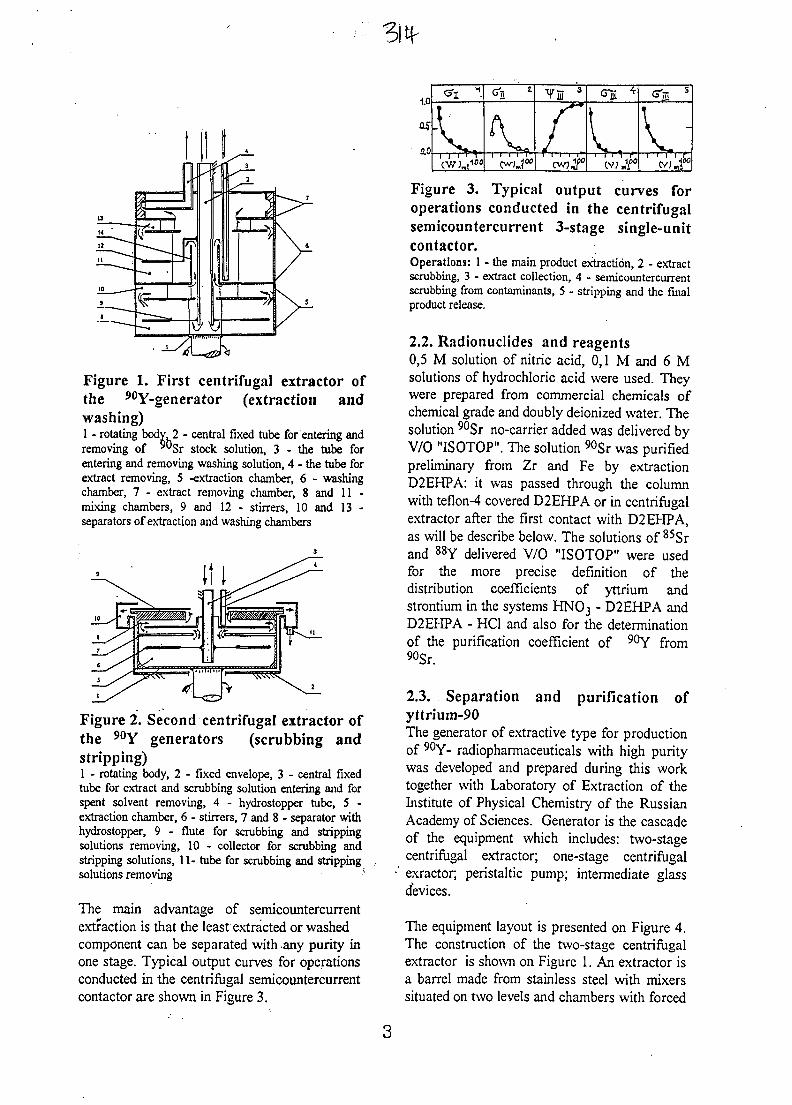
Figure 1. First centrifugal extractor ofthe 90Y-generator (extraction andwashing)1 - rotating body 2 - central fixed tube for entering andremoving of ^ S r stock solution, 3 - the tube forentering and removing washing solution, 4 - the tube forextract removing, 5 -extraction chamber, 6 - washingchamber, 7 - extract removing chamber, 8 and 11 -mixing chambers, 9 and 12 - stirrers, 10 and 13 -separators of extraction and washing chambers
Figure 2. Second centrifugal extractor ofthe 90Y generators (scrubbing andstripping)1 - rotating body, 2 - fixed envelope, 3 - central fixedtube for extract and scrubbing solution entering and forspent solvent removing, 4 - hydrostopper tube, 5 -extraction chamber, 6 - stirrers, 7 and 8 - separator withhydrostopper, 9 - flute for scrubbing and strippingsolutions removing, 10 - collector for scrubbing andstripping solutions, 11- tube for scrubbing and strippingsolutions removing :
The main advantage of semicountercurrentextraction is that the least extracted or washedcomponent can be separated with any purity inone stage. Typical output curves for operationsconducted in the centrifugal semicountercurrentcontactor are shown in Figure 3.
Figure 3. Typical output curves foroperations conducted in the centrifugalsemicountercurrent 3-stage single-unitcontactor.Operations: 1 - the main product extraction, 2 - extractscrubbing, 3 - extract collection, 4 - semicountercurrentscrubbing from contaminants, 5 - stripping and the finalproduct release.
2.2. Radionuclides and reagents0,5 M solution of nitric acid, 0,1 M and 6 Msolutions of hydrochloric acid were used. Theywere prepared from commercial chemicals ofchemical grade and doubly deionized water. Thesolution 90Sr no-carrier added was delivered byV/O "ISOTOP". The solution 90Sr was purifiedpreliminary from Zr and Fe by extractionD2EHPA: it was passed through the columnwith teflon-4 covered D2EHPA or in centrifugalextractor after the first contact with D2EHPA,as will be describe below. The solutions of 85Srand 88Y delivered V/O "ISOTOP" were usedfor the more precise definition of thedistribution coefficients of yttrium andstrontium in the systems HN0 3 " D2EHPA andD2EHPA - HC1 and also for the determinationof the purification coefficient of 90Y from90Sr.
2.3. Separation and purification ofyttrium-90The generator of extractive type for productionof 90Y- radiopharmaceuticals with high puritywas developed and prepared during this worktogether with Laboratory of Extraction of theInstitute of Physical Chemistry of the RussianAcademy of Sciences. Generator is the cascadeof the equipment which includes: two-stagecentrifugal extractor; one-stage centrifugalexractor; peristaltic pump; intermediate glassdevices.
The equipment layout is presented on Figure 4.The construction of the two-stage centrifugalextractor is shown on Figure 1. An extractor isa barrel made from stainless steel with mixerssituated on two levels and chambers with forced
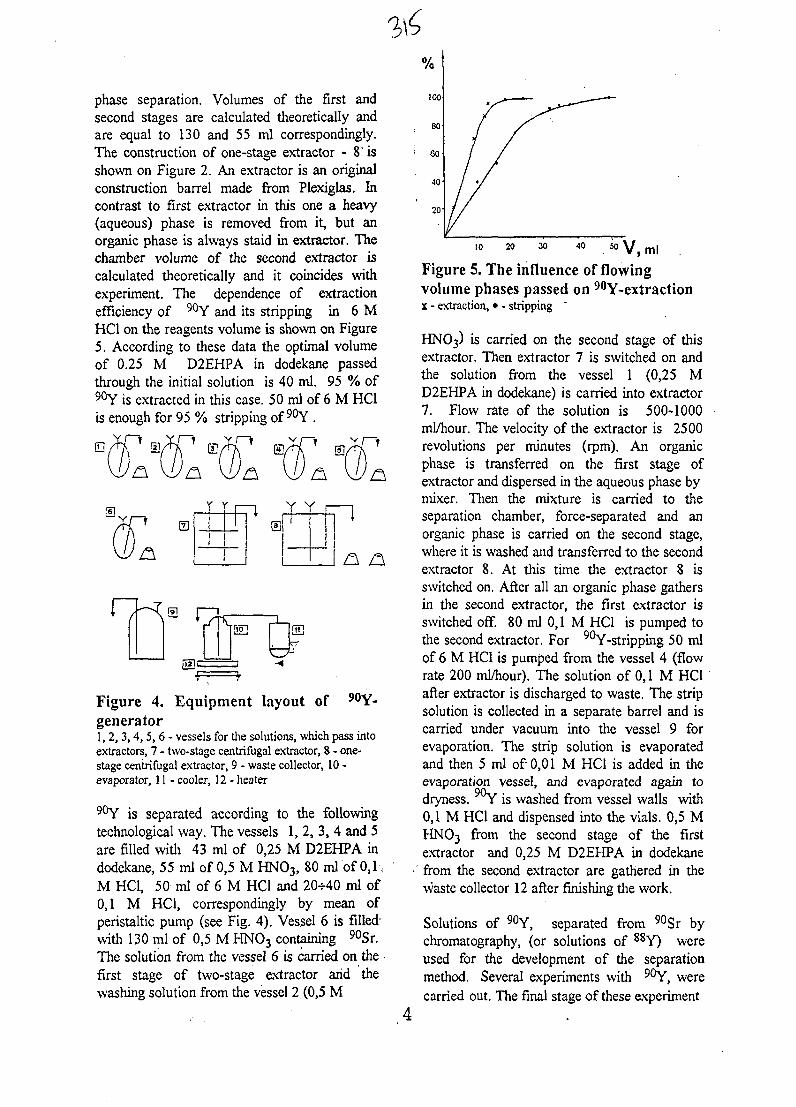
phase separation. Volumes of the first andsecond stages are calculated theoretically andare equal to 130 and 55 ml correspondingly.The construction of one-stage extractor - 8" isshown on Figure 2. An extractor is an originalconstruction barrel made from Plexiglas. Incontrast to first extractor in this one a heavy(aqueous) phase is removed from it, but anorganic phase is always staid in extractor. Thechamber volume of the second extractor iscalculated theoretically and it coincides withexperiment. The dependence of extractionefficiency of 90Y and its stripping in 6 MHCl on the reagents volume is shown on Figure5. According to these data the optimal volumeof 0.25 M D2EHPA in dodekane passedthrough the initial solution is 40 ml. 95 % of90Y is extracted in this case. 50 ml of 6 M HClis enough for 95 % stripping of 90Y .
Figure 4. Equipment layout of 90Y-generator1,2 ,3 ,4 ,5 ,6 - vessels for the solutions, which pass intoextractors, 7 - two-stage centrifugal extractor, 8 - one-stage centrifugal extractor, 9 - waste collector, 10 -evaporator, 11 - cooler, 12 - heater
90Y is separated according to the followingtechnological way. The vessels 1, 2, 3, 4 and 5are filled with 43 ml of 0,25 M D2EHPA indodekane, 55 ml of 0,5 M HN03 , 80 ml of 0,1.M HCl, 50 ml of 6 M HCl and 20+40 ml of0,1 M HCl, correspondingly by mean ofperistaltic pump (see Fig. 4). Vessel 6 is filled'with 130 ml of 0,5 M HN03 containing 90Sr.The solution from the vessel 6 is carried on thefirst stage of two-stage extractor arid thewashing solution from the vessel 2 (0,5 M
40 50 V, ml .Figure 5. The influence of flowingvolume phases passed on 90Y-extractionx - extraction, • - stripping
HNO3) is carried on the second stage of thisextractor. Then extractor 7 is switched on andthe solution from the vessel 1 (0,25 MD2EHPA in dodekane) is carried into extractor7. Flow rate of the solution is 500-1000ml/hour. The velocity of the extractor is 2500revolutions per minutes (rpm). An organicphase is transferred on the first stage ofextractor and dispersed in the aqueous phase bymixer. Then the mixture is carried to theseparation chamber, force-separated and anorganic phase is carried on the second stage,where it is washed and transferred to the secondextractor 8. At this time the extractor 8 isswitched on. After all an organic phase gathersin the second extractor, the first extractor isswitched off. 80 ml 0,1 M HCl is pumped tothe second extractor. For 90Y-stripping 50 mlof 6 M HCl is pumped from the vessel 4 (flowrate 200 ml/hour). The solution of 0,1 M HClafter extractor is discharged to waste. The stripsolution is collected in a separate barrel and iscarried under vacuum into the vessel 9 forevaporation. The strip solution is evaporatedand then 5 ml of 0,01 M HCl is added in theevaporation vessel, and evaporated again todryness. nf is washed from vessel walls with0,1 M HCl and dispensed into the vials. 0,5 MHNO3 from the second stage of the firstextractor and 0,25 M D2EHPA in dodekane
-' from the second extractor are gathered in thewaste collector 12 after finishing the work.
Solutions of 90Y, separated from 90Sr bychromatography, (or solutions of 88Y) wereused for the development of the separationmethod. Several experiments with 90Y, werecarried out. The final stage of these experiment
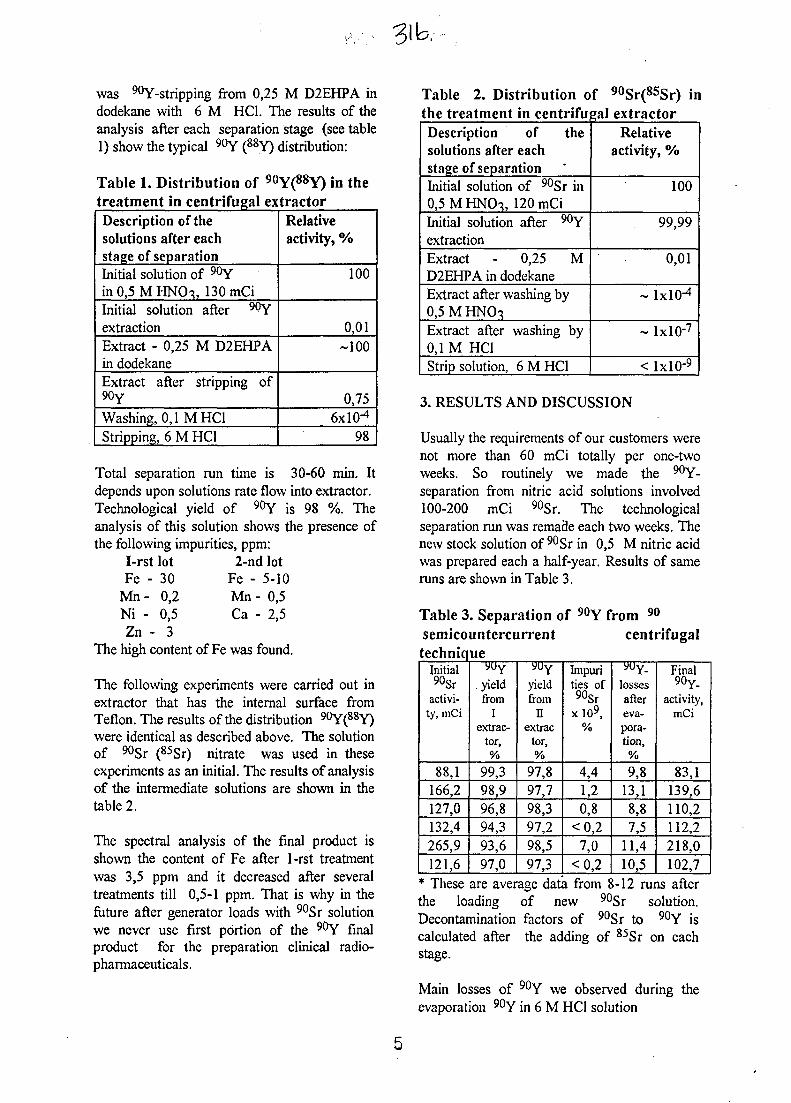
was 90Y-stripping from 0,25 M D2EHPA indodekane with 6 M HC1. The results of theanalysis after each separation stage (see table1) show the typical 90Y (88Y) distribution:
Table 1. Distribution of 90Y(88y) in thetreatment in centrifugal extractor
Table 2. Distribution of 90Sr(85Sr) inthe treatment in centrifugal extractor
Description of thesolutions after eachstage of separationInitial solution of 90Yin 0,5 M HNOq, 130 mCiInitial solution after 9(?YextractionExtract - 0,25 M D2EHPAin dodekaneExtract after stripping of90y
Washing, 0,1 MHC1Stripping, 6 M HC1
Relativeactivity, %
100
0,01-100
0,756X10-4
98
Total separation run time is 30-60 min. Itdepends upon solutions rate flow into extractor.Technological yield of 90Y is 98 %. Theanalysis of this solution shows the presence ofthe following impurities, ppm:
I-rst lot 2-nd lotFe - 30 Fe - 5-10
Mn- 0,2 Mn- 0,5Ni - 0,5 Ca - 2,5Zn - 3
The high content of Fe was found.
The following experiments were carried out inextractor that has the internal surface fromTeflon. The results of the distribution 9OY(88y)were identical as described above. The solutionof 90Sr (85Sr) nitrate was used in theseexperiments as an initial. The results of analysisof the intermediate solutions are shown in thetable 2.
The spectral analysis of the final product isshown the content of Fe after 1-rst treatmentwas 3,5 ppm and it decreased after severaltreatments till 0,5-1 ppm. That is why in thefuture after generator loads with 90Sr solutionwe never use first portion of the 90Y finalproduct for the preparation clinical radio-pharmaceuticals.
Description of thesolutions after eachstage of separationInitial solution of 90Sr in0,5 M HNCh, 120 mCiInitial solution after 90YextractionExtract - 0,25 MD2EHPA in dodekaneExtract after washing by0,5MHNChExtract after washing by0,1 M HC1Strip solution, 6MHC1
Relativeactivity, %
100
99,99
0,01
~ lxl(H
~ lxlO'7
< lxlO-9
3. RESULTS AND DISCUSSION
Usually the requirements of our customers werenot more than 60 mCi totally per one-twoweeks. So routinely we made the 90Y-separation from nitric acid solutions involved100-200 mCi 90Sr. The technologicalseparation run was remade each two weeks. Thenew stock solution of 90Sr in 0,5 M nitric acidwas prepared each a half-year. Results of sameruns are shown in Table 3.
Table 3. Separation of 9 0Y from 9 0
semicountercurrent centrifugaltechnique
Initial90Sr
activi-ty, mCi
88,1166,2127,0132,4265,9121,6
yuyyieldfrom
Iextrac-
tor,
99,398,996,894,393,697,0
yuyyieldfrom
nextrac
tor,
97,897,798,397,298,597,3
Impurities of
9 0SrxlO9,
%
4,41,20,8
<0,27,0
<0,2
VUy.
lossesaftereva-pora-tion,
9,813,18,87,5
11,410,5
Final90y.
activity,mCi
83,1139,6110,2112,2218,0102,7
* These are average data from 8-12 runs afterthe loading of new 90Sr solution.Decontamination factors of 90Sr to 90Y iscalculated after the adding of 85Sr on eachstage.
Main losses of 90Y we observed during theevaporation 90Y in 6 M HC1 solution
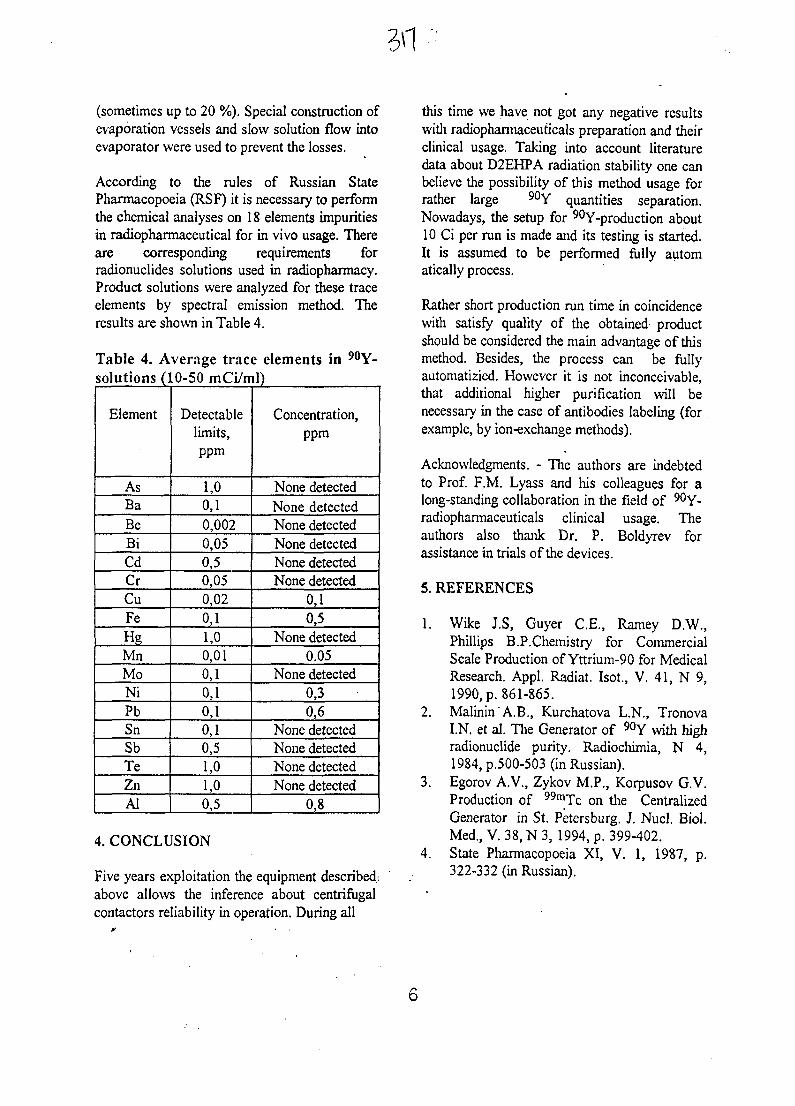
(sometimes up to 20 %). Special construction ofevaporation vessels and slow solution flow intoevaporator were used to prevent the losses.
According to the rules of Russian StatePharmacopoeia (RSF) it is necessary to performthe chemical analyses on 18 elements impuritiesin radiopharmaceutical for in vivo usage. Thereare corresponding requirements forradionuclides solutions used in radiopharmacy.Product solutions were analyzed for these traceelements by spectral emission method. Theresults are shown in Table 4.
Table 4. Average trace elements in 90Y-solutions (10-50 mCi/ml)
Element
AsBaBeBiCdCrCuFeHgMnMoNiPbSnSbTeZnAl
Detectablelimits,ppm
1,00,10,0020,050,50,050,02
0,11,00,010,10,10,10,10,51,01,00,5
Concentration,ppm
None detectedNone detectedNone detectedNone detectedNone detectedNone detected
0,10,5
None detected0.05
None detected0,30,6
None detectedNone detectedNone detectedNone detected
0,8
4. CONCLUSION
Five years exploitation the equipment described/,above allows the inference about centrifugalcontactors reliability in operation. During all
this time we have not got any negative resultswith radiopharmaceuticals preparation and theirclinical usage. Taking into account literaturedata about D2EHPA radiation stability one canbelieve the possibility of this method usage forrather large 90Y quantities separation.Nowadays, the setup for 90Y-production about10 Ci per run is made and its testing is started.It is assumed to be performed fully automatically process.
Rather short production run time in coincidencewith satisfy quality of the obtained productshould be considered the main advantage of thismethod. Besides, the process can be fullyautomatizied. However it is not inconceivable,that additional higher purification will benecessary in the case of antibodies labeling (for .example, by ion-exchange methods).
Acknowledgments. - The authors are indebtedto Prof. F.M. Lyass and his colleagues for along-standing collaboration in the field of 90Y-radiopharmaceuticals clinical usage. Theauthors also thank Dr. P. Boldyrev forassistance in trials of the devices.
5. REFERENCES
1. Wike J.S, Guyer C.E., Ramey D.W.,Phillips B.P.Chemistry for CommercialScale Production of Yttrium-90 for MedicalResearch. Appl. Radiat. Isot., V. 41, N 9,1990 p.861-865.
2. MalininA.B., Kurchatova L.N., TronovaI.N. et al. The Generator of 90Y with highradionuclide purity. Radiochimia, N 4,1984, p.500-503 (in Russian).
3. Egorov A.V., Zykov M.P., Korpusov G.V.Production of 99mTc on the CentralizedGenerator in St. Petersburg. J. Nucl. Biol.Med., V. 38, N 3, 1994, p. 399-402.
4. State Pharmacopoeia XI, V. 1, 1987, p.322-332 (in Russian).
AU9817358
Paper 57/41
A New Radioisotope Facility for Thailand
K R HORLOCKANSTO, Private Mail Bag 1, Meriai NSW 2234, Australia
The Thai Office of Atomic Energy for Peace (OAEP)is planning a new Nuclear Research Centrewhich will be located at Ongkharak, a greenfield site some 100 km North of Bangkok.
General Atomics (GA) has submitted a bid for a turnkey contract for the core facilities comprisinga Reactor to be supplied by GA, an Isotope Production Facility supplied by ANSTO and a WasteProcessing and Storage Facility to be supplied by Hitachi through Marubeni. The buildings forthese facilities will be provided by Raytheon, the largest constructor of nuclear facilities in theUSA.
The proposed Isotope Facility will consist of a 3000 m2 building adjacent to the reactor with apneumatic radioisotope transfer system. Hot cells, process equipment and clean rooms will beprovided, as well as the usual maintenance and support services required for processingradiopharmaceutical and industrial products. To ensure the highest standards of product purity theprocessing areas will be supplied with clean air and operated at slightly positive pressure.
The radioisotopes to be manufactured include Phosphorus 32 (S-32 [n,p]P-32), I-131(Te-130[n,g]Te-131[p]I-131) for bulk, diagnostic capsules and therapeutic capsules, Iridium 192 (Ir-191[n,g]Ir-192) wire for radiotherapy and discs for industrial radiography sources and bulk Iodine125 (Xe-124[n,g]Xe-125[beta]I-125 for radioimmunoassay.
The bid includes proposals for training OAEP staff during design and development at ANSTO'sradioisotope facilities, and during construction and commissioning in Thailand.
The entire project is planned to take four years with commencement anticipated in early 1997.
The paper will describe the development of the design of the hot-cells, process equipment,building layout and ventilation and other services.
AU9817359
Highly-Enriched Actinide and Stable Isotopes for Scientific Research inRussian Federal Nuclear Center
S.P.VESNOVSKIIRussian Federal Nuclear Center - All-Union Experimental Physics Research Institute
607190, Sarov (Arzamas-16), Nizhny Novgorod region, Russia
SUMMARY. The report presents information and capabilities of production on highly enriched stableand actinide isotopes for scientific research and applied utilization. Electromagnetic separator and ra-diochemical methods provide obtaining of superpure isotope samples for nuclear-physical experiments,for manufacturing standard materials and radiation sources used in calibrating of radiometric andmass-spectrometric equipment, and also as tracers when analyzing environmental contamination. Thedata on nomenclature of stable and highly enriched isotopes produced and delivered is presented. Thebrief information on the possibilities of manufacturing targets, layers and also sources containing highlyenriched and superpure isotopes is given.
1. INTRODUCTION
The Russian Federal Nuclear Center founded in1946 to design Russian nuclear weapons hasturned into the largest scientific research center,to great extent influencing the modern sciencedevelopment in the various fields of the funda-mental and applied research. The research in thefield of experimental nuclear physics performedon the experimental base and measuring tech-nique concentrated in the Center for nuclear andradiation research are of great importance inRFNC activities.
The main fields of the research are as follows:• Study of fission and fusion nuclear reac-tions, measurement of nuclear data for a widerange of elements and construction materials,measurement of critical mass, study of criticalmass configurations, measurement of integralnuclear constants.• Creation, development and application tech-niques of radiation characteristics measurementfor pulse and stationary regimes.• Research in the field of radiochemistry,mass-spectrum and isotope analyses using su-perpure actinide isotopes, including transura-nium elements, development of radiochemicalmeasurement techniques and technologies fordifferent purposes.
• Design and creation of the laboratory ex-perimental base for nuclear physics research onthe basis of electrophysics and nuclear physicsfacilities, using radioisotopes.• Study of possibility of transuranium ele-ments transmutation, the latter containing inradioactive wastes of nuclear power engineer-ing, measurements of nuclear constants, neces-sary for transmutation process development.Monitoring of environmental contamination(soil, underground waters, etc.) with actinideelements, creation of technology for the con-taminated areas, decontamination, monitoringof residual actinide content.
To provide this research program, the actinideisotopes electromagnetic separation laboratorythat operates a mass-separator, S-2 type,equipped with personnel radiation protection toproduce superpure isotopes of uranium, pluto-nium, americium and curium was set up in1967 in the Radiochemical Department. Thereis also a group dealing with production of lay-ers and targets of these isotopes for nuclearphysics experiments. The isotope production ofthe Radiochemical Department was delivered todifferent Russian research institutes to performthe state program on nuclear constants meas-urements for actinide elements. Not long agothis production became available for the foreignlaboratories, as well.
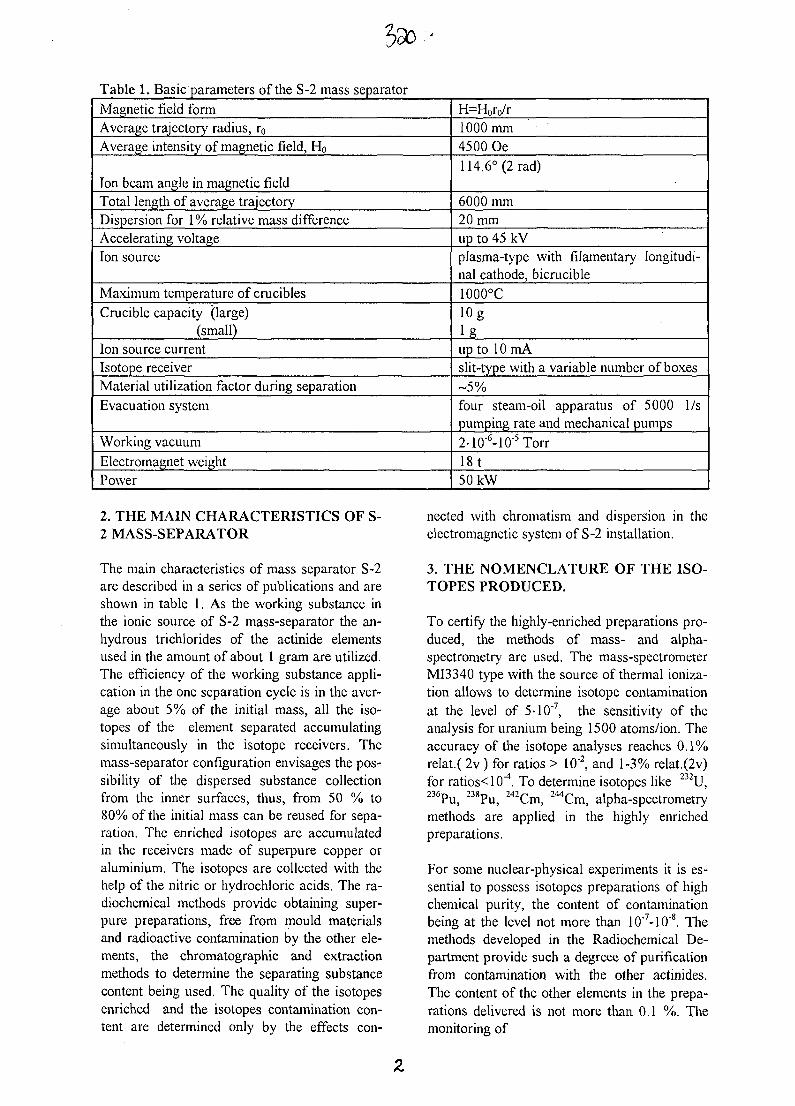
Table 1. Basic parameters of the S-2 mass separatorMagnetic field formAverage trajectory radius, r0
Average intensity of magnetic field, Ho
Ion beam angle in magnetic fieldTotal length of average trajectoryDispersion for 1 % relative mass differenceAccelerating voltageIon source
Maximum temperature of cruciblesCrucible capacity (large)
(small)Ion source currentIsotope receiverMaterial utilization factor during separationEvacuation system
Working vacuumElectromagnet weightPower
H=H0ro/r1000 mm4500 Oe114.6° (2 rad)
6000 mm20 mmup to 45 kVplasma-type with filamentary longitudi-nal cathode, bicrucible1000°ClOg
I gup to 10 mAslit-type with a variable number of boxes- 5 %four steam-oil apparatus of 5000 1/spumping rate and mechanical pumps2-10"6-10-5Torr18 t50 kW
2. THE MAIN CHARACTERISTICS OF S-2 MASS-SEPARATOR
The main characteristics of mass separator S-2are described in a series of publications and areshown in table 1. As the working substance inthe ionic source of S-2 mass-separator the an-hydrous trichlorides of the actinide elementsused in the amount of about 1 gram are utilized.The efficiency of the working substance appli-cation in the one separation cycle is in the aver-age about 5% of the initial mass, all the iso-topes of the element separated accumulatingsimultaneously in the isotope receivers. Themass-separator configuration envisages the pos-sibility of the dispersed substance collectionfrom the inner surfaces, thus, from 50 % to80% of the initial mass can be reused for sepa-ration. The enriched isotopes are accumulatedin the receivers made of superpure copper oraluminium. The isotopes are collected with thehelp of the nitric or hydrochloric acids. The ra-diochemical methods provide obtaining super-pure preparations, free from mould materialsand radioactive contamination by the other ele-ments, the chromatographic and extractionmethods to determine the separating substancecontent being used. The quality of the isotopesenriched and the isotopes contamination con-tent are determined only by the effects con-
nected with chromatism and dispersion in theelectromagnetic system of S-2 installation.
3. THE NOMENCLATURE OF THE ISO-TOPES PRODUCED.
To certify the highly-enriched preparations pro-duced, the methods of mass- and alpha-spectrometry are used. The mass-spectrometerMI3340 type with the source of thermal ioniza-tion allows to determine isotope contaminationat the level of 5-10'7, the sensitivity of theanalysis for uranium being 1500 atoms/ion. Theaccuracy of the isotope analyses reaches 0.1%relat.( 2v ) for ratios > 10"2, and 1-3% relat.(2v)for ratios<10'4. To determine isotopes like 232U,236Pu, 238Pu, 242Cm, 244Cm, alpha-spectrometrymethods are applied in the highly enrichedpreparations.
For some nuclear-physical experiments it is es-sential to possess isotopes preparations of highchemical purity, the content of contaminationbeing at the level not more than 10'7-10'8. Themethods developed in the Radiochemical De-partment provide such a degreee of purificationfrom contamination with the other actinides.The content of the other elements in the prepa-rations delivered is not more than 0.1 %. Themonitoring of
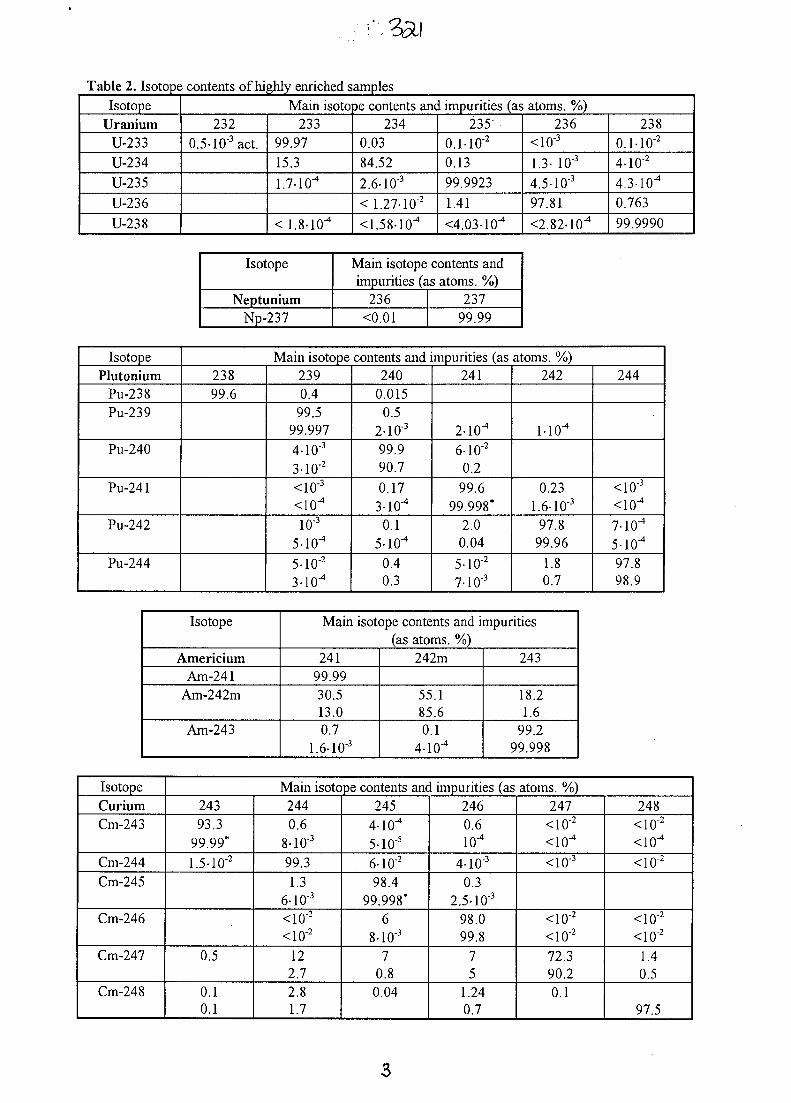
Table 2. Isotope contents of highly enriched samples
IsotopeUranium
U-233
U-234
U-235
U-236
U-238
Main isoto232
0.5-10"3 act.
23399.97
15.3
1.7-10"4
< 1.8-10"*
pe contents and impurities (as atoms. %)234
0.03
84.52
2.6-10"3
< 1.27-10"2
<1.58-1Q-4
235'
0.1-10"2
0.13
99.9923
1.41
<4.03-10"4
236<10"3
1.3- 10"3
4.5-10"3
97.81
<2.82-10"4
2380.1-10"2
4-10"2
4.3-10"4
0.763
99.9990
Isotope
NeptuniumNp-237
Main isotope contents andimpurities (as atoms. %)
236<0.01
23799.99
IsotopePlutonium
Pu-238Pu-239
Pu-240
Pu-241
Pu-242
Pu-244
Main isotope contents and impurities (as atoms. %)23899.6
2390.4
99.599.997
4-10-3
3-10"2
<10"3
<10"4
io-3
5-10"4
5-10'2
3-10"4
2400.015
0.52-10"3
99.990.7
0.173-10-4
0.1
5-10"4
0.40.3
241
2-10"4
6-10'2
0.2
99.699.998*
2.00.04
5-10"2
7-10°
242
M0"4
0.231.610"3
97.899.96
1.80.7
244
<10"3
<10"4
7-10"4
5-10"4
97.898.9
Isotope
AmericiumAm-241
Am-242m
Am-243
Main isotope contents and impurities(as atoms. %)
24199.9930.513.00.7
1.6-10"3
242m
55.185.60.1
4-10"4
243
18.21.6
99.299.998
IsotopeCuriumCm-243
Cm-244
Cm-245
Cm-246
Cm-247
Cm-248
Main isotope contents and impurities (as atoms. %)24393.3
99.99*
1.5-10"2
0.5
0.10.1
2440.6
8-10"3
99.3
1.36-10"3
<10"2
<10"2
122.72.81.7
2454-10"4
5-105
6-10"2
98.499.998*
68-10'3
70.8
0.04
2460.6io-4
4-10"3
0.32 . 5 1 0 3
98.099.8
75
1.240.7
247<10~2
<10"4
<10"3
<10"2
<10"2
72.390.2
0.1
248<io-2
<10"4
<io-2
<10 2
<10"2
1.40.5
97.5
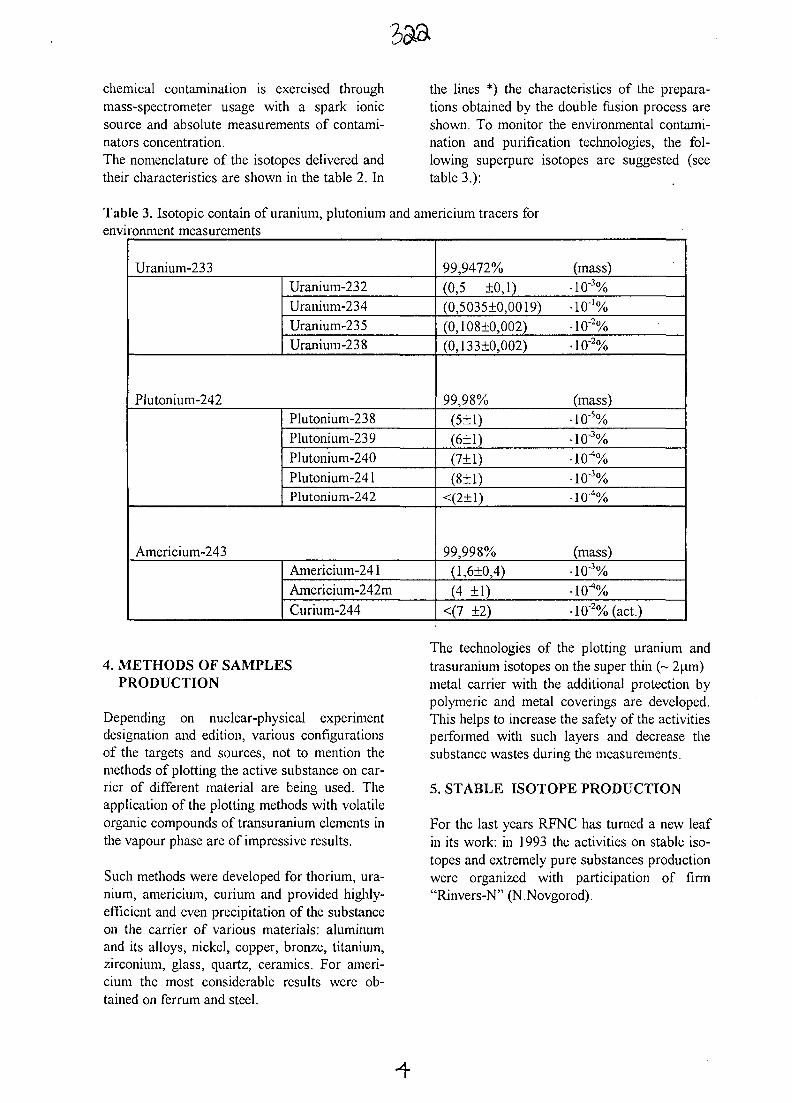
chemical contamination is exercised throughmass-spectrometer usage with a spark ionicsource and absolute measurements of contami-nators concentration.The nomenclature of the isotopes delivered andtheir characteristics are shown in the table 2. In
the lines *) the characteristics of the prepara-tions obtained by the double fusion process areshown. To monitor the environmental contami-nation and purification technologies, the fol-lowing superpure isotopes are suggested (seetable 3.):
Table 3. Isotopic contain of uranium, plutonium and americium tracers forenvironment measurements
Uranium-233Uranium-232Uranium-234Uranium-235Uranium-238
Plutonium-242Plutonium-238Plutonium-239Plutonium-240Plutonium-241Plutonium-242
Americium-243Americium-241Americium-242mCurium-244
99,9472% (mass)(0,5 ±0,1) -10-3%(0,503510,0019) -10-'%(0,108±0,002) -10-2%(0,133+0,002) -10-2%
99,98% (mass)(5±1) -10"5%(6+1) -10"3%(7±1) -lO^/o(8±1) -10"3%
<(2±1) -lO^/o
99,998% (mass)(l,6±0,4) -10-3%(4 ±1) -lO^/o
<(7 ±2) -10"2%(act.)
4. METHODS OF SAMPLESPRODUCTION
Depending on nuclear-physical experimentdesignation and edition, various configurationsof the targets and sources, not to mention themethods of plotting the active substance on car-rier of different material are being used. Theapplication of the plotting methods with volatileorganic compounds of transuranium elements inthe vapour phase are of impressive results.
Such methods were developed for thorium, ura-nium, americium, curium and provided highly-efficient and even precipitation of the substanceon the carrier of various materials: aluminumand its alloys, nickel, copper, bronze, titanium,zirconium, glass, quartz, ceramics. For ameri-cium the most considerable results were ob-tained on ferrum and steel.
The technologies of the plotting uranium andtrasuranium isotopes on the super thin (~ 2u.m)metal carrier with the additional protection bypolymeric and metal coverings are developed.This helps to increase the safety of the activitiesperformed with such layers and decrease thesubstance wastes during the measurements.
5. STABLE ISOTOPE PRODUCTION
For the last years RFNC has turned a new leafin its work: in 1993 the activities on stable iso-topes and extremely pure substances productionwere organized with participation of firm"Rinvers-N" (N.Novgorod).
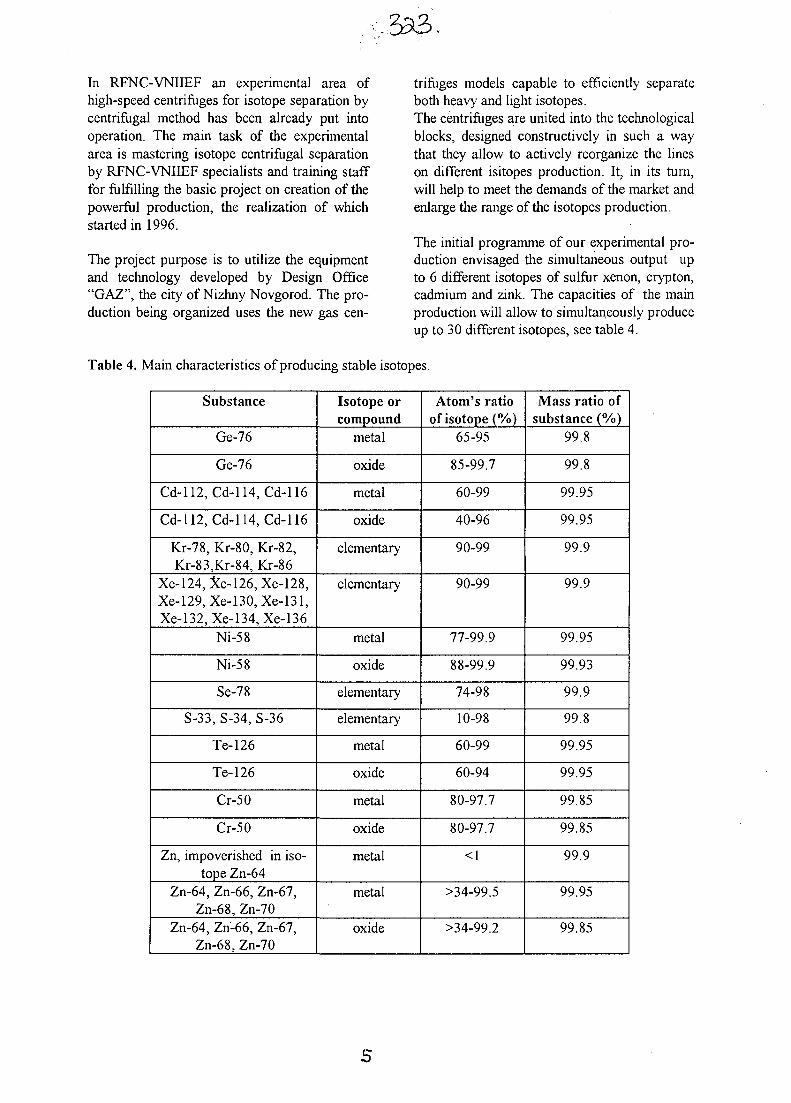
.333.
In RFNC-VNIIEF an experimental area ofhigh-speed centrifuges for isotope separation bycentrifugal method has been already put intooperation. The main task of the experimentalarea is mastering isotope centrifugal separationby RFNC-VNIIEF specialists and training stafffor fulfilling the basic project on creation of thepowerful production, the realization of whichstarted in 1996.
The project purpose is to utilize the equipmentand technology developed by Design Office"GAZ", the city of Nizhny Novgorod. The pro-duction being organized uses the new gas cen-
trifuges models capable to efficiently separateboth heavy and light isotopes.The centrifuges are united into the technologicalblocks, designed constructively in such a waythat they allow to actively reorganize the lineson different isitopes production. It, in its turn,will help to meet the demands of the market andenlarge the range of the isotopes production.
The initial programme of our experimental pro-duction envisaged the simultaneous output upto 6 different isotopes of sulfur xenon, crypton,cadmium and zink. The capacities of the mainproduction will allow to simultaneously produceup to 30 different isotopes, see table 4.
Table 4. Main characteristics of producing stable isotopes.
Substance
Ge-76
Ge-76
Cd-112, Cd-114, Cd-116
Cd-112, Cd-114, Cd-116
Kr-78, Kr-80, Kr-82,Kr-83,Kr-84, Kr-86
Xe-124, Xe-126, Xe-128,Xe-129, Xe-130,Xe-131,Xe-132,Xe-134,Xe-136
Ni-58
Ni-58
Se-78
S-33, S-34, S-36
Te-126
Te-126
Cr-50
Cr-50
Zn, impoverished in iso-tope Zn-64
Zn-64, Zn-66, Zn-67,Zn-68, Zn-70
Zn-64, Zn-66, Zn-67,Zn-68, Zn-70
Isotope orcompound
metal
oxide
metal
oxide
elementary
elementary
metal
oxide
elementary
elementary
metal
oxide
metal
oxide
metal
metal
oxide
Atom's ratioof isotope (%)
65-95
85-99.7
60-99
40-96
90-99
90-99
77-99.9
88-99.9
74-98
10-98
60-99
60-94
80-97.7
80-97.7
<1
>34-99.5
>34-99.2
Mass ratio ofsubstance (%)
99.8
99.8
99.95
99.95
99.9
99.9
99.95
99.93
99.9
99.8
99.95
99.95
99.85
99.85
99.9
99.95
99.85
6. CONCLUSIONS
The highly enriched and superpure isotopesproduced in RFNC are of the unique character-istics on enrichment. They are applied in lots oflaboratories and research centers both ofEurope and Asia, with which we are in closecontact and buisness relations. We possesstransport containers that meet all the interna-tional rules of radioactive substances transpor-tation. The articles produced and delivered byus containing highly enriched isotopes havebeen highly approved by the customers. Re-cently Russian - American project on highly-enriched Plutonium-244 isotope production forcreation of new plutonium standards used inIAEA programmes is being worked out.We would be pleased to find new customers.
6. REFERENCES
[1] S.P.Vesnovskii, V.N.Polynov. Transura-nium Elements. ACS, Washington, DC(1992)131.[2] S.P.Vesnovskii, V.N.Polynov . andL.D.Danilin, Nucl.Instr.&Meth.A312(1992)1.[3] S.M.Abramychev, N.V.Balashov et al.,Nucl.Instr.&Meth.B70(1992)5.[4] S.P.Vesnovskii, V.N.Polynov,Nucl.Instr.&Meth.B70(1992)9.[5] S.M.Abramychev, N.V.Balashov et al.,Springer-Verlag Berlin Heidelberg (1992)449.[6] S.P.Vesnovskii, V.N.Vjachin et al.,Nucl.Instr.&Meth.A334(l 993)37.
t>
AU9817360
Reactor-Produced Radionuclides at theUniversity of Missouri Research Reactor
A.R. KETRING, M. S. EVANS-BLUMER and G. J. EHRHARDTUniversity of Missouri Research Reactor and Departments of Radiology,
Chemistry, and Nuclear EngineeringColumbia, MO, 65211, USA
SUMMARY. In recent, years a revolution in radiotherapy has been developing based on moresophisticated targeting methods, including radioactive intra-arterial microspheres, chemically-guided bone agents, labeled monoclonal antibodies, and isotopically-tagged polypeptide receptor-binding agents. The isotopes of choice for these applications include reactor-produced betaemitters such as Sm-153, Re-186, Re-188, Ho-166, Lu-177, and Rh-105. The University ofMissouri Research Reactor (MURR) has been in the forefront of research into means ofpreparing, handling, and supplying these high-specific-activity isotopes in quantities appropriatenot only for research, but also for patient trials in the U.S. and around the world. Considerableeffort has been expended to develop techniques for irradiation, handling, and shippingradioisotopes worldwide. The MURR has also served as a highly reliable production source forradioisotopes, with one of the best operating histories of any radioisotope production reactor inthe world.
1. INTRODUCTION
Nuclear medicine today is primarilydiagnostic, but it has been pointed out thatdiagnosis of an incurable disease is of limitedvalue. With competition from otherdiagnostic modalities, recent progress innuclear medicine has focussed on its uniqueability to provide radiotherapy formalignancies and other maladies. Supply ofradioisotopes for these purposes is crucialbecause more activity is required per patient(typically at least 100 mCi, or 3.7 Gbq) andthe specific activity may have to be veryhigh. In addition, beta emitters are highlypreferred because their 1-10 mm ranges intissue are appropriate to lesion sizes and theinhomogeneity of typical isotopedistributions.
High powered research reactors areappropriate for making therapy isotopesbecause neutron bombardment produces betaemitters and because copious amounts ofisotope can be made in many targetssimultaneously. Although (n,gamma)reactions tend to produce low specificactivity radioisotope, judicious choice ofhigh cross-section targets and very highthermal fluxes often makes the radioisotope
high enough in specific activity to be usefulfor techniques such as radioimmunotherapy.In addition, reactors can produce no-carrieradded (NCA) isotope by indirect production,in which (n,gamma) reactions are followed bybeta decay and a chemical separation, and alsothrough production of isotope generators,such as the W-188/Re-188 system.
2. DEVELOPMENT OF THERAPEUTICISOTOPES
Nuclear medicine therapy requires physical,chemical, or immunological guidance todeliver radioisotope to the sites where it maydestroy diseased tissue. An example ofphysical guidance which MURR has beenheavily involved in is the use of labeledmicrospheres directed by catheter or syringeto areas of lesions. Researchers at MURR, inconjunction with other University of Missouri(MU) scientists and a pharmaceuticalcompany, developed 64.1-hr. Y-90TheraSphere™, an activatable glassmicrosphere(l) injected via catheter throughthe hepatic artery to treat liver tumors.Clinical trials of this agent from 1986-1989in Canada and the U.S. resulted in its approvalin Canada in 1991. Other work at MU hassuggested the applicability of this technique to
pre-surgically sterilize kidney tumors, using46.3-hr. Sm-153 activated glassmicrospheres. Work at MURR has alsobeen performed on Re-186/Re-188 labeledprotein or polypeptide microspheres forradiation synovectomy(2).
About 15 years ago MURR became part oftwo projects to develop therapeutic boneagents to palliate the pain of osseousmetastases. This represents what some havecalled the "small, labeled molecule"approach to radiotherapy, in which thechemical characteristics of the compounddetermine its targeting. In particular, highmetabolic rates at bone cancer sites arebelieved to lead to concentration ofphosphonate compounds. Production atMURR supplied and continues to supplydevelopment and trials of 89.3-hr. Re-186HEDP (hydroxyethylidene diphosphonicacid) for this purpose(3). In addition, aproject arose at MU and MURR toinvestigate Sm-153 for this purpose,culminating in the development of Sm-153EDTMP (ethylenediaminetetramethylenephosphonic acid)(4,5). With the success ofPhase I clinical trials of this agent, it wenton to become an approved drug in the U.S.in March, 1997, with MURR being theprincipal supplier of radioisotope. Thisproject in particular demonstrates what canbe accomplished with a multidisciplinaryuniversity effort (reactor, chemistrydepartment, veterinary school, and medicalschool) in conjunction with good industrialsupport. A related effort is MURR'scurrent supply of Curie (37 Gbq) quantitiesof Ho-166 for small-molecule, controlledablation of diseased bone marrow inleukemia patients prior to marrowrecolonization(6). Although these Re-186,Sm-153 and Ho-166 agents do not requireextremely high specific activities, the largeneutron cross sections of their precursorspermit production of Curie (37 Gbq)quantities of activity per mg of target.
Much work is now being conducted atMURR to develop, prepare and supply high-specific-activity isotopes for research andc l i n i c a l t r i a l s i n v o l v i n gradioimmunotherapy and receptor-guidedtherapy. In such treatments, antibodies,fragments of antibodies, or short-chainpolypeptides are used as the targetingvectors. Radiosotopes can be attachedeither through direct labeling to amino acids
(e.g., Re-186 or Re-188) or via bifunctionalchelates (radiolanthanides and Rh-105).
For about 6 years MURR has been producing1-3 Ci (37-110 Gbq) quantities of Re-186 at aspecific activity of about 3.5 Ci (130 Gbq) permg of rhenium for radioimmunotherapy trialsin the U.S. and Europe(7); development ofnew rhenium targetry greatly aided thisprocess(8) and simplified labeling byclinicians. Related to this has beendevelopment at MURR of W-188/Re-188 gelgenerators able to supply no-carrier-added(NCA) Re-188 (tl/2=17hr) using low specificactivity, W-188 (tl/2=69.4hr) produced bydouble neutron capture on W-186(9). Thistechnology, in which target material isprocessed into a column packing in which theRe-188 diffuses efficiently into saline eluate,permits gram quantities of tungsten to beloaded onto small columns producing the verycompact elution profiles (i.e., high activityconcentrations) of Re-188 needed forradioimmuno- and receptor agent labeling.
The extensive experience at MU withradiolanthanides has led to work with Lu-177,which has a very large cross section forneutron capture on Lu-176, and with the Dy-I66/H0-I66 generator system. The Lu-177(t 1/2=6.72 day) irradiated in the MURR highflux (flux trap) position of about 4.5 X10¹⁴
neutrons/cm2/sec activates about 1 in 5 Luatoms to Lu-177. At such specific activities,this radioisotope is being produced by MURRfor clinical trials in the U.S.(10). Similarly,while Dy-166 must be produced by doubleneutron capture, MURR is able to achieve aspecific activity of over 1 Ci (37 Gbq) Dy-166/gm dysprosium. As Ho-166 is thedaughter of Dy-166, this has led our group topropose an in-vivo, delayed dose generator, inwhich Dy-166 is separated from its Ho-166daughter and injected as a component of atherapeutic radiopharmaceutical. Duringlocalization, the weak beta of Dy-166 woulddo relatively little damage to healthy tissue,while after localization and ingrowth of high-beta-energy Ho-166 the dosage to targettissue would be much higher. Supplying Ho-166 (t]/2=26.8hr) via Dy-166 (t,/2=81.6hr)permits generator supply of NCA, Ho-166while reducing decay losses during shipment.Work at MURR has shown that the generatorseparation may be achievable by a hot-atomprocess.
Rhodium-105, with its 35.4-hr, half life, low
energy beta emissions, and inert complexformation, has been suggested as an idealradiopharmaceutical isotope similar in somerespects to the difficult-to-obtain Cu-67.For a number of years MURR has producedresearch quantities of NCA Rh-105 for useat MU and other universities. Thisproduction involves irradiation of Ru-104to produce Ru-105 (tl/2=4.5hr), whichdecays to Rh-105. Separation is complex,requiring oxidation of ruthenium target toRUO4 and subsequent distillation, leavingRh-105 in the original solution. Thisradioisotope has so far been supplied onlyfor animal trials.
3. OTHER REACTOR PRODUCEDISOTOPES
In addition to the above nuclear medicineisotopes, MURR produces large quantities ofradioisotope for other purposes, principallyas biomedical research tracers. Many curies(37 Gbq quantities) of P-32 and S-35 areproduced by irradiation of natural isotopicenrichment sulfur and potassium chloride,respectively. Indeed, MURR is one of theworld's leading sources of these rawradioisotopes, produced via (n,p) reaction.Recently, development of a proprietyprocess using isotopically enriched S-33 hasled to MURR supply of large quantities ofP-33. This radioisotope, which has a longerhalf life than P-32 (25.3 vs. 14.3 d) and alower beta energy, is more convenient andsafer than P-32 and thus has found favorfor labeled compound research.
4. CONCLUSIONS
High power research reactors capable ofsupplying short-lived radioisotopes have avital role to play both in biomedicalresearch and in the upcoming field oftherapeutic nuclear medicine. A network ofthese reactors throughout the world isimportant to progress in human health andbiomedical research.
ACKNOWLEDGEMENTS:
The authors would like to gratefullyacknowledge Theragenics Corp., DowChemical Co., NeoRx Corp., andMallinckrodt Medical, Inc. for theirgenerous support.
REFERENCES:
1) G.J. Ehrhardt and D.E. Day, "TherapeuticUse of Y-90 Microspheres," Nucl. Med. Biol.14(3), 233-242 (1987).
2) Jia, W., Ehrhardt, G.J., Zinn, K., Wang,N., and Ketring, A.R., "Re-186/Re-188Labeled Polypeptide Microspheres as aPotential Radiation Synovectomy Agent," LRadioanalytical and Nuclear Che m is t rv .Articles. Vol. 206, No. 1, 107-117, (1996).
3) H.R. Maxon III, L.E. Schroder, V.S.Hertzberg, S.R. Thomas, E.E. Englaro,R.Samaratunga, H. Smith, J.S. Moulton,C.C.Williams, G.J. Ehrhardt, and H.J.Schneider, "Re-186 (Sn)HEDP for Treatmentof Painful Osseous Metastases: Results of aDouble-blind Crossover Comparison withPlacebo," J. Nucl. Med. 32 (10),. 1877,(1991) .
4) W. A.Volkert, J. Simon, A.R. Ketring, R.A.Holmes, J.C. Lattimer, and L.A. Corwin,"Radiolabeled Phosphonic Acid Chelates:Potential Therapeutic Agents for Treatmentof Skeletal Metastases," Drugs of the Future1989. 14: 799-811.
5) J.F. Eary, C. Collins, M. Stabin, etal.,"Samarium-153-EDTMP Biodistribution andDosimetry Estimation," J. Nucl. Med.43:1031-1036, (1993).
6) J.E. Bayouth, D.J. Macey, L.P. Kasi etal.,"Pharmacokinetics, Dosimetry, and Toxicityof Holmium-166-DOTMP for Bone MarrowAblation in Multiple Myeloma, J. Nucl. Med.36: 730-737, (1995) .
7) H.B. Breitz, J. S. Durham, D.R. Fisher,etal. "Pharmacokinetics and Normal OrganDosimetry Following IntraperitonealRhen ium-1 8 6-L abeled M o n o c l o n a lAntibody." J. Nucl. Med. 36: 754-761, (1995)
8) J.-L. Vanderheyden, F.-M. Su and G. J.Ehrhardt, U.S. Patent #5,053,186 "SolubleIrradiation Targets and Methods for theProduction of Radiorhenium," issued October1, 1991.
9) G.J. Ehrhardt, A.R. Ketring, Q. Liang,R.A. Miller, A. Holmes, and R.G. Wolfangel,"Refinement of the Peroxide Process forMaking W-188/Re-188 and Mo-99/Tc-99m

Gel Radioisotope Generators for NuclearMedicine," Technetium and Rhenium inChemistry and Nuclear Medicine 4. editedby M. Nicolini, G. Bandoli, and U.Mazzi, SGEditoriali, Padova, Ital, 1995
10) M.E. Schott, J. Schlom, K. Siler, etal.,"Biodistribution and PreclinicalRadioimmunotherapy Studies UsingR a d i o l a n t h a n i d e - L a b e l e dImmunoconjugates," CANCER. Vol. 73,No. 3, pp. 993-998, (1994).
4
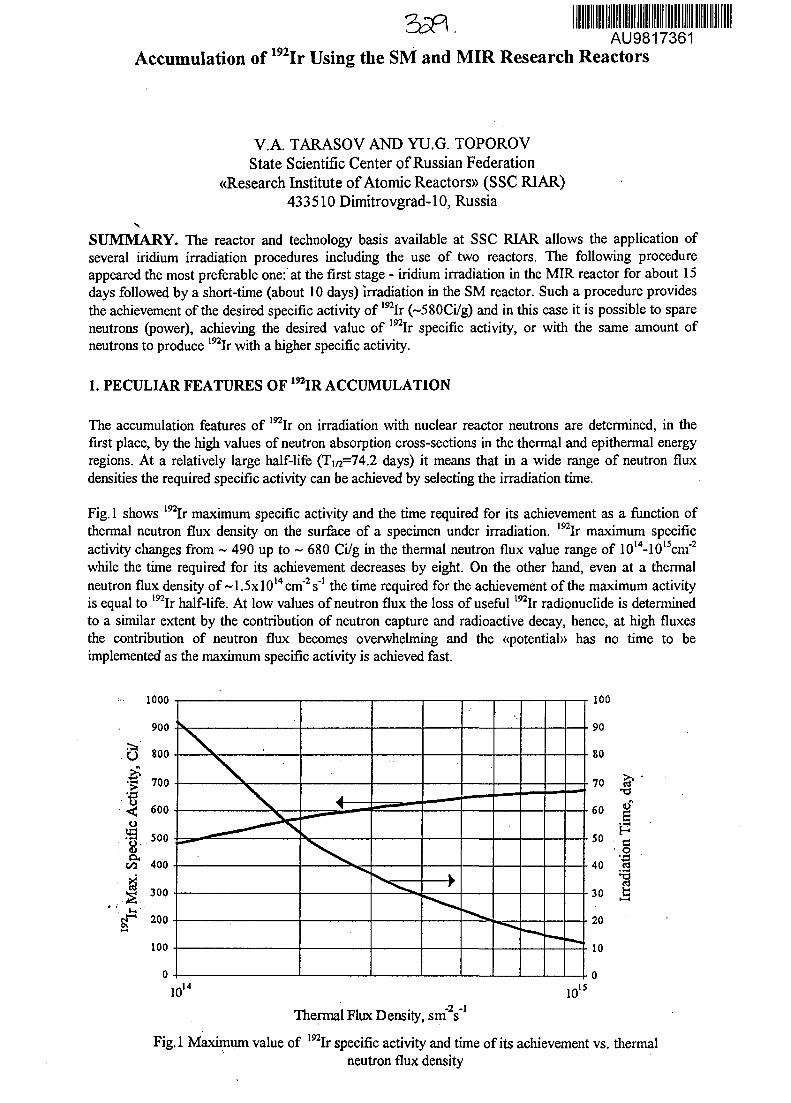
AU9817361Accumulation of 192Ir Using the SM and MIR Research Reactors
V.A. TARASOV AND YU.G. TOPOROVState Scientific Center of Russian Federation
«Research Institute of Atomic Reactors» (SSC RIAR)433510 Dimitrovgrad-10, Russia
SUMMARY. The reactor and technology basis available at SSC RIAR allows the application ofseveral iridium irradiation procedures including the use of two reactors. The following procedureappeared the most preferable one: at the first stage - iridium irradiation in the MIR reactor for about 15days followed by a short-time (about 10 days) irradiation in the SM reactor. Such a procedure providesthe achievement of the desired specific activity of l92Ir (~580Ci/g) and in this case it is possible to spareneutrons (power), achieving the desired value of I92Ir specific activity, or with the same amount ofneutrons to produce 192Ir with a higher specific activity.
1. PECULIAR FEATURES OF 1WIR ACCUMULATION
The accumulation features of Ir on irradiation with nuclear reactor neutrons are determined, in thefirst place, by the high values of neutron absorption cross-sections in the thermal and epithermal energyregions. At a relatively large half-life (Ti/2=74.2 days) it means that in a wide range of neutron fluxdensities the required specific activity can be achieved by selecting the irradiation time.
Fig. 1 shows 192Ir maximum specific activity and the time required for its achievement as a function ofthermal neutron flux density on the surface of a specimen under irradiation. I92Ir maximum specificactivity changes from ~ 490 up to ~ 680 Ci/g in the thermal neutron flux value range of 1014-10l5cm"2
while the time required for its achievement decreases by eight. On the other hand, even at a thermalneutron flux density of ~1.5xlO14
CITIES"1 the time required for the achievement of the maximum activityis equal to 192Ir half-life. At low values of neutron flux the loss of useful 192Ir radionuclide is determinedto a similar extent by the contribution of neutron capture and radioactive decay, hence, at high fluxesthe contribution of neutron flux becomes overwhelming and the «potential» has no time to beimplemented as the maximum specific activity is achieved fast.
fa,
00
1000
900
800
700
600
500
400
300
200
100
0
\
\
\
— —
i
. — — — • "
X ,
—- 1 —
k.
r
mmmmm
1014
Thermal Flux Density, sm s"
100
90
SO
70 &*
-60 |
-50 .P
40 .rt
30 |
20
10
0
1015
Fig. 1 Maximum value of I92Ir specific activity and time of its achievement vs. thermalneutron flux density
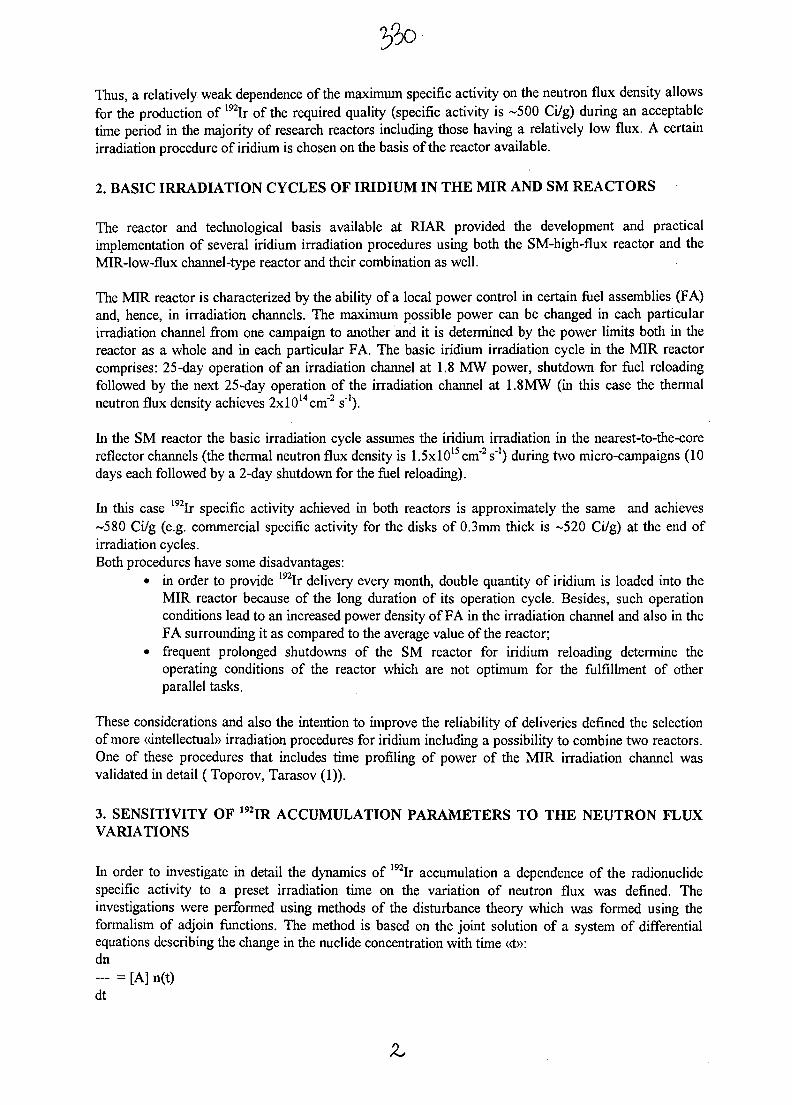
Thus, a relatively weak dependence of the maximum specific activity on the neutron flux density allowsfor the production of 192Ir of the required quality (specific activity is ~500 Ci/g) during an acceptabletime period in the majority of research reactors including those having a relatively low flux. A certainirradiation procedure of indium is chosen on the basis of the reactor available.
2. BASIC IRRADIATION CYCLES OF IRIDIUM IN THE MIR AND SM REACTORS
The reactor and technological basis available at RIAR provided the development and practicalimplementation of several indium irradiation procedures using both the SM-high-flux reactor and theMIR-low-flux channel-type reactor and their combination as well.
The MIR reactor is characterized by the ability of a local power control in certain fuel assemblies (FA)and, hence, in irradiation channels. The maximum possible power can be changed in each particularirradiation channel from one campaign to another and it is determined by the power limits both in thereactor as a whole and in each particular FA. The basic indium irradiation cycle in the MIR reactorcomprises: 25-day operation of an irradiation channel at 1.8 MW power, shutdown for fuel reloadingfollowed by the next 25-day operation of the irradiation channel at 1.8MW (in this case the thermalneutron flux density achieves 2xl014cm"2 s'1).
In the SM reactor the basic irradiation cycle assumes the iridium irradiation in the nearest-to-the-corereflector channels (the thermal neutron flux density is 1.5xl015cm'2s'') during two micro-campaigns (10days each followed by a 2-day shutdown for the fuel reloading).
In this case 192Ir specific activity achieved in both reactors is approximately the same and achieves-580 Ci/g (e.g. commercial specific activity for the disks of 0.3mm thick is ~520 Ci/g) at the end ofirradiation cycles.Both procedures have some disadvantages:
• in order to provide 192Ir delivery every month, double quantity of iridium is loaded into theMIR reactor because of the long duration of its operation cycle. Besides, such operationconditions lead to an increased power density of FA in the irradiation channel and also in theFA surrounding it as compared to the average value of the reactor;
• frequent prolonged shutdowns of the SM reactor for iridium reloading determine theoperating conditions of the reactor which are not optimum for the fulfillment of otherparallel tasks.
These considerations and also the intention to improve the reliability of deliveries defined the selectionof more «intellectual» irradiation procedures for iridium including a possibility to combine two reactors.One of these procedures that includes time profiling of power of the MIR irradiation channel wasvalidated in detail (Toporov, Tarasov (1)).
3. SENSITIVITY OF 192IR ACCUMULATION PARAMETERS TO THE NEUTRON FLUXVARIATIONS
In order to investigate in detail the dynamics of 192Ir accumulation a dependence of the radionuclidespecific activity to a preset irradiation time on the variation of neutron flux was defined. Theinvestigations were performed using methods of the disturbance theory which was formed using theformalism of adjoin functions. The method is based on the joint solution of a system of differentialequations describing the change in the nuclide concentration with time «t»:dn- = [A] n(t)dt
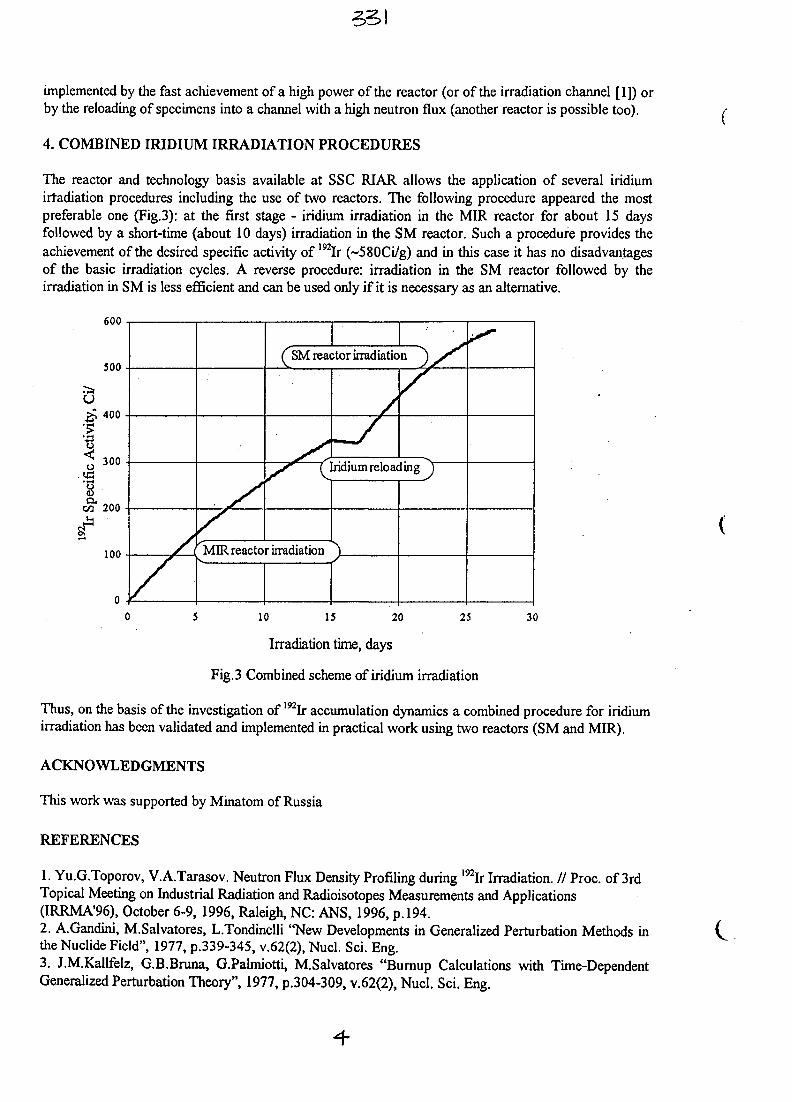
implemented by the fast achievement of a high power of the reactor (or of the irradiation channel [1]) orby the reloading of specimens into a channel with a high neutron flux (another reactor is possible too).
4. COMBINED IRIDIUM IRRADIATION PROCEDURES
The reactor and technology basis available at SSC RIAR allows the application of several iridiumirradiation procedures including the use of two reactors. The following procedure appeared the mostpreferable one (Fig.3): at the first stage - iridium irradiation in the MIR reactor for about 15 daysfollowed by a short-time (about 10 days) irradiation in the SM reactor. Such a procedure provides theachievement of the desired specific activity of I92Ir (~580Ci/g) and in this case it has no disadvantagesof the basic irradiation cycles. A reverse procedure: irradiation in the SM reactor followed by theirradiation in SM is less efficient and can be used only if it is necessary as an alternative.
600
soo
O400
300
W* 200
100
/
^SM reactor irradiation ") v*"
//
~f (Indiumreloading \
MIR reactor irradiation \
25 300 5 10 15 20
Irradiation time, days
Fig.3 Combined scheme of iridium irradiation
Thus, on the basis of the investigation of 192Ir accumulation dynamics a combined procedure for iridiumirradiation has been validated and implemented in practical work using two reactors (SM and MIR).
ACKNOWLEDGMENTS
This work was supported by Minatom of Russia
REFERENCES
1. Yu.G.Toporov, V.A.Tarasov. Neutron Flux Density Profiling during 192Ir Irradiation. // Proc. of 3rdTopical Meeting on Industrial Radiation and Radioisotopes Measurements and Applications(IRRMA'96), October 6-9, 1996, Raleigh, NC: ANS, 1996, p. 194.2. A.Gandini, M.Salvatores, L.Tondinelli "New Developments in Generalized Perturbation Methods inthe Nuclide Field", 1977, p.339-345, v.62(2), Nucl. Sci. Eng.3. J.M.Kallfelz, G.B.Bruna, G.Palmiotti, M.Salvatores "Burnup Calculations with Time-DependentGeneralized Perturbation Theory", 1977, p.304-309, v.62(2), Nucl. Sci. Eng.
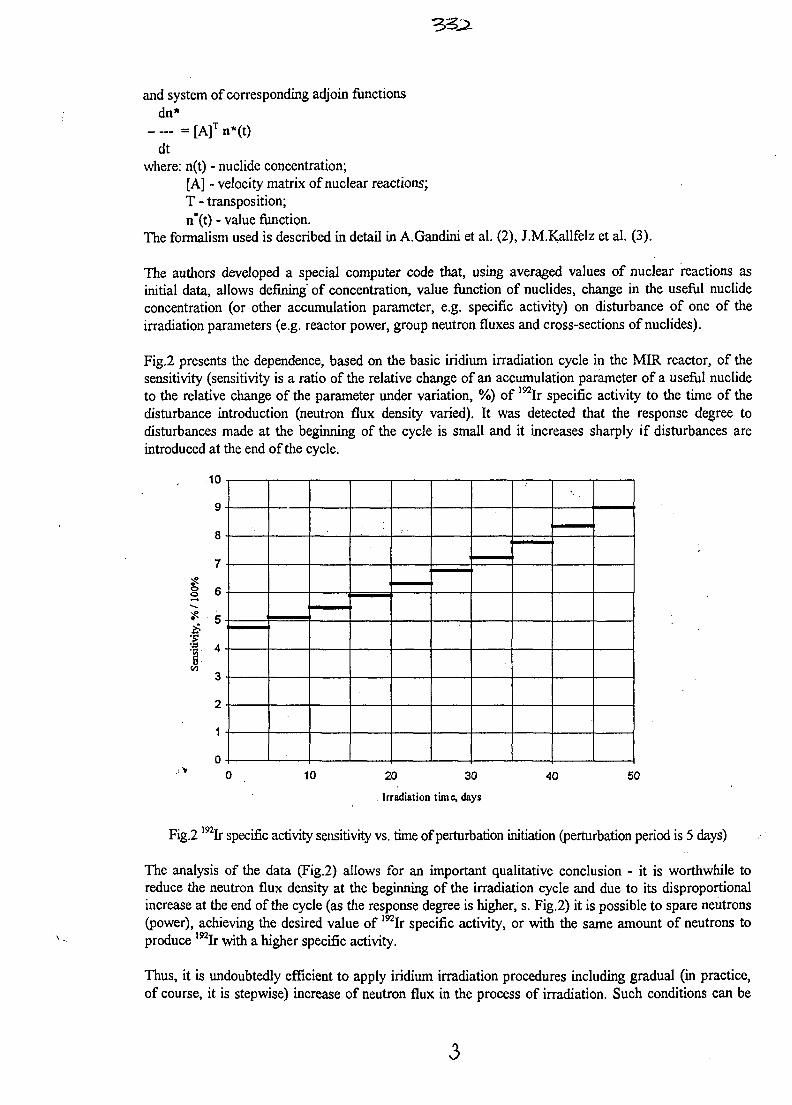
and system of corresponding adjoin functionsdn*
- - = [A]T n*(t)dt
where: n(t) - nuclide concentration;[A] - velocity matrix of nuclear reactions;T - transposition;n*(t) - value function.
The formalism used is described in detail in A.Gandini et al. (2), J.M.Kallfelz et al. (3).
The authors developed a special computer code that, using averaged values of nuclear reactions asinitial data, allows defining' of concentration, value function of nuclides, change in the useful nuclideconcentration (or other accumulation parameter, e.g. specific activity) on disturbance of one of theirradiation parameters (e.g. reactor power, group neutron fluxes and cross-sections of nuclides).
Fig.2 presents the dependence, based on the basic iridium irradiation cycle in the MIR reactor, of thesensitivity (sensitivity is a ratio of the relative change of an accumulation parameter of a useful nuclideto the relative change of the parameter under variation, %) of I92Ir specific activity to the time of thedisturbance introduction (neutron flux density varied). It was detected that the response degree todisturbances made at the beginning of the cycle is small and it increases sharply if disturbances areintroduced at the end of the cycle.
.10-1
9 -
8-
7-
S 6 •
S? 5 .
I 43-
2-
1 •
0 -
c) 10 20
Irradiation
30
time, days
40 5<
Fig.2 Ir specific activity sensitivity vs. time of perturbation initiation (perturbation period is 5 days)
The analysis of the data (Fig.2) allows for an important qualitative conclusion - it is worthwhile toreduce the neutron flux density at the beginning of the irradiation cycle and due to its disproportionalincrease at the end of the cycle (as the response degree is higher, s. Fig.2) it is possible to spare neutrons(power), achieving the desired value of 192Ir specific activity, or with the same amount of neutrons toproduce l92Ir with a higher specific activity.
Thus, it is undoubtedly efficient to apply iridium irradiation procedures including gradual (in practice,of course, it is stepwise) increase of neutron flux in the process of irradiation. Such conditions can be
Related Documents