21 ST National Award for Excellence in Energy Management-2020 1 Presented By : 1. Mr. Abhinav Prakash Trivedi (Sr. GM – Operation & TS) 2.Mrs. Pratibha Pathak (Sr. Manager –O&E) 3. Mr. Vipin Dubey (Manager – O&E)

Welcome message from author
This document is posted to help you gain knowledge. Please leave a comment to let me know what you think about it! Share it to your friends and learn new things together.
Transcript
21ST National Awardfor
Excellence in Energy Management-2020
1
Presented By : 1. Mr. Abhinav Prakash Trivedi (Sr. GM – Operation & TS)2.Mrs. Pratibha Pathak (Sr. Manager –O&E)3. Mr. Vipin Dubey (Manager – O&E)
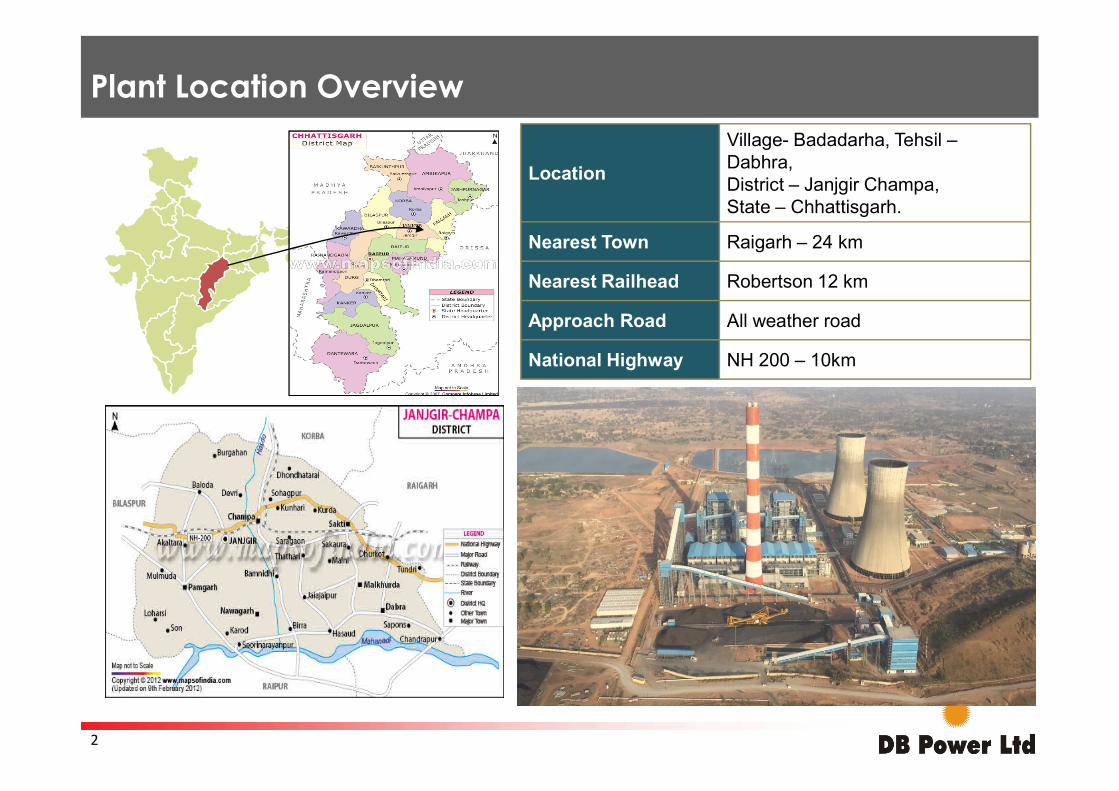
Location
Village- Badadarha, Tehsil –Dabhra,District – Janjgir Champa, State – Chhattisgarh.
Nearest Town Raigarh – 24 km
Nearest Railhead Robertson 12 km
Approach Road All weather road
National Highway NH 200 – 10km
Plant Location Overview
2
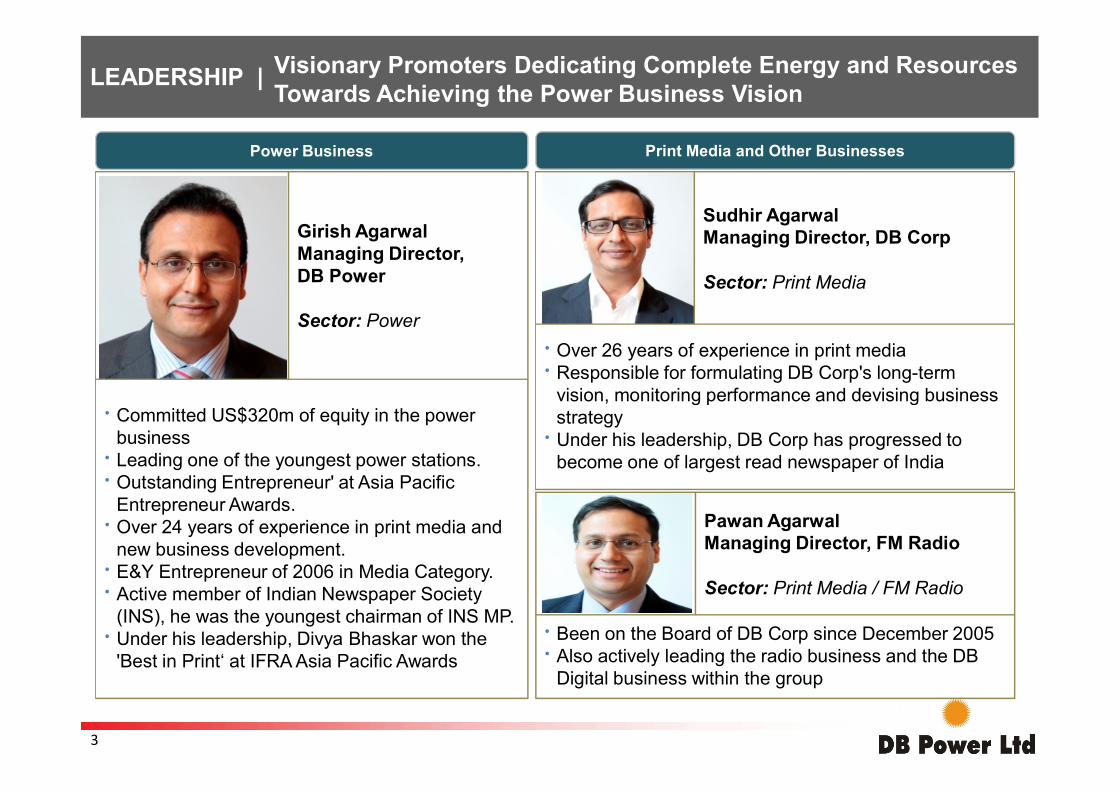
Girish AgarwalManaging Director, DB Power
Sector: Power
Sudhir AgarwalManaging Director, DB Corp
Sector: Print Media
• Over 26 years of experience in print media • Responsible for formulating DB Corp's long-term
vision, monitoring performance and devising business
LEADERSHIP |
Print Media and Other Businesses Power Business
Visionary Promoters Dedicating Complete Energy and Resources Towards Achieving the Power Business Vision
3
Pawan Agarwal Managing Director, FM Radio
Sector: Print Media / FM Radio
• Been on the Board of DB Corp since December 2005• Also actively leading the radio business and the DB
Digital business within the group
• Committed US$320m of equity in the power business
• Leading one of the youngest power stations.• Outstanding Entrepreneur' at Asia Pacific
Entrepreneur Awards.• Over 24 years of experience in print media and
new business development.• E&Y Entrepreneur of 2006 in Media Category.• Active member of Indian Newspaper Society
(INS), he was the youngest chairman of INS MP.• Under his leadership, Divya Bhaskar won the
'Best in Print‘ at IFRA Asia Pacific Awards
vision, monitoring performance and devising business strategy
• Under his leadership, DB Corp has progressed to become one of largest read newspaper of India
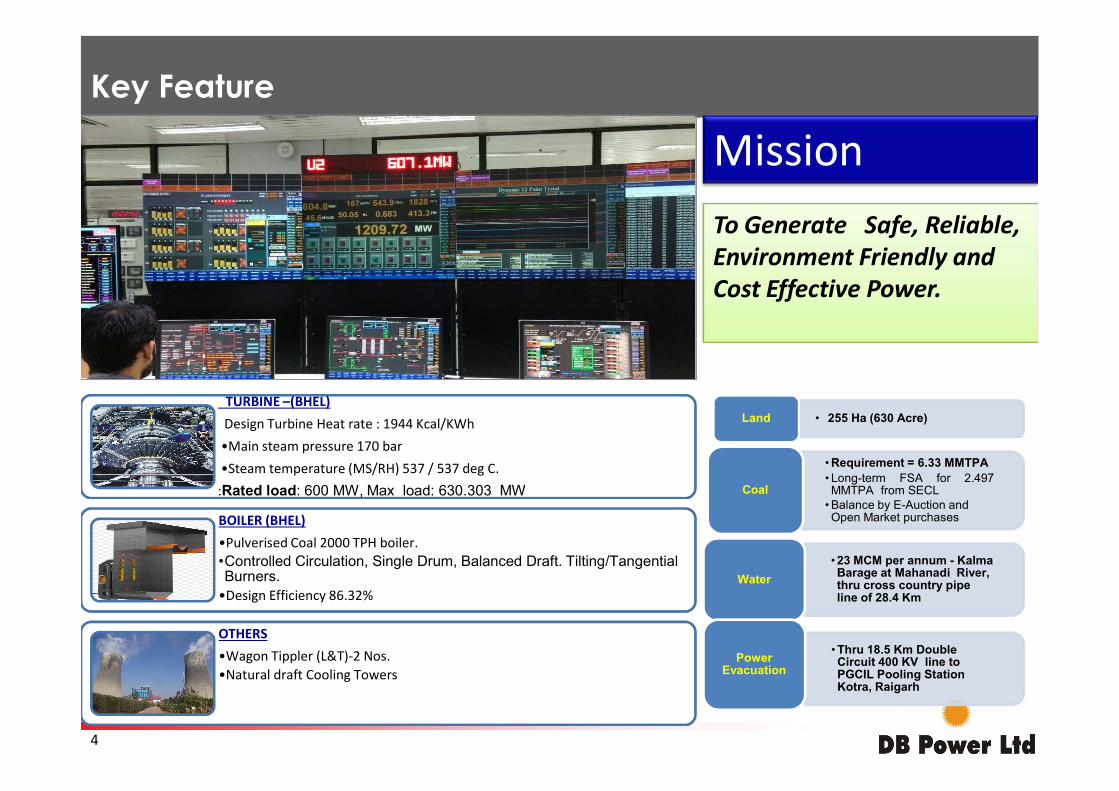
Key Feature
TURBINE –(BHEL)
MissionTo Generate Safe, Reliable, Environment Friendly and Cost Effective Power.
4
TURBINE –(BHEL)Design Turbine Heat rate : 1944 Kcal/KWh
•Main steam pressure 170 bar•Steam temperature (MS/RH) 537 / 537 deg C.:Rated load: 600 MW, Max load: 630.303 MW
BOILER (BHEL)•Pulverised Coal 2000 TPH boiler.•Controlled Circulation, Single Drum, Balanced Draft. Tilting/Tangential Burners.
•Design Efficiency 86.32%
OTHERS•Wagon Tippler (L&T)-2 Nos.•Natural draft Cooling Towers
• 255 Ha (630 Acre)Land
• Requirement = 6.33 MMTPA • Long-term FSA for 2.497MMTPA from SECL
• Balance by E-Auction and Open Market purchases
Coal
• 23 MCM per annum - Kalma Barage at Mahanadi River, thru cross country pipe line of 28.4 Km
Water
• Thru 18.5 Km Double Circuit 400 KV line to PGCIL Pooling Station Kotra, Raigarh
Power Evacuation
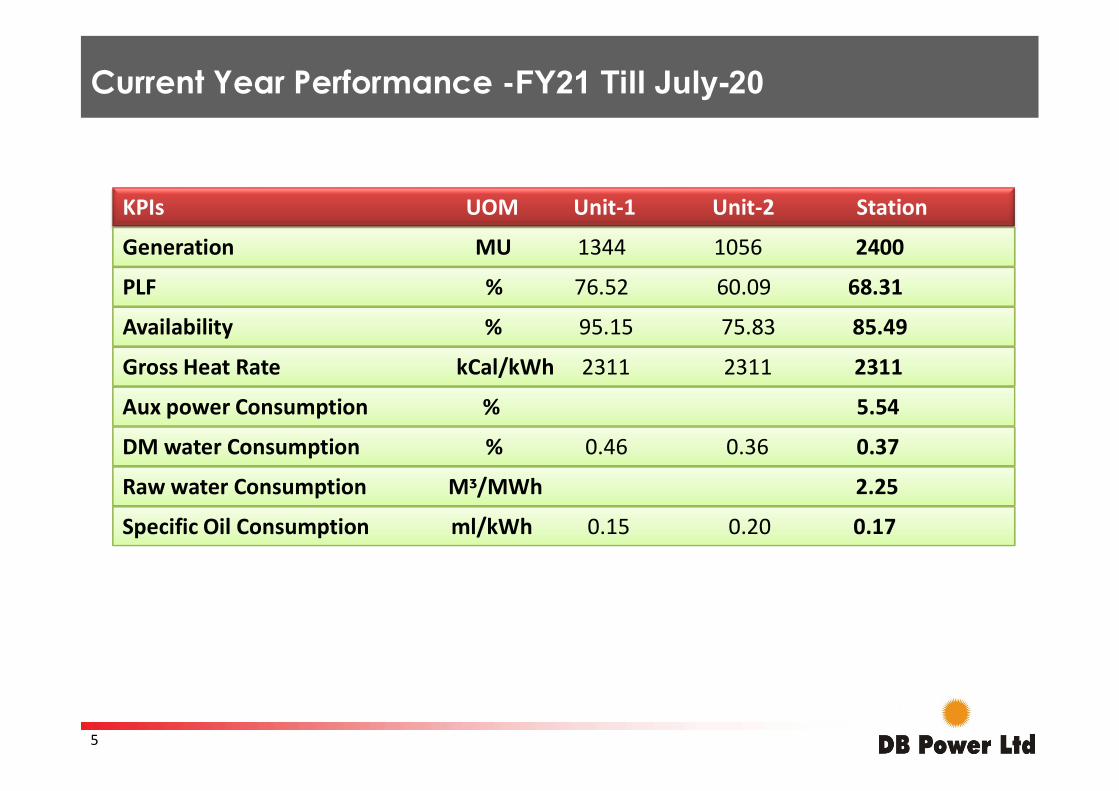
Current Year Performance -FY21 Till July-20
KPIs UOM Unit-1 Unit-2 Station
Generation MU 1344 1056 2400
PLF % 76.52 60.09 68.31
Availability % 95.15 75.83 85.49
Gross Heat Rate kCal/kWh 2311 2311 2311
Aux power Consumption % 5.54
5
Aux power Consumption % 5.54
DM water Consumption % 0.46 0.36 0.37
Raw water Consumption Mᶾ/MWh 2.25
Specific Oil Consumption ml/kWh 0.15 0.20 0.17
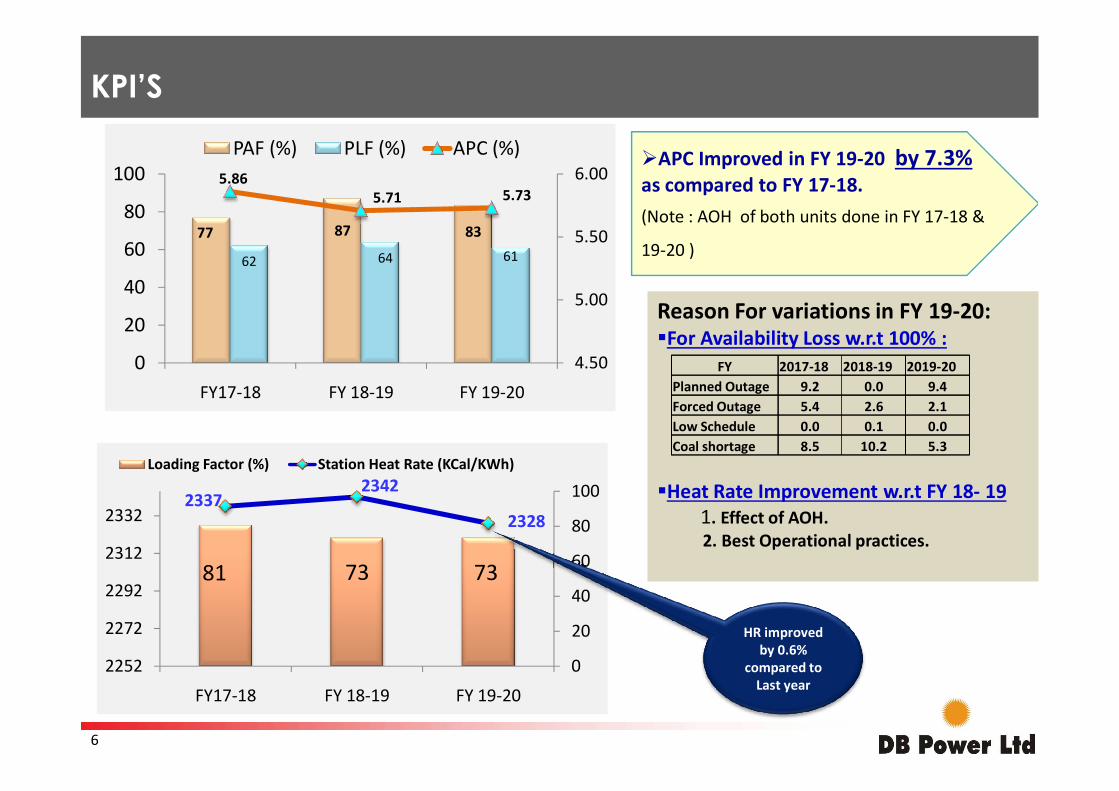
KPI’S
77 87 83
62 64 61
5.865.71 5.73
4.50
5.00
5.50
6.00
0
20
40
60
80
100
FY17-18 FY 18-19 FY 19-20
PAF (%) PLF (%) APC (%)
Reason For variations in FY 19-20: For Availability Loss w.r.t 100% :
by 7.3% APC Improved in FY 19-20 by 7.3% as compared to FY 17-18. (Note : AOH of both units done in FY 17-18 &
19-20 )
FY 2017-18 2018-19 2019-20Planned Outage 9.2 0.0 9.4
6
81 73 73
23372342
2328
0
20
40
60
80
100
2252
2272
2292
2312
2332
FY17-18 FY 18-19 FY 19-20
Loading Factor (%) Station Heat Rate (KCal/KWh)
HR improved by 0.6%
compared to Last year
FY17-18 FY 18-19 FY 19-20
Heat Rate Improvement w.r.t FY 18- 19 1. Effect of AOH.2. Best Operational practices.
Planned Outage 9.2 0.0 9.4Forced Outage 5.4 2.6 2.1Low Schedule 0.0 0.1 0.0Coal shortage 8.5 10.2 5.3
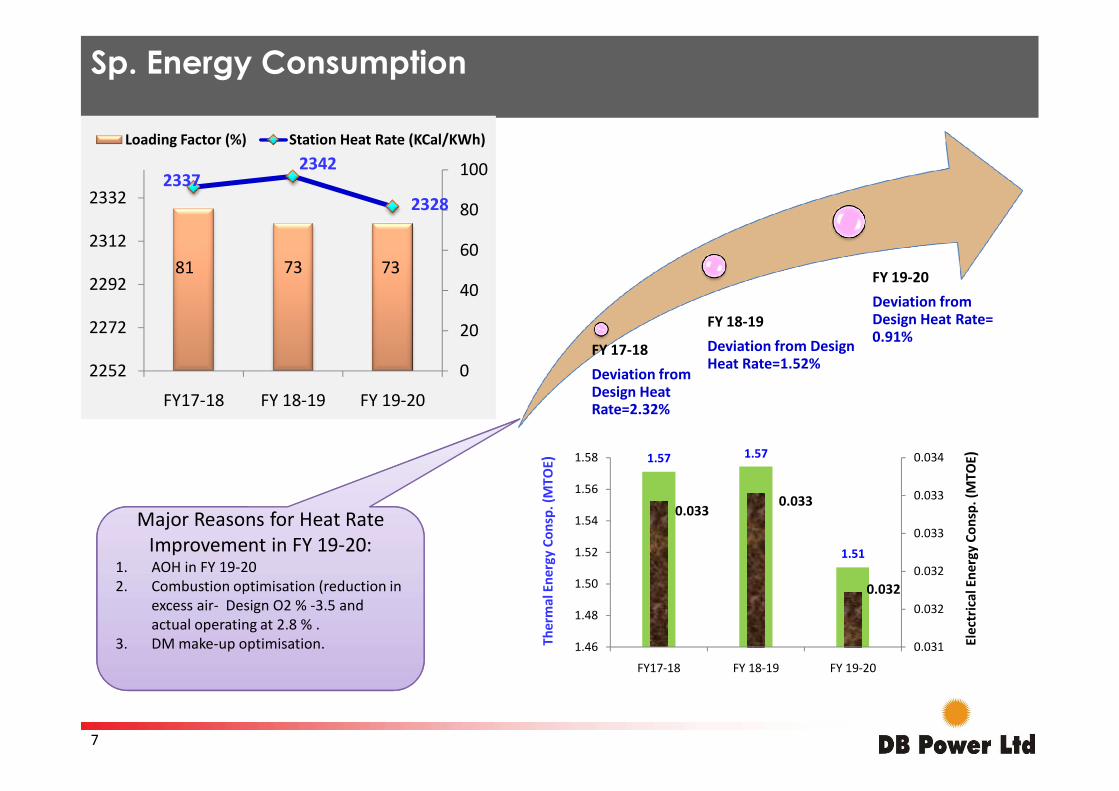
Sp. Energy Consumption
FY 17-18
Deviation from Design Heat
FY 18-19
Deviation from Design Heat Rate=1.52%
FY 19-20
Deviation from Design Heat Rate= 0.91%
81 73 73
23372342
2328
0
20
40
60
80
100
2252
2272
2292
2312
2332
FY17-18 FY 18-19 FY 19-20
Loading Factor (%) Station Heat Rate (KCal/KWh)
7
Design Heat Rate=2.32%
Major Reasons for Heat Rate Major Reasons for Heat Rate Improvement in FY 19-20:
1. AOH in FY 19-202. Combustion optimisation (reduction in
excess air- Design O2 % -3.5 and actual operating at 2.8 % .
3. DM make-up optimisation.
FY17-18 FY 18-19 FY 19-20
1.57 1.57
1.51
0.0330.033
0.032
0.031
0.032
0.032
0.033
0.033
0.034
1.46
1.48
1.50
1.52
1.54
1.56
1.58
FY17-18 FY 18-19 FY 19-20
Ther
mal
Ene
rgy
Cons
p. (M
TOE)
Elec
tric
al E
nerg
y Co
nsp.
(MTO
E)
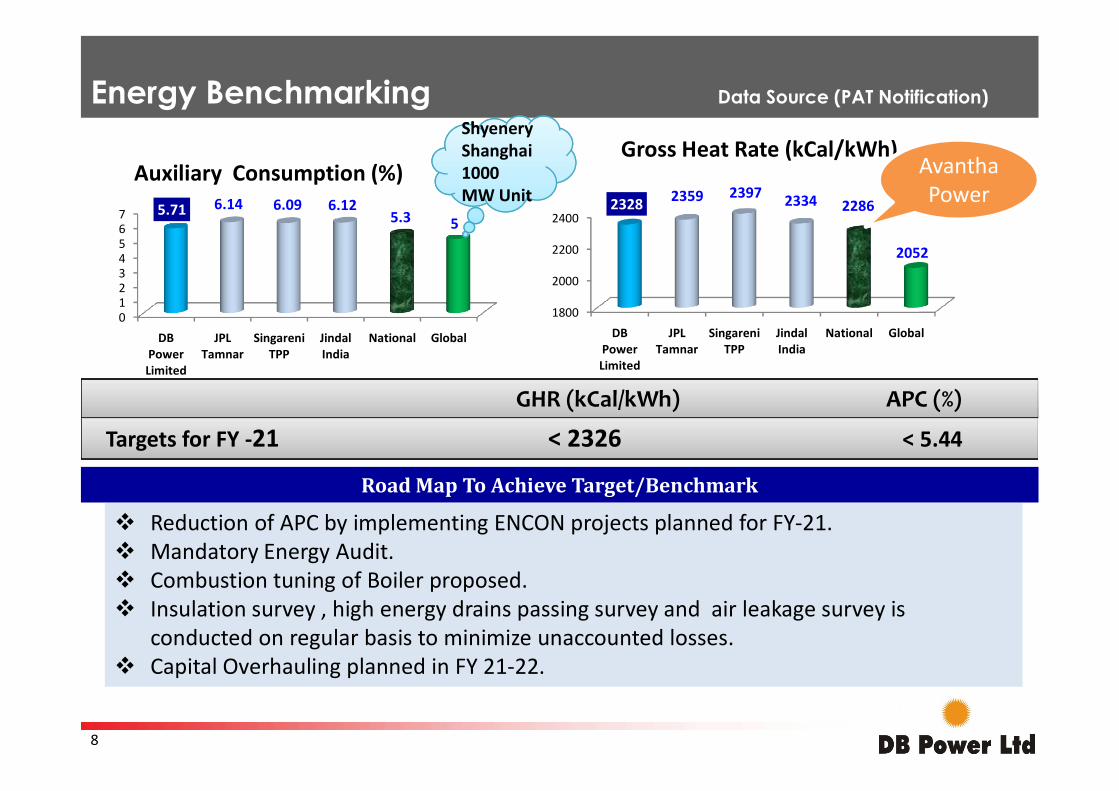
Energy Benchmarking Data Source (PAT Notification)
GHR (kCal/kWh) APC (%)
1800
2000
2200
2400
DB Power Limited
JPL Tamnar
Singareni TPP
Jindal India
National Global
2328 2359 2397 2334 2286
2052
Gross Heat Rate (kCal/kWh)
01234567
DB Power Limited
JPL Tamnar
Singareni TPP
Jindal India
National Global
5.71 6.14 6.09 6.125.3 5
Auxiliary Consumption (%) Avantha Power
Shyenery
MW Unit
Shyenery Shanghai 1000 MW Unit
8
Targets for FY -21 < 2326 < 5.44
GHR (kCal/kWh) APC (%)
Road Map To Achieve Target/Benchmark
Reduction of APC by implementing ENCON projects planned for FY-21. Mandatory Energy Audit. Combustion tuning of Boiler proposed. Insulation survey , high energy drains passing survey and air leakage survey is
conducted on regular basis to minimize unaccounted losses. Capital Overhauling planned in FY 21-22.
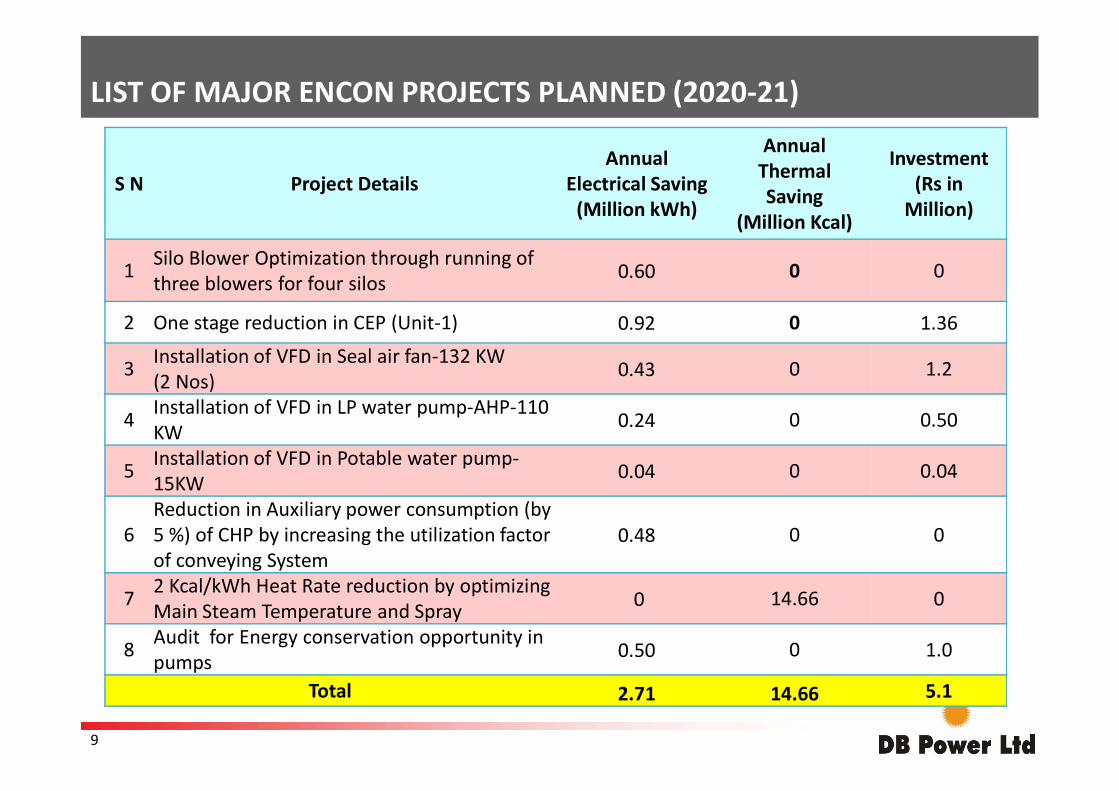
LIST OF MAJOR ENCON PROJECTS PLANNED (2020-21)
S N Project DetailsAnnual
Electrical Saving(Million kWh)
Annual Thermal Saving
(Million Kcal)
Investment(Rs in
Million)
1 Silo Blower Optimization through running of three blowers for four silos 0.60 0 0
2 One stage reduction in CEP (Unit-1) 0.92 0 1.36
3 Installation of VFD in Seal air fan-132 KW (2 Nos) 0.43 0 1.2
Installation of VFD in LP water pump-AHP-110
9
4 Installation of VFD in LP water pump-AHP-110 KW 0.24 0 0.50
5 Installation of VFD in Potable water pump-15KW 0.04 0 0.04
6Reduction in Auxiliary power consumption (by 5 %) of CHP by increasing the utilization factor of conveying System
0.48 0 0
7 2 Kcal/kWh Heat Rate reduction by optimizing Main Steam Temperature and Spray 0 14.66 0
8 Audit for Energy conservation opportunity in pumps 0.50 0 1.0
Total 2.71 14.66 5.1
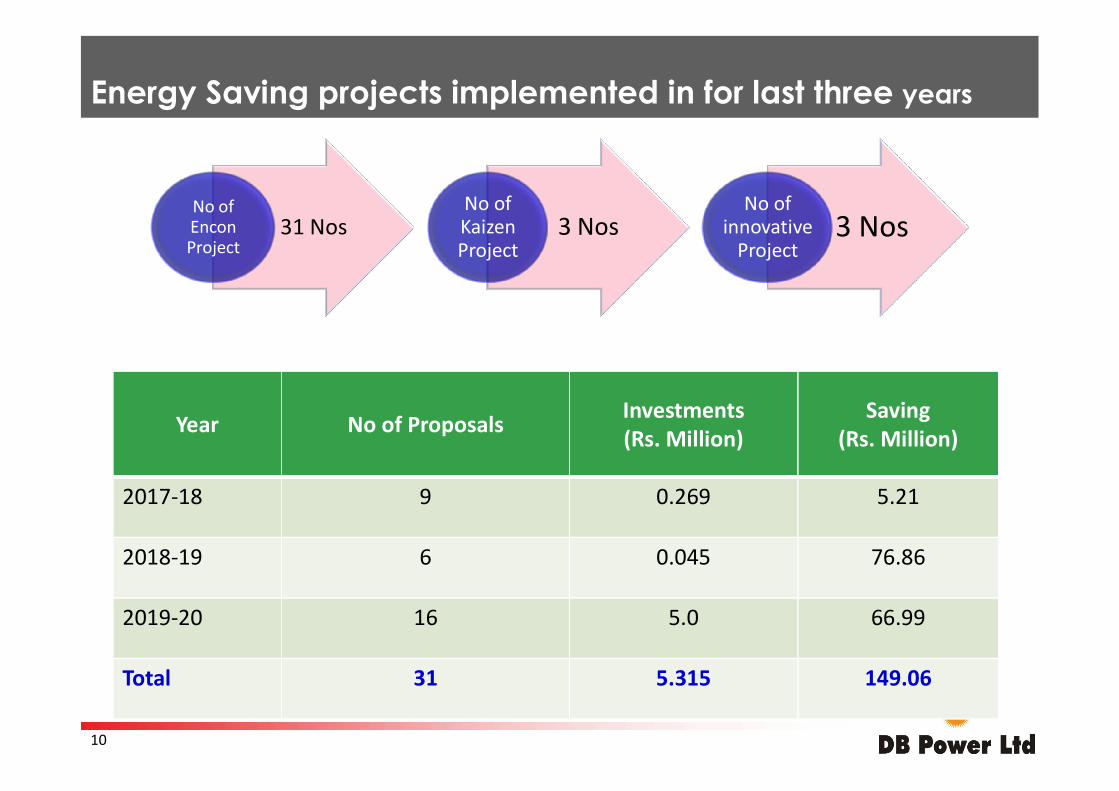
Energy Saving projects implemented in for last three years
Investments Saving
31 NosNo of Encon Project
3 NosNo of Kaizen Project
3 NosNo of
innovative Project
10
Year No of Proposals Investments(Rs. Million)
Saving(Rs. Million)
2017-18 9 0.269 5.21
2018-19 6 0.045 76.86
2019-20 16 5.0 66.99
Total 31 5.315 149.06
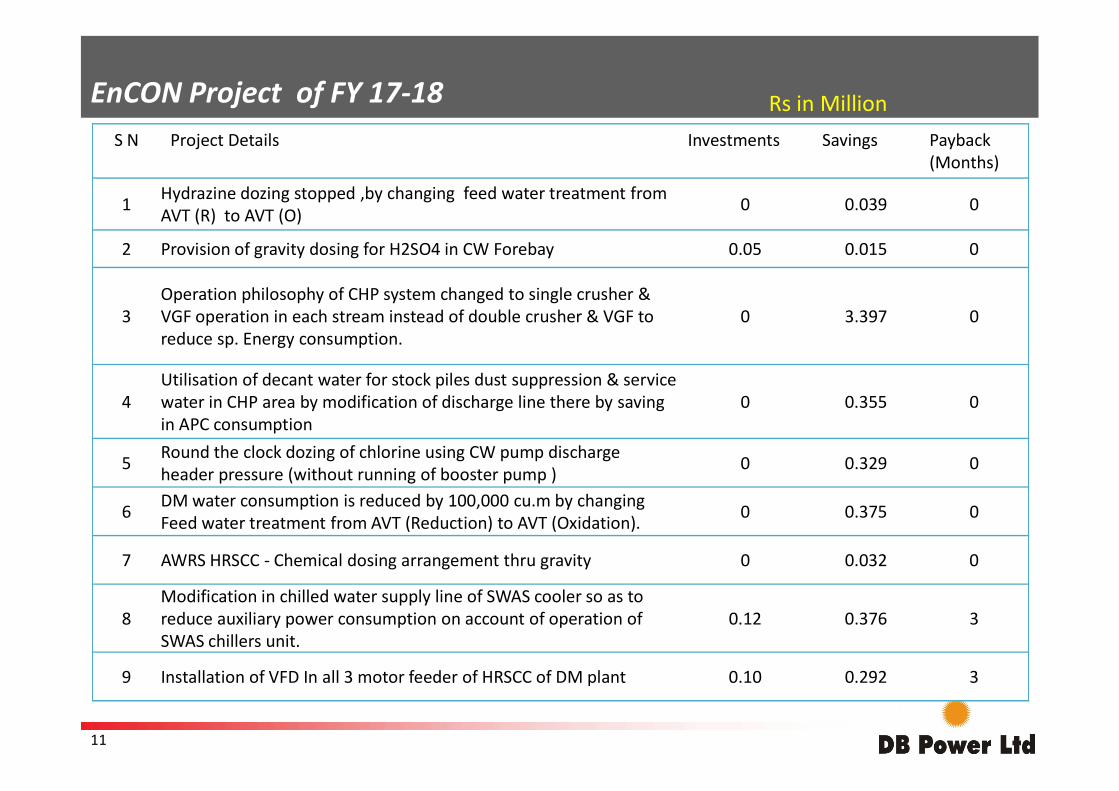
EnCON Project of FY 17-18 Rs in Million S N Project Details Investments Savings Payback
(Months)
1 Hydrazine dozing stopped ,by changing feed water treatment from AVT (R) to AVT (O) 0 0.039 0
2 Provision of gravity dosing for H2SO4 in CW Forebay 0.05 0.015 0
3Operation philosophy of CHP system changed to single crusher & VGF operation in each stream instead of double crusher & VGF to reduce sp. Energy consumption.
0 3.397 0
4Utilisation of decant water for stock piles dust suppression & service water in CHP area by modification of discharge line there by saving 0 0.355 0
11
4 water in CHP area by modification of discharge line there by saving in APC consumption
0 0.355 0
5 Round the clock dozing of chlorine using CW pump discharge header pressure (without running of booster pump ) 0 0.329 0
6 DM water consumption is reduced by 100,000 cu.m by changing Feed water treatment from AVT (Reduction) to AVT (Oxidation). 0 0.375 0
7 AWRS HRSCC - Chemical dosing arrangement thru gravity 0 0.032 0
8Modification in chilled water supply line of SWAS cooler so as to reduce auxiliary power consumption on account of operation of SWAS chillers unit.
0.12 0.376 3
9 Installation of VFD In all 3 motor feeder of HRSCC of DM plant 0.10 0.292 3
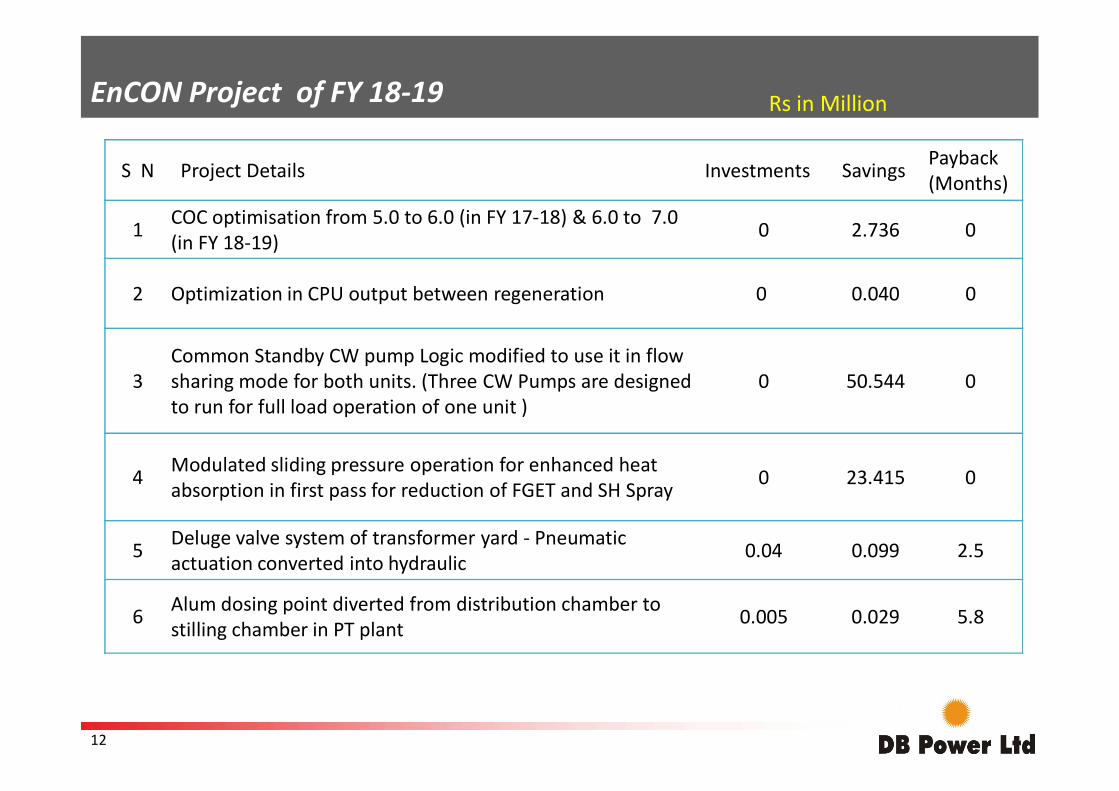
EnCON Project of FY 18-19
S N Project Details Investments Savings Payback (Months)
1 COC optimisation from 5.0 to 6.0 (in FY 17-18) & 6.0 to 7.0 (in FY 18-19) 0 2.736 0
2 Optimization in CPU output between regeneration 0 0.040 0
3Common Standby CW pump Logic modified to use it in flow sharing mode for both units. (Three CW Pumps are designed to run for full load operation of one unit )
0 50.544 0
Rs in Million
12
to run for full load operation of one unit )
4 Modulated sliding pressure operation for enhanced heat absorption in first pass for reduction of FGET and SH Spray 0 23.415 0
5 Deluge valve system of transformer yard - Pneumatic actuation converted into hydraulic 0.04 0.099 2.5
6 Alum dosing point diverted from distribution chamber to stilling chamber in PT plant 0.005 0.029 5.8
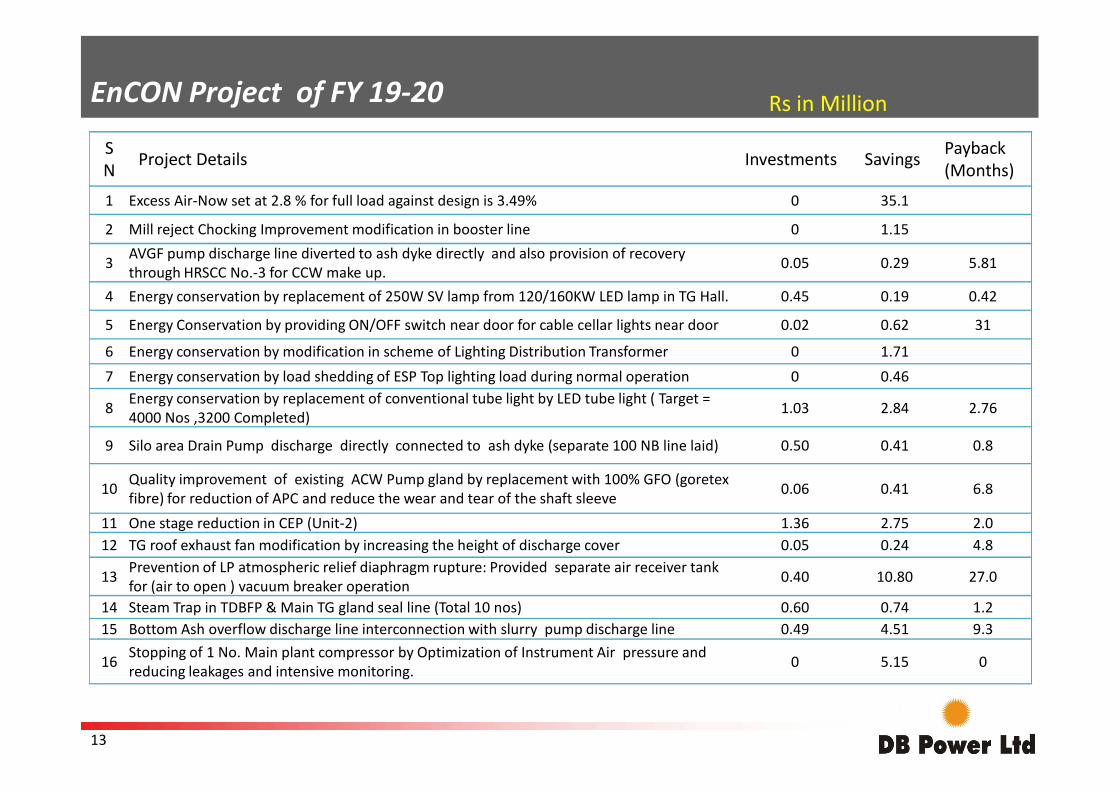
EnCON Project of FY 19-20
SN Project Details Investments Savings Payback
(Months)
1 Excess Air-Now set at 2.8 % for full load against design is 3.49% 0 35.1
2 Mill reject Chocking Improvement modification in booster line 0 1.15
3 AVGF pump discharge line diverted to ash dyke directly and also provision of recovery through HRSCC No.-3 for CCW make up. 0.05 0.29 5.81
4 Energy conservation by replacement of 250W SV lamp from 120/160KW LED lamp in TG Hall. 0.45 0.19 0.42
5 Energy Conservation by providing ON/OFF switch near door for cable cellar lights near door 0.02 0.62 31
6 Energy conservation by modification in scheme of Lighting Distribution Transformer 0 1.71
7 Energy conservation by load shedding of ESP Top lighting load during normal operation 0 0.46Energy conservation by replacement of conventional tube light by LED tube light ( Target =
Rs in Million
13
8 Energy conservation by replacement of conventional tube light by LED tube light ( Target = 4000 Nos ,3200 Completed) 1.03 2.84 2.76
9 Silo area Drain Pump discharge directly connected to ash dyke (separate 100 NB line laid) 0.50 0.41 0.8
10 Quality improvement of existing ACW Pump gland by replacement with 100% GFO (goretex fibre) for reduction of APC and reduce the wear and tear of the shaft sleeve 0.06 0.41 6.8
11 One stage reduction in CEP (Unit-2) 1.36 2.75 2.012 TG roof exhaust fan modification by increasing the height of discharge cover 0.05 0.24 4.8
13 Prevention of LP atmospheric relief diaphragm rupture: Provided separate air receiver tank for (air to open ) vacuum breaker operation 0.40 10.80 27.0
14 Steam Trap in TDBFP & Main TG gland seal line (Total 10 nos) 0.60 0.74 1.215 Bottom Ash overflow discharge line interconnection with slurry pump discharge line 0.49 4.51 9.3
16 Stopping of 1 No. Main plant compressor by Optimization of Instrument Air pressure and reducing leakages and intensive monitoring. 0 5.15 0
INNOVATIVE PROJECTSINNOVATIVE PROJECTS
14
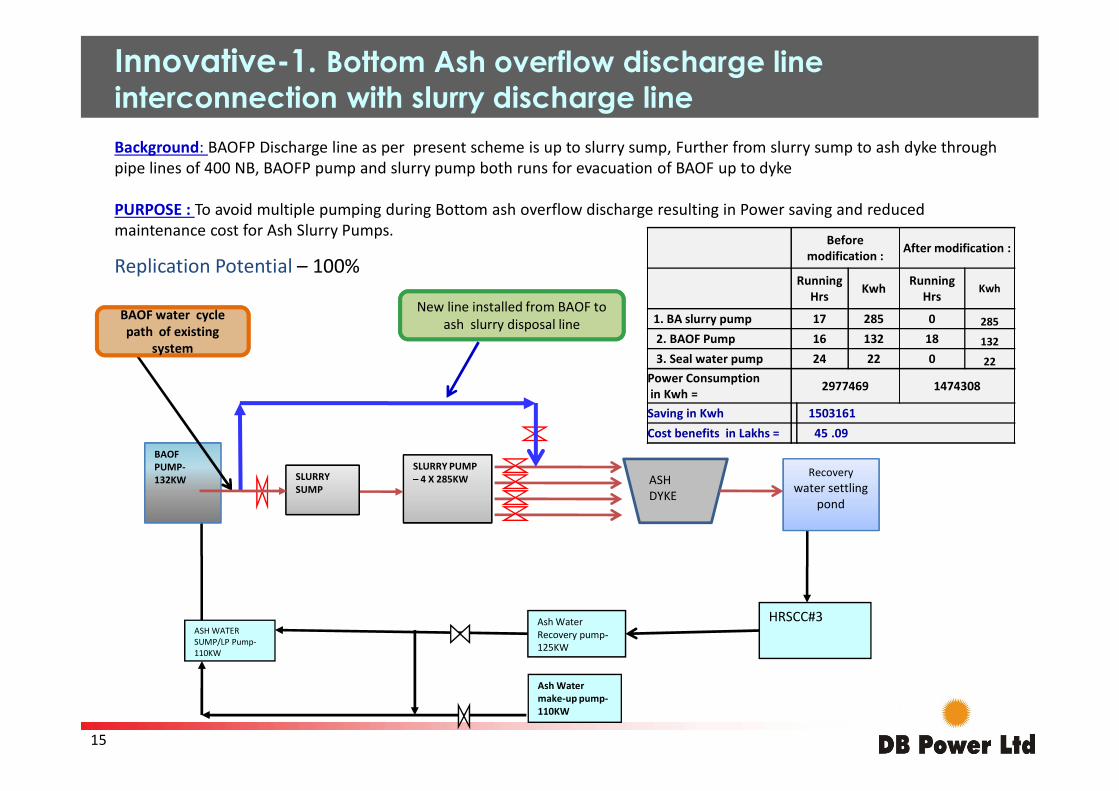
Innovative-1. Bottom Ash overflow discharge line interconnection with slurry discharge line
Background: BAOFP Discharge line as per present scheme is up to slurry sump, Further from slurry sump to ash dyke through pipe lines of 400 NB, BAOFP pump and slurry pump both runs for evacuation of BAOF up to dyke
PURPOSE : To avoid multiple pumping during Bottom ash overflow discharge resulting in Power saving and reduced maintenance cost for Ash Slurry Pumps.
BAOF water cycle
system
BAOF water cycle path of existing
system
New line installed from BAOF to ash slurry disposal line
Before modification : After modification :
Running Hrs Kwh Running
HrsKwh
1. BA slurry pump 17 285 0 2852. BAOF Pump 16 132 18 1323. Seal water pump 24 22 0 22
Power Consumptionin Kwh = 2977469 1474308
Replication Potential – 100%
15
Ash Water Recovery pump-125KW
HRSCC#3ASH WATER SUMP/LP Pump-110KW
Ash Water make-up pump-110KW
SLURRY PUMP – 4 X 285KW Recovery
water settling pond
BAOF PUMP-132KW SLURRY
SUMPASH DYKE
in Kwh =Saving in Kwh 1503161Cost benefits in Lakhs = 45 .09
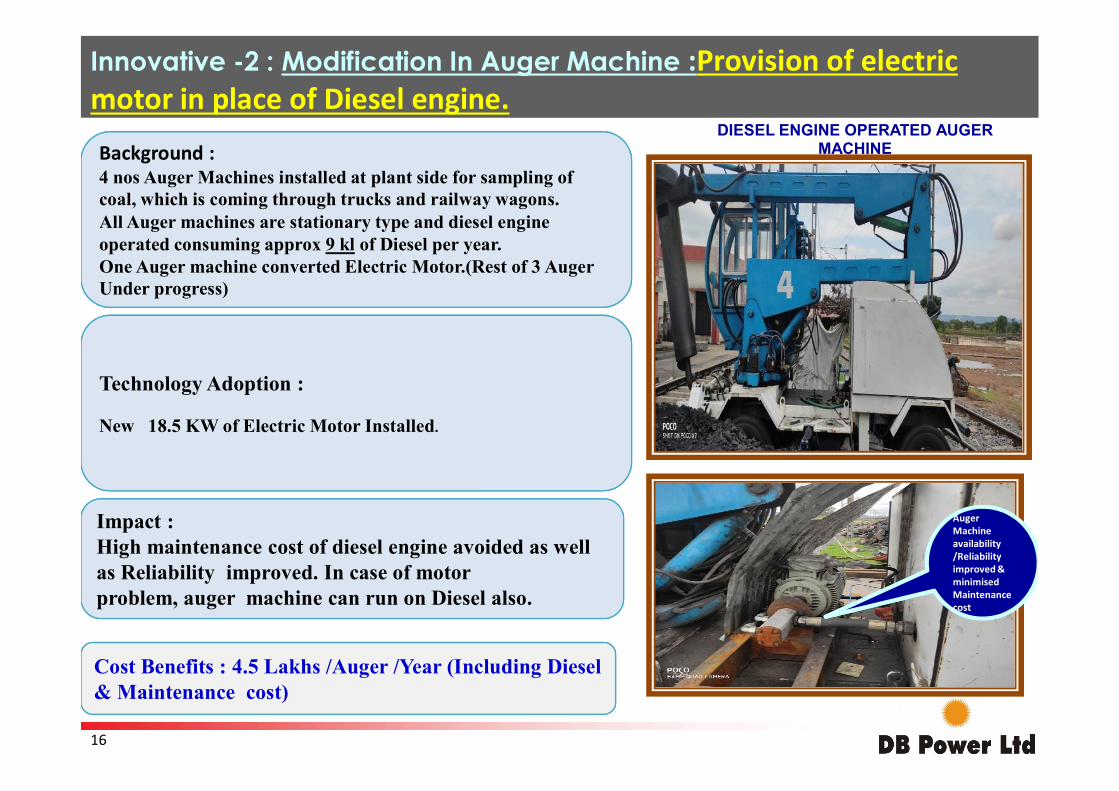
Innovative -2 : Modification In Auger Machine :Provision of electric motor in place of Diesel engine.
DIESEL ENGINE OPERATED AUGER MACHINEBackground :
4 nos Auger Machines installed at plant side for sampling ofcoal, which is coming through trucks and railway wagons.All Auger machines are stationary type and diesel engine operated consuming approx 9 kl of Diesel per year.One Auger machine converted Electric Motor.(Rest of 3 Auger Under progress)
Technology Adoption :
16
Auger
cost
Auger Machine availability /Reliability improved & minimised Maintenance cost
New 18.5 KW of Electric Motor Installed.
Impact :High maintenance cost of diesel engine avoided as well as Reliability improved. In case of motor problem, auger machine can run on Diesel also.
Cost Benefits : 4.5 Lakhs /Auger /Year (Including Diesel & Maintenance cost)
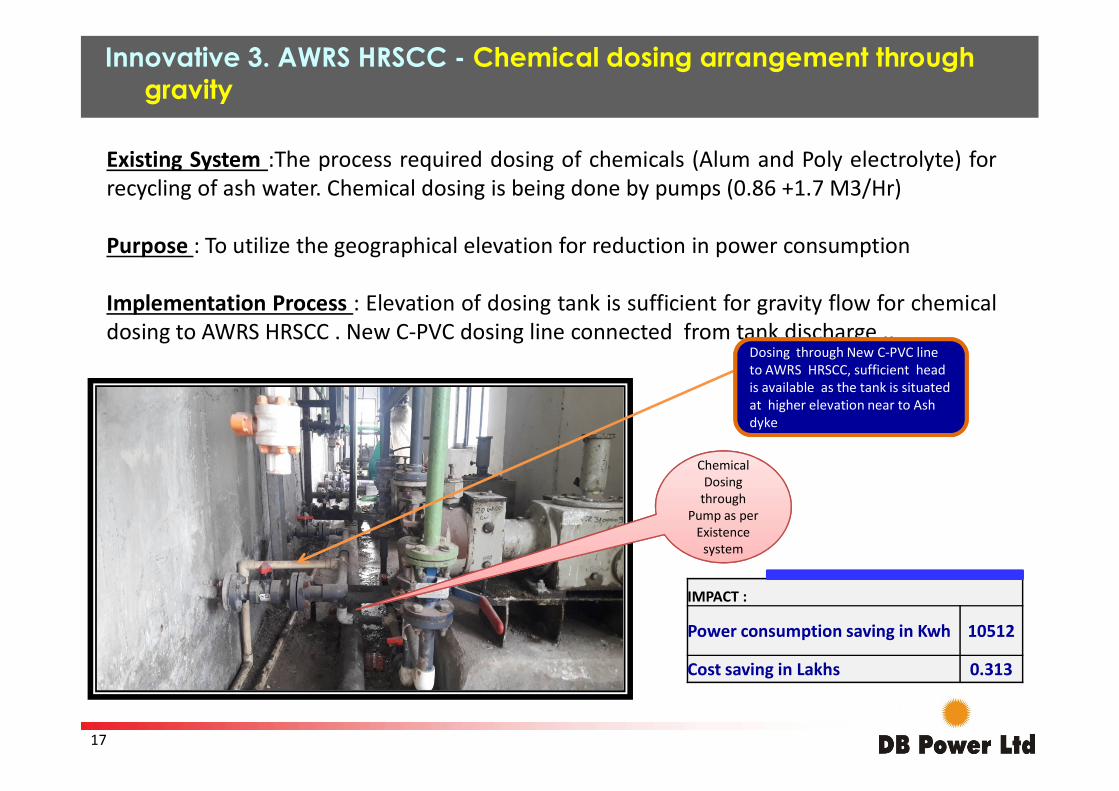
Existing System :The process required dosing of chemicals (Alum and Poly electrolyte) forrecycling of ash water. Chemical dosing is being done by pumps (0.86 +1.7 M3/Hr)
Purpose : To utilize the geographical elevation for reduction in power consumption
Implementation Process : Elevation of dosing tank is sufficient for gravity flow for chemicaldosing to AWRS HRSCC . New C-PVC dosing line connected from tank discharge ..
Dosing through New C-PVC line to AWRS HRSCC, sufficient head is available as the tank is situated
Innovative 3. AWRS HRSCC - Chemical dosing arrangement through gravity
17
Chemical Chemical Dosing
through Pump as per
Existence system
is available as the tank is situated at higher elevation near to Ash dyke
IMPACT :
Power consumption saving in Kwh 10512
Cost saving in Lakhs 0.313
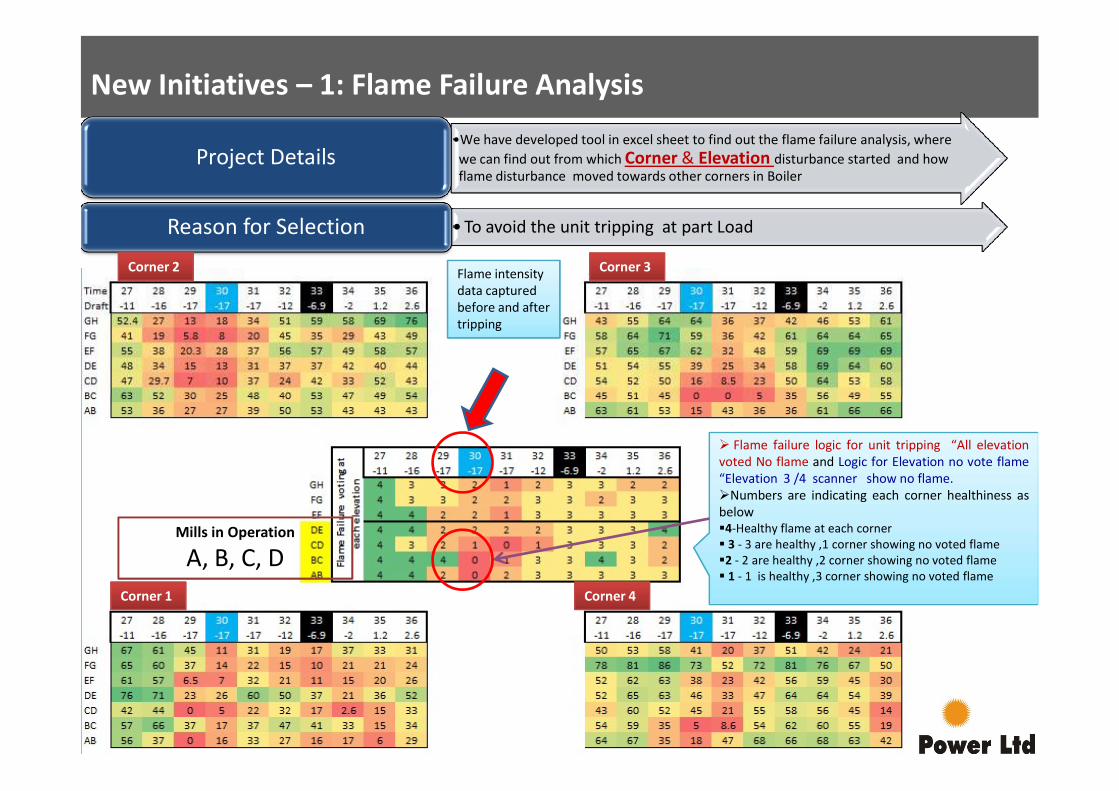
New Initiatives – 1: Flame Failure Analysis
•We have developed tool in excel sheet to find out the flame failure analysis, where we can find out from which Corner & Elevation disturbance started and how flame disturbance moved towards other corners in Boiler
Project Details
• To avoid the unit tripping at part Load Reason for Selection
Corner 2 Corner 3Flame intensity data captured before and after tripping
18
Mills in Operation
A, B, C, DCorner 1 Corner 4
Flame failure logic for unit tripping “All elevationvoted No flame and Logic for Elevation no vote flame“Elevation 3 /4 scanner show no flame.Numbers are indicating each corner healthiness asbelow4-Healthy flame at each corner 3 - 3 are healthy ,1 corner showing no voted flame2 - 2 are healthy ,2 corner showing no voted flame 1 - 1 is healthy ,3 corner showing no voted flame
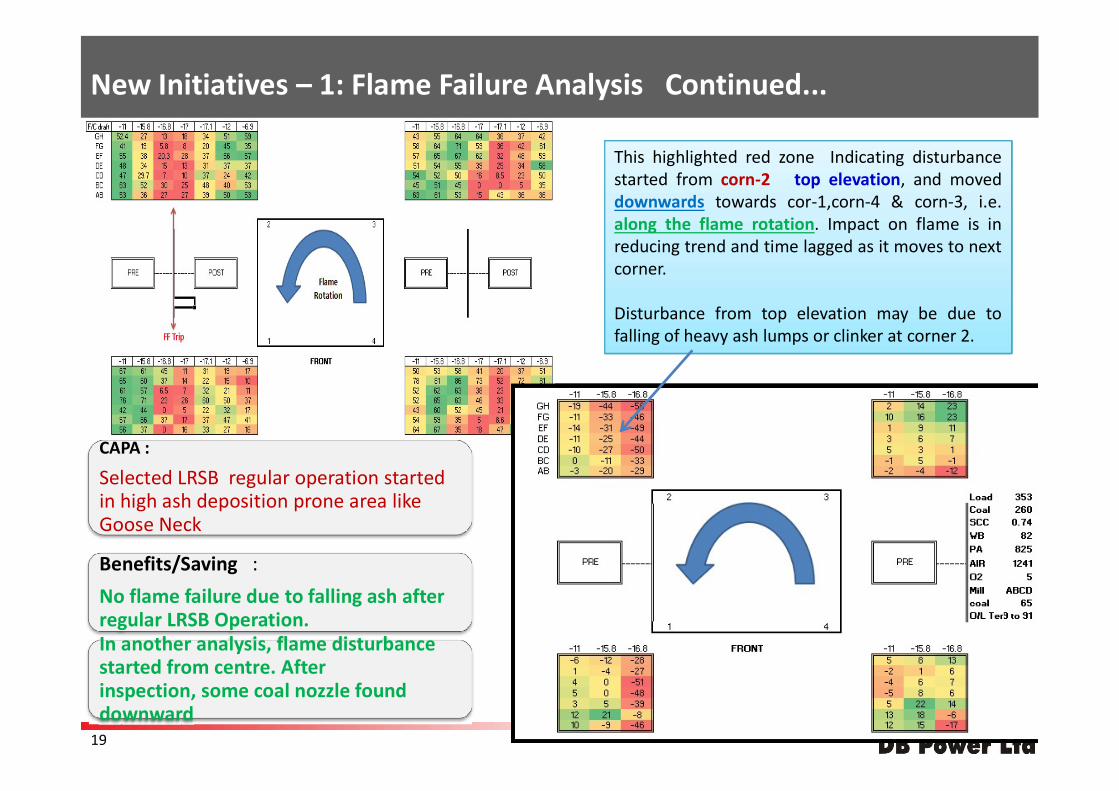
This highlighted red zone Indicating disturbancestarted from corn-2 top elevation, and moveddownwards towards cor-1,corn-4 & corn-3, i.e.along the flame rotation. Impact on flame is inreducing trend and time lagged as it moves to nextcorner.
Disturbance from top elevation may be due tofalling of heavy ash lumps or clinker at corner 2.
New Initiatives – 1: Flame Failure Analysis Continued...
19
CAPA :
Selected LRSB regular operation started in high ash deposition prone area like Goose Neck
Benefits/Saving :
No flame failure due to falling ash after regular LRSB Operation.In another analysis, flame disturbance started from centre. After inspection, some coal nozzle found downward
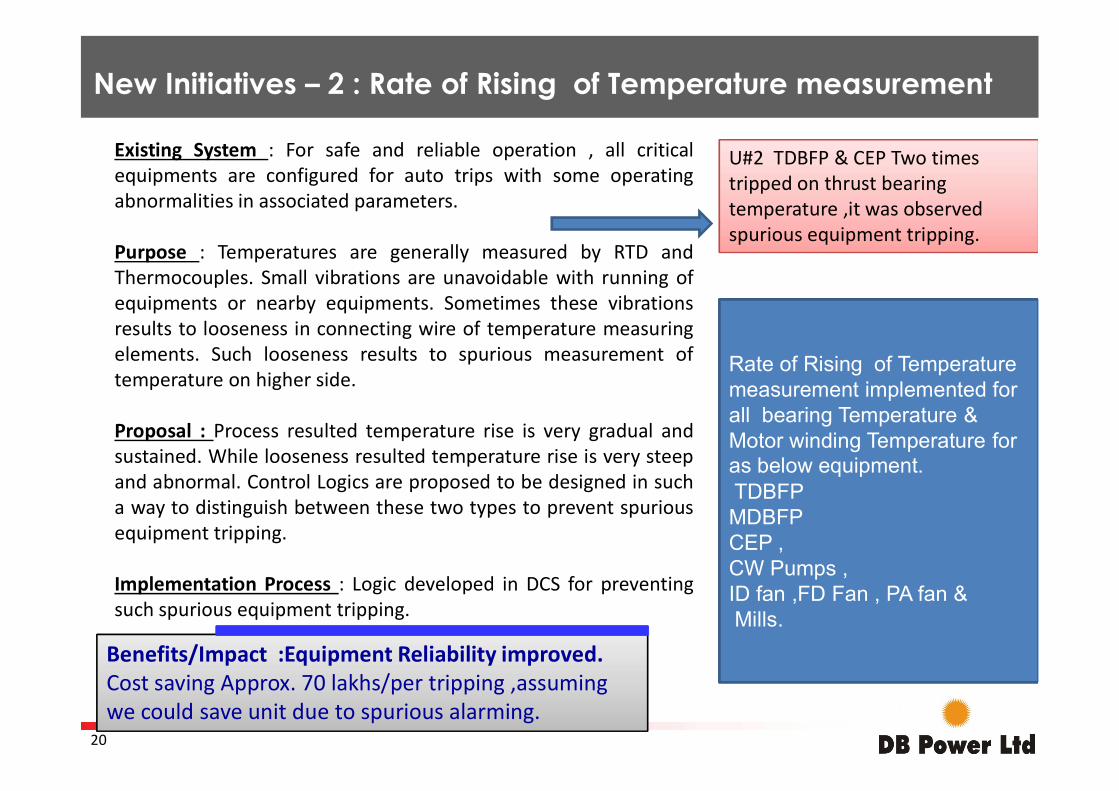
New Initiatives – 2 : Rate of Rising of Temperature measurement
Existing System : For safe and reliable operation , all criticalequipments are configured for auto trips with some operatingabnormalities in associated parameters.
Purpose : Temperatures are generally measured by RTD andThermocouples. Small vibrations are unavoidable with running ofequipments or nearby equipments. Sometimes these vibrationsresults to looseness in connecting wire of temperature measuringelements. Such looseness results to spurious measurement oftemperature on higher side.
U#2 TDBFP & CEP Two times tripped on thrust bearing temperature ,it was observed spurious equipment tripping.
Rate of Rising of Temperature measurement implemented for
20
Proposal : Process resulted temperature rise is very gradual andsustained. While looseness resulted temperature rise is very steepand abnormal. Control Logics are proposed to be designed in sucha way to distinguish between these two types to prevent spuriousequipment tripping.
Implementation Process : Logic developed in DCS for preventingsuch spurious equipment tripping.
measurement implemented for all bearing Temperature & Motor winding Temperature for as below equipment. TDBFP MDBFPCEP ,CW Pumps ,ID fan ,FD Fan , PA fan &Mills.
Benefits/Impact :Equipment Reliability improved. Cost saving Approx. 70 lakhs/per tripping ,assuming we could save unit due to spurious alarming.
IMPROVEMENT PROJECTIMPROVEMENT PROJECT
21
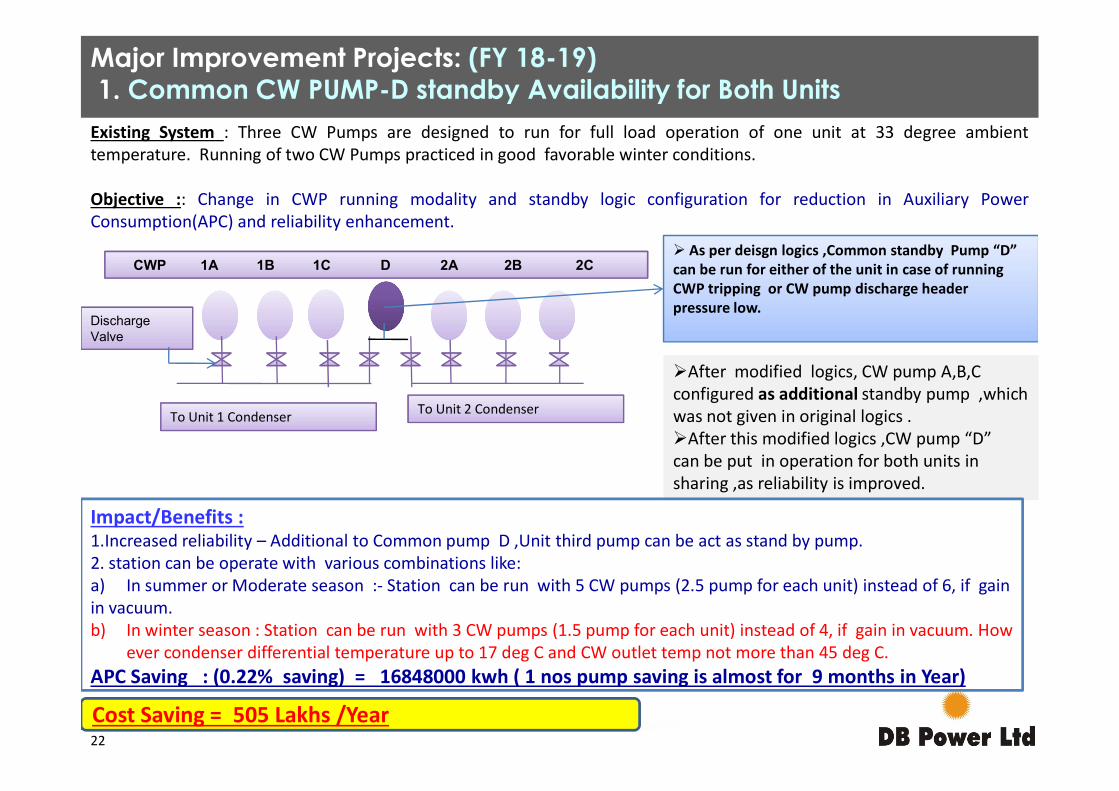
CWP 1A 1B 1C D 2A 2B 2C
Discharge Valve
As per deisgn logics ,Common standby Pump “D” can be run for either of the unit in case of running CWP tripping or CW pump discharge header pressure low.
After modified logics, CW pump A,B,C configured as additional standby pump ,which
Existing System : Three CW Pumps are designed to run for full load operation of one unit at 33 degree ambienttemperature. Running of two CW Pumps practiced in good favorable winter conditions.
Objective :: Change in CWP running modality and standby logic configuration for reduction in Auxiliary PowerConsumption(APC) and reliability enhancement.
Major Improvement Projects: (FY 18-19)1. Common CW PUMP-D standby Availability for Both Units
To Unit 1 Condenser To Unit 2 Condenserconfigured as additional standby pump ,which was not given in original logics .After this modified logics ,CW pump “D” can be put in operation for both units in sharing ,as reliability is improved.
Impact/Benefits :1.Increased reliability – Additional to Common pump D ,Unit third pump can be act as stand by pump.2. station can be operate with various combinations like: a) In summer or Moderate season :- Station can be run with 5 CW pumps (2.5 pump for each unit) instead of 6, if gain in vacuum.b) In winter season : Station can be run with 3 CW pumps (1.5 pump for each unit) instead of 4, if gain in vacuum. How
ever condenser differential temperature up to 17 deg C and CW outlet temp not more than 45 deg C.APC Saving : (0.22% saving) = 16848000 kwh ( 1 nos pump saving is almost for 9 months in Year)
Cost Saving = 505 Lakhs /Year22
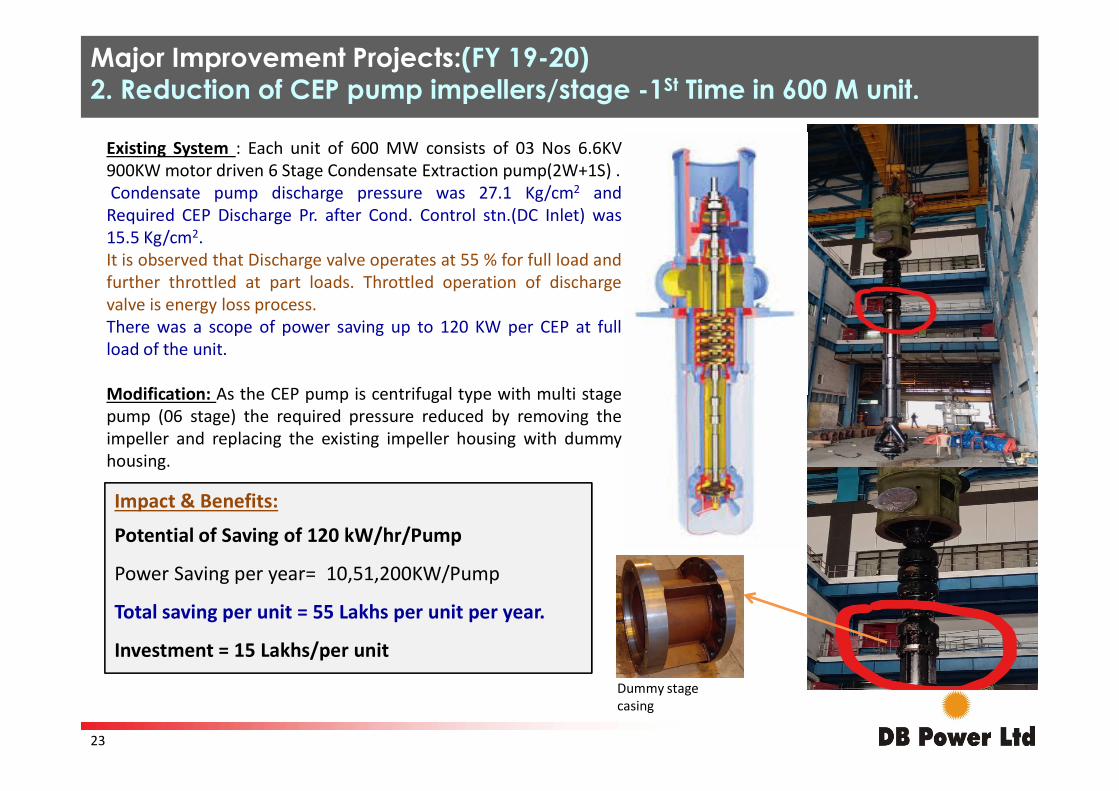
11. Blanking of CEP stageExisting System : Each unit of 600 MW consists of 03 Nos 6.6KV900KW motor driven 6 Stage Condensate Extraction pump(2W+1S) .Condensate pump discharge pressure was 27.1 Kg/cm2 andRequired CEP Discharge Pr. after Cond. Control stn.(DC Inlet) was15.5 Kg/cm2.It is observed that Discharge valve operates at 55 % for full load andfurther throttled at part loads. Throttled operation of dischargevalve is energy loss process.There was a scope of power saving up to 120 KW per CEP at fullload of the unit.
Modification: As the CEP pump is centrifugal type with multi stage
Major Improvement Projects:(FY 19-20)2. Reduction of CEP pump impellers/stage -1St Time in 600 M unit.
Modification: As the CEP pump is centrifugal type with multi stagepump (06 stage) the required pressure reduced by removing theimpeller and replacing the existing impeller housing with dummyhousing.
Impact & Benefits:
Potential of Saving of 120 kW/hr/Pump
Power Saving per year= 10,51,200KW/Pump
Total saving per unit = 55 Lakhs per unit per year.
Investment = 15 Lakhs/per unit
Dummy stage casing
23
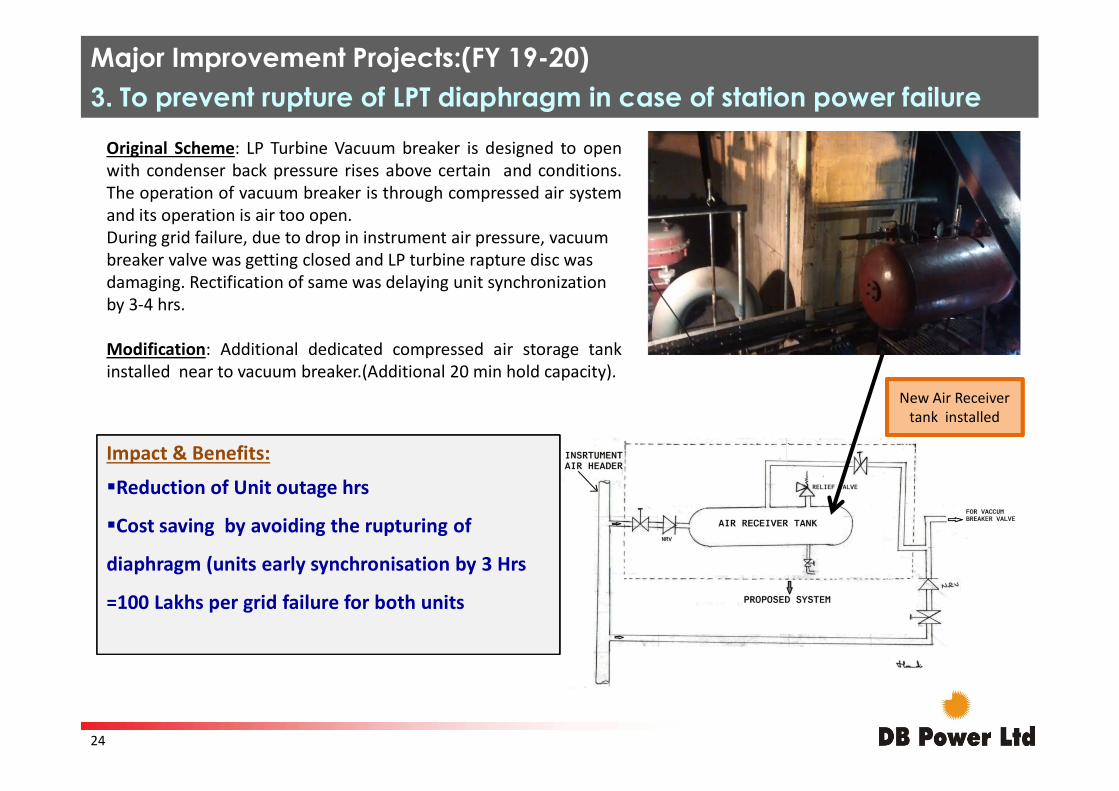
3. To prevent rupture of LPT diaphragm in case of station power failure
Original Scheme: LP Turbine Vacuum breaker is designed to openwith condenser back pressure rises above certain and conditions.The operation of vacuum breaker is through compressed air systemand its operation is air too open.During grid failure, due to drop in instrument air pressure, vacuum breaker valve was getting closed and LP turbine rapture disc was damaging. Rectification of same was delaying unit synchronization by 3-4 hrs.
Modification: Additional dedicated compressed air storage tankinstalled near to vacuum breaker.(Additional 20 min hold capacity).
Major Improvement Projects:(FY 19-20)
New Air Receiver New Air Receiver tank installed
Impact & Benefits:
Reduction of Unit outage hrs
Cost saving by avoiding the rupturing of
diaphragm (units early synchronisation by 3 Hrs
=100 Lakhs per grid failure for both units
24
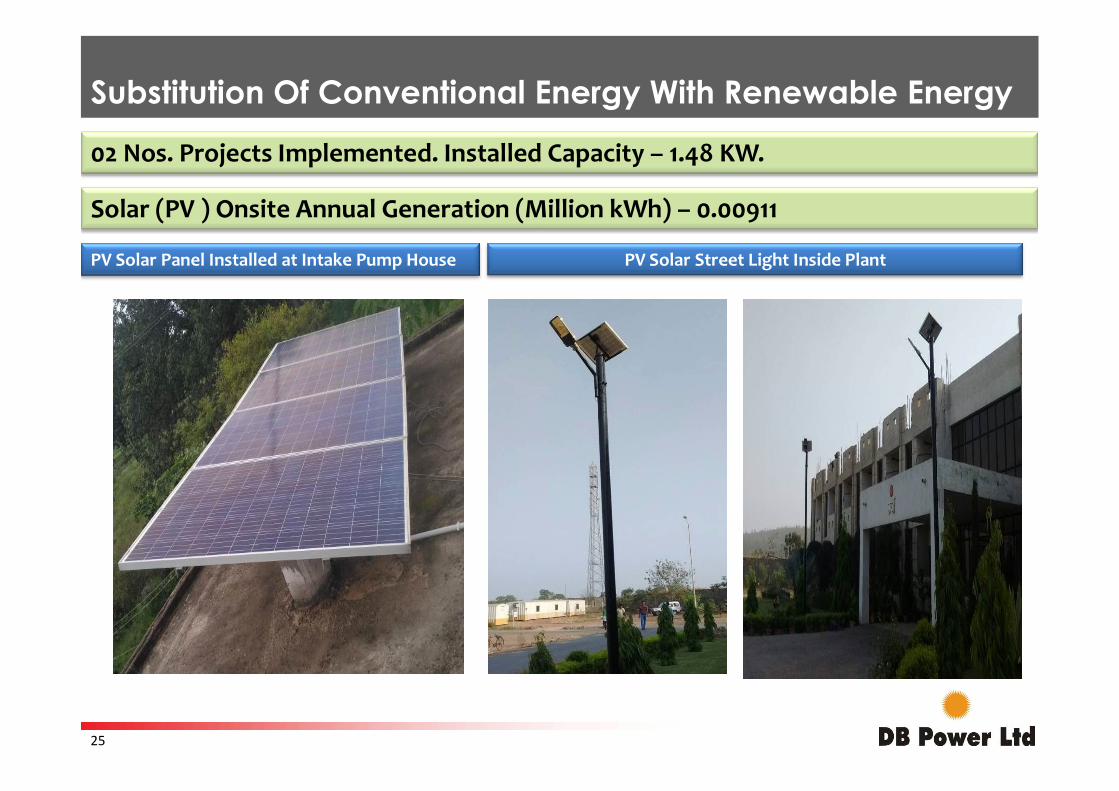
Substitution Of Conventional Energy With Renewable Energy
Solar (PV ) Onsite Annual Generation (Million kWh) – 0.00911
PV Solar Panel Installed at Intake Pump House PV Solar Street Light Inside Plant
02 Nos. Projects Implemented. Installed Capacity – 1.48 KW.
25
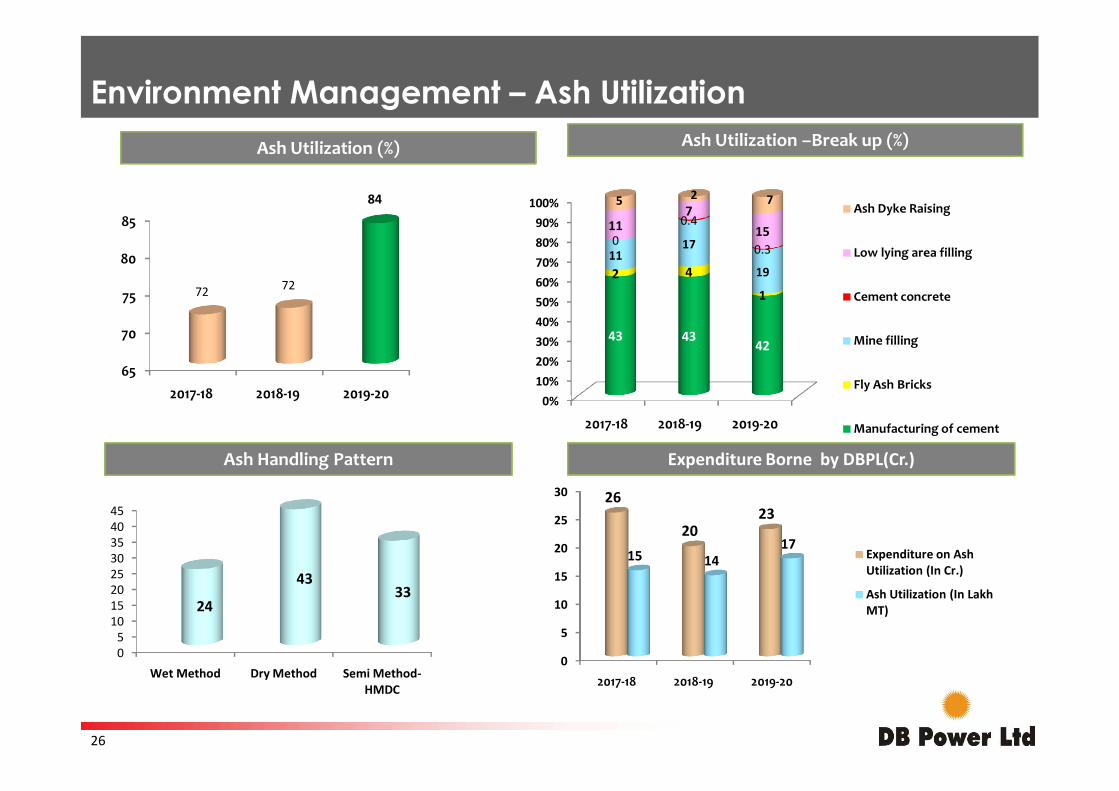
Environment Management – Ash Utilization
65
70
75
80
85
2017-18 2018-19 2019-20
72 72
84
0%10%20%30%40%50%60%70%80%90%
100%
43 4342
2 4
1
1117
19
00.4
0.3
117
15
5 2 7Ash Dyke Raising
Low lying area filling
Cement concrete
Mine filling
Fly Ash Bricks
Ash Utilization –Break up (%)Ash Utilization (%)
2017-18 2018-19 2019-20 0%
2017-18 2018-19 2019-20 Manufacturing of cement
05
1015202530354045
Wet Method Dry Method Semi Method-HMDC
24
4333
Ash Handling Pattern
0
5
10
15
20
25
30
2017-18 2018-19 2019-20
26
2023
15 1417
Expenditure on Ash Utilization (In Cr.)
Ash Utilization (In Lakh MT)
Expenditure Borne by DBPL(Cr.)
26
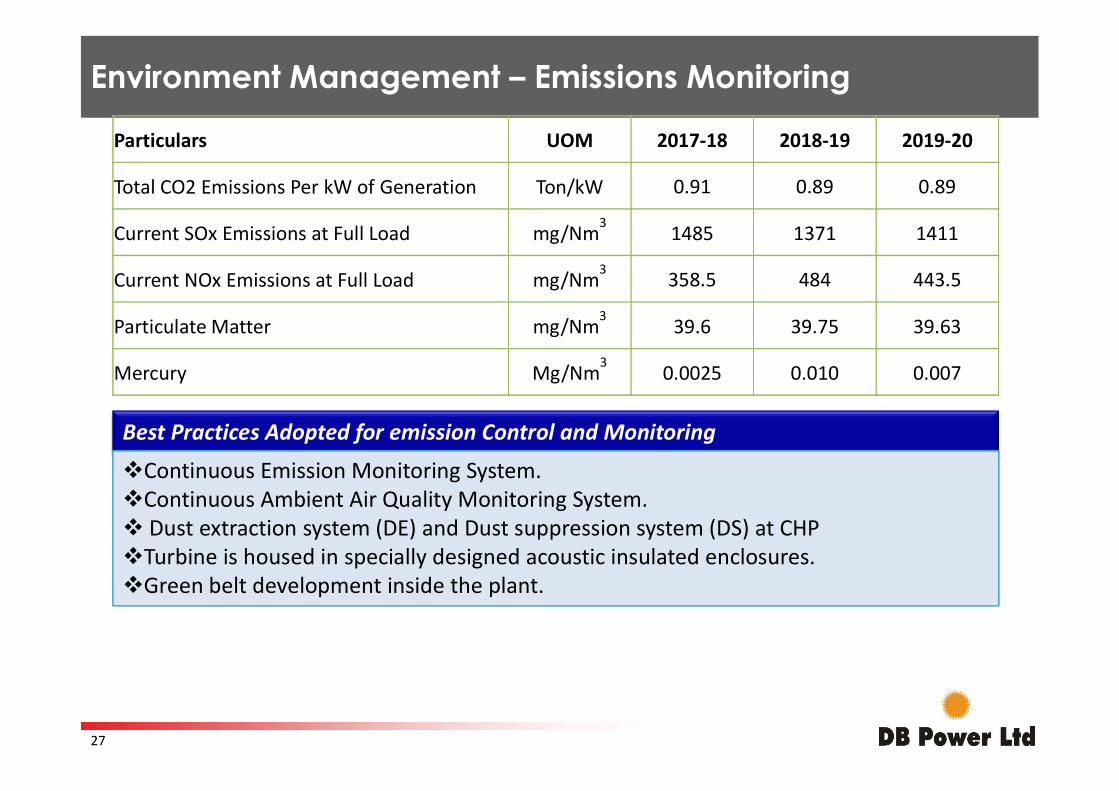
Environment Management – Emissions Monitoring
Particulars UOM 2017-18 2018-19 2019-20
Total CO2 Emissions Per kW of Generation Ton/kW 0.91 0.89 0.89
Current SOx Emissions at Full Load mg/Nm3
1485 1371 1411
Current NOx Emissions at Full Load mg/Nm3 358.5 484 443.5
Particulate Matter mg/Nm3
39.6 39.75 39.63
Mercury Mg/Nm3
0.0025 0.010 0.007
Best Practices Adopted for emission Control and Monitoring
Continuous Emission Monitoring System.Continuous Ambient Air Quality Monitoring System. Dust extraction system (DE) and Dust suppression system (DS) at CHPTurbine is housed in specially designed acoustic insulated enclosures.Green belt development inside the plant.
27
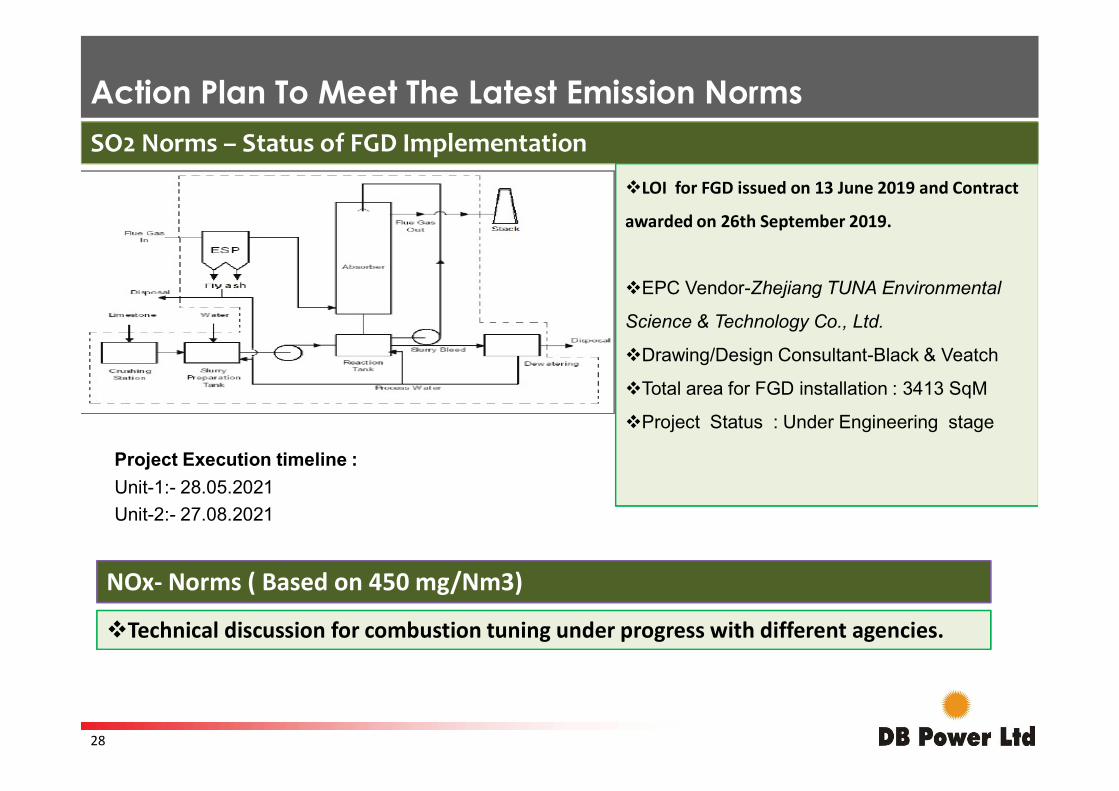
Action Plan To Meet The Latest Emission Norms SO2 Norms – Status of FGD Implementation
LOI for FGD issued on 13 June 2019 and Contract
awarded on 26th September 2019.
EPC Vendor-Zhejiang TUNA Environmental
Science & Technology Co., Ltd.
Drawing/Design Consultant-Black & Veatch
Total area for FGD installation : 3413 SqMTotal area for FGD installation : 3413 SqM
Project Status : Under Engineering stage
NOx- Norms ( Based on 450 mg/Nm3)
Technical discussion for combustion tuning under progress with different agencies.
Project Execution timeline :
Unit-1:- 28.05.2021
Unit-2:- 27.08.2021
28
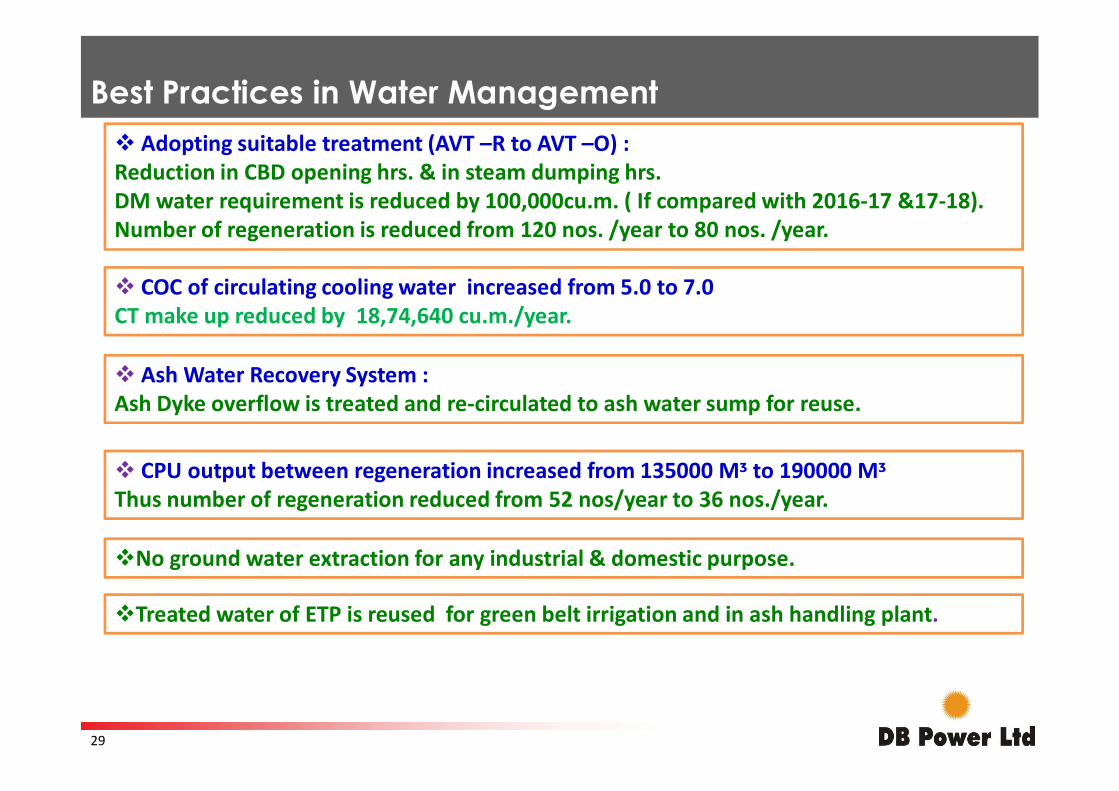
Best Practices in Water Management
COC of circulating cooling water increased from 5.0 to 7.0CT make up reduced by 18,74,640 cu.m./year.
Adopting suitable treatment (AVT –R to AVT –O) : Reduction in CBD opening hrs. & in steam dumping hrs.DM water requirement is reduced by 100,000cu.m. ( If compared with 2016-17 &17-18).Number of regeneration is reduced from 120 nos. /year to 80 nos. /year.
Ash Water Recovery System :Ash Dyke overflow is treated and re-circulated to ash water sump for reuse.
CPU output between regeneration increased from 135000 Mᶾ to 190000 MᶾThus number of regeneration reduced from 52 nos/year to 36 nos./year.
No ground water extraction for any industrial & domestic purpose.
Treated water of ETP is reused for green belt irrigation and in ash handling plant.
Ash Dyke overflow is treated and re-circulated to ash water sump for reuse.
29
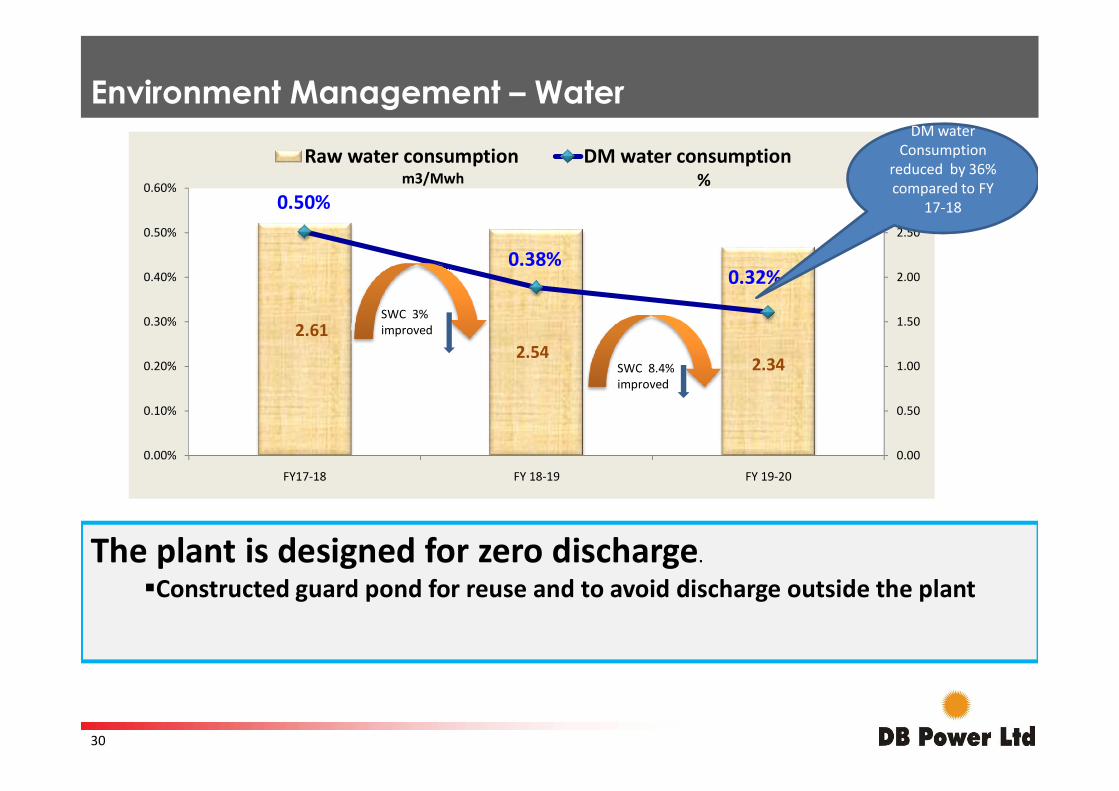
2.612.54
2.34
0.50%
0.38%0.32%
1.00
1.50
2.00
2.50
3.00
0.20%
0.30%
0.40%
0.50%
0.60%
Raw water consumption DM water consumption
SWC 3% improved
SWC 8.4% improved
DM water Consumption
reduced by 36% compared to FY
17-18
Environment Management – Water
%m3/Mwh
0.00
0.50
0.00%
0.10%
FY17-18 FY 18-19 FY 19-20
The plant is designed for zero discharge.
Constructed guard pond for reuse and to avoid discharge outside the plant
30
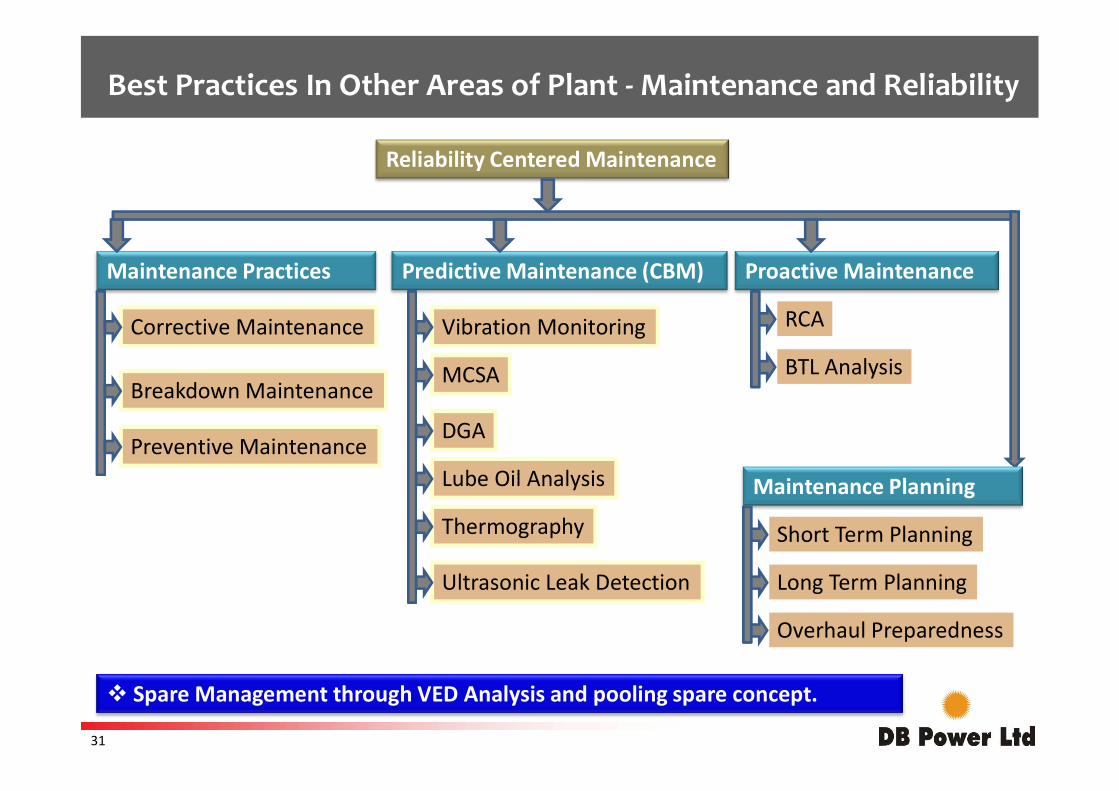
Best Practices In Other Areas of Plant - Maintenance and Reliability
Reliability Centered Maintenance
Maintenance Practices Predictive Maintenance (CBM) Proactive Maintenance
Corrective Maintenance
Breakdown Maintenance
Vibration Monitoring
MCSA
RCA
BTL AnalysisBreakdown Maintenance
DGA
Lube Oil Analysis
Thermography
Ultrasonic Leak Detection
Spare Management through VED Analysis and pooling spare concept.
Preventive Maintenance
Maintenance Planning
Short Term Planning
Long Term Planning
Overhaul Preparedness
31
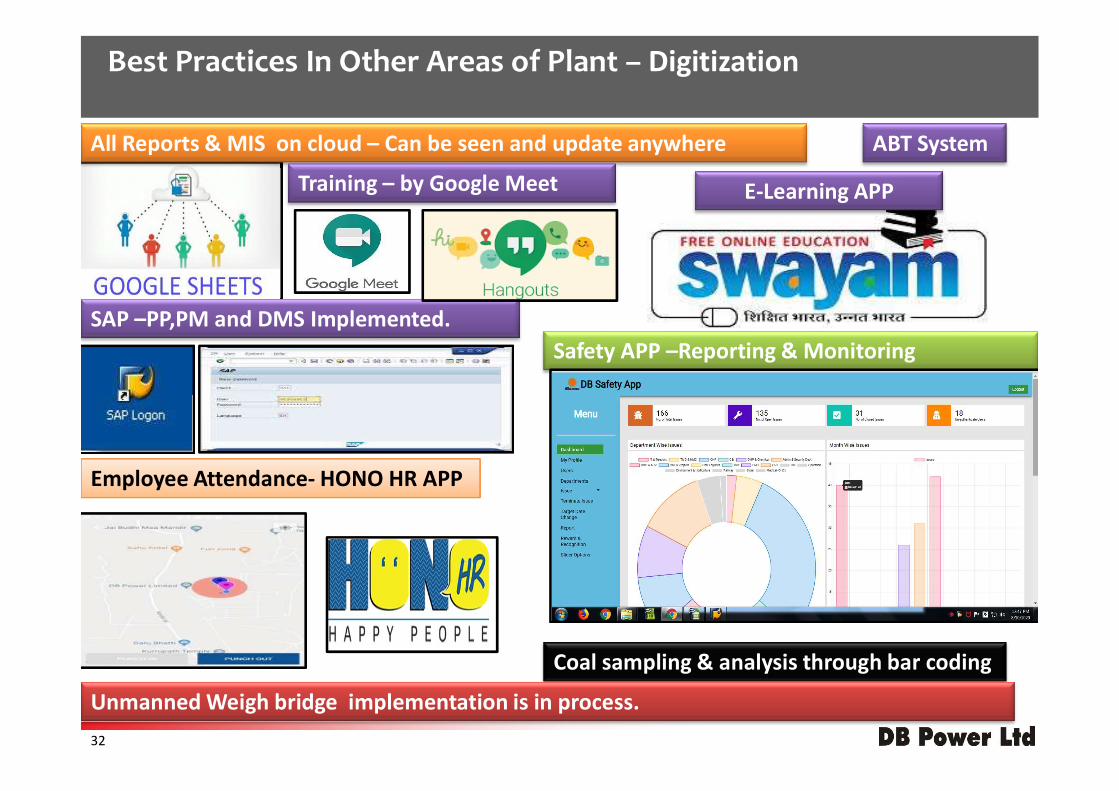
All Reports & MIS on cloud – Can be seen and update anywhere
Safety APP –Reporting & MonitoringSAP –PP,PM and DMS Implemented.
ABT System
Training – by Google Meet
Best Practices In Other Areas of Plant – Digitization
E-Learning APP
Employee Attendance- HONO HR APP
Coal sampling & analysis through bar coding
Unmanned Weigh bridge implementation is in process.32
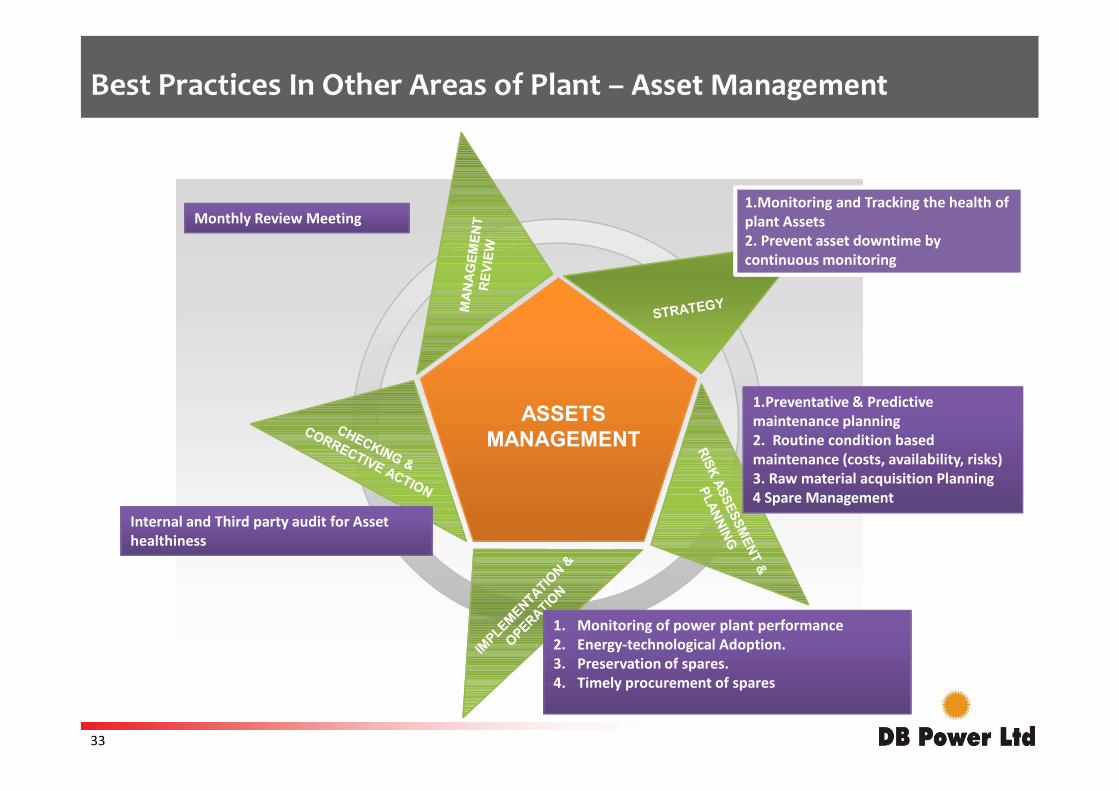
1.Monitoring and Tracking the health of plant Assets2. Prevent asset downtime by continuous monitoring
1.Preventative & Predictive
Monthly Review Meeting
Best Practices In Other Areas of Plant – Asset Management
ASSETSMANAGEMENT
1.Preventative & Predictive maintenance planning2. Routine condition based maintenance (costs, availability, risks) 3. Raw material acquisition Planning4 Spare Management
1. Monitoring of power plant performance2. Energy-technological Adoption.3. Preservation of spares.4. Timely procurement of spares
Internal and Third party audit for Asset healthiness
33
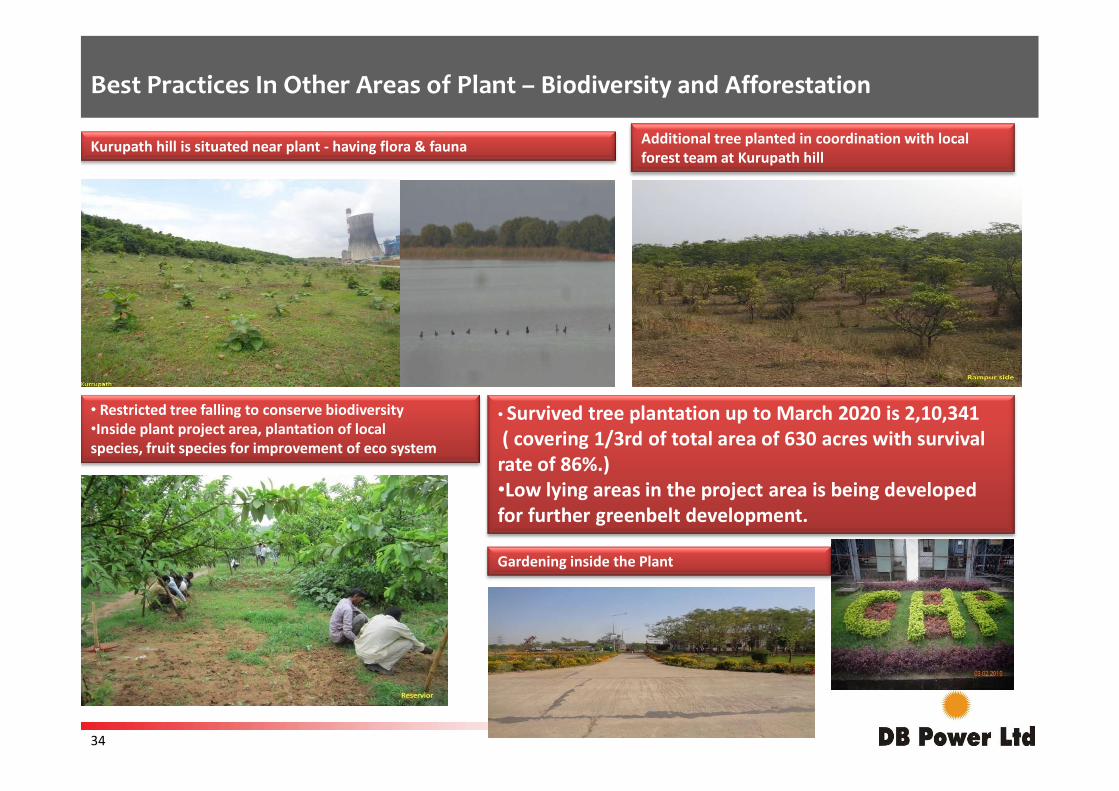
Kurupath hill is situated near plant - having flora & fauna Additional tree planted in coordination with local forest team at Kurupath hill
Best Practices In Other Areas of Plant – Biodiversity and Afforestation
• Restricted tree falling to conserve biodiversity•Inside plant project area, plantation of local species, fruit species for improvement of eco system
• Survived tree plantation up to March 2020 is 2,10,341( covering 1/3rd of total area of 630 acres with survival rate of 86%.)•Low lying areas in the project area is being developed for further greenbelt development.
Gardening inside the Plant
34
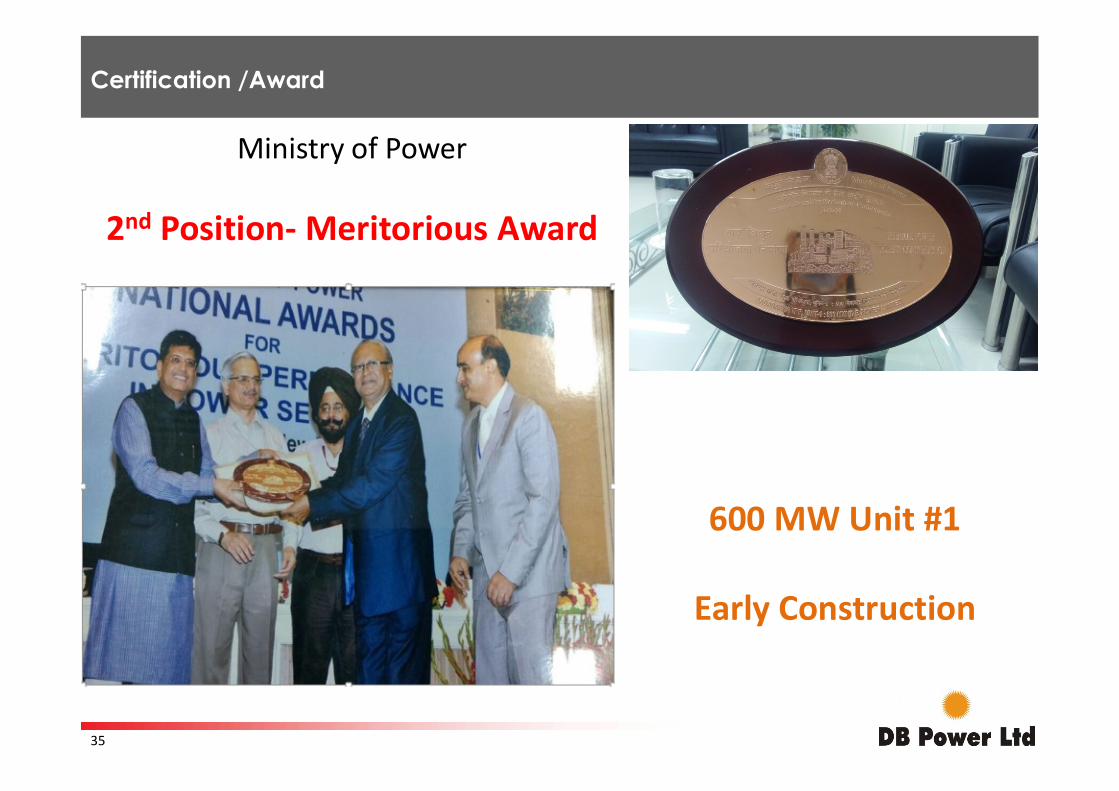
Certification /Award
Ministry of Power
2nd Position- Meritorious Award
600 MW Unit #1
Early Construction
35
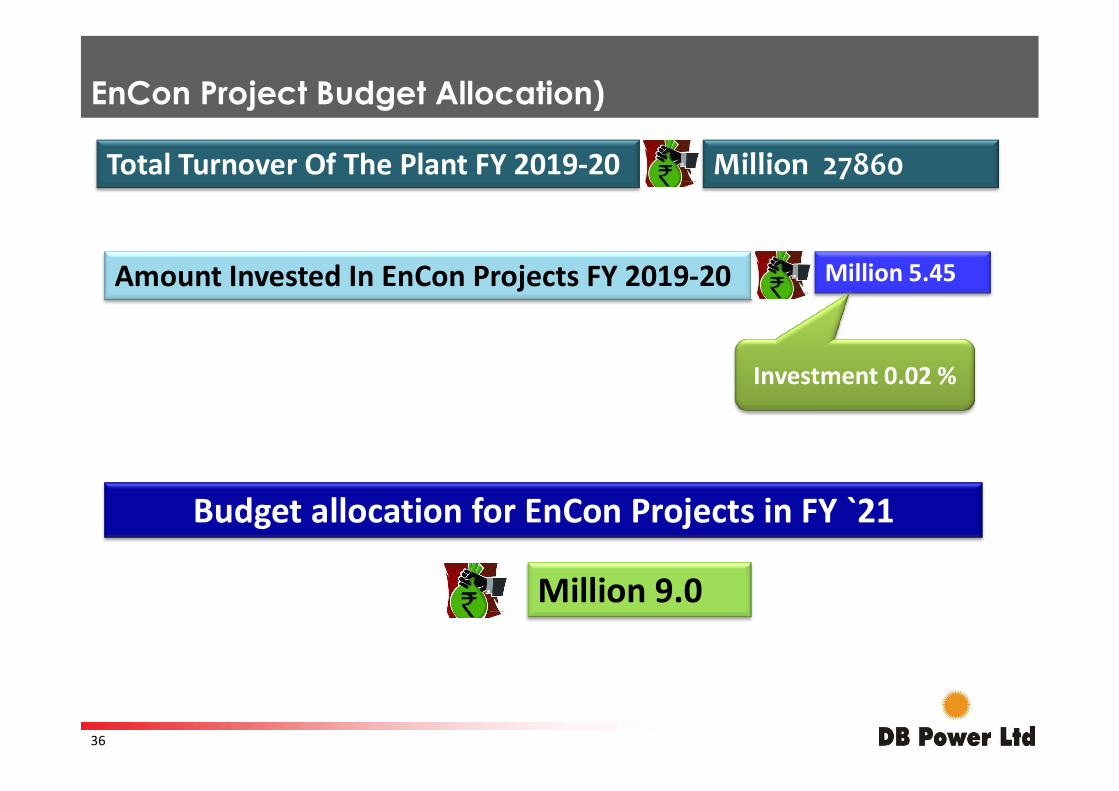
EnCon Project Budget Allocation)
Total Turnover Of The Plant FY 2019-20
Amount Invested In EnCon Projects FY 2019-20
Million 27860
Million 5.45
Investment 0.02 %
Budget allocation for EnCon Projects in FY `21
Million 9.0
36
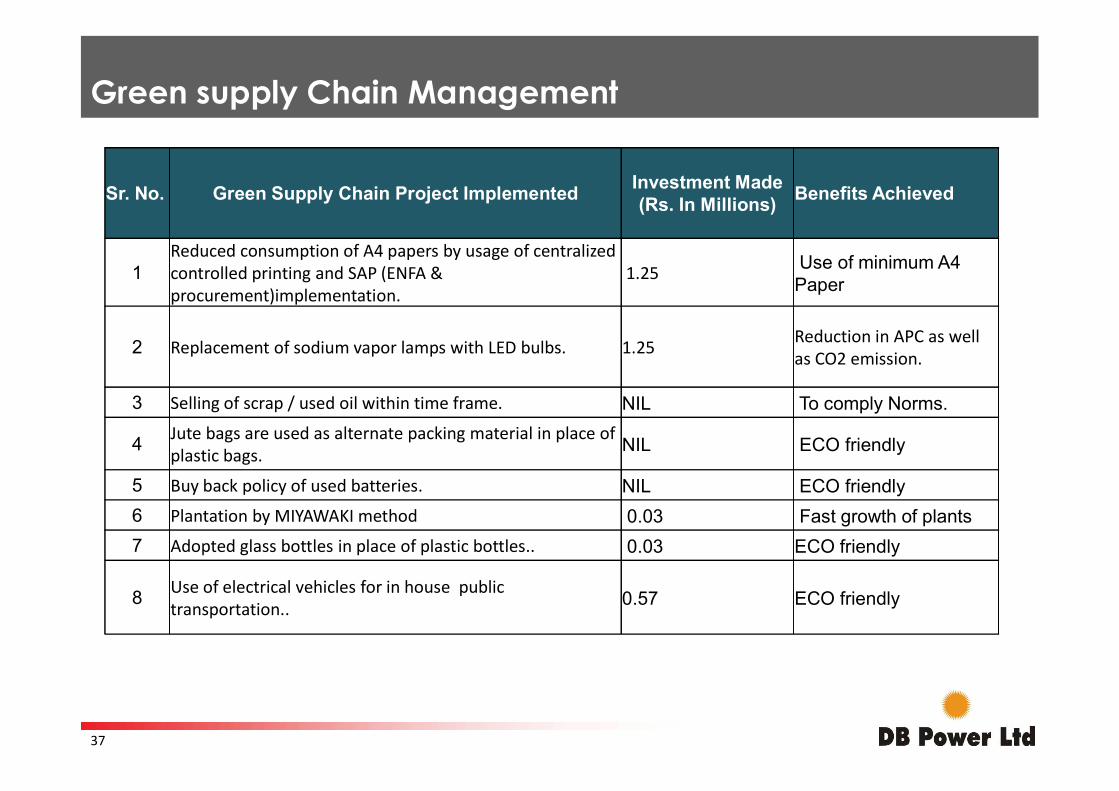
Green supply Chain Management
Sr. No. Green Supply Chain Project ImplementedInvestment Made (Rs. In Millions)
Benefits Achieved
1Reduced consumption of A4 papers by usage of centralized controlled printing and SAP (ENFA & procurement)implementation.
1.25 Use of minimum A4 Paper
2 Replacement of sodium vapor lamps with LED bulbs. 1.25 Reduction in APC as well as CO2 emission.
3 Selling of scrap / used oil within time frame. NIL To comply Norms.3 Selling of scrap / used oil within time frame. NIL To comply Norms.
4Jute bags are used as alternate packing material in place of plastic bags. NIL ECO friendly
5 Buy back policy of used batteries. NIL ECO friendly
6 Plantation by MIYAWAKI method 0.03 Fast growth of plants
7 Adopted glass bottles in place of plastic bottles.. 0.03 ECO friendly
8Use of electrical vehicles for in house public transportation.. 0.57 ECO friendly
37
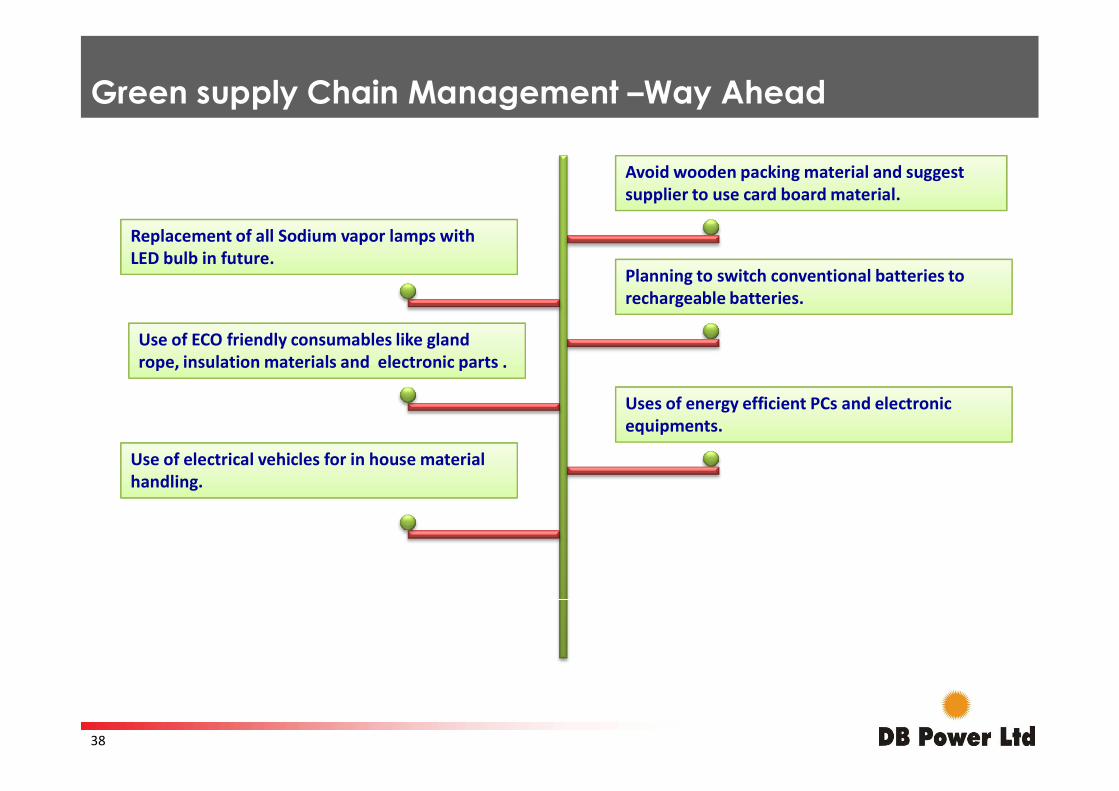
Avoid wooden packing material and suggest supplier to use card board material.
Replacement of all Sodium vapor lamps with LED bulb in future.
Use of ECO friendly consumables like gland rope, insulation materials and electronic parts .
Planning to switch conventional batteries to rechargeable batteries.
Uses of energy efficient PCs and electronic
Green supply Chain Management –Way Ahead
Use of electrical vehicles for in house material handling.
Uses of energy efficient PCs and electronic equipments.
38
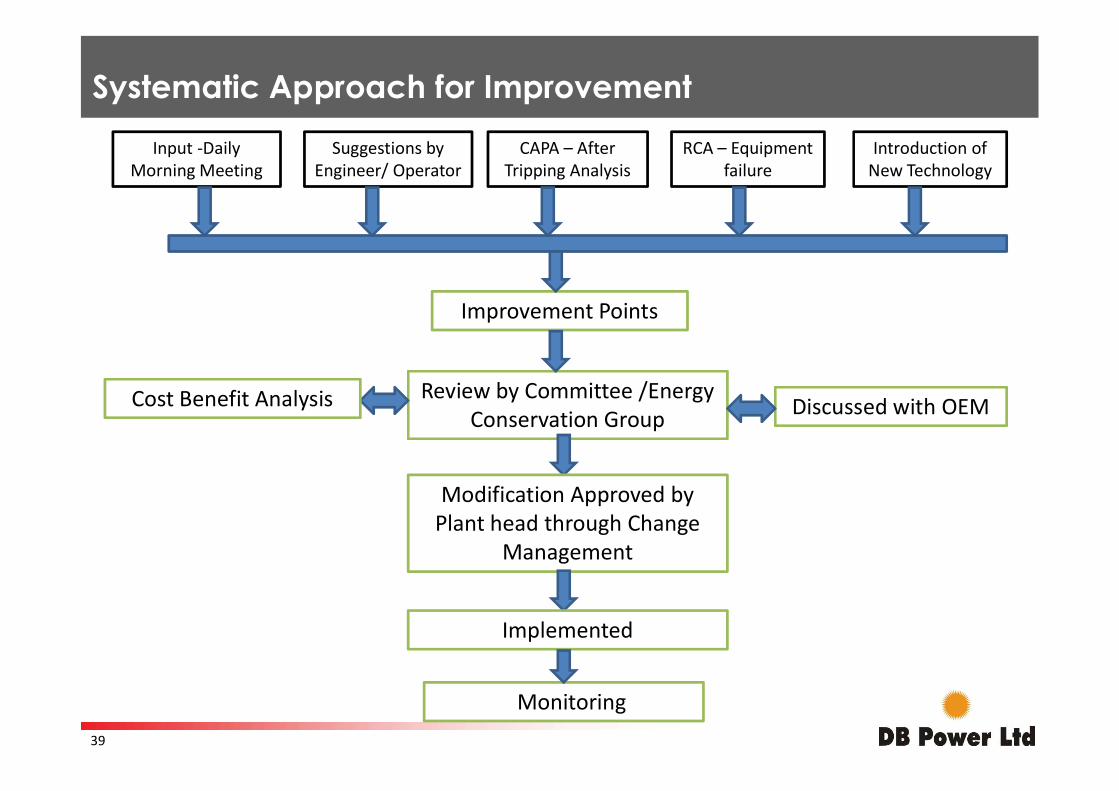
Systematic Approach for Improvement
Improvement Points
Input -Daily Morning Meeting
Suggestions by Engineer/ Operator
CAPA – After Tripping Analysis
RCA – Equipment failure
Review by Committee /Energy Discussed with OEMCost Benefit Analysis
Introduction of New Technology
Review by Committee /Energy Conservation Group
Modification Approved by Plant head through Change
Management
Implemented
Discussed with OEMCost Benefit Analysis
Monitoring39
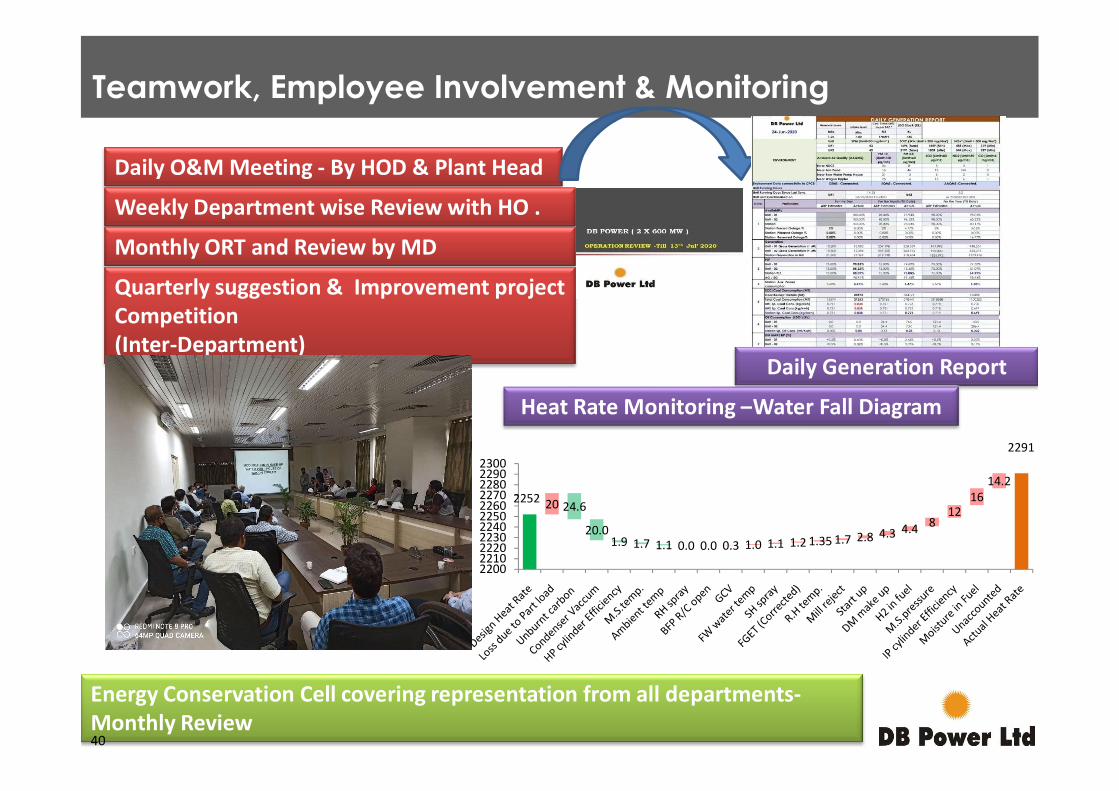
Teamwork, Employee Involvement & Monitoring
Daily O&M Meeting - By HOD & Plant Head
Weekly Department wise Review with HO .
Monthly ORT and Review by MD
Quarterly suggestion & Improvement project Competition (Inter-Department)
Daily Generation Report
Heat Rate Monitoring –Water Fall Diagram
Energy Conservation Cell covering representation from all departments-Monthly Review
2252
2291
24.6
20.01.9 1.7 1.1
20
0.0 0.0 0.3 1.0 1.1 1.2 1.35 1.7 2.8 4.3 4.4 812
1614.2
22002210222022302240225022602270228022902300
Heat Rate Monitoring –Water Fall Diagram
40
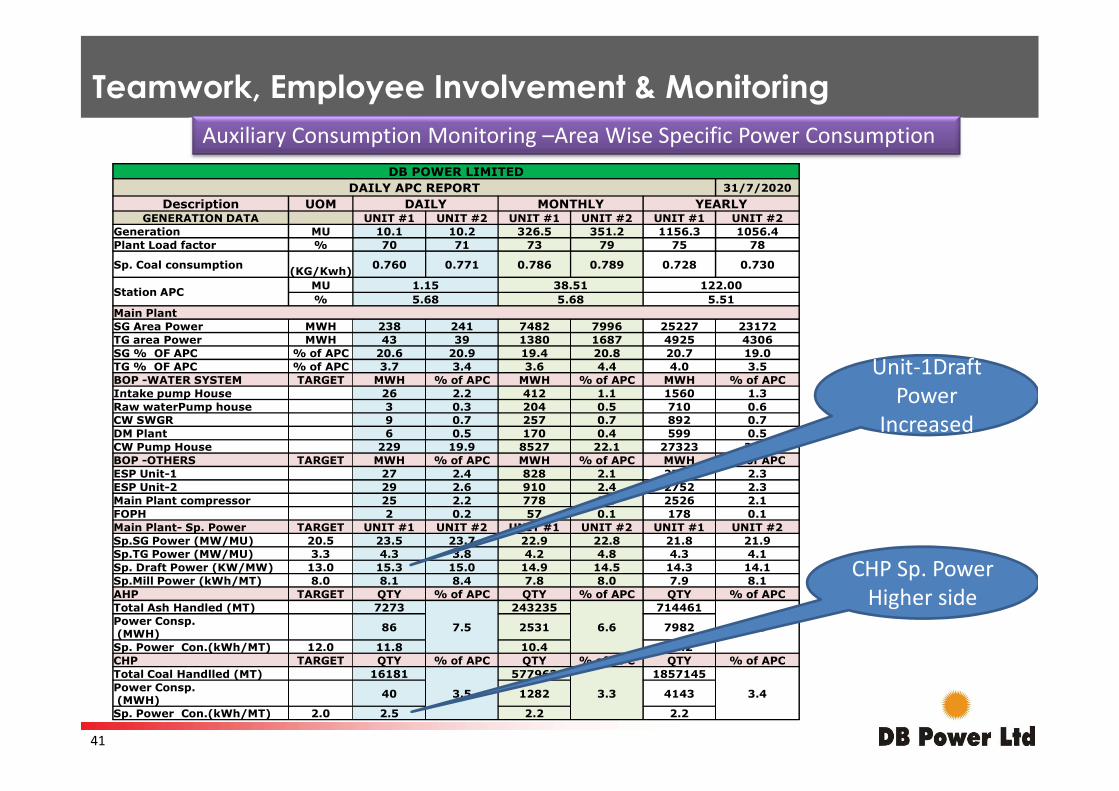
Teamwork, Employee Involvement & MonitoringAuxiliary Consumption Monitoring –Area Wise Specific Power Consumption
DB POWER LIMITEDDAILY APC REPORT 31/7/2020
Description UOM DAILY MONTHLY YEARLYGENERATION DATA UNIT #1 UNIT #2 UNIT #1 UNIT #2 UNIT #1 UNIT #2
Generation MU 10.1 10.2 326.5 351.2 1156.3 1056.4Plant Load factor % 70 71 73 79 75 78
Sp. Coal consumption (KG/Kwh) 0.760 0.771 0.786 0.789 0.728 0.730
Station APCMU 1.15 38.51 122.00% 5.68 5.68 5.51
Main PlantSG Area Power MWH 238 241 7482 7996 25227 23172TG area Power MWH 43 39 1380 1687 4925 4306SG % OF APC % of APC 20.6 20.9 19.4 20.8 20.7 19.0TG % OF APC % of APC 3.7 3.4 3.6 4.4 4.0 3.5BOP -WATER SYSTEM TARGET MWH % of APC MWH % of APC MWH % of APCIntake pump House 26 2.2 412 1.1 1560 1.3
Unit-1Draft Power Intake pump House 26 2.2 412 1.1 1560 1.3
Raw waterPump house 3 0.3 204 0.5 710 0.6CW SWGR 9 0.7 257 0.7 892 0.7DM Plant 6 0.5 170 0.4 599 0.5CW Pump House 229 19.9 8527 22.1 27323 22.4BOP -OTHERS TARGET MWH % of APC MWH % of APC MWH % of APCESP Unit-1 27 2.4 828 2.1 2797 2.3ESP Unit-2 29 2.6 910 2.4 2752 2.3Main Plant compressor 25 2.2 778 2.0 2526 2.1FOPH 2 0.2 57 0.1 178 0.1Main Plant- Sp. Power TARGET UNIT #1 UNIT #2 UNIT #1 UNIT #2 UNIT #1 UNIT #2Sp.SG Power (MW/MU) 20.5 23.5 23.7 22.9 22.8 21.8 21.9Sp.TG Power (MW/MU) 3.3 4.3 3.8 4.2 4.8 4.3 4.1Sp. Draft Power (KW/MW) 13.0 15.3 15.0 14.9 14.5 14.3 14.1Sp.Mill Power (kWh/MT) 8.0 8.1 8.4 7.8 8.0 7.9 8.1AHP TARGET QTY % of APC QTY % of APC QTY % of APCTotal Ash Handled (MT) 7273
7.5
243235
6.6
714461
6.5Power Consp.(MWH) 86 2531 7982
Sp. Power Con.(kWh/MT) 12.0 11.8 10.4 11.2CHP TARGET QTY % of APC QTY % of APC QTY % of APCTotal Coal Handlled (MT) 16181
3.5
577963
3.3
1857145
3.4Power Consp.(MWH) 40 1282 4143
Sp. Power Con.(kWh/MT) 2.0 2.5 2.2 2.2
CHP Sp. Power Higher side
Power Increased
41
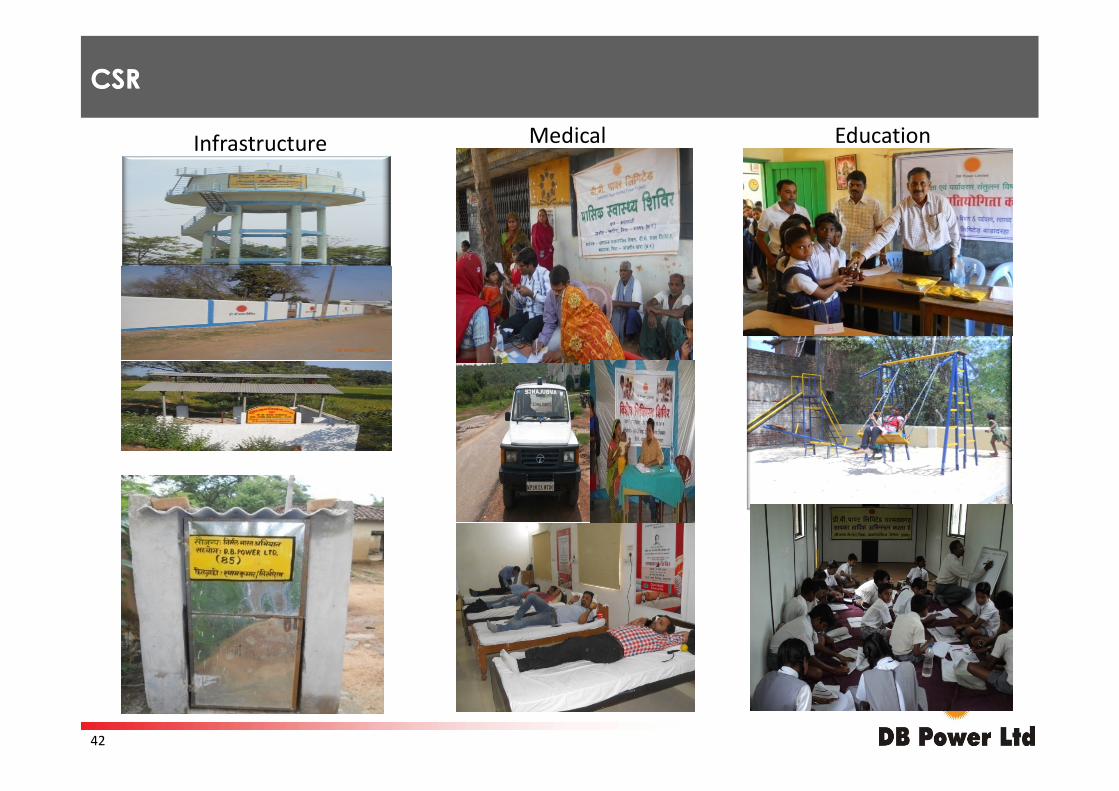
CSRCSR
Infrastructure Medical Education
42
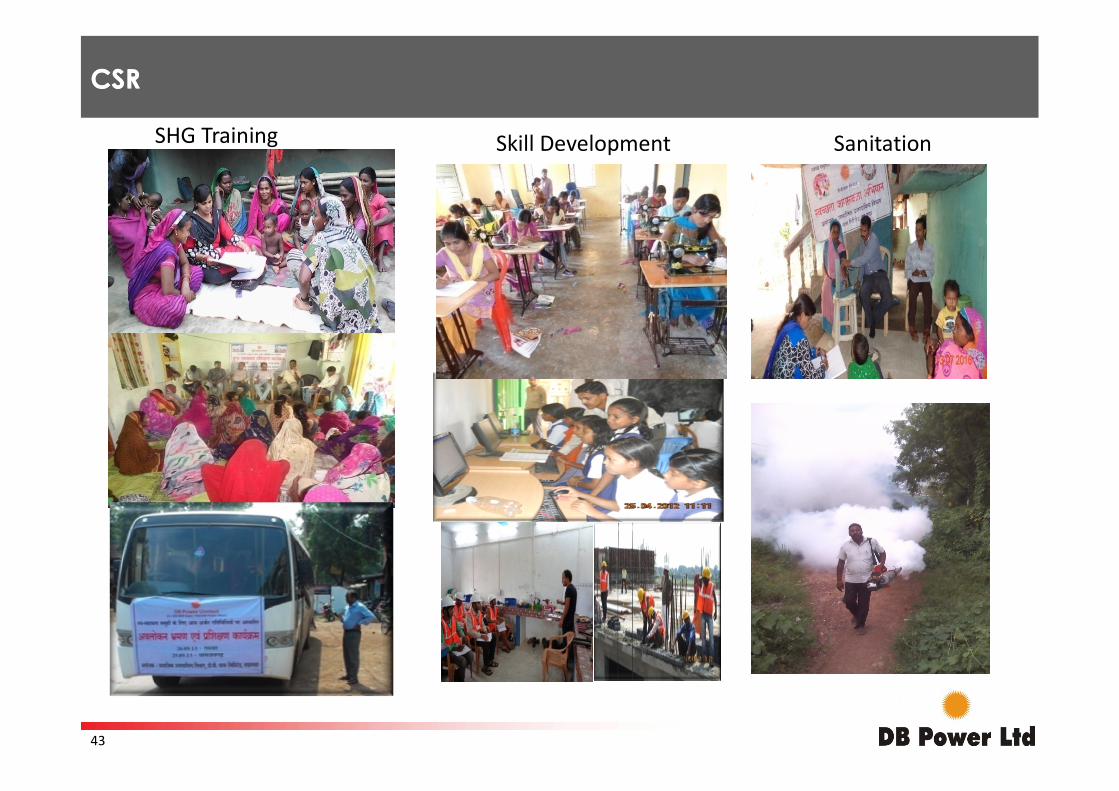
CSRCSR
SHG Training SanitationSkill Development
43
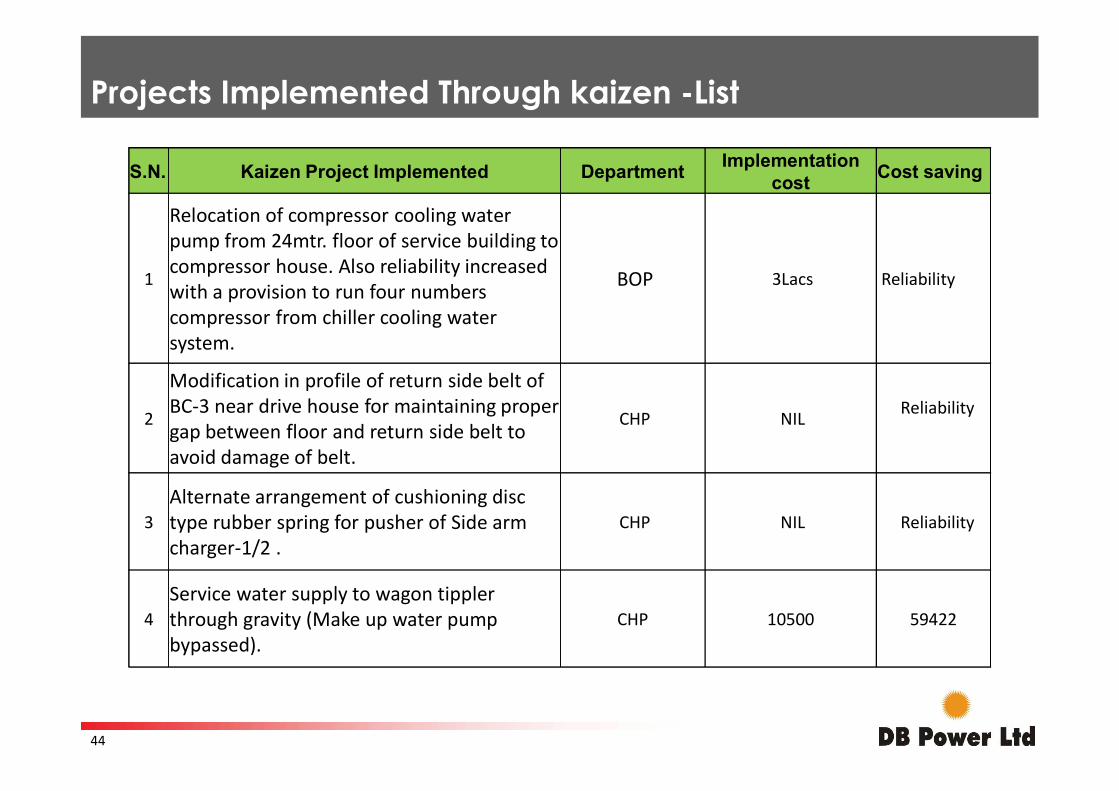
Projects Implemented Through kaizen -List
S.N. Kaizen Project Implemented DepartmentImplementation
costCost saving
1
Relocation of compressor cooling water pump from 24mtr. floor of service building to compressor house. Also reliability increased with a provision to run four numbers compressor from chiller cooling water system.
BOP 3Lacs Reliability
Modification in profile of return side belt of BC-3 near drive house for maintaining proper
2BC-3 near drive house for maintaining proper gap between floor and return side belt to avoid damage of belt.
CHP NIL Reliability
3Alternate arrangement of cushioning disc type rubber spring for pusher of Side arm charger-1/2 .
CHP NIL Reliability
4Service water supply to wagon tippler through gravity (Make up water pump bypassed).
CHP 10500 59422
44
SWT at TGBuilding
EL 32 Meter
MakeupWater Tank
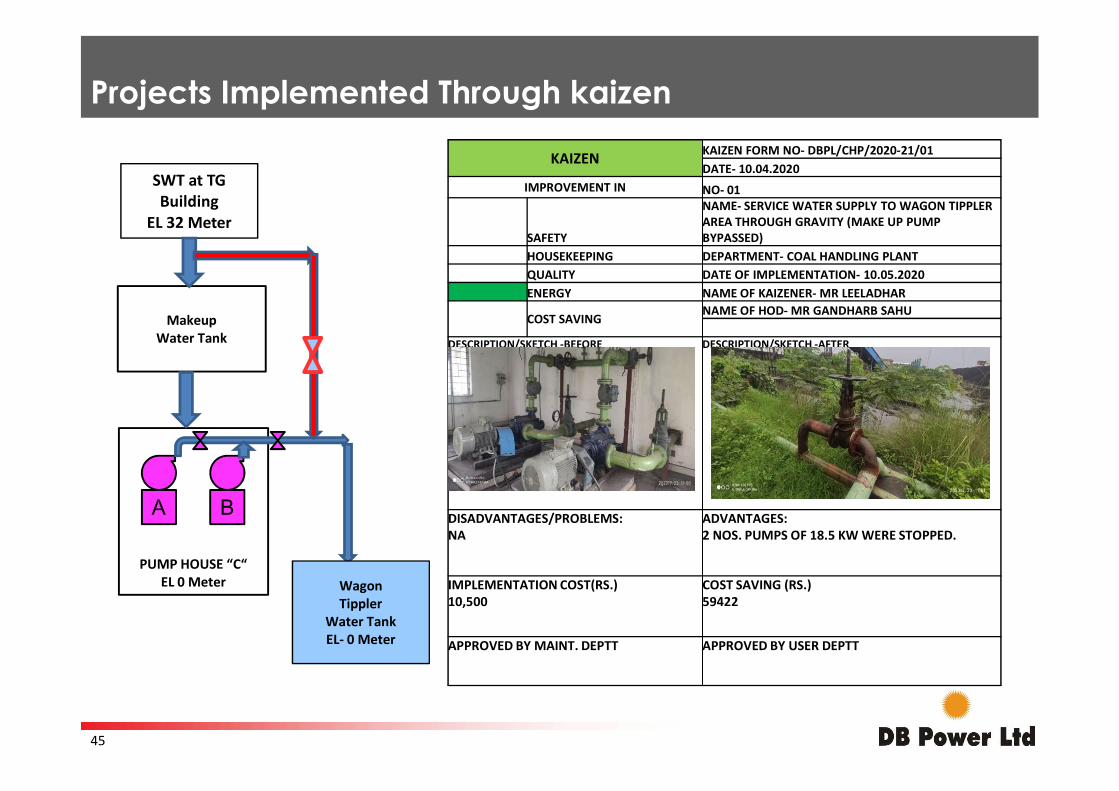
Projects Implemented Through kaizen
KAIZEN KAIZEN FORM NO- DBPL/CHP/2020-21/01DATE- 10.04.2020
IMPROVEMENT IN NO- 01
SAFETY
NAME- SERVICE WATER SUPPLY TO WAGON TIPPLER AREA THROUGH GRAVITY (MAKE UP PUMP BYPASSED)
HOUSEKEEPING DEPARTMENT- COAL HANDLING PLANTQUALITY DATE OF IMPLEMENTATION- 10.05.2020ENERGY NAME OF KAIZENER- MR LEELADHAR
COST SAVINGNAME OF HOD- MR GANDHARB SAHU
DESCRIPTION/SKETCH -BEFORE DESCRIPTION/SKETCH -AFTER
PUMP HOUSE “C“EL 0 Meter
A B
WagonTippler
Water TankEL- 0 Meter
DISADVANTAGES/PROBLEMS:NA
ADVANTAGES:2 NOS. PUMPS OF 18.5 KW WERE STOPPED.
IMPLEMENTATION COST(RS.)10,500
COST SAVING (RS.)59422
APPROVED BY MAINT. DEPTT APPROVED BY USER DEPTT
45
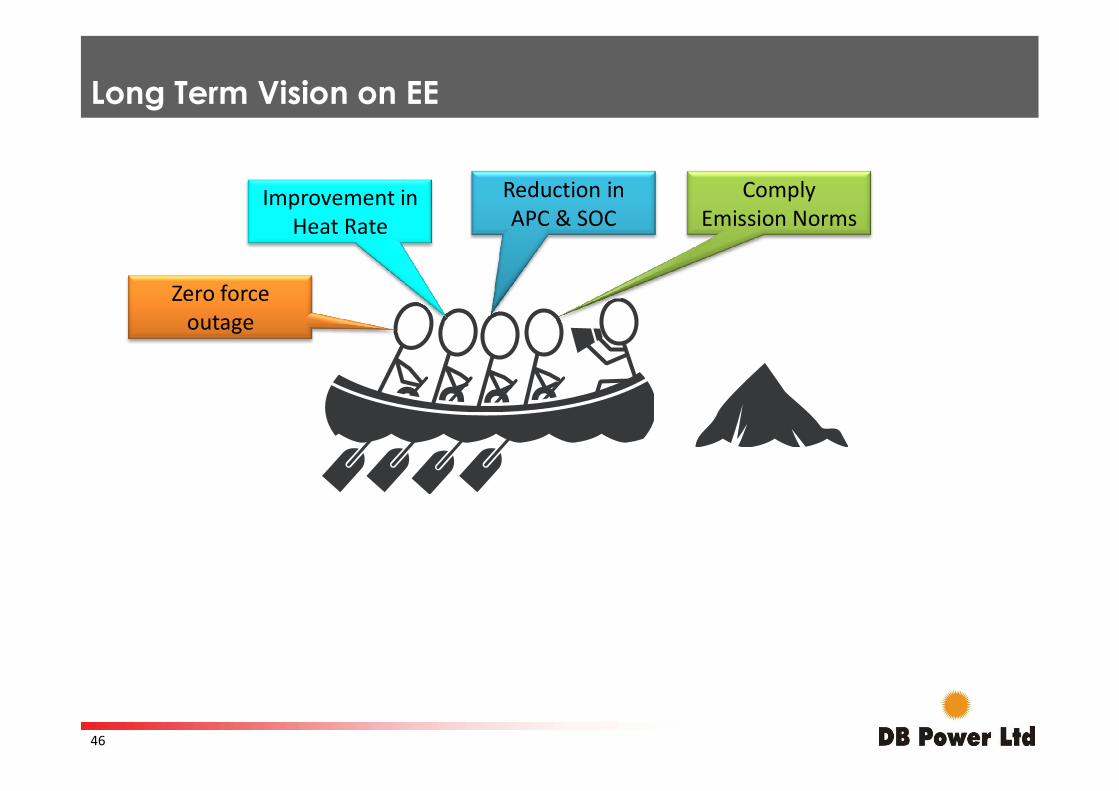
Long Term Vision on EE
Zero force outage
Improvement in Heat Rate
Reduction in APC & SOC
Comply Emission Norms
46
47
Related Documents