2080 -0.5°C 0.0°C 2.0°C 1.5°C 1.0°C 0.5°C 3.0°C 2.5°C 2040 2000 1960 1920 1880 1840 1800 Observational Record IPCC* Prediction Little Ice Age -0.5°C 0.0°C 0.5°C ___________________________ *Inter-Governmental Panel on Climate Change by Poorna Pal, MS MBA PhD Professor: Geology/Oceanography, International Business Glendale Community College

Welcome message from author
This document is posted to help you gain knowledge. Please leave a comment to let me know what you think about it! Share it to your friends and learn new things together.
Transcript

2080
-0.5°C
0.0°C
2.0°C
1.5°C
1.0°C
0.5°C
3.0°C
2.5°C
2040200019601920188018401800
Observational Record
IPCC*Prediction
Little Ice Age
-0.5°C
0.0°C
0.5°C
___________________________*Inter-Governmental Panel on Climate Change
by
Poorna Pal, MS MBA PhD
Professor: Geology/Oceanography, International BusinessGlendale Community College

What probabilities, in time and space, can be assigned to any catastrophes that result and how economically feasible and practicable are various mitigating measures?
What is climate change and why does it matter?
What are the forcing mechanisms for this climate change, what are their possible consequences, and how exhaustive and robust are the supporting evidences?
2080
-0.5°C
0.0°C
2.0°C
1.5°C
1.0°C
0.5°C
3.0°C
2.5°C
2040200019601920188018401800
Observational Record
IPCC*Prediction
Little Ice Age
-0.5°C
0.0°C
0.5°C
___________________________*Inter-Governmental Panel on Climate Change
natural factors, such as changes in the sun's intensity or slow changes in the Earth's orbit around the sun;
natural processes within the climate system (e.g. changes in ocean circulation);
human activities that change the atmosphere's composition (e.g. through burning fossil fuels) and the land surface (e.g. deforestation, reforestation, urbanization, desertification, etc.)
Climate change refers to any significant change in measures of climate (such as temperature, precipitation, or wind) lasting for an extended period (decades or longer).
http://www.epa.gov/climatechange/basicinfo.html
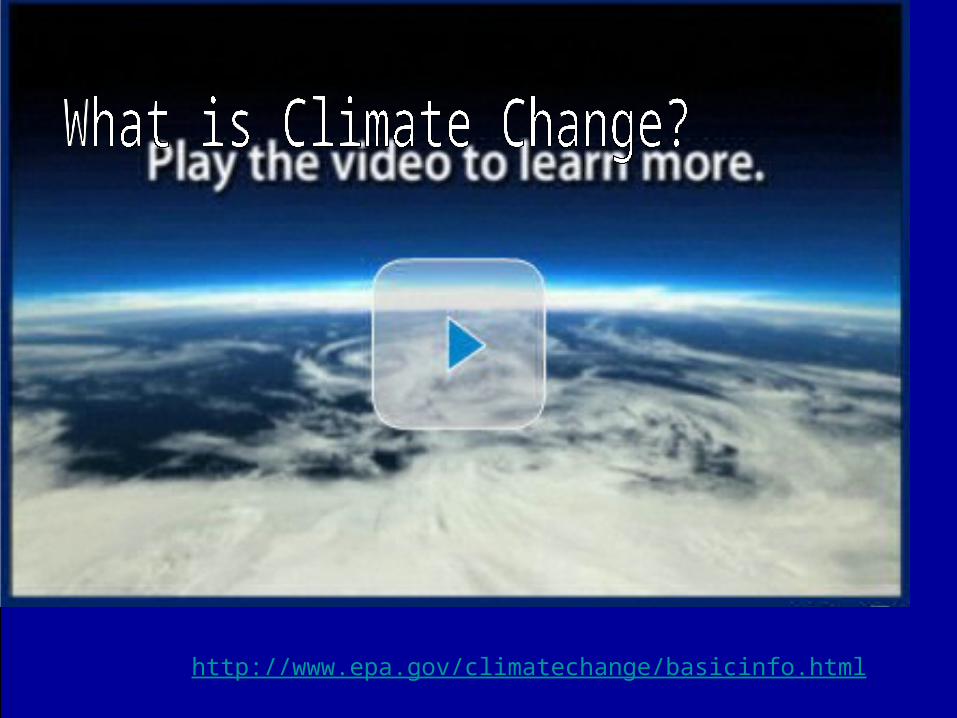
Thermosphere
MesosphereStratosphereTroposphere
300 km
50 km
40 km10 km
400 km altitude
Exosphere
is the Earth’s 110 km thick gaseous envelope, andevolved in three stages:
4-4.5 Ga agodominantly H, He (much like Jupiter, Saturn and Sun)
3.5 Ga ago changed to mostly C, N and O when the first oceans appeared
1.25 Ga agobecame mostly N and O, as at the present time, because of loss of C. Where did this atmospheric
CO2 go? It ended up in the oceans. How? Because of
photosynthesis.

Troposphere
extends to 16-18 km above the tropics but <10 km above the poles;
contains ~80% of atmosphere’s mass; and
runs the hydrological cycle because tropo-spheric temperatures decrease with height.
Stra
tosp
he
reS
trato
sph
ere
StratopauseStratopause
Me
so
sph
ere
Me
so
sph
ere
MesopauseMesopause
Th
ermo
-T
herm
o-
sp
he
res
ph
ere
TropopauseTropopause
TroposphereTroposphere
Average temperature, °C
Hei
gh
t, a
bo
ve m
ean
sea
lev
el (
km)
Average atmospheric temperature
What if the tropo-spheric temperature
gradient changes?
Why is ozone good overAntarctica but bad over Southern California?
There is a hole in the Ozone layer right above Antarctica

Differential heating:Tropics receive most solar heat.Differential gravity:Gravitational acceleration is most at the poles, least at the equator. Differential rotation:Equatorial surface wind blows to the west, against the direction of Earth’s spin.
A general model of tropospheric circulation3 forces govern this circulation:
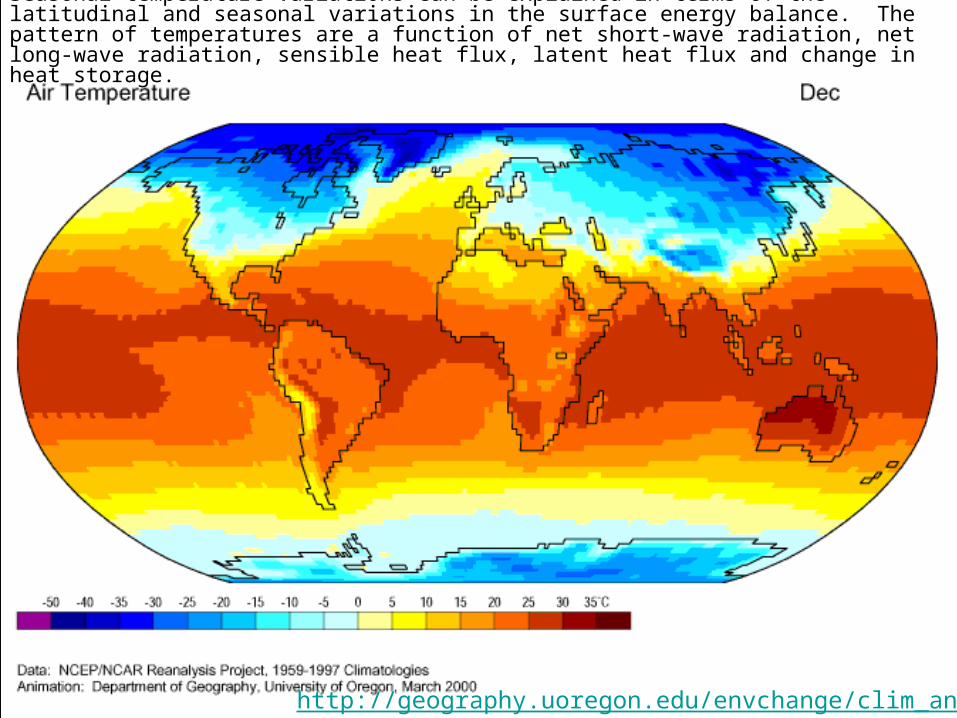
Seasonal temperature variations can be explained in terms of the latitudinal and seasonal variations in the surface energy balance. The pattern of temperatures are a function of net short-wave radiation, net long-wave radiation, sensible heat flux, latent heat flux and change in heat storage.
http://geography.uoregon.edu/envchange/clim_animations/

http://ingrid.ldgo.columbia.edu/maproom/.Global/.Climatologies/Precip_Loop.html
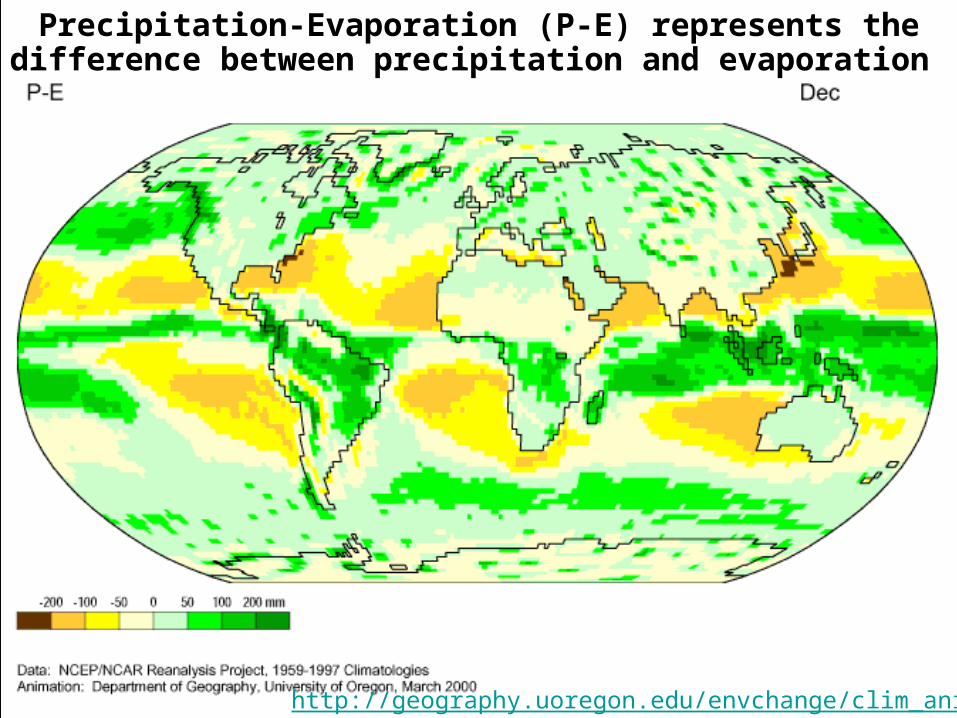
Precipitation-Evaporation (P-E) represents the difference between precipitation and evaporation
http://geography.uoregon.edu/envchange/clim_animations/

Some implicationsAt 30°N/S latitudes, sea surface salinity tends to be high and deserts tend to cluster on land.When equatorial surface wind blows to the west, it also stacks the warm surface waters to the west, so producing the E—W temperature differential that produces the hurricanes and cyclones that strike eastern margins of tropical/semitropical land.
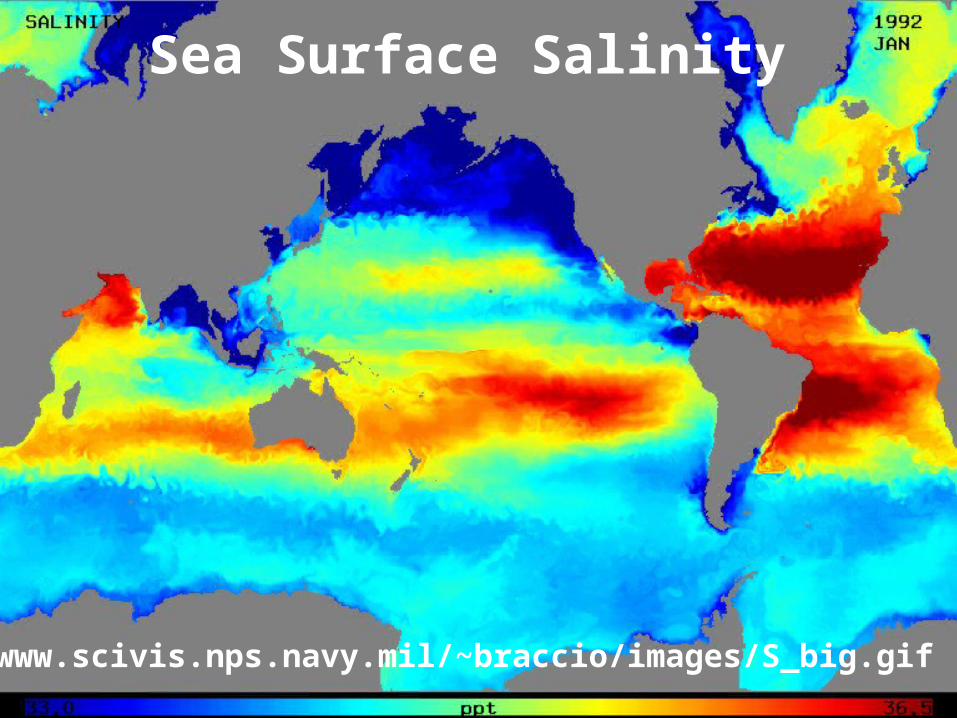
http://www.scivis.nps.navy.mil/~braccio/images/S_big.gif
Sea Surface Salinity
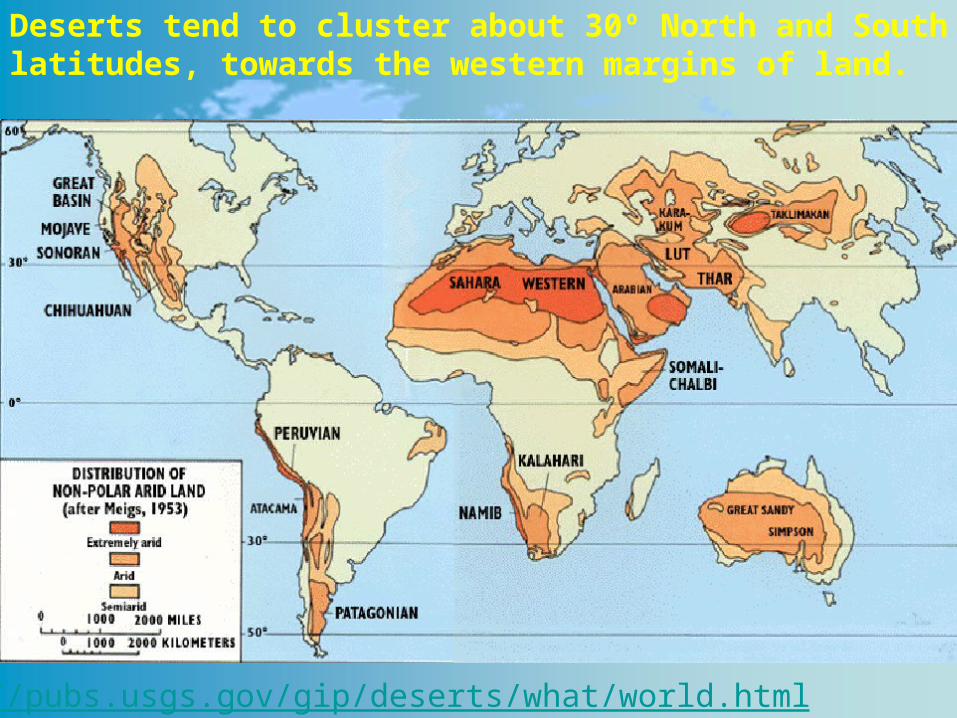
http://pubs.usgs.gov/gip/deserts/what/world.html
Deserts tend to cluster about 30º North and South latitudes, towards the western margins of land.

Tropical cyclones develop in the hot, humid air over a sea surface exceeding 26°C in temperature.

Hurricanes typically occur on our Atlantic coast and originate
farther to the east, as can be seen in this animation of
Hurricane Katrina.

Global Surface TemperatureGlobal Surface Temperature
This graph illustrates the change in global surface temperature relative to 1951-1980 average temperatures. Global surface temperatures in 2010 tied 2005 as the warmest on record. (Source: NASA/GISS) The gray error bars represent the uncertainty on measurements. This research is broadly consistent with similar constructions prepared by the Climatic Research Unit and the National Atmos-pheric and Oceanic Administration.
http://climate.nasa.gov/keyIndicators/
http://www.cartoonistgroup.com/store/add.php?iid=16537

Grow apples in AlaskaDan Elliott harvests apples from his orchard on Thursday, October 9, 2008. Elliott grows over 100 varieties at his home off Fairview Loop.
Dan Elliott heads into his orchard to harvest apples on Thursday, October 9, 2008. Elliott grows over 100 varieties at his home off Fairview Loop.
Read more here: http://community.adn.com/node/133499#storylink=cpy

Grow bananas in Kansas!!!Those there are dwarf musa cavendish, and red tiger sikki. in the back which we can't see are red murelli ensete. Well if you ever come this way,let me know your still welcome to a banana, I give several away every fall, when I dig them up for winter.
Posted by dbrya1 Z6KS ([email protected]) on Sun, Sep 2, 07 at 0:31http://forums.gardenweb.com/forums/load/banana/msg0821134611632.html?11

http://www.geology.um.maine.edu/ges121/lectures/11-little-ice-age/little-ice-age.html
1100 1900170015001300
warm
cold
Little Ice Age

Ghorama is an island located in West Bengal, India, that is eroding into the ocean due to a dramatic increase in the sea level. The photographer posed locals on disappearing segments of the island. According to the artist, locals who still live on the larger segment of the island expect to be relocated within the next 25 years. (Photo: Daesung Lee/Sipa Press)
http://news.yahoo.com/photos/snapshots-1320966603-slideshow/snapshots111312-photo-1326482674.html

http://climate.nasa.gov/SeaLevelViewer/seaLevelViewer.cfm

http://climate.nasa.gov/keyIndicators/
Carbon dioxide (CO2) is an important heat-trapping (greenhouse) gas, which is released through human activities such as deforestation and burning fossil fuels, as well as natural processes such as respiration and volcanic eruptions. The chart on the left shows the CO2 levels in the Earth's atmosphere during the last three glacial cycles, as reconstructed from ice cores. The chart on the right shows CO2 levels in recent years, corrected for average seasonal cycles.

http://www.latimes.com/news/opinion/commentary/la-oe-holguin-veras-tsunami-20120311,0,1967271.story

http://climate.nasa.gov/keyIndicators/
The time series at right shows global distribution and variation of the concentration of mid-tropospheric carbon dioxide in parts per million (ppmv) at an altitude range of 3-13 kilometers (1.9 to 8 miles).
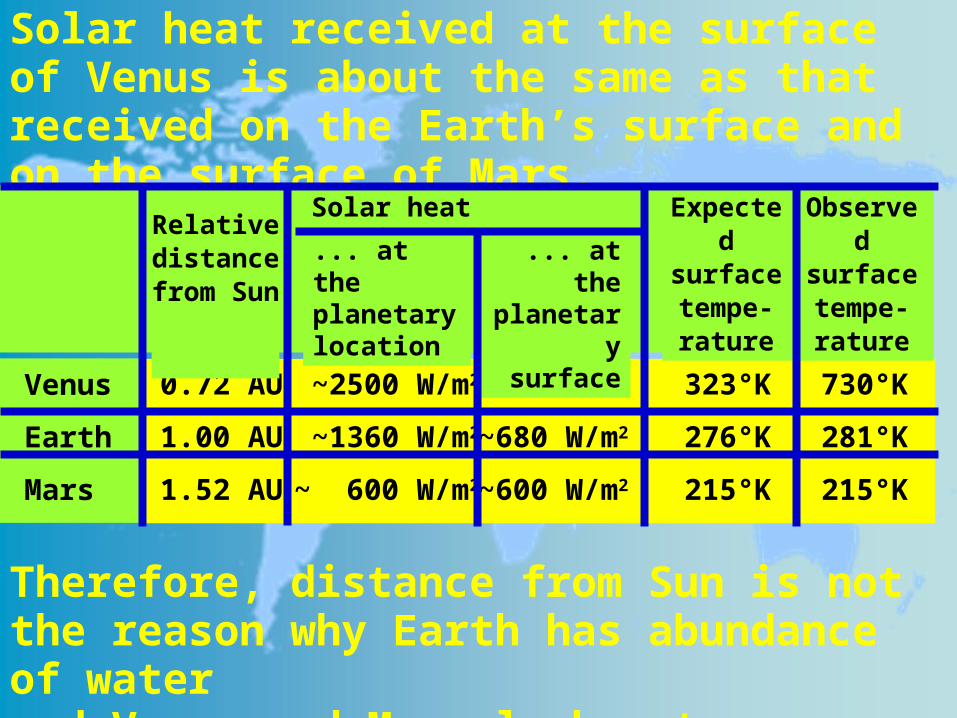
Therefore, distance from Sun is not the reason why Earth has abundance of water and Venus and Mars lack water.
Solar heat received at the surface of Venus is about the same as that received on the Earth’s surface and on the surface of Mars.
Venus
Earth
Mars
0.72 AU
1.00 AU
1.52 AU
~2500 W/m2
~1360 W/m2
~ 600 W/m2
~650 W/m2
~680 W/m2
~600 W/m2
323°K
276°K
215°K
730°K
281°K
215°K
Solar heat received...
... at the planetary location
... at the planetary
surface
Expected surface tempe-rature
Observed surface tempe-rature
Relative distance from Sun

The 20th century data reflect this, with correlated rises, since
1900, of 0.6ºC in mean global temperatures and ~10 cm in the mean sea level worldwide; and
increased precipitation at higher latitudes, in the Northern hemisphere, and relative aridity at the lower latitudes, compared to
greater precipitation throughout the Southern hemisphere, but for ~20ºS.
0
8
-8
Mean
Se
a level relative
to 1
951-70 (cm)M
ean
glo
bal
te
mp
erat
ure
s re
lati
ve
to 1
951-
80 (
ºC)
Sources: (a) For temperature data: http://www.giss.nasa.gov/data/update/gistemp/graphs
(b) For sea level data: T.P. Barnett, in CLIMATE CHANGE (IPCC Working Group Report: Cambridge University Press, 1990)
Land as the % of Earth’s surface area per 1º
latitude band
40oS
0o
40oN
0
- 10% 10%0%
Precipitation Change (1900-94)
10.5
Recomputed from the data in Thomas Karl, Neville Nicholls & Jonathan Gregory: The Coming Climate, Scientific American, May 1997
Oceans modulate the climate, irrespective of whether global warming is anthopogenic or not.

A recent analysis of Earth’s heat balance* goes a step further, by quantitatively demonstrating that, during the latter half of the 20th century, changes in the ocean heat content have dominated the changes in Earth’s heatbalance.
Much of this heat appears tohave gone particularly into thewarming of Atlantic waters.
* S. Levitus, J.I. Antonov, J. Wang, T.L. Delworth, K.W. Dixon & A.J. Broccoli: Anthropogenic warming of Earth’s climatic system. Science, 292: 267-270 (2001).
0
50
100
150
200
Hea
t C
on
ten
t In
crea
se
(in
102
1 Jo
ule
s)
World Ocean (1.82x10²³ J)
Glo
bal
Atm
osp
her
e (6
.6x1
021
J)
Sea
-Ice
Mel
t (3
.2x1
021
J)
Gla
cial
Mel
t (9
.2x1
021 J)
Surface
3 Km depth
http://www.nodc.noaa.gov/OC5/WOA98F/woaf_cd/search.html
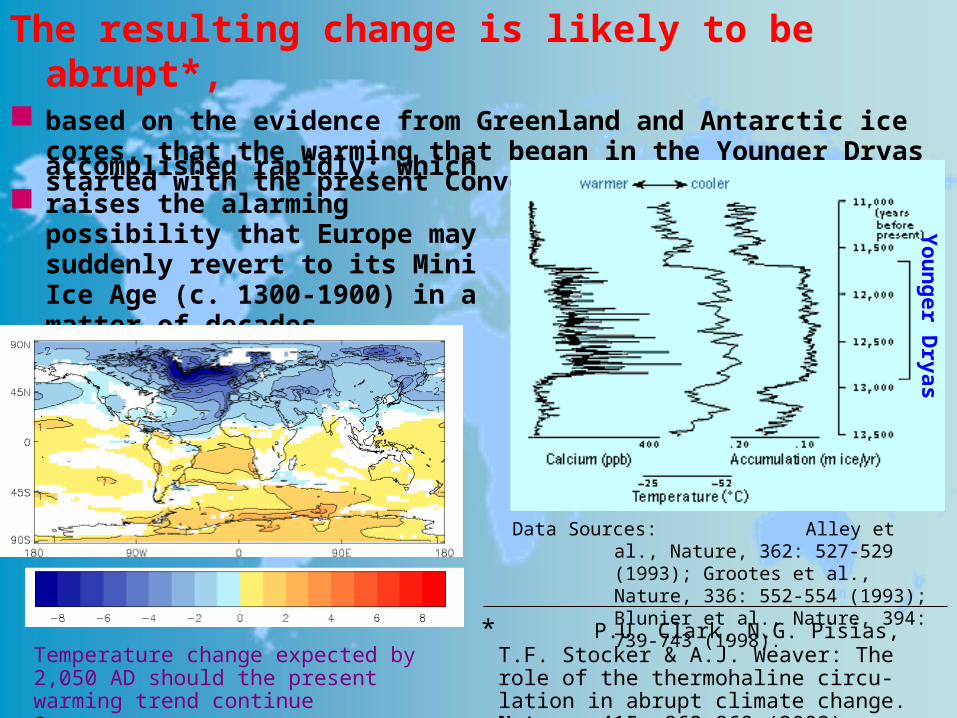
The resulting change is likely to be abrupt*, based on the evidence from Greenland and Antarctic ice
cores, that the warming that began in the Younger Dryas started with the present Conveyor Belt and was aaccomplished rapidly; which
raises the alarming possibility that Europe may suddenly revert to its Mini Ice Age (c. 1300-1900) in a matter of decades.
Data Sources: Alley et al., Nature, 362: 527-529 (1993); Grootes et al., Nature, 336: 552-554 (1993); Blunier et al., Nature, 394: 739-743 (1998).
Yo
un
ger D
ryas
* P.U. Clark, N.G. Pisias, T.F. Stocker & A.J. Weaver: The role of the thermohaline circu-lation in abrupt climate change. Nature, 415: 863-869 (2002).
Temperature change expected by 2,050 AD should the present warming trend continueSource: http://www.giss.nasa.gov/data/update/gistemp
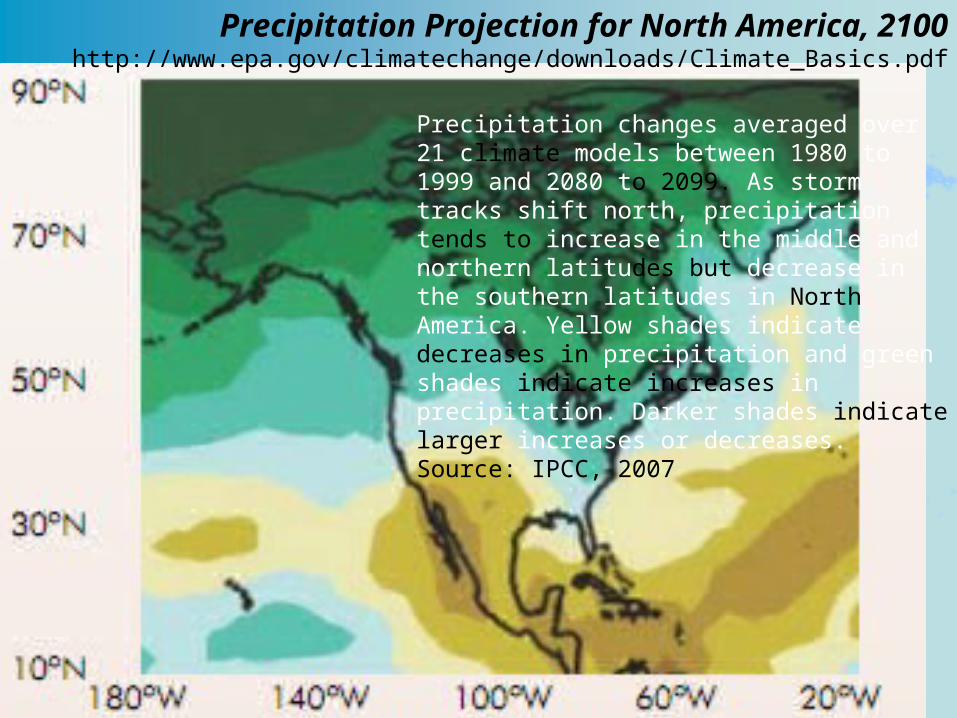
Precipitation Projection for North America, 2100http://www.epa.gov/climatechange/downloads/Climate_Basics.pdf
Precipitation changes averaged over 21 climate models between 1980 to 1999 and 2080 to 2099. As storm tracks shift north, precipitation tends to increase in the middle and northern latitudes but decrease in the southern latitudes in North America. Yellow shades indicate decreases in precipitation and green shades indicate increases in precipitation. Darker shades indicate larger increases or decreases. Source: IPCC, 2007

What probabilities, in time and space, can be assigned to any catastrophes that result and how economically feasible and practicable are various mitigating measures?
Two problems arise here:
1.Unpredictability of disasters2.Economic impracticability

0.1
1
10
0.01
1 10 100 1,000 10,000
FloodsFloods
Hurricanes
EarthquakesEarthquakes
Nu
mb
er o
f ev
ents
per
yea
r N
um
ber
of
even
ts p
er y
ear
Tornadoes
The U.S. 20th Century The U.S. 20th Century Natural Disaster Fatality-Natural Disaster Fatality-
Frequency PlotsFrequency Plots

It’s the Economy, Stupid
Climate Change Acceptance Sinks During Economic SlumpsArs Technica | March 20, 2012 | 11:00 am | Categories: EnvironmentBy John Timmer, Ars Technica
A few years back, the US public’s acceptance of conclusions reached by climate scientists took a dramatic drop. It’s only now beginning to recover. Not a lot has changed about the science during that time, raising questions about what’s driving the ups and downs in the polls. Studies have found correlations with the weather and a role for political leaders in driving these changes, but a new study suggests some of that is misplaced. Instead, its authors come to a conclusion we’ve heard before: it’s the economy, stupid.

FranceFranceU.K.U.K.
ChinaChina
SwedenSweden
RussiaRussia
USAUSA
BrazilBrazilItalyItaly
SingaporeSingapore
0.10.1
11
1010
100100
0.010.01 0.10.1 11 1010
MexicoMexico
GermanyGermanyIndiaIndia JapanJapan
NorwayNorwaySwtizerlandSwtizerland
Saudi ArabiaSaudi ArabiaNetherlandsNetherlands
AustraliaAustraliaSpainSpain
GDP (PPP) in trillion US $ (Y)GDP (PPP) in trillion US $ (Y)
Economic prosperity and energy Economic prosperity and energy consumption are closely correlatedconsumption are closely correlated
En
erg
y E
ner
gy
Co
nsu
mp
tio
n
Co
nsu
mp
tio
n
(ter
rajo
ule
s) (
E)
(ter
rajo
ule
s) (
E)

100 1,000 10,000
GDP (PPP) in billion international $
100
1,00
0
En
erg
y c
on
su
mp
tio
n(m
illio
n to
ns o
il eq
uiva
lent
)
The same direct dependence of economy on energy consumption is also what the time series data from China and India show.
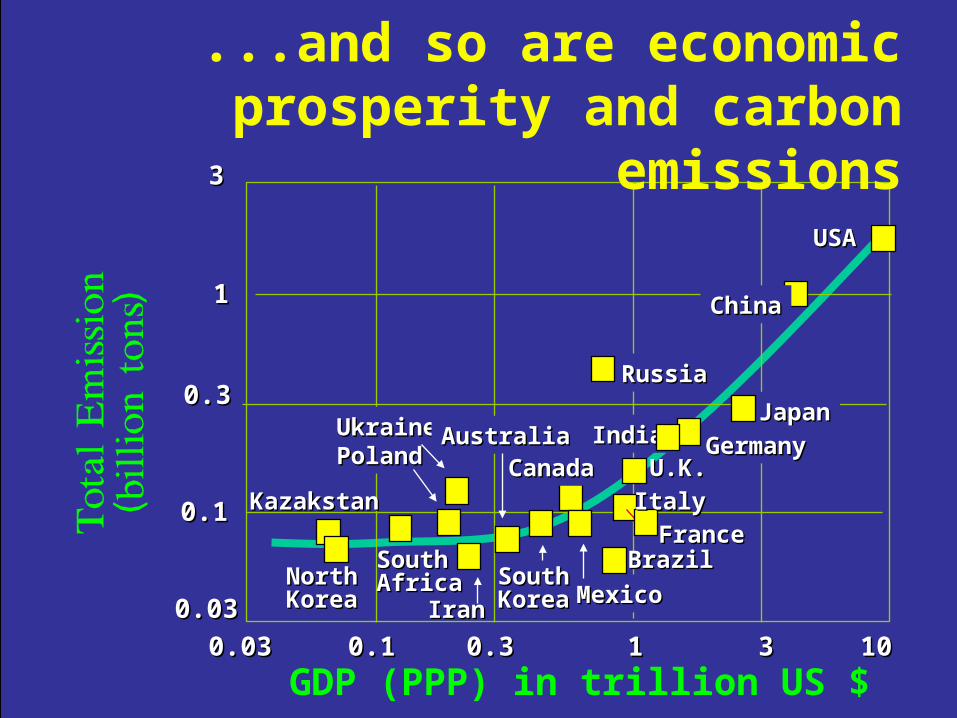
0.030.03
0.10.1
11
33
0.10.1 11 1010
0.30.3
330.30.30.030.03
USAUSA
ChinaChina
JapanJapan
RussiaRussia
GermanyGermanyIndiaIndia
U.K.U.K.
UkraineUkrainePolandPoland CanadaCanada
ItalyItaly
FranceFrance
IranIran
BrazilBrazil
MexicoMexicoSouthSouthKoreaKorea
AustraliaAustralia
SouthSouthAfricaAfricaNorthNorth
KoreaKorea
KazakstanKazakstan
...and so are economic prosperity and carbon emissions
GDP (PPP) in trillion US $

• Clearly, then, China, India and the other BRICS countries that hold the key to the world’s continued economic welfare are also likely to be the most significant sources of future carbon emissions.
• The fact that global economic growth is anemic elsewhere, in North America and Europe, therefore makes it unlikely for environmental idealism to not have to take a back seat to economic realism.

Thank You!
Related Documents