JANUARY 31, 2022 Not FDIC Insured - May Lose Value - No Bank Guarantee 2022 Semi-Annual Report (unaudited) BlackRock Funds SM • BlackRock Total Factor Fund BNM0322U-2100207-6479109

Welcome message from author
This document is posted to help you gain knowledge. Please leave a comment to let me know what you think about it! Share it to your friends and learn new things together.
Transcript
JANUARY 31, 2022
Not FDIC Insured - May Lose Value - No Bank Guarantee
2022 Semi-Annual Report(unaudited)
BlackRock FundsSM
• BlackRock Total Factor Fund
BNM0322U-2100207-6479109
Dear Shareholder,
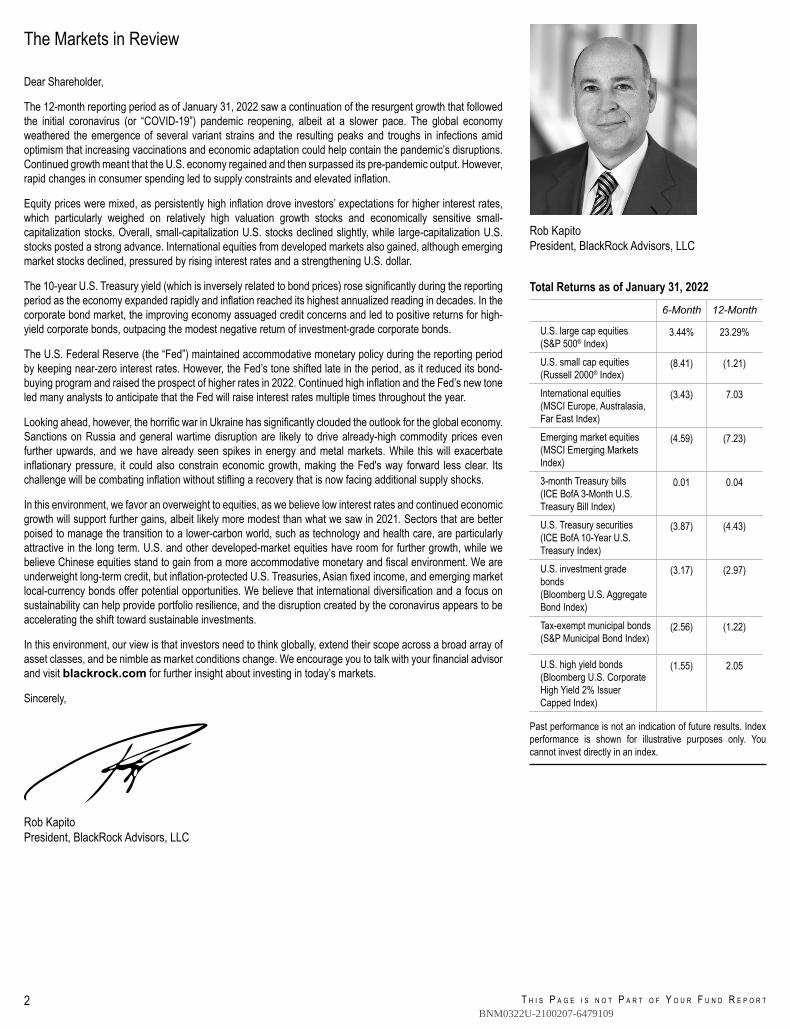
The 12-month reporting period as of January 31, 2022 saw a continuation of the resurgent growth that followedthe initial coronavirus (or “COVID-19”) pandemic reopening, albeit at a slower pace. The global economyweathered the emergence of several variant strains and the resulting peaks and troughs in infections amidoptimism that increasing vaccinations and economic adaptation could help contain the pandemic’s disruptions.Continued growth meant that the U.S. economy regained and then surpassed its pre-pandemic output. However,rapid changes in consumer spending led to supply constraints and elevated inflation.
Equity prices were mixed, as persistently high inflation drove investors’ expectations for higher interest rates,which particularly weighed on relatively high valuation growth stocks and economically sensitive small-capitalization stocks. Overall, small-capitalization U.S. stocks declined slightly, while large-capitalization U.S.stocks posted a strong advance. International equities from developed markets also gained, although emergingmarket stocks declined, pressured by rising interest rates and a strengthening U.S. dollar.
The 10-year U.S. Treasury yield (which is inversely related to bond prices) rose significantly during the reportingperiod as the economy expanded rapidly and inflation reached its highest annualized reading in decades. In thecorporate bond market, the improving economy assuaged credit concerns and led to positive returns for high-yield corporate bonds, outpacing the modest negative return of investment-grade corporate bonds.
The U.S. Federal Reserve (the “Fed”) maintained accommodative monetary policy during the reporting periodby keeping near-zero interest rates. However, the Fed’s tone shifted late in the period, as it reduced its bond-buying program and raised the prospect of higher rates in 2022. Continued high inflation and the Fed’s new toneled many analysts to anticipate that the Fed will raise interest rates multiple times throughout the year.
Looking ahead, however, the horrific war in Ukraine has significantly clouded the outlook for the global economy.Sanctions on Russia and general wartime disruption are likely to drive already-high commodity prices evenfurther upwards, and we have already seen spikes in energy and metal markets. While this will exacerbateinflationary pressure, it could also constrain economic growth, making the Fed's way forward less clear. Itschallenge will be combating inflation without stifling a recovery that is now facing additional supply shocks.
In this environment, we favor an overweight to equities, as we believe low interest rates and continued economicgrowth will support further gains, albeit likely more modest than what we saw in 2021. Sectors that are betterpoised to manage the transition to a lower-carbon world, such as technology and health care, are particularlyattractive in the long term. U.S. and other developed-market equities have room for further growth, while webelieve Chinese equities stand to gain from a more accommodative monetary and fiscal environment. We areunderweight long-term credit, but inflation-protected U.S. Treasuries, Asian fixed income, and emerging marketlocal-currency bonds offer potential opportunities. We believe that international diversification and a focus onsustainability can help provide portfolio resilience, and the disruption created by the coronavirus appears to beaccelerating the shift toward sustainable investments.
In this environment, our view is that investors need to think globally, extend their scope across a broad array ofasset classes, and be nimble as market conditions change. We encourage you to talk with your financial advisorand visit blackrock.com for further insight about investing in today’s markets.
Sincerely,
Rob KapitoPresident, BlackRock Advisors, LLC
The Markets in Review
Rob KapitoPresident, BlackRock Advisors, LLC
Total Returns as of January 31, 2022
6-Month 12-Month
U.S. large cap equities(S&P 500® Index)
3.44% 23.29%
U.S. small cap equities(Russell 2000® Index)
(8.41) (1.21)
International equities(MSCI Europe, Australasia,Far East Index)
(3.43) 7.03
Emerging market equities(MSCI Emerging MarketsIndex)
(4.59) (7.23)
3-month Treasury bills(ICE BofA 3-Month U.S.Treasury Bill Index)
0.01 0.04
U.S. Treasury securities(ICE BofA 10-Year U.S.Treasury Index)
(3.87) (4.43)
U.S. investment gradebonds(Bloomberg U.S. AggregateBond Index)
(3.17) (2.97)
Tax-exempt municipal bonds(S&P Municipal Bond Index)
(2.56) (1.22)
U.S. high yield bonds(Bloomberg U.S. CorporateHigh Yield 2% IssuerCapped Index)
(1.55) 2.05
Past performance is not an indication of future results. Indexperformance is shown for illustrative purposes only. Youcannot invest directly in an index.
T H I S P A G E I S N O T P A R T O F Y O U R F U N D R E P O R T2BNM0322U-2100207-6479109
Table of Contents
Page
3
The Markets in Review . . . . . . . . . . . . . . . . . . . . . . . . . . . . . . . . . . . . . . . . . . . . . . . . . . . . . . . . . . . . . . . . . . . . . . . . . . . . . . . . . . . . . . . . . . . . . . . . . . . 2Semi-Annual Report:Fund Summary . . . . . . . . . . . . . . . . . . . . . . . . . . . . . . . . . . . . . . . . . . . . . . . . . . . . . . . . . . . . . . . . . . . . . . . . . . . . . . . . . . . . . . . . . . . . . . . . . . . . . . . . 4About Fund Performance . . . . . . . . . . . . . . . . . . . . . . . . . . . . . . . . . . . . . . . . . . . . . . . . . . . . . . . . . . . . . . . . . . . . . . . . . . . . . . . . . . . . . . . . . . . . . . . . . . 7Disclosure of Expenses . . . . . . . . . . . . . . . . . . . . . . . . . . . . . . . . . . . . . . . . . . . . . . . . . . . . . . . . . . . . . . . . . . . . . . . . . . . . . . . . . . . . . . . . . . . . . . . . . . . 7Derivative Financial Instruments . . . . . . . . . . . . . . . . . . . . . . . . . . . . . . . . . . . . . . . . . . . . . . . . . . . . . . . . . . . . . . . . . . . . . . . . . . . . . . . . . . . . . . . . . . . . . 8Consolidated Financial Statements:
Consolidated Schedule of Investments . . . . . . . . . . . . . . . . . . . . . . . . . . . . . . . . . . . . . . . . . . . . . . . . . . . . . . . . . . . . . . . . . . . . . . . . . . . . . . . . . . . . . . . . 9Consolidated Statement of Assets and Liabilities . . . . . . . . . . . . . . . . . . . . . . . . . . . . . . . . . . . . . . . . . . . . . . . . . . . . . . . . . . . . . . . . . . . . . . . . . . . . . . . . . . 63Consolidated Statement of Operations . . . . . . . . . . . . . . . . . . . . . . . . . . . . . . . . . . . . . . . . . . . . . . . . . . . . . . . . . . . . . . . . . . . . . . . . . . . . . . . . . . . . . . . . 65Consolidated Statements of Changes in Net Assets . . . . . . . . . . . . . . . . . . . . . . . . . . . . . . . . . . . . . . . . . . . . . . . . . . . . . . . . . . . . . . . . . . . . . . . . . . . . . . . . 66
Consolidated Financial Highlights . . . . . . . . . . . . . . . . . . . . . . . . . . . . . . . . . . . . . . . . . . . . . . . . . . . . . . . . . . . . . . . . . . . . . . . . . . . . . . . . . . . . . . . . . . . . . 67Notes to Consolidated Financial Statements . . . . . . . . . . . . . . . . . . . . . . . . . . . . . . . . . . . . . . . . . . . . . . . . . . . . . . . . . . . . . . . . . . . . . . . . . . . . . . . . . . . . . . 71Statement Regarding Liquidity Risk Management Program . . . . . . . . . . . . . . . . . . . . . . . . . . . . . . . . . . . . . . . . . . . . . . . . . . . . . . . . . . . . . . . . . . . . . . . . . . . . . 81Additional Information . . . . . . . . . . . . . . . . . . . . . . . . . . . . . . . . . . . . . . . . . . . . . . . . . . . . . . . . . . . . . . . . . . . . . . . . . . . . . . . . . . . . . . . . . . . . . . . . . . . . 82Glossary of Terms Used in this Report . . . . . . . . . . . . . . . . . . . . . . . . . . . . . . . . . . . . . . . . . . . . . . . . . . . . . . . . . . . . . . . . . . . . . . . . . . . . . . . . . . . . . . . . . . 84
BNM0322U-2100207-6479109
Fund Summary as of January 31, 2022
2 0 2 2 B L A C K R O C K S E M I - A N N U A L R E P O R T T O S H A R E H O L D E R S4
BlackRock Total Factor Fund
Investment ObjectiveBlackRock Total Factor Fund’s (the “Fund”) investment objective is to seek total return.
Portfolio Management Commentary
How did the Fund perform?For the six-month period ended January 31, 2022, all of the Fund's share classes outperformed its reference benchmark, a blend of 60% MSCI World Index Hedged USDNet/40% Bloomberg U.S. Aggregate Bond Index. For the same period, all of the Fund's share classes outperformed its secondary benchmark, the ICE BofA 3-Month U.S.Treasury Bill Index.
What factors influenced performance?The Fund targets a total return in the form of capital appreciation and income over the long term. The Fund utilizes a factor investing approach to provide a diversified enginefor growth. The Fund targets multiple return drivers, or factors, across many asset classes and geographies. By leveraging a long/short implementation framework, thestrategy seeks to isolate broad and persistent sources of returns, while maintaining a low correlation to equity and fixed-income markets in seeking to be resilient to marketshocks and drawdowns.
Positive relative performance was driven by the Fund’s long/short market-neutral style factor area, which receives roughly two-thirds of the allocation, as a hawkish shifttoward the tightening of monetary policy from global central banks acted as a tailwind for most style factors. Within the style factor allocation, four out of five headlinebuckets – carry (income), value, quality, and low volatility – finished firmly in positive territory as a continuation of the reflation trade and a strong tilt toward durable, profitablecompanies relative to high risk, unprofitable firms underpinned performance. Across style factors, single name equities, currencies, and equity markets (country futures) werethe best-performing asset classes. Single name equities contributed positively in five out of six months over the period, and both currencies and equity markets benefited fromstrong security selection across emerging markets. Within the risk parity/macro factor allocation, only the pro-cyclical economic growth factor finished in positive territory asexposure to commodities supported performance following continued imbalances between energy supply and demand along with inflationary pressures.
The risk parity/macro factor allocation, which receives roughly one-third of the Fund’s total risk budget, ended the period slightly lower as the defensive exposures – realrates (inflation-linked bonds) and inflation (nominal debt) – were hindered by the probabilities of further rate hikes being priced in following persistent inflation overshoots andmixed macro data. Within the market-neutral style factor portion of the portfolio, only bonds and commodities trekked modestly lower. From a factor standpoint, momentumwas the lone style factor that underperformed, albeit marginally, with relative trends experiencing mixed results as positive performance from single name equities was offsetby some rotation across both bonds and commodities.
The Fund routinely holds derivatives including futures, swaps, and currency forwards to gain exposure to single name stocks, global bonds, currencies, commodities, andequity market indices in a cost-efficient and capital-efficient manner. Additionally, some of the Fund’s currency forwards are held for hedging purposes to protect againstunintended exposure to foreign currency risk. Over the period, the use of derivatives contributed positively to performance.
The Fund holds large, unencumbered cash positions to meet collateral calls on its derivative positions. The cash balance did not have a material impact on performanceduring the period.
Describe recent portfolio activity.While the overall allocations to the factor groupings remained stable throughout the period, the timing model within single name equities was tilted toward quality andmomentum insights early in the period, taking advantage of positive sentiment behind companies with robust cash flows and earnings able to weather a rising rate regime.At the tail end of the period, the timing model began to pare back its underweight to value, which experienced a strong, positive rotation following persistently higher-than-expected levels of inflation across the globe and a moving forward of the expected timetables for global central banks to end quantitative easing and hike policy rates.
Describe portfolio positioning at period end.The Fund continued to seek to deliver positive absolute returns by balancing risks among equities, bonds, commodities, currencies and diversifying strategies. At the end ofthe period, the Fund was positioned slightly overweight to value and momentum strategies and with a marginal tilt away from carry. Within single name equities, the timingmodel was modestly tilted toward momentum and quality insights, and slightly underweight to value and low volatility. At the overall portfolio level, equities and fixed incomeremained the most overweight asset classes.
The views expressed reflect the opinions of BlackRock as of the date of this report and are subject to change based on changes in market, economic or other conditions.These views are not intended to be a forecast of future events and are no guarantee of future results.
BNM0322U-2100207-6479109
Fund Summary as of January 31, 2022 (continued)
5F U N D S U M M A R Y
BlackRock Total Factor Fund
Portfolio Information
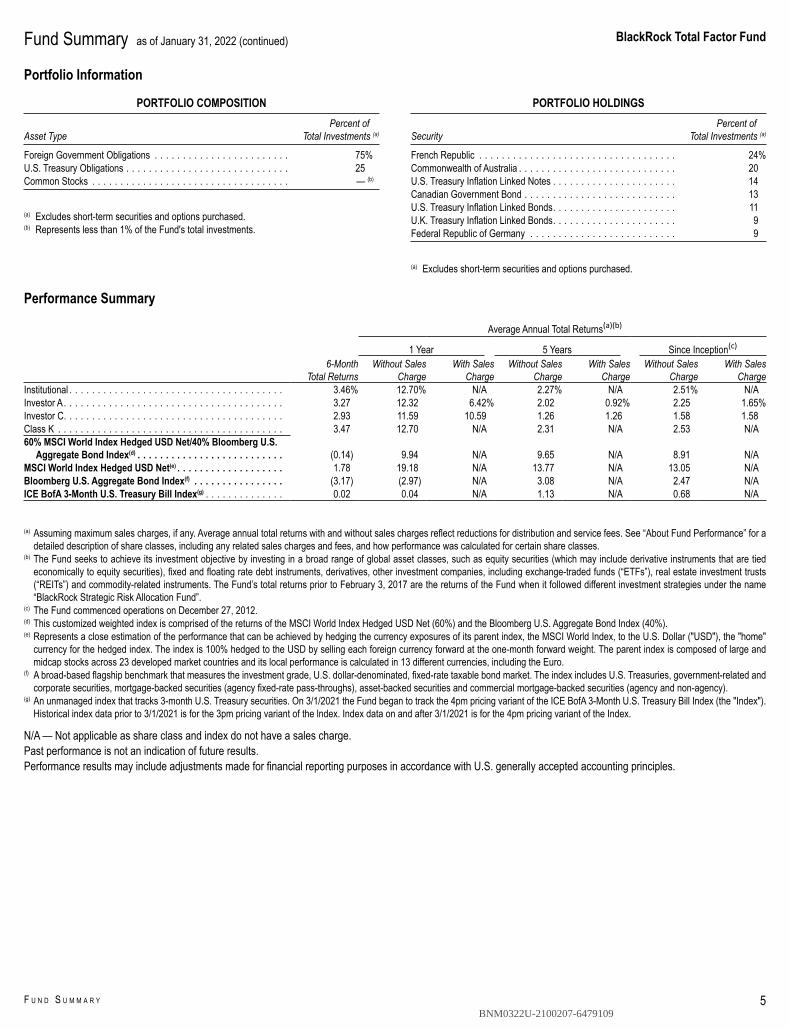
PORTFOLIO COMPOSITION
Asset TypePercent of at
Total Investments (a)
Foreign Government Obligations . . . . . . . . . . . . . . . . . . . . . . . . 75%U.S. Treasury Obligations . . . . . . . . . . . . . . . . . . . . . . . . . . . . . 25Common Stocks . . . . . . . . . . . . . . . . . . . . . . . . . . . . . . . . . . . — (b)
(a) Excludes short-term securities and options purchased.(b) Represents less than 1% of the Fund's total investments.
PORTFOLIO HOLDINGS
SecurityPercent of at
Total Investments (a)
French Republic . . . . . . . . . . . . . . . . . . . . . . . . . . . . . . . . . . . 24%Commonwealth of Australia . . . . . . . . . . . . . . . . . . . . . . . . . . . . 20U.S. Treasury Inflation Linked Notes . . . . . . . . . . . . . . . . . . . . . . 14Canadian Government Bond . . . . . . . . . . . . . . . . . . . . . . . . . . . 13U.S. Treasury Inflation Linked Bonds. . . . . . . . . . . . . . . . . . . . . . 11U.K. Treasury Inflation Linked Bonds. . . . . . . . . . . . . . . . . . . . . . 9Federal Republic of Germany . . . . . . . . . . . . . . . . . . . . . . . . . . 9
(a) Excludes short-term securities and options purchased.
Performance Summary
Average Annual Total Returns(a)(b)
1 Year 5 Years Since Inception(c)
6-MonthTotal Returns
Without SalesCharge
With SalesCharge
Without SalesCharge
With SalesCharge
Without SalesCharge
With SalesCharge
Institutional . . . . . . . . . . . . . . . . . . . . . . . . . . . . . . . . . . . . . . 3.46% 12.70% N/A 2.27% N/A 2.51% N/AInvestor A. . . . . . . . . . . . . . . . . . . . . . . . . . . . . . . . . . . . . . . 3.27 12.32 6.42% 2.02 0.92% 2.25 1.65%Investor C. . . . . . . . . . . . . . . . . . . . . . . . . . . . . . . . . . . . . . . 2.93 11.59 10.59 1.26 1.26 1.58 1.58Class K . . . . . . . . . . . . . . . . . . . . . . . . . . . . . . . . . . . . . . . . 3.47 12.70 N/A 2.31 N/A 2.53 N/A60% MSCI World Index Hedged USD Net/40% Bloomberg U.S.
Aggregate Bond Index(d) . . . . . . . . . . . . . . . . . . . . . . . . . . (0.14) 9.94 N/A 9.65 N/A 8.91 N/AMSCI World Index Hedged USD Net(e) . . . . . . . . . . . . . . . . . . . 1.78 19.18 N/A 13.77 N/A 13.05 N/ABloomberg U.S. Aggregate Bond Index(f) . . . . . . . . . . . . . . . . (3.17) (2.97) N/A 3.08 N/A 2.47 N/AICE BofA 3-Month U.S. Treasury Bill Index(g) . . . . . . . . . . . . . . 0.02 0.04 N/A 1.13 N/A 0.68 N/A
(a) Assuming maximum sales charges, if any. Average annual total returns with and without sales charges reflect reductions for distribution and service fees. See “About Fund Performance” for adetailed description of share classes, including any related sales charges and fees, and how performance was calculated for certain share classes.
(b) The Fund seeks to achieve its investment objective by investing in a broad range of global asset classes, such as equity securities (which may include derivative instruments that are tiedeconomically to equity securities), fixed and floating rate debt instruments, derivatives, other investment companies, including exchange-traded funds (“ETFs”), real estate investment trusts(“REITs”) and commodity-related instruments. The Fund’s total returns prior to February 3, 2017 are the returns of the Fund when it followed different investment strategies under the name“BlackRock Strategic Risk Allocation Fund”.
(c) The Fund commenced operations on December 27, 2012.(d) This customized weighted index is comprised of the returns of the MSCI World Index Hedged USD Net (60%) and the Bloomberg U.S. Aggregate Bond Index (40%).(e) Represents a close estimation of the performance that can be achieved by hedging the currency exposures of its parent index, the MSCI World Index, to the U.S. Dollar ("USD"), the "home"
currency for the hedged index. The index is 100% hedged to the USD by selling each foreign currency forward at the one-month forward weight. The parent index is composed of large andmidcap stocks across 23 developed market countries and its local performance is calculated in 13 different currencies, including the Euro.
(f) A broad-based flagship benchmark that measures the investment grade, U.S. dollar-denominated, fixed-rate taxable bond market. The index includes U.S. Treasuries, government-related andcorporate securities, mortgage-backed securities (agency fixed-rate pass-throughs), asset-backed securities and commercial mortgage-backed securities (agency and non-agency).
(g) An unmanaged index that tracks 3-month U.S. Treasury securities. On 3/1/2021 the Fund began to track the 4pm pricing variant of the ICE BofA 3-Month U.S. Treasury Bill Index (the "Index").Historical index data prior to 3/1/2021 is for the 3pm pricing variant of the lndex. Index data on and after 3/1/2021 is for the 4pm pricing variant of the Index.
N/A — Not applicable as share class and index do not have a sales charge.Past performance is not an indication of future results.Performance results may include adjustments made for financial reporting purposes in accordance with U.S. generally accepted accounting principles.
BNM0322U-2100207-6479109
Fund Summary as of January 31, 2022 (continued)
2 0 2 2 B L A C K R O C K S E M I - A N N U A L R E P O R T T O S H A R E H O L D E R S6
BlackRock Total Factor Fund
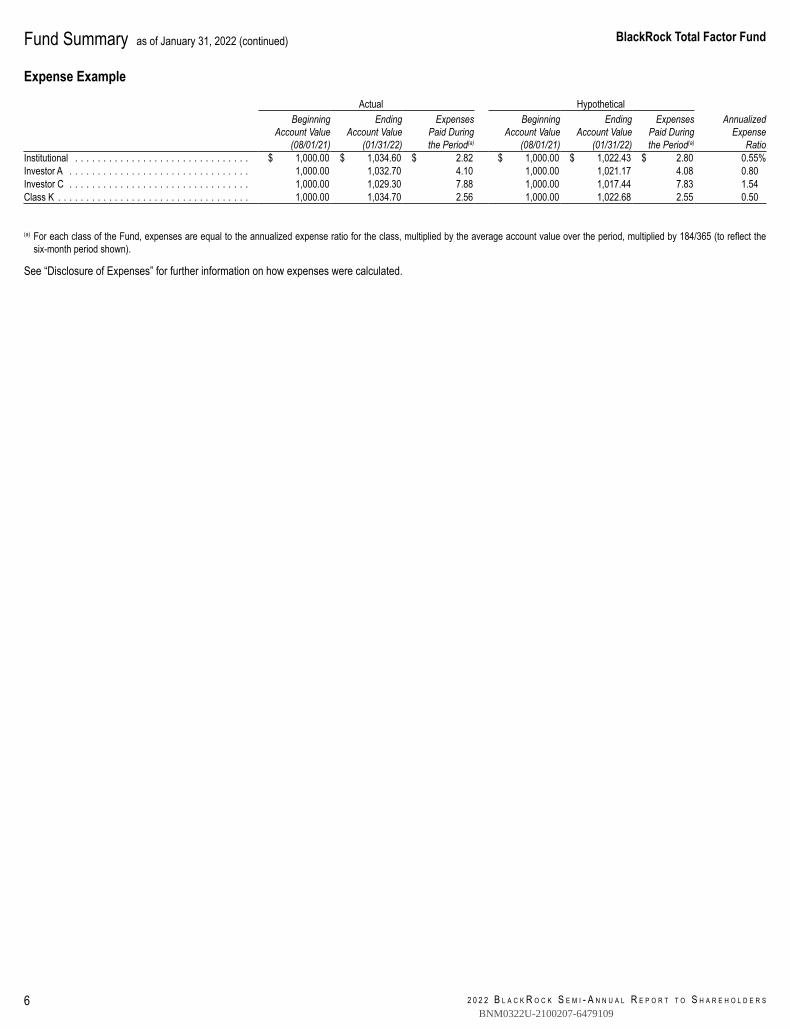
Expense Example
Actual HypotheticalBeginning
Account Value(08/01/21)
EndingAccount Value
(01/31/22)
ExpensesPaid Duringthe Period(a)
BeginningAccount Value
(08/01/21)
EndingAccount Value
(01/31/22)
ExpensesPaid Duringthe Period(a)
AnnualizedExpense
RatioInstitutional . . . . . . . . . . . . . . . . . . . . . . . . . . . . . . . $ 1,000.00 $ 1,034.60 $ 2.82 $ 1,000.00 $ 1,022.43 $ 2.80 0.55%Investor A . . . . . . . . . . . . . . . . . . . . . . . . . . . . . . . . 1,000.00 1,032.70 4.10 1,000.00 1,021.17 4.08 0.80Investor C . . . . . . . . . . . . . . . . . . . . . . . . . . . . . . . . 1,000.00 1,029.30 7.88 1,000.00 1,017.44 7.83 1.54Class K . . . . . . . . . . . . . . . . . . . . . . . . . . . . . . . . . . 1,000.00 1,034.70 2.56 1,000.00 1,022.68 2.55 0.50
(a) For each class of the Fund, expenses are equal to the annualized expense ratio for the class, multiplied by the average account value over the period, multiplied by 184/365 (to reflect thesix-month period shown).
See “Disclosure of Expenses” for further information on how expenses were calculated.
BNM0322U-2100207-6479109
About Fund Performance
7A B O U T F U N D P E R F O R M A N C E / D I S C L O S U R E O F E X P E N S E S
Institutional and Class K Shares are not subject to any sales charge. These shares bear no ongoing distribution or service fees and are available only to certain eligibleinvestors. Class K Shares performance shown prior to the Class K Shares inception date of February 3, 2017 is that of Institutional Shares. The performance of theFund’s Class K Shares would be substantially similar to Institutional Shares because Class K Shares and Institutional Shares invest in the same portfolio of securities andperformance would only differ to the extent that Class K Shares and Institutional Shares have different expenses. The actual returns of Class K Shares would have beenhigher than those of the Institutional Shares because Class K Shares have lower expenses than the Institutional Shares.
Investor A Shares are subject to a maximum initial sales charge (front-end load) of 5.25% and a service fee of 0.25% per year (but no distribution fee). Certain redemptionsof these shares may be subject to a contingent deferred sales charge ("CDSC") where no initial sales charge was paid at the time of purchase. These shares are generallyavailable through financial intermediaries.
Investor C Shares are subject to a 1.00% CDSC if redeemed within one year of purchase. In addition, these shares are subject to a distribution fee of 0.75% per yearand a service fee of 0.25% per year. These shares are generally available through financial intermediaries. These shares automatically convert to Investor A Shares afterapproximately eight years.
Past performance is not an indication of future results. Financial markets have experienced extreme volatility and trading in many instruments has been disrupted. Thesecircumstances may continue for an extended period of time, and may continue to affect adversely the value and liquidity of the fund's investments. As a result, currentperformance may be lower or higher than the performance data quoted. Refer to blackrock.com to obtain performance data current to the most recent month-end.Performance results do not reflect the deduction of taxes that a shareholder would pay on Fund distributions or the redemption of Fund shares. Figures shown in theperformance table(s) assume reinvestment of all distributions, if any, at net asset value ("NAV") on the ex-dividend date or payable date, as applicable. Investment returnand principal value of shares will fluctuate so that shares, when redeemed, may be worth more or less than their original cost. Distributions paid to each class of shares willvary because of the different levels of service, distribution and transfer agency fees applicable to each class, which are deducted from the income available to be paid toshareholders.
BlackRock Advisors, LLC (the "Manager”), the Fund's investment adviser, has contractually and/or voluntarily agreed to waive and/or reimburse a portion of the Fund’sexpenses. Without such waiver(s) and/or reimbursement(s), the Fund's performance would have been lower. With respect to the Fund's voluntary waiver(s), if any, theManager is under no obligation to waive and/or reimburse or to continue waiving and/or reimbursing its fees and such voluntary waiver(s) may be reduced or discontinuedat any time. With respect to the Fund's contractual waiver(s), if any, the Manager is under no obligation to continue waiving and/or reimbursing its fees after the applicabletermination date of such agreement. See the Notes to Consolidated Financial Statements for additional information on waivers and/or reimbursements.
Disclosure of ExpensesShareholders of the Fund may incur the following charges: (a) transactional expenses, such as sales charges; and (b) operating expenses, including investment advisoryfees, administration fees, service and distribution fees, including 12b-1 fees, acquired fund fees and expenses, and other fund expenses. The expense example shown(which is based on a hypothetical investment of $1,000 invested at the beginning of the period (or from the commencement of operations if less than 6 months) and heldthrough the end of the period) is intended to assist shareholders both in calculating expenses based on an investment in the Fund and in comparing these expenses withsimilar costs of investing in other mutual funds.
The expense example provides information about actual account values and actual expenses. Annualized expense ratios reflect contractual and voluntary fee waivers, if any.In order to estimate the expenses a shareholder paid during the period covered by this report, shareholders can divide their account value by $1,000 and then multiply theresult by the number corresponding to their share class under the heading entitled “Expenses Paid During the Period.”
The expense example also provides information about hypothetical account values and hypothetical expenses based on the Fund’s actual expense ratio and an assumedrate of return of 5% per year before expenses. In order to assist shareholders in comparing the ongoing expenses of investing in the Fund and other funds, compare the 5%hypothetical example with the 5% hypothetical examples that appear in shareholder reports of other funds.
The expenses shown in the expense example are intended to highlight shareholders’ ongoing costs only and do not reflect transactional expenses, such as sales charges,if any. Therefore, the hypothetical example is useful in comparing ongoing expenses only and will not help shareholders determine the relative total expenses of owningdifferent funds. If these transactional expenses were included, shareholder expenses would have been higher.
BNM0322U-2100207-6479109
Derivative Financial Instruments
2 0 2 2 B L A C K R O C K S E M I - A N N U A L R E P O R T T O S H A R E H O L D E R S8
The Fund may invest in various derivative financial instruments. These instruments are used to obtain exposure to a security, commodity, index, market, and/or other assetswithout owning or taking physical custody of securities, commodities and/or other referenced assets or to manage market, equity, credit, interest rate, foreign currencyexchange rate, commodity and/or other risks. Derivative financial instruments may give rise to a form of economic leverage and involve risks, including the imperfectcorrelation between the value of a derivative financial instrument and the underlying asset, possible default of the counterparty to the transaction or illiquidity of the instrument.The Fund’s successful use of a derivative financial instrument depends on the investment adviser’s ability to predict pertinent market movements accurately, which cannot beassured. The use of these instruments may result in losses greater than if they had not been used, may limit the amount of appreciation the Fund can realize on an investmentand/or may result in lower distributions paid to shareholders. The Fund’s investments in these instruments, if any, are discussed in detail in the Notes to ConsolidatedFinancial Statements.
BNM0322U-2100207-6479109
BlackRock Total Factor Fund
C O N S O L I D A T E D S C H E D U L E O F I N V E S T M E N T S 9
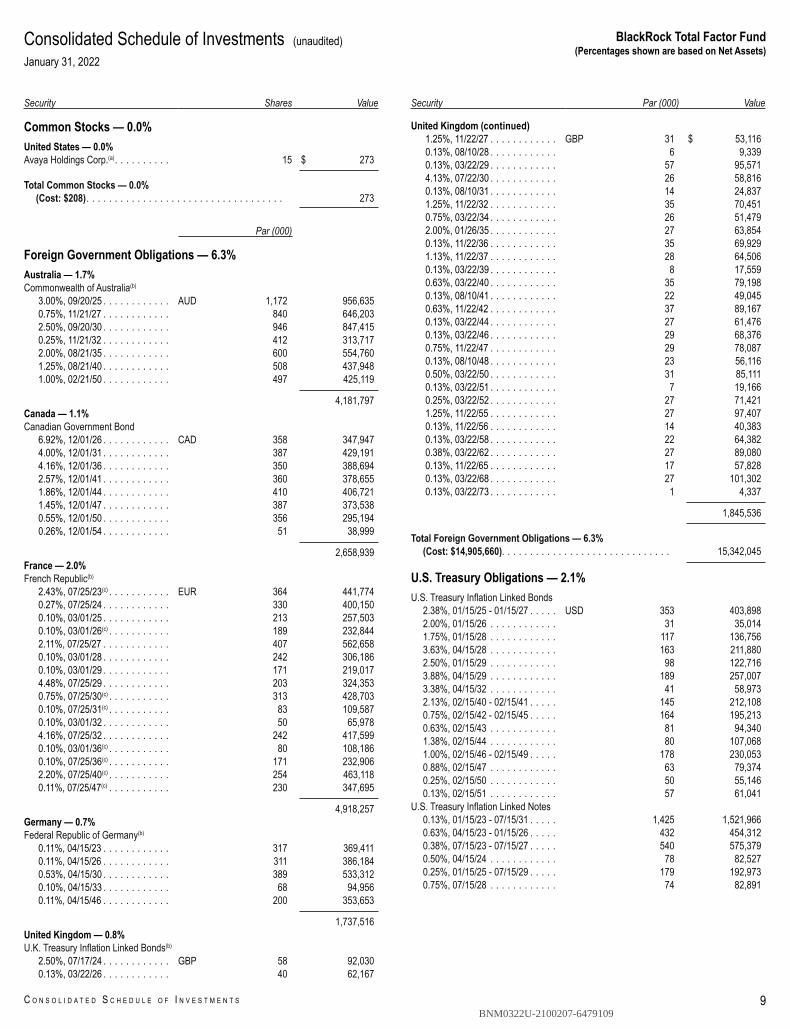
(Percentages shown are based on Net Assets)Consolidated Schedule of Investments (unaudited)January 31, 2022
SecuritySharesShares Value
Common Stocks — 0.0%United States — 0.0%Avaya Holdings Corp.(a). . . . . . . . . . 15 $ 273
Total Common Stocks — 0.0%(Cost: $208). . . . . . . . . . . . . . . . . . . . . . . . . . . . . . . . . . . 273
Par (000)Par (000)
Foreign Government Obligations — 6.3%Australia — 1.7%Commonwealth of Australia(b)
3.00%, 09/20/25 . . . . . . . . . . . . AUD 1,172 956,6350.75%, 11/21/27 . . . . . . . . . . . . 840 646,2032.50%, 09/20/30 . . . . . . . . . . . . 946 847,4150.25%, 11/21/32 . . . . . . . . . . . . 412 313,7172.00%, 08/21/35 . . . . . . . . . . . . 600 554,7601.25%, 08/21/40 . . . . . . . . . . . . 508 437,9481.00%, 02/21/50 . . . . . . . . . . . . 497 425,119
4,181,797Canada — 1.1%Canadian Government Bond
6.92%, 12/01/26 . . . . . . . . . . . . CAD 358 347,9474.00%, 12/01/31 . . . . . . . . . . . . 387 429,1914.16%, 12/01/36 . . . . . . . . . . . . 350 388,6942.57%, 12/01/41 . . . . . . . . . . . . 360 378,6551.86%, 12/01/44 . . . . . . . . . . . . 410 406,7211.45%, 12/01/47 . . . . . . . . . . . . 387 373,5380.55%, 12/01/50 . . . . . . . . . . . . 356 295,1940.26%, 12/01/54 . . . . . . . . . . . . 51 38,999
2,658,939France — 2.0%French Republic(b)
2.43%, 07/25/23(c) . . . . . . . . . . . EUR 364 441,7740.27%, 07/25/24 . . . . . . . . . . . . 330 400,1500.10%, 03/01/25 . . . . . . . . . . . . 213 257,5030.10%, 03/01/26(c) . . . . . . . . . . . 189 232,8442.11%, 07/25/27 . . . . . . . . . . . . 407 562,6580.10%, 03/01/28 . . . . . . . . . . . . 242 306,1860.10%, 03/01/29 . . . . . . . . . . . . 171 219,0174.48%, 07/25/29 . . . . . . . . . . . . 203 324,3530.75%, 07/25/30(c) . . . . . . . . . . . 313 428,7030.10%, 07/25/31(c) . . . . . . . . . . . 83 109,5870.10%, 03/01/32 . . . . . . . . . . . . 50 65,9784.16%, 07/25/32 . . . . . . . . . . . . 242 417,5990.10%, 03/01/36(c) . . . . . . . . . . . 80 108,1860.10%, 07/25/36(c) . . . . . . . . . . . 171 232,9062.20%, 07/25/40(c) . . . . . . . . . . . 254 463,1180.11%, 07/25/47(c) . . . . . . . . . . . 230 347,695
4,918,257Germany — 0.7%Federal Republic of Germany(b)
0.11%, 04/15/23 . . . . . . . . . . . . 317 369,4110.11%, 04/15/26 . . . . . . . . . . . . 311 386,1840.53%, 04/15/30 . . . . . . . . . . . . 389 533,3120.10%, 04/15/33 . . . . . . . . . . . . 68 94,9560.11%, 04/15/46 . . . . . . . . . . . . 200 353,653
1,737,516United Kingdom — 0.8%U.K. Treasury Inflation Linked Bonds(b)
2.50%, 07/17/24 . . . . . . . . . . . . GBP 58 92,0300.13%, 03/22/26 . . . . . . . . . . . . 40 62,167
SecurityPar (000)Par (000) Value
United Kingdom (continued)1.25%, 11/22/27 . . . . . . . . . . . . GBP 31 $ 53,1160.13%, 08/10/28 . . . . . . . . . . . . 6 9,3390.13%, 03/22/29 . . . . . . . . . . . . 57 95,5714.13%, 07/22/30 . . . . . . . . . . . . 26 58,8160.13%, 08/10/31 . . . . . . . . . . . . 14 24,8371.25%, 11/22/32 . . . . . . . . . . . . 35 70,4510.75%, 03/22/34 . . . . . . . . . . . . 26 51,4792.00%, 01/26/35 . . . . . . . . . . . . 27 63,8540.13%, 11/22/36 . . . . . . . . . . . . 35 69,9291.13%, 11/22/37 . . . . . . . . . . . . 28 64,5060.13%, 03/22/39 . . . . . . . . . . . . 8 17,5590.63%, 03/22/40 . . . . . . . . . . . . 35 79,1980.13%, 08/10/41 . . . . . . . . . . . . 22 49,0450.63%, 11/22/42 . . . . . . . . . . . . 37 89,1670.13%, 03/22/44 . . . . . . . . . . . . 27 61,4760.13%, 03/22/46 . . . . . . . . . . . . 29 68,3760.75%, 11/22/47 . . . . . . . . . . . . 29 78,0870.13%, 08/10/48 . . . . . . . . . . . . 23 56,1160.50%, 03/22/50 . . . . . . . . . . . . 31 85,1110.13%, 03/22/51 . . . . . . . . . . . . 7 19,1660.25%, 03/22/52 . . . . . . . . . . . . 27 71,4211.25%, 11/22/55 . . . . . . . . . . . . 27 97,4070.13%, 11/22/56 . . . . . . . . . . . . 14 40,3830.13%, 03/22/58 . . . . . . . . . . . . 22 64,3820.38%, 03/22/62 . . . . . . . . . . . . 27 89,0800.13%, 11/22/65 . . . . . . . . . . . . 17 57,8280.13%, 03/22/68 . . . . . . . . . . . . 27 101,3020.13%, 03/22/73 . . . . . . . . . . . . 1 4,337
1,845,536
Total Foreign Government Obligations — 6.3%(Cost: $14,905,660). . . . . . . . . . . . . . . . . . . . . . . . . . . . . . 15,342,045
U.S. Treasury Obligations — 2.1%U.S. Treasury Inflation Linked Bonds
2.38%, 01/15/25 - 01/15/27 . . . . . USD 353 403,8982.00%, 01/15/26 . . . . . . . . . . . . 31 35,0141.75%, 01/15/28 . . . . . . . . . . . . 117 136,7563.63%, 04/15/28 . . . . . . . . . . . . 163 211,8802.50%, 01/15/29 . . . . . . . . . . . . 98 122,7163.88%, 04/15/29 . . . . . . . . . . . . 189 257,0073.38%, 04/15/32 . . . . . . . . . . . . 41 58,9732.13%, 02/15/40 - 02/15/41 . . . . . 145 212,1080.75%, 02/15/42 - 02/15/45 . . . . . 164 195,2130.63%, 02/15/43 . . . . . . . . . . . . 81 94,3401.38%, 02/15/44 . . . . . . . . . . . . 80 107,0681.00%, 02/15/46 - 02/15/49 . . . . . 178 230,0530.88%, 02/15/47 . . . . . . . . . . . . 63 79,3740.25%, 02/15/50 . . . . . . . . . . . . 50 55,1460.13%, 02/15/51 . . . . . . . . . . . . 57 61,041
U.S. Treasury Inflation Linked Notes0.13%, 01/15/23 - 07/15/31 . . . . . 1,425 1,521,9660.63%, 04/15/23 - 01/15/26 . . . . . 432 454,3120.38%, 07/15/23 - 07/15/27 . . . . . 540 575,3790.50%, 04/15/24 . . . . . . . . . . . . 78 82,5270.25%, 01/15/25 - 07/15/29 . . . . . 179 192,9730.75%, 07/15/28 . . . . . . . . . . . . 74 82,891
BNM0322U-2100207-6479109
2 0 2 2 B L A C K R O C K S E M I - A N N U A L R E P O R T T O S H A R E H O L D E R S
BlackRock Total Factor Fund
10
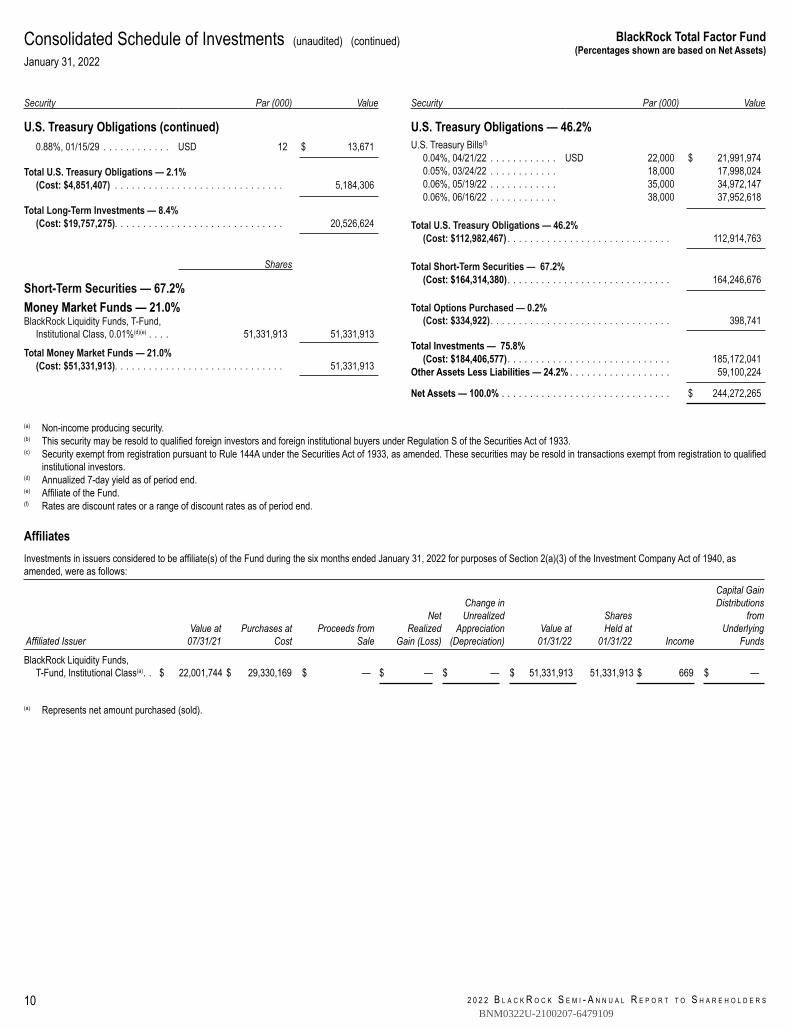
(Percentages shown are based on Net Assets)Consolidated Schedule of Investments (unaudited) (continued)January 31, 2022
SecurityPar (000)Par (000) Value
U.S. Treasury Obligations (continued)0.88%, 01/15/29 . . . . . . . . . . . . USD 12 $ 13,671
Total U.S. Treasury Obligations — 2.1%(Cost: $4,851,407) . . . . . . . . . . . . . . . . . . . . . . . . . . . . . . 5,184,306
Total Long-Term Investments — 8.4%(Cost: $19,757,275). . . . . . . . . . . . . . . . . . . . . . . . . . . . . . 20,526,624
SharesShares
Short-Term Securities — 67.2%Money Market Funds — 21.0%BlackRock Liquidity Funds, T-Fund,
Institutional Class, 0.01%(d)(e) . . . . 51,331,913 51,331,913
Total Money Market Funds — 21.0%(Cost: $51,331,913). . . . . . . . . . . . . . . . . . . . . . . . . . . . . . 51,331,913
SecurityPar (000)Par (000) Value
U.S. Treasury Obligations — 46.2%U.S. Treasury Bills(f)
0.04%, 04/21/22 . . . . . . . . . . . . USD 22,000 $ 21,991,9740.05%, 03/24/22 . . . . . . . . . . . . 18,000 17,998,0240.06%, 05/19/22 . . . . . . . . . . . . 35,000 34,972,1470.06%, 06/16/22 . . . . . . . . . . . . 38,000 37,952,618
Total U.S. Treasury Obligations — 46.2%(Cost: $112,982,467) . . . . . . . . . . . . . . . . . . . . . . . . . . . . . 112,914,763
Total Short-Term Securities — 67.2%(Cost: $164,314,380). . . . . . . . . . . . . . . . . . . . . . . . . . . . . 164,246,676
Total Options Purchased — 0.2%(Cost: $334,922). . . . . . . . . . . . . . . . . . . . . . . . . . . . . . . . 398,741
Total Investments — 75.8%(Cost: $184,406,577). . . . . . . . . . . . . . . . . . . . . . . . . . . . . 185,172,041
Other Assets Less Liabilities — 24.2% . . . . . . . . . . . . . . . . . . 59,100,224
Net Assets — 100.0% . . . . . . . . . . . . . . . . . . . . . . . . . . . . . . $ 244,272,265
(a) Non-income producing security.(b) This security may be resold to qualified foreign investors and foreign institutional buyers under Regulation S of the Securities Act of 1933.(c) Security exempt from registration pursuant to Rule 144A under the Securities Act of 1933, as amended. These securities may be resold in transactions exempt from registration to qualified
institutional investors.(d) Annualized 7-day yield as of period end.(e) Affiliate of the Fund.(f) Rates are discount rates or a range of discount rates as of period end.
AffiliatesInvestments in issuers considered to be affiliate(s) of the Fund during the six months ended January 31, 2022 for purposes of Section 2(a)(3) of the Investment Company Act of 1940, asamended, were as follows:
Affiliated IssuerValue at
07/31/21Purchases at
CostProceeds from
Sale
NetRealized
Gain (Loss)
Change inUnrealized
Appreciation(Depreciation)
Value at01/31/22
SharesHeld at
01/31/22 Income
Capital GainDistributions
fromUnderlying
Funds
BlackRock Liquidity Funds,T-Fund, Institutional Class(a). . $ 22,001,744 $ 29,330,169 $ — $ — $ — $ 51,331,913 51,331,913 $ 669 $ —
— —
(a) Represents net amount purchased (sold).
BNM0322U-2100207-6479109
BlackRock Total Factor Fund
C O N S O L I D A T E D S C H E D U L E O F I N V E S T M E N T S 11
Consolidated Schedule of Investments (unaudited) (continued)January 31, 2022
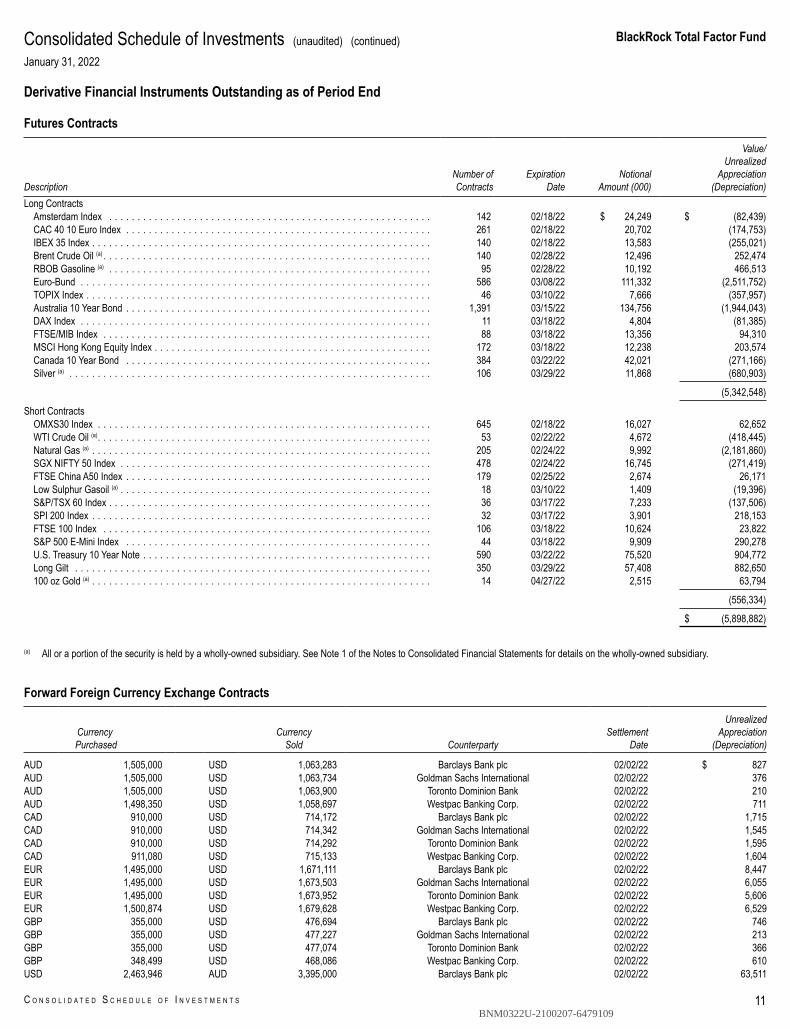
Derivative Financial Instruments Outstanding as of Period End
Futures Contracts
DescriptionNumber ofContracts
ExpirationDate
NotionalAmount (000)
Value/Unrealized
Appreciation(Depreciation)
Long ContractsAmsterdam Index . . . . . . . . . . . . . . . . . . . . . . . . . . . . . . . . . . . . . . . . . . . . . . . . . . . . . . . . . 142 02/18/22 $ 24,249 $ (82,439)CAC 40 10 Euro Index . . . . . . . . . . . . . . . . . . . . . . . . . . . . . . . . . . . . . . . . . . . . . . . . . . . . . . 261 02/18/22 20,702 (174,753)IBEX 35 Index . . . . . . . . . . . . . . . . . . . . . . . . . . . . . . . . . . . . . . . . . . . . . . . . . . . . . . . . . . . . 140 02/18/22 13,583 (255,021)Brent Crude Oil (a) . . . . . . . . . . . . . . . . . . . . . . . . . . . . . . . . . . . . . . . . . . . . . . . . . . . . . . . . . . 140 02/28/22 12,496 252,474RBOB Gasoline (a) . . . . . . . . . . . . . . . . . . . . . . . . . . . . . . . . . . . . . . . . . . . . . . . . . . . . . . . . . 95 02/28/22 10,192 466,513Euro-Bund . . . . . . . . . . . . . . . . . . . . . . . . . . . . . . . . . . . . . . . . . . . . . . . . . . . . . . . . . . . . . . 586 03/08/22 111,332 (2,511,752)TOPIX Index . . . . . . . . . . . . . . . . . . . . . . . . . . . . . . . . . . . . . . . . . . . . . . . . . . . . . . . . . . . . . 46 03/10/22 7,666 (357,957)Australia 10 Year Bond . . . . . . . . . . . . . . . . . . . . . . . . . . . . . . . . . . . . . . . . . . . . . . . . . . . . . . 1,391 03/15/22 134,756 (1,944,043)DAX Index . . . . . . . . . . . . . . . . . . . . . . . . . . . . . . . . . . . . . . . . . . . . . . . . . . . . . . . . . . . . . . 11 03/18/22 4,804 (81,385)FTSE/MIB Index . . . . . . . . . . . . . . . . . . . . . . . . . . . . . . . . . . . . . . . . . . . . . . . . . . . . . . . . . . 88 03/18/22 13,356 94,310MSCI Hong Kong Equity Index . . . . . . . . . . . . . . . . . . . . . . . . . . . . . . . . . . . . . . . . . . . . . . . . . 172 03/18/22 12,238 203,574Canada 10 Year Bond . . . . . . . . . . . . . . . . . . . . . . . . . . . . . . . . . . . . . . . . . . . . . . . . . . . . . . 384 03/22/22 42,021 (271,166)Silver (a) . . . . . . . . . . . . . . . . . . . . . . . . . . . . . . . . . . . . . . . . . . . . . . . . . . . . . . . . . . . . . . . . 106 03/29/22 11,868 (680,903)
(5,342,548)
Short ContractsOMXS30 Index . . . . . . . . . . . . . . . . . . . . . . . . . . . . . . . . . . . . . . . . . . . . . . . . . . . . . . . . . . . 645 02/18/22 16,027 62,652WTI Crude Oil (a). . . . . . . . . . . . . . . . . . . . . . . . . . . . . . . . . . . . . . . . . . . . . . . . . . . . . . . . . . . 53 02/22/22 4,672 (418,445)Natural Gas (a) . . . . . . . . . . . . . . . . . . . . . . . . . . . . . . . . . . . . . . . . . . . . . . . . . . . . . . . . . . . . 205 02/24/22 9,992 (2,181,860)SGX NIFTY 50 Index . . . . . . . . . . . . . . . . . . . . . . . . . . . . . . . . . . . . . . . . . . . . . . . . . . . . . . . 478 02/24/22 16,745 (271,419)FTSE China A50 Index . . . . . . . . . . . . . . . . . . . . . . . . . . . . . . . . . . . . . . . . . . . . . . . . . . . . . . 179 02/25/22 2,674 26,171Low Sulphur Gasoil (a) . . . . . . . . . . . . . . . . . . . . . . . . . . . . . . . . . . . . . . . . . . . . . . . . . . . . . . . 18 03/10/22 1,409 (19,396)S&P/TSX 60 Index . . . . . . . . . . . . . . . . . . . . . . . . . . . . . . . . . . . . . . . . . . . . . . . . . . . . . . . . . 36 03/17/22 7,233 (137,506)SPI 200 Index . . . . . . . . . . . . . . . . . . . . . . . . . . . . . . . . . . . . . . . . . . . . . . . . . . . . . . . . . . . . 32 03/17/22 3,901 218,153FTSE 100 Index . . . . . . . . . . . . . . . . . . . . . . . . . . . . . . . . . . . . . . . . . . . . . . . . . . . . . . . . . . 106 03/18/22 10,624 23,822S&P 500 E-Mini Index . . . . . . . . . . . . . . . . . . . . . . . . . . . . . . . . . . . . . . . . . . . . . . . . . . . . . . 44 03/18/22 9,909 290,278U.S. Treasury 10 Year Note . . . . . . . . . . . . . . . . . . . . . . . . . . . . . . . . . . . . . . . . . . . . . . . . . . . 590 03/22/22 75,520 904,772Long Gilt . . . . . . . . . . . . . . . . . . . . . . . . . . . . . . . . . . . . . . . . . . . . . . . . . . . . . . . . . . . . . . . 350 03/29/22 57,408 882,650100 oz Gold (a) . . . . . . . . . . . . . . . . . . . . . . . . . . . . . . . . . . . . . . . . . . . . . . . . . . . . . . . . . . . . 14 04/27/22 2,515 63,794
(556,334)
$ (5,898,882)
(a) All or a portion of the security is held by a wholly-owned subsidiary. See Note 1 of the Notes to Consolidated Financial Statements for details on the wholly-owned subsidiary.
Forward Foreign Currency Exchange Contracts
CurrencyPurchased
CurrencySold Counterparty
SettlementDate
UnrealizedAppreciation
(Depreciation)
AUD 1,505,000 USD 1,063,283 Barclays Bank plc 02/02/22 $ 827AUD 1,505,000 USD 1,063,734 Goldman Sachs International 02/02/22 376AUD 1,505,000 USD 1,063,900 Toronto Dominion Bank 02/02/22 210AUD 1,498,350 USD 1,058,697 Westpac Banking Corp. 02/02/22 711CAD 910,000 USD 714,172 Barclays Bank plc 02/02/22 1,715CAD 910,000 USD 714,342 Goldman Sachs International 02/02/22 1,545CAD 910,000 USD 714,292 Toronto Dominion Bank 02/02/22 1,595CAD 911,080 USD 715,133 Westpac Banking Corp. 02/02/22 1,604EUR 1,495,000 USD 1,671,111 Barclays Bank plc 02/02/22 8,447EUR 1,495,000 USD 1,673,503 Goldman Sachs International 02/02/22 6,055EUR 1,495,000 USD 1,673,952 Toronto Dominion Bank 02/02/22 5,606EUR 1,500,874 USD 1,679,628 Westpac Banking Corp. 02/02/22 6,529GBP 355,000 USD 476,694 Barclays Bank plc 02/02/22 746GBP 355,000 USD 477,227 Goldman Sachs International 02/02/22 213GBP 355,000 USD 477,074 Toronto Dominion Bank 02/02/22 366GBP 348,499 USD 468,086 Westpac Banking Corp. 02/02/22 610USD 2,463,946 AUD 3,395,000 Barclays Bank plc 02/02/22 63,511
BNM0322U-2100207-6479109
2 0 2 2 B L A C K R O C K S E M I - A N N U A L R E P O R T T O S H A R E H O L D E R S
BlackRock Total Factor Fund
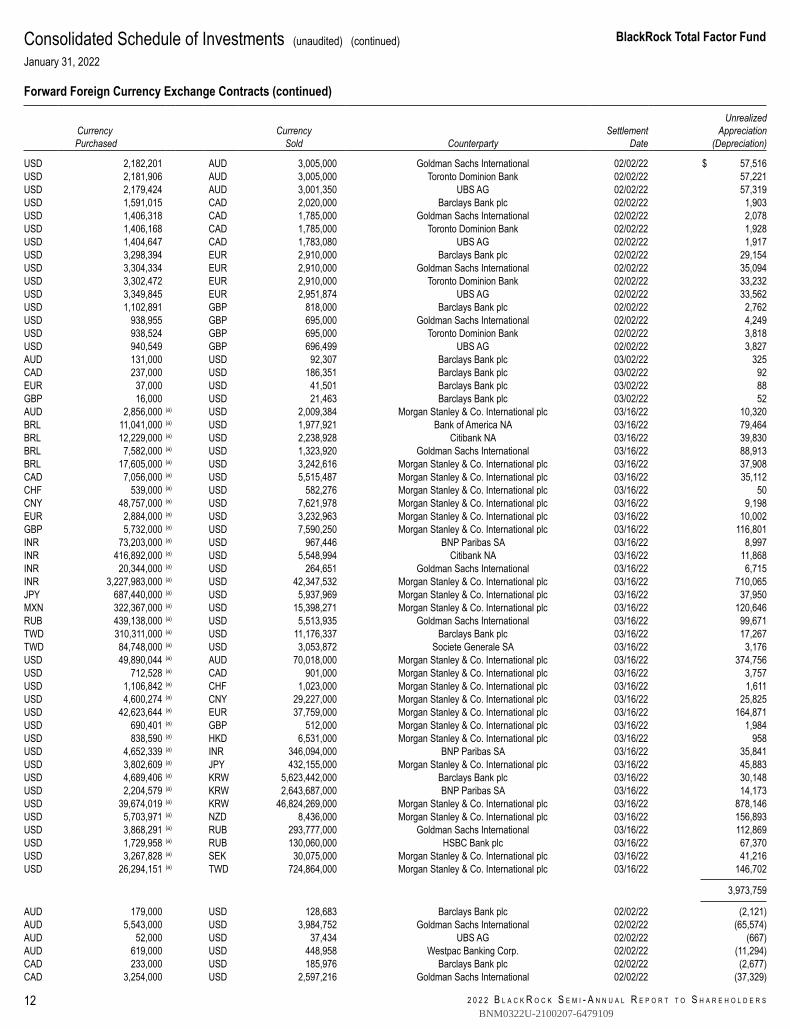
12
Consolidated Schedule of Investments (unaudited) (continued)January 31, 2022
Forward Foreign Currency Exchange Contracts (continued)
CurrencyPurchased
CurrencySold Counterparty
SettlementDate
UnrealizedAppreciation
(Depreciation)
USD 2,182,201 AUD 3,005,000 Goldman Sachs International 02/02/22 $ 57,516USD 2,181,906 AUD 3,005,000 Toronto Dominion Bank 02/02/22 57,221USD 2,179,424 AUD 3,001,350 UBS AG 02/02/22 57,319USD 1,591,015 CAD 2,020,000 Barclays Bank plc 02/02/22 1,903USD 1,406,318 CAD 1,785,000 Goldman Sachs International 02/02/22 2,078USD 1,406,168 CAD 1,785,000 Toronto Dominion Bank 02/02/22 1,928USD 1,404,647 CAD 1,783,080 UBS AG 02/02/22 1,917USD 3,298,394 EUR 2,910,000 Barclays Bank plc 02/02/22 29,154USD 3,304,334 EUR 2,910,000 Goldman Sachs International 02/02/22 35,094USD 3,302,472 EUR 2,910,000 Toronto Dominion Bank 02/02/22 33,232USD 3,349,845 EUR 2,951,874 UBS AG 02/02/22 33,562USD 1,102,891 GBP 818,000 Barclays Bank plc 02/02/22 2,762USD 938,955 GBP 695,000 Goldman Sachs International 02/02/22 4,249USD 938,524 GBP 695,000 Toronto Dominion Bank 02/02/22 3,818USD 940,549 GBP 696,499 UBS AG 02/02/22 3,827AUD 131,000 USD 92,307 Barclays Bank plc 03/02/22 325CAD 237,000 USD 186,351 Barclays Bank plc 03/02/22 92EUR 37,000 USD 41,501 Barclays Bank plc 03/02/22 88GBP 16,000 USD 21,463 Barclays Bank plc 03/02/22 52AUD 2,856,000 (a) USD 2,009,384 Morgan Stanley & Co. International plc 03/16/22 10,320BRL 11,041,000 (a) USD 1,977,921 Bank of America NA 03/16/22 79,464BRL 12,229,000 (a) USD 2,238,928 Citibank NA 03/16/22 39,830BRL 7,582,000 (a) USD 1,323,920 Goldman Sachs International 03/16/22 88,913BRL 17,605,000 (a) USD 3,242,616 Morgan Stanley & Co. International plc 03/16/22 37,908CAD 7,056,000 (a) USD 5,515,487 Morgan Stanley & Co. International plc 03/16/22 35,112CHF 539,000 (a) USD 582,276 Morgan Stanley & Co. International plc 03/16/22 50CNY 48,757,000 (a) USD 7,621,978 Morgan Stanley & Co. International plc 03/16/22 9,198EUR 2,884,000 (a) USD 3,232,963 Morgan Stanley & Co. International plc 03/16/22 10,002GBP 5,732,000 (a) USD 7,590,250 Morgan Stanley & Co. International plc 03/16/22 116,801INR 73,203,000 (a) USD 967,446 BNP Paribas SA 03/16/22 8,997INR 416,892,000 (a) USD 5,548,994 Citibank NA 03/16/22 11,868INR 20,344,000 (a) USD 264,651 Goldman Sachs International 03/16/22 6,715INR 3,227,983,000 (a) USD 42,347,532 Morgan Stanley & Co. International plc 03/16/22 710,065JPY 687,440,000 (a) USD 5,937,969 Morgan Stanley & Co. International plc 03/16/22 37,950MXN 322,367,000 (a) USD 15,398,271 Morgan Stanley & Co. International plc 03/16/22 120,646RUB 439,138,000 (a) USD 5,513,935 Goldman Sachs International 03/16/22 99,671TWD 310,311,000 (a) USD 11,176,337 Barclays Bank plc 03/16/22 17,267TWD 84,748,000 (a) USD 3,053,872 Societe Generale SA 03/16/22 3,176USD 49,890,044 (a) AUD 70,018,000 Morgan Stanley & Co. International plc 03/16/22 374,756USD 712,528 (a) CAD 901,000 Morgan Stanley & Co. International plc 03/16/22 3,757USD 1,106,842 (a) CHF 1,023,000 Morgan Stanley & Co. International plc 03/16/22 1,611USD 4,600,274 (a) CNY 29,227,000 Morgan Stanley & Co. International plc 03/16/22 25,825USD 42,623,644 (a) EUR 37,759,000 Morgan Stanley & Co. International plc 03/16/22 164,871USD 690,401 (a) GBP 512,000 Morgan Stanley & Co. International plc 03/16/22 1,984USD 838,590 (a) HKD 6,531,000 Morgan Stanley & Co. International plc 03/16/22 958USD 4,652,339 (a) INR 346,094,000 BNP Paribas SA 03/16/22 35,841USD 3,802,609 (a) JPY 432,155,000 Morgan Stanley & Co. International plc 03/16/22 45,883USD 4,689,406 (a) KRW 5,623,442,000 Barclays Bank plc 03/16/22 30,148USD 2,204,579 (a) KRW 2,643,687,000 BNP Paribas SA 03/16/22 14,173USD 39,674,019 (a) KRW 46,824,269,000 Morgan Stanley & Co. International plc 03/16/22 878,146USD 5,703,971 (a) NZD 8,436,000 Morgan Stanley & Co. International plc 03/16/22 156,893USD 3,868,291 (a) RUB 293,777,000 Goldman Sachs International 03/16/22 112,869USD 1,729,958 (a) RUB 130,060,000 HSBC Bank plc 03/16/22 67,370USD 3,267,828 (a) SEK 30,075,000 Morgan Stanley & Co. International plc 03/16/22 41,216USD 26,294,151 (a) TWD 724,864,000 Morgan Stanley & Co. International plc 03/16/22 146,702
3,973,759
AUD 179,000 USD 128,683 Barclays Bank plc 02/02/22 (2,121)AUD 5,543,000 USD 3,984,752 Goldman Sachs International 02/02/22 (65,574)AUD 52,000 USD 37,434 UBS AG 02/02/22 (667)AUD 619,000 USD 448,958 Westpac Banking Corp. 02/02/22 (11,294)CAD 233,000 USD 185,976 Barclays Bank plc 02/02/22 (2,677)CAD 3,254,000 USD 2,597,216 Goldman Sachs International 02/02/22 (37,329)
BNM0322U-2100207-6479109
BlackRock Total Factor Fund
C O N S O L I D A T E D S C H E D U L E O F I N V E S T M E N T S 13
Consolidated Schedule of Investments (unaudited) (continued)January 31, 2022
Forward Foreign Currency Exchange Contracts (continued)
CurrencyPurchased
CurrencySold Counterparty
SettlementDate
UnrealizedAppreciation
(Depreciation)
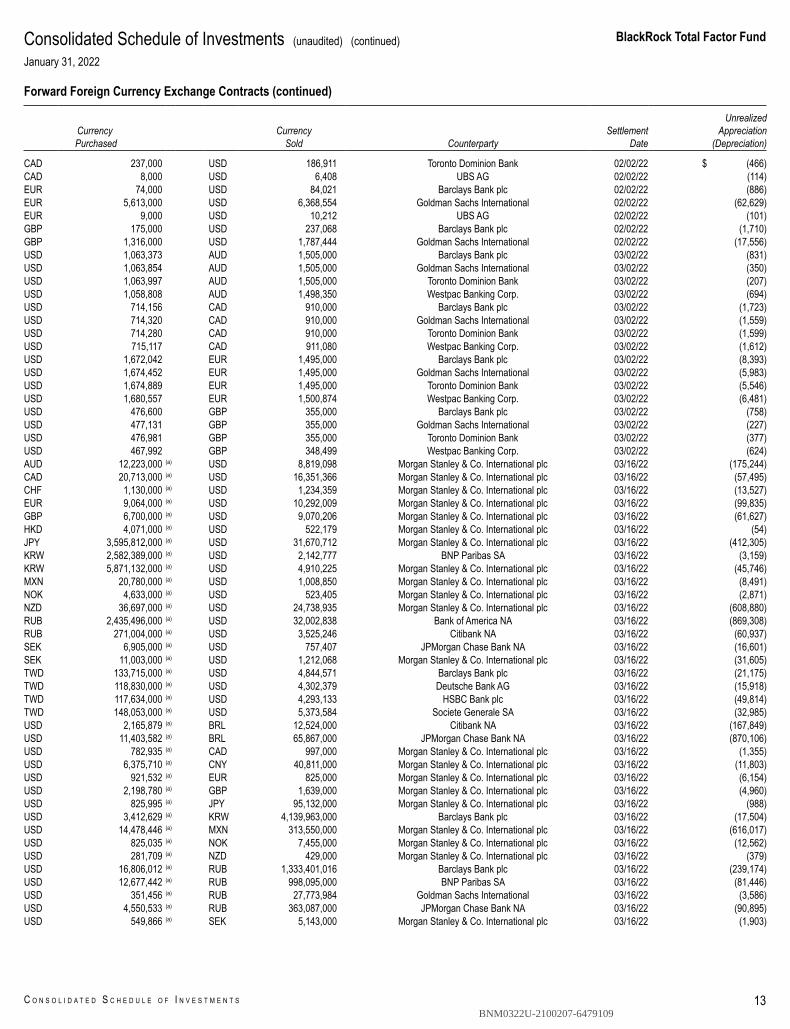
CAD 237,000 USD 186,911 Toronto Dominion Bank 02/02/22 $ (466)CAD 8,000 USD 6,408 UBS AG 02/02/22 (114)EUR 74,000 USD 84,021 Barclays Bank plc 02/02/22 (886)EUR 5,613,000 USD 6,368,554 Goldman Sachs International 02/02/22 (62,629)EUR 9,000 USD 10,212 UBS AG 02/02/22 (101)GBP 175,000 USD 237,068 Barclays Bank plc 02/02/22 (1,710)GBP 1,316,000 USD 1,787,444 Goldman Sachs International 02/02/22 (17,556)USD 1,063,373 AUD 1,505,000 Barclays Bank plc 03/02/22 (831)USD 1,063,854 AUD 1,505,000 Goldman Sachs International 03/02/22 (350)USD 1,063,997 AUD 1,505,000 Toronto Dominion Bank 03/02/22 (207)USD 1,058,808 AUD 1,498,350 Westpac Banking Corp. 03/02/22 (694)USD 714,156 CAD 910,000 Barclays Bank plc 03/02/22 (1,723)USD 714,320 CAD 910,000 Goldman Sachs International 03/02/22 (1,559)USD 714,280 CAD 910,000 Toronto Dominion Bank 03/02/22 (1,599)USD 715,117 CAD 911,080 Westpac Banking Corp. 03/02/22 (1,612)USD 1,672,042 EUR 1,495,000 Barclays Bank plc 03/02/22 (8,393)USD 1,674,452 EUR 1,495,000 Goldman Sachs International 03/02/22 (5,983)USD 1,674,889 EUR 1,495,000 Toronto Dominion Bank 03/02/22 (5,546)USD 1,680,557 EUR 1,500,874 Westpac Banking Corp. 03/02/22 (6,481)USD 476,600 GBP 355,000 Barclays Bank plc 03/02/22 (758)USD 477,131 GBP 355,000 Goldman Sachs International 03/02/22 (227)USD 476,981 GBP 355,000 Toronto Dominion Bank 03/02/22 (377)USD 467,992 GBP 348,499 Westpac Banking Corp. 03/02/22 (624)AUD 12,223,000 (a) USD 8,819,098 Morgan Stanley & Co. International plc 03/16/22 (175,244)CAD 20,713,000 (a) USD 16,351,366 Morgan Stanley & Co. International plc 03/16/22 (57,495)CHF 1,130,000 (a) USD 1,234,359 Morgan Stanley & Co. International plc 03/16/22 (13,527)EUR 9,064,000 (a) USD 10,292,009 Morgan Stanley & Co. International plc 03/16/22 (99,835)GBP 6,700,000 (a) USD 9,070,206 Morgan Stanley & Co. International plc 03/16/22 (61,627)HKD 4,071,000 (a) USD 522,179 Morgan Stanley & Co. International plc 03/16/22 (54)JPY 3,595,812,000 (a) USD 31,670,712 Morgan Stanley & Co. International plc 03/16/22 (412,305)KRW 2,582,389,000 (a) USD 2,142,777 BNP Paribas SA 03/16/22 (3,159)KRW 5,871,132,000 (a) USD 4,910,225 Morgan Stanley & Co. International plc 03/16/22 (45,746)MXN 20,780,000 (a) USD 1,008,850 Morgan Stanley & Co. International plc 03/16/22 (8,491)NOK 4,633,000 (a) USD 523,405 Morgan Stanley & Co. International plc 03/16/22 (2,871)NZD 36,697,000 (a) USD 24,738,935 Morgan Stanley & Co. International plc 03/16/22 (608,880)RUB 2,435,496,000 (a) USD 32,002,838 Bank of America NA 03/16/22 (869,308)RUB 271,004,000 (a) USD 3,525,246 Citibank NA 03/16/22 (60,937)SEK 6,905,000 (a) USD 757,407 JPMorgan Chase Bank NA 03/16/22 (16,601)SEK 11,003,000 (a) USD 1,212,068 Morgan Stanley & Co. International plc 03/16/22 (31,605)TWD 133,715,000 (a) USD 4,844,571 Barclays Bank plc 03/16/22 (21,175)TWD 118,830,000 (a) USD 4,302,379 Deutsche Bank AG 03/16/22 (15,918)TWD 117,634,000 (a) USD 4,293,133 HSBC Bank plc 03/16/22 (49,814)TWD 148,053,000 (a) USD 5,373,584 Societe Generale SA 03/16/22 (32,985)USD 2,165,879 (a) BRL 12,524,000 Citibank NA 03/16/22 (167,849)USD 11,403,582 (a) BRL 65,867,000 JPMorgan Chase Bank NA 03/16/22 (870,106)USD 782,935 (a) CAD 997,000 Morgan Stanley & Co. International plc 03/16/22 (1,355)USD 6,375,710 (a) CNY 40,811,000 Morgan Stanley & Co. International plc 03/16/22 (11,803)USD 921,532 (a) EUR 825,000 Morgan Stanley & Co. International plc 03/16/22 (6,154)USD 2,198,780 (a) GBP 1,639,000 Morgan Stanley & Co. International plc 03/16/22 (4,960)USD 825,995 (a) JPY 95,132,000 Morgan Stanley & Co. International plc 03/16/22 (988)USD 3,412,629 (a) KRW 4,139,963,000 Barclays Bank plc 03/16/22 (17,504)USD 14,478,446 (a) MXN 313,550,000 Morgan Stanley & Co. International plc 03/16/22 (616,017)USD 825,035 (a) NOK 7,455,000 Morgan Stanley & Co. International plc 03/16/22 (12,562)USD 281,709 (a) NZD 429,000 Morgan Stanley & Co. International plc 03/16/22 (379)USD 16,806,012 (a) RUB 1,333,401,016 Barclays Bank plc 03/16/22 (239,174)USD 12,677,442 (a) RUB 998,095,000 BNP Paribas SA 03/16/22 (81,446)USD 351,456 (a) RUB 27,773,984 Goldman Sachs International 03/16/22 (3,586)USD 4,550,533 (a) RUB 363,087,000 JPMorgan Chase Bank NA 03/16/22 (90,895)USD 549,866 (a) SEK 5,143,000 Morgan Stanley & Co. International plc 03/16/22 (1,903)
BNM0322U-2100207-6479109
2 0 2 2 B L A C K R O C K S E M I - A N N U A L R E P O R T T O S H A R E H O L D E R S
BlackRock Total Factor Fund
14
Consolidated Schedule of Investments (unaudited) (continued)January 31, 2022
Forward Foreign Currency Exchange Contracts (continued)
CurrencyPurchased
CurrencySold Counterparty
SettlementDate
UnrealizedAppreciation
(Depreciation)
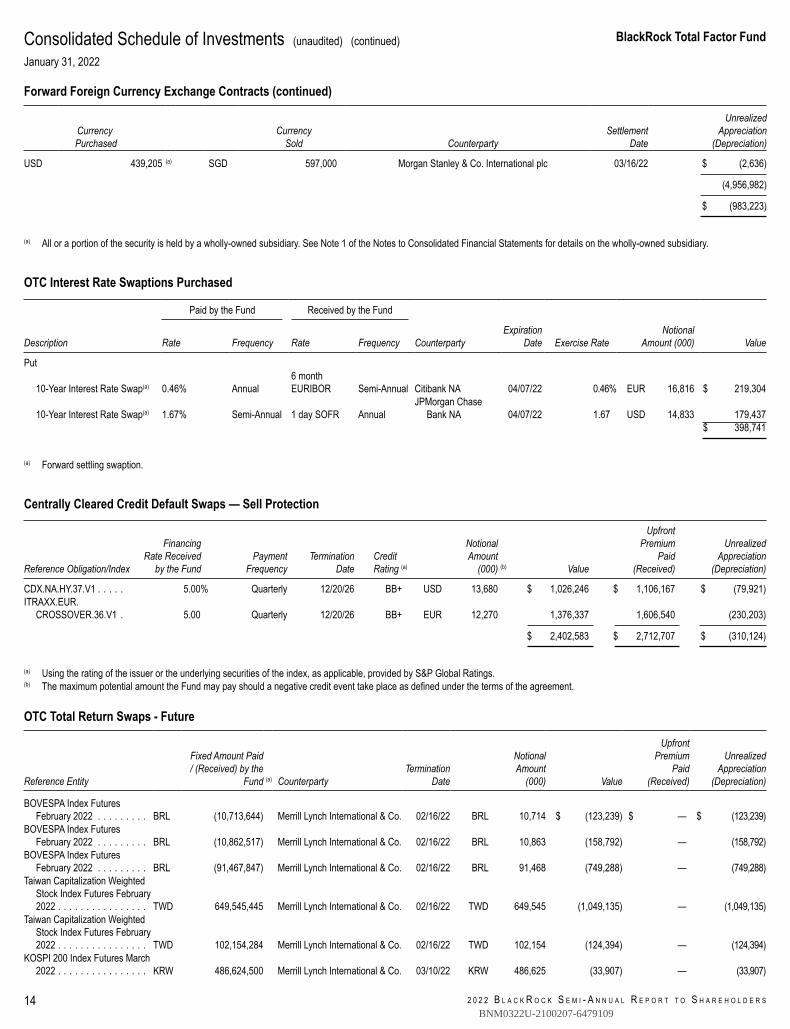
USD 439,205 (a) SGD 597,000 Morgan Stanley & Co. International plc 03/16/22 $ (2,636)
(4,956,982)
$ (983,223)
(a) All or a portion of the security is held by a wholly-owned subsidiary. See Note 1 of the Notes to Consolidated Financial Statements for details on the wholly-owned subsidiary.
OTC Interest Rate Swaptions Purchased
Paid by the Fund Received by the Fund
Description Rate Frequency Rate Frequency CounterpartyExpiration
Date Exercise RateNotional
Amount (000) Value
Put
10-Year Interest Rate Swap(a) 0.46% Annual6 monthEURIBOR Semi-Annual Citibank NA 04/07/22 0.46% EUR 16,816 $ 219,304
10-Year Interest Rate Swap(a) 1.67% Semi-Annual 1 day SOFR AnnualJPMorgan Chase
Bank NA 04/07/22 1.67 USD 14,833 179,437$ 398,741
(a) Forward settling swaption.
Centrally Cleared Credit Default Swaps — Sell Protection
Reference Obligation/Index
FinancingRate Received
by the FundPayment
FrequencyTermination
DateCreditRating (a)
NotionalAmount
(000) (b) Value
UpfrontPremium
Paid(Received)
UnrealizedAppreciation
(Depreciation)
CDX.NA.HY.37.V1 . . . . . 5.00% Quarterly 12/20/26 BB+ USD 13,680 $ 1,026,246 $ 1,106,167 $ (79,921)ITRAXX.EUR.
CROSSOVER.36.V1 . 5.00 Quarterly 12/20/26 BB+ EUR 12,270 1,376,337 1,606,540 (230,203)
$ 2,402,583 $ 2,712,707 $ (310,124)
(a) Using the rating of the issuer or the underlying securities of the index, as applicable, provided by S&P Global Ratings.(b) The maximum potential amount the Fund may pay should a negative credit event take place as defined under the terms of the agreement.
OTC Total Return Swaps - Future
Reference Entity
Fixed Amount Paid/ (Received) by the
Fund (a) CounterpartyTermination
Date
NotionalAmount
(000) Value
UpfrontPremium
Paid(Received)
UnrealizedAppreciation
(Depreciation)
BOVESPA Index FuturesFebruary 2022 . . . . . . . . . BRL (10,713,644) Merrill Lynch International & Co. 02/16/22 BRL 10,714 $ (123,239) $ — $ (123,239)
BOVESPA Index FuturesFebruary 2022 . . . . . . . . . BRL (10,862,517) Merrill Lynch International & Co. 02/16/22 BRL 10,863 (158,792) — (158,792)
BOVESPA Index FuturesFebruary 2022 . . . . . . . . . BRL (91,467,847) Merrill Lynch International & Co. 02/16/22 BRL 91,468 (749,288) — (749,288)
Taiwan Capitalization WeightedStock Index Futures February2022 . . . . . . . . . . . . . . . . TWD 649,545,445 Merrill Lynch International & Co. 02/16/22 TWD 649,545 (1,049,135) — (1,049,135)
Taiwan Capitalization WeightedStock Index Futures February2022 . . . . . . . . . . . . . . . . TWD 102,154,284 Merrill Lynch International & Co. 02/16/22 TWD 102,154 (124,394) — (124,394)
KOSPI 200 Index Futures March2022 . . . . . . . . . . . . . . . . KRW 486,624,500 Merrill Lynch International & Co. 03/10/22 KRW 486,625 (33,907) — (33,907)
BNM0322U-2100207-6479109
BlackRock Total Factor Fund
C O N S O L I D A T E D S C H E D U L E O F I N V E S T M E N T S 15
Consolidated Schedule of Investments (unaudited) (continued)January 31, 2022
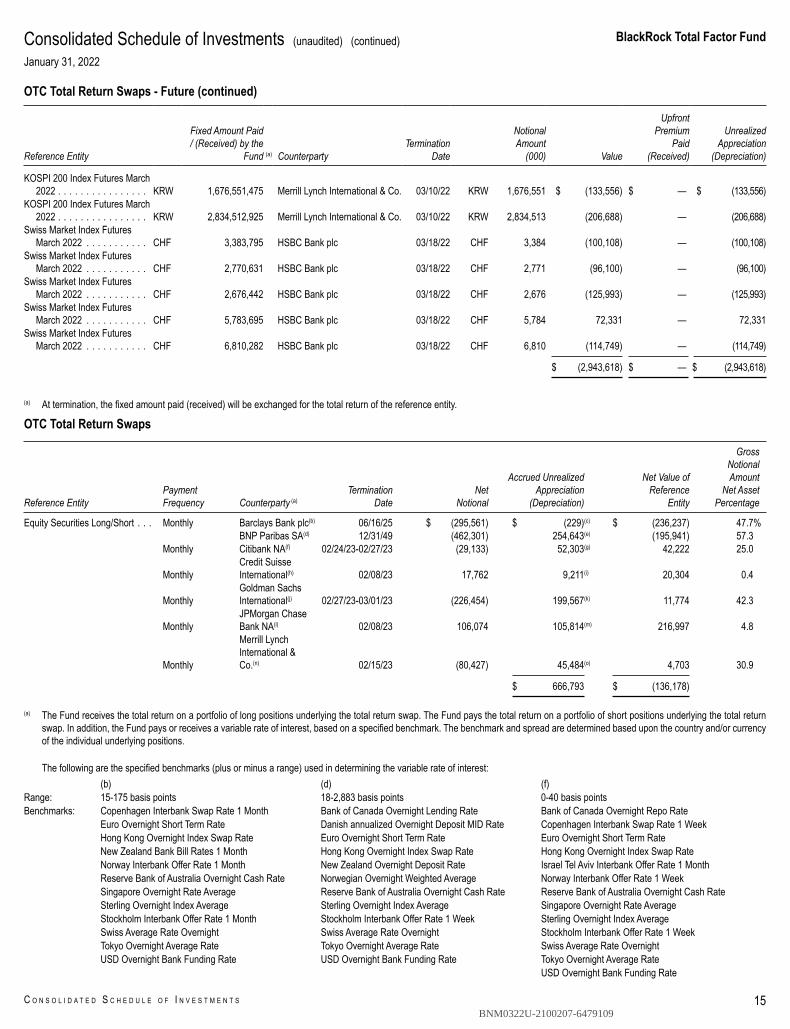
OTC Total Return Swaps - Future (continued)
Reference Entity
Fixed Amount Paid/ (Received) by the
Fund (a) CounterpartyTermination
Date
NotionalAmount
(000) Value
UpfrontPremium
Paid(Received)
UnrealizedAppreciation
(Depreciation)
KOSPI 200 Index Futures March2022 . . . . . . . . . . . . . . . . KRW 1,676,551,475 Merrill Lynch International & Co. 03/10/22 KRW 1,676,551 $ (133,556) $ — $ (133,556)
KOSPI 200 Index Futures March2022 . . . . . . . . . . . . . . . . KRW 2,834,512,925 Merrill Lynch International & Co. 03/10/22 KRW 2,834,513 (206,688) — (206,688)
Swiss Market Index FuturesMarch 2022 . . . . . . . . . . . CHF 3,383,795 HSBC Bank plc 03/18/22 CHF 3,384 (100,108) — (100,108)
Swiss Market Index FuturesMarch 2022 . . . . . . . . . . . CHF 2,770,631 HSBC Bank plc 03/18/22 CHF 2,771 (96,100) — (96,100)
Swiss Market Index FuturesMarch 2022 . . . . . . . . . . . CHF 2,676,442 HSBC Bank plc 03/18/22 CHF 2,676 (125,993) — (125,993)
Swiss Market Index FuturesMarch 2022 . . . . . . . . . . . CHF 5,783,695 HSBC Bank plc 03/18/22 CHF 5,784 72,331 — 72,331
Swiss Market Index FuturesMarch 2022 . . . . . . . . . . . CHF 6,810,282 HSBC Bank plc 03/18/22 CHF 6,810 (114,749) — (114,749)
$ (2,943,618) $ — $ (2,943,618)
(a) At termination, the fixed amount paid (received) will be exchanged for the total return of the reference entity.
OTC Total Return Swaps
Reference EntityPaymentFrequency Counterparty (a)
TerminationDate
NetNotional
Accrued UnrealizedAppreciation
(Depreciation)
Net Value ofReference
Entity
GrossNotionalAmount
Net AssetPercentage
Equity Securities Long/Short . . . Monthly Barclays Bank plc(b) 06/16/25 $ (295,561) $ (229)(c) $ (236,237) 47.7%BNP Paribas SA(d) 12/31/49 (462,301) 254,643(e) (195,941) 57.3
Monthly Citibank NA(f) 02/24/23-02/27/23 (29,133) 52,303(g) 42,222 25.0
MonthlyCredit SuisseInternational(h) 02/08/23 17,762 9,211(i) 20,304 0.4
MonthlyGoldman SachsInternational(j) 02/27/23-03/01/23 (226,454) 199,567(k) 11,774 42.3
MonthlyJPMorgan ChaseBank NA(l) 02/08/23 106,074 105,814(m) 216,997 4.8
Monthly
Merrill LynchInternational &Co.(n) 02/15/23 (80,427) 45,484(o) 4,703 30.9
$ 666,793 $ (136,178)
(a) The Fund receives the total return on a portfolio of long positions underlying the total return swap. The Fund pays the total return on a portfolio of short positions underlying the total returnswap. In addition, the Fund pays or receives a variable rate of interest, based on a specified benchmark. The benchmark and spread are determined based upon the country and/or currencyof the individual underlying positions.
The following are the specified benchmarks (plus or minus a range) used in determining the variable rate of interest:(b) (d) (f)
Range: 15-175 basis points 18-2,883 basis points 0-40 basis pointsBenchmarks: Copenhagen Interbank Swap Rate 1 Month Bank of Canada Overnight Lending Rate Bank of Canada Overnight Repo Rate
Euro Overnight Short Term Rate Danish annualized Overnight Deposit MID Rate Copenhagen Interbank Swap Rate 1 WeekHong Kong Overnight Index Swap Rate Euro Overnight Short Term Rate Euro Overnight Short Term RateNew Zealand Bank Bill Rates 1 Month Hong Kong Overnight Index Swap Rate Hong Kong Overnight Index Swap RateNorway Interbank Offer Rate 1 Month New Zealand Overnight Deposit Rate Israel Tel Aviv Interbank Offer Rate 1 MonthReserve Bank of Australia Overnight Cash Rate Norwegian Overnight Weighted Average Norway Interbank Offer Rate 1 WeekSingapore Overnight Rate Average Reserve Bank of Australia Overnight Cash Rate Reserve Bank of Australia Overnight Cash RateSterling Overnight Index Average Sterling Overnight Index Average Singapore Overnight Rate AverageStockholm Interbank Offer Rate 1 Month Stockholm Interbank Offer Rate 1 Week Sterling Overnight Index AverageSwiss Average Rate Overnight Swiss Average Rate Overnight Stockholm Interbank Offer Rate 1 WeekTokyo Overnight Average Rate Tokyo Overnight Average Rate Swiss Average Rate OvernightUSD Overnight Bank Funding Rate USD Overnight Bank Funding Rate Tokyo Overnight Average Rate
USD Overnight Bank Funding Rate
BNM0322U-2100207-6479109
2 0 2 2 B L A C K R O C K S E M I - A N N U A L R E P O R T T O S H A R E H O L D E R S
BlackRock Total Factor Fund
16
Consolidated Schedule of Investments (unaudited) (continued)January 31, 2022
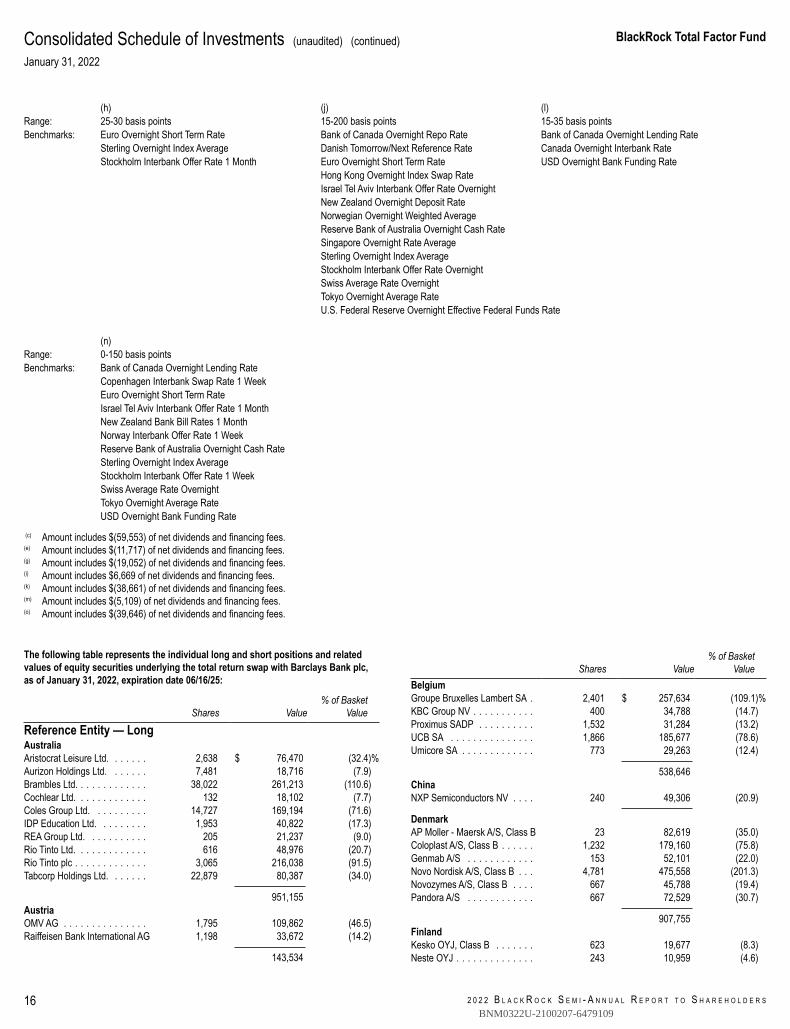
(h) (j) (l)Range: 25-30 basis points 15-200 basis points 15-35 basis pointsBenchmarks: Euro Overnight Short Term Rate Bank of Canada Overnight Repo Rate Bank of Canada Overnight Lending Rate
Sterling Overnight Index Average Danish Tomorrow/Next Reference Rate Canada Overnight Interbank RateStockholm Interbank Offer Rate 1 Month Euro Overnight Short Term Rate USD Overnight Bank Funding Rate
Hong Kong Overnight Index Swap RateIsrael Tel Aviv Interbank Offer Rate OvernightNew Zealand Overnight Deposit RateNorwegian Overnight Weighted AverageReserve Bank of Australia Overnight Cash RateSingapore Overnight Rate AverageSterling Overnight Index AverageStockholm Interbank Offer Rate OvernightSwiss Average Rate OvernightTokyo Overnight Average RateU.S. Federal Reserve Overnight Effective Federal Funds Rate
(n)Range: 0-150 basis pointsBenchmarks: Bank of Canada Overnight Lending Rate
Copenhagen Interbank Swap Rate 1 WeekEuro Overnight Short Term RateIsrael Tel Aviv Interbank Offer Rate 1 MonthNew Zealand Bank Bill Rates 1 MonthNorway Interbank Offer Rate 1 WeekReserve Bank of Australia Overnight Cash RateSterling Overnight Index AverageStockholm Interbank Offer Rate 1 WeekSwiss Average Rate OvernightTokyo Overnight Average RateUSD Overnight Bank Funding Rate
(c) Amount includes $(59,553) of net dividends and financing fees.(e) Amount includes $(11,717) of net dividends and financing fees.(g) Amount includes $(19,052) of net dividends and financing fees.(i) Amount includes $6,669 of net dividends and financing fees.(k) Amount includes $(38,661) of net dividends and financing fees.(m) Amount includes $(5,109) of net dividends and financing fees.(o) Amount includes $(39,646) of net dividends and financing fees.
The following table represents the individual long and short positions and relatedvalues of equity securities underlying the total return swap with Barclays Bank plc,as of January 31, 2022, expiration date 06/16/25:
Shares Value% of Basket
Value
Reference Entity — LongAustraliaAristocrat Leisure Ltd. . . . . . . 2,638 $ 76,470 (32.4)%Aurizon Holdings Ltd. . . . . . . 7,481 18,716 (7.9)Brambles Ltd. . . . . . . . . . . . . 38,022 261,213 (110.6)Cochlear Ltd. . . . . . . . . . . . . 132 18,102 (7.7)Coles Group Ltd. . . . . . . . . . 14,727 169,194 (71.6)IDP Education Ltd. . . . . . . . . 1,953 40,822 (17.3)REA Group Ltd. . . . . . . . . . . 205 21,237 (9.0)Rio Tinto Ltd. . . . . . . . . . . . . 616 48,976 (20.7)Rio Tinto plc . . . . . . . . . . . . . 3,065 216,038 (91.5)Tabcorp Holdings Ltd. . . . . . . 22,879 80,387 (34.0)
951,155AustriaOMV AG . . . . . . . . . . . . . . . 1,795 109,862 (46.5)Raiffeisen Bank International AG 1,198 33,672 (14.2)
143,534
Shares Value% of Basket
ValueBelgiumGroupe Bruxelles Lambert SA . 2,401 $ 257,634 (109.1)%KBC Group NV . . . . . . . . . . . 400 34,788 (14.7)Proximus SADP . . . . . . . . . . 1,532 31,284 (13.2)UCB SA . . . . . . . . . . . . . . . 1,866 185,677 (78.6)Umicore SA . . . . . . . . . . . . . 773 29,263 (12.4)
538,646ChinaNXP Semiconductors NV . . . . 240 49,306 (20.9)
DenmarkAP Moller - Maersk A/S, Class B 23 82,619 (35.0)Coloplast A/S, Class B . . . . . . 1,232 179,160 (75.8)Genmab A/S . . . . . . . . . . . . 153 52,101 (22.0)Novo Nordisk A/S, Class B . . . 4,781 475,558 (201.3)Novozymes A/S, Class B . . . . 667 45,788 (19.4)Pandora A/S . . . . . . . . . . . . 667 72,529 (30.7)
907,755FinlandKesko OYJ, Class B . . . . . . . 623 19,677 (8.3)Neste OYJ . . . . . . . . . . . . . . 243 10,959 (4.6)
BNM0322U-2100207-6479109
BlackRock Total Factor Fund
C O N S O L I D A T E D S C H E D U L E O F I N V E S T M E N T S 17
Consolidated Schedule of Investments (unaudited) (continued)January 31, 2022
Shares Value% of Basket
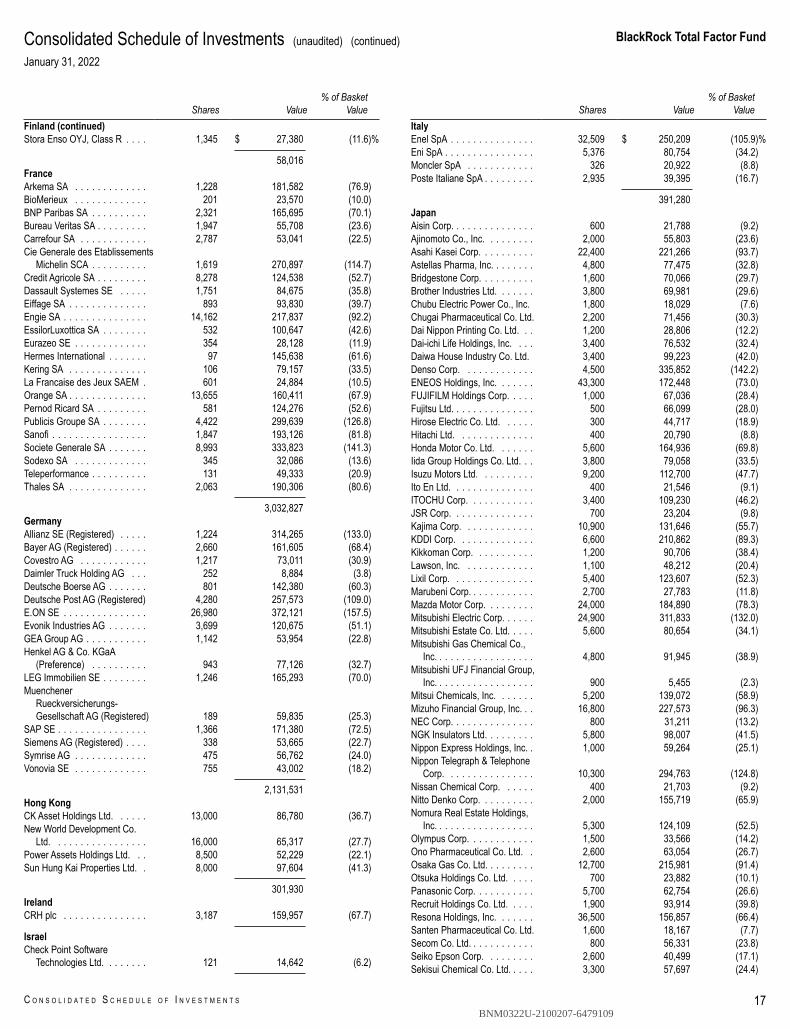
ValueFinland (continued)Stora Enso OYJ, Class R . . . . 1,345 $ 27,380 (11.6)%
58,016FranceArkema SA . . . . . . . . . . . . . 1,228 181,582 (76.9)BioMerieux . . . . . . . . . . . . . 201 23,570 (10.0)BNP Paribas SA . . . . . . . . . . 2,321 165,695 (70.1)Bureau Veritas SA . . . . . . . . . 1,947 55,708 (23.6)Carrefour SA . . . . . . . . . . . . 2,787 53,041 (22.5)Cie Generale des Etablissements
Michelin SCA . . . . . . . . . . 1,619 270,897 (114.7)Credit Agricole SA . . . . . . . . . 8,278 124,538 (52.7)Dassault Systemes SE . . . . . 1,751 84,675 (35.8)Eiffage SA . . . . . . . . . . . . . . 893 93,830 (39.7)Engie SA . . . . . . . . . . . . . . . 14,162 217,837 (92.2)EssilorLuxottica SA . . . . . . . . 532 100,647 (42.6)Eurazeo SE . . . . . . . . . . . . . 354 28,128 (11.9)Hermes International . . . . . . . 97 145,638 (61.6)Kering SA . . . . . . . . . . . . . . 106 79,157 (33.5)La Francaise des Jeux SAEM . 601 24,884 (10.5)Orange SA . . . . . . . . . . . . . . 13,655 160,411 (67.9)Pernod Ricard SA . . . . . . . . . 581 124,276 (52.6)Publicis Groupe SA . . . . . . . . 4,422 299,639 (126.8)Sanofi . . . . . . . . . . . . . . . . . 1,847 193,126 (81.8)Societe Generale SA . . . . . . . 8,993 333,823 (141.3)Sodexo SA . . . . . . . . . . . . . 345 32,086 (13.6)Teleperformance . . . . . . . . . . 131 49,333 (20.9)Thales SA . . . . . . . . . . . . . . 2,063 190,306 (80.6)
3,032,827GermanyAllianz SE (Registered) . . . . . 1,224 314,265 (133.0)Bayer AG (Registered) . . . . . . 2,660 161,605 (68.4)Covestro AG . . . . . . . . . . . . 1,217 73,011 (30.9)Daimler Truck Holding AG . . . 252 8,884 (3.8)Deutsche Boerse AG . . . . . . . 801 142,380 (60.3)Deutsche Post AG (Registered) 4,280 257,573 (109.0)E.ON SE . . . . . . . . . . . . . . . 26,980 372,121 (157.5)Evonik Industries AG . . . . . . . 3,699 120,675 (51.1)GEA Group AG . . . . . . . . . . . 1,142 53,954 (22.8)Henkel AG & Co. KGaA
(Preference) . . . . . . . . . . 943 77,126 (32.7)LEG Immobilien SE . . . . . . . . 1,246 165,293 (70.0)Muenchener
Rueckversicherungs-Gesellschaft AG (Registered) 189 59,835 (25.3)
SAP SE . . . . . . . . . . . . . . . . 1,366 171,380 (72.5)Siemens AG (Registered) . . . . 338 53,665 (22.7)Symrise AG . . . . . . . . . . . . . 475 56,762 (24.0)Vonovia SE . . . . . . . . . . . . . 755 43,002 (18.2)
2,131,531Hong KongCK Asset Holdings Ltd. . . . . . 13,000 86,780 (36.7)New World Development Co.
Ltd. . . . . . . . . . . . . . . . . 16,000 65,317 (27.7)Power Assets Holdings Ltd. . . 8,500 52,229 (22.1)Sun Hung Kai Properties Ltd. . 8,000 97,604 (41.3)
301,930IrelandCRH plc . . . . . . . . . . . . . . . 3,187 159,957 (67.7)
IsraelCheck Point Software
Technologies Ltd. . . . . . . . 121 14,642 (6.2)
Shares Value% of Basket
ValueItalyEnel SpA . . . . . . . . . . . . . . . 32,509 $ 250,209 (105.9)%Eni SpA . . . . . . . . . . . . . . . . 5,376 80,754 (34.2)Moncler SpA . . . . . . . . . . . . 326 20,922 (8.8)Poste Italiane SpA . . . . . . . . . 2,935 39,395 (16.7)
391,280JapanAisin Corp. . . . . . . . . . . . . . . 600 21,788 (9.2)Ajinomoto Co., Inc. . . . . . . . . 2,000 55,803 (23.6)Asahi Kasei Corp. . . . . . . . . . 22,400 221,266 (93.7)Astellas Pharma, Inc. . . . . . . . 4,800 77,475 (32.8)Bridgestone Corp. . . . . . . . . . 1,600 70,066 (29.7)Brother Industries Ltd. . . . . . . 3,800 69,981 (29.6)Chubu Electric Power Co., Inc. 1,800 18,029 (7.6)Chugai Pharmaceutical Co. Ltd. 2,200 71,456 (30.3)Dai Nippon Printing Co. Ltd. . . 1,200 28,806 (12.2)Dai-ichi Life Holdings, Inc. . . . 3,400 76,532 (32.4)Daiwa House Industry Co. Ltd. 3,400 99,223 (42.0)Denso Corp. . . . . . . . . . . . . 4,500 335,852 (142.2)ENEOS Holdings, Inc. . . . . . . 43,300 172,448 (73.0)FUJIFILM Holdings Corp. . . . . 1,000 67,036 (28.4)Fujitsu Ltd. . . . . . . . . . . . . . . 500 66,099 (28.0)Hirose Electric Co. Ltd. . . . . . 300 44,717 (18.9)Hitachi Ltd. . . . . . . . . . . . . . 400 20,790 (8.8)Honda Motor Co. Ltd. . . . . . . 5,600 164,936 (69.8)Iida Group Holdings Co. Ltd. . . 3,800 79,058 (33.5)Isuzu Motors Ltd. . . . . . . . . . 9,200 112,700 (47.7)Ito En Ltd. . . . . . . . . . . . . . . 400 21,546 (9.1)ITOCHU Corp. . . . . . . . . . . . 3,400 109,230 (46.2)JSR Corp. . . . . . . . . . . . . . . 700 23,204 (9.8)Kajima Corp. . . . . . . . . . . . . 10,900 131,646 (55.7)KDDI Corp. . . . . . . . . . . . . . 6,600 210,862 (89.3)Kikkoman Corp. . . . . . . . . . . 1,200 90,706 (38.4)Lawson, Inc. . . . . . . . . . . . . 1,100 48,212 (20.4)Lixil Corp. . . . . . . . . . . . . . . 5,400 123,607 (52.3)Marubeni Corp. . . . . . . . . . . . 2,700 27,783 (11.8)Mazda Motor Corp. . . . . . . . . 24,000 184,890 (78.3)Mitsubishi Electric Corp. . . . . . 24,900 311,833 (132.0)Mitsubishi Estate Co. Ltd. . . . . 5,600 80,654 (34.1)Mitsubishi Gas Chemical Co.,
Inc. . . . . . . . . . . . . . . . . . 4,800 91,945 (38.9)Mitsubishi UFJ Financial Group,
Inc. . . . . . . . . . . . . . . . . . 900 5,455 (2.3)Mitsui Chemicals, Inc. . . . . . . 5,200 139,072 (58.9)Mizuho Financial Group, Inc. . . 16,800 227,573 (96.3)NEC Corp. . . . . . . . . . . . . . . 800 31,211 (13.2)NGK Insulators Ltd. . . . . . . . . 5,800 98,007 (41.5)Nippon Express Holdings, Inc. . 1,000 59,264 (25.1)Nippon Telegraph & Telephone
Corp. . . . . . . . . . . . . . . . 10,300 294,763 (124.8)Nissan Chemical Corp. . . . . . 400 21,703 (9.2)Nitto Denko Corp. . . . . . . . . . 2,000 155,719 (65.9)Nomura Real Estate Holdings,
Inc. . . . . . . . . . . . . . . . . . 5,300 124,109 (52.5)Olympus Corp. . . . . . . . . . . . 1,500 33,566 (14.2)Ono Pharmaceutical Co. Ltd. . 2,600 63,054 (26.7)Osaka Gas Co. Ltd. . . . . . . . . 12,700 215,981 (91.4)Otsuka Holdings Co. Ltd. . . . . 700 23,882 (10.1)Panasonic Corp. . . . . . . . . . . 5,700 62,754 (26.6)Recruit Holdings Co. Ltd. . . . . 1,900 93,914 (39.8)Resona Holdings, Inc. . . . . . . 36,500 156,857 (66.4)Santen Pharmaceutical Co. Ltd. 1,600 18,167 (7.7)Secom Co. Ltd. . . . . . . . . . . . 800 56,331 (23.8)Seiko Epson Corp. . . . . . . . . 2,600 40,499 (17.1)Sekisui Chemical Co. Ltd. . . . . 3,300 57,697 (24.4)
BNM0322U-2100207-6479109
2 0 2 2 B L A C K R O C K S E M I - A N N U A L R E P O R T T O S H A R E H O L D E R S
BlackRock Total Factor Fund
18
Consolidated Schedule of Investments (unaudited) (continued)January 31, 2022
Shares Value% of Basket
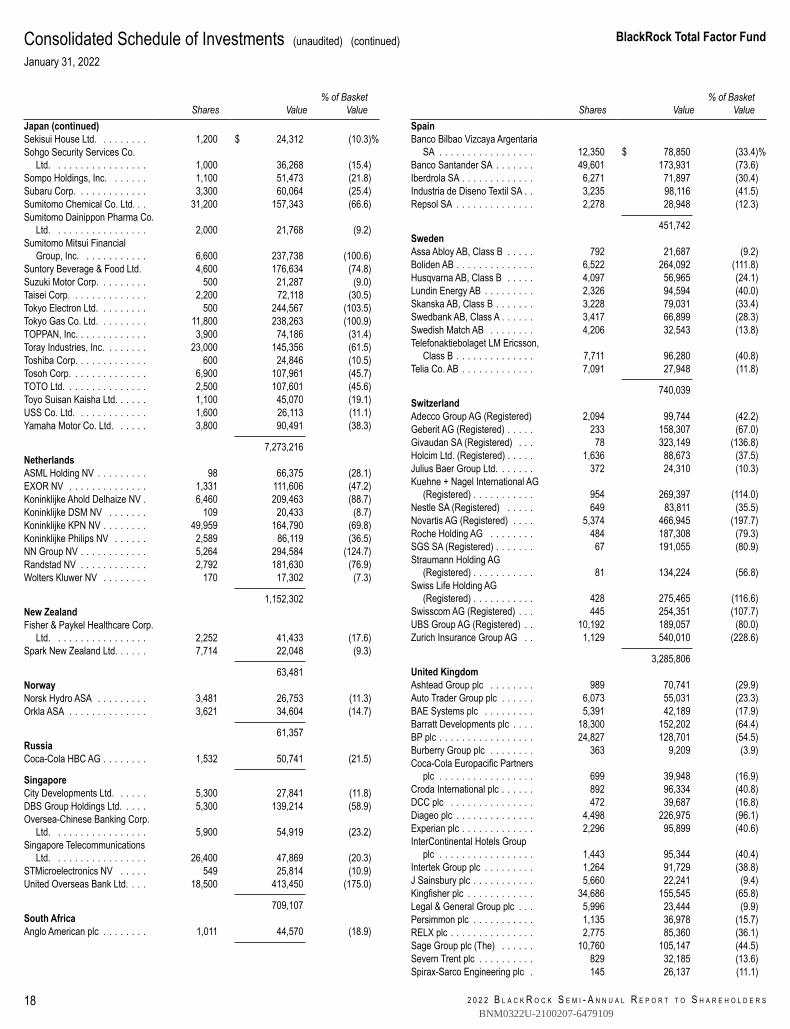
ValueJapan (continued)Sekisui House Ltd. . . . . . . . . 1,200 $ 24,312 (10.3)%Sohgo Security Services Co.
Ltd. . . . . . . . . . . . . . . . . 1,000 36,268 (15.4)Sompo Holdings, Inc. . . . . . . 1,100 51,473 (21.8)Subaru Corp. . . . . . . . . . . . . 3,300 60,064 (25.4)Sumitomo Chemical Co. Ltd. . . 31,200 157,343 (66.6)Sumitomo Dainippon Pharma Co.
Ltd. . . . . . . . . . . . . . . . . 2,000 21,768 (9.2)Sumitomo Mitsui Financial
Group, Inc. . . . . . . . . . . . 6,600 237,738 (100.6)Suntory Beverage & Food Ltd. 4,600 176,634 (74.8)Suzuki Motor Corp. . . . . . . . . 500 21,287 (9.0)Taisei Corp. . . . . . . . . . . . . . 2,200 72,118 (30.5)Tokyo Electron Ltd. . . . . . . . . 500 244,567 (103.5)Tokyo Gas Co. Ltd. . . . . . . . . 11,800 238,263 (100.9)TOPPAN, Inc. . . . . . . . . . . . . 3,900 74,186 (31.4)Toray Industries, Inc. . . . . . . . 23,000 145,356 (61.5)Toshiba Corp. . . . . . . . . . . . . 600 24,846 (10.5)Tosoh Corp. . . . . . . . . . . . . . 6,900 107,961 (45.7)TOTO Ltd. . . . . . . . . . . . . . . 2,500 107,601 (45.6)Toyo Suisan Kaisha Ltd. . . . . . 1,100 45,070 (19.1)USS Co. Ltd. . . . . . . . . . . . . 1,600 26,113 (11.1)Yamaha Motor Co. Ltd. . . . . . 3,800 90,491 (38.3)
7,273,216NetherlandsASML Holding NV . . . . . . . . . 98 66,375 (28.1)EXOR NV . . . . . . . . . . . . . . 1,331 111,606 (47.2)Koninklijke Ahold Delhaize NV . 6,460 209,463 (88.7)Koninklijke DSM NV . . . . . . . 109 20,433 (8.7)Koninklijke KPN NV . . . . . . . . 49,959 164,790 (69.8)Koninklijke Philips NV . . . . . . 2,589 86,119 (36.5)NN Group NV . . . . . . . . . . . . 5,264 294,584 (124.7)Randstad NV . . . . . . . . . . . . 2,792 181,630 (76.9)Wolters Kluwer NV . . . . . . . . 170 17,302 (7.3)
1,152,302New ZealandFisher & Paykel Healthcare Corp.
Ltd. . . . . . . . . . . . . . . . . 2,252 41,433 (17.6)Spark New Zealand Ltd. . . . . . 7,714 22,048 (9.3)
63,481NorwayNorsk Hydro ASA . . . . . . . . . 3,481 26,753 (11.3)Orkla ASA . . . . . . . . . . . . . . 3,621 34,604 (14.7)
61,357RussiaCoca-Cola HBC AG . . . . . . . . 1,532 50,741 (21.5)
SingaporeCity Developments Ltd. . . . . . 5,300 27,841 (11.8)DBS Group Holdings Ltd. . . . . 5,300 139,214 (58.9)Oversea-Chinese Banking Corp.
Ltd. . . . . . . . . . . . . . . . . 5,900 54,919 (23.2)Singapore Telecommunications
Ltd. . . . . . . . . . . . . . . . . 26,400 47,869 (20.3)STMicroelectronics NV . . . . . 549 25,814 (10.9)United Overseas Bank Ltd. . . . 18,500 413,450 (175.0)
709,107South AfricaAnglo American plc . . . . . . . . 1,011 44,570 (18.9)
Shares Value% of Basket
ValueSpainBanco Bilbao Vizcaya Argentaria
SA . . . . . . . . . . . . . . . . . 12,350 $ 78,850 (33.4)%Banco Santander SA . . . . . . . 49,601 173,931 (73.6)Iberdrola SA . . . . . . . . . . . . . 6,271 71,897 (30.4)Industria de Diseno Textil SA . . 3,235 98,116 (41.5)Repsol SA . . . . . . . . . . . . . . 2,278 28,948 (12.3)
451,742SwedenAssa Abloy AB, Class B . . . . . 792 21,687 (9.2)Boliden AB . . . . . . . . . . . . . . 6,522 264,092 (111.8)Husqvarna AB, Class B . . . . . 4,097 56,965 (24.1)Lundin Energy AB . . . . . . . . . 2,326 94,594 (40.0)Skanska AB, Class B . . . . . . . 3,228 79,031 (33.4)Swedbank AB, Class A . . . . . . 3,417 66,899 (28.3)Swedish Match AB . . . . . . . . 4,206 32,543 (13.8)Telefonaktiebolaget LM Ericsson,
Class B . . . . . . . . . . . . . . 7,711 96,280 (40.8)Telia Co. AB . . . . . . . . . . . . . 7,091 27,948 (11.8)
740,039SwitzerlandAdecco Group AG (Registered) 2,094 99,744 (42.2)Geberit AG (Registered) . . . . . 233 158,307 (67.0)Givaudan SA (Registered) . . . 78 323,149 (136.8)Holcim Ltd. (Registered) . . . . . 1,636 88,673 (37.5)Julius Baer Group Ltd. . . . . . . 372 24,310 (10.3)Kuehne + Nagel International AG
(Registered) . . . . . . . . . . . 954 269,397 (114.0)Nestle SA (Registered) . . . . . 649 83,811 (35.5)Novartis AG (Registered) . . . . 5,374 466,945 (197.7)Roche Holding AG . . . . . . . . 484 187,308 (79.3)SGS SA (Registered) . . . . . . . 67 191,055 (80.9)Straumann Holding AG
(Registered) . . . . . . . . . . . 81 134,224 (56.8)Swiss Life Holding AG
(Registered) . . . . . . . . . . . 428 275,465 (116.6)Swisscom AG (Registered) . . . 445 254,351 (107.7)UBS Group AG (Registered) . . 10,192 189,057 (80.0)Zurich Insurance Group AG . . 1,129 540,010 (228.6)
3,285,806United KingdomAshtead Group plc . . . . . . . . 989 70,741 (29.9)Auto Trader Group plc . . . . . . 6,073 55,031 (23.3)BAE Systems plc . . . . . . . . . 5,391 42,189 (17.9)Barratt Developments plc . . . . 18,300 152,202 (64.4)BP plc . . . . . . . . . . . . . . . . . 24,827 128,701 (54.5)Burberry Group plc . . . . . . . . 363 9,209 (3.9)Coca-Cola Europacific Partners
plc . . . . . . . . . . . . . . . . . 699 39,948 (16.9)Croda International plc . . . . . . 892 96,334 (40.8)DCC plc . . . . . . . . . . . . . . . 472 39,687 (16.8)Diageo plc . . . . . . . . . . . . . . 4,498 226,975 (96.1)Experian plc . . . . . . . . . . . . . 2,296 95,899 (40.6)InterContinental Hotels Group
plc . . . . . . . . . . . . . . . . . 1,443 95,344 (40.4)Intertek Group plc . . . . . . . . . 1,264 91,729 (38.8)J Sainsbury plc . . . . . . . . . . . 5,660 22,241 (9.4)Kingfisher plc . . . . . . . . . . . . 34,686 155,545 (65.8)Legal & General Group plc . . . 5,996 23,444 (9.9)Persimmon plc . . . . . . . . . . . 1,135 36,978 (15.7)RELX plc . . . . . . . . . . . . . . . 2,775 85,360 (36.1)Sage Group plc (The) . . . . . . 10,760 105,147 (44.5)Severn Trent plc . . . . . . . . . . 829 32,185 (13.6)Spirax-Sarco Engineering plc . 145 26,137 (11.1)
BNM0322U-2100207-6479109
BlackRock Total Factor Fund
C O N S O L I D A T E D S C H E D U L E O F I N V E S T M E N T S 19
Consolidated Schedule of Investments (unaudited) (continued)January 31, 2022
Shares Value% of Basket
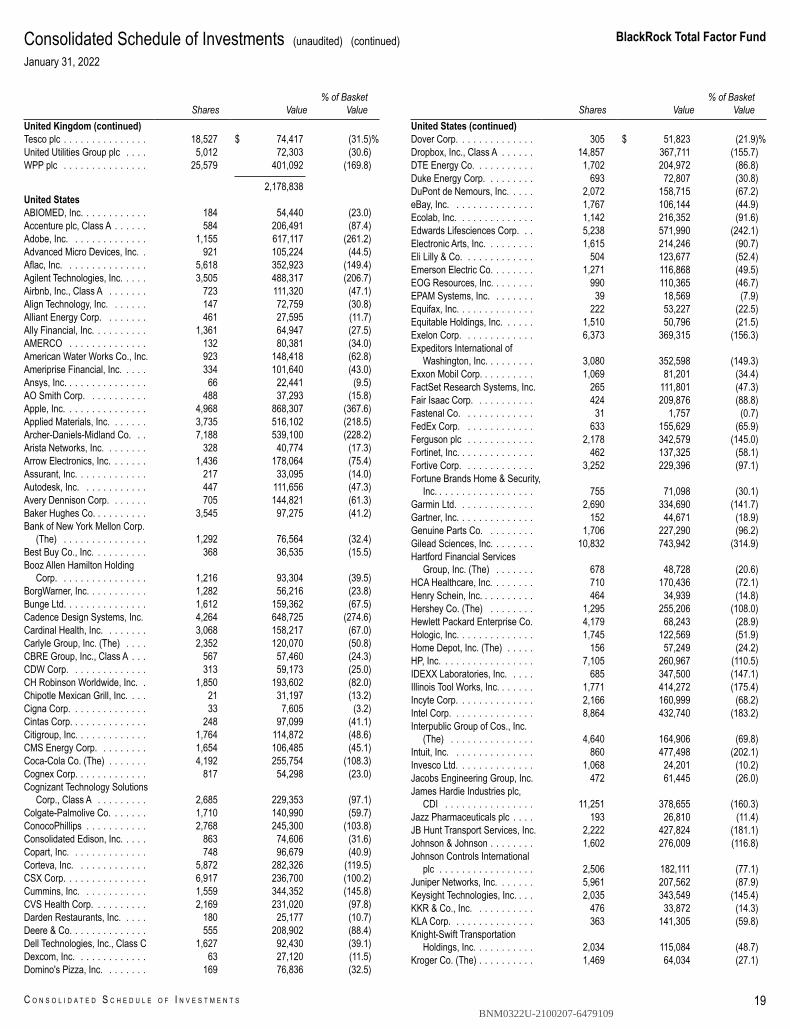
ValueUnited Kingdom (continued)Tesco plc . . . . . . . . . . . . . . . 18,527 $ 74,417 (31.5)%United Utilities Group plc . . . . 5,012 72,303 (30.6)WPP plc . . . . . . . . . . . . . . . 25,579 401,092 (169.8)
2,178,838United StatesABIOMED, Inc. . . . . . . . . . . . 184 54,440 (23.0)Accenture plc, Class A . . . . . . 584 206,491 (87.4)Adobe, Inc. . . . . . . . . . . . . . 1,155 617,117 (261.2)Advanced Micro Devices, Inc. . 921 105,224 (44.5)Aflac, Inc. . . . . . . . . . . . . . . 5,618 352,923 (149.4)Agilent Technologies, Inc. . . . . 3,505 488,317 (206.7)Airbnb, Inc., Class A . . . . . . . 723 111,320 (47.1)Align Technology, Inc. . . . . . . 147 72,759 (30.8)Alliant Energy Corp. . . . . . . . 461 27,595 (11.7)Ally Financial, Inc. . . . . . . . . . 1,361 64,947 (27.5)AMERCO . . . . . . . . . . . . . . 132 80,381 (34.0)American Water Works Co., Inc. 923 148,418 (62.8)Ameriprise Financial, Inc. . . . . 334 101,640 (43.0)Ansys, Inc. . . . . . . . . . . . . . . 66 22,441 (9.5)AO Smith Corp. . . . . . . . . . . 488 37,293 (15.8)Apple, Inc. . . . . . . . . . . . . . . 4,968 868,307 (367.6)Applied Materials, Inc. . . . . . . 3,735 516,102 (218.5)Archer-Daniels-Midland Co. . . 7,188 539,100 (228.2)Arista Networks, Inc. . . . . . . . 328 40,774 (17.3)Arrow Electronics, Inc. . . . . . . 1,436 178,064 (75.4)Assurant, Inc. . . . . . . . . . . . . 217 33,095 (14.0)Autodesk, Inc. . . . . . . . . . . . 447 111,656 (47.3)Avery Dennison Corp. . . . . . . 705 144,821 (61.3)Baker Hughes Co. . . . . . . . . . 3,545 97,275 (41.2)Bank of New York Mellon Corp.
(The) . . . . . . . . . . . . . . . 1,292 76,564 (32.4)Best Buy Co., Inc. . . . . . . . . . 368 36,535 (15.5)Booz Allen Hamilton Holding
Corp. . . . . . . . . . . . . . . . 1,216 93,304 (39.5)BorgWarner, Inc. . . . . . . . . . . 1,282 56,216 (23.8)Bunge Ltd. . . . . . . . . . . . . . . 1,612 159,362 (67.5)Cadence Design Systems, Inc. 4,264 648,725 (274.6)Cardinal Health, Inc. . . . . . . . 3,068 158,217 (67.0)Carlyle Group, Inc. (The) . . . . 2,352 120,070 (50.8)CBRE Group, Inc., Class A . . . 567 57,460 (24.3)CDW Corp. . . . . . . . . . . . . . 313 59,173 (25.0)CH Robinson Worldwide, Inc. . 1,850 193,602 (82.0)Chipotle Mexican Grill, Inc. . . . 21 31,197 (13.2)Cigna Corp. . . . . . . . . . . . . . 33 7,605 (3.2)Cintas Corp. . . . . . . . . . . . . . 248 97,099 (41.1)Citigroup, Inc. . . . . . . . . . . . . 1,764 114,872 (48.6)CMS Energy Corp. . . . . . . . . 1,654 106,485 (45.1)Coca-Cola Co. (The) . . . . . . . 4,192 255,754 (108.3)Cognex Corp. . . . . . . . . . . . . 817 54,298 (23.0)Cognizant Technology Solutions
Corp., Class A . . . . . . . . . 2,685 229,353 (97.1)Colgate-Palmolive Co. . . . . . . 1,710 140,990 (59.7)ConocoPhillips . . . . . . . . . . . 2,768 245,300 (103.8)Consolidated Edison, Inc. . . . . 863 74,606 (31.6)Copart, Inc. . . . . . . . . . . . . . 748 96,679 (40.9)Corteva, Inc. . . . . . . . . . . . . 5,872 282,326 (119.5)CSX Corp. . . . . . . . . . . . . . . 6,917 236,700 (100.2)Cummins, Inc. . . . . . . . . . . . 1,559 344,352 (145.8)CVS Health Corp. . . . . . . . . . 2,169 231,020 (97.8)Darden Restaurants, Inc. . . . . 180 25,177 (10.7)Deere & Co. . . . . . . . . . . . . . 555 208,902 (88.4)Dell Technologies, Inc., Class C 1,627 92,430 (39.1)Dexcom, Inc. . . . . . . . . . . . . 63 27,120 (11.5)Domino's Pizza, Inc. . . . . . . . 169 76,836 (32.5)
Shares Value% of Basket
ValueUnited States (continued)Dover Corp. . . . . . . . . . . . . . 305 $ 51,823 (21.9)%Dropbox, Inc., Class A . . . . . . 14,857 367,711 (155.7)DTE Energy Co. . . . . . . . . . . 1,702 204,972 (86.8)Duke Energy Corp. . . . . . . . . 693 72,807 (30.8)DuPont de Nemours, Inc. . . . . 2,072 158,715 (67.2)eBay, Inc. . . . . . . . . . . . . . . 1,767 106,144 (44.9)Ecolab, Inc. . . . . . . . . . . . . . 1,142 216,352 (91.6)Edwards Lifesciences Corp. . . 5,238 571,990 (242.1)Electronic Arts, Inc. . . . . . . . . 1,615 214,246 (90.7)Eli Lilly & Co. . . . . . . . . . . . . 504 123,677 (52.4)Emerson Electric Co. . . . . . . . 1,271 116,868 (49.5)EOG Resources, Inc. . . . . . . . 990 110,365 (46.7)EPAM Systems, Inc. . . . . . . . 39 18,569 (7.9)Equifax, Inc. . . . . . . . . . . . . . 222 53,227 (22.5)Equitable Holdings, Inc. . . . . . 1,510 50,796 (21.5)Exelon Corp. . . . . . . . . . . . . 6,373 369,315 (156.3)Expeditors International of
Washington, Inc. . . . . . . . . 3,080 352,598 (149.3)Exxon Mobil Corp. . . . . . . . . . 1,069 81,201 (34.4)FactSet Research Systems, Inc. 265 111,801 (47.3)Fair Isaac Corp. . . . . . . . . . . 424 209,876 (88.8)Fastenal Co. . . . . . . . . . . . . 31 1,757 (0.7)FedEx Corp. . . . . . . . . . . . . 633 155,629 (65.9)Ferguson plc . . . . . . . . . . . . 2,178 342,579 (145.0)Fortinet, Inc. . . . . . . . . . . . . . 462 137,325 (58.1)Fortive Corp. . . . . . . . . . . . . 3,252 229,396 (97.1)Fortune Brands Home & Security,
Inc. . . . . . . . . . . . . . . . . . 755 71,098 (30.1)Garmin Ltd. . . . . . . . . . . . . . 2,690 334,690 (141.7)Gartner, Inc. . . . . . . . . . . . . . 152 44,671 (18.9)Genuine Parts Co. . . . . . . . . 1,706 227,290 (96.2)Gilead Sciences, Inc. . . . . . . . 10,832 743,942 (314.9)Hartford Financial Services
Group, Inc. (The) . . . . . . . 678 48,728 (20.6)HCA Healthcare, Inc. . . . . . . . 710 170,436 (72.1)Henry Schein, Inc. . . . . . . . . . 464 34,939 (14.8)Hershey Co. (The) . . . . . . . . 1,295 255,206 (108.0)Hewlett Packard Enterprise Co. 4,179 68,243 (28.9)Hologic, Inc. . . . . . . . . . . . . . 1,745 122,569 (51.9)Home Depot, Inc. (The) . . . . . 156 57,249 (24.2)HP, Inc. . . . . . . . . . . . . . . . . 7,105 260,967 (110.5)IDEXX Laboratories, Inc. . . . . 685 347,500 (147.1)Illinois Tool Works, Inc. . . . . . . 1,771 414,272 (175.4)Incyte Corp. . . . . . . . . . . . . . 2,166 160,999 (68.2)Intel Corp. . . . . . . . . . . . . . . 8,864 432,740 (183.2)Interpublic Group of Cos., Inc.
(The) . . . . . . . . . . . . . . . 4,640 164,906 (69.8)Intuit, Inc. . . . . . . . . . . . . . . 860 477,498 (202.1)Invesco Ltd. . . . . . . . . . . . . . 1,068 24,201 (10.2)Jacobs Engineering Group, Inc. 472 61,445 (26.0)James Hardie Industries plc,
CDI . . . . . . . . . . . . . . . . 11,251 378,655 (160.3)Jazz Pharmaceuticals plc . . . . 193 26,810 (11.4)JB Hunt Transport Services, Inc. 2,222 427,824 (181.1)Johnson & Johnson . . . . . . . . 1,602 276,009 (116.8)Johnson Controls International
plc . . . . . . . . . . . . . . . . . 2,506 182,111 (77.1)Juniper Networks, Inc. . . . . . . 5,961 207,562 (87.9)Keysight Technologies, Inc. . . . 2,035 343,549 (145.4)KKR & Co., Inc. . . . . . . . . . . 476 33,872 (14.3)KLA Corp. . . . . . . . . . . . . . . 363 141,305 (59.8)Knight-Swift Transportation
Holdings, Inc. . . . . . . . . . . 2,034 115,084 (48.7)Kroger Co. (The) . . . . . . . . . . 1,469 64,034 (27.1)
BNM0322U-2100207-6479109
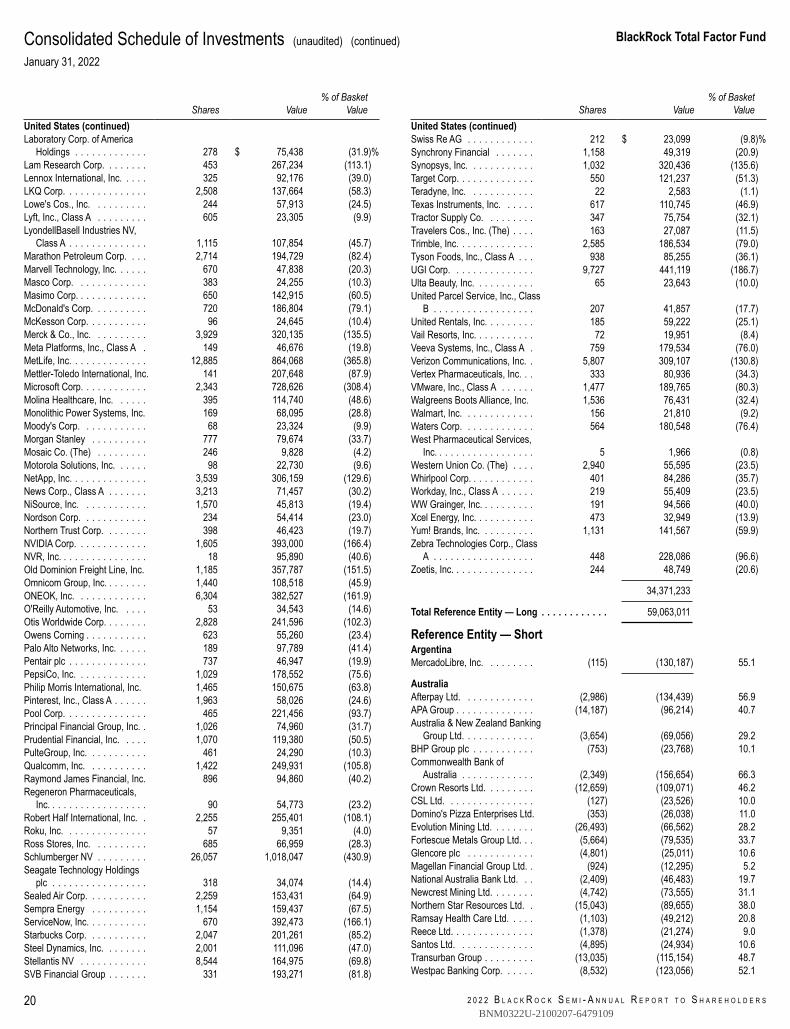
2 0 2 2 B L A C K R O C K S E M I - A N N U A L R E P O R T T O S H A R E H O L D E R S
BlackRock Total Factor Fund
20
Consolidated Schedule of Investments (unaudited) (continued)January 31, 2022
Shares Value% of Basket
ValueUnited States (continued)Laboratory Corp. of America
Holdings . . . . . . . . . . . . . 278 $ 75,438 (31.9)%Lam Research Corp. . . . . . . . 453 267,234 (113.1)Lennox International, Inc. . . . . 325 92,176 (39.0)LKQ Corp. . . . . . . . . . . . . . . 2,508 137,664 (58.3)Lowe's Cos., Inc. . . . . . . . . . 244 57,913 (24.5)Lyft, Inc., Class A . . . . . . . . . 605 23,305 (9.9)LyondellBasell Industries NV,
Class A . . . . . . . . . . . . . . 1,115 107,854 (45.7)Marathon Petroleum Corp. . . . 2,714 194,729 (82.4)Marvell Technology, Inc. . . . . . 670 47,838 (20.3)Masco Corp. . . . . . . . . . . . . 383 24,255 (10.3)Masimo Corp. . . . . . . . . . . . . 650 142,915 (60.5)McDonald's Corp. . . . . . . . . . 720 186,804 (79.1)McKesson Corp. . . . . . . . . . . 96 24,645 (10.4)Merck & Co., Inc. . . . . . . . . . 3,929 320,135 (135.5)Meta Platforms, Inc., Class A . 149 46,676 (19.8)MetLife, Inc. . . . . . . . . . . . . . 12,885 864,068 (365.8)Mettler-Toledo International, Inc. 141 207,648 (87.9)Microsoft Corp. . . . . . . . . . . . 2,343 728,626 (308.4)Molina Healthcare, Inc. . . . . . 395 114,740 (48.6)Monolithic Power Systems, Inc. 169 68,095 (28.8)Moody's Corp. . . . . . . . . . . . 68 23,324 (9.9)Morgan Stanley . . . . . . . . . . 777 79,674 (33.7)Mosaic Co. (The) . . . . . . . . . 246 9,828 (4.2)Motorola Solutions, Inc. . . . . . 98 22,730 (9.6)NetApp, Inc. . . . . . . . . . . . . . 3,539 306,159 (129.6)News Corp., Class A . . . . . . . 3,213 71,457 (30.2)NiSource, Inc. . . . . . . . . . . . 1,570 45,813 (19.4)Nordson Corp. . . . . . . . . . . . 234 54,414 (23.0)Northern Trust Corp. . . . . . . . 398 46,423 (19.7)NVIDIA Corp. . . . . . . . . . . . . 1,605 393,000 (166.4)NVR, Inc. . . . . . . . . . . . . . . . 18 95,890 (40.6)Old Dominion Freight Line, Inc. 1,185 357,787 (151.5)Omnicom Group, Inc. . . . . . . . 1,440 108,518 (45.9)ONEOK, Inc. . . . . . . . . . . . . 6,304 382,527 (161.9)O'Reilly Automotive, Inc. . . . . 53 34,543 (14.6)Otis Worldwide Corp. . . . . . . . 2,828 241,596 (102.3)Owens Corning . . . . . . . . . . . 623 55,260 (23.4)Palo Alto Networks, Inc. . . . . . 189 97,789 (41.4)Pentair plc . . . . . . . . . . . . . . 737 46,947 (19.9)PepsiCo, Inc. . . . . . . . . . . . . 1,029 178,552 (75.6)Philip Morris International, Inc. 1,465 150,675 (63.8)Pinterest, Inc., Class A . . . . . . 1,963 58,026 (24.6)Pool Corp. . . . . . . . . . . . . . . 465 221,456 (93.7)Principal Financial Group, Inc. . 1,026 74,960 (31.7)Prudential Financial, Inc. . . . . 1,070 119,380 (50.5)PulteGroup, Inc. . . . . . . . . . . 461 24,290 (10.3)Qualcomm, Inc. . . . . . . . . . . 1,422 249,931 (105.8)Raymond James Financial, Inc. 896 94,860 (40.2)Regeneron Pharmaceuticals,
Inc. . . . . . . . . . . . . . . . . . 90 54,773 (23.2)Robert Half International, Inc. . 2,255 255,401 (108.1)Roku, Inc. . . . . . . . . . . . . . . 57 9,351 (4.0)Ross Stores, Inc. . . . . . . . . . 685 66,959 (28.3)Schlumberger NV . . . . . . . . . 26,057 1,018,047 (430.9)Seagate Technology Holdings
plc . . . . . . . . . . . . . . . . . 318 34,074 (14.4)Sealed Air Corp. . . . . . . . . . . 2,259 153,431 (64.9)Sempra Energy . . . . . . . . . . 1,154 159,437 (67.5)ServiceNow, Inc. . . . . . . . . . . 670 392,473 (166.1)Starbucks Corp. . . . . . . . . . . 2,047 201,261 (85.2)Steel Dynamics, Inc. . . . . . . . 2,001 111,096 (47.0)Stellantis NV . . . . . . . . . . . . 8,544 164,975 (69.8)SVB Financial Group . . . . . . . 331 193,271 (81.8)
Shares Value% of Basket
ValueUnited States (continued)Swiss Re AG . . . . . . . . . . . . 212 $ 23,099 (9.8)%Synchrony Financial . . . . . . . 1,158 49,319 (20.9)Synopsys, Inc. . . . . . . . . . . . 1,032 320,436 (135.6)Target Corp. . . . . . . . . . . . . . 550 121,237 (51.3)Teradyne, Inc. . . . . . . . . . . . 22 2,583 (1.1)Texas Instruments, Inc. . . . . . 617 110,745 (46.9)Tractor Supply Co. . . . . . . . . 347 75,754 (32.1)Travelers Cos., Inc. (The) . . . . 163 27,087 (11.5)Trimble, Inc. . . . . . . . . . . . . . 2,585 186,534 (79.0)Tyson Foods, Inc., Class A . . . 938 85,255 (36.1)UGI Corp. . . . . . . . . . . . . . . 9,727 441,119 (186.7)Ulta Beauty, Inc. . . . . . . . . . . 65 23,643 (10.0)United Parcel Service, Inc., Class
B . . . . . . . . . . . . . . . . . . 207 41,857 (17.7)United Rentals, Inc. . . . . . . . . 185 59,222 (25.1)Vail Resorts, Inc. . . . . . . . . . . 72 19,951 (8.4)Veeva Systems, Inc., Class A . 759 179,534 (76.0)Verizon Communications, Inc. . 5,807 309,107 (130.8)Vertex Pharmaceuticals, Inc. . . 333 80,936 (34.3)VMware, Inc., Class A . . . . . . 1,477 189,765 (80.3)Walgreens Boots Alliance, Inc. 1,536 76,431 (32.4)Walmart, Inc. . . . . . . . . . . . . 156 21,810 (9.2)Waters Corp. . . . . . . . . . . . . 564 180,548 (76.4)West Pharmaceutical Services,
Inc. . . . . . . . . . . . . . . . . . 5 1,966 (0.8)Western Union Co. (The) . . . . 2,940 55,595 (23.5)Whirlpool Corp. . . . . . . . . . . . 401 84,286 (35.7)Workday, Inc., Class A . . . . . . 219 55,409 (23.5)WW Grainger, Inc. . . . . . . . . . 191 94,566 (40.0)Xcel Energy, Inc. . . . . . . . . . . 473 32,949 (13.9)Yum! Brands, Inc. . . . . . . . . . 1,131 141,567 (59.9)Zebra Technologies Corp., Class
A . . . . . . . . . . . . . . . . . . 448 228,086 (96.6)Zoetis, Inc. . . . . . . . . . . . . . . 244 48,749 (20.6)
34,371,233
Total Reference Entity — Long . . . . . . . . . . . . 59,063,011
Reference Entity — ShortArgentinaMercadoLibre, Inc. . . . . . . . . (115) (130,187) 55.1
AustraliaAfterpay Ltd. . . . . . . . . . . . . (2,986) (134,439) 56.9APA Group . . . . . . . . . . . . . . (14,187) (96,214) 40.7Australia & New Zealand Banking
Group Ltd. . . . . . . . . . . . . (3,654) (69,056) 29.2BHP Group plc . . . . . . . . . . . (753) (23,768) 10.1Commonwealth Bank of
Australia . . . . . . . . . . . . . (2,349) (156,654) 66.3Crown Resorts Ltd. . . . . . . . . (12,659) (109,071) 46.2CSL Ltd. . . . . . . . . . . . . . . . (127) (23,526) 10.0Domino's Pizza Enterprises Ltd. (353) (26,038) 11.0Evolution Mining Ltd. . . . . . . . (26,493) (66,562) 28.2Fortescue Metals Group Ltd. . . (5,664) (79,535) 33.7Glencore plc . . . . . . . . . . . . (4,801) (25,011) 10.6Magellan Financial Group Ltd. . (924) (12,295) 5.2National Australia Bank Ltd. . . (2,409) (46,483) 19.7Newcrest Mining Ltd. . . . . . . . (4,742) (73,555) 31.1Northern Star Resources Ltd. . (15,043) (89,655) 38.0Ramsay Health Care Ltd. . . . . (1,103) (49,212) 20.8Reece Ltd. . . . . . . . . . . . . . . (1,378) (21,274) 9.0Santos Ltd. . . . . . . . . . . . . . (4,895) (24,934) 10.6Transurban Group . . . . . . . . . (13,035) (115,154) 48.7Westpac Banking Corp. . . . . . (8,532) (123,056) 52.1
BNM0322U-2100207-6479109
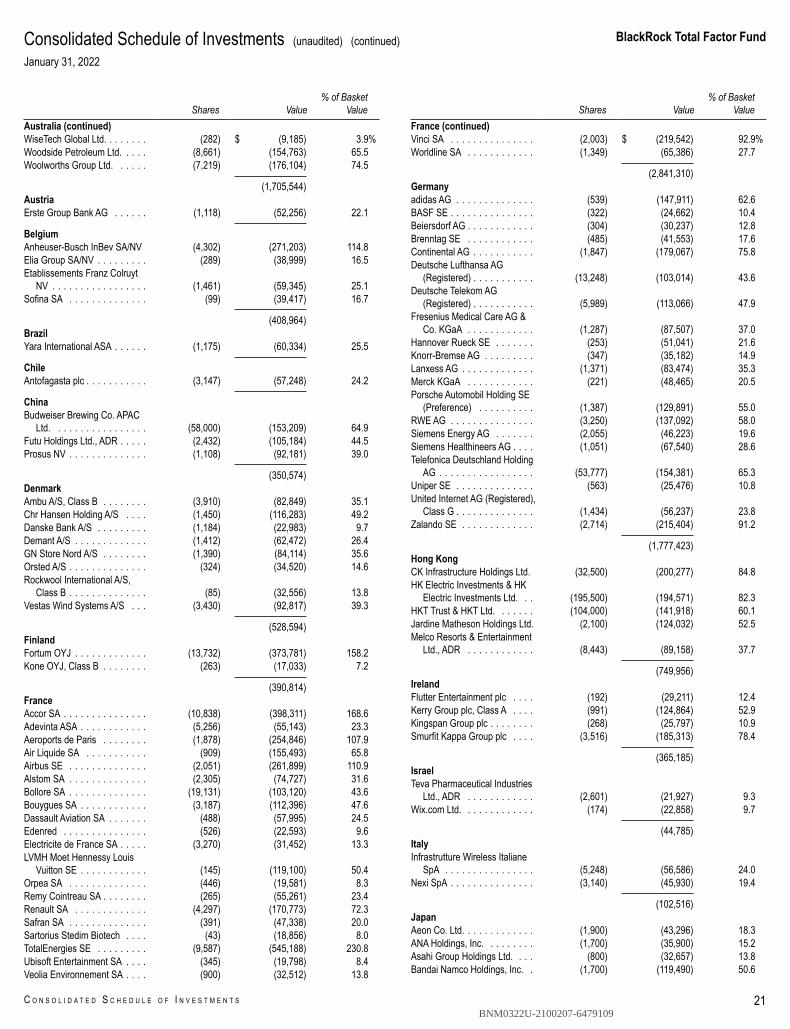
BlackRock Total Factor Fund
C O N S O L I D A T E D S C H E D U L E O F I N V E S T M E N T S 21
Consolidated Schedule of Investments (unaudited) (continued)January 31, 2022
Shares Value% of Basket
ValueAustralia (continued)WiseTech Global Ltd. . . . . . . . (282) $ (9,185) 3.9%Woodside Petroleum Ltd. . . . . (8,661) (154,763) 65.5Woolworths Group Ltd. . . . . . (7,219) (176,104) 74.5
(1,705,544)AustriaErste Group Bank AG . . . . . . (1,118) (52,256) 22.1
BelgiumAnheuser-Busch InBev SA/NV (4,302) (271,203) 114.8Elia Group SA/NV . . . . . . . . . (289) (38,999) 16.5Etablissements Franz Colruyt
NV . . . . . . . . . . . . . . . . . (1,461) (59,345) 25.1Sofina SA . . . . . . . . . . . . . . (99) (39,417) 16.7
(408,964)BrazilYara International ASA . . . . . . (1,175) (60,334) 25.5
ChileAntofagasta plc . . . . . . . . . . . (3,147) (57,248) 24.2
ChinaBudweiser Brewing Co. APAC
Ltd. . . . . . . . . . . . . . . . . (58,000) (153,209) 64.9Futu Holdings Ltd., ADR . . . . . (2,432) (105,184) 44.5Prosus NV . . . . . . . . . . . . . . (1,108) (92,181) 39.0
(350,574)DenmarkAmbu A/S, Class B . . . . . . . . (3,910) (82,849) 35.1Chr Hansen Holding A/S . . . . (1,450) (116,283) 49.2Danske Bank A/S . . . . . . . . . (1,184) (22,983) 9.7Demant A/S . . . . . . . . . . . . . (1,412) (62,472) 26.4GN Store Nord A/S . . . . . . . . (1,390) (84,114) 35.6Orsted A/S . . . . . . . . . . . . . . (324) (34,520) 14.6Rockwool International A/S,
Class B . . . . . . . . . . . . . . (85) (32,556) 13.8Vestas Wind Systems A/S . . . (3,430) (92,817) 39.3
(528,594)FinlandFortum OYJ . . . . . . . . . . . . . (13,732) (373,781) 158.2Kone OYJ, Class B . . . . . . . . (263) (17,033) 7.2
(390,814)FranceAccor SA . . . . . . . . . . . . . . . (10,838) (398,311) 168.6Adevinta ASA . . . . . . . . . . . . (5,256) (55,143) 23.3Aeroports de Paris . . . . . . . . (1,878) (254,846) 107.9Air Liquide SA . . . . . . . . . . . (909) (155,493) 65.8Airbus SE . . . . . . . . . . . . . . (2,051) (261,899) 110.9Alstom SA . . . . . . . . . . . . . . (2,305) (74,727) 31.6Bollore SA . . . . . . . . . . . . . . (19,131) (103,120) 43.6Bouygues SA . . . . . . . . . . . . (3,187) (112,396) 47.6Dassault Aviation SA . . . . . . . (488) (57,995) 24.5Edenred . . . . . . . . . . . . . . . (526) (22,593) 9.6Electricite de France SA . . . . . (3,270) (31,452) 13.3LVMH Moet Hennessy Louis
Vuitton SE . . . . . . . . . . . . (145) (119,100) 50.4Orpea SA . . . . . . . . . . . . . . (446) (19,581) 8.3Remy Cointreau SA . . . . . . . . (265) (55,261) 23.4Renault SA . . . . . . . . . . . . . (4,297) (170,773) 72.3Safran SA . . . . . . . . . . . . . . (391) (47,338) 20.0Sartorius Stedim Biotech . . . . (43) (18,856) 8.0TotalEnergies SE . . . . . . . . . (9,587) (545,188) 230.8Ubisoft Entertainment SA . . . . (345) (19,798) 8.4Veolia Environnement SA . . . . (900) (32,512) 13.8
Shares Value% of Basket
ValueFrance (continued)Vinci SA . . . . . . . . . . . . . . . (2,003) $ (219,542) 92.9%Worldline SA . . . . . . . . . . . . (1,349) (65,386) 27.7
(2,841,310)Germanyadidas AG . . . . . . . . . . . . . . (539) (147,911) 62.6BASF SE . . . . . . . . . . . . . . . (322) (24,662) 10.4Beiersdorf AG . . . . . . . . . . . . (304) (30,237) 12.8Brenntag SE . . . . . . . . . . . . (485) (41,553) 17.6Continental AG . . . . . . . . . . . (1,847) (179,067) 75.8Deutsche Lufthansa AG
(Registered) . . . . . . . . . . . (13,248) (103,014) 43.6Deutsche Telekom AG
(Registered) . . . . . . . . . . . (5,989) (113,066) 47.9Fresenius Medical Care AG &
Co. KGaA . . . . . . . . . . . . (1,287) (87,507) 37.0Hannover Rueck SE . . . . . . . (253) (51,041) 21.6Knorr-Bremse AG . . . . . . . . . (347) (35,182) 14.9Lanxess AG . . . . . . . . . . . . . (1,371) (83,474) 35.3Merck KGaA . . . . . . . . . . . . (221) (48,465) 20.5Porsche Automobil Holding SE
(Preference) . . . . . . . . . . (1,387) (129,891) 55.0RWE AG . . . . . . . . . . . . . . . (3,250) (137,092) 58.0Siemens Energy AG . . . . . . . (2,055) (46,223) 19.6Siemens Healthineers AG . . . . (1,051) (67,540) 28.6Telefonica Deutschland Holding
AG . . . . . . . . . . . . . . . . . (53,777) (154,381) 65.3Uniper SE . . . . . . . . . . . . . . (563) (25,476) 10.8United Internet AG (Registered),
Class G . . . . . . . . . . . . . . (1,434) (56,237) 23.8Zalando SE . . . . . . . . . . . . . (2,714) (215,404) 91.2
(1,777,423)Hong KongCK Infrastructure Holdings Ltd. (32,500) (200,277) 84.8HK Electric Investments & HK
Electric Investments Ltd. . . (195,500) (194,571) 82.3HKT Trust & HKT Ltd. . . . . . . (104,000) (141,918) 60.1Jardine Matheson Holdings Ltd. (2,100) (124,032) 52.5Melco Resorts & Entertainment
Ltd., ADR . . . . . . . . . . . . (8,443) (89,158) 37.7
(749,956)IrelandFlutter Entertainment plc . . . . (192) (29,211) 12.4Kerry Group plc, Class A . . . . (991) (124,864) 52.9Kingspan Group plc . . . . . . . . (268) (25,797) 10.9Smurfit Kappa Group plc . . . . (3,516) (185,313) 78.4
(365,185)IsraelTeva Pharmaceutical Industries
Ltd., ADR . . . . . . . . . . . . (2,601) (21,927) 9.3Wix.com Ltd. . . . . . . . . . . . . (174) (22,858) 9.7
(44,785)ItalyInfrastrutture Wireless Italiane
SpA . . . . . . . . . . . . . . . . (5,248) (56,586) 24.0Nexi SpA . . . . . . . . . . . . . . . (3,140) (45,930) 19.4
(102,516)JapanAeon Co. Ltd. . . . . . . . . . . . . (1,900) (43,296) 18.3ANA Holdings, Inc. . . . . . . . . (1,700) (35,900) 15.2Asahi Group Holdings Ltd. . . . (800) (32,657) 13.8Bandai Namco Holdings, Inc. . (1,700) (119,490) 50.6
BNM0322U-2100207-6479109

2 0 2 2 B L A C K R O C K S E M I - A N N U A L R E P O R T T O S H A R E H O L D E R S
BlackRock Total Factor Fund
22
Consolidated Schedule of Investments (unaudited) (continued)January 31, 2022
Shares Value% of Basket
ValueJapan (continued)Canon, Inc. . . . . . . . . . . . . . (2,400) $ (56,762) 24.0%Central Japan Railway Co. . . . (2,500) (328,027) 138.9Cosmos Pharmaceutical Corp. (300) (37,465) 15.9Daiichi Sankyo Co. Ltd. . . . . . (1,100) (24,717) 10.5Daikin Industries Ltd. . . . . . . . (200) (41,989) 17.8East Japan Railway Co. . . . . . (3,800) (216,991) 91.8Fast Retailing Co. Ltd. . . . . . . (400) (235,386) 99.6GMO Payment Gateway, Inc. . (1,600) (140,403) 59.4Hikari Tsushin, Inc. . . . . . . . . (100) (12,006) 5.1Inpex Corp. . . . . . . . . . . . . . (11,400) (115,248) 48.8Japan Exchange Group, Inc. . . (900) (18,514) 7.8Japan Post Bank Co. Ltd. . . . . (15,300) (150,518) 63.7JFE Holdings, Inc. . . . . . . . . . (6,100) (78,366) 33.2Keio Corp. . . . . . . . . . . . . . . (1,700) (76,467) 32.4Keisei Electric Railway Co. Ltd. (600) (16,933) 7.2Keyence Corp. . . . . . . . . . . . (500) (256,461) 108.6Kobayashi Pharmaceutical Co.
Ltd. . . . . . . . . . . . . . . . . (300) (23,362) 9.9Kobe Bussan Co. Ltd. . . . . . . (7,300) (227,245) 96.2Koei Tecmo Holdings Co. Ltd. . (5,750) (208,016) 88.1Koito Manufacturing Co. Ltd. . . (400) (20,084) 8.5Kose Corp. . . . . . . . . . . . . . (1,500) (137,144) 58.1Kubota Corp. . . . . . . . . . . . . (14,200) (304,527) 128.9Lasertec Corp. . . . . . . . . . . . (500) (112,169) 47.5Lion Corp. . . . . . . . . . . . . . . (1,200) (15,679) 6.6Makita Corp. . . . . . . . . . . . . (2,400) (89,816) 38.0McDonald's Holdings Co. Japan
Ltd. . . . . . . . . . . . . . . . . (2,300) (100,442) 42.5Mercari, Inc. . . . . . . . . . . . . . (2,800) (105,744) 44.8MISUMI Group, Inc. . . . . . . . . (900) (29,198) 12.4Mitsubishi Corp. . . . . . . . . . . (6,000) (203,715) 86.2Murata Manufacturing Co. Ltd. (1,500) (112,775) 47.7Nexon Co. Ltd. . . . . . . . . . . . (4,100) (77,292) 32.7Nidec Corp. . . . . . . . . . . . . . (1,200) (106,356) 45.0Nihon M&A Center Holdings,
Inc. . . . . . . . . . . . . . . . . . (4,400) (69,270) 29.3Nintendo Co. Ltd. . . . . . . . . . (400) (196,017) 83.0Nippon Paint Holdings Co. Ltd. (2,600) (20,793) 8.8Nippon Sanso Holdings Corp. . (6,700) (133,054) 56.3Nippon Shinyaku Co. Ltd. . . . . (500) (32,685) 13.8NTT Data Corp. . . . . . . . . . . (4,500) (86,268) 36.5Odakyu Electric Railway Co. Ltd. (10,600) (187,310) 79.3Oji Holdings Corp. . . . . . . . . . (3,600) (19,163) 8.1Open House Group Co. Ltd. . . (1,600) (82,837) 35.1Oracle Corp. Japan . . . . . . . . (400) (29,916) 12.7Oriental Land Co. Ltd. . . . . . . (200) (34,817) 14.7Otsuka Corp. . . . . . . . . . . . . (5,200) (210,999) 89.3Pola Orbis Holdings, Inc. . . . . (11,400) (169,910) 71.9Rakuten Group, Inc. . . . . . . . (9,500) (82,416) 34.9Ryohin Keikaku Co. Ltd. . . . . . (4,300) (61,745) 26.1SBI Holdings, Inc. . . . . . . . . . (1,100) (28,375) 12.0SCSK Corp. . . . . . . . . . . . . . (3,600) (60,917) 25.8Shimizu Corp. . . . . . . . . . . . (8,200) (54,599) 23.1Shin-Etsu Chemical Co. Ltd. . . (800) (133,848) 56.7Shiseido Co. Ltd. . . . . . . . . . (1,300) (65,577) 27.8SMC Corp. . . . . . . . . . . . . . . (100) (55,776) 23.6SoftBank Corp. . . . . . . . . . . . (14,600) (183,024) 77.5SoftBank Group Corp. . . . . . . (5,300) (234,788) 99.4Square Enix Holdings Co. Ltd. . (1,500) (73,557) 31.1SUMCO Corp. . . . . . . . . . . . (4,800) (88,493) 37.5Sumitomo Electric Industries
Ltd. . . . . . . . . . . . . . . . . (15,400) (204,181) 86.4Takeda Pharmaceutical Co. Ltd. (18,000) (521,698) 220.8TIS, Inc. . . . . . . . . . . . . . . . (4,900) (128,873) 54.5Tobu Railway Co. Ltd. . . . . . . (3,500) (81,981) 34.7
Shares Value% of Basket
ValueJapan (continued)Toho Co. Ltd. . . . . . . . . . . . . (1,600) $ (61,980) 26.2%Tokyo Century Corp. . . . . . . . (600) (29,610) 12.5Tokyo Electric Power Co.
Holdings, Inc. . . . . . . . . . . (27,300) (72,734) 30.8Tokyu Corp. . . . . . . . . . . . . . (4,800) (63,782) 27.0Tsuruha Holdings, Inc. . . . . . . (400) (32,218) 13.6Unicharm Corp. . . . . . . . . . . (1,000) (38,644) 16.4Welcia Holdings Co. Ltd. . . . . (2,500) (67,520) 28.6West Japan Railway Co. . . . . (3,600) (150,854) 63.9Z Holdings Corp. . . . . . . . . . . (7,900) (40,121) 17.0
(7,801,510)JordanHikma Pharmaceuticals plc . . . (2,453) (68,912) 29.2
LuxembourgArcelorMittal SA . . . . . . . . . . (7,243) (215,146) 91.1Eurofins Scientific SE . . . . . . (188) (18,876) 8.0
(234,022)NetherlandsABN AMRO Bank NV, CVA . . . (4,692) (75,302) 31.9Aegon NV . . . . . . . . . . . . . . (9,136) (51,541) 21.8Akzo Nobel NV . . . . . . . . . . . (224) (23,186) 9.8ASM International NV . . . . . . (204) (70,090) 29.7Euronext NV . . . . . . . . . . . . (1,573) (151,657) 64.2Heineken NV . . . . . . . . . . . . (279) (29,922) 12.7JDE Peet's NV . . . . . . . . . . . (5,023) (150,409) 63.7Universal Music Group NV . . . (6,591) (162,726) 68.9
(714,833)New ZealandXero Ltd. . . . . . . . . . . . . . . . (1,064) (86,190) 36.5
NorwayGjensidige Forsikring ASA . . . (1,266) (30,924) 13.1Schibsted ASA, Class B . . . . . (994) (27,433) 11.6
(58,357)RussiaEvraz plc . . . . . . . . . . . . . . . (23,848) (162,014) 68.6
Saudi ArabiaDelivery Hero SE . . . . . . . . . (438) (33,809) 14.3
SingaporeKeppel Corp. Ltd. . . . . . . . . . (55,100) (232,313) 98.3Venture Corp. Ltd. . . . . . . . . . (12,800) (167,702) 71.0
(400,015)SpainAena SME SA . . . . . . . . . . . (984) (158,997) 67.3Amadeus IT Group SA . . . . . . (1,150) (79,074) 33.5Cellnex Telecom SA . . . . . . . (7,631) (346,032) 146.5EDP Renovaveis SA . . . . . . . (3,879) (81,542) 34.5Ferrovial SA . . . . . . . . . . . . . (1,588) (44,128) 18.7Grifols SA . . . . . . . . . . . . . . (11,414) (201,278) 85.2Naturgy Energy Group SA . . . (365) (11,557) 4.9Siemens Gamesa Renewable
Energy SA . . . . . . . . . . . . (2,260) (48,902) 20.7Telefonica SA . . . . . . . . . . . . (27,895) (130,035) 55.0
(1,101,545)SwedenAtlas Copco AB, Class A . . . . (1,726) (102,155) 43.2Embracer Group AB . . . . . . . (9,210) (92,407) 39.1EQT AB . . . . . . . . . . . . . . . . (2,573) (100,827) 42.7Essity AB, Class B . . . . . . . . (1,228) (34,618) 14.7
BNM0322U-2100207-6479109
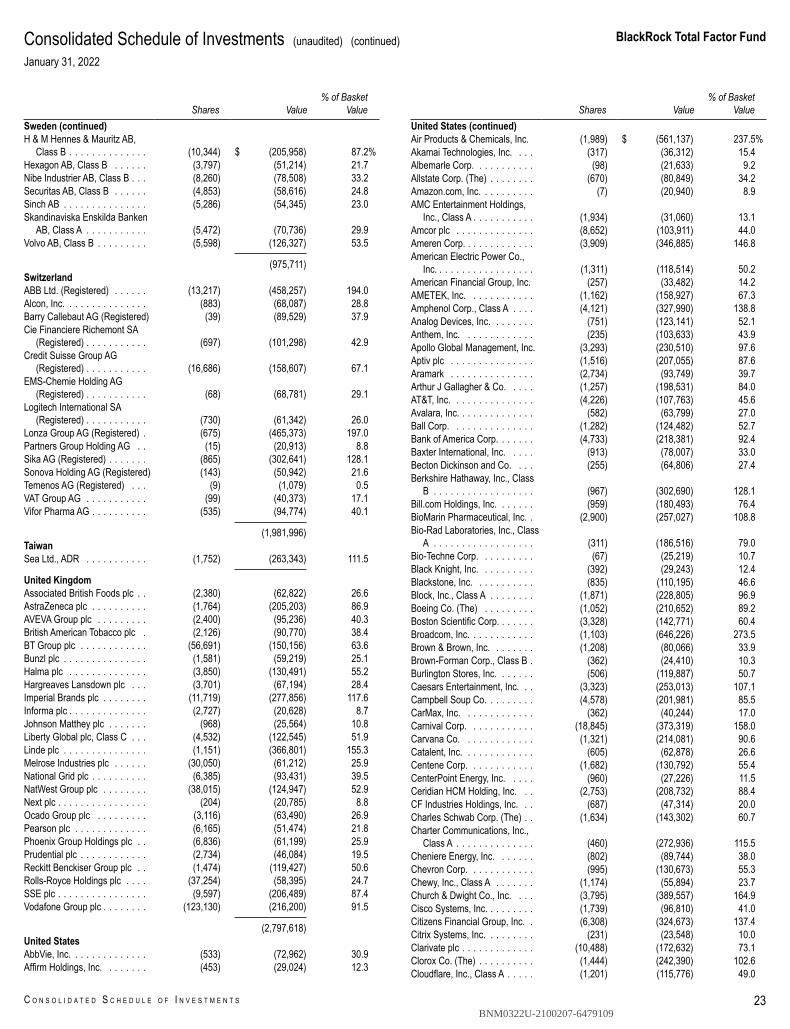
BlackRock Total Factor Fund
C O N S O L I D A T E D S C H E D U L E O F I N V E S T M E N T S 23
Consolidated Schedule of Investments (unaudited) (continued)January 31, 2022
Shares Value% of Basket
ValueSweden (continued)H & M Hennes & Mauritz AB,
Class B . . . . . . . . . . . . . . (10,344) $ (205,958) 87.2%Hexagon AB, Class B . . . . . . (3,797) (51,214) 21.7Nibe Industrier AB, Class B . . . (8,260) (78,508) 33.2Securitas AB, Class B . . . . . . (4,853) (58,616) 24.8Sinch AB . . . . . . . . . . . . . . . (5,286) (54,345) 23.0Skandinaviska Enskilda Banken
AB, Class A . . . . . . . . . . . (5,472) (70,736) 29.9Volvo AB, Class B . . . . . . . . . (5,598) (126,327) 53.5
(975,711)SwitzerlandABB Ltd. (Registered) . . . . . . (13,217) (458,257) 194.0Alcon, Inc. . . . . . . . . . . . . . . (883) (68,087) 28.8Barry Callebaut AG (Registered) (39) (89,529) 37.9Cie Financiere Richemont SA
(Registered) . . . . . . . . . . . (697) (101,298) 42.9Credit Suisse Group AG
(Registered) . . . . . . . . . . . (16,686) (158,607) 67.1EMS-Chemie Holding AG
(Registered) . . . . . . . . . . . (68) (68,781) 29.1Logitech International SA
(Registered) . . . . . . . . . . . (730) (61,342) 26.0Lonza Group AG (Registered) . (675) (465,373) 197.0Partners Group Holding AG . . (15) (20,913) 8.8Sika AG (Registered) . . . . . . . (865) (302,641) 128.1Sonova Holding AG (Registered) (143) (50,942) 21.6Temenos AG (Registered) . . . (9) (1,079) 0.5VAT Group AG . . . . . . . . . . . (99) (40,373) 17.1Vifor Pharma AG . . . . . . . . . . (535) (94,774) 40.1
(1,981,996)TaiwanSea Ltd., ADR . . . . . . . . . . . (1,752) (263,343) 111.5
United KingdomAssociated British Foods plc . . (2,380) (62,822) 26.6AstraZeneca plc . . . . . . . . . . (1,764) (205,203) 86.9AVEVA Group plc . . . . . . . . . (2,400) (95,236) 40.3British American Tobacco plc . (2,126) (90,770) 38.4BT Group plc . . . . . . . . . . . . (56,691) (150,156) 63.6Bunzl plc . . . . . . . . . . . . . . . (1,581) (59,219) 25.1Halma plc . . . . . . . . . . . . . . (3,850) (130,491) 55.2Hargreaves Lansdown plc . . . (3,701) (67,194) 28.4Imperial Brands plc . . . . . . . . (11,719) (277,856) 117.6Informa plc . . . . . . . . . . . . . . (2,727) (20,628) 8.7Johnson Matthey plc . . . . . . . (968) (25,564) 10.8Liberty Global plc, Class C . . . (4,532) (122,545) 51.9Linde plc . . . . . . . . . . . . . . . (1,151) (366,801) 155.3Melrose Industries plc . . . . . . (30,050) (61,212) 25.9National Grid plc . . . . . . . . . . (6,385) (93,431) 39.5NatWest Group plc . . . . . . . . (38,015) (124,947) 52.9Next plc . . . . . . . . . . . . . . . . (204) (20,785) 8.8Ocado Group plc . . . . . . . . . (3,116) (63,490) 26.9Pearson plc . . . . . . . . . . . . . (6,165) (51,474) 21.8Phoenix Group Holdings plc . . (6,836) (61,199) 25.9Prudential plc . . . . . . . . . . . . (2,734) (46,084) 19.5Reckitt Benckiser Group plc . . (1,474) (119,427) 50.6Rolls-Royce Holdings plc . . . . (37,254) (58,395) 24.7SSE plc . . . . . . . . . . . . . . . . (9,597) (206,489) 87.4Vodafone Group plc . . . . . . . . (123,130) (216,200) 91.5
(2,797,618)United StatesAbbVie, Inc. . . . . . . . . . . . . . (533) (72,962) 30.9Affirm Holdings, Inc. . . . . . . . (453) (29,024) 12.3
Shares Value% of Basket
ValueUnited States (continued)Air Products & Chemicals, Inc. (1,989) $ (561,137) 237.5%Akamai Technologies, Inc. . . . (317) (36,312) 15.4Albemarle Corp. . . . . . . . . . . (98) (21,633) 9.2Allstate Corp. (The) . . . . . . . . (670) (80,849) 34.2Amazon.com, Inc. . . . . . . . . . (7) (20,940) 8.9AMC Entertainment Holdings,
Inc., Class A . . . . . . . . . . . (1,934) (31,060) 13.1Amcor plc . . . . . . . . . . . . . . (8,652) (103,911) 44.0Ameren Corp. . . . . . . . . . . . . (3,909) (346,885) 146.8American Electric Power Co.,
Inc. . . . . . . . . . . . . . . . . . (1,311) (118,514) 50.2American Financial Group, Inc. (257) (33,482) 14.2AMETEK, Inc. . . . . . . . . . . . (1,162) (158,927) 67.3Amphenol Corp., Class A . . . . (4,121) (327,990) 138.8Analog Devices, Inc. . . . . . . . (751) (123,141) 52.1Anthem, Inc. . . . . . . . . . . . . (235) (103,633) 43.9Apollo Global Management, Inc. (3,293) (230,510) 97.6Aptiv plc . . . . . . . . . . . . . . . (1,516) (207,055) 87.6Aramark . . . . . . . . . . . . . . . (2,734) (93,749) 39.7Arthur J Gallagher & Co. . . . . (1,257) (198,531) 84.0AT&T, Inc. . . . . . . . . . . . . . . (4,226) (107,763) 45.6Avalara, Inc. . . . . . . . . . . . . . (582) (63,799) 27.0Ball Corp. . . . . . . . . . . . . . . (1,282) (124,482) 52.7Bank of America Corp. . . . . . . (4,733) (218,381) 92.4Baxter International, Inc. . . . . (913) (78,007) 33.0Becton Dickinson and Co. . . . (255) (64,806) 27.4Berkshire Hathaway, Inc., Class
B . . . . . . . . . . . . . . . . . . (967) (302,690) 128.1Bill.com Holdings, Inc. . . . . . . (959) (180,493) 76.4BioMarin Pharmaceutical, Inc. . (2,900) (257,027) 108.8Bio-Rad Laboratories, Inc., Class
A . . . . . . . . . . . . . . . . . . (311) (186,516) 79.0Bio-Techne Corp. . . . . . . . . . (67) (25,219) 10.7Black Knight, Inc. . . . . . . . . . (392) (29,243) 12.4Blackstone, Inc. . . . . . . . . . . (835) (110,195) 46.6Block, Inc., Class A . . . . . . . . (1,871) (228,805) 96.9Boeing Co. (The) . . . . . . . . . (1,052) (210,652) 89.2Boston Scientific Corp. . . . . . . (3,328) (142,771) 60.4Broadcom, Inc. . . . . . . . . . . . (1,103) (646,226) 273.5Brown & Brown, Inc. . . . . . . . (1,208) (80,066) 33.9Brown-Forman Corp., Class B . (362) (24,410) 10.3Burlington Stores, Inc. . . . . . . (506) (119,887) 50.7Caesars Entertainment, Inc. . . (3,323) (253,013) 107.1Campbell Soup Co. . . . . . . . . (4,578) (201,981) 85.5CarMax, Inc. . . . . . . . . . . . . (362) (40,244) 17.0Carnival Corp. . . . . . . . . . . . (18,845) (373,319) 158.0Carvana Co. . . . . . . . . . . . . (1,321) (214,081) 90.6Catalent, Inc. . . . . . . . . . . . . (605) (62,878) 26.6Centene Corp. . . . . . . . . . . . (1,682) (130,792) 55.4CenterPoint Energy, Inc. . . . . (960) (27,226) 11.5Ceridian HCM Holding, Inc. . . (2,753) (208,732) 88.4CF Industries Holdings, Inc. . . (687) (47,314) 20.0Charles Schwab Corp. (The) . . (1,634) (143,302) 60.7Charter Communications, Inc.,
Class A . . . . . . . . . . . . . . (460) (272,936) 115.5Cheniere Energy, Inc. . . . . . . (802) (89,744) 38.0Chevron Corp. . . . . . . . . . . . (995) (130,673) 55.3Chewy, Inc., Class A . . . . . . . (1,174) (55,894) 23.7Church & Dwight Co., Inc. . . . (3,795) (389,557) 164.9Cisco Systems, Inc. . . . . . . . . (1,739) (96,810) 41.0Citizens Financial Group, Inc. . (6,308) (324,673) 137.4Citrix Systems, Inc. . . . . . . . . (231) (23,548) 10.0Clarivate plc . . . . . . . . . . . . . (10,488) (172,632) 73.1Clorox Co. (The) . . . . . . . . . . (1,444) (242,390) 102.6Cloudflare, Inc., Class A . . . . . (1,201) (115,776) 49.0
BNM0322U-2100207-6479109
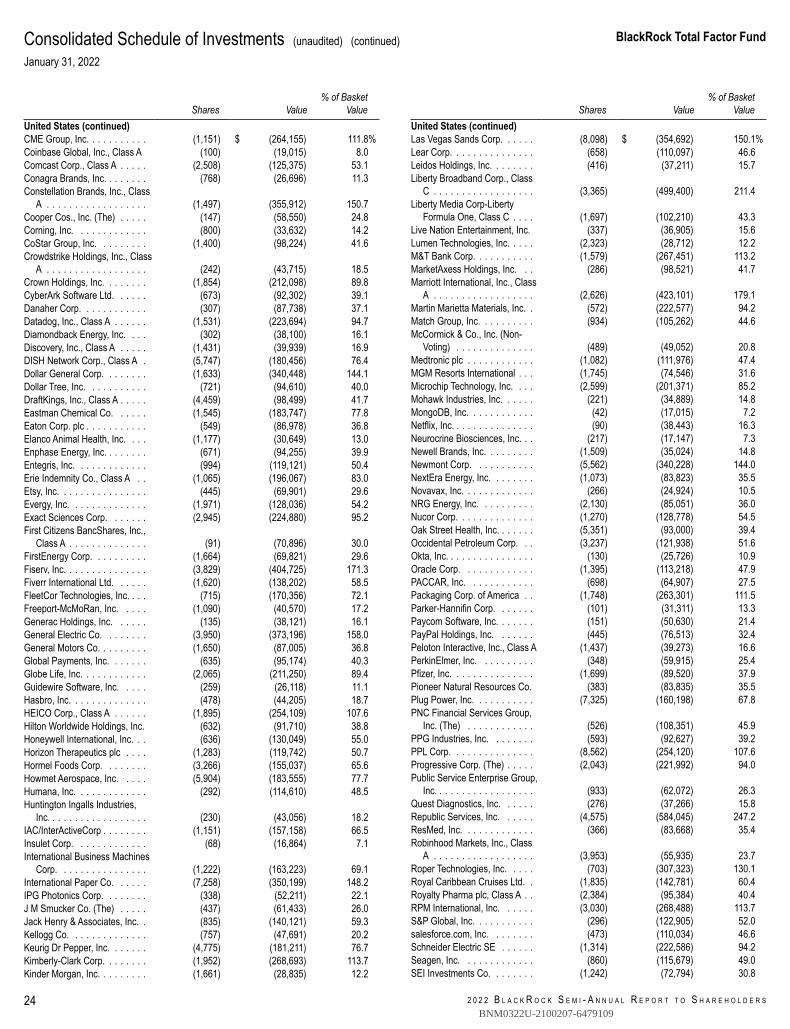
2 0 2 2 B L A C K R O C K S E M I - A N N U A L R E P O R T T O S H A R E H O L D E R S
BlackRock Total Factor Fund
24
Consolidated Schedule of Investments (unaudited) (continued)January 31, 2022
Shares Value% of Basket
ValueUnited States (continued)CME Group, Inc. . . . . . . . . . . (1,151) $ (264,155) 111.8%Coinbase Global, Inc., Class A (100) (19,015) 8.0Comcast Corp., Class A . . . . . (2,508) (125,375) 53.1Conagra Brands, Inc. . . . . . . . (768) (26,696) 11.3Constellation Brands, Inc., Class
A . . . . . . . . . . . . . . . . . . (1,497) (355,912) 150.7Cooper Cos., Inc. (The) . . . . . (147) (58,550) 24.8Corning, Inc. . . . . . . . . . . . . (800) (33,632) 14.2CoStar Group, Inc. . . . . . . . . (1,400) (98,224) 41.6Crowdstrike Holdings, Inc., Class
A . . . . . . . . . . . . . . . . . . (242) (43,715) 18.5Crown Holdings, Inc. . . . . . . . (1,854) (212,098) 89.8CyberArk Software Ltd. . . . . . (673) (92,302) 39.1Danaher Corp. . . . . . . . . . . . (307) (87,738) 37.1Datadog, Inc., Class A . . . . . . (1,531) (223,694) 94.7Diamondback Energy, Inc. . . . (302) (38,100) 16.1Discovery, Inc., Class A . . . . . (1,431) (39,939) 16.9DISH Network Corp., Class A . (5,747) (180,456) 76.4Dollar General Corp. . . . . . . . (1,633) (340,448) 144.1Dollar Tree, Inc. . . . . . . . . . . (721) (94,610) 40.0DraftKings, Inc., Class A . . . . . (4,459) (98,499) 41.7Eastman Chemical Co. . . . . . (1,545) (183,747) 77.8Eaton Corp. plc . . . . . . . . . . . (549) (86,978) 36.8Elanco Animal Health, Inc. . . . (1,177) (30,649) 13.0Enphase Energy, Inc. . . . . . . . (671) (94,255) 39.9Entegris, Inc. . . . . . . . . . . . . (994) (119,121) 50.4Erie Indemnity Co., Class A . . (1,065) (196,067) 83.0Etsy, Inc. . . . . . . . . . . . . . . . (445) (69,901) 29.6Evergy, Inc. . . . . . . . . . . . . . (1,971) (128,036) 54.2Exact Sciences Corp. . . . . . . (2,945) (224,880) 95.2First Citizens BancShares, Inc.,
Class A . . . . . . . . . . . . . . (91) (70,896) 30.0FirstEnergy Corp. . . . . . . . . . (1,664) (69,821) 29.6Fiserv, Inc. . . . . . . . . . . . . . . (3,829) (404,725) 171.3Fiverr International Ltd. . . . . . (1,620) (138,202) 58.5FleetCor Technologies, Inc. . . . (715) (170,356) 72.1Freeport-McMoRan, Inc. . . . . (1,090) (40,570) 17.2Generac Holdings, Inc. . . . . . (135) (38,121) 16.1General Electric Co. . . . . . . . (3,950) (373,196) 158.0General Motors Co. . . . . . . . . (1,650) (87,005) 36.8Global Payments, Inc. . . . . . . (635) (95,174) 40.3Globe Life, Inc. . . . . . . . . . . . (2,065) (211,250) 89.4Guidewire Software, Inc. . . . . (259) (26,118) 11.1Hasbro, Inc. . . . . . . . . . . . . . (478) (44,205) 18.7HEICO Corp., Class A . . . . . . (1,895) (254,109) 107.6Hilton Worldwide Holdings, Inc. (632) (91,710) 38.8Honeywell International, Inc. . . (636) (130,049) 55.0Horizon Therapeutics plc . . . . (1,283) (119,742) 50.7Hormel Foods Corp. . . . . . . . (3,266) (155,037) 65.6Howmet Aerospace, Inc. . . . . (5,904) (183,555) 77.7Humana, Inc. . . . . . . . . . . . . (292) (114,610) 48.5Huntington Ingalls Industries,
Inc. . . . . . . . . . . . . . . . . . (230) (43,056) 18.2IAC/InterActiveCorp . . . . . . . . (1,151) (157,158) 66.5Insulet Corp. . . . . . . . . . . . . (68) (16,864) 7.1International Business Machines
Corp. . . . . . . . . . . . . . . . (1,222) (163,223) 69.1International Paper Co. . . . . . (7,258) (350,199) 148.2IPG Photonics Corp. . . . . . . . (338) (52,211) 22.1J M Smucker Co. (The) . . . . . (437) (61,433) 26.0Jack Henry & Associates, Inc. . (835) (140,121) 59.3Kellogg Co. . . . . . . . . . . . . . (757) (47,691) 20.2Keurig Dr Pepper, Inc. . . . . . . (4,775) (181,211) 76.7Kimberly-Clark Corp. . . . . . . . (1,952) (268,693) 113.7Kinder Morgan, Inc. . . . . . . . . (1,661) (28,835) 12.2
Shares Value% of Basket
ValueUnited States (continued)Las Vegas Sands Corp. . . . . . (8,098) $ (354,692) 150.1%Lear Corp. . . . . . . . . . . . . . . (658) (110,097) 46.6Leidos Holdings, Inc. . . . . . . . (416) (37,211) 15.7Liberty Broadband Corp., Class
C . . . . . . . . . . . . . . . . . . (3,365) (499,400) 211.4Liberty Media Corp-Liberty
Formula One, Class C . . . . (1,697) (102,210) 43.3Live Nation Entertainment, Inc. (337) (36,905) 15.6Lumen Technologies, Inc. . . . . (2,323) (28,712) 12.2M&T Bank Corp. . . . . . . . . . . (1,579) (267,451) 113.2MarketAxess Holdings, Inc. . . (286) (98,521) 41.7Marriott International, Inc., Class
A . . . . . . . . . . . . . . . . . . (2,626) (423,101) 179.1Martin Marietta Materials, Inc. . (572) (222,577) 94.2Match Group, Inc. . . . . . . . . . (934) (105,262) 44.6McCormick & Co., Inc. (Non-
Voting) . . . . . . . . . . . . . . (489) (49,052) 20.8Medtronic plc . . . . . . . . . . . . (1,082) (111,976) 47.4MGM Resorts International . . . (1,745) (74,546) 31.6Microchip Technology, Inc. . . . (2,599) (201,371) 85.2Mohawk Industries, Inc. . . . . . (221) (34,889) 14.8MongoDB, Inc. . . . . . . . . . . . (42) (17,015) 7.2Netflix, Inc. . . . . . . . . . . . . . . (90) (38,443) 16.3Neurocrine Biosciences, Inc. . . (217) (17,147) 7.3Newell Brands, Inc. . . . . . . . . (1,509) (35,024) 14.8Newmont Corp. . . . . . . . . . . (5,562) (340,228) 144.0NextEra Energy, Inc. . . . . . . . (1,073) (83,823) 35.5Novavax, Inc. . . . . . . . . . . . . (266) (24,924) 10.5NRG Energy, Inc. . . . . . . . . . (2,130) (85,051) 36.0Nucor Corp. . . . . . . . . . . . . . (1,270) (128,778) 54.5Oak Street Health, Inc. . . . . . . (5,351) (93,000) 39.4Occidental Petroleum Corp. . . (3,237) (121,938) 51.6Okta, Inc. . . . . . . . . . . . . . . . (130) (25,726) 10.9Oracle Corp. . . . . . . . . . . . . (1,395) (113,218) 47.9PACCAR, Inc. . . . . . . . . . . . (698) (64,907) 27.5Packaging Corp. of America . . (1,748) (263,301) 111.5Parker-Hannifin Corp. . . . . . . (101) (31,311) 13.3Paycom Software, Inc. . . . . . . (151) (50,630) 21.4PayPal Holdings, Inc. . . . . . . (445) (76,513) 32.4Peloton Interactive, Inc., Class A (1,437) (39,273) 16.6PerkinElmer, Inc. . . . . . . . . . (348) (59,915) 25.4Pfizer, Inc. . . . . . . . . . . . . . . (1,699) (89,520) 37.9Pioneer Natural Resources Co. (383) (83,835) 35.5Plug Power, Inc. . . . . . . . . . . (7,325) (160,198) 67.8PNC Financial Services Group,
Inc. (The) . . . . . . . . . . . . (526) (108,351) 45.9PPG Industries, Inc. . . . . . . . (593) (92,627) 39.2PPL Corp. . . . . . . . . . . . . . . (8,562) (254,120) 107.6Progressive Corp. (The) . . . . . (2,043) (221,992) 94.0Public Service Enterprise Group,
Inc. . . . . . . . . . . . . . . . . . (933) (62,072) 26.3Quest Diagnostics, Inc. . . . . . (276) (37,266) 15.8Republic Services, Inc. . . . . . (4,575) (584,045) 247.2ResMed, Inc. . . . . . . . . . . . . (366) (83,668) 35.4Robinhood Markets, Inc., Class
A . . . . . . . . . . . . . . . . . . (3,953) (55,935) 23.7Roper Technologies, Inc. . . . . (703) (307,323) 130.1Royal Caribbean Cruises Ltd. . (1,835) (142,781) 60.4Royalty Pharma plc, Class A . . (2,384) (95,384) 40.4RPM International, Inc. . . . . . (3,030) (268,488) 113.7S&P Global, Inc. . . . . . . . . . . (296) (122,905) 52.0salesforce.com, Inc. . . . . . . . (473) (110,034) 46.6Schneider Electric SE . . . . . . (1,314) (222,586) 94.2Seagen, Inc. . . . . . . . . . . . . (860) (115,679) 49.0SEI Investments Co. . . . . . . . (1,242) (72,794) 30.8
BNM0322U-2100207-6479109
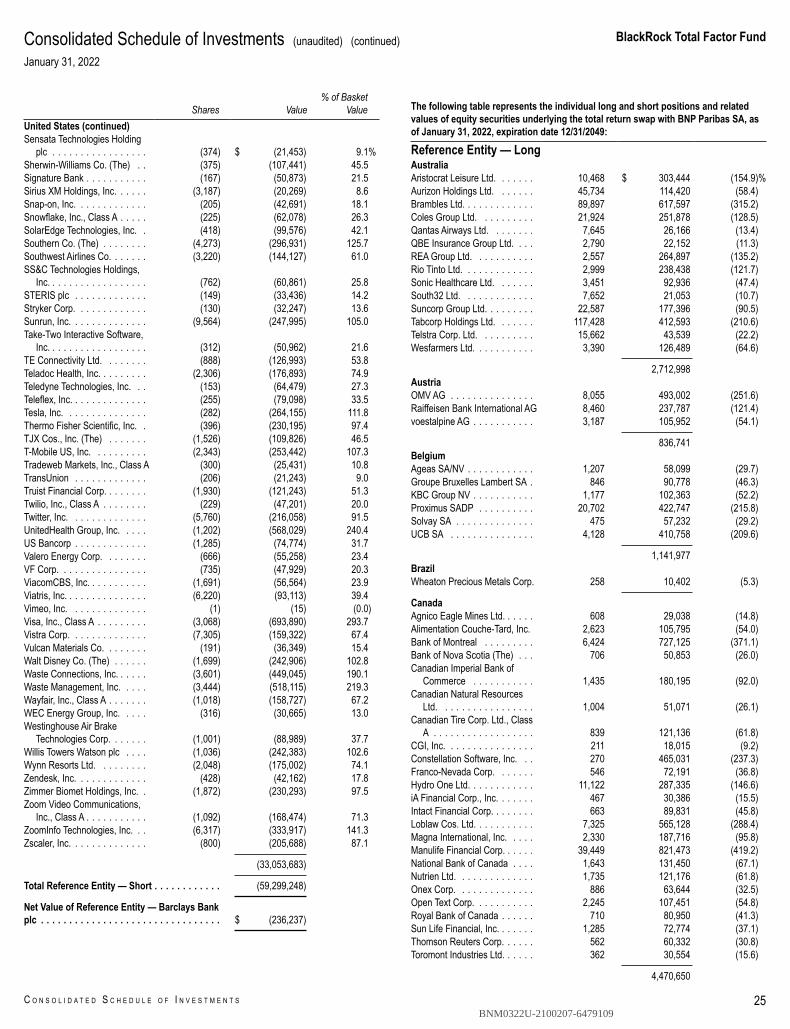
BlackRock Total Factor Fund
C O N S O L I D A T E D S C H E D U L E O F I N V E S T M E N T S 25
Consolidated Schedule of Investments (unaudited) (continued)January 31, 2022
Shares Value% of Basket
ValueUnited States (continued)Sensata Technologies Holding
plc . . . . . . . . . . . . . . . . . (374) $ (21,453) 9.1%Sherwin-Williams Co. (The) . . (375) (107,441) 45.5Signature Bank . . . . . . . . . . . (167) (50,873) 21.5Sirius XM Holdings, Inc. . . . . . (3,187) (20,269) 8.6Snap-on, Inc. . . . . . . . . . . . . (205) (42,691) 18.1Snowflake, Inc., Class A . . . . . (225) (62,078) 26.3SolarEdge Technologies, Inc. . (418) (99,576) 42.1Southern Co. (The) . . . . . . . . (4,273) (296,931) 125.7Southwest Airlines Co. . . . . . . (3,220) (144,127) 61.0SS&C Technologies Holdings,
Inc. . . . . . . . . . . . . . . . . . (762) (60,861) 25.8STERIS plc . . . . . . . . . . . . . (149) (33,436) 14.2Stryker Corp. . . . . . . . . . . . . (130) (32,247) 13.6Sunrun, Inc. . . . . . . . . . . . . . (9,564) (247,995) 105.0Take-Two Interactive Software,
Inc. . . . . . . . . . . . . . . . . . (312) (50,962) 21.6TE Connectivity Ltd. . . . . . . . (888) (126,993) 53.8Teladoc Health, Inc. . . . . . . . . (2,306) (176,893) 74.9Teledyne Technologies, Inc. . . (153) (64,479) 27.3Teleflex, Inc. . . . . . . . . . . . . . (255) (79,098) 33.5Tesla, Inc. . . . . . . . . . . . . . . (282) (264,155) 111.8Thermo Fisher Scientific, Inc. . (396) (230,195) 97.4TJX Cos., Inc. (The) . . . . . . . (1,526) (109,826) 46.5T-Mobile US, Inc. . . . . . . . . . (2,343) (253,442) 107.3Tradeweb Markets, Inc., Class A (300) (25,431) 10.8TransUnion . . . . . . . . . . . . . (206) (21,243) 9.0Truist Financial Corp. . . . . . . . (1,930) (121,243) 51.3Twilio, Inc., Class A . . . . . . . . (229) (47,201) 20.0Twitter, Inc. . . . . . . . . . . . . . (5,760) (216,058) 91.5UnitedHealth Group, Inc. . . . . (1,202) (568,029) 240.4US Bancorp . . . . . . . . . . . . . (1,285) (74,774) 31.7Valero Energy Corp. . . . . . . . (666) (55,258) 23.4VF Corp. . . . . . . . . . . . . . . . (735) (47,929) 20.3ViacomCBS, Inc. . . . . . . . . . . (1,691) (56,564) 23.9Viatris, Inc. . . . . . . . . . . . . . . (6,220) (93,113) 39.4Vimeo, Inc. . . . . . . . . . . . . . (1) (15) (0.0)Visa, Inc., Class A . . . . . . . . . (3,068) (693,890) 293.7Vistra Corp. . . . . . . . . . . . . . (7,305) (159,322) 67.4Vulcan Materials Co. . . . . . . . (191) (36,349) 15.4Walt Disney Co. (The) . . . . . . (1,699) (242,906) 102.8Waste Connections, Inc. . . . . . (3,601) (449,045) 190.1Waste Management, Inc. . . . . (3,444) (518,115) 219.3Wayfair, Inc., Class A . . . . . . . (1,018) (158,727) 67.2WEC Energy Group, Inc. . . . . (316) (30,665) 13.0Westinghouse Air Brake
Technologies Corp. . . . . . . (1,001) (88,989) 37.7Willis Towers Watson plc . . . . (1,036) (242,383) 102.6Wynn Resorts Ltd. . . . . . . . . (2,048) (175,002) 74.1Zendesk, Inc. . . . . . . . . . . . . (428) (42,162) 17.8Zimmer Biomet Holdings, Inc. . (1,872) (230,293) 97.5Zoom Video Communications,
Inc., Class A . . . . . . . . . . . (1,092) (168,474) 71.3ZoomInfo Technologies, Inc. . . (6,317) (333,917) 141.3Zscaler, Inc. . . . . . . . . . . . . . (800) (205,688) 87.1
(33,053,683)
Total Reference Entity — Short . . . . . . . . . . . . (59,299,248)
Net Value of Reference Entity — Barclays Bankplc . . . . . . . . . . . . . . . . . . . . . . . . . . . . . . . . $ (236,237)
The following table represents the individual long and short positions and relatedvalues of equity securities underlying the total return swap with BNP Paribas SA, asof January 31, 2022, expiration date 12/31/2049:
Reference Entity — LongAustraliaAristocrat Leisure Ltd. . . . . . . 10,468 $ 303,444 (154.9)%Aurizon Holdings Ltd. . . . . . . 45,734 114,420 (58.4)Brambles Ltd. . . . . . . . . . . . . 89,897 617,597 (315.2)Coles Group Ltd. . . . . . . . . . 21,924 251,878 (128.5)Qantas Airways Ltd. . . . . . . . 7,645 26,166 (13.4)QBE Insurance Group Ltd. . . . 2,790 22,152 (11.3)REA Group Ltd. . . . . . . . . . . 2,557 264,897 (135.2)Rio Tinto Ltd. . . . . . . . . . . . . 2,999 238,438 (121.7)Sonic Healthcare Ltd. . . . . . . 3,451 92,936 (47.4)South32 Ltd. . . . . . . . . . . . . 7,652 21,053 (10.7)Suncorp Group Ltd. . . . . . . . . 22,587 177,396 (90.5)Tabcorp Holdings Ltd. . . . . . . 117,428 412,593 (210.6)Telstra Corp. Ltd. . . . . . . . . . 15,662 43,539 (22.2)Wesfarmers Ltd. . . . . . . . . . . 3,390 126,489 (64.6)
2,712,998AustriaOMV AG . . . . . . . . . . . . . . . 8,055 493,002 (251.6)Raiffeisen Bank International AG 8,460 237,787 (121.4)voestalpine AG . . . . . . . . . . . 3,187 105,952 (54.1)
836,741BelgiumAgeas SA/NV . . . . . . . . . . . . 1,207 58,099 (29.7)Groupe Bruxelles Lambert SA . 846 90,778 (46.3)KBC Group NV . . . . . . . . . . . 1,177 102,363 (52.2)Proximus SADP . . . . . . . . . . 20,702 422,747 (215.8)Solvay SA . . . . . . . . . . . . . . 475 57,232 (29.2)UCB SA . . . . . . . . . . . . . . . 4,128 410,758 (209.6)
1,141,977BrazilWheaton Precious Metals Corp. 258 10,402 (5.3)
CanadaAgnico Eagle Mines Ltd. . . . . . 608 29,038 (14.8)Alimentation Couche-Tard, Inc. 2,623 105,795 (54.0)Bank of Montreal . . . . . . . . . 6,424 727,125 (371.1)Bank of Nova Scotia (The) . . . 706 50,853 (26.0)Canadian Imperial Bank of
Commerce . . . . . . . . . . . 1,435 180,195 (92.0)Canadian Natural Resources
Ltd. . . . . . . . . . . . . . . . . 1,004 51,071 (26.1)Canadian Tire Corp. Ltd., Class
A . . . . . . . . . . . . . . . . . . 839 121,136 (61.8)CGI, Inc. . . . . . . . . . . . . . . . 211 18,015 (9.2)Constellation Software, Inc. . . 270 465,031 (237.3)Franco-Nevada Corp. . . . . . . 546 72,191 (36.8)Hydro One Ltd. . . . . . . . . . . . 11,122 287,335 (146.6)iA Financial Corp., Inc. . . . . . . 467 30,386 (15.5)Intact Financial Corp. . . . . . . . 663 89,831 (45.8)Loblaw Cos. Ltd. . . . . . . . . . . 7,325 565,128 (288.4)Magna International, Inc. . . . . 2,330 187,716 (95.8)Manulife Financial Corp. . . . . . 39,449 821,473 (419.2)National Bank of Canada . . . . 1,643 131,450 (67.1)Nutrien Ltd. . . . . . . . . . . . . . 1,735 121,176 (61.8)Onex Corp. . . . . . . . . . . . . . 886 63,644 (32.5)Open Text Corp. . . . . . . . . . . 2,245 107,451 (54.8)Royal Bank of Canada . . . . . . 710 80,950 (41.3)Sun Life Financial, Inc. . . . . . . 1,285 72,774 (37.1)Thomson Reuters Corp. . . . . . 562 60,332 (30.8)Toromont Industries Ltd. . . . . . 362 30,554 (15.6)
4,470,650
BNM0322U-2100207-6479109
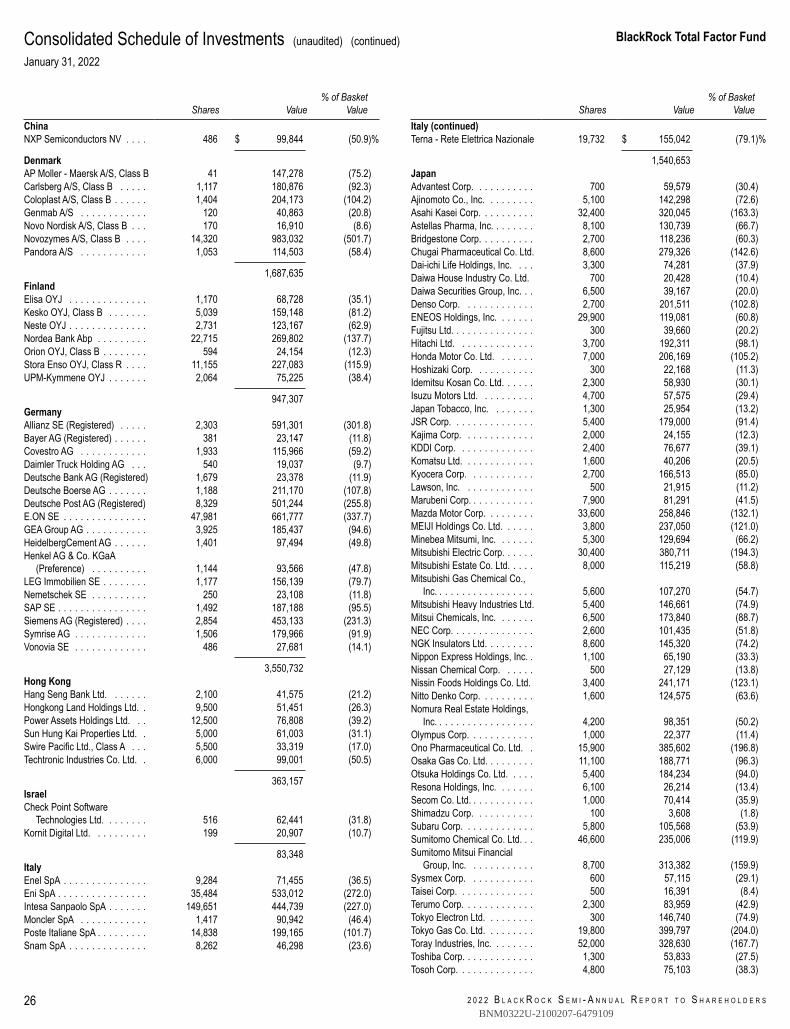
2 0 2 2 B L A C K R O C K S E M I - A N N U A L R E P O R T T O S H A R E H O L D E R S
BlackRock Total Factor Fund
26
Consolidated Schedule of Investments (unaudited) (continued)January 31, 2022
Shares Value% of Basket
ValueChinaNXP Semiconductors NV . . . . 486 $ 99,844 (50.9)%
DenmarkAP Moller - Maersk A/S, Class B 41 147,278 (75.2)Carlsberg A/S, Class B . . . . . 1,117 180,876 (92.3)Coloplast A/S, Class B . . . . . . 1,404 204,173 (104.2)Genmab A/S . . . . . . . . . . . . 120 40,863 (20.8)Novo Nordisk A/S, Class B . . . 170 16,910 (8.6)Novozymes A/S, Class B . . . . 14,320 983,032 (501.7)Pandora A/S . . . . . . . . . . . . 1,053 114,503 (58.4)
1,687,635FinlandElisa OYJ . . . . . . . . . . . . . . 1,170 68,728 (35.1)Kesko OYJ, Class B . . . . . . . 5,039 159,148 (81.2)Neste OYJ . . . . . . . . . . . . . . 2,731 123,167 (62.9)Nordea Bank Abp . . . . . . . . . 22,715 269,802 (137.7)Orion OYJ, Class B . . . . . . . . 594 24,154 (12.3)Stora Enso OYJ, Class R . . . . 11,155 227,083 (115.9)UPM-Kymmene OYJ . . . . . . . 2,064 75,225 (38.4)
947,307GermanyAllianz SE (Registered) . . . . . 2,303 591,301 (301.8)Bayer AG (Registered) . . . . . . 381 23,147 (11.8)Covestro AG . . . . . . . . . . . . 1,933 115,966 (59.2)Daimler Truck Holding AG . . . 540 19,037 (9.7)Deutsche Bank AG (Registered) 1,679 23,378 (11.9)Deutsche Boerse AG . . . . . . . 1,188 211,170 (107.8)Deutsche Post AG (Registered) 8,329 501,244 (255.8)E.ON SE . . . . . . . . . . . . . . . 47,981 661,777 (337.7)GEA Group AG . . . . . . . . . . . 3,925 185,437 (94.6)HeidelbergCement AG . . . . . . 1,401 97,494 (49.8)Henkel AG & Co. KGaA
(Preference) . . . . . . . . . . 1,144 93,566 (47.8)LEG Immobilien SE . . . . . . . . 1,177 156,139 (79.7)Nemetschek SE . . . . . . . . . . 250 23,108 (11.8)SAP SE . . . . . . . . . . . . . . . . 1,492 187,188 (95.5)Siemens AG (Registered) . . . . 2,854 453,133 (231.3)Symrise AG . . . . . . . . . . . . . 1,506 179,966 (91.9)Vonovia SE . . . . . . . . . . . . . 486 27,681 (14.1)
3,550,732Hong KongHang Seng Bank Ltd. . . . . . . 2,100 41,575 (21.2)Hongkong Land Holdings Ltd. . 9,500 51,451 (26.3)Power Assets Holdings Ltd. . . 12,500 76,808 (39.2)Sun Hung Kai Properties Ltd. . 5,000 61,003 (31.1)Swire Pacific Ltd., Class A . . . 5,500 33,319 (17.0)Techtronic Industries Co. Ltd. . 6,000 99,001 (50.5)
363,157IsraelCheck Point Software
Technologies Ltd. . . . . . . . 516 62,441 (31.8)Kornit Digital Ltd. . . . . . . . . . 199 20,907 (10.7)
83,348ItalyEnel SpA . . . . . . . . . . . . . . . 9,284 71,455 (36.5)Eni SpA . . . . . . . . . . . . . . . . 35,484 533,012 (272.0)Intesa Sanpaolo SpA . . . . . . . 149,651 444,739 (227.0)Moncler SpA . . . . . . . . . . . . 1,417 90,942 (46.4)Poste Italiane SpA . . . . . . . . . 14,838 199,165 (101.7)Snam SpA . . . . . . . . . . . . . . 8,262 46,298 (23.6)
Shares Value% of Basket
ValueItaly (continued)Terna - Rete Elettrica Nazionale 19,732 $ 155,042 (79.1)%
1,540,653JapanAdvantest Corp. . . . . . . . . . . 700 59,579 (30.4)Ajinomoto Co., Inc. . . . . . . . . 5,100 142,298 (72.6)Asahi Kasei Corp. . . . . . . . . . 32,400 320,045 (163.3)Astellas Pharma, Inc. . . . . . . . 8,100 130,739 (66.7)Bridgestone Corp. . . . . . . . . . 2,700 118,236 (60.3)Chugai Pharmaceutical Co. Ltd. 8,600 279,326 (142.6)Dai-ichi Life Holdings, Inc. . . . 3,300 74,281 (37.9)Daiwa House Industry Co. Ltd. 700 20,428 (10.4)Daiwa Securities Group, Inc. . . 6,500 39,167 (20.0)Denso Corp. . . . . . . . . . . . . 2,700 201,511 (102.8)ENEOS Holdings, Inc. . . . . . . 29,900 119,081 (60.8)Fujitsu Ltd. . . . . . . . . . . . . . . 300 39,660 (20.2)Hitachi Ltd. . . . . . . . . . . . . . 3,700 192,311 (98.1)Honda Motor Co. Ltd. . . . . . . 7,000 206,169 (105.2)Hoshizaki Corp. . . . . . . . . . . 300 22,168 (11.3)Idemitsu Kosan Co. Ltd. . . . . . 2,300 58,930 (30.1)Isuzu Motors Ltd. . . . . . . . . . 4,700 57,575 (29.4)Japan Tobacco, Inc. . . . . . . . 1,300 25,954 (13.2)JSR Corp. . . . . . . . . . . . . . . 5,400 179,000 (91.4)Kajima Corp. . . . . . . . . . . . . 2,000 24,155 (12.3)KDDI Corp. . . . . . . . . . . . . . 2,400 76,677 (39.1)Komatsu Ltd. . . . . . . . . . . . . 1,600 40,206 (20.5)Kyocera Corp. . . . . . . . . . . . 2,700 166,513 (85.0)Lawson, Inc. . . . . . . . . . . . . 500 21,915 (11.2)Marubeni Corp. . . . . . . . . . . . 7,900 81,291 (41.5)Mazda Motor Corp. . . . . . . . . 33,600 258,846 (132.1)MEIJI Holdings Co. Ltd. . . . . . 3,800 237,050 (121.0)Minebea Mitsumi, Inc. . . . . . . 5,300 129,694 (66.2)Mitsubishi Electric Corp. . . . . . 30,400 380,711 (194.3)Mitsubishi Estate Co. Ltd. . . . . 8,000 115,219 (58.8)Mitsubishi Gas Chemical Co.,
Inc. . . . . . . . . . . . . . . . . . 5,600 107,270 (54.7)Mitsubishi Heavy Industries Ltd. 5,400 146,661 (74.9)Mitsui Chemicals, Inc. . . . . . . 6,500 173,840 (88.7)NEC Corp. . . . . . . . . . . . . . . 2,600 101,435 (51.8)NGK Insulators Ltd. . . . . . . . . 8,600 145,320 (74.2)Nippon Express Holdings, Inc. . 1,100 65,190 (33.3)Nissan Chemical Corp. . . . . . 500 27,129 (13.8)Nissin Foods Holdings Co. Ltd. 3,400 241,171 (123.1)Nitto Denko Corp. . . . . . . . . . 1,600 124,575 (63.6)Nomura Real Estate Holdings,
Inc. . . . . . . . . . . . . . . . . . 4,200 98,351 (50.2)Olympus Corp. . . . . . . . . . . . 1,000 22,377 (11.4)Ono Pharmaceutical Co. Ltd. . 15,900 385,602 (196.8)Osaka Gas Co. Ltd. . . . . . . . . 11,100 188,771 (96.3)Otsuka Holdings Co. Ltd. . . . . 5,400 184,234 (94.0)Resona Holdings, Inc. . . . . . . 6,100 26,214 (13.4)Secom Co. Ltd. . . . . . . . . . . . 1,000 70,414 (35.9)Shimadzu Corp. . . . . . . . . . . 100 3,608 (1.8)Subaru Corp. . . . . . . . . . . . . 5,800 105,568 (53.9)Sumitomo Chemical Co. Ltd. . . 46,600 235,006 (119.9)Sumitomo Mitsui Financial
Group, Inc. . . . . . . . . . . . 8,700 313,382 (159.9)Sysmex Corp. . . . . . . . . . . . 600 57,115 (29.1)Taisei Corp. . . . . . . . . . . . . . 500 16,391 (8.4)Terumo Corp. . . . . . . . . . . . . 2,300 83,959 (42.9)Tokyo Electron Ltd. . . . . . . . . 300 146,740 (74.9)Tokyo Gas Co. Ltd. . . . . . . . . 19,800 399,797 (204.0)Toray Industries, Inc. . . . . . . . 52,000 328,630 (167.7)Toshiba Corp. . . . . . . . . . . . . 1,300 53,833 (27.5)Tosoh Corp. . . . . . . . . . . . . . 4,800 75,103 (38.3)
BNM0322U-2100207-6479109
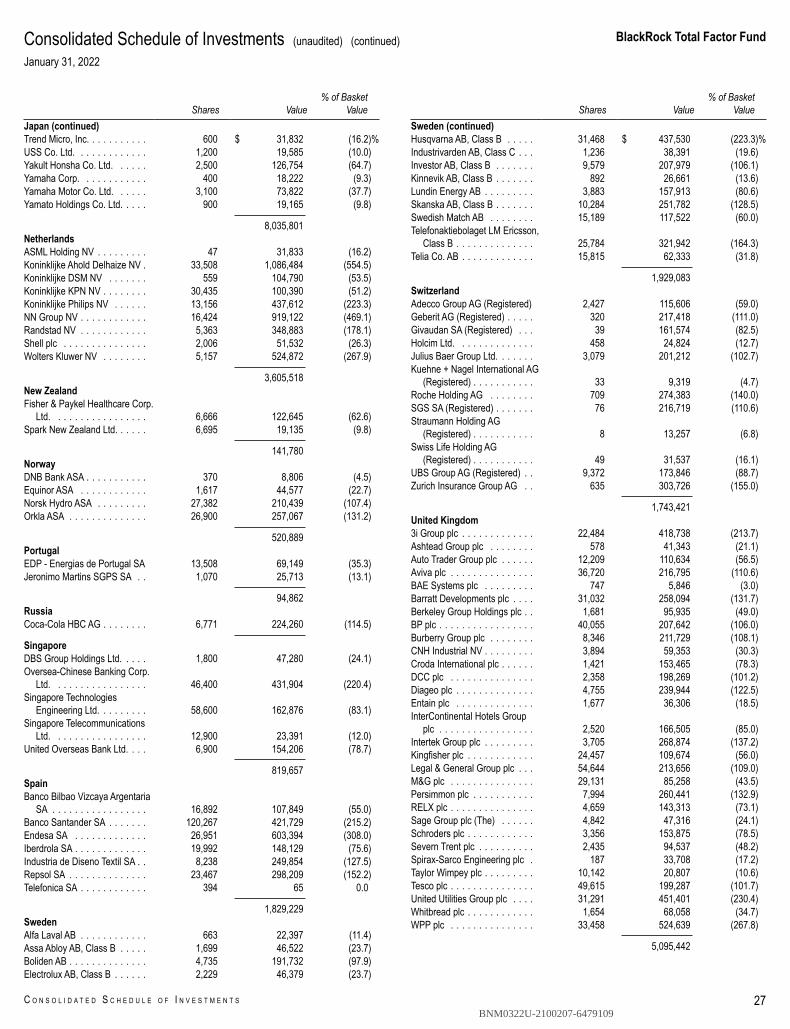
BlackRock Total Factor Fund
C O N S O L I D A T E D S C H E D U L E O F I N V E S T M E N T S 27
Consolidated Schedule of Investments (unaudited) (continued)January 31, 2022
Shares Value% of Basket
ValueJapan (continued)Trend Micro, Inc. . . . . . . . . . . 600 $ 31,832 (16.2)%USS Co. Ltd. . . . . . . . . . . . . 1,200 19,585 (10.0)Yakult Honsha Co. Ltd. . . . . . 2,500 126,754 (64.7)Yamaha Corp. . . . . . . . . . . . 400 18,222 (9.3)Yamaha Motor Co. Ltd. . . . . . 3,100 73,822 (37.7)Yamato Holdings Co. Ltd. . . . . 900 19,165 (9.8)
8,035,801NetherlandsASML Holding NV . . . . . . . . . 47 31,833 (16.2)Koninklijke Ahold Delhaize NV . 33,508 1,086,484 (554.5)Koninklijke DSM NV . . . . . . . 559 104,790 (53.5)Koninklijke KPN NV . . . . . . . . 30,435 100,390 (51.2)Koninklijke Philips NV . . . . . . 13,156 437,612 (223.3)NN Group NV . . . . . . . . . . . . 16,424 919,122 (469.1)Randstad NV . . . . . . . . . . . . 5,363 348,883 (178.1)Shell plc . . . . . . . . . . . . . . . 2,006 51,532 (26.3)Wolters Kluwer NV . . . . . . . . 5,157 524,872 (267.9)
3,605,518New ZealandFisher & Paykel Healthcare Corp.
Ltd. . . . . . . . . . . . . . . . . 6,666 122,645 (62.6)Spark New Zealand Ltd. . . . . . 6,695 19,135 (9.8)
141,780NorwayDNB Bank ASA . . . . . . . . . . . 370 8,806 (4.5)Equinor ASA . . . . . . . . . . . . 1,617 44,577 (22.7)Norsk Hydro ASA . . . . . . . . . 27,382 210,439 (107.4)Orkla ASA . . . . . . . . . . . . . . 26,900 257,067 (131.2)
520,889PortugalEDP - Energias de Portugal SA 13,508 69,149 (35.3)Jeronimo Martins SGPS SA . . 1,070 25,713 (13.1)
94,862RussiaCoca-Cola HBC AG . . . . . . . . 6,771 224,260 (114.5)
SingaporeDBS Group Holdings Ltd. . . . . 1,800 47,280 (24.1)Oversea-Chinese Banking Corp.
Ltd. . . . . . . . . . . . . . . . . 46,400 431,904 (220.4)Singapore Technologies
Engineering Ltd. . . . . . . . . 58,600 162,876 (83.1)Singapore Telecommunications
Ltd. . . . . . . . . . . . . . . . . 12,900 23,391 (12.0)United Overseas Bank Ltd. . . . 6,900 154,206 (78.7)
819,657SpainBanco Bilbao Vizcaya Argentaria
SA . . . . . . . . . . . . . . . . . 16,892 107,849 (55.0)Banco Santander SA . . . . . . . 120,267 421,729 (215.2)Endesa SA . . . . . . . . . . . . . 26,951 603,394 (308.0)Iberdrola SA . . . . . . . . . . . . . 19,992 148,129 (75.6)Industria de Diseno Textil SA . . 8,238 249,854 (127.5)Repsol SA . . . . . . . . . . . . . . 23,467 298,209 (152.2)Telefonica SA . . . . . . . . . . . . 394 65 0.0
1,829,229SwedenAlfa Laval AB . . . . . . . . . . . . 663 22,397 (11.4)Assa Abloy AB, Class B . . . . . 1,699 46,522 (23.7)Boliden AB . . . . . . . . . . . . . . 4,735 191,732 (97.9)Electrolux AB, Class B . . . . . . 2,229 46,379 (23.7)
Shares Value% of Basket
ValueSweden (continued)Husqvarna AB, Class B . . . . . 31,468 $ 437,530 (223.3)%Industrivarden AB, Class C . . . 1,236 38,391 (19.6)Investor AB, Class B . . . . . . . 9,579 207,979 (106.1)Kinnevik AB, Class B . . . . . . . 892 26,661 (13.6)Lundin Energy AB . . . . . . . . . 3,883 157,913 (80.6)Skanska AB, Class B . . . . . . . 10,284 251,782 (128.5)Swedish Match AB . . . . . . . . 15,189 117,522 (60.0)Telefonaktiebolaget LM Ericsson,
Class B . . . . . . . . . . . . . . 25,784 321,942 (164.3)Telia Co. AB . . . . . . . . . . . . . 15,815 62,333 (31.8)
1,929,083SwitzerlandAdecco Group AG (Registered) 2,427 115,606 (59.0)Geberit AG (Registered) . . . . . 320 217,418 (111.0)Givaudan SA (Registered) . . . 39 161,574 (82.5)Holcim Ltd. . . . . . . . . . . . . . 458 24,824 (12.7)Julius Baer Group Ltd. . . . . . . 3,079 201,212 (102.7)Kuehne + Nagel International AG
(Registered) . . . . . . . . . . . 33 9,319 (4.7)Roche Holding AG . . . . . . . . 709 274,383 (140.0)SGS SA (Registered) . . . . . . . 76 216,719 (110.6)Straumann Holding AG
(Registered) . . . . . . . . . . . 8 13,257 (6.8)Swiss Life Holding AG
(Registered) . . . . . . . . . . . 49 31,537 (16.1)UBS Group AG (Registered) . . 9,372 173,846 (88.7)Zurich Insurance Group AG . . 635 303,726 (155.0)
1,743,421United Kingdom3i Group plc . . . . . . . . . . . . . 22,484 418,738 (213.7)Ashtead Group plc . . . . . . . . 578 41,343 (21.1)Auto Trader Group plc . . . . . . 12,209 110,634 (56.5)Aviva plc . . . . . . . . . . . . . . . 36,720 216,795 (110.6)BAE Systems plc . . . . . . . . . 747 5,846 (3.0)Barratt Developments plc . . . . 31,032 258,094 (131.7)Berkeley Group Holdings plc . . 1,681 95,935 (49.0)BP plc . . . . . . . . . . . . . . . . . 40,055 207,642 (106.0)Burberry Group plc . . . . . . . . 8,346 211,729 (108.1)CNH Industrial NV . . . . . . . . . 3,894 59,353 (30.3)Croda International plc . . . . . . 1,421 153,465 (78.3)DCC plc . . . . . . . . . . . . . . . 2,358 198,269 (101.2)Diageo plc . . . . . . . . . . . . . . 4,755 239,944 (122.5)Entain plc . . . . . . . . . . . . . . 1,677 36,306 (18.5)InterContinental Hotels Group
plc . . . . . . . . . . . . . . . . . 2,520 166,505 (85.0)Intertek Group plc . . . . . . . . . 3,705 268,874 (137.2)Kingfisher plc . . . . . . . . . . . . 24,457 109,674 (56.0)Legal & General Group plc . . . 54,644 213,656 (109.0)M&G plc . . . . . . . . . . . . . . . 29,131 85,258 (43.5)Persimmon plc . . . . . . . . . . . 7,994 260,441 (132.9)RELX plc . . . . . . . . . . . . . . . 4,659 143,313 (73.1)Sage Group plc (The) . . . . . . 4,842 47,316 (24.1)Schroders plc . . . . . . . . . . . . 3,356 153,875 (78.5)Severn Trent plc . . . . . . . . . . 2,435 94,537 (48.2)Spirax-Sarco Engineering plc . 187 33,708 (17.2)Taylor Wimpey plc . . . . . . . . . 10,142 20,807 (10.6)Tesco plc . . . . . . . . . . . . . . . 49,615 199,287 (101.7)United Utilities Group plc . . . . 31,291 451,401 (230.4)Whitbread plc . . . . . . . . . . . . 1,654 68,058 (34.7)WPP plc . . . . . . . . . . . . . . . 33,458 524,639 (267.8)
5,095,442
BNM0322U-2100207-6479109
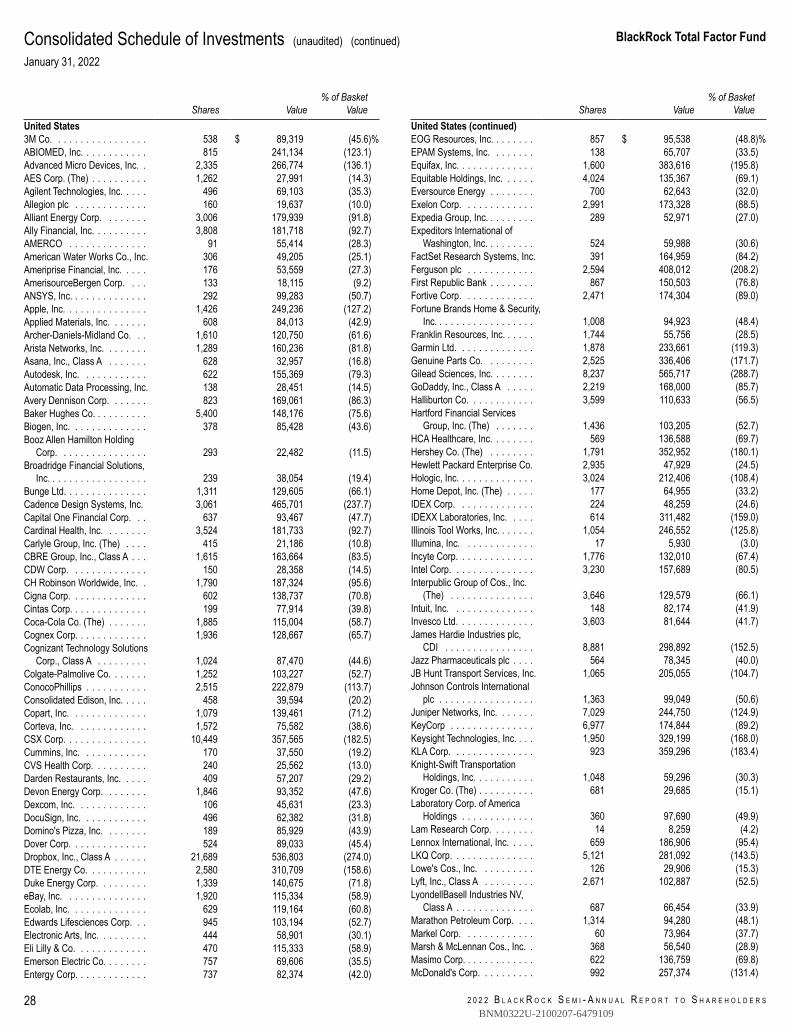
2 0 2 2 B L A C K R O C K S E M I - A N N U A L R E P O R T T O S H A R E H O L D E R S
BlackRock Total Factor Fund
28
Consolidated Schedule of Investments (unaudited) (continued)January 31, 2022
Shares Value% of Basket
ValueUnited States3M Co. . . . . . . . . . . . . . . . . 538 $ 89,319 (45.6)%ABIOMED, Inc. . . . . . . . . . . . 815 241,134 (123.1)Advanced Micro Devices, Inc. . 2,335 266,774 (136.1)AES Corp. (The) . . . . . . . . . . 1,262 27,991 (14.3)Agilent Technologies, Inc. . . . . 496 69,103 (35.3)Allegion plc . . . . . . . . . . . . . 160 19,637 (10.0)Alliant Energy Corp. . . . . . . . 3,006 179,939 (91.8)Ally Financial, Inc. . . . . . . . . . 3,808 181,718 (92.7)AMERCO . . . . . . . . . . . . . . 91 55,414 (28.3)American Water Works Co., Inc. 306 49,205 (25.1)Ameriprise Financial, Inc. . . . . 176 53,559 (27.3)AmerisourceBergen Corp. . . . 133 18,115 (9.2)ANSYS, Inc. . . . . . . . . . . . . . 292 99,283 (50.7)Apple, Inc. . . . . . . . . . . . . . . 1,426 249,236 (127.2)Applied Materials, Inc. . . . . . . 608 84,013 (42.9)Archer-Daniels-Midland Co. . . 1,610 120,750 (61.6)Arista Networks, Inc. . . . . . . . 1,289 160,236 (81.8)Asana, Inc., Class A . . . . . . . 628 32,957 (16.8)Autodesk, Inc. . . . . . . . . . . . 622 155,369 (79.3)Automatic Data Processing, Inc. 138 28,451 (14.5)Avery Dennison Corp. . . . . . . 823 169,061 (86.3)Baker Hughes Co. . . . . . . . . . 5,400 148,176 (75.6)Biogen, Inc. . . . . . . . . . . . . . 378 85,428 (43.6)Booz Allen Hamilton Holding
Corp. . . . . . . . . . . . . . . . 293 22,482 (11.5)Broadridge Financial Solutions,
Inc. . . . . . . . . . . . . . . . . . 239 38,054 (19.4)Bunge Ltd. . . . . . . . . . . . . . . 1,311 129,605 (66.1)Cadence Design Systems, Inc. 3,061 465,701 (237.7)Capital One Financial Corp. . . 637 93,467 (47.7)Cardinal Health, Inc. . . . . . . . 3,524 181,733 (92.7)Carlyle Group, Inc. (The) . . . . 415 21,186 (10.8)CBRE Group, Inc., Class A . . . 1,615 163,664 (83.5)CDW Corp. . . . . . . . . . . . . . 150 28,358 (14.5)CH Robinson Worldwide, Inc. . 1,790 187,324 (95.6)Cigna Corp. . . . . . . . . . . . . . 602 138,737 (70.8)Cintas Corp. . . . . . . . . . . . . . 199 77,914 (39.8)Coca-Cola Co. (The) . . . . . . . 1,885 115,004 (58.7)Cognex Corp. . . . . . . . . . . . . 1,936 128,667 (65.7)Cognizant Technology Solutions
Corp., Class A . . . . . . . . . 1,024 87,470 (44.6)Colgate-Palmolive Co. . . . . . . 1,252 103,227 (52.7)ConocoPhillips . . . . . . . . . . . 2,515 222,879 (113.7)Consolidated Edison, Inc. . . . . 458 39,594 (20.2)Copart, Inc. . . . . . . . . . . . . . 1,079 139,461 (71.2)Corteva, Inc. . . . . . . . . . . . . 1,572 75,582 (38.6)CSX Corp. . . . . . . . . . . . . . . 10,449 357,565 (182.5)Cummins, Inc. . . . . . . . . . . . 170 37,550 (19.2)CVS Health Corp. . . . . . . . . . 240 25,562 (13.0)Darden Restaurants, Inc. . . . . 409 57,207 (29.2)Devon Energy Corp. . . . . . . . 1,846 93,352 (47.6)Dexcom, Inc. . . . . . . . . . . . . 106 45,631 (23.3)DocuSign, Inc. . . . . . . . . . . . 496 62,382 (31.8)Domino's Pizza, Inc. . . . . . . . 189 85,929 (43.9)Dover Corp. . . . . . . . . . . . . . 524 89,033 (45.4)Dropbox, Inc., Class A . . . . . . 21,689 536,803 (274.0)DTE Energy Co. . . . . . . . . . . 2,580 310,709 (158.6)Duke Energy Corp. . . . . . . . . 1,339 140,675 (71.8)eBay, Inc. . . . . . . . . . . . . . . 1,920 115,334 (58.9)Ecolab, Inc. . . . . . . . . . . . . . 629 119,164 (60.8)Edwards Lifesciences Corp. . . 945 103,194 (52.7)Electronic Arts, Inc. . . . . . . . . 444 58,901 (30.1)Eli Lilly & Co. . . . . . . . . . . . . 470 115,333 (58.9)Emerson Electric Co. . . . . . . . 757 69,606 (35.5)Entergy Corp. . . . . . . . . . . . . 737 82,374 (42.0)
Shares Value% of Basket
ValueUnited States (continued)EOG Resources, Inc. . . . . . . . 857 $ 95,538 (48.8)%EPAM Systems, Inc. . . . . . . . 138 65,707 (33.5)Equifax, Inc. . . . . . . . . . . . . . 1,600 383,616 (195.8)Equitable Holdings, Inc. . . . . . 4,024 135,367 (69.1)Eversource Energy . . . . . . . . 700 62,643 (32.0)Exelon Corp. . . . . . . . . . . . . 2,991 173,328 (88.5)Expedia Group, Inc. . . . . . . . . 289 52,971 (27.0)Expeditors International of
Washington, Inc. . . . . . . . . 524 59,988 (30.6)FactSet Research Systems, Inc. 391 164,959 (84.2)Ferguson plc . . . . . . . . . . . . 2,594 408,012 (208.2)First Republic Bank . . . . . . . . 867 150,503 (76.8)Fortive Corp. . . . . . . . . . . . . 2,471 174,304 (89.0)Fortune Brands Home & Security,
Inc. . . . . . . . . . . . . . . . . . 1,008 94,923 (48.4)Franklin Resources, Inc. . . . . . 1,744 55,756 (28.5)Garmin Ltd. . . . . . . . . . . . . . 1,878 233,661 (119.3)Genuine Parts Co. . . . . . . . . 2,525 336,406 (171.7)Gilead Sciences, Inc. . . . . . . . 8,237 565,717 (288.7)GoDaddy, Inc., Class A . . . . . 2,219 168,000 (85.7)Halliburton Co. . . . . . . . . . . . 3,599 110,633 (56.5)Hartford Financial Services
Group, Inc. (The) . . . . . . . 1,436 103,205 (52.7)HCA Healthcare, Inc. . . . . . . . 569 136,588 (69.7)Hershey Co. (The) . . . . . . . . 1,791 352,952 (180.1)Hewlett Packard Enterprise Co. 2,935 47,929 (24.5)Hologic, Inc. . . . . . . . . . . . . . 3,024 212,406 (108.4)Home Depot, Inc. (The) . . . . . 177 64,955 (33.2)IDEX Corp. . . . . . . . . . . . . . 224 48,259 (24.6)IDEXX Laboratories, Inc. . . . . 614 311,482 (159.0)Illinois Tool Works, Inc. . . . . . . 1,054 246,552 (125.8)Illumina, Inc. . . . . . . . . . . . . 17 5,930 (3.0)Incyte Corp. . . . . . . . . . . . . . 1,776 132,010 (67.4)Intel Corp. . . . . . . . . . . . . . . 3,230 157,689 (80.5)Interpublic Group of Cos., Inc.
(The) . . . . . . . . . . . . . . . 3,646 129,579 (66.1)Intuit, Inc. . . . . . . . . . . . . . . 148 82,174 (41.9)Invesco Ltd. . . . . . . . . . . . . . 3,603 81,644 (41.7)James Hardie Industries plc,
CDI . . . . . . . . . . . . . . . . 8,881 298,892 (152.5)Jazz Pharmaceuticals plc . . . . 564 78,345 (40.0)JB Hunt Transport Services, Inc. 1,065 205,055 (104.7)Johnson Controls International
plc . . . . . . . . . . . . . . . . . 1,363 99,049 (50.6)Juniper Networks, Inc. . . . . . . 7,029 244,750 (124.9)KeyCorp . . . . . . . . . . . . . . . 6,977 174,844 (89.2)Keysight Technologies, Inc. . . . 1,950 329,199 (168.0)KLA Corp. . . . . . . . . . . . . . . 923 359,296 (183.4)Knight-Swift Transportation
Holdings, Inc. . . . . . . . . . . 1,048 59,296 (30.3)Kroger Co. (The) . . . . . . . . . . 681 29,685 (15.1)Laboratory Corp. of America
Holdings . . . . . . . . . . . . . 360 97,690 (49.9)Lam Research Corp. . . . . . . . 14 8,259 (4.2)Lennox International, Inc. . . . . 659 186,906 (95.4)LKQ Corp. . . . . . . . . . . . . . . 5,121 281,092 (143.5)Lowe's Cos., Inc. . . . . . . . . . 126 29,906 (15.3)Lyft, Inc., Class A . . . . . . . . . 2,671 102,887 (52.5)LyondellBasell Industries NV,
Class A . . . . . . . . . . . . . . 687 66,454 (33.9)Marathon Petroleum Corp. . . . 1,314 94,280 (48.1)Markel Corp. . . . . . . . . . . . . 60 73,964 (37.7)Marsh & McLennan Cos., Inc. . 368 56,540 (28.9)Masimo Corp. . . . . . . . . . . . . 622 136,759 (69.8)McDonald's Corp. . . . . . . . . . 992 257,374 (131.4)
BNM0322U-2100207-6479109
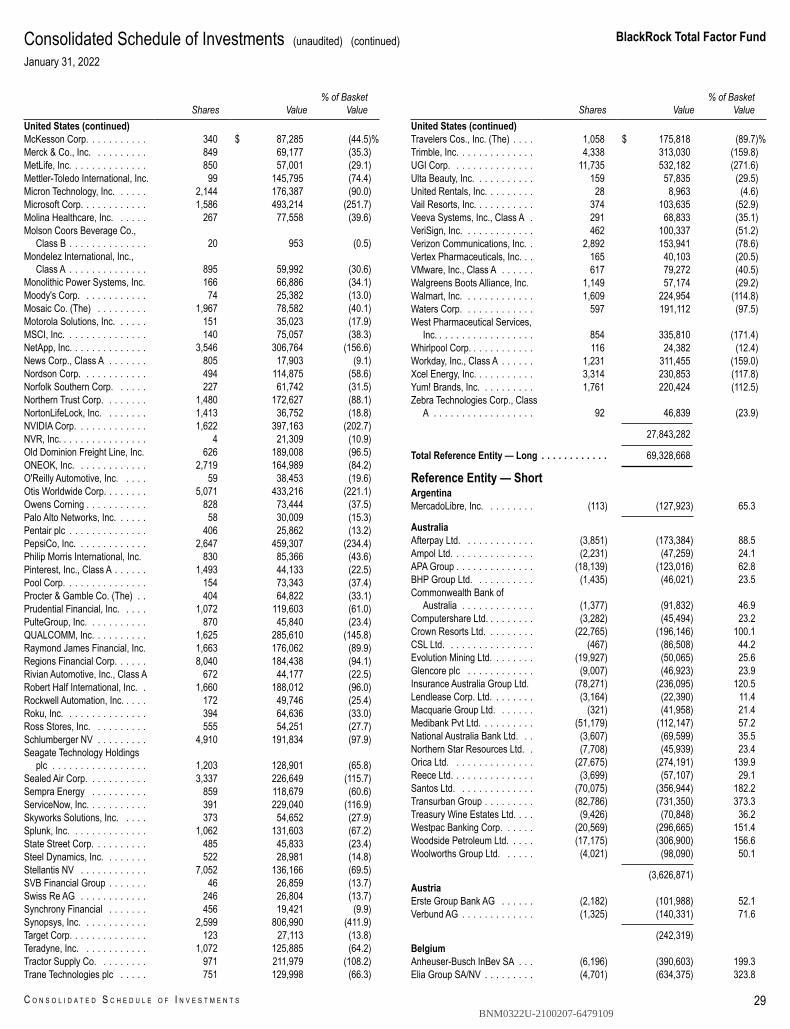
BlackRock Total Factor Fund
C O N S O L I D A T E D S C H E D U L E O F I N V E S T M E N T S 29
Consolidated Schedule of Investments (unaudited) (continued)January 31, 2022
Shares Value% of Basket
ValueUnited States (continued)McKesson Corp. . . . . . . . . . . 340 $ 87,285 (44.5)%Merck & Co., Inc. . . . . . . . . . 849 69,177 (35.3)MetLife, Inc. . . . . . . . . . . . . . 850 57,001 (29.1)Mettler-Toledo International, Inc. 99 145,795 (74.4)Micron Technology, Inc. . . . . . 2,144 176,387 (90.0)Microsoft Corp. . . . . . . . . . . . 1,586 493,214 (251.7)Molina Healthcare, Inc. . . . . . 267 77,558 (39.6)Molson Coors Beverage Co.,
Class B . . . . . . . . . . . . . . 20 953 (0.5)Mondelez International, Inc.,
Class A . . . . . . . . . . . . . . 895 59,992 (30.6)Monolithic Power Systems, Inc. 166 66,886 (34.1)Moody's Corp. . . . . . . . . . . . 74 25,382 (13.0)Mosaic Co. (The) . . . . . . . . . 1,967 78,582 (40.1)Motorola Solutions, Inc. . . . . . 151 35,023 (17.9)MSCI, Inc. . . . . . . . . . . . . . . 140 75,057 (38.3)NetApp, Inc. . . . . . . . . . . . . . 3,546 306,764 (156.6)News Corp., Class A . . . . . . . 805 17,903 (9.1)Nordson Corp. . . . . . . . . . . . 494 114,875 (58.6)Norfolk Southern Corp. . . . . . 227 61,742 (31.5)Northern Trust Corp. . . . . . . . 1,480 172,627 (88.1)NortonLifeLock, Inc. . . . . . . . 1,413 36,752 (18.8)NVIDIA Corp. . . . . . . . . . . . . 1,622 397,163 (202.7)NVR, Inc. . . . . . . . . . . . . . . . 4 21,309 (10.9)Old Dominion Freight Line, Inc. 626 189,008 (96.5)ONEOK, Inc. . . . . . . . . . . . . 2,719 164,989 (84.2)O'Reilly Automotive, Inc. . . . . 59 38,453 (19.6)Otis Worldwide Corp. . . . . . . . 5,071 433,216 (221.1)Owens Corning . . . . . . . . . . . 828 73,444 (37.5)Palo Alto Networks, Inc. . . . . . 58 30,009 (15.3)Pentair plc . . . . . . . . . . . . . . 406 25,862 (13.2)PepsiCo, Inc. . . . . . . . . . . . . 2,647 459,307 (234.4)Philip Morris International, Inc. 830 85,366 (43.6)Pinterest, Inc., Class A . . . . . . 1,493 44,133 (22.5)Pool Corp. . . . . . . . . . . . . . . 154 73,343 (37.4)Procter & Gamble Co. (The) . . 404 64,822 (33.1)Prudential Financial, Inc. . . . . 1,072 119,603 (61.0)PulteGroup, Inc. . . . . . . . . . . 870 45,840 (23.4)QUALCOMM, Inc. . . . . . . . . . 1,625 285,610 (145.8)Raymond James Financial, Inc. 1,663 176,062 (89.9)Regions Financial Corp. . . . . . 8,040 184,438 (94.1)Rivian Automotive, Inc., Class A 672 44,177 (22.5)Robert Half International, Inc. . 1,660 188,012 (96.0)Rockwell Automation, Inc. . . . . 172 49,746 (25.4)Roku, Inc. . . . . . . . . . . . . . . 394 64,636 (33.0)Ross Stores, Inc. . . . . . . . . . 555 54,251 (27.7)Schlumberger NV . . . . . . . . . 4,910 191,834 (97.9)Seagate Technology Holdings
plc . . . . . . . . . . . . . . . . . 1,203 128,901 (65.8)Sealed Air Corp. . . . . . . . . . . 3,337 226,649 (115.7)Sempra Energy . . . . . . . . . . 859 118,679 (60.6)ServiceNow, Inc. . . . . . . . . . . 391 229,040 (116.9)Skyworks Solutions, Inc. . . . . 373 54,652 (27.9)Splunk, Inc. . . . . . . . . . . . . . 1,062 131,603 (67.2)State Street Corp. . . . . . . . . . 485 45,833 (23.4)Steel Dynamics, Inc. . . . . . . . 522 28,981 (14.8)Stellantis NV . . . . . . . . . . . . 7,052 136,166 (69.5)SVB Financial Group . . . . . . . 46 26,859 (13.7)Swiss Re AG . . . . . . . . . . . . 246 26,804 (13.7)Synchrony Financial . . . . . . . 456 19,421 (9.9)Synopsys, Inc. . . . . . . . . . . . 2,599 806,990 (411.9)Target Corp. . . . . . . . . . . . . . 123 27,113 (13.8)Teradyne, Inc. . . . . . . . . . . . 1,072 125,885 (64.2)Tractor Supply Co. . . . . . . . . 971 211,979 (108.2)Trane Technologies plc . . . . . 751 129,998 (66.3)
Shares Value% of Basket
ValueUnited States (continued)Travelers Cos., Inc. (The) . . . . 1,058 $ 175,818 (89.7)%Trimble, Inc. . . . . . . . . . . . . . 4,338 313,030 (159.8)UGI Corp. . . . . . . . . . . . . . . 11,735 532,182 (271.6)Ulta Beauty, Inc. . . . . . . . . . . 159 57,835 (29.5)United Rentals, Inc. . . . . . . . . 28 8,963 (4.6)Vail Resorts, Inc. . . . . . . . . . . 374 103,635 (52.9)Veeva Systems, Inc., Class A . 291 68,833 (35.1)VeriSign, Inc. . . . . . . . . . . . . 462 100,337 (51.2)Verizon Communications, Inc. . 2,892 153,941 (78.6)Vertex Pharmaceuticals, Inc. . . 165 40,103 (20.5)VMware, Inc., Class A . . . . . . 617 79,272 (40.5)Walgreens Boots Alliance, Inc. 1,149 57,174 (29.2)Walmart, Inc. . . . . . . . . . . . . 1,609 224,954 (114.8)Waters Corp. . . . . . . . . . . . . 597 191,112 (97.5)West Pharmaceutical Services,
Inc. . . . . . . . . . . . . . . . . . 854 335,810 (171.4)Whirlpool Corp. . . . . . . . . . . . 116 24,382 (12.4)Workday, Inc., Class A . . . . . . 1,231 311,455 (159.0)Xcel Energy, Inc. . . . . . . . . . . 3,314 230,853 (117.8)Yum! Brands, Inc. . . . . . . . . . 1,761 220,424 (112.5)Zebra Technologies Corp., Class
A . . . . . . . . . . . . . . . . . . 92 46,839 (23.9)
27,843,282
Total Reference Entity — Long . . . . . . . . . . . . 69,328,668
Reference Entity — ShortArgentinaMercadoLibre, Inc. . . . . . . . . (113) (127,923) 65.3
AustraliaAfterpay Ltd. . . . . . . . . . . . . (3,851) (173,384) 88.5Ampol Ltd. . . . . . . . . . . . . . . (2,231) (47,259) 24.1APA Group . . . . . . . . . . . . . . (18,139) (123,016) 62.8BHP Group Ltd. . . . . . . . . . . (1,435) (46,021) 23.5Commonwealth Bank of
Australia . . . . . . . . . . . . . (1,377) (91,832) 46.9Computershare Ltd. . . . . . . . . (3,282) (45,494) 23.2Crown Resorts Ltd. . . . . . . . . (22,765) (196,146) 100.1CSL Ltd. . . . . . . . . . . . . . . . (467) (86,508) 44.2Evolution Mining Ltd. . . . . . . . (19,927) (50,065) 25.6Glencore plc . . . . . . . . . . . . (9,007) (46,923) 23.9Insurance Australia Group Ltd. (78,271) (236,095) 120.5Lendlease Corp. Ltd. . . . . . . . (3,164) (22,390) 11.4Macquarie Group Ltd. . . . . . . (321) (41,958) 21.4Medibank Pvt Ltd. . . . . . . . . . (51,179) (112,147) 57.2National Australia Bank Ltd. . . (3,607) (69,599) 35.5Northern Star Resources Ltd. . (7,708) (45,939) 23.4Orica Ltd. . . . . . . . . . . . . . . (27,675) (274,191) 139.9Reece Ltd. . . . . . . . . . . . . . . (3,699) (57,107) 29.1Santos Ltd. . . . . . . . . . . . . . (70,075) (356,944) 182.2Transurban Group . . . . . . . . . (82,786) (731,350) 373.3Treasury Wine Estates Ltd. . . . (9,426) (70,848) 36.2Westpac Banking Corp. . . . . . (20,569) (296,665) 151.4Woodside Petroleum Ltd. . . . . (17,175) (306,900) 156.6Woolworths Group Ltd. . . . . . (4,021) (98,090) 50.1
(3,626,871)AustriaErste Group Bank AG . . . . . . (2,182) (101,988) 52.1Verbund AG . . . . . . . . . . . . . (1,325) (140,331) 71.6
(242,319)BelgiumAnheuser-Busch InBev SA . . . (6,196) (390,603) 199.3Elia Group SA/NV . . . . . . . . . (4,701) (634,375) 323.8
BNM0322U-2100207-6479109
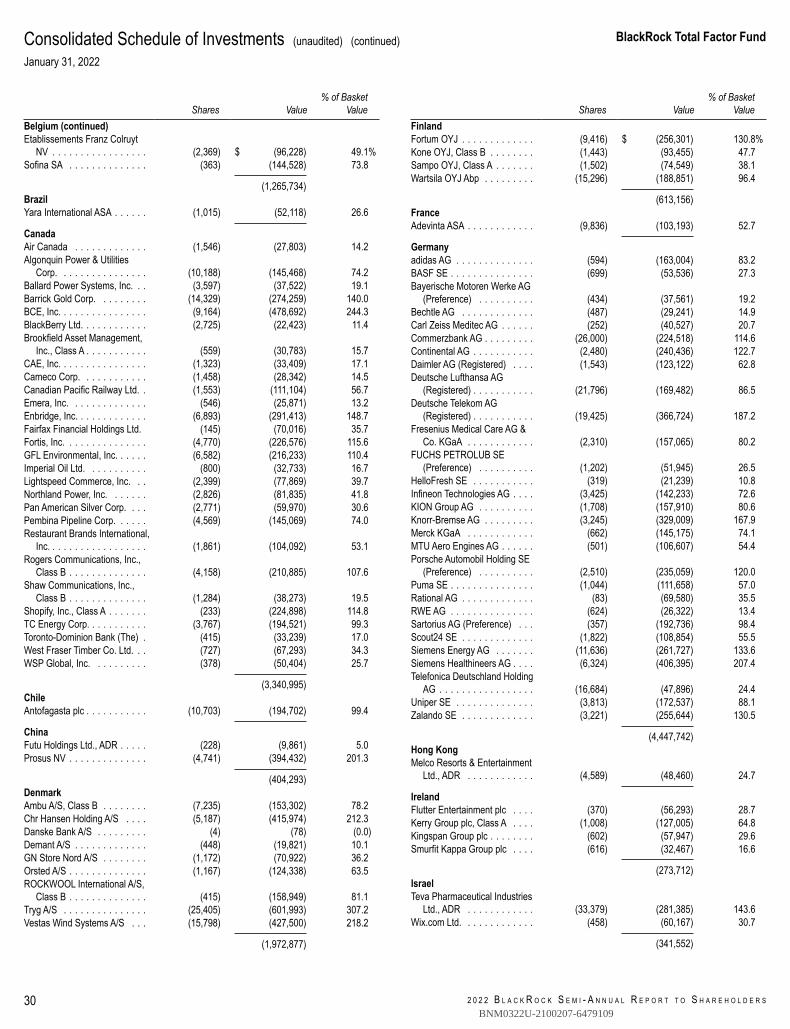
2 0 2 2 B L A C K R O C K S E M I - A N N U A L R E P O R T T O S H A R E H O L D E R S
BlackRock Total Factor Fund
30
Consolidated Schedule of Investments (unaudited) (continued)January 31, 2022
Shares Value% of Basket
ValueBelgium (continued)Etablissements Franz Colruyt
NV . . . . . . . . . . . . . . . . . (2,369) $ (96,228) 49.1%Sofina SA . . . . . . . . . . . . . . (363) (144,528) 73.8
(1,265,734)BrazilYara International ASA . . . . . . (1,015) (52,118) 26.6
CanadaAir Canada . . . . . . . . . . . . . (1,546) (27,803) 14.2Algonquin Power & Utilities
Corp. . . . . . . . . . . . . . . . (10,188) (145,468) 74.2Ballard Power Systems, Inc. . . (3,597) (37,522) 19.1Barrick Gold Corp. . . . . . . . . (14,329) (274,259) 140.0BCE, Inc. . . . . . . . . . . . . . . . (9,164) (478,692) 244.3BlackBerry Ltd. . . . . . . . . . . . (2,725) (22,423) 11.4Brookfield Asset Management,
Inc., Class A . . . . . . . . . . . (559) (30,783) 15.7CAE, Inc. . . . . . . . . . . . . . . . (1,323) (33,409) 17.1Cameco Corp. . . . . . . . . . . . (1,458) (28,342) 14.5Canadian Pacific Railway Ltd. . (1,553) (111,104) 56.7Emera, Inc. . . . . . . . . . . . . . (546) (25,871) 13.2Enbridge, Inc. . . . . . . . . . . . . (6,893) (291,413) 148.7Fairfax Financial Holdings Ltd. (145) (70,016) 35.7Fortis, Inc. . . . . . . . . . . . . . . (4,770) (226,576) 115.6GFL Environmental, Inc. . . . . . (6,582) (216,233) 110.4Imperial Oil Ltd. . . . . . . . . . . (800) (32,733) 16.7Lightspeed Commerce, Inc. . . (2,399) (77,869) 39.7Northland Power, Inc. . . . . . . (2,826) (81,835) 41.8Pan American Silver Corp. . . . (2,771) (59,970) 30.6Pembina Pipeline Corp. . . . . . (4,569) (145,069) 74.0Restaurant Brands International,
Inc. . . . . . . . . . . . . . . . . . (1,861) (104,092) 53.1Rogers Communications, Inc.,
Class B . . . . . . . . . . . . . . (4,158) (210,885) 107.6Shaw Communications, Inc.,
Class B . . . . . . . . . . . . . . (1,284) (38,273) 19.5Shopify, Inc., Class A . . . . . . . (233) (224,898) 114.8TC Energy Corp. . . . . . . . . . . (3,767) (194,521) 99.3Toronto-Dominion Bank (The) . (415) (33,239) 17.0West Fraser Timber Co. Ltd. . . (727) (67,293) 34.3WSP Global, Inc. . . . . . . . . . (378) (50,404) 25.7
(3,340,995)ChileAntofagasta plc . . . . . . . . . . . (10,703) (194,702) 99.4
ChinaFutu Holdings Ltd., ADR . . . . . (228) (9,861) 5.0Prosus NV . . . . . . . . . . . . . . (4,741) (394,432) 201.3
(404,293)DenmarkAmbu A/S, Class B . . . . . . . . (7,235) (153,302) 78.2Chr Hansen Holding A/S . . . . (5,187) (415,974) 212.3Danske Bank A/S . . . . . . . . . (4) (78) (0.0)Demant A/S . . . . . . . . . . . . . (448) (19,821) 10.1GN Store Nord A/S . . . . . . . . (1,172) (70,922) 36.2Orsted A/S . . . . . . . . . . . . . . (1,167) (124,338) 63.5ROCKWOOL International A/S,
Class B . . . . . . . . . . . . . . (415) (158,949) 81.1Tryg A/S . . . . . . . . . . . . . . . (25,405) (601,993) 307.2Vestas Wind Systems A/S . . . (15,798) (427,500) 218.2
(1,972,877)
Shares Value% of Basket
ValueFinlandFortum OYJ . . . . . . . . . . . . . (9,416) $ (256,301) 130.8%Kone OYJ, Class B . . . . . . . . (1,443) (93,455) 47.7Sampo OYJ, Class A . . . . . . . (1,502) (74,549) 38.1Wartsila OYJ Abp . . . . . . . . . (15,296) (188,851) 96.4
(613,156)FranceAdevinta ASA . . . . . . . . . . . . (9,836) (103,193) 52.7
Germanyadidas AG . . . . . . . . . . . . . . (594) (163,004) 83.2BASF SE . . . . . . . . . . . . . . . (699) (53,536) 27.3Bayerische Motoren Werke AG
(Preference) . . . . . . . . . . (434) (37,561) 19.2Bechtle AG . . . . . . . . . . . . . (487) (29,241) 14.9Carl Zeiss Meditec AG . . . . . . (252) (40,527) 20.7Commerzbank AG . . . . . . . . . (26,000) (224,518) 114.6Continental AG . . . . . . . . . . . (2,480) (240,436) 122.7Daimler AG (Registered) . . . . (1,543) (123,122) 62.8Deutsche Lufthansa AG
(Registered) . . . . . . . . . . . (21,796) (169,482) 86.5Deutsche Telekom AG
(Registered) . . . . . . . . . . . (19,425) (366,724) 187.2Fresenius Medical Care AG &
Co. KGaA . . . . . . . . . . . . (2,310) (157,065) 80.2FUCHS PETROLUB SE
(Preference) . . . . . . . . . . (1,202) (51,945) 26.5HelloFresh SE . . . . . . . . . . . (319) (21,239) 10.8Infineon Technologies AG . . . . (3,425) (142,233) 72.6KION Group AG . . . . . . . . . . (1,708) (157,910) 80.6Knorr-Bremse AG . . . . . . . . . (3,245) (329,009) 167.9Merck KGaA . . . . . . . . . . . . (662) (145,175) 74.1MTU Aero Engines AG . . . . . . (501) (106,607) 54.4Porsche Automobil Holding SE
(Preference) . . . . . . . . . . (2,510) (235,059) 120.0Puma SE . . . . . . . . . . . . . . . (1,044) (111,658) 57.0Rational AG . . . . . . . . . . . . . (83) (69,580) 35.5RWE AG . . . . . . . . . . . . . . . (624) (26,322) 13.4Sartorius AG (Preference) . . . (357) (192,736) 98.4Scout24 SE . . . . . . . . . . . . . (1,822) (108,854) 55.5Siemens Energy AG . . . . . . . (11,636) (261,727) 133.6Siemens Healthineers AG . . . . (6,324) (406,395) 207.4Telefonica Deutschland Holding
AG . . . . . . . . . . . . . . . . . (16,684) (47,896) 24.4Uniper SE . . . . . . . . . . . . . . (3,813) (172,537) 88.1Zalando SE . . . . . . . . . . . . . (3,221) (255,644) 130.5
(4,447,742)Hong KongMelco Resorts & Entertainment
Ltd., ADR . . . . . . . . . . . . (4,589) (48,460) 24.7
IrelandFlutter Entertainment plc . . . . (370) (56,293) 28.7Kerry Group plc, Class A . . . . (1,008) (127,005) 64.8Kingspan Group plc . . . . . . . . (602) (57,947) 29.6Smurfit Kappa Group plc . . . . (616) (32,467) 16.6
(273,712)IsraelTeva Pharmaceutical Industries
Ltd., ADR . . . . . . . . . . . . (33,379) (281,385) 143.6Wix.com Ltd. . . . . . . . . . . . . (458) (60,167) 30.7
(341,552)
BNM0322U-2100207-6479109
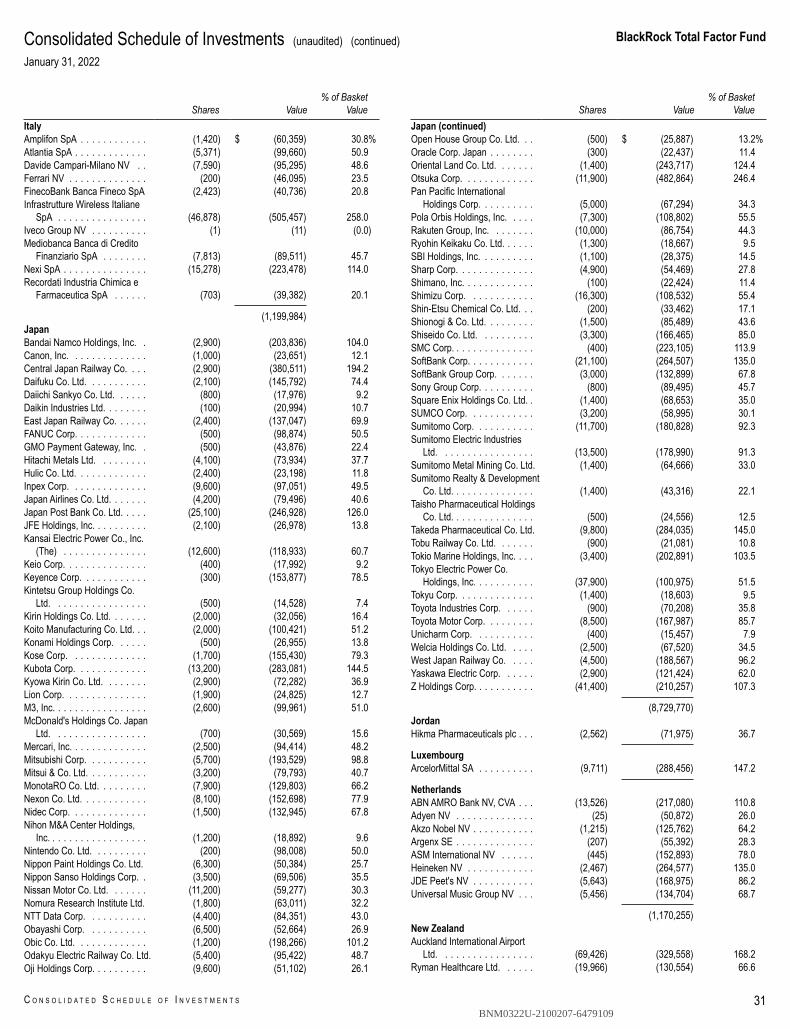
BlackRock Total Factor Fund
C O N S O L I D A T E D S C H E D U L E O F I N V E S T M E N T S 31
Consolidated Schedule of Investments (unaudited) (continued)January 31, 2022
Shares Value% of Basket
ValueItalyAmplifon SpA . . . . . . . . . . . . (1,420) $ (60,359) 30.8%Atlantia SpA . . . . . . . . . . . . . (5,371) (99,660) 50.9Davide Campari-Milano NV . . (7,590) (95,295) 48.6Ferrari NV . . . . . . . . . . . . . . (200) (46,095) 23.5FinecoBank Banca Fineco SpA (2,423) (40,736) 20.8Infrastrutture Wireless Italiane
SpA . . . . . . . . . . . . . . . . (46,878) (505,457) 258.0Iveco Group NV . . . . . . . . . . (1) (11) (0.0)Mediobanca Banca di Credito
Finanziario SpA . . . . . . . . (7,813) (89,511) 45.7Nexi SpA . . . . . . . . . . . . . . . (15,278) (223,478) 114.0Recordati Industria Chimica e
Farmaceutica SpA . . . . . . (703) (39,382) 20.1
(1,199,984)JapanBandai Namco Holdings, Inc. . (2,900) (203,836) 104.0Canon, Inc. . . . . . . . . . . . . . (1,000) (23,651) 12.1Central Japan Railway Co. . . . (2,900) (380,511) 194.2Daifuku Co. Ltd. . . . . . . . . . . (2,100) (145,792) 74.4Daiichi Sankyo Co. Ltd. . . . . . (800) (17,976) 9.2Daikin Industries Ltd. . . . . . . . (100) (20,994) 10.7East Japan Railway Co. . . . . . (2,400) (137,047) 69.9FANUC Corp. . . . . . . . . . . . . (500) (98,874) 50.5GMO Payment Gateway, Inc. . (500) (43,876) 22.4Hitachi Metals Ltd. . . . . . . . . (4,100) (73,934) 37.7Hulic Co. Ltd. . . . . . . . . . . . . (2,400) (23,198) 11.8Inpex Corp. . . . . . . . . . . . . . (9,600) (97,051) 49.5Japan Airlines Co. Ltd. . . . . . . (4,200) (79,496) 40.6Japan Post Bank Co. Ltd. . . . . (25,100) (246,928) 126.0JFE Holdings, Inc. . . . . . . . . . (2,100) (26,978) 13.8Kansai Electric Power Co., Inc.
(The) . . . . . . . . . . . . . . . (12,600) (118,933) 60.7Keio Corp. . . . . . . . . . . . . . . (400) (17,992) 9.2Keyence Corp. . . . . . . . . . . . (300) (153,877) 78.5Kintetsu Group Holdings Co.
Ltd. . . . . . . . . . . . . . . . . (500) (14,528) 7.4Kirin Holdings Co. Ltd. . . . . . . (2,000) (32,056) 16.4Koito Manufacturing Co. Ltd. . . (2,000) (100,421) 51.2Konami Holdings Corp. . . . . . (500) (26,955) 13.8Kose Corp. . . . . . . . . . . . . . (1,700) (155,430) 79.3Kubota Corp. . . . . . . . . . . . . (13,200) (283,081) 144.5Kyowa Kirin Co. Ltd. . . . . . . . (2,900) (72,282) 36.9Lion Corp. . . . . . . . . . . . . . . (1,900) (24,825) 12.7M3, Inc. . . . . . . . . . . . . . . . . (2,600) (99,961) 51.0McDonald's Holdings Co. Japan
Ltd. . . . . . . . . . . . . . . . . (700) (30,569) 15.6Mercari, Inc. . . . . . . . . . . . . . (2,500) (94,414) 48.2Mitsubishi Corp. . . . . . . . . . . (5,700) (193,529) 98.8Mitsui & Co. Ltd. . . . . . . . . . . (3,200) (79,793) 40.7MonotaRO Co. Ltd. . . . . . . . . (7,900) (129,803) 66.2Nexon Co. Ltd. . . . . . . . . . . . (8,100) (152,698) 77.9Nidec Corp. . . . . . . . . . . . . . (1,500) (132,945) 67.8Nihon M&A Center Holdings,
Inc. . . . . . . . . . . . . . . . . . (1,200) (18,892) 9.6Nintendo Co. Ltd. . . . . . . . . . (200) (98,008) 50.0Nippon Paint Holdings Co. Ltd. (6,300) (50,384) 25.7Nippon Sanso Holdings Corp. . (3,500) (69,506) 35.5Nissan Motor Co. Ltd. . . . . . . (11,200) (59,277) 30.3Nomura Research Institute Ltd. (1,800) (63,011) 32.2NTT Data Corp. . . . . . . . . . . (4,400) (84,351) 43.0Obayashi Corp. . . . . . . . . . . (6,500) (52,664) 26.9Obic Co. Ltd. . . . . . . . . . . . . (1,200) (198,266) 101.2Odakyu Electric Railway Co. Ltd. (5,400) (95,422) 48.7Oji Holdings Corp. . . . . . . . . . (9,600) (51,102) 26.1
Shares Value% of Basket
ValueJapan (continued)Open House Group Co. Ltd. . . (500) $ (25,887) 13.2%Oracle Corp. Japan . . . . . . . . (300) (22,437) 11.4Oriental Land Co. Ltd. . . . . . . (1,400) (243,717) 124.4Otsuka Corp. . . . . . . . . . . . . (11,900) (482,864) 246.4Pan Pacific International
Holdings Corp. . . . . . . . . . (5,000) (67,294) 34.3Pola Orbis Holdings, Inc. . . . . (7,300) (108,802) 55.5Rakuten Group, Inc. . . . . . . . (10,000) (86,754) 44.3Ryohin Keikaku Co. Ltd. . . . . . (1,300) (18,667) 9.5SBI Holdings, Inc. . . . . . . . . . (1,100) (28,375) 14.5Sharp Corp. . . . . . . . . . . . . . (4,900) (54,469) 27.8Shimano, Inc. . . . . . . . . . . . . (100) (22,424) 11.4Shimizu Corp. . . . . . . . . . . . (16,300) (108,532) 55.4Shin-Etsu Chemical Co. Ltd. . . (200) (33,462) 17.1Shionogi & Co. Ltd. . . . . . . . . (1,500) (85,489) 43.6Shiseido Co. Ltd. . . . . . . . . . (3,300) (166,465) 85.0SMC Corp. . . . . . . . . . . . . . . (400) (223,105) 113.9SoftBank Corp. . . . . . . . . . . . (21,100) (264,507) 135.0SoftBank Group Corp. . . . . . . (3,000) (132,899) 67.8Sony Group Corp. . . . . . . . . . (800) (89,495) 45.7Square Enix Holdings Co. Ltd. . (1,400) (68,653) 35.0SUMCO Corp. . . . . . . . . . . . (3,200) (58,995) 30.1Sumitomo Corp. . . . . . . . . . . (11,700) (180,828) 92.3Sumitomo Electric Industries
Ltd. . . . . . . . . . . . . . . . . (13,500) (178,990) 91.3Sumitomo Metal Mining Co. Ltd. (1,400) (64,666) 33.0Sumitomo Realty & Development
Co. Ltd. . . . . . . . . . . . . . . (1,400) (43,316) 22.1Taisho Pharmaceutical Holdings
Co. Ltd. . . . . . . . . . . . . . . (500) (24,556) 12.5Takeda Pharmaceutical Co. Ltd. (9,800) (284,035) 145.0Tobu Railway Co. Ltd. . . . . . . (900) (21,081) 10.8Tokio Marine Holdings, Inc. . . . (3,400) (202,891) 103.5Tokyo Electric Power Co.
Holdings, Inc. . . . . . . . . . . (37,900) (100,975) 51.5Tokyu Corp. . . . . . . . . . . . . . (1,400) (18,603) 9.5Toyota Industries Corp. . . . . . (900) (70,208) 35.8Toyota Motor Corp. . . . . . . . . (8,500) (167,987) 85.7Unicharm Corp. . . . . . . . . . . (400) (15,457) 7.9Welcia Holdings Co. Ltd. . . . . (2,500) (67,520) 34.5West Japan Railway Co. . . . . (4,500) (188,567) 96.2Yaskawa Electric Corp. . . . . . (2,900) (121,424) 62.0Z Holdings Corp. . . . . . . . . . . (41,400) (210,257) 107.3
(8,729,770)JordanHikma Pharmaceuticals plc . . . (2,562) (71,975) 36.7
LuxembourgArcelorMittal SA . . . . . . . . . . (9,711) (288,456) 147.2
NetherlandsABN AMRO Bank NV, CVA . . . (13,526) (217,080) 110.8Adyen NV . . . . . . . . . . . . . . (25) (50,872) 26.0Akzo Nobel NV . . . . . . . . . . . (1,215) (125,762) 64.2Argenx SE . . . . . . . . . . . . . . (207) (55,392) 28.3ASM International NV . . . . . . (445) (152,893) 78.0Heineken NV . . . . . . . . . . . . (2,467) (264,577) 135.0JDE Peet's NV . . . . . . . . . . . (5,643) (168,975) 86.2Universal Music Group NV . . . (5,456) (134,704) 68.7
(1,170,255)New ZealandAuckland International Airport
Ltd. . . . . . . . . . . . . . . . . (69,426) (329,558) 168.2Ryman Healthcare Ltd. . . . . . (19,966) (130,554) 66.6
BNM0322U-2100207-6479109
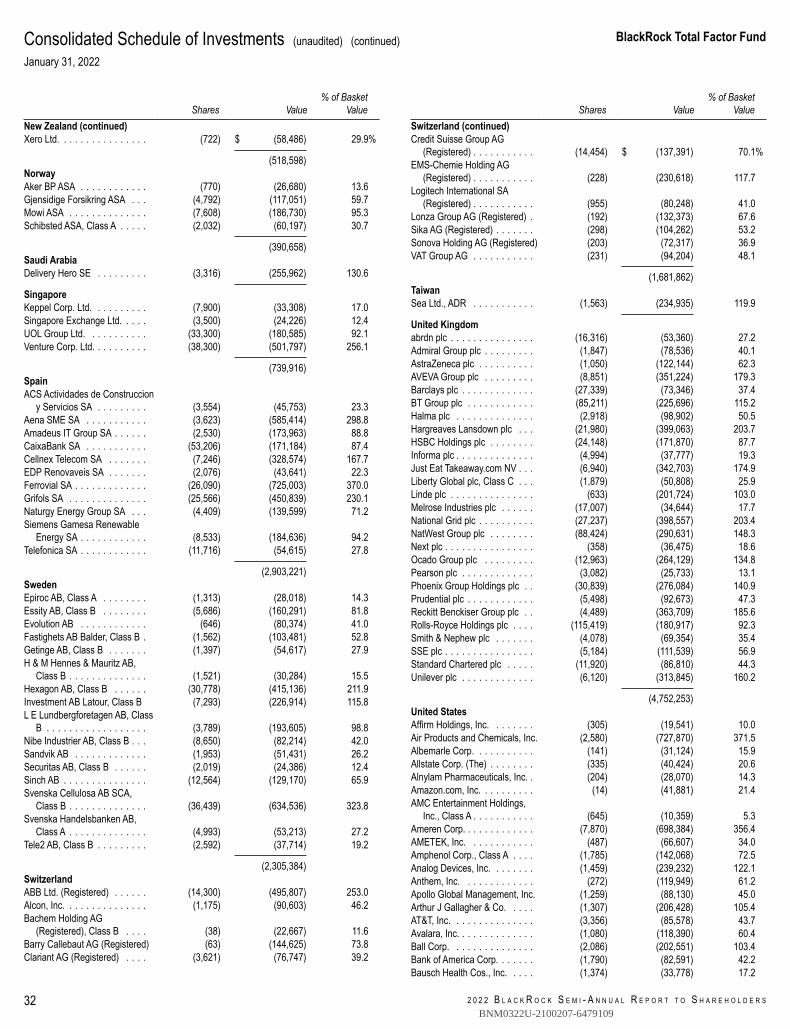
2 0 2 2 B L A C K R O C K S E M I - A N N U A L R E P O R T T O S H A R E H O L D E R S
BlackRock Total Factor Fund
32
Consolidated Schedule of Investments (unaudited) (continued)January 31, 2022
Shares Value% of Basket
ValueNew Zealand (continued)Xero Ltd. . . . . . . . . . . . . . . . (722) $ (58,486) 29.9%
(518,598)NorwayAker BP ASA . . . . . . . . . . . . (770) (26,680) 13.6Gjensidige Forsikring ASA . . . (4,792) (117,051) 59.7Mowi ASA . . . . . . . . . . . . . . (7,608) (186,730) 95.3Schibsted ASA, Class A . . . . . (2,032) (60,197) 30.7
(390,658)Saudi ArabiaDelivery Hero SE . . . . . . . . . (3,316) (255,962) 130.6
SingaporeKeppel Corp. Ltd. . . . . . . . . . (7,900) (33,308) 17.0Singapore Exchange Ltd. . . . . (3,500) (24,226) 12.4UOL Group Ltd. . . . . . . . . . . (33,300) (180,585) 92.1Venture Corp. Ltd. . . . . . . . . . (38,300) (501,797) 256.1
(739,916)SpainACS Actividades de Construccion
y Servicios SA . . . . . . . . . (3,554) (45,753) 23.3Aena SME SA . . . . . . . . . . . (3,623) (585,414) 298.8Amadeus IT Group SA . . . . . . (2,530) (173,963) 88.8CaixaBank SA . . . . . . . . . . . (53,206) (171,184) 87.4Cellnex Telecom SA . . . . . . . (7,246) (328,574) 167.7EDP Renovaveis SA . . . . . . . (2,076) (43,641) 22.3Ferrovial SA . . . . . . . . . . . . . (26,090) (725,003) 370.0Grifols SA . . . . . . . . . . . . . . (25,566) (450,839) 230.1Naturgy Energy Group SA . . . (4,409) (139,599) 71.2Siemens Gamesa Renewable
Energy SA . . . . . . . . . . . . (8,533) (184,636) 94.2Telefonica SA . . . . . . . . . . . . (11,716) (54,615) 27.8
(2,903,221)SwedenEpiroc AB, Class A . . . . . . . . (1,313) (28,018) 14.3Essity AB, Class B . . . . . . . . (5,686) (160,291) 81.8Evolution AB . . . . . . . . . . . . (646) (80,374) 41.0Fastighets AB Balder, Class B . (1,562) (103,481) 52.8Getinge AB, Class B . . . . . . . (1,397) (54,617) 27.9H & M Hennes & Mauritz AB,
Class B . . . . . . . . . . . . . . (1,521) (30,284) 15.5Hexagon AB, Class B . . . . . . (30,778) (415,136) 211.9Investment AB Latour, Class B (7,293) (226,914) 115.8L E Lundbergforetagen AB, Class
B . . . . . . . . . . . . . . . . . . (3,789) (193,605) 98.8Nibe Industrier AB, Class B . . . (8,650) (82,214) 42.0Sandvik AB . . . . . . . . . . . . . (1,953) (51,431) 26.2Securitas AB, Class B . . . . . . (2,019) (24,386) 12.4Sinch AB . . . . . . . . . . . . . . . (12,564) (129,170) 65.9Svenska Cellulosa AB SCA,
Class B . . . . . . . . . . . . . . (36,439) (634,536) 323.8Svenska Handelsbanken AB,
Class A . . . . . . . . . . . . . . (4,993) (53,213) 27.2Tele2 AB, Class B . . . . . . . . . (2,592) (37,714) 19.2
(2,305,384)SwitzerlandABB Ltd. (Registered) . . . . . . (14,300) (495,807) 253.0Alcon, Inc. . . . . . . . . . . . . . . (1,175) (90,603) 46.2Bachem Holding AG
(Registered), Class B . . . . (38) (22,667) 11.6Barry Callebaut AG (Registered) (63) (144,625) 73.8Clariant AG (Registered) . . . . (3,621) (76,747) 39.2
Shares Value% of Basket
ValueSwitzerland (continued)Credit Suisse Group AG
(Registered) . . . . . . . . . . . (14,454) $ (137,391) 70.1%EMS-Chemie Holding AG
(Registered) . . . . . . . . . . . (228) (230,618) 117.7Logitech International SA
(Registered) . . . . . . . . . . . (955) (80,248) 41.0Lonza Group AG (Registered) . (192) (132,373) 67.6Sika AG (Registered) . . . . . . . (298) (104,262) 53.2Sonova Holding AG (Registered) (203) (72,317) 36.9VAT Group AG . . . . . . . . . . . (231) (94,204) 48.1
(1,681,862)TaiwanSea Ltd., ADR . . . . . . . . . . . (1,563) (234,935) 119.9
United Kingdomabrdn plc . . . . . . . . . . . . . . . (16,316) (53,360) 27.2Admiral Group plc . . . . . . . . . (1,847) (78,536) 40.1AstraZeneca plc . . . . . . . . . . (1,050) (122,144) 62.3AVEVA Group plc . . . . . . . . . (8,851) (351,224) 179.3Barclays plc . . . . . . . . . . . . . (27,339) (73,346) 37.4BT Group plc . . . . . . . . . . . . (85,211) (225,696) 115.2Halma plc . . . . . . . . . . . . . . (2,918) (98,902) 50.5Hargreaves Lansdown plc . . . (21,980) (399,063) 203.7HSBC Holdings plc . . . . . . . . (24,148) (171,870) 87.7Informa plc . . . . . . . . . . . . . . (4,994) (37,777) 19.3Just Eat Takeaway.com NV . . . (6,940) (342,703) 174.9Liberty Global plc, Class C . . . (1,879) (50,808) 25.9Linde plc . . . . . . . . . . . . . . . (633) (201,724) 103.0Melrose Industries plc . . . . . . (17,007) (34,644) 17.7National Grid plc . . . . . . . . . . (27,237) (398,557) 203.4NatWest Group plc . . . . . . . . (88,424) (290,631) 148.3Next plc . . . . . . . . . . . . . . . . (358) (36,475) 18.6Ocado Group plc . . . . . . . . . (12,963) (264,129) 134.8Pearson plc . . . . . . . . . . . . . (3,082) (25,733) 13.1Phoenix Group Holdings plc . . (30,839) (276,084) 140.9Prudential plc . . . . . . . . . . . . (5,498) (92,673) 47.3Reckitt Benckiser Group plc . . (4,489) (363,709) 185.6Rolls-Royce Holdings plc . . . . (115,419) (180,917) 92.3Smith & Nephew plc . . . . . . . (4,078) (69,354) 35.4SSE plc . . . . . . . . . . . . . . . . (5,184) (111,539) 56.9Standard Chartered plc . . . . . (11,920) (86,810) 44.3Unilever plc . . . . . . . . . . . . . (6,120) (313,845) 160.2
(4,752,253)United StatesAffirm Holdings, Inc. . . . . . . . (305) (19,541) 10.0Air Products and Chemicals, Inc. (2,580) (727,870) 371.5Albemarle Corp. . . . . . . . . . . (141) (31,124) 15.9Allstate Corp. (The) . . . . . . . . (335) (40,424) 20.6Alnylam Pharmaceuticals, Inc. . (204) (28,070) 14.3Amazon.com, Inc. . . . . . . . . . (14) (41,881) 21.4AMC Entertainment Holdings,
Inc., Class A . . . . . . . . . . . (645) (10,359) 5.3Ameren Corp. . . . . . . . . . . . . (7,870) (698,384) 356.4AMETEK, Inc. . . . . . . . . . . . (487) (66,607) 34.0Amphenol Corp., Class A . . . . (1,785) (142,068) 72.5Analog Devices, Inc. . . . . . . . (1,459) (239,232) 122.1Anthem, Inc. . . . . . . . . . . . . (272) (119,949) 61.2Apollo Global Management, Inc. (1,259) (88,130) 45.0Arthur J Gallagher & Co. . . . . (1,307) (206,428) 105.4AT&T, Inc. . . . . . . . . . . . . . . (3,356) (85,578) 43.7Avalara, Inc. . . . . . . . . . . . . . (1,080) (118,390) 60.4Ball Corp. . . . . . . . . . . . . . . (2,086) (202,551) 103.4Bank of America Corp. . . . . . . (1,790) (82,591) 42.2Bausch Health Cos., Inc. . . . . (1,374) (33,778) 17.2
BNM0322U-2100207-6479109
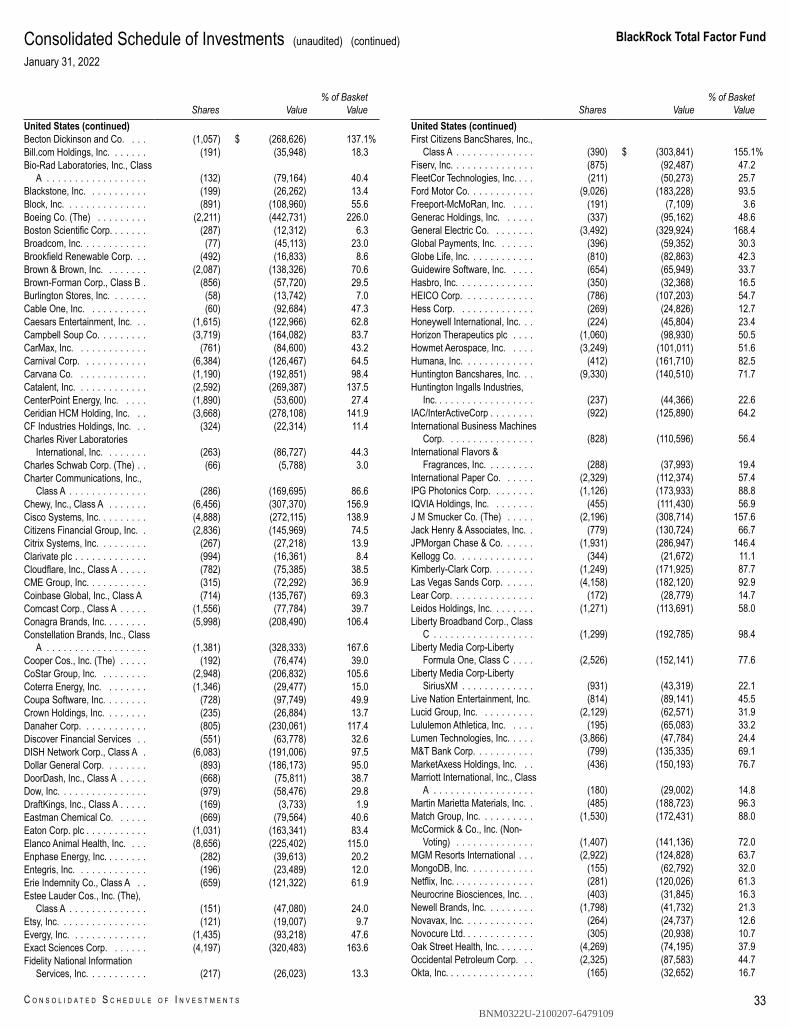
BlackRock Total Factor Fund
C O N S O L I D A T E D S C H E D U L E O F I N V E S T M E N T S 33
Consolidated Schedule of Investments (unaudited) (continued)January 31, 2022
Shares Value% of Basket
ValueUnited States (continued)Becton Dickinson and Co. . . . (1,057) $ (268,626) 137.1%Bill.com Holdings, Inc. . . . . . . (191) (35,948) 18.3Bio-Rad Laboratories, Inc., Class
A . . . . . . . . . . . . . . . . . . (132) (79,164) 40.4Blackstone, Inc. . . . . . . . . . . (199) (26,262) 13.4Block, Inc. . . . . . . . . . . . . . . (891) (108,960) 55.6Boeing Co. (The) . . . . . . . . . (2,211) (442,731) 226.0Boston Scientific Corp. . . . . . . (287) (12,312) 6.3Broadcom, Inc. . . . . . . . . . . . (77) (45,113) 23.0Brookfield Renewable Corp. . . (492) (16,833) 8.6Brown & Brown, Inc. . . . . . . . (2,087) (138,326) 70.6Brown-Forman Corp., Class B . (856) (57,720) 29.5Burlington Stores, Inc. . . . . . . (58) (13,742) 7.0Cable One, Inc. . . . . . . . . . . (60) (92,684) 47.3Caesars Entertainment, Inc. . . (1,615) (122,966) 62.8Campbell Soup Co. . . . . . . . . (3,719) (164,082) 83.7CarMax, Inc. . . . . . . . . . . . . (761) (84,600) 43.2Carnival Corp. . . . . . . . . . . . (6,384) (126,467) 64.5Carvana Co. . . . . . . . . . . . . (1,190) (192,851) 98.4Catalent, Inc. . . . . . . . . . . . . (2,592) (269,387) 137.5CenterPoint Energy, Inc. . . . . (1,890) (53,600) 27.4Ceridian HCM Holding, Inc. . . (3,668) (278,108) 141.9CF Industries Holdings, Inc. . . (324) (22,314) 11.4Charles River Laboratories
International, Inc. . . . . . . . (263) (86,727) 44.3Charles Schwab Corp. (The) . . (66) (5,788) 3.0Charter Communications, Inc.,
Class A . . . . . . . . . . . . . . (286) (169,695) 86.6Chewy, Inc., Class A . . . . . . . (6,456) (307,370) 156.9Cisco Systems, Inc. . . . . . . . . (4,888) (272,115) 138.9Citizens Financial Group, Inc. . (2,836) (145,969) 74.5Citrix Systems, Inc. . . . . . . . . (267) (27,218) 13.9Clarivate plc . . . . . . . . . . . . . (994) (16,361) 8.4Cloudflare, Inc., Class A . . . . . (782) (75,385) 38.5CME Group, Inc. . . . . . . . . . . (315) (72,292) 36.9Coinbase Global, Inc., Class A (714) (135,767) 69.3Comcast Corp., Class A . . . . . (1,556) (77,784) 39.7Conagra Brands, Inc. . . . . . . . (5,998) (208,490) 106.4Constellation Brands, Inc., Class
A . . . . . . . . . . . . . . . . . . (1,381) (328,333) 167.6Cooper Cos., Inc. (The) . . . . . (192) (76,474) 39.0CoStar Group, Inc. . . . . . . . . (2,948) (206,832) 105.6Coterra Energy, Inc. . . . . . . . (1,346) (29,477) 15.0Coupa Software, Inc. . . . . . . . (728) (97,749) 49.9Crown Holdings, Inc. . . . . . . . (235) (26,884) 13.7Danaher Corp. . . . . . . . . . . . (805) (230,061) 117.4Discover Financial Services . . (551) (63,778) 32.6DISH Network Corp., Class A . (6,083) (191,006) 97.5Dollar General Corp. . . . . . . . (893) (186,173) 95.0DoorDash, Inc., Class A . . . . . (668) (75,811) 38.7Dow, Inc. . . . . . . . . . . . . . . . (979) (58,476) 29.8DraftKings, Inc., Class A . . . . . (169) (3,733) 1.9Eastman Chemical Co. . . . . . (669) (79,564) 40.6Eaton Corp. plc . . . . . . . . . . . (1,031) (163,341) 83.4Elanco Animal Health, Inc. . . . (8,656) (225,402) 115.0Enphase Energy, Inc. . . . . . . . (282) (39,613) 20.2Entegris, Inc. . . . . . . . . . . . . (196) (23,489) 12.0Erie Indemnity Co., Class A . . (659) (121,322) 61.9Estee Lauder Cos., Inc. (The),
Class A . . . . . . . . . . . . . . (151) (47,080) 24.0Etsy, Inc. . . . . . . . . . . . . . . . (121) (19,007) 9.7Evergy, Inc. . . . . . . . . . . . . . (1,435) (93,218) 47.6Exact Sciences Corp. . . . . . . (4,197) (320,483) 163.6Fidelity National Information
Services, Inc. . . . . . . . . . . (217) (26,023) 13.3
Shares Value% of Basket
ValueUnited States (continued)First Citizens BancShares, Inc.,
Class A . . . . . . . . . . . . . . (390) $ (303,841) 155.1%Fiserv, Inc. . . . . . . . . . . . . . . (875) (92,487) 47.2FleetCor Technologies, Inc. . . . (211) (50,273) 25.7Ford Motor Co. . . . . . . . . . . . (9,026) (183,228) 93.5Freeport-McMoRan, Inc. . . . . (191) (7,109) 3.6Generac Holdings, Inc. . . . . . (337) (95,162) 48.6General Electric Co. . . . . . . . (3,492) (329,924) 168.4Global Payments, Inc. . . . . . . (396) (59,352) 30.3Globe Life, Inc. . . . . . . . . . . . (810) (82,863) 42.3Guidewire Software, Inc. . . . . (654) (65,949) 33.7Hasbro, Inc. . . . . . . . . . . . . . (350) (32,368) 16.5HEICO Corp. . . . . . . . . . . . . (786) (107,203) 54.7Hess Corp. . . . . . . . . . . . . . (269) (24,826) 12.7Honeywell International, Inc. . . (224) (45,804) 23.4Horizon Therapeutics plc . . . . (1,060) (98,930) 50.5Howmet Aerospace, Inc. . . . . (3,249) (101,011) 51.6Humana, Inc. . . . . . . . . . . . . (412) (161,710) 82.5Huntington Bancshares, Inc. . . (9,330) (140,510) 71.7Huntington Ingalls Industries,
Inc. . . . . . . . . . . . . . . . . . (237) (44,366) 22.6IAC/InterActiveCorp . . . . . . . . (922) (125,890) 64.2International Business Machines
Corp. . . . . . . . . . . . . . . . (828) (110,596) 56.4International Flavors &
Fragrances, Inc. . . . . . . . . (288) (37,993) 19.4International Paper Co. . . . . . (2,329) (112,374) 57.4IPG Photonics Corp. . . . . . . . (1,126) (173,933) 88.8IQVIA Holdings, Inc. . . . . . . . (455) (111,430) 56.9J M Smucker Co. (The) . . . . . (2,196) (308,714) 157.6Jack Henry & Associates, Inc. . (779) (130,724) 66.7JPMorgan Chase & Co. . . . . . (1,931) (286,947) 146.4Kellogg Co. . . . . . . . . . . . . . (344) (21,672) 11.1Kimberly-Clark Corp. . . . . . . . (1,249) (171,925) 87.7Las Vegas Sands Corp. . . . . . (4,158) (182,120) 92.9Lear Corp. . . . . . . . . . . . . . . (172) (28,779) 14.7Leidos Holdings, Inc. . . . . . . . (1,271) (113,691) 58.0Liberty Broadband Corp., Class
C . . . . . . . . . . . . . . . . . . (1,299) (192,785) 98.4Liberty Media Corp-Liberty
Formula One, Class C . . . . (2,526) (152,141) 77.6Liberty Media Corp-Liberty
SiriusXM . . . . . . . . . . . . . (931) (43,319) 22.1Live Nation Entertainment, Inc. (814) (89,141) 45.5Lucid Group, Inc. . . . . . . . . . (2,129) (62,571) 31.9Lululemon Athletica, Inc. . . . . (195) (65,083) 33.2Lumen Technologies, Inc. . . . . (3,866) (47,784) 24.4M&T Bank Corp. . . . . . . . . . . (799) (135,335) 69.1MarketAxess Holdings, Inc. . . (436) (150,193) 76.7Marriott International, Inc., Class
A . . . . . . . . . . . . . . . . . . (180) (29,002) 14.8Martin Marietta Materials, Inc. . (485) (188,723) 96.3Match Group, Inc. . . . . . . . . . (1,530) (172,431) 88.0McCormick & Co., Inc. (Non-
Voting) . . . . . . . . . . . . . . (1,407) (141,136) 72.0MGM Resorts International . . . (2,922) (124,828) 63.7MongoDB, Inc. . . . . . . . . . . . (155) (62,792) 32.0Netflix, Inc. . . . . . . . . . . . . . . (281) (120,026) 61.3Neurocrine Biosciences, Inc. . . (403) (31,845) 16.3Newell Brands, Inc. . . . . . . . . (1,798) (41,732) 21.3Novavax, Inc. . . . . . . . . . . . . (264) (24,737) 12.6Novocure Ltd. . . . . . . . . . . . . (305) (20,938) 10.7Oak Street Health, Inc. . . . . . . (4,269) (74,195) 37.9Occidental Petroleum Corp. . . (2,325) (87,583) 44.7Okta, Inc. . . . . . . . . . . . . . . . (165) (32,652) 16.7
BNM0322U-2100207-6479109
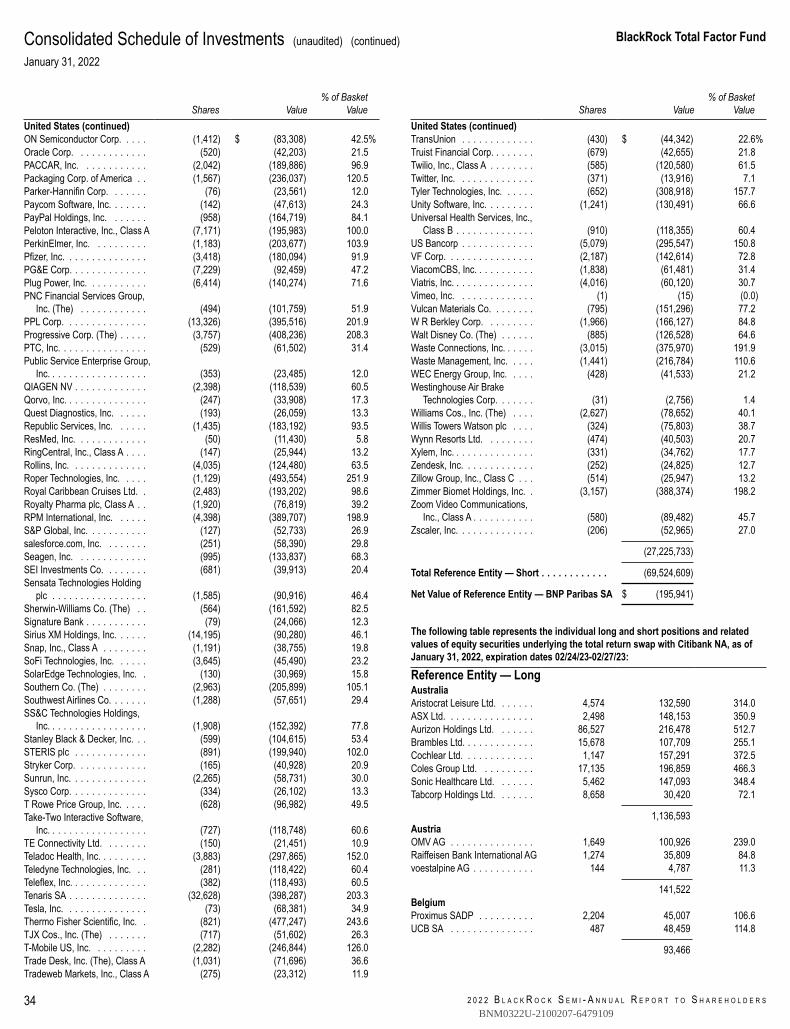
2 0 2 2 B L A C K R O C K S E M I - A N N U A L R E P O R T T O S H A R E H O L D E R S
BlackRock Total Factor Fund
34
Consolidated Schedule of Investments (unaudited) (continued)January 31, 2022
Shares Value% of Basket
ValueUnited States (continued)ON Semiconductor Corp. . . . . (1,412) $ (83,308) 42.5%Oracle Corp. . . . . . . . . . . . . (520) (42,203) 21.5PACCAR, Inc. . . . . . . . . . . . (2,042) (189,886) 96.9Packaging Corp. of America . . (1,567) (236,037) 120.5Parker-Hannifin Corp. . . . . . . (76) (23,561) 12.0Paycom Software, Inc. . . . . . . (142) (47,613) 24.3PayPal Holdings, Inc. . . . . . . (958) (164,719) 84.1Peloton Interactive, Inc., Class A (7,171) (195,983) 100.0PerkinElmer, Inc. . . . . . . . . . (1,183) (203,677) 103.9Pfizer, Inc. . . . . . . . . . . . . . . (3,418) (180,094) 91.9PG&E Corp. . . . . . . . . . . . . . (7,229) (92,459) 47.2Plug Power, Inc. . . . . . . . . . . (6,414) (140,274) 71.6PNC Financial Services Group,
Inc. (The) . . . . . . . . . . . . (494) (101,759) 51.9PPL Corp. . . . . . . . . . . . . . . (13,326) (395,516) 201.9Progressive Corp. (The) . . . . . (3,757) (408,236) 208.3PTC, Inc. . . . . . . . . . . . . . . . (529) (61,502) 31.4Public Service Enterprise Group,
Inc. . . . . . . . . . . . . . . . . . (353) (23,485) 12.0QIAGEN NV . . . . . . . . . . . . . (2,398) (118,539) 60.5Qorvo, Inc. . . . . . . . . . . . . . . (247) (33,908) 17.3Quest Diagnostics, Inc. . . . . . (193) (26,059) 13.3Republic Services, Inc. . . . . . (1,435) (183,192) 93.5ResMed, Inc. . . . . . . . . . . . . (50) (11,430) 5.8RingCentral, Inc., Class A . . . . (147) (25,944) 13.2Rollins, Inc. . . . . . . . . . . . . . (4,035) (124,480) 63.5Roper Technologies, Inc. . . . . (1,129) (493,554) 251.9Royal Caribbean Cruises Ltd. . (2,483) (193,202) 98.6Royalty Pharma plc, Class A . . (1,920) (76,819) 39.2RPM International, Inc. . . . . . (4,398) (389,707) 198.9S&P Global, Inc. . . . . . . . . . . (127) (52,733) 26.9salesforce.com, Inc. . . . . . . . (251) (58,390) 29.8Seagen, Inc. . . . . . . . . . . . . (995) (133,837) 68.3SEI Investments Co. . . . . . . . (681) (39,913) 20.4Sensata Technologies Holding
plc . . . . . . . . . . . . . . . . . (1,585) (90,916) 46.4Sherwin-Williams Co. (The) . . (564) (161,592) 82.5Signature Bank . . . . . . . . . . . (79) (24,066) 12.3Sirius XM Holdings, Inc. . . . . . (14,195) (90,280) 46.1Snap, Inc., Class A . . . . . . . . (1,191) (38,755) 19.8SoFi Technologies, Inc. . . . . . (3,645) (45,490) 23.2SolarEdge Technologies, Inc. . (130) (30,969) 15.8Southern Co. (The) . . . . . . . . (2,963) (205,899) 105.1Southwest Airlines Co. . . . . . . (1,288) (57,651) 29.4SS&C Technologies Holdings,
Inc. . . . . . . . . . . . . . . . . . (1,908) (152,392) 77.8Stanley Black & Decker, Inc. . . (599) (104,615) 53.4STERIS plc . . . . . . . . . . . . . (891) (199,940) 102.0Stryker Corp. . . . . . . . . . . . . (165) (40,928) 20.9Sunrun, Inc. . . . . . . . . . . . . . (2,265) (58,731) 30.0Sysco Corp. . . . . . . . . . . . . . (334) (26,102) 13.3T Rowe Price Group, Inc. . . . . (628) (96,982) 49.5Take-Two Interactive Software,
Inc. . . . . . . . . . . . . . . . . . (727) (118,748) 60.6TE Connectivity Ltd. . . . . . . . (150) (21,451) 10.9Teladoc Health, Inc. . . . . . . . . (3,883) (297,865) 152.0Teledyne Technologies, Inc. . . (281) (118,422) 60.4Teleflex, Inc. . . . . . . . . . . . . . (382) (118,493) 60.5Tenaris SA . . . . . . . . . . . . . . (32,628) (398,287) 203.3Tesla, Inc. . . . . . . . . . . . . . . (73) (68,381) 34.9Thermo Fisher Scientific, Inc. . (821) (477,247) 243.6TJX Cos., Inc. (The) . . . . . . . (717) (51,602) 26.3T-Mobile US, Inc. . . . . . . . . . (2,282) (246,844) 126.0Trade Desk, Inc. (The), Class A (1,031) (71,696) 36.6Tradeweb Markets, Inc., Class A (275) (23,312) 11.9
Shares Value% of Basket
ValueUnited States (continued)TransUnion . . . . . . . . . . . . . (430) $ (44,342) 22.6%Truist Financial Corp. . . . . . . . (679) (42,655) 21.8Twilio, Inc., Class A . . . . . . . . (585) (120,580) 61.5Twitter, Inc. . . . . . . . . . . . . . (371) (13,916) 7.1Tyler Technologies, Inc. . . . . . (652) (308,918) 157.7Unity Software, Inc. . . . . . . . . (1,241) (130,491) 66.6Universal Health Services, Inc.,
Class B . . . . . . . . . . . . . . (910) (118,355) 60.4US Bancorp . . . . . . . . . . . . . (5,079) (295,547) 150.8VF Corp. . . . . . . . . . . . . . . . (2,187) (142,614) 72.8ViacomCBS, Inc. . . . . . . . . . . (1,838) (61,481) 31.4Viatris, Inc. . . . . . . . . . . . . . . (4,016) (60,120) 30.7Vimeo, Inc. . . . . . . . . . . . . . (1) (15) (0.0)Vulcan Materials Co. . . . . . . . (795) (151,296) 77.2W R Berkley Corp. . . . . . . . . (1,966) (166,127) 84.8Walt Disney Co. (The) . . . . . . (885) (126,528) 64.6Waste Connections, Inc. . . . . . (3,015) (375,970) 191.9Waste Management, Inc. . . . . (1,441) (216,784) 110.6WEC Energy Group, Inc. . . . . (428) (41,533) 21.2Westinghouse Air Brake
Technologies Corp. . . . . . . (31) (2,756) 1.4Williams Cos., Inc. (The) . . . . (2,627) (78,652) 40.1Willis Towers Watson plc . . . . (324) (75,803) 38.7Wynn Resorts Ltd. . . . . . . . . (474) (40,503) 20.7Xylem, Inc. . . . . . . . . . . . . . . (331) (34,762) 17.7Zendesk, Inc. . . . . . . . . . . . . (252) (24,825) 12.7Zillow Group, Inc., Class C . . . (514) (25,947) 13.2Zimmer Biomet Holdings, Inc. . (3,157) (388,374) 198.2Zoom Video Communications,
Inc., Class A . . . . . . . . . . . (580) (89,482) 45.7Zscaler, Inc. . . . . . . . . . . . . . (206) (52,965) 27.0
(27,225,733)
Total Reference Entity — Short . . . . . . . . . . . . (69,524,609)
Net Value of Reference Entity — BNP Paribas SA $ (195,941)
The following table represents the individual long and short positions and relatedvalues of equity securities underlying the total return swap with Citibank NA, as ofJanuary 31, 2022, expiration dates 02/24/23-02/27/23:
Reference Entity — LongAustraliaAristocrat Leisure Ltd. . . . . . . 4,574 132,590 314.0ASX Ltd. . . . . . . . . . . . . . . . 2,498 148,153 350.9Aurizon Holdings Ltd. . . . . . . 86,527 216,478 512.7Brambles Ltd. . . . . . . . . . . . . 15,678 107,709 255.1Cochlear Ltd. . . . . . . . . . . . . 1,147 157,291 372.5Coles Group Ltd. . . . . . . . . . 17,135 196,859 466.3Sonic Healthcare Ltd. . . . . . . 5,462 147,093 348.4Tabcorp Holdings Ltd. . . . . . . 8,658 30,420 72.1
1,136,593AustriaOMV AG . . . . . . . . . . . . . . . 1,649 100,926 239.0Raiffeisen Bank International AG 1,274 35,809 84.8voestalpine AG . . . . . . . . . . . 144 4,787 11.3
141,522BelgiumProximus SADP . . . . . . . . . . 2,204 45,007 106.6UCB SA . . . . . . . . . . . . . . . 487 48,459 114.8
93,466
BNM0322U-2100207-6479109
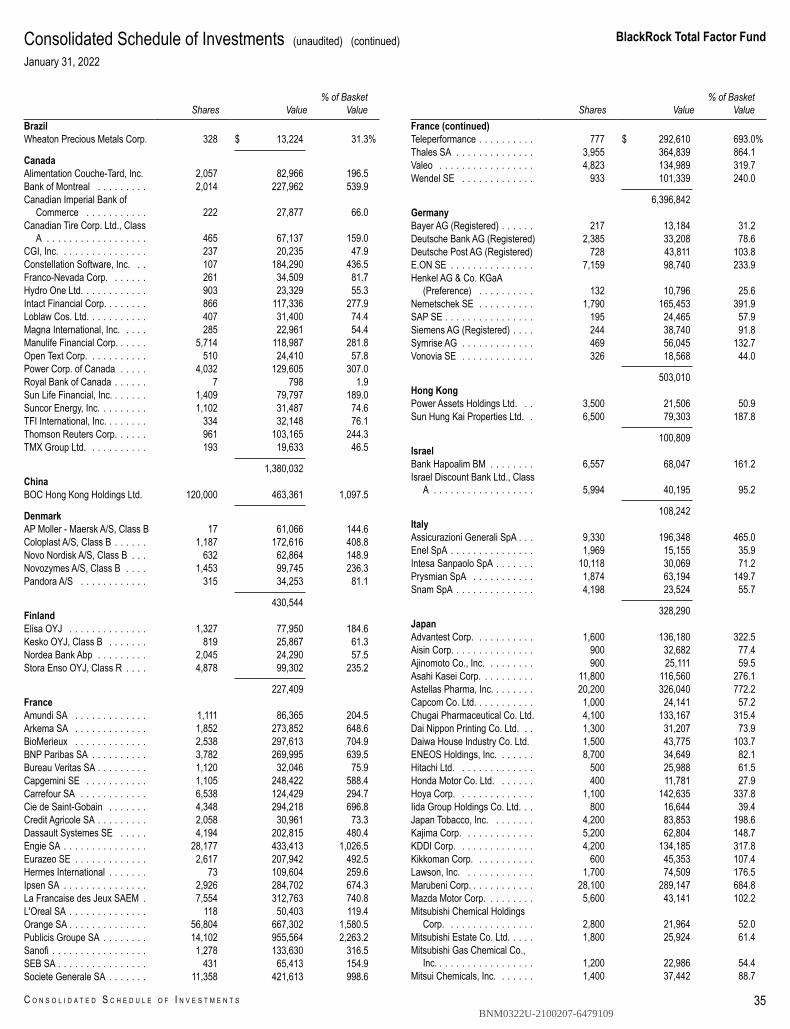
BlackRock Total Factor Fund
C O N S O L I D A T E D S C H E D U L E O F I N V E S T M E N T S 35
Consolidated Schedule of Investments (unaudited) (continued)January 31, 2022
Shares Value% of Basket
ValueBrazilWheaton Precious Metals Corp. 328 $ 13,224 31.3%
CanadaAlimentation Couche-Tard, Inc. 2,057 82,966 196.5Bank of Montreal . . . . . . . . . 2,014 227,962 539.9Canadian Imperial Bank of
Commerce . . . . . . . . . . . 222 27,877 66.0Canadian Tire Corp. Ltd., Class
A . . . . . . . . . . . . . . . . . . 465 67,137 159.0CGI, Inc. . . . . . . . . . . . . . . . 237 20,235 47.9Constellation Software, Inc. . . 107 184,290 436.5Franco-Nevada Corp. . . . . . . 261 34,509 81.7Hydro One Ltd. . . . . . . . . . . . 903 23,329 55.3Intact Financial Corp. . . . . . . . 866 117,336 277.9Loblaw Cos. Ltd. . . . . . . . . . . 407 31,400 74.4Magna International, Inc. . . . . 285 22,961 54.4Manulife Financial Corp. . . . . . 5,714 118,987 281.8Open Text Corp. . . . . . . . . . . 510 24,410 57.8Power Corp. of Canada . . . . . 4,032 129,605 307.0Royal Bank of Canada . . . . . . 7 798 1.9Sun Life Financial, Inc. . . . . . . 1,409 79,797 189.0Suncor Energy, Inc. . . . . . . . . 1,102 31,487 74.6TFI International, Inc. . . . . . . . 334 32,148 76.1Thomson Reuters Corp. . . . . . 961 103,165 244.3TMX Group Ltd. . . . . . . . . . . 193 19,633 46.5
1,380,032ChinaBOC Hong Kong Holdings Ltd. 120,000 463,361 1,097.5
DenmarkAP Moller - Maersk A/S, Class B 17 61,066 144.6Coloplast A/S, Class B . . . . . . 1,187 172,616 408.8Novo Nordisk A/S, Class B . . . 632 62,864 148.9Novozymes A/S, Class B . . . . 1,453 99,745 236.3Pandora A/S . . . . . . . . . . . . 315 34,253 81.1
430,544FinlandElisa OYJ . . . . . . . . . . . . . . 1,327 77,950 184.6Kesko OYJ, Class B . . . . . . . 819 25,867 61.3Nordea Bank Abp . . . . . . . . . 2,045 24,290 57.5Stora Enso OYJ, Class R . . . . 4,878 99,302 235.2
227,409FranceAmundi SA . . . . . . . . . . . . . 1,111 86,365 204.5Arkema SA . . . . . . . . . . . . . 1,852 273,852 648.6BioMerieux . . . . . . . . . . . . . 2,538 297,613 704.9BNP Paribas SA . . . . . . . . . . 3,782 269,995 639.5Bureau Veritas SA . . . . . . . . . 1,120 32,046 75.9Capgemini SE . . . . . . . . . . . 1,105 248,422 588.4Carrefour SA . . . . . . . . . . . . 6,538 124,429 294.7Cie de Saint-Gobain . . . . . . . 4,348 294,218 696.8Credit Agricole SA . . . . . . . . . 2,058 30,961 73.3Dassault Systemes SE . . . . . 4,194 202,815 480.4Engie SA . . . . . . . . . . . . . . . 28,177 433,413 1,026.5Eurazeo SE . . . . . . . . . . . . . 2,617 207,942 492.5Hermes International . . . . . . . 73 109,604 259.6Ipsen SA . . . . . . . . . . . . . . . 2,926 284,702 674.3La Francaise des Jeux SAEM . 7,554 312,763 740.8L'Oreal SA . . . . . . . . . . . . . . 118 50,403 119.4Orange SA . . . . . . . . . . . . . . 56,804 667,302 1,580.5Publicis Groupe SA . . . . . . . . 14,102 955,564 2,263.2Sanofi . . . . . . . . . . . . . . . . . 1,278 133,630 316.5SEB SA . . . . . . . . . . . . . . . . 431 65,413 154.9Societe Generale SA . . . . . . . 11,358 421,613 998.6
Shares Value% of Basket
ValueFrance (continued)Teleperformance . . . . . . . . . . 777 $ 292,610 693.0%Thales SA . . . . . . . . . . . . . . 3,955 364,839 864.1Valeo . . . . . . . . . . . . . . . . . 4,823 134,989 319.7Wendel SE . . . . . . . . . . . . . 933 101,339 240.0
6,396,842GermanyBayer AG (Registered) . . . . . . 217 13,184 31.2Deutsche Bank AG (Registered) 2,385 33,208 78.6Deutsche Post AG (Registered) 728 43,811 103.8E.ON SE . . . . . . . . . . . . . . . 7,159 98,740 233.9Henkel AG & Co. KGaA
(Preference) . . . . . . . . . . 132 10,796 25.6Nemetschek SE . . . . . . . . . . 1,790 165,453 391.9SAP SE . . . . . . . . . . . . . . . . 195 24,465 57.9Siemens AG (Registered) . . . . 244 38,740 91.8Symrise AG . . . . . . . . . . . . . 469 56,045 132.7Vonovia SE . . . . . . . . . . . . . 326 18,568 44.0
503,010Hong KongPower Assets Holdings Ltd. . . 3,500 21,506 50.9Sun Hung Kai Properties Ltd. . 6,500 79,303 187.8
100,809IsraelBank Hapoalim BM . . . . . . . . 6,557 68,047 161.2Israel Discount Bank Ltd., Class
A . . . . . . . . . . . . . . . . . . 5,994 40,195 95.2
108,242ItalyAssicurazioni Generali SpA . . . 9,330 196,348 465.0Enel SpA . . . . . . . . . . . . . . . 1,969 15,155 35.9Intesa Sanpaolo SpA . . . . . . . 10,118 30,069 71.2Prysmian SpA . . . . . . . . . . . 1,874 63,194 149.7Snam SpA . . . . . . . . . . . . . . 4,198 23,524 55.7
328,290JapanAdvantest Corp. . . . . . . . . . . 1,600 136,180 322.5Aisin Corp. . . . . . . . . . . . . . . 900 32,682 77.4Ajinomoto Co., Inc. . . . . . . . . 900 25,111 59.5Asahi Kasei Corp. . . . . . . . . . 11,800 116,560 276.1Astellas Pharma, Inc. . . . . . . . 20,200 326,040 772.2Capcom Co. Ltd. . . . . . . . . . . 1,000 24,141 57.2Chugai Pharmaceutical Co. Ltd. 4,100 133,167 315.4Dai Nippon Printing Co. Ltd. . . 1,300 31,207 73.9Daiwa House Industry Co. Ltd. 1,500 43,775 103.7ENEOS Holdings, Inc. . . . . . . 8,700 34,649 82.1Hitachi Ltd. . . . . . . . . . . . . . 500 25,988 61.5Honda Motor Co. Ltd. . . . . . . 400 11,781 27.9Hoya Corp. . . . . . . . . . . . . . 1,100 142,635 337.8Iida Group Holdings Co. Ltd. . . 800 16,644 39.4Japan Tobacco, Inc. . . . . . . . 4,200 83,853 198.6Kajima Corp. . . . . . . . . . . . . 5,200 62,804 148.7KDDI Corp. . . . . . . . . . . . . . 4,200 134,185 317.8Kikkoman Corp. . . . . . . . . . . 600 45,353 107.4Lawson, Inc. . . . . . . . . . . . . 1,700 74,509 176.5Marubeni Corp. . . . . . . . . . . . 28,100 289,147 684.8Mazda Motor Corp. . . . . . . . . 5,600 43,141 102.2Mitsubishi Chemical Holdings
Corp. . . . . . . . . . . . . . . . 2,800 21,964 52.0Mitsubishi Estate Co. Ltd. . . . . 1,800 25,924 61.4Mitsubishi Gas Chemical Co.,
Inc. . . . . . . . . . . . . . . . . . 1,200 22,986 54.4Mitsui Chemicals, Inc. . . . . . . 1,400 37,442 88.7
BNM0322U-2100207-6479109
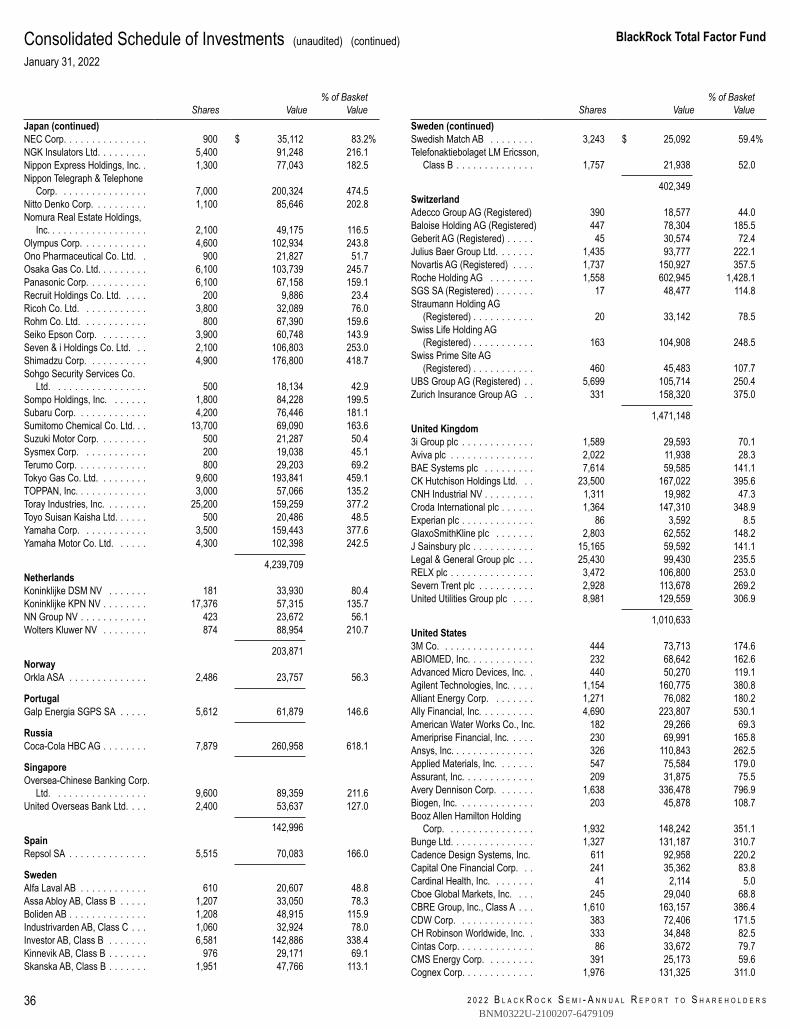
2 0 2 2 B L A C K R O C K S E M I - A N N U A L R E P O R T T O S H A R E H O L D E R S
BlackRock Total Factor Fund
36
Consolidated Schedule of Investments (unaudited) (continued)January 31, 2022
Shares Value% of Basket
ValueJapan (continued)NEC Corp. . . . . . . . . . . . . . . 900 $ 35,112 83.2%NGK Insulators Ltd. . . . . . . . . 5,400 91,248 216.1Nippon Express Holdings, Inc. . 1,300 77,043 182.5Nippon Telegraph & Telephone
Corp. . . . . . . . . . . . . . . . 7,000 200,324 474.5Nitto Denko Corp. . . . . . . . . . 1,100 85,646 202.8Nomura Real Estate Holdings,
Inc. . . . . . . . . . . . . . . . . . 2,100 49,175 116.5Olympus Corp. . . . . . . . . . . . 4,600 102,934 243.8Ono Pharmaceutical Co. Ltd. . 900 21,827 51.7Osaka Gas Co. Ltd. . . . . . . . . 6,100 103,739 245.7Panasonic Corp. . . . . . . . . . . 6,100 67,158 159.1Recruit Holdings Co. Ltd. . . . . 200 9,886 23.4Ricoh Co. Ltd. . . . . . . . . . . . 3,800 32,089 76.0Rohm Co. Ltd. . . . . . . . . . . . 800 67,390 159.6Seiko Epson Corp. . . . . . . . . 3,900 60,748 143.9Seven & i Holdings Co. Ltd. . . 2,100 106,803 253.0Shimadzu Corp. . . . . . . . . . . 4,900 176,800 418.7Sohgo Security Services Co.
Ltd. . . . . . . . . . . . . . . . . 500 18,134 42.9Sompo Holdings, Inc. . . . . . . 1,800 84,228 199.5Subaru Corp. . . . . . . . . . . . . 4,200 76,446 181.1Sumitomo Chemical Co. Ltd. . . 13,700 69,090 163.6Suzuki Motor Corp. . . . . . . . . 500 21,287 50.4Sysmex Corp. . . . . . . . . . . . 200 19,038 45.1Terumo Corp. . . . . . . . . . . . . 800 29,203 69.2Tokyo Gas Co. Ltd. . . . . . . . . 9,600 193,841 459.1TOPPAN, Inc. . . . . . . . . . . . . 3,000 57,066 135.2Toray Industries, Inc. . . . . . . . 25,200 159,259 377.2Toyo Suisan Kaisha Ltd. . . . . . 500 20,486 48.5Yamaha Corp. . . . . . . . . . . . 3,500 159,443 377.6Yamaha Motor Co. Ltd. . . . . . 4,300 102,398 242.5
4,239,709NetherlandsKoninklijke DSM NV . . . . . . . 181 33,930 80.4Koninklijke KPN NV . . . . . . . . 17,376 57,315 135.7NN Group NV . . . . . . . . . . . . 423 23,672 56.1Wolters Kluwer NV . . . . . . . . 874 88,954 210.7
203,871NorwayOrkla ASA . . . . . . . . . . . . . . 2,486 23,757 56.3
PortugalGalp Energia SGPS SA . . . . . 5,612 61,879 146.6
RussiaCoca-Cola HBC AG . . . . . . . . 7,879 260,958 618.1
SingaporeOversea-Chinese Banking Corp.
Ltd. . . . . . . . . . . . . . . . . 9,600 89,359 211.6United Overseas Bank Ltd. . . . 2,400 53,637 127.0
142,996SpainRepsol SA . . . . . . . . . . . . . . 5,515 70,083 166.0
SwedenAlfa Laval AB . . . . . . . . . . . . 610 20,607 48.8Assa Abloy AB, Class B . . . . . 1,207 33,050 78.3Boliden AB . . . . . . . . . . . . . . 1,208 48,915 115.9Industrivarden AB, Class C . . . 1,060 32,924 78.0Investor AB, Class B . . . . . . . 6,581 142,886 338.4Kinnevik AB, Class B . . . . . . . 976 29,171 69.1Skanska AB, Class B . . . . . . . 1,951 47,766 113.1
Shares Value% of Basket
ValueSweden (continued)Swedish Match AB . . . . . . . . 3,243 $ 25,092 59.4%Telefonaktiebolaget LM Ericsson,
Class B . . . . . . . . . . . . . . 1,757 21,938 52.0
402,349SwitzerlandAdecco Group AG (Registered) 390 18,577 44.0Baloise Holding AG (Registered) 447 78,304 185.5Geberit AG (Registered) . . . . . 45 30,574 72.4Julius Baer Group Ltd. . . . . . . 1,435 93,777 222.1Novartis AG (Registered) . . . . 1,737 150,927 357.5Roche Holding AG . . . . . . . . 1,558 602,945 1,428.1SGS SA (Registered) . . . . . . . 17 48,477 114.8Straumann Holding AG
(Registered) . . . . . . . . . . . 20 33,142 78.5Swiss Life Holding AG
(Registered) . . . . . . . . . . . 163 104,908 248.5Swiss Prime Site AG
(Registered) . . . . . . . . . . . 460 45,483 107.7UBS Group AG (Registered) . . 5,699 105,714 250.4Zurich Insurance Group AG . . 331 158,320 375.0
1,471,148United Kingdom3i Group plc . . . . . . . . . . . . . 1,589 29,593 70.1Aviva plc . . . . . . . . . . . . . . . 2,022 11,938 28.3BAE Systems plc . . . . . . . . . 7,614 59,585 141.1CK Hutchison Holdings Ltd. . . 23,500 167,022 395.6CNH Industrial NV . . . . . . . . . 1,311 19,982 47.3Croda International plc . . . . . . 1,364 147,310 348.9Experian plc . . . . . . . . . . . . . 86 3,592 8.5GlaxoSmithKline plc . . . . . . . 2,803 62,552 148.2J Sainsbury plc . . . . . . . . . . . 15,165 59,592 141.1Legal & General Group plc . . . 25,430 99,430 235.5RELX plc . . . . . . . . . . . . . . . 3,472 106,800 253.0Severn Trent plc . . . . . . . . . . 2,928 113,678 269.2United Utilities Group plc . . . . 8,981 129,559 306.9
1,010,633United States3M Co. . . . . . . . . . . . . . . . . 444 73,713 174.6ABIOMED, Inc. . . . . . . . . . . . 232 68,642 162.6Advanced Micro Devices, Inc. . 440 50,270 119.1Agilent Technologies, Inc. . . . . 1,154 160,775 380.8Alliant Energy Corp. . . . . . . . 1,271 76,082 180.2Ally Financial, Inc. . . . . . . . . . 4,690 223,807 530.1American Water Works Co., Inc. 182 29,266 69.3Ameriprise Financial, Inc. . . . . 230 69,991 165.8Ansys, Inc. . . . . . . . . . . . . . . 326 110,843 262.5Applied Materials, Inc. . . . . . . 547 75,584 179.0Assurant, Inc. . . . . . . . . . . . . 209 31,875 75.5Avery Dennison Corp. . . . . . . 1,638 336,478 796.9Biogen, Inc. . . . . . . . . . . . . . 203 45,878 108.7Booz Allen Hamilton Holding
Corp. . . . . . . . . . . . . . . . 1,932 148,242 351.1Bunge Ltd. . . . . . . . . . . . . . . 1,327 131,187 310.7Cadence Design Systems, Inc. 611 92,958 220.2Capital One Financial Corp. . . 241 35,362 83.8Cardinal Health, Inc. . . . . . . . 41 2,114 5.0Cboe Global Markets, Inc. . . . 245 29,040 68.8CBRE Group, Inc., Class A . . . 1,610 163,157 386.4CDW Corp. . . . . . . . . . . . . . 383 72,406 171.5CH Robinson Worldwide, Inc. . 333 34,848 82.5Cintas Corp. . . . . . . . . . . . . . 86 33,672 79.7CMS Energy Corp. . . . . . . . . 391 25,173 59.6Cognex Corp. . . . . . . . . . . . . 1,976 131,325 311.0
BNM0322U-2100207-6479109
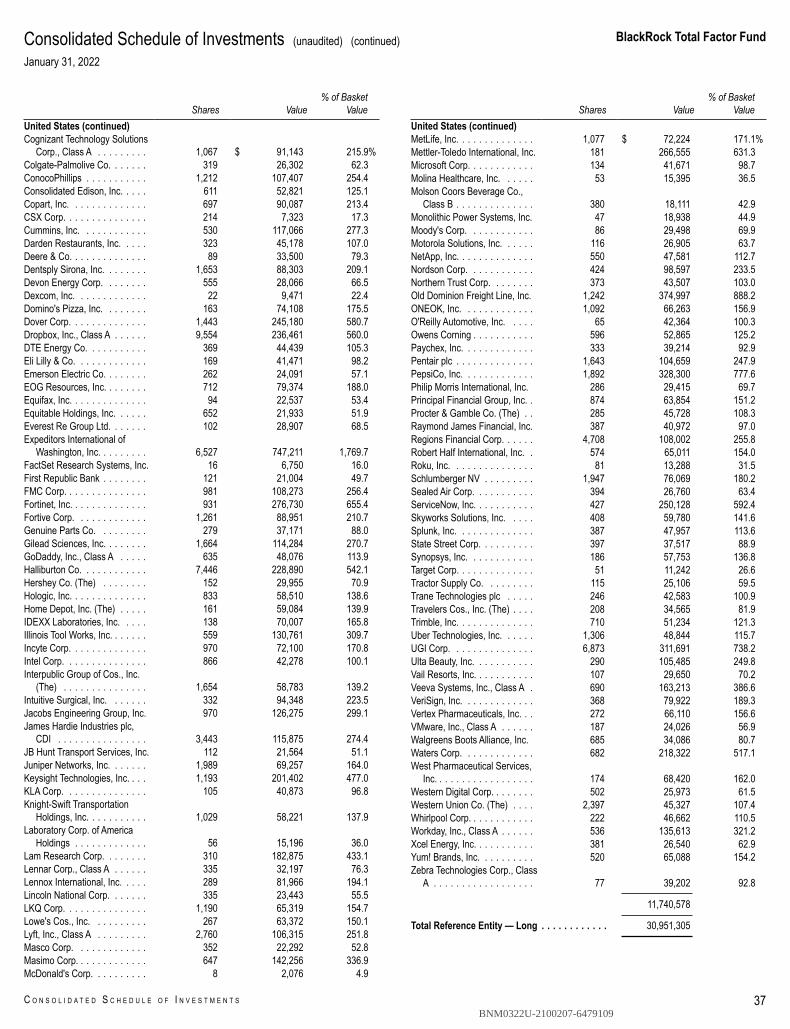
BlackRock Total Factor Fund
C O N S O L I D A T E D S C H E D U L E O F I N V E S T M E N T S 37
Consolidated Schedule of Investments (unaudited) (continued)January 31, 2022
Shares Value% of Basket
ValueUnited States (continued)Cognizant Technology Solutions
Corp., Class A . . . . . . . . . 1,067 $ 91,143 215.9%Colgate-Palmolive Co. . . . . . . 319 26,302 62.3ConocoPhillips . . . . . . . . . . . 1,212 107,407 254.4Consolidated Edison, Inc. . . . . 611 52,821 125.1Copart, Inc. . . . . . . . . . . . . . 697 90,087 213.4CSX Corp. . . . . . . . . . . . . . . 214 7,323 17.3Cummins, Inc. . . . . . . . . . . . 530 117,066 277.3Darden Restaurants, Inc. . . . . 323 45,178 107.0Deere & Co. . . . . . . . . . . . . . 89 33,500 79.3Dentsply Sirona, Inc. . . . . . . . 1,653 88,303 209.1Devon Energy Corp. . . . . . . . 555 28,066 66.5Dexcom, Inc. . . . . . . . . . . . . 22 9,471 22.4Domino's Pizza, Inc. . . . . . . . 163 74,108 175.5Dover Corp. . . . . . . . . . . . . . 1,443 245,180 580.7Dropbox, Inc., Class A . . . . . . 9,554 236,461 560.0DTE Energy Co. . . . . . . . . . . 369 44,439 105.3Eli Lilly & Co. . . . . . . . . . . . . 169 41,471 98.2Emerson Electric Co. . . . . . . . 262 24,091 57.1EOG Resources, Inc. . . . . . . . 712 79,374 188.0Equifax, Inc. . . . . . . . . . . . . . 94 22,537 53.4Equitable Holdings, Inc. . . . . . 652 21,933 51.9Everest Re Group Ltd. . . . . . . 102 28,907 68.5Expeditors International of
Washington, Inc. . . . . . . . . 6,527 747,211 1,769.7FactSet Research Systems, Inc. 16 6,750 16.0First Republic Bank . . . . . . . . 121 21,004 49.7FMC Corp. . . . . . . . . . . . . . . 981 108,273 256.4Fortinet, Inc. . . . . . . . . . . . . . 931 276,730 655.4Fortive Corp. . . . . . . . . . . . . 1,261 88,951 210.7Genuine Parts Co. . . . . . . . . 279 37,171 88.0Gilead Sciences, Inc. . . . . . . . 1,664 114,284 270.7GoDaddy, Inc., Class A . . . . . 635 48,076 113.9Halliburton Co. . . . . . . . . . . . 7,446 228,890 542.1Hershey Co. (The) . . . . . . . . 152 29,955 70.9Hologic, Inc. . . . . . . . . . . . . . 833 58,510 138.6Home Depot, Inc. (The) . . . . . 161 59,084 139.9IDEXX Laboratories, Inc. . . . . 138 70,007 165.8Illinois Tool Works, Inc. . . . . . . 559 130,761 309.7Incyte Corp. . . . . . . . . . . . . . 970 72,100 170.8Intel Corp. . . . . . . . . . . . . . . 866 42,278 100.1Interpublic Group of Cos., Inc.
(The) . . . . . . . . . . . . . . . 1,654 58,783 139.2Intuitive Surgical, Inc. . . . . . . 332 94,348 223.5Jacobs Engineering Group, Inc. 970 126,275 299.1James Hardie Industries plc,
CDI . . . . . . . . . . . . . . . . 3,443 115,875 274.4JB Hunt Transport Services, Inc. 112 21,564 51.1Juniper Networks, Inc. . . . . . . 1,989 69,257 164.0Keysight Technologies, Inc. . . . 1,193 201,402 477.0KLA Corp. . . . . . . . . . . . . . . 105 40,873 96.8Knight-Swift Transportation
Holdings, Inc. . . . . . . . . . . 1,029 58,221 137.9Laboratory Corp. of America
Holdings . . . . . . . . . . . . . 56 15,196 36.0Lam Research Corp. . . . . . . . 310 182,875 433.1Lennar Corp., Class A . . . . . . 335 32,197 76.3Lennox International, Inc. . . . . 289 81,966 194.1Lincoln National Corp. . . . . . . 335 23,443 55.5LKQ Corp. . . . . . . . . . . . . . . 1,190 65,319 154.7Lowe's Cos., Inc. . . . . . . . . . 267 63,372 150.1Lyft, Inc., Class A . . . . . . . . . 2,760 106,315 251.8Masco Corp. . . . . . . . . . . . . 352 22,292 52.8Masimo Corp. . . . . . . . . . . . . 647 142,256 336.9McDonald's Corp. . . . . . . . . . 8 2,076 4.9
Shares Value% of Basket
ValueUnited States (continued)MetLife, Inc. . . . . . . . . . . . . . 1,077 $ 72,224 171.1%Mettler-Toledo International, Inc. 181 266,555 631.3Microsoft Corp. . . . . . . . . . . . 134 41,671 98.7Molina Healthcare, Inc. . . . . . 53 15,395 36.5Molson Coors Beverage Co.,
Class B . . . . . . . . . . . . . . 380 18,111 42.9Monolithic Power Systems, Inc. 47 18,938 44.9Moody's Corp. . . . . . . . . . . . 86 29,498 69.9Motorola Solutions, Inc. . . . . . 116 26,905 63.7NetApp, Inc. . . . . . . . . . . . . . 550 47,581 112.7Nordson Corp. . . . . . . . . . . . 424 98,597 233.5Northern Trust Corp. . . . . . . . 373 43,507 103.0Old Dominion Freight Line, Inc. 1,242 374,997 888.2ONEOK, Inc. . . . . . . . . . . . . 1,092 66,263 156.9O'Reilly Automotive, Inc. . . . . 65 42,364 100.3Owens Corning . . . . . . . . . . . 596 52,865 125.2Paychex, Inc. . . . . . . . . . . . . 333 39,214 92.9Pentair plc . . . . . . . . . . . . . . 1,643 104,659 247.9PepsiCo, Inc. . . . . . . . . . . . . 1,892 328,300 777.6Philip Morris International, Inc. 286 29,415 69.7Principal Financial Group, Inc. . 874 63,854 151.2Procter & Gamble Co. (The) . . 285 45,728 108.3Raymond James Financial, Inc. 387 40,972 97.0Regions Financial Corp. . . . . . 4,708 108,002 255.8Robert Half International, Inc. . 574 65,011 154.0Roku, Inc. . . . . . . . . . . . . . . 81 13,288 31.5Schlumberger NV . . . . . . . . . 1,947 76,069 180.2Sealed Air Corp. . . . . . . . . . . 394 26,760 63.4ServiceNow, Inc. . . . . . . . . . . 427 250,128 592.4Skyworks Solutions, Inc. . . . . 408 59,780 141.6Splunk, Inc. . . . . . . . . . . . . . 387 47,957 113.6State Street Corp. . . . . . . . . . 397 37,517 88.9Synopsys, Inc. . . . . . . . . . . . 186 57,753 136.8Target Corp. . . . . . . . . . . . . . 51 11,242 26.6Tractor Supply Co. . . . . . . . . 115 25,106 59.5Trane Technologies plc . . . . . 246 42,583 100.9Travelers Cos., Inc. (The) . . . . 208 34,565 81.9Trimble, Inc. . . . . . . . . . . . . . 710 51,234 121.3Uber Technologies, Inc. . . . . . 1,306 48,844 115.7UGI Corp. . . . . . . . . . . . . . . 6,873 311,691 738.2Ulta Beauty, Inc. . . . . . . . . . . 290 105,485 249.8Vail Resorts, Inc. . . . . . . . . . . 107 29,650 70.2Veeva Systems, Inc., Class A . 690 163,213 386.6VeriSign, Inc. . . . . . . . . . . . . 368 79,922 189.3Vertex Pharmaceuticals, Inc. . . 272 66,110 156.6VMware, Inc., Class A . . . . . . 187 24,026 56.9Walgreens Boots Alliance, Inc. 685 34,086 80.7Waters Corp. . . . . . . . . . . . . 682 218,322 517.1West Pharmaceutical Services,
Inc. . . . . . . . . . . . . . . . . . 174 68,420 162.0Western Digital Corp. . . . . . . . 502 25,973 61.5Western Union Co. (The) . . . . 2,397 45,327 107.4Whirlpool Corp. . . . . . . . . . . . 222 46,662 110.5Workday, Inc., Class A . . . . . . 536 135,613 321.2Xcel Energy, Inc. . . . . . . . . . . 381 26,540 62.9Yum! Brands, Inc. . . . . . . . . . 520 65,088 154.2Zebra Technologies Corp., Class
A . . . . . . . . . . . . . . . . . . 77 39,202 92.8
11,740,578
Total Reference Entity — Long . . . . . . . . . . . . 30,951,305
BNM0322U-2100207-6479109
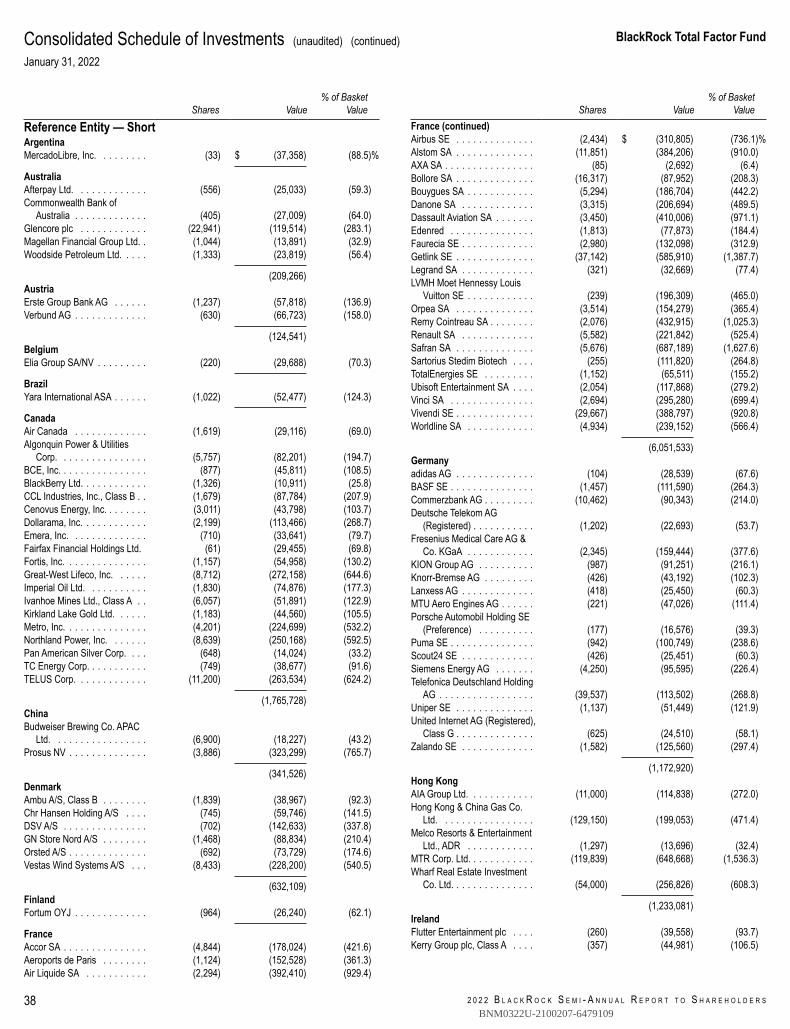
2 0 2 2 B L A C K R O C K S E M I - A N N U A L R E P O R T T O S H A R E H O L D E R S
BlackRock Total Factor Fund
38
Consolidated Schedule of Investments (unaudited) (continued)January 31, 2022
Shares Value% of Basket
Value
Reference Entity — ShortArgentinaMercadoLibre, Inc. . . . . . . . . (33) $ (37,358) (88.5)%
AustraliaAfterpay Ltd. . . . . . . . . . . . . (556) (25,033) (59.3)Commonwealth Bank of
Australia . . . . . . . . . . . . . (405) (27,009) (64.0)Glencore plc . . . . . . . . . . . . (22,941) (119,514) (283.1)Magellan Financial Group Ltd. . (1,044) (13,891) (32.9)Woodside Petroleum Ltd. . . . . (1,333) (23,819) (56.4)
(209,266)AustriaErste Group Bank AG . . . . . . (1,237) (57,818) (136.9)Verbund AG . . . . . . . . . . . . . (630) (66,723) (158.0)
(124,541)BelgiumElia Group SA/NV . . . . . . . . . (220) (29,688) (70.3)
BrazilYara International ASA . . . . . . (1,022) (52,477) (124.3)
CanadaAir Canada . . . . . . . . . . . . . (1,619) (29,116) (69.0)Algonquin Power & Utilities
Corp. . . . . . . . . . . . . . . . (5,757) (82,201) (194.7)BCE, Inc. . . . . . . . . . . . . . . . (877) (45,811) (108.5)BlackBerry Ltd. . . . . . . . . . . . (1,326) (10,911) (25.8)CCL Industries, Inc., Class B . . (1,679) (87,784) (207.9)Cenovus Energy, Inc. . . . . . . . (3,011) (43,798) (103.7)Dollarama, Inc. . . . . . . . . . . . (2,199) (113,466) (268.7)Emera, Inc. . . . . . . . . . . . . . (710) (33,641) (79.7)Fairfax Financial Holdings Ltd. (61) (29,455) (69.8)Fortis, Inc. . . . . . . . . . . . . . . (1,157) (54,958) (130.2)Great-West Lifeco, Inc. . . . . . (8,712) (272,158) (644.6)Imperial Oil Ltd. . . . . . . . . . . (1,830) (74,876) (177.3)Ivanhoe Mines Ltd., Class A . . (6,057) (51,891) (122.9)Kirkland Lake Gold Ltd. . . . . . (1,183) (44,560) (105.5)Metro, Inc. . . . . . . . . . . . . . . (4,201) (224,699) (532.2)Northland Power, Inc. . . . . . . (8,639) (250,168) (592.5)Pan American Silver Corp. . . . (648) (14,024) (33.2)TC Energy Corp. . . . . . . . . . . (749) (38,677) (91.6)TELUS Corp. . . . . . . . . . . . . (11,200) (263,534) (624.2)
(1,765,728)ChinaBudweiser Brewing Co. APAC
Ltd. . . . . . . . . . . . . . . . . (6,900) (18,227) (43.2)Prosus NV . . . . . . . . . . . . . . (3,886) (323,299) (765.7)
(341,526)DenmarkAmbu A/S, Class B . . . . . . . . (1,839) (38,967) (92.3)Chr Hansen Holding A/S . . . . (745) (59,746) (141.5)DSV A/S . . . . . . . . . . . . . . . (702) (142,633) (337.8)GN Store Nord A/S . . . . . . . . (1,468) (88,834) (210.4)Orsted A/S . . . . . . . . . . . . . . (692) (73,729) (174.6)Vestas Wind Systems A/S . . . (8,433) (228,200) (540.5)
(632,109)FinlandFortum OYJ . . . . . . . . . . . . . (964) (26,240) (62.1)
FranceAccor SA . . . . . . . . . . . . . . . (4,844) (178,024) (421.6)Aeroports de Paris . . . . . . . . (1,124) (152,528) (361.3)Air Liquide SA . . . . . . . . . . . (2,294) (392,410) (929.4)
Shares Value% of Basket
ValueFrance (continued)Airbus SE . . . . . . . . . . . . . . (2,434) $ (310,805) (736.1)%Alstom SA . . . . . . . . . . . . . . (11,851) (384,206) (910.0)AXA SA . . . . . . . . . . . . . . . . (85) (2,692) (6.4)Bollore SA . . . . . . . . . . . . . . (16,317) (87,952) (208.3)Bouygues SA . . . . . . . . . . . . (5,294) (186,704) (442.2)Danone SA . . . . . . . . . . . . . (3,315) (206,694) (489.5)Dassault Aviation SA . . . . . . . (3,450) (410,006) (971.1)Edenred . . . . . . . . . . . . . . . (1,813) (77,873) (184.4)Faurecia SE . . . . . . . . . . . . . (2,980) (132,098) (312.9)Getlink SE . . . . . . . . . . . . . . (37,142) (585,910) (1,387.7)Legrand SA . . . . . . . . . . . . . (321) (32,669) (77.4)LVMH Moet Hennessy Louis
Vuitton SE . . . . . . . . . . . . (239) (196,309) (465.0)Orpea SA . . . . . . . . . . . . . . (3,514) (154,279) (365.4)Remy Cointreau SA . . . . . . . . (2,076) (432,915) (1,025.3)Renault SA . . . . . . . . . . . . . (5,582) (221,842) (525.4)Safran SA . . . . . . . . . . . . . . (5,676) (687,189) (1,627.6)Sartorius Stedim Biotech . . . . (255) (111,820) (264.8)TotalEnergies SE . . . . . . . . . (1,152) (65,511) (155.2)Ubisoft Entertainment SA . . . . (2,054) (117,868) (279.2)Vinci SA . . . . . . . . . . . . . . . (2,694) (295,280) (699.4)Vivendi SE . . . . . . . . . . . . . . (29,667) (388,797) (920.8)Worldline SA . . . . . . . . . . . . (4,934) (239,152) (566.4)
(6,051,533)Germanyadidas AG . . . . . . . . . . . . . . (104) (28,539) (67.6)BASF SE . . . . . . . . . . . . . . . (1,457) (111,590) (264.3)Commerzbank AG . . . . . . . . . (10,462) (90,343) (214.0)Deutsche Telekom AG
(Registered) . . . . . . . . . . . (1,202) (22,693) (53.7)Fresenius Medical Care AG &
Co. KGaA . . . . . . . . . . . . (2,345) (159,444) (377.6)KION Group AG . . . . . . . . . . (987) (91,251) (216.1)Knorr-Bremse AG . . . . . . . . . (426) (43,192) (102.3)Lanxess AG . . . . . . . . . . . . . (418) (25,450) (60.3)MTU Aero Engines AG . . . . . . (221) (47,026) (111.4)Porsche Automobil Holding SE
(Preference) . . . . . . . . . . (177) (16,576) (39.3)Puma SE . . . . . . . . . . . . . . . (942) (100,749) (238.6)Scout24 SE . . . . . . . . . . . . . (426) (25,451) (60.3)Siemens Energy AG . . . . . . . (4,250) (95,595) (226.4)Telefonica Deutschland Holding
AG . . . . . . . . . . . . . . . . . (39,537) (113,502) (268.8)Uniper SE . . . . . . . . . . . . . . (1,137) (51,449) (121.9)United Internet AG (Registered),
Class G . . . . . . . . . . . . . . (625) (24,510) (58.1)Zalando SE . . . . . . . . . . . . . (1,582) (125,560) (297.4)
(1,172,920)Hong KongAIA Group Ltd. . . . . . . . . . . . (11,000) (114,838) (272.0)Hong Kong & China Gas Co.
Ltd. . . . . . . . . . . . . . . . . (129,150) (199,053) (471.4)Melco Resorts & Entertainment
Ltd., ADR . . . . . . . . . . . . (1,297) (13,696) (32.4)MTR Corp. Ltd. . . . . . . . . . . . (119,839) (648,668) (1,536.3)Wharf Real Estate Investment
Co. Ltd. . . . . . . . . . . . . . . (54,000) (256,826) (608.3)
(1,233,081)IrelandFlutter Entertainment plc . . . . (260) (39,558) (93.7)Kerry Group plc, Class A . . . . (357) (44,981) (106.5)
BNM0322U-2100207-6479109
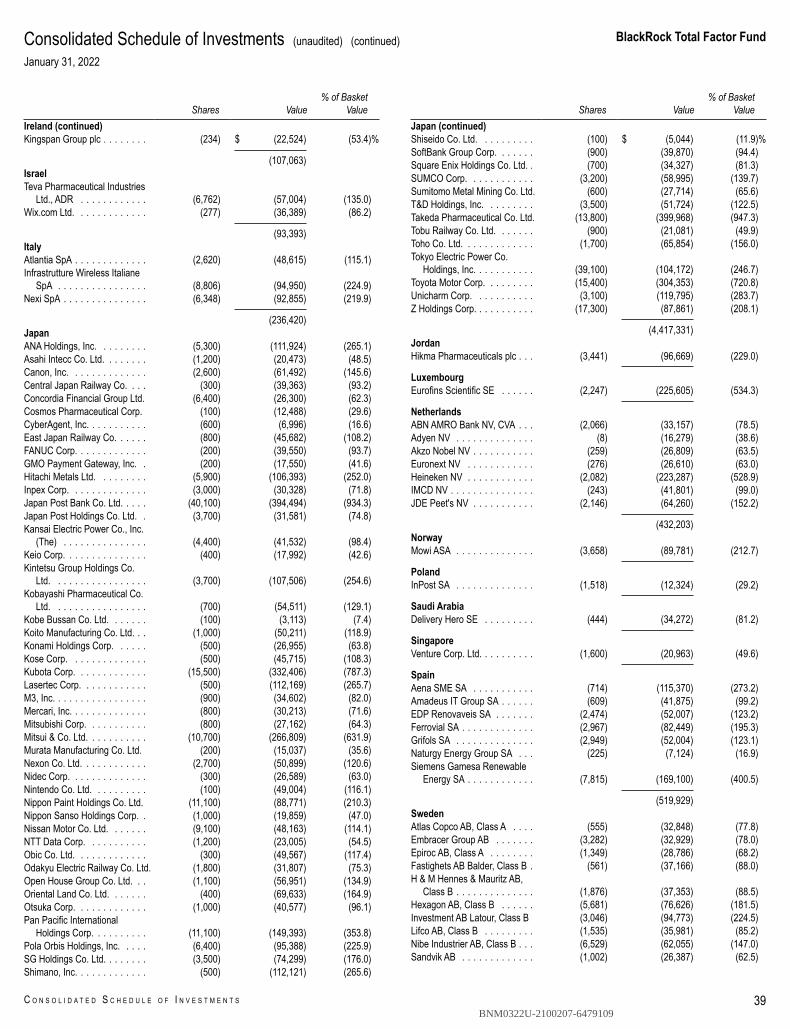
BlackRock Total Factor Fund
C O N S O L I D A T E D S C H E D U L E O F I N V E S T M E N T S 39
Consolidated Schedule of Investments (unaudited) (continued)January 31, 2022
Shares Value% of Basket
ValueIreland (continued)Kingspan Group plc . . . . . . . . (234) $ (22,524) (53.4)%
(107,063)IsraelTeva Pharmaceutical Industries
Ltd., ADR . . . . . . . . . . . . (6,762) (57,004) (135.0)Wix.com Ltd. . . . . . . . . . . . . (277) (36,389) (86.2)
(93,393)ItalyAtlantia SpA . . . . . . . . . . . . . (2,620) (48,615) (115.1)Infrastrutture Wireless Italiane
SpA . . . . . . . . . . . . . . . . (8,806) (94,950) (224.9)Nexi SpA . . . . . . . . . . . . . . . (6,348) (92,855) (219.9)
(236,420)JapanANA Holdings, Inc. . . . . . . . . (5,300) (111,924) (265.1)Asahi Intecc Co. Ltd. . . . . . . . (1,200) (20,473) (48.5)Canon, Inc. . . . . . . . . . . . . . (2,600) (61,492) (145.6)Central Japan Railway Co. . . . (300) (39,363) (93.2)Concordia Financial Group Ltd. (6,400) (26,300) (62.3)Cosmos Pharmaceutical Corp. (100) (12,488) (29.6)CyberAgent, Inc. . . . . . . . . . . (600) (6,996) (16.6)East Japan Railway Co. . . . . . (800) (45,682) (108.2)FANUC Corp. . . . . . . . . . . . . (200) (39,550) (93.7)GMO Payment Gateway, Inc. . (200) (17,550) (41.6)Hitachi Metals Ltd. . . . . . . . . (5,900) (106,393) (252.0)Inpex Corp. . . . . . . . . . . . . . (3,000) (30,328) (71.8)Japan Post Bank Co. Ltd. . . . . (40,100) (394,494) (934.3)Japan Post Holdings Co. Ltd. . (3,700) (31,581) (74.8)Kansai Electric Power Co., Inc.
(The) . . . . . . . . . . . . . . . (4,400) (41,532) (98.4)Keio Corp. . . . . . . . . . . . . . . (400) (17,992) (42.6)Kintetsu Group Holdings Co.
Ltd. . . . . . . . . . . . . . . . . (3,700) (107,506) (254.6)Kobayashi Pharmaceutical Co.
Ltd. . . . . . . . . . . . . . . . . (700) (54,511) (129.1)Kobe Bussan Co. Ltd. . . . . . . (100) (3,113) (7.4)Koito Manufacturing Co. Ltd. . . (1,000) (50,211) (118.9)Konami Holdings Corp. . . . . . (500) (26,955) (63.8)Kose Corp. . . . . . . . . . . . . . (500) (45,715) (108.3)Kubota Corp. . . . . . . . . . . . . (15,500) (332,406) (787.3)Lasertec Corp. . . . . . . . . . . . (500) (112,169) (265.7)M3, Inc. . . . . . . . . . . . . . . . . (900) (34,602) (82.0)Mercari, Inc. . . . . . . . . . . . . . (800) (30,213) (71.6)Mitsubishi Corp. . . . . . . . . . . (800) (27,162) (64.3)Mitsui & Co. Ltd. . . . . . . . . . . (10,700) (266,809) (631.9)Murata Manufacturing Co. Ltd. (200) (15,037) (35.6)Nexon Co. Ltd. . . . . . . . . . . . (2,700) (50,899) (120.6)Nidec Corp. . . . . . . . . . . . . . (300) (26,589) (63.0)Nintendo Co. Ltd. . . . . . . . . . (100) (49,004) (116.1)Nippon Paint Holdings Co. Ltd. (11,100) (88,771) (210.3)Nippon Sanso Holdings Corp. . (1,000) (19,859) (47.0)Nissan Motor Co. Ltd. . . . . . . (9,100) (48,163) (114.1)NTT Data Corp. . . . . . . . . . . (1,200) (23,005) (54.5)Obic Co. Ltd. . . . . . . . . . . . . (300) (49,567) (117.4)Odakyu Electric Railway Co. Ltd. (1,800) (31,807) (75.3)Open House Group Co. Ltd. . . (1,100) (56,951) (134.9)Oriental Land Co. Ltd. . . . . . . (400) (69,633) (164.9)Otsuka Corp. . . . . . . . . . . . . (1,000) (40,577) (96.1)Pan Pacific International
Holdings Corp. . . . . . . . . . (11,100) (149,393) (353.8)Pola Orbis Holdings, Inc. . . . . (6,400) (95,388) (225.9)SG Holdings Co. Ltd. . . . . . . . (3,500) (74,299) (176.0)Shimano, Inc. . . . . . . . . . . . . (500) (112,121) (265.6)
Shares Value% of Basket
ValueJapan (continued)Shiseido Co. Ltd. . . . . . . . . . (100) $ (5,044) (11.9)%SoftBank Group Corp. . . . . . . (900) (39,870) (94.4)Square Enix Holdings Co. Ltd. . (700) (34,327) (81.3)SUMCO Corp. . . . . . . . . . . . (3,200) (58,995) (139.7)Sumitomo Metal Mining Co. Ltd. (600) (27,714) (65.6)T&D Holdings, Inc. . . . . . . . . (3,500) (51,724) (122.5)Takeda Pharmaceutical Co. Ltd. (13,800) (399,968) (947.3)Tobu Railway Co. Ltd. . . . . . . (900) (21,081) (49.9)Toho Co. Ltd. . . . . . . . . . . . . (1,700) (65,854) (156.0)Tokyo Electric Power Co.
Holdings, Inc. . . . . . . . . . . (39,100) (104,172) (246.7)Toyota Motor Corp. . . . . . . . . (15,400) (304,353) (720.8)Unicharm Corp. . . . . . . . . . . (3,100) (119,795) (283.7)Z Holdings Corp. . . . . . . . . . . (17,300) (87,861) (208.1)
(4,417,331)JordanHikma Pharmaceuticals plc . . . (3,441) (96,669) (229.0)
LuxembourgEurofins Scientific SE . . . . . . (2,247) (225,605) (534.3)
NetherlandsABN AMRO Bank NV, CVA . . . (2,066) (33,157) (78.5)Adyen NV . . . . . . . . . . . . . . (8) (16,279) (38.6)Akzo Nobel NV . . . . . . . . . . . (259) (26,809) (63.5)Euronext NV . . . . . . . . . . . . (276) (26,610) (63.0)Heineken NV . . . . . . . . . . . . (2,082) (223,287) (528.9)IMCD NV . . . . . . . . . . . . . . . (243) (41,801) (99.0)JDE Peet's NV . . . . . . . . . . . (2,146) (64,260) (152.2)
(432,203)NorwayMowi ASA . . . . . . . . . . . . . . (3,658) (89,781) (212.7)
PolandInPost SA . . . . . . . . . . . . . . (1,518) (12,324) (29.2)
Saudi ArabiaDelivery Hero SE . . . . . . . . . (444) (34,272) (81.2)
SingaporeVenture Corp. Ltd. . . . . . . . . . (1,600) (20,963) (49.6)
SpainAena SME SA . . . . . . . . . . . (714) (115,370) (273.2)Amadeus IT Group SA . . . . . . (609) (41,875) (99.2)EDP Renovaveis SA . . . . . . . (2,474) (52,007) (123.2)Ferrovial SA . . . . . . . . . . . . . (2,967) (82,449) (195.3)Grifols SA . . . . . . . . . . . . . . (2,949) (52,004) (123.1)Naturgy Energy Group SA . . . (225) (7,124) (16.9)Siemens Gamesa Renewable
Energy SA . . . . . . . . . . . . (7,815) (169,100) (400.5)
(519,929)SwedenAtlas Copco AB, Class A . . . . (555) (32,848) (77.8)Embracer Group AB . . . . . . . (3,282) (32,929) (78.0)Epiroc AB, Class A . . . . . . . . (1,349) (28,786) (68.2)Fastighets AB Balder, Class B . (561) (37,166) (88.0)H & M Hennes & Mauritz AB,
Class B . . . . . . . . . . . . . . (1,876) (37,353) (88.5)Hexagon AB, Class B . . . . . . (5,681) (76,626) (181.5)Investment AB Latour, Class B (3,046) (94,773) (224.5)Lifco AB, Class B . . . . . . . . . (1,535) (35,981) (85.2)Nibe Industrier AB, Class B . . . (6,529) (62,055) (147.0)Sandvik AB . . . . . . . . . . . . . (1,002) (26,387) (62.5)
BNM0322U-2100207-6479109
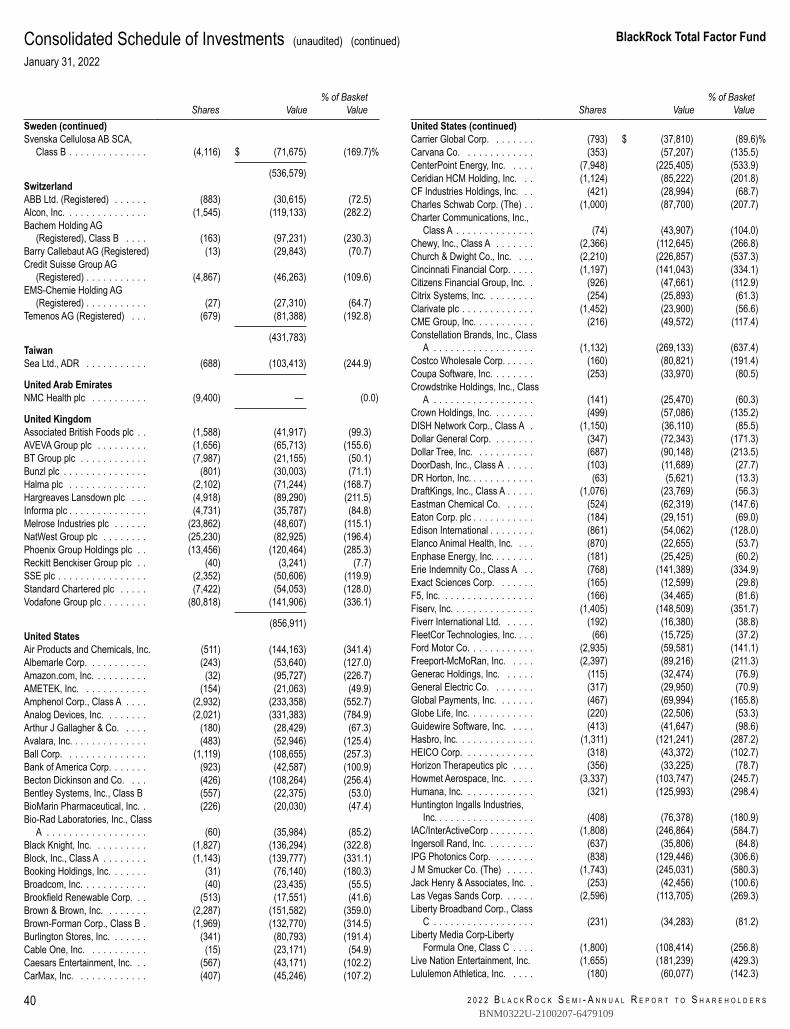
2 0 2 2 B L A C K R O C K S E M I - A N N U A L R E P O R T T O S H A R E H O L D E R S
BlackRock Total Factor Fund
40
Consolidated Schedule of Investments (unaudited) (continued)January 31, 2022
Shares Value% of Basket
ValueSweden (continued)Svenska Cellulosa AB SCA,
Class B . . . . . . . . . . . . . . (4,116) $ (71,675) (169.7)%
(536,579)SwitzerlandABB Ltd. (Registered) . . . . . . (883) (30,615) (72.5)Alcon, Inc. . . . . . . . . . . . . . . (1,545) (119,133) (282.2)Bachem Holding AG
(Registered), Class B . . . . (163) (97,231) (230.3)Barry Callebaut AG (Registered) (13) (29,843) (70.7)Credit Suisse Group AG
(Registered) . . . . . . . . . . . (4,867) (46,263) (109.6)EMS-Chemie Holding AG
(Registered) . . . . . . . . . . . (27) (27,310) (64.7)Temenos AG (Registered) . . . (679) (81,388) (192.8)
(431,783)TaiwanSea Ltd., ADR . . . . . . . . . . . (688) (103,413) (244.9)
United Arab EmiratesNMC Health plc . . . . . . . . . . (9,400) — (0.0)
United KingdomAssociated British Foods plc . . (1,588) (41,917) (99.3)AVEVA Group plc . . . . . . . . . (1,656) (65,713) (155.6)BT Group plc . . . . . . . . . . . . (7,987) (21,155) (50.1)Bunzl plc . . . . . . . . . . . . . . . (801) (30,003) (71.1)Halma plc . . . . . . . . . . . . . . (2,102) (71,244) (168.7)Hargreaves Lansdown plc . . . (4,918) (89,290) (211.5)Informa plc . . . . . . . . . . . . . . (4,731) (35,787) (84.8)Melrose Industries plc . . . . . . (23,862) (48,607) (115.1)NatWest Group plc . . . . . . . . (25,230) (82,925) (196.4)Phoenix Group Holdings plc . . (13,456) (120,464) (285.3)Reckitt Benckiser Group plc . . (40) (3,241) (7.7)SSE plc . . . . . . . . . . . . . . . . (2,352) (50,606) (119.9)Standard Chartered plc . . . . . (7,422) (54,053) (128.0)Vodafone Group plc . . . . . . . . (80,818) (141,906) (336.1)
(856,911)United StatesAir Products and Chemicals, Inc. (511) (144,163) (341.4)Albemarle Corp. . . . . . . . . . . (243) (53,640) (127.0)Amazon.com, Inc. . . . . . . . . . (32) (95,727) (226.7)AMETEK, Inc. . . . . . . . . . . . (154) (21,063) (49.9)Amphenol Corp., Class A . . . . (2,932) (233,358) (552.7)Analog Devices, Inc. . . . . . . . (2,021) (331,383) (784.9)Arthur J Gallagher & Co. . . . . (180) (28,429) (67.3)Avalara, Inc. . . . . . . . . . . . . . (483) (52,946) (125.4)Ball Corp. . . . . . . . . . . . . . . (1,119) (108,655) (257.3)Bank of America Corp. . . . . . . (923) (42,587) (100.9)Becton Dickinson and Co. . . . (426) (108,264) (256.4)Bentley Systems, Inc., Class B (557) (22,375) (53.0)BioMarin Pharmaceutical, Inc. . (226) (20,030) (47.4)Bio-Rad Laboratories, Inc., Class
A . . . . . . . . . . . . . . . . . . (60) (35,984) (85.2)Black Knight, Inc. . . . . . . . . . (1,827) (136,294) (322.8)Block, Inc., Class A . . . . . . . . (1,143) (139,777) (331.1)Booking Holdings, Inc. . . . . . . (31) (76,140) (180.3)Broadcom, Inc. . . . . . . . . . . . (40) (23,435) (55.5)Brookfield Renewable Corp. . . (513) (17,551) (41.6)Brown & Brown, Inc. . . . . . . . (2,287) (151,582) (359.0)Brown-Forman Corp., Class B . (1,969) (132,770) (314.5)Burlington Stores, Inc. . . . . . . (341) (80,793) (191.4)Cable One, Inc. . . . . . . . . . . (15) (23,171) (54.9)Caesars Entertainment, Inc. . . (567) (43,171) (102.2)CarMax, Inc. . . . . . . . . . . . . (407) (45,246) (107.2)
Shares Value% of Basket
ValueUnited States (continued)Carrier Global Corp. . . . . . . . (793) $ (37,810) (89.6)%Carvana Co. . . . . . . . . . . . . (353) (57,207) (135.5)CenterPoint Energy, Inc. . . . . (7,948) (225,405) (533.9)Ceridian HCM Holding, Inc. . . (1,124) (85,222) (201.8)CF Industries Holdings, Inc. . . (421) (28,994) (68.7)Charles Schwab Corp. (The) . . (1,000) (87,700) (207.7)Charter Communications, Inc.,
Class A . . . . . . . . . . . . . . (74) (43,907) (104.0)Chewy, Inc., Class A . . . . . . . (2,366) (112,645) (266.8)Church & Dwight Co., Inc. . . . (2,210) (226,857) (537.3)Cincinnati Financial Corp. . . . . (1,197) (141,043) (334.1)Citizens Financial Group, Inc. . (926) (47,661) (112.9)Citrix Systems, Inc. . . . . . . . . (254) (25,893) (61.3)Clarivate plc . . . . . . . . . . . . . (1,452) (23,900) (56.6)CME Group, Inc. . . . . . . . . . . (216) (49,572) (117.4)Constellation Brands, Inc., Class
A . . . . . . . . . . . . . . . . . . (1,132) (269,133) (637.4)Costco Wholesale Corp. . . . . . (160) (80,821) (191.4)Coupa Software, Inc. . . . . . . . (253) (33,970) (80.5)Crowdstrike Holdings, Inc., Class
A . . . . . . . . . . . . . . . . . . (141) (25,470) (60.3)Crown Holdings, Inc. . . . . . . . (499) (57,086) (135.2)DISH Network Corp., Class A . (1,150) (36,110) (85.5)Dollar General Corp. . . . . . . . (347) (72,343) (171.3)Dollar Tree, Inc. . . . . . . . . . . (687) (90,148) (213.5)DoorDash, Inc., Class A . . . . . (103) (11,689) (27.7)DR Horton, Inc. . . . . . . . . . . . (63) (5,621) (13.3)DraftKings, Inc., Class A . . . . . (1,076) (23,769) (56.3)Eastman Chemical Co. . . . . . (524) (62,319) (147.6)Eaton Corp. plc . . . . . . . . . . . (184) (29,151) (69.0)Edison International . . . . . . . . (861) (54,062) (128.0)Elanco Animal Health, Inc. . . . (870) (22,655) (53.7)Enphase Energy, Inc. . . . . . . . (181) (25,425) (60.2)Erie Indemnity Co., Class A . . (768) (141,389) (334.9)Exact Sciences Corp. . . . . . . (165) (12,599) (29.8)F5, Inc. . . . . . . . . . . . . . . . . (166) (34,465) (81.6)Fiserv, Inc. . . . . . . . . . . . . . . (1,405) (148,509) (351.7)Fiverr International Ltd. . . . . . (192) (16,380) (38.8)FleetCor Technologies, Inc. . . . (66) (15,725) (37.2)Ford Motor Co. . . . . . . . . . . . (2,935) (59,581) (141.1)Freeport-McMoRan, Inc. . . . . (2,397) (89,216) (211.3)Generac Holdings, Inc. . . . . . (115) (32,474) (76.9)General Electric Co. . . . . . . . (317) (29,950) (70.9)Global Payments, Inc. . . . . . . (467) (69,994) (165.8)Globe Life, Inc. . . . . . . . . . . . (220) (22,506) (53.3)Guidewire Software, Inc. . . . . (413) (41,647) (98.6)Hasbro, Inc. . . . . . . . . . . . . . (1,311) (121,241) (287.2)HEICO Corp. . . . . . . . . . . . . (318) (43,372) (102.7)Horizon Therapeutics plc . . . . (356) (33,225) (78.7)Howmet Aerospace, Inc. . . . . (3,337) (103,747) (245.7)Humana, Inc. . . . . . . . . . . . . (321) (125,993) (298.4)Huntington Ingalls Industries,
Inc. . . . . . . . . . . . . . . . . . (408) (76,378) (180.9)IAC/InterActiveCorp . . . . . . . . (1,808) (246,864) (584.7)Ingersoll Rand, Inc. . . . . . . . . (637) (35,806) (84.8)IPG Photonics Corp. . . . . . . . (838) (129,446) (306.6)J M Smucker Co. (The) . . . . . (1,743) (245,031) (580.3)Jack Henry & Associates, Inc. . (253) (42,456) (100.6)Las Vegas Sands Corp. . . . . . (2,596) (113,705) (269.3)Liberty Broadband Corp., Class
C . . . . . . . . . . . . . . . . . . (231) (34,283) (81.2)Liberty Media Corp-Liberty
Formula One, Class C . . . . (1,800) (108,414) (256.8)Live Nation Entertainment, Inc. (1,655) (181,239) (429.3)Lululemon Athletica, Inc. . . . . (180) (60,077) (142.3)
BNM0322U-2100207-6479109
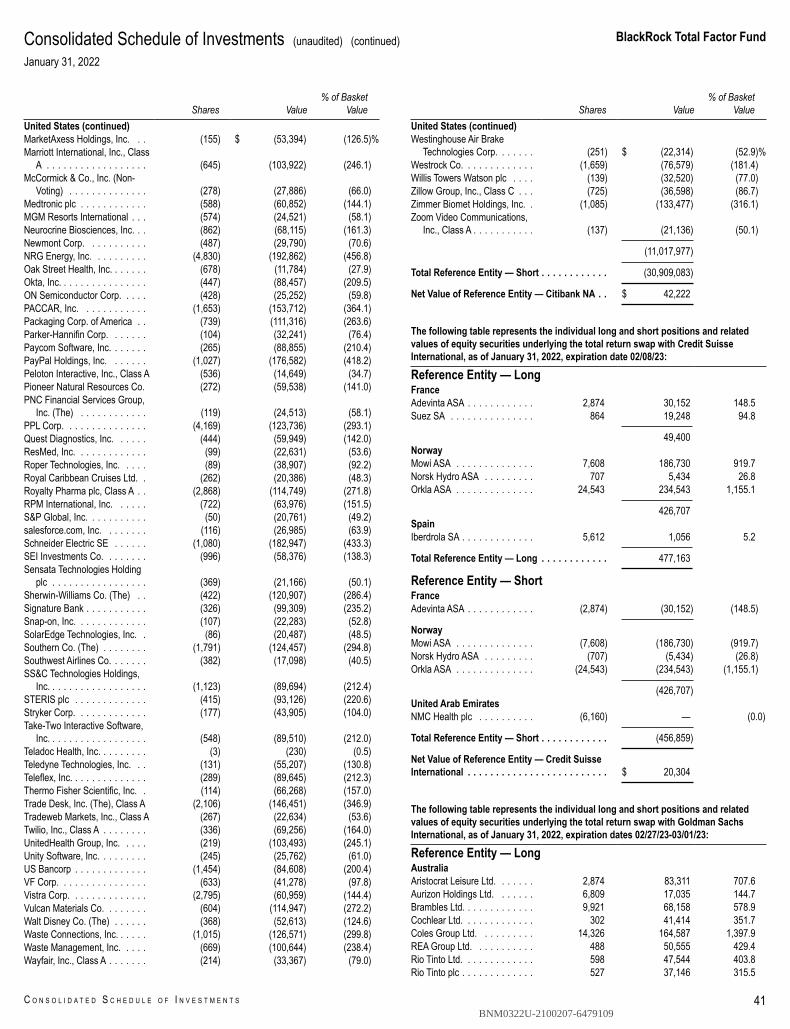
BlackRock Total Factor Fund
C O N S O L I D A T E D S C H E D U L E O F I N V E S T M E N T S 41
Consolidated Schedule of Investments (unaudited) (continued)January 31, 2022
Shares Value% of Basket
ValueUnited States (continued)MarketAxess Holdings, Inc. . . (155) $ (53,394) (126.5)%Marriott International, Inc., Class
A . . . . . . . . . . . . . . . . . . (645) (103,922) (246.1)McCormick & Co., Inc. (Non-
Voting) . . . . . . . . . . . . . . (278) (27,886) (66.0)Medtronic plc . . . . . . . . . . . . (588) (60,852) (144.1)MGM Resorts International . . . (574) (24,521) (58.1)Neurocrine Biosciences, Inc. . . (862) (68,115) (161.3)Newmont Corp. . . . . . . . . . . (487) (29,790) (70.6)NRG Energy, Inc. . . . . . . . . . (4,830) (192,862) (456.8)Oak Street Health, Inc. . . . . . . (678) (11,784) (27.9)Okta, Inc. . . . . . . . . . . . . . . . (447) (88,457) (209.5)ON Semiconductor Corp. . . . . (428) (25,252) (59.8)PACCAR, Inc. . . . . . . . . . . . (1,653) (153,712) (364.1)Packaging Corp. of America . . (739) (111,316) (263.6)Parker-Hannifin Corp. . . . . . . (104) (32,241) (76.4)Paycom Software, Inc. . . . . . . (265) (88,855) (210.4)PayPal Holdings, Inc. . . . . . . (1,027) (176,582) (418.2)Peloton Interactive, Inc., Class A (536) (14,649) (34.7)Pioneer Natural Resources Co. (272) (59,538) (141.0)PNC Financial Services Group,
Inc. (The) . . . . . . . . . . . . (119) (24,513) (58.1)PPL Corp. . . . . . . . . . . . . . . (4,169) (123,736) (293.1)Quest Diagnostics, Inc. . . . . . (444) (59,949) (142.0)ResMed, Inc. . . . . . . . . . . . . (99) (22,631) (53.6)Roper Technologies, Inc. . . . . (89) (38,907) (92.2)Royal Caribbean Cruises Ltd. . (262) (20,386) (48.3)Royalty Pharma plc, Class A . . (2,868) (114,749) (271.8)RPM International, Inc. . . . . . (722) (63,976) (151.5)S&P Global, Inc. . . . . . . . . . . (50) (20,761) (49.2)salesforce.com, Inc. . . . . . . . (116) (26,985) (63.9)Schneider Electric SE . . . . . . (1,080) (182,947) (433.3)SEI Investments Co. . . . . . . . (996) (58,376) (138.3)Sensata Technologies Holding
plc . . . . . . . . . . . . . . . . . (369) (21,166) (50.1)Sherwin-Williams Co. (The) . . (422) (120,907) (286.4)Signature Bank . . . . . . . . . . . (326) (99,309) (235.2)Snap-on, Inc. . . . . . . . . . . . . (107) (22,283) (52.8)SolarEdge Technologies, Inc. . (86) (20,487) (48.5)Southern Co. (The) . . . . . . . . (1,791) (124,457) (294.8)Southwest Airlines Co. . . . . . . (382) (17,098) (40.5)SS&C Technologies Holdings,
Inc. . . . . . . . . . . . . . . . . . (1,123) (89,694) (212.4)STERIS plc . . . . . . . . . . . . . (415) (93,126) (220.6)Stryker Corp. . . . . . . . . . . . . (177) (43,905) (104.0)Take-Two Interactive Software,
Inc. . . . . . . . . . . . . . . . . . (548) (89,510) (212.0)Teladoc Health, Inc. . . . . . . . . (3) (230) (0.5)Teledyne Technologies, Inc. . . (131) (55,207) (130.8)Teleflex, Inc. . . . . . . . . . . . . . (289) (89,645) (212.3)Thermo Fisher Scientific, Inc. . (114) (66,268) (157.0)Trade Desk, Inc. (The), Class A (2,106) (146,451) (346.9)Tradeweb Markets, Inc., Class A (267) (22,634) (53.6)Twilio, Inc., Class A . . . . . . . . (336) (69,256) (164.0)UnitedHealth Group, Inc. . . . . (219) (103,493) (245.1)Unity Software, Inc. . . . . . . . . (245) (25,762) (61.0)US Bancorp . . . . . . . . . . . . . (1,454) (84,608) (200.4)VF Corp. . . . . . . . . . . . . . . . (633) (41,278) (97.8)Vistra Corp. . . . . . . . . . . . . . (2,795) (60,959) (144.4)Vulcan Materials Co. . . . . . . . (604) (114,947) (272.2)Walt Disney Co. (The) . . . . . . (368) (52,613) (124.6)Waste Connections, Inc. . . . . . (1,015) (126,571) (299.8)Waste Management, Inc. . . . . (669) (100,644) (238.4)Wayfair, Inc., Class A . . . . . . . (214) (33,367) (79.0)
Shares Value% of Basket
ValueUnited States (continued)Westinghouse Air Brake
Technologies Corp. . . . . . . (251) $ (22,314) (52.9)%Westrock Co. . . . . . . . . . . . . (1,659) (76,579) (181.4)Willis Towers Watson plc . . . . (139) (32,520) (77.0)Zillow Group, Inc., Class C . . . (725) (36,598) (86.7)Zimmer Biomet Holdings, Inc. . (1,085) (133,477) (316.1)Zoom Video Communications,
Inc., Class A . . . . . . . . . . . (137) (21,136) (50.1)
(11,017,977)
Total Reference Entity — Short . . . . . . . . . . . . (30,909,083)
Net Value of Reference Entity — Citibank NA . . $ 42,222
The following table represents the individual long and short positions and relatedvalues of equity securities underlying the total return swap with Credit SuisseInternational, as of January 31, 2022, expiration date 02/08/23:
Reference Entity — LongFranceAdevinta ASA . . . . . . . . . . . . 2,874 30,152 148.5Suez SA . . . . . . . . . . . . . . . 864 19,248 94.8
49,400NorwayMowi ASA . . . . . . . . . . . . . . 7,608 186,730 919.7Norsk Hydro ASA . . . . . . . . . 707 5,434 26.8Orkla ASA . . . . . . . . . . . . . . 24,543 234,543 1,155.1
426,707SpainIberdrola SA . . . . . . . . . . . . . 5,612 1,056 5.2
Total Reference Entity — Long . . . . . . . . . . . . 477,163
Reference Entity — ShortFranceAdevinta ASA . . . . . . . . . . . . (2,874) (30,152) (148.5)
NorwayMowi ASA . . . . . . . . . . . . . . (7,608) (186,730) (919.7)Norsk Hydro ASA . . . . . . . . . (707) (5,434) (26.8)Orkla ASA . . . . . . . . . . . . . . (24,543) (234,543) (1,155.1)
(426,707)United Arab EmiratesNMC Health plc . . . . . . . . . . (6,160) — (0.0)
Total Reference Entity — Short . . . . . . . . . . . . (456,859)
Net Value of Reference Entity — Credit SuisseInternational . . . . . . . . . . . . . . . . . . . . . . . . . $ 20,304
The following table represents the individual long and short positions and relatedvalues of equity securities underlying the total return swap with Goldman SachsInternational, as of January 31, 2022, expiration dates 02/27/23-03/01/23:
Reference Entity — LongAustraliaAristocrat Leisure Ltd. . . . . . . 2,874 83,311 707.6Aurizon Holdings Ltd. . . . . . . 6,809 17,035 144.7Brambles Ltd. . . . . . . . . . . . . 9,921 68,158 578.9Cochlear Ltd. . . . . . . . . . . . . 302 41,414 351.7Coles Group Ltd. . . . . . . . . . 14,326 164,587 1,397.9REA Group Ltd. . . . . . . . . . . 488 50,555 429.4Rio Tinto Ltd. . . . . . . . . . . . . 598 47,544 403.8Rio Tinto plc . . . . . . . . . . . . . 527 37,146 315.5
BNM0322U-2100207-6479109
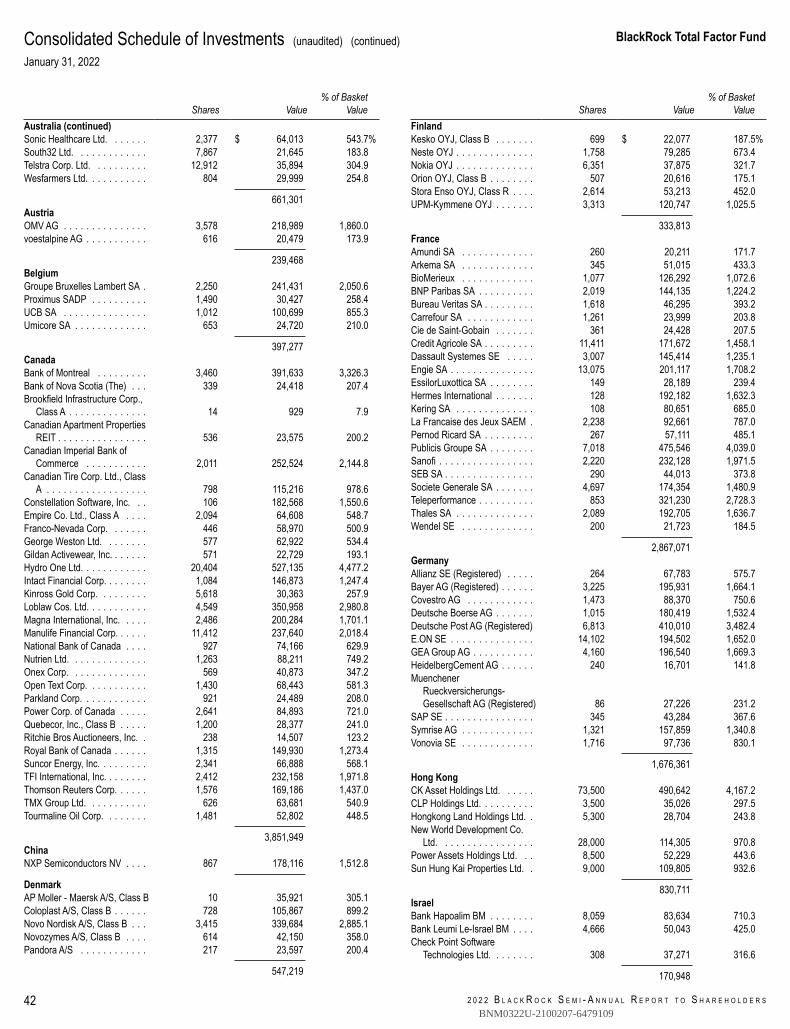
2 0 2 2 B L A C K R O C K S E M I - A N N U A L R E P O R T T O S H A R E H O L D E R S
BlackRock Total Factor Fund
42
Consolidated Schedule of Investments (unaudited) (continued)January 31, 2022
Shares Value% of Basket
ValueAustralia (continued)Sonic Healthcare Ltd. . . . . . . 2,377 $ 64,013 543.7%South32 Ltd. . . . . . . . . . . . . 7,867 21,645 183.8Telstra Corp. Ltd. . . . . . . . . . 12,912 35,894 304.9Wesfarmers Ltd. . . . . . . . . . . 804 29,999 254.8
661,301AustriaOMV AG . . . . . . . . . . . . . . . 3,578 218,989 1,860.0voestalpine AG . . . . . . . . . . . 616 20,479 173.9
239,468BelgiumGroupe Bruxelles Lambert SA . 2,250 241,431 2,050.6Proximus SADP . . . . . . . . . . 1,490 30,427 258.4UCB SA . . . . . . . . . . . . . . . 1,012 100,699 855.3Umicore SA . . . . . . . . . . . . . 653 24,720 210.0
397,277CanadaBank of Montreal . . . . . . . . . 3,460 391,633 3,326.3Bank of Nova Scotia (The) . . . 339 24,418 207.4Brookfield Infrastructure Corp.,
Class A . . . . . . . . . . . . . . 14 929 7.9Canadian Apartment Properties
REIT . . . . . . . . . . . . . . . . 536 23,575 200.2Canadian Imperial Bank of
Commerce . . . . . . . . . . . 2,011 252,524 2,144.8Canadian Tire Corp. Ltd., Class
A . . . . . . . . . . . . . . . . . . 798 115,216 978.6Constellation Software, Inc. . . 106 182,568 1,550.6Empire Co. Ltd., Class A . . . . 2,094 64,608 548.7Franco-Nevada Corp. . . . . . . 446 58,970 500.9George Weston Ltd. . . . . . . . 577 62,922 534.4Gildan Activewear, Inc. . . . . . . 571 22,729 193.1Hydro One Ltd. . . . . . . . . . . . 20,404 527,135 4,477.2Intact Financial Corp. . . . . . . . 1,084 146,873 1,247.4Kinross Gold Corp. . . . . . . . . 5,618 30,363 257.9Loblaw Cos. Ltd. . . . . . . . . . . 4,549 350,958 2,980.8Magna International, Inc. . . . . 2,486 200,284 1,701.1Manulife Financial Corp. . . . . . 11,412 237,640 2,018.4National Bank of Canada . . . . 927 74,166 629.9Nutrien Ltd. . . . . . . . . . . . . . 1,263 88,211 749.2Onex Corp. . . . . . . . . . . . . . 569 40,873 347.2Open Text Corp. . . . . . . . . . . 1,430 68,443 581.3Parkland Corp. . . . . . . . . . . . 921 24,489 208.0Power Corp. of Canada . . . . . 2,641 84,893 721.0Quebecor, Inc., Class B . . . . . 1,200 28,377 241.0Ritchie Bros Auctioneers, Inc. . 238 14,507 123.2Royal Bank of Canada . . . . . . 1,315 149,930 1,273.4Suncor Energy, Inc. . . . . . . . . 2,341 66,888 568.1TFI International, Inc. . . . . . . . 2,412 232,158 1,971.8Thomson Reuters Corp. . . . . . 1,576 169,186 1,437.0TMX Group Ltd. . . . . . . . . . . 626 63,681 540.9Tourmaline Oil Corp. . . . . . . . 1,481 52,802 448.5
3,851,949ChinaNXP Semiconductors NV . . . . 867 178,116 1,512.8
DenmarkAP Moller - Maersk A/S, Class B 10 35,921 305.1Coloplast A/S, Class B . . . . . . 728 105,867 899.2Novo Nordisk A/S, Class B . . . 3,415 339,684 2,885.1Novozymes A/S, Class B . . . . 614 42,150 358.0Pandora A/S . . . . . . . . . . . . 217 23,597 200.4
547,219
Shares Value% of Basket
ValueFinlandKesko OYJ, Class B . . . . . . . 699 $ 22,077 187.5%Neste OYJ . . . . . . . . . . . . . . 1,758 79,285 673.4Nokia OYJ . . . . . . . . . . . . . . 6,351 37,875 321.7Orion OYJ, Class B . . . . . . . . 507 20,616 175.1Stora Enso OYJ, Class R . . . . 2,614 53,213 452.0UPM-Kymmene OYJ . . . . . . . 3,313 120,747 1,025.5
333,813FranceAmundi SA . . . . . . . . . . . . . 260 20,211 171.7Arkema SA . . . . . . . . . . . . . 345 51,015 433.3BioMerieux . . . . . . . . . . . . . 1,077 126,292 1,072.6BNP Paribas SA . . . . . . . . . . 2,019 144,135 1,224.2Bureau Veritas SA . . . . . . . . . 1,618 46,295 393.2Carrefour SA . . . . . . . . . . . . 1,261 23,999 203.8Cie de Saint-Gobain . . . . . . . 361 24,428 207.5Credit Agricole SA . . . . . . . . . 11,411 171,672 1,458.1Dassault Systemes SE . . . . . 3,007 145,414 1,235.1Engie SA . . . . . . . . . . . . . . . 13,075 201,117 1,708.2EssilorLuxottica SA . . . . . . . . 149 28,189 239.4Hermes International . . . . . . . 128 192,182 1,632.3Kering SA . . . . . . . . . . . . . . 108 80,651 685.0La Francaise des Jeux SAEM . 2,238 92,661 787.0Pernod Ricard SA . . . . . . . . . 267 57,111 485.1Publicis Groupe SA . . . . . . . . 7,018 475,546 4,039.0Sanofi . . . . . . . . . . . . . . . . . 2,220 232,128 1,971.5SEB SA . . . . . . . . . . . . . . . . 290 44,013 373.8Societe Generale SA . . . . . . . 4,697 174,354 1,480.9Teleperformance . . . . . . . . . . 853 321,230 2,728.3Thales SA . . . . . . . . . . . . . . 2,089 192,705 1,636.7Wendel SE . . . . . . . . . . . . . 200 21,723 184.5
2,867,071GermanyAllianz SE (Registered) . . . . . 264 67,783 575.7Bayer AG (Registered) . . . . . . 3,225 195,931 1,664.1Covestro AG . . . . . . . . . . . . 1,473 88,370 750.6Deutsche Boerse AG . . . . . . . 1,015 180,419 1,532.4Deutsche Post AG (Registered) 6,813 410,010 3,482.4E.ON SE . . . . . . . . . . . . . . . 14,102 194,502 1,652.0GEA Group AG . . . . . . . . . . . 4,160 196,540 1,669.3HeidelbergCement AG . . . . . . 240 16,701 141.8Muenchener
Rueckversicherungs-Gesellschaft AG (Registered) 86 27,226 231.2
SAP SE . . . . . . . . . . . . . . . . 345 43,284 367.6Symrise AG . . . . . . . . . . . . . 1,321 157,859 1,340.8Vonovia SE . . . . . . . . . . . . . 1,716 97,736 830.1
1,676,361Hong KongCK Asset Holdings Ltd. . . . . . 73,500 490,642 4,167.2CLP Holdings Ltd. . . . . . . . . . 3,500 35,026 297.5Hongkong Land Holdings Ltd. . 5,300 28,704 243.8New World Development Co.
Ltd. . . . . . . . . . . . . . . . . 28,000 114,305 970.8Power Assets Holdings Ltd. . . 8,500 52,229 443.6Sun Hung Kai Properties Ltd. . 9,000 109,805 932.6
830,711IsraelBank Hapoalim BM . . . . . . . . 8,059 83,634 710.3Bank Leumi Le-Israel BM . . . . 4,666 50,043 425.0Check Point Software
Technologies Ltd. . . . . . . . 308 37,271 316.6
170,948
BNM0322U-2100207-6479109
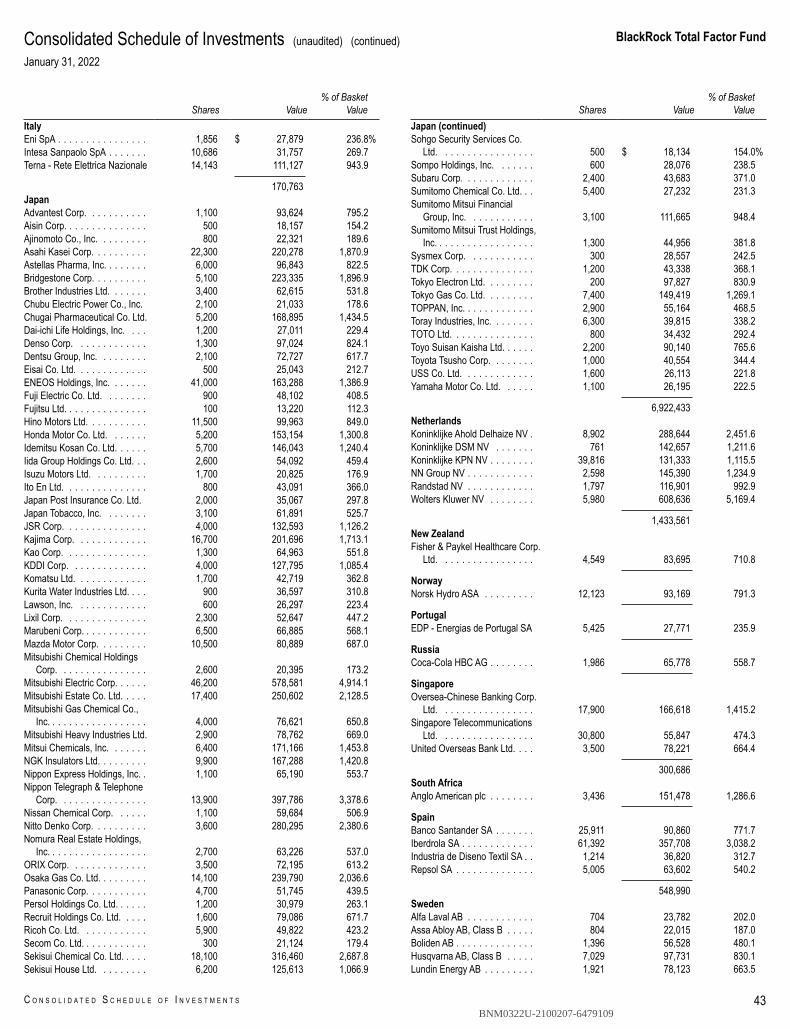
BlackRock Total Factor Fund
C O N S O L I D A T E D S C H E D U L E O F I N V E S T M E N T S 43
Consolidated Schedule of Investments (unaudited) (continued)January 31, 2022
Shares Value% of Basket
ValueItalyEni SpA . . . . . . . . . . . . . . . . 1,856 $ 27,879 236.8%Intesa Sanpaolo SpA . . . . . . . 10,686 31,757 269.7Terna - Rete Elettrica Nazionale 14,143 111,127 943.9
170,763JapanAdvantest Corp. . . . . . . . . . . 1,100 93,624 795.2Aisin Corp. . . . . . . . . . . . . . . 500 18,157 154.2Ajinomoto Co., Inc. . . . . . . . . 800 22,321 189.6Asahi Kasei Corp. . . . . . . . . . 22,300 220,278 1,870.9Astellas Pharma, Inc. . . . . . . . 6,000 96,843 822.5Bridgestone Corp. . . . . . . . . . 5,100 223,335 1,896.9Brother Industries Ltd. . . . . . . 3,400 62,615 531.8Chubu Electric Power Co., Inc. 2,100 21,033 178.6Chugai Pharmaceutical Co. Ltd. 5,200 168,895 1,434.5Dai-ichi Life Holdings, Inc. . . . 1,200 27,011 229.4Denso Corp. . . . . . . . . . . . . 1,300 97,024 824.1Dentsu Group, Inc. . . . . . . . . 2,100 72,727 617.7Eisai Co. Ltd. . . . . . . . . . . . . 500 25,043 212.7ENEOS Holdings, Inc. . . . . . . 41,000 163,288 1,386.9Fuji Electric Co. Ltd. . . . . . . . 900 48,102 408.5Fujitsu Ltd. . . . . . . . . . . . . . . 100 13,220 112.3Hino Motors Ltd. . . . . . . . . . . 11,500 99,963 849.0Honda Motor Co. Ltd. . . . . . . 5,200 153,154 1,300.8Idemitsu Kosan Co. Ltd. . . . . . 5,700 146,043 1,240.4Iida Group Holdings Co. Ltd. . . 2,600 54,092 459.4Isuzu Motors Ltd. . . . . . . . . . 1,700 20,825 176.9Ito En Ltd. . . . . . . . . . . . . . . 800 43,091 366.0Japan Post Insurance Co. Ltd. 2,000 35,067 297.8Japan Tobacco, Inc. . . . . . . . 3,100 61,891 525.7JSR Corp. . . . . . . . . . . . . . . 4,000 132,593 1,126.2Kajima Corp. . . . . . . . . . . . . 16,700 201,696 1,713.1Kao Corp. . . . . . . . . . . . . . . 1,300 64,963 551.8KDDI Corp. . . . . . . . . . . . . . 4,000 127,795 1,085.4Komatsu Ltd. . . . . . . . . . . . . 1,700 42,719 362.8Kurita Water Industries Ltd. . . . 900 36,597 310.8Lawson, Inc. . . . . . . . . . . . . 600 26,297 223.4Lixil Corp. . . . . . . . . . . . . . . 2,300 52,647 447.2Marubeni Corp. . . . . . . . . . . . 6,500 66,885 568.1Mazda Motor Corp. . . . . . . . . 10,500 80,889 687.0Mitsubishi Chemical Holdings
Corp. . . . . . . . . . . . . . . . 2,600 20,395 173.2Mitsubishi Electric Corp. . . . . . 46,200 578,581 4,914.1Mitsubishi Estate Co. Ltd. . . . . 17,400 250,602 2,128.5Mitsubishi Gas Chemical Co.,
Inc. . . . . . . . . . . . . . . . . . 4,000 76,621 650.8Mitsubishi Heavy Industries Ltd. 2,900 78,762 669.0Mitsui Chemicals, Inc. . . . . . . 6,400 171,166 1,453.8NGK Insulators Ltd. . . . . . . . . 9,900 167,288 1,420.8Nippon Express Holdings, Inc. . 1,100 65,190 553.7Nippon Telegraph & Telephone
Corp. . . . . . . . . . . . . . . . 13,900 397,786 3,378.6Nissan Chemical Corp. . . . . . 1,100 59,684 506.9Nitto Denko Corp. . . . . . . . . . 3,600 280,295 2,380.6Nomura Real Estate Holdings,
Inc. . . . . . . . . . . . . . . . . . 2,700 63,226 537.0ORIX Corp. . . . . . . . . . . . . . 3,500 72,195 613.2Osaka Gas Co. Ltd. . . . . . . . . 14,100 239,790 2,036.6Panasonic Corp. . . . . . . . . . . 4,700 51,745 439.5Persol Holdings Co. Ltd. . . . . . 1,200 30,979 263.1Recruit Holdings Co. Ltd. . . . . 1,600 79,086 671.7Ricoh Co. Ltd. . . . . . . . . . . . 5,900 49,822 423.2Secom Co. Ltd. . . . . . . . . . . . 300 21,124 179.4Sekisui Chemical Co. Ltd. . . . . 18,100 316,460 2,687.8Sekisui House Ltd. . . . . . . . . 6,200 125,613 1,066.9
Shares Value% of Basket
ValueJapan (continued)Sohgo Security Services Co.
Ltd. . . . . . . . . . . . . . . . . 500 $ 18,134 154.0%Sompo Holdings, Inc. . . . . . . 600 28,076 238.5Subaru Corp. . . . . . . . . . . . . 2,400 43,683 371.0Sumitomo Chemical Co. Ltd. . . 5,400 27,232 231.3Sumitomo Mitsui Financial
Group, Inc. . . . . . . . . . . . 3,100 111,665 948.4Sumitomo Mitsui Trust Holdings,
Inc. . . . . . . . . . . . . . . . . . 1,300 44,956 381.8Sysmex Corp. . . . . . . . . . . . 300 28,557 242.5TDK Corp. . . . . . . . . . . . . . . 1,200 43,338 368.1Tokyo Electron Ltd. . . . . . . . . 200 97,827 830.9Tokyo Gas Co. Ltd. . . . . . . . . 7,400 149,419 1,269.1TOPPAN, Inc. . . . . . . . . . . . . 2,900 55,164 468.5Toray Industries, Inc. . . . . . . . 6,300 39,815 338.2TOTO Ltd. . . . . . . . . . . . . . . 800 34,432 292.4Toyo Suisan Kaisha Ltd. . . . . . 2,200 90,140 765.6Toyota Tsusho Corp. . . . . . . . 1,000 40,554 344.4USS Co. Ltd. . . . . . . . . . . . . 1,600 26,113 221.8Yamaha Motor Co. Ltd. . . . . . 1,100 26,195 222.5
6,922,433NetherlandsKoninklijke Ahold Delhaize NV . 8,902 288,644 2,451.6Koninklijke DSM NV . . . . . . . 761 142,657 1,211.6Koninklijke KPN NV . . . . . . . . 39,816 131,333 1,115.5NN Group NV . . . . . . . . . . . . 2,598 145,390 1,234.9Randstad NV . . . . . . . . . . . . 1,797 116,901 992.9Wolters Kluwer NV . . . . . . . . 5,980 608,636 5,169.4
1,433,561New ZealandFisher & Paykel Healthcare Corp.
Ltd. . . . . . . . . . . . . . . . . 4,549 83,695 710.8
NorwayNorsk Hydro ASA . . . . . . . . . 12,123 93,169 791.3
PortugalEDP - Energias de Portugal SA 5,425 27,771 235.9
RussiaCoca-Cola HBC AG . . . . . . . . 1,986 65,778 558.7
SingaporeOversea-Chinese Banking Corp.
Ltd. . . . . . . . . . . . . . . . . 17,900 166,618 1,415.2Singapore Telecommunications
Ltd. . . . . . . . . . . . . . . . . 30,800 55,847 474.3United Overseas Bank Ltd. . . . 3,500 78,221 664.4
300,686South AfricaAnglo American plc . . . . . . . . 3,436 151,478 1,286.6
SpainBanco Santander SA . . . . . . . 25,911 90,860 771.7Iberdrola SA . . . . . . . . . . . . . 61,392 357,708 3,038.2Industria de Diseno Textil SA . . 1,214 36,820 312.7Repsol SA . . . . . . . . . . . . . . 5,005 63,602 540.2
548,990SwedenAlfa Laval AB . . . . . . . . . . . . 704 23,782 202.0Assa Abloy AB, Class B . . . . . 804 22,015 187.0Boliden AB . . . . . . . . . . . . . . 1,396 56,528 480.1Husqvarna AB, Class B . . . . . 7,029 97,731 830.1Lundin Energy AB . . . . . . . . . 1,921 78,123 663.5
BNM0322U-2100207-6479109
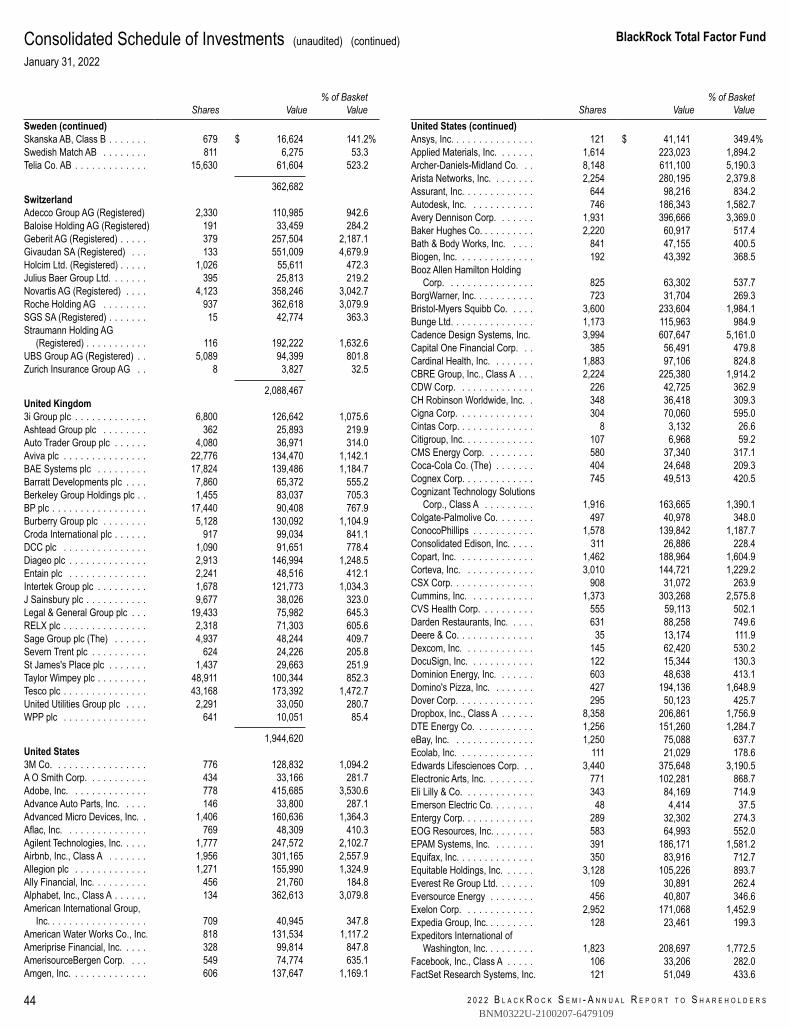
2 0 2 2 B L A C K R O C K S E M I - A N N U A L R E P O R T T O S H A R E H O L D E R S
BlackRock Total Factor Fund
44
Consolidated Schedule of Investments (unaudited) (continued)January 31, 2022
Shares Value% of Basket
ValueSweden (continued)Skanska AB, Class B . . . . . . . 679 $ 16,624 141.2%Swedish Match AB . . . . . . . . 811 6,275 53.3Telia Co. AB . . . . . . . . . . . . . 15,630 61,604 523.2
362,682SwitzerlandAdecco Group AG (Registered) 2,330 110,985 942.6Baloise Holding AG (Registered) 191 33,459 284.2Geberit AG (Registered) . . . . . 379 257,504 2,187.1Givaudan SA (Registered) . . . 133 551,009 4,679.9Holcim Ltd. (Registered) . . . . . 1,026 55,611 472.3Julius Baer Group Ltd. . . . . . . 395 25,813 219.2Novartis AG (Registered) . . . . 4,123 358,246 3,042.7Roche Holding AG . . . . . . . . 937 362,618 3,079.9SGS SA (Registered) . . . . . . . 15 42,774 363.3Straumann Holding AG
(Registered) . . . . . . . . . . . 116 192,222 1,632.6UBS Group AG (Registered) . . 5,089 94,399 801.8Zurich Insurance Group AG . . 8 3,827 32.5
2,088,467United Kingdom3i Group plc . . . . . . . . . . . . . 6,800 126,642 1,075.6Ashtead Group plc . . . . . . . . 362 25,893 219.9Auto Trader Group plc . . . . . . 4,080 36,971 314.0Aviva plc . . . . . . . . . . . . . . . 22,776 134,470 1,142.1BAE Systems plc . . . . . . . . . 17,824 139,486 1,184.7Barratt Developments plc . . . . 7,860 65,372 555.2Berkeley Group Holdings plc . . 1,455 83,037 705.3BP plc . . . . . . . . . . . . . . . . . 17,440 90,408 767.9Burberry Group plc . . . . . . . . 5,128 130,092 1,104.9Croda International plc . . . . . . 917 99,034 841.1DCC plc . . . . . . . . . . . . . . . 1,090 91,651 778.4Diageo plc . . . . . . . . . . . . . . 2,913 146,994 1,248.5Entain plc . . . . . . . . . . . . . . 2,241 48,516 412.1Intertek Group plc . . . . . . . . . 1,678 121,773 1,034.3J Sainsbury plc . . . . . . . . . . . 9,677 38,026 323.0Legal & General Group plc . . . 19,433 75,982 645.3RELX plc . . . . . . . . . . . . . . . 2,318 71,303 605.6Sage Group plc (The) . . . . . . 4,937 48,244 409.7Severn Trent plc . . . . . . . . . . 624 24,226 205.8St James's Place plc . . . . . . . 1,437 29,663 251.9Taylor Wimpey plc . . . . . . . . . 48,911 100,344 852.3Tesco plc . . . . . . . . . . . . . . . 43,168 173,392 1,472.7United Utilities Group plc . . . . 2,291 33,050 280.7WPP plc . . . . . . . . . . . . . . . 641 10,051 85.4
1,944,620United States3M Co. . . . . . . . . . . . . . . . . 776 128,832 1,094.2A O Smith Corp. . . . . . . . . . . 434 33,166 281.7Adobe, Inc. . . . . . . . . . . . . . 778 415,685 3,530.6Advance Auto Parts, Inc. . . . . 146 33,800 287.1Advanced Micro Devices, Inc. . 1,406 160,636 1,364.3Aflac, Inc. . . . . . . . . . . . . . . 769 48,309 410.3Agilent Technologies, Inc. . . . . 1,777 247,572 2,102.7Airbnb, Inc., Class A . . . . . . . 1,956 301,165 2,557.9Allegion plc . . . . . . . . . . . . . 1,271 155,990 1,324.9Ally Financial, Inc. . . . . . . . . . 456 21,760 184.8Alphabet, Inc., Class A . . . . . . 134 362,613 3,079.8American International Group,
Inc. . . . . . . . . . . . . . . . . . 709 40,945 347.8American Water Works Co., Inc. 818 131,534 1,117.2Ameriprise Financial, Inc. . . . . 328 99,814 847.8AmerisourceBergen Corp. . . . 549 74,774 635.1Amgen, Inc. . . . . . . . . . . . . . 606 137,647 1,169.1
Shares Value% of Basket
ValueUnited States (continued)Ansys, Inc. . . . . . . . . . . . . . . 121 $ 41,141 349.4%Applied Materials, Inc. . . . . . . 1,614 223,023 1,894.2Archer-Daniels-Midland Co. . . 8,148 611,100 5,190.3Arista Networks, Inc. . . . . . . . 2,254 280,195 2,379.8Assurant, Inc. . . . . . . . . . . . . 644 98,216 834.2Autodesk, Inc. . . . . . . . . . . . 746 186,343 1,582.7Avery Dennison Corp. . . . . . . 1,931 396,666 3,369.0Baker Hughes Co. . . . . . . . . . 2,220 60,917 517.4Bath & Body Works, Inc. . . . . 841 47,155 400.5Biogen, Inc. . . . . . . . . . . . . . 192 43,392 368.5Booz Allen Hamilton Holding
Corp. . . . . . . . . . . . . . . . 825 63,302 537.7BorgWarner, Inc. . . . . . . . . . . 723 31,704 269.3Bristol-Myers Squibb Co. . . . . 3,600 233,604 1,984.1Bunge Ltd. . . . . . . . . . . . . . . 1,173 115,963 984.9Cadence Design Systems, Inc. 3,994 607,647 5,161.0Capital One Financial Corp. . . 385 56,491 479.8Cardinal Health, Inc. . . . . . . . 1,883 97,106 824.8CBRE Group, Inc., Class A . . . 2,224 225,380 1,914.2CDW Corp. . . . . . . . . . . . . . 226 42,725 362.9CH Robinson Worldwide, Inc. . 348 36,418 309.3Cigna Corp. . . . . . . . . . . . . . 304 70,060 595.0Cintas Corp. . . . . . . . . . . . . . 8 3,132 26.6Citigroup, Inc. . . . . . . . . . . . . 107 6,968 59.2CMS Energy Corp. . . . . . . . . 580 37,340 317.1Coca-Cola Co. (The) . . . . . . . 404 24,648 209.3Cognex Corp. . . . . . . . . . . . . 745 49,513 420.5Cognizant Technology Solutions
Corp., Class A . . . . . . . . . 1,916 163,665 1,390.1Colgate-Palmolive Co. . . . . . . 497 40,978 348.0ConocoPhillips . . . . . . . . . . . 1,578 139,842 1,187.7Consolidated Edison, Inc. . . . . 311 26,886 228.4Copart, Inc. . . . . . . . . . . . . . 1,462 188,964 1,604.9Corteva, Inc. . . . . . . . . . . . . 3,010 144,721 1,229.2CSX Corp. . . . . . . . . . . . . . . 908 31,072 263.9Cummins, Inc. . . . . . . . . . . . 1,373 303,268 2,575.8CVS Health Corp. . . . . . . . . . 555 59,113 502.1Darden Restaurants, Inc. . . . . 631 88,258 749.6Deere & Co. . . . . . . . . . . . . . 35 13,174 111.9Dexcom, Inc. . . . . . . . . . . . . 145 62,420 530.2DocuSign, Inc. . . . . . . . . . . . 122 15,344 130.3Dominion Energy, Inc. . . . . . . 603 48,638 413.1Domino's Pizza, Inc. . . . . . . . 427 194,136 1,648.9Dover Corp. . . . . . . . . . . . . . 295 50,123 425.7Dropbox, Inc., Class A . . . . . . 8,358 206,861 1,756.9DTE Energy Co. . . . . . . . . . . 1,256 151,260 1,284.7eBay, Inc. . . . . . . . . . . . . . . 1,250 75,088 637.7Ecolab, Inc. . . . . . . . . . . . . . 111 21,029 178.6Edwards Lifesciences Corp. . . 3,440 375,648 3,190.5Electronic Arts, Inc. . . . . . . . . 771 102,281 868.7Eli Lilly & Co. . . . . . . . . . . . . 343 84,169 714.9Emerson Electric Co. . . . . . . . 48 4,414 37.5Entergy Corp. . . . . . . . . . . . . 289 32,302 274.3EOG Resources, Inc. . . . . . . . 583 64,993 552.0EPAM Systems, Inc. . . . . . . . 391 186,171 1,581.2Equifax, Inc. . . . . . . . . . . . . . 350 83,916 712.7Equitable Holdings, Inc. . . . . . 3,128 105,226 893.7Everest Re Group Ltd. . . . . . . 109 30,891 262.4Eversource Energy . . . . . . . . 456 40,807 346.6Exelon Corp. . . . . . . . . . . . . 2,952 171,068 1,452.9Expedia Group, Inc. . . . . . . . . 128 23,461 199.3Expeditors International of
Washington, Inc. . . . . . . . . 1,823 208,697 1,772.5Facebook, Inc., Class A . . . . . 106 33,206 282.0FactSet Research Systems, Inc. 121 51,049 433.6
BNM0322U-2100207-6479109
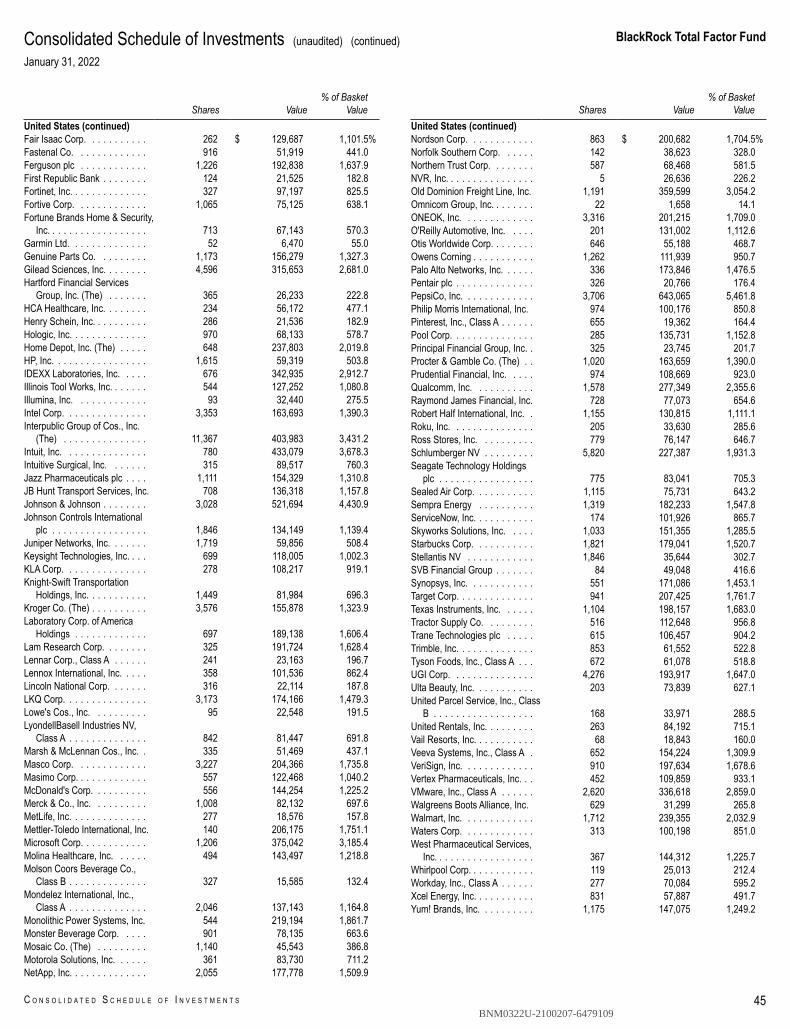
BlackRock Total Factor Fund
C O N S O L I D A T E D S C H E D U L E O F I N V E S T M E N T S 45
Consolidated Schedule of Investments (unaudited) (continued)January 31, 2022
Shares Value% of Basket
ValueUnited States (continued)Fair Isaac Corp. . . . . . . . . . . 262 $ 129,687 1,101.5%Fastenal Co. . . . . . . . . . . . . 916 51,919 441.0Ferguson plc . . . . . . . . . . . . 1,226 192,838 1,637.9First Republic Bank . . . . . . . . 124 21,525 182.8Fortinet, Inc. . . . . . . . . . . . . . 327 97,197 825.5Fortive Corp. . . . . . . . . . . . . 1,065 75,125 638.1Fortune Brands Home & Security,
Inc. . . . . . . . . . . . . . . . . . 713 67,143 570.3Garmin Ltd. . . . . . . . . . . . . . 52 6,470 55.0Genuine Parts Co. . . . . . . . . 1,173 156,279 1,327.3Gilead Sciences, Inc. . . . . . . . 4,596 315,653 2,681.0Hartford Financial Services
Group, Inc. (The) . . . . . . . 365 26,233 222.8HCA Healthcare, Inc. . . . . . . . 234 56,172 477.1Henry Schein, Inc. . . . . . . . . . 286 21,536 182.9Hologic, Inc. . . . . . . . . . . . . . 970 68,133 578.7Home Depot, Inc. (The) . . . . . 648 237,803 2,019.8HP, Inc. . . . . . . . . . . . . . . . . 1,615 59,319 503.8IDEXX Laboratories, Inc. . . . . 676 342,935 2,912.7Illinois Tool Works, Inc. . . . . . . 544 127,252 1,080.8Illumina, Inc. . . . . . . . . . . . . 93 32,440 275.5Intel Corp. . . . . . . . . . . . . . . 3,353 163,693 1,390.3Interpublic Group of Cos., Inc.
(The) . . . . . . . . . . . . . . . 11,367 403,983 3,431.2Intuit, Inc. . . . . . . . . . . . . . . 780 433,079 3,678.3Intuitive Surgical, Inc. . . . . . . 315 89,517 760.3Jazz Pharmaceuticals plc . . . . 1,111 154,329 1,310.8JB Hunt Transport Services, Inc. 708 136,318 1,157.8Johnson & Johnson . . . . . . . . 3,028 521,694 4,430.9Johnson Controls International
plc . . . . . . . . . . . . . . . . . 1,846 134,149 1,139.4Juniper Networks, Inc. . . . . . . 1,719 59,856 508.4Keysight Technologies, Inc. . . . 699 118,005 1,002.3KLA Corp. . . . . . . . . . . . . . . 278 108,217 919.1Knight-Swift Transportation
Holdings, Inc. . . . . . . . . . . 1,449 81,984 696.3Kroger Co. (The) . . . . . . . . . . 3,576 155,878 1,323.9Laboratory Corp. of America
Holdings . . . . . . . . . . . . . 697 189,138 1,606.4Lam Research Corp. . . . . . . . 325 191,724 1,628.4Lennar Corp., Class A . . . . . . 241 23,163 196.7Lennox International, Inc. . . . . 358 101,536 862.4Lincoln National Corp. . . . . . . 316 22,114 187.8LKQ Corp. . . . . . . . . . . . . . . 3,173 174,166 1,479.3Lowe's Cos., Inc. . . . . . . . . . 95 22,548 191.5LyondellBasell Industries NV,
Class A . . . . . . . . . . . . . . 842 81,447 691.8Marsh & McLennan Cos., Inc. . 335 51,469 437.1Masco Corp. . . . . . . . . . . . . 3,227 204,366 1,735.8Masimo Corp. . . . . . . . . . . . . 557 122,468 1,040.2McDonald's Corp. . . . . . . . . . 556 144,254 1,225.2Merck & Co., Inc. . . . . . . . . . 1,008 82,132 697.6MetLife, Inc. . . . . . . . . . . . . . 277 18,576 157.8Mettler-Toledo International, Inc. 140 206,175 1,751.1Microsoft Corp. . . . . . . . . . . . 1,206 375,042 3,185.4Molina Healthcare, Inc. . . . . . 494 143,497 1,218.8Molson Coors Beverage Co.,
Class B . . . . . . . . . . . . . . 327 15,585 132.4Mondelez International, Inc.,
Class A . . . . . . . . . . . . . . 2,046 137,143 1,164.8Monolithic Power Systems, Inc. 544 219,194 1,861.7Monster Beverage Corp. . . . . 901 78,135 663.6Mosaic Co. (The) . . . . . . . . . 1,140 45,543 386.8Motorola Solutions, Inc. . . . . . 361 83,730 711.2NetApp, Inc. . . . . . . . . . . . . . 2,055 177,778 1,509.9
Shares Value% of Basket
ValueUnited States (continued)Nordson Corp. . . . . . . . . . . . 863 $ 200,682 1,704.5%Norfolk Southern Corp. . . . . . 142 38,623 328.0Northern Trust Corp. . . . . . . . 587 68,468 581.5NVR, Inc. . . . . . . . . . . . . . . . 5 26,636 226.2Old Dominion Freight Line, Inc. 1,191 359,599 3,054.2Omnicom Group, Inc. . . . . . . . 22 1,658 14.1ONEOK, Inc. . . . . . . . . . . . . 3,316 201,215 1,709.0O'Reilly Automotive, Inc. . . . . 201 131,002 1,112.6Otis Worldwide Corp. . . . . . . . 646 55,188 468.7Owens Corning . . . . . . . . . . . 1,262 111,939 950.7Palo Alto Networks, Inc. . . . . . 336 173,846 1,476.5Pentair plc . . . . . . . . . . . . . . 326 20,766 176.4PepsiCo, Inc. . . . . . . . . . . . . 3,706 643,065 5,461.8Philip Morris International, Inc. 974 100,176 850.8Pinterest, Inc., Class A . . . . . . 655 19,362 164.4Pool Corp. . . . . . . . . . . . . . . 285 135,731 1,152.8Principal Financial Group, Inc. . 325 23,745 201.7Procter & Gamble Co. (The) . . 1,020 163,659 1,390.0Prudential Financial, Inc. . . . . 974 108,669 923.0Qualcomm, Inc. . . . . . . . . . . 1,578 277,349 2,355.6Raymond James Financial, Inc. 728 77,073 654.6Robert Half International, Inc. . 1,155 130,815 1,111.1Roku, Inc. . . . . . . . . . . . . . . 205 33,630 285.6Ross Stores, Inc. . . . . . . . . . 779 76,147 646.7Schlumberger NV . . . . . . . . . 5,820 227,387 1,931.3Seagate Technology Holdings
plc . . . . . . . . . . . . . . . . . 775 83,041 705.3Sealed Air Corp. . . . . . . . . . . 1,115 75,731 643.2Sempra Energy . . . . . . . . . . 1,319 182,233 1,547.8ServiceNow, Inc. . . . . . . . . . . 174 101,926 865.7Skyworks Solutions, Inc. . . . . 1,033 151,355 1,285.5Starbucks Corp. . . . . . . . . . . 1,821 179,041 1,520.7Stellantis NV . . . . . . . . . . . . 1,846 35,644 302.7SVB Financial Group . . . . . . . 84 49,048 416.6Synopsys, Inc. . . . . . . . . . . . 551 171,086 1,453.1Target Corp. . . . . . . . . . . . . . 941 207,425 1,761.7Texas Instruments, Inc. . . . . . 1,104 198,157 1,683.0Tractor Supply Co. . . . . . . . . 516 112,648 956.8Trane Technologies plc . . . . . 615 106,457 904.2Trimble, Inc. . . . . . . . . . . . . . 853 61,552 522.8Tyson Foods, Inc., Class A . . . 672 61,078 518.8UGI Corp. . . . . . . . . . . . . . . 4,276 193,917 1,647.0Ulta Beauty, Inc. . . . . . . . . . . 203 73,839 627.1United Parcel Service, Inc., Class
B . . . . . . . . . . . . . . . . . . 168 33,971 288.5United Rentals, Inc. . . . . . . . . 263 84,192 715.1Vail Resorts, Inc. . . . . . . . . . . 68 18,843 160.0Veeva Systems, Inc., Class A . 652 154,224 1,309.9VeriSign, Inc. . . . . . . . . . . . . 910 197,634 1,678.6Vertex Pharmaceuticals, Inc. . . 452 109,859 933.1VMware, Inc., Class A . . . . . . 2,620 336,618 2,859.0Walgreens Boots Alliance, Inc. 629 31,299 265.8Walmart, Inc. . . . . . . . . . . . . 1,712 239,355 2,032.9Waters Corp. . . . . . . . . . . . . 313 100,198 851.0West Pharmaceutical Services,
Inc. . . . . . . . . . . . . . . . . . 367 144,312 1,225.7Whirlpool Corp. . . . . . . . . . . . 119 25,013 212.4Workday, Inc., Class A . . . . . . 277 70,084 595.2Xcel Energy, Inc. . . . . . . . . . . 831 57,887 491.7Yum! Brands, Inc. . . . . . . . . . 1,175 147,075 1,249.2
BNM0322U-2100207-6479109
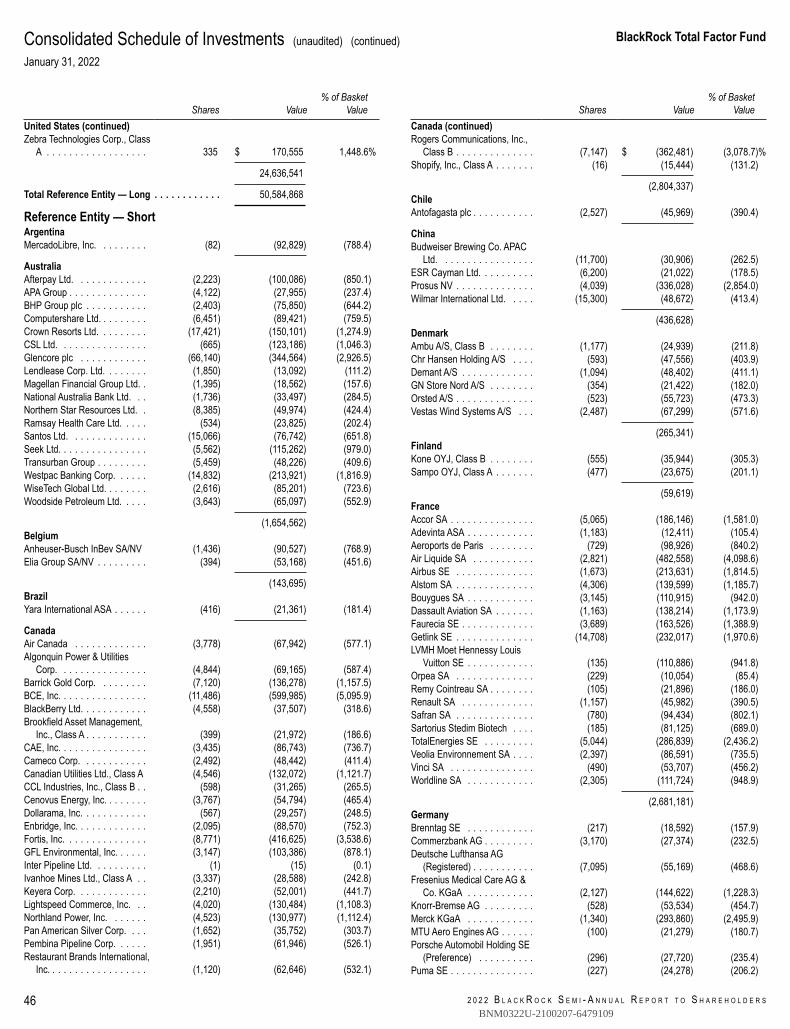
2 0 2 2 B L A C K R O C K S E M I - A N N U A L R E P O R T T O S H A R E H O L D E R S
BlackRock Total Factor Fund
46
Consolidated Schedule of Investments (unaudited) (continued)January 31, 2022
Shares Value% of Basket
ValueUnited States (continued)Zebra Technologies Corp., Class
A . . . . . . . . . . . . . . . . . . 335 $ 170,555 1,448.6%
24,636,541
Total Reference Entity — Long . . . . . . . . . . . . 50,584,868
Reference Entity — ShortArgentinaMercadoLibre, Inc. . . . . . . . . (82) (92,829) (788.4)
AustraliaAfterpay Ltd. . . . . . . . . . . . . (2,223) (100,086) (850.1)APA Group . . . . . . . . . . . . . . (4,122) (27,955) (237.4)BHP Group plc . . . . . . . . . . . (2,403) (75,850) (644.2)Computershare Ltd. . . . . . . . . (6,451) (89,421) (759.5)Crown Resorts Ltd. . . . . . . . . (17,421) (150,101) (1,274.9)CSL Ltd. . . . . . . . . . . . . . . . (665) (123,186) (1,046.3)Glencore plc . . . . . . . . . . . . (66,140) (344,564) (2,926.5)Lendlease Corp. Ltd. . . . . . . . (1,850) (13,092) (111.2)Magellan Financial Group Ltd. . (1,395) (18,562) (157.6)National Australia Bank Ltd. . . (1,736) (33,497) (284.5)Northern Star Resources Ltd. . (8,385) (49,974) (424.4)Ramsay Health Care Ltd. . . . . (534) (23,825) (202.4)Santos Ltd. . . . . . . . . . . . . . (15,066) (76,742) (651.8)Seek Ltd. . . . . . . . . . . . . . . . (5,562) (115,262) (979.0)Transurban Group . . . . . . . . . (5,459) (48,226) (409.6)Westpac Banking Corp. . . . . . (14,832) (213,921) (1,816.9)WiseTech Global Ltd. . . . . . . . (2,616) (85,201) (723.6)Woodside Petroleum Ltd. . . . . (3,643) (65,097) (552.9)
(1,654,562)BelgiumAnheuser-Busch InBev SA/NV (1,436) (90,527) (768.9)Elia Group SA/NV . . . . . . . . . (394) (53,168) (451.6)
(143,695)BrazilYara International ASA . . . . . . (416) (21,361) (181.4)
CanadaAir Canada . . . . . . . . . . . . . (3,778) (67,942) (577.1)Algonquin Power & Utilities
Corp. . . . . . . . . . . . . . . . (4,844) (69,165) (587.4)Barrick Gold Corp. . . . . . . . . (7,120) (136,278) (1,157.5)BCE, Inc. . . . . . . . . . . . . . . . (11,486) (599,985) (5,095.9)BlackBerry Ltd. . . . . . . . . . . . (4,558) (37,507) (318.6)Brookfield Asset Management,
Inc., Class A . . . . . . . . . . . (399) (21,972) (186.6)CAE, Inc. . . . . . . . . . . . . . . . (3,435) (86,743) (736.7)Cameco Corp. . . . . . . . . . . . (2,492) (48,442) (411.4)Canadian Utilities Ltd., Class A (4,546) (132,072) (1,121.7)CCL Industries, Inc., Class B . . (598) (31,265) (265.5)Cenovus Energy, Inc. . . . . . . . (3,767) (54,794) (465.4)Dollarama, Inc. . . . . . . . . . . . (567) (29,257) (248.5)Enbridge, Inc. . . . . . . . . . . . . (2,095) (88,570) (752.3)Fortis, Inc. . . . . . . . . . . . . . . (8,771) (416,625) (3,538.6)GFL Environmental, Inc. . . . . . (3,147) (103,386) (878.1)Inter Pipeline Ltd. . . . . . . . . . (1) (15) (0.1)Ivanhoe Mines Ltd., Class A . . (3,337) (28,588) (242.8)Keyera Corp. . . . . . . . . . . . . (2,210) (52,001) (441.7)Lightspeed Commerce, Inc. . . (4,020) (130,484) (1,108.3)Northland Power, Inc. . . . . . . (4,523) (130,977) (1,112.4)Pan American Silver Corp. . . . (1,652) (35,752) (303.7)Pembina Pipeline Corp. . . . . . (1,951) (61,946) (526.1)Restaurant Brands International,
Inc. . . . . . . . . . . . . . . . . . (1,120) (62,646) (532.1)
Shares Value% of Basket
ValueCanada (continued)Rogers Communications, Inc.,
Class B . . . . . . . . . . . . . . (7,147) $ (362,481) (3,078.7)%Shopify, Inc., Class A . . . . . . . (16) (15,444) (131.2)
(2,804,337)ChileAntofagasta plc . . . . . . . . . . . (2,527) (45,969) (390.4)
ChinaBudweiser Brewing Co. APAC
Ltd. . . . . . . . . . . . . . . . . (11,700) (30,906) (262.5)ESR Cayman Ltd. . . . . . . . . . (6,200) (21,022) (178.5)Prosus NV . . . . . . . . . . . . . . (4,039) (336,028) (2,854.0)Wilmar International Ltd. . . . . (15,300) (48,672) (413.4)
(436,628)DenmarkAmbu A/S, Class B . . . . . . . . (1,177) (24,939) (211.8)Chr Hansen Holding A/S . . . . (593) (47,556) (403.9)Demant A/S . . . . . . . . . . . . . (1,094) (48,402) (411.1)GN Store Nord A/S . . . . . . . . (354) (21,422) (182.0)Orsted A/S . . . . . . . . . . . . . . (523) (55,723) (473.3)Vestas Wind Systems A/S . . . (2,487) (67,299) (571.6)
(265,341)FinlandKone OYJ, Class B . . . . . . . . (555) (35,944) (305.3)Sampo OYJ, Class A . . . . . . . (477) (23,675) (201.1)
(59,619)FranceAccor SA . . . . . . . . . . . . . . . (5,065) (186,146) (1,581.0)Adevinta ASA . . . . . . . . . . . . (1,183) (12,411) (105.4)Aeroports de Paris . . . . . . . . (729) (98,926) (840.2)Air Liquide SA . . . . . . . . . . . (2,821) (482,558) (4,098.6)Airbus SE . . . . . . . . . . . . . . (1,673) (213,631) (1,814.5)Alstom SA . . . . . . . . . . . . . . (4,306) (139,599) (1,185.7)Bouygues SA . . . . . . . . . . . . (3,145) (110,915) (942.0)Dassault Aviation SA . . . . . . . (1,163) (138,214) (1,173.9)Faurecia SE . . . . . . . . . . . . . (3,689) (163,526) (1,388.9)Getlink SE . . . . . . . . . . . . . . (14,708) (232,017) (1,970.6)LVMH Moet Hennessy Louis
Vuitton SE . . . . . . . . . . . . (135) (110,886) (941.8)Orpea SA . . . . . . . . . . . . . . (229) (10,054) (85.4)Remy Cointreau SA . . . . . . . . (105) (21,896) (186.0)Renault SA . . . . . . . . . . . . . (1,157) (45,982) (390.5)Safran SA . . . . . . . . . . . . . . (780) (94,434) (802.1)Sartorius Stedim Biotech . . . . (185) (81,125) (689.0)TotalEnergies SE . . . . . . . . . (5,044) (286,839) (2,436.2)Veolia Environnement SA . . . . (2,397) (86,591) (735.5)Vinci SA . . . . . . . . . . . . . . . (490) (53,707) (456.2)Worldline SA . . . . . . . . . . . . (2,305) (111,724) (948.9)
(2,681,181)GermanyBrenntag SE . . . . . . . . . . . . (217) (18,592) (157.9)Commerzbank AG . . . . . . . . . (3,170) (27,374) (232.5)Deutsche Lufthansa AG
(Registered) . . . . . . . . . . . (7,095) (55,169) (468.6)Fresenius Medical Care AG &
Co. KGaA . . . . . . . . . . . . (2,127) (144,622) (1,228.3)Knorr-Bremse AG . . . . . . . . . (528) (53,534) (454.7)Merck KGaA . . . . . . . . . . . . (1,340) (293,860) (2,495.9)MTU Aero Engines AG . . . . . . (100) (21,279) (180.7)Porsche Automobil Holding SE
(Preference) . . . . . . . . . . (296) (27,720) (235.4)Puma SE . . . . . . . . . . . . . . . (227) (24,278) (206.2)
BNM0322U-2100207-6479109
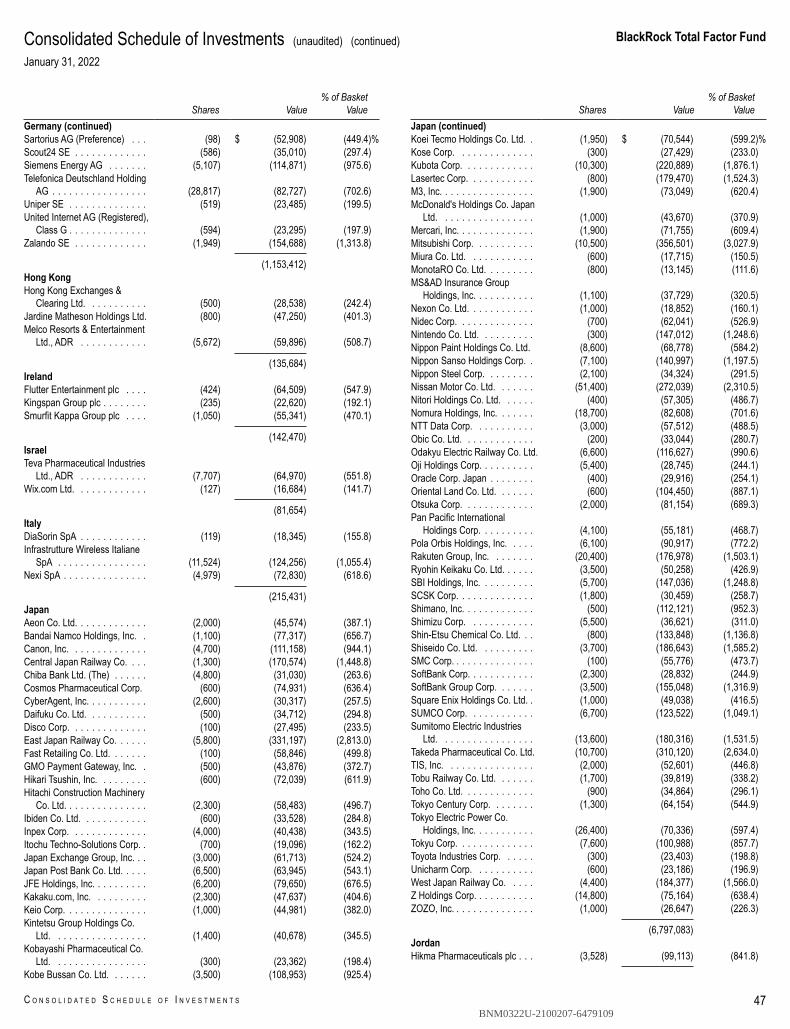
BlackRock Total Factor Fund
C O N S O L I D A T E D S C H E D U L E O F I N V E S T M E N T S 47
Consolidated Schedule of Investments (unaudited) (continued)January 31, 2022
Shares Value% of Basket
ValueGermany (continued)Sartorius AG (Preference) . . . (98) $ (52,908) (449.4)%Scout24 SE . . . . . . . . . . . . . (586) (35,010) (297.4)Siemens Energy AG . . . . . . . (5,107) (114,871) (975.6)Telefonica Deutschland Holding
AG . . . . . . . . . . . . . . . . . (28,817) (82,727) (702.6)Uniper SE . . . . . . . . . . . . . . (519) (23,485) (199.5)United Internet AG (Registered),
Class G . . . . . . . . . . . . . . (594) (23,295) (197.9)Zalando SE . . . . . . . . . . . . . (1,949) (154,688) (1,313.8)
(1,153,412)Hong KongHong Kong Exchanges &
Clearing Ltd. . . . . . . . . . . (500) (28,538) (242.4)Jardine Matheson Holdings Ltd. (800) (47,250) (401.3)Melco Resorts & Entertainment
Ltd., ADR . . . . . . . . . . . . (5,672) (59,896) (508.7)
(135,684)IrelandFlutter Entertainment plc . . . . (424) (64,509) (547.9)Kingspan Group plc . . . . . . . . (235) (22,620) (192.1)Smurfit Kappa Group plc . . . . (1,050) (55,341) (470.1)
(142,470)IsraelTeva Pharmaceutical Industries
Ltd., ADR . . . . . . . . . . . . (7,707) (64,970) (551.8)Wix.com Ltd. . . . . . . . . . . . . (127) (16,684) (141.7)
(81,654)ItalyDiaSorin SpA . . . . . . . . . . . . (119) (18,345) (155.8)Infrastrutture Wireless Italiane
SpA . . . . . . . . . . . . . . . . (11,524) (124,256) (1,055.4)Nexi SpA . . . . . . . . . . . . . . . (4,979) (72,830) (618.6)
(215,431)JapanAeon Co. Ltd. . . . . . . . . . . . . (2,000) (45,574) (387.1)Bandai Namco Holdings, Inc. . (1,100) (77,317) (656.7)Canon, Inc. . . . . . . . . . . . . . (4,700) (111,158) (944.1)Central Japan Railway Co. . . . (1,300) (170,574) (1,448.8)Chiba Bank Ltd. (The) . . . . . . (4,800) (31,030) (263.6)Cosmos Pharmaceutical Corp. (600) (74,931) (636.4)CyberAgent, Inc. . . . . . . . . . . (2,600) (30,317) (257.5)Daifuku Co. Ltd. . . . . . . . . . . (500) (34,712) (294.8)Disco Corp. . . . . . . . . . . . . . (100) (27,495) (233.5)East Japan Railway Co. . . . . . (5,800) (331,197) (2,813.0)Fast Retailing Co. Ltd. . . . . . . (100) (58,846) (499.8)GMO Payment Gateway, Inc. . (500) (43,876) (372.7)Hikari Tsushin, Inc. . . . . . . . . (600) (72,039) (611.9)Hitachi Construction Machinery
Co. Ltd. . . . . . . . . . . . . . . (2,300) (58,483) (496.7)Ibiden Co. Ltd. . . . . . . . . . . . (600) (33,528) (284.8)Inpex Corp. . . . . . . . . . . . . . (4,000) (40,438) (343.5)Itochu Techno-Solutions Corp. . (700) (19,096) (162.2)Japan Exchange Group, Inc. . . (3,000) (61,713) (524.2)Japan Post Bank Co. Ltd. . . . . (6,500) (63,945) (543.1)JFE Holdings, Inc. . . . . . . . . . (6,200) (79,650) (676.5)Kakaku.com, Inc. . . . . . . . . . (2,300) (47,637) (404.6)Keio Corp. . . . . . . . . . . . . . . (1,000) (44,981) (382.0)Kintetsu Group Holdings Co.
Ltd. . . . . . . . . . . . . . . . . (1,400) (40,678) (345.5)Kobayashi Pharmaceutical Co.
Ltd. . . . . . . . . . . . . . . . . (300) (23,362) (198.4)Kobe Bussan Co. Ltd. . . . . . . (3,500) (108,953) (925.4)
Shares Value% of Basket
ValueJapan (continued)Koei Tecmo Holdings Co. Ltd. . (1,950) $ (70,544) (599.2)%Kose Corp. . . . . . . . . . . . . . (300) (27,429) (233.0)Kubota Corp. . . . . . . . . . . . . (10,300) (220,889) (1,876.1)Lasertec Corp. . . . . . . . . . . . (800) (179,470) (1,524.3)M3, Inc. . . . . . . . . . . . . . . . . (1,900) (73,049) (620.4)McDonald's Holdings Co. Japan
Ltd. . . . . . . . . . . . . . . . . (1,000) (43,670) (370.9)Mercari, Inc. . . . . . . . . . . . . . (1,900) (71,755) (609.4)Mitsubishi Corp. . . . . . . . . . . (10,500) (356,501) (3,027.9)Miura Co. Ltd. . . . . . . . . . . . (600) (17,715) (150.5)MonotaRO Co. Ltd. . . . . . . . . (800) (13,145) (111.6)MS&AD Insurance Group
Holdings, Inc. . . . . . . . . . . (1,100) (37,729) (320.5)Nexon Co. Ltd. . . . . . . . . . . . (1,000) (18,852) (160.1)Nidec Corp. . . . . . . . . . . . . . (700) (62,041) (526.9)Nintendo Co. Ltd. . . . . . . . . . (300) (147,012) (1,248.6)Nippon Paint Holdings Co. Ltd. (8,600) (68,778) (584.2)Nippon Sanso Holdings Corp. . (7,100) (140,997) (1,197.5)Nippon Steel Corp. . . . . . . . . (2,100) (34,324) (291.5)Nissan Motor Co. Ltd. . . . . . . (51,400) (272,039) (2,310.5)Nitori Holdings Co. Ltd. . . . . . (400) (57,305) (486.7)Nomura Holdings, Inc. . . . . . . (18,700) (82,608) (701.6)NTT Data Corp. . . . . . . . . . . (3,000) (57,512) (488.5)Obic Co. Ltd. . . . . . . . . . . . . (200) (33,044) (280.7)Odakyu Electric Railway Co. Ltd. (6,600) (116,627) (990.6)Oji Holdings Corp. . . . . . . . . . (5,400) (28,745) (244.1)Oracle Corp. Japan . . . . . . . . (400) (29,916) (254.1)Oriental Land Co. Ltd. . . . . . . (600) (104,450) (887.1)Otsuka Corp. . . . . . . . . . . . . (2,000) (81,154) (689.3)Pan Pacific International
Holdings Corp. . . . . . . . . . (4,100) (55,181) (468.7)Pola Orbis Holdings, Inc. . . . . (6,100) (90,917) (772.2)Rakuten Group, Inc. . . . . . . . (20,400) (176,978) (1,503.1)Ryohin Keikaku Co. Ltd. . . . . . (3,500) (50,258) (426.9)SBI Holdings, Inc. . . . . . . . . . (5,700) (147,036) (1,248.8)SCSK Corp. . . . . . . . . . . . . . (1,800) (30,459) (258.7)Shimano, Inc. . . . . . . . . . . . . (500) (112,121) (952.3)Shimizu Corp. . . . . . . . . . . . (5,500) (36,621) (311.0)Shin-Etsu Chemical Co. Ltd. . . (800) (133,848) (1,136.8)Shiseido Co. Ltd. . . . . . . . . . (3,700) (186,643) (1,585.2)SMC Corp. . . . . . . . . . . . . . . (100) (55,776) (473.7)SoftBank Corp. . . . . . . . . . . . (2,300) (28,832) (244.9)SoftBank Group Corp. . . . . . . (3,500) (155,048) (1,316.9)Square Enix Holdings Co. Ltd. . (1,000) (49,038) (416.5)SUMCO Corp. . . . . . . . . . . . (6,700) (123,522) (1,049.1)Sumitomo Electric Industries
Ltd. . . . . . . . . . . . . . . . . (13,600) (180,316) (1,531.5)Takeda Pharmaceutical Co. Ltd. (10,700) (310,120) (2,634.0)TIS, Inc. . . . . . . . . . . . . . . . (2,000) (52,601) (446.8)Tobu Railway Co. Ltd. . . . . . . (1,700) (39,819) (338.2)Toho Co. Ltd. . . . . . . . . . . . . (900) (34,864) (296.1)Tokyo Century Corp. . . . . . . . (1,300) (64,154) (544.9)Tokyo Electric Power Co.
Holdings, Inc. . . . . . . . . . . (26,400) (70,336) (597.4)Tokyu Corp. . . . . . . . . . . . . . (7,600) (100,988) (857.7)Toyota Industries Corp. . . . . . (300) (23,403) (198.8)Unicharm Corp. . . . . . . . . . . (600) (23,186) (196.9)West Japan Railway Co. . . . . (4,400) (184,377) (1,566.0)Z Holdings Corp. . . . . . . . . . . (14,800) (75,164) (638.4)ZOZO, Inc. . . . . . . . . . . . . . . (1,000) (26,647) (226.3)
(6,797,083)JordanHikma Pharmaceuticals plc . . . (3,528) (99,113) (841.8)
BNM0322U-2100207-6479109
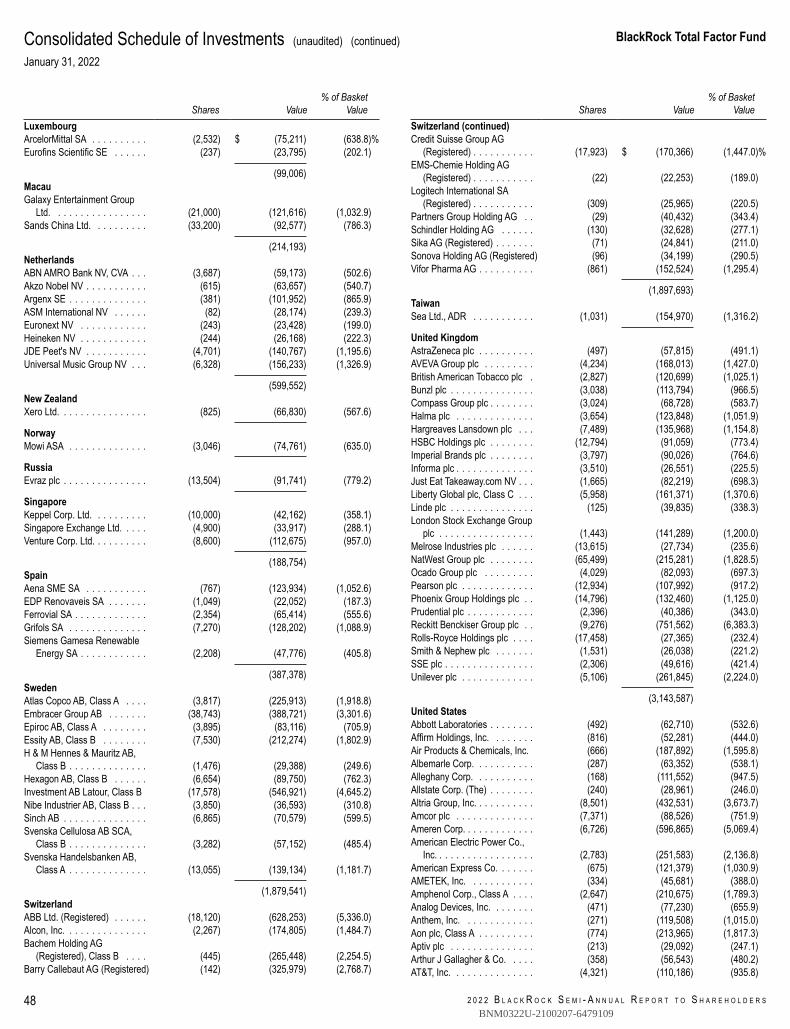
2 0 2 2 B L A C K R O C K S E M I - A N N U A L R E P O R T T O S H A R E H O L D E R S
BlackRock Total Factor Fund
48
Consolidated Schedule of Investments (unaudited) (continued)January 31, 2022
Shares Value% of Basket
ValueLuxembourgArcelorMittal SA . . . . . . . . . . (2,532) $ (75,211) (638.8)%Eurofins Scientific SE . . . . . . (237) (23,795) (202.1)
(99,006)MacauGalaxy Entertainment Group
Ltd. . . . . . . . . . . . . . . . . (21,000) (121,616) (1,032.9)Sands China Ltd. . . . . . . . . . (33,200) (92,577) (786.3)
(214,193)NetherlandsABN AMRO Bank NV, CVA . . . (3,687) (59,173) (502.6)Akzo Nobel NV . . . . . . . . . . . (615) (63,657) (540.7)Argenx SE . . . . . . . . . . . . . . (381) (101,952) (865.9)ASM International NV . . . . . . (82) (28,174) (239.3)Euronext NV . . . . . . . . . . . . (243) (23,428) (199.0)Heineken NV . . . . . . . . . . . . (244) (26,168) (222.3)JDE Peet's NV . . . . . . . . . . . (4,701) (140,767) (1,195.6)Universal Music Group NV . . . (6,328) (156,233) (1,326.9)
(599,552)New ZealandXero Ltd. . . . . . . . . . . . . . . . (825) (66,830) (567.6)
NorwayMowi ASA . . . . . . . . . . . . . . (3,046) (74,761) (635.0)
RussiaEvraz plc . . . . . . . . . . . . . . . (13,504) (91,741) (779.2)
SingaporeKeppel Corp. Ltd. . . . . . . . . . (10,000) (42,162) (358.1)Singapore Exchange Ltd. . . . . (4,900) (33,917) (288.1)Venture Corp. Ltd. . . . . . . . . . (8,600) (112,675) (957.0)
(188,754)SpainAena SME SA . . . . . . . . . . . (767) (123,934) (1,052.6)EDP Renovaveis SA . . . . . . . (1,049) (22,052) (187.3)Ferrovial SA . . . . . . . . . . . . . (2,354) (65,414) (555.6)Grifols SA . . . . . . . . . . . . . . (7,270) (128,202) (1,088.9)Siemens Gamesa Renewable
Energy SA . . . . . . . . . . . . (2,208) (47,776) (405.8)
(387,378)SwedenAtlas Copco AB, Class A . . . . (3,817) (225,913) (1,918.8)Embracer Group AB . . . . . . . (38,743) (388,721) (3,301.6)Epiroc AB, Class A . . . . . . . . (3,895) (83,116) (705.9)Essity AB, Class B . . . . . . . . (7,530) (212,274) (1,802.9)H & M Hennes & Mauritz AB,
Class B . . . . . . . . . . . . . . (1,476) (29,388) (249.6)Hexagon AB, Class B . . . . . . (6,654) (89,750) (762.3)Investment AB Latour, Class B (17,578) (546,921) (4,645.2)Nibe Industrier AB, Class B . . . (3,850) (36,593) (310.8)Sinch AB . . . . . . . . . . . . . . . (6,865) (70,579) (599.5)Svenska Cellulosa AB SCA,
Class B . . . . . . . . . . . . . . (3,282) (57,152) (485.4)Svenska Handelsbanken AB,
Class A . . . . . . . . . . . . . . (13,055) (139,134) (1,181.7)
(1,879,541)SwitzerlandABB Ltd. (Registered) . . . . . . (18,120) (628,253) (5,336.0)Alcon, Inc. . . . . . . . . . . . . . . (2,267) (174,805) (1,484.7)Bachem Holding AG
(Registered), Class B . . . . (445) (265,448) (2,254.5)Barry Callebaut AG (Registered) (142) (325,979) (2,768.7)
Shares Value% of Basket
ValueSwitzerland (continued)Credit Suisse Group AG
(Registered) . . . . . . . . . . . (17,923) $ (170,366) (1,447.0)%EMS-Chemie Holding AG
(Registered) . . . . . . . . . . . (22) (22,253) (189.0)Logitech International SA
(Registered) . . . . . . . . . . . (309) (25,965) (220.5)Partners Group Holding AG . . (29) (40,432) (343.4)Schindler Holding AG . . . . . . (130) (32,628) (277.1)Sika AG (Registered) . . . . . . . (71) (24,841) (211.0)Sonova Holding AG (Registered) (96) (34,199) (290.5)Vifor Pharma AG . . . . . . . . . . (861) (152,524) (1,295.4)
(1,897,693)TaiwanSea Ltd., ADR . . . . . . . . . . . (1,031) (154,970) (1,316.2)
United KingdomAstraZeneca plc . . . . . . . . . . (497) (57,815) (491.1)AVEVA Group plc . . . . . . . . . (4,234) (168,013) (1,427.0)British American Tobacco plc . (2,827) (120,699) (1,025.1)Bunzl plc . . . . . . . . . . . . . . . (3,038) (113,794) (966.5)Compass Group plc . . . . . . . . (3,024) (68,728) (583.7)Halma plc . . . . . . . . . . . . . . (3,654) (123,848) (1,051.9)Hargreaves Lansdown plc . . . (7,489) (135,968) (1,154.8)HSBC Holdings plc . . . . . . . . (12,794) (91,059) (773.4)Imperial Brands plc . . . . . . . . (3,797) (90,026) (764.6)Informa plc . . . . . . . . . . . . . . (3,510) (26,551) (225.5)Just Eat Takeaway.com NV . . . (1,665) (82,219) (698.3)Liberty Global plc, Class C . . . (5,958) (161,371) (1,370.6)Linde plc . . . . . . . . . . . . . . . (125) (39,835) (338.3)London Stock Exchange Group
plc . . . . . . . . . . . . . . . . . (1,443) (141,289) (1,200.0)Melrose Industries plc . . . . . . (13,615) (27,734) (235.6)NatWest Group plc . . . . . . . . (65,499) (215,281) (1,828.5)Ocado Group plc . . . . . . . . . (4,029) (82,093) (697.3)Pearson plc . . . . . . . . . . . . . (12,934) (107,992) (917.2)Phoenix Group Holdings plc . . (14,796) (132,460) (1,125.0)Prudential plc . . . . . . . . . . . . (2,396) (40,386) (343.0)Reckitt Benckiser Group plc . . (9,276) (751,562) (6,383.3)Rolls-Royce Holdings plc . . . . (17,458) (27,365) (232.4)Smith & Nephew plc . . . . . . . (1,531) (26,038) (221.2)SSE plc . . . . . . . . . . . . . . . . (2,306) (49,616) (421.4)Unilever plc . . . . . . . . . . . . . (5,106) (261,845) (2,224.0)
(3,143,587)United StatesAbbott Laboratories . . . . . . . . (492) (62,710) (532.6)Affirm Holdings, Inc. . . . . . . . (816) (52,281) (444.0)Air Products & Chemicals, Inc. (666) (187,892) (1,595.8)Albemarle Corp. . . . . . . . . . . (287) (63,352) (538.1)Alleghany Corp. . . . . . . . . . . (168) (111,552) (947.5)Allstate Corp. (The) . . . . . . . . (240) (28,961) (246.0)Altria Group, Inc. . . . . . . . . . . (8,501) (432,531) (3,673.7)Amcor plc . . . . . . . . . . . . . . (7,371) (88,526) (751.9)Ameren Corp. . . . . . . . . . . . . (6,726) (596,865) (5,069.4)American Electric Power Co.,
Inc. . . . . . . . . . . . . . . . . . (2,783) (251,583) (2,136.8)American Express Co. . . . . . . (675) (121,379) (1,030.9)AMETEK, Inc. . . . . . . . . . . . (334) (45,681) (388.0)Amphenol Corp., Class A . . . . (2,647) (210,675) (1,789.3)Analog Devices, Inc. . . . . . . . (471) (77,230) (655.9)Anthem, Inc. . . . . . . . . . . . . (271) (119,508) (1,015.0)Aon plc, Class A . . . . . . . . . . (774) (213,965) (1,817.3)Aptiv plc . . . . . . . . . . . . . . . (213) (29,092) (247.1)Arthur J Gallagher & Co. . . . . (358) (56,543) (480.2)AT&T, Inc. . . . . . . . . . . . . . . (4,321) (110,186) (935.8)
BNM0322U-2100207-6479109
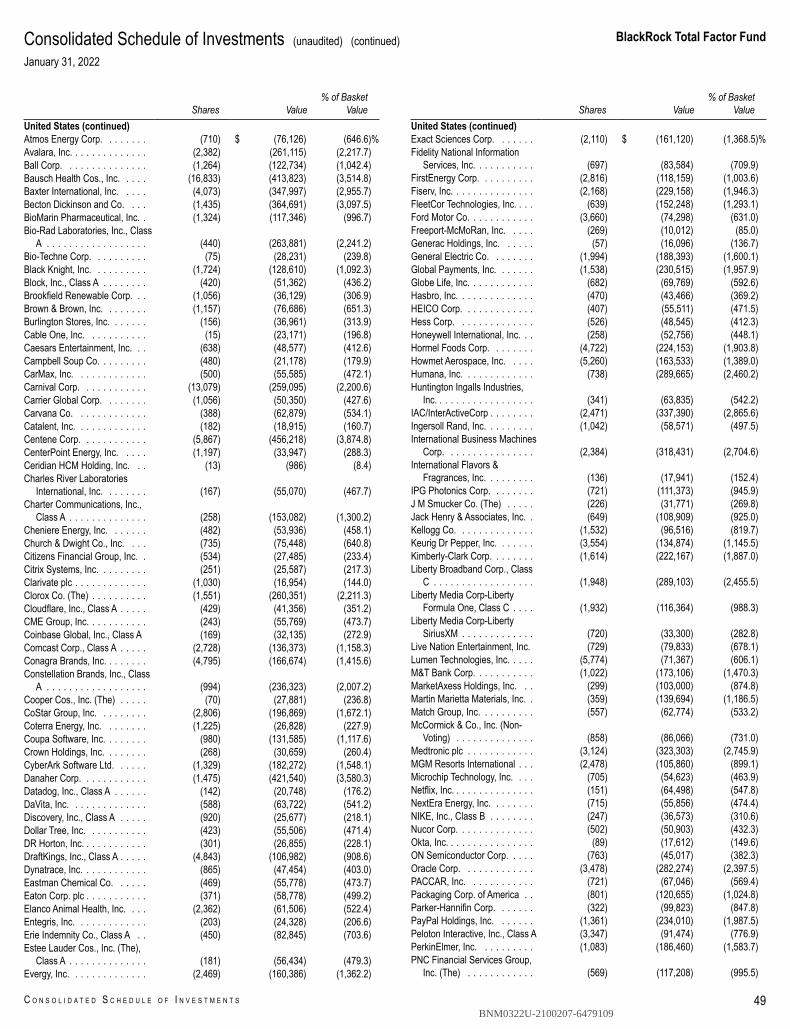
BlackRock Total Factor Fund
C O N S O L I D A T E D S C H E D U L E O F I N V E S T M E N T S 49
Consolidated Schedule of Investments (unaudited) (continued)January 31, 2022
Shares Value% of Basket
ValueUnited States (continued)Atmos Energy Corp. . . . . . . . (710) $ (76,126) (646.6)%Avalara, Inc. . . . . . . . . . . . . . (2,382) (261,115) (2,217.7)Ball Corp. . . . . . . . . . . . . . . (1,264) (122,734) (1,042.4)Bausch Health Cos., Inc. . . . . (16,833) (413,823) (3,514.8)Baxter International, Inc. . . . . (4,073) (347,997) (2,955.7)Becton Dickinson and Co. . . . (1,435) (364,691) (3,097.5)BioMarin Pharmaceutical, Inc. . (1,324) (117,346) (996.7)Bio-Rad Laboratories, Inc., Class
A . . . . . . . . . . . . . . . . . . (440) (263,881) (2,241.2)Bio-Techne Corp. . . . . . . . . . (75) (28,231) (239.8)Black Knight, Inc. . . . . . . . . . (1,724) (128,610) (1,092.3)Block, Inc., Class A . . . . . . . . (420) (51,362) (436.2)Brookfield Renewable Corp. . . (1,056) (36,129) (306.9)Brown & Brown, Inc. . . . . . . . (1,157) (76,686) (651.3)Burlington Stores, Inc. . . . . . . (156) (36,961) (313.9)Cable One, Inc. . . . . . . . . . . (15) (23,171) (196.8)Caesars Entertainment, Inc. . . (638) (48,577) (412.6)Campbell Soup Co. . . . . . . . . (480) (21,178) (179.9)CarMax, Inc. . . . . . . . . . . . . (500) (55,585) (472.1)Carnival Corp. . . . . . . . . . . . (13,079) (259,095) (2,200.6)Carrier Global Corp. . . . . . . . (1,056) (50,350) (427.6)Carvana Co. . . . . . . . . . . . . (388) (62,879) (534.1)Catalent, Inc. . . . . . . . . . . . . (182) (18,915) (160.7)Centene Corp. . . . . . . . . . . . (5,867) (456,218) (3,874.8)CenterPoint Energy, Inc. . . . . (1,197) (33,947) (288.3)Ceridian HCM Holding, Inc. . . (13) (986) (8.4)Charles River Laboratories
International, Inc. . . . . . . . (167) (55,070) (467.7)Charter Communications, Inc.,
Class A . . . . . . . . . . . . . . (258) (153,082) (1,300.2)Cheniere Energy, Inc. . . . . . . (482) (53,936) (458.1)Church & Dwight Co., Inc. . . . (735) (75,448) (640.8)Citizens Financial Group, Inc. . (534) (27,485) (233.4)Citrix Systems, Inc. . . . . . . . . (251) (25,587) (217.3)Clarivate plc . . . . . . . . . . . . . (1,030) (16,954) (144.0)Clorox Co. (The) . . . . . . . . . . (1,551) (260,351) (2,211.3)Cloudflare, Inc., Class A . . . . . (429) (41,356) (351.2)CME Group, Inc. . . . . . . . . . . (243) (55,769) (473.7)Coinbase Global, Inc., Class A (169) (32,135) (272.9)Comcast Corp., Class A . . . . . (2,728) (136,373) (1,158.3)Conagra Brands, Inc. . . . . . . . (4,795) (166,674) (1,415.6)Constellation Brands, Inc., Class
A . . . . . . . . . . . . . . . . . . (994) (236,323) (2,007.2)Cooper Cos., Inc. (The) . . . . . (70) (27,881) (236.8)CoStar Group, Inc. . . . . . . . . (2,806) (196,869) (1,672.1)Coterra Energy, Inc. . . . . . . . (1,225) (26,828) (227.9)Coupa Software, Inc. . . . . . . . (980) (131,585) (1,117.6)Crown Holdings, Inc. . . . . . . . (268) (30,659) (260.4)CyberArk Software Ltd. . . . . . (1,329) (182,272) (1,548.1)Danaher Corp. . . . . . . . . . . . (1,475) (421,540) (3,580.3)Datadog, Inc., Class A . . . . . . (142) (20,748) (176.2)DaVita, Inc. . . . . . . . . . . . . . (588) (63,722) (541.2)Discovery, Inc., Class A . . . . . (920) (25,677) (218.1)Dollar Tree, Inc. . . . . . . . . . . (423) (55,506) (471.4)DR Horton, Inc. . . . . . . . . . . . (301) (26,855) (228.1)DraftKings, Inc., Class A . . . . . (4,843) (106,982) (908.6)Dynatrace, Inc. . . . . . . . . . . . (865) (47,454) (403.0)Eastman Chemical Co. . . . . . (469) (55,778) (473.7)Eaton Corp. plc . . . . . . . . . . . (371) (58,778) (499.2)Elanco Animal Health, Inc. . . . (2,362) (61,506) (522.4)Entegris, Inc. . . . . . . . . . . . . (203) (24,328) (206.6)Erie Indemnity Co., Class A . . (450) (82,845) (703.6)Estee Lauder Cos., Inc. (The),
Class A . . . . . . . . . . . . . . (181) (56,434) (479.3)Evergy, Inc. . . . . . . . . . . . . . (2,469) (160,386) (1,362.2)
Shares Value% of Basket
ValueUnited States (continued)Exact Sciences Corp. . . . . . . (2,110) $ (161,120) (1,368.5)%Fidelity National Information
Services, Inc. . . . . . . . . . . (697) (83,584) (709.9)FirstEnergy Corp. . . . . . . . . . (2,816) (118,159) (1,003.6)Fiserv, Inc. . . . . . . . . . . . . . . (2,168) (229,158) (1,946.3)FleetCor Technologies, Inc. . . . (639) (152,248) (1,293.1)Ford Motor Co. . . . . . . . . . . . (3,660) (74,298) (631.0)Freeport-McMoRan, Inc. . . . . (269) (10,012) (85.0)Generac Holdings, Inc. . . . . . (57) (16,096) (136.7)General Electric Co. . . . . . . . (1,994) (188,393) (1,600.1)Global Payments, Inc. . . . . . . (1,538) (230,515) (1,957.9)Globe Life, Inc. . . . . . . . . . . . (682) (69,769) (592.6)Hasbro, Inc. . . . . . . . . . . . . . (470) (43,466) (369.2)HEICO Corp. . . . . . . . . . . . . (407) (55,511) (471.5)Hess Corp. . . . . . . . . . . . . . (526) (48,545) (412.3)Honeywell International, Inc. . . (258) (52,756) (448.1)Hormel Foods Corp. . . . . . . . (4,722) (224,153) (1,903.8)Howmet Aerospace, Inc. . . . . (5,260) (163,533) (1,389.0)Humana, Inc. . . . . . . . . . . . . (738) (289,665) (2,460.2)Huntington Ingalls Industries,
Inc. . . . . . . . . . . . . . . . . . (341) (63,835) (542.2)IAC/InterActiveCorp . . . . . . . . (2,471) (337,390) (2,865.6)Ingersoll Rand, Inc. . . . . . . . . (1,042) (58,571) (497.5)International Business Machines
Corp. . . . . . . . . . . . . . . . (2,384) (318,431) (2,704.6)International Flavors &
Fragrances, Inc. . . . . . . . . (136) (17,941) (152.4)IPG Photonics Corp. . . . . . . . (721) (111,373) (945.9)J M Smucker Co. (The) . . . . . (226) (31,771) (269.8)Jack Henry & Associates, Inc. . (649) (108,909) (925.0)Kellogg Co. . . . . . . . . . . . . . (1,532) (96,516) (819.7)Keurig Dr Pepper, Inc. . . . . . . (3,554) (134,874) (1,145.5)Kimberly-Clark Corp. . . . . . . . (1,614) (222,167) (1,887.0)Liberty Broadband Corp., Class
C . . . . . . . . . . . . . . . . . . (1,948) (289,103) (2,455.5)Liberty Media Corp-Liberty
Formula One, Class C . . . . (1,932) (116,364) (988.3)Liberty Media Corp-Liberty
SiriusXM . . . . . . . . . . . . . (720) (33,300) (282.8)Live Nation Entertainment, Inc. (729) (79,833) (678.1)Lumen Technologies, Inc. . . . . (5,774) (71,367) (606.1)M&T Bank Corp. . . . . . . . . . . (1,022) (173,106) (1,470.3)MarketAxess Holdings, Inc. . . (299) (103,000) (874.8)Martin Marietta Materials, Inc. . (359) (139,694) (1,186.5)Match Group, Inc. . . . . . . . . . (557) (62,774) (533.2)McCormick & Co., Inc. (Non-
Voting) . . . . . . . . . . . . . . (858) (86,066) (731.0)Medtronic plc . . . . . . . . . . . . (3,124) (323,303) (2,745.9)MGM Resorts International . . . (2,478) (105,860) (899.1)Microchip Technology, Inc. . . . (705) (54,623) (463.9)Netflix, Inc. . . . . . . . . . . . . . . (151) (64,498) (547.8)NextEra Energy, Inc. . . . . . . . (715) (55,856) (474.4)NIKE, Inc., Class B . . . . . . . . (247) (36,573) (310.6)Nucor Corp. . . . . . . . . . . . . . (502) (50,903) (432.3)Okta, Inc. . . . . . . . . . . . . . . . (89) (17,612) (149.6)ON Semiconductor Corp. . . . . (763) (45,017) (382.3)Oracle Corp. . . . . . . . . . . . . (3,478) (282,274) (2,397.5)PACCAR, Inc. . . . . . . . . . . . (721) (67,046) (569.4)Packaging Corp. of America . . (801) (120,655) (1,024.8)Parker-Hannifin Corp. . . . . . . (322) (99,823) (847.8)PayPal Holdings, Inc. . . . . . . (1,361) (234,010) (1,987.5)Peloton Interactive, Inc., Class A (3,347) (91,474) (776.9)PerkinElmer, Inc. . . . . . . . . . (1,083) (186,460) (1,583.7)PNC Financial Services Group,
Inc. (The) . . . . . . . . . . . . (569) (117,208) (995.5)
BNM0322U-2100207-6479109
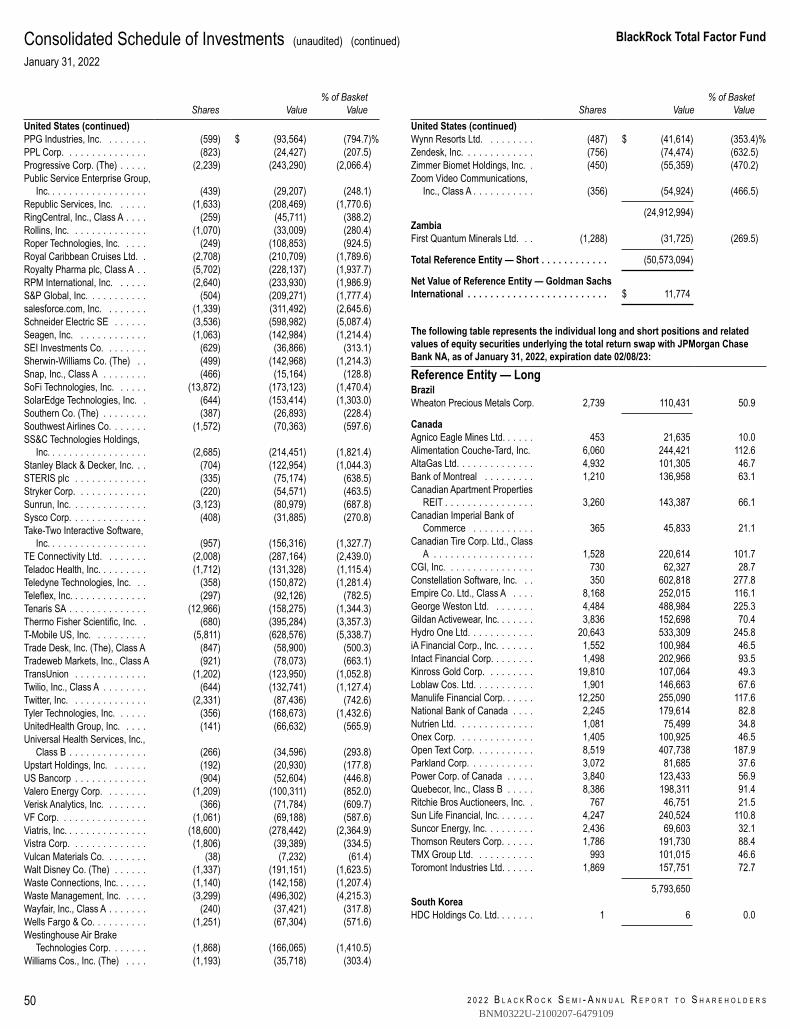
2 0 2 2 B L A C K R O C K S E M I - A N N U A L R E P O R T T O S H A R E H O L D E R S
BlackRock Total Factor Fund
50
Consolidated Schedule of Investments (unaudited) (continued)January 31, 2022
Shares Value% of Basket
ValueUnited States (continued)PPG Industries, Inc. . . . . . . . (599) $ (93,564) (794.7)%PPL Corp. . . . . . . . . . . . . . . (823) (24,427) (207.5)Progressive Corp. (The) . . . . . (2,239) (243,290) (2,066.4)Public Service Enterprise Group,
Inc. . . . . . . . . . . . . . . . . . (439) (29,207) (248.1)Republic Services, Inc. . . . . . (1,633) (208,469) (1,770.6)RingCentral, Inc., Class A . . . . (259) (45,711) (388.2)Rollins, Inc. . . . . . . . . . . . . . (1,070) (33,009) (280.4)Roper Technologies, Inc. . . . . (249) (108,853) (924.5)Royal Caribbean Cruises Ltd. . (2,708) (210,709) (1,789.6)Royalty Pharma plc, Class A . . (5,702) (228,137) (1,937.7)RPM International, Inc. . . . . . (2,640) (233,930) (1,986.9)S&P Global, Inc. . . . . . . . . . . (504) (209,271) (1,777.4)salesforce.com, Inc. . . . . . . . (1,339) (311,492) (2,645.6)Schneider Electric SE . . . . . . (3,536) (598,982) (5,087.4)Seagen, Inc. . . . . . . . . . . . . (1,063) (142,984) (1,214.4)SEI Investments Co. . . . . . . . (629) (36,866) (313.1)Sherwin-Williams Co. (The) . . (499) (142,968) (1,214.3)Snap, Inc., Class A . . . . . . . . (466) (15,164) (128.8)SoFi Technologies, Inc. . . . . . (13,872) (173,123) (1,470.4)SolarEdge Technologies, Inc. . (644) (153,414) (1,303.0)Southern Co. (The) . . . . . . . . (387) (26,893) (228.4)Southwest Airlines Co. . . . . . . (1,572) (70,363) (597.6)SS&C Technologies Holdings,
Inc. . . . . . . . . . . . . . . . . . (2,685) (214,451) (1,821.4)Stanley Black & Decker, Inc. . . (704) (122,954) (1,044.3)STERIS plc . . . . . . . . . . . . . (335) (75,174) (638.5)Stryker Corp. . . . . . . . . . . . . (220) (54,571) (463.5)Sunrun, Inc. . . . . . . . . . . . . . (3,123) (80,979) (687.8)Sysco Corp. . . . . . . . . . . . . . (408) (31,885) (270.8)Take-Two Interactive Software,
Inc. . . . . . . . . . . . . . . . . . (957) (156,316) (1,327.7)TE Connectivity Ltd. . . . . . . . (2,008) (287,164) (2,439.0)Teladoc Health, Inc. . . . . . . . . (1,712) (131,328) (1,115.4)Teledyne Technologies, Inc. . . (358) (150,872) (1,281.4)Teleflex, Inc. . . . . . . . . . . . . . (297) (92,126) (782.5)Tenaris SA . . . . . . . . . . . . . . (12,966) (158,275) (1,344.3)Thermo Fisher Scientific, Inc. . (680) (395,284) (3,357.3)T-Mobile US, Inc. . . . . . . . . . (5,811) (628,576) (5,338.7)Trade Desk, Inc. (The), Class A (847) (58,900) (500.3)Tradeweb Markets, Inc., Class A (921) (78,073) (663.1)TransUnion . . . . . . . . . . . . . (1,202) (123,950) (1,052.8)Twilio, Inc., Class A . . . . . . . . (644) (132,741) (1,127.4)Twitter, Inc. . . . . . . . . . . . . . (2,331) (87,436) (742.6)Tyler Technologies, Inc. . . . . . (356) (168,673) (1,432.6)UnitedHealth Group, Inc. . . . . (141) (66,632) (565.9)Universal Health Services, Inc.,
Class B . . . . . . . . . . . . . . (266) (34,596) (293.8)Upstart Holdings, Inc. . . . . . . (192) (20,930) (177.8)US Bancorp . . . . . . . . . . . . . (904) (52,604) (446.8)Valero Energy Corp. . . . . . . . (1,209) (100,311) (852.0)Verisk Analytics, Inc. . . . . . . . (366) (71,784) (609.7)VF Corp. . . . . . . . . . . . . . . . (1,061) (69,188) (587.6)Viatris, Inc. . . . . . . . . . . . . . . (18,600) (278,442) (2,364.9)Vistra Corp. . . . . . . . . . . . . . (1,806) (39,389) (334.5)Vulcan Materials Co. . . . . . . . (38) (7,232) (61.4)Walt Disney Co. (The) . . . . . . (1,337) (191,151) (1,623.5)Waste Connections, Inc. . . . . . (1,140) (142,158) (1,207.4)Waste Management, Inc. . . . . (3,299) (496,302) (4,215.3)Wayfair, Inc., Class A . . . . . . . (240) (37,421) (317.8)Wells Fargo & Co. . . . . . . . . . (1,251) (67,304) (571.6)Westinghouse Air Brake
Technologies Corp. . . . . . . (1,868) (166,065) (1,410.5)Williams Cos., Inc. (The) . . . . (1,193) (35,718) (303.4)
Shares Value% of Basket
ValueUnited States (continued)Wynn Resorts Ltd. . . . . . . . . (487) $ (41,614) (353.4)%Zendesk, Inc. . . . . . . . . . . . . (756) (74,474) (632.5)Zimmer Biomet Holdings, Inc. . (450) (55,359) (470.2)Zoom Video Communications,
Inc., Class A . . . . . . . . . . . (356) (54,924) (466.5)
(24,912,994)ZambiaFirst Quantum Minerals Ltd. . . (1,288) (31,725) (269.5)
Total Reference Entity — Short . . . . . . . . . . . . (50,573,094)
Net Value of Reference Entity — Goldman SachsInternational . . . . . . . . . . . . . . . . . . . . . . . . . $ 11,774
The following table represents the individual long and short positions and relatedvalues of equity securities underlying the total return swap with JPMorgan ChaseBank NA, as of January 31, 2022, expiration date 02/08/23:
Reference Entity — LongBrazilWheaton Precious Metals Corp. 2,739 110,431 50.9
CanadaAgnico Eagle Mines Ltd. . . . . . 453 21,635 10.0Alimentation Couche-Tard, Inc. 6,060 244,421 112.6AltaGas Ltd. . . . . . . . . . . . . . 4,932 101,305 46.7Bank of Montreal . . . . . . . . . 1,210 136,958 63.1Canadian Apartment Properties
REIT . . . . . . . . . . . . . . . . 3,260 143,387 66.1Canadian Imperial Bank of
Commerce . . . . . . . . . . . 365 45,833 21.1Canadian Tire Corp. Ltd., Class
A . . . . . . . . . . . . . . . . . . 1,528 220,614 101.7CGI, Inc. . . . . . . . . . . . . . . . 730 62,327 28.7Constellation Software, Inc. . . 350 602,818 277.8Empire Co. Ltd., Class A . . . . 8,168 252,015 116.1George Weston Ltd. . . . . . . . 4,484 488,984 225.3Gildan Activewear, Inc. . . . . . . 3,836 152,698 70.4Hydro One Ltd. . . . . . . . . . . . 20,643 533,309 245.8iA Financial Corp., Inc. . . . . . . 1,552 100,984 46.5Intact Financial Corp. . . . . . . . 1,498 202,966 93.5Kinross Gold Corp. . . . . . . . . 19,810 107,064 49.3Loblaw Cos. Ltd. . . . . . . . . . . 1,901 146,663 67.6Manulife Financial Corp. . . . . . 12,250 255,090 117.6National Bank of Canada . . . . 2,245 179,614 82.8Nutrien Ltd. . . . . . . . . . . . . . 1,081 75,499 34.8Onex Corp. . . . . . . . . . . . . . 1,405 100,925 46.5Open Text Corp. . . . . . . . . . . 8,519 407,738 187.9Parkland Corp. . . . . . . . . . . . 3,072 81,685 37.6Power Corp. of Canada . . . . . 3,840 123,433 56.9Quebecor, Inc., Class B . . . . . 8,386 198,311 91.4Ritchie Bros Auctioneers, Inc. . 767 46,751 21.5Sun Life Financial, Inc. . . . . . . 4,247 240,524 110.8Suncor Energy, Inc. . . . . . . . . 2,436 69,603 32.1Thomson Reuters Corp. . . . . . 1,786 191,730 88.4TMX Group Ltd. . . . . . . . . . . 993 101,015 46.6Toromont Industries Ltd. . . . . . 1,869 157,751 72.7
5,793,650South KoreaHDC Holdings Co. Ltd. . . . . . . 1 6 0.0
BNM0322U-2100207-6479109
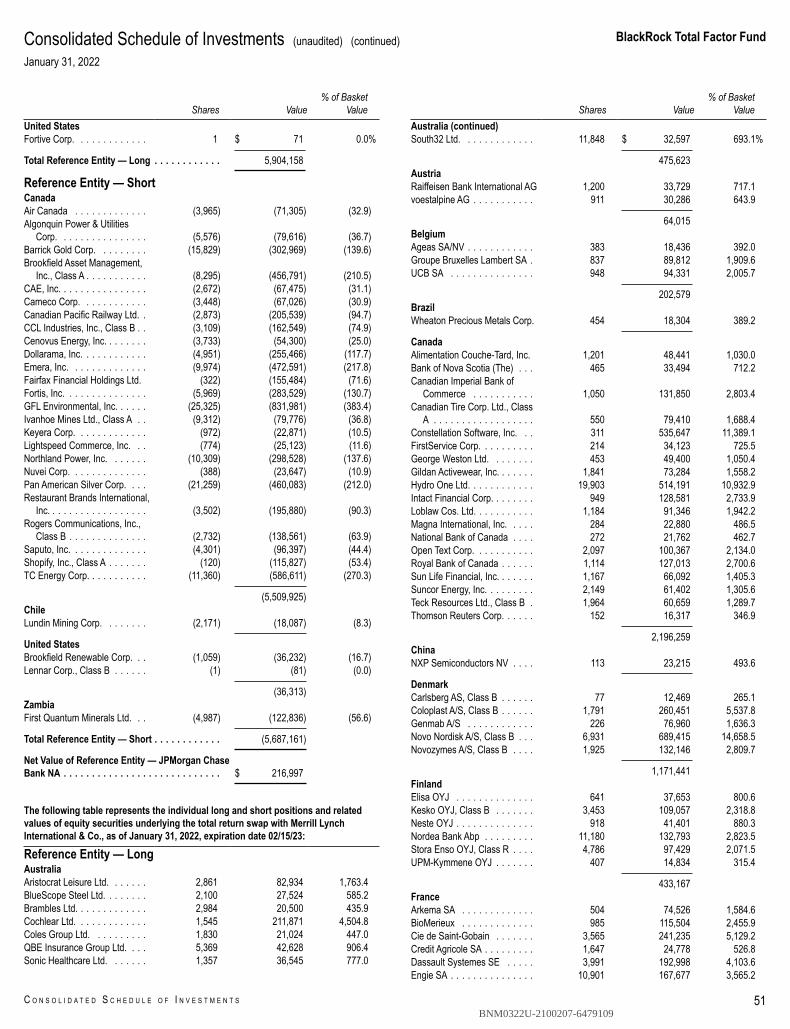
BlackRock Total Factor Fund
C O N S O L I D A T E D S C H E D U L E O F I N V E S T M E N T S 51
Consolidated Schedule of Investments (unaudited) (continued)January 31, 2022
Shares Value% of Basket
ValueUnited StatesFortive Corp. . . . . . . . . . . . . 1 $ 71 0.0%
Total Reference Entity — Long . . . . . . . . . . . . 5,904,158
Reference Entity — ShortCanadaAir Canada . . . . . . . . . . . . . (3,965) (71,305) (32.9)Algonquin Power & Utilities
Corp. . . . . . . . . . . . . . . . (5,576) (79,616) (36.7)Barrick Gold Corp. . . . . . . . . (15,829) (302,969) (139.6)Brookfield Asset Management,
Inc., Class A . . . . . . . . . . . (8,295) (456,791) (210.5)CAE, Inc. . . . . . . . . . . . . . . . (2,672) (67,475) (31.1)Cameco Corp. . . . . . . . . . . . (3,448) (67,026) (30.9)Canadian Pacific Railway Ltd. . (2,873) (205,539) (94.7)CCL Industries, Inc., Class B . . (3,109) (162,549) (74.9)Cenovus Energy, Inc. . . . . . . . (3,733) (54,300) (25.0)Dollarama, Inc. . . . . . . . . . . . (4,951) (255,466) (117.7)Emera, Inc. . . . . . . . . . . . . . (9,974) (472,591) (217.8)Fairfax Financial Holdings Ltd. (322) (155,484) (71.6)Fortis, Inc. . . . . . . . . . . . . . . (5,969) (283,529) (130.7)GFL Environmental, Inc. . . . . . (25,325) (831,981) (383.4)Ivanhoe Mines Ltd., Class A . . (9,312) (79,776) (36.8)Keyera Corp. . . . . . . . . . . . . (972) (22,871) (10.5)Lightspeed Commerce, Inc. . . (774) (25,123) (11.6)Northland Power, Inc. . . . . . . (10,309) (298,528) (137.6)Nuvei Corp. . . . . . . . . . . . . . (388) (23,647) (10.9)Pan American Silver Corp. . . . (21,259) (460,083) (212.0)Restaurant Brands International,
Inc. . . . . . . . . . . . . . . . . . (3,502) (195,880) (90.3)Rogers Communications, Inc.,
Class B . . . . . . . . . . . . . . (2,732) (138,561) (63.9)Saputo, Inc. . . . . . . . . . . . . . (4,301) (96,397) (44.4)Shopify, Inc., Class A . . . . . . . (120) (115,827) (53.4)TC Energy Corp. . . . . . . . . . . (11,360) (586,611) (270.3)
(5,509,925)ChileLundin Mining Corp. . . . . . . . (2,171) (18,087) (8.3)
United StatesBrookfield Renewable Corp. . . (1,059) (36,232) (16.7)Lennar Corp., Class B . . . . . . (1) (81) (0.0)
(36,313)ZambiaFirst Quantum Minerals Ltd. . . (4,987) (122,836) (56.6)
Total Reference Entity — Short . . . . . . . . . . . . (5,687,161)
Net Value of Reference Entity — JPMorgan ChaseBank NA . . . . . . . . . . . . . . . . . . . . . . . . . . . . $ 216,997
The following table represents the individual long and short positions and relatedvalues of equity securities underlying the total return swap with Merrill LynchInternational & Co., as of January 31, 2022, expiration date 02/15/23:
Reference Entity — LongAustraliaAristocrat Leisure Ltd. . . . . . . 2,861 82,934 1,763.4BlueScope Steel Ltd. . . . . . . . 2,100 27,524 585.2Brambles Ltd. . . . . . . . . . . . . 2,984 20,500 435.9Cochlear Ltd. . . . . . . . . . . . . 1,545 211,871 4,504.8Coles Group Ltd. . . . . . . . . . 1,830 21,024 447.0QBE Insurance Group Ltd. . . . 5,369 42,628 906.4Sonic Healthcare Ltd. . . . . . . 1,357 36,545 777.0
Shares Value% of Basket
ValueAustralia (continued)South32 Ltd. . . . . . . . . . . . . 11,848 $ 32,597 693.1%
475,623AustriaRaiffeisen Bank International AG 1,200 33,729 717.1voestalpine AG . . . . . . . . . . . 911 30,286 643.9
64,015BelgiumAgeas SA/NV . . . . . . . . . . . . 383 18,436 392.0Groupe Bruxelles Lambert SA . 837 89,812 1,909.6UCB SA . . . . . . . . . . . . . . . 948 94,331 2,005.7
202,579BrazilWheaton Precious Metals Corp. 454 18,304 389.2
CanadaAlimentation Couche-Tard, Inc. 1,201 48,441 1,030.0Bank of Nova Scotia (The) . . . 465 33,494 712.2Canadian Imperial Bank of
Commerce . . . . . . . . . . . 1,050 131,850 2,803.4Canadian Tire Corp. Ltd., Class
A . . . . . . . . . . . . . . . . . . 550 79,410 1,688.4Constellation Software, Inc. . . 311 535,647 11,389.1FirstService Corp. . . . . . . . . . 214 34,123 725.5George Weston Ltd. . . . . . . . 453 49,400 1,050.4Gildan Activewear, Inc. . . . . . . 1,841 73,284 1,558.2Hydro One Ltd. . . . . . . . . . . . 19,903 514,191 10,932.9Intact Financial Corp. . . . . . . . 949 128,581 2,733.9Loblaw Cos. Ltd. . . . . . . . . . . 1,184 91,346 1,942.2Magna International, Inc. . . . . 284 22,880 486.5National Bank of Canada . . . . 272 21,762 462.7Open Text Corp. . . . . . . . . . . 2,097 100,367 2,134.0Royal Bank of Canada . . . . . . 1,114 127,013 2,700.6Sun Life Financial, Inc. . . . . . . 1,167 66,092 1,405.3Suncor Energy, Inc. . . . . . . . . 2,149 61,402 1,305.6Teck Resources Ltd., Class B . 1,964 60,659 1,289.7Thomson Reuters Corp. . . . . . 152 16,317 346.9
2,196,259ChinaNXP Semiconductors NV . . . . 113 23,215 493.6
DenmarkCarlsberg AS, Class B . . . . . . 77 12,469 265.1Coloplast A/S, Class B . . . . . . 1,791 260,451 5,537.8Genmab A/S . . . . . . . . . . . . 226 76,960 1,636.3Novo Nordisk A/S, Class B . . . 6,931 689,415 14,658.5Novozymes A/S, Class B . . . . 1,925 132,146 2,809.7
1,171,441FinlandElisa OYJ . . . . . . . . . . . . . . 641 37,653 800.6Kesko OYJ, Class B . . . . . . . 3,453 109,057 2,318.8Neste OYJ . . . . . . . . . . . . . . 918 41,401 880.3Nordea Bank Abp . . . . . . . . . 11,180 132,793 2,823.5Stora Enso OYJ, Class R . . . . 4,786 97,429 2,071.5UPM-Kymmene OYJ . . . . . . . 407 14,834 315.4
433,167FranceArkema SA . . . . . . . . . . . . . 504 74,526 1,584.6BioMerieux . . . . . . . . . . . . . 985 115,504 2,455.9Cie de Saint-Gobain . . . . . . . 3,565 241,235 5,129.2Credit Agricole SA . . . . . . . . . 1,647 24,778 526.8Dassault Systemes SE . . . . . 3,991 192,998 4,103.6Engie SA . . . . . . . . . . . . . . . 10,901 167,677 3,565.2
BNM0322U-2100207-6479109
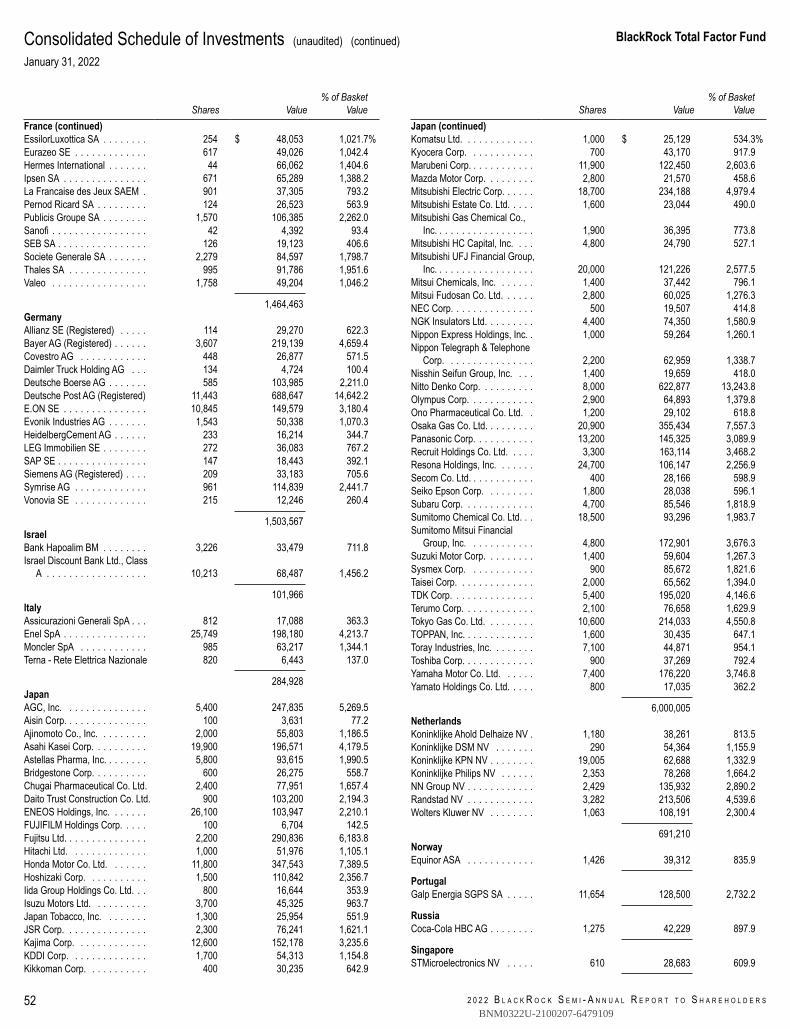
2 0 2 2 B L A C K R O C K S E M I - A N N U A L R E P O R T T O S H A R E H O L D E R S
BlackRock Total Factor Fund
52
Consolidated Schedule of Investments (unaudited) (continued)January 31, 2022
Shares Value% of Basket
ValueFrance (continued)EssilorLuxottica SA . . . . . . . . 254 $ 48,053 1,021.7%Eurazeo SE . . . . . . . . . . . . . 617 49,026 1,042.4Hermes International . . . . . . . 44 66,062 1,404.6Ipsen SA . . . . . . . . . . . . . . . 671 65,289 1,388.2La Francaise des Jeux SAEM . 901 37,305 793.2Pernod Ricard SA . . . . . . . . . 124 26,523 563.9Publicis Groupe SA . . . . . . . . 1,570 106,385 2,262.0Sanofi . . . . . . . . . . . . . . . . . 42 4,392 93.4SEB SA . . . . . . . . . . . . . . . . 126 19,123 406.6Societe Generale SA . . . . . . . 2,279 84,597 1,798.7Thales SA . . . . . . . . . . . . . . 995 91,786 1,951.6Valeo . . . . . . . . . . . . . . . . . 1,758 49,204 1,046.2
1,464,463GermanyAllianz SE (Registered) . . . . . 114 29,270 622.3Bayer AG (Registered) . . . . . . 3,607 219,139 4,659.4Covestro AG . . . . . . . . . . . . 448 26,877 571.5Daimler Truck Holding AG . . . 134 4,724 100.4Deutsche Boerse AG . . . . . . . 585 103,985 2,211.0Deutsche Post AG (Registered) 11,443 688,647 14,642.2E.ON SE . . . . . . . . . . . . . . . 10,845 149,579 3,180.4Evonik Industries AG . . . . . . . 1,543 50,338 1,070.3HeidelbergCement AG . . . . . . 233 16,214 344.7LEG Immobilien SE . . . . . . . . 272 36,083 767.2SAP SE . . . . . . . . . . . . . . . . 147 18,443 392.1Siemens AG (Registered) . . . . 209 33,183 705.6Symrise AG . . . . . . . . . . . . . 961 114,839 2,441.7Vonovia SE . . . . . . . . . . . . . 215 12,246 260.4
1,503,567IsraelBank Hapoalim BM . . . . . . . . 3,226 33,479 711.8Israel Discount Bank Ltd., Class
A . . . . . . . . . . . . . . . . . . 10,213 68,487 1,456.2
101,966ItalyAssicurazioni Generali SpA . . . 812 17,088 363.3Enel SpA . . . . . . . . . . . . . . . 25,749 198,180 4,213.7Moncler SpA . . . . . . . . . . . . 985 63,217 1,344.1Terna - Rete Elettrica Nazionale 820 6,443 137.0
284,928JapanAGC, Inc. . . . . . . . . . . . . . . 5,400 247,835 5,269.5Aisin Corp. . . . . . . . . . . . . . . 100 3,631 77.2Ajinomoto Co., Inc. . . . . . . . . 2,000 55,803 1,186.5Asahi Kasei Corp. . . . . . . . . . 19,900 196,571 4,179.5Astellas Pharma, Inc. . . . . . . . 5,800 93,615 1,990.5Bridgestone Corp. . . . . . . . . . 600 26,275 558.7Chugai Pharmaceutical Co. Ltd. 2,400 77,951 1,657.4Daito Trust Construction Co. Ltd. 900 103,200 2,194.3ENEOS Holdings, Inc. . . . . . . 26,100 103,947 2,210.1FUJIFILM Holdings Corp. . . . . 100 6,704 142.5Fujitsu Ltd. . . . . . . . . . . . . . . 2,200 290,836 6,183.8Hitachi Ltd. . . . . . . . . . . . . . 1,000 51,976 1,105.1Honda Motor Co. Ltd. . . . . . . 11,800 347,543 7,389.5Hoshizaki Corp. . . . . . . . . . . 1,500 110,842 2,356.7Iida Group Holdings Co. Ltd. . . 800 16,644 353.9Isuzu Motors Ltd. . . . . . . . . . 3,700 45,325 963.7Japan Tobacco, Inc. . . . . . . . 1,300 25,954 551.9JSR Corp. . . . . . . . . . . . . . . 2,300 76,241 1,621.1Kajima Corp. . . . . . . . . . . . . 12,600 152,178 3,235.6KDDI Corp. . . . . . . . . . . . . . 1,700 54,313 1,154.8Kikkoman Corp. . . . . . . . . . . 400 30,235 642.9
Shares Value% of Basket
ValueJapan (continued)Komatsu Ltd. . . . . . . . . . . . . 1,000 $ 25,129 534.3%Kyocera Corp. . . . . . . . . . . . 700 43,170 917.9Marubeni Corp. . . . . . . . . . . . 11,900 122,450 2,603.6Mazda Motor Corp. . . . . . . . . 2,800 21,570 458.6Mitsubishi Electric Corp. . . . . . 18,700 234,188 4,979.4Mitsubishi Estate Co. Ltd. . . . . 1,600 23,044 490.0Mitsubishi Gas Chemical Co.,
Inc. . . . . . . . . . . . . . . . . . 1,900 36,395 773.8Mitsubishi HC Capital, Inc. . . . 4,800 24,790 527.1Mitsubishi UFJ Financial Group,
Inc. . . . . . . . . . . . . . . . . . 20,000 121,226 2,577.5Mitsui Chemicals, Inc. . . . . . . 1,400 37,442 796.1Mitsui Fudosan Co. Ltd. . . . . . 2,800 60,025 1,276.3NEC Corp. . . . . . . . . . . . . . . 500 19,507 414.8NGK Insulators Ltd. . . . . . . . . 4,400 74,350 1,580.9Nippon Express Holdings, Inc. . 1,000 59,264 1,260.1Nippon Telegraph & Telephone
Corp. . . . . . . . . . . . . . . . 2,200 62,959 1,338.7Nisshin Seifun Group, Inc. . . . 1,400 19,659 418.0Nitto Denko Corp. . . . . . . . . . 8,000 622,877 13,243.8Olympus Corp. . . . . . . . . . . . 2,900 64,893 1,379.8Ono Pharmaceutical Co. Ltd. . 1,200 29,102 618.8Osaka Gas Co. Ltd. . . . . . . . . 20,900 355,434 7,557.3Panasonic Corp. . . . . . . . . . . 13,200 145,325 3,089.9Recruit Holdings Co. Ltd. . . . . 3,300 163,114 3,468.2Resona Holdings, Inc. . . . . . . 24,700 106,147 2,256.9Secom Co. Ltd. . . . . . . . . . . . 400 28,166 598.9Seiko Epson Corp. . . . . . . . . 1,800 28,038 596.1Subaru Corp. . . . . . . . . . . . . 4,700 85,546 1,818.9Sumitomo Chemical Co. Ltd. . . 18,500 93,296 1,983.7Sumitomo Mitsui Financial
Group, Inc. . . . . . . . . . . . 4,800 172,901 3,676.3Suzuki Motor Corp. . . . . . . . . 1,400 59,604 1,267.3Sysmex Corp. . . . . . . . . . . . 900 85,672 1,821.6Taisei Corp. . . . . . . . . . . . . . 2,000 65,562 1,394.0TDK Corp. . . . . . . . . . . . . . . 5,400 195,020 4,146.6Terumo Corp. . . . . . . . . . . . . 2,100 76,658 1,629.9Tokyo Gas Co. Ltd. . . . . . . . . 10,600 214,033 4,550.8TOPPAN, Inc. . . . . . . . . . . . . 1,600 30,435 647.1Toray Industries, Inc. . . . . . . . 7,100 44,871 954.1Toshiba Corp. . . . . . . . . . . . . 900 37,269 792.4Yamaha Motor Co. Ltd. . . . . . 7,400 176,220 3,746.8Yamato Holdings Co. Ltd. . . . . 800 17,035 362.2
6,000,005NetherlandsKoninklijke Ahold Delhaize NV . 1,180 38,261 813.5Koninklijke DSM NV . . . . . . . 290 54,364 1,155.9Koninklijke KPN NV . . . . . . . . 19,005 62,688 1,332.9Koninklijke Philips NV . . . . . . 2,353 78,268 1,664.2NN Group NV . . . . . . . . . . . . 2,429 135,932 2,890.2Randstad NV . . . . . . . . . . . . 3,282 213,506 4,539.6Wolters Kluwer NV . . . . . . . . 1,063 108,191 2,300.4
691,210NorwayEquinor ASA . . . . . . . . . . . . 1,426 39,312 835.9
PortugalGalp Energia SGPS SA . . . . . 11,654 128,500 2,732.2
RussiaCoca-Cola HBC AG . . . . . . . . 1,275 42,229 897.9
SingaporeSTMicroelectronics NV . . . . . 610 28,683 609.9
BNM0322U-2100207-6479109
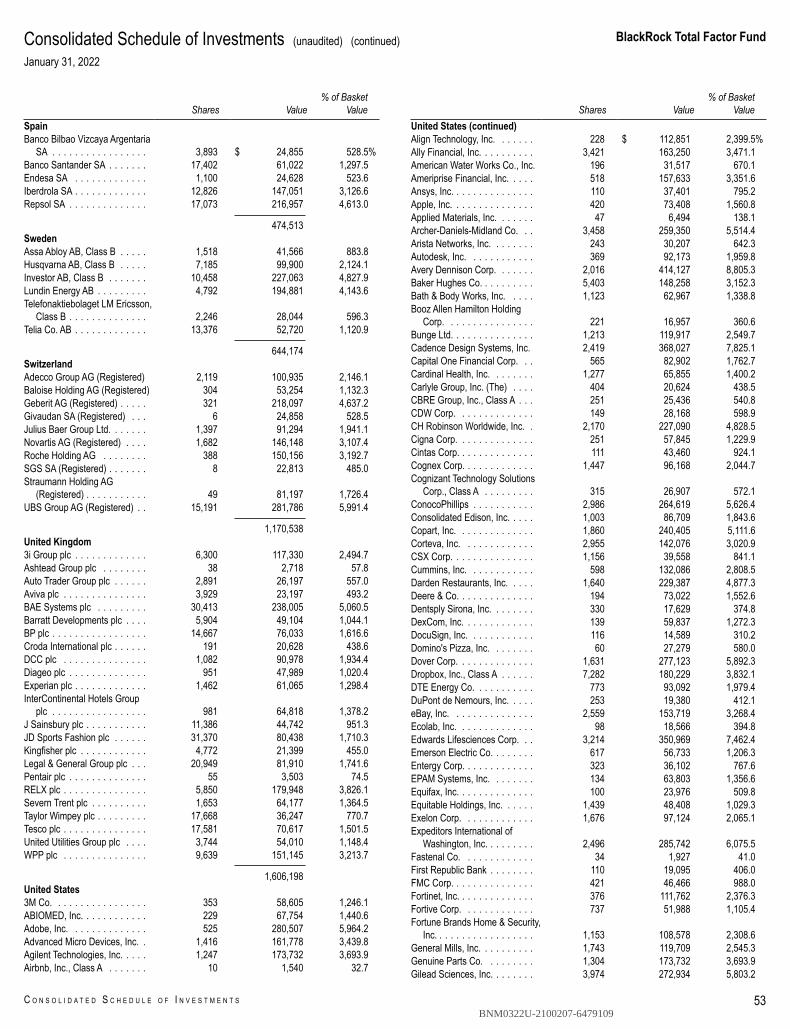
BlackRock Total Factor Fund
C O N S O L I D A T E D S C H E D U L E O F I N V E S T M E N T S 53
Consolidated Schedule of Investments (unaudited) (continued)January 31, 2022
Shares Value% of Basket
ValueSpainBanco Bilbao Vizcaya Argentaria
SA . . . . . . . . . . . . . . . . . 3,893 $ 24,855 528.5%Banco Santander SA . . . . . . . 17,402 61,022 1,297.5Endesa SA . . . . . . . . . . . . . 1,100 24,628 523.6Iberdrola SA . . . . . . . . . . . . . 12,826 147,051 3,126.6Repsol SA . . . . . . . . . . . . . . 17,073 216,957 4,613.0
474,513SwedenAssa Abloy AB, Class B . . . . . 1,518 41,566 883.8Husqvarna AB, Class B . . . . . 7,185 99,900 2,124.1Investor AB, Class B . . . . . . . 10,458 227,063 4,827.9Lundin Energy AB . . . . . . . . . 4,792 194,881 4,143.6Telefonaktiebolaget LM Ericsson,
Class B . . . . . . . . . . . . . . 2,246 28,044 596.3Telia Co. AB . . . . . . . . . . . . . 13,376 52,720 1,120.9
644,174SwitzerlandAdecco Group AG (Registered) 2,119 100,935 2,146.1Baloise Holding AG (Registered) 304 53,254 1,132.3Geberit AG (Registered) . . . . . 321 218,097 4,637.2Givaudan SA (Registered) . . . 6 24,858 528.5Julius Baer Group Ltd. . . . . . . 1,397 91,294 1,941.1Novartis AG (Registered) . . . . 1,682 146,148 3,107.4Roche Holding AG . . . . . . . . 388 150,156 3,192.7SGS SA (Registered) . . . . . . . 8 22,813 485.0Straumann Holding AG
(Registered) . . . . . . . . . . . 49 81,197 1,726.4UBS Group AG (Registered) . . 15,191 281,786 5,991.4
1,170,538United Kingdom3i Group plc . . . . . . . . . . . . . 6,300 117,330 2,494.7Ashtead Group plc . . . . . . . . 38 2,718 57.8Auto Trader Group plc . . . . . . 2,891 26,197 557.0Aviva plc . . . . . . . . . . . . . . . 3,929 23,197 493.2BAE Systems plc . . . . . . . . . 30,413 238,005 5,060.5Barratt Developments plc . . . . 5,904 49,104 1,044.1BP plc . . . . . . . . . . . . . . . . . 14,667 76,033 1,616.6Croda International plc . . . . . . 191 20,628 438.6DCC plc . . . . . . . . . . . . . . . 1,082 90,978 1,934.4Diageo plc . . . . . . . . . . . . . . 951 47,989 1,020.4Experian plc . . . . . . . . . . . . . 1,462 61,065 1,298.4InterContinental Hotels Group
plc . . . . . . . . . . . . . . . . . 981 64,818 1,378.2J Sainsbury plc . . . . . . . . . . . 11,386 44,742 951.3JD Sports Fashion plc . . . . . . 31,370 80,438 1,710.3Kingfisher plc . . . . . . . . . . . . 4,772 21,399 455.0Legal & General Group plc . . . 20,949 81,910 1,741.6Pentair plc . . . . . . . . . . . . . . 55 3,503 74.5RELX plc . . . . . . . . . . . . . . . 5,850 179,948 3,826.1Severn Trent plc . . . . . . . . . . 1,653 64,177 1,364.5Taylor Wimpey plc . . . . . . . . . 17,668 36,247 770.7Tesco plc . . . . . . . . . . . . . . . 17,581 70,617 1,501.5United Utilities Group plc . . . . 3,744 54,010 1,148.4WPP plc . . . . . . . . . . . . . . . 9,639 151,145 3,213.7
1,606,198United States3M Co. . . . . . . . . . . . . . . . . 353 58,605 1,246.1ABIOMED, Inc. . . . . . . . . . . . 229 67,754 1,440.6Adobe, Inc. . . . . . . . . . . . . . 525 280,507 5,964.2Advanced Micro Devices, Inc. . 1,416 161,778 3,439.8Agilent Technologies, Inc. . . . . 1,247 173,732 3,693.9Airbnb, Inc., Class A . . . . . . . 10 1,540 32.7
Shares Value% of Basket
ValueUnited States (continued)Align Technology, Inc. . . . . . . 228 $ 112,851 2,399.5%Ally Financial, Inc. . . . . . . . . . 3,421 163,250 3,471.1American Water Works Co., Inc. 196 31,517 670.1Ameriprise Financial, Inc. . . . . 518 157,633 3,351.6Ansys, Inc. . . . . . . . . . . . . . . 110 37,401 795.2Apple, Inc. . . . . . . . . . . . . . . 420 73,408 1,560.8Applied Materials, Inc. . . . . . . 47 6,494 138.1Archer-Daniels-Midland Co. . . 3,458 259,350 5,514.4Arista Networks, Inc. . . . . . . . 243 30,207 642.3Autodesk, Inc. . . . . . . . . . . . 369 92,173 1,959.8Avery Dennison Corp. . . . . . . 2,016 414,127 8,805.3Baker Hughes Co. . . . . . . . . . 5,403 148,258 3,152.3Bath & Body Works, Inc. . . . . 1,123 62,967 1,338.8Booz Allen Hamilton Holding
Corp. . . . . . . . . . . . . . . . 221 16,957 360.6Bunge Ltd. . . . . . . . . . . . . . . 1,213 119,917 2,549.7Cadence Design Systems, Inc. 2,419 368,027 7,825.1Capital One Financial Corp. . . 565 82,902 1,762.7Cardinal Health, Inc. . . . . . . . 1,277 65,855 1,400.2Carlyle Group, Inc. (The) . . . . 404 20,624 438.5CBRE Group, Inc., Class A . . . 251 25,436 540.8CDW Corp. . . . . . . . . . . . . . 149 28,168 598.9CH Robinson Worldwide, Inc. . 2,170 227,090 4,828.5Cigna Corp. . . . . . . . . . . . . . 251 57,845 1,229.9Cintas Corp. . . . . . . . . . . . . . 111 43,460 924.1Cognex Corp. . . . . . . . . . . . . 1,447 96,168 2,044.7Cognizant Technology Solutions
Corp., Class A . . . . . . . . . 315 26,907 572.1ConocoPhillips . . . . . . . . . . . 2,986 264,619 5,626.4Consolidated Edison, Inc. . . . . 1,003 86,709 1,843.6Copart, Inc. . . . . . . . . . . . . . 1,860 240,405 5,111.6Corteva, Inc. . . . . . . . . . . . . 2,955 142,076 3,020.9CSX Corp. . . . . . . . . . . . . . . 1,156 39,558 841.1Cummins, Inc. . . . . . . . . . . . 598 132,086 2,808.5Darden Restaurants, Inc. . . . . 1,640 229,387 4,877.3Deere & Co. . . . . . . . . . . . . . 194 73,022 1,552.6Dentsply Sirona, Inc. . . . . . . . 330 17,629 374.8DexCom, Inc. . . . . . . . . . . . . 139 59,837 1,272.3DocuSign, Inc. . . . . . . . . . . . 116 14,589 310.2Domino's Pizza, Inc. . . . . . . . 60 27,279 580.0Dover Corp. . . . . . . . . . . . . . 1,631 277,123 5,892.3Dropbox, Inc., Class A . . . . . . 7,282 180,229 3,832.1DTE Energy Co. . . . . . . . . . . 773 93,092 1,979.4DuPont de Nemours, Inc. . . . . 253 19,380 412.1eBay, Inc. . . . . . . . . . . . . . . 2,559 153,719 3,268.4Ecolab, Inc. . . . . . . . . . . . . . 98 18,566 394.8Edwards Lifesciences Corp. . . 3,214 350,969 7,462.4Emerson Electric Co. . . . . . . . 617 56,733 1,206.3Entergy Corp. . . . . . . . . . . . . 323 36,102 767.6EPAM Systems, Inc. . . . . . . . 134 63,803 1,356.6Equifax, Inc. . . . . . . . . . . . . . 100 23,976 509.8Equitable Holdings, Inc. . . . . . 1,439 48,408 1,029.3Exelon Corp. . . . . . . . . . . . . 1,676 97,124 2,065.1Expeditors International of
Washington, Inc. . . . . . . . . 2,496 285,742 6,075.5Fastenal Co. . . . . . . . . . . . . 34 1,927 41.0First Republic Bank . . . . . . . . 110 19,095 406.0FMC Corp. . . . . . . . . . . . . . . 421 46,466 988.0Fortinet, Inc. . . . . . . . . . . . . . 376 111,762 2,376.3Fortive Corp. . . . . . . . . . . . . 737 51,988 1,105.4Fortune Brands Home & Security,
Inc. . . . . . . . . . . . . . . . . . 1,153 108,578 2,308.6General Mills, Inc. . . . . . . . . . 1,743 119,709 2,545.3Genuine Parts Co. . . . . . . . . 1,304 173,732 3,693.9Gilead Sciences, Inc. . . . . . . . 3,974 272,934 5,803.2
BNM0322U-2100207-6479109
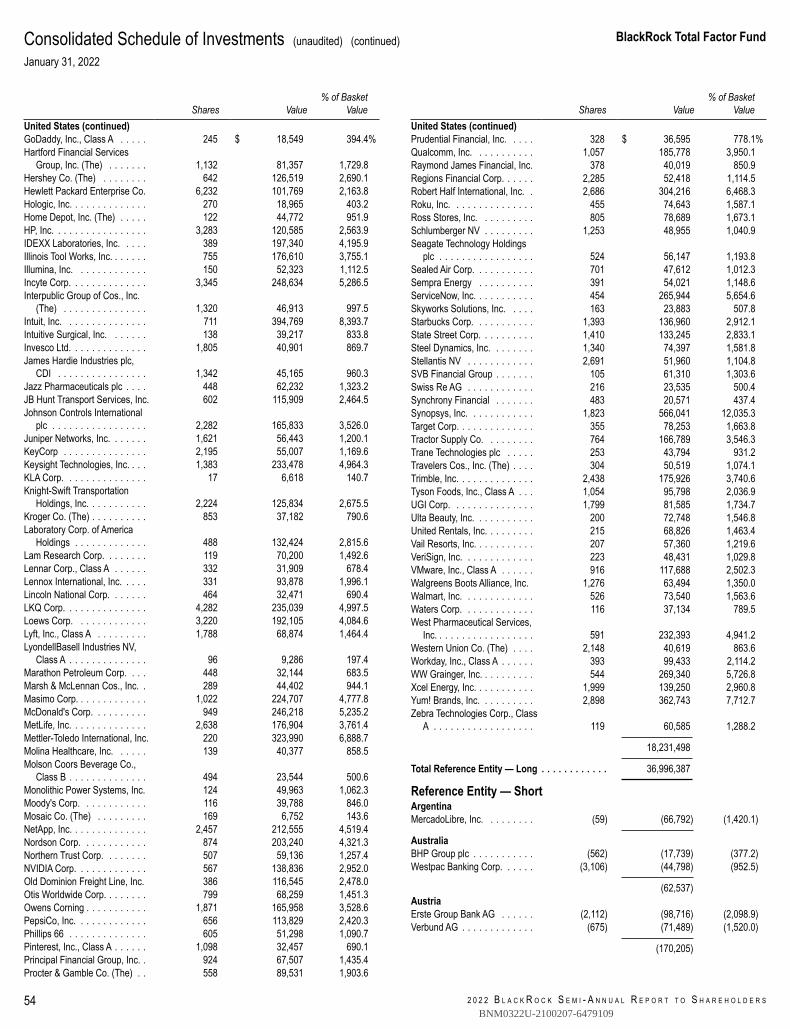
2 0 2 2 B L A C K R O C K S E M I - A N N U A L R E P O R T T O S H A R E H O L D E R S
BlackRock Total Factor Fund
54
Consolidated Schedule of Investments (unaudited) (continued)January 31, 2022
Shares Value% of Basket
ValueUnited States (continued)GoDaddy, Inc., Class A . . . . . 245 $ 18,549 394.4%Hartford Financial Services
Group, Inc. (The) . . . . . . . 1,132 81,357 1,729.8Hershey Co. (The) . . . . . . . . 642 126,519 2,690.1Hewlett Packard Enterprise Co. 6,232 101,769 2,163.8Hologic, Inc. . . . . . . . . . . . . . 270 18,965 403.2Home Depot, Inc. (The) . . . . . 122 44,772 951.9HP, Inc. . . . . . . . . . . . . . . . . 3,283 120,585 2,563.9IDEXX Laboratories, Inc. . . . . 389 197,340 4,195.9Illinois Tool Works, Inc. . . . . . . 755 176,610 3,755.1Illumina, Inc. . . . . . . . . . . . . 150 52,323 1,112.5Incyte Corp. . . . . . . . . . . . . . 3,345 248,634 5,286.5Interpublic Group of Cos., Inc.
(The) . . . . . . . . . . . . . . . 1,320 46,913 997.5Intuit, Inc. . . . . . . . . . . . . . . 711 394,769 8,393.7Intuitive Surgical, Inc. . . . . . . 138 39,217 833.8Invesco Ltd. . . . . . . . . . . . . . 1,805 40,901 869.7James Hardie Industries plc,
CDI . . . . . . . . . . . . . . . . 1,342 45,165 960.3Jazz Pharmaceuticals plc . . . . 448 62,232 1,323.2JB Hunt Transport Services, Inc. 602 115,909 2,464.5Johnson Controls International
plc . . . . . . . . . . . . . . . . . 2,282 165,833 3,526.0Juniper Networks, Inc. . . . . . . 1,621 56,443 1,200.1KeyCorp . . . . . . . . . . . . . . . 2,195 55,007 1,169.6Keysight Technologies, Inc. . . . 1,383 233,478 4,964.3KLA Corp. . . . . . . . . . . . . . . 17 6,618 140.7Knight-Swift Transportation
Holdings, Inc. . . . . . . . . . . 2,224 125,834 2,675.5Kroger Co. (The) . . . . . . . . . . 853 37,182 790.6Laboratory Corp. of America
Holdings . . . . . . . . . . . . . 488 132,424 2,815.6Lam Research Corp. . . . . . . . 119 70,200 1,492.6Lennar Corp., Class A . . . . . . 332 31,909 678.4Lennox International, Inc. . . . . 331 93,878 1,996.1Lincoln National Corp. . . . . . . 464 32,471 690.4LKQ Corp. . . . . . . . . . . . . . . 4,282 235,039 4,997.5Loews Corp. . . . . . . . . . . . . 3,220 192,105 4,084.6Lyft, Inc., Class A . . . . . . . . . 1,788 68,874 1,464.4LyondellBasell Industries NV,
Class A . . . . . . . . . . . . . . 96 9,286 197.4Marathon Petroleum Corp. . . . 448 32,144 683.5Marsh & McLennan Cos., Inc. . 289 44,402 944.1Masimo Corp. . . . . . . . . . . . . 1,022 224,707 4,777.8McDonald's Corp. . . . . . . . . . 949 246,218 5,235.2MetLife, Inc. . . . . . . . . . . . . . 2,638 176,904 3,761.4Mettler-Toledo International, Inc. 220 323,990 6,888.7Molina Healthcare, Inc. . . . . . 139 40,377 858.5Molson Coors Beverage Co.,
Class B . . . . . . . . . . . . . . 494 23,544 500.6Monolithic Power Systems, Inc. 124 49,963 1,062.3Moody's Corp. . . . . . . . . . . . 116 39,788 846.0Mosaic Co. (The) . . . . . . . . . 169 6,752 143.6NetApp, Inc. . . . . . . . . . . . . . 2,457 212,555 4,519.4Nordson Corp. . . . . . . . . . . . 874 203,240 4,321.3Northern Trust Corp. . . . . . . . 507 59,136 1,257.4NVIDIA Corp. . . . . . . . . . . . . 567 138,836 2,952.0Old Dominion Freight Line, Inc. 386 116,545 2,478.0Otis Worldwide Corp. . . . . . . . 799 68,259 1,451.3Owens Corning . . . . . . . . . . . 1,871 165,958 3,528.6PepsiCo, Inc. . . . . . . . . . . . . 656 113,829 2,420.3Phillips 66 . . . . . . . . . . . . . . 605 51,298 1,090.7Pinterest, Inc., Class A . . . . . . 1,098 32,457 690.1Principal Financial Group, Inc. . 924 67,507 1,435.4Procter & Gamble Co. (The) . . 558 89,531 1,903.6
Shares Value% of Basket
ValueUnited States (continued)Prudential Financial, Inc. . . . . 328 $ 36,595 778.1%Qualcomm, Inc. . . . . . . . . . . 1,057 185,778 3,950.1Raymond James Financial, Inc. 378 40,019 850.9Regions Financial Corp. . . . . . 2,285 52,418 1,114.5Robert Half International, Inc. . 2,686 304,216 6,468.3Roku, Inc. . . . . . . . . . . . . . . 455 74,643 1,587.1Ross Stores, Inc. . . . . . . . . . 805 78,689 1,673.1Schlumberger NV . . . . . . . . . 1,253 48,955 1,040.9Seagate Technology Holdings
plc . . . . . . . . . . . . . . . . . 524 56,147 1,193.8Sealed Air Corp. . . . . . . . . . . 701 47,612 1,012.3Sempra Energy . . . . . . . . . . 391 54,021 1,148.6ServiceNow, Inc. . . . . . . . . . . 454 265,944 5,654.6Skyworks Solutions, Inc. . . . . 163 23,883 507.8Starbucks Corp. . . . . . . . . . . 1,393 136,960 2,912.1State Street Corp. . . . . . . . . . 1,410 133,245 2,833.1Steel Dynamics, Inc. . . . . . . . 1,340 74,397 1,581.8Stellantis NV . . . . . . . . . . . . 2,691 51,960 1,104.8SVB Financial Group . . . . . . . 105 61,310 1,303.6Swiss Re AG . . . . . . . . . . . . 216 23,535 500.4Synchrony Financial . . . . . . . 483 20,571 437.4Synopsys, Inc. . . . . . . . . . . . 1,823 566,041 12,035.3Target Corp. . . . . . . . . . . . . . 355 78,253 1,663.8Tractor Supply Co. . . . . . . . . 764 166,789 3,546.3Trane Technologies plc . . . . . 253 43,794 931.2Travelers Cos., Inc. (The) . . . . 304 50,519 1,074.1Trimble, Inc. . . . . . . . . . . . . . 2,438 175,926 3,740.6Tyson Foods, Inc., Class A . . . 1,054 95,798 2,036.9UGI Corp. . . . . . . . . . . . . . . 1,799 81,585 1,734.7Ulta Beauty, Inc. . . . . . . . . . . 200 72,748 1,546.8United Rentals, Inc. . . . . . . . . 215 68,826 1,463.4Vail Resorts, Inc. . . . . . . . . . . 207 57,360 1,219.6VeriSign, Inc. . . . . . . . . . . . . 223 48,431 1,029.8VMware, Inc., Class A . . . . . . 916 117,688 2,502.3Walgreens Boots Alliance, Inc. 1,276 63,494 1,350.0Walmart, Inc. . . . . . . . . . . . . 526 73,540 1,563.6Waters Corp. . . . . . . . . . . . . 116 37,134 789.5West Pharmaceutical Services,
Inc. . . . . . . . . . . . . . . . . . 591 232,393 4,941.2Western Union Co. (The) . . . . 2,148 40,619 863.6Workday, Inc., Class A . . . . . . 393 99,433 2,114.2WW Grainger, Inc. . . . . . . . . . 544 269,340 5,726.8Xcel Energy, Inc. . . . . . . . . . . 1,999 139,250 2,960.8Yum! Brands, Inc. . . . . . . . . . 2,898 362,743 7,712.7Zebra Technologies Corp., Class
A . . . . . . . . . . . . . . . . . . 119 60,585 1,288.2
18,231,498
Total Reference Entity — Long . . . . . . . . . . . . 36,996,387
Reference Entity — ShortArgentinaMercadoLibre, Inc. . . . . . . . . (59) (66,792) (1,420.1)
AustraliaBHP Group plc . . . . . . . . . . . (562) (17,739) (377.2)Westpac Banking Corp. . . . . . (3,106) (44,798) (952.5)
(62,537)AustriaErste Group Bank AG . . . . . . (2,112) (98,716) (2,098.9)Verbund AG . . . . . . . . . . . . . (675) (71,489) (1,520.0)
(170,205)
BNM0322U-2100207-6479109
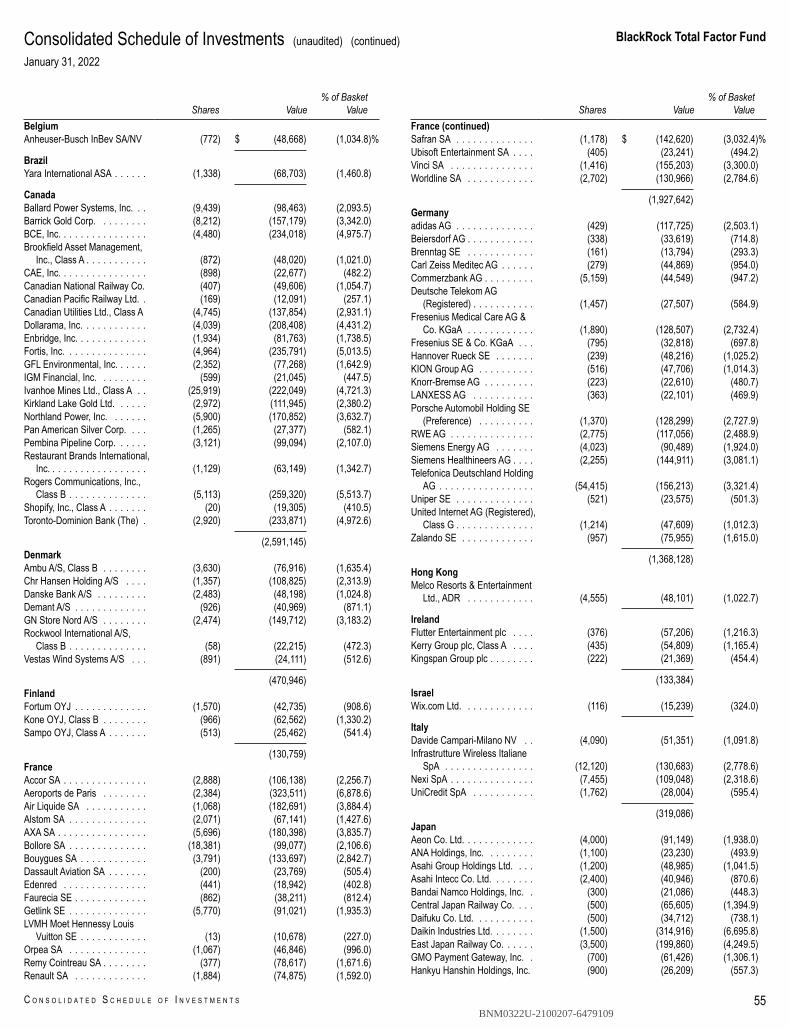
BlackRock Total Factor Fund
C O N S O L I D A T E D S C H E D U L E O F I N V E S T M E N T S 55
Consolidated Schedule of Investments (unaudited) (continued)January 31, 2022
Shares Value% of Basket
ValueBelgiumAnheuser-Busch InBev SA/NV (772) $ (48,668) (1,034.8)%
BrazilYara International ASA . . . . . . (1,338) (68,703) (1,460.8)
CanadaBallard Power Systems, Inc. . . (9,439) (98,463) (2,093.5)Barrick Gold Corp. . . . . . . . . (8,212) (157,179) (3,342.0)BCE, Inc. . . . . . . . . . . . . . . . (4,480) (234,018) (4,975.7)Brookfield Asset Management,
Inc., Class A . . . . . . . . . . . (872) (48,020) (1,021.0)CAE, Inc. . . . . . . . . . . . . . . . (898) (22,677) (482.2)Canadian National Railway Co. (407) (49,606) (1,054.7)Canadian Pacific Railway Ltd. . (169) (12,091) (257.1)Canadian Utilities Ltd., Class A (4,745) (137,854) (2,931.1)Dollarama, Inc. . . . . . . . . . . . (4,039) (208,408) (4,431.2)Enbridge, Inc. . . . . . . . . . . . . (1,934) (81,763) (1,738.5)Fortis, Inc. . . . . . . . . . . . . . . (4,964) (235,791) (5,013.5)GFL Environmental, Inc. . . . . . (2,352) (77,268) (1,642.9)IGM Financial, Inc. . . . . . . . . (599) (21,045) (447.5)Ivanhoe Mines Ltd., Class A . . (25,919) (222,049) (4,721.3)Kirkland Lake Gold Ltd. . . . . . (2,972) (111,945) (2,380.2)Northland Power, Inc. . . . . . . (5,900) (170,852) (3,632.7)Pan American Silver Corp. . . . (1,265) (27,377) (582.1)Pembina Pipeline Corp. . . . . . (3,121) (99,094) (2,107.0)Restaurant Brands International,
Inc. . . . . . . . . . . . . . . . . . (1,129) (63,149) (1,342.7)Rogers Communications, Inc.,
Class B . . . . . . . . . . . . . . (5,113) (259,320) (5,513.7)Shopify, Inc., Class A . . . . . . . (20) (19,305) (410.5)Toronto-Dominion Bank (The) . (2,920) (233,871) (4,972.6)
(2,591,145)DenmarkAmbu A/S, Class B . . . . . . . . (3,630) (76,916) (1,635.4)Chr Hansen Holding A/S . . . . (1,357) (108,825) (2,313.9)Danske Bank A/S . . . . . . . . . (2,483) (48,198) (1,024.8)Demant A/S . . . . . . . . . . . . . (926) (40,969) (871.1)GN Store Nord A/S . . . . . . . . (2,474) (149,712) (3,183.2)Rockwool International A/S,
Class B . . . . . . . . . . . . . . (58) (22,215) (472.3)Vestas Wind Systems A/S . . . (891) (24,111) (512.6)
(470,946)FinlandFortum OYJ . . . . . . . . . . . . . (1,570) (42,735) (908.6)Kone OYJ, Class B . . . . . . . . (966) (62,562) (1,330.2)Sampo OYJ, Class A . . . . . . . (513) (25,462) (541.4)
(130,759)FranceAccor SA . . . . . . . . . . . . . . . (2,888) (106,138) (2,256.7)Aeroports de Paris . . . . . . . . (2,384) (323,511) (6,878.6)Air Liquide SA . . . . . . . . . . . (1,068) (182,691) (3,884.4)Alstom SA . . . . . . . . . . . . . . (2,071) (67,141) (1,427.6)AXA SA . . . . . . . . . . . . . . . . (5,696) (180,398) (3,835.7)Bollore SA . . . . . . . . . . . . . . (18,381) (99,077) (2,106.6)Bouygues SA . . . . . . . . . . . . (3,791) (133,697) (2,842.7)Dassault Aviation SA . . . . . . . (200) (23,769) (505.4)Edenred . . . . . . . . . . . . . . . (441) (18,942) (402.8)Faurecia SE . . . . . . . . . . . . . (862) (38,211) (812.4)Getlink SE . . . . . . . . . . . . . . (5,770) (91,021) (1,935.3)LVMH Moet Hennessy Louis
Vuitton SE . . . . . . . . . . . . (13) (10,678) (227.0)Orpea SA . . . . . . . . . . . . . . (1,067) (46,846) (996.0)Remy Cointreau SA . . . . . . . . (377) (78,617) (1,671.6)Renault SA . . . . . . . . . . . . . (1,884) (74,875) (1,592.0)
Shares Value% of Basket
ValueFrance (continued)Safran SA . . . . . . . . . . . . . . (1,178) $ (142,620) (3,032.4)%Ubisoft Entertainment SA . . . . (405) (23,241) (494.2)Vinci SA . . . . . . . . . . . . . . . (1,416) (155,203) (3,300.0)Worldline SA . . . . . . . . . . . . (2,702) (130,966) (2,784.6)
(1,927,642)Germanyadidas AG . . . . . . . . . . . . . . (429) (117,725) (2,503.1)Beiersdorf AG . . . . . . . . . . . . (338) (33,619) (714.8)Brenntag SE . . . . . . . . . . . . (161) (13,794) (293.3)Carl Zeiss Meditec AG . . . . . . (279) (44,869) (954.0)Commerzbank AG . . . . . . . . . (5,159) (44,549) (947.2)Deutsche Telekom AG
(Registered) . . . . . . . . . . . (1,457) (27,507) (584.9)Fresenius Medical Care AG &
Co. KGaA . . . . . . . . . . . . (1,890) (128,507) (2,732.4)Fresenius SE & Co. KGaA . . . (795) (32,818) (697.8)Hannover Rueck SE . . . . . . . (239) (48,216) (1,025.2)KION Group AG . . . . . . . . . . (516) (47,706) (1,014.3)Knorr-Bremse AG . . . . . . . . . (223) (22,610) (480.7)LANXESS AG . . . . . . . . . . . (363) (22,101) (469.9)Porsche Automobil Holding SE
(Preference) . . . . . . . . . . (1,370) (128,299) (2,727.9)RWE AG . . . . . . . . . . . . . . . (2,775) (117,056) (2,488.9)Siemens Energy AG . . . . . . . (4,023) (90,489) (1,924.0)Siemens Healthineers AG . . . . (2,255) (144,911) (3,081.1)Telefonica Deutschland Holding
AG . . . . . . . . . . . . . . . . . (54,415) (156,213) (3,321.4)Uniper SE . . . . . . . . . . . . . . (521) (23,575) (501.3)United Internet AG (Registered),
Class G . . . . . . . . . . . . . . (1,214) (47,609) (1,012.3)Zalando SE . . . . . . . . . . . . . (957) (75,955) (1,615.0)
(1,368,128)Hong KongMelco Resorts & Entertainment
Ltd., ADR . . . . . . . . . . . . (4,555) (48,101) (1,022.7)
IrelandFlutter Entertainment plc . . . . (376) (57,206) (1,216.3)Kerry Group plc, Class A . . . . (435) (54,809) (1,165.4)Kingspan Group plc . . . . . . . . (222) (21,369) (454.4)
(133,384)IsraelWix.com Ltd. . . . . . . . . . . . . (116) (15,239) (324.0)
ItalyDavide Campari-Milano NV . . (4,090) (51,351) (1,091.8)Infrastrutture Wireless Italiane
SpA . . . . . . . . . . . . . . . . (12,120) (130,683) (2,778.6)Nexi SpA . . . . . . . . . . . . . . . (7,455) (109,048) (2,318.6)UniCredit SpA . . . . . . . . . . . (1,762) (28,004) (595.4)
(319,086)JapanAeon Co. Ltd. . . . . . . . . . . . . (4,000) (91,149) (1,938.0)ANA Holdings, Inc. . . . . . . . . (1,100) (23,230) (493.9)Asahi Group Holdings Ltd. . . . (1,200) (48,985) (1,041.5)Asahi Intecc Co. Ltd. . . . . . . . (2,400) (40,946) (870.6)Bandai Namco Holdings, Inc. . (300) (21,086) (448.3)Central Japan Railway Co. . . . (500) (65,605) (1,394.9)Daifuku Co. Ltd. . . . . . . . . . . (500) (34,712) (738.1)Daikin Industries Ltd. . . . . . . . (1,500) (314,916) (6,695.8)East Japan Railway Co. . . . . . (3,500) (199,860) (4,249.5)GMO Payment Gateway, Inc. . (700) (61,426) (1,306.1)Hankyu Hanshin Holdings, Inc. (900) (26,209) (557.3)
BNM0322U-2100207-6479109
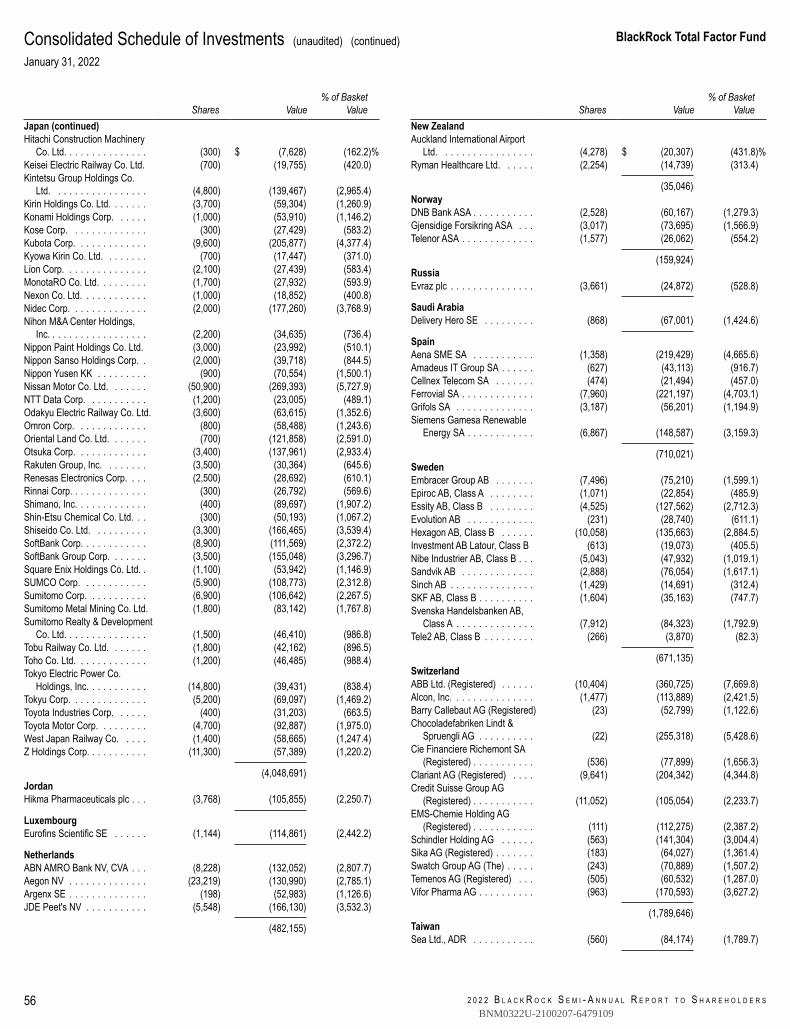
2 0 2 2 B L A C K R O C K S E M I - A N N U A L R E P O R T T O S H A R E H O L D E R S
BlackRock Total Factor Fund
56
Consolidated Schedule of Investments (unaudited) (continued)January 31, 2022
Shares Value% of Basket
ValueJapan (continued)Hitachi Construction Machinery
Co. Ltd. . . . . . . . . . . . . . . (300) $ (7,628) (162.2)%Keisei Electric Railway Co. Ltd. (700) (19,755) (420.0)Kintetsu Group Holdings Co.
Ltd. . . . . . . . . . . . . . . . . (4,800) (139,467) (2,965.4)Kirin Holdings Co. Ltd. . . . . . . (3,700) (59,304) (1,260.9)Konami Holdings Corp. . . . . . (1,000) (53,910) (1,146.2)Kose Corp. . . . . . . . . . . . . . (300) (27,429) (583.2)Kubota Corp. . . . . . . . . . . . . (9,600) (205,877) (4,377.4)Kyowa Kirin Co. Ltd. . . . . . . . (700) (17,447) (371.0)Lion Corp. . . . . . . . . . . . . . . (2,100) (27,439) (583.4)MonotaRO Co. Ltd. . . . . . . . . (1,700) (27,932) (593.9)Nexon Co. Ltd. . . . . . . . . . . . (1,000) (18,852) (400.8)Nidec Corp. . . . . . . . . . . . . . (2,000) (177,260) (3,768.9)Nihon M&A Center Holdings,
Inc. . . . . . . . . . . . . . . . . . (2,200) (34,635) (736.4)Nippon Paint Holdings Co. Ltd. (3,000) (23,992) (510.1)Nippon Sanso Holdings Corp. . (2,000) (39,718) (844.5)Nippon Yusen KK . . . . . . . . . (900) (70,554) (1,500.1)Nissan Motor Co. Ltd. . . . . . . (50,900) (269,393) (5,727.9)NTT Data Corp. . . . . . . . . . . (1,200) (23,005) (489.1)Odakyu Electric Railway Co. Ltd. (3,600) (63,615) (1,352.6)Omron Corp. . . . . . . . . . . . . (800) (58,488) (1,243.6)Oriental Land Co. Ltd. . . . . . . (700) (121,858) (2,591.0)Otsuka Corp. . . . . . . . . . . . . (3,400) (137,961) (2,933.4)Rakuten Group, Inc. . . . . . . . (3,500) (30,364) (645.6)Renesas Electronics Corp. . . . (2,500) (28,692) (610.1)Rinnai Corp. . . . . . . . . . . . . . (300) (26,792) (569.6)Shimano, Inc. . . . . . . . . . . . . (400) (89,697) (1,907.2)Shin-Etsu Chemical Co. Ltd. . . (300) (50,193) (1,067.2)Shiseido Co. Ltd. . . . . . . . . . (3,300) (166,465) (3,539.4)SoftBank Corp. . . . . . . . . . . . (8,900) (111,569) (2,372.2)SoftBank Group Corp. . . . . . . (3,500) (155,048) (3,296.7)Square Enix Holdings Co. Ltd. . (1,100) (53,942) (1,146.9)SUMCO Corp. . . . . . . . . . . . (5,900) (108,773) (2,312.8)Sumitomo Corp. . . . . . . . . . . (6,900) (106,642) (2,267.5)Sumitomo Metal Mining Co. Ltd. (1,800) (83,142) (1,767.8)Sumitomo Realty & Development
Co. Ltd. . . . . . . . . . . . . . . (1,500) (46,410) (986.8)Tobu Railway Co. Ltd. . . . . . . (1,800) (42,162) (896.5)Toho Co. Ltd. . . . . . . . . . . . . (1,200) (46,485) (988.4)Tokyo Electric Power Co.
Holdings, Inc. . . . . . . . . . . (14,800) (39,431) (838.4)Tokyu Corp. . . . . . . . . . . . . . (5,200) (69,097) (1,469.2)Toyota Industries Corp. . . . . . (400) (31,203) (663.5)Toyota Motor Corp. . . . . . . . . (4,700) (92,887) (1,975.0)West Japan Railway Co. . . . . (1,400) (58,665) (1,247.4)Z Holdings Corp. . . . . . . . . . . (11,300) (57,389) (1,220.2)
(4,048,691)JordanHikma Pharmaceuticals plc . . . (3,768) (105,855) (2,250.7)
LuxembourgEurofins Scientific SE . . . . . . (1,144) (114,861) (2,442.2)
NetherlandsABN AMRO Bank NV, CVA . . . (8,228) (132,052) (2,807.7)Aegon NV . . . . . . . . . . . . . . (23,219) (130,990) (2,785.1)Argenx SE . . . . . . . . . . . . . . (198) (52,983) (1,126.6)JDE Peet's NV . . . . . . . . . . . (5,548) (166,130) (3,532.3)
(482,155)
Shares Value% of Basket
ValueNew ZealandAuckland International Airport
Ltd. . . . . . . . . . . . . . . . . (4,278) $ (20,307) (431.8)%Ryman Healthcare Ltd. . . . . . (2,254) (14,739) (313.4)
(35,046)NorwayDNB Bank ASA . . . . . . . . . . . (2,528) (60,167) (1,279.3)Gjensidige Forsikring ASA . . . (3,017) (73,695) (1,566.9)Telenor ASA . . . . . . . . . . . . . (1,577) (26,062) (554.2)
(159,924)RussiaEvraz plc . . . . . . . . . . . . . . . (3,661) (24,872) (528.8)
Saudi ArabiaDelivery Hero SE . . . . . . . . . (868) (67,001) (1,424.6)
SpainAena SME SA . . . . . . . . . . . (1,358) (219,429) (4,665.6)Amadeus IT Group SA . . . . . . (627) (43,113) (916.7)Cellnex Telecom SA . . . . . . . (474) (21,494) (457.0)Ferrovial SA . . . . . . . . . . . . . (7,960) (221,197) (4,703.1)Grifols SA . . . . . . . . . . . . . . (3,187) (56,201) (1,194.9)Siemens Gamesa Renewable
Energy SA . . . . . . . . . . . . (6,867) (148,587) (3,159.3)
(710,021)SwedenEmbracer Group AB . . . . . . . (7,496) (75,210) (1,599.1)Epiroc AB, Class A . . . . . . . . (1,071) (22,854) (485.9)Essity AB, Class B . . . . . . . . (4,525) (127,562) (2,712.3)Evolution AB . . . . . . . . . . . . (231) (28,740) (611.1)Hexagon AB, Class B . . . . . . (10,058) (135,663) (2,884.5)Investment AB Latour, Class B (613) (19,073) (405.5)Nibe Industrier AB, Class B . . . (5,043) (47,932) (1,019.1)Sandvik AB . . . . . . . . . . . . . (2,888) (76,054) (1,617.1)Sinch AB . . . . . . . . . . . . . . . (1,429) (14,691) (312.4)SKF AB, Class B . . . . . . . . . . (1,604) (35,163) (747.7)Svenska Handelsbanken AB,
Class A . . . . . . . . . . . . . . (7,912) (84,323) (1,792.9)Tele2 AB, Class B . . . . . . . . . (266) (3,870) (82.3)
(671,135)SwitzerlandABB Ltd. (Registered) . . . . . . (10,404) (360,725) (7,669.8)Alcon, Inc. . . . . . . . . . . . . . . (1,477) (113,889) (2,421.5)Barry Callebaut AG (Registered) (23) (52,799) (1,122.6)Chocoladefabriken Lindt &
Spruengli AG . . . . . . . . . . (22) (255,318) (5,428.6)Cie Financiere Richemont SA
(Registered) . . . . . . . . . . . (536) (77,899) (1,656.3)Clariant AG (Registered) . . . . (9,641) (204,342) (4,344.8)Credit Suisse Group AG
(Registered) . . . . . . . . . . . (11,052) (105,054) (2,233.7)EMS-Chemie Holding AG
(Registered) . . . . . . . . . . . (111) (112,275) (2,387.2)Schindler Holding AG . . . . . . (563) (141,304) (3,004.4)Sika AG (Registered) . . . . . . . (183) (64,027) (1,361.4)Swatch Group AG (The) . . . . . (243) (70,889) (1,507.2)Temenos AG (Registered) . . . (505) (60,532) (1,287.0)Vifor Pharma AG . . . . . . . . . . (963) (170,593) (3,627.2)
(1,789,646)TaiwanSea Ltd., ADR . . . . . . . . . . . (560) (84,174) (1,789.7)
BNM0322U-2100207-6479109
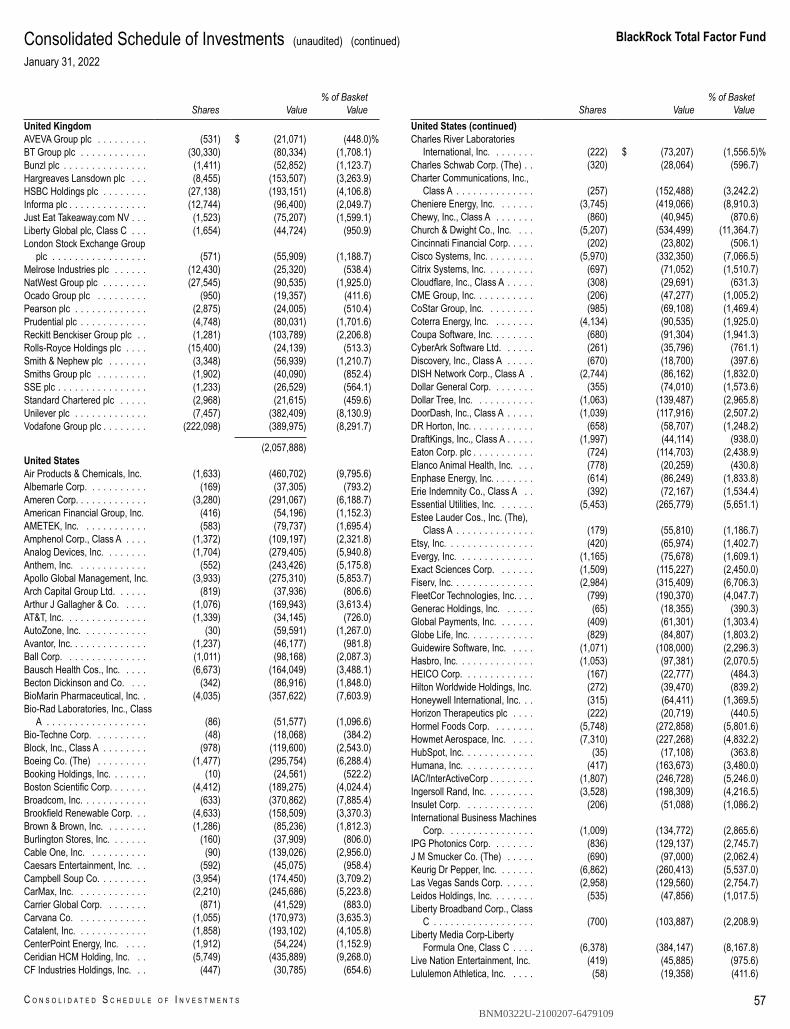
BlackRock Total Factor Fund
C O N S O L I D A T E D S C H E D U L E O F I N V E S T M E N T S 57
Consolidated Schedule of Investments (unaudited) (continued)January 31, 2022
Shares Value% of Basket
ValueUnited KingdomAVEVA Group plc . . . . . . . . . (531) $ (21,071) (448.0)%BT Group plc . . . . . . . . . . . . (30,330) (80,334) (1,708.1)Bunzl plc . . . . . . . . . . . . . . . (1,411) (52,852) (1,123.7)Hargreaves Lansdown plc . . . (8,455) (153,507) (3,263.9)HSBC Holdings plc . . . . . . . . (27,138) (193,151) (4,106.8)Informa plc . . . . . . . . . . . . . . (12,744) (96,400) (2,049.7)Just Eat Takeaway.com NV . . . (1,523) (75,207) (1,599.1)Liberty Global plc, Class C . . . (1,654) (44,724) (950.9)London Stock Exchange Group
plc . . . . . . . . . . . . . . . . . (571) (55,909) (1,188.7)Melrose Industries plc . . . . . . (12,430) (25,320) (538.4)NatWest Group plc . . . . . . . . (27,545) (90,535) (1,925.0)Ocado Group plc . . . . . . . . . (950) (19,357) (411.6)Pearson plc . . . . . . . . . . . . . (2,875) (24,005) (510.4)Prudential plc . . . . . . . . . . . . (4,748) (80,031) (1,701.6)Reckitt Benckiser Group plc . . (1,281) (103,789) (2,206.8)Rolls-Royce Holdings plc . . . . (15,400) (24,139) (513.3)Smith & Nephew plc . . . . . . . (3,348) (56,939) (1,210.7)Smiths Group plc . . . . . . . . . (1,902) (40,090) (852.4)SSE plc . . . . . . . . . . . . . . . . (1,233) (26,529) (564.1)Standard Chartered plc . . . . . (2,968) (21,615) (459.6)Unilever plc . . . . . . . . . . . . . (7,457) (382,409) (8,130.9)Vodafone Group plc . . . . . . . . (222,098) (389,975) (8,291.7)
(2,057,888)United StatesAir Products & Chemicals, Inc. (1,633) (460,702) (9,795.6)Albemarle Corp. . . . . . . . . . . (169) (37,305) (793.2)Ameren Corp. . . . . . . . . . . . . (3,280) (291,067) (6,188.7)American Financial Group, Inc. (416) (54,196) (1,152.3)AMETEK, Inc. . . . . . . . . . . . (583) (79,737) (1,695.4)Amphenol Corp., Class A . . . . (1,372) (109,197) (2,321.8)Analog Devices, Inc. . . . . . . . (1,704) (279,405) (5,940.8)Anthem, Inc. . . . . . . . . . . . . (552) (243,426) (5,175.8)Apollo Global Management, Inc. (3,933) (275,310) (5,853.7)Arch Capital Group Ltd. . . . . . (819) (37,936) (806.6)Arthur J Gallagher & Co. . . . . (1,076) (169,943) (3,613.4)AT&T, Inc. . . . . . . . . . . . . . . (1,339) (34,145) (726.0)AutoZone, Inc. . . . . . . . . . . . (30) (59,591) (1,267.0)Avantor, Inc. . . . . . . . . . . . . . (1,237) (46,177) (981.8)Ball Corp. . . . . . . . . . . . . . . (1,011) (98,168) (2,087.3)Bausch Health Cos., Inc. . . . . (6,673) (164,049) (3,488.1)Becton Dickinson and Co. . . . (342) (86,916) (1,848.0)BioMarin Pharmaceutical, Inc. . (4,035) (357,622) (7,603.9)Bio-Rad Laboratories, Inc., Class
A . . . . . . . . . . . . . . . . . . (86) (51,577) (1,096.6)Bio-Techne Corp. . . . . . . . . . (48) (18,068) (384.2)Block, Inc., Class A . . . . . . . . (978) (119,600) (2,543.0)Boeing Co. (The) . . . . . . . . . (1,477) (295,754) (6,288.4)Booking Holdings, Inc. . . . . . . (10) (24,561) (522.2)Boston Scientific Corp. . . . . . . (4,412) (189,275) (4,024.4)Broadcom, Inc. . . . . . . . . . . . (633) (370,862) (7,885.4)Brookfield Renewable Corp. . . (4,633) (158,509) (3,370.3)Brown & Brown, Inc. . . . . . . . (1,286) (85,236) (1,812.3)Burlington Stores, Inc. . . . . . . (160) (37,909) (806.0)Cable One, Inc. . . . . . . . . . . (90) (139,026) (2,956.0)Caesars Entertainment, Inc. . . (592) (45,075) (958.4)Campbell Soup Co. . . . . . . . . (3,954) (174,450) (3,709.2)CarMax, Inc. . . . . . . . . . . . . (2,210) (245,686) (5,223.8)Carrier Global Corp. . . . . . . . (871) (41,529) (883.0)Carvana Co. . . . . . . . . . . . . (1,055) (170,973) (3,635.3)Catalent, Inc. . . . . . . . . . . . . (1,858) (193,102) (4,105.8)CenterPoint Energy, Inc. . . . . (1,912) (54,224) (1,152.9)Ceridian HCM Holding, Inc. . . (5,749) (435,889) (9,268.0)CF Industries Holdings, Inc. . . (447) (30,785) (654.6)
Shares Value% of Basket
ValueUnited States (continued)Charles River Laboratories
International, Inc. . . . . . . . (222) $ (73,207) (1,556.5)%Charles Schwab Corp. (The) . . (320) (28,064) (596.7)Charter Communications, Inc.,
Class A . . . . . . . . . . . . . . (257) (152,488) (3,242.2)Cheniere Energy, Inc. . . . . . . (3,745) (419,066) (8,910.3)Chewy, Inc., Class A . . . . . . . (860) (40,945) (870.6)Church & Dwight Co., Inc. . . . (5,207) (534,499) (11,364.7)Cincinnati Financial Corp. . . . . (202) (23,802) (506.1)Cisco Systems, Inc. . . . . . . . . (5,970) (332,350) (7,066.5)Citrix Systems, Inc. . . . . . . . . (697) (71,052) (1,510.7)Cloudflare, Inc., Class A . . . . . (308) (29,691) (631.3)CME Group, Inc. . . . . . . . . . . (206) (47,277) (1,005.2)CoStar Group, Inc. . . . . . . . . (985) (69,108) (1,469.4)Coterra Energy, Inc. . . . . . . . (4,134) (90,535) (1,925.0)Coupa Software, Inc. . . . . . . . (680) (91,304) (1,941.3)CyberArk Software Ltd. . . . . . (261) (35,796) (761.1)Discovery, Inc., Class A . . . . . (670) (18,700) (397.6)DISH Network Corp., Class A . (2,744) (86,162) (1,832.0)Dollar General Corp. . . . . . . . (355) (74,010) (1,573.6)Dollar Tree, Inc. . . . . . . . . . . (1,063) (139,487) (2,965.8)DoorDash, Inc., Class A . . . . . (1,039) (117,916) (2,507.2)DR Horton, Inc. . . . . . . . . . . . (658) (58,707) (1,248.2)DraftKings, Inc., Class A . . . . . (1,997) (44,114) (938.0)Eaton Corp. plc . . . . . . . . . . . (724) (114,703) (2,438.9)Elanco Animal Health, Inc. . . . (778) (20,259) (430.8)Enphase Energy, Inc. . . . . . . . (614) (86,249) (1,833.8)Erie Indemnity Co., Class A . . (392) (72,167) (1,534.4)Essential Utilities, Inc. . . . . . . (5,453) (265,779) (5,651.1)Estee Lauder Cos., Inc. (The),
Class A . . . . . . . . . . . . . . (179) (55,810) (1,186.7)Etsy, Inc. . . . . . . . . . . . . . . . (420) (65,974) (1,402.7)Evergy, Inc. . . . . . . . . . . . . . (1,165) (75,678) (1,609.1)Exact Sciences Corp. . . . . . . (1,509) (115,227) (2,450.0)Fiserv, Inc. . . . . . . . . . . . . . . (2,984) (315,409) (6,706.3)FleetCor Technologies, Inc. . . . (799) (190,370) (4,047.7)Generac Holdings, Inc. . . . . . (65) (18,355) (390.3)Global Payments, Inc. . . . . . . (409) (61,301) (1,303.4)Globe Life, Inc. . . . . . . . . . . . (829) (84,807) (1,803.2)Guidewire Software, Inc. . . . . (1,071) (108,000) (2,296.3)Hasbro, Inc. . . . . . . . . . . . . . (1,053) (97,381) (2,070.5)HEICO Corp. . . . . . . . . . . . . (167) (22,777) (484.3)Hilton Worldwide Holdings, Inc. (272) (39,470) (839.2)Honeywell International, Inc. . . (315) (64,411) (1,369.5)Horizon Therapeutics plc . . . . (222) (20,719) (440.5)Hormel Foods Corp. . . . . . . . (5,748) (272,858) (5,801.6)Howmet Aerospace, Inc. . . . . (7,310) (227,268) (4,832.2)HubSpot, Inc. . . . . . . . . . . . . (35) (17,108) (363.8)Humana, Inc. . . . . . . . . . . . . (417) (163,673) (3,480.0)IAC/InterActiveCorp . . . . . . . . (1,807) (246,728) (5,246.0)Ingersoll Rand, Inc. . . . . . . . . (3,528) (198,309) (4,216.5)Insulet Corp. . . . . . . . . . . . . (206) (51,088) (1,086.2)International Business Machines
Corp. . . . . . . . . . . . . . . . (1,009) (134,772) (2,865.6)IPG Photonics Corp. . . . . . . . (836) (129,137) (2,745.7)J M Smucker Co. (The) . . . . . (690) (97,000) (2,062.4)Keurig Dr Pepper, Inc. . . . . . . (6,862) (260,413) (5,537.0)Las Vegas Sands Corp. . . . . . (2,958) (129,560) (2,754.7)Leidos Holdings, Inc. . . . . . . . (535) (47,856) (1,017.5)Liberty Broadband Corp., Class
C . . . . . . . . . . . . . . . . . . (700) (103,887) (2,208.9)Liberty Media Corp-Liberty
Formula One, Class C . . . . (6,378) (384,147) (8,167.8)Live Nation Entertainment, Inc. (419) (45,885) (975.6)Lululemon Athletica, Inc. . . . . (58) (19,358) (411.6)
BNM0322U-2100207-6479109
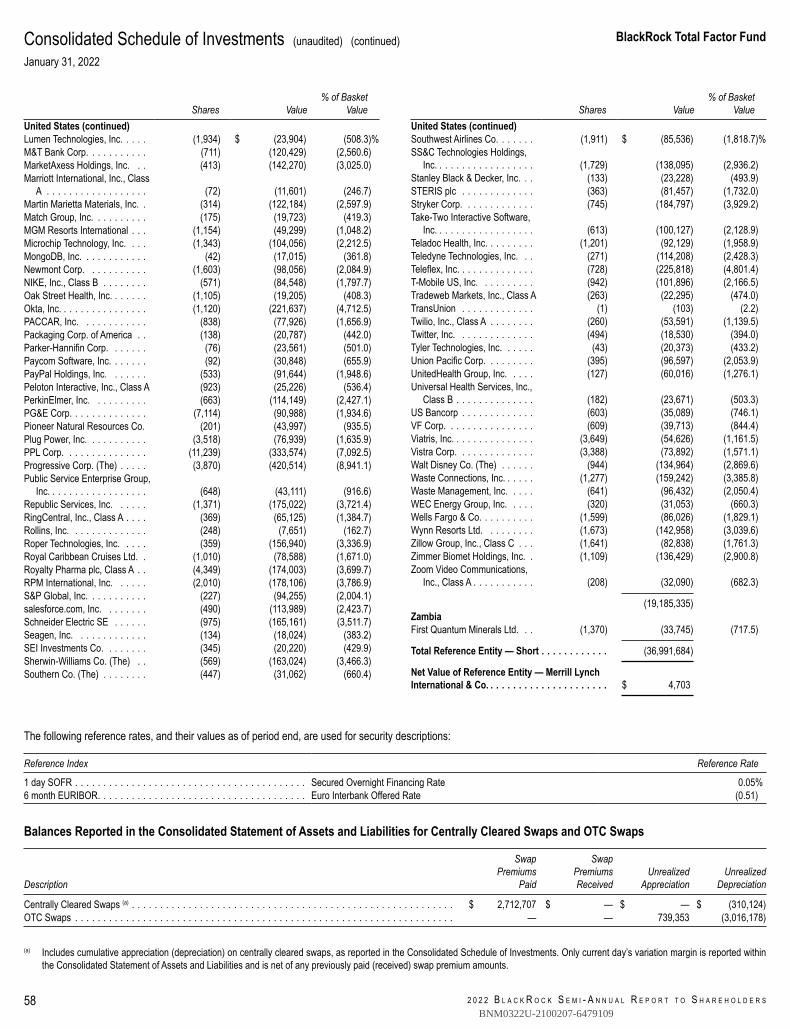
2 0 2 2 B L A C K R O C K S E M I - A N N U A L R E P O R T T O S H A R E H O L D E R S
BlackRock Total Factor Fund
58
Consolidated Schedule of Investments (unaudited) (continued)January 31, 2022
Shares Value% of Basket
ValueUnited States (continued)Lumen Technologies, Inc. . . . . (1,934) $ (23,904) (508.3)%M&T Bank Corp. . . . . . . . . . . (711) (120,429) (2,560.6)MarketAxess Holdings, Inc. . . (413) (142,270) (3,025.0)Marriott International, Inc., Class
A . . . . . . . . . . . . . . . . . . (72) (11,601) (246.7)Martin Marietta Materials, Inc. . (314) (122,184) (2,597.9)Match Group, Inc. . . . . . . . . . (175) (19,723) (419.3)MGM Resorts International . . . (1,154) (49,299) (1,048.2)Microchip Technology, Inc. . . . (1,343) (104,056) (2,212.5)MongoDB, Inc. . . . . . . . . . . . (42) (17,015) (361.8)Newmont Corp. . . . . . . . . . . (1,603) (98,056) (2,084.9)NIKE, Inc., Class B . . . . . . . . (571) (84,548) (1,797.7)Oak Street Health, Inc. . . . . . . (1,105) (19,205) (408.3)Okta, Inc. . . . . . . . . . . . . . . . (1,120) (221,637) (4,712.5)PACCAR, Inc. . . . . . . . . . . . (838) (77,926) (1,656.9)Packaging Corp. of America . . (138) (20,787) (442.0)Parker-Hannifin Corp. . . . . . . (76) (23,561) (501.0)Paycom Software, Inc. . . . . . . (92) (30,848) (655.9)PayPal Holdings, Inc. . . . . . . (533) (91,644) (1,948.6)Peloton Interactive, Inc., Class A (923) (25,226) (536.4)PerkinElmer, Inc. . . . . . . . . . (663) (114,149) (2,427.1)PG&E Corp. . . . . . . . . . . . . . (7,114) (90,988) (1,934.6)Pioneer Natural Resources Co. (201) (43,997) (935.5)Plug Power, Inc. . . . . . . . . . . (3,518) (76,939) (1,635.9)PPL Corp. . . . . . . . . . . . . . . (11,239) (333,574) (7,092.5)Progressive Corp. (The) . . . . . (3,870) (420,514) (8,941.1)Public Service Enterprise Group,
Inc. . . . . . . . . . . . . . . . . . (648) (43,111) (916.6)Republic Services, Inc. . . . . . (1,371) (175,022) (3,721.4)RingCentral, Inc., Class A . . . . (369) (65,125) (1,384.7)Rollins, Inc. . . . . . . . . . . . . . (248) (7,651) (162.7)Roper Technologies, Inc. . . . . (359) (156,940) (3,336.9)Royal Caribbean Cruises Ltd. . (1,010) (78,588) (1,671.0)Royalty Pharma plc, Class A . . (4,349) (174,003) (3,699.7)RPM International, Inc. . . . . . (2,010) (178,106) (3,786.9)S&P Global, Inc. . . . . . . . . . . (227) (94,255) (2,004.1)salesforce.com, Inc. . . . . . . . (490) (113,989) (2,423.7)Schneider Electric SE . . . . . . (975) (165,161) (3,511.7)Seagen, Inc. . . . . . . . . . . . . (134) (18,024) (383.2)SEI Investments Co. . . . . . . . (345) (20,220) (429.9)Sherwin-Williams Co. (The) . . (569) (163,024) (3,466.3)Southern Co. (The) . . . . . . . . (447) (31,062) (660.4)
Shares Value% of Basket
ValueUnited States (continued)Southwest Airlines Co. . . . . . . (1,911) $ (85,536) (1,818.7)%SS&C Technologies Holdings,
Inc. . . . . . . . . . . . . . . . . . (1,729) (138,095) (2,936.2)Stanley Black & Decker, Inc. . . (133) (23,228) (493.9)STERIS plc . . . . . . . . . . . . . (363) (81,457) (1,732.0)Stryker Corp. . . . . . . . . . . . . (745) (184,797) (3,929.2)Take-Two Interactive Software,
Inc. . . . . . . . . . . . . . . . . . (613) (100,127) (2,128.9)Teladoc Health, Inc. . . . . . . . . (1,201) (92,129) (1,958.9)Teledyne Technologies, Inc. . . (271) (114,208) (2,428.3)Teleflex, Inc. . . . . . . . . . . . . . (728) (225,818) (4,801.4)T-Mobile US, Inc. . . . . . . . . . (942) (101,896) (2,166.5)Tradeweb Markets, Inc., Class A (263) (22,295) (474.0)TransUnion . . . . . . . . . . . . . (1) (103) (2.2)Twilio, Inc., Class A . . . . . . . . (260) (53,591) (1,139.5)Twitter, Inc. . . . . . . . . . . . . . (494) (18,530) (394.0)Tyler Technologies, Inc. . . . . . (43) (20,373) (433.2)Union Pacific Corp. . . . . . . . . (395) (96,597) (2,053.9)UnitedHealth Group, Inc. . . . . (127) (60,016) (1,276.1)Universal Health Services, Inc.,
Class B . . . . . . . . . . . . . . (182) (23,671) (503.3)US Bancorp . . . . . . . . . . . . . (603) (35,089) (746.1)VF Corp. . . . . . . . . . . . . . . . (609) (39,713) (844.4)Viatris, Inc. . . . . . . . . . . . . . . (3,649) (54,626) (1,161.5)Vistra Corp. . . . . . . . . . . . . . (3,388) (73,892) (1,571.1)Walt Disney Co. (The) . . . . . . (944) (134,964) (2,869.6)Waste Connections, Inc. . . . . . (1,277) (159,242) (3,385.8)Waste Management, Inc. . . . . (641) (96,432) (2,050.4)WEC Energy Group, Inc. . . . . (320) (31,053) (660.3)Wells Fargo & Co. . . . . . . . . . (1,599) (86,026) (1,829.1)Wynn Resorts Ltd. . . . . . . . . (1,673) (142,958) (3,039.6)Zillow Group, Inc., Class C . . . (1,641) (82,838) (1,761.3)Zimmer Biomet Holdings, Inc. . (1,109) (136,429) (2,900.8)Zoom Video Communications,
Inc., Class A . . . . . . . . . . . (208) (32,090) (682.3)
(19,185,335)ZambiaFirst Quantum Minerals Ltd. . . (1,370) (33,745) (717.5)
Total Reference Entity — Short . . . . . . . . . . . . (36,991,684)
Net Value of Reference Entity — Merrill LynchInternational & Co. . . . . . . . . . . . . . . . . . . . . . $ 4,703
The following reference rates, and their values as of period end, are used for security descriptions:
Reference Index Reference Rate
1 day SOFR . . . . . . . . . . . . . . . . . . . . . . . . . . . . . . . . . . . . . . . . . Secured Overnight Financing Rate 0.05%6 month EURIBOR. . . . . . . . . . . . . . . . . . . . . . . . . . . . . . . . . . . . . Euro Interbank Offered Rate (0.51)
Balances Reported in the Consolidated Statement of Assets and Liabilities for Centrally Cleared Swaps and OTC Swaps
Description
SwapPremiums
Paid
SwapPremiumsReceived
UnrealizedAppreciation
UnrealizedDepreciation
Centrally Cleared Swaps (a) . . . . . . . . . . . . . . . . . . . . . . . . . . . . . . . . . . . . . . . . . . . . . . . . . . . . . . . . . $ 2,712,707 $ — $ — $ (310,124)OTC Swaps . . . . . . . . . . . . . . . . . . . . . . . . . . . . . . . . . . . . . . . . . . . . . . . . . . . . . . . . . . . . . . . . . . . — — 739,353 (3,016,178)
(a) Includes cumulative appreciation (depreciation) on centrally cleared swaps, as reported in the Consolidated Schedule of Investments. Only current day’s variation margin is reported withinthe Consolidated Statement of Assets and Liabilities and is net of any previously paid (received) swap premium amounts.
BNM0322U-2100207-6479109
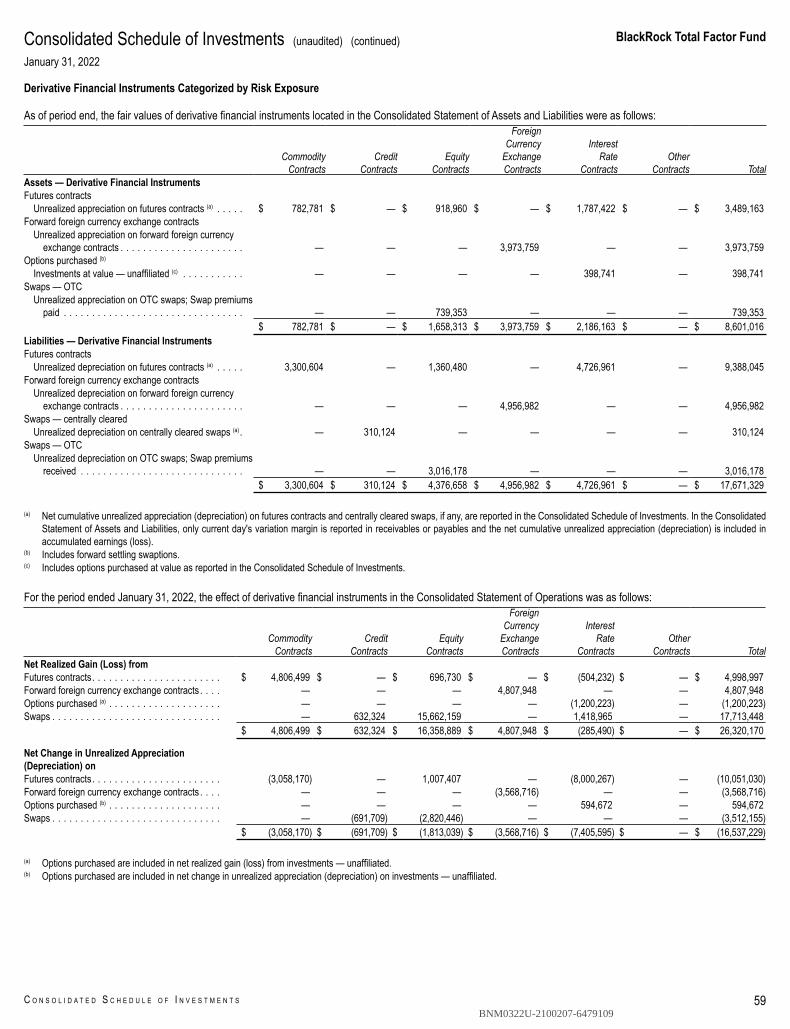
BlackRock Total Factor Fund
C O N S O L I D A T E D S C H E D U L E O F I N V E S T M E N T S 59
Consolidated Schedule of Investments (unaudited) (continued)January 31, 2022
Derivative Financial Instruments Categorized by Risk Exposure
As of period end, the fair values of derivative financial instruments located in the Consolidated Statement of Assets and Liabilities were as follows:
CommodityContracts
CreditContracts
EquityContracts
ForeignCurrency
ExchangeContracts
InterestRate
ContractsOther
Contracts TotalAssets — Derivative Financial InstrumentsFutures contracts
Unrealized appreciation on futures contracts (a) . . . . . $ 782,781 $ — $ 918,960 $ — $ 1,787,422 $ — $ 3,489,163Forward foreign currency exchange contracts
Unrealized appreciation on forward foreign currencyexchange contracts . . . . . . . . . . . . . . . . . . . . . . — — — 3,973,759 — — 3,973,759
Options purchased (b)
Investments at value — unaffiliated (c) . . . . . . . . . . . — — — — 398,741 — 398,741Swaps — OTC
Unrealized appreciation on OTC swaps; Swap premiumspaid . . . . . . . . . . . . . . . . . . . . . . . . . . . . . . . . — — 739,353 — — — 739,353
$ 782,781 $ — $ 1,658,313 $ 3,973,759 $ 2,186,163 $ — $ 8,601,016Liabilities — Derivative Financial InstrumentsFutures contracts
Unrealized depreciation on futures contracts (a) . . . . . 3,300,604 — 1,360,480 — 4,726,961 — 9,388,045Forward foreign currency exchange contracts
Unrealized depreciation on forward foreign currencyexchange contracts . . . . . . . . . . . . . . . . . . . . . . — — — 4,956,982 — — 4,956,982
Swaps — centrally clearedUnrealized depreciation on centrally cleared swaps (a) . — 310,124 — — — — 310,124
Swaps — OTCUnrealized depreciation on OTC swaps; Swap premiums
received . . . . . . . . . . . . . . . . . . . . . . . . . . . . . — — 3,016,178 — — — 3,016,178$ 3,300,604 $ 310,124 $ 4,376,658 $ 4,956,982 $ 4,726,961 $ — $ 17,671,329
(a) Net cumulative unrealized appreciation (depreciation) on futures contracts and centrally cleared swaps, if any, are reported in the Consolidated Schedule of Investments. In the ConsolidatedStatement of Assets and Liabilities, only current day's variation margin is reported in receivables or payables and the net cumulative unrealized appreciation (depreciation) is included inaccumulated earnings (loss).
(b) Includes forward settling swaptions.(c) Includes options purchased at value as reported in the Consolidated Schedule of Investments.
For the period ended January 31, 2022, the effect of derivative financial instruments in the Consolidated Statement of Operations was as follows:
CommodityContracts
CreditContracts
EquityContracts
ForeignCurrency
ExchangeContracts
InterestRate
ContractsOther
Contracts TotalNet Realized Gain (Loss) fromFutures contracts. . . . . . . . . . . . . . . . . . . . . . . $ 4,806,499 $ — $ 696,730 $ — $ (504,232) $ — $ 4,998,997Forward foreign currency exchange contracts . . . . — — — 4,807,948 — — 4,807,948Options purchased (a) . . . . . . . . . . . . . . . . . . . . — — — — (1,200,223) — (1,200,223)Swaps . . . . . . . . . . . . . . . . . . . . . . . . . . . . . . — 632,324 15,662,159 — 1,418,965 — 17,713,448
$ 4,806,499 $ 632,324 $ 16,358,889 $ 4,807,948 $ (285,490) $ — $ 26,320,170
Net Change in Unrealized Appreciation(Depreciation) onFutures contracts. . . . . . . . . . . . . . . . . . . . . . . (3,058,170) — 1,007,407 — (8,000,267) — (10,051,030)Forward foreign currency exchange contracts . . . . — — — (3,568,716) — — (3,568,716)Options purchased (b) . . . . . . . . . . . . . . . . . . . . — — — — 594,672 — 594,672Swaps . . . . . . . . . . . . . . . . . . . . . . . . . . . . . . — (691,709) (2,820,446) — — — (3,512,155)
$ (3,058,170) $ (691,709) $ (1,813,039) $ (3,568,716) $ (7,405,595) $ — $ (16,537,229)
(a) Options purchased are included in net realized gain (loss) from investments — unaffiliated.(b) Options purchased are included in net change in unrealized appreciation (depreciation) on investments — unaffiliated.
BNM0322U-2100207-6479109
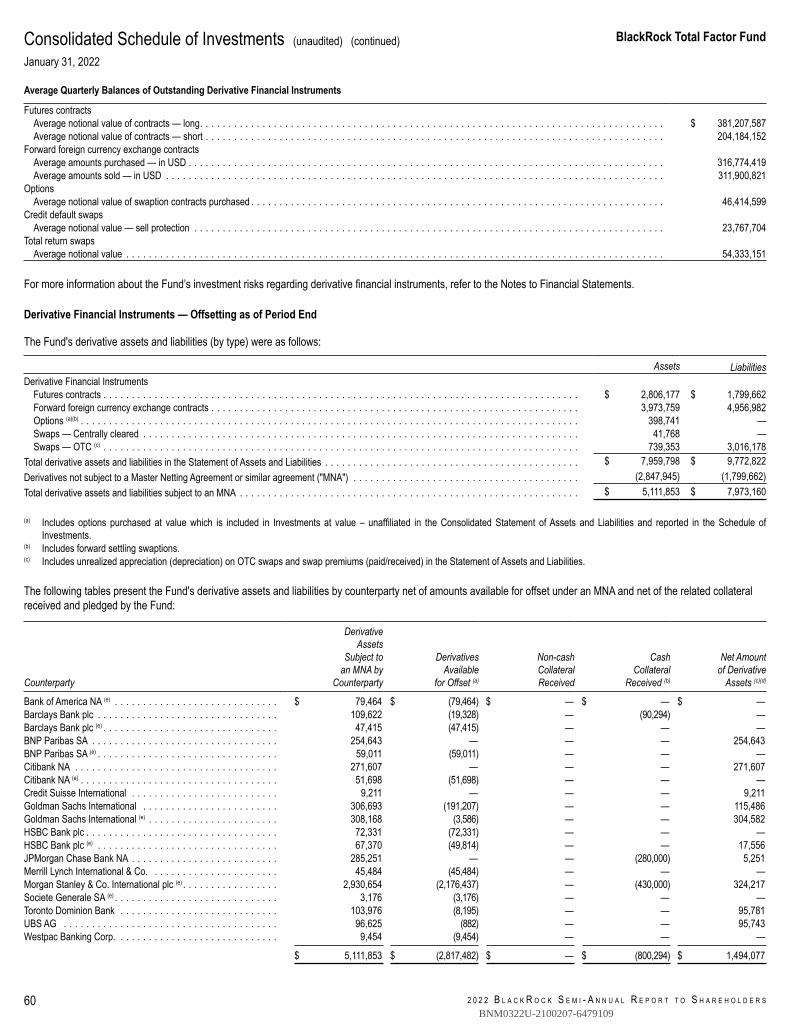
2 0 2 2 B L A C K R O C K S E M I - A N N U A L R E P O R T T O S H A R E H O L D E R S
BlackRock Total Factor Fund
60
Consolidated Schedule of Investments (unaudited) (continued)January 31, 2022
Average Quarterly Balances of Outstanding Derivative Financial Instruments
Futures contractsAverage notional value of contracts — long. . . . . . . . . . . . . . . . . . . . . . . . . . . . . . . . . . . . . . . . . . . . . . . . . . . . . . . . . . . . . . . . . . . . . . . . . . . . . . . . . . $ 381,207,587Average notional value of contracts — short . . . . . . . . . . . . . . . . . . . . . . . . . . . . . . . . . . . . . . . . . . . . . . . . . . . . . . . . . . . . . . . . . . . . . . . . . . . . . . . . . 204,184,152
Forward foreign currency exchange contractsAverage amounts purchased — in USD . . . . . . . . . . . . . . . . . . . . . . . . . . . . . . . . . . . . . . . . . . . . . . . . . . . . . . . . . . . . . . . . . . . . . . . . . . . . . . . . . . . . 316,774,419Average amounts sold — in USD . . . . . . . . . . . . . . . . . . . . . . . . . . . . . . . . . . . . . . . . . . . . . . . . . . . . . . . . . . . . . . . . . . . . . . . . . . . . . . . . . . . . . . . . 311,900,821
OptionsAverage notional value of swaption contracts purchased . . . . . . . . . . . . . . . . . . . . . . . . . . . . . . . . . . . . . . . . . . . . . . . . . . . . . . . . . . . . . . . . . . . . . . . . . 46,414,599
Credit default swapsAverage notional value — sell protection . . . . . . . . . . . . . . . . . . . . . . . . . . . . . . . . . . . . . . . . . . . . . . . . . . . . . . . . . . . . . . . . . . . . . . . . . . . . . . . . . . . 23,767,704
Total return swapsAverage notional value . . . . . . . . . . . . . . . . . . . . . . . . . . . . . . . . . . . . . . . . . . . . . . . . . . . . . . . . . . . . . . . . . . . . . . . . . . . . . . . . . . . . . . . . . . . . . . . 54,333,151
For more information about the Fund’s investment risks regarding derivative financial instruments, refer to the Notes to Financial Statements.
Derivative Financial Instruments — Offsetting as of Period End
The Fund's derivative assets and liabilities (by type) were as follows:
Assets LiabilitiesDerivative Financial Instruments $ 4,806,499
Futures contracts . . . . . . . . . . . . . . . . . . . . . . . . . . . . . . . . . . . . . . . . . . . . . . . . . . . . . . . . . . . . . . . . . . . . . . . . . . . . . . . . . . . . $ 2,806,177 $ 1,799,662Forward foreign currency exchange contracts . . . . . . . . . . . . . . . . . . . . . . . . . . . . . . . . . . . . . . . . . . . . . . . . . . . . . . . . . . . . . . . . . 3,973,759 4,956,982Options (a)(b) . . . . . . . . . . . . . . . . . . . . . . . . . . . . . . . . . . . . . . . . . . . . . . . . . . . . . . . . . . . . . . . . . . . . . . . . . . . . . . . . . . . . . . . . 398,741 —Swaps — Centrally cleared . . . . . . . . . . . . . . . . . . . . . . . . . . . . . . . . . . . . . . . . . . . . . . . . . . . . . . . . . . . . . . . . . . . . . . . . . . . . . 41,768 —Swaps — OTC (c) . . . . . . . . . . . . . . . . . . . . . . . . . . . . . . . . . . . . . . . . . . . . . . . . . . . . . . . . . . . . . . . . . . . . . . . . . . . . . . . . . . . . 739,353 3,016,178
Total derivative assets and liabilities in the Statement of Assets and Liabilities . . . . . . . . . . . . . . . . . . . . . . . . . . . . . . . . . . . . . . . . . . . . . $ 7,959,798 $ 9,772,822Derivatives not subject to a Master Netting Agreement or similar agreement ("MNA") . . . . . . . . . . . . . . . . . . . . . . . . . . . . . . . . . . . . . . . . (2,847,945) (1,799,662)Total derivative assets and liabilities subject to an MNA . . . . . . . . . . . . . . . . . . . . . . . . . . . . . . . . . . . . . . . . . . . . . . . . . . . . . . . . . . . . $ 5,111,853 $ 7,973,160
(a) Includes options purchased at value which is included in Investments at value – unaffiliated in the Consolidated Statement of Assets and Liabilities and reported in the Schedule ofInvestments.
(b) Includes forward settling swaptions.(c) Includes unrealized appreciation (depreciation) on OTC swaps and swap premiums (paid/received) in the Statement of Assets and Liabilities.
The following tables present the Fund's derivative assets and liabilities by counterparty net of amounts available for offset under an MNA and net of the related collateralreceived and pledged by the Fund:
Counterparty
DerivativeAssets
Subject toan MNA by
Counterparty
DerivativesAvailable
for Offset (a)
Non-cashCollateralReceived
CashCollateral
Received (b)
Net Amountof Derivative
Assets (c)(d)
Bank of America NA (e) . . . . . . . . . . . . . . . . . . . . . . . . . . . . . $ 79,464 $ (79,464) $ — $ — $ —Barclays Bank plc . . . . . . . . . . . . . . . . . . . . . . . . . . . . . . . . 109,622 (19,328) — (90,294) —Barclays Bank plc (e) . . . . . . . . . . . . . . . . . . . . . . . . . . . . . . . 47,415 (47,415) — — —BNP Paribas SA . . . . . . . . . . . . . . . . . . . . . . . . . . . . . . . . . 254,643 — — — 254,643BNP Paribas SA (e) . . . . . . . . . . . . . . . . . . . . . . . . . . . . . . . . 59,011 (59,011) — — —Citibank NA . . . . . . . . . . . . . . . . . . . . . . . . . . . . . . . . . . . . 271,607 — — — 271,607Citibank NA (e) . . . . . . . . . . . . . . . . . . . . . . . . . . . . . . . . . . . 51,698 (51,698) — — —Credit Suisse International . . . . . . . . . . . . . . . . . . . . . . . . . . 9,211 — — — 9,211Goldman Sachs International . . . . . . . . . . . . . . . . . . . . . . . . 306,693 (191,207) — — 115,486Goldman Sachs International (e) . . . . . . . . . . . . . . . . . . . . . . . 308,168 (3,586) — — 304,582HSBC Bank plc . . . . . . . . . . . . . . . . . . . . . . . . . . . . . . . . . . 72,331 (72,331) — — —HSBC Bank plc (e) . . . . . . . . . . . . . . . . . . . . . . . . . . . . . . . . 67,370 (49,814) — — 17,556JPMorgan Chase Bank NA . . . . . . . . . . . . . . . . . . . . . . . . . . 285,251 — — (280,000) 5,251Merrill Lynch International & Co. . . . . . . . . . . . . . . . . . . . . . . 45,484 (45,484) — — —Morgan Stanley & Co. International plc (e) . . . . . . . . . . . . . . . . . 2,930,654 (2,176,437) — (430,000) 324,217Societe Generale SA (e) . . . . . . . . . . . . . . . . . . . . . . . . . . . . . 3,176 (3,176) — — —Toronto Dominion Bank . . . . . . . . . . . . . . . . . . . . . . . . . . . . 103,976 (8,195) — — 95,781UBS AG . . . . . . . . . . . . . . . . . . . . . . . . . . . . . . . . . . . . . . 96,625 (882) — — 95,743Westpac Banking Corp. . . . . . . . . . . . . . . . . . . . . . . . . . . . . 9,454 (9,454) — — —
$ 5,111,853 $ (2,817,482) $ — $ (800,294) $ 1,494,077
BNM0322U-2100207-6479109
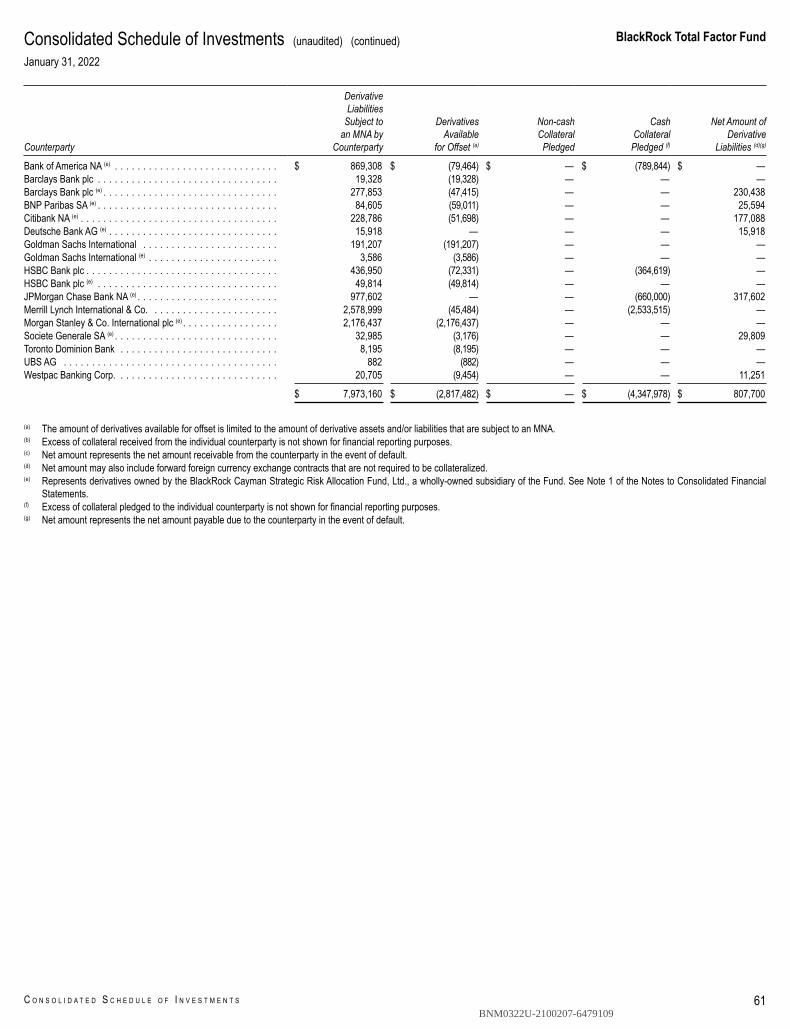
BlackRock Total Factor Fund
C O N S O L I D A T E D S C H E D U L E O F I N V E S T M E N T S 61
Consolidated Schedule of Investments (unaudited) (continued)January 31, 2022
Counterparty
DerivativeLiabilities
Subject toan MNA by
Counterparty
DerivativesAvailable
for Offset (a)
Non-cashCollateralPledged
CashCollateralPledged (f)
Net Amount ofDerivative
Liabilities (d)(g)
Bank of America NA (e) . . . . . . . . . . . . . . . . . . . . . . . . . . . . . $ 869,308 $ (79,464) $ — $ (789,844) $ —Barclays Bank plc . . . . . . . . . . . . . . . . . . . . . . . . . . . . . . . . 19,328 (19,328) — — —Barclays Bank plc (e) . . . . . . . . . . . . . . . . . . . . . . . . . . . . . . . 277,853 (47,415) — — 230,438BNP Paribas SA (e) . . . . . . . . . . . . . . . . . . . . . . . . . . . . . . . . 84,605 (59,011) — — 25,594Citibank NA (e) . . . . . . . . . . . . . . . . . . . . . . . . . . . . . . . . . . . 228,786 (51,698) — — 177,088Deutsche Bank AG (e) . . . . . . . . . . . . . . . . . . . . . . . . . . . . . . 15,918 — — — 15,918Goldman Sachs International . . . . . . . . . . . . . . . . . . . . . . . . 191,207 (191,207) — — —Goldman Sachs International (e) . . . . . . . . . . . . . . . . . . . . . . . 3,586 (3,586) — — —HSBC Bank plc . . . . . . . . . . . . . . . . . . . . . . . . . . . . . . . . . . 436,950 (72,331) — (364,619) —HSBC Bank plc (e) . . . . . . . . . . . . . . . . . . . . . . . . . . . . . . . . 49,814 (49,814) — — —JPMorgan Chase Bank NA (e) . . . . . . . . . . . . . . . . . . . . . . . . . 977,602 — — (660,000) 317,602Merrill Lynch International & Co. . . . . . . . . . . . . . . . . . . . . . . 2,578,999 (45,484) — (2,533,515) —Morgan Stanley & Co. International plc (e) . . . . . . . . . . . . . . . . . 2,176,437 (2,176,437) — — —Societe Generale SA (e) . . . . . . . . . . . . . . . . . . . . . . . . . . . . . 32,985 (3,176) — — 29,809Toronto Dominion Bank . . . . . . . . . . . . . . . . . . . . . . . . . . . . 8,195 (8,195) — — —UBS AG . . . . . . . . . . . . . . . . . . . . . . . . . . . . . . . . . . . . . . 882 (882) — — —Westpac Banking Corp. . . . . . . . . . . . . . . . . . . . . . . . . . . . . 20,705 (9,454) — — 11,251
$ 7,973,160 $ (2,817,482) $ — $ (4,347,978) $ 807,700
(a) The amount of derivatives available for offset is limited to the amount of derivative assets and/or liabilities that are subject to an MNA.(b) Excess of collateral received from the individual counterparty is not shown for financial reporting purposes.(c) Net amount represents the net amount receivable from the counterparty in the event of default.(d) Net amount may also include forward foreign currency exchange contracts that are not required to be collateralized.(e) Represents derivatives owned by the BlackRock Cayman Strategic Risk Allocation Fund, Ltd., a wholly-owned subsidiary of the Fund. See Note 1 of the Notes to Consolidated Financial
Statements.(f) Excess of collateral pledged to the individual counterparty is not shown for financial reporting purposes.(g) Net amount represents the net amount payable due to the counterparty in the event of default.
BNM0322U-2100207-6479109
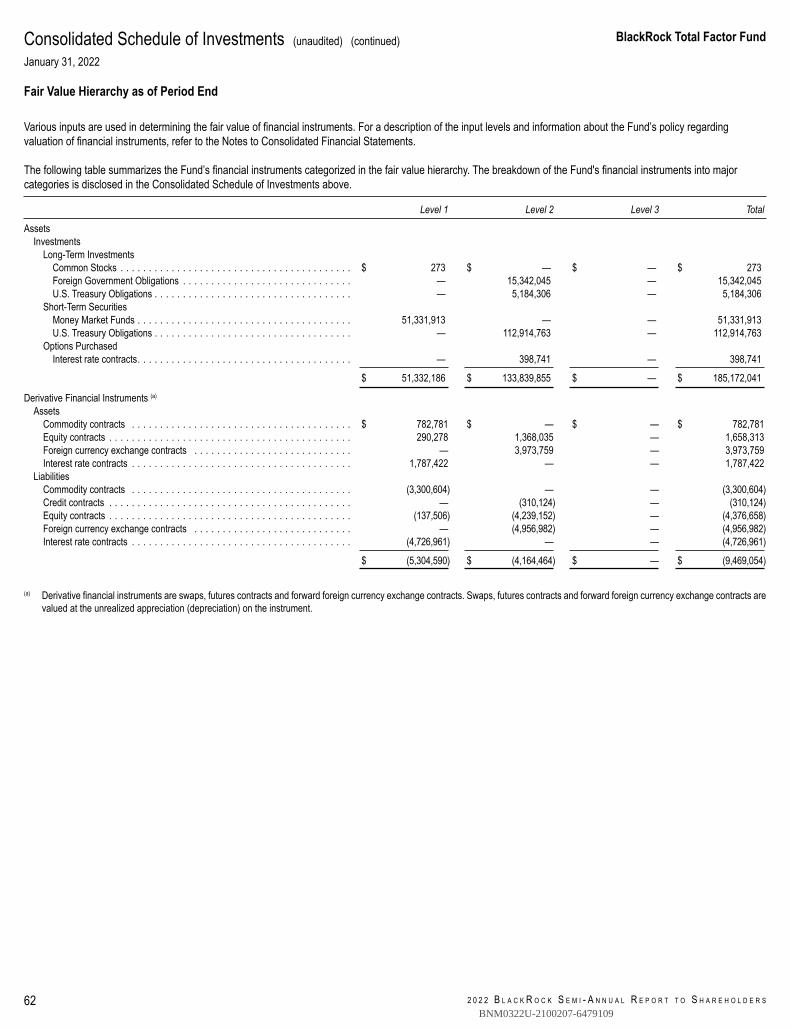
2 0 2 2 B L A C K R O C K S E M I - A N N U A L R E P O R T T O S H A R E H O L D E R S
BlackRock Total Factor Fund
62
Consolidated Schedule of Investments (unaudited) (continued)January 31, 2022
Fair Value Hierarchy as of Period End
Various inputs are used in determining the fair value of financial instruments. For a description of the input levels and information about the Fund’s policy regardingvaluation of financial instruments, refer to the Notes to Consolidated Financial Statements.
The following table summarizes the Fund’s financial instruments categorized in the fair value hierarchy. The breakdown of the Fund's financial instruments into majorcategories is disclosed in the Consolidated Schedule of Investments above.
Level 1 Level 2 Level 3 Total
AssetsInvestments
Long-Term InvestmentsCommon Stocks . . . . . . . . . . . . . . . . . . . . . . . . . . . . . . . . . . . . . . . . . $ 273 $ — $ — $ 273Foreign Government Obligations . . . . . . . . . . . . . . . . . . . . . . . . . . . . . . — 15,342,045 — 15,342,045U.S. Treasury Obligations . . . . . . . . . . . . . . . . . . . . . . . . . . . . . . . . . . . — 5,184,306 — 5,184,306
Short-Term SecuritiesMoney Market Funds . . . . . . . . . . . . . . . . . . . . . . . . . . . . . . . . . . . . . . 51,331,913 — — 51,331,913U.S. Treasury Obligations . . . . . . . . . . . . . . . . . . . . . . . . . . . . . . . . . . . — 112,914,763 — 112,914,763
Options PurchasedInterest rate contracts. . . . . . . . . . . . . . . . . . . . . . . . . . . . . . . . . . . . . . — 398,741 — 398,741
$ 51,332,186 $ 133,839,855 $ — $ 185,172,041
Derivative Financial Instruments (a)
AssetsCommodity contracts . . . . . . . . . . . . . . . . . . . . . . . . . . . . . . . . . . . . . . . $ 782,781 $ — $ — $ 782,781Equity contracts . . . . . . . . . . . . . . . . . . . . . . . . . . . . . . . . . . . . . . . . . . . 290,278 1,368,035 — 1,658,313Foreign currency exchange contracts . . . . . . . . . . . . . . . . . . . . . . . . . . . . — 3,973,759 — 3,973,759Interest rate contracts . . . . . . . . . . . . . . . . . . . . . . . . . . . . . . . . . . . . . . . 1,787,422 — — 1,787,422
LiabilitiesCommodity contracts . . . . . . . . . . . . . . . . . . . . . . . . . . . . . . . . . . . . . . . (3,300,604) — — (3,300,604)Credit contracts . . . . . . . . . . . . . . . . . . . . . . . . . . . . . . . . . . . . . . . . . . . — (310,124) — (310,124)Equity contracts . . . . . . . . . . . . . . . . . . . . . . . . . . . . . . . . . . . . . . . . . . . (137,506) (4,239,152) — (4,376,658)Foreign currency exchange contracts . . . . . . . . . . . . . . . . . . . . . . . . . . . . — (4,956,982) — (4,956,982)Interest rate contracts . . . . . . . . . . . . . . . . . . . . . . . . . . . . . . . . . . . . . . . (4,726,961) — — (4,726,961)
$ (5,304,590) $ (4,164,464) $ — $ (9,469,054)
(a) Derivative financial instruments are swaps, futures contracts and forward foreign currency exchange contracts. Swaps, futures contracts and forward foreign currency exchange contracts arevalued at the unrealized appreciation (depreciation) on the instrument.
BNM0322U-2100207-6479109
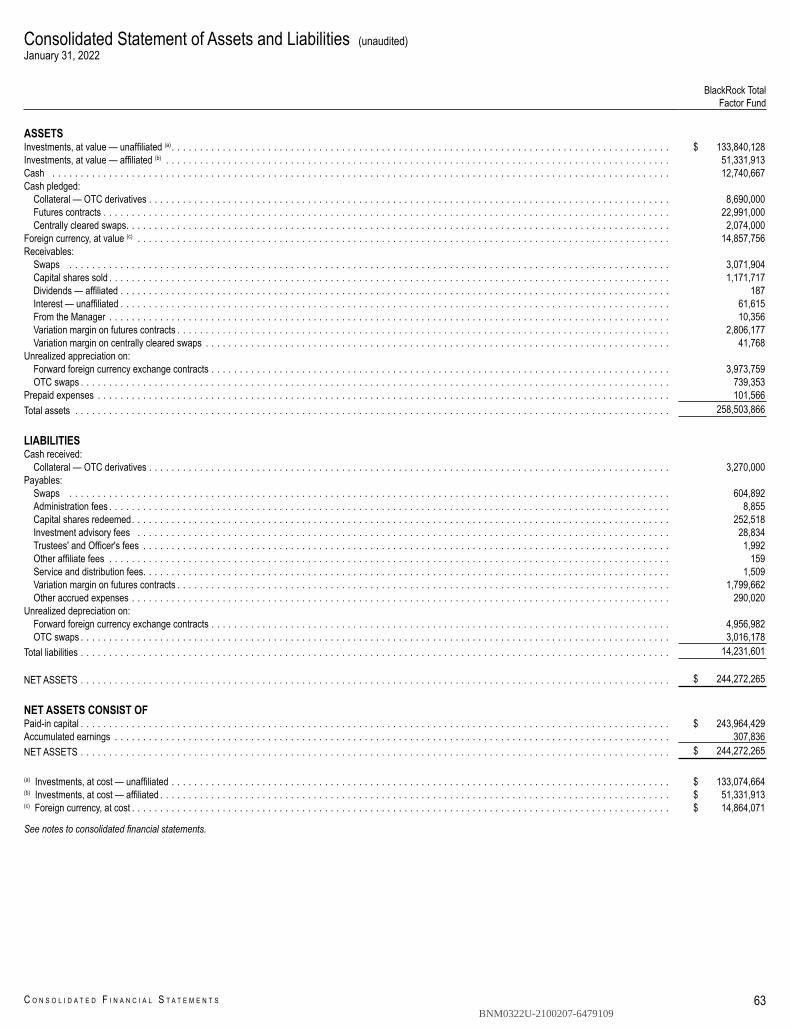
Consolidated Statement of Assets and Liabilities (unaudited)January 31, 2022
63C O N S O L I D A T E D F I N A N C I A L S T A T E M E N T S
BlackRock TotalFactor Fund
ASSETSInvestments, at value — unaffiliated (a) . . . . . . . . . . . . . . . . . . . . . . . . . . . . . . . . . . . . . . . . . . . . . . . . . . . . . . . . . . . . . . . . . . . . . . . . . . . . . . . . . . . . . . . . $ 133,840,128Investments, at value — affiliated (b) . . . . . . . . . . . . . . . . . . . . . . . . . . . . . . . . . . . . . . . . . . . . . . . . . . . . . . . . . . . . . . . . . . . . . . . . . . . . . . . . . . . . . . . . . 51,331,913Cash . . . . . . . . . . . . . . . . . . . . . . . . . . . . . . . . . . . . . . . . . . . . . . . . . . . . . . . . . . . . . . . . . . . . . . . . . . . . . . . . . . . . . . . . . . . . . . . . . . . . . . . . . . . . . 12,740,667Cash pledged: –
Collateral — OTC derivatives . . . . . . . . . . . . . . . . . . . . . . . . . . . . . . . . . . . . . . . . . . . . . . . . . . . . . . . . . . . . . . . . . . . . . . . . . . . . . . . . . . . . . . . . . . . . 8,690,000Futures contracts . . . . . . . . . . . . . . . . . . . . . . . . . . . . . . . . . . . . . . . . . . . . . . . . . . . . . . . . . . . . . . . . . . . . . . . . . . . . . . . . . . . . . . . . . . . . . . . . . . . . 22,991,000Centrally cleared swaps. . . . . . . . . . . . . . . . . . . . . . . . . . . . . . . . . . . . . . . . . . . . . . . . . . . . . . . . . . . . . . . . . . . . . . . . . . . . . . . . . . . . . . . . . . . . . . . . 2,074,000
Foreign currency, at value (c) . . . . . . . . . . . . . . . . . . . . . . . . . . . . . . . . . . . . . . . . . . . . . . . . . . . . . . . . . . . . . . . . . . . . . . . . . . . . . . . . . . . . . . . . . . . . . . 14,857,756Receivables: –
Swaps . . . . . . . . . . . . . . . . . . . . . . . . . . . . . . . . . . . . . . . . . . . . . . . . . . . . . . . . . . . . . . . . . . . . . . . . . . . . . . . . . . . . . . . . . . . . . . . . . . . . . . . . . . 3,071,904Capital shares sold . . . . . . . . . . . . . . . . . . . . . . . . . . . . . . . . . . . . . . . . . . . . . . . . . . . . . . . . . . . . . . . . . . . . . . . . . . . . . . . . . . . . . . . . . . . . . . . . . . . 1,171,717Dividends — affiliated . . . . . . . . . . . . . . . . . . . . . . . . . . . . . . . . . . . . . . . . . . . . . . . . . . . . . . . . . . . . . . . . . . . . . . . . . . . . . . . . . . . . . . . . . . . . . . . . . 187Interest — unaffiliated . . . . . . . . . . . . . . . . . . . . . . . . . . . . . . . . . . . . . . . . . . . . . . . . . . . . . . . . . . . . . . . . . . . . . . . . . . . . . . . . . . . . . . . . . . . . . . . . . 61,615From the Manager . . . . . . . . . . . . . . . . . . . . . . . . . . . . . . . . . . . . . . . . . . . . . . . . . . . . . . . . . . . . . . . . . . . . . . . . . . . . . . . . . . . . . . . . . . . . . . . . . . . 10,356Variation margin on futures contracts . . . . . . . . . . . . . . . . . . . . . . . . . . . . . . . . . . . . . . . . . . . . . . . . . . . . . . . . . . . . . . . . . . . . . . . . . . . . . . . . . . . . . . . 2,806,177Variation margin on centrally cleared swaps . . . . . . . . . . . . . . . . . . . . . . . . . . . . . . . . . . . . . . . . . . . . . . . . . . . . . . . . . . . . . . . . . . . . . . . . . . . . . . . . . . 41,768
Unrealized appreciation on: –Forward foreign currency exchange contracts . . . . . . . . . . . . . . . . . . . . . . . . . . . . . . . . . . . . . . . . . . . . . . . . . . . . . . . . . . . . . . . . . . . . . . . . . . . . . . . . . 3,973,759OTC swaps . . . . . . . . . . . . . . . . . . . . . . . . . . . . . . . . . . . . . . . . . . . . . . . . . . . . . . . . . . . . . . . . . . . . . . . . . . . . . . . . . . . . . . . . . . . . . . . . . . . . . . . . 739,353
Prepaid expenses . . . . . . . . . . . . . . . . . . . . . . . . . . . . . . . . . . . . . . . . . . . . . . . . . . . . . . . . . . . . . . . . . . . . . . . . . . . . . . . . . . . . . . . . . . . . . . . . . . . . . 101,566Total assets . . . . . . . . . . . . . . . . . . . . . . . . . . . . . . . . . . . . . . . . . . . . . . . . . . . . . . . . . . . . . . . . . . . . . . . . . . . . . . . . . . . . . . . . . . . . . . . . . . . . . . . . . 258,503,866
LIABILITIESCash received: –
Collateral — OTC derivatives . . . . . . . . . . . . . . . . . . . . . . . . . . . . . . . . . . . . . . . . . . . . . . . . . . . . . . . . . . . . . . . . . . . . . . . . . . . . . . . . . . . . . . . . . . . . 3,270,000Payables: –
Swaps . . . . . . . . . . . . . . . . . . . . . . . . . . . . . . . . . . . . . . . . . . . . . . . . . . . . . . . . . . . . . . . . . . . . . . . . . . . . . . . . . . . . . . . . . . . . . . . . . . . . . . . . . . 604,892Administration fees . . . . . . . . . . . . . . . . . . . . . . . . . . . . . . . . . . . . . . . . . . . . . . . . . . . . . . . . . . . . . . . . . . . . . . . . . . . . . . . . . . . . . . . . . . . . . . . . . . . 8,855Capital shares redeemed. . . . . . . . . . . . . . . . . . . . . . . . . . . . . . . . . . . . . . . . . . . . . . . . . . . . . . . . . . . . . . . . . . . . . . . . . . . . . . . . . . . . . . . . . . . . . . . 252,518Investment advisory fees . . . . . . . . . . . . . . . . . . . . . . . . . . . . . . . . . . . . . . . . . . . . . . . . . . . . . . . . . . . . . . . . . . . . . . . . . . . . . . . . . . . . . . . . . . . . . . 28,834Trustees' and Officer's fees . . . . . . . . . . . . . . . . . . . . . . . . . . . . . . . . . . . . . . . . . . . . . . . . . . . . . . . . . . . . . . . . . . . . . . . . . . . . . . . . . . . . . . . . . . . . . 1,992Other affiliate fees . . . . . . . . . . . . . . . . . . . . . . . . . . . . . . . . . . . . . . . . . . . . . . . . . . . . . . . . . . . . . . . . . . . . . . . . . . . . . . . . . . . . . . . . . . . . . . . . . . . 159Service and distribution fees. . . . . . . . . . . . . . . . . . . . . . . . . . . . . . . . . . . . . . . . . . . . . . . . . . . . . . . . . . . . . . . . . . . . . . . . . . . . . . . . . . . . . . . . . . . . . 1,509Variation margin on futures contracts . . . . . . . . . . . . . . . . . . . . . . . . . . . . . . . . . . . . . . . . . . . . . . . . . . . . . . . . . . . . . . . . . . . . . . . . . . . . . . . . . . . . . . . 1,799,662Other accrued expenses . . . . . . . . . . . . . . . . . . . . . . . . . . . . . . . . . . . . . . . . . . . . . . . . . . . . . . . . . . . . . . . . . . . . . . . . . . . . . . . . . . . . . . . . . . . . . . . 290,020
Unrealized depreciation on: –Forward foreign currency exchange contracts . . . . . . . . . . . . . . . . . . . . . . . . . . . . . . . . . . . . . . . . . . . . . . . . . . . . . . . . . . . . . . . . . . . . . . . . . . . . . . . . . 4,956,982OTC swaps . . . . . . . . . . . . . . . . . . . . . . . . . . . . . . . . . . . . . . . . . . . . . . . . . . . . . . . . . . . . . . . . . . . . . . . . . . . . . . . . . . . . . . . . . . . . . . . . . . . . . . . . 3,016,178
Total liabilities . . . . . . . . . . . . . . . . . . . . . . . . . . . . . . . . . . . . . . . . . . . . . . . . . . . . . . . . . . . . . . . . . . . . . . . . . . . . . . . . . . . . . . . . . . . . . . . . . . . . . . . . 14,231,601
NET ASSETS . . . . . . . . . . . . . . . . . . . . . . . . . . . . . . . . . . . . . . . . . . . . . . . . . . . . . . . . . . . . . . . . . . . . . . . . . . . . . . . . . . . . . . . . . . . . . . . . . . . . . . . . $ 244,272,265
NET ASSETS CONSIST OFPaid-in capital . . . . . . . . . . . . . . . . . . . . . . . . . . . . . . . . . . . . . . . . . . . . . . . . . . . . . . . . . . . . . . . . . . . . . . . . . . . . . . . . . . . . . . . . . . . . . . . . . . . . . . . . $ 243,964,429Accumulated earnings . . . . . . . . . . . . . . . . . . . . . . . . . . . . . . . . . . . . . . . . . . . . . . . . . . . . . . . . . . . . . . . . . . . . . . . . . . . . . . . . . . . . . . . . . . . . . . . . . . 307,836NET ASSETS . . . . . . . . . . . . . . . . . . . . . . . . . . . . . . . . . . . . . . . . . . . . . . . . . . . . . . . . . . . . . . . . . . . . . . . . . . . . . . . . . . . . . . . . . . . . . . . . . . . . . . . . $ 244,272,265
(a) Investments, at cost — unaffiliated . . . . . . . . . . . . . . . . . . . . . . . . . . . . . . . . . . . . . . . . . . . . . . . . . . . . . . . . . . . . . . . . . . . . . . . . . . . . . . . . . . . . . . . . $ 133,074,664(b) Investments, at cost — affiliated . . . . . . . . . . . . . . . . . . . . . . . . . . . . . . . . . . . . . . . . . . . . . . . . . . . . . . . . . . . . . . . . . . . . . . . . . . . . . . . . . . . . . . . . . . $ 51,331,913(c) Foreign currency, at cost . . . . . . . . . . . . . . . . . . . . . . . . . . . . . . . . . . . . . . . . . . . . . . . . . . . . . . . . . . . . . . . . . . . . . . . . . . . . . . . . . . . . . . . . . . . . . . . $ 14,864,071
See notes to consolidated financial statements.
BNM0322U-2100207-6479109
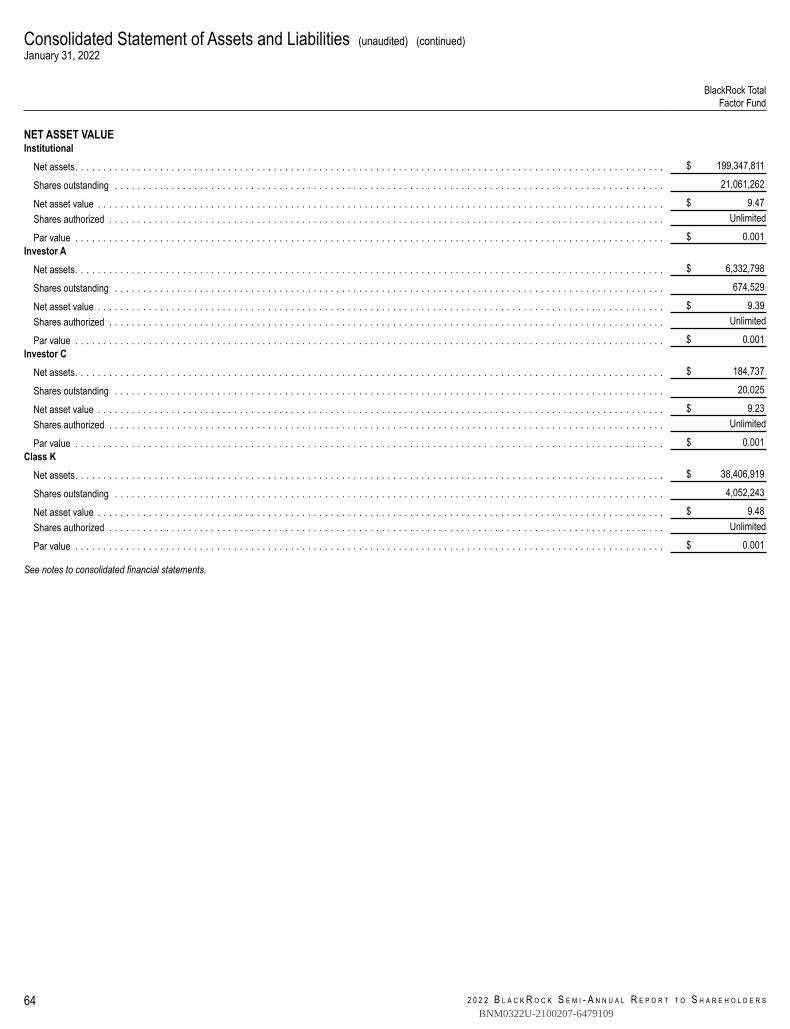
Consolidated Statement of Assets and Liabilities (unaudited) (continued)January 31, 2022
2 0 2 2 B L A C K R O C K S E M I - A N N U A L R E P O R T T O S H A R E H O L D E R S64
BlackRock TotalFactor Fund
NET ASSET VALUEInstitutional
Net assets. . . . . . . . . . . . . . . . . . . . . . . . . . . . . . . . . . . . . . . . . . . . . . . . . . . . . . . . . . . . . . . . . . . . . . . . . . . . . . . . . . . . . . . . . . . . . . . . . . . . . . . . $ 199,347,811
Shares outstanding . . . . . . . . . . . . . . . . . . . . . . . . . . . . . . . . . . . . . . . . . . . . . . . . . . . . . . . . . . . . . . . . . . . . . . . . . . . . . . . . . . . . . . . . . . . . . . . . . 21,061,262
Net asset value . . . . . . . . . . . . . . . . . . . . . . . . . . . . . . . . . . . . . . . . . . . . . . . . . . . . . . . . . . . . . . . . . . . . . . . . . . . . . . . . . . . . . . . . . . . . . . . . . . . . $ 9.47Shares authorized . . . . . . . . . . . . . . . . . . . . . . . . . . . . . . . . . . . . . . . . . . . . . . . . . . . . . . . . . . . . . . . . . . . . . . . . . . . . . . . . . . . . . . . . . . . . . . . . . . Unlimited
Par value . . . . . . . . . . . . . . . . . . . . . . . . . . . . . . . . . . . . . . . . . . . . . . . . . . . . . . . . . . . . . . . . . . . . . . . . . . . . . . . . . . . . . . . . . . . . . . . . . . . . . . . . $ 0.001Investor A
Net assets. . . . . . . . . . . . . . . . . . . . . . . . . . . . . . . . . . . . . . . . . . . . . . . . . . . . . . . . . . . . . . . . . . . . . . . . . . . . . . . . . . . . . . . . . . . . . . . . . . . . . . . . $ 6,332,798
Shares outstanding . . . . . . . . . . . . . . . . . . . . . . . . . . . . . . . . . . . . . . . . . . . . . . . . . . . . . . . . . . . . . . . . . . . . . . . . . . . . . . . . . . . . . . . . . . . . . . . . . 674,529
Net asset value . . . . . . . . . . . . . . . . . . . . . . . . . . . . . . . . . . . . . . . . . . . . . . . . . . . . . . . . . . . . . . . . . . . . . . . . . . . . . . . . . . . . . . . . . . . . . . . . . . . . $ 9.39Shares authorized . . . . . . . . . . . . . . . . . . . . . . . . . . . . . . . . . . . . . . . . . . . . . . . . . . . . . . . . . . . . . . . . . . . . . . . . . . . . . . . . . . . . . . . . . . . . . . . . . . Unlimited
Par value . . . . . . . . . . . . . . . . . . . . . . . . . . . . . . . . . . . . . . . . . . . . . . . . . . . . . . . . . . . . . . . . . . . . . . . . . . . . . . . . . . . . . . . . . . . . . . . . . . . . . . . . $ 0.001Investor C
Net assets. . . . . . . . . . . . . . . . . . . . . . . . . . . . . . . . . . . . . . . . . . . . . . . . . . . . . . . . . . . . . . . . . . . . . . . . . . . . . . . . . . . . . . . . . . . . . . . . . . . . . . . . $ 184,737
Shares outstanding . . . . . . . . . . . . . . . . . . . . . . . . . . . . . . . . . . . . . . . . . . . . . . . . . . . . . . . . . . . . . . . . . . . . . . . . . . . . . . . . . . . . . . . . . . . . . . . . . 20,025
Net asset value . . . . . . . . . . . . . . . . . . . . . . . . . . . . . . . . . . . . . . . . . . . . . . . . . . . . . . . . . . . . . . . . . . . . . . . . . . . . . . . . . . . . . . . . . . . . . . . . . . . . $ 9.23Shares authorized . . . . . . . . . . . . . . . . . . . . . . . . . . . . . . . . . . . . . . . . . . . . . . . . . . . . . . . . . . . . . . . . . . . . . . . . . . . . . . . . . . . . . . . . . . . . . . . . . . Unlimited
Par value . . . . . . . . . . . . . . . . . . . . . . . . . . . . . . . . . . . . . . . . . . . . . . . . . . . . . . . . . . . . . . . . . . . . . . . . . . . . . . . . . . . . . . . . . . . . . . . . . . . . . . . . $ 0.001Class K
Net assets. . . . . . . . . . . . . . . . . . . . . . . . . . . . . . . . . . . . . . . . . . . . . . . . . . . . . . . . . . . . . . . . . . . . . . . . . . . . . . . . . . . . . . . . . . . . . . . . . . . . . . . . $ 38,406,919
Shares outstanding . . . . . . . . . . . . . . . . . . . . . . . . . . . . . . . . . . . . . . . . . . . . . . . . . . . . . . . . . . . . . . . . . . . . . . . . . . . . . . . . . . . . . . . . . . . . . . . . . 4,052,243
Net asset value . . . . . . . . . . . . . . . . . . . . . . . . . . . . . . . . . . . . . . . . . . . . . . . . . . . . . . . . . . . . . . . . . . . . . . . . . . . . . . . . . . . . . . . . . . . . . . . . . . . . $ 9.48Shares authorized . . . . . . . . . . . . . . . . . . . . . . . . . . . . . . . . . . . . . . . . . . . . . . . . . . . . . . . . . . . . . . . . . . . . . . . . . . . . . . . . . . . . . . . . . . . . . . . . . . Unlimited
Par value . . . . . . . . . . . . . . . . . . . . . . . . . . . . . . . . . . . . . . . . . . . . . . . . . . . . . . . . . . . . . . . . . . . . . . . . . . . . . . . . . . . . . . . . . . . . . . . . . . . . . . . . $ 0.001
See notes to consolidated financial statements.
BNM0322U-2100207-6479109
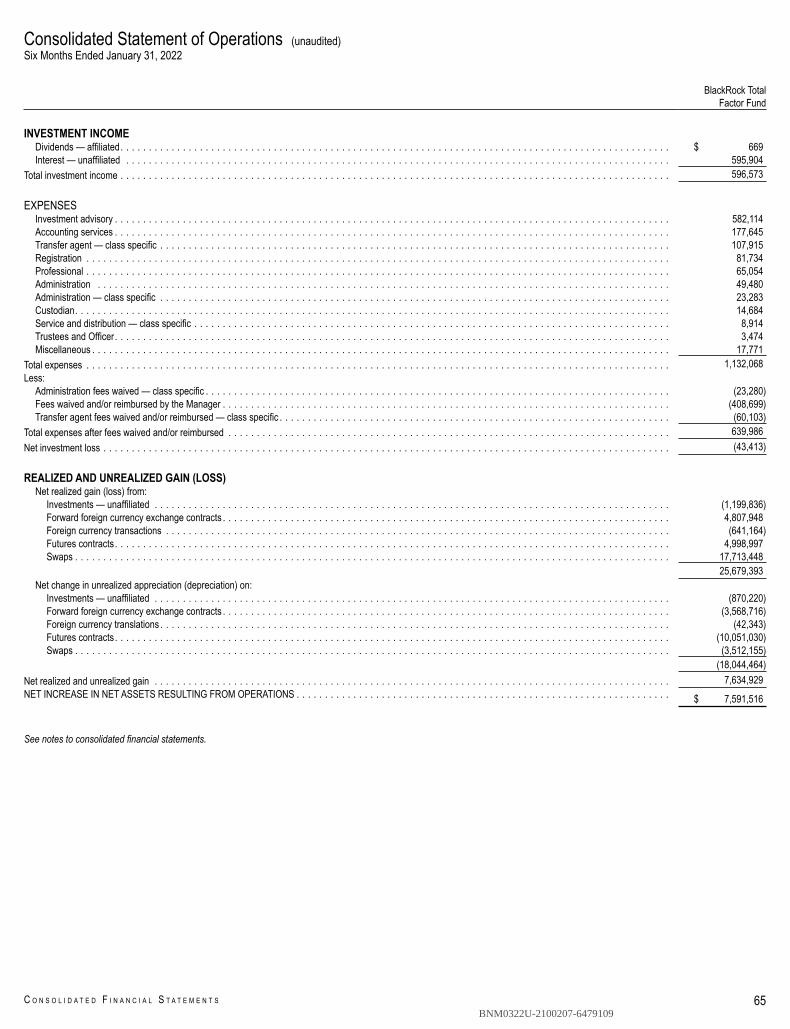
Consolidated Statement of Operations (unaudited)Six Months Ended January 31, 2022
65C O N S O L I D A T E D F I N A N C I A L S T A T E M E N T S
BlackRock TotalFactor Fund
INVESTMENT INCOMEDividends — affiliated. . . . . . . . . . . . . . . . . . . . . . . . . . . . . . . . . . . . . . . . . . . . . . . . . . . . . . . . . . . . . . . . . . . . . . . . . . . . . . . . . . . . . . . . . . . . . . . . . $ 669Interest — unaffiliated . . . . . . . . . . . . . . . . . . . . . . . . . . . . . . . . . . . . . . . . . . . . . . . . . . . . . . . . . . . . . . . . . . . . . . . . . . . . . . . . . . . . . . . . . . . . . . . . 595,904
Total investment income . . . . . . . . . . . . . . . . . . . . . . . . . . . . . . . . . . . . . . . . . . . . . . . . . . . . . . . . . . . . . . . . . . . . . . . . . . . . . . . . . . . . . . . . . . . . . . . . . 596,573
EXPENSESInvestment advisory . . . . . . . . . . . . . . . . . . . . . . . . . . . . . . . . . . . . . . . . . . . . . . . . . . . . . . . . . . . . . . . . . . . . . . . . . . . . . . . . . . . . . . . . . . . . . . . . . . 582,114Accounting services . . . . . . . . . . . . . . . . . . . . . . . . . . . . . . . . . . . . . . . . . . . . . . . . . . . . . . . . . . . . . . . . . . . . . . . . . . . . . . . . . . . . . . . . . . . . . . . . . . 177,645Transfer agent — class specific . . . . . . . . . . . . . . . . . . . . . . . . . . . . . . . . . . . . . . . . . . . . . . . . . . . . . . . . . . . . . . . . . . . . . . . . . . . . . . . . . . . . . . . . . . 107,915Registration . . . . . . . . . . . . . . . . . . . . . . . . . . . . . . . . . . . . . . . . . . . . . . . . . . . . . . . . . . . . . . . . . . . . . . . . . . . . . . . . . . . . . . . . . . . . . . . . . . . . . . . 81,734Professional . . . . . . . . . . . . . . . . . . . . . . . . . . . . . . . . . . . . . . . . . . . . . . . . . . . . . . . . . . . . . . . . . . . . . . . . . . . . . . . . . . . . . . . . . . . . . . . . . . . . . . . 65,054Administration . . . . . . . . . . . . . . . . . . . . . . . . . . . . . . . . . . . . . . . . . . . . . . . . . . . . . . . . . . . . . . . . . . . . . . . . . . . . . . . . . . . . . . . . . . . . . . . . . . . . . 49,480Administration — class specific . . . . . . . . . . . . . . . . . . . . . . . . . . . . . . . . . . . . . . . . . . . . . . . . . . . . . . . . . . . . . . . . . . . . . . . . . . . . . . . . . . . . . . . . . . 23,283Custodian. . . . . . . . . . . . . . . . . . . . . . . . . . . . . . . . . . . . . . . . . . . . . . . . . . . . . . . . . . . . . . . . . . . . . . . . . . . . . . . . . . . . . . . . . . . . . . . . . . . . . . . . . 14,684Service and distribution — class specific . . . . . . . . . . . . . . . . . . . . . . . . . . . . . . . . . . . . . . . . . . . . . . . . . . . . . . . . . . . . . . . . . . . . . . . . . . . . . . . . . . . . 8,914Trustees and Officer. . . . . . . . . . . . . . . . . . . . . . . . . . . . . . . . . . . . . . . . . . . . . . . . . . . . . . . . . . . . . . . . . . . . . . . . . . . . . . . . . . . . . . . . . . . . . . . . . . 3,474Miscellaneous . . . . . . . . . . . . . . . . . . . . . . . . . . . . . . . . . . . . . . . . . . . . . . . . . . . . . . . . . . . . . . . . . . . . . . . . . . . . . . . . . . . . . . . . . . . . . . . . . . . . . . 17,771
Total expenses . . . . . . . . . . . . . . . . . . . . . . . . . . . . . . . . . . . . . . . . . . . . . . . . . . . . . . . . . . . . . . . . . . . . . . . . . . . . . . . . . . . . . . . . . . . . . . . . . . . . . . . 1,132,068Less: –
Administration fees waived — class specific . . . . . . . . . . . . . . . . . . . . . . . . . . . . . . . . . . . . . . . . . . . . . . . . . . . . . . . . . . . . . . . . . . . . . . . . . . . . . . . . . . (23,280)Fees waived and/or reimbursed by the Manager . . . . . . . . . . . . . . . . . . . . . . . . . . . . . . . . . . . . . . . . . . . . . . . . . . . . . . . . . . . . . . . . . . . . . . . . . . . . . . . (408,699)Transfer agent fees waived and/or reimbursed — class specific . . . . . . . . . . . . . . . . . . . . . . . . . . . . . . . . . . . . . . . . . . . . . . . . . . . . . . . . . . . . . . . . . . . . . (60,103)
Total expenses after fees waived and/or reimbursed . . . . . . . . . . . . . . . . . . . . . . . . . . . . . . . . . . . . . . . . . . . . . . . . . . . . . . . . . . . . . . . . . . . . . . . . . . . . . . 639,986Net investment loss . . . . . . . . . . . . . . . . . . . . . . . . . . . . . . . . . . . . . . . . . . . . . . . . . . . . . . . . . . . . . . . . . . . . . . . . . . . . . . . . . . . . . . . . . . . . . . . . . . . . (43,413)
REALIZED AND UNREALIZED GAIN (LOSS) $ 7,634,929Net realized gain (loss) from: $ –
Investments — unaffiliated . . . . . . . . . . . . . . . . . . . . . . . . . . . . . . . . . . . . . . . . . . . . . . . . . . . . . . . . . . . . . . . . . . . . . . . . . . . . . . . . . . . . . . . . . . . (1,199,836)Forward foreign currency exchange contracts . . . . . . . . . . . . . . . . . . . . . . . . . . . . . . . . . . . . . . . . . . . . . . . . . . . . . . . . . . . . . . . . . . . . . . . . . . . . . . . 4,807,948Foreign currency transactions . . . . . . . . . . . . . . . . . . . . . . . . . . . . . . . . . . . . . . . . . . . . . . . . . . . . . . . . . . . . . . . . . . . . . . . . . . . . . . . . . . . . . . . . . (641,164)Futures contracts. . . . . . . . . . . . . . . . . . . . . . . . . . . . . . . . . . . . . . . . . . . . . . . . . . . . . . . . . . . . . . . . . . . . . . . . . . . . . . . . . . . . . . . . . . . . . . . . . . 4,998,997Swaps . . . . . . . . . . . . . . . . . . . . . . . . . . . . . . . . . . . . . . . . . . . . . . . . . . . . . . . . . . . . . . . . . . . . . . . . . . . . . . . . . . . . . . . . . . . . . . . . . . . . . . . . . 17,713,448
A 25,679,393Net change in unrealized appreciation (depreciation) on:
Investments — unaffiliated . . . . . . . . . . . . . . . . . . . . . . . . . . . . . . . . . . . . . . . . . . . . . . . . . . . . . . . . . . . . . . . . . . . . . . . . . . . . . . . . . . . . . . . . . . . (870,220)Forward foreign currency exchange contracts . . . . . . . . . . . . . . . . . . . . . . . . . . . . . . . . . . . . . . . . . . . . . . . . . . . . . . . . . . . . . . . . . . . . . . . . . . . . . . . (3,568,716)Foreign currency translations . . . . . . . . . . . . . . . . . . . . . . . . . . . . . . . . . . . . . . . . . . . . . . . . . . . . . . . . . . . . . . . . . . . . . . . . . . . . . . . . . . . . . . . . . . (42,343)Futures contracts. . . . . . . . . . . . . . . . . . . . . . . . . . . . . . . . . . . . . . . . . . . . . . . . . . . . . . . . . . . . . . . . . . . . . . . . . . . . . . . . . . . . . . . . . . . . . . . . . . (10,051,030)Swaps . . . . . . . . . . . . . . . . . . . . . . . . . . . . . . . . . . . . . . . . . . . . . . . . . . . . . . . . . . . . . . . . . . . . . . . . . . . . . . . . . . . . . . . . . . . . . . . . . . . . . . . . . (3,512,155)
A (18,044,464)Net realized and unrealized gain . . . . . . . . . . . . . . . . . . . . . . . . . . . . . . . . . . . . . . . . . . . . . . . . . . . . . . . . . . . . . . . . . . . . . . . . . . . . . . . . . . . . . . . . . . . 7,634,929NET INCREASE IN NET ASSETS RESULTING FROM OPERATIONS . . . . . . . . . . . . . . . . . . . . . . . . . . . . . . . . . . . . . . . . . . . . . . . . . . . . . . . . . . . . . . . . . . $ 7,591,516
See notes to consolidated financial statements.
BNM0322U-2100207-6479109
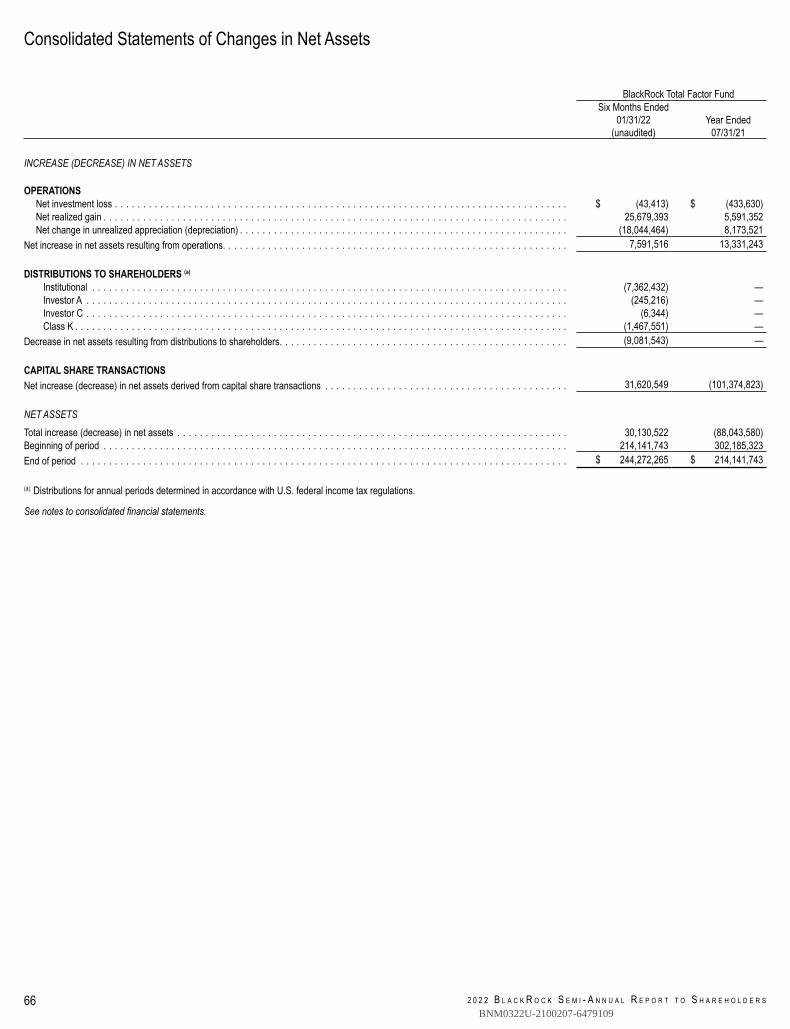
Consolidated Statements of Changes in Net Assets
2 0 2 2 B L A C K R O C K S E M I - A N N U A L R E P O R T T O S H A R E H O L D E R S66
BlackRock Total Factor FundSix Months Ended
01/31/22(unaudited)
Year Ended07/31/21
INCREASE (DECREASE) IN NET ASSETS
OPERATIONSNet investment loss . . . . . . . . . . . . . . . . . . . . . . . . . . . . . . . . . . . . . . . . . . . . . . . . . . . . . . . . . . . . . . . . . . . . . . . . . . . . . . . . $ (43,413) $ (433,630)Net realized gain . . . . . . . . . . . . . . . . . . . . . . . . . . . . . . . . . . . . . . . . . . . . . . . . . . . . . . . . . . . . . . . . . . . . . . . . . . . . . . . . . . 25,679,393 5,591,352Net change in unrealized appreciation (depreciation) . . . . . . . . . . . . . . . . . . . . . . . . . . . . . . . . . . . . . . . . . . . . . . . . . . . . . . . . . . (18,044,464) 8,173,521
Net increase in net assets resulting from operations. . . . . . . . . . . . . . . . . . . . . . . . . . . . . . . . . . . . . . . . . . . . . . . . . . . . . . . . . . . . . 7,591,516 13,331,243
DISTRIBUTIONS TO SHAREHOLDERS (a)
Institutional . . . . . . . . . . . . . . . . . . . . . . . . . . . . . . . . . . . . . . . . . . . . . . . . . . . . . . . . . . . . . . . . . . . . . . . . . . . . . . . . . . . . (7,362,432) —Investor A . . . . . . . . . . . . . . . . . . . . . . . . . . . . . . . . . . . . . . . . . . . . . . . . . . . . . . . . . . . . . . . . . . . . . . . . . . . . . . . . . . . . . (245,216) —Investor C . . . . . . . . . . . . . . . . . . . . . . . . . . . . . . . . . . . . . . . . . . . . . . . . . . . . . . . . . . . . . . . . . . . . . . . . . . . . . . . . . . . . . (6,344) —Class K . . . . . . . . . . . . . . . . . . . . . . . . . . . . . . . . . . . . . . . . . . . . . . . . . . . . . . . . . . . . . . . . . . . . . . . . . . . . . . . . . . . . . . . (1,467,551) —
Decrease in net assets resulting from distributions to shareholders. . . . . . . . . . . . . . . . . . . . . . . . . . . . . . . . . . . . . . . . . . . . . . . . . . . (9,081,543) —
CAPITAL SHARE TRANSACTIONSNet increase (decrease) in net assets derived from capital share transactions . . . . . . . . . . . . . . . . . . . . . . . . . . . . . . . . . . . . . . . . . . . 31,620,549 (101,374,823)
NET ASSETS
Total increase (decrease) in net assets . . . . . . . . . . . . . . . . . . . . . . . . . . . . . . . . . . . . . . . . . . . . . . . . . . . . . . . . . . . . . . . . . . . . . 30,130,522 (88,043,580)Beginning of period . . . . . . . . . . . . . . . . . . . . . . . . . . . . . . . . . . . . . . . . . . . . . . . . . . . . . . . . . . . . . . . . . . . . . . . . . . . . . . . . . . 214,141,743 302,185,323End of period . . . . . . . . . . . . . . . . . . . . . . . . . . . . . . . . . . . . . . . . . . . . . . . . . . . . . . . . . . . . . . . . . . . . . . . . . . . . . . . . . . . . . . $ 244,272,265 $ 214,141,743
(a) Distributions for annual periods determined in accordance with U.S. federal income tax regulations.
See notes to consolidated financial statements.
BNM0322U-2100207-6479109
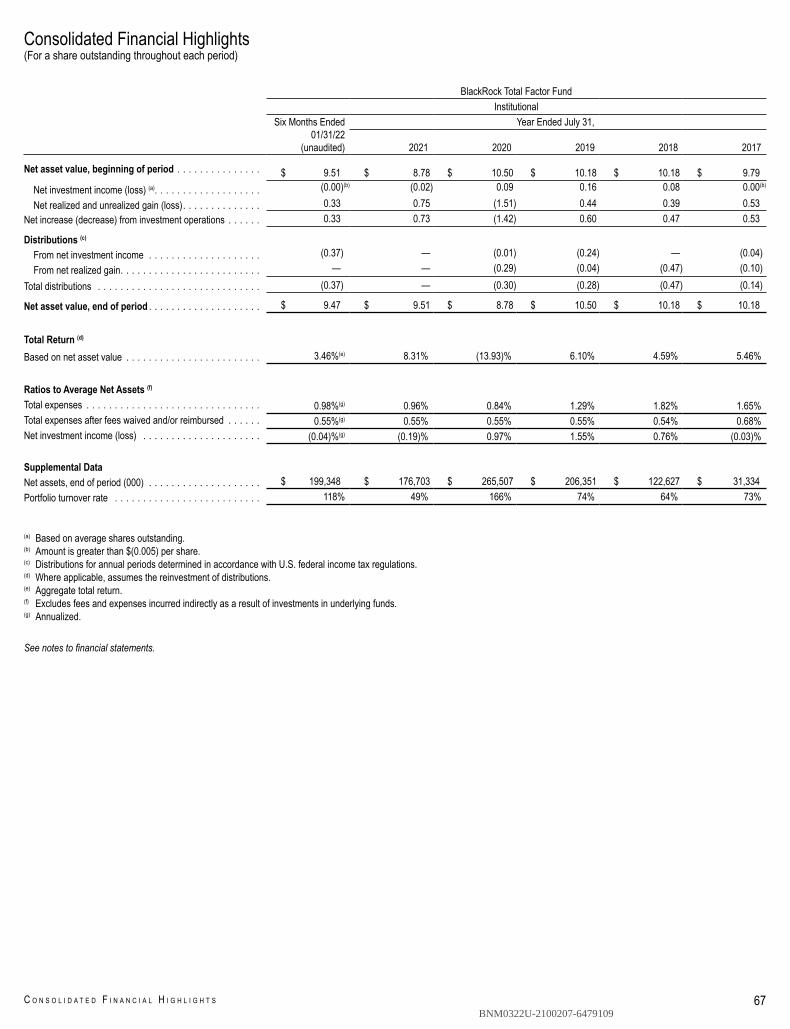
Consolidated Financial Highlights(For a share outstanding throughout each period)
67C O N S O L I D A T E D F I N A N C I A L H I G H L I G H T S
BlackRock Total Factor FundInstitutional
Six Months Ended01/31/22
(unaudited)
Year Ended July 31,
2021 2020 2019 2018 2017
Net asset value, beginning of period . . . . . . . . . . . . . . . $ 9.51 $ 8.78 $ 10.50 $ 10.18 $ 10.18 $ 9.79Net investment income (loss) (a). . . . . . . . . . . . . . . . . . . (0.00)(b) (0.02) 0.09 0.16 0.08 0.00(b)
Net realized and unrealized gain (loss). . . . . . . . . . . . . . 0.33 0.75 (1.51) 0.44 0.39 0.53Net increase (decrease) from investment operations . . . . . . 0.33 0.73 (1.42) 0.60 0.47 0.53
Distributions (c) – – – – – –From net investment income . . . . . . . . . . . . . . . . . . . . (0.37) — (0.01) (0.24) — (0.04)From net realized gain. . . . . . . . . . . . . . . . . . . . . . . . . — — (0.29) (0.04) (0.47) (0.10)
Total distributions . . . . . . . . . . . . . . . . . . . . . . . . . . . . . (0.37) — (0.30) (0.28) (0.47) (0.14)
Net asset value, end of period . . . . . . . . . . . . . . . . . . . . $ 9.47 $ 9.51 $ 8.78 $ 10.50 $ 10.18 $ 10.18
Total Return (d) 3.46% 8.31% (13.93)% 6.10% 4.59% —Based on net asset value . . . . . . . . . . . . . . . . . . . . . . . . 3.46%(e) 8.31% (13.93)% 6.10% 4.59% 5.46%
Ratios to Average Net Assets (f)
Total expenses . . . . . . . . . . . . . . . . . . . . . . . . . . . . . . . 0.98%(g) 0.96% 0.84% 1.29% 1.82% 1.65%Total expenses after fees waived and/or reimbursed . . . . . . 0.55%(g) 0.55% 0.55% 0.55% 0.54% 0.68%Net investment income (loss) . . . . . . . . . . . . . . . . . . . . . (0.04)%(g) (0.19)% 0.97% 1.55% 0.76% (0.03)%
Supplemental DataNet assets, end of period (000) . . . . . . . . . . . . . . . . . . . . $ 199,348 $ 176,703 $ 265,507 $ 206,351 $ 122,627 $ 31,334Portfolio turnover rate . . . . . . . . . . . . . . . . . . . . . . . . . . 118% 49% 166% 74% 64% 73%
(a) Based on average shares outstanding.(b) Amount is greater than $(0.005) per share.(c) Distributions for annual periods determined in accordance with U.S. federal income tax regulations.(d) Where applicable, assumes the reinvestment of distributions.(e) Aggregate total return.(f) Excludes fees and expenses incurred indirectly as a result of investments in underlying funds.(g) Annualized.
See notes to financial statements.
BNM0322U-2100207-6479109
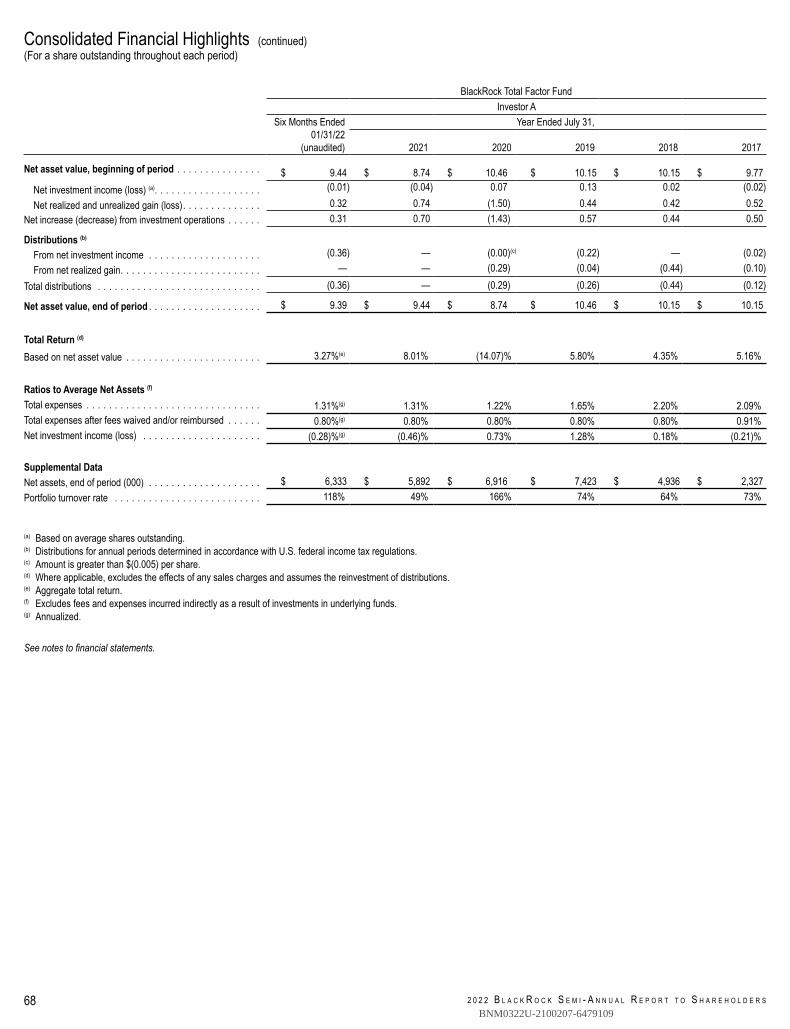
Consolidated Financial Highlights (continued)(For a share outstanding throughout each period)
2 0 2 2 B L A C K R O C K S E M I - A N N U A L R E P O R T T O S H A R E H O L D E R S68
BlackRock Total Factor FundInvestor A
Six Months Ended01/31/22
(unaudited)
Year Ended July 31,
2021 2020 2019 2018 2017
Net asset value, beginning of period . . . . . . . . . . . . . . . $ 9.44 $ 8.74 $ 10.46 $ 10.15 $ 10.15 $ 9.77Net investment income (loss) (a). . . . . . . . . . . . . . . . . . . (0.01) (0.04) 0.07 0.13 0.02 (0.02)Net realized and unrealized gain (loss). . . . . . . . . . . . . . 0.32 0.74 (1.50) 0.44 0.42 0.52
Net increase (decrease) from investment operations . . . . . . 0.31 0.70 (1.43) 0.57 0.44 0.50
Distributions (b) – – – – – –From net investment income . . . . . . . . . . . . . . . . . . . . (0.36) — (0.00)(c) (0.22) — (0.02)From net realized gain. . . . . . . . . . . . . . . . . . . . . . . . . — — (0.29) (0.04) (0.44) (0.10)
Total distributions . . . . . . . . . . . . . . . . . . . . . . . . . . . . . (0.36) — (0.29) (0.26) (0.44) (0.12)
Net asset value, end of period . . . . . . . . . . . . . . . . . . . . $ 9.39 $ 9.44 $ 8.74 $ 10.46 $ 10.15 $ 10.15
Total Return (d) 3.27% 8.01% (14.07)% 5.80% 4.35% —Based on net asset value . . . . . . . . . . . . . . . . . . . . . . . . 3.27%(e) 8.01% (14.07)% 5.80% 4.35% 5.16%
Ratios to Average Net Assets (f)
Total expenses . . . . . . . . . . . . . . . . . . . . . . . . . . . . . . . 1.31%(g) 1.31% 1.22% 1.65% 2.20% 2.09%Total expenses after fees waived and/or reimbursed . . . . . . 0.80%(g) 0.80% 0.80% 0.80% 0.80% 0.91%Net investment income (loss) . . . . . . . . . . . . . . . . . . . . . (0.28)%(g) (0.46)% 0.73% 1.28% 0.18% (0.21)%
Supplemental DataNet assets, end of period (000) . . . . . . . . . . . . . . . . . . . . $ 6,333 $ 5,892 $ 6,916 $ 7,423 $ 4,936 $ 2,327Portfolio turnover rate . . . . . . . . . . . . . . . . . . . . . . . . . . 118% 49% 166% 74% 64% 73%
(a) Based on average shares outstanding.(b) Distributions for annual periods determined in accordance with U.S. federal income tax regulations.(c) Amount is greater than $(0.005) per share.(d) Where applicable, excludes the effects of any sales charges and assumes the reinvestment of distributions.(e) Aggregate total return.(f) Excludes fees and expenses incurred indirectly as a result of investments in underlying funds.(g) Annualized.
See notes to financial statements.
BNM0322U-2100207-6479109
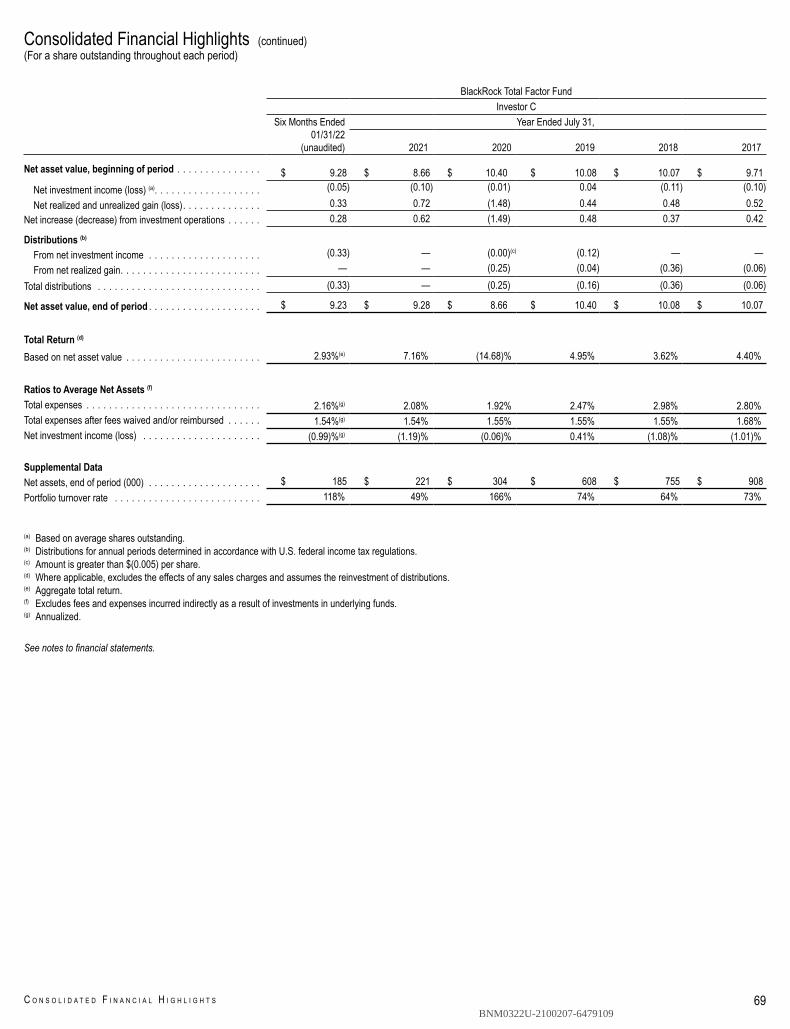
Consolidated Financial Highlights (continued)(For a share outstanding throughout each period)
69C O N S O L I D A T E D F I N A N C I A L H I G H L I G H T S
BlackRock Total Factor FundInvestor C
Six Months Ended01/31/22
(unaudited)
Year Ended July 31,
2021 2020 2019 2018 2017
Net asset value, beginning of period . . . . . . . . . . . . . . . $ 9.28 $ 8.66 $ 10.40 $ 10.08 $ 10.07 $ 9.71Net investment income (loss) (a). . . . . . . . . . . . . . . . . . . (0.05) (0.10) (0.01) 0.04 (0.11) (0.10)Net realized and unrealized gain (loss). . . . . . . . . . . . . . 0.33 0.72 (1.48) 0.44 0.48 0.52
Net increase (decrease) from investment operations . . . . . . 0.28 0.62 (1.49) 0.48 0.37 0.42
Distributions (b) – – – – – –From net investment income . . . . . . . . . . . . . . . . . . . . (0.33) — (0.00)(c) (0.12) — —From net realized gain. . . . . . . . . . . . . . . . . . . . . . . . . — — (0.25) (0.04) (0.36) (0.06)
Total distributions . . . . . . . . . . . . . . . . . . . . . . . . . . . . . (0.33) — (0.25) (0.16) (0.36) (0.06)
Net asset value, end of period . . . . . . . . . . . . . . . . . . . . $ 9.23 $ 9.28 $ 8.66 $ 10.40 $ 10.08 $ 10.07
Total Return (d) 2.93% 7.16% (14.68)% 4.95% 3.62% —Based on net asset value . . . . . . . . . . . . . . . . . . . . . . . . 2.93%(e) 7.16% (14.68)% 4.95% 3.62% 4.40%
Ratios to Average Net Assets (f)
Total expenses . . . . . . . . . . . . . . . . . . . . . . . . . . . . . . . 2.16%(g) 2.08% 1.92% 2.47% 2.98% 2.80%Total expenses after fees waived and/or reimbursed . . . . . . 1.54%(g) 1.54% 1.55% 1.55% 1.55% 1.68%Net investment income (loss) . . . . . . . . . . . . . . . . . . . . . (0.99)%(g) (1.19)% (0.06)% 0.41% (1.08)% (1.01)%
Supplemental DataNet assets, end of period (000) . . . . . . . . . . . . . . . . . . . . $ 185 $ 221 $ 304 $ 608 $ 755 $ 908Portfolio turnover rate . . . . . . . . . . . . . . . . . . . . . . . . . . 118% 49% 166% 74% 64% 73%
(a) Based on average shares outstanding.(b) Distributions for annual periods determined in accordance with U.S. federal income tax regulations.(c) Amount is greater than $(0.005) per share.(d) Where applicable, excludes the effects of any sales charges and assumes the reinvestment of distributions.(e) Aggregate total return.(f) Excludes fees and expenses incurred indirectly as a result of investments in underlying funds.(g) Annualized.
See notes to financial statements.
BNM0322U-2100207-6479109
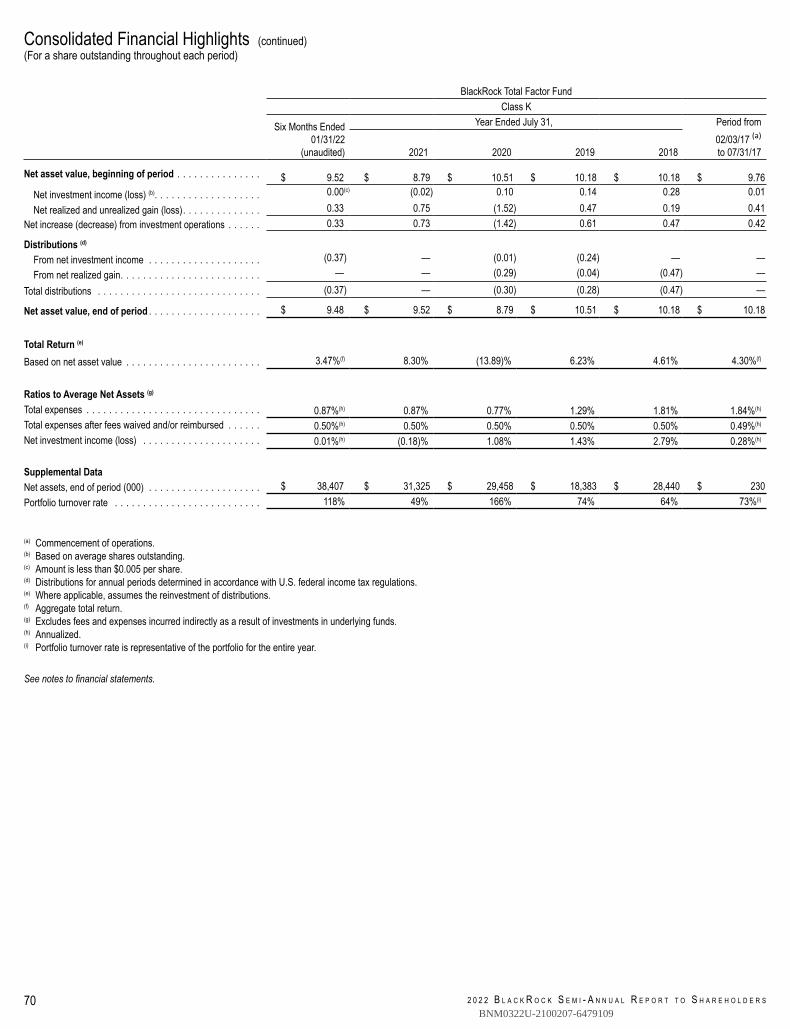
Consolidated Financial Highlights (continued)(For a share outstanding throughout each period)
2 0 2 2 B L A C K R O C K S E M I - A N N U A L R E P O R T T O S H A R E H O L D E R S70
BlackRock Total Factor FundClass K
Six Months Ended01/31/22
(unaudited)
Year Ended July 31, Period from02/03/17 (a)
to 07/31/172021 2020 2019 2018
Net asset value, beginning of period . . . . . . . . . . . . . . . $ 9.52 $ 8.79 $ 10.51 $ 10.18 $ 10.18 $ 9.76Net investment income (loss) (b). . . . . . . . . . . . . . . . . . . 0.00(c) (0.02) 0.10 0.14 0.28 0.01Net realized and unrealized gain (loss). . . . . . . . . . . . . . 0.33 0.75 (1.52) 0.47 0.19 0.41
Net increase (decrease) from investment operations . . . . . . 0.33 0.73 (1.42) 0.61 0.47 0.42
Distributions (d) – – – – – –From net investment income . . . . . . . . . . . . . . . . . . . . (0.37) — (0.01) (0.24) — —From net realized gain. . . . . . . . . . . . . . . . . . . . . . . . . — — (0.29) (0.04) (0.47) —
Total distributions . . . . . . . . . . . . . . . . . . . . . . . . . . . . . (0.37) — (0.30) (0.28) (0.47) —
Net asset value, end of period . . . . . . . . . . . . . . . . . . . . $ 9.48 $ 9.52 $ 8.79 $ 10.51 $ 10.18 $ 10.18
Total Return (e) 3.47% 8.30% (13.89)% 6.23% 4.61% —Based on net asset value . . . . . . . . . . . . . . . . . . . . . . . . 3.47%(f) 8.30% (13.89)% 6.23% 4.61% 4.30%(f)
Ratios to Average Net Assets (g)
Total expenses . . . . . . . . . . . . . . . . . . . . . . . . . . . . . . . 0.87%(h) 0.87% 0.77% 1.29% 1.81% 1.84%(h)
Total expenses after fees waived and/or reimbursed . . . . . . 0.50%(h) 0.50% 0.50% 0.50% 0.50% 0.49%(h)
Net investment income (loss) . . . . . . . . . . . . . . . . . . . . . 0.01%(h) (0.18)% 1.08% 1.43% 2.79% 0.28%(h)
Supplemental DataNet assets, end of period (000) . . . . . . . . . . . . . . . . . . . . $ 38,407 $ 31,325 $ 29,458 $ 18,383 $ 28,440 $ 230Portfolio turnover rate . . . . . . . . . . . . . . . . . . . . . . . . . . 118% 49% 166% 74% 64% 73%(i)
(a) Commencement of operations.(b) Based on average shares outstanding.(c) Amount is less than $0.005 per share.(d) Distributions for annual periods determined in accordance with U.S. federal income tax regulations.(e) Where applicable, assumes the reinvestment of distributions.(f) Aggregate total return.(g) Excludes fees and expenses incurred indirectly as a result of investments in underlying funds.(h) Annualized.(i) Portfolio turnover rate is representative of the portfolio for the entire year.
See notes to financial statements.
BNM0322U-2100207-6479109
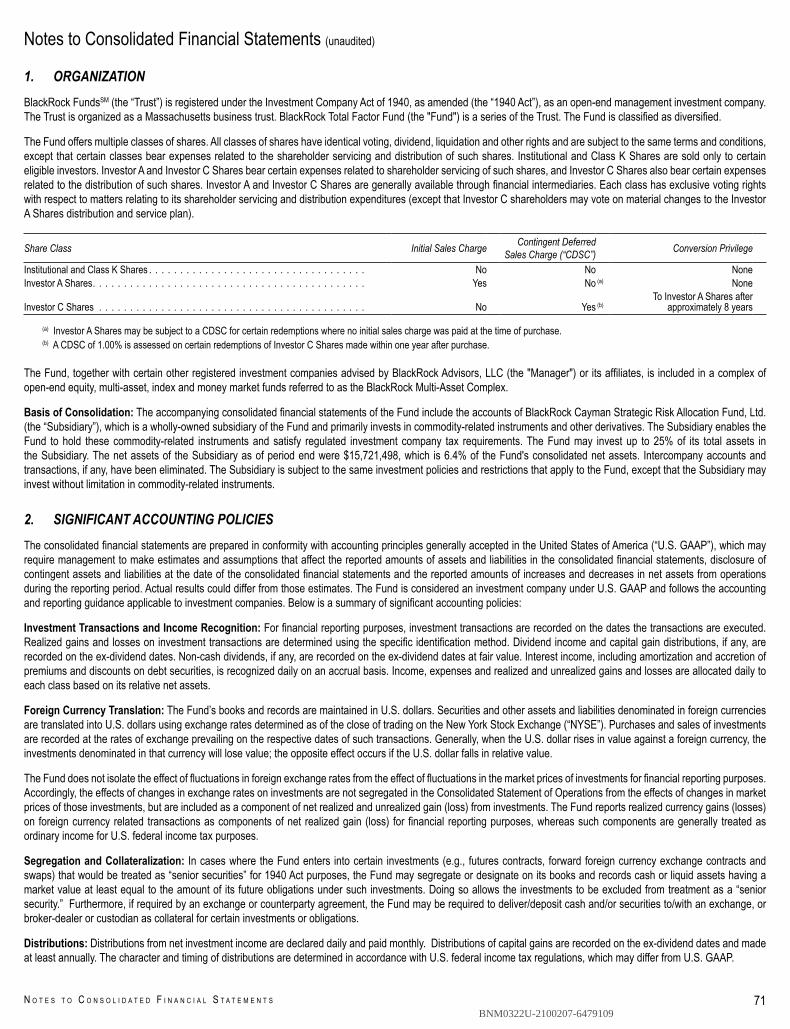
Notes to Consolidated Financial Statements (unaudited)
71N O T E S T O C O N S O L I D A T E D F I N A N C I A L S T A T E M E N T S
1. ORGANIZATIONBlackRock FundsSM (the “Trust”) is registered under the Investment Company Act of 1940, as amended (the “1940 Act”), as an open-end management investment company.The Trust is organized as a Massachusetts business trust. BlackRock Total Factor Fund (the "Fund") is a series of the Trust. The Fund is classified as diversified.
The Fund offers multiple classes of shares. All classes of shares have identical voting, dividend, liquidation and other rights and are subject to the same terms and conditions,except that certain classes bear expenses related to the shareholder servicing and distribution of such shares. Institutional and Class K Shares are sold only to certaineligible investors. Investor A and Investor C Shares bear certain expenses related to shareholder servicing of such shares, and Investor C Shares also bear certain expensesrelated to the distribution of such shares. Investor A and Investor C Shares are generally available through financial intermediaries. Each class has exclusive voting rightswith respect to matters relating to its shareholder servicing and distribution expenditures (except that Investor C shareholders may vote on material changes to the InvestorA Shares distribution and service plan).
Share Class Initial Sales Charge Contingent DeferredSales Charge (“CDSC”) Conversion Privilege
Institutional and Class K Shares . . . . . . . . . . . . . . . . . . . . . . . . . . . . . . . . . . . No No NoneInvestor A Shares. . . . . . . . . . . . . . . . . . . . . . . . . . . . . . . . . . . . . . . . . . . . Yes No (a) None
Investor C Shares . . . . . . . . . . . . . . . . . . . . . . . . . . . . . . . . . . . . . . . . . . . No Yes (b)To Investor A Shares after
approximately 8 years
(a) Investor A Shares may be subject to a CDSC for certain redemptions where no initial sales charge was paid at the time of purchase.(b) A CDSC of 1.00% is assessed on certain redemptions of Investor C Shares made within one year after purchase.
The Fund, together with certain other registered investment companies advised by BlackRock Advisors, LLC (the "Manager") or its affiliates, is included in a complex ofopen-end equity, multi-asset, index and money market funds referred to as the BlackRock Multi-Asset Complex.
Basis of Consolidation: The accompanying consolidated financial statements of the Fund include the accounts of BlackRock Cayman Strategic Risk Allocation Fund, Ltd.(the “Subsidiary”), which is a wholly-owned subsidiary of the Fund and primarily invests in commodity-related instruments and other derivatives. The Subsidiary enables theFund to hold these commodity-related instruments and satisfy regulated investment company tax requirements. The Fund may invest up to 25% of its total assets inthe Subsidiary. The net assets of the Subsidiary as of period end were $15,721,498, which is 6.4% of the Fund's consolidated net assets. Intercompany accounts andtransactions, if any, have been eliminated. The Subsidiary is subject to the same investment policies and restrictions that apply to the Fund, except that the Subsidiary mayinvest without limitation in commodity-related instruments.
2. SIGNIFICANT ACCOUNTING POLICIESThe consolidated financial statements are prepared in conformity with accounting principles generally accepted in the United States of America (“U.S. GAAP”), which mayrequire management to make estimates and assumptions that affect the reported amounts of assets and liabilities in the consolidated financial statements, disclosure ofcontingent assets and liabilities at the date of the consolidated financial statements and the reported amounts of increases and decreases in net assets from operationsduring the reporting period. Actual results could differ from those estimates. The Fund is considered an investment company under U.S. GAAP and follows the accountingand reporting guidance applicable to investment companies. Below is a summary of significant accounting policies:
Investment Transactions and Income Recognition: For financial reporting purposes, investment transactions are recorded on the dates the transactions are executed.Realized gains and losses on investment transactions are determined using the specific identification method. Dividend income and capital gain distributions, if any, arerecorded on the ex-dividend dates. Non-cash dividends, if any, are recorded on the ex-dividend dates at fair value. Interest income, including amortization and accretion ofpremiums and discounts on debt securities, is recognized daily on an accrual basis. Income, expenses and realized and unrealized gains and losses are allocated daily toeach class based on its relative net assets.
Foreign Currency Translation: The Fund’s books and records are maintained in U.S. dollars. Securities and other assets and liabilities denominated in foreign currenciesare translated into U.S. dollars using exchange rates determined as of the close of trading on the New York Stock Exchange (“NYSE”). Purchases and sales of investmentsare recorded at the rates of exchange prevailing on the respective dates of such transactions. Generally, when the U.S. dollar rises in value against a foreign currency, theinvestments denominated in that currency will lose value; the opposite effect occurs if the U.S. dollar falls in relative value.
The Fund does not isolate the effect of fluctuations in foreign exchange rates from the effect of fluctuations in the market prices of investments for financial reporting purposes.Accordingly, the effects of changes in exchange rates on investments are not segregated in the Consolidated Statement of Operations from the effects of changes in marketprices of those investments, but are included as a component of net realized and unrealized gain (loss) from investments. The Fund reports realized currency gains (losses)on foreign currency related transactions as components of net realized gain (loss) for financial reporting purposes, whereas such components are generally treated asordinary income for U.S. federal income tax purposes.
Segregation and Collateralization: In cases where the Fund enters into certain investments (e.g., futures contracts, forward foreign currency exchange contracts andswaps) that would be treated as “senior securities” for 1940 Act purposes, the Fund may segregate or designate on its books and records cash or liquid assets having amarket value at least equal to the amount of its future obligations under such investments. Doing so allows the investments to be excluded from treatment as a “seniorsecurity.” Furthermore, if required by an exchange or counterparty agreement, the Fund may be required to deliver/deposit cash and/or securities to/with an exchange, orbroker-dealer or custodian as collateral for certain investments or obligations.
Distributions: Distributions from net investment income are declared daily and paid monthly. Distributions of capital gains are recorded on the ex-dividend dates and madeat least annually. The character and timing of distributions are determined in accordance with U.S. federal income tax regulations, which may differ from U.S. GAAP.
BNM0322U-2100207-6479109
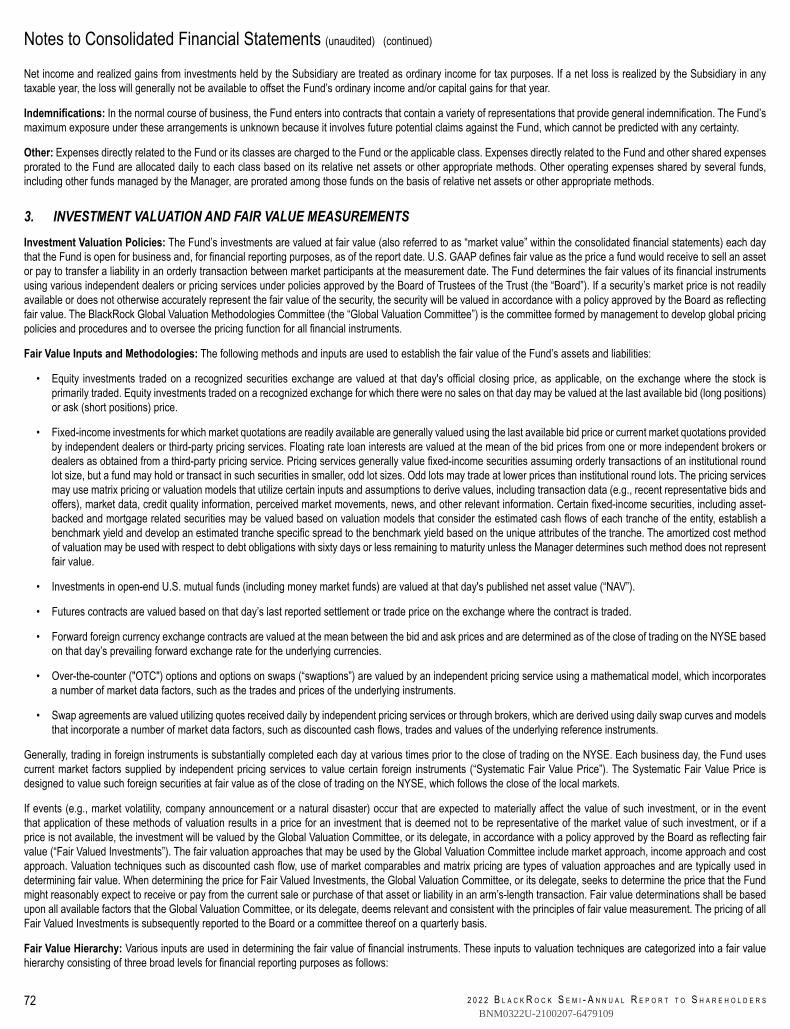
Notes to Consolidated Financial Statements (unaudited) (continued)
2 0 2 2 B L A C K R O C K S E M I - A N N U A L R E P O R T T O S H A R E H O L D E R S72
Net income and realized gains from investments held by the Subsidiary are treated as ordinary income for tax purposes. If a net loss is realized by the Subsidiary in anytaxable year, the loss will generally not be available to offset the Fund’s ordinary income and/or capital gains for that year.
Indemnifications: In the normal course of business, the Fund enters into contracts that contain a variety of representations that provide general indemnification. The Fund’smaximum exposure under these arrangements is unknown because it involves future potential claims against the Fund, which cannot be predicted with any certainty.
Other: Expenses directly related to the Fund or its classes are charged to the Fund or the applicable class. Expenses directly related to the Fund and other shared expensesprorated to the Fund are allocated daily to each class based on its relative net assets or other appropriate methods. Other operating expenses shared by several funds,including other funds managed by the Manager, are prorated among those funds on the basis of relative net assets or other appropriate methods.
3. INVESTMENT VALUATION AND FAIR VALUE MEASUREMENTSInvestment Valuation Policies: The Fund’s investments are valued at fair value (also referred to as “market value” within the consolidated financial statements) each daythat the Fund is open for business and, for financial reporting purposes, as of the report date. U.S. GAAP defines fair value as the price a fund would receive to sell an assetor pay to transfer a liability in an orderly transaction between market participants at the measurement date. The Fund determines the fair values of its financial instrumentsusing various independent dealers or pricing services under policies approved by the Board of Trustees of the Trust (the “Board”). If a security’s market price is not readilyavailable or does not otherwise accurately represent the fair value of the security, the security will be valued in accordance with a policy approved by the Board as reflectingfair value. The BlackRock Global Valuation Methodologies Committee (the “Global Valuation Committee”) is the committee formed by management to develop global pricingpolicies and procedures and to oversee the pricing function for all financial instruments.
Fair Value Inputs and Methodologies: The following methods and inputs are used to establish the fair value of the Fund’s assets and liabilities:
• Equity investments traded on a recognized securities exchange are valued at that day's official closing price, as applicable, on the exchange where the stock isprimarily traded. Equity investments traded on a recognized exchange for which there were no sales on that day may be valued at the last available bid (long positions)or ask (short positions) price.
• Fixed-income investments for which market quotations are readily available are generally valued using the last available bid price or current market quotations providedby independent dealers or third-party pricing services. Floating rate loan interests are valued at the mean of the bid prices from one or more independent brokers ordealers as obtained from a third-party pricing service. Pricing services generally value fixed-income securities assuming orderly transactions of an institutional roundlot size, but a fund may hold or transact in such securities in smaller, odd lot sizes. Odd lots may trade at lower prices than institutional round lots. The pricing servicesmay use matrix pricing or valuation models that utilize certain inputs and assumptions to derive values, including transaction data (e.g., recent representative bids andoffers), market data, credit quality information, perceived market movements, news, and other relevant information. Certain fixed-income securities, including asset-backed and mortgage related securities may be valued based on valuation models that consider the estimated cash flows of each tranche of the entity, establish abenchmark yield and develop an estimated tranche specific spread to the benchmark yield based on the unique attributes of the tranche. The amortized cost methodof valuation may be used with respect to debt obligations with sixty days or less remaining to maturity unless the Manager determines such method does not representfair value.
• Investments in open-end U.S. mutual funds (including money market funds) are valued at that day's published net asset value (“NAV”).
• Futures contracts are valued based on that day’s last reported settlement or trade price on the exchange where the contract is traded.
• Forward foreign currency exchange contracts are valued at the mean between the bid and ask prices and are determined as of the close of trading on the NYSE basedon that day’s prevailing forward exchange rate for the underlying currencies.
• Over-the-counter ("OTC") options and options on swaps (“swaptions”) are valued by an independent pricing service using a mathematical model, which incorporatesa number of market data factors, such as the trades and prices of the underlying instruments.
• Swap agreements are valued utilizing quotes received daily by independent pricing services or through brokers, which are derived using daily swap curves and modelsthat incorporate a number of market data factors, such as discounted cash flows, trades and values of the underlying reference instruments.
Generally, trading in foreign instruments is substantially completed each day at various times prior to the close of trading on the NYSE. Each business day, the Fund usescurrent market factors supplied by independent pricing services to value certain foreign instruments (“Systematic Fair Value Price”). The Systematic Fair Value Price isdesigned to value such foreign securities at fair value as of the close of trading on the NYSE, which follows the close of the local markets.
If events (e.g., market volatility, company announcement or a natural disaster) occur that are expected to materially affect the value of such investment, or in the eventthat application of these methods of valuation results in a price for an investment that is deemed not to be representative of the market value of such investment, or if aprice is not available, the investment will be valued by the Global Valuation Committee, or its delegate, in accordance with a policy approved by the Board as reflecting fairvalue (“Fair Valued Investments”). The fair valuation approaches that may be used by the Global Valuation Committee include market approach, income approach and costapproach. Valuation techniques such as discounted cash flow, use of market comparables and matrix pricing are types of valuation approaches and are typically used indetermining fair value. When determining the price for Fair Valued Investments, the Global Valuation Committee, or its delegate, seeks to determine the price that the Fundmight reasonably expect to receive or pay from the current sale or purchase of that asset or liability in an arm’s-length transaction. Fair value determinations shall be basedupon all available factors that the Global Valuation Committee, or its delegate, deems relevant and consistent with the principles of fair value measurement. The pricing of allFair Valued Investments is subsequently reported to the Board or a committee thereof on a quarterly basis.
Fair Value Hierarchy: Various inputs are used in determining the fair value of financial instruments. These inputs to valuation techniques are categorized into a fair valuehierarchy consisting of three broad levels for financial reporting purposes as follows:
BNM0322U-2100207-6479109
Notes to Consolidated Financial Statements (unaudited) (continued)
73N O T E S T O C O N S O L I D A T E D F I N A N C I A L S T A T E M E N T S
• Level 1 — Unadjusted price quotations in active markets/exchanges for identical assets or liabilities that the Fund has the ability to access;
• Level 2 — Other observable inputs (including, but not limited to, quoted prices for similar assets or liabilities in markets that are active, quoted prices for identical orsimilar assets or liabilities in markets that are not active, inputs other than quoted prices that are observable for the assets or liabilities (such as interest rates, yieldcurves, volatilities, prepayment speeds, loss severities, credit risks and default rates) or other market–corroborated inputs); and
• Level 3 — Unobservable inputs based on the best information available in the circumstances, to the extent observable inputs are not available (including the GlobalValuation Committee's assumptions used in determining the fair value of financial instruments).
The hierarchy gives the highest priority to unadjusted quoted prices in active markets for identical assets or liabilities (Level 1 measurements) and the lowest priority tounobservable inputs (Level 3 measurements). Accordingly, the degree of judgment exercised in determining fair value is greatest for instruments categorized in Level 3.The inputs used to measure fair value may fall into different levels of the fair value hierarchy. In such cases, for disclosure purposes, the fair value hierarchy classification isdetermined based on the lowest level input that is significant to the fair value measurement in its entirety. Investments classified within Level 3 have significant unobservableinputs used by the Global Valuation Committee in determining the price for Fair Valued Investments. Level 3 investments include equity or debt issued by privately heldcompanies that may not have a secondary market and/or may have a limited number of investors. The categorization of a value determined for financial instruments is basedon the pricing transparency of the financial instruments and is not necessarily an indication of the risks associated with investing in those securities.
4. SECURITIES AND OTHER INVESTMENTSInflation-Indexed Bonds: Inflation-indexed bonds (other than municipal inflation-indexed and certain corporate inflation-indexed bonds) are fixed-income securities whoseprincipal value is periodically adjusted according to the rate of inflation. If the index measuring inflation rises or falls, the principal value of inflation-indexed bonds (other thanmunicipal inflation-indexed and certain corporate inflation-indexed bonds) will be adjusted upward or downward, and consequently the interest payable on these securities(calculated with respect to a larger or smaller principal amount) will be increased or reduced, respectively. Any upward or downward adjustment in the principal amount ofan inflation-indexed bond is included as interest income in the Consolidated Statement of Operations, even though investors do not receive their principal until maturity.Repayment of the original bond principal upon maturity (as adjusted for inflation) is guaranteed in the case of U.S. Treasury inflation-indexed bonds. For bonds that do notprovide a similar guarantee, the adjusted principal value of the bond repaid at maturity may be less than the original principal. With regard to municipal inflation-indexed bondsand certain corporate inflation-indexed bonds, the inflation adjustment is typically reflected in the semi-annual coupon payment. As a result, the principal value of municipalinflation-indexed bonds and such corporate inflation-indexed bonds does not adjust according to the rate of inflation.
5. DERIVATIVE FINANCIAL INSTRUMENTSThe Fund engages in various portfolio investment strategies using derivative contracts both to increase the returns of the Fund and/or to manage its exposure to certain riskssuch as credit risk, equity risk, interest rate risk, foreign currency exchange rate risk, commodity price risk or other risks (e.g., inflation risk). Derivative financial instrumentscategorized by risk exposure are included in the Consolidated Schedule of Investments. These contracts may be transacted on an exchange or OTC.
Futures Contracts: Futures contracts are purchased or sold to gain exposure to, or manage exposure to, changes in interest rates (interest rate risk) and changes in thevalue of equity securities (equity risk) or foreign currencies (foreign currency exchange rate risk).
Futures contracts are exchange-traded agreements between the Fund and a counterparty to buy or sell a specific quantity of an underlying instrument at a specified price andon a specified date. Depending on the terms of a contract, it is settled either through physical delivery of the underlying instrument on the settlement date or by payment ofa cash amount on the settlement date. Upon entering into a futures contract, the Fund is required to deposit initial margin with the broker in the form of cash or securities inan amount that varies depending on a contract’s size and risk profile. The initial margin deposit must then be maintained at an established level over the life of the contract.Amounts pledged, which are considered restricted, are included in cash pledged for futures contracts in the Consolidated Statement of Assets and Liabilities.
Securities deposited as initial margin are designated in the Consolidated Schedule of Investments and cash deposited, if any, are shown as cash pledged for futures contractsin the Consolidated Statement of Assets and Liabilities. Pursuant to the contract, the Fund agrees to receive from or pay to the broker an amount of cash equal to the dailyfluctuation in market value of the contract (“variation margin”). Variation margin is recorded as unrealized appreciation (depreciation) and, if any, shown as variation marginreceivable (or payable) on futures contracts in the Consolidated Statement of Assets and Liabilities. When the contract is closed, a realized gain or loss is recorded in theConsolidated Statement of Operations equal to the difference between the notional amount of the contract at the time it was opened and the notional amount at the time itwas closed. The use of futures contracts involves the risk of an imperfect correlation in the movements in the price of futures contracts and interest rates, foreign currencyexchange rates or underlying assets.
Forward Foreign Currency Exchange Contracts: Forward foreign currency exchange contracts are entered into to gain or reduce exposure to foreign currencies (foreigncurrency exchange rate risk).
A forward foreign currency exchange contract is an agreement between two parties to buy and sell a currency at a set exchange rate on a specified date. These contracts helpto manage the overall exposure to the currencies in which some of the investments held by the Fund are denominated and in some cases, may be used to obtain exposureto a particular market. The contracts are traded OTC and not on an organized exchange.
The contract is marked-to-market daily and the change in market value is recorded as unrealized appreciation (depreciation) in the Consolidated Statement of Assets andLiabilities. When a contract is closed, a realized gain or loss is recorded in the Consolidated Statement of Operations equal to the difference between the value at the timeit was opened and the value at the time it was closed. Non-deliverable forward foreign currency exchange contracts are settled with the counterparty in cash without thedelivery of foreign currency. The use of forward foreign currency exchange contracts involves the risk that the value of a forward foreign currency exchange contract changesunfavorably due to movements in the value of the referenced foreign currencies, and such value may exceed the amount(s) reflected in the Consolidated Statement of Assetsand Liabilities. Cash amounts pledged for forward foreign currency exchange contracts are considered restricted and are included in cash pledged as collateral for OTC
BNM0322U-2100207-6479109
Notes to Consolidated Financial Statements (unaudited) (continued)
2 0 2 2 B L A C K R O C K S E M I - A N N U A L R E P O R T T O S H A R E H O L D E R S74
derivatives in the Consolidated Statement of Assets and Liabilities. A Fund’s risk of loss from counterparty credit risk on OTC derivatives is generally limited to the aggregateunrealized gain netted against any collateral held by the Fund.
Options: The Fund may purchase and write call and put options to increase or decrease its exposure to the risks of underlying instruments, including equity risk, interest raterisk and/or commodity price risk and/or, in the case of options written, to generate gains from options premiums.
A call option gives the purchaser (holder) of the option the right (but not the obligation) to buy, and obligates the seller (writer) to sell (when the option is exercised) theunderlying instrument at the exercise or strike price at any time or at a specified time during the option period. A put option gives the holder the right to sell and obligates thewriter to buy the underlying instrument at the exercise or strike price at any time or at a specified time during the option period.
Premiums paid on options purchased and premiums received on options written, as well as the daily fluctuation in market value, are included in investments at value –unaffiliated and options written at value, respectively, in the Consolidated Statement of Assets and Liabilities. When an instrument is purchased or sold through the exerciseof an option, the premium is offset against the cost or proceeds of the underlying instrument. When an option expires, a realized gain or loss is recorded in the ConsolidatedStatement of Operations to the extent of the premiums received or paid. When an option is closed or sold, a gain or loss is recorded in the Consolidated Statement ofOperations to the extent the cost of the closing transaction exceeds the premiums received or paid. When the Fund writes a call option, such option is typically “covered,”meaning that it holds the underlying instrument subject to being called by the option counterparty. When the Fund writes a put option, cash is segregated in an amountsufficient to cover the obligation. These amounts, which are considered restricted, are included in cash pledged as collateral for options written in the Consolidated Statementof Assets and Liabilities.
• Swaptions – The Fund may purchase and write options on swaps (“swaptions”) primarily to preserve a return or spread on a particular investment or portion of theFund’s holdings, as a duration management technique or to protect against an increase in the price of securities it anticipates purchasing at a later date. The purchaserand writer of a swaption is buying or granting the right to enter into a previously agreed upon interest rate or credit default swap agreement (interest rate risk and/orcredit risk) at any time before the expiration of the option.
In purchasing and writing options, the Fund bears the risk of an unfavorable change in the value of the underlying instrument or the risk that it may not be able to enter intoa closing transaction due to an illiquid market. Exercise of a written option could result in the Fund purchasing or selling a security when it otherwise would not, or at a pricedifferent from the current market value.
Swaps: Swap contracts are entered into to manage exposure to issuers, markets and securities. Such contracts are agreements between the Fund and a counterparty tomake periodic net payments on a specified notional amount or a net payment upon termination. Swap agreements are privately negotiated in the OTC market and may beentered into as a bilateral contract (“OTC swaps”) or centrally cleared (“centrally cleared swaps”).
For OTC swaps, any upfront premiums paid and any upfront fees received are shown as swap premiums paid and swap premiums received, respectively, in the ConsolidatedStatement of Assets and Liabilities and amortized over the term of the contract. The daily fluctuation in market value is recorded as unrealized appreciation (depreciation) onOTC Swaps in the Consolidated Statement of Assets and Liabilities. Payments received or paid are recorded in the Consolidated Statement of Operations as realized gainsor losses, respectively. When an OTC swap is terminated, a realized gain or loss is recorded in the Consolidated Statement of Operations equal to the difference between theproceeds from (or cost of) the closing transaction and the Fund’s basis in the contract, if any. Generally, the basis of the contract is the premium received or paid.
In a centrally cleared swap, immediately following execution of the swap contract, the swap contract is novated to a central counterparty (the “CCP”) and the CCP becomesthe Fund’s counterparty on the swap. The Fund is required to interface with the CCP through the broker. Upon entering into a centrally cleared swap, the Fund is requiredto deposit initial margin with the broker in the form of cash or securities in an amount that varies depending on the size and risk profile of the particular swap. Securitiesdeposited as initial margin are designated in the Consolidated Schedule of Investments and cash deposited is shown as cash pledged for centrally cleared swaps in theConsolidated Statement of Assets and Liabilities. Amounts pledged, which are considered restricted cash, are included in cash pledged for centrally cleared swaps in theConsolidated Statement of Assets and Liabilities. Pursuant to the contract, the Fund agrees to receive from or pay to the broker variation margin. Variation margin is recordedas unrealized appreciation (depreciation) and shown as variation margin receivable (or payable) on centrally cleared swaps in the Consolidated Statement of Assets andLiabilities. Payments received from (paid to) the counterparty are amortized over the term of the contract and recorded as realized gains (losses) in the ConsolidatedStatement of Operations, including those at termination.
• Credit default swaps — Credit default swaps are entered into to manage exposure to the market or certain sectors of the market, to reduce risk exposure to defaults ofcorporate and/or sovereign issuers or to create exposure to corporate and/or sovereign issuers to which a fund is not otherwise exposed (credit risk).
The Fund may either buy or sell (write) credit default swaps on single-name issuers (corporate or sovereign), a combination or basket of single-name issuers or tradedindexes. Credit default swaps are agreements in which the protection buyer pays fixed periodic payments to the seller in consideration for a promise from the protectionseller to make a specific payment should a negative credit event take place with respect to the referenced entity (e.g., bankruptcy, failure to pay, obligation acceleration,repudiation, moratorium or restructuring). As a buyer, if an underlying credit event occurs, the Fund will either (i) receive from the seller an amount equal to the notionalamount of the swap and deliver the referenced security or underlying securities comprising the index, or (ii) receive a net settlement of cash equal to the notionalamount of the swap less the recovery value of the security or underlying securities comprising the index. As a seller (writer), if an underlying credit event occurs, theFund will either pay the buyer an amount equal to the notional amount of the swap and take delivery of the referenced security or underlying securities comprising theindex or pay a net settlement of cash equal to the notional amount of the swap less the recovery value of the security or underlying securities comprising the index.
• Total return swaps — Total return swaps are entered into to obtain exposure to a security or market without owning such security or investing directly in such marketor to exchange the risk/return of one security or market (e.g., fixed-income) with another security or market (e.g., equity or commodity prices) (equity risk, commodityprice risk and/or interest rate risk).
Total return swaps are agreements in which there is an exchange of cash flows whereby one party commits to make payments based on the total return (distributionsplus capital gains/losses) of an underlying instrument, or basket of underlying instruments, in exchange for fixed or floating rate interest payments. If the total return
BNM0322U-2100207-6479109
Notes to Consolidated Financial Statements (unaudited) (continued)
75N O T E S T O C O N S O L I D A T E D F I N A N C I A L S T A T E M E N T S
of the instrument(s) or index underlying the transaction exceeds or falls short of the offsetting fixed or floating interest rate obligation, the Fund receives payment fromor makes a payment to the counterparty.
Certain total return swaps are designed to function as a portfolio of direct investments in long and short equity positions. This means that the Fund has the ability totrade in and out of these long and short positions within the swap and will receive the economic benefits and risks equivalent to direct investment in these positions,subject to certain adjustments due to events related to the counterparty. Benefits and risks include capital appreciation (depreciation), corporate actions and dividendsreceived and paid, all of which are reflected in the swap’s market value. The market value also includes interest charges and credits (“financing fees”) related to thenotional values of the long and short positions and cash balances within the swap. These interest charges and credits are based on a specified benchmark rate plusor minus a specified spread determined based upon the country and/or currency of the positions in the portfolio.
Positions within the swap and financing fees are reset periodically. During a reset, any unrealized appreciation (depreciation) on positions and accrued financing feesbecome available for cash settlement between the Fund and the counterparty. The amounts that are available for cash settlement are recorded as realized gains orlosses in the Consolidated Statement of Operations. Cash settlement in and out of the swap may occur at a reset date or any other date, at the discretion of the Fundand the counterparty, over the life of the agreement. Certain swaps have no stated expiration and can be terminated by either party at any time.
Swap transactions involve, to varying degrees, elements of interest rate, credit and market risk in excess of the amounts recognized in the Consolidated Statement of Assetsand Liabilities. Such risks involve the possibility that there will be no liquid market for these agreements, that the counterparty to the agreements may default on its obligationto perform or disagree as to the meaning of the contractual terms in the agreements, and that there may be unfavorable changes in interest rates and/or market valuesassociated with these transactions.
Master Netting Arrangements: In order to define its contractual rights and to secure rights that will help it mitigate its counterparty risk, the Fund may enter into anInternational Swaps and Derivatives Association, Inc. Master Agreement (“ISDA Master Agreement”) or similar agreement with its counterparties. An ISDA Master Agreementis a bilateral agreement between a Fund and a counterparty that governs certain OTC derivatives and typically contains, among other things, collateral posting terms andnetting provisions in the event of a default and/or termination event. Under an ISDA Master Agreement, a Fund may, under certain circumstances, offset with the counterpartycertain derivative financial instruments’ payables and/or receivables with collateral held and/or posted and create one single net payment. The provisions of the ISDA MasterAgreement typically permit a single net payment in the event of default including the bankruptcy or insolvency of the counterparty. However, bankruptcy or insolvency lawsof a particular jurisdiction may impose restrictions on or prohibitions against the right of offset in bankruptcy, insolvency or other events.
Collateral Requirements: For derivatives traded under an ISDA Master Agreement, the collateral requirements are typically calculated by netting the mark-to-market amountfor each transaction under such agreement and comparing that amount to the value of any collateral currently pledged by the Fund and the counterparty.
Cash collateral that has been pledged to cover obligations of the Fund and cash collateral received from the counterparty, if any, is reported separately in the ConsolidatedStatement of Assets and Liabilities as cash pledged as collateral and cash received as collateral, respectively. Non-cash collateral pledged by the Fund, if any, is noted in theConsolidated Schedule of Investments. Generally, the amount of collateral due from or to a counterparty is subject to a certain minimum transfer amount threshold beforea transfer is required, which is determined at the close of business of the Fund. Any additional required collateral is delivered to/pledged by the Fund on the next businessday. Typically, the counterparty is not permitted to sell, re-pledge or use cash and non-cash collateral it receives. The Fund generally agrees not to use non-cash collateralthat it receives but may, absent default or certain other circumstances defined in the underlying ISDA Master Agreement, be permitted to use cash collateral received. Insuch cases, interest may be paid pursuant to the collateral arrangement with the counterparty. To the extent amounts due to the Fund from the counterparties are not fullycollateralized, the Fund bears the risk of loss from counterparty non-performance. Likewise, to the extent the Fund has delivered collateral to a counterparty and stands readyto perform under the terms of its agreement with such counterparty, the Fund bears the risk of loss from a counterparty in the amount of the value of the collateral in the eventthe counterparty fails to return such collateral. Based on the terms of agreements, collateral may not be required for all derivative contracts.
For financial reporting purposes, the Fund does not offset derivative assets and derivative liabilities that are subject to netting arrangements, if any, in the ConsolidatedStatement of Assets and Liabilities.
6. INVESTMENT ADVISORY AGREEMENT AND OTHER TRANSACTIONS WITH AFFILIATESInvestment Advisory: The Trust, on behalf of the Fund, entered into an Investment Advisory Agreement with the Manager, the Fund’s investment adviser and an indirect,wholly-owned subsidiary of BlackRock, Inc. (“BlackRock”), to provide investment advisory services. The Manager is responsible for the management of the Fund’s portfolioand provides the personnel, facilities, equipment and certain other services necessary to the operations of the Fund.
For such services, the Fund pays the Manager a monthly fee at an annual rate equal to the following percentages of the average daily value of the Fund’s net assets:
Average Daily Net AssetsInvestment
Advisory FeesFirst $1 billion . . . . . . . . . . . . . . . . . . . . . . . . . . . . . . . . . . . . . . . . . . . . . . . . . . . . . . . . . . . . . . . . . . . . . . . . . . . . . . . . . . . . . . . . . . . . . . . . . . . . . . . . . 0.50%$1 billion - $3 billion . . . . . . . . . . . . . . . . . . . . . . . . . . . . . . . . . . . . . . . . . . . . . . . . . . . . . . . . . . . . . . . . . . . . . . . . . . . . . . . . . . . . . . . . . . . . . . . . . . . . . 0.47$3 billion - $5 billion . . . . . . . . . . . . . . . . . . . . . . . . . . . . . . . . . . . . . . . . . . . . . . . . . . . . . . . . . . . . . . . . . . . . . . . . . . . . . . . . . . . . . . . . . . . . . . . . . . . . . 0.45$5 billion - $10 billion . . . . . . . . . . . . . . . . . . . . . . . . . . . . . . . . . . . . . . . . . . . . . . . . . . . . . . . . . . . . . . . . . . . . . . . . . . . . . . . . . . . . . . . . . . . . . . . . . . . . 0.44Greater than $10 billion. . . . . . . . . . . . . . . . . . . . . . . . . . . . . . . . . . . . . . . . . . . . . . . . . . . . . . . . . . . . . . . . . . . . . . . . . . . . . . . . . . . . . . . . . . . . . . . . . . . 0.43
The Manager provides investment management and other services to the Subsidiary. The Manager does not receive separate compensation from the Subsidiary for providinginvestment management or administrative services. However, the Fund pays the Manager based on the Fund's net assets, which includes the assets of the Subsidiary.
BNM0322U-2100207-6479109
Notes to Consolidated Financial Statements (unaudited) (continued)
2 0 2 2 B L A C K R O C K S E M I - A N N U A L R E P O R T T O S H A R E H O L D E R S76
The Manager entered into a sub-advisory agreement with BlackRock International Limited (“BIL”), an affiliate of the Manager. The Manager pays BIL for services it providesfor that portion of the Fund for which BIL acts as sub-adviser, a monthly fee that is equal to a percentage of the investment advisory fees paid by the Fund to the Manager.
Service and Distribution Fees: The Trust, on behalf of the Fund, entered into a Distribution Agreement and a Distribution and Service Plan with BlackRock Investments, LLC(“BRIL”), an affiliate of the Manager. Pursuant to the Distribution and Service Plan and in accordance with Rule 12b-1 under the 1940 Act, the Fund pays BRIL ongoing serviceand distribution fees. The fees are accrued daily and paid monthly at annual rates based upon the average daily net assets of the relevant share class of the Fund as follows:
Share Class Service Fees Distribution FeesInvestor A. . . . . . . . . . . . . . . . . . . . . . . . . . . . . . . . . . . . . . . . . . . . . . . . . . . . . . . . . . . . . . . . . . . . . . . . . . . . . . . . . . . . . . . . . . . . . . . . . 0.25% —%Investor C. . . . . . . . . . . . . . . . . . . . . . . . . . . . . . . . . . . . . . . . . . . . . . . . . . . . . . . . . . . . . . . . . . . . . . . . . . . . . . . . . . . . . . . . . . . . . . . . . 0.25 0.75
BRIL and broker-dealers, pursuant to sub-agreements with BRIL, provide shareholder servicing and distribution services to the Fund. The ongoing service and/or distributionfee compensates BRIL and each broker-dealer for providing shareholder servicing and/or distribution related services to shareholders.
For the six months ended January 31, 2022, the following table shows the class specific service and distribution fees borne directly by each share class of the Fund:
Service andDistribution
FeesInvestor A. . . . . . . . . . . . . . . . . . . . . . . . . . . . . . . . . . . . . . . . . . . . . . . . . . . . . . . . . . . . . . . . . . . . . . . . . . . . . . . . . . . . . . . . . . . . . . . . . . . . . . . . $ 7,854Investor C. . . . . . . . . . . . . . . . . . . . . . . . . . . . . . . . . . . . . . . . . . . . . . . . . . . . . . . . . . . . . . . . . . . . . . . . . . . . . . . . . . . . . . . . . . . . . . . . . . . . . . . . 1,060
$ 8,914
Administration: The Trust, on behalf of the Fund, entered into an Administration Agreement with the Manager, an indirect, wholly-owned subsidiary of BlackRock, to provideadministrative services. For these services, the Manager receives an administration fee computed daily and payable monthly, based on a percentage of the average daily netassets of the Fund. The administration fee, which is shown as administration in the Consolidated Statement of Operations, is paid at the annual rates below.
Average Daily Net Assets Administration FeesFirst $500 million . . . . . . . . . . . . . . . . . . . . . . . . . . . . . . . . . . . . . . . . . . . . . . . . . . . . . . . . . . . . . . . . . . . . . . . . . . . . . . . . . . . . . . . . . . . . . 0.0425%$500 million - $1 billion . . . . . . . . . . . . . . . . . . . . . . . . . . . . . . . . . . . . . . . . . . . . . . . . . . . . . . . . . . . . . . . . . . . . . . . . . . . . . . . . . . . . . . . . . 0.0400$1 billion - $2 billion . . . . . . . . . . . . . . . . . . . . . . . . . . . . . . . . . . . . . . . . . . . . . . . . . . . . . . . . . . . . . . . . . . . . . . . . . . . . . . . . . . . . . . . . . . . 0.0375$2 billion - $4 billion . . . . . . . . . . . . . . . . . . . . . . . . . . . . . . . . . . . . . . . . . . . . . . . . . . . . . . . . . . . . . . . . . . . . . . . . . . . . . . . . . . . . . . . . . . . 0.0350$4 billion - $13 billion . . . . . . . . . . . . . . . . . . . . . . . . . . . . . . . . . . . . . . . . . . . . . . . . . . . . . . . . . . . . . . . . . . . . . . . . . . . . . . . . . . . . . . . . . . 0.0325Greater than $13 billion . . . . . . . . . . . . . . . . . . . . . . . . . . . . . . . . . . . . . . . . . . . . . . . . . . . . . . . . . . . . . . . . . . . . . . . . . . . . . . . . . . . . . . . . . 0.0300
In addition, the Manager charges each of the share classes an administration fee, which is shown as administration — class specific in the Consolidated Statement ofOperations, at an annual rate of 0.02% of the average daily net assets of each respective class.
For the six months ended January 31, 2022, the Fund paid the following to the Manager in return for these services, which are included in administration — class specificin the Consolidated Statement of Operations:
Institutional . . . . . . . . . . . . . . . . . . . . . . . . . . . . . . . . . . . . . . . . . . . . . . . . . . . . . . . . . . . . . . . . . . . . . . . . . . . . . . . . . . . . . . . . . . . . . . . . . . . . . . . $ 18,975Investor A. . . . . . . . . . . . . . . . . . . . . . . . . . . . . . . . . . . . . . . . . . . . . . . . . . . . . . . . . . . . . . . . . . . . . . . . . . . . . . . . . . . . . . . . . . . . . . . . . . . . . . . . 629Investor C. . . . . . . . . . . . . . . . . . . . . . . . . . . . . . . . . . . . . . . . . . . . . . . . . . . . . . . . . . . . . . . . . . . . . . . . . . . . . . . . . . . . . . . . . . . . . . . . . . . . . . . . 21Class K . . . . . . . . . . . . . . . . . . . . . . . . . . . . . . . . . . . . . . . . . . . . . . . . . . . . . . . . . . . . . . . . . . . . . . . . . . . . . . . . . . . . . . . . . . . . . . . . . . . . . . . . . 3,658
$ 23,283
Transfer Agent: Pursuant to written agreements, certain financial intermediaries, some of which may be affiliates, provide the Fund with sub-accounting, recordkeeping,sub-transfer agency and other administrative services with respect to servicing of underlying investor accounts. For these services, these entities receive an asset-based feeor an annual fee per shareholder account, which will vary depending on share class and/or net assets. For the six months ended January 31, 2022, the Fund did not pay anyamounts to affiliates in return for these services.
The Manager maintains a call center that is responsible for providing certain shareholder services to the Fund. Shareholder services include responding to inquiries andprocessing purchases and sales based upon instructions from shareholders. For the six months ended January 31, 2022, the Fund reimbursed the Manager the followingamounts for costs incurred in running the call center, which are included in transfer agent — class specific in the Consolidated Statement of Operations:
Institutional . . . . . . . . . . . . . . . . . . . . . . . . . . . . . . . . . . . . . . . . . . . . . . . . . . . . . . . . . . . . . . . . . . . . . . . . . . . . . . . . . . . . . . . . . . . . . . . . . . . . $ 114Investor A. . . . . . . . . . . . . . . . . . . . . . . . . . . . . . . . . . . . . . . . . . . . . . . . . . . . . . . . . . . . . . . . . . . . . . . . . . . . . . . . . . . . . . . . . . . . . . . . . . . . . 11
$ 125
BNM0322U-2100207-6479109
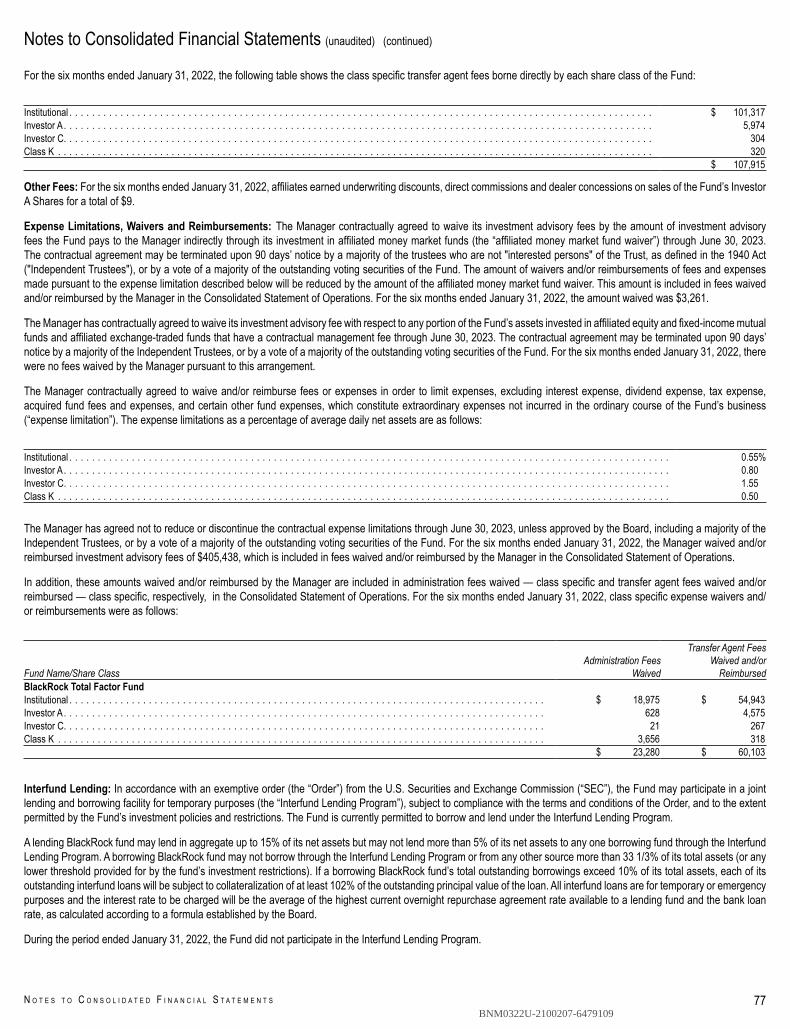
Notes to Consolidated Financial Statements (unaudited) (continued)
77N O T E S T O C O N S O L I D A T E D F I N A N C I A L S T A T E M E N T S
For the six months ended January 31, 2022, the following table shows the class specific transfer agent fees borne directly by each share class of the Fund:
Institutional . . . . . . . . . . . . . . . . . . . . . . . . . . . . . . . . . . . . . . . . . . . . . . . . . . . . . . . . . . . . . . . . . . . . . . . . . . . . . . . . . . . . . . . . . . . . . . . . . . . . . . . $ 101,317Investor A. . . . . . . . . . . . . . . . . . . . . . . . . . . . . . . . . . . . . . . . . . . . . . . . . . . . . . . . . . . . . . . . . . . . . . . . . . . . . . . . . . . . . . . . . . . . . . . . . . . . . . . . 5,974Investor C. . . . . . . . . . . . . . . . . . . . . . . . . . . . . . . . . . . . . . . . . . . . . . . . . . . . . . . . . . . . . . . . . . . . . . . . . . . . . . . . . . . . . . . . . . . . . . . . . . . . . . . . 304Class K . . . . . . . . . . . . . . . . . . . . . . . . . . . . . . . . . . . . . . . . . . . . . . . . . . . . . . . . . . . . . . . . . . . . . . . . . . . . . . . . . . . . . . . . . . . . . . . . . . . . . . . . . 320
$ 107,915
Other Fees: For the six months ended January 31, 2022, affiliates earned underwriting discounts, direct commissions and dealer concessions on sales of the Fund’s InvestorA Shares for a total of $9.
Expense Limitations, Waivers and Reimbursements: The Manager contractually agreed to waive its investment advisory fees by the amount of investment advisoryfees the Fund pays to the Manager indirectly through its investment in affiliated money market funds (the “affiliated money market fund waiver”) through June 30, 2023.The contractual agreement may be terminated upon 90 days’ notice by a majority of the trustees who are not "interested persons" of the Trust, as defined in the 1940 Act("Independent Trustees"), or by a vote of a majority of the outstanding voting securities of the Fund. The amount of waivers and/or reimbursements of fees and expensesmade pursuant to the expense limitation described below will be reduced by the amount of the affiliated money market fund waiver. This amount is included in fees waivedand/or reimbursed by the Manager in the Consolidated Statement of Operations. For the six months ended January 31, 2022, the amount waived was $3,261.
The Manager has contractually agreed to waive its investment advisory fee with respect to any portion of the Fund’s assets invested in affiliated equity and fixed-income mutualfunds and affiliated exchange-traded funds that have a contractual management fee through June 30, 2023. The contractual agreement may be terminated upon 90 days’notice by a majority of the Independent Trustees, or by a vote of a majority of the outstanding voting securities of the Fund. For the six months ended January 31, 2022, therewere no fees waived by the Manager pursuant to this arrangement.
The Manager contractually agreed to waive and/or reimburse fees or expenses in order to limit expenses, excluding interest expense, dividend expense, tax expense,acquired fund fees and expenses, and certain other fund expenses, which constitute extraordinary expenses not incurred in the ordinary course of the Fund’s business(“expense limitation”). The expense limitations as a percentage of average daily net assets are as follows:
Institutional . . . . . . . . . . . . . . . . . . . . . . . . . . . . . . . . . . . . . . . . . . . . . . . . . . . . . . . . . . . . . . . . . . . . . . . . . . . . . . . . . . . . . . . . . . . . . . . . . . . . . . . . . . 0.55%Investor A. . . . . . . . . . . . . . . . . . . . . . . . . . . . . . . . . . . . . . . . . . . . . . . . . . . . . . . . . . . . . . . . . . . . . . . . . . . . . . . . . . . . . . . . . . . . . . . . . . . . . . . . . . . 0.80Investor C. . . . . . . . . . . . . . . . . . . . . . . . . . . . . . . . . . . . . . . . . . . . . . . . . . . . . . . . . . . . . . . . . . . . . . . . . . . . . . . . . . . . . . . . . . . . . . . . . . . . . . . . . . . 1.55Class K . . . . . . . . . . . . . . . . . . . . . . . . . . . . . . . . . . . . . . . . . . . . . . . . . . . . . . . . . . . . . . . . . . . . . . . . . . . . . . . . . . . . . . . . . . . . . . . . . . . . . . . . . . . . 0.50
The Manager has agreed not to reduce or discontinue the contractual expense limitations through June 30, 2023, unless approved by the Board, including a majority of theIndependent Trustees, or by a vote of a majority of the outstanding voting securities of the Fund. For the six months ended January 31, 2022, the Manager waived and/orreimbursed investment advisory fees of $405,438, which is included in fees waived and/or reimbursed by the Manager in the Consolidated Statement of Operations.
In addition, these amounts waived and/or reimbursed by the Manager are included in administration fees waived — class specific and transfer agent fees waived and/orreimbursed — class specific, respectively, in the Consolidated Statement of Operations. For the six months ended January 31, 2022, class specific expense waivers and/or reimbursements were as follows:
Fund Name/Share ClassAdministration Fees
Waived
Transfer Agent FeesWaived and/or
ReimbursedBlackRock Total Factor FundInstitutional . . . . . . . . . . . . . . . . . . . . . . . . . . . . . . . . . . . . . . . . . . . . . . . . . . . . . . . . . . . . . . . . . . . . . . . . . . . . . . . . . . . . $ 18,975 $ 54,943Investor A. . . . . . . . . . . . . . . . . . . . . . . . . . . . . . . . . . . . . . . . . . . . . . . . . . . . . . . . . . . . . . . . . . . . . . . . . . . . . . . . . . . . . 628 4,575Investor C. . . . . . . . . . . . . . . . . . . . . . . . . . . . . . . . . . . . . . . . . . . . . . . . . . . . . . . . . . . . . . . . . . . . . . . . . . . . . . . . . . . . . 21 267Class K . . . . . . . . . . . . . . . . . . . . . . . . . . . . . . . . . . . . . . . . . . . . . . . . . . . . . . . . . . . . . . . . . . . . . . . . . . . . . . . . . . . . . . 3,656 318
$ 23,280 $ 60,103
Interfund Lending: In accordance with an exemptive order (the “Order”) from the U.S. Securities and Exchange Commission (“SEC”), the Fund may participate in a jointlending and borrowing facility for temporary purposes (the “Interfund Lending Program”), subject to compliance with the terms and conditions of the Order, and to the extentpermitted by the Fund’s investment policies and restrictions. The Fund is currently permitted to borrow and lend under the Interfund Lending Program.
A lending BlackRock fund may lend in aggregate up to 15% of its net assets but may not lend more than 5% of its net assets to any one borrowing fund through the InterfundLending Program. A borrowing BlackRock fund may not borrow through the Interfund Lending Program or from any other source more than 33 1/3% of its total assets (or anylower threshold provided for by the fund’s investment restrictions). If a borrowing BlackRock fund’s total outstanding borrowings exceed 10% of its total assets, each of itsoutstanding interfund loans will be subject to collateralization of at least 102% of the outstanding principal value of the loan. All interfund loans are for temporary or emergencypurposes and the interest rate to be charged will be the average of the highest current overnight repurchase agreement rate available to a lending fund and the bank loanrate, as calculated according to a formula established by the Board.
During the period ended January 31, 2022, the Fund did not participate in the Interfund Lending Program.
BNM0322U-2100207-6479109
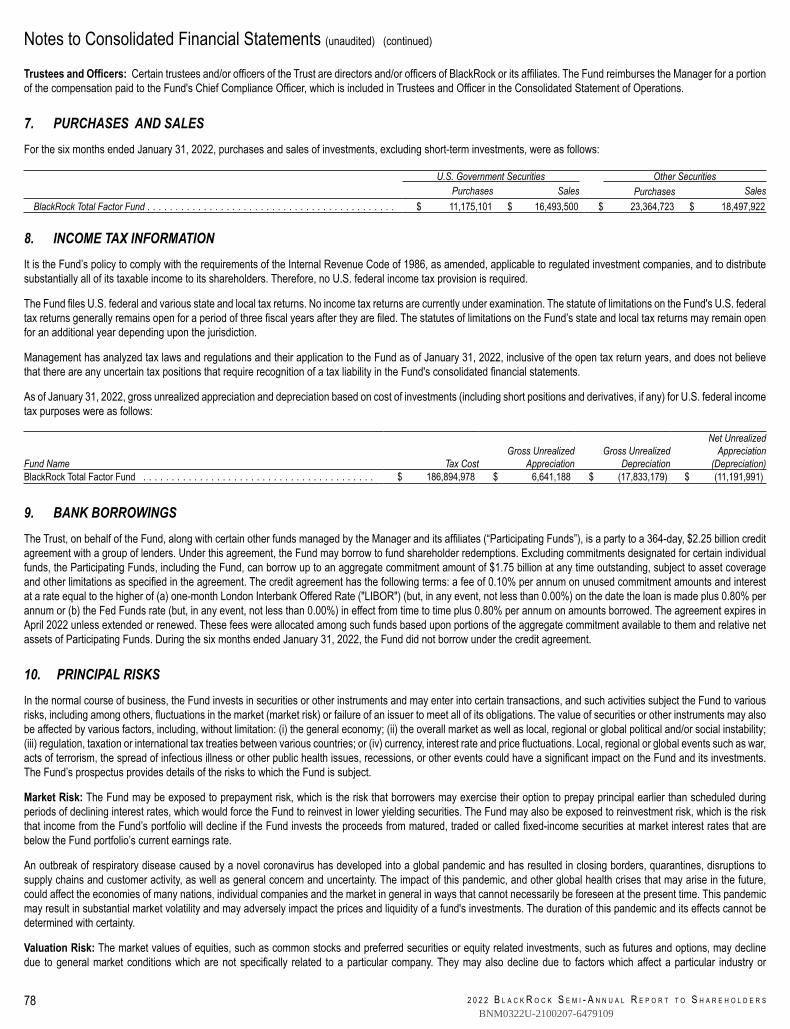
Notes to Consolidated Financial Statements (unaudited) (continued)
2 0 2 2 B L A C K R O C K S E M I - A N N U A L R E P O R T T O S H A R E H O L D E R S78
Trustees and Officers: Certain trustees and/or officers of the Trust are directors and/or officers of BlackRock or its affiliates. The Fund reimburses the Manager for a portionof the compensation paid to the Fund's Chief Compliance Officer, which is included in Trustees and Officer in the Consolidated Statement of Operations.
7. PURCHASES AND SALESFor the six months ended January 31, 2022, purchases and sales of investments, excluding short-term investments, were as follows:
U.S. Government Securities Other SecuritiesPurchases Sales Purchases Sales
BlackRock Total Factor Fund . . . . . . . . . . . . . . . . . . . . . . . . . . . . . . . . . . . . . . . . . . . . $ 11,175,101 $ 16,493,500 $ 23,364,723 $ 18,497,922
8. INCOME TAX INFORMATIONIt is the Fund’s policy to comply with the requirements of the Internal Revenue Code of 1986, as amended, applicable to regulated investment companies, and to distributesubstantially all of its taxable income to its shareholders. Therefore, no U.S. federal income tax provision is required.
The Fund files U.S. federal and various state and local tax returns. No income tax returns are currently under examination. The statute of limitations on the Fund's U.S. federaltax returns generally remains open for a period of three fiscal years after they are filed. The statutes of limitations on the Fund’s state and local tax returns may remain openfor an additional year depending upon the jurisdiction.
Management has analyzed tax laws and regulations and their application to the Fund as of January 31, 2022, inclusive of the open tax return years, and does not believethat there are any uncertain tax positions that require recognition of a tax liability in the Fund's consolidated financial statements.
As of January 31, 2022, gross unrealized appreciation and depreciation based on cost of investments (including short positions and derivatives, if any) for U.S. federal incometax purposes were as follows:
Fund Name Tax CostGross Unrealized
AppreciationGross Unrealized
Depreciation
Net UnrealizedAppreciation
(Depreciation)BlackRock Total Factor Fund . . . . . . . . . . . . . . . . . . . . . . . . . . . . . . . . . . . . . . . . . $ 186,894,978 $ 6,641,188 $ (17,833,179) $ (11,191,991)
9. BANK BORROWINGSThe Trust, on behalf of the Fund, along with certain other funds managed by the Manager and its affiliates (“Participating Funds”), is a party to a 364-day, $2.25 billion creditagreement with a group of lenders. Under this agreement, the Fund may borrow to fund shareholder redemptions. Excluding commitments designated for certain individualfunds, the Participating Funds, including the Fund, can borrow up to an aggregate commitment amount of $1.75 billion at any time outstanding, subject to asset coverageand other limitations as specified in the agreement. The credit agreement has the following terms: a fee of 0.10% per annum on unused commitment amounts and interestat a rate equal to the higher of (a) one-month London Interbank Offered Rate ("LIBOR") (but, in any event, not less than 0.00%) on the date the loan is made plus 0.80% perannum or (b) the Fed Funds rate (but, in any event, not less than 0.00%) in effect from time to time plus 0.80% per annum on amounts borrowed. The agreement expires inApril 2022 unless extended or renewed. These fees were allocated among such funds based upon portions of the aggregate commitment available to them and relative netassets of Participating Funds. During the six months ended January 31, 2022, the Fund did not borrow under the credit agreement.
10. PRINCIPAL RISKSIn the normal course of business, the Fund invests in securities or other instruments and may enter into certain transactions, and such activities subject the Fund to variousrisks, including among others, fluctuations in the market (market risk) or failure of an issuer to meet all of its obligations. The value of securities or other instruments may alsobe affected by various factors, including, without limitation: (i) the general economy; (ii) the overall market as well as local, regional or global political and/or social instability;(iii) regulation, taxation or international tax treaties between various countries; or (iv) currency, interest rate and price fluctuations. Local, regional or global events such as war,acts of terrorism, the spread of infectious illness or other public health issues, recessions, or other events could have a significant impact on the Fund and its investments.The Fund’s prospectus provides details of the risks to which the Fund is subject.
Market Risk: The Fund may be exposed to prepayment risk, which is the risk that borrowers may exercise their option to prepay principal earlier than scheduled duringperiods of declining interest rates, which would force the Fund to reinvest in lower yielding securities. The Fund may also be exposed to reinvestment risk, which is the riskthat income from the Fund’s portfolio will decline if the Fund invests the proceeds from matured, traded or called fixed-income securities at market interest rates that arebelow the Fund portfolio’s current earnings rate.
An outbreak of respiratory disease caused by a novel coronavirus has developed into a global pandemic and has resulted in closing borders, quarantines, disruptions tosupply chains and customer activity, as well as general concern and uncertainty. The impact of this pandemic, and other global health crises that may arise in the future,could affect the economies of many nations, individual companies and the market in general in ways that cannot necessarily be foreseen at the present time. This pandemicmay result in substantial market volatility and may adversely impact the prices and liquidity of a fund's investments. The duration of this pandemic and its effects cannot bedetermined with certainty.
Valuation Risk: The market values of equities, such as common stocks and preferred securities or equity related investments, such as futures and options, may declinedue to general market conditions which are not specifically related to a particular company. They may also decline due to factors which affect a particular industry or
BNM0322U-2100207-6479109
Notes to Consolidated Financial Statements (unaudited) (continued)
79N O T E S T O C O N S O L I D A T E D F I N A N C I A L S T A T E M E N T S
industries. The Fund may invest in illiquid investments. An illiquid investment is any investment that the Fund reasonably expects cannot be sold or disposed of in currentmarket conditions in seven calendar days or less without the sale or disposition significantly changing the market value of the investment. The Fund may experience difficultyin selling illiquid investments in a timely manner at the price that it believes the investments are worth. Prices may fluctuate widely over short or extended periods in responseto company, market or economic news. Markets also tend to move in cycles, with periods of rising and falling prices. This volatility may cause the Fund’s NAV to experiencesignificant increases or decreases over short periods of time. If there is a general decline in the securities and other markets, the NAV of the Fund may lose value, regardlessof the individual results of the securities and other instruments in which the Fund invests.
Counterparty Credit Risk: The Fund may be exposed to counterparty credit risk, or the risk that an entity may fail to or be unable to perform on its commitments related tounsettled or open transactions, including making timely interest and/or principal payments or otherwise honoring its obligations. The Fund manages counterparty credit riskby entering into transactions only with counterparties that the Manager believes have the financial resources to honor their obligations and by monitoring the financial stabilityof those counterparties. Financial assets, which potentially expose the Fund to market, issuer and counterparty credit risks, consist principally of financial instruments andreceivables due from counterparties. The extent of the Fund’s exposure to market, issuer and counterparty credit risks with respect to these financial assets is approximatelytheir value recorded in the Consolidated Statement of Assets and Liabilities, less any collateral held by the Fund.
A derivative contract may suffer a mark-to-market loss if the value of the contract decreases due to an unfavorable change in the market rates or values of the underlyinginstrument. Losses can also occur if the counterparty does not perform under the contract.
For OTC options purchased, the Fund bears the risk of loss in the amount of the premiums paid plus the positive change in market values net of any collateral held by theFund should the counterparty fail to perform under the contracts. Options written by the Fund do not typically give rise to counterparty credit risk, as options written generallyobligate the Fund, and not the counterparty, to perform. The Fund may be exposed to counterparty credit risk with respect to options written to the extent the Fund depositscollateral with its counterparty to a written option.
With exchange-traded futures and centrally cleared swaps, there is less counterparty credit risk to the Fund since the exchange or clearinghouse, as counterparty to suchinstruments, guarantees against a possible default. The clearinghouse stands between the buyer and the seller of the contract; therefore, credit risk is limited to failure of theclearinghouse. While offset rights may exist under applicable law, the Fund does not have a contractual right of offset against a clearing broker or clearinghouse in the eventof a default (including the bankruptcy or insolvency). Additionally, credit risk exists in exchange-traded futures and centrally cleared swaps with respect to initial and variationmargin that is held in a clearing broker’s customer accounts. While clearing brokers are required to segregate customer margin from their own assets, in the event that aclearing broker becomes insolvent or goes into bankruptcy and at that time there is a shortfall in the aggregate amount of margin held by the clearing broker for all its clients,typically the shortfall would be allocated on a pro rata basis across all the clearing broker’s customers, potentially resulting in losses to the Fund.
Concentration Risk: A diversified portfolio, where this is appropriate and consistent with a fund's objectives, minimizes the risk that a price change of a particular investmentwill have a material impact on the NAV of a fund. The investment concentrations within the Fund's portfolio are disclosed in its Consolidated Schedule of Investments.
The Fund invests a significant portion of its assets in fixed-income securities and/or uses derivatives tied to the fixed-income markets. Changes in market interest rates oreconomic conditions may affect the value and/or liquidity of such investments. Interest rate risk is the risk that prices of bonds and other fixed-income securities will increaseas interest rates fall and decrease as interest rates rise. The Funds may be subject to a greater risk of rising interest rates due to the current period of historically low rates.
The Fund invests a significant portion of its assets in securities of issuers located in Europe or with significant exposure to European issuers or countries. The Europeanfinancial markets have recently experienced volatility and adverse trends due to concerns about economic downturns in, or rising government debt levels of, severalEuropean countries as well as acts of war in the region. These events may spread to other countries in Europe and may affect the value and liquidity of certain of the Fund’sinvestments.
Responses to the financial problems by European governments, central banks and others, including austerity measures and reforms, may not work, may result in socialunrest and may limit future growth and economic recovery or have other unintended consequences. Further defaults or restructurings by governments and others of theirdebt could have additional adverse effects on economies, financial markets and asset valuations around the world. The United Kingdom has withdrawn from the EuropeanUnion, and one or more other countries may withdraw from the European Union and/or abandon the Euro, the common currency of the European Union. The impact of theseactions, especially if they occur in a disorderly fashion, is not clear but could be significant and far reaching. In addition, Russia launched a large-scale invasion of Ukraine onFebruary 24, 2022. The extent and duration of the military action, resulting sanctions and resulting future market disruptions in the region are impossible to predict, but couldbe significant and have a severe adverse effect on the region, including significant negative impacts on the economy and the markets for certain securities and commodities,such as oil and natural gas, as well as other sectors.
Significant Shareholder Redemption Risk: Certain shareholders may own or manage a substantial amount of fund shares and/or hold their fund investments for a limitedperiod of time. Large redemptions of fund shares by these shareholders may force a Fund to sell portfolio securities, which may negatively impact the fund’s NAV, increasethe fund’s brokerage costs, and/or accelerate the realization of taxable income/gains and cause the fund to make additional taxable distributions to shareholders.
LIBOR Transition Risk: The United Kingdom’s Financial Conduct Authority announced a phase out of LIBOR. Although many LIBOR rates ceased to be published or nolonger are representative of the underlying market they seek to measure after December 31, 2021, a selection of widely used USD LIBOR rates will continue to be publishedthrough June 2023 in order to assist with the transition. The Fund may be exposed to financial instruments tied to LIBOR to determine payment obligations, financing terms,hedging strategies or investment value. The transition process away from LIBOR might lead to increased volatility and illiquidity in markets for, and reduce the effectivenessof new hedges placed against instruments whose terms currently include LIBOR. The ultimate effect of the LIBOR transition process on the Fund is uncertain.
BNM0322U-2100207-6479109
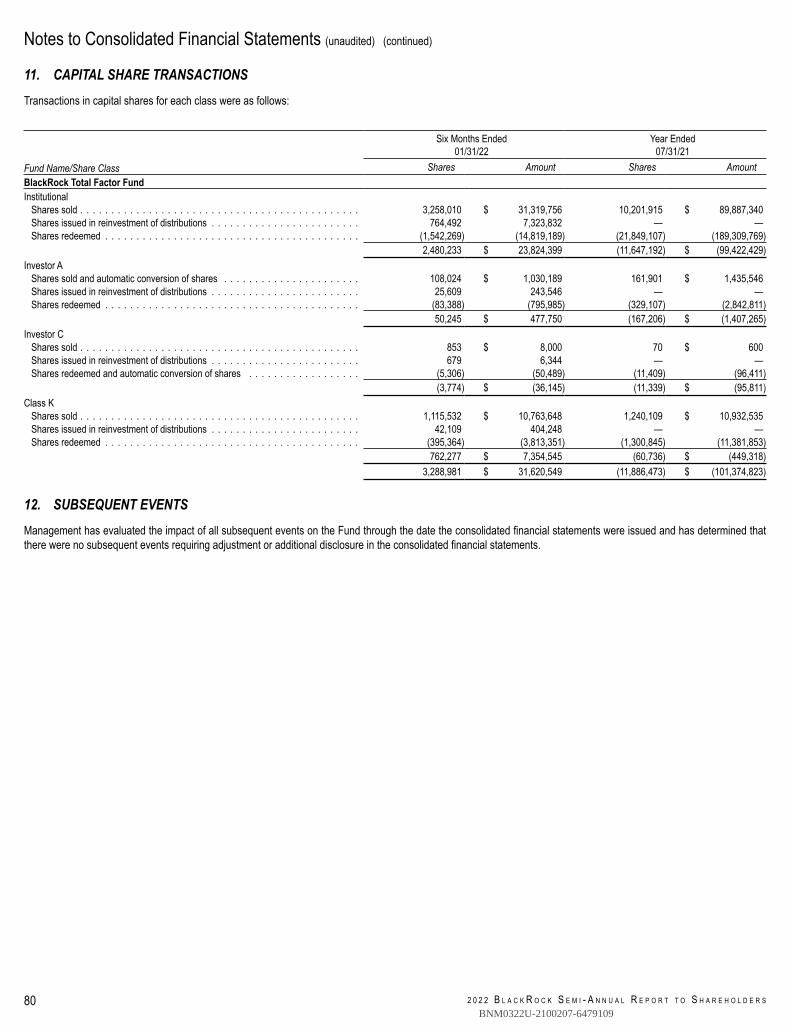
Notes to Consolidated Financial Statements (unaudited) (continued)
2 0 2 2 B L A C K R O C K S E M I - A N N U A L R E P O R T T O S H A R E H O L D E R S80
11. CAPITAL SHARE TRANSACTIONSTransactions in capital shares for each class were as follows:
Six Months Ended01/31/22
Year Ended07/31/21
Fund Name/Share Class Shares Amount Shares AmountBlackRock Total Factor FundInstitutional
Shares sold . . . . . . . . . . . . . . . . . . . . . . . . . . . . . . . . . . . . . . . . . . . . . 3,258,010 $ 31,319,756 10,201,915 $ 89,887,340Shares issued in reinvestment of distributions . . . . . . . . . . . . . . . . . . . . . . . . 764,492 7,323,832 — —Shares redeemed . . . . . . . . . . . . . . . . . . . . . . . . . . . . . . . . . . . . . . . . . (1,542,269) (14,819,189) (21,849,107) (189,309,769)
2,480,233 $ 23,824,399 (11,647,192) $ (99,422,429)Investor A
Shares sold and automatic conversion of shares . . . . . . . . . . . . . . . . . . . . . . 108,024 $ 1,030,189 161,901 $ 1,435,546Shares issued in reinvestment of distributions . . . . . . . . . . . . . . . . . . . . . . . . 25,609 243,546 — —Shares redeemed . . . . . . . . . . . . . . . . . . . . . . . . . . . . . . . . . . . . . . . . . (83,388) (795,985) (329,107) (2,842,811)
50,245 $ 477,750 (167,206) $ (1,407,265)Investor C
Shares sold . . . . . . . . . . . . . . . . . . . . . . . . . . . . . . . . . . . . . . . . . . . . . 853 $ 8,000 70 $ 600Shares issued in reinvestment of distributions . . . . . . . . . . . . . . . . . . . . . . . . 679 6,344 — —Shares redeemed and automatic conversion of shares . . . . . . . . . . . . . . . . . . (5,306) (50,489) (11,409) (96,411)
(3,774) $ (36,145) (11,339) $ (95,811)Class K
Shares sold . . . . . . . . . . . . . . . . . . . . . . . . . . . . . . . . . . . . . . . . . . . . . 1,115,532 $ 10,763,648 1,240,109 $ 10,932,535Shares issued in reinvestment of distributions . . . . . . . . . . . . . . . . . . . . . . . . 42,109 404,248 — —Shares redeemed . . . . . . . . . . . . . . . . . . . . . . . . . . . . . . . . . . . . . . . . . (395,364) (3,813,351) (1,300,845) (11,381,853)
762,277 $ 7,354,545 (60,736) $ (449,318)3,288,981 $ 31,620,549 (11,886,473) $ (101,374,823)
12. SUBSEQUENT EVENTSManagement has evaluated the impact of all subsequent events on the Fund through the date the consolidated financial statements were issued and has determined thatthere were no subsequent events requiring adjustment or additional disclosure in the consolidated financial statements.
BNM0322U-2100207-6479109
Statement Regarding Liquidity Risk Management Program
81S T A T E M E N T R E G A R D I N G L I Q U I D I T Y R I S K M A N A G E M E N T P R O G R A M
In compliance with Rule 22e-4 under the Investment Company Act of 1940, as amended (the “Liquidity Rule”), BlackRock FundsSM (the “Trust”) has adopted and implementeda liquidity risk management program (the “Program”) for BlackRock Total Factor Fund (the “Fund”), a series of the Trust, which is reasonably designed to assess and managethe Fund’s liquidity risk.
The Board of Trustees (the “Board”) of the Trust, on behalf of the Fund, met on November 9-10, 2021 (the “Meeting”) to review the Program. The Board previously appointedBlackRock Advisors, LLC or BlackRock Fund Advisors (“BlackRock”), each an investment adviser to certain BlackRock funds, as the program administrator for the Fund’sProgram, as applicable. BlackRock also previously delegated oversight of the Program to the 40 Act Liquidity Risk Management Committee (the “Committee”). At theMeeting, the Committee, on behalf of BlackRock, provided the Board with a report that addressed the operation of the Program and assessed its adequacy and effectivenessof implementation, including the management of the Fund’s Highly Liquid Investment Minimum (“HLIM”) where applicable, and any material changes to the Program (the“Report”). The Report covered the period from October 1, 2020 through September 30, 2021 (the “Program Reporting Period”).
The Report described the Program’s liquidity classification methodology for categorizing the Fund’s investments (including derivative transactions) into one of four liquiditybuckets. It also referenced the methodology used by BlackRock to establish the Fund’s HLIM and noted that the Committee reviews and ratifies the HLIM assigned to theFund no less frequently than annually. The Report also discussed notable events affecting liquidity over the Program Reporting Period, including the imposition of capitalcontrols in certain countries.
The Report noted that the Program complied with the key factors for consideration under the Liquidity Rule for assessing, managing and periodically reviewing the Fund’sliquidity risk, as follows:
a) The Fund’s investment strategy and liquidity of portfolio investments during both normal and reasonably foreseeablestressed conditions. During the Program Reporting Period, the Committee reviewed whether the Fund’s strategy is appropriate for an open-end fundstructure with a focus on funds with more significant and consistent holdings of less liquid and illiquid assets. The Committee also factored a fund’s concentration inan issuer into the liquidity classification methodology by taking issuer position sizes into account. Where a fund participated in borrowings for investment purposes(such as tender option bonds or reverse repurchase agreements), such borrowings were factored into the Program’s calculation of a fund’s liquidity bucketing.Derivative exposure was also considered in such calculation.
b) Short-term and long-term cash flow projections during both normal and reasonably foreseeable stressed conditions. Duringthe Program Reporting Period, the Committee reviewed historical redemption activity and used this information as a component to establish the Fund’s reasonablyanticipated trading size (“RATS”). The Fund has adopted an in-kind redemption policy which may be utilized to meet larger redemption requests. The Committeemay also take into consideration a fund’s shareholder ownership concentration (which, depending on product type and distribution channel, may or may not beavailable), a fund’s distribution channels, and the degree of certainty associated with a fund’s short-term and long-term cash flow projections.
c) Holdings of cash and cash equivalents, as well as borrowing arrangements. The Committee considered the terms of the credit facilitycommitted to the Fund, the financial health of the institution providing the facility and the fact that the credit facility is shared among multiple funds (including thata portion of the aggregate commitment amount is specifically designated for BlackRock Floating Rate Income Portfolio, a series of BlackRock Funds V). TheCommittee also considered other types of borrowing available to the Fund, such as the ability to use reverse repurchase agreements and interfund lending, asapplicable.
There were no material changes to the Program during the Program Reporting Period other than the enhancement of certain model components in the Program’s methodology.The Report provided to the Board stated that the Committee concluded that based on the operation of the functions, as described in the Report, the Program is operating asintended and is effective in implementing the requirements of the Liquidity Rule.
BNM0322U-2100207-6479109
Additional Information
2 0 2 2 B L A C K R O C K S E M I - A N N U A L R E P O R T T O S H A R E H O L D E R S82
Regulation Regarding Derivatives
On October 28, 2020, the Securities and Exchange Commission (the “SEC”) adopted regulations governing the use of derivatives by registered investment companies (“Rule18f-4”). The Fund will be required to implement and comply with Rule 18f-4 by August 19, 2022. Once implemented, Rule 18f-4 will impose limits on the amount of derivativesa fund can enter into, eliminate the asset segregation framework currently used by funds to comply with Section 18 of the 1940 Act, treat derivatives as senior securities andrequire funds whose use of derivatives is more than a limited specified exposure amount to establish and maintain a comprehensive derivatives risk management programand appoint a derivatives risk manager.
General Information
Quarterly performance, semi-annual and annual reports, current net asset value and other information regarding the Fund may be found on BlackRock’s website, which canbe accessed at blackrock.com. Any reference to BlackRock’s website in this report is intended to allow investors public access to information regarding the Fund and doesnot, and is not intended to, incorporate BlackRock’s website in this report.
Householding
The Fund will mail only one copy of shareholder documents, including prospectuses, annual and semi-annual reports, Rule 30e-3 notices and proxy statements, toshareholders with multiple accounts at the same address. This practice is commonly called “householding” and is intended to reduce expenses and eliminate duplicatemailings of shareholder documents. Mailings of your shareholder documents may be householded indefinitely unless you instruct us otherwise. If you do not want the mailingof these documents to be combined with those for other members of your household, please call the Fund at (800) 441-7762.
Availability of Quarterly Schedule of Investments
The Fund files its complete schedule of portfolio holdings with the SEC for the first and third quarters of each fiscal year as an exhibit to its reports on Form N-PORT. TheFund’s Form N-PORT is available on the SEC’s website at sec.gov. Additionally, the Fund makes its portfolio holdings for the first and third quarters of each fiscal yearavailable at blackrock.com/fundreports.
Availability of Proxy Voting Policies, Procedures and Voting Records
A description of the policies and procedures that the Fund uses to determine how to vote proxies relating to portfolio securities and information about how the Fund votedproxies relating to securities held in the Fund's portfolio during the most recent 12-month period ended June 30 is available without charge, upon request (1) by calling (800)441-7762; (2) on the BlackRock website at blackrock.com; and (3) on the SEC’s website at sec.gov.
BlackRock’s Mutual Fund Family
BlackRock offers a diverse lineup of open-end mutual funds crossing all investment styles and managed by experts in equity, fixed-income and tax-exempt investing. Visitblackrock.com for more information.
Shareholder Privileges
Account Information
Call us at (800) 441-7762 from 8:00 AM to 6:00 PM ET on any business day to get information about your account balances, recent transactions and share prices. You canalso visit blackrock.com for more information.
Automatic Investment Plans
Investor class shareholders who want to invest regularly can arrange to have $50 or more automatically deducted from their checking or savings account and invested inany of the BlackRock funds.
Systematic Withdrawal Plans
Investor class shareholders can establish a systematic withdrawal plan and receive periodic payments of $50 or more from their BlackRock funds, as long as their accountbalance is at least $10,000.
Retirement Plans
Shareholders may make investments in conjunction with Traditional, Rollover, Roth, Coverdell, Simple IRAs, SEP IRAs and 403(b) Plans.
BNM0322U-2100207-6479109
Additional Information (continued)
83A D D I T I O N A L I N F O R M A T I O N
BlackRock Privacy Principles
BlackRock is committed to maintaining the privacy of its current and former fund investors and individual clients (collectively, “Clients”) and to safeguarding their non-publicpersonal information. The following information is provided to help you understand what personal information BlackRock collects, how we protect that information and whyin certain cases we share such information with select parties.
If you are located in a jurisdiction where specific laws, rules or regulations require BlackRock to provide you with additional or different privacy-related rights beyond what isset forth below, then BlackRock will comply with those specific laws, rules or regulations.
BlackRock obtains or verifies personal non-public information from and about you from different sources, including the following: (i) information we receive from you or, ifapplicable, your financial intermediary, on applications, forms or other documents; (ii) information about your transactions with us, our affiliates, or others; (iii) information wereceive from a consumer reporting agency; and (iv) from visits to our websites.
BlackRock does not sell or disclose to non-affiliated third parties any non-public personal information about its Clients, except as permitted by law or as is necessary torespond to regulatory requests or to service Client accounts. These non-affiliated third parties are required to protect the confidentiality and security of this information andto use it only for its intended purpose.
We may share information with our affiliates to service your account or to provide you with information about other BlackRock products or services that may be of interestto you. In addition, BlackRock restricts access to non-public personal information about its Clients to those BlackRock employees with a legitimate business need for theinformation. BlackRock maintains physical, electronic and procedural safeguards that are designed to protect the non-public personal information of its Clients, includingprocedures relating to the proper storage and disposal of such information.
Fund and Service ProvidersInvestment Adviser and AdministratorBlackRock Advisors, LLCWilmington, DE 19809
Sub-AdviserBlackRock International LimitedEdinburgh, EH3 8BLUnited Kingdom
Accounting AgentJPMorgan Chase Bank, N.A.New York, NY 10179
Transfer AgentBNY Mellon Investment Servicing (US) Inc.Wilmington, DE 19809
CustodianJPMorgan Chase Bank, N.A.New York, NY 10179
Independent Registered Public Accounting FirmPricewaterhouseCoopers LLPPhiladelphia, PA 19103
DistributorBlackRock Investments, LLCNew York, NY 10022
Legal CounselSidley Austin LLPNew York, NY 10019
Address of the Trust100 Bellevue ParkwayWilmington, DE 19809
BNM0322U-2100207-6479109
Glossary of Terms Used in this Report
2 0 2 2 B L A C K R O C K S E M I - A N N U A L R E P O R T T O S H A R E H O L D E R S84
Currency Abbreviation
AUD Australian DollarBRL Brazilian RealCAD Canadian DollarCHF Swiss FrancCNY Chinese YuanDKK Danish KroneEUR EuroGBP British PoundHKD Hong Kong DollarINR Indian RupeeJPY Japanese YenKRW South Korean WonMXN Mexican PesoNOK Norwegian KroneNZD New Zealand DollarRUB New Russian RubleSEK Swedish KronaSGD Singapore DollarTWD Taiwan New DollarUSD United States Dollar
Portfolio Abbreviation
ADR American Depositary ReceiptsCMT Constant Maturity TreasuryCVA Certification Van Aandelon (Dutch Certificate)EURIBOR Euro Interbank Offered RateLIBOR London Interbank Offered RateMSCI Morgan Stanley Capital InternationalOTC Over-the-counterRBOB Reformulated Gasoline Blend Stock for Oxygen BlendingREIT Real Estate Investment TrustS&P Standard & Poor'sSCA Svenska Cellulosa AktiebolagetSOFR Secured Overnight Financing RateWTI West Texas Intermediate
BNM0322U-2100207-6479109

THIS PAGE INTENTIONALLY LEFT BLANK.
BNM0322U-2100207-6479109

THIS PAGE INTENTIONALLY LEFT BLANK.
BNM0322U-2100207-6479109

THIS PAGE INTENTIONALLY LEFT BLANK.
BNM0322U-2100207-6479109
Go paperless. . .It’s Easy, Economical and Green!Go to www.blackrock.com/edelivery
Want to knowmore?blackrock.com | 800-441-7762
This report is intended for current holders. It is not authorized for use as an offer of sale or a solicitation of an offer to buyshares of the Fund unless preceded or accompanied by the Fund’s current prospectus. Past performance results shownin this report should not be considered a representation of future performance. Investment returns and principal value ofshares will fluctuate so that shares, when redeemed, may be worth more or less than their original cost. Statements andother information herein are as dated and are subject to change.
SRA-1/22-SAR
BNM0322U-2100207-6479109
Related Documents